Religious culture, democratisation and patterns of technological innovation
14
This article appeared in a journal published by Elsevier. The attached copy is furnished to the author for internal non-commercial research and education use, including for instruction at the authors institution and sharing with colleagues. Other uses, including reproduction and distribution, or selling or licensing copies, or posting to personal, institutional or third party websites are prohibited. In most cases authors are permitted to post their version of the article (e.g. in Word or Tex form) to their personal website or institutional repository. Authors requiring further information regarding Elsevier’s archiving and manuscript policies are encouraged to visit: http://www.elsevier.com/authorsrights
Transcript of Religious culture, democratisation and patterns of technological innovation

This article appeared in a journal published by Elsevier. The attachedcopy is furnished to the author for internal non-commercial researchand education use, including for instruction at the authors institution
and sharing with colleagues.
Other uses, including reproduction and distribution, or selling orlicensing copies, or posting to personal, institutional or third party
websites are prohibited.
In most cases authors are permitted to post their version of thearticle (e.g. in Word or Tex form) to their personal website orinstitutional repository. Authors requiring further information
regarding Elsevier’s archiving and manuscript policies areencouraged to visit:
http://www.elsevier.com/authorsrights

Author's personal copy
Socio-cultural origins of the patterns of technologicalinnovation: What is the likely interaction among religiousculture, religious plurality and innovation? Towards a theoryof socio-cultural drivers of the patterns of technologicalinnovation
Mario Coccia a,b,c,d,*
aCNR – National Research Council of Italy, Torino, ItalybUnited Nations University (UNU)-Maastricht Economic and Social Research Institute on Innovation and Technology (MERIT),Maastricht, The NetherlandscUniversity of Toronto, The Munk Centre for International Studies at Trinity College, Toronto, CanadadBureau d’Economie Théorique et Appliquée, Université de Strasbourg, France
a r t i c l e i n f o
Article history:Received 15 April 2013Received in revised form 18 November 2013Accepted 26 November 2013
Keywords:ReligionInnovationCultureDemocracyCivilization
a b s t r a c t
Religion shapes people’s attitude of mind, education, culture and institutions of countriesand likely is a main socio-cultural determinant of the patterns of technological innovation.This study analyses the process of technological innovation exploring the predominantreligious culture of countries and tests the hypothesis that a higher religious plurality, amain proxy of cultural diversity, the higher the technological outputs in advanced econ-omies. The findings show that, on average, societies with a predominance of the Protes-tant, Jewish and Eastern religions tend to have technological performance higher thansocieties with other predominant religious cultures. In addition, the statistical evidencesupports de facto the hypothesis that a higher religious fractionalization, ceteris paribus,has a positive effect on technological outputs. This appears to be particularly true amongricher and more democratic countries, which are mainly located in the European andNorth-American geo-economic areas. Further discussion is needed to understand truecausality for developing a socio-economic theory of the origins of patterns of technologicalinnovation.
� 2013 Elsevier Ltd. All rights reserved.
Vere scire est per causas scire1
1. Introduction and the problem
Many economists and social scientists analyse themain socio-economic determinants of economic growth
(e.g. [3,11,32,47,58,64]). Barro and McCleary ([9], p. 760)argue that: “successful explanations of economic per-formance must go beyond narrow measures of eco-nomic variables to encompass political and socialforces”. In fact, socio-economic research, considering ainterdisciplinary perspective, is analysing specific
* CNR – National Research Council of Italy, CERIS-CNR, Institute for Economic Research on Firm and Growth, Collegio Carlo Alberto – via Real Collegio, N.30, 10024 Moncalieri, Torino, Italy. Tel.: þ39 011 68 24 925; fax: þ39 011 68 24 966.
E-mail address: [email protected] From Latin to English: Real knowledge lies in knowing causes.
Contents lists available at ScienceDirect
Technology in Society
journal homepage: www.elsevier .com/locate/ techsoc
0160-791X/$ – see front matter � 2013 Elsevier Ltd. All rights reserved.http://dx.doi.org/10.1016/j.techsoc.2013.11.002
Technology in Society 36 (2014) 13–25

Author's personal copy
driving forces of economic development, such as theculture (e.g. Guiso et al. [37, pp. 23ff], [51,59]), economicgovernance (cf. Dixit [29], pp. 5ff), democracy, religion2
and other factors (cf. [64]).One vital determinant of economic growth is tech-
nological innovation,3 which is, in turn, also affected byseveral socio-economic drivers and by political regime(cf. [19,24,27]). Coccia [19] claims that: “ ‘democracyrichness’ generates a higher rate of technological inno-vation with fruitful effects for the wellbeing and wealthof nations (pp. 248 and 257) [and].democratizationgenerates greater production of technology, i.e. technicaland economic change (p. 260)”. The form of the politicalregime, such as democracy,4 is based on cultural andsocial norms that are shaped by religious culture, civili-zation and history of countries (cf. [46,61]).
In other words, religious culture [52] and ‘historicaldevelopment paths’ (Acemoglu et al. [2, p. 48]) can affectsocial norms [38], institutions (cf. [64]) and form of gov-ernment that, in turn, plays a primary role in supportinglong-run patterns of technological innovation and eco-nomic growth (cf. [17,19]).
Several studies have provided many valuable insightsinto the theory of technological innovation(cf. [15,16,23,26,31]). A new problem for economics ofinnovation is the analysis of the interaction between somesocio-cultural forces and technological outputs in order toadequately explain the likely source of the patterns oftechnological innovation. In particular, the search forsocio-cultural influences on the patterns of technologicalinnovation requires a “dissection” to see what elements ofsocio-culture might play a critical role or at least influencethese patterns. One critical and interesting element ofsocio-culture that deserves to be studied is religion. Isthere a relationship between religion and technologicalinnovation? Huff [40] argues that larger forces are at playin terms of the “public sphere” and the opportunities forscientific exploration. However, can we see a relationshipbetween religious pluralism and higher technologicaloutputs or do we see just as much technological innova-tion in societies with one predominant religion? Under-standing whether or not this relationship exists wouldhelp enhance our understanding of the origins andcontinuous diffusion of technological innovation in somegeo-economic areas.
This paper, within a theoretical backgroundof modernization theory by Seymour Lipset [63], endeavorsto build a better theoretical framework to explain the likelysocio-economic linkages between some socio-cultural fac-tors and patterns of technological innovation. The purposeof the study, specifically, is:
– on the one hand, to analyse the interaction betweenpredominant religious culture of countries and tech-nological output; and
– on the other hand, to test the hypothesis that a higherreligious plurality of advanced societies fruitful sup-ports technological outputs.
The philosophy of science of my research is based on theposition that there can be no adequate knowledge wherecauses are unknown. This study analyses the likely links bya scientific realism in order to achieve “at least approximatetruths” (Thagard [68, p. 145]; cf. [48]). This approach canshed light on some socio-cultural driving forces and non-market factors5 of the patterns of technological innova-tion in modern and advanced countries to lay the founda-tion for a socio-economic theory of the origins of innovativeactivity [70].
2. Background of the study
Technical knowledge is the engine of technologicalinnovation, which is a main determinant of economicgrowth [4,35,50]. In fact, models of semiendogenousgrowth show that economic growth is correlated with thegrowth rate of effort in research and development, whichsupports innovative output (cf. [44]).
Within the literature of economic growth, some socialscientists claim that socio-cultural factors might play a vitalrole to explain economic performance of countries6 (seeRef. [9]). In particular, scholars argue that the religion ofcountries shapes and affects the economic attitudes ofpeople (see Guiso et al. [36, p. 251ff]; cf. [60]).
Deneulin and Rakodi [28] claim that religion7 is:
an institutionalized belief system that unites a com-munity of believers around social practices, rather than‘spirituality’, which concerns the individual, potentiallyin a socially and historically detached way (p. 3, originalemphasis).Benthall.adopts a ‘fuzzy’ concept of reli-gion, arguing that it is not a single category but a socialfield (p. 7, original emphasis).
Weber [69] in The Protestant Ethic and the Spirit ofCapitalism, published in 1905, discusses how the Prot-estant religious culture affects the economic perfor-mance and the entrepreneurship that have supportedthe capitalistic systems.8 Current socio-economic
2 See Iannaccone [42]; Barro and McCleary ([9], pp. 760ff); McClearyand Barro ([53], pp. 49ff; [54]); Guiso et al. ([36], pp. 225ff); McCleary[52].
3 See Aghion and Howitt ([4], Chapters 2 and 10).4 Archibugi ([6], p. 439) states: “Democracy is. a process rather than
as a set of norms and procedures”.
5 Cf. Iannaccone [42, pp. 1465ff].6 Generally speaking, innovative output can be an economic
performance.7 The origin of the word religion may be the Latin releg�ere (to collect
ritual acts) and/or the word religere (to repeat ritual acts). Cf. Devoto G.,Oli G. C., Il Dizionario della Lingua Italiana, Le Monnier.
8 Cf. Barro and McCleary [9, p. 760] and McCleary and Barro [53, pp.49–50]; see also Guiso et al. [36, pp. 226–231]. Several scholars havecriticized Weber’s stance, such as Iannaccone (1998, p. 1474, originalemphasis) [42] who states: “Samuelsonn and Tawney demonstrate thatnearly all the capitalist institutions emphasized by Weber preceded theprotestant Reformation that he viewed as their cause”.
M. Coccia / Technology in Society 36 (2014) 13–2514

Author's personal copy
research shows interesting results concerning the rela-tionship between religion,9 culture and economicgrowth (cf. [9,10,36,37,52,64]). In particular, Greif ([34],pp. 912ff) examines the importance of cultural factorsthat have led to pre-modern societies (Muslim and Latinworld) with different institutions and distinct patternsof economic development. Guiso et al. [36] analyse theinterplay between intensity of religious beliefs10 andpeople’s attitudes that are conducive to economicgrowth such as cooperation, trust, thriftiness, govern-ment, institutions, women’s propensity to work, legalrules, and fairness of the market. In particular, Guisoet al. ([36], p. 225),11 “find that on average, religiousbeliefs are.conducive to higher per capita income andgrowth .Christian religions are more positively associ-ated with attitudes conducive to economic growth”.Instead, Bettendorf and Dijkgraaf ([12], p. 23): “findsupport for the hypothesis that the effect of religion onincome is more favorable in high-income countries.While a negative effect of religion on income is found forlow-income countries, this effect is positive for high-income countries”.12 However, these authors also arguethat it is important to check the countries includedwithin the sample since this might influence the results.Elgin et al. ([30], p. 225ff) show that countries withhigher religiosity are prone to greater income inequalitydue to the lower level of government services. McClearyand Barro ([53], p. 49) display that religion can affectindividual characteristics of people such as work ethic,honesty, thrift and thereby economic performance. Someof these attitudes that can support wealthy society arepresent in more democratic countries [19,63]. Predomi-nant religion also seems to affect the self-employmentchoices in some countries (see Ref. [7]).
To sum up, the socio-economic literature remarks thatthe relation between religion and economic growth pro-vides vital results. Hence, as technological progress is amain determinant of economic growth, and technicalknowledge is the engine of technological innovations, aninteresting socio-economic problem is to analyze how bothpredominant religion and religious plurality (sometimesreferred to as fractionalization) are linked with techno-logical innovation.
The next section presents a research methodologyto analyse this critical problem for the economics ofinnovation.
3. Research design
3.1. Data, sources and key concepts
The CIA World Factbook [14] classifies13 countries permain predominant religious cultures, which are14: RomanCatholic, Protestant, Orthodox, Jewish, Muslim, Hindu andEastern. This dataset provides a proxy, on a large scale, ofthe main predominant religion across countries. However,the CIA World Factbook classification may have someconstraints because there are countries where it is verydifficult to find a predominant religion (e.g. China, India,Japan, etc.; cf. [66]), and/or there are some clusters, such asEastern religion countries, that include nations withdifferent socio-cultural contexts. This study is carried outnot per country but per type of religion, under which acluster of different countries are listed.
Table 1 shows the main concepts of the study basedon social, economic and political characteristics of 191nations.
The research here considers the main predominantreligious culture of countries (as defined and measured inTable 1), their level of democratization, category of GrossDomestic Product –GDP– per capita (<$2000, $2000 to$5000, $5001 to $10,000, >$10,000), rate of religiousfractionalization and geo-economic regions (Africa, Asiaand Pacific, C&E Europe,15 Middle East, North America,South America, Scandinavia and Western Europe).
Technological output16 of countries is measured bypatents of residents (cf. Steil et al. [65, pp. 3–22]),17 whichindicate the current innovation of countries and alsocommercially promising inventions. This paper also con-siders other metrics of innovative output in order to in-crease the robustness of the empirical analysis:
9 In general, religious culture is affected by “historical developmentpaths” Acemoglu et al. [2, p. 48].10 These are measured by percentage of positive answers to somequestions such as: “ ‘how often do you attend religious services thesedays?’ “ .” ‘Do you believe in God’?” Guiso et al. [36, p. 234].11 This study is based on the World Value Surveys by the University ofMichigan and includes 80% of the world’s population: the 1995–1997survey covered 54 independent countries.cf. also Iannaccone [42, pp.1474–1478] on these topics.12 Income was measured with a 10 income deciles and the respondentswere asked which class their household was in, counting all wages, sal-aries, pensions and other incomes. Several measures are used to inves-tigate the beliefs and practices of religious individuals, such as churchmembership and participation. For details, see Bettendorf and Dijkgraaf[12, pp. 14–16 and pp. 20–22].
13 The CIA World Factbook [14] provides information on the history,people, government, economy, geography, communications, trans-portation, military, and transnational issues for 266 world entities.14 The predominant religion is computed by the number of currentadherents, based on a combination of census reports and populationsurveys. Results can vary widely depending on the chosen definitions ofreligion, on whether historically predominant religious cultures areconsidered, or those who actively ‘practice’ a particular religion only, etc.An interesting discussion of the evolution of some religions is carried outby Ausloos and Petroni [8].15 C & E Europe is the group of countries in Central and Eastern Europe,a definition that has long been a source of controversy.16 Technology is based on inventions and innovations. Invention is acommercially promising product or service, based on new science and/ortechnology that meets the requirements for a patent application and/orthe patent is already granted. On the other hand, innovation, whichalready has a valid and granted patent, is the successful entry of a newscience or technology-based product into a particular market (cf. Coccia[19, p. 252]).17 Patents as sources of innovation can have some limits: for instance,transaction costs and disclosure rules vary among countries. Moreover,patented inventions give no information on innovation and on the pro-cess of development of technology, involving the translation of a blue-print into a working device suitable for mass production Coccia [19, pp.252–253].
M. Coccia / Technology in Society 36 (2014) 13–25 15
Author's personal copy
– Research & Development (R&D) expenditures (as per-centage of GDP).
– Number of researchers in R&D.– Number of scientific and technical journal articles.
Data are taken from the World Bank’s “World Devel-opment Indicators” [71]. These factors are a good proxy ofthe level of the technological innovation of countries[19,23].
3.2. Methodology of research
Firstly, this paper analyses the interaction between thepredominant religious culture of countries and innovative
performance of countries by descriptive statistics. This partof the study is a preliminary study.
The second part of this research (I refer to as the mainstudy) applies a hypothetical-deductive approach à laCarl Hempel, and intends to test the following hypothesis(HP):
HP: a higher religious plurality (often referred to as frac-tionalization) is positively associated to technological out-puts of advanced countries.
Given the index defined by Alesina et al. [5] uses theterm “fractionalization” to represent the religious pluralityof countries, it will be used “fractionalization” to indicatethis concept (see Table 1).
In particular, I hypothesize that religious fractionaliza-tion tends to generate a socio-cultural diversity, whichassociated to democratization and other factors, may spurpatterns of technological innovation of countries. Thesepatterns of technological innovation and technologicaloutputs, in turn, can support economic performances ofcountries.
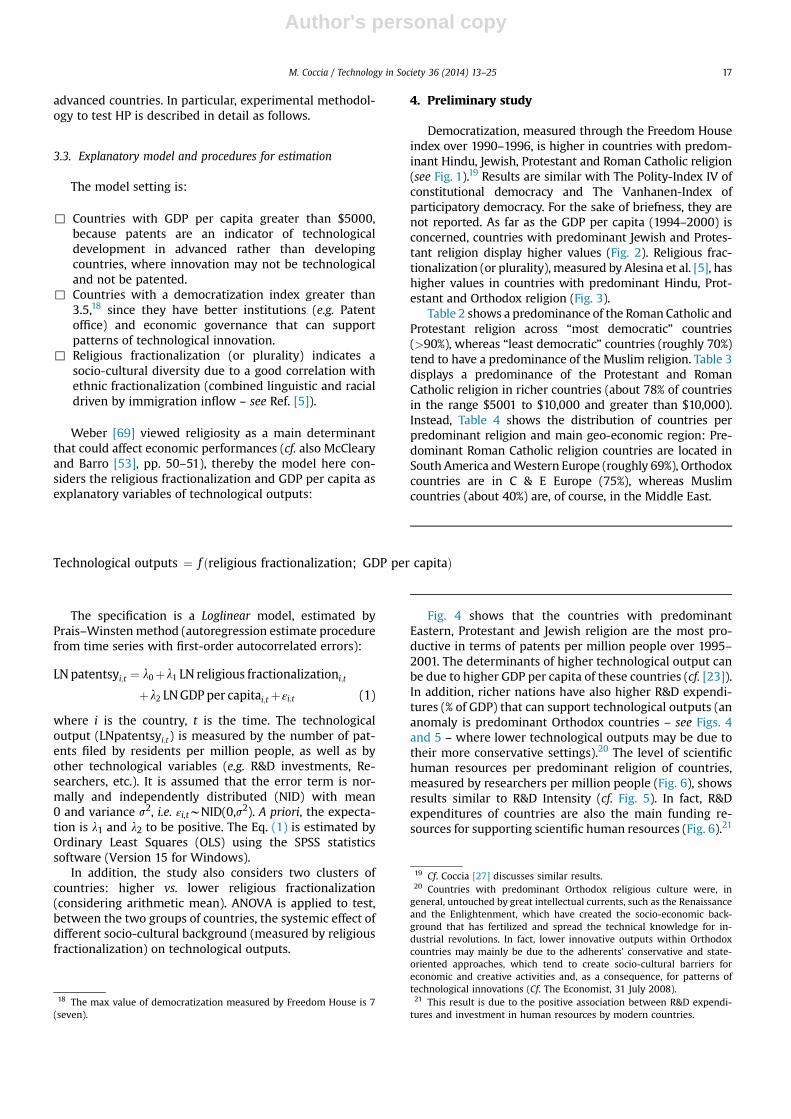
The key building blocks of the theory of socio-culturaldrivers of technological innovation are summarized in thefollowing schema:
Spolaore and Wacziarg ([64], p. 39) claim: “The inter-generational transmission of traits and characteristicshappens with variation, and the diffusion of knowledgetakes place not only vertically (from one generation to thenext within populations) but also horizontally (acrosspopulations).”
Preliminary statistical analysis is based on graphsconsidering all data. The main statistical analysis (bivariateand partial correlations as well as regression analysis)considers sub-sets of the dataset, mainly represented by
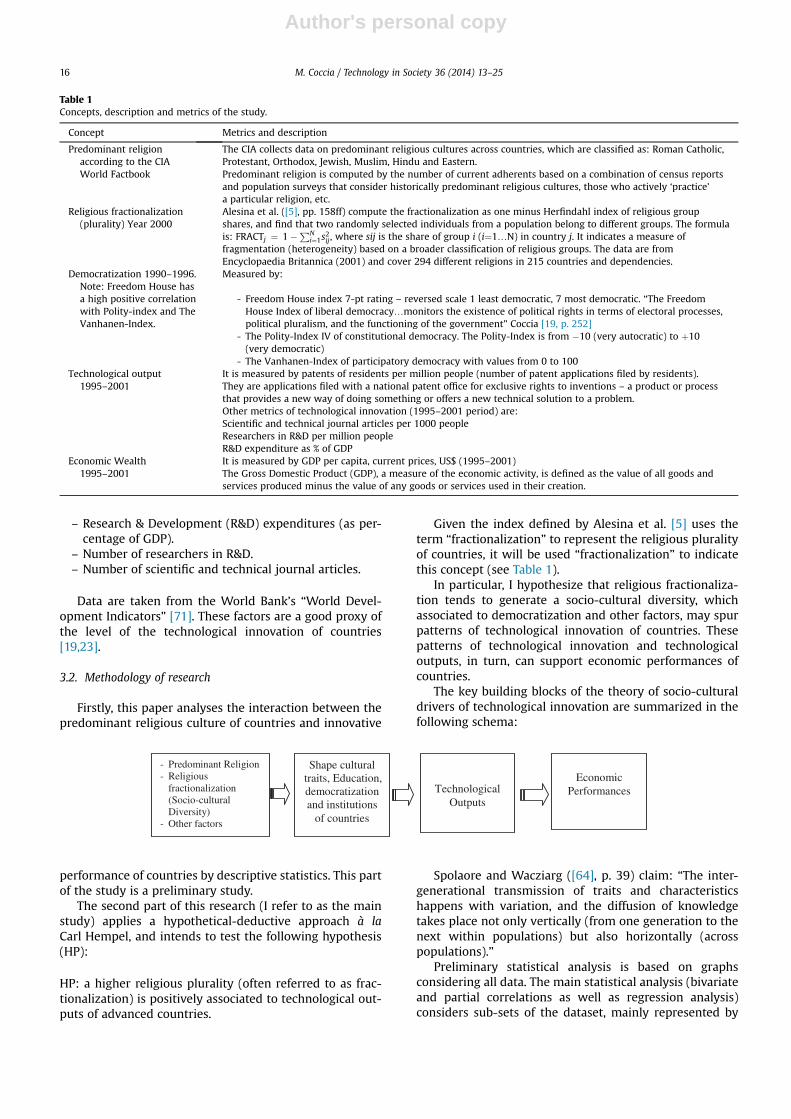
Table 1Concepts, description and metrics of the study.
Concept Metrics and description
Predominant religionaccording to the CIAWorld Factbook
The CIA collects data on predominant religious cultures across countries, which are classified as: Roman Catholic,Protestant, Orthodox, Jewish, Muslim, Hindu and Eastern.Predominant religion is computed by the number of current adherents based on a combination of census reportsand population surveys that consider historically predominant religious cultures, those who actively ‘practice’a particular religion, etc.
Religious fractionalization(plurality) Year 2000
Alesina et al. ([5], pp. 158ff) compute the fractionalization as one minus Herfindahl index of religious groupshares, and find that two randomly selected individuals from a population belong to different groups. The formulais: FRACTj ¼ 1�PN
i¼1s2ij , where sij is the share of group i (i¼1.N) in country j. It indicates a measure of
fragmentation (heterogeneity) based on a broader classification of religious groups. The data are fromEncyclopaedia Britannica (2001) and cover 294 different religions in 215 countries and dependencies.
Democratization 1990–1996.Note: Freedom House hasa high positive correlationwith Polity-index and TheVanhanen-Index.
Measured by:
- Freedom House index 7-pt rating – reversed scale 1 least democratic, 7 most democratic. “The FreedomHouse Index of liberal democracy.monitors the existence of political rights in terms of electoral processes,political pluralism, and the functioning of the government” Coccia [19, p. 252]
- The Polity-Index IV of constitutional democracy. The Polity-Index is from �10 (very autocratic) to þ10(very democratic)
- The Vanhanen-Index of participatory democracy with values from 0 to 100Technological output
1995–2001It is measured by patents of residents per million people (number of patent applications filed by residents).They are applications filed with a national patent office for exclusive rights to inventions – a product or processthat provides a new way of doing something or offers a new technical solution to a problem.Other metrics of technological innovation (1995–2001 period) are:Scientific and technical journal articles per 1000 peopleResearchers in R&D per million peopleR&D expenditure as % of GDP
Economic Wealth1995–2001
It is measured by GDP per capita, current prices, US$ (1995–2001)The Gross Domestic Product (GDP), a measure of the economic activity, is defined as the value of all goods andservices produced minus the value of any goods or services used in their creation.
- Predominant Religion - Religious
fractionalization(Socio-cultural Diversity)
- Other factors
Shape cultural traits, Education,democratizationand institutions
of countries
Technological Outputs
Economic Performances
M. Coccia / Technology in Society 36 (2014) 13–2516
Author's personal copy
advanced countries. In particular, experimental methodol-ogy to test HP is described in detail as follows.
3.3. Explanatory model and procedures for estimation
The model setting is:
, Countries with GDP per capita greater than $5000,because patents are an indicator of technologicaldevelopment in advanced rather than developingcountries, where innovation may not be technologicaland not be patented.
, Countries with a democratization index greater than3.5,18 since they have better institutions (e.g. Patentoffice) and economic governance that can supportpatterns of technological innovation.
, Religious fractionalization (or plurality) indicates asocio-cultural diversity due to a good correlation withethnic fractionalization (combined linguistic and racialdriven by immigration inflow – see Ref. [5]).
Weber [69] viewed religiosity as a main determinantthat could affect economic performances (cf. also McClearyand Barro [53], pp. 50–51), thereby the model here con-siders the religious fractionalization and GDP per capita asexplanatory variables of technological outputs:
The specification is a Loglinear model, estimated byPrais–Winstenmethod (autoregression estimate procedurefrom time series with first-order autocorrelated errors):
LN patentsyi;t ¼ l0þl1 LN religious fractionalizationi;t
þl2 LNGDP per capitai;t þεi;t (1)
where i is the country, t is the time. The technologicaloutput (LNpatentsyi;t) is measured by the number of pat-ents filed by residents per million people, as well as byother technological variables (e.g. R&D investments, Re-searchers, etc.). It is assumed that the error term is nor-mally and independently distributed (NID) with mean0 and variance s2, i.e. εi,twNID(0,s2). A priori, the expecta-tion is l1 and l2 to be positive. The Eq. (1) is estimated byOrdinary Least Squares (OLS) using the SPSS statisticssoftware (Version 15 for Windows).
In addition, the study also considers two clusters ofcountries: higher vs. lower religious fractionalization(considering arithmetic mean). ANOVA is applied to test,between the two groups of countries, the systemic effect ofdifferent socio-cultural background (measured by religiousfractionalization) on technological outputs.
4. Preliminary study
Democratization, measured through the Freedom Houseindex over 1990–1996, is higher in countries with predom-inant Hindu, Jewish, Protestant and Roman Catholic religion(see Fig. 1).19 Results are similar with The Polity-Index IV ofconstitutional democracy and The Vanhanen-Index ofparticipatory democracy. For the sake of briefness, they arenot reported. As far as the GDP per capita (1994–2000) isconcerned, countries with predominant Jewish and Protes-tant religion display higher values (Fig. 2). Religious frac-tionalization (or plurality), measured by Alesina et al. [5], hashigher values in countries with predominant Hindu, Prot-estant and Orthodox religion (Fig. 3).
Table 2 shows a predominance of the Roman Catholic andProtestant religion across “most democratic” countries(>90%), whereas “least democratic” countries (roughly 70%)tend to have a predominance of the Muslim religion. Table 3displays a predominance of the Protestant and RomanCatholic religion in richer countries (about 78% of countriesin the range $5001 to $10,000 and greater than $10,000).Instead, Table 4 shows the distribution of countries perpredominant religion and main geo-economic region: Pre-dominant Roman Catholic religion countries are located inSouth America andWestern Europe (roughly 69%), Orthodoxcountries are in C & E Europe (75%), whereas Muslimcountries (about 40%) are, of course, in the Middle East.
Fig. 4 shows that the countries with predominantEastern, Protestant and Jewish religion are the most pro-ductive in terms of patents per million people over 1995–2001. The determinants of higher technological output canbe due to higher GDP per capita of these countries (cf. [23]).In addition, richer nations have also higher R&D expendi-tures (% of GDP) that can support technological outputs (ananomaly is predominant Orthodox countries – see Figs. 4and 5 – where lower technological outputs may be due totheir more conservative settings).20 The level of scientifichuman resources per predominant religion of countries,measured by researchers per million people (Fig. 6), showsresults similar to R&D Intensity (cf. Fig. 5). In fact, R&Dexpenditures of countries are also the main funding re-sources for supporting scientific human resources (Fig. 6).21
Technological outputs ¼ f ðreligious fractionalization; GDP per capitaÞ
18 The max value of democratization measured by Freedom House is 7(seven).
19 Cf. Coccia [27] discusses similar results.20 Countries with predominant Orthodox religious culture were, ingeneral, untouched by great intellectual currents, such as the Renaissanceand the Enlightenment, which have created the socio-economic back-ground that has fertilized and spread the technical knowledge for in-dustrial revolutions. In fact, lower innovative outputs within Orthodoxcountries may mainly be due to the adherents’ conservative and state-oriented approaches, which tend to create socio-cultural barriers foreconomic and creative activities and, as a consequence, for patterns oftechnological innovations (Cf. The Economist, 31 July 2008).21 This result is due to the positive association between R&D expendi-tures and investment in human resources by modern countries.
M. Coccia / Technology in Society 36 (2014) 13–25 17

Author's personal copy
Publications of articles on scientific and technical journals(permillion people), over 1995–2001, are higher in countrieswith predominant Jewish and Protestant religion, also due tohigh investments in R&D and scientific human capital.
5. Main study
The coefficient of correlation between Religious frac-tionalization and Patents per million people in richercountries ($5001 to $10,000 and>$10,000 per capita) has apositive association equal to r¼þ0.49 and r¼þ0.33,respectively (significant at the 0.01 level). The partial cor-relation between Religious fractionalization and Patentsper million people in “most democratic” countries alsoshows a positive significant interaction:
rpatent;Rel: Fractional:jMostDemocracy ¼ 31%ðsig: 0:00Þ
Other indicators of innovative performance confirmthese analyses but, for the sake of briefness, the results arenot reported because they are roughly similar to thosealready described.
An interesting socio-economic problem is whethersocio-cultural diversity, associated to richness of countries,may provide a prediction about technological outputs ofadvanced countries. Religion can be used as instrumentalvariable for culture Guiso et al. [37, p. 24]. Empirical anal-ysis here, mainly based on richer and more democraticcountries, assumes the religious fractionalization (which isa proxy of socio-cultural diversity) and wealth as drivers oftechnological outputs.22 In particular, the multiple
Fig. 1. Democratization index per predominant religion, 1990–1996 period. Note: results are similar with other metrics of democracy.
Fig. 2. GDP per capita per predominant religion, 1994–2000 period.
22 Some variables are transformed into natural logarithms (LN) in orderto have normal distributions.
M. Coccia / Technology in Society 36 (2014) 13–2518

Author's personal copy
Fig. 3. Religious fractionalization by Alesina per predominant religion.
Table 2Countries per predominant religion and level of democratization.
Democratization: Freedom House Roman Catholic Protestant Orthodox Jewish Muslim Hindu Eastern Other Total
Least Democratic 1 – – – – 7 – 2 1 102 – – – – 6 – – 1 73 1 4 1 – 4 – – 1 114 5 1 5 – 4 – 2 1 185 8 – 3 – 1 – 2 2 166 5 2 2 1 1 – 2 1 14
Most democratic 7 16 12 1 – – 1 1 – 31
Total countries 35 19 12 1 23 1 9 7 107% 32.71 17.76 11.21 0.93 21.50 0.93 8.41 6.54 100.00
Note: similar results are with the Polity-Index IV of constitutional democracy and the Vanhanen-Index of participatory democracy.
Table 3Countries per predominant religion and category of GDP per capita.
GDP per capita category Roman Catholic Protestant Orthodox Jewish Muslim Hindu Eastern Other Total
Less than $2000 7 4 9 – 18 – 5 5 48$2000–$5000 12 3 1 – 3 1 1 2 23$5001–$10,000 6 – – – 2 – 1 – 9>$10,000 10 12 2 1 – – 2 – 27
Total countries 35 19 12 1 23 1 9 7 107% 32.71 17.76 11.21 0.93 21.50 0.93 8.41 6.54 100.00
Table 4Countries per predominant religion and geo-economic location.
Region Roman Catholic Protestant Orthodox Jewish Muslim Hindu Eastern Other Total
Africa 1 5 1 – 3 1 – 6 17Asia and Pacific 1 2 – – 4 – 9 – 16C & E Europea 7 2 9 – 7 – – – 25Middle East – – – 1 9 – – – 10North America 2 1 – – – – – – 3South America 14 – – – – – – 1 15Scandinavia - 5 – – – – – – 5Western Europe 10 4 2 – – – – – 16
Total countries 35 19 12 1 23 1 9 7 107% 32.71 17.76 11.21 0.93 21.50 0.93 8.41 6.54 100.00
a Central and Eastern Europe.
M. Coccia / Technology in Society 36 (2014) 13–25 19

Author's personal copy
regression analysis by a Loglinear model23 explains the LNof patents per million people (1995–2001) from the LN ofReligious fractionalization (2000) and LN of GDP per capita(1994–2000).24
Table 5, ceteris paribus, shows an expected patent in-crease of approximately 0.71% for a religious fractionaliza-tion increase of 1% across richer and more democraticcountries, where the patents are main indicators of tech-nological development. The R2 value is so high that confi-dence in the theoretical model (1) is justified. In addition,the estimated relationship of Table 5 can be applied topredict the future values for the dependent variable at agiven value for the explanatory variables. For instance, aEuropean country, such as Italy, with an average religiousfractionalization of about 0.36 and an average GDP percapita roughly of V22,559, has a number of expected LNPatents per million people equal to:
�26:187þ 0:71 LNð0:36Þ þ 3:242 LNð22559Þ ¼ 5:585
Expected annual patents per million people are: exp{5.585}¼ 266 (the actual annual average of patents permillion people of these countries is 222 units)25. Fixed thesame GDP per capita, if this European country had the highreligious fractionalization of the US, namely about 0.82,they would have a predicted annual number of patents permillion people roughly equal to 478 units.
The statistical analysis to reinforce these results is theANOVA. Countries can be divided into two clusters (A and B):
- A¼ lower religious fractionalization countries (i.e.FRACT< 0.42, which is the arithmetic mean of thedistribution). They have an annual average of 125.88patents per million people;
- B¼ higher religious fractionalization countries(FRACT� 0.42) with annual average of 378.34 patentsper million people.
Average production of patents per million people in-creases in countries with higher religious fractionalization:
mA lower religious fract ¼ 125:88 patents per million people
mB higher religious fract ¼ 378:34 patents per million people
If patents per million people are normally distributed,two alternative statistical hypotheses are:
H0 : mAðpatents per million peopleÞ¼ mBðpatents per million peopleÞ
H1 : mAðpatents per million peopleÞsmBðpatents per million peopleÞ
ANOVA is in Table 6.
Fig. 4. Patents (million people) per predominant religion of countries, 1995–2001 period.
Fig. 5. R&D expenditures (% of GDP) per predominant religion of countries1995–2001 period.
Fig. 6. Researchers (million people) per predominant religion of countries,1995–2001 period.
23 Note that in the loglinear model the coefficients have the interpre-tation of elasticities.24 The model has some traces of heteroskedasticity.25 This result is based upon the assumption that the error term is nor-mally distributed; in addition, the term that corresponds to one-half ofthe estimated error variance is not considered.
M. Coccia / Technology in Society 36 (2014) 13–2520

Author's personal copy
The significancevalueof theF-test is0.00 (Table6), therebythis statistical analysis rejects thenullhypothesis (H0): averageproduction of patents per million people is equal acrosscountries with higher and lower religious fractionalization. Ingeneral, the structure of the data shows that countries withmore religious plurality have a production of patents permillion people higher than lower religious plurality countries.Although the variability within groups is 88.94%, the vari-ability between groups assumes a considerably high valueequal to 11.06%: this is the effect of the difference in averagepatents per million people between clusters A and B.
5.1. Observations
The statistical evidence seems to confirm, ceteris paribus,that religious fractionalization (a proxy of socio-cultural di-versity) can be a main driver of technological output, asso-ciated to GDP per capita, in advanced countries. However,the residuals of themodel have a great amount of variance tobe explained. This strongly suggests that the relationshipbetween religious fractionalization and technological out-puts is also driven by omitted factors influencing both socio-economic structure of countries and patterns of technolog-ical innovation. For instance, France and Spain have aroughly similar religious fractionalization (z0.4), but Spainhas an annual average of about 82 patents per million peo-ple, whereas France has an annual average of 333 patents.
Why does technological innovation vary across countries?What are the omitted factors influencing the relationshipbetween predominant religion, religious fractionalization andtechnological performance?
The answer could be that the drivers of the patterns oftechnological innovations of some countries are based on‘historical development paths’ (Acemoglu et al. [2, p. 48])that have supported cultural, intellectual, technological and
industrial development [65]. In general, different religiousbackgrounds generate different social and ethical con-straints, people’s attitude of mind, education, culture andinstitutions. These factors may explain dissimilar economicbehavior and technological performance across societies:social and ethical rules, as well as variations in the legalprinciples that result from these rules, have a strong impacton the economic sphere, and vice versa.
In particular, socio-economic driving forces of the pat-terns of technological innovation (cf. [20]) and economicgrowth interact within a complex system and are repre-sented by many factors including:
, higher democratization ([19]; cf. also [43]);, effective economic governance [29];, diversity of cultures ([5,37]);, geo-economic location of countries ([64]; cf. also [26]);, available natural resources and efficient energy system
(cf. [21]);, colonial origins of countries [1];, demographic change [13] and population [25];, institutions, effective national system of innovation [24]
and fruitful university, industry and government link-ages (Triple Helix);
, higher investment in R&D [18,22,56];, industrial structure of countries [23].
In fact, France has R&D expenditures (% of GDP) of about2.15%, whereas Spain has lesser than 1%; researchers inR&D per million people are more than 2600 units in France,while Spain has an average of about 1900 researchers;Royalty and license fees receipts are about 40 (BoP currentUS$) in France in 1995–2001 vs. roughly 8 in Spain. More-over, Spain has a population of about 40 million, France hasroughly 58.5 million and democratization is rather similarbetween these countries. The factors listed above, in addi-tion to religious fractionalization and other elements, play acritical role in explaining the different production of tech-nological output between France and Spain, and in generalacross countries. Hence, the production of technologicaloutput can be endogenous for countries and supported byeffective national system of innovation, industrial structureof the economy and other factors that are nurtured orconstrained in socio-economic contexts based on moredemocratization, cultural diversity and competition.
Probare a causis est elementa rei colligere26
6. The likely nature of the origins of technological andeconomic change: towards a theory of socio-culturaldrivers of the patterns of technological innovation
Spolaore and Wacziarg (2013, pp. 37–38) [64] claim:
a fuller understanding of the process of economicdevelopment will emerge from the study of the
Table 5Prais–Winsten estimation results of technological innovation functionbased on richer (>$5000 per capita) and more democratic countries(Freedom House >3.5).
Log linear model
Dependent variable: LN (Patents per million people) 1995–2001
Explanatory variables Estimatedcoefficients
Standard error t-Ratio
(Constant) �26.187*** 2.13 �12.31LN religious
fractionalization0.71*** 0.22 3.26
LN GDP per capita1990–2000
3.24*** 0.21 15.16
R2 ¼0.558 Adj. R2 ¼0.550 DW¼2.067
Note: ***¼ Parameter is significant at 0.001.
Table 6ANOVA based on LN patents 1995–2001.
Sum ofsquares
df Mean square F Sig.
Between groups 58.685 1 58.69 24.98 0.00Within groups 472.131 201 2.35Total 530.815 202
26 From Latin to English: To prove something [a phenomenon] begin-ning from the causes, it means to identify its general principles [origin-s].The Italian philosopher Giambattista Vico claims that the cause of athing is whatever adequately explains it, the whole ground, reason, orsource of it, –“quella che per produrre l’effetto non ha d’altra bisogno”.
M. Coccia / Technology in Society 36 (2014) 13–25 21

Author's personal copy
interactions between persistent traits, transmitted fromone generation to the next over the long run, andcontingent shocks and changes, whose effects acrosssocieties may partly depend on persistent traitsdforexample, when the diffusion of brand-new technolog-ical and institutional innovations in modern times de-pends on long-term genealogical relatedness.
Religion shapes people’s attitude of mind, education,culture and institutions of countries and may be a mainsocio-cultural determinant of the patterns of technologicalinnovation (of course associated to other factors). Consid-ering a reasoning of backward induction (Fig. 7), techno-logical innovation (D4INNOVATION) is positively affected byeconomic growth – D4ECONOMIC GROWTH (and vice versa27; cf.[4,23]). Both, in turn, can be driven by higher democrati-zation – D3DEMOCRATIZATION [19]. Democracy has roots incultural traits (D2CULTURE) transmitted within population[64]. The origins of cultural traits are also affected by reli-gious culture (D1RELIGIOUS CULTURE AND OTHER FACTORS).
In other words, the origin of fruitful patterns of techno-logical innovation may be also strongly influenced by thereligious culture of geo-economic areas (Initial Driver:D1RELIGIOUS CULTURE), which shapes the people’s attitude ofmind, education, culture and institutions supporting specific‘historical development paths’ (Acemoglu et al. [2, p. 48]).
The statistical evidence of this study seems to confirmthat higher technological outputs of advanced countriescan be further explained by religious plurality and by somepredominant religions that have shaped a fruitful socio-economic background. These vital linkages between reli-gion, culture and technological outputs may lay the foun-dation for an initial theory of socio-economic drivers of thepatterns of technological innovation. The structure of thistheory can be underpinned in the following results derivedfrom the statistical analysis and the hypothetical-deductiveanalysis applied in the study:
, on average, technological performances of advancedcountries tend to be higher in societies based on Protestantand Eastern religious cultures.
, on average, higher religious fractionalization (plurality),a main proxy of cultural diversity, ceteris paribus, tendsto support technological outputs of advanced socio-economic systems.
, on average, predominant religious culture shapes thesocio-cultural background and education of countries. Itaffects the GDP per capita of countries and can create afruitful (or hostile) context for higher (or lower) tech-nological and economic performances.
In general, in some economies, the initial linkage is:religion and religious fractionalization (a main cause of
cultural diversity and competitive context), associated withother factors, shape the culture of the geo-economic area,influencing the development of social capital of populationand supporting higher education [36,42,52]. These vitalelements affect democratization [63]. These factors indi-vidually as well as higher democratization can supportpatterns of technological innovation [19] and thereby eco-nomic performance (cf. [1]). In mature economies, a multi-plicity of positive feedback mechanisms (þ) can run fromeconomic growth to education, democratization and tech-nological performance that further trigger a fruitful inter-action for continuous economic and technological changeof countries [3,32].
These basic linkages of the theory of socio-cultural ori-gins of the patterns of technological innovation are shownin Fig. 8.
The theoretical framework of socio-cultural origins ofthe patterns of technological innovation is based on mainlinks between vital factors.
- Connections among religion, socio-economic actions andinnovative output
Vital question is:Why do some religious cultures tend to support, on
average, higher economic performances and technologicaloutputs of advanced countries?
Guiso et al. ([36], p. 225) show that: “Christian religionsare positively associated with [people’s] attitudes condu-cive to economic growth” such as cooperation, trust,thriftiness, legal rules, and fairness, etc. Grier suggests that:“Protestantism is correlated positively with growth anddevelopment” (as quoted by Guiso et al., [36, p. 230]).
Deneulin and Rakodi [28] argue that: “Religion is animportant force that shapes people’s values, what theyconsider worthwhile and valuable (p. 4).The economic,political, social, cultural, and scientific spheres cannotfunction independently of normative considerations, ofwhich religion is an important source (p. 5)”.28
Religion, on one hand, sets formal and informal ethicalconstraints to the human interests; on the other hand, itshapes culture of societies and stimulates people’s attitudeof mind that develops the social capital in population.Hence, religious doctrines, accepted by the majority ofpeople, have a vast influence on the direction and govern-ment of human life, culture, education, institutions, form ofgovernment, business and other socio-economic activitiesof countries (despite the fact that non-observant people arealso present in a given country). John Stuart Mill ([55], pp.55ff) discusses the social benefits of religion and argues thatthe education of any form of ethics is taught as religiouseducation, which has awide influence on all human actions.In fact, higher technological performance, in some geo-
D1RELIGION D2CULTURE D3DEMOCRATIZATION D4EC. GROWTH D4INNOVATION
Fig. 7. Backward induction to detect initial drivers of innovative performance.
27 As there may be simultaneity between these factors, I use the samenumber 4. 28 Cf. also Habermas [38].
M. Coccia / Technology in Society 36 (2014) 13–2522

Author's personal copy
economic areas, may be due to some religious cultures thatsupport high levels of education and shape fruitful culturaltraits of population (e.g. stimulate individual motivation).For instance, Iannaccone ([42], p. 1475) claims that:“American Jews average significantly higherwages.largelyattributable to their higher level of education”, whereasGuiso et al. ([36], p. 231) argue that: “Catholics in the UnitedStates tend to have higher wages.attributed to the qualityof their educational system”. Instead, protestant countrieshave beenmore successful economically because accordingto: “Blum and Dudley.Protestantism.improved the levelof mutual trust and cooperation” (as quoted by Guiso et al.,[36, p. 230]).Moreover, “Protestants andHindus are the onlyreligious groups that favor incentives. This result is consis-tent with Weber’s view” [36, p. 280].
As far as Muslim religion is concerned, Islamic world inthe past (mainly 10th–13th centuries) has played an activerole of intellectual and technological outpourings for Eu-ropean science.29 Current Muslim-majority countries seemto promote lower technological output likely due to ups anddowns of the historical path, which has generated: politicalinstability, financial problems, weak industrial and eco-nomic structures, lower democratization, lack of effectivenational systems of innovation and a continuous brain draintoward richer countries in Europe, North-America and Asia.
In terms of modernization theory by Seymour Lipset[63] the linkages can be summarized as: education, affectedby religious culture, promotes social capital of populationand democratization (cf. Acemoglu et al. [2, p. 48]), whichplays a vital role for fruitful patterns of technologicalinnovation [19].
- Connections among religious fractionalization, socio-economic background, democratization and innovativeoutput
As far as religious plurality is concerned, this papershows that technological outputs of advanced countries,
measured by patents per million people, may also receivebenefits from higher religious fractionalization (plurality),in particular among “more democratic” and richer coun-tries, which are mainly located in the geo-economic areasof Western Europe and North America.
Critical question is:How does higher religious plurality (fractionalization)
nurture the cultural background of advanced countries andgenerate, on average, high technological performances?
Alesina et al. [5] suggests that: “religious fractionaliza-tion tends to be higher in more tolerant and free societies”(p. 158) and “The index of religious fractionalization bears arelationship to controlling corruption, preventing bureau-cratic delays, tax compliance, transfers, infrastructurequality,.lower illiteracy, school attainment, democracy,and political rights.observed religious fragmentation islarger in more tolerant countries” (p. 173 and p. 175). Thesesocio-cultural elements are widespread in countries withhigher democratization, which has de facto fruitful effectson patterns of technological innovation (cf. Coccia [19, pp.260–261]) and economic growth (cf. [3,32]). As a matterof fact, democratization (with religious plurality) is also thesocio-institutional background for good economic gover-nance that allows markets, economic activities and trans-actions to function well. Dixit (2009, p. 5) [29] claims thatgood governance is important to secure the essential pre-requisites of market economies, i.e. protection of propertyrights, enforcement of contracts and collective actions.Good economic governance can be based on religious be-liefs that shape cultural traits such as honesty, work ethic,etc. In fact, Arrow wrote: “virtually every commercialtransaction has within itself an element of trust” (as quotedby Guiso et al., [37, p. 34]). Therefore, higher religiousfractionalization, springing from ethnic heterogeneity,would nurture the competitive contexts and new (andgroundbreaking) ideas of advanced countries and societies,spurring scientific and technological breakthroughs. In fact,Hunt and Gauthier-Loiselle [41] show the fruitful effect ofimmigrants (a main determinant of religious fractional-ization) on patents per capita increase, whereas Kerr andLincoln ([45], p. 473ff) argue that the immigrants whoremain in US support innovation patterns and thereby US
Linkages when countries are at the early stage of developmentLinkages in mature economies
+ Positive linkages(+) Positive feedbacks
T(initial process) Countries at the early stage of development
Culture and develop social capital in the population+ other social factors
-Institutions
-EducationDemocratization Patterns of
Technological Innovation
EconomicPerformance/Growth
T+1inMature Economies
Some Religions &High Religious Fractionalization
(+)
(+)
+ + + +
(+) Feedback mechanisms
Fig. 8. Relationships among factors to lay the foundations for a theoretical framework of socio-cultural origins of the patterns of technological innovation.
29 Cf. Goodman [33] and Saliba [62] for vital contributions of Islamiccivilization in astronomy.
M. Coccia / Technology in Society 36 (2014) 13–25 23

Author's personal copy
total factor productivity. In particular, higher religiousfractionalization in the USA, due to their “historical devel-opment paths”, supports cultural diversity (and richness)and competitive context that are supporting US scientificand technological worldwide leadership and “fuellingAmerica’s continuing growth” (Linstone [49, p. 697]).
Page [57] describes: “how the power of diversity createsbetter groups, firms, schools and societies”. However, ac-cording to Linstone ([49], p. 697),30
there is a downside to cultural diversity: communica-tion, and hence agreement, may be more difficult toreach.too much diversity may prove as undesirable astoo little. Finding a good balance remains the ultimatechallenge in dealing with every aspect of multiplicityand one that will always call for thoughtful judgment.
7. Concluding observations
The study here likely has found some fruitful socio-cultural interactions between some religious cultures andtechnological outputs. Empirical evidence seems also toshow the leveraging effect of higher religious fractional-ization (a proxy of cultural diversity) on innovative per-formances across richer and more democratic countries.
Hence, religious culture is a main element of the socialsystem that shapes culture, education and institutions overtime and can affect the generation and adoption of tech-nological innovations, as described by Herbig and Palumbo([39], p. 98) in the context of the American and Japaneseeconomies. Nevertheless, religion and culture, of course, arenot the only factors that may influence the technologicaloutputs of countries. Herbig and Palumbo ([39], p. 98) arguethat: “culture can explain between 33 and 65% of the vari-ance [of innovative behavior]”. Patterns of technologicalinnovation are also driven by other intrinsic factors to thesociety and economic system, such as effective economicgovernance, fruitful demographic change [25], higherdemocratization [19], apt geo-economic location [26], socialand cultural openness, efficient national system of innova-tion and rule of law [23], etc. (cf. [64,67]).
Although other socio-demographic–economic factors areimportant for a systematic analysis of drivers of the techno-logical change, the analysis discussed here provides impor-tant preliminary evidence to suggest that some importantlinkages exist. It also provides a theoretical framework tobetter understand the socio-cultural origins of vital in-teractions that support patterns of technological innovation.
The findings seem to provide a degree of closeness totrue socio-economic facts. However, socio-economic the-ories have an infinite set of consequences such that no rulewill be true in all situations (different geographical areasand/or time period), especially when we know that otherthings are often not equal. Certainly, this is not a study ofcausality but instead a study to identify critical factors andlinks that may need further study and to develop a theo-retical framework for continuing to do so.
Acknowledgments
I thank Alfons Bora and Peter Weingart (UniversitätBielefeld, Germany), John Roemer (Yale University) andBart Verspagen (UNU-MERIT) for helpful suggestions anddetailed comments. Seminar and conference participants atthe University of Milano, UNESCO Section of Lucera, AISSEC2011 (Università degli Studi di Macerata, Italy) providedstimulating discussions. I thank Diego Margon and SilvanaZelli for capable research assistance, Charla Griffy-Brown(Editor-In-Chief, Technology in Society) and two anony-mous referees for detailed comments. I gratefullyacknowledge financial support by CNR – National ResearchCouncil of Italy to this research project, which started at theInstitute for Science and Technology Studies of the Uni-versität Bielefeld (Germany) in 2009, and developed at theYale University (USA) in 2011, Georgia Institute of Tech-nology (2012), University of Strasbourg, UNU-MERIT andUniversity of Toronto in 2013. The usual disclaimer applies.
References
[1] Acemoglu D, Johnson S, Robinson J. The colonial origins ofcomparative development: an empirical investigation. Am Econ Rev2001;91(5):1369–401.
[2] Acemoglu D, Johnson S, Robinson JA, Yared P. From education todemocracy? Am Econ Rev 2005;95(2):44–9.
[3] Acemoglu D, Johnson S, Robinson JA, Yared P. Income and de-mocracy. Am Econ Rev 2008;98(3):808–42.
[4] Aghion P, Howitt P. Endogenous growth theory. Cambridge, USA:MIT Press; 1998.
[5] Alesina A, Devleeschauwer A, Easterly W, Kurlat S, Wacziarg R.Fractionalization. J Econ Growth 2003;8(2):155–94.
[6] Archibugi D. Cosmopolitan democracy and its critics: a review. Eur JInt Relat 2004;10(3):437–73.
[7] Audretsch DB, Bönte W, Tamvada PJ. Religion, social class, andentrepreneurial choice. J Bus Ventur 2013;28(6):774–89.
[8] Ausloos M, Petroni F. Statistical dynamics of religion evolutions.Phys A: Stat Mech Appl 2009;388(20):4438–44.
[9] Barro RJ, McCleary R. Religion and economic growth across coun-tries. Am Sociol Rev 2003;68(5):760–81.
[10] Barro RJ, McCleary R. Which countries have state religions. Q J Econ2005;120(4):1331–70.
[11] Barro RJ, Sala-i-Martin X. Economic growth. 2nd ed. McGraw Hill;2004.
[12] Bettendorf L, Dijkgraaf E. Religion and income: heterogeneity be-tween countries. J Econ Behav Org 2010;74(1–2):12–29.
[13] Boserup E. Population and technological change: a study of long-term trends. Chicago: University of Chicago Press; 1981.
[14] CIA world factbook.https://www.cia.gov/library/publications/the-world-factbook/; 2010 (accessed 24.02.2010).
[15] Coccia M. Measuring intensity of technological change: the seismicapproach. Technol Forecast Soc Change 2005;72(2):117–44.
[16] Coccia M. Technometrics: origins, historical evolution and new di-rection. Technol Forecast Soc Change 2005;72(8):944–79.
[17] Coccia M. A new approach for measuring and analyzing patterns ofregional economic growth: empirical analysis in Italy. Ital J Reg Sci(Sci Reg) 2009;8(2):71–95.
[18] Coccia M. What is the optimal rate of R&D investment to maximizeproductivitygrowth?Technol Forecast SocChange2009;76(3):433–46.
[19] Coccia M. Democratization is the driving force for technological andeconomic change. Technol Forecast Soc Change 2010;77(2):248–64.
[20] Coccia M. The asymmetric path of economic long waves. TechnolForecast Soc Change 2010;77(5):730–8.
[21] Coccia M. Energy metrics for driving competitiveness of countries:energy weakness magnitude, GDP per barrel and barrels per capita.Energy Policy 2010;38(3):1330–9.
[22] Coccia M. The interaction between public and private R&D expen-diture and national productivity. Prometheus Crit Stud Innovat2011;29(2):121–30.
[23] Coccia M. Evolutionary trajectories of the nanotechnology researchacross worldwide economic players. Technol Anal Strat Manage2012;24(10):1029–50.
30 Cf. also Alesina et al. [5, pp. 157–158, pp. 165–175] and for ethnicconflict see pp. 179–183.
M. Coccia / Technology in Society 36 (2014) 13–2524

Author's personal copy
[24] Coccia M. Political economy of R&D to support the moderncompetitiveness of nations. Technovation 2012;32(6):329–414.
[25] Coccia M. Driving forces of technological change: the relation be-tween population growth and technological innovation. TechnolForecast Soc Change. http://dx.doi.org/10.1016/j.techfore.2013.06.001; 2013.
[26] Coccia M. The effect of country wealth on incidence of breast cancer.Breast Cancer Res Treat 2013;141(2):225–9.
[27] Coccia M. Religious culture, democratisation and patterns of tech-nological innovation. Int J Sustain Soc (forthcoming 2014).
[28] Deneulin S, Rakodi C. Revisiting religion: development studies thirtyyears on. World Dev 2011;39(1):45–54.
[29] Dixit A. Governance institutions and economic activity. Am EconRev 2009;99(1):5–24.
[30] Elgin Ceyhun, Goksel Turkmen, Gurdal Mehmet Y, Orman Cuneyt.Religion, income inequality, and the size of the government. EconModel 2013;30:225–34.
[31] Freeman C. The economics of innovation. Elgar reference collection.Elgar; 1990.
[32] Glaeser EL, La Porta R, Lopez-de-Silanes F, Shleifer A. Do institutionscause growth? J Econ Growth 2004;9(3):271–303.
[33] Goodman LE. Islamic humanism. Oxford University Press; 2005.[34] Greif A. Cultural beliefs and the organization of society: a historical
and theoretical reflection on collectivist and individualist societies.J Polit Econ 1994;102(5):912–50.
[35] Grossman G, Helpman E. Innovation and growth in the globaleconomy. Cambridge: MIT Press; 1991.
[36] Guiso L, Sapienza P, Zingales L. People’s opium? Religion and eco-nomic attitudes. J Monetary Econ 2003;50(1):225–82.
[37] Guiso L, Sapienza P, Zingales L. Does culture affect economic out-comes? J Econ Perspect 2006;20(2):23–48.
[38] Habermas J. Religion in thepublic sphere. Eur J Philos 2006;14(1):1–25.[39] Herbig PA, Palumbo F. The effect of culture on the adoption process:
a comparison of Japanese and American behavior. Technol ForecastSoc Change 1994;46(1):71–101.
[40] Huff TE. Science and the public sphere: comparative institutionaldevelopment in Islam and the west. Soc Epistemol 1997;11(1):25–37.
[41] Hunt J, Gauthier-Loiselle M. How much does immigration boostinnovation? Am Econ J Macroecon 2010;2(2):31–56.
[42] Iannaccone LR. Introduction to the economics of religion. J. Econ. Lit.1998;36(3):1465–95.
[43] Jansson F, Lindenfors P, Sandberg M. Democratic revolutions asinstitutional innovation diffusion: rapid adoption and survival ofdemocracy. Technol Forecast Soc Change 2013;80(8):1546–56.
[44] Jones CI. R&D-based models of economic growth. J Polit Econ 1995;103(4):759–84.
[45] Kerr W, Lincoln W. The supply side of innovation: H-1B visa reformsand U.S. ethnic invention. J Labor Econ 2010;28(3):473–508.
[46] Kim SW, Douai A. Google vs. China’s “Great Firewall”: ethical implica-tions for free speech and sovereignty. Technol Soc 2012;34(2):174–81.
[47] Knutsen CH. Democracy, state capacity, and economic growth.World Dev March 2013;43:1–18.
[48] Kukla A. Studies in scientific realism. NY: Oxford University Press;1998.
[49] Linstone HA. Multiple perspectives redux. Technol Forecast SocChange 2010;77(4):696–8.
[50] Lucas Jr RE. On the mechanics of economic development. J MonetaryEcon 1988;22(1):3–42.
[51] Maridal JH. Cultural impact on national economic growth. J Socio-Econ 2013:136–46.
[52] McCleary R. Religion and economic development: a two-waycausation. Policy Rev April–May 2008;(148).
[53] McCleary R, Barro R. Religion and economy. J Econ Perspect 2006;20(2):49–72.
[54] McCleary R, Barro R. Religion and political economy in an interna-tional panel. J Sci Study Relig 2006;45(2):149–75.
[55] Mill JS.Essaysonreligions. London: Longmans,Green&Co;1953[1885].[56] Nichols RW. Pluralism in science and technology: arguments for
organizing federal support for R&D around independent missions.Technol Soc 1986;8(1–2):33–63.
[57] Page S. The difference: how the power of diversity creates bettergroups, firms, schools, and societies. Princeton, N.J.: Princeton Uni-versity Press; 2007.
[58] Persson T, Tabellini G. Democracy and development: the devil in thedetails. Am Econ Rev 2006;96(2):319–24.
[59] Petrakis P, Kostis P. Economic growth and cultural change. J Socio-Econ. http://dx.doi.org/10.1016/j.socec.2013.02.011; 2013 (in press).
[60] Rivers TJ. Technology and religion: a metaphysical challenge.Technol Soc 2006;28(4):517–31.
[61] Roy R. Religious commitment and its interaction with scientificprofessions: a low-church real-science, critique of ‘science’ and‘spirituality’. Technol Soc 1999;21(4):417–25.
[62] Saliba G. Islamic science and the making of the European renais-sance. MIT Press; 2011.
[63] Seymour Lipset M. Some social requisites of democracy: economicdevelopment and political legitimacy. Am Polit Sci Rev 1959;53(1):69–105.
[64] Spolaore E, Wacziarg R. How deep are the roots of economicdevelopment? J Econ Lit 2013;51(2):1–45.
[65] Steil B, Victor DG, Nelson RR, editors. Technological innovation andeconomic performance. Princeton (USA): Princeton UniversityPress; 2002.
[66] Tanaka K. Limitations for measuring religion in a different culturalcontext – the case of Japan. Soc Sci J 2010;47(4):845–52.
[67] Tatum JS. Technology and liberty: enriching the conversation.Technol Soc 1996;18(1):41–59.
[68] Thagard P. Computational philosophy of science. Cambridge, MA,USA: The MIT Press; 1988.
[69] Weber M. The protestant ethnic and the spirit of capitalism. Lon-don: Unwin; 1956 [1905].
[70] Weick KE. Theory construction as disciplined imagination. AcadManage Rev 1989;14(4):516–31.
[71] World Bank. World development indicators on CD-ROM. Wash-ington D.C.: The World Bank; 2009.
M. Coccia / Technology in Society 36 (2014) 13–25 25