Reliability of the liner system using the response surface method
10
Environmental Geotechnics Reliability of the liner system using the response surface method Santhosh and Sivakumar Babu Environmental Geotechnics http://dx.doi.org/10.1680/envgeo.13.00002 Paper 13.00002 Received 14/03/2013; accepted 13/06/2013 Keywords: groundwater/landfill/risk & probability analysis ICE Publishing: All rights reserved 1 2 1 Reliability of the liner system using the response surface method Notation C contaminant concentration C0 initial concentration of the chloride contaminant Cr rate of increase in concentration with time due to the addition of mass C −1 inverse of the covariance matrix of random variables Caq chloride concentration in the base aquifer Caqlim maximum threshold value for chloride concentration in the aquifer (denoted as g(x) in the reliability or probability part) D coefficient of hydrodynamic dispersion or clay diffusion coefficient of the compacted clay liner Dg coefficient of hydrodynamic dispersion or clay diffusion coefficient of the geomembrane e error from other sources F failure region in the transformed space Hb entire thickness of the base strata hb thickness of the base aquifer Hr reference head of the leachate above geomembrane Kd distribution/partitioning (sorption) coefficient of a contaminant L length of the landfill parallel to the base outflow velocity in the aquifer M vector of mean value of random variables n porosity of the compacted clay layer and base soil nb porosity of the base aquifer qc volume of leachate collected per unit area of the landfill per unit time T transpose t time V advective velocity Vb Darcy velocity or base outflow velocity in the aquifer X vector of random variables y surface response z depth below ground level b reliability index f(b ) probability of failure of landfill liner system f(–b ) probability of no failure of landfill liner system µ mean of a variable ρ dry density of the clay soil σ standard deviation of a variable Introduction Landfills are one of the most significant sources of groundwater contamination. Leachate generated due to biodegradation of waste and infiltration of rainwater reaches groundwater through the subsurface soil. Leachate contains dissolved organic matter, inorganic macro components, heavy metals and so on. Among various contaminants, chloride (Cl – ) is an ion that is of great concern, and excess amounts of chloride can make water salty One of the most convenient ways to communicate the risk of groundwater contamination in the vicinity of a landfill is through the use of probability of failure or reliability of the containment system of the landfill. The reliability of the engineered containment system influences the risk of groundwater contamination. In this paper, an approach to understanding the effectiveness of the liner system using the response surface method, taking into consideration the variability of five parameters (initial chloride concentration, clay diffusion coefficient, soil porosity, aquifer porosity and base outflow velocity) is presented. Comparative analysis was performed with respect to the relationship of the reliability index and the coefficient of variation of each variable in order to understand their influence on the reliability of the liner system. The implications of the study are presented here. It may be noted that the developed response surface equations are only valid for the conditions considered in this analysis. 2 G.L. Sivakumar Babu ME, PhD Professor, Department of Civil Engineering, Centre for Sustainable Technologies, Indian Institute of Science, Bangalore, Karnataka, India 1 L.G. Santhosh MTech Research Scholar, Centre for Sustainable Technologies, Indian Institute of Science, Bangalore, Karnataka, India
Transcript of Reliability of the liner system using the response surface method

Environmental Geotechnics
Reliability of the liner system using the response surface methodSanthosh and Sivakumar Babu
Environmental Geotechnicshttp://dx.doi.org/10.1680/envgeo.13.00002Paper 13.00002Received 14/03/2013; accepted 13/06/2013Keywords: groundwater/landfill/risk & probability analysis
ICE Publishing: All rights reserved
1
21
Reliability of the liner system using the response surface method
NotationC contaminant concentrationC0 initial concentration of the chloride contaminantCr rate of increase in concentration with time due to the
addition of massC−1 inverse of the covariance matrix of random variablesCaq chloride concentration in the base aquiferCaqlim maximum threshold value for chloride concentration
in the aquifer (denoted as g(x) in the reliability or probability part)
D coefficient of hydrodynamic dispersion or clay diffusion coefficient of the compacted clay liner
Dg coefficient of hydrodynamic dispersion or clay diffusion coefficient of the geomembrane
e error from other sourcesF failure region in the transformed spaceHb entire thickness of the base stratahb thickness of the base aquiferHr reference head of the leachate above geomembraneKd distribution/partitioning (sorption) coefficient of a
contaminantL length of the landfill parallel to the base outflow velocity
in the aquiferM vector of mean value of random variablesn porosity of the compacted clay layer and base soil
nb porosity of the base aquiferqc volume of leachate collected per unit area of the landfill
per unit timeT transposet timeV advective velocityVb Darcy velocity or base outflow velocity in the aquiferX vector of random variablesy surface responsez depth below ground levelb reliability indexf(b ) probability of failure of landfill liner systemf(–b ) probability of no failure of landfill liner systemµ mean of a variableρ dry density of the clay soilσ standard deviation of a variable
IntroductionLandfills are one of the most significant sources of groundwater
contamination. Leachate generated due to biodegradation of
waste and infiltration of rainwater reaches groundwater through
the subsurface soil. Leachate contains dissolved organic matter,
inorganic macro components, heavy metals and so on. Among
various contaminants, chloride (Cl–) is an ion that is of great
concern, and excess amounts of chloride can make water salty
One of the most convenient ways to communicate the risk of groundwater contamination in the vicinity of a landfill
is through the use of probability of failure or reliability of the containment system of the landfill. The reliability of
the engineered containment system influences the risk of groundwater contamination. In this paper, an approach to
understanding the effectiveness of the liner system using the response surface method, taking into consideration the
variability of five parameters (initial chloride concentration, clay diffusion coefficient, soil porosity, aquifer porosity
and base outflow velocity) is presented. Comparative analysis was performed with respect to the relationship of the
reliability index and the coefficient of variation of each variable in order to understand their influence on the reliability
of the liner system. The implications of the study are presented here. It may be noted that the developed response
surface equations are only valid for the conditions considered in this analysis.
2 G.L. Sivakumar Babu ME, PhD Professor, Department of Civil Engineering, Centre for Sustainable
Technologies, Indian Institute of Science, Bangalore, Karnataka, India
1 L.G. Santhosh MTech Research Scholar, Centre for Sustainable Technologies, Indian Institute
of Science, Bangalore, Karnataka, India
envgeo1300002.indd 1 Manila Typesetting Company 01/10/2014 06:05PM

Environmental Geotechnics Reliability of the liner system using the response surface methodSanthosh and Sivakumar Babu
2
and undrinkable. Not all forms of chlorine are harmful, however,
chloride-containing compounds can pose a risk to human health.
The threshold for chloride concentration in drinking water ranges
from 200 mg/l to 300 mg/l (Bureau of Indian Standards (BIS),
2005, 2009; World Health Organization (WHO), 2011). Rowe
(1991) indicates that a permissible level of 125 mg/l is used to
define the lower bound for drinking water in Canada. One of the
most convenient ways to communicate risk is through the use of
probability, or severity of risk, of chloride contamination, and the
reliability of the containment system of the landfill as an engineered
structure. Quantification and risk assessment of groundwater
contamination, as well as the reliability of the containment system,
play a decisive role in taking remedial measures to reduce adverse
affects on the environment and human health in the vicinity of
landfill sites. Pre-assessment of risk also guides engineers and
policy makers in efficient solid-waste management. Parameters
associated with groundwater contamination are variable in nature.
The effect of this variability needs to be properly analysed to
obtain rational inputs on which landfill design guidelines can be
evaluated.
Literature reviewMany researchers have been working on understanding the
process of contaminant migration in the subsurface environment
through experiments, measurements and modelling. In the analysis
of contaminant migration, chloride is normally chosen as the
contaminant ion on which to evaluate containment system designs
as it is a conservative ion. Measurements of the contamination of
groundwater sources close to landfills due to chloride have been
made in India. Kumar and Alappat (2003) analysed leachate from
the Okhla municipal landfill, New Delhi, and found chloride
concentration in excess of 16 000 mg/l. Mor et al. (2006) indicated
that the high chloride content of groundwater is likely to originate
from pollution sources such as domestic effluents, fertilisers and
septic tanks, as well as from natural sources such as rainfall and
the dissolution of fluid inclusions. Srivastava and Ramanathan
(2008) analysed leachate samples in Delhi and indicated chloride
concentration in the range 4000–4500 mg/l. Venkatesan and
Swaminathan (2009) reviewed the status of contamination of
groundwater in nearby landfill sites due to chloride and sulfate.
Jhamnani and Singh (2009) found a chloride concentration of
4000 mg/l in a leachate sample from the Bhalaswa landfill, Delhi.
Singh and Mittal (2009) conducted tests to analyse the leachate
characteristics of the municipal solid waste (MSW) landfill in
Delhi and reported that chloride concentration varied between
16 000 mg/l and 23 000 mg/l in the area under study. Kanmani and
Gandhimathi (2013) studied the physicochemical characteristics of
leachate and reported that chloride concentration ranges between
1996 mg/l and 6998 mg/l. Ramprasad (2012) characterised
leachate samples from a landfill in Chennai, India, and reported
chloride concentration in the range 1505–1667 mg/l. D’Souza and
Somashekar (2013) analysed the physicochemical characteristics of
leachate samples from various landfills in Bangalore city and found
that the concentration of chloride in the leachate varied between
1300 mg/l and 3900 mg/l.
Gillham et al. (1984) presented advection–dispersion and
advection–diffusion models for contaminant solute transport
process in heterogeneous unconsolidated geological deposits.
Rowe and Booker (1985) described a technique to analyse
contaminant transport from a landfill into a homogeneous clayey
layer in a two-dimensional space, taking into consideration the
concentration of the contaminant as it infiltrates into the soil. They
showed that there is a critical velocity in the aquifer at which the
maximum concentration at a point occurs. They also investigated
contaminant transport through soils, barriers, natural clayey soils,
two- or three-dimensional fractured networks, fractured rock, intact
shale, fractured till, layered zones and clayey silt underlain by fine
sand or silt using numerical and analytical models. Abriola (1987)
presented details on contaminant transport when in an immiscible
phase and in fractured media, along with dispersion modelling and
numerical modelling for saturated groundwater aquifer systems.
Giroud and Bonaparte (1989) modelled and analysed the leakage of
contaminant through geomembrane alone and with low permeable
soil layers assuming perfect contact and interface flow between the
layers in two- and three-dimensional space. Reddi and Scarlatos
(1996) collected actual data and modelled migration of leachate
from 11 landfills in Florida, installed with modern liner systems,
and revealed that the liners provided were effective in preventing
groundwater contamination. Foose et al. (2002) modelled transport
of cadmium and toluene through geomembrane, geosynthetic
clay liner and thick soil barrier using one- and three-dimensional
numerical models under various conditions. Peters et al. (2002)
modelled solute transport through a typical porous medium from
an engineered landfill, considering the porous medium to be
rigid material. El-Zein (2008) developed an approach to study
time-dependent contaminant migration through composite liners
with leaking geomembranes for various combinations of system
conditions, state of waste, constant mass of contaminants in the
waste, steady-state or transient flow in the geomembrane and
steady-state or transient seepage velocities in the mineral liner. Du
et al. (2008) evaluated the performance of the German standard
MSW landfill bottom liner system and compared two types of
bottom liner systems considering the one-dimensional advection–
diffusion–dispersion theory of contaminant transport process.
Varank et al. (2011) carried out field studies on four identical
pilot-level landfill reactors with different alternative composite
liners. These were operated simultaneously over a period of about
540 days to investigate and simulate the migration behaviours of
phenolic compounds and heavy metals from the landfill leachate to
the groundwater.
Several methods of risk and reliability analysis are available in
the literature. The most widely used methods are the Monte Carlo
simulation, first-order reliability method (FORM) and second-order
reliability method (SORM). Many researchers have used these
methods to predict uncertainties involved in the parameters that
influence contaminant transport. Jim Yeh (1992) made an attempt
to understand the uncertainties in predictions and estimations of
groundwater flow and solute transport using stochastic modelling
techniques. Jang et al. (1994) applied FORM and SORM to
envgeo1300002.indd 2 Manila Typesetting Company 01/10/2014 06:05PM envgeo1300002.indd 3 Manila Typesetting Company 01/10/2014 06:05PM
Environmental Geotechnics Reliability of the liner system using the response surface methodSanthosh and Sivakumar Babu
3
model contaminant transport probabilistically in one and two
dimensions, taking into account the random spatial variability of
the input parameters, along with their spatial correlation. Adams
(1994) examined the use of the response surface method (RSM) as
a parameter estimation technique for groundwater flow modelling
at a landfill site. The author calibrated three hydraulic parameters
(porosity, transverse permeability and rate of recharge) of an
existing two-dimensional, steady-state flow model. The regression
model showed that the response had a high degree of variability
for transverse permeability. Hamed and Bedient (1999) presented
a probabilistic modelling tool based on FORM and SORM to ana-
lyse uncertainty involved in the contaminant transport process. This
methodology was also applied to analytical groundwater models to
provide a simple screening tool for the assessment of contamination
and remediation. In addition, numerical-analysis-based reliability
models were developed to account for aquifer spatial heterogeneity
and correlation structure in more complex systems. Ranade et al.
(2010) described the use of stochastic response surface technique
to estimate the uncertainty in groundwater modelling. Datta and
Kushwaha (2011) studied the importance of various hydrogeologic
parameters in the uncertainty assessment of the contaminant
concentration using stochastic response methodology.
Though measurements and modelling tools are available, there is a
need to develop a methodology to assess the integrity of the landfill
liner system.
ObjectivesThe reported case studies of contamination of groundwater in India
presented in Section 1×1 highlight the need for a methodology
for reliability analysis of liners in landfills. In this paper, an
approach to assess the risk of the landfill liner system contributing
to groundwater contamination due to chloride migration near a
landfill site is presented. The approach uses the response surface
equations obtained from RSM, which are subsequently used for
reliability analysis. It may be noted that the developed response
surface equations are only valid for the conditions considered in
this analysis.
MethodologyModeling of contaminant transport beneath landfill siteBiodegradation of MSW stored in landfills generates a huge quantity
of leachate. This degradation process in the landfill is very complex
and continues for a very long time. The contaminant transport
process is difficult to understand due to the complex matrix of
the waste mass and the heterogeneity of the subsurface soil. The
single composite liner landfill model shown in Figure 1 consists
of an upper component of a flexible-membrane liner and a lower
component of compacted clay layer (CCL) and is considered for
one-dimensional modelling in the computer program POLLUTE
v7 (SSG, 2012). Assuming uniform groundwater velocity (V) and
linear sorption of contaminant, the governing equation for one-
dimensional contaminant migration for an intact material, as given
by Rowe and Booker (1985, 1987, 1991), is
1.
2
2
ddC d C dC K dCD V
dt dz n dzdz
ρ= - -
The top boundary is assumed to have finite mass, in which case
the source concentration starts at C0, increases linearly with time
Finite mass
10·0-m-thick municipal solid waste
1·524-mm-thick geomembrane
1·0-m-thick compacted clay liner
5·0-m-thick clayey soil(attenuation layer)
3·0-m-thick alluvial aquifer
Fixed base outflow
1·0 m
Figure 1. Cross-section of the single composite liner landfill model
envgeo1300002.indd 2 Manila Typesetting Company 01/10/2014 06:05PM envgeo1300002.indd 3 Manila Typesetting Company 01/10/2014 06:05PM

Environmental Geotechnics Reliability of the liner system using the response surface methodSanthosh and Sivakumar Babu
4
at a rate of Cr and then decreases with time t as contaminant is
transported into the soil and collected by a leachate-collection
system (1) if present. Therefore, the concentration at the top
boundary is given by
2. c
0 r
r r
1( ) ( , ) ( ) .
t t
o o
qC t C C t f C t dt C t dt
H H
= + - -ò ò
The bottom boundary is assumed to have a fixed outflow to
represent a base aquifer, where the concentration varies with time
as contaminant mass is transported into the aquifer from the landfill
and transported out of the aquifer with velocity Vb. Consideration of
the conservation of mass gives the base concentration as
3. b b b
b
b b b0
( , , ( , )( , )
t
f t z H C V C t z HC t z H dt
n h n L
ì ü= == = -í ýî þ
ò
To model the one-dimensional contaminant migration process
through the clayey subsurface soil mass, a landfill with a length
of 700 m and a width of 1 m is considered as the source of
contamination. The longitudinal dimension of the landfill is parallel
to the groundwater table. The Resource Conservation and Recovery
Act, Subtitle D (USC, 1976) Landfill consists of a composite liner
and leachate-collection system. The contaminant source type is
assumed to be a finite mass with a waste thickness of 10 m. The unit
weight of MSW varies between 5 kN/m3 and 10×4 kN/m
3 (Zekkos
et al., 2006). Kavazanjian et al. (1995) studied the variation of waste
properties in landfills and indicated that the unit weight of MSW
varied from 6 kN/m3 at the surface to about 13 kN/m
3 at depths of
45 m or greater. Therefore, in this study, the unit weight of the waste
is taken as 6 kN/m3. Moo-Young et al. (2004) reviewed the literature
to characterise infiltration rates from landfill liners and indicated that
average infiltration rates through the CCL range 1×6 × 10−9
cm/s to
1×2 × 10−6
cm/s, with an average of 3×1 × 10−7
cm/s. Therefore, in
this study, an infiltration rate of 4×75 × 10−8
cm/s is assumed. Rowe
(1995) reported that chloride constitutes about 0×07–0×21% of the in
situ mass of waste with 0×18% as the most probable value and 0×2%
as a reasonable value for leachable chloride mass. Based on this,
the mass of the chloride contaminant is taken as 0×2% of the total
mass of the waste. In India, leachate-collection systems are neither
effectively installed nor efficiently working to remove the stagnant
leachate from the bottom of the waste matrix. Hence the leachate-
collection system is not considered for modelling of the contaminant
transport process in the present study. Based on the available
literature, an initial chloride concentration of 1500 mg/l to 4000 mg/l
with a standard deviation of 622 mg/l is considered for analysis.
The hydraulic head of the leachate above the geomembrane is
taken as 1 m. Geomembrane placed above the 1-m-thick clay
liner has a thickness of 1×52 mm. The diffusion coefficient for
the geomembrane is assumed to be 3 × 10⁻⁵
m2/year. Leakage
through the defects in a composite liner system is computed
using the equations given by Rowe et al. (2004). Porosity of the
clayey soil varied between 0×4 and 0×6 and is in accordance
with the study by Adams (1994). Giroud and Bonaparte (1989)
indicated that three to five defects per hectare can be expected
even when the geomembrane is installed well above the CCL.
The number of defects in the geomembrane per hectare is taken
as 2×5, with radius, transmissivity and conductivity of 5×64 mm,
1 × 10⁻¹⁰
m2/s and 0×1 mm/s respectively (Rowe et al., 2004). The
bulk density and hydraulic conductivity for 1-m thick CCL below
the geomembrane and 5-m thick clayey soil mass (attenuation
layer) are taken as 19 kN/m3 and 1 × 10
–9 m/s respectively. In
clayey soils, the coefficient of hydrodynamic dispersion is often
controlled by the diffusion coefficient, and the coefficient of
mechanical dispersion is negligible. Therefore, the study is carried
out considering the clay diffusion coefficient D values in the
range 0×018–0×020 m2/year as determined by Rowe and Booker
(1987). With the chloride ion being a conservative contaminant
(no sorption), the value of Kd is taken as zero for both the CCL and
the attenuation layer (Rowe, 1995). The thickness of the alluvial
aquifer is considered as 3 m with porosity nb in the range 0×2–0×4
(Adams, 1994; Rowe and Booker 1985). A summary of the input
values for each variable is presented in Table 1. It is difficult to
determine the values of the base flow velocity (Rowe, 1995),
Landfill component Value
Source Landfill length 700.0 mLandfill width 1.0 mSource type Finite mass
Waste thickness 10.0 mWaste density 6 kN/m3
Per cent of mass 0.2Hydraulic head Leachate head on
primary landfill liner1.0 m
Groundwater level relative to top of the
aquifer
0.0 m
Geomembrane Thickness 1.52 mmDiffusion coefficient 3 × 10⁻⁵ m2/year
Leakage Hole frequency 2.5/haHole radius 5.64 mm
Wrinkle radius 5.64 mmTransmissivity 1 × 10⁻¹⁰ m2/sConductivity 0.1 mm/s
Distribution coefficient 0 ml/gClay liner Thickness 1.0 m
Density 19 kN/m3
Conductivity 1 × 10⁻⁹ m/sAquitard (attenuation layer)
Thickness 5.0 mDensity 19 kN/m3
Conductivity 1 × 10⁻⁷ m/sAquifer Thickness 3.0 m
Table 1. Summary of input values considered for modeling
envgeo1300002.indd 4 Manila Typesetting Company 01/10/2014 06:05PM envgeo1300002.indd 5 Manila Typesetting Company 01/10/2014 06:05PM

Environmental Geotechnics Reliability of the liner system using the response surface methodSanthosh and Sivakumar Babu
5
and the velocity of the water is very slow in the alluvial aquifer.
Hence, the value of the base flow velocity is considered to be in
the range 3×5–4×5 m/year.
Response surface methodThe RSM is a collection of mathematical and statistical techniques
useful in a situation where a greater number of variables are
potentially influencing or controlling the outcome response of the
process. It can be found from the literature that many researchers
have applied RSM in various fields to develop, improve and optimise
the performance measure or the quality characteristic of the process
that involves uncertainties in the variables. In this study, using the
RSM, an approximate explicit functional relationship between the
output response – that is, chloride contaminant concentration in the
aquifer (Caq) – and input variables x1, x2, x3, x4 and x5 for initial
chloride concentration C0 (mg/l), clay diffusion coefficient D (m2/
year), soil porosity n, aquifer porosity nb and base outflow velocity
Vb (m/year), respectively, is established using regression analysis
with least-squares error approach. This relationship is termed as a
response surface equation and is given as
4. 1 2 3 4 5( , , , , )y f x x x x x e= +
A normal probability plot that follows a straight line defines the
adequacy of the fitted model and gives a good approximation of
the true system (Babu and Srivastava, 2007). The coefficient of
multiple determination R2 is a measure of the amount of reduction
in the variability of output response y obtained by incorporating the
uncertain variables (Myers and Montgomery, 2002).
In RSM, a single replicate 2n (n is the total number of input variables)
factorial design is used to fit a first-order linear regression model.
For developing a response surface equation, 32 sample points are
required. The upper and lower limits related to the mean (µ) and
standard deviation (σ) can be defined using relationships xu = m +
1×65σ and xl = m – 1×65σ, respectively. The RSM equations are
developed after computing the rate of contamination in the aquifer
(Caq) for each set of sample points. Regression analysis is also
performed to check the adequacy model.
Reliability analysisIt is known that parameters involved in the contamination
migration are random variables and hence the use of reliability
analysis is desirable. For landfills, though many guidelines have
been formulated, there is a need to examine to what extent these
guidelines correspond to reliability-based guidelines, using the
reliability index. The second-moment reliability index b as defined
by Hasofer and Lind (1974) is generally considered to be a better
approach for reliability-based designs in civil engineering (Low and
Tang, 1997). The reliability index b is calculated on the basis of
the matrix formulation for the second moment and Hasofer–Lind
reliability index (b) defined as
5. 1min ( ) ( )
T
X F
X M C X Mβ -Î
= - -
The reliability index b in the present study is defined in terms of
f(b ) exceeding the permissible level of concentration in ground-
water, given that the influencing factors such as C0, D, n, nb and Vb
are random variables.
Variables Mean Standard deviation CoV: % Minimum Maximum Distribution
Initial chloride concentration, C0: mg/l 2750 622 22.6 1723.7 3776.3 NormalClay diffusion coefficient, D: m2/year 0.0190 0.001 5.3 0.0174 0.0207 NormalPorosity, n 0.33 0.013 4.0 0.3036 0.3465 NormalAquifer porosity, nb 0.275 0.0413 15.0 0.2069 0.3431 NormalBase outflow velocity, Vb: m/year 4.00 0.2 5.0 3.67 4.33 Normal
Table 2. Statistics of variables for case I
Variables Mean Standard deviation CoV: % Minimum Maximum Distribution
Initial chloride concentration, C0: mg/l 2750.0 137.5 5.0 2523.13 2976.88 NormalClay diffusion coefficient, D: m2/year 0.019 0.00095 5.0 0.0174 0.0206 NormalPorosity, n 0.325 0.01625 5.0 0.298 0.351 NormalAquifer porosity, nb 0.275 0.01375 5.0 0.252 0.297 NormalBase outflow velocity, Vb: m/year 4.00 0.2 5.0 3.67 4.33 Normal
Table 3. Statistics of variables for case II
envgeo1300002.indd 4 Manila Typesetting Company 01/10/2014 06:05PM envgeo1300002.indd 5 Manila Typesetting Company 01/10/2014 06:05PM

Environmental Geotechnics Reliability of the liner system using the response surface methodSanthosh and Sivakumar Babu
6
Results and discussionThis study has been carried out for two cases. In one case, referred
to as case I, different coefficient of variation (CoV) values based
on the data available in the literature are considered and represent
realistic scenarios. In the second case, referred to as case II, all the
variables are assumed to have a CoV of 5% and is a typical analysis
in reliability calculations. This is done to examine the variation
of regression coefficients in the two cases and the corresponding
effect on reliability analysis results. Statistics of the five variables
for both cases are presented in Tables 2 and 3.
In order to develop a multi-linear response surface model between
input and output variables, 25 = 32 sample points are used. Regression
analysis with the least-squares error method is adopted to fit the
response surface model. Coefficients of multiple determination R2
and adjusted coefficients of multiple determination 2
adjR defining
the adequacy of the fitted linear model are evaluated. Residual
analysis is also performed to check the normality assumption.
Normal probability plots of residuals for case I and case II are
shown in Figures 2 and 3, respectively. These plots approximately
follow a straight line, indicating that the assumption of normality
is satisfactory.
The statistics of the results that show the Caq (at a depth Z = 6 m, on
the top layer of the aquifer) at a time period of 100 years, obtained
from 32 sample points for each of the cases mentioned above, are
tabulated in Table 4.
Accordingly, response surface functions for case I and case II are
formulated using the results of regression analysis for 32 sample
points and are given in Equations 6 and 7, respectively.
6.
Caq = 769×73 + 0×0942C0 + 12 878×79D – 2291×08n
– 670×095nb – 17×55Vb
7.
Caq = 760×78 + 0×0929C0 + 12 806×61D – 2266×69n
– 670×495nb – 16×592Vb
Coefficients of multiple determination R2 and adjusted coefficients
of multiple determination 2
adjR obtained from regression analysis are
presented in Table 5. Statistics of the regression analysis showed
that standard error from the RSM model for case I is greater than
that from the RSM model of case II. Nevertheless, the values of
R2 in both cases are greater than 0×94 and are considered to be
satisfactory.
Reliability analysis is carried out using a spreadsheet algorithm
for FORM in a Microsoft spreadsheet developed by Low and Tang
(2007), solving Equation 5 using the solver tool of the Microsoft
spreadsheet. In order to optimise the reliability index b, the
constraint g(x) = Caqlim = 200 mg/l is considered for both cases.
To identify the influencing variables, further analysis is performed
and variation of the reliability index b with parameters C0, D, n, nb
1009080706050403020100–2 –1·5 –1 –0·5 0 1 2 30·5 1·5 2·5
Residuals
Nor
mal
pro
babi
lity:
%
Figure 3. Normal probability plot of residuals for case II
1009080706050403020100–1·5 –0·5–1 0 1 1·5 2 32·50·5
Nor
mal
pro
babi
lity:
%
Residuals
Figure 2. Normal probability plot of residuals for case I
Regression statistics Case I Case II
Multiple R 0.9762 0.9957R2 0.9529 0.9915Adjusted R2 0.9439 0.9899Standard error 29.5417 7.1211Sample points 32.0 32.0
Table 5. Regression statistics from regression analysis for both cases
Statistics Case I Case II
Mean 273.60 272.30Standard deviation 124.70 70.71CoV: % 45.50 26.00
Table 4. Statistics for contaminant concentration in the aquifer (Caq at Z = 6 m) at a time period of 100 years in both cases
envgeo1300002.indd 6 Manila Typesetting Company 01/10/2014 06:05PM envgeo1300002.indd 7 Manila Typesetting Company 01/10/2014 06:05PM

Environmental Geotechnics Reliability of the liner system using the response surface methodSanthosh and Sivakumar Babu
7
and Vb is obtained. The response pattern in Figure 4 indicates that
an increase in the source concentration of the chloride contaminant
leads to lower values of the reliability index b, indicating higher
risk of groundwater or aquifer contamination.
Diffusion is one of the most prominent mechanisms of the
contaminant transport process. It dominates advection and
dispersion in clayey soil mass. Figure 5 shows that an increase in the
diffusivity of the contaminant through clayey soil will eventually
increase the risk of groundwater contamination.
Figures 6 and 7 show that an increase in soil and aquifer porosity
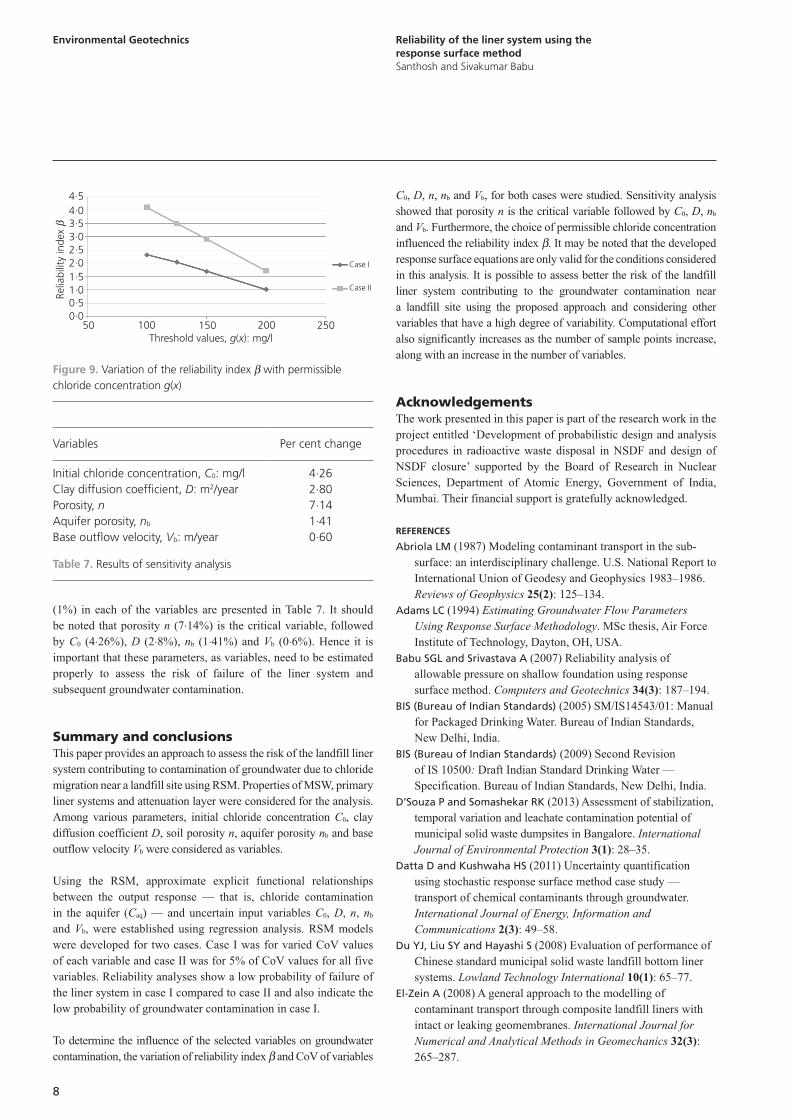
reduces the risk of contamination. Figure 8 indicates that an
increase in the base outflow velocity has no significant influence
on the reliability index b or risk of contamination. Furthermore,
the choices of permissible chloride concentration can influence
the reliability index b, the results of which are presented in Table 6
and Figure 9.
The results of sensitivity analysis expressed in terms of percentage
change in reliability index b as a result of percentage change
2·5
2·0
1·5
1·0
0·5
0·0
Relia
bilit
y in
dex
β
0·0175 0·018 0·019 0·02 0·02050·0185 0·0195
Case I
Case II
Clay diffusion coefficient, D: m2/year
Figure 5. Comparison between the reliability index b and the clay diffusion coefficient D for both cases
2·5
2·0
1·5
1·0
0·5
0·00·305 0·31 0·32 0·33 0·340·315 0·325 0·355 0·345
Soil porosity, n
Case I
Case II
Relia
bilit
y in
dex
β
Figure 6. Comparison between the reliability index b and the soil porosity n for both cases
2·01·81·61·41·21·01·80·60·40·20·0
Relia
bilit
y in
dex
β
3·8 3·9 4 4·1 4·2 4·3 4·4 4·5Base outflow velocity, Vb: m/year
Case II
Case I
Figure 8. Comparison between the reliability index b and the base outflow velocity Vb for both cases
2·5
2·0
1·5
1·0
0·5
0·00·2 0·22 0·24 0·26 0·28 0·3 0·32 0·34 0·36
Aquifer porosity, nb
Relia
bilit
y in
dex
β
Case I
Case II
Figure 7. Comparison between the reliability index b and the aquifer porosity nb for both cases
Cases g(x): mg/l b f(b ): % f(–b ): %
Case I 200 1.014 84.48 15.52150 1.702 95.57 4.43125 2.047 97.97 2.03100 2.319 99.17 0.83
Case II 200 1.7180 95.71 4.28150 2.908 99.82 0.18125 3.503 99.97 0.03100 4.099 99.99 0.01
Table 6. Variation of reliability index with threshold values g(x)
5·0
4·0
3·0
2·0
1·0
0·00 500 1000 1500 2000 2500 3000 3500 4000
Initial chloride concentration, C0: mg/l
Case I
Case II
Relia
bilit
y in
dex
β
Figure 4. Comparison between the reliability index b and the initial chloride concentration C0 for both cases
envgeo1300002.indd 6 Manila Typesetting Company 01/10/2014 06:05PM envgeo1300002.indd 7 Manila Typesetting Company 01/10/2014 06:05PM
Environmental Geotechnics Reliability of the liner system using the response surface methodSanthosh and Sivakumar Babu
8
(1%) in each of the variables are presented in Table 7. It should
be noted that porosity n (7×14%) is the critical variable, followed
by C0 (4×26%), D (2×8%), nb (1×41%) and Vb (0×6%). Hence it is
important that these parameters, as variables, need to be estimated
properly to assess the risk of failure of the liner system and
subsequent groundwater contamination.
Summary and conclusionsThis paper provides an approach to assess the risk of the landfill liner
system contributing to contamination of groundwater due to chloride
migration near a landfill site using RSM. Properties of MSW, primary
liner systems and attenuation layer were considered for the analysis.
Among various parameters, initial chloride concentration C0, clay
diffusion coefficient D, soil porosity n, aquifer porosity nb and base
outflow velocity Vb were considered as variables.
Using the RSM, approximate explicit functional relationships
between the output response — that is, chloride contamination
in the aquifer (Caq) — and uncertain input variables C0, D, n, nb
and Vb, were established using regression analysis. RSM models
were developed for two cases. Case I was for varied CoV values
of each variable and case II was for 5% of CoV values for all five
variables. Reliability analyses show a low probability of failure of
the liner system in case I compared to case II and also indicate the
low probability of groundwater contamination in case I.
To determine the influence of the selected variables on groundwater
contamination, the variation of reliability index b and CoV of variables
C0, D, n, nb and Vb, for both cases were studied. Sensitivity analysis
showed that porosity n is the critical variable followed by C0, D, nb
and Vb. Furthermore, the choice of permissible chloride concentration
influenced the reliability index b. It may be noted that the developed
response surface equations are only valid for the conditions considered
in this analysis. It is possible to assess better the risk of the landfill
liner system contributing to the groundwater contamination near
a landfill site using the proposed approach and considering other
variables that have a high degree of variability. Computational effort
also significantly increases as the number of sample points increase,
along with an increase in the number of variables.
AcknowledgementsThe work presented in this paper is part of the research work in the
project entitled ‘Development of probabilistic design and analysis
procedures in radioactive waste disposal in NSDF and design of
NSDF closure’ supported by the Board of Research in Nuclear
Sciences, Department of Atomic Energy, Government of India,
Mumbai. Their financial support is gratefully acknowledged.
REFEREnCES
Abriola LM (1987) Modeling contaminant transport in the sub-
surface: an interdisciplinary challenge. U.S. National Report to
International Union of Geodesy and Geophysics 1983–1986.
Reviews of Geophysics 25(2): 125–134.
Adams LC (1994) Estimating Groundwater Flow Parameters
Using Response Surface Methodology. MSc thesis, Air Force
Institute of Technology, Dayton, OH, USA.
Babu SGL and Srivastava A (2007) Reliability analysis of
allowable pressure on shallow foundation using response
surface method. Computers and Geotechnics 34(3): 187–194.
BIS (Bureau of Indian Standards) (2005) SM/IS14543/01: Manual
for Packaged Drinking Water. Bureau of Indian Standards,
New Delhi, India.
BIS (Bureau of Indian Standards) (2009) Second Revision
of IS 10500: Draft Indian Standard Drinking Water —
Specification. Bureau of Indian Standards, New Delhi, India.
D’Souza P and Somashekar RK (2013) Assessment of stabilization,
temporal variation and leachate contamination potential of
municipal solid waste dumpsites in Bangalore. International
Journal of Environmental Protection 3(1): 28–35.
Datta D and Kushwaha HS (2011) Uncertainty quantification
using stochastic response surface method case study —
transport of chemical contaminants through groundwater.
International Journal of Energy, Information and
Communications 2(3): 49–58.
Du YJ, Liu SY and Hayashi S (2008) Evaluation of performance of
Chinese standard municipal solid waste landfill bottom liner
systems. Lowland Technology International 10(1): 65–77.
El-Zein A (2008) A general approach to the modelling of
contaminant transport through composite landfill liners with
intact or leaking geomembranes. International Journal for
Numerical and Analytical Methods in Geomechanics 32(3):
265–287.
Variables Per cent change
Initial chloride concentration, C0: mg/l 4.26Clay diffusion coefficient, D: m2/year 2.80Porosity, n 7.14Aquifer porosity, nb 1.41Base outflow velocity, Vb: m/year 0.60
Table 7. Results of sensitivity analysis
4·54·03·5
2·5
1·51·00·50·0
3·0
2·0
50 100 150 200 250
Case II
Case I
Threshold values, g(x): mg/l
Relia
bilit
y in
dex
β
Figure 9. Variation of the reliability index b with permissible chloride concentration g(x)
envgeo1300002.indd 8 Manila Typesetting Company 01/10/2014 06:05PM envgeo1300002.indd 9 Manila Typesetting Company 01/10/2014 06:05PM
Environmental Geotechnics Reliability of the liner system using the response surface methodSanthosh and Sivakumar Babu
9
Foose GJ, Benson CH and Edil TB (2002) Comparison of solute
transport in three composite liners. Journal of Geotechnical
and Geoenvironmental Engineering 128(5): 391–403.
Gillham RW, Sudicky EA, Cherry JA and Frind EO (1984)
An advection–diffusion concept for solute transport in
heterogeneous unconsolidated geological deposits. Water
Resources Research 20(3): 369–378.
Giroud JP and Bonaparte R (1989) Leakage through liners
constructed with geomembrane part II. Composite liners.
Geotextiles and Geomembranes 8(2): 71–111.
Hamed MM and Bedient PB (1999) Reliability-Based
Uncertainty Analysis of Groundwater Contaminant Transport
and Remediation. National Risk Management Research
Laboratory, U.S. Environmental Protection Agency,
Washington, DC, USA, EPA/600/R-99/028.
Hasofer AM and Lind NC (1974) Exact and invariant second
moment code format. Journal of Engineering Mechanics
100(1): 111–121.
Jang Y-S, Sitar N and Der Kiureghian A (1994) Reliability analysis
of contaminant transport in saturated porous media. Water
Resources Research 30(8): 2435–2448.
Jhamnani B and Singh SK (2009) Groundwater contamination due
to Bhalaswa landfill site in New Delhi. International Journal
of Civil and Environmental Engineering 1(3): 121–125.
Jim Yeh TC (1992) Stochastic modelling of groundwater flow and
solute transport in aquifers. Journal of Hydrological Processes
6(4): 369–395.
Kanmani S and Gandhimathi R (2013) Assessment of heavy metal
contamination in soil due to leachate migration from an open
dumping site. Applied Water Science 3(1): 193–205.
Kavazanjian E Jr, Matacsovic N, Bonaparte R and Schmertmann
GR (1995) Evaluation of MSW properties for seismic
analysis. In Geoenvironment 2000 (Acar YB and Daniel
DE (eds)). American Society of Civil Engineers, New York,
NY, USA, Geotechnical Special Publication 46, vol. 2,
pp. 1126–1141.
Kumar D and Alappat BJ (2003) Analysis of leachate
contamination potential of a municipal landfill using leachate
pollution index. In Workshop on Sustainable Landfill
Management, Chennai, India (Kurian J, Nagendran R,
Palanivelu K and Thanasekaran K (eds.)). Allied Publishers
Pvt Limited, Chennai, India. pp. 147–153.
Low BK and Tang WH (1997) Efficient reliability evaluation using
spreadsheet. Journal of Engineering Mechanics — ASCE
123(7): 749–752.
Moo-Young H, Johnson B, Johnson A et al. (2004)
Characterization of infiltration rates from landfills: supporting
groundwater modeling efforts. Journal of Environmental
Monitoring and Assessment 96(1–3): 283–311.
Mor S, Ravindra K, Dahiya RP and Chandra A (2006) Leachate
characterization and assessment of groundwater pollution near
municipal solid waste landfill site. Journal of Environmental
Monitoring and Assessment 118(1–3): 435–456.
Myers RH and Montgomery DC (2002) Response Surface
Methodology, 2nd edn. Wiley, New York, NY, USA.
Peters GP and Smith DW (2002) Solute transport through
a deforming porous medium. International Journal for
Numerical and Analytical Methods in Geomechanics 26(7):
683–717.
Ramprasad C (2012) Electrochemical treatment of landfill
leachate. International Journal of Applied Sciences and
Engineering Research 1(2): 57–67.
Ranade AK, Pandey M and Datta D (2010) Stochastic response
surface based simulation of groundwater modeling. In
International Conference on Modeling, Optimization and
Computing (Paruya S, Kar S and Roy S (eds.)). American
Institute of Physics, Melville, New York., pp. 213–218.
Reddi VJ and Scarlatos PD (1996) Leachate leakage from landfills
with modern liner systems. Water Resources Bulletin,
American Water Resources Association 32(4): 697–709.
Rowe RK (1991) Contaminant impact assessment and the
contaminating lifespan of landfills. Canadian Journal of Civil
Engineering 18(2): 244–253.
Rowe RK (1995) Leachate characteristics of MSW landfills. In
Proceedings of the Fifth International Landfill Symposium,
Sarbiniaʼ95, Cagliari, Italy. 2: 327–344.
Rowe RK and Booker JR (1985) Two-dimensional pollutant
migration in soils of finite depth. Canadian Geotechnical
Journal 22(4): 429–436.
Rowe RK and Booker JR (1987) An efficient analysis of pollutant
migration through soil. In Numerical Methods in Transient
and Coupled Systems (Lewis RW, Hinton E, Bettess P and
Schrefler BA (eds.)). Wiley, Chichester, UK, chapter 2,
pp. 13–42.
Rowe RK and Booker JR (1991) Pollutant migration through
liner underlain by fractured soil. Journal of Geotechnical
Engineering — ASCE 117(12): 1902–1919.
Rowe RK, Quigley RM, Brachman RWI and Booker JR (2004)
Barrier Systems for Waste Disposal Facilities. Taylor &
Francis, London, UK.
Singh V and Mittal AK (2009) Toxicity analysis and public health
aspects of municipal landfill leachate: a case study of Okhla
landfill, Delhi. In Proceedings of the 8th World Wide Workshop
for Young Environmental Scientists WWW-YES 2009: Urban
Waters: Resource or Risks? Arcueil, France (Thevenot D
(ed.)). pp. 1–8.
SSG (Scientific Software Group) (2012) POLLUTE, v. 7.
Scientific Software Group, Sandy, UT, USA.
Srivastava SK and Ramanathan AL (2008) Geochemical
assessment of groundwater quality in vicinity of Bhalswa
landfill, Delhi, India, using graphical and multivariate
statistical methods. Journal of Environmental Geology 53(7):
1509–1528.
USC (United States Congress) (1976) Resource Conservation and
Recovery Act of 1976, Public Law 94-580, 90 STAT. 2795,
96th Congress, October 21, 1976. United States Congress,
Washington, DC, USA.
Varank G, Demir A, Top S et al. (2011) Migration behavior of
landfill leachate contaminants through alternative composite
liners. Science of the Total Environment 409(17): 3183–3196.
envgeo1300002.indd 8 Manila Typesetting Company 01/10/2014 06:05PM envgeo1300002.indd 9 Manila Typesetting Company 01/10/2014 06:05PM
10
WHAT DO YOU THINK?
To discuss this paper, please submit up to 500 words to the editor at www.editorialmanager.com/envgeo by 1 January 2014. Your contribution will be forwarded to the author(s) for a reply and, if considered appropriate by the editorial panel, will be published as a discussion in a future issue of the journal.
Environmental Geotechnics Reliability of the liner system using the response surface methodSanthosh and Sivakumar Babu
Venkatesan G and Swaminathan G (2009) Review of chloride
and sulphate attenuation in groundwater nearby solid waste
landfill sites. Journal of Environmental Engineering and
Landscape Management 17(1): 1–7.
WHO (World Health Organization) (2011) Guidelines for
Drinking-water Quality, 4th edn. World Health Organization,
Geneva, Switzerland.
Zekkos D, Bray JD, Kavazanjian E Jr et al. (2006) Unit weight
of municipal solid waste. Journal of Geotechnical and
Geoenvironmental Engineering 132(10): 1250–1261.
envgeo1300002.indd 10 Manila Typesetting Company 01/10/2014 06:05PM