Bulk and surface mechanical properties of clay modified HDPE used in liner applications
13
Bulk and Surface Mechanical Properties of Clay Modified HDPE used in Liner Applications Jimoh K. Adewole, 1 Usamah A. Al-Mubaiyedh, 1 Anwar Ul-Hamid, 2 Abdulhadi A. Al-Juhani 2 and Ibnelwaleed A. Hussein 1 * 1. Department of Chemical Engineering, King Fahd University of Petroleum & Minerals, Dhahran 31261, Saudi Arabia 2. Center of Engineering Research, Research Institute, King Fahd University of Petroleum & Minerals, Dhahran 31261, Saudi Arabia High-density polyethylene (HDPE)/clay nanocomposites were prepared by melt blending process. The HDPE was mixed with different organ- oclays and polyethylene-grafted-maleic anhydride was used as a compatibiliser. A masterbatch procedure was used to obtain final organoclays concentrations of 1, 2.5 and 5 wt%. The effects of various types of nanoclays and their concentrations on morphological, thermal and mechanical properties of nanocomposites were investigated. Surface mechanical properties such as instrumented nanohardness, modulus of elasticity and creep were also measured using a nanoindentation technique. Young’s, storage and loss moduli, were found to be higher than that of the neat polymer at low loading (2.5 wt%) for clay Cloisite 15A and at higher loading (5 wt%) for clay Nanomer 1.44P. The ultimate strength and the toughness decreased slightly compared to pure HDPE. The differential scanning calorimetry analysis revealed that the peak temperature of the nanocomposites increased with increased clay content while the crystallinity decreased. Also, dynamic mechanical analysis revealed the storage and loss moduli are enhanced by addition of nanoclay. Both mechanical and thermal properties of HDPE/Nanomer 1.44P nanocomposite showed interesting trends. All properties first dropped when 1 wt% of the clay was added. Thereafter, a gradual increase or decrease then followed as the loading of Nanomer was increased. These trends were observed for all mechanical properties. The results obtained from nanoindentation tests for surface mechanical properties also showed similar trend to that of bulk measurements. Based on these measurements a nanoclay additive for a liner grade HDPE was selected. Keywords: polyethylene, organoclay, nanocomposites, dynamic mechanical analysis, thermal properties, nanoindentation INTRODUCTION A new class of polymer composites has emerged in which the reinforcing phase has the dimensions in nanometric scale (Giannelis, 1996; Hocine, 2010). These new composites (nanocomposites) offer significantly enhanced mechanical prop- erties due to the high aspect ratio and the high surface area of the dispersed nanosized particles. The reinforcement efficiency of nanocomposites with 2–6% of anisotropic nanoparticles can in some situations match that of conventional composites with 40–50% of loading with classical fillers. Various nanoreinforce- ments are currently being developed; however, layered silicate clay minerals are the most popular due to their availability (nat- ural source), low cost, high aspect ratio, high-surface area and more importantly environmental friendliness (Ray and Okamoto, 2003). In reality, the mechanical behaviour of polymer–nanofiller com- posites is controlled by several microsructural parameters which include the properties of the matrix and the fillers, as well as the methods of processing employed (Hocine, 2010). Layered sil- icates are known to be hydrophilic while on the contrary most of the engineering polymers are hydrophobic (Tjong, 2006). Thus, it becomes difficult to obtain a good dispersion of clay particles in most polymers due to the intrinsic incompatibility between the clay and the polymers. In order to have a successful development of clay-based nanocomposites, natural clays are often chemi- cally modified through an ion exchange reaction (Hwang et al., 2008; Mittal, 2010). With such modification full advantage of the ∗ Author to whom correspondence may be addressed. E-mail address: [email protected] Can. J. Chem. Eng. 9999:1–13, 2011 © 2011 Canadian Society for Chemical Engineering DOI 10.1002/cjce.20619 Published online in Wiley Online Library (wileyonlinelibrary.com). | VOLUME 9999, 2011 | | THE CANADIAN JOURNAL OF CHEMICAL ENGINEERING | 1 |
-
Upload
independent -
Category
Documents
-
view
5 -
download
0
Transcript of Bulk and surface mechanical properties of clay modified HDPE used in liner applications
Bulk and Surface Mechanical Properties ofClay Modified HDPE used in Liner ApplicationsJimoh K. Adewole,1 Usamah A. Al-Mubaiyedh,1 Anwar Ul-Hamid,2
Abdulhadi A. Al-Juhani2 and Ibnelwaleed A. Hussein1*
1. Department of Chemical Engineering, King Fahd University of Petroleum & Minerals, Dhahran 31261, Saudi Arabia
2. Center of Engineering Research, Research Institute, King Fahd University of Petroleum & Minerals, Dhahran 31261, SaudiArabia
High-density polyethylene (HDPE)/clay nanocomposites were prepared by melt blending process. The HDPE was mixed with different organ-oclays and polyethylene-grafted-maleic anhydride was used as a compatibiliser. A masterbatch procedure was used to obtain final organoclaysconcentrations of 1, 2.5 and 5 wt%. The effects of various types of nanoclays and their concentrations on morphological, thermal and mechanicalproperties of nanocomposites were investigated. Surface mechanical properties such as instrumented nanohardness, modulus of elasticity andcreep were also measured using a nanoindentation technique. Young’s, storage and loss moduli, were found to be higher than that of the neatpolymer at low loading (2.5 wt%) for clay Cloisite 15A and at higher loading (5 wt%) for clay Nanomer 1.44P. The ultimate strength and thetoughness decreased slightly compared to pure HDPE. The differential scanning calorimetry analysis revealed that the peak temperature of thenanocomposites increased with increased clay content while the crystallinity decreased. Also, dynamic mechanical analysis revealed the storageand loss moduli are enhanced by addition of nanoclay. Both mechanical and thermal properties of HDPE/Nanomer 1.44P nanocomposite showedinteresting trends. All properties first dropped when 1 wt% of the clay was added. Thereafter, a gradual increase or decrease then followed as theloading of Nanomer was increased. These trends were observed for all mechanical properties. The results obtained from nanoindentation tests forsurface mechanical properties also showed similar trend to that of bulk measurements. Based on these measurements a nanoclay additive for aliner grade HDPE was selected.
Keywords: polyethylene, organoclay, nanocomposites, dynamic mechanical analysis, thermal properties, nanoindentation
INTRODUCTION
Anew class of polymer composites has emerged in which thereinforcing phase has the dimensions in nanometric scale(Giannelis, 1996; Hocine, 2010). These new composites
(nanocomposites) offer significantly enhanced mechanical prop-erties due to the high aspect ratio and the high surface area ofthe dispersed nanosized particles. The reinforcement efficiencyof nanocomposites with 2–6% of anisotropic nanoparticles canin some situations match that of conventional composites with40–50% of loading with classical fillers. Various nanoreinforce-ments are currently being developed; however, layered silicateclay minerals are the most popular due to their availability (nat-ural source), low cost, high aspect ratio, high-surface area andmore importantly environmental friendliness (Ray and Okamoto,2003).
In reality, the mechanical behaviour of polymer–nanofiller com-posites is controlled by several microsructural parameters which
include the properties of the matrix and the fillers, as well asthe methods of processing employed (Hocine, 2010). Layered sil-icates are known to be hydrophilic while on the contrary most ofthe engineering polymers are hydrophobic (Tjong, 2006). Thus,it becomes difficult to obtain a good dispersion of clay particlesin most polymers due to the intrinsic incompatibility between theclay and the polymers. In order to have a successful developmentof clay-based nanocomposites, natural clays are often chemi-cally modified through an ion exchange reaction (Hwang et al.,2008; Mittal, 2010). With such modification full advantage of the
∗Author to whom correspondence may be addressed.E-mail address: [email protected]. J. Chem. Eng. 9999:1–13, 2011© 2011 Canadian Society for Chemical EngineeringDOI 10.1002/cjce.20619Published online in Wiley Online Library(wileyonlinelibrary.com).
| VOLUME 9999, 2011 | | THE CANADIAN JOURNAL OF CHEMICAL ENGINEERING | 1 |
potential offered by nanoparticles in areas of improved mechani-cal and thermal properties can be obtained. Up till now, most ofthe claims regarding the improvement of properties of polymerby the addition of nanocomposite seem to plateau at about 4%clay loadings. Higher loadings of ∼7 wt% were reported for veryfew polymers such as Nylon-6 (Nguyen and Baird, 2006). Thishas been linked to the peresence of hydrogen bonding betweenamide groups and nanoclay particles.
Exfoliation of most organoclays in neat polyolefins such aspolypropylene and polyethylene is not very good and far less thanthat observed in polar ploymers like polyamides, polyurethaneand so on. Again, exfoliation can be improved by adding a smallamount (about 1 or 2 wt%) of polyolefins that has been slightlygrafted with maleic anhydride to act as a compatibiliser (Pauland Robeson, 2008). For example, polymer–organoclay affinity isincreased by adding polyethylene-grafted-maleic anhydride (PE-g-MA). An alternative way to improve clay dispersion is the methodof processing. Several studies were conducted on the synthesisand enhancement of properties of polyethylene/nanocompositebut much still need to be done in these areas. Three commonlyused methods of synthesising polymer/clay nanocomposites areintercalation of a suitable monomer and subsequent in situ poly-merisation; intercalation of polymer from solution and polymermelt intercalation (Qi et al., 2006). The drawbacks of the firsttwo methods are the requirement of suitable solvent, high costassociated with the purchase of solvents, their disposal and envi-ronmental impact. In addition, the method of in situ intercalativepolymerisation can lead to formation of exfoliated, intercalatedor agglomerated structures when the clay loading is higherthan 3 wt%. With melt intercalation technique, exfoliation wasobserved at about 5 wt% loading of montmorillonite (Nguyen andBaird, 2006). Consequently, the melt intercalation technique hasbeen employed in this research.
PE is one of the most widely used polyolefin polymers fordomestic and industrial applications such as garbage bags,transparency films, clothing and carpeting fibres, automotiveand aerospace components, videotapes, packaging films andplastic bottles. Thus, PE–clay nanocomposites have recentlyattracted considerable attention due to the need for improvedmechanical and thermal properties. Variety of research is doneon polymer/clay nanocomposite especially on polypropylenenanocomposites. The high-density polyethylenes (HDPEs) havebeen studied to a lower extent (Fujiyama, 2010). Moreover, litera-ture review shows that few of the available research works onpolyethylene–clay nanocomposites have not reported the com-plete behaviour and properties of the PE/nanocomposite. Forexample, the flammability of PE/nanocomposite was studiedby Zhang and Wilkie (2003); and Lotti et al. (2008) carriedout study on rheological, mechanical and transport propertiesusing clay Cloisite 20A, and Pegoretti et al. (2007) investi-gated the microstructural and mechanical charateristics usingclays Cloisite 20A and 15A with focus on the creep behaviour.Also, the work of Qi et al. (2006) on PE–clay nanocompos-ite has focussed on low-density polyetylene using in situ graftmethod.
Cloisite C15A, C10A and 30B were reported to be very goodreinforcing nanoparticles for some polymers up to a maximumloading of about 3 wt% (Innocentini-Mei, 2010). Specifically,C15A has been reported to be suitable for less polar poly-mer while 30B is suitable for more polar ones (Pavlidou andPapaspyrides, 2008). For example, C30B was used by Gonzalez-Vidal et al. (2010) to investigate the preparation, morphology
and properties of poly(hexamethylene terephthalate)–layeredsilicates. Thus, C30B was employed to study its effect onthe compatibilised PE samples produced. Moreover, the effectof the number of alkyl groups attached to the nitrogen ofarganic modifier on exfoliation and improvement of mechani-cal and transport properties was investigated by Hotta and Paul(2004). The authors found out that nanocomposites derivedfrom the organoclay having two alkyl tails (2M2HT) exhib-ited better dispersion and improvement in mechanical propertiesthan those based on organoclays having one alkyl tail. Simi-lar results were obtained by Samak et al. (2008). Thus, C15Awith two alkyl tails was one of the organoclays used in thiswork.
On the other hand, hardness testing is widely used to studythe mechanical properties of metals and ceramics due to adirect correlation between hardness and yield strength of thesematerials. Vickers indentation tests have been used to measurehardness, toughness, residual stress, yielding stress, modulusof elasticity and thermal shock resistance. Similar studies forviscoelastic materials such as polymers and its composites isless common due to its pronounced degree of elastic recov-ery and time-dependent properties. However, it has been shownthat hardness measurements can be correlated with the mechan-ical properties (Balta-Calleja et al., 1995; Flores et al., 2000;Suwanprateeb, 2000a,b) and can also be used to observe changesin the surface morphology and microstructure of polymers(Suwanprateeb, 2004). Application of conventional hardness test-ing techniques for polymer characterisation is limited due totheir high loads, indenter shapes and high hardness range. In thepresent study, instrumented nanoindentation was used to deter-mine the mechanical properties of polymer composite surfaces.This technique employs small loads and miniature indenter tipsthat cannot only measure the hardness but also the modulus ofelasticity and creep deformation of the material surface. The objec-tive of nanohardness measurements was to determine the surfacemechanical behaviour of HDPE nanocomposites and investigatepossible correlation between its surface and bulk properties.
The overall objective of this work is the selection of a proper clayadditive to be used for PE liners used in gas pipelines. These linersusually fail to isolate the sour gas from steel pipes and eventuallythis leads to corrosion of the pipeline. It is essential to understandthe reasons behind the failure of the PE liners. Possible reasonscould be pure mechanical due to stress cycles and creep of poly-mers or the gas may diffuse in the liner due to high pressureor a combination of these two factors. The use of clay additiveswas suggested to improve the mechanical properties of the linerwith especial focus on creep. Also, the use of clay additives isexpected to limit the diffusion of natural gas in the liner. Temper-ature effects are also examined. Therefore, there is a need to screenclays of diffrent structures for potential application as fillers in PEliners. In addition to the decrease in permeability of the resultingPE–clay liner, it is also important to ensure that other essentialproperties such mechanical and thermal properties are not com-promised. In this research, the influence of variuos nanoclayson thermal and mechanical properties of PE–nanocomposite areinvestigated. Four different organically modified nanoclays wereused. These are Cloisite® 10A, Cloisite®15A, Cloisite® 30B andNanomer® 1.44P. Henceforth, these organoclays shall be referredto as C10A, C15A, C15B and N1.44P in this article. Throughoutthe review carried out on this work, we did not come across asingle journal where N1.44P was studied as reinforcing agent forpolyethylene.
| 2 | THE CANADIAN JOURNAL OF CHEMICAL ENGINEERING | | VOLUME 9999, 2011 |
EXPERIMENTAL
MaterialsA HDPE HE3490-LS with melt flow index of 0.25 g/10 min(190◦C/2.16 kg) and density 959 kg/m3 supplied by Borouge Com-pany, Ruwais, UAE was used as matrix. This grade is usually usedfor liner applications. PE-g-MA used was acquired from Aldrich,St. Louis. PE-g-MA contained ∼3 wt% maleic anhydride; its vis-cosity is 1700–4500 cP and melt temperature is 105◦C.
Commercial organoclays—Closite C10A, C15A and C30B weresupplied by Southern Clay Products, Inc., TX and N1.44P byNanocor, Inc., IL, C10A contains dimethyl, benzyl, hydrogenatedtallow, quaternary ammonium (2MBHT) at 125 meq/100 g clayconcentration as organic modifier while 15A contain dimethyldehydrogenated tallow ammonium (2M2HT) at the same con-centration. C30B contains methyl, tallow, bis-2-hydroxyethyl,quaternary ammonium (MT2EtOH) at 90 meq/100 g clay. N1.44Pnanoclay has a quaternary ammonium chemistry-based surfacemodification.
Sample PreparationThe same preparation process was used for all the composites.In accordance with procedure employed by Barick and Tripathy(2010), the clay samples were first dried for 24 h at about 100◦Cprior to blending them with the polymer. Sample of a new poly-mer of PE and PE-g-MA was produced by melt blending 98 wt%HDPE with 2 wt% PE-g-MA (Zhang and Wilkie, 2003). Variuosresearch works has been done using different content of compat-ibiliser in nancomposite preparations (Hotta and Paul, 2004; Leeet al., 2005; Usuki et al., 2005; Pegoretti et al., 2007; Pavlidou andPapaspyrides, 2008). In this work, 2 wt% of PE-g-MA was usedfor preparing the new polymer blend which henceforth will bereffered to as BHDPE. Masterbatches with higher concentrationof organoclay were first prepared. These masterbatches were thendiluted by melt blending with more BHDPE to attain a final com-position of 1, 2.5 and 5 wt% of organoclays with Brabender mixeroperating at a blending temperature of 190◦C for 10 min at 50 rpm.Sheets of various shapes were finally obtained by compressionmoulding in a Carver press.
Mechanical TestingTensile tests were performed using an Instron 5560 Mechani-cal Testing Machine on dumbbell specimens according to ASTMtest standard D-638. All tests were conducted at cross-speed of60 mm/min and gage length of 30 mm. The measured stress/straindata was used to find all the mechanical properties. The Young’smodulus was calculated at 0.20% strain. Minimum of five sampleswere tested for each composition.
Differential Scanning Calorimetry (DSC)DSC measurements were performed using a TA Q1000 instrumentequipped with a liquid nitrogen cooling system and auto sam-pler. Nitrogen at a flow rate of 50 mL/min was used to purge theinstrument to prevent degradation of samples upon thermal treat-ments. The DSC was calibrated in terms of melting temperatureand heat of fusion using a high purity indium standard (156.6◦Cand 28.45 J/g). Universal Analysis software was used to calcu-late the percentage crystallinity using 293 J/g heat of fusion for a100% polyethylene crystal (Blaine, 2010).
Nanocomposite samples (5–10 mg) were sliced and placed ina non-hermetic aluminum pans. To minimise the thermal lagbetween the sample and the pan, samples with flat surface were
used. An empty aluminum pan was used as a reference. First, thebaseline was calibrated using empty crimped aluminum pans. Alltesting was performed in the standard DSC mode between 30 and200◦C using the procedure described in Blaine (2010); and Cuiand Tao (2010).
Dynamic Mechanical AnalysisThe dynamic mechanical behaviour of the PE/clay nanocompos-ites samples obtained from Carver press was measured using TAQ800 DMTA. The dimensions of the rectangular specimens usedare 1 mm × 10 mm × 4 mm (thickness × width × length). Temper-ature step/frequency sweeps and creep tests were performed.
Surface Mechanical PropertiesSurface mechanical properties of the samples were measuredusing a nanoindenter. In a typical instrumented nanoindenta-tion test, the applied normal load and the depth of penetrationis recorded during the measurement while the area of the indentis calculated from the known geometry of the indenter tip. Thesevalues can be plotted to result in load-displacement curves. In thepresent study, three sided diamond pyramid Berkovich indenterwas used. The indenter penetrated the sample at a maximum loadof 20 mN with load/unload speed of 40 mN/min. The indenterremained stationary for 90 s between each loading and unloadingcycle. The hardness, elasticity and creep data were acquired fromthe normal force versus penetration depth curves generated by thecomputer. A set of four indentations was acquired for each test.The nanoindentation method is used to correlate the bulk withnanomechanical properties.
Morphological CharacterisationDegree of clay dispersion in the composites was first investigatedby X-ray diffraction (XRD). The test was conducted on nanoclaypowders, pure HDPE and the nanocomposites using a diffractome-ter with Cu K˛ radiation of � = 1.5406 A, voltage of 40.0 kV andcurrent of 30.0 mA. Samples were scanned in 2� from 1.8◦ to 10◦
at the rate of 1◦/min. The XRD patterns were used to calculated-spacings of the nanocomposites layers using Bragg’s law. Rel-ative intercalation (RI) of the clay in the polymeric matrix wascalculated using Equation (1):
RI =(
d−d0
d0
)100 (1)
where d0 and d are the d-spacings of the pure clay and the clay inthe nanocomposites, respectively (Pegoretti et al., 2007).
SEM was done by first etching the polymer samples. Surfaces oftheses sample were then coated with gold on a JEOL Fine Coat IonSputter JFC −1100 m sputtering equipment. Morphological stud-ies were performed on the chemically etched and gold sputteredsamples using Scanning Electron Microscope.
RESULTS AND DISCUSSIONThe results obtained from various tests were discussed as follows.
Mechanical TestingTable 1 shows the results for mechanical testing. It is evidentthat mechanical properties were markedly promoted by additionof PE-g-MA compatibiliser. The new polymer (BHDPE) is stifferand tougher than pure HDPE. Young modulus increased by ∼5%,
| VOLUME 9999, 2011 | | THE CANADIAN JOURNAL OF CHEMICAL ENGINEERING | 3 |
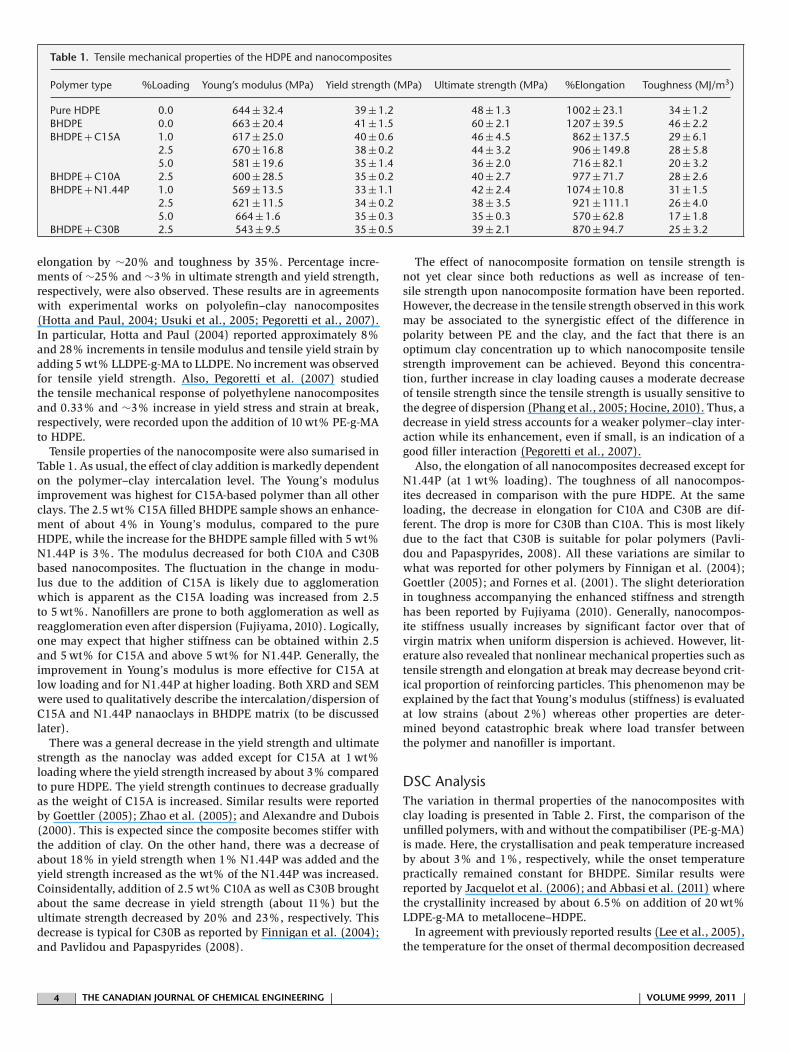
Table 1. Tensile mechanical properties of the HDPE and nanocomposites
Polymer type %Loading Young’s modulus (MPa) Yield strength (MPa) Ultimate strength (MPa) %Elongation Toughness (MJ/m3)
Pure HDPE 0.0 644 ± 32.4 39 ± 1.2 48 ± 1.3 1002 ± 23.1 34 ± 1.2BHDPE 0.0 663 ± 20.4 41 ± 1.5 60 ± 2.1 1207 ± 39.5 46 ± 2.2BHDPE + C15A 1.0 617 ± 25.0 40 ± 0.6 46 ± 4.5 862 ± 137.5 29 ± 6.1
2.5 670 ± 16.8 38 ± 0.2 44 ± 3.2 906 ± 149.8 28 ± 5.85.0 581 ± 19.6 35 ± 1.4 36 ± 2.0 716 ± 82.1 20 ± 3.2
BHDPE + C10A 2.5 600 ± 28.5 35 ± 0.2 40 ± 2.7 977 ± 71.7 28 ± 2.6BHDPE + N1.44P 1.0 569 ± 13.5 33 ± 1.1 42 ± 2.4 1074 ± 10.8 31 ± 1.5
2.5 621 ± 11.5 34 ± 0.2 38 ± 3.5 921 ± 111.1 26 ± 4.05.0 664 ± 1.6 35 ± 0.3 35 ± 0.3 570 ± 62.8 17 ± 1.8
BHDPE + C30B 2.5 543 ± 9.5 35 ± 0.5 39 ± 2.1 870 ± 94.7 25 ± 3.2
elongation by ∼20% and toughness by 35%. Percentage incre-ments of ∼25% and ∼3% in ultimate strength and yield strength,respectively, were also observed. These results are in agreementswith experimental works on polyolefin–clay nanocomposites(Hotta and Paul, 2004; Usuki et al., 2005; Pegoretti et al., 2007).In particular, Hotta and Paul (2004) reported approximately 8%and 28% increments in tensile modulus and tensile yield strain byadding 5 wt% LLDPE-g-MA to LLDPE. No increment was observedfor tensile yield strength. Also, Pegoretti et al. (2007) studiedthe tensile mechanical response of polyethylene nanocompositesand 0.33% and ∼3% increase in yield stress and strain at break,respectively, were recorded upon the addition of 10 wt% PE-g-MAto HDPE.
Tensile properties of the nanocomposite were also sumarised inTable 1. As usual, the effect of clay addition is markedly dependenton the polymer–clay intercalation level. The Young’s modulusimprovement was highest for C15A-based polymer than all otherclays. The 2.5 wt% C15A filled BHDPE sample shows an enhance-ment of about 4% in Young’s modulus, compared to the pureHDPE, while the increase for the BHDPE sample filled with 5 wt%N1.44P is 3%. The modulus decreased for both C10A and C30Bbased nanocomposites. The fluctuation in the change in modu-lus due to the addition of C15A is likely due to agglomerationwhich is apparent as the C15A loading was increased from 2.5to 5 wt%. Nanofillers are prone to both agglomeration as well asreagglomeration even after dispersion (Fujiyama, 2010). Logically,one may expect that higher stiffness can be obtained within 2.5and 5 wt% for C15A and above 5 wt% for N1.44P. Generally, theimprovement in Young’s modulus is more effective for C15A atlow loading and for N1.44P at higher loading. Both XRD and SEMwere used to qualitatively describe the intercalation/dispersion ofC15A and N1.44P nanaoclays in BHDPE matrix (to be discussedlater).
There was a general decrease in the yield strength and ultimatestrength as the nanoclay was added except for C15A at 1 wt%loading where the yield strength increased by about 3% comparedto pure HDPE. The yield strength continues to decrease graduallyas the weight of C15A is increased. Similar results were reportedby Goettler (2005); Zhao et al. (2005); and Alexandre and Dubois(2000). This is expected since the composite becomes stiffer withthe addition of clay. On the other hand, there was a decrease ofabout 18% in yield strength when 1% N1.44P was added and theyield strength increased as the wt% of the N1.44P was increased.Coinsidentally, addition of 2.5 wt% C10A as well as C30B broughtabout the same decrease in yield strength (about 11%) but theultimate strength decreased by 20% and 23%, respectively. Thisdecrease is typical for C30B as reported by Finnigan et al. (2004);and Pavlidou and Papaspyrides (2008).
The effect of nanocomposite formation on tensile strength isnot yet clear since both reductions as well as increase of ten-sile strength upon nanocomposite formation have been reported.However, the decrease in the tensile strength observed in this workmay be associated to the synergistic effect of the difference inpolarity between PE and the clay, and the fact that there is anoptimum clay concentration up to which nanocomposite tensilestrength improvement can be achieved. Beyond this concentra-tion, further increase in clay loading causes a moderate decreaseof tensile strength since the tensile strength is usually sensitive tothe degree of dispersion (Phang et al., 2005; Hocine, 2010). Thus, adecrease in yield stress accounts for a weaker polymer–clay inter-action while its enhancement, even if small, is an indication of agood filler interaction (Pegoretti et al., 2007).
Also, the elongation of all nanocomposites decreased except forN1.44P (at 1 wt% loading). The toughness of all nanocompos-ites decreased in comparison with the pure HDPE. At the sameloading, the decrease in elongation for C10A and C30B are dif-ferent. The drop is more for C30B than C10A. This is most likelydue to the fact that C30B is suitable for polar polymers (Pavli-dou and Papaspyrides, 2008). All these variations are similar towhat was reported for other polymers by Finnigan et al. (2004);Goettler (2005); and Fornes et al. (2001). The slight deteriorationin toughness accompanying the enhanced stiffness and strengthhas been reported by Fujiyama (2010). Generally, nanocompos-ite stiffness usually increases by significant factor over that ofvirgin matrix when uniform dispersion is achieved. However, lit-erature also revealed that nonlinear mechanical properties such astensile strength and elongation at break may decrease beyond crit-ical proportion of reinforcing particles. This phenomenon may beexplained by the fact that Young’s modulus (stiffness) is evaluatedat low strains (about 2%) whereas other properties are deter-mined beyond catastrophic break where load transfer betweenthe polymer and nanofiller is important.
DSC AnalysisThe variation in thermal properties of the nanocomposites withclay loading is presented in Table 2. First, the comparison of theunfilled polymers, with and without the compatibiliser (PE-g-MA)is made. Here, the crystallisation and peak temperature increasedby about 3% and 1%, respectively, while the onset temperaturepractically remained constant for BHDPE. Similar results werereported by Jacquelot et al. (2006); and Abbasi et al. (2011) wherethe crystallinity increased by about 6.5% on addition of 20 wt%LDPE-g-MA to metallocene–HDPE.
In agreement with previously reported results (Lee et al., 2005),the temperature for the onset of thermal decomposition decreased
| 4 | THE CANADIAN JOURNAL OF CHEMICAL ENGINEERING | | VOLUME 9999, 2011 |
Table 2. Thermal properties of nanocomposites for various claycontents
Polymer Nanoclaytype loading (wt%) Xc, (%) Tonset (◦C) Tpeak (◦C)
Pure HDPE 0 65.32 116.34 131.6BHDPE 0 67.05 116.23 132.81BHDPE + C15A 1 63.56 115.81 133.72
2.5 63.69 116.14 132.235 60.36 115.78 133.23
BHDPE + C10A 2.5 62.32 115.93 133.45BHDPE + N1.44P 1 62.35 115.88 134.39
2.5 62.91 116.03 134.85 63.87 115.8 135.03
BHDPE + C30B 2.5 65.14 116.06 133.48
with increasing clay content. The decrease is because the amountof PE-g-MA was fixed for various clay contents and the decrease intemperature might have been caused by difference in the amountof octadecylamine accompanied by an increase in the clay con-tent. There was a decrease in crystallinity for all nanoclay exceptC30B which remain almost constant (0.18% decrease). For C15A,there was practically no change in crystallinity as the loadingwas increase from 1% to 2.5%. Thereafter a decrease of 3.33%was obtained. In the case of N1.44P, the crystallinity first droppedand then gradually increased with increase in the percent load-ing. The increase was more pronounced at higher loading. Forexample, about 0.9% increase in crystallinity was obtained byincreasing the wt% N1.44P loading from 1 to 2.5 whereas 1.53%resulted when the wt% was increased from 2.5 to 5. Similar flunc-tuation in the degree of crystallinity has also been reported byKhumalo et al. (2010). According to the authors, flunctuations aredue to the efficiencies of the nanoparticles as nucleating agents.Also, the presence of nanoclay such as montmorillonite in a poly-olefin enhances its crystallisation rate and reduces its crystalline(spherulite) size, since it functions as a nucleating agent (Abbasiet al., 2011). Moreover, comprehensive expalanations for dra-matic changes in the crystallinity have been reported by Fujiyama(2010); and Paul and Robeson (2008). According to Paul and Robe-son, the complex process of crystallisation is influenced by manycompeting factors. Thus, incorporation of nanoparticles into a
polymer matrix can bring about both nucleation as well disruptionof attainable spherulite size.
The melt peak temperature increased with loading. The highestmelt peak temperature of 135.03◦C was obtained with the additionof 5 wt% N1.44P. Moreover, when comparing the melting pointfor the nanocomposites with that of virgin polyethylene, it wasobserved that the melting point decreased with the addition of allnanoclays and hence the degree of crystallinity. This is a muchexpected result since it is well known that the incorporation ofnanoclays in a semicrystalline polymer (such as polyethylene)constitutes a physical obstacle to the molecular chain movementthat hinders the crystallisation process (Gonzalez-Vidal et al.,2010).
Dynamic Mechanical Analysis (DMA)
Effect of temperatureGenerally, DMA results are expressed by three main parameters:(a) the elastic response to the deformation termed as the stor-age modulus (E′), (b) the plastic response to the deformationcorresponding to the loss modulus (E′′) and (c) the tan ı (ratioE′′/E′) which is a measure of the damping behaviour responsiblefor determining the occurrence of molecular mobility transitionssuch as the glass transition temperature. In this work, DMA wascarried out to monitor the temperature and frequency dependenceof these three factors as shown in Tables 3–5, respectively. The sig-nificant enhancement of storage modulus (E′) in the investigatedtemperature range for all BHDPE nanocomposites over that of pureHDPE matrix (Table 3) indicates that nanoclay has a strong effecton the elastic properties of the neat HDPE due to the restrictedmovement of HDPE chains that resulted from the dispersion ofclay layers. Within the clay types, the storage modulus increasedwith the addition of nanoclay. For example, the moduli increasedby 90% with the addition of 1 wt% C15A and by 96%, and 122%when 2.5 and 5 wt% clay were added, respectively. For N1.44P,the increases were 29%, 135% and 93% for 1, 2.5 and 5 wt%clay loadings, respectively, over that of HDPE. The drop in storagemodulus for 5 wt% N1.44P is due to the formation of N1.44P clayaggregates (Innocentini-Mei, 2010). This result is supported by theresults of microstructural investigation (SEM and XRD) which isdiscussed later in this work. Also, the stability changes observed
Table 3. Storage modulus of pure HDPE and HDPE/clay nanocomposites as a function of temperature
BHDPE + C15A BHDPE + N1.44P
◦C Pure HDPE BHDPE 1% 2.50% 5% 1% 2.50% 5%
Storage modulus (MPa) at frequency = 0.1 Hz30 303.8 671.9 578 596.2 676 390.4 715.1 586.350 203.6 372.7 404.6 386.7 437 221.3 536.4 378.370 110.5 210.5 210 219.8 239 120.1 285.4 200.390 52.25 108.1 98.13 96.75 114 54.66 121.2 90.54
Storage modulus (MPa) at frequency = 1 Hz30 381.7 793.3 738.3 756.3 864 461.2 911.8 75050 262.8 490.3 520.2 495.8 565 281.7 692.5 488.370 152.5 295.3 300 283.2 319 161 374.4 269.790 70.36 146.7 149.6 142.1 162 76.79 182.7 136.5
Storage modulus (MPa) at frequency = 10 Hz30 454.6 907.5 880 902.6 1039 527.1 1095 90050 326.7 644.7 649.7 620.8 717 344.5 866.4 614.470 185.8 383.9 390.6 353.2 413 207.5 464.3 351.890 93.32 194.2 202.1 197.3 217 102.9 246.3 189.2
| VOLUME 9999, 2011 | | THE CANADIAN JOURNAL OF CHEMICAL ENGINEERING | 5 |
Table 4. Loss modulus of pure HDPE and HDPE/clay nanocomposites as a function of temperature
BHDPE + C15A BHDPE + N1.44P
◦C Pure HDPE BHDPE 1% 2.50% 5% 1% 2.50% 5%
Loss modulus (MPa) at frequency = 0.1 Hz30 53.4 131.8 103.5 106.6 122.9 71.82 130.1 106.950 38.2 82.74 77.04 75.62 92.79 50.68 105.8 77.370 27.25 53.34 50.47 54.12 59.54 30.13 70.71 50.7990 14.59 29.93 29.46 27.51 31.09 15.5 35.95 26.38
Loss modulus (MPa) at frequency = 1 Hz30 55.84 114.7 111.1 113.6 134.5 61.15 140.1 116.250 45.33 93.26 92.21 89.29 104.6 52.12 126.7 90.5870 30.96 61.54 62.47 58.31 64.53 33.02 79.09 56.5890 16.48 34.71 36.65 34.92 38.15 18.37 45.78 33.45
Loss modulus (MPa) at frequency = 10 Hz30 41.27 79.27 81.73 88.8 107.3 40.47 106.3 92.2750 41.32 88.65 84.53 83.9 100.5 45.91 119.1 84.9770 32.18 68.18 69.42 61.74 72.25 36.01 84.13 63.5190 18.38 38.53 41.24 40.17 42.52 20.16 51.65 39.29
is in agreement with the results reported by Lim et al. (2002); andPaul et al. (2003). However, our results are slightly different fromwhat was reported by Zhai et al. (2004) where only a system with1 wt% of organoclay has good thermal stability compared to thebase resin. The drop in modulus was observed for all the samplesas the temperature increased is said to be typical of polyethylene(Peacock, 2000). The values of storage modulus at 30◦C are aboutsix times that at 90◦C. This is due to disordering of the crystallinedomain and increase in the chains freedom of movement owing toan increase in free volume that usually accompanies temperatureincrease.
The loss modulus, as presnted in Table 4, increased withincreased loading of C15A but fluctuate with increase in loading ofN1.44P at 30◦C. For both nanoclays, the loss modulus fluctuated at50, 70 and 90◦C. The highest modulus was obtained at 5 wt% load-ing for C15A and 2.5 wt% loading for N1.44P nanocomposites.The trend observed for the damping factor is shown in Table 5.It is interesting to note that tan ı remained practically unchangedwith increase in clay loading but increased slightly with increasein temperature.
Effect of frequencyAlso shown in Tables 3–5 is the frequency dependence ofstorage modulus (E′), loss modulus (E′′) and tan ı of theBHDPE/nanocomposites and the HDPE at room temperature.The storage and loss moduli of the nanocomposites are sub-stantially higher than that of their pristine counterpart for allfrequencies due to the strong dimensional stability and rigidityof the nanoscopically dispersed nanoclay in BHDPE matrix. Thenanocomposites containing higher filler concentration (5 wt%)show highest modulus at all measured frequencies for C15A asorganoclay may restrain the relaxation phenomenon of every seg-ment in HDPE chains as a result modulus increases. Highestmodulus was obtained for N1.44P nanocomposite at intermediateconcentration (2.5 wt %).
Unlike, the storage modulus, the change in loss modulus doesnot follow a definite pattern. At lower frequencies (0.1 and 1 Hz)loss modulus increased generally at all temperatures except forfew cases such as BHDPE, BHDPE + 10A and BHDPE + 1 wt%N1.44P. Generally, the loss and storage moduli of nanocompos-ites are significantly higher than that of the neat HDPE for all
Table 5. Tan ı of pure HDPE and HDPE/clay nanocomposites as a function of temperature
BHDPE + C15A BHDPE + N1.44P
◦C Pure HDPE BHDPE 1% 2.50% 5% 1% 2.50% 5%
Tan ı at frequency = 0.1 Hz30 0.1758 0.1962 0.1792 0.1787 0.1817 0.184 0.182 0.182450 0.1876 0.222 0.1904 0.1956 0.2121 0.2291 0.1972 0.204370 0.2467 0.2534 0.2403 0.2462 0.2488 0.2509 0.2478 0.253690 0.2793 0.277 0.3002 0.2843 0.2726 0.2836 0.2967 0.2913
Tan ı at frequency = 1 Hz30 0.1463 0.1446 0.1505 0.1502 0.1557 0.1326 0.1536 0.154950 0.1725 0.1902 0.1773 0.1801 0.1853 0.1851 0.1829 0.185570 0.203 0.2084 0.2082 0.2059 0.2026 0.2051 0.2113 0.209890 0.2342 0.2366 0.245 0.2457 0.2361 0.2392 0.2505 0.2451
Tan ı at frequency = 10 Hz30 0.0908 0.08735 0.0929 0.0984 0.1033 0.0768 0.097 0.102550 0.1265 0.1375 0.1301 0.1352 0.1401 0.1333 0.1375 0.138370 0.1733 0.1776 0.1777 0.1748 0.1748 0.1736 0.1812 0.180690 0.197 0.1984 0.2041 0.2036 0.1956 0.1959 0.2097 0.2077
| 6 | THE CANADIAN JOURNAL OF CHEMICAL ENGINEERING | | VOLUME 9999, 2011 |
the measured frequencies. These results are in agreement withthat of Barick and Tripathy (2010) for storage and loss moduli ofthermoplastic polyurethane/organoclay. According to the authors,the increase in the moduli is due to strong dimensional stabil-ity and rigidity of nanoscopically dispersed nanoclay in the neatmatrix. Tan ı was found to increase with increase in tempera-ture, decrease with increase in frequency and remain practicallyunchanged with increase in clay loading. However, the nanocom-posites have higher tan ı than that of neat HDPE especially at highfrequencies.
Cole–Cole plotThe Cole–Cole plots are usually represented as loss modulus ver-sus storage modulus as function of frequency or time element(Hussein et al., 2006). The plots have been applied for the studyof linear viscoelastic mechanical properties of polymers, espe-cially in the vicinity of the glass transition (Sperling, 2006). It isalso used to study the phase behaviour and structural changestaking place after addition of nanofiller to polymeric systems(Barick and Tripathy, 2010) and have been reportedly employedas useful tool to offer indirect proof of considerable exfoliationthat takes place during the processing of polymeric materials(Dominkovics and Pukanszky, 2007). In this work, the dynamic
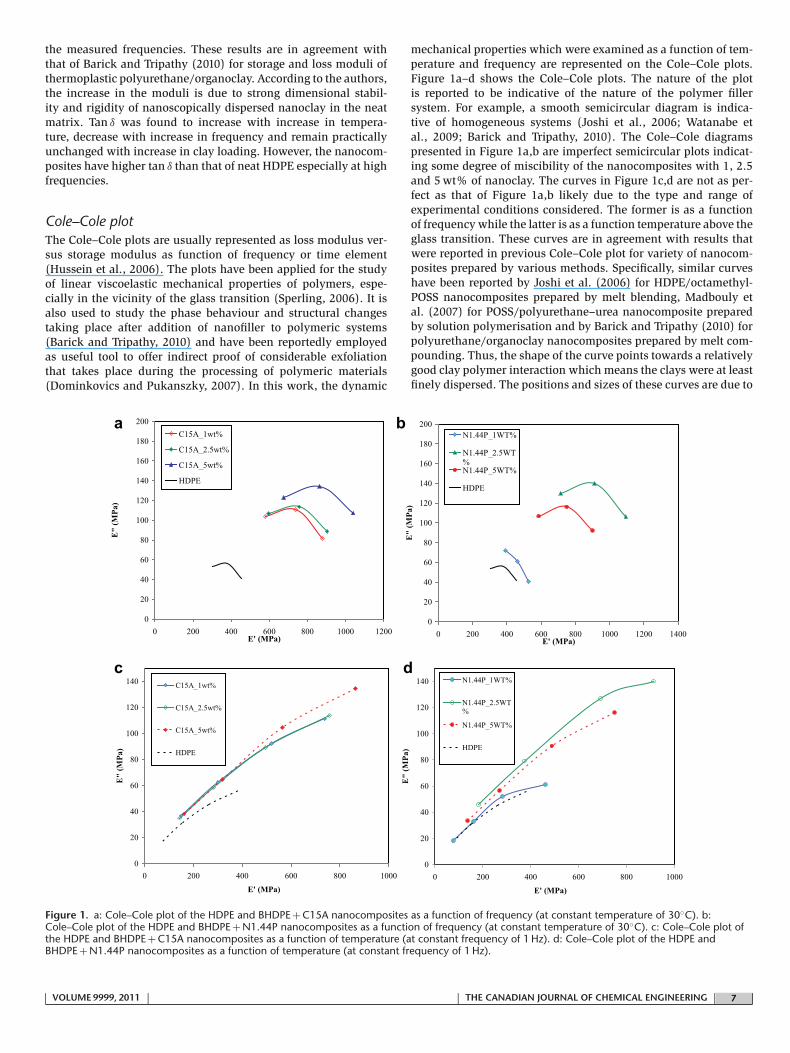
mechanical properties which were examined as a function of tem-perature and frequency are represented on the Cole–Cole plots.Figure 1a–d shows the Cole–Cole plots. The nature of the plotis reported to be indicative of the nature of the polymer fillersystem. For example, a smooth semicircular diagram is indica-tive of homogeneous systems (Joshi et al., 2006; Watanabe etal., 2009; Barick and Tripathy, 2010). The Cole–Cole diagramspresented in Figure 1a,b are imperfect semicircular plots indicat-ing some degree of miscibility of the nanocomposites with 1, 2.5and 5 wt% of nanoclay. The curves in Figure 1c,d are not as per-fect as that of Figure 1a,b likely due to the type and range ofexperimental conditions considered. The former is as a functionof frequency while the latter is as a function temperature above theglass transition. These curves are in agreement with results thatwere reported in previous Cole–Cole plot for variety of nanocom-posites prepared by various methods. Specifically, similar curveshave been reported by Joshi et al. (2006) for HDPE/octamethyl-POSS nanocomposites prepared by melt blending, Madbouly etal. (2007) for POSS/polyurethane–urea nanocomposite preparedby solution polymerisation and by Barick and Tripathy (2010) forpolyurethane/organoclay nanocomposites prepared by melt com-pounding. Thus, the shape of the curve points towards a relativelygood clay polymer interaction which means the clays were at leastfinely dispersed. The positions and sizes of these curves are due to
a
c d
b
Figure 1. a: Cole–Cole plot of the HDPE and BHDPE + C15A nanocomposites as a function of frequency (at constant temperature of 30◦C). b:Cole–Cole plot of the HDPE and BHDPE + N1.44P nanocomposites as a function of frequency (at constant temperature of 30◦C). c: Cole–Cole plot ofthe HDPE and BHDPE + C15A nanocomposites as a function of temperature (at constant frequency of 1 Hz). d: Cole–Cole plot of the HDPE andBHDPE + N1.44P nanocomposites as a function of temperature (at constant frequency of 1 Hz).
| VOLUME 9999, 2011 | | THE CANADIAN JOURNAL OF CHEMICAL ENGINEERING | 7 |

properties change resulting from varying nanoclay loadings. Con-sequently, it can be concluded that BHDPE/clay nanocompositessystems posses some degree of homogeneities for different amountof organoclay loadings.
Surface Mechanical PropertiesInstrumented nanoindentation technique involves the use ofsmall loads and indenter tips which result in shallow indents.This allows study of surface properties of materials. For instancein the present study, information was obtained from HDPE poly-mers from a depth range of merely 2–4 �m. For metals and alloys,indenter penetration could be as low as tens or few hundreds ofnanometers. Typical indent obtained from pure HDPE sample isshown in Figure 2a. During instrumented nanoindentation, loadand depth of penetration is recorded and the area of the indentis determined using the known geometry of the indentation tip.These values are plotted on a graph to create a force–displacementcurve which is used to extract mechanical properties of materialsas shown in Figure 2b,c.
Hardness is calculated using the depth of penetration of inden-ter and modulus of elasticity is measured from the slope of theunloading curve. This technique can also be used to measurecreep for certain materials such as polymers and soft metals. Creepis commonly measured by maintaining the force at a constantmaximum level and measuring the change in the depth of theindenter as a function of time. The relative change in the inden-tation depth is taken as the creep of the specimen. For polymers,if indenter is held at constant force for a certain period of time,the indenter continues to penetrate the sample due to creep. Thisappears as the flat area on top in the force-displacement curvesas shown in Figure 2c. The flat region indicates that the mate-rial continues to deform at constant force which is defined ascreep. During loading, the size of the indent increases with timeas a result of viscoelastic flow and relaxation processes occurringwithin the polymer. Shape of indents obtained in this study aretypical of those obtained for polymer materials where the edges ofthe indent appear to cave inwards indicating significant recoveryof the polymer material upon unloading (see Figure 2a). Theseindents are sometimes called “pincushioned” indents which sug-gest that elastic recovery has taken place on the edges or faces, butnot along the diagonals of the indent. Absence of elastic recoveryalong the diagonals of the indents suggests that nanoindentationis an appropriate tool to study the nanohardness and viscoelas-tic behaviour of polymers (Low, 1998). Small amount of elasticdeformation occurs during the course of indentation which isthen followed by viscoelastic flow. When the indenter is removed,instantaneous elastic recovery occurs followed by time-dependentrecovery. The degree of recovery depends on the type of material,internal stress and temperature.
Surface mechanical properties of HDPE composites studied hereare shown in Table 6. It can be seen that all polymer and its com-posites show relatively low hardness and elastic modulus and highcreep typical of viscoelastic materials. Hardness and creep char-acteristics are comparable for pure HDPE and HDPE/nanoclaysamples. Addition of 1% C15A and 1% N1.44P to HDPE withcompatibiliser reduces hardness and increases creep. However,additions of 2.5% and 5.0% C15A results in improved properties.Appreciable decrease in percentage creep is observed in sam-ples with 5% C15A. Addition of 2.5% and 5% N1.44P increaseshardness, elastic modulus and % creep compared to HDPE withcompatibiliser. Highest creep was observed for sample with 2.5%N1.44 clay.
Figure 2. a: Typical indent obtained from pure HDPE at a maximumload of 20 mN. b,c: Force–displacement curves obtained fromnanoindentation of pure HDPE at a maximum load of 20 mN. b: Normalforce (mN) and penetration depth are plotted against time (s) ofindentation. c: Normal force is plotted against depth of penetration. Flatregion at the top of the curve indicates deformation at a constant forceindicating creep. Modulus of elasticity is obtained from the slope of theunloading curve.
| 8 | THE CANADIAN JOURNAL OF CHEMICAL ENGINEERING | | VOLUME 9999, 2011 |
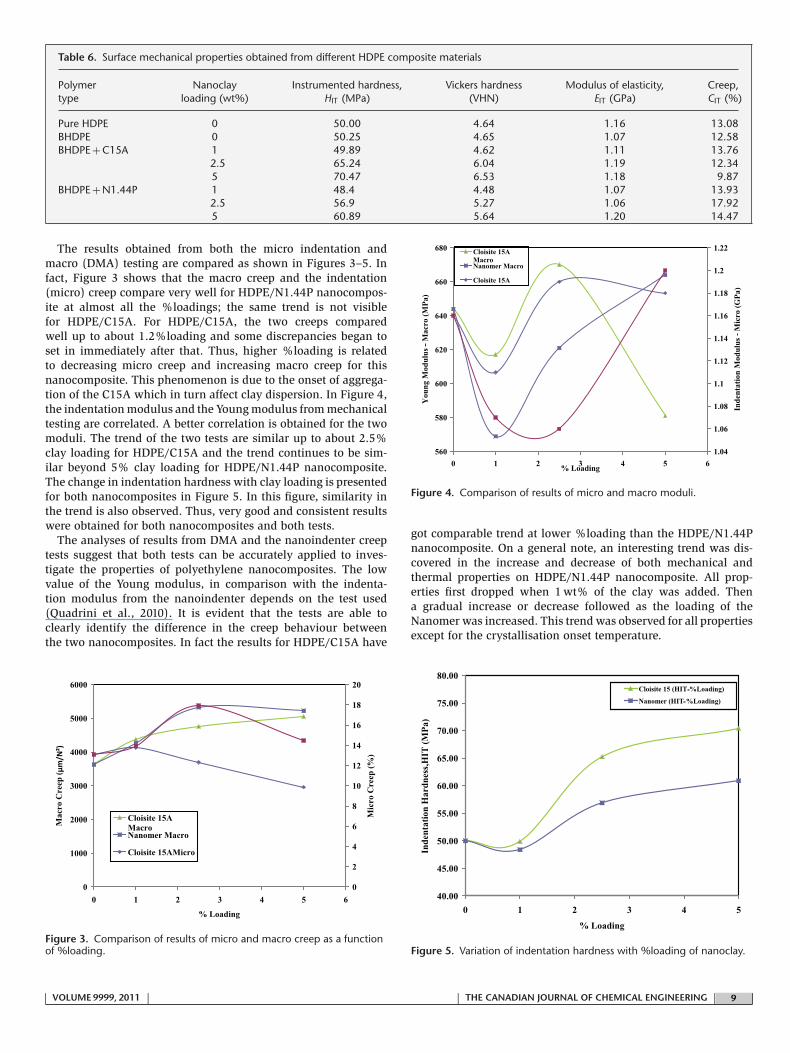
Table 6. Surface mechanical properties obtained from different HDPE composite materials
Polymer Nanoclay Instrumented hardness, Vickers hardness Modulus of elasticity, Creep,type loading (wt%) HIT (MPa) (VHN) EIT (GPa) CIT (%)
Pure HDPE 0 50.00 4.64 1.16 13.08BHDPE 0 50.25 4.65 1.07 12.58BHDPE + C15A 1 49.89 4.62 1.11 13.76
2.5 65.24 6.04 1.19 12.345 70.47 6.53 1.18 9.87
BHDPE + N1.44P 1 48.4 4.48 1.07 13.932.5 56.9 5.27 1.06 17.925 60.89 5.64 1.20 14.47
The results obtained from both the micro indentation andmacro (DMA) testing are compared as shown in Figures 3–5. Infact, Figure 3 shows that the macro creep and the indentation(micro) creep compare very well for HDPE/N1.44P nanocompos-ite at almost all the %loadings; the same trend is not visiblefor HDPE/C15A. For HDPE/C15A, the two creeps comparedwell up to about 1.2%loading and some discrepancies began toset in immediately after that. Thus, higher %loading is relatedto decreasing micro creep and increasing macro creep for thisnanocomposite. This phenomenon is due to the onset of aggrega-tion of the C15A which in turn affect clay dispersion. In Figure 4,the indentation modulus and the Young modulus from mechanicaltesting are correlated. A better correlation is obtained for the twomoduli. The trend of the two tests are similar up to about 2.5%clay loading for HDPE/C15A and the trend continues to be sim-ilar beyond 5% clay loading for HDPE/N1.44P nanocomposite.The change in indentation hardness with clay loading is presentedfor both nanocomposites in Figure 5. In this figure, similarity inthe trend is also observed. Thus, very good and consistent resultswere obtained for both nanocomposites and both tests.
The analyses of results from DMA and the nanoindenter creeptests suggest that both tests can be accurately applied to inves-tigate the properties of polyethylene nanocomposites. The lowvalue of the Young modulus, in comparison with the indenta-tion modulus from the nanoindenter depends on the test used(Quadrini et al., 2010). It is evident that the tests are able toclearly identify the difference in the creep behaviour betweenthe two nanocomposites. In fact the results for HDPE/C15A have
Figure 3. Comparison of results of micro and macro creep as a functionof %loading.
Figure 4. Comparison of results of micro and macro moduli.
got comparable trend at lower %loading than the HDPE/N1.44Pnanocomposite. On a general note, an interesting trend was dis-covered in the increase and decrease of both mechanical andthermal properties on HDPE/N1.44P nanocomposite. All prop-erties first dropped when 1 wt% of the clay was added. Thena gradual increase or decrease followed as the loading of theNanomer was increased. This trend was observed for all propertiesexcept for the crystallisation onset temperature.
Figure 5. Variation of indentation hardness with %loading of nanoclay.
| VOLUME 9999, 2011 | | THE CANADIAN JOURNAL OF CHEMICAL ENGINEERING | 9 |
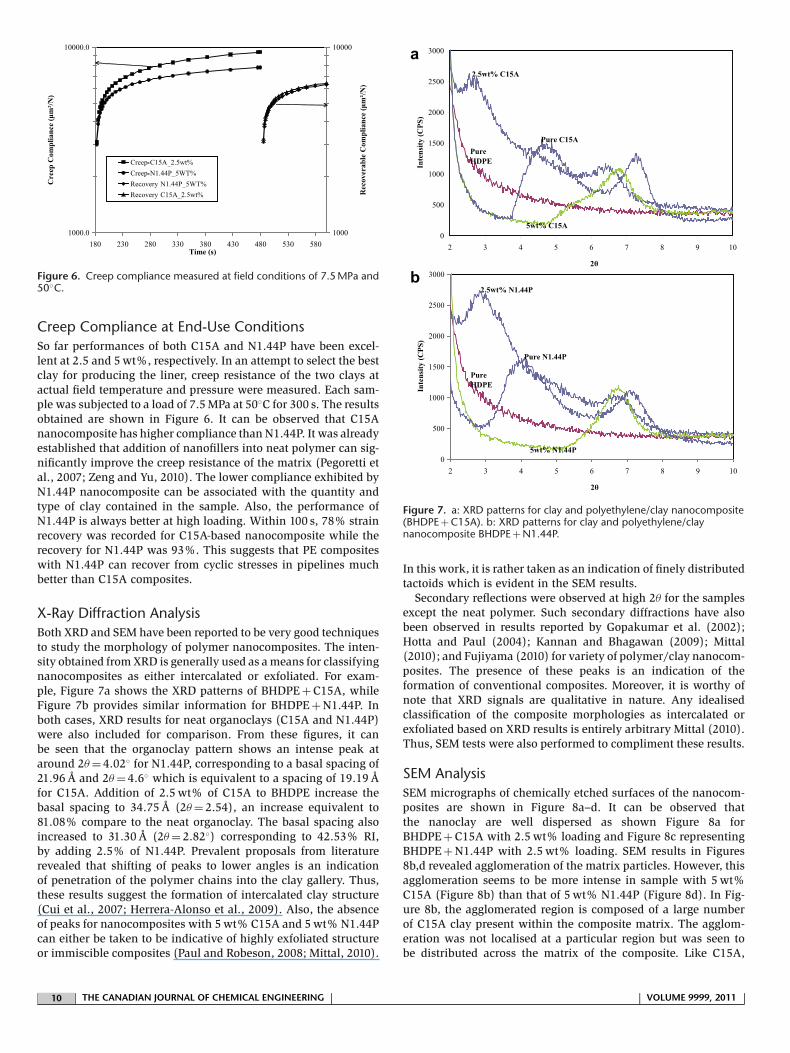
Figure 6. Creep compliance measured at field conditions of 7.5 MPa and50◦C.
Creep Compliance at End-Use ConditionsSo far performances of both C15A and N1.44P have been excel-lent at 2.5 and 5 wt%, respectively. In an attempt to select the bestclay for producing the liner, creep resistance of the two clays atactual field temperature and pressure were measured. Each sam-ple was subjected to a load of 7.5 MPa at 50◦C for 300 s. The resultsobtained are shown in Figure 6. It can be observed that C15Ananocomposite has higher compliance than N1.44P. It was alreadyestablished that addition of nanofillers into neat polymer can sig-nificantly improve the creep resistance of the matrix (Pegoretti etal., 2007; Zeng and Yu, 2010). The lower compliance exhibited byN1.44P nanocomposite can be associated with the quantity andtype of clay contained in the sample. Also, the performance ofN1.44P is always better at high loading. Within 100 s, 78% strainrecovery was recorded for C15A-based nanocomposite while therecovery for N1.44P was 93%. This suggests that PE compositeswith N1.44P can recover from cyclic stresses in pipelines muchbetter than C15A composites.
X-Ray Diffraction AnalysisBoth XRD and SEM have been reported to be very good techniquesto study the morphology of polymer nanocomposites. The inten-sity obtained from XRD is generally used as a means for classifyingnanocomposites as either intercalated or exfoliated. For exam-ple, Figure 7a shows the XRD patterns of BHDPE + C15A, whileFigure 7b provides similar information for BHDPE + N1.44P. Inboth cases, XRD results for neat organoclays (C15A and N1.44P)were also included for comparison. From these figures, it canbe seen that the organoclay pattern shows an intense peak ataround 2� = 4.02◦ for N1.44P, corresponding to a basal spacing of21.96 A and 2� = 4.6◦ which is equivalent to a spacing of 19.19 Afor C15A. Addition of 2.5 wt% of C15A to BHDPE increase thebasal spacing to 34.75 A (2� = 2.54), an increase equivalent to81.08% compare to the neat organoclay. The basal spacing alsoincreased to 31.30 A (2� = 2.82◦) corresponding to 42.53% RI,by adding 2.5% of N1.44P. Prevalent proposals from literaturerevealed that shifting of peaks to lower angles is an indicationof penetration of the polymer chains into the clay gallery. Thus,these results suggest the formation of intercalated clay structure(Cui et al., 2007; Herrera-Alonso et al., 2009). Also, the absenceof peaks for nanocomposites with 5 wt% C15A and 5 wt% N1.44Pcan either be taken to be indicative of highly exfoliated structureor immiscible composites (Paul and Robeson, 2008; Mittal, 2010).
a
b
Figure 7. a: XRD patterns for clay and polyethylene/clay nanocomposite(BHDPE + C15A). b: XRD patterns for clay and polyethylene/claynanocomposite BHDPE + N1.44P.
In this work, it is rather taken as an indication of finely distributedtactoids which is evident in the SEM results.
Secondary reflections were observed at high 2� for the samplesexcept the neat polymer. Such secondary diffractions have alsobeen observed in results reported by Gopakumar et al. (2002);Hotta and Paul (2004); Kannan and Bhagawan (2009); Mittal(2010); and Fujiyama (2010) for variety of polymer/clay nanocom-posites. The presence of these peaks is an indication of theformation of conventional composites. Moreover, it is worthy ofnote that XRD signals are qualitative in nature. Any idealisedclassification of the composite morphologies as intercalated orexfoliated based on XRD results is entirely arbitrary Mittal (2010).Thus, SEM tests were also performed to compliment these results.
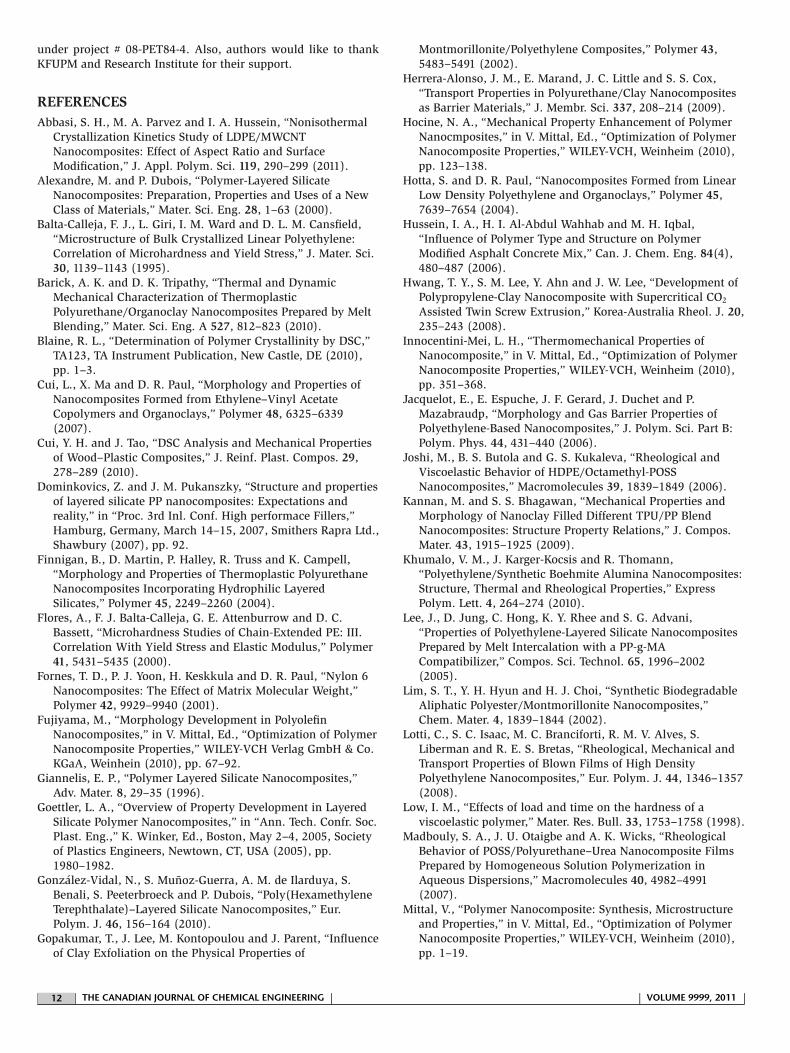
SEM AnalysisSEM micrographs of chemically etched surfaces of the nanocom-posites are shown in Figure 8a–d. It can be observed thatthe nanoclay are well dispersed as shown Figure 8a forBHDPE + C15A with 2.5 wt% loading and Figure 8c representingBHDPE + N1.44P with 2.5 wt% loading. SEM results in Figures8b,d revealed agglomeration of the matrix particles. However, thisagglomeration seems to be more intense in sample with 5 wt%C15A (Figure 8b) than that of 5 wt% N1.44P (Figure 8d). In Fig-ure 8b, the agglomerated region is composed of a large numberof C15A clay present within the composite matrix. The agglom-eration was not localised at a particular region but was seen tobe distributed across the matrix of the composite. Like C15A,
| 10 | THE CANADIAN JOURNAL OF CHEMICAL ENGINEERING | | VOLUME 9999, 2011 |
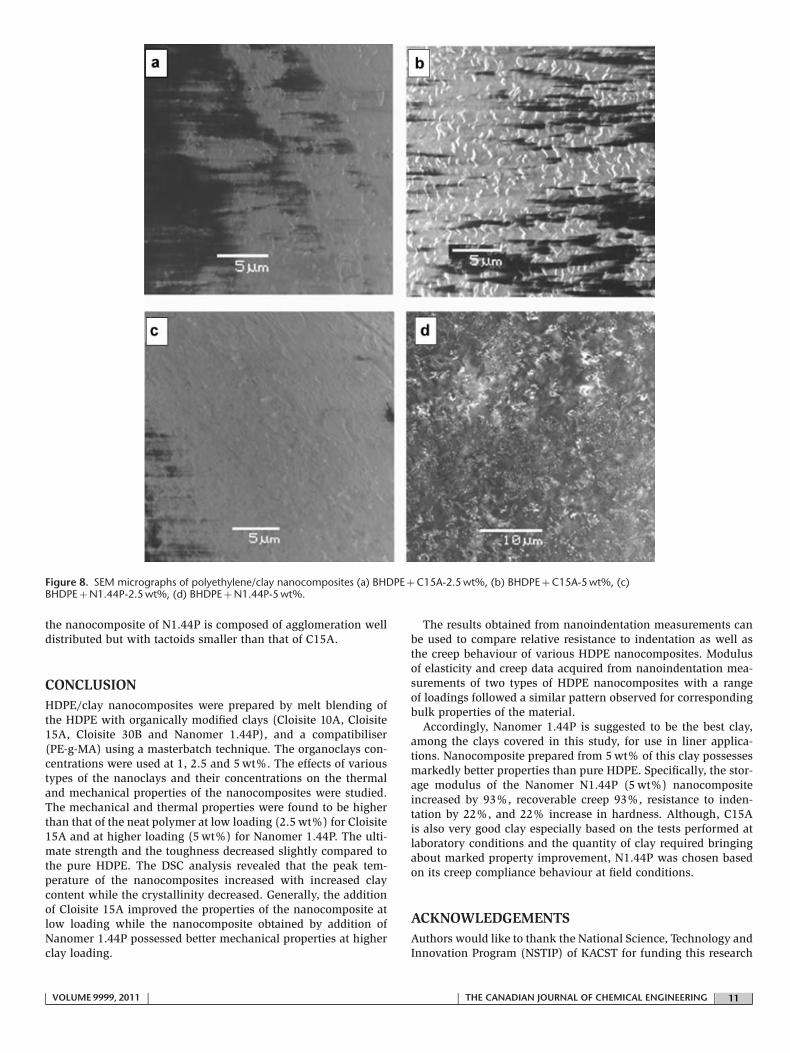
Figure 8. SEM micrographs of polyethylene/clay nanocomposites (a) BHDPE + C15A-2.5 wt%, (b) BHDPE + C15A-5 wt%, (c)BHDPE + N1.44P-2.5 wt%, (d) BHDPE + N1.44P-5 wt%.
the nanocomposite of N1.44P is composed of agglomeration welldistributed but with tactoids smaller than that of C15A.
CONCLUSIONHDPE/clay nanocomposites were prepared by melt blending ofthe HDPE with organically modified clays (Cloisite 10A, Cloisite15A, Cloisite 30B and Nanomer 1.44P), and a compatibiliser(PE-g-MA) using a masterbatch technique. The organoclays con-centrations were used at 1, 2.5 and 5 wt%. The effects of varioustypes of the nanoclays and their concentrations on the thermaland mechanical properties of the nanocomposites were studied.The mechanical and thermal properties were found to be higherthan that of the neat polymer at low loading (2.5 wt%) for Cloisite15A and at higher loading (5 wt%) for Nanomer 1.44P. The ulti-mate strength and the toughness decreased slightly compared tothe pure HDPE. The DSC analysis revealed that the peak tem-perature of the nanocomposites increased with increased claycontent while the crystallinity decreased. Generally, the additionof Cloisite 15A improved the properties of the nanocomposite atlow loading while the nanocomposite obtained by addition ofNanomer 1.44P possessed better mechanical properties at higherclay loading.
The results obtained from nanoindentation measurements canbe used to compare relative resistance to indentation as well asthe creep behaviour of various HDPE nanocomposites. Modulusof elasticity and creep data acquired from nanoindentation mea-surements of two types of HDPE nanocomposites with a rangeof loadings followed a similar pattern observed for correspondingbulk properties of the material.
Accordingly, Nanomer 1.44P is suggested to be the best clay,among the clays covered in this study, for use in liner applica-tions. Nanocomposite prepared from 5 wt% of this clay possessesmarkedly better properties than pure HDPE. Specifically, the stor-age modulus of the Nanomer N1.44P (5 wt%) nanocompositeincreased by 93%, recoverable creep 93%, resistance to inden-tation by 22%, and 22% increase in hardness. Although, C15Ais also very good clay especially based on the tests performed atlaboratory conditions and the quantity of clay required bringingabout marked property improvement, N1.44P was chosen basedon its creep compliance behaviour at field conditions.
ACKNOWLEDGEMENTSAuthors would like to thank the National Science, Technology andInnovation Program (NSTIP) of KACST for funding this research
| VOLUME 9999, 2011 | | THE CANADIAN JOURNAL OF CHEMICAL ENGINEERING | 11 |
under project # 08-PET84-4. Also, authors would like to thankKFUPM and Research Institute for their support.
REFERENCESAbbasi, S. H., M. A. Parvez and I. A. Hussein, “Nonisothermal
Crystallization Kinetics Study of LDPE/MWCNTNanocomposites: Effect of Aspect Ratio and SurfaceModification,” J. Appl. Polym. Sci. 119, 290–299 (2011).
Alexandre, M. and P. Dubois, “Polymer-Layered SilicateNanocomposites: Preparation, Properties and Uses of a NewClass of Materials,” Mater. Sci. Eng. 28, 1–63 (2000).
Balta-Calleja, F. J., L. Giri, I. M. Ward and D. L. M. Cansfield,“Microstructure of Bulk Crystallized Linear Polyethylene:Correlation of Microhardness and Yield Stress,” J. Mater. Sci.30, 1139–1143 (1995).
Barick, A. K. and D. K. Tripathy, “Thermal and DynamicMechanical Characterization of ThermoplasticPolyurethane/Organoclay Nanocomposites Prepared by MeltBlending,” Mater. Sci. Eng. A 527, 812–823 (2010).
Blaine, R. L., “Determination of Polymer Crystallinity by DSC,”TA123, TA Instrument Publication, New Castle, DE (2010),pp. 1–3.
Cui, L., X. Ma and D. R. Paul, “Morphology and Properties ofNanocomposites Formed from Ethylene–Vinyl AcetateCopolymers and Organoclays,” Polymer 48, 6325–6339(2007).
Cui, Y. H. and J. Tao, “DSC Analysis and Mechanical Propertiesof Wood–Plastic Composites,” J. Reinf. Plast. Compos. 29,278–289 (2010).
Dominkovics, Z. and J. M. Pukanszky, “Structure and propertiesof layered silicate PP nanocomposites: Expectations andreality,” in “Proc. 3rd Inl. Conf. High performace Fillers,”Hamburg, Germany, March 14–15, 2007, Smithers Rapra Ltd.,Shawbury (2007), pp. 92.
Finnigan, B., D. Martin, P. Halley, R. Truss and K. Campell,“Morphology and Properties of Thermoplastic PolyurethaneNanocomposites Incorporating Hydrophilic LayeredSilicates,” Polymer 45, 2249–2260 (2004).
Flores, A., F. J. Balta-Calleja, G. E. Attenburrow and D. C.Bassett, “Microhardness Studies of Chain-Extended PE: III.Correlation With Yield Stress and Elastic Modulus,” Polymer41, 5431–5435 (2000).
Fornes, T. D., P. J. Yoon, H. Keskkula and D. R. Paul, “Nylon 6Nanocomposites: The Effect of Matrix Molecular Weight,”Polymer 42, 9929–9940 (2001).
Fujiyama, M., “Morphology Development in PolyolefinNanocomposites,” in V. Mittal, Ed., “Optimization of PolymerNanocomposite Properties,” WILEY-VCH Verlag GmbH & Co.KGaA, Weinhein (2010), pp. 67–92.
Giannelis, E. P., “Polymer Layered Silicate Nanocomposites,”Adv. Mater. 8, 29–35 (1996).
Goettler, L. A., “Overview of Property Development in LayeredSilicate Polymer Nanocomposites,” in “Ann. Tech. Confr. Soc.Plast. Eng.,” K. Winker, Ed., Boston, May 2–4, 2005, Societyof Plastics Engineers, Newtown, CT, USA (2005), pp.1980–1982.
Gonzalez-Vidal, N., S. Munoz-Guerra, A. M. de Ilarduya, S.Benali, S. Peeterbroeck and P. Dubois, “Poly(HexamethyleneTerephthalate)–Layered Silicate Nanocomposites,” Eur.Polym. J. 46, 156–164 (2010).
Gopakumar, T., J. Lee, M. Kontopoulou and J. Parent, “Influenceof Clay Exfoliation on the Physical Properties of
Montmorillonite/Polyethylene Composites,” Polymer 43,5483–5491 (2002).
Herrera-Alonso, J. M., E. Marand, J. C. Little and S. S. Cox,“Transport Properties in Polyurethane/Clay Nanocompositesas Barrier Materials,” J. Membr. Sci. 337, 208–214 (2009).
Hocine, N. A., “Mechanical Property Enhancement of PolymerNanocmposites,” in V. Mittal, Ed., “Optimization of PolymerNanocomposite Properties,” WILEY-VCH, Weinheim (2010),pp. 123–138.
Hotta, S. and D. R. Paul, “Nanocomposites Formed from LinearLow Density Polyethylene and Organoclays,” Polymer 45,7639–7654 (2004).
Hussein, I. A., H. I. Al-Abdul Wahhab and M. H. Iqbal,“Influence of Polymer Type and Structure on PolymerModified Asphalt Concrete Mix,” Can. J. Chem. Eng. 84(4),480–487 (2006).
Hwang, T. Y., S. M. Lee, Y. Ahn and J. W. Lee, “Development ofPolypropylene-Clay Nanocomposite with Supercritical CO2
Assisted Twin Screw Extrusion,” Korea-Australia Rheol. J. 20,235–243 (2008).
Innocentini-Mei, L. H., “Thermomechanical Properties ofNanocomposite,” in V. Mittal, Ed., “Optimization of PolymerNanocomposite Properties,” WILEY-VCH, Weinheim (2010),pp. 351–368.
Jacquelot, E., E. Espuche, J. F. Gerard, J. Duchet and P.Mazabraudp, “Morphology and Gas Barrier Properties ofPolyethylene-Based Nanocomposites,” J. Polym. Sci. Part B:Polym. Phys. 44, 431–440 (2006).
Joshi, M., B. S. Butola and G. S. Kukaleva, “Rheological andViscoelastic Behavior of HDPE/Octamethyl-POSSNanocomposites,” Macromolecules 39, 1839–1849 (2006).
Kannan, M. and S. S. Bhagawan, “Mechanical Properties andMorphology of Nanoclay Filled Different TPU/PP BlendNanocomposites: Structure Property Relations,” J. Compos.Mater. 43, 1915–1925 (2009).
Khumalo, V. M., J. Karger-Kocsis and R. Thomann,“Polyethylene/Synthetic Boehmite Alumina Nanocomposites:Structure, Thermal and Rheological Properties,” ExpressPolym. Lett. 4, 264–274 (2010).
Lee, J., D. Jung, C. Hong, K. Y. Rhee and S. G. Advani,“Properties of Polyethylene-Layered Silicate NanocompositesPrepared by Melt Intercalation with a PP-g-MACompatibilizer,” Compos. Sci. Technol. 65, 1996–2002(2005).
Lim, S. T., Y. H. Hyun and H. J. Choi, “Synthetic BiodegradableAliphatic Polyester/Montmorillonite Nanocomposites,”Chem. Mater. 4, 1839–1844 (2002).
Lotti, C., S. C. Isaac, M. C. Branciforti, R. M. V. Alves, S.Liberman and R. E. S. Bretas, “Rheological, Mechanical andTransport Properties of Blown Films of High DensityPolyethylene Nanocomposites,” Eur. Polym. J. 44, 1346–1357(2008).
Low, I. M., “Effects of load and time on the hardness of aviscoelastic polymer,” Mater. Res. Bull. 33, 1753–1758 (1998).
Madbouly, S. A., J. U. Otaigbe and A. K. Wicks, “RheologicalBehavior of POSS/Polyurethane–Urea Nanocomposite FilmsPrepared by Homogeneous Solution Polymerization inAqueous Dispersions,” Macromolecules 40, 4982–4991(2007).
Mittal, V., “Polymer Nanocomposite: Synthesis, Microstructureand Properties,” in V. Mittal, Ed., “Optimization of PolymerNanocomposite Properties,” WILEY-VCH, Weinheim (2010),pp. 1–19.
| 12 | THE CANADIAN JOURNAL OF CHEMICAL ENGINEERING | | VOLUME 9999, 2011 |
Nguyen, Q. T. and D. G. Baird, “Preparation of Polymer–ClayNanocomposites and their Properties,” Adv. Polym. Tech. 25,270–285 (2006).
Paul, D. R. and L. M. Robeson, “Polymer Nanotechnology:Nanocomposites,” Polymer 49, 3187–3204 (2008).
Paul, M. A., M. Alexandre, P. Degee, C. Henrist, A. Rulmont andP. Dubois, “New Nanocomposite Materials Based onPlasticized Poly(L-Lactide) and Organo-ModifiedMontmorillonites: Thermal and Morphological Study,”Polymer 44, 443–450 (2003).
Pavlidou, S. and C. D. Papaspyrides, “A Review onPolymer–Layered Silicate Nanocomposites,” Prog. Polym. Sci.33, 1119–1198 (2008).
Peacock, A. J., “Properties of Polyethylene,” in D. E. Hudgin,Ed., “Handbook of Polyethylene Structures, Properties andApplications,” Marcel Dekker, Inc., New York (2000), pp.123–241.
Pegoretti, A., A. Dorigato and A. Penati, “Tensile MechanicalResponse of Polyethylene–Clay Nanocomposites,” ExpressPolym. Lett. 1, 123–131 (2007).
Phang, I. Y., T. Liu, A. Mohamed, K. P. Pramoda, L. Chen and L.Shen, “Morphology, Thermal and Mechanical Properties ofNylon12/Organoclay Nanocomposites Prepared by MeltCompounding,” Polym. Int. 54, 456–464 (2005).
Qi, R., X. Jin and C. Zhou, “Preparation and Properties ofPolyethylene–Clay Nanocomposites by an In Situ GraftMethod,” J. Appl. Polym. Sci. 102, 4921–4927 (2006).
Quadrini, F., E. A. Squeo and A. Guglielmotti, “IndentationCreep of Polymers. I. Experimental,” Polym. Sci. Eng. 50,2431–2439. (2010).
Ray, S. S. and M. Okamoto, “Polymer/Layered SilicateNanocomposites: A Review from Preparation to Processing,”Prog. Polym. Sci. 28, 1539–1641 (2003).
Samak, S. K., S. K. Nayak and S. Mohanty, “PolypropyleneNanocomposites: Effect of Organo-Modified Layered Silicateson Mechanical, Thermal & Morphological Performance,” J.Thermoplast. Compos. Mater. 21, 243–263 (2008).
Sperling, L. H., “Introduction to Physical Polymer Science,”Wiley Interscience, New Jersey (2006), pp. 374.
Suwanprateeb, J., “Calcium Carbonate Filled Polyethylene:Correlation of Hardness and Yield Stress,” Composites A 31,353–359 (2000a).
Suwanprateeb, J., “Rate-Dependent function in the correlationbetween hardness and yield stress of polyethylenecomposites,” Polym. Comp. 21, 238–244 (2000b).
Suwanprateeb, J., “Rapid Examination of Annealing Conditionsfor HDPE using Indentation Microhardness Test,” Polym.Test. 23, 157–161 (2004).
Tjong, S. C., “Synthesis and Structure–Property Characteristicsof Clay–Polymer Nanocomposites,” in S. C. Tjong, Ed.,“Nanocrystalline Materials theirSynthesis—Structure—Property Relationships andApplications,” Elsevier, Amsterdam (2006), pp. 311–348.
Usuki, A., N. Hasegawa and M. Kato,“Polymer-ClayNanocomposites,” Adv. Polym. Sci. 179,135–195 (2005).
Watanabe, K., Y. Taka and O. Fujiwara, “Cole–Cole Measurementof Dispersion Properties for Quality Evaluation of Red Wine,”Meas. Sci. Rev. 9, 113–116 (2009).
Zeng, Q. and A. Yu, “Prediction of the Mechanical Properties ofNanocomposites,” in V. Mittal, Ed., “Optimization of PolymerNanocomposite Properties,” WILEY-VCH, Weinheim (2010),pp. 301–331.
Zhai, H., W. Xu, H. Guo, Z. Zhou, S. Shen and Q. Song,“Preparation and Characterization of PE andPE-g-MAH/Montmorillonite Nanocomposites,” Eur. Polym. J.40, 2539–2545 (2004).
Zhang, J. and C. A. Wilkie, “Preparation and FlammabilityProperties of Polyethylene–Clay Nanocomposites,” Polym.Degrad. Stabil. 80, 163–169 (2003).
Zhao, C., H. Qin, F. Gong, M. Feng, S. Zhang and M. Yang,“Mechanical, Thermal and Flammability Properties ofPolyethylene/Clay Nanocomposite,” Polym. Degrad. Stabil.87, 183–189 (2005).
Manuscript received January 3, 2011; revised manuscriptreceived February 19, 2011; accepted for publication March 10,2011.
| VOLUME 9999, 2011 | | THE CANADIAN JOURNAL OF CHEMICAL ENGINEERING | 13 |