Relationships among water quality, food resources, fish diet and fish growth in polyculture ponds: A...
8
Relationships among water quality, food resources, fish diet and fish growth in polyculture ponds: A multivariate approach M. Mustafizur Rahman a , Leopold A.J. Nagelkerke a, ⁎ , Marc C.J. Verdegem a , M. Abdul Wahab b , Johan A.J. Verreth a a Aquaculture and Fisheries Group, Department of Animal Sciences, Wageningen University, P.O. Box 338, 6700 AH Wageningen, The Netherlands b Faculty of Fisheries, Bangladesh Agricultural University, Mymensingh 2202, Bangladesh Received 19 June 2007; received in revised form 22 January 2008; accepted 22 January 2008 Abstract We examined the influence of addition of common carp (Cyprinus carpio) and artificial feed in rohu (Labeo rohita) ponds. We analyzed the relationships among four datasets on different components of the pond food web (water quality, food availability, natural food intake, and fish growth and production) with the aim to examine the effects of the addition of common carp and/or artificial feed on the different components of the pond food web, and to analyze the nature and strength of the interactions between these components. We used redundancy analysis (RDA) to investigate these effects and interactions. We found that the addition of common carp increased bio-available N and P in the water column. Artificial feed addition increased N and P only in the presence of common carp. N and P increases were more pronounced in the presence of 0.5 than in the presence of 1 common carp m - 2 . Plankton availability was strongly positively correlated with bio-available N and P. Phytoplankton availability correlated strongest with PO 4 –P, and zooplankton availability correlated strongest with PO 4 –P and DO. Natural food intake in rohu was positively correlated with plankton availability in the pond water and rohu growth was also positively correlated with natural food intake. Rohu preferred plankton over artificial feed, which acted as a fertilizer for rohu growth. Common carp preferred artificial feed over natural food and its growth was higher in the presence of artificial feed and negatively correlated with natural food availability. © 2008 Elsevier B.V. All rights reserved. Keywords: Common carp; Multivariate statistics; Polyculture; Pond; Redundancy analysis; Rohu 1. Introduction In South Asia, especially in Bangladesh, several culture combinations of indigenous and exotic carp species are com- monly practiced (Wahab et al., 1994; Miah et al., 1997). The idea of polyculture is based on the principle that each species stocked has its own feeding niche that does not completely overlap with the feeding niches of other species. Therefore, a more complete use is made of the food resources and space available in polyculture than in monoculture. In some cases, one species enhances the food availability for other species and thus increases the total fish yield per unit area (Hepher et al., 1989; Miah et al., 1993; Azad et al., 2004). Traditionally in Bangladesh, 5–8 species are stocked, not always with satis- factory result, which leads to farmers using fewer species. The combination of the column-feeder rohu (Labeo rohita) and the bottom-feeder common carp (CC) (Cyprinus carpio), is rapidly becoming popular because these species realize high growth rates, while fetching excellent prices in local markets. Since polyculture ponds are complex and not fully under- stood, we investigated different stocking combinations of rohu, common carp, and artificial feed addition. Read out parameters focused on four components of the pond food web, i.e. (1) water quality, (2) natural food availability, (3) dietary preference, and (4) growth and production. Although some cause-effect re- lationships were revealed (Rahman et al., 2006), predicting growth and production in polyculture ponds remains difficult, Available online at www.sciencedirect.com Aquaculture 275 (2008) 108 – 115 www.elsevier.com/locate/aqua-online ⁎ Corresponding author. Tel.: +31-317 483307; fax: +31-317-483937. E-mail address: [email protected] (L.A.J. Nagelkerke). 0044-8486/$ - see front matter © 2008 Elsevier B.V. All rights reserved. doi:10.1016/j.aquaculture.2008.01.027
-
Upload
independent -
Category
Documents
-
view
1 -
download
0
Transcript of Relationships among water quality, food resources, fish diet and fish growth in polyculture ponds: A...
Available online at www.sciencedirect.com
008) 108–115www.elsevier.com/locate/aqua-online
Aquaculture 275 (2
Relationships among water quality, food resources, fish diet and fish growthin polyculture ponds: A multivariate approach
M. Mustafizur Rahman a, Leopold A.J. Nagelkerke a,⁎, Marc C.J. Verdegem a,M. Abdul Wahab b, Johan A.J. Verreth a
a Aquaculture and Fisheries Group, Department of Animal Sciences, Wageningen University, P.O. Box 338, 6700 AH Wageningen, The Netherlandsb Faculty of Fisheries, Bangladesh Agricultural University, Mymensingh 2202, Bangladesh
Received 19 June 2007; received in revised form 22 January 2008; accepted 22 January 2008
Abstract
We examined the influence of addition of common carp (Cyprinus carpio) and artificial feed in rohu (Labeo rohita) ponds. We analyzed therelationships among four datasets on different components of the pond food web (water quality, food availability, natural food intake, and fishgrowth and production) with the aim to examine the effects of the addition of common carp and/or artificial feed on the different components ofthe pond food web, and to analyze the nature and strength of the interactions between these components. We used redundancy analysis (RDA) toinvestigate these effects and interactions. We found that the addition of common carp increased bio-available N and P in the water column.Artificial feed addition increased N and P only in the presence of common carp. N and P increases were more pronounced in the presence of 0.5than in the presence of 1 common carp m−2. Plankton availability was strongly positively correlated with bio-available N and P. Phytoplanktonavailability correlated strongest with PO4–P, and zooplankton availability correlated strongest with PO4–P and DO. Natural food intake in rohuwas positively correlated with plankton availability in the pond water and rohu growth was also positively correlated with natural food intake.Rohu preferred plankton over artificial feed, which acted as a fertilizer for rohu growth. Common carp preferred artificial feed over natural foodand its growth was higher in the presence of artificial feed and negatively correlated with natural food availability.© 2008 Elsevier B.V. All rights reserved.
Keywords: Common carp; Multivariate statistics; Polyculture; Pond; Redundancy analysis; Rohu
1. Introduction
In South Asia, especially in Bangladesh, several culturecombinations of indigenous and exotic carp species are com-monly practiced (Wahab et al., 1994; Miah et al., 1997). Theidea of polyculture is based on the principle that each speciesstocked has its own feeding niche that does not completelyoverlap with the feeding niches of other species. Therefore, amore complete use is made of the food resources and spaceavailable in polyculture than in monoculture. In some cases, onespecies enhances the food availability for other species andthus increases the total fish yield per unit area (Hepher et al.,
⁎ Corresponding author. Tel.: +31-317 483307; fax: +31-317-483937.E-mail address: [email protected] (L.A.J. Nagelkerke).
0044-8486/$ - see front matter © 2008 Elsevier B.V. All rights reserved.doi:10.1016/j.aquaculture.2008.01.027
1989; Miah et al., 1993; Azad et al., 2004). Traditionally inBangladesh, 5–8 species are stocked, not always with satis-factory result, which leads to farmers using fewer species. Thecombination of the column-feeder rohu (Labeo rohita) and thebottom-feeder common carp (CC) (Cyprinus carpio), is rapidlybecoming popular because these species realize high growthrates, while fetching excellent prices in local markets.
Since polyculture ponds are complex and not fully under-stood, we investigated different stocking combinations of rohu,common carp, and artificial feed addition. Read out parametersfocused on four components of the pond food web, i.e. (1) waterquality, (2) natural food availability, (3) dietary preference, and(4) growth and production. Although some cause-effect re-lationships were revealed (Rahman et al., 2006), predictinggrowth and production in polyculture ponds remains difficult,
109M.M. Rahman et al. / Aquaculture 275 (2008) 108–115
as the complex relationships between water quality, natural foodtypes including their production and availability, fish dietarypreferences, fish growth and production are not fully under-stood. In order to simultaneously explore the relationship be-tween multiple variables we used multivariate statistics, whichenables the analysis of overall patterns and relationships. Sincewe were most interested in these overall patterns and relation-ships between variables, rather than in formal hypothesis testingbetween different treatments, we chose for a graphical multi-variate approach.
Multivariate techniques have been used relatively rarelyfor the analysis of pond aquaculture. Mostly indirect gradientanalyses, such as factor analysis and principal componentanalysis (PCA), were used in which an ordination is calculatedfrom one set of variables only. For examples, Milstein et al.(2002) used factor analysis to explain the relationships amongdifferent water quality variables in pond aquaculture. In anotherstudy Azim et al. (2003) used factor analysis to explore rela-tionship between periphyton and water quality.
In this study, direct gradient analysis was used to explain thevariation in one set of variables on a particular component of thefood web, by a set of variables on another component. In thisway, direct relationships among sets of variables related to eachof the food web components were explored, which is novel inpond aquaculture. Direct gradient analysis was used as a tool toconfirm established knowledge from experiments designedfor testing mechanistic hypothesis (Persson and Diehl, 1990).The principal objectives of this study were to examine theeffects of the addition of common carp and/or artificial feedon the different components of the pond food web, and toanalyze the nature and strength of the interactions between thesecomponents.
2. Materials and methods
2.1. Pond management and experimental design
The 4.5 months experiment was carried out in 18 earthen ponds betweenMarch and July 2003 at the Field Laboratory, Faculty of Fisheries, BangladeshAgriculture University, Bangladesh. Each of the ponds had a surface area of100 m2 and a depth of 1.2 m. Before the start of the experiment, ponds weredrained to eradicate all weeds and animal life and repair embankments andslopes. Agricultural lime (CaCO3) was applied to all ponds at 250 kg ha−1.Seven days before fertilization, all ponds were individually filled with groundwater from an adjacent deep tube-well. The fertilizer dose consisted of 1250 kgha−1 decomposed cow manure, 31 kg ha−1 urea and 16 kg ha−1 triple superphosphate, and was applied to all ponds one week before stocking and thereafterfortnightly throughout the study period. All ponds were stocked with 1.5 rohum−2. The experiment followed a 3×2 factorial design with three levels ofcommon carp densities (first factor; 0, 0.5 and 1.0 m−2) and two levels ofartificial feed (second factor; with and without feed). Each treatment had threereplications. The feed contained 30% protein and was applied daily at a rate of15 g kg−0.8 day−1 from the day after releasing fingerlings until the end of theexperiment. Feeding rates per pond were adjusted monthly after weighing aminimum of 30–50 fish (equalling 20% of the fishes stocked).
2.2. Water quality data
Water quality variables, viz. dissolved oxygen (DO), pH, total alkalinity,nitrate nitrogen (NO3–N), total ammonia nitrogen (TAN), total nitrogen (TN),phosphate phosphorus (PO4–P), total phosphorus (TP), and total suspended
solids (TSS) were determined fortnightly between 9.00 and 10.00 AM. DO wasmeasured by Winkler titration method (Stirling, 1985). The pH was measuredwith a Jenway model 3020 pH meter. Total alkalinity was determined by atitrimetric method (Stirling, 1985). Total ammonia nitrogen and phosphatephosphorus were analyzed with a spectrophotometer (Milton Roy Spectronic,model 1001 plus) following Stirling (1985). Nitrate nitrogen (cadmium re-duction), total phosphorus (acid persulphate method) and total Kjeldahl nitrogenwere determined following the methodology of APHA (1998). Total nitrogenwas determined as the sum of nitrite nitrogen, nitrate nitrogen and Kjeldahlnitrogen. Total suspended solids were determined according to Stirling (1985).
2.3. Plankton and benthos data
For plankton analysis water samples were collected fortnightly by taking at1-L sample at 10 different locations in each pond with a Niskin sampler. Thecomposite 10-L samples were then passed through a 10-µm mesh size planktonnet. Each concentrated plankton sample was transferred to a plastic bottle anddiluted with formalin and distilled water to obtain 100 ml of a 5% bufferedformalin solution. Plankton numbers were estimated in a Sedgewick–Rafter(S–R) cell containing 1000 fields of 1 mm3. A 1-ml sample was put in the S–Rcell and was left 10 min to allow plankton to settle. The plankton in 10 randomlyselected fields in the S–R cell was identified up to genus level and counted, usingthe determination keys byWard andWhipple (1959), Prescott (1962), Belcher andSwale (1976) and Bellinger (1992). Plankton density was calculated using theformula,
N ¼ P � C � 100ð Þ=Lwith N=the number of plankton per liter of pond water; P=the number ofplanktonic organisms counted in ten fields;C=the volume of plastic bottle holdingthe sample (100 ml); L=the volume of the pond water sample (10 L).
The benthos samples were collected fortnightly with an Ekman dredge. Ineach pond, bottom mud samples from three different randomly selected siteswere collected and washed through a 250 µm mesh size sieve. Benthosremaining on the sieve were preserved in a plastic vial containing a 10%buffered formalin solution. Identification keys used for benthos were afterBrinkhurst (1971) and Pinder and Reiss (1983). Benthos density was calculatedusing the formula,
N ¼ Y � 10000=3A
with N=the number of benthos (m−2); Y=total number of benthos counted in 3samples; A=area of Ekman dredge (cm2).
2.4. Diet data
Diets included all groups of phytoplankton, zooplankton and benthicmacroinvertebrates, found in the gut. One fish per species per pond wascollected monthly, weighed individually and killed in ice water. The body cavitywas opened and the anterior five cm of the gut was removed and preservedimmediately in a 10% buffered formalin solution until examined. The gutcontent was washed into a Petri dish and diluted to 50 ml with water. A 1-ml sub-sample was transferred by a pipette to an S–R cell and left for 10 min to allowthe solid particles to settle. With a microscope, food items were identified up togenus and counted in 10 randomly chosen square fields of the S–R cell. Thediets were quantified using the formula,
N ¼ P � C � 100
with N=number of a specific food item available in the gut sample, P=totalnumber of a specific food item observed in 10 fields, and C=volume (ml) ofsample in Petri dish.
2.5. Fish growth data
Fish growth and production were estimated using average individual weight,specific growth rate (SGR) and fish yield per species. Monthly estimates werecalculated. Fish were collected with a seine net and weighed to the nearest 0.1 g.

Table 2Redundancy analyses (RDA) of water quality explaining natural foodavailability
Axis 1 Axis 2 Axis 3 Axis 4
Eigenvalues 0.427 0.046 0.019 0.014Natural food availability–water qualitycorrelation
0.894 0.688 0.439 0.441
Cumulative % variance of natural foodavailability data
44.9 49.7 51.8 53.2
Cumulative % variance natural foodavailability–water quality relation
82.9 91.7 95.5 98.1
Total variance=1.000; RDA was statistically significant at Pb0.05.
110 M.M. Rahman et al. / Aquaculture 275 (2008) 108–115
Specific growth rate (% body weight day−1) was calculated using the formula(Hopkins, 1992),
SGR ¼ lnWTF � lnWTI½ � � 100=T
with WTF=final fish weight (g), WTI= initial fish weight (g), T=days betweeninitial and final weight. Species yield was the average weight of fish multipliedby the total numbers of fish in the pond. At the end of the experiment, all pondswere drained and all fish were harvested to determine the final average weight.
2.6. Data analysis
Four different datasets were used: (1) water quality: DO, pH, total alkalinity,NO3–N, TAN, TN, PO4–P, TP, TSS; (2) natural foods: total Bacillariophyceae,total Chlorophyceae, total Cyanophyceae, total Euglenophyceae, total Rotifera,total Cladocera, total Copepoda and total macroinvertebrates; (3) fish diet (gutcontent): total Bacillariophyceae, total Chlorophyceae, total Cyanophyceae,total Euglenophyceae, total Rotifera, total Cladocera, total Copepoda and totalmacroinvertebrates; and (4) growth and production: average individualharvesting weight, SGR, total fish yield. Monthly mean values were calculatedfor all variables and for each pond, resulting in five repeated measures per pondand 90 data points in total. Percent data were arcsine transformed beforeanalysis.
We calculated the explanatory power of each of the four datasets for all otherdatasets, in order to see which interactions between food web components werestrongest. This means that each dataset was used both as a response and anexplanatory variable in all combinations (e.g. we did not only calculate theexplanatory power of water quality for diet, but also the explanatory effect ofdiet on water quality). We chose this approach because in complex pondinteractions it is not possible to identify true ‘independent’ and ‘dependent’variables. Our analysis resulted in 12 correlations between datasets, both forrohu and for common carp (Table 1).
Multivariate ordinations were performed with the computer programCANOCO 4 (ter Braak and Šmilauer, 1998). First, an indirect gradient analysis(detrended correspondence analysis; DCA) was executed to reveal prevailingpatterns of the response variables in relation with the explanatory variablegradient (Jongman et al., 1995). Ordination axes smaller than two standarddeviations indicated monotonic responses, suggesting that redundancy analysis(RDA) was the proper method for direct gradient analysis. RDA was run withvariables centred and standardized by subtracting the mean and dividing by thestandard deviation.
RDA was used to directly explain the variation in the response variablesfrom the variation in the explanatory variables. To correct for the time effect,caused by the 4.5 month duration of the experiment, date was used as acovariate. The significance of first ordination axis and the significance of thefirst four canonical axes together were evaluated with Monte Carlo-permutationtests with 1000 permutations. Monte Carlo tests were restricted to account forrepeated measures for each pond. The standard deviation of the score on the firstordination axis in the DCAwas always less than 2 indicating linear or monotonic
Table 1Correlations among the datasets along the first canonical RDA axis (r value)
Explanatory variables Response variables
Water quality Food availability Diet Growth
RohuWater quality × 0.894 0.732 0.653Food availability 0.710 × 0.835 0.742Diet 0.535 0.459 × 0.787Growth 0.588 0.092 0.703 ×
Common carpWater quality × 0.894 0.620 0.927Food availability 0.710 × 0.766 0.839Diet 0.473 0.525 × 0.767Growth 0.694 0.600 0.613 ×
In bold are the highest correlations for each response variable dataset.
relationships. Therefore, RDA was appropriate to perform direct gradientanalysis in all cases. All possible RDAs among the four datasets were performedand evaluated for the correlation between the explanatory and response variablesalong the first canonical axis. The highest canonical correlation indicated thehighest direct explanatory power, thereby identifying the set of variables withhighest explanatory power.
3. Results
The first canonical axis as well as the first four canonical axescombined were statistically significant at the 5% level for all RDAs.Table 1 indicates the correlations between the sets of explanatory andresponse variables along the first canonical axis, whereby the highestcanonical correlation indicates the highest direct explanatory power.Natural food availability was best explained by water quality, and dietby natural food availability for both rohu and common carp (CC). Inturn, diet best explained growth for rohu. However, CC growth wasbest explained by water quality. These relationships are further ex-plored in the following sections.
Fig. 1. RDA biplot (first two axes) of natural food availability in the pondexplained by pond water quality (baci = total Bacillariophyceae, chl = totalChlorophyceae, cya = total Cyanophyceae, eug = total Euglenophyceae, rot =total Rotifera, cla = total Cladocera, cop = total Copepoda, bmi = total benthicmacroinvertebrates and Alka = total alkalinity).

Table 3Redundancy analyses (RDA) of natural food availability explaining diet of rohuand common carp (CC)
Axis 1 Axis 2 Axis 3 Axis 4
RohuEigenvalues 0.276 0.018 0.010 0.009Rohu diet–natural food availabilitycorrelation
0.835 0.454 0.397 364
Cumulative % variance of rohu diet data 36.4 38.8 40.1 41.3Cumulative % variance rohu diet–naturalfood availability relation
86.4 92.0 95.1 97.9
Common carpEigenvalues 0.124 0.015 0.010 0.006CC diet–natural food availabilitycorrelation
0.766 0.534 0.436 0.365
Cumulative % variance of CC diet data 27.2 30.5 32.5 34.0Cumulative % variance CC diet–naturalfood availability relation
76.9 86.2 92.3 96.1
Total variance=1.000; both RDAs were statistically significant at Pb0.05.
111M.M. Rahman et al. / Aquaculture 275 (2008) 108–115
3.1. Food availability explained by water quality
Two significant axes explained 49.7% of the variance in naturalfood availability and 91.7% of the natural food-water quality relationin the RDA (Table 2). The first RDA axis was positively correlatedwith the presence of CC (Fig. 1), although the lower density of CC(0.5 CC m−2) obtained the highest values. This axis may be inter-preted as a ‘CC addition’ axis, positively correlated with all nitroge-nous (NO3–N, TAN and TN) and phosphorus (PO4–P and TP) speciesand all groups of phytoplankton and zooplankton availability, andnegatively correlated with total alkalinity, pH and DO concentration
Fig. 2. RDA biplot (first two axes) of fish diet explained by food availability in the poCyanophyceae, eug = total Euglenophyceae, rot = total Rotifera, cla = total Cladocerabenthic macroinvertebrate groups having d in front indicate availability of that grEuglenophyceae was absent in CC diet).
and total benthic macroinvertebrate availability. The correlation amongaddition of CC, all nitrogenous and phosphorus species and all groupsof phytoplankton and zooplankton availability was stronger in thepresence of artificial feed than in the absence of it. The overall con-centrations of nitrogenous and phosphorus species and the densities ofall groups of phytoplankton and zooplankton were stronger in thetreatments with 0.5 than 1 CC m−2.
With the options used for RDA, a small angle between two vari-ables is indicative of a high positive correlation between the variables,an angle of 90° indicates independence of variables, and an angle largerthan 90° indicates a negative correlation. Using this way of inter-pretation, all groups of phytoplankton and zooplankton in the pondwater were positively correlated with all nitrogen and phosphorusspecies and TSS, whereas negatively correlated with total alkalinity, pHand DO concentration. An opposite relation was observed in case ofbenthic macroinvertebrate availability. The density of benthic macro-invertebrates was positively correlated with total alkalinity, pH and DOconcentration whereas negatively correlated with all other water qualityparameters.
3.2. Diet explained by natural food availability
The first two canonical axes explained 38.8% of the variance in dietand 92% of the diet-natural food availability relationship in rohu and30.5% and 86.2% of these relationships in common carp (Table 3). Inrohu, the treatments with artificial feed addition scored high on the firstRDA axis (Fig. 2), whichmay therefore be interpreted as an artificial feedaddition axis. This axis is positively correlated with natural food avail-ability and with all components of rohu diet except Euglenophyceaeand Chlorophyceae ingestion. Ingestion of all groups of phytoplankton(except Euglenophyceae) and zooplankton by rohu was positivelycorrelated with natural food availability in the water. Euglenophyceae
nds water (baci = total Bacilariophyceae, chl = total Chlorophyceae, cya = total, cop = total Copepoda and bmi = total benthic macroinvertebrate; plankton andoups in the fish diet; benthic macroinvertebrate was absent in rohu diet and
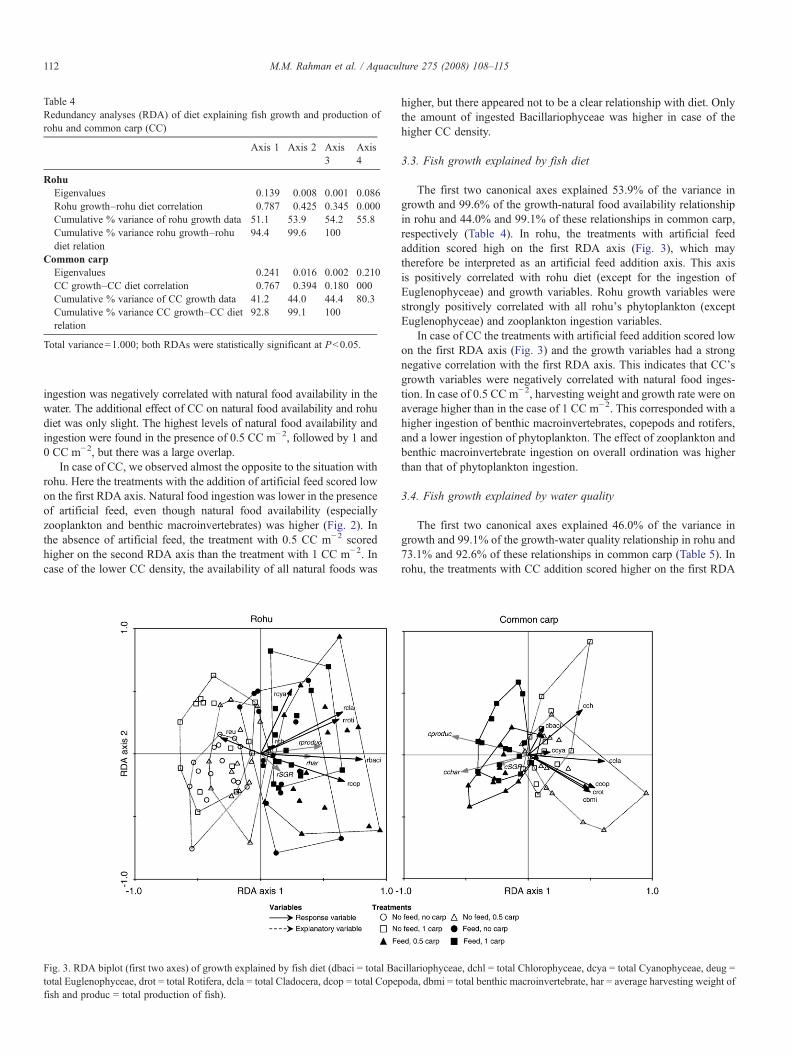
Table 4Redundancy analyses (RDA) of diet explaining fish growth and production ofrohu and common carp (CC)
Axis 1 Axis 2 Axis3
Axis4
RohuEigenvalues 0.139 0.008 0.001 0.086Rohu growth–rohu diet correlation 0.787 0.425 0.345 0.000Cumulative % variance of rohu growth data 51.1 53.9 54.2 55.8Cumulative % variance rohu growth–rohudiet relation
94.4 99.6 100
Common carpEigenvalues 0.241 0.016 0.002 0.210CC growth–CC diet correlation 0.767 0.394 0.180 000Cumulative % variance of CC growth data 41.2 44.0 44.4 80.3Cumulative % variance CC growth–CC dietrelation
92.8 99.1 100
Total variance=1.000; both RDAs were statistically significant at Pb0.05.
112 M.M. Rahman et al. / Aquaculture 275 (2008) 108–115
ingestion was negatively correlated with natural food availability in thewater. The additional effect of CC on natural food availability and rohudiet was only slight. The highest levels of natural food availability andingestion were found in the presence of 0.5 CC m−2, followed by 1 and0 CC m−2, but there was a large overlap.
In case of CC, we observed almost the opposite to the situation withrohu. Here the treatments with the addition of artificial feed scored lowon the first RDA axis. Natural food ingestion was lower in the presenceof artificial feed, even though natural food availability (especiallyzooplankton and benthic macroinvertebrates) was higher (Fig. 2). Inthe absence of artificial feed, the treatment with 0.5 CC m−2 scoredhigher on the second RDA axis than the treatment with 1 CC m−2. Incase of the lower CC density, the availability of all natural foods was
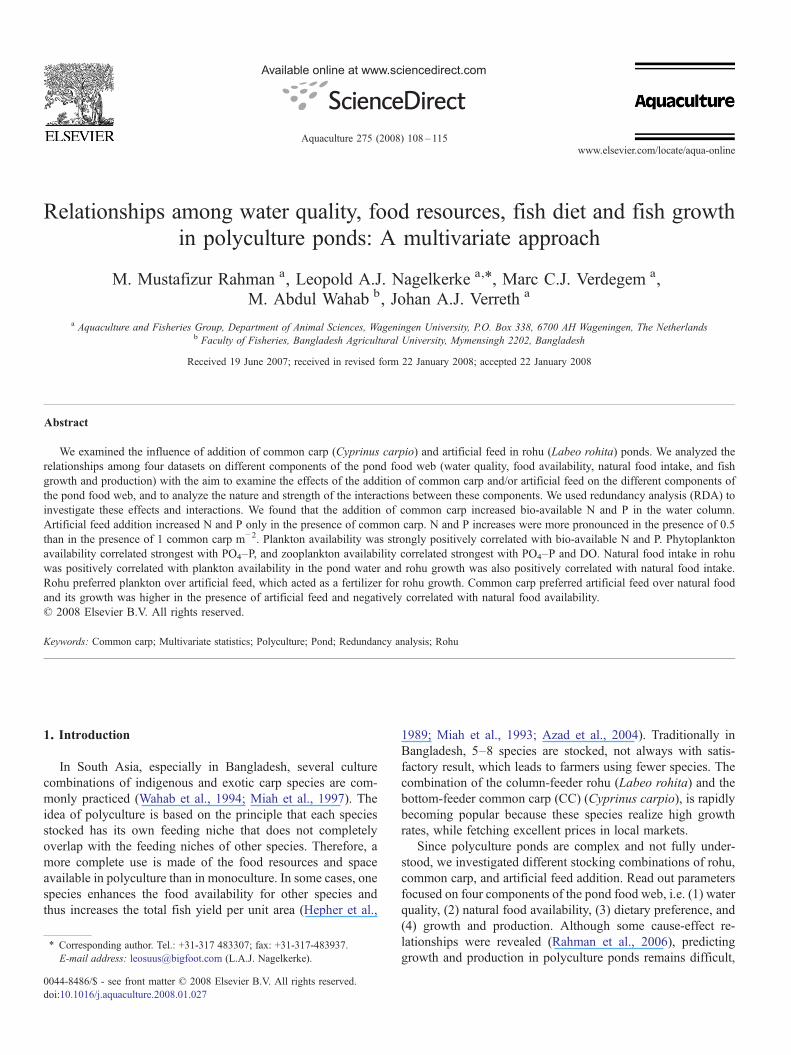
Fig. 3. RDA biplot (first two axes) of growth explained by fish diet (dbaci = total Batotal Euglenophyceae, drot = total Rotifera, dcla = total Cladocera, dcop = total Copepfish and produc = total production of fish).
higher, but there appeared not to be a clear relationship with diet. Onlythe amount of ingested Bacillariophyceae was higher in case of thehigher CC density.
3.3. Fish growth explained by fish diet
The first two canonical axes explained 53.9% of the variance ingrowth and 99.6% of the growth-natural food availability relationshipin rohu and 44.0% and 99.1% of these relationships in common carp,respectively (Table 4). In rohu, the treatments with artificial feedaddition scored high on the first RDA axis (Fig. 3), which maytherefore be interpreted as an artificial feed addition axis. This axisis positively correlated with rohu diet (except for the ingestion ofEuglenophyceae) and growth variables. Rohu growth variables werestrongly positively correlated with all rohu's phytoplankton (exceptEuglenophyceae) and zooplankton ingestion variables.
In case of CC the treatments with artificial feed addition scored lowon the first RDA axis (Fig. 3) and the growth variables had a strongnegative correlation with the first RDA axis. This indicates that CC'sgrowth variables were negatively correlated with natural food inges-tion. In case of 0.5 CC m−2, harvesting weight and growth rate were onaverage higher than in the case of 1 CC m−2. This corresponded with ahigher ingestion of benthic macroinvertebrates, copepods and rotifers,and a lower ingestion of phytoplankton. The effect of zooplankton andbenthic macroinvertebrate ingestion on overall ordination was higherthan that of phytoplankton ingestion.
3.4. Fish growth explained by water quality
The first two canonical axes explained 46.0% of the variance ingrowth and 99.1% of the growth-water quality relationship in rohu and73.1% and 92.6% of these relationships in common carp (Table 5). Inrohu, the treatments with CC addition scored higher on the first RDA
cillariophyceae, dchl = total Chlorophyceae, dcya = total Cyanophyceae, deug =oda, dbmi = total benthic macroinvertebrate, har = average harvesting weight of
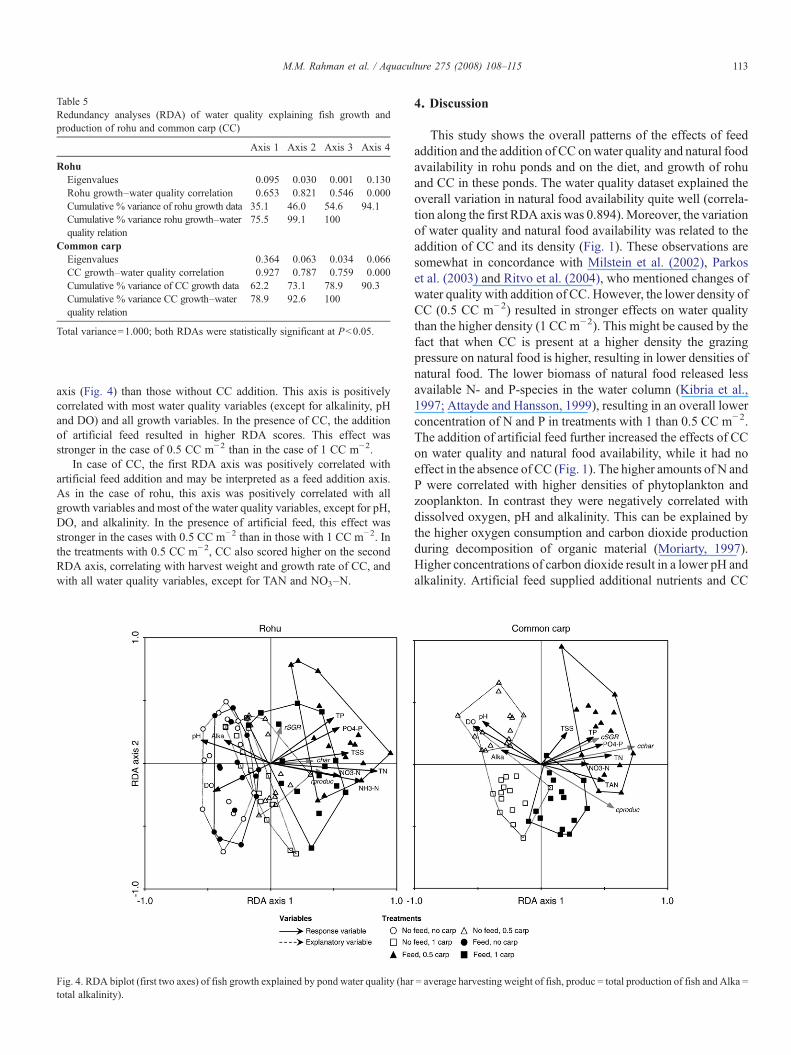
Table 5Redundancy analyses (RDA) of water quality explaining fish growth andproduction of rohu and common carp (CC)
Axis 1 Axis 2 Axis 3 Axis 4
RohuEigenvalues 0.095 0.030 0.001 0.130Rohu growth–water quality correlation 0.653 0.821 0.546 0.000Cumulative % variance of rohu growth data 35.1 46.0 54.6 94.1Cumulative % variance rohu growth–waterquality relation
75.5 99.1 100
Common carpEigenvalues 0.364 0.063 0.034 0.066CC growth–water quality correlation 0.927 0.787 0.759 0.000Cumulative % variance of CC growth data 62.2 73.1 78.9 90.3Cumulative % variance CC growth–waterquality relation
78.9 92.6 100
Total variance=1.000; both RDAs were statistically significant at Pb0.05.
113M.M. Rahman et al. / Aquaculture 275 (2008) 108–115
axis (Fig. 4) than those without CC addition. This axis is positivelycorrelated with most water quality variables (except for alkalinity, pHand DO) and all growth variables. In the presence of CC, the additionof artificial feed resulted in higher RDA scores. This effect wasstronger in the case of 0.5 CC m−2 than in the case of 1 CC m−2.
In case of CC, the first RDA axis was positively correlated withartificial feed addition and may be interpreted as a feed addition axis.As in the case of rohu, this axis was positively correlated with allgrowth variables and most of the water quality variables, except for pH,DO, and alkalinity. In the presence of artificial feed, this effect wasstronger in the cases with 0.5 CC m−2 than in those with 1 CC m−2. Inthe treatments with 0.5 CC m−2, CC also scored higher on the secondRDA axis, correlating with harvest weight and growth rate of CC, andwith all water quality variables, except for TAN and NO3–N.
Fig. 4. RDA biplot (first two axes) of fish growth explained by pond water quality (hartotal alkalinity).
4. Discussion
This study shows the overall patterns of the effects of feedaddition and the addition of CC onwater quality and natural foodavailability in rohu ponds and on the diet, and growth of rohuand CC in these ponds. The water quality dataset explained theoverall variation in natural food availability quite well (correla-tion along the first RDA axis was 0.894).Moreover, the variationof water quality and natural food availability was related to theaddition of CC and its density (Fig. 1). These observations aresomewhat in concordance with Milstein et al. (2002), Parkoset al. (2003) and Ritvo et al. (2004), who mentioned changes ofwater quality with addition of CC. However, the lower density ofCC (0.5 CC m−2) resulted in stronger effects on water qualitythan the higher density (1 CC m−2). This might be caused by thefact that when CC is present at a higher density the grazingpressure on natural food is higher, resulting in lower densities ofnatural food. The lower biomass of natural food released lessavailable N- and P-species in the water column (Kibria et al.,1997; Attayde and Hansson, 1999), resulting in an overall lowerconcentration of N and P in treatments with 1 than 0.5 CC m−2.The addition of artificial feed further increased the effects of CCon water quality and natural food availability, while it had noeffect in the absence of CC (Fig. 1). The higher amounts of N andP were correlated with higher densities of phytoplankton andzooplankton. In contrast they were negatively correlated withdissolved oxygen, pH and alkalinity. This can be explained bythe higher oxygen consumption and carbon dioxide productionduring decomposition of organic material (Moriarty, 1997).Higher concentrations of carbon dioxide result in a lower pH andalkalinity. Artificial feed supplied additional nutrients and CC
= average harvesting weight of fish, produc = total production of fish and Alka =
114 M.M. Rahman et al. / Aquaculture 275 (2008) 108–115
increased decomposition and liberation of those nutrients fromsediment to the water column (Hohener and Gachter, 1994),resulting in the observed patterns.
It was found that PO4–P and NO3–N were strongly posi-tively correlated with phytoplankton and zooplankton biomass.PO4–P had the strongest overall correlation with phytoplanktondensity (longer vector in Fig. 1) and with natural food avail-ability in general. The correlation between PO4–P and totalphytoplankton biomass was stronger in treatments withoutCC (r=0.64, Pb0.01) than with CC (r=0.50, Pb0.01), whichmight indicate that phytoplankton biomass was limited byPO4–P concentrations in treatment without CC. This is inaccordance with Schindler (1988), Elser et al. (1990) and Dianaet al. (1997), who stated that phosphorus is a major limitingnutrient in most freshwater ecosystems. In another study, Smith(1985) showed that phytoplankton production at optimumlight intensity was highly dependent on phosphorus. Overallzooplankton densities are best explained by PO4–P and DOconcentrations. Total zooplankton biomass was strongly cor-related with these two factors (PO4–P: r=0.68, Pb0.01; DO:r=−0.65, Pb0.01) whereas correlations with all other waterquality parameters were weak. The positive correlation be-tween zooplankton and PO4–P might be caused directlythrough the release of PO4–P by zooplankton (Wen et al.,1994; Ikeda et al., 1982), and indirectly via phytoplanktonproduction. Some zooplankton species are known not to tol-erate low oxygen concentrations (Elgmork, 1959). However,DO concentration generally affects zooplankton at much lowerconcentrations (b2.5 mg L−1: Hanazato et al., 1989; Bertilssonet al., 1995) than found in this study (range: 4.6–7.7 mg L−1)and therefore it is not likely that it played a significant role instructuring the zooplankton community in the ponds. Thenegative correlation between DO concentration and zooplank-ton density was most probably caused by, (i) the respiration ofzooplankton, and (ii) decomposition of organic matter producedby the zooplankton. A similar negative correlation between zoo-plankton availability and DO concentration was documented byAka et al. (2000) and Dresilign (2003).
We found that for rohu overall diet was best explained bynatural food availability (correlation along the first RDA axis:r=0.835; Table 1). These results clearly indicate that rohumainly feeds on natural food and that the positive effect ofartificial feed on natural food availability, ingestion and growthis indirect. Probably the artificial feed acts as a fertilizer (Dewanet al., 1988; Diana et al., 1997), increasing the amount of naturalfood through the higher concentrations of nutrients in presenceof common carp (Fig. 1). This allowed rohu to eat higheramounts of phytoplankton and zooplankton, which is its pre-ferred food when foraging in the water column (Dewan et al.,1977; Jhingran and Pullin, 1985; Wahab et al., 1994). There-fore, addition of artificial feed and common carp both areimportant factors for rohu's natural food ingestion and growthand production.
The effects of ingestion of all zooplankton groups on theoverall ordination are stronger than the effects of almost allphytoplankton ingestion variables (except for Bacillariophy-ceae; Fig. 2)). These results indicate that rohu reacts more
strongly on changes in zooplankton availability, suggesting thatrohu prefers zooplankton over phytoplankton. This result some-what agrees with Miah et al. (1984), who mentioned rohu fryprefer zooplankton above phytoplankton.
In CC, we found that the overall diet was best explainedby food availability (correlation along the first RDA axis:r=0.766; Table 1), but not as good as in rohu (r=0.835). Theoverall relationship between the natural food ingestion andgrowth and production datasets in CC is lower (r=0.767 alongthe first RDA axis; Table 1), than the relationship between waterquality and growth and production datasets (r=0.927 along thefirst RDA axis; Table 1), probably because artificial feed inges-tion was not used as a variable in the analysis. In CC, ingestionof natural food was lower and growth and production was higherwith addition of artificial feed, although availability of natu-ral food was higher with addition of artificial feed (Figs. 2, 3).These results indicate that common carp prefers artificial feedover natural foods. In absence of artificial feed, CC preferredzooplankton and benthic macroinvertebrates when natural foodwas relatively more abundant in presence of 0.5 CC m−2, but itswitched to ingest phytoplankton when natural food was lessabundant in presence of 1 CCm−2 (Fig. 2). This result somewhatagrees with Spataru et al. (1983), Sibbing (1988) and Garcia-Berthou (2001), who mentioned CC is a bottom feeder, feedingon zooplankton and benthic macroinvertebrates but it can alsofeed on phytoplankton. The strongest correlation between waterquality and growth and production of CC might be related withstirring effects, which increased nutrient fluxes from the sedi-ment to the water column (Graneli, 1979; Hohener and Gachter,1994; Hargreaves, 1998).
Our results show that in the management of rohu pondsaddition of artificial feed and stocking of CC have positive, butinteracting, effects on total pond yield. The addition of feedappears to be most profitable in the presence of an intermediatedensity of CC, because then CC can profit most of both naturalfood (especially macroinvertebrates) and artificial feed, while,at the same time, rohu profits most from the fertilizing effect offeed addition and the stirring effect of CC. At higher densities ofCC competition between CC for the available macroinverte-brates may be stronger (Rahman et al., 2006). This could lead toa more efficient uptake of artificial feed by CC, leaving less feedavailable for pond fertilization. This would result in less plank-ton production, which is the preferred food of rohu. The exis-tence of an intermediate optimum stocking density of CC toincrease total fish yield could be taken into account by pondmanagers, for instance by implementing small-scale trials withdifferent stocking densities.
5. Conclusions
For rohu and common carp in polyculture ponds we foundthat water quality variables were the best explanatory variablesfor natural food availability, which in turn explained naturalfood ingestion best. In the case of rohu, natural food ingestionexplained most of the variation in growth and production,but not for common carp, which preferred artificial feed overnatural food. The stepwise correlation of growth and production
115M.M. Rahman et al. / Aquaculture 275 (2008) 108–115
of rohu and carp from datasets of water quality, food availabilityand food ingestion, using redundancy analysis explained moreof the total variation than would have been shown by separatelycorrelating these datasets. Therefore we believe that this ap-proach could be a promising tool for elucidating causal links inpond aquaculture research.
References
Aka, M., Pagano, M., Saint-Jean, L., Arfi, R., Bouvy, M., Cecchi, P., Corbin, D.,Thomas, S., 2000. Zooplankton variability in 49 shallow tropical reservoirsof Ivory Coast (West Africa). Int. Rev. Hydrobiol. 85, 491–504.
APHA, 1998. Standard methods for the examination of water and waste water.American Public Health Association, Washington DC. 1162 pp.
Attayde, J.L., Hansson, L.-A., 1999. Effects of nutrient recycling by zooplanktonand fish on phytoplankton communities. Oecologia 121, 47–54.
Azad, M.A.K., Rahman, M.R., Rahman, Z., Kader, M.A., Haque, M.M., Alam,M.J., 2004. Polyculture of carp, tilapia and pangas using low cost inputs.Pakistan J. Biol. Sci. 7, 1918–1926.
Azim, M.E., Milstein, A., Wahab, M.A., Verdegem, M.C.J., 2003. Periphyton-water quality relationships in fertilized fishponds with artificial substrates.Aquaculture 228, 169–187.
Belcher, H., Swale, S., 1976. A beginner's guide to freshwater algae. Institute ofTerrestrial Ecology, Natural Environmental Research Council, London. 47 pp.
Bellinger, E.G., 1992. A key to common algae. The Institute of Water andEnvironmental Management, London. 138 pp.
Bertilsson, J., Berzins, B., Pejler, B., 1995. Occurrence of limnic micro-crustaceans in relation to temperature and oxygen. Hydrobiology 299,163–167.
Brinkhurst, R.O., 1971. A guide for the identification of British aquaticOligochaeta. Freshwater Biological Association Scientific Publication (No.22), Ambleside. 55 pp.
Dewan, S., Ali, M.M., Islam, M.A., 1977. Studies on the size and patterns offeeding of fries and fingerlings of three major carps viz. Labeo rohita(Ham.) Catla catla (Ham.) and Cirrhina mrigala (Ham.). Bangladesh J.Agric. 2, 223–228.
Dewan, S., Hossain, M.S., Islam, M.S., Hossain, S.M.A., 1988. Exploration ofpond fish production under village condition. Bangladesh J. Fish. 11, 101–104.
Diana, J.S., Szyper, J.P., Batterson, T.R., Boyd, C.E., Piedrahita, R.H., 1997.Water quality in ponds. In: Egna, H.S., Boyd, C.E. (Eds.), Dynamics of pondaquaculture. CRC press, LLC, pp. 53–72.
Dresilign, E.D., 2003. Ecology and potential for fishery of the small barbs(Cyprinidae, Teleostei) of Lake Tana, Ethiopia. Wageningen University,Wageningen, the Netherlands. 180 pp.
Elgmork, K., 1959. Seasonal occurrence of Cyclops strenuus in relation toenvironment in small water bodies in southern Norway. Folia Limnol.Scand. 11, 1–96.
Elser, J., Marzolf, E., Goldman, C., 1990. Phosphorus and nitrogen limitation ofphytoplankton in the freshwaters of North America: a review and critique ofexperimental enrichments. Can. J. Fish. Aquat. Sci. 47, 1468–1477.
Garcia-Berthou, E., 2001. Size- and depth-dependent variation in habitat anddiet of the common carp (Cyprinus carpio). Aquat. Sci. 63, 466–476.
Graneli, W., 1979. The influence of Chironomus plumosus larvae on the oxygenuptake of sediment. Arch. Hydrobiol. 87, 385–403.
Hanazato, T., Yasuno, M., Hosomi, M., 1989. Significance of a low oxygenlayer for a Daphnia population in Lake Yunoko, Japan. Hydrobiologia 185,19–28.
Hargreaves, J.A., 1998. Nitrogen biochemistry of aquaculture ponds. Aqua-culture 166, 181–212.
Hepher, B., Milstein, A., Leventer, H., Teltsch, B., 1989. The effect of fishdensity and species combination on growth and utilization of natural food inponds. Aquacult. Fish. Manag. 20, 59–71.
Hohener, P., Gachter, R., 1994. Nitrogen cycling across the sediment-waterinterface in the eutrophic, artificially oxygenated lake.Aquat. Sci. 56, 115–132.
Hopkins, K.D., 1992. Reporting fish growth: a review of the basics. J. WorldAquac. Soc. 23, 173–179.
Ikeda, T., Hing Fay, E., Hutchinson, S.A., Boto, G.M., 1982. Ammonia andinorganic phosphate excretion by zooplankton from inshore waters of thegreat barrier reef, Queensland. I. Relationship between excretion rate andbody size. Aust. J. Mar. Fresh. Res. 33, 55–70.
Jhingran, V.G., Pullin, R.S.V., 1985. A hatchery manual for the common,Chinese and Indian major carp. ADB and ICLARM Publication, ICLARMcontribution 252. 191 pp.
Jongman, R.H.G., ter Braak, C.J.F., van Tongeren, O.F.R., 1995. Data analysisin community and landscape ecology. Cambridge University Press. 321 pp.
Kibria, G., Nugegoda, D., Fairclough, R., Lam, P., 1997. The nutrient contentand the release of nutrients from fish food and faeces. Hydrobiologia 357,165–171.
Miah, M.I.U., Dewan, S., Wahiduzzaman, M., 1984. Studies on the type andamount of food taken by the silver carp Hypophthalmichthys molitrix (Val.)and diet patterns of feeding in a Bangladesh pond. Bangladesh J. Fish. 7,49–54.
Miah, M.S., Uddin, M.S., Shah, M.S., 1993. Effects of artificial feed in carpspolyculture system. Bangladesh J. Agric. Sci. 20, 359–364.
Miah, M.S., Uddin, M.S., Shah, M.S., 1997. Effect of stocking ratios on thegrowth and production of fishes in mixed polyculture system. Bangladesh J.Fish. 20, 135–138.
Milstein, A., Wahab, M.A., Rahman, M.M., 2002. Environmental effects ofcommon carp, Cyprinus carpio (L.) and mrigal, Cirrhinus mrigala(Hamilton) as bottom feeders in major Indian carp polycultures. Aquac.Res. 33, 1103–1117.
Moriarty, D.J.W., 1997. The role of microorganisms in aquaculture ponds.Aquaculture 151, 333–349.
Parkos III, J.J., Santucci Jr., V.J., Wahl, D.H., 2003. Effects of adult commoncarp (Cyprinus carpio) on multiple trophic levels in shallow mesocosms.Can. J. Fish. Aquat. Sci. 60, 182–192.
Persson, L., Diehl, S., 1990. Mechanistic individual-based approaches in thepopulation/communities ecology of fish. Ann. Zool. Fenn. 27, 165–182.
Pinder, L.C., Reiss, F., 1983. The larvae of Chironomidae (Diptera: Chironomidae)of the Holarctic region. In: Wiederholm, T. (Ed.), Chironomidae ofthe Holarctic Region, Entomological Scandinavic Supplement No. 19,pp. 293–437.
Prescott, G.W., 1962. Algae of the Western Great Lakes Area. Wm. C. BrownCo., Dubuque, Iowa. 977 pp.
Rahman,M.M., Verdegem,M.C.J., Nagelkerke, L.A.J.,Wahab,M.A.,Milstein, A.,Verreth, J.A.J., 2006. Growth, production and food preference of rohu Labeorohita (H.) in monoculture and in polyculture with common carp Cyprinuscarpio (L.) under fed and non-fed ponds. Aquaculture 257, 359–372.
Ritvo, G., Kochba, M., Avnimelech, Y., 2004. The effects of common carpbioturbation on fishpond bottom soil. Aquaculture 242, 345–356.
Schindler, D.W., 1988. Experimental studies of chemical stressors on whole lakeecosystems. Verh. Int. Ver. Limnol. 23, 11–41.
Sibbing, F.A., 1988. Specializations and limitations in the utilization of foodresources by the carp, Cyprinus carpio: a study of oral food processing.Environ. Biol. Fish. 22, 161–178.
Smith, D.W., 1985. Biological control of excessive phytoplankton growth andthe enhancement of aquacultural production. Can. J. Fish. Aquat. Sci. 42,1940–1945.
Spataru, P., Wohlfarth, G.W., Hulata, G., 1983. Studies on the natural food ofdifferent fish species in intensively manured polyculture ponds. Aquaculture35, 283–298.
Stirling, H.P., 1985. Chemical and Biological methods of water analysisfor aquaculturists, Institute of Aquaculture. University of Stirling, Stirling.117 pp.
ter Braak, C.J.F., Šmilauer, P., 1998. CANOCO reference manual and user'sguide to Canoco for Windows: software for canonical community ordination(version 4). Microcomputer Power, Ithaca, NY, USA. 352 pp.
Wahab, M.A., Ahmed, Z.F., Haq, M.S., Begum, M., 1994. Compatibility ofSilver carp in the polyculture of cyprinid fishes. Prog. Agric. 5, 221–227.
Ward, H.B., Whipple, G.C., 1959. Freshwater Biology. John Wiley and Sons,New York. 1248 pp.
Wen, Y.H., Vezina, A., Peters, R.H., 1994. Phosphorus fluxes in limneticcladocerans: coupling of allometry and compartmental analysis. Can. J. Fish.Aquat. Sci. 51, 1055–1064.