Ammonia variations in phytotreatment ponds of land-based fish farm wastewater
10
Ammonia variations in phytotreatment ponds of land-based fish farm wastewater Salvatore Porrello a, * , Giuseppe Ferrari, Mauro Lenzi b , Emma Persia a a Central Institute for Marine Research, ICRAM, Via di Casalotti, 300-00166 Rome, Italy b Lagoon Ecology and Aquaculture Laboratory (lealab), OPL S.R.L., Orbetello, Italy Received 25 January 2002; received in revised form 11 October 2002; accepted 18 November 2002 Abstract The present study reports the results of 2 years monitoring of ammonia present in intensive sea- farm water and in the effluent from phytotreatment ponds (lagooning) to which fish farm wastewater is conveyed before discharge into the Orbetello Lagoon (Tuscany, Italy). The aims were: (1) to evaluate the quality of the water discharged into the receiving environment, which consists of a shallow coastal lagoon with low renewal rate; (2) to assess the effect of lagooning on fish farming wastewater with reference to total ammonia and undissociated ammonia. During the test period, physicochemical parameters were measured using two HYDROLAB Datasonde 3 multiparameter probes. Water samples were taken monthly. Ammonia determinations were performed on a BRAN + LUEBBE AA III Autoanalyzer. Recorded undissociated ammonia concentrations represent a critical water quality element for the receiving environment: the NH 3 during the above period lay between 0.16 and 5.06 AM (annual mean: 1.12 F 1.21 AM). The increase in pH occurring inside the system appreciably increases undissociated ammonia content as a result of high macroalgal development. The pH pick value (8.56 unity) was recorded in the treatment ponds in October. Undissociated ammonia increases wastewater toxicity, but, at the same time, its volatilization is an important mechanism of nitrogen removal, which reduces the eutrophizing contribution of the wastewater itself. D 2003 Elsevier Science B.V. All rights reserved. Keywords: Ammonia; Eutrophication; Aquaculture wastewater; Phytotreatment pond 0044-8486/03/$ - see front matter D 2003 Elsevier Science B.V. All rights reserved. doi:10.1016/S0044-8486(02)00637-3 * Corresponding author. E-mail address: [email protected] (S. Porrello). www.elsevier.com/locate/aqua-online Aquaculture 219 (2003) 485 – 494
-
Upload
independent -
Category
Documents
-
view
3 -
download
0
Transcript of Ammonia variations in phytotreatment ponds of land-based fish farm wastewater
Ammonia variations in phytotreatment ponds of
land-based fish farm wastewater
Salvatore Porrelloa,*, Giuseppe Ferrari,Mauro Lenzib, Emma Persiaa
aCentral Institute for Marine Research, ICRAM, Via di Casalotti, 300-00166 Rome, ItalybLagoon Ecology and Aquaculture Laboratory (lealab), OPL S.R.L., Orbetello, Italy
Received 25 January 2002; received in revised form 11 October 2002; accepted 18 November 2002
Abstract
The present study reports the results of 2 years monitoring of ammonia present in intensive sea-
farm water and in the effluent from phytotreatment ponds (lagooning) to which fish farm wastewater
is conveyed before discharge into the Orbetello Lagoon (Tuscany, Italy). The aims were: (1) to
evaluate the quality of the water discharged into the receiving environment, which consists of a
shallow coastal lagoon with low renewal rate; (2) to assess the effect of lagooning on fish farming
wastewater with reference to total ammonia and undissociated ammonia. During the test period,
physicochemical parameters were measured using two HYDROLAB Datasonde 3 multiparameter
probes. Water samples were taken monthly. Ammonia determinations were performed on a
BRAN+LUEBBE AA III Autoanalyzer. Recorded undissociated ammonia concentrations represent
a critical water quality element for the receiving environment: the NH3 during the above period lay
between 0.16 and 5.06 AM (annual mean: 1.12F 1.21 AM). The increase in pH occurring inside the
system appreciably increases undissociated ammonia content as a result of high macroalgal
development. The pH pick value (8.56 unity) was recorded in the treatment ponds in October.
Undissociated ammonia increases wastewater toxicity, but, at the same time, its volatilization is an
important mechanism of nitrogen removal, which reduces the eutrophizing contribution of the
wastewater itself.
D 2003 Elsevier Science B.V. All rights reserved.
Keywords: Ammonia; Eutrophication; Aquaculture wastewater; Phytotreatment pond
0044-8486/03/$ - see front matter D 2003 Elsevier Science B.V. All rights reserved.
doi:10.1016/S0044-8486(02)00637-3
* Corresponding author.
E-mail address: [email protected] (S. Porrello).
www.elsevier.com/locate/aqua-online
Aquaculture 219 (2003) 485–494
1. Introduction
Ammonia, as undissociated form (NH3), is one of the most toxic substances produced
by intensive fish farms and has a high impact on aquatic communities when transported by
the effluent from the plants themselves (Ziemann et al., 1992).
The chemical equilibrium between undissociated ammonia and total ammonia is a
function of salinity, temperature and, to a large extent, pH (Miller et al., 1990; Soderberg
and Meade, 1991; Boyd, 1990). For equal initial concentration values of total ammonia, a
pH variation from 7 to 8 leads to a 10-fold increase in the formation of the toxic fraction
(Lloyd, 1992).
The release of dissolved nutrients by a fish farm leads to an increase in their
concentration in the receiving water body. This increase has been called ‘‘hypernutrifica-
tion’’ (Gowen and Bradbury, 1987). The total ammonia is the largest component of the
nitrogenous fraction of this output.
A large number of scientific investigations have been carried out on ammonia toxicity
in fish farming and on water quality of rearing. The most significant review about these
arguments is Handy and Poxton (1993); also considered important is the EU Report on the
topic published by Munday et al., 1992.
In confined areas such as pools, tanks, ponds, especially with inadequate water renewal,
ammonia may reach concentrations strong enough to cause serious damage to the health
and growth of the farmed animals, with sometimes lethal effects. For fresh water, Colt and
Tchobanollus (1978) found an inverse correlation between farmed animal growth and
undissociated ammonia concentration. For Atlantic salmon, Alabaster et al. (1979)
reported 24-h LC50 NH3 concentration values of 0.09 and 0.23 mg/l, respectively, for
DO levels of 3.1 and 9.5 mg/l. The same authors also concluded that DO levels greater
than 10 mg/l can reduce the risks due to the presence of NH3.
Alabaster and Lloyd (1980) indicate a value of 0.025 mg/l of NH3 as a safety limit for
temperatures higher than 5 jC. On the other hand, Klontz et al. (1985) found that constant
exposure to 0.05 mg/l does not determine any growth reduction in rainbow trout. An
investigation covering the entire life cycle, again of the rainbow trout (Thurston et al.,
1984), revealed no effects on survival, growth or reproductive capacity at concentrations
of 0.074 mg/l and set a value of 0.031 mg/l as histopathological value. Poxton and Allouse
(1987) and Poxton and Lloyd (1989) reported an appreciable increase in NH3 levels as a
function of feeding; this increase is also related to the method used for food distribution.
Critical values of NH3 for farmed animals are much more difficult to ascertain in the
presence of large variations in concentration. Exposure to high concentration peaks may
actually be more detrimental than exposure to high but constant values owing to the
animal’s failure to adapt to the environment (Ruffier et al., 1981).
Toxic effects of undissociated ammonia on aquatic organisms in the concentration range
0.09–3.35 mg/l have been reported by Handy and Poxton (1993). The literature data are
scarce and refer to only a small number of fish species on which experiments have been
carried out under different conditions (pH, T [jC], dissolved oxygen), which makes them
difficult to compare. One valid approach seems to be that proposed by Barnabe (1994) in
which the non-ionized ammonia concentration range within which no apparent damage is
caused to the farmed animals is set at 0–0.01 mg N–NH3/l for freshwater species, 0–0.02
S. Porrello et al. / Aquaculture 219 (2003) 485–494486
mg N–NH3/l for salmonids and 0–0.05 mg/l for sea fish. Values >0.10 lead to sublethal or
lethal conditions depending on the different degrees of resistance shown by the species.
The Water Research Centre (UK) suggests a safety limit for non-ionized ammonia of
0.021 mg/l (1.5 AM) as N–NH3 to protect marine fish life (Handy and Poxton, 1993).
In the Orbetello lagoon basin (South Tuscany, Italian West Coast), there are four
intensive fish farming facilities with land-based tanks and a fish farming wastewater inflow
in the order of 200,000 m3 day� 1, recently estimated as the equivalent of 265 kg nitrogen
day� 1 and 13 kg phosphorus day� 1 (Lenzi et al., in progress). The result is a strong
environmental impact leading to an extensive cyclic growth of opportunistic macro-
chlorophyceae, which cause serious decomposition phenomena in Spring and Summer
(Lenzi, 1998).
The present investigation presents the results of monitoring total and undissociated
ammonia contained in the wastewater from intensive fish farming plants and in the effluent
from phytotreatment ponds (lagooning) into which the fish farm wastewater has been
conveyed. The aims were: (1) to evaluate the quality of the water discharged into the
receiving environment, which consists of a shallow coastal lagoon with low renewal rate;
(2) to assess the effect of lagooning on fish farming wastewater with reference to
undissociated ammonia.
2. Materials and methods
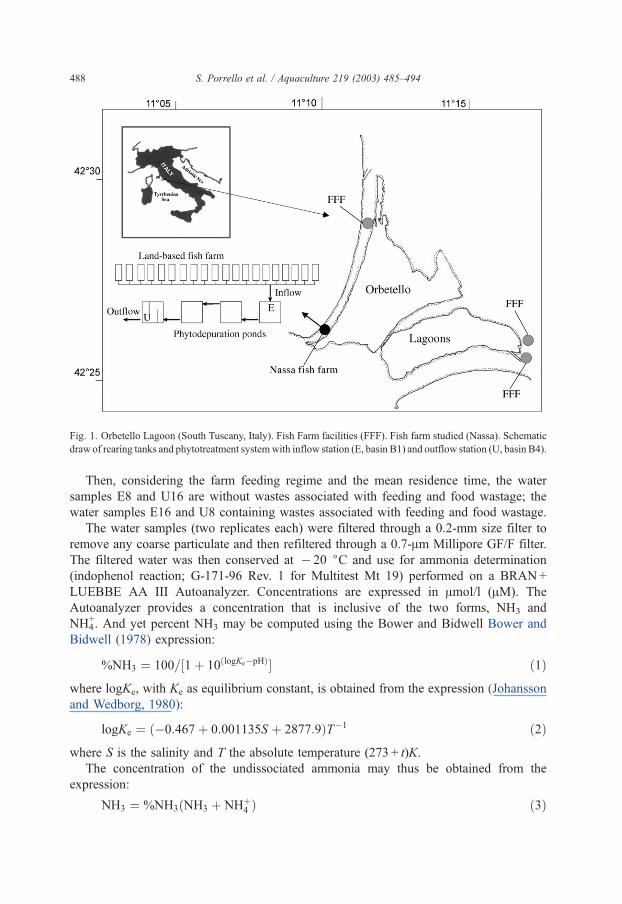
The monitoring was performed in the intensive fish farming facility of Orbetello Pesca
Lagunare (Tuscany, Italy West Coast). The farm produces about 100 tonnes year� 1 (ICR
1:2) of European sea bass (Dicentrarchus labrax L.) and gilt head sea bream (Sparus
aurata L.), in 450 m2 soft PVC tanks having a total volume of 9000 m3 (Fig. 1). The plant
wastewater is conveyed to four phytotreatment ponds, arranged in series, from which it is
ultimately discharged into the nearby sea-lagoon canal. The first pond receives the effluent
from the rearing tanks and the water leaves from the forth after undergoing phytotreatment
(Fig. 1). The phytotreatment zone covers a total area of 10,451 m2 and has a total volume
of 7134 m3 (accounting for 79% of the volume of the intensive fish farming facility); the
intake flow rate of the effluent into the phytotreatment section from the production section
is 139.5 l s� 1. Monitoring of the physicochemical parameters required to determine the
percentage of undissociated ammonia was performed in the first pond on water conveyed
directly from the intensive fish farm (E) and in the fourth pond at the outflow of the last
pond (U) (Fig. 1). Data acquisition was performed using two HYDROLAB Datasonde 3
multiparameter probes using the data corresponding to the hour and day the water samples
were taken. The parameters measured were: temperature in jC (T), pH, salinity in PTU (S)
and dissolved oxygen in mg/l (DO).
Monthly samples were taken on input into phytotreatment system (first pond, station E)
and on output from phytotreatment system (forth pond, station U) between May 1998 and
May 2000. Samples were taken at 8:00 a.m. (E8 and U8) and at 4:00 p.m (E16 and U16)
In fact, the mean residence time of the water mass for both the lagooning ponds and the
rearing tanks was computed throughout as 8 h each (Porrello et al., I, in press). All samples
were taken twofold.
S. Porrello et al. / Aquaculture 219 (2003) 485–494 487
Then, considering the farm feeding regime and the mean residence time, the water
samples E8 and U16 are without wastes associated with feeding and food wastage; the
water samples E16 and U8 containing wastes associated with feeding and food wastage.
The water samples (two replicates each) were filtered through a 0.2-mm size filter to
remove any coarse particulate and then refiltered through a 0.7-Am Millipore GF/F filter.
The filtered water was then conserved at � 20 jC and use for ammonia determination
(indophenol reaction; G-171-96 Rev. 1 for Multitest Mt 19) performed on a BRAN+
LUEBBE AA III Autoanalyzer. Concentrations are expressed in Amol/l (AM). The
Autoanalyzer provides a concentration that is inclusive of the two forms, NH3 and
NH4+. And yet percent NH3 may be computed using the Bower and Bidwell Bower and
Bidwell (1978) expression:
%NH3 ¼ 100=½1þ 10ðlogKe�pHÞ� ð1Þwhere logKe, with Ke as equilibrium constant, is obtained from the expression (Johansson
and Wedborg, 1980):
logKe ¼ ð�0:467þ 0:001135S þ 2877:9ÞT�1 ð2Þwhere S is the salinity and T the absolute temperature (273 + t)K.
The concentration of the undissociated ammonia may thus be obtained from the
expression:
NH3 ¼ %NH3ðNH3 þ NHþ4 Þ ð3Þ
Fig. 1. Orbetello Lagoon (South Tuscany, Italy). Fish Farm facilities (FFF). Fish farm studied (Nassa). Schematic
draw of rearing tanks and phytotreatment systemwith inflow station (E, basin B1) and outflow station (U, basin B4).
S. Porrello et al. / Aquaculture 219 (2003) 485–494488
The NH3 +NH4+ values used were the mean values obtained by analytical determination.
‘‘Undissociated ammonia’’ is indicated as NH3 when expressed as a concentration and as
%NH3 when expressed as a percentage, while the term ‘‘total ammonia’’ is used to indicate
analytically determined ammonia (NH3 +NH4+).
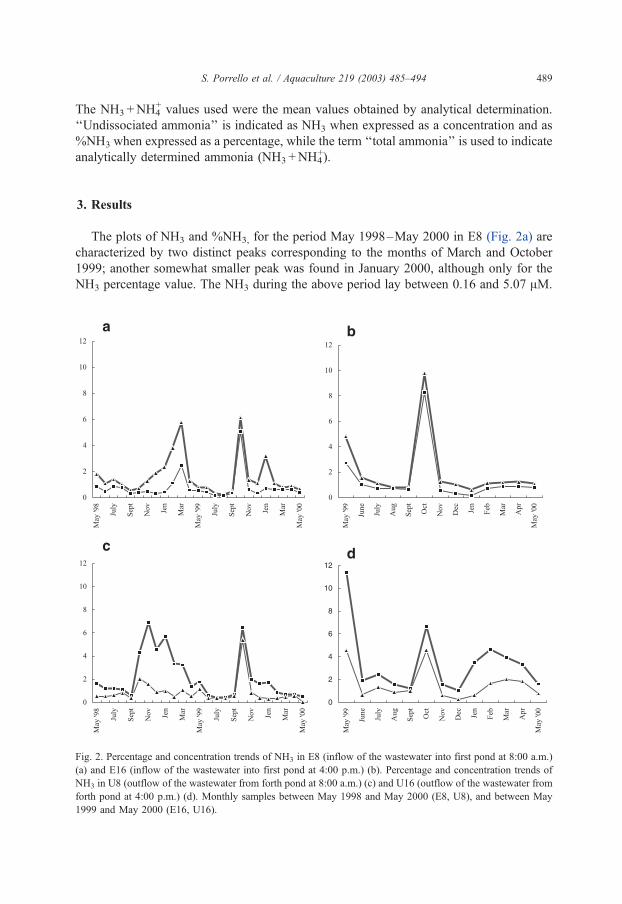
3. Results
The plots of NH3 and %NH3, for the period May 1998–May 2000 in E8 (Fig. 2a) are
characterized by two distinct peaks corresponding to the months of March and October
1999; another somewhat smaller peak was found in January 2000, although only for the
NH3 percentage value. The NH3 during the above period lay between 0.16 and 5.07 AM.
Fig. 2. Percentage and concentration trends of NH3 in E8 (inflow of the wastewater into first pond at 8:00 a.m.)
(a) and E16 (inflow of the wastewater into first pond at 4:00 p.m.) (b). Percentage and concentration trends of
NH3 in U8 (outflow of the wastewater from forth pond at 8:00 a.m.) (c) and U16 (outflow of the wastewater from
forth pond at 4:00 p.m.) (d). Monthly samples between May 1998 and May 2000 (E8, U8), and between May
1999 and May 2000 (E16, U16).
S. Porrello et al. / Aquaculture 219 (2003) 485–494 489

The trends found in U8 (0.04–5.37 AM) are basically the same as those found in E8 in
the period May 1999–May 2000 (Fig. 2c). In the preceding 12 months, the period
November 1998–April 1999 was characterized by comparatively high values of %NH3,
for which there was no corresponding increase in NH3 owing to relatively low total
ammonia content.
In E16, there was only one high peak in the month of October both in %NH3 and NH3
(8.24 AM). For the remaining NH3 values, the range lay between 0.15 and 2.72 AM (Fig. 2b).
In U16, %NH3 was much more variable, with two peaks, a particularly high one in the
month of May (11.38%) and a smaller one in October (6.62%). The NH3 values lay
between 0.25 and 4.57 AM (Fig. 2d).
Further insights may be gained from comparisons between the E8 and U16 sampling
stations. Indeed, since the passage time between the first and the last pond is about 8 h, it
may be assumed that the output water mass at 4 p.m. is roughly the same as that entering at
8.00 a.m. The comparison is characterized by the NH3 values in U16 (0.25–4.57 AM),
which were often higher than those in E8 (0.16–5.07 AM), in particular in the Spring–
Summer period (Fig. 3a). The increase in NH3 was the direct consequence of the increased
Fig. 3. Comparison of NH3 concentrations between E8 (inflow of the wastewater into first pond at 8:00 a.m.) and
U16 (outflow of the wastewater from forth pond at 4:00 p.m.) (a).Comparison of NH3 concentrations between E8
(inflow of the wastewater into first pond at 8:00 a.m.) and E16 (inflow of the wastewater into first pond at 4:00
p.m.) (b). Monthly samples between May 1999 and May 2000.
S. Porrello et al. / Aquaculture 219 (2003) 485–494490

pH values the water undergoes as it passes through the lagooning ponds (Fig. 4). This
increase was produced by the intense photosynthesis activity that occurs in the lagooning
ponds due to the development of large masses of benthonic macrochlorophyceae (Porrello
et al., II, in press). This explanation does not fit with the pH and NH3 peaks recorded in
October 1999 both in E8 and U16 (Figs. 3a and 4) because, in this period, it was not
recorded micro-macroalgal blooms.
The water output from the fish farm tanks at E8 and E16 was found different (Fig. 3b).
In fact, the E16 (0.15–8.24 AM ) values were influenced by after feeding NH3 excretion.
4. Discussion and conclusions
Differences in the type of fish farm plant, the variable environmental parameters, the
nature and quantity of the species present in the fish farms, the rate of renewal and purity
of the water circulating in the plant are all factors influencing the degree of toxicity of the
ammonia and make it impossible to establish a certain concentration limit that is valid for
all situations. Nevertheless, on the basis of literature data, it is possible to set a permissible
concentration level of 0.025 mg l� 1 (1.23 AM) of NH3 for marine fish farming wastewater.
The total ammonia concentrations recorded during the 2-year test period certainly
represent a critical factor for the quality of water used in fish farming that is conveyed
outside the plant and lagooning system towards the Orbetello lagoon itself. In all the
stations considered, NH3 values greater than 1.23 AMwere found in 18.4% of the available
data, in detail, 10.53% in E (Fig. 2a,b) and 23.68% in U (Fig. 2c,d). In U16, the permissible
level is exceeded in 46.15% of the cases (Fig. 2d). It is thus particularly significant that,
compared with total ammonia, the undissociated ammonia fraction increases significantly
as it proceeds through the lagooning process from input to output owing to the increasing in
pH. This passage through is thus apparently negative. It is necessary to take into account
that, without the intermediate lagooning volume, the problems of effluent impact would be
Fig. 4. Comparison of pH values in E8 (inflow of the wastewater into first pond at 8:00 a.m) and U16 (outflow of
the wastewater from forth pond at 4:00 p.m.). Monthly samples between May 1999 and May 2000.
S. Porrello et al. / Aquaculture 219 (2003) 485–494 491

totally dependent on Orbetello lagoon, which displays pH trends comparable to those of the
ponds. Moreover, the intermediate volume favours the atmospheric dispersion of some of
the undissociated ammonia as a result of volatilization processes determined by the pH
conditions (Hariyadi et al., 1994). In fact, ammonia volatilization is enhanced by increased
ammonia concentration, pH, temperature, evaporation rate and wind speed. Schoerder
(1987) estimated volatilization value of 50 mg N–NH4 m� 2 day� 1 from polyculture ponds
at pH 8 and 0.5 mg N–NH4 l� 1.
With respect to the recorded pH and NH3 peaks in October 1999 in E8 and U16 (Figs.
3a and 4), the phenomenon can be probably explained with chemistry of the ponds and
fish farm tanks related to degradation of primary production (ammoniation). In fact, most
decomposition in sediments takes place in the anaerobic layer; thus, relatively more N is
related from organic matter decomposition under anaerobic conditions (Reddy and
Patrick, 1984).
The problem of keeping undissociated ammonia concentration within non-harmful
limits is reduced in practice to control over the total ammonia concentration. In fact, owing
to the high flow rate of water, it is hard to modify the physicochemical parameters
(temperature, pH and salinity) affecting the equilibrium between ionized species and non-
ionized species.
Since, all conditions being equal, NH3 is a function of total dissolved ammonia, it may
be computed by substituting in expressions (1) and (3):
NH3 þ NHþ4 ¼ NH3*ð1þ 10ðlogKe�pHÞÞ ð4Þ
One example of an application of this relation is shown in Table 1. For variable values
of t (jC) and pH (constant salinity of 38 PTU), a determination is made of total ammonia
concentrations producing the limiting value set for NH3. As shown in the table, an NH3
concentration of 1.2 AM (i.e., below the permissible level), at pH 9 and a temperature of 25
jC, is generated by a small total ammonia concentration. For pH values of less than 8, on
Table 1
Total ammonia concentrations (AM) related to t (jC), pH variable values and constant salinity (38 PTU), which
produce safe concentration of NH3 = 1.2 AM
pH Temperatures
10 jC 15 jC 20 jC 25 jC
7.0 743.23 494.67 333.98 228.61
7.2 469.41 312.57 211.18 144.69
7.4 296.63 197.67 133.71 91.75
7.6 187.61 125.18 84.81 58.34
7.8 118.83 79.44 53.97 37.27
8.0 75.43 50.57 34.51 23.97
8.2 48.05 32.36 22.23 15.58
8.4 30.77 20.87 14.48 10.28
8.6 19.87 13.62 9.59 6.94
8.8 12.99 9.05 6.51 4.83
9.0 8.65 6.16 4.56 3.51
S. Porrello et al. / Aquaculture 219 (2003) 485–494492
the other hand, much larger total ammonia concentrations are needed to obtain the same
NH3 concentration.
Ammonia levels have increased after feeding (Handy and Poxton, 1993). The values of
E16 concentrations (containing wastes associated with feeding and food wastage) were
frequently higher than E8 values (without wastes associated with feeding and food
wastage) except for January value when the fish was not fed. Based on experimental
data (May 1999–May 2000), we have plotted total ammonia concentrations versus food
provided. The regression equations calculated is a close semi-logarithmic type. This
relation may be expressed mathematically as follows:
NH3 þ NHþ4 ¼ 1:9143þ 33:494 lnðFÞ ðR ¼ 0:928Þ ð5Þ
where F is the quantity of food provided in mg l� 1 day� 1.
The results showed that 86.2% of total ammonia variability is the function of food
provided.
Therefore, the results show that the reduction of the impact of total ammonia on the
receiving environment may be essentially obtained upstream by optimizing fish farming
management practices regarding feeding and water quality.
Finally, a controlled development of Ulva rigida to the density of 2 kgwet weight m� 2
could improve the abatement of N values, as described by Jimenez del Rio et al. Jimenez
del Rio et al. (1996), and avoid extreme values of physicochemical parameters in the
phytotreatment ponds.
References
Alabaster, J.S., Lloyd, R., 1980. Water Quality Criteria for Freshwater Fish. Butterworths. 297 pp.
Alabaster, J.S., Shurben, D.G., Knoweles, G., 1979. The effect of dissolved oxygen and salinity on the toxicity of
ammonia to smolts of salmon. J. Fish Biol. 15, 705–712.
Barnabe, G., 1994. On growing fish in intensive system. Aquaculture: biology and ecology of cultured species.
In: Barnabe, G. (Ed.), Ellis Horwood Series in Aquaculture and Fisheries Support, pp. 353–356.
Bower, C.E., Bidwell, J.P., 1978. Ionization of ammonia in sea water effects of temperature, pH, and salinity on
Salmo salar L. J. Fish. Res. Board Can. 35, 1012–1016.
Boyd, 1990. Water Quality in Ponds for Aquaculture. Auburn Univ. Press, Birmingham.
Colt, J., Tchobanollus, G., 1978. Chronic exposure of channel catfish, Ictalurus puntuatus, to ammonia: effects
on growth and survival. Aquaculture 15, 353–372.
Gowen, R.J., Bradbury, N.B., 1987. The ecological impact of salmonid farming in coastal waters: a review.
Oceanogr. Mar. Biol. Ann. Rev. 25, 563–575.
Handy, R.D., Poxton, M.G., 1993. Nitrogen pollution in marine culture: toxicity and excretion of nitrogenous
compounds by marine fish. Rev. Fish Biol. Fish. 3, 205–241.
Hariyadi, S., Tucker, C.S., Steeby, J.A., van der Ploeg, M., Boyd, C.E., 1994. Environmental conditions and
channel catfish (Ictalurus punctatus) production under similar pond management regimes in Alabama and
Mississippi. J. World Aquac. Soc. 25, 236–249.
Jimenez del Rio, M., Ramazanov, Z., Garcia-Reina, G., 1996. Ulva rigida (Ulvales, Chlorophyta) tank culture as
biofilters for dissolved inorganic nitrogen from fishpond effluents. Hydrobiologia 326/327, 61–66.
Johansson, O., Wedborg, M., 1980. The ammonia–ammonium equilibrium in the water at temperature between 5
and 25 jC. J. Solution Chem. 9 (1), 37–43.
Klontz, W., Stewart, B.C., Eib, D.W., 1985. On the etiology and pathophysiology of environmental gill disease in
juvenile salmonoids. In: Ellis, A.E. (Ed.), Fish and Shellfish Pathology. Academic Press, London, pp. 199–210.
S. Porrello et al. / Aquaculture 219 (2003) 485–494 493

Lenzi, M., 1998. L’eutrofizzazione e le opere di risanamento della Laguna di Orbetello. Il Mediterraneo e lo
Sviluppo Sostenibile (CD rom). ENEA-Centro Ricerche Ambiente Marino, S. Teresa, La Spezia.
Lenzi, M., Porrello, S., Palmieri, R., in press. Restoration of the eutrophic Orbetello lagoon (Tyrrhenian Sea,
Italy): water quality management.
Lloyd, R., 1992. Pollution and Freshwater Fish. Fishing News Books, West Byfleet.
Miller, C.L., Poucher, S., Cardin, J.A., Hansen, D., 1990. The acute and chronic toxicity of ammonia to marine
fish and a mysid. Arch. Environ. Contam. Toxicol. 19, 40–48.
Munday, B.W., Elefteriou, A., Kentouri, M., Divanach, P., 1992. The Interaction of Aquaculture and the Environ-
ment—A Bibliographical Review. Commissioners of the European Community, Brussels DGXIV/D/3.
Porrello, S., Lenzi, M., Persia, E., Finoia, M.G., in preparation. Eutrophication by intensive aquaculture using a
phytotreatment pond system: I. Dissolved and particulate nitrogen and phosphorus.
Porrello, S., Lenzi, M., Tomassetti, P., Persia, E., Finoia, M.G., Mercatali, I., 2003. Eutrophication by intensive
aquaculture using a phytotreatment pond system: II. Nitrogen and phosphorus content in pond macroalgae and
sediment. Aquaculture (in press).
Poxton, M.G., Allouse, S.B., 1987. Cyclical fluctuations in ammonia and nitrite–nitrogen resulting from the
feeding of turbot, Scophthalmus maximus (L.) in recirculating systems. Aquac. Eng. 6, 301–322.
Poxton, M.G., Lloyd, N.J., 1989. Fluctuations in ammonia production by eels (Anguilla anguilla L.) as a result of
feeding strategy. In: De Pauwn, N. (Ed.), Aquaculture. A Biotechnology in Progress. Europ. Aquaculture
Society, Bredene, Belgium, pp. 1125–1135.
Reddy, K.R., Patrick, W.H., 1984. Nitrogen transformations and loss in flooded soils and sediment. CRC Crit.
Rev. Environ. Control 13, 273–309.
Ruffier, P.J., Boyle, W.C., Wleinschmidt, J., 1981. Short-term acute bioassays to evaluate ammonia toxicity and
effluent standards. J. Water Pollut. Control Fed. 53, 367–377.
Schoerder, G.L., 1987. Carbon and nitrogen budget in manured fish ponds on Israel’s coastal plain. Aquaculture
62, 259–279.
Soderberg, R.N., Meade, J.W., 1991. The effects of ionic strength on unionized ammonia concentration. Prog.
Fish-Cult. 53, 118–120.
Thurston, R.V., Russo, R.C., Luedtke, R.J., Smith, C.E., Meyn, E.L., Chakoumakos, C., Wang, K.C., Rown,
C.J.D., 1984. Chronic toxicity of ammonia to rainbow trout. Trans. Am. Fish. Soc. 113, 56–73.
Ziemann, D.A., Walsh, W.A., Saphore, E.G., Fulton-Bennett, K., 1992. A survey of water quality characteristics
of effluent from Hawaiian aquaculture facilities. J. World Aquac. Soc. 23, 180–191.
S. Porrello et al. / Aquaculture 219 (2003) 485–494494