Observational constraints on methane emissions from Polish ...
Upload
independentCategory
view
1download
0
Relation of Genetic Variation in the Gene Coding for C-ReactiveProtein with its Plasma Protein Concentrations: Findings fromthe Women’s Health Initiative Observational Cohort
Cathy C. Lee1,2, Nai-chieh Yuko You3, Yiqing Song4, Yi-Hsiang Hsu5, JoAnn Manson4,Lauren Nathan6, Lesley Tinker7, and Simin Liu1,3,81 Department of Medicine, David Geffen School of Medicine, UCLA, Los Angeles, CA 900952 VA Greater Los Angeles Healthcare System, Los Angeles, CA 900733 Department of Epidemiology, UCLA, School of Public Health, Los Angeles, CA 900954 Division of Preventive Medicine, Department of Medicine, Brigham and Women’s Hospital andHarvard Medical School, Boston, MA 022155 Molecular and Integrative Physiological Science Program, Department of Environmental Health,Harvard School of Public Health, Boston, MA 022156 Department of OB/GYN, David Geffen School of Medicine, UCLA, Los Angeles, CA 900957 Fred Hutchinson Cancer Research Center, Seattle, WA 981098 Johnson Comprehensive Cancer Center, David Geffen School of Medicine, UCLA, Los Angeles,CA 90095
AbstractBACKGROUND—Although common genetic variants of the CRP gene have been associatedwith plasma CRP concentrations (hsCRP) in several cohorts of European Americans, relativelyfew studies have comprehensively assessed this association in well-characterized multiethnicpopulations.
METHODS—In a case-control study of diabetes nested in the Women’s Health InitiativeObservational Cohort, we comprehensively evaluated the association of genetic variation in the
*To whom correspondence should be addressed at: Simin Liu, Department of Epidemiology, UCLA School of Public Health, Box951772, 650 Charles E. Young Drive South, Los Angeles, CA 90095. Tel: 310-206-5862; Fax: 310-206-6039; [email protected] and NYY contributed equally to this work.HUMAN GENES DISCUSSED IN THIS MANUSCRIPT: CRP with HUGO approved names “C-reactive protein” and “pentraxin-related” (HGNC: 2367). Alias: PTX1.CONFLICT OF INTEREST: None of the authorshad any conflicts of interest.AUTHOR CONTRIBUTIONS: Drs. You and Liu had full access to the data in the study and take responsibility for the integrity ofthe data and the accuracy of the data analysis. Dr. Lee and Dr. You contributed equally to the manuscript as joint first authors.Conception and design: Liu, YouAcquisition of data: Liu, Tinker, Nathan, MansonAnalysis and interpretation of data: You, Liu, Lee, Song, HsuDrafting of manuscript: Lee, You, LiuCritical revision for intellectual content: Lee, You, Song, Hsu, Tinker, Manson, Nathan, LiuStatistical expertise: You, Song, Hsu, LiuObtained funding: LiuAdministrative, technical, or material support: Liu, Manson, Tinker, NathanStudy supervision: Liu
NIH Public AccessAuthor ManuscriptClin Chem. Author manuscript; available in PMC 2010 April 19.
Published in final edited form as:Clin Chem. 2009 February ; 55(2): 351–360. doi:10.1373/clinchem.2008.117176.
NIH
-PA Author Manuscript
NIH
-PA Author Manuscript
NIH
-PA Author Manuscript

CRP gene with plasma hsCRP concentrations. Thirteen tagging single nucleotide polymorphisms(tSNPs) were identified and subsequently genotyped in 3,782 postmenopausal women.
RESULTS—The allele frequencies for these tSNPs and haplotype blocks defined by these tSNPsvaried significantly by ethnic group. Consistent with prior studies among Whites, rs3093068,rs1130864 and rs1417938 were significantly associated with higher hsCRP concentrations(geometric mean per minor allele change: 1.20–1.25 mg/L), while rs1205 and rs1800947 weresignificantly associated with lower hsCRP values (1.28–1.48 mg/L). The associations withrs3093068 and rs1205 appeared to be stronger in Asian/Pacific Islanders than in Whites with ageometric mean increase of 1.65 mg/L compared to 1.25 mg/L, respectively. The minor alleles,rs3093075 and rs3093059, were associated with substantially increased hsCRP concentrationswhereas rs1800947 was associated with lower hsCRP values. All haplotype-based associationresults tended to be consistent with the associations seen with single CRP SNPs.
CONCLUSION—Our large multiethnic case-control study of postmenopausal women providesevidence that common genetic variants in CRP gene are substantially associated with plasmahsCRP concentrations in this case-control subcohort. There are also suggestions of ethnicvariations in these associations.
KeywordsC-Reactive Protein; CRP; Women’s Health Initiative; WHI
INTRODUCTIONC-Reactive Protein (CRP) is an acute phase reactant secreted by the liver that has long beenused to characterize systemic inflammation. Increased circulating concentrations of high-sensitivity CRP (hsCRP) have been associated with obesity, type 2 diabetes (T2DM)(1–4),and atherosclerotic cardiovascular disease(5–11). In a prospective case-control study of3,782 postmenopausal women nested in the Women’s Health Initiative observational study(WHI-OS), increased circulating concentrations of hsCRP were significantly associated withan increased risk of clinical diabetes(3). Further, racial and ethnic differences in plasmahsCRP values have also been noted in these populations(12–14). More recently, commongenetic variants in the CRP gene were found to be associated with plasma hsCRPconcentrations in several cohorts of European Americans(15–20). To date, however,relatively few studies have examined the associations of common variants in the genecoding for CRP with its plasma hsCRP concentrations in a multiethnic-population.Therefore, we conducted a comprehensive assessment of the association of genetic variationin the CRP gene with plasma hsCRP values in a large case-control study nested in the WHI-OS, an ethnically diverse cohort of postmenopausal women aged over 50 years includingWhite/Caucasian, Black/African, Hispanic and Asian/Pacific Islander participants. Inparticular, we examined whether any genetic effect on plasma hsCRP concentrations differby ethnicity.
MATERIALS AND METHODSStudy Participants
Details regarding our case-control study design have been described elsewhere(3;21).Briefly, of the 93,676 postmenopausal women enrolled in the WHI-OS(21), approximately82,069 had no prior history of cardiovascular disease and/or diabetes at baseline. Followingthe principle of risk-set sampling, 1,584 diabetes cases were individually matched with2,198 controls on age (±2.5 years), ethnicity, clinical center, time of blood draw (±0.10hours), and length of follow-up. The ethnic groups represented in this study include Whites
Lee et al. Page 2
Clin Chem. Author manuscript; available in PMC 2010 April 19.
NIH
-PA Author Manuscript
NIH
-PA Author Manuscript
NIH
-PA Author Manuscript

(n=1,936), Blacks (n=1,098), Hispanics (n=455), and Asian/Pacific Islanders (n=293).Further details about the ethnic distribution and demographics have already been describedpreviously(3). The Institutional Review Board (IRB) at UCLA has previously approved theoriginal study, and all study subjects have signed informed consent forms prior to studyenrollment in the WHI.
Tagging SNP SelectionAs described previously(22), we implemented a two-stage approach in choosing haplotypetagging Single Nucleotide Polymorphisms (tSNPs). First, we surveyed common geneticvariation using the National Center for Biotechnology Information database SNP (NCBIdbSNP) supplemented by HapMap database(23). Our goal was to capture the commonhaplotype patterns in the genetic region covering the 30 kb 5′ upstream and 30 kb 3′downstream of the CRP gene (3.1kb). The initial set of SNPs were selected based on thefollowing criteria: 1) Functionality priority: nonsynonymous coding SNPs (cSNPs) andsplicing-site SNPs (ssSNPs) must be kept; the priority order of picking SNPs based on theirpotential functions is: nonsynonymous SNPs > ssSNPs > synonymous SNPs > 5′ UTR SNPs> 3′ UTR SNPs > intronic SNPs; 2) minor allele frequency (MAF) ≥ 5% in at least oneethnic group; and 3) SNP density: SNPs should be relatively evenly spaced across the generegion(24).
In the second stage, we identified tSNPs based on the Linkage Disequilibrium (LD) patternsof those selected SNPs among 61 individuals from each ethnic population. Pair-wise LDbetween SNPs was assessed using the squared correlation statistic r2. The Haploviewprogram was used to calculate the LD coefficient and define haplotype blocks(25;26). Fromthe initial set of SNPs, a total of 13 tSNPs that account for most of the genetic variationwithin the CRP locus across all four ethnic groups were selected and genotyped in all thecase-control samples.
SNP Genotyping MethodFor these 13 tSNPs, large-scale genotyping was performed using the TaqMan allelicdiscrimination method. Specific primers and probes were custom-designed by AppliedBiosystems (Applied Biosystems, ABI). Following polymerase chain reaction (PCR)amplification, end-point fluorescence was read using the ABI Primer 7900HT instrumentand genotypes were scored using SDS2.2.2 Allelic Discrimination Software (AppliedBiosystems). To evaluate reproducibility we performed blind duplicate genotyping in arandomly-selected subset of 5% of samples. Concordance rate was >99%.
Measurement of hsCRP concentrationsSince all incident cases and controls were free of clinical diabetes at baseline, baselinehsCRP concentrations were not influenced by clinical diabetes status. According to astandardized protocol, fasting blood specimens were collected from each participant atbaseline and processed locally into separate aliquots containing serum, plasma, and buffycoat. Detailed sample preparation and handling procedures are described elsewhere(3).hsCRP was measured on the Hitachi 911 analyzer (Roche Diagnostics) using animmunoturbidimetric assay with reagents and calibrators from Denka Seiken Co Ltd. Thecoefficient of variation was 1.61% for hsCRP(3).
Statistical AnalysisWe assessed each SNP for allele frequency and Hardy-Weinberg Equilibrium (HWE) testusing the Proc Allele procedure in SAS (v9.1.3, SAS Institute, Cary, NC). We also tested forheterogeneity of genotype distributions across ethnic groups using the Chi-square test. For
Lee et al. Page 3
Clin Chem. Author manuscript; available in PMC 2010 April 19.
NIH
-PA Author Manuscript
NIH
-PA Author Manuscript
NIH
-PA Author Manuscript
hsCRP concentrations with markedly skewed distributions, we made logarithmictransformations to enhance compliance with normality assumption then calculated geometricmean differences. To determine the effect of genetic variants on plasma hsCRPconcentrations, we calculated the geometric mean differences in plasma hsCRP according toeach tSNP genotyped by fitting general linear models (GLM) treating plasma hsCRPconcentration as a dependent variable and tSNPs as independent variables. An additiveinheritance model was used in single gene analysis, and the results of this analysis wereexpressed as the geometric mean increase in hsCRP per each additional copy of the minorallele. All the linear models included matching factors and potential confounders (case/control status, alcohol consumption, cigarette smoking, body mass index (BMI), hormonereplacement therapy (HRT) used, and physical activity) as covariates in each of the fourethnic groups. Likelihood ratio tests were used to test the interaction effects between thegenotypes and ethnicity on diabetes risk.
The Haploview program was used to characterize the LD patterns between tSNPs(25;26). Inhaplotype-based analysis, we estimated haplotype frequency using an “expectation-substitution” algorithm(27), which treated expected haplotype scores (calculated under auser-specified inheritance model) as observed covariates in analysis, and stored theseexpected scores in an auxiliary data set for customized analyses. Only haplotypes withestimated frequencies ≥ 1% in the combined controls were included for further analyses. Toexamine the association between the resulting haplotype/haplotype combinations and hsCRPconcentrations, the estimate of haplotype dosage was treated as a surrogate variable for thetrue haplotype.
Further, to account for potential false positives due to multiple comparisons, we calculatedthe false discovery rate (FDR) by incorporating all p-values from multiple tests performedfor SNPs and haplotypes in the GLM analysis(28). Proc Multtest procedure in SAS 9.1.3was used to obtain the adjusted p-values.
RESULTSLD Patterns in the CRP gene defined by tagging SNPs
Table 1 summarizes the genetic variation within the CRP locus defined by the 13 tSNPs ineach of the four ethnic groups. The allele frequencies for all tSNPs varied significantly byethnicity (all P < 0.0001). The specific locations of these thirteen tSNPs are schematicallypresented in Figure 1, based on NCBI Entrez gene for the CRP gene structure(NT_004487.18), and contig position for each SNP based on NCBI build 36 and dbSNPb129. None of the SNPs, except for rs3093068 in Whites, showed statistically significantdeviation from HWE among controls in each ethnic group (data not shown).
Single-marker association analysisOf the 13 tSNPs genotyped, eleven tSNPs were significantly associated with plasma hsCRPconcentrations after adjustment for matching factors and other potential confounders (seeSupplemental Data Table 1 available at www.clinchem.org with the online version of thispaper). Supplemental Data Figure 1 shows the different pattern in the mean differences(without logarithmic transformations) and 95% confidence intervals (CIs) of hsCRPconcentrations for each SNP, as estimated by an additive genetic model. In an additivemodel, geometric mean differences in plasma hsCRP concentrations were associated with anincreasing number of minor alleles as compared to those homozygous major alleles (i.e. thegenotypes were coded as 0=homozygous major alleles, 1=heterozygotes, and2=homozygous minor alleles). For six tSNPs, carriers of each additional copy of the minorallele were associated with decreased hsCRP concentrations: the geometric mean per-allele
Lee et al. Page 4
Clin Chem. Author manuscript; available in PMC 2010 April 19.
NIH
-PA Author Manuscript
NIH
-PA Author Manuscript
NIH
-PA Author Manuscript
decrease ranging from 1.07 to 1.46 mg/L(all P < 0.05). In contrast, the minor alleles of fivetSNPs (rs3093059, rs1417938, rs1130864, rs3093075, and rs3093068) were associated withincreased hsCRP concentrations with the geometric mean per-allele increase ranging from1.17 to 1.27mg/L (all P < 0.05). The tSNPs that were associated with plasma hsCRPconcentrations also varied by ethnicity (Supplemental Data Table 2). Figure 2 shows thedifferent pattern in the mean differences (without logarithmic transformations) and 95% CIsof hsCRP values for each SNP by ethnicity, as estimated by an additive genetic model. Nineout of 13 tSNPs were significantly associated with plasma hsCRP concentrations in Whitesand Asian/Pacific Islanders, and eight of these nine tSNPs were common to both ethnicgroups. The one significantly different tSNP, rs1417938 in Whites, rs4275453 in Asian/Pacific Islanders, was associated with increased hsCRP concentrations. The association ofthese tSNPs with higher hsCRP concentrations in Whites and Asian/Pacific Islanders wassignificantly different from that in Blacks and Hispanics where no association with hsCRPconcentrations was observed. In contrast, only four of the 13 tSNPs among Blacks andHispanics were significantly associated with plasma hsCRP concentrations. There was nooverlap in the four significant tSNPs between Blacks and Hispanics.
Haplotype association analysisThe lengths and locations of specific haplotype blocks by ethnicity are presented in Figure 3.Haplotype frequencies and the specific haplotype blocks varied with ethnicity (Figure 3 andTable 2). In Whites, there were three haplotypes in block 1 and five haplotypes in block 2.The 0-0 carriers in block 1 and carriers of 0-1-1-0-0-0-0-0-1-0 in block 2 (where 0 coded formajor allele and 1 coded for minor allele) exhibited the highest hsCRP values withgeometric mean difference in hsCRP concentrations of 1.27 mg/L and 1.21 mg/L comparedwith non-carriers, respectively. We only identified 3 haplotypic blocks of this CRP gene inother ethnicities, each containing two to five haplotypes within each block. Blacks andHispanics had haplotype blocks with similar boundaries whereas block 2 in Asian/PacificIslanders was significantly different from the other ethnic groups. In block 2 for Blacks andHispanics, haplotype 0-0-0-0-0-0-0 carriers had increased hsCRP concentrations (1.23 and1.58 mg/L, respectively) compared with non-carriers.
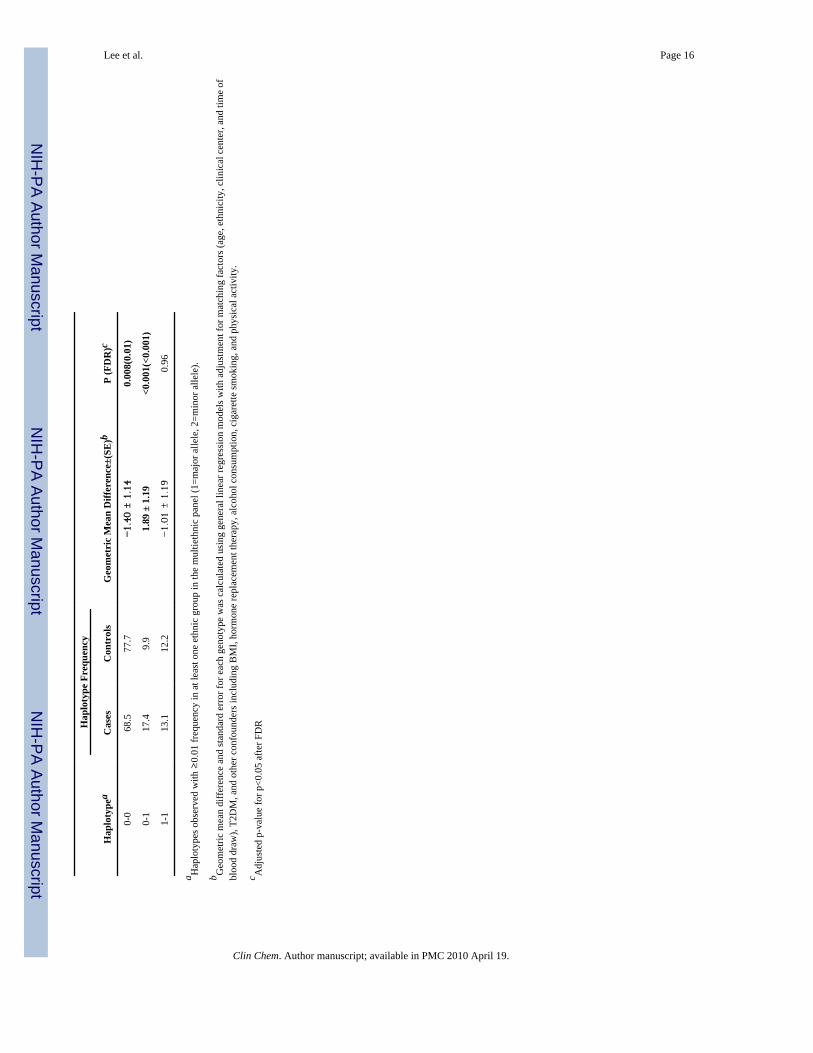
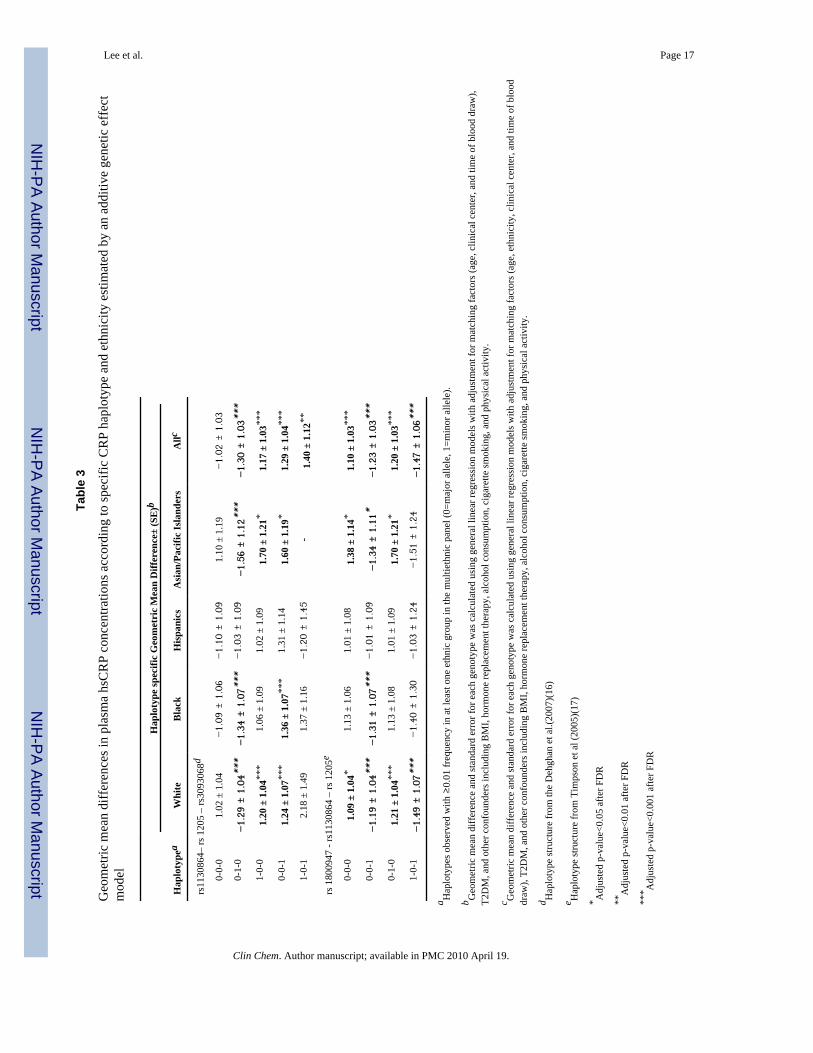
In addition to examining the haplotype block identified in our study population, we alsoreplicated the haplotypes found in other studies (i.e., rs1130864-rs1205-rs3093068 byDehghan et al(16), and rs1180947-rs1130864-rs1205 by Timpson et al(17) (Table 3 andSupplemental Data Table 3). Among the rs1130864-rs1205-rs3093068 haplotypes, 0-0-1carriers appeared to have increased plasma hsCRP compared with non-carriers, and thisrelationship was consistently observed in all four ethnicities (geometric mean difference =1.24, 1.36, 1.31, and 1.60 mg/L, respectively).
DISCUSSIONIn this large multiethnic cohort of postmenopausal women, common genetic variants in theCRP gene were highly associated with plasma hsCRP concentrations. In particular, thesegenotype-phenotype relationships appeared to vary significantly across ethnic groups.
Several tSNPs (rs1130864, rs1205, rs3093068, rs1800947, rs2794521) identified in ourstudy have been reported previously in both White and African American men and women(15–20). Although the specific effects of these variants on plasma hsCRP concentrationsremain to be determined, it has been estimated in a previous family study that 30–40% of thevariation in plasma hsCRP concentrations may be due to genes(29). In our multi-ethniccohort, common genetic variants in the CRP gene accounted for 4% of the total variation ofplasma hsCRP in Whites, 5% of the variation in Blacks, and 10% of the variation inHispanics and Asian/Pacific Islanders.
Lee et al. Page 5
Clin Chem. Author manuscript; available in PMC 2010 April 19.
NIH
-PA Author Manuscript
NIH
-PA Author Manuscript
NIH
-PA Author Manuscript

Consistent with prior studies among Whites (19), carriers of minor alleles of rs3093068,rs1130864 and rs1417938 were found to have significantly higher hsCRP concentrations,whereas rs1205 and rs1800947 were associated with lower plasma hsCRP concentrationscompared to non-carriers. The tSNPs rs1130864 and rs1205 appeared to have even greatereffects on plasma hsCRP concentrations in Asian/Pacific Islanders (hsCRP concentrationsincrease by 1.62 mg/L with rs1130864 and decrease by 1.57 mg/L with rs1205). Similarethnic differences were also found for rs3093075 and rs3093059 where greater magnitude ofassociations appeared more evident in Asians and Hispanics than that in Whites (i.e.geometric mean hsCRP values increase by 1.5 to 1.7 mg/L vs. 1.2 mg/L). In contrast,rs1800947 was significantly associated with lower hsCRP concentrations in Whites but notin Hispanics, a finding that has been reported previously(20). The tSNP rs2794521 has notbeen found to be associated with plasma hsCRP concentrations in other studies but has beenreported to be associated with T2DM in Pima Indians(30) and coronary disease in ethnicHan Chinese(31). In the current study, both rs2794521 and rs2808634 were significantlyassociated with lower hsCRP concentrations in Hispanics but not in Whites. The directionand magnitude of associations for rs1205, rs3093075, rs2808629 and rs1470515 weresimilar in Blacks compared to Whites.
Several reasons for the ethnic differences of the gene-phenotype relationships have beennoted previously. The apparently distinct LD patterns of this CRP gene by ethnicity were anovel observation and a unique strength of our multiethnic study, as previous studies havemainly examined tSNPs or haplotypes in European Americans. In prior reports(15;32),rs3091244 was found to be a functional triallelic SNP in the CRP promoter region with highLD to other SNPs (i.e., rs113084, rs1417938 and rs2795421), possibly explaining thesignificant associations found in those studies. There may be further population stratification(33–35) within each ethnic subgroup.I If such stratification is present, the significant ethnicdifferences we found in our study would only be biased toward the null.
Since comprehensive screening of SNPs was conducted in the current study, we were able todefine haplotype structures for each ethnic group beyond those reported in previousstudies(16;17). The haplotype frequencies for Whites were similar to those reported forEuropean Americans(16;17). For example, Timpson et al(17) showed that carriers of C-A-Cin rs1800947, rs1130864, and rs1205 (i.e. 0-1-0 in Table 3 and Supplemental Data Table 3)have the highest plasma hsCRP values whereas GGT carriers have the lowest hsCRPconcentrations. In our study, plasma hsCRP concentrations were 1.21 mg/L (Standard error(SE)=1.04) higher in haplotype 0-1-0 carriers, and 1.49 mg/L (SE=1.07) lower in 1-0-1carriers compared with that of non-carriers. Similar trends were also found in Black andAsian carriers (i.e., carriers of haplotype 0-1-0 carriers had higher hsCRP values comparedto non-carriers). In contrast, carriers of the same haplotypes had lower hsCRPconcentrations than did non-carriers among Hispanics (p>0.05). In the report by Dehghan etal(16), the highest contrast of plasma hsCRP values was found in comparing carriers of theCCG haplotype (defined by three SNPs, rs1130754, rs1205, and rs3093068, same as 0-0-1in Table 3 and Supplemental Data Table 3) with carriers of the most common haplotypeCTC (i.e., 0-1-0 in Supplemental Data Table 3).
More importantly, minor allele frequencies, haplotype structure, and LD patterns varied byethnic group. For example, we observed similar haplotype frequencies in Whites as well assimilar magnitudes of effects on plasma hsCRP concentrations associated with thehaplotypes to those seen in the Dehghan et al study(16) (i.e., increased hsCRPconcentrations by 1.24 mg/L in carriers of 0-0-1 and decreased hsCRP concentrations by1.29 mg/L in carriers of 0-1-0 haplotype). However, no significant associations were foundbetween hsCRP and these haplotypes in the other ethnic groups. In general, our haplotype-based analysis was consistent with the single SNP- plasma hsCRP associations in terms of
Lee et al. Page 6
Clin Chem. Author manuscript; available in PMC 2010 April 19.
NIH
-PA Author Manuscript
NIH
-PA Author Manuscript
NIH
-PA Author Manuscript

direction and magnitude. We also observed that the direction of the effect remained the samebut the magnitude of the effect varied with ethnicity.
In conclusion, we found that common genetic variants in the CRP gene were substantiallyand independently associated with plasma hsCRP concentrations in this large multiethniccase–control study of postmenopausal women. These associations may differ by ethnicity.Further studies will be warranted to confirm the ethnic differences of CRP gene varianceand the potential direct role of these genetic variants on T2DM risk.
Supplementary MaterialRefer to Web version on PubMed Central for supplementary material.
AcknowledgmentsWe would like to acknowledge all WHI centers, principal investigators and committed participants in this research.The WHI is funded by the National Heart, Lung, and Blood Institute, and U.S. Department of Health and HumanServices. This study was supported by the National Institute of Diabetes and Digestive and Kidney Diseases R01DK062290 from the National Institutes of Health.
ABBREVIATIONS
CRP C-Reactive Protein
tSNPs haplotype tagging SNPs
hsCRP high-sensitivity C-Reactive Protein
T2DM type 2 diabetes mellitus
IRB Institutional Review Board
UCLA University of California, Los Angeles,
WHI-OS Women’s Health Initiative Observational Study
SNP single nucleotide polymorphism
NCBI dbSNP National Center for Biotechnology Information database SNP
ssSNPs splicing-site SNPs
cSNPs nonsynonymous coding SNPs
UTR Untranslated Region
PCR polymerase chain reaction
ABI Applied Biosystems
MAF minor allele frequency
LD linkage disequilibrium
HWE Hardy-Weinberg Equilibrium
GLM general linear models
BMI body mass index
HRT hormone replacement therapy
FDR false discovery rate
SE standard error
Lee et al. Page 7
Clin Chem. Author manuscript; available in PMC 2010 April 19.
NIH
-PA Author Manuscript
NIH
-PA Author Manuscript
NIH
-PA Author Manuscript

Reference List1. Hu FB, Meigs JB, Li TY, Rifai N, Manson JE. Inflammatory markers and risk of developing type 2
diabetes in women. Diabetes 2004;53:693–700. [PubMed: 14988254]2. Pradhan AD, Manson JE, Rifai N, Buring JE, Ridker PM. C-reactive protein, interleukin 6, and risk
of developing type 2 diabetes mellitus. JAMA 2001;286:327–34. [PubMed: 11466099]3. Liu S, Tinker L, Song Y, Rifai N, Bonds DE, Cook NR, et al. A prospective study of inflammatory
cytokines and diabetes mellitus in a multiethnic cohort of postmenopausal women. Arch Intern Med2007;167:1676–85. [PubMed: 17698692]
4. Zee RY, Germer S, Thomas A, Raji A, Rhees B, Ridker PM, et al. C-reactive protein gene variationand type 2 diabetes mellitus: a case-control study. Atherosclerosis 2008;197:931–6. [PubMed:17900590]
5. Pai JK, Pischon T, Ma J, Manson JE, Hankinson SE, Joshipura K, et al. Inflammatory markers andthe risk of coronary heart disease in men and women. N Engl J Med 2004;351:2599–610. [PubMed:15602020]
6. Ridker PM, Hennekens CH, Buring JE, Rifai N. C-reactive protein and other markers ofinflammation in the prediction of cardiovascular disease in women. N Engl J Med 2000;342:836–43. [PubMed: 10733371]
7. Ridker PM, Cushman M, Stampfer MJ, Tracy RP, Hennekens CH. Plasma concentration of C-reactive protein and risk of developing peripheral vascular disease. Circulation 1998;97:425–8.[PubMed: 9490235]
8. Ridker PM, Buring JE, Shih J, Matias M, Hennekens CH. Prospective study of C-reactive proteinand the risk of future cardiovascular events among apparently healthy women. Circulation1998;98:731–3. [PubMed: 9727541]
9. Ridker PM, Haughie P. Prospective studies of C-reactive protein as a risk factor for cardiovasculardisease. J Investig Med 1998;46:391–5.
10. Ridker P, Rifai N, Koenig W, Blumenthal RS. C-reactive protein and cardiovascular risk in theFramingham Study. Arch Intern Med 2006;166:1327–8. [PubMed: 16801524]
11. Pai JK, Mukamal KJ, Rexrode KM, Rimm EB. C-reactive protein (CRP) gene polymorphisms,CRP levels, and risk of incident coronary heart disease in two nested case-control studies. PLoSONE 2008;3:e1395. [PubMed: 18167554]
12. Ranjit N, Diez-Roux AV, Shea S, Cushman M, Ni H, Seeman T. Socioeconomic position, race/ethnicity, and inflammation in the multi-ethnic study of atherosclerosis. Circulation2007;116:2383–90. [PubMed: 18025402]
13. Albert MA, Glynn RJ, Buring J, Ridker PM. C-reactive protein levels among women of variousethnic groups living in the United States (from the Women’s Health Study). Am J Cardiol2004;93:1238–42. [PubMed: 15135696]
14. Albert MA, Ridker PM. C-reactive protein as a risk predictor: do race/ethnicity and gender make adifference? Circulation 2006;114:e67–e74. [PubMed: 16880331]
15. Miller DT, Zee RY, Suk DJ, Kozlowski P, Chasman DI, Lazarus R, et al. Association of commonCRP gene variants with CRP levels and cardiovascular events. Ann Hum Genet 2005;69:623–38.[PubMed: 16266402]
16. Dehghan A, Kardys I, de Maat MP, Uitterlinden AG, Sijbrands EJ, Bootsma AH, et al. Geneticvariation, C-reactive protein levels, and incidence of diabetes. Diabetes 2007;56:872–8. [PubMed:17327459]
17. Timpson NJ, Lawlor DA, Harbord RM, Gaunt TR, Day IN, Palmer LJ, et al. C-reactive protein andits role in metabolic syndrome: mendelian randomisation study. Lancet 2005;366:1954–9.[PubMed: 16325697]
18. Carlson CS, Aldred SF, Lee PK, Tracy RP, Schwartz SM, Rieder M, et al. Polymorphisms withinthe C-reactive protein (CRP) promoter region are associated with plasma CRP levels. Am J HumGenet 2005;77:64–77. [PubMed: 15897982]
19. Lange LA, Burdon K, Langefeld CD, Liu Y, Beck SR, Rich SS, et al. Heritability and expressionof C-reactive protein in type 2 diabetes in the Diabetes Heart Study. Ann Hum Genet2006;70:717–25. [PubMed: 17044846]
Lee et al. Page 8
Clin Chem. Author manuscript; available in PMC 2010 April 19.
NIH
-PA Author Manuscript
NIH
-PA Author Manuscript
NIH
-PA Author Manuscript

20. Crawford DC, Yi Q, Smith JD, Shephard C, Wong M, Witrak L, et al. Allelic spectrum of thenatural variation in CRP. Hum Genet 2006;119:496–504. [PubMed: 16550411]
21. The Women’s Health Initiative Study Group. Design of the Women’s Health Initiative clinical trialand observational study. Control Clin Trials 1998;19:61–109. [PubMed: 9492970]
22. Hao K, Liu S, Niu T. A sparse marker extension tree algorithm for selecting the best set ofhaplotype tagging single nucleotide polymorphisms. Genet Epidemiol 2005;29:336–52. [PubMed:16294299]
23. A haplotype map of the human genome. Nature 2005;437:1299–320. [PubMed: 16255080]24. Wang L, Liu S, Niu T, Xu X. SNPHunter: a bioinformatic software for single nucleotide
polymorphism data acquisition and management. BMC Bioinformatics 2005;6:60. [PubMed:15774022]
25. Gabriel SB, Schaffner SF, Nguyen H, Moore JM, Roy J, Blumenstiel B, et al. The structure ofhaplotype blocks in the human genome. Science 2002;296:2225–9. [PubMed: 12029063]
26. Barrett JC, Fry B, Maller J, Daly MJ. Haploview: analysis and visualization of LD and haplotypemaps. Bioinformatics 2005;21:263–5. [PubMed: 15297300]
27. Kraft P, Cox DG, Paynter RA, Hunter D, De VI. Accounting for haplotype uncertainty in matchedassociation studies: a comparison of simple and flexible techniques. Genet Epidemiol2005;28:261–72. [PubMed: 15637718]
28. Benjamini Y, Drai D, Elmer G, Kafkafi N, Golani I. Controlling the false discovery rate inbehavior genetics research. Behav Brain Res 2001;125:279–84. [PubMed: 11682119]
29. Pankow JS, Folsom AR, Cushman M, Borecki IB, Hopkins PN, Eckfeldt JH, Tracy RP. Familialand genetic determinants of systemic markers of inflammation: the NHLBI family heart study.Atherosclerosis 2001;154:681–9. [PubMed: 11257270]
30. Wolford JK, Gruber JD, Ossowski VM, Vozarova B, Antonio TP, Bogardus C, Hanson RL. A C-reactive protein promoter polymorphism is associated with type 2 diabetes mellitus in PimaIndians. Mol Genet Metab 2003;78:136–44. [PubMed: 12618085]
31. Chen J, Zhao J, Huang J, Su S, Qiang B, Gu D. -717A>G polymorphism of human C-reactiveprotein gene associated with coronary heart disease in ethnic Han Chinese: the Beijingatherosclerosis study. J Mol Med 2005;83:72–8. [PubMed: 15517131]
32. Szalai AJ, Wu J, Lange EM, McCrory MA, Langefeld CD, Williams A, et al. Single-nucleotidepolymorphisms in the C-reactive protein (CRP) gene promoter that affect transcription factorbinding, alter transcriptional activity, and associate with differences in baseline serum CRP level. JMol Med 2005;83:440–7. [PubMed: 15778807]
33. Serre D, Montpetit A, Pare G, Engert JC, Yusuf S, Keavney B, et al. Correction of populationstratification in large multi-ethnic association studies. PLoS ONE 2008;3:e1382. [PubMed:18196181]
34. Pritchard JK, Stephens M, Donnelly P. Inference of population structure using multilocus genotypedata. Genetics 2000;155:945–59. [PubMed: 10835412]
35. Hao K, Li C, Rosenow C, Wong WH. Detect and adjust for population stratification in population-based association study using genomic control markers: an application of Affymetrix GenechipHuman Mapping 10K array. Eur J Hum Genet 2004;12:1001–6. [PubMed: 15367915]
Lee et al. Page 9
Clin Chem. Author manuscript; available in PMC 2010 April 19.
NIH
-PA Author Manuscript
NIH
-PA Author Manuscript
NIH
-PA Author Manuscript
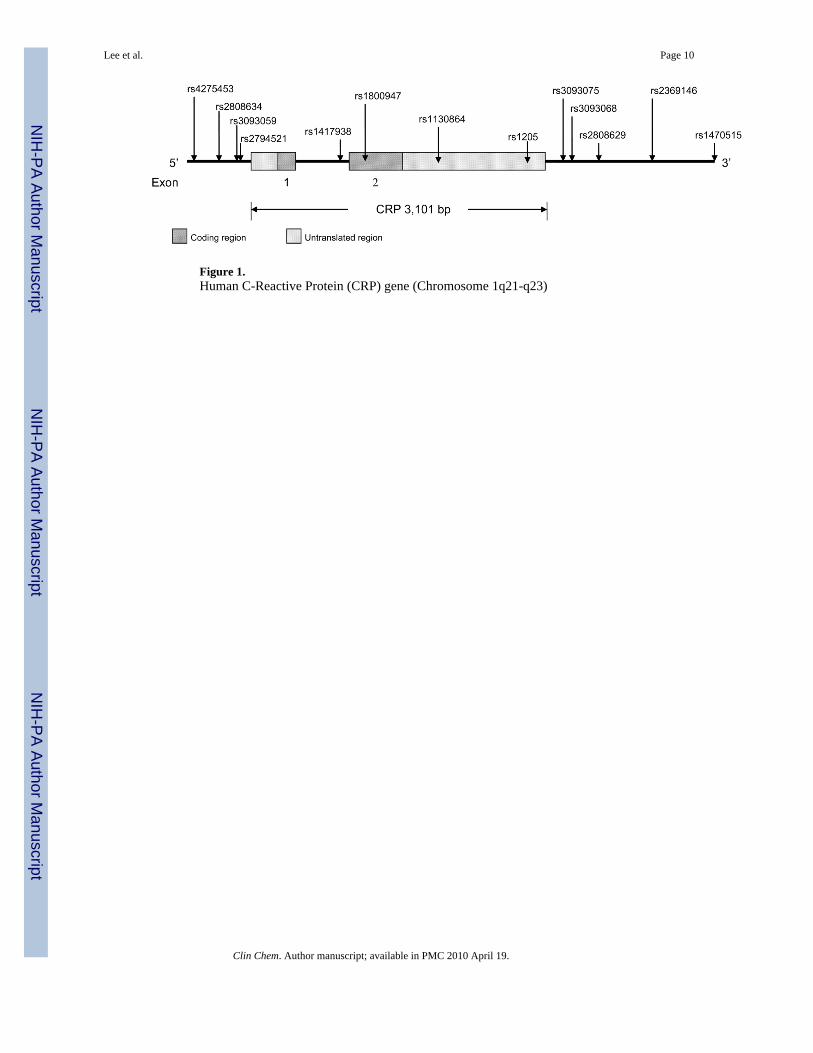
Figure 1.Human C-Reactive Protein (CRP) gene (Chromosome 1q21-q23)
Lee et al. Page 10
Clin Chem. Author manuscript; available in PMC 2010 April 19.
NIH
-PA Author Manuscript
NIH
-PA Author Manuscript
NIH
-PA Author Manuscript

Figure 2.The adjusted mean difference of plasma hsCRP concentrations (95% confidence intervals)according to CRP gene variation based on an additive genetic model, by ethnicity
Lee et al. Page 11
Clin Chem. Author manuscript; available in PMC 2010 April 19.
NIH
-PA Author Manuscript
NIH
-PA Author Manuscript
NIH
-PA Author Manuscript

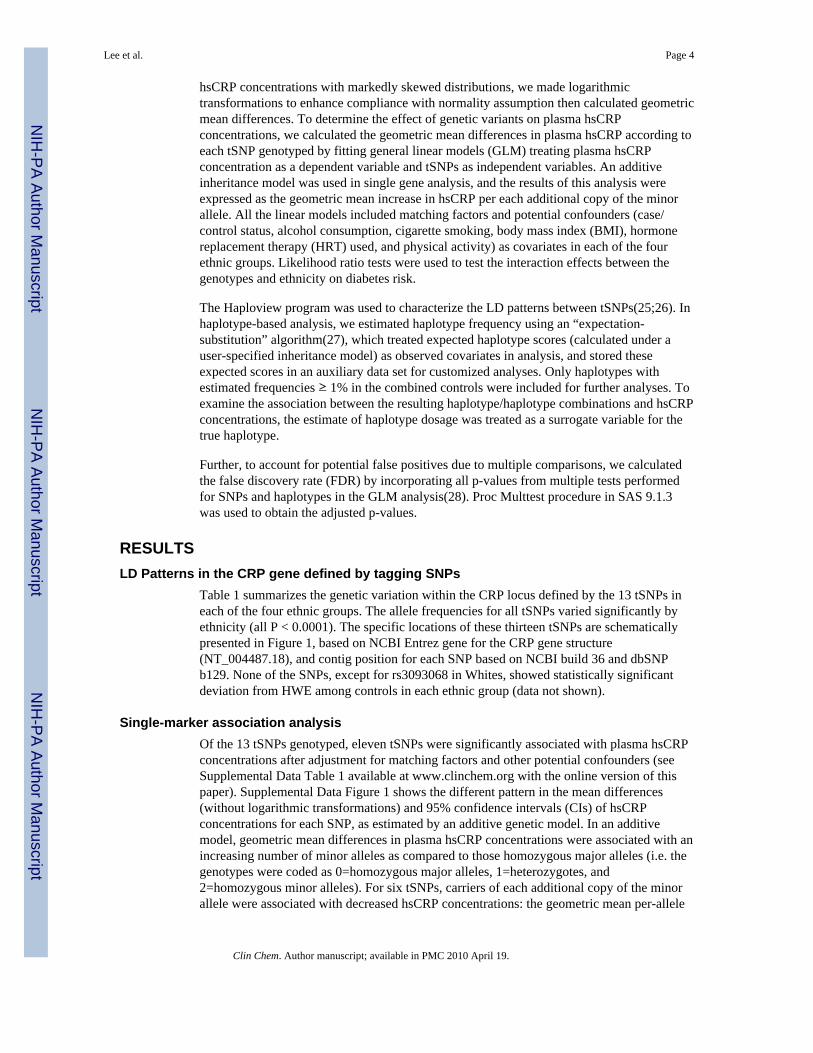
Figure 3.Haploview plot defining ethnic-specific LD structures between the 13 tSNPs within or nearCRP gene among control participants. Each diamond for each SNP combination indicatesthe pairwise LD between all tSNPs. LD strength between the chosen SNPs is determined bythe 90% confidence limits of D′ statistic.
Lee et al. Page 12
Clin Chem. Author manuscript; available in PMC 2010 April 19.
NIH
-PA Author Manuscript
NIH
-PA Author Manuscript
NIH
-PA Author Manuscript

NIH
-PA Author Manuscript
NIH
-PA Author Manuscript
NIH
-PA Author Manuscript
Lee et al. Page 13
Tabl
e 1
The
loca
tion,
rela
tive
dist
ance
s, m
inor
alle
le fr
eque
ncie
s (M
AF)
of g
enot
yped
tagg
ing
SNPs
in C
RP
Gen
e in
Con
trols
Min
or a
llele
freq
uenc
y (%
)
dbSN
P ID
aL
ocat
ionb
Alle
lec
Whi
tes (
n=96
8)B
lack
s (n=
732)
His
pani
cs (n
=303
)A
sian
/Pac
ific
Isla
nder
s (n=
195)
Pool
ed (n
=2,1
98)
Pd
rs42
7545
35′
flan
king
T/C
37.1
55.7
30.8
26.9
42.0
<0.0
001
rs28
0863
45′
flan
king
C/T
29.7
17.9
21.3
14.0
23.3
<0.0
001
rs30
9305
95′
flan
king
T/C
7.0
23.7
9.1
12.8
13.6
<0.0
001
rs27
9452
15′
flan
king
T/C
30.1
17.6
20.9
12.9
23.2
<0.0
001
rs14
1793
8In
tron1
T/A
29.9
11.7
30.5
7.8
21.9
<0.0
001
rs18
0094
7Ex
on2
G/C
6.0
1.8
3.3
8.3
4.3
<0.0
001
rs11
3086
4Ex
on2
C/T
29.3
16.6
31.9
8.2
23.5
<0.0
001
rs12
05Ex
on2
C/T
32.5
22.0
35.4
64.4
31.7
<0.0
001
rs30
9307
53′
flan
king
C/A
6.8
24.3
9.6
11.8
13.7
<0.0
001
rs30
9306
83′
flan
king
C/G
8.4
24.1
9.0
12.5
14.3
<0.0
001
rs28
0862
93′
flan
king
G/A
32.5
22.9
36.1
64.9
32.1
<0.0
001
rs23
6914
63′
flan
king
G/A
25.0
37.3
20.9
14.9
28.0
<0.0
001
rs14
7051
53′
flan
king
G/A
37.5
28.8
40.8
62.6
36.8
<0.0
001
a From
the
Nat
iona
l Cen
ter f
or B
iote
chno
logy
Info
rmat
ion
(NC
BI)
dbS
NP
data
base
.
b SNP
loca
tion
is b
ased
on
NC
BI E
ntre
z ge
ne fo
r the
CR
P ge
ne st
ruct
ure
(NT_
0044
87.1
8), a
nd c
ontig
pos
ition
for e
ach
SNPs
bas
ed o
n N
CB
I bui
ld 3
6 an
d db
SNP
b129
.
c Maj
or/M
inor
Alle
le b
ased
on
the
NC
BI d
bSN
P.
d P-va
lues
wer
e es
timat
ed b
y a
chi-s
quar
e te
st (d
f=3)
for g
enot
ype
dist
ribut
ion
acro
ss th
e fo
ur e
thni
c gr
oups
.
Clin Chem. Author manuscript; available in PMC 2010 April 19.

NIH
-PA Author Manuscript
NIH
-PA Author Manuscript
NIH
-PA Author Manuscript
Lee et al. Page 14
Tabl
e 2
Ass
ocia
tions
bet
wee
n et
hnic
-spe
cific
hap
loty
pes o
f CR
P ge
ne a
nd p
lasm
a hs
CR
P co
ncen
tratio
ns
Hap
loty
pe F
requ
ency
Hap
loty
pea
Cas
esC
ontr
ols
Geo
met
ric
Mea
n D
iffer
ence
±(SE
)bP
(FD
R)c
Whi
tes
(n=9
68)
(n=9
68)
Blo
ck 1
rs14
7051
5-rs
2369
146
0-0
40.9
33.2
1.27
± 1
.04
<0.0
01(<
0.00
1)
1-0
35.4
41.8
−1.
20 ±
1.0
3<0
.001
(<0.
001)
0-1
23.4
24.9
−1.
05 ±
1.0
40.
20
Blo
ck 2
rs28
0862
9-rs
3093
068-
rs30
9307
5-rs
1205
-rs1
1308
64-r
s180
0947
-rs1
4179
38-r
s279
4521
-rs3
0930
59-r
s280
8634
0-0-
0-0-
1-0-
1-0-
0-0
32.2
25.7
1.19
± 1
.04
<0.0
01(<
0.00
1)
0-0-
0-0-
0-0-
0-1-
0-1
28.0
27.9
−1.
02 ±
1.0
40.
64
1-0-
0-1-
0-0-
0-0-
0-0
23.4
29.0
−1.
18 ±
1.0
4<0
.001
(<0.
001)
1-0-
0-1-
0-1-
0-0-
0-0
5.0
7.8
−1.
48 ±
1.0
7<0
.001
(<0.
001)
0-1-
1-0-
0-0-
0-0-
1-0
6.9
6.1
1.21
± 1
.07
0.00
4(0.
005)
Bla
cks
(n=3
66)
(n=7
32)
Blo
ck1
rs14
7051
5-rs
2369
146-
rs28
0862
9
0-0-
039
.530
.81.
38 ±
1.0
6<0
.001
(<0.
001)
0-1-
05.
636
.8−1.
06 ±
1.0
60.
31
1-0-
118
.024
.9−1.
29 ±
1.0
7<0
.001
(0.0
02)
1-0-
06.
66.
6−1.
22 ±
1.1
10.
07
Blo
ck2
rs30
9307
5-rs
1205
-rs1
1308
64-r
s180
0947
-rs1
4179
38-r
s279
4521
-rs3
0930
59
1-0-
0-0-
0-0-
124
.123
.21.
07 ±
1.0
60.
27
0-0-
0-0-
0-0-
023
.119
.31.
23 ±
1.0
70.
001(
0.00
5)
0-1-
0-0-
0-0-
016
.323
.2−1.
33 ±
1.0
7<0
.001
(<0.
001)
0-0-
0-0-
0-1-
015
.417
.5−1.
14 ±
1.0
70.
06
0-0-
1-0-
1-0-
012
.610
.51.
08 ±
1.0
90.
35
0-0-
1-0-
0-0-
05.
83.
721.
22 ±
1.1
30.
10
0-1-
0-1-
0-0-
01.
21.
75−1.
29 ±
1.2
50.
25
Blo
ck3
rs28
0863
4-rs
4275
453
0-0
42.5
45.2
−1.
06 ±
1.0
50.
28
Clin Chem. Author manuscript; available in PMC 2010 April 19.

NIH
-PA Author Manuscript
NIH
-PA Author Manuscript
NIH
-PA Author Manuscript
Lee et al. Page 15
Hap
loty
pe F
requ
ency
Hap
loty
pea
Cas
esC
ontr
ols
Geo
met
ric
Mea
n D
iffer
ence
±(SE
)bP
(FD
R)c
0-1
41.9
37.3
1.14
± 1
.05
0.01
(0.0
4)
1-1
15.6
17.5
−1.
14 ±
1.0
70.
06
His
pani
cs(n
=152
)(n
=303
)
Blo
ck1
rs14
7051
5-rs
2369
146-
rs28
0862
9
0-0-
041
.032
.61.
24 ±
1.0
80.
007(
0.03
)
1-0-
134
.237
.7−1.
07 ±
1.0
80.
41
0-1-
019
.623
.1−1.
08 ±
1.0
90.
39
1-0-
04.
55.
6−1.
42 ±
1.1
80.
03(0
.07)
Blo
ck2
rs30
9307
5-rs
1205
-rs1
1308
64-r
s180
0947
-rs1
4179
38-r
s279
4521
-rs3
0930
59
0-1-
0-0-
0-0-
030
.933
.7−1.
04 ±
1.0
80.
59
0-0-
1-0-
1-0-
031
.129
.21.
04 ±
1.0
90.
67
0-0-
0-0-
0-1-
017
.724
.1−1.
34 ±
1.1
00.
002(
0.00
6)
1-0-
0-0-
0-0-
19.
46.
31.
57 ±
1.1
4<0
.001
(0.0
05)
0-0-
0-0-
0-0-
06.
21.
01.
58 ±
1.1
90.
01(0
.02)
0-1-
0-1-
0-0-
03.
23.
1−1.
02 ±
1.2
50.
93
Blo
ck3
rs28
0863
4-rs
4275
453
0-0
69.9
67.0
1.13
± 1
.08
0.10
1-1
18.2
24.7
−1.
36 ±
1.1
00.
001(
0.00
3)
0-1
11.7
8.4
1.20
± 1.
120.
12
Asi
ans/
Paci
fic Is
land
ers
(n=9
8)(n
=195
)
Blo
ck1
rs14
7051
5-rs
2369
146
1-0
47.1
68.2
−1.
45 ±
1.1
20.
001(
0.00
2)
0-0
37.8
18.4
1.61
± 1
.14
<0.0
01(<
0.00
1)
0-1
15.0
13.2
−1.
00 ±
1.1
80.
98
Blo
ck2
rs28
0862
9-rs
3093
068-
rs30
9307
5-rs
1205
-rs1
1308
64
1-0-
0-1-
049
.671
.7−1.
57 ±
1.1
2<0
.001
(<0.
001)
0-0-
0-0-
016
.213
.01.
08 ±
1.1
90.
66
0-1-
1-0-
014
.79.
71.
48 ±
1.1
90.
02(0
.003
)
0-0-
0-0-
116
.64.
81.
69 ±
1.2
10.
007(
0.01
)
Blo
ck3
rs28
0863
4-rs
4275
453
Clin Chem. Author manuscript; available in PMC 2010 April 19.
NIH
-PA Author Manuscript
NIH
-PA Author Manuscript
NIH
-PA Author Manuscript
Lee et al. Page 16
Hap
loty
pe F
requ
ency
Hap
loty
pea
Cas
esC
ontr
ols
Geo
met
ric
Mea
n D
iffer
ence
±(SE
)bP
(FD
R)c
0-0
68.5
77.7
−1.
40 ±
1.1
40.
008(
0.01
)
0-1
17.4
9.9
1.89
± 1
.19
<0.0
01(<
0.00
1)
1-1
13.1
12.2
−1.
01 ±
1.1
90.
96
a Hap
loty
pes o
bser
ved
with
≥0.
01 fr
eque
ncy
in a
t lea
st o
ne e
thni
c gr
oup
in th
e m
ultie
thni
c pa
nel (
1=m
ajor
alle
le, 2
=min
or a
llele
).
b Geo
met
ric m
ean
diff
eren
ce a
nd st
anda
rd e
rror
for e
ach
geno
type
was
cal
cula
ted
usin
g ge
nera
l lin
ear r
egre
ssio
n m
odel
s with
adj
ustm
ent f
or m
atch
ing
fact
ors (
age,
eth
nici
ty, c
linic
al c
ente
r, an
d tim
e of
bloo
d dr
aw),
T2D
M, a
nd o
ther
con
foun
ders
incl
udin
g B
MI,
horm
one
repl
acem
ent t
hera
py, a
lcoh
ol c
onsu
mpt
ion,
cig
aret
te sm
okin
g, a
nd p
hysi
cal a
ctiv
ity.
c Adj
uste
d p-
valu
e fo
r p<0
.05
afte
r FD
R
Clin Chem. Author manuscript; available in PMC 2010 April 19.
NIH
-PA Author Manuscript
NIH
-PA Author Manuscript
NIH
-PA Author Manuscript
Lee et al. Page 17
Tabl
e 3
Geo
met
ric m
ean
diff
eren
ces i
n pl
asm
a hs
CR
P co
ncen
tratio
ns a
ccor
ding
to sp
ecifi
c C
RP
hapl
otyp
e an
d et
hnic
ity e
stim
ated
by
an a
dditi
ve g
enet
ic e
ffec
tm
odel
Hap
loty
pe sp
ecifi
c G
eom
etri
c M
ean
Diff
eren
ce±
(SE
)b
Hap
loty
pea
Whi
teB
lack
His
pani
csA
sian
/Pac
ific
Isla
nder
sA
llc
rs11
3086
4– rs
120
5 –
rs30
9306
8d
0-0-
01.
02 ±
1.0
4−1.
09 ±
1.0
6−1.
10 ±
1.0
91.
10 ±
1.1
9−1.
02 ±
1.0
3
0-1-
0−1.
29 ±
1.0
4***
−1.
34 ±
1.0
7***
−1.
03 ±
1.0
9−1.
56 ±
1.1
2***
−1.
30 ±
1.0
3***
1-0-
01.
20 ±
1.0
4***
1.06
± 1
.09
1.02
± 1
.09
1.70
± 1
.21*
1.17
± 1
.03*
**
0-0-
11.
24 ±
1.0
7***
1.36
± 1
.07*
**1.
31 ±
1.1
41.
60 ±
1.1
9*1.
29 ±
1.0
4***
1-0-
12.
18 ±
1.4
91.
37 ±
1.1
6−1.
20 ±
1.4
5-
1.40
± 1
.12*
*
rs 1
8009
47 -
rs11
3086
4 –
rs 1
205e
0-0-
01.
09 ±
1.0
4*1.
13 ±
1.0
61.
01 ±
1.0
81.
38 ±
1.1
4*1.
10 ±
1.0
3***
0-0-
1−1.
19 ±
1.0
4***
−1.
31 ±
1.0
7***
−1.
01 ±
1.0
9−1.
34 ±
1.1
1*−1.
23 ±
1.0
3***
0-1-
01.
21 ±
1.0
4***
1.13
± 1
.08
1.01
± 1
.09
1.70
± 1
.21*
1.20
± 1
.03*
**
1-0-
1−1.
49 ±
1.0
7***
−1.
40 ±
1.3
0−1.
03 ±
1.2
4−1.
51 ±
1.2
4−1.
47 ±
1.0
6***
a Hap
loty
pes o
bser
ved
with
≥0.
01 fr
eque
ncy
in a
t lea
st o
ne e
thni
c gr
oup
in th
e m
ultie
thni
c pa
nel (
0=m
ajor
alle
le, 1
=min
or a
llele
).
b Geo
met
ric m
ean
diff
eren
ce a
nd st
anda
rd e
rror
for e
ach
geno
type
was
cal
cula
ted
usin
g ge
nera
l lin
ear r
egre
ssio
n m
odel
s with
adj
ustm
ent f
or m
atch
ing
fact
ors (
age,
clin
ical
cen
ter,
and
time
of b
lood
dra
w),
T2D
M, a
nd o
ther
con
foun
ders
incl
udin
g B
MI,
horm
one
repl
acem
ent t
hera
py, a
lcoh
ol c
onsu
mpt
ion,
cig
aret
te sm
okin
g, a
nd p
hysi
cal a
ctiv
ity.
c Geo
met
ric m
ean
diff
eren
ce a
nd st
anda
rd e
rror
for e
ach
geno
type
was
cal
cula
ted
usin
g ge
nera
l lin
ear r
egre
ssio
n m
odel
s with
adj
ustm
ent f
or m
atch
ing
fact
ors (
age,
eth
nici
ty, c
linic
al c
ente
r, an
d tim
e of
blo
oddr
aw),
T2D
M, a
nd o
ther
con
foun
ders
incl
udin
g B
MI,
horm
one
repl
acem
ent t
hera
py, a
lcoh
ol c
onsu
mpt
ion,
cig
aret
te sm
okin
g, a
nd p
hysi
cal a
ctiv
ity.
d Hap
loty
pe st
ruct
ure
from
the
Deh
ghan
et a
l.(20
07)(
16)
e Hap
loty
pe st
ruct
ure
from
Tim
pson
et a
l (20
05)(
17)
* Adj
uste
d p-
valu
e<0.
05 a
fter F
DR
**A
djus
ted
p-va
lue<
0.01
afte
r FD
R
*** A
djus
ted
p-va
lue<
0.00
1 af
ter F
DR
Clin Chem. Author manuscript; available in PMC 2010 April 19.
Copyright © 2022 FDOKUMEN