Relation of frontal eye field activity to saccade initiation during a countermanding task
37
Relation of Frontal Eye Field Activity to Saccade Initiation during a Countermanding Task Joshua W. Brown 1,2 , Doug P. Hanes 1 , Jeffrey D. Schall 1 , and Veit Stuphorn 1,3 1 Center for Integrative & Cognitive Neuroscience, Vanderbilt Vision Research Center, Department of Psychology, Vanderbilt University, Nashville, TN 37203 2 Department of Psychological & Brain Sciences, Indiana University, 1101 E Tenth St., Bloomington, IN 47405 3 The Zanvyl Krieger Mind/Brain Institute and The Department of Psychological & Brain Sciences, Johns Hopkins University, 362 Krieger Hall, 3400 N. Charles Street, Baltimore, MD 21218 Abstract The countermanding (or stop signal) task probes the control of the initiation of a movement by measuring subjects’ ability to withhold a movement in various degrees of preparation in response to an infrequent stop signal. Previous research found that saccades are initiated when the activity of movement-related neurons reaches a threshold, and saccades are withheld if the growth of activity is interrupted. To extend and evaluate this relationship of frontal eye field (FEF) activity to saccade initiation, two new analyses were performed. First, we fit a neurometric function that describes the proportion of trials with a stop signal in which neural activity exceeded a criterion discharge rate as a function of stop signal delay, to the inhibition function that describes the probability of producing a saccade as a function of stop signal delay. The activity of movement-related but not visual neurons provided the best correspondence between neurometric and inhibition functions. Second, we determined the criterion discharge rate that optimally discriminated between the distributions of discharge rates measured on trials when saccades were produced or withheld. Differential activity of movement-related but not visual neurons could distinguish whether a saccade occurred. The threshold discharge rates determined for individual neurons through these two methods agreed. To investigate how reliably movement-related activity predicted movement initiation; the analyses were carried out with samples of activity from increasing numbers of trials from the same or from different neurons. The reliability of both measures of initiation threshold improved with number of trials and neurons to an asymptote of between 10 to 20 movement-related neurons. Combining the activity of visual neurons did not improve the reliability of predicting saccade initiation. These results demonstrate how the activity of a population of movement-related but not visual neurons in the FEF contributes to the control of saccade initiation. The results also validate these analytical procedures for identifying signals that control saccade initiation in other brain structures. copyright Springer-Verlag Berlin Heidelberg Address for correspondence, Prof. Joshua W. Brown, Dept. of Psychological & Brain Sciences, Indiana University, 1101 E Tenth St., Bloomington, IN 47405 USA, +1 812 855-9282 (OFFICE), +1 812 855-4691 (FAX), [email protected]. Publisher's Disclaimer: This article is an un-copyedited author manuscript that has been accepted for publication in Experimental Brain Research, copyright Springer-Verlag Berlin Heidelberg. The original publication is available at http://www.springerlink.com/content/2287772053p131k8/ or at www.springerlink.com NIH Public Access Author Manuscript Exp Brain Res. Author manuscript; available in PMC 2009 September 22. Published in final edited form as: Exp Brain Res. 2008 September ; 190(2): 135–151. doi:10.1007/s00221-008-1455-0. NIH-PA Author Manuscript NIH-PA Author Manuscript NIH-PA Author Manuscript
-
Upload
vanderbilt -
Category
Documents
-
view
4 -
download
0
Transcript of Relation of frontal eye field activity to saccade initiation during a countermanding task
Relation of Frontal Eye Field Activity to Saccade Initiation duringa Countermanding Task
Joshua W. Brown1,2, Doug P. Hanes1, Jeffrey D. Schall1, and Veit Stuphorn1,31Center for Integrative & Cognitive Neuroscience, Vanderbilt Vision Research Center, Departmentof Psychology, Vanderbilt University, Nashville, TN 372032Department of Psychological & Brain Sciences, Indiana University, 1101 E Tenth St., Bloomington,IN 474053The Zanvyl Krieger Mind/Brain Institute and The Department of Psychological & Brain Sciences,Johns Hopkins University, 362 Krieger Hall, 3400 N. Charles Street, Baltimore, MD 21218
AbstractThe countermanding (or stop signal) task probes the control of the initiation of a movement bymeasuring subjects’ ability to withhold a movement in various degrees of preparation in response toan infrequent stop signal. Previous research found that saccades are initiated when the activity ofmovement-related neurons reaches a threshold, and saccades are withheld if the growth of activityis interrupted. To extend and evaluate this relationship of frontal eye field (FEF) activity to saccadeinitiation, two new analyses were performed. First, we fit a neurometric function that describes theproportion of trials with a stop signal in which neural activity exceeded a criterion discharge rate asa function of stop signal delay, to the inhibition function that describes the probability of producinga saccade as a function of stop signal delay. The activity of movement-related but not visual neuronsprovided the best correspondence between neurometric and inhibition functions. Second, wedetermined the criterion discharge rate that optimally discriminated between the distributions ofdischarge rates measured on trials when saccades were produced or withheld. Differential activityof movement-related but not visual neurons could distinguish whether a saccade occurred. Thethreshold discharge rates determined for individual neurons through these two methods agreed. Toinvestigate how reliably movement-related activity predicted movement initiation; the analyses werecarried out with samples of activity from increasing numbers of trials from the same or from differentneurons. The reliability of both measures of initiation threshold improved with number of trials andneurons to an asymptote of between 10 to 20 movement-related neurons. Combining the activity ofvisual neurons did not improve the reliability of predicting saccade initiation. These resultsdemonstrate how the activity of a population of movement-related but not visual neurons in the FEFcontributes to the control of saccade initiation. The results also validate these analytical proceduresfor identifying signals that control saccade initiation in other brain structures.
copyright Springer-Verlag Berlin HeidelbergAddress for correspondence, Prof. Joshua W. Brown, Dept. of Psychological & Brain Sciences, Indiana University, 1101 E Tenth St.,Bloomington, IN 47405 USA, +1 812 855-9282 (OFFICE), +1 812 855-4691 (FAX), [email protected]'s Disclaimer: This article is an un-copyedited author manuscript that has been accepted for publication in Experimental BrainResearch, copyright Springer-Verlag Berlin Heidelberg. The original publication is available athttp://www.springerlink.com/content/2287772053p131k8/ or at www.springerlink.com
NIH Public AccessAuthor ManuscriptExp Brain Res. Author manuscript; available in PMC 2009 September 22.
Published in final edited form as:Exp Brain Res. 2008 September ; 190(2): 135–151. doi:10.1007/s00221-008-1455-0.
NIH
-PA Author Manuscript
NIH
-PA Author Manuscript
NIH
-PA Author Manuscript

KeywordsFRONTAL CORTEX; MOTOR CONTROL; OCULOMOTOR; REACTION TIME; RESPONSETIME; STOCHASTIC MODELS; STOP SIGNAL; SACCADE LATENCY
INTRODUCTIONStudies of the oculomotor system over the last 30 years have found that the production of asaccade depends on the balance of activation of gaze-shifting and gaze-holding neuronsdistributed in the brainstem (Scudder et al. 2002), superior colliculus (Munoz 2002), basalganglia (Hikosaka et al., 2000) and frontal eye field (FEF) (Schall et al., 2002). While there isconsensus regarding the opponency between gaze-holding and gaze-shifting in the oculomotorsystem, current models of saccade generation do not explain the preliminary event necessaryand sufficient to initiate a saccade (Scudder et al. 2002).
To investigate the neural control of movement initiation, we have used the countermanding orstop signal paradigm (Logan 1994; Logan and Cowan 1984). The countermanding task testsa subject's ability to control the initiation of movements in a speeded response task byinfrequently presenting an imperative stop signal. Performance on this task is stochastic butcan be accounted for by a race between a process that generates the movement (GO) and aprocess that interrupts movement preparation (STOP). This race model provides an estimateof the time needed to cancel the planned movement, the stop signal reaction time (SSRT). Anew interactive race model of countermanding performance shows that SSRT corresponds tothe time when the GO process is inhibited by the STOP process (Boucher et al. 2007).
The findings of our previous studies are summarized diagrammatically in Figure 1 (Hanes andSchall 1996;Hanes et al. 1998; see also Paré and Hanes 2003). Saccades were initiated whenthe discharge rate of single movement-related neurons in FEF reached a particular value. Thisdischarge rate constituted a threshold at which the balance tipped from gaze-holding to gaze-shifting. The variability of saccade latency was accounted for by variability in the rate ofincrease of the discharge rate of gaze-shifting neurons to the threshold. When movements werecanceled in response to the stop signal, the movement-related activity in FEF, which had begunto grow toward the trigger threshold, decreased and so failed to reach the threshold activationlevel. The modulation of movement-related activity when saccades were canceled occurredwithin the SSRT. Therefore, according to the logic of the countermanding paradigm, theactivity of single FEF movement neurons is sufficient to specify on average whether an eyemovement will be produced. This pattern of results was observed consistently in neurons withmovement-related activity, and a complementary pattern of activation was observed in fixationneurons but the activity of neurons with only visual responses was modulated not at all or toolate to contribute to controlling saccade initiation (Hanes et al. 1998). Effectively identicalresults have been obtained in the superior colliculus (Paré and Hanes 2003). These findingsindicate that the preparation of a saccade is a controlled process that can be canceled if andonly if the growth of activation toward the trigger threshold is sufficiently slow to beinterrupted.
While these findings appear to provide a sensible account of the neural events leading tosaccade initiation, some key issues remain unclear. For example, the trigger threshold has beendefined simply as the average of the discharge rate in the period immediately before saccadeinitiation from samples of 10 trials (Hanes and Schall, 1996). This analysis has twoshortcomings. First, strictly speaking, all trials with discharge rates less than the averagethreshold should not have resulted in saccades, which obviously was not the case. Thus, a majorgoal of the present analysis was to devise a functional formulation of the trigger threshold.
Brown et al. Page 2
Exp Brain Res. Author manuscript; available in PMC 2009 September 22.
NIH
-PA Author Manuscript
NIH
-PA Author Manuscript
NIH
-PA Author Manuscript

Second, averaging across trials probably underestimates the variability of the threshold, but ifthis variability is too great, the threshold concept may become only a heuristic approximation,in which case the mechanism underlying movement initiation becomes less clear. Thus, theother major goal of this research was to measure the reliability of the trigger threshold in activitypooled across trials and neurons.
The results of inactivation, lesion, and anatomical investigations demonstrate that many (105
– 106) neurons are necessary to produce a saccade1, but how many single neurons aresufficient to specify whether and when a saccade will be produced? By pooling the activityfrom a variable number of trials combined within and across neurons, we determined the fewestneurons sufficient to predict reliably when a saccade would be initiated. While the results wedescribe are consistent with the previous reports and thus are not entirely novel, this worksubstantiates the theory that saccades are initiated when the total activation among gaze-shifting neurons reaches a threshold and in so doing provides a proof of principle of this analyticapproach that empowers it in the companion investigation of the supplementary eye field aswell as future studies of other visuomotor structures. Some of these results have been presentedin abstract form (Brown et al. 2001; Schall et al. 1999).
MATERIALS AND METHODSSurgical and Behavioral Procedures
Conventional methods were used. Two male macaque monkeys (Macaca mulatta) wereprepared as described previously (Hanes et al. 1998). All experimental procedured conformedto United States Public Health Service guidelines as interpreted by the Vanderbilt UniversityAnimal Care and Use Committee. A PDP-11/83 presented stimuli and collected eye position,spike and event data.
The Countermanding TaskThe saccade version of the countermanding task has been described (Hanes et al. 1998; Hanesand Schall 1995) (Figure 2). After fixation of a central spot, it disappeared simultaneously withthe presentation of a visual target either in the most sensitive zone of a neuron’s response fieldor in the opposite hemifield at the same eccentricity. On a fraction of trials after a variabledelay, referred to as the stop signal delay, the fixation spot reappeared, instructing monkeysto withhold the movement (stop signal trials). During the trials in which the stop signal wasnot presented (no stop signal trials) monkeys were rewarded for generating a single saccade to
1In asking how many neurons prepare a saccade one discovers a specific lack of information about density and number of neurons invarious structures. However, a back-of-the-envelope calculation is possible. We start with an estimate of 73,000 neurons/mm2 based onthe count of 146,000 cells per mm2 of cerebral cortex with other estimates from as low as 20,000 neurons/mm2 to as high as 92,000neurons/mm2 Rockel AJ, Hiorns RW, Powell TP (1980) The basic uniformity in structure of the neocortex. Brain 103:221-244,Braitenberg V, Schüz A (1991) Anatomy of the Cortex: Statistics and Geometry. Berlin: Springer-Verlag‥ Lacking information to thecontrary, we will assume equivalent density for all relevant structures. The structures we considered in which presaccadic activity relatedto the timing of the initiation of the movement has been reported are the frontal eye field, superior colliculus, thalamus, basal gangliaand brainstem. We take the cortical area of FEF to be 50 mm2, so assuming a uniform 2 mm cortical depth, the total cell number in FEFis 7,300,000 (low 2,000,000; high 9,200,000). However, if only the pyramidal cells in layer 5 are responsible for saccade generation,then this count must be reduced proportionally by estimating the depth of layer 5 at 0.05 mm – 182,500 (low 50,000; high230,000).Estimates for the superior colliculus derived from direct counts using new methods Herculano-Houzel S, Collins CE, Wong P,Kaas JH (2007) Cellular scaling rules for primate brains. Proc Natl Acad Sci U S A 104:3562-3567. are that there are ∼7,000,000 totalcells in the SC with about 25% of those being neurons. Assuming the intermediate layers constitute 40% of the depth of the SC and that50% of the neurons in the intermediate layers contribute to saccade generation, the number of neurons is 350,000. Restricting the thalamuscontribution to the lateral sector of the medial dorsal nucleus and assuming again that 50% of these neurons contribute to saccadegeneration, the number is 100,000. Assuming that the number of neurons in the caudate nucleus and the substantia nigra pars reticulatathat contribute to saccade generation are equivalent to that in the superior colliculus, then the basal ganglia number is 700,000. Finally,we assume that there are 10,000 long-lead burst neurons in the brainstem. Based on all these assumptions and estimates, the total numberof presaccadic movement-related neurons amounts to 9.9 × 10⁵. Now, not all of these neurons will be active before a given saccade. Ifwe assume that 1/3 of the neurons are active before any saccade, then the total is 3.3 × 10⁵, and if the fraction is as low as 1/10, then thetotal is 9.9 × 10⁴. This is the basis for our claim that 105 to 106 neurons are necessary for initiation of a saccade.
Brown et al. Page 3
Exp Brain Res. Author manuscript; available in PMC 2009 September 22.
NIH
-PA Author Manuscript
NIH
-PA Author Manuscript
NIH
-PA Author Manuscript

the peripheral target. During stop signal trials monkeys were rewarded for maintaining fixationon the central spot (canceled trials). If the monkeys generated a saccade to the peripheral targetduring stop signal trials (non-canceled trials), no reward was given. On correct trials juicereward was given on a variable ratio schedule coupled with an acoustic secondary reinforcergiven on every correct trial.
Performance in the countermanding task is probabilistic because of the variability in reactiontimes across trials. The probability of not canceling the movement increases as the delaybetween the signal to initiate the movement and the signal to inhibit the movement (stop signaldelay) increases. Stop signal delays were varied according to the monkeys' performance so thatat the shortest stop signal delay monkeys generally inhibited the movement on more than 85%of the stop signal trials and at the longest delay monkeys inhibited the movement on fewer than15% of the stop signal trials. Movements generated with a short latency tend to be initiatedbefore the stop signal can influence the system. Conversely, movements that would begenerated with long latencies tend to be canceled because there is enough time for the stopsignal to influence the system. The time needed to cancel the movement, known as stop signalreaction time (SSRT), can be estimated from a model of a stochastic race between a processthat produces the movement and a process that cancels the movement (Logan and Cowan1984; Boucher et al. 2007). The procedures for measuring SSRT have been described in detailpreviously (Logan and Cowan, 1984; Hanes and Schall, 1995). Saccade stop signal reactiontimes average around 80–100 ms in monkeys (Hanes et al. 1998; Hanes and Schall 1995;Kornylo et al. 2003).
The goal of this paper is to describe how the activity of FEF neurons relates to performance asa function of stop signal delay. During many but not all recording sessions, stop signal delaywas manipulated with a staircase procedure to maintain the error rate on stop trials around50%. This led to a proliferation of stop signal delays, with as many as 20 per session.Consequently, to achieve sufficient statistical power to estimate discharge probabilities for agiven stop signal delay, delays differing by less than 20 ms were combined into 20 ms widebins, with the mean value used as the stop signal delay for the analysis.
Analysis of Neural ActivitySpike density functions were obtained by convolving the spike train with a function resemblinga postsynaptic potential A(t) = [1-exp(-t/τg)] ·[exp(-t/τd )]. Physiological data from excitatorysynapses indicate τg ∼ 1 ms and τd ∼ 20 ms (Sayer et al. 1990).
Two kinds of analyses were carried out to characterize the relationship between discharge rateand saccade initiation; these will be described in detail below. The neurometric thresholdminimized the difference between a neurometric function and a psychometric inhibitionfunction. The optimal discriminant threshold maximized the predictive accuracy that a saccadewould occur given the activity level on each stop signal trial.
The value submitted to these analyses from no stop signal and non-canceled trials was themaximum of the spike density function in the 20 ms prior to saccade initiation. This interval(especially between 20 and 10 ms prior to saccade initiation) was used previously to define thethreshold for movement initiation (Hanes and Schall 1996) because omnipause neurons releaseinhibition on the burst neurons at that time before saccade initiation (Scudder et al. 2002)making this the point of no return. In this analysis, we measure the maximimum neural activityuntil the moment of saccade initiation, as this more directly matches the control condition inthe cancelled trials, which extends to the SSRT. However, the main conclusions would not bedifferent if we included values only up to 10–20 ms before saccade initiation. The measureused in canceled trials was the maximum of the spike density function in the interval from
Brown et al. Page 4
Exp Brain Res. Author manuscript; available in PMC 2009 September 22.
NIH
-PA Author Manuscript
NIH
-PA Author Manuscript
NIH
-PA Author Manuscript

target presentation until SSRT + 20 ms; the extra 20 ms was included to account for possibleunderestimation of the SSRT.
Distributions of maximum activity were obtained from three sets of trials. First, for eachneuron, the maximum was measured in the specified interval for each trial. Second,bootstrapped sampling of multiple trials within and across cells was used to obtain an estimateof the variance (and therefore the validity) of the threshold. For the population analysis withbootstrapped sampling, N trials were selected randomly and with replacement either from asingle neuron (“pooled within”) or across the sample of neurons (“pooled across”) andcombined to generate a virtual trial. The N trials were aligned on the event of interest (targetappearance for canceled trials, and saccade initiation for no stop signal and non-canceled trials)and averaged at each point in time. The maximum of this average firing rate in the specifiedinterval pooled among the sample of N trials was determined. When canceled trials withdifferent stop signal delays were combined, the average firing rate at each point in time wascalculated from only those trials for which the current time had not exceeded the SSRT + 20ms. In other words, at each point in time, we excluded from the average those trials for whichthe SSRT + 20 msec had elapsed, because activity on those trials could not logically providea causal signal to drive saccade initation. Third, for bootstrap sampling of trials from a singleneuron, 1000 virtual trials were generated for each stop signal delay. To avoid bias in thederived thresholds, canceled and non-canceled trials were sampled in proportion to the actualfractions of each trial type that occurred while recording from the neuron. For example, if 60%of stop signal trials were canceled, then 600 virtual canceled trials and 400 virtual non-canceledtrials were generated. When pooling trials across neurons, 1000 virtual canceled trials and 1000virtual non-canceled trials were generated.
Neurometric threshold from best fit of neurometric to inhibition function—Theinhibition function plots the fraction of non-canceled trials in which saccade is produced inspite of stop signal as a function of stop signal delay. The fraction of non-canceled trials is anincreasing function of stop signal delay, because saccades are less likely to be canceled aspreparation progresses through time. If saccades are produced when the activity of movement-related neurons crosses a threshold, then the inhibition function should correspond to thefraction of trials in which the discharge rate exceeded that threshold at each stop signal delay.A neurometric function was defined as the probability of discharge rate exceeding a criterionvalue as a function of stop signal delay. Therefore, a search was performed for the singlecriterion discharge rate that provided the best correspondence between the neurometricfunction and the inhibition function.
Neurometric functions were constructed as follows (Figure 3). All three sampling methods(individual neurons, bootstrap within and bootstrap across neurons) yielded a set of trials witha measure of maximum activity, grouped by stop signal delay. The fraction of trials that do notexceed a criterion or threshold discharge rate decreases as the criterion increases (Figure 3A).The fraction of canceled and non-canceled stop signal trials in which activity did not exceedthe criterion was plotted for each stop signal delay group as a function of criterion value (Figure3B). Presaccadic movement-related activity increases with time, so the probability of thedischarge rate exceeding the criterion will increase with stop signal delay so the neurometricfunction derived from this relationship will increase with stop signal delay. The neurometricfunction is parameterized by the criterion discharge rate so that it shifts left or upward for lowercriterion values and right or downward for higher values (Figure 3C). In other words, a criterionthat is too low would be crossed by minimal discharge rates which would predict many non-canceled saccades, and a criteron that is too high would be crossed only by rare maximaldischarge rates which would predict few non-canceled saccades. If a given neuron contributesto controlling saccade initiation, then some criteron discharge rate must exist that produces aneurometric function corresponding closely to the behavioral inhibition function. Therefore, a
Brown et al. Page 5
Exp Brain Res. Author manuscript; available in PMC 2009 September 22.
NIH
-PA Author Manuscript
NIH
-PA Author Manuscript
NIH
-PA Author Manuscript

search was performed for the criterion discharge rate that minimized the least-squares fit ofthe neurometric function to the inhibition function.
The goodness-of-fit between the neurometric and inhibition function was measured with thePearson correlation coefficient. At first glance, the Pearson correlation might appear to be aninappropriate measure of goodness-of-fit, due to insensitivity to scale differences. For example,a range between 1% and 9% saccade probability could correlate highly with a range between10% and 90% probability of neural activity exceeding threshold, despite scale differences.Nonetheless, this issue is resolved by the fact that the prior best fit of the neurometric thresholdrequires the actual values of the neurometric and psychometric functions to be as numericallyclose as possible, i.e. of the same scale. Thus, a high Pearson correlation in this case impliesboth similar scale and similar functional form, which are the basic elements of a good fit. Inprinciple, a chi-squared test might also be appropriate to test goodness-of-fit. In this casehowever, a chi-squared test was inappropriate, because it requires an estimate of the variancefor the neurometric and inhibition functions, and the variances were not readily known. Toobtain reliable estimates of shape parameters, the neurometric function was fit with a Weibullfunction of the form:
where t is time after target presentation, α is the time at which the neurometric function reaches64% of its full growth, β is the slope, γ is the maximum value of the neurometric function andδ is the minimum value of the neurometric function.
Threshold from optimal discrimination between canceled and non-canceledtrial activity—This analysis was based on another defining feature of a trigger threshold. Ifmovements are initiated if and only if the activity of presaccadic neurons exceeds a thresholddischarge rate, then the distribution of discharge rates in canceled trials must be less than thedistribution of discharge rates in non-canceled trials. Thus, another measure of a putativetrigger threshold is the discharge rate that optimally discriminates between the distributions ofmaximum activity measured in canceled and non-canceled trials (Figure 4). Specifically, thisoptimal discriminant threshold measurement determined the discharge rate that maximized thenumber of canceled trials with activity below the criterion threshold and the number of non-canceled trials with activity above the criterion. The quality of the discrimination can be plottedas a function of criterion discharge rate and its value is greatest at the optimal threshold. Trialswith no stop signal were not used to calculate the optimal threshold. A measure of thisdiscrimination quality is the fraction of stop signal trials with activity on canceled trials belowthe criterion and with activity on non-canceled trials above the criterion. The threshold in thiscase constitutes a classical linear discriminant (Fisher, 1936).
RESULTSThis analysis concentrated on neurons with activity related to the production of saccades.Movement-related and visual activity was distinguished in data collected during performanceof memory-guided saccades and the stop signal task. Movement-related activity was identifiedas pronounced modulation synchronized with saccade initiation, such that movement-alignedactivity was greater than stimulus-aligned activity, consistent with our classification innumerous previous studies. We did not require a minimum discharge rate aligned on movementinitiation for a cell to be classified as a movement cell. Visual activity was identified aspronounced modulation synchronized on target presentation. The data included 48 neuronswith movement-related activity (many of which had visual responses) and a select group of 12
Brown et al. Page 6
Exp Brain Res. Author manuscript; available in PMC 2009 September 22.
NIH
-PA Author Manuscript
NIH
-PA Author Manuscript
NIH
-PA Author Manuscript

neurons with only visual activity recorded from the frontal eye fields of two monkeysperforming the countermanding task (Hanes et al. 1998).
Prediction of Movement Initiation by Individual FEF neuronsConsistent with previous results (Hanes and Schall, 1996), we found that the movement-relatedactivity of most neurons (37/48) exhibited a specific albeit idiosyncratic discharge rate whensaccades are initiated. The goal of this study was to explore the reliability of this thresholddischarge rate. The analyses presented herein extend the previous analysis that included onlytrials with no stop signal by determining whether a critical threshold of discharge rate canpredict saccade initiation in trials when the stop signal was presented. Movement-relatedneurons, such as the example shown in Figure 5, generally had greater activity on non-canceledand no stop signal trials than on canceled trials.
If the fixed trigger threshold hypothesis is correct, then the probability of producing a saccadeon a stop signal trial, i.e., the fraction of non-canceled trials, must correspond to the probabilityof activity exceeding the fixed threshold. This implication of the hypothesis motivates ananalysis similar to that performed in studies of sensory discrimination (Britten et al., 1992;Luna et al., 2005) of comparing a neurometric function derived from some measure of neuralactivity with the psychometric function. Applying the analysis illustrated in Figure 3, we foundthat in stop signal trials, the probability of the activity of FEF movement neurons exceeding acriterion discharge rate increased with stop signal delay (Figure 6A). This occurs because ofthe characteristic growth of activity of movement-related neurons in FEF (Figure 1). For agiven stop signal delay, the level of peak activity on each stop signal trial was progressivelymore likely to be less than successively high criterion levels. Figure 6B shows that for thisrepresentative movement neuron, one criterion discharge rate existed for which at each stopsignal delay, the fraction of trials with activity exceeding the criterion corresponded to thefraction of non-canceled trials produced at that stop signal delay. In other words, a particulardischarge rate defined a threshold criterion that provided the best fit between the neurometricand behavioral inhibition functions. This will be referred to as the neurometric threshold.
The critical step of this analysis was to determine whether any particular discharge rate criterionproduced a neurometric function that fit the inhibition function. The neurometric threshold wasdefined as the criterion discharge rate that minimized the least squares fit between theneurometric and psychometric functions. Figure 6B (cf. Fig. 3B) demonstrates the goodagreement between the neurometric and psychometric functions for a threshold of 117 sp/secfor this respective neuron. The goodness of fit was evidenced by a Pearson correlation of r =0.9997, computed by pairing data points at each stop signal delay from the neurometric andpsychometric function.
We determined the Pearson correlation coefficient for neurometric-psychometric functions forall 48 FEF movements, as a measure of goodness-of-fit between the two functions. Figure 6Cshows the distribution to be clearly skewed towards values close to 1. The median value was0.92. The correlation was significant for only a third of neurons (16/48), but this reflects thesmall sample of stop signal delays providing estimates for each neuron rather than problemswith the goodness-of-fit. Unfortunately, it was necessary to use fewer stop signal delays toobtain enough trials at each delay. For example, the Pearson correlation in Figure 6B is closeto 1.0 but is based on only three available data points. Nevertheless, the quality of this fit candistinguish neurons with a threshold from those without (see Figure 13 and the companionpaper). In summary, for most individual FEF movement neurons, a discharge rate could bedetermined that provided a unique correspondence between the functionally definedneurometric function and the behavioral inhibition function.
Brown et al. Page 7
Exp Brain Res. Author manuscript; available in PMC 2009 September 22.
NIH
-PA Author Manuscript
NIH
-PA Author Manuscript
NIH
-PA Author Manuscript

Another clear implication of the fixed threshold hypothesis is that the threshold must beexceeded when saccade is produced on no stop signal or non-canceled trials but not when thesaccade is withheld in canceled trials. Figure 7A shows the distributions of maximalpresaccadic discharge rates in all non-canceled and canceled stop signal trials and in all trialswith no stop signal for this single movement-related neuron. As reported previously (Hanes etal. 1998), across the population, the means of the maximum activity on canceled trials for eachcell were less than the means of the maximum activity on non-canceled (t(47) = 6.77 , p <10−7) and on no stop signal trials (t(47) = 6.56, p < 10−7) for each cell. This implication suggestsanother straightforward estimate of the trigger threshold that can be obtained by determiningthe discharge rate that optimally discriminated between canceled and non-canceled trials, i.e.minimized the false classification rate of saccade vs. no-saccade given the peak neural activity.This will be referred to as the optimal discriminant threshold.
The cyan curve in Figure 7A shows the probability that the observed behavior (saccade initiatedor not) was correctly classified as a function of criterion discharge rate (cf. Figure 4). Note thatthe predictive accuracy for extreme discharge rate criteria is chance which is ∼50% becauseroughly half of the stop signal trials are non-canceled. For example, with a criterion of 0 sp/sec the activity on all trials exceeds the criterion and so should produce a saccade which iswhat happens by chance on approximately half of the trials. A maximal classification accuracyof 78% was obtained at 76 spike/sec. It should be noted that the discrimination accuracyfunction for this neuron had a broad peak, so the true threshold value could lie anywhere withinthis plateau. In fact, a threshold of 103 sp/sec, which agrees more closely with the neurometricthreshold, yields a predictive accuracy of 77%.
Figure 7B shows the predictive accuracy distribution based on the optimal discriminantthreshold for all 48 FEF movement neurons. The values scatter broadly over a range from 0.5−1 and the median value is 0.75. Clearly, the activity of single movement-related neurons didnot predict movement initiation with perfect accuracy, and stronger predictions have beenfound in superior colliculus cells (Pare and Hanes, 2003). This is due in part to the well-knownvariability in discharge rates of single neurons, and we show below that combining activityacross multiple neurons leads to improved reliability of the relation between fit movement-related activity and saccade initiation. It must also be noted that the activity of other classes ofneurons in FEF and other structures relate to saccade initiation much less than these FEFmovement-related neurons (see Figure 13 and companion paper).
The validity of the optimal discriminant threshold may be tested by the area under the receiveroperating characteristic (ROC) curve. The ROC curve plots the false positive rate against thetrue positive rate as a function of threshold. The area under the ROC curve provides a measureof how discriminable two distributions are. An ROC area value of 1.0 indicates perfectdiscriminability, and a value of 0.5 corresponds to chance. The measure is independent of theparticular choice of thereshold, which allows it to provide a validity test that is independent ofthe particular value of optimal threshold. A histogram of the area under the ROC curve for thepopulation of 48 FEF movement neurons is shown in Figure 7C. Each ROC curve calculationwas derived from data as shown in Figure 7A. The average ROC curve area was significantlygreater than the chance value of 0.5 (t(47) = 8.36, p < 0.00001). In the companion paper, weshow that the area under the ROC curve was significantly greater for FEF than SEF movementcells.
Comparison of Threshold ValuesThe best-fit neurometric and optimal discriminant thresholds were compared across the FEFmovement neuron population. The neurometric and discriminant thresholds found for eachneuron generally agreed (Figure 8), except for three obvious outliers. Further investigationrevealed that each of these outliers exhibited no significant difference between the distributions
Brown et al. Page 8
Exp Brain Res. Author manuscript; available in PMC 2009 September 22.
NIH
-PA Author Manuscript
NIH
-PA Author Manuscript
NIH
-PA Author Manuscript

of maximum presaccadic activity on canceled and non-canceled trials (t-test, all p’s > 0.05).This violates a key assumption of the optimal discriminant threshold (Figure 4) and thereforemakes the test invalid. When we excluded neurons with no significant difference betweencanceled and non-canceled maximum activity, the correlation between the two thresholdmeasures was significant (r = 0.66, t(25) = 4.44, p < 0.001), and the slope of the regressionpassing through the origin did not differ from unity (t(26) = 0.32, p = 0.75). Thus, FEF neuronsthat show significant activity differences between canceled and non-canceled saccades alsoshow strong agreement between the thresholds obtained by the two different methods. Thisprovides converging evidence for both the validity of the concept of a movement initiationthreshold and the near-optimality of the best-fit threshold approach.
Timing of threshold crossing for individual trialThe hypothesis of a fixed threshold trigger of saccade initiation has an implication about timing.If a threshold-crossing triggers a movement, that crossing must happen only once and not tooearly before the movement is initiated. To this point we have established that whether FEFmovement neuron discharge rate reaches a particular value predicts if a saccade is initiated.We will now investigate if the time when the activity first exceeds that threshold predicts whena saccade will be initiated. Figure 9 plots the time when the discharge rate first exceeded theoptimal discriminant threshold for all trials of all FEF movement-related neurons. For non-canceled trials (Figure 9A), this event typically occurred most commonly 20 ms prior to saccadeinitiation, but the distribution spreads broadly around this value. Such dispersion is notunexpected given the well-known variability of neuron discharges, but it should be noted thatthis temporal relationship does not occur for all neurons in visuomotor structures (see Figure13 and accompanying paper). The vast majority of values (75%) fell into the range of 100 msbefore saccade onset and 70% were within 50 ms of saccade initiation. The modal time ofthreshold crossing was around 20 ms prior to saccade onset, in agreement with earlier results(Scudder et al. 2002). Figure 9B shows that on canceled trials measure the peak of activity onsingle trials exceeded threshold occasionally, though much less often and less predictably thanin non-canceled trials. This is of course due to the lower level of activity on canceled trials.
Population analysis of multiple trials from individual neuronsThe results thus far demonstrate that the activity of individual FEF movement neurons accountsreasonably well for whether and when a saccade will be initiated. However, the predictionsalso showed limitations on both accounts. This is not surprising, because the analysis was basedon a single trial from individual noisy neurons. However, it is well known that a population ofneurons in a network including FEF, SC, thalamus, basal ganglia, cerebellum and brainstemproduces saccades and the activity of pools of neurons is more reliable than that of singleneurons. Therefore, we extended the analysis to determine whether a threshold derived fromactivity averaged from pools of trials and of neurons was more reliable. If so, the results couldindicate how many neurons are sufficient to specify whether and when a saccade will beproduced. The size of the pool sufficient to account for saccade initiation provides an importantperspective on the size of the pool necessary to initiate a saccade. This analysis is similar tothat employed by Bichot et al. (2001) to investigate the relation of activity of visuallyresponsive neurons in FEF to saccade target selection during visual search (see also: Krauzlisand Dill 2002; Shadlen et al. 1996; Tolhurst et al. 1983).
We first tested whether combining multiple trials from an individual neuron yielded greaterpredictive accuracy for the threshold. We examined trial pools ranging from 1 to 50. For agiven trial pool size, we averaged the randomly sampled, individual spike density functions,thus constructing a single virtual canceled and non-canceled trial. We repeated this procedureand created a distribution of virtual pooled trials. We then determined the optimal discriminantthreshold between the distributions of activity on pooled canceled and non-canceled trials. As
Brown et al. Page 9
Exp Brain Res. Author manuscript; available in PMC 2009 September 22.
NIH
-PA Author Manuscript
NIH
-PA Author Manuscript
NIH
-PA Author Manuscript

the size of the pool increased, the variance of these distributions decreased, leading to greaterresolution between them. Figure 10A shows that the predictive accuracy of the discriminantthreshold increases as a function of pool size. For example, the cell in Figure 5 reached 95%accuracy with seven trials pooled and 97 % accuracy with fifty trials pooled. The distributionof asymptotic accuracy is shown in Figure 10B. As a whole, the cells seemed to reachasymptotic accuracy (92%) with 20 trials pooled within a cell, which was just short of the 93%accuracy with 50 trials pooled. However, while most neurons yield an asymptote over 90%accuracy, a few neurons did not carry sufficient information to predict reliably saccadeinitiation, regardless of how many trials were pooled. The outliers in Figure 8 generallyprovided less reliable predictive accuracy.
To examine why some cells provided better predictive accuracy than others, we arbitrarilydivided the neurons into two subgroups, based on their average accuracy with 40 to 50 trialspooled: a group of “ low predictor” neurons (9/48; 19%) that reach asymptotic fraction correctlevels of less than 0.84 (one standard deviation below the mean accuracy) and a larger groupof “high predictor” neurons (39/48; 81%) that reach higher fraction correct levels. The averagefraction of correctly predicted trials is 0.97 for the high-predictors and 0.76 for the lowpredictors. We sought to determine whether any other characteristic distinguished these twogroups of neurons. The FEF movement neurons change their activity on canceled trials, whenthe monkey was able to suppress the planned saccade. This time was termed the cancellationtime (Hanes et al., 1998). The cancellation times of the low predictor group were notsignificantly later than the ones of the high predictor group (p = 0.36). Sample size also didnot explain the difference. There was no significant difference in either the total number ofstop signal trials (p = 0.08) or the smaller number of trials of either canceled or non-canceledtrials (p = 0.26). However, the activity profiles of the two groups differed. The low-predictionneurons showed a stronger visual response, while the saccade-related burst was identical. Thissuggests that the lower prediction results from the stronger visual bursts of these neurons, whichlead to maximum activity distributions of canceled trials that show more overlap with thedistribution of non-canceled trials. This result emphasizes the point that movement-relatedneurons are so classified because they respond much more strongly in relation to movementinitiation than to visual signals, but this does not necessarily imply the complete absence of avisual response.
Population analysis of multiple trials from multiple neuronsIn addition to combining multiple trials from the same neuron, we examined the predictivepower of combining multiple trials from different neurons. Figure 11 shows the predictiveaccuracy for activity recorded in stop trials and in no-stop signal trials, using the discriminantthreshold for pools derived from the population of all movement neurons. The error barsrepresent the standard deviation from 10 random samples. Predictive accuracy reached 95%in no stop signal trials with as few as six neurons and 100% accuracy with 10 neurons. Forstop signal trials, the predictive accuracy asymptotically approached 95% accuracy as the poolsize approached 50. The reason for the greater predictive accuracy on no-stop signal trials isthat the maximum activity across the population on these trials measures on average greaterthan the maximum activity on non-canceled trials (Figure 5B). Given this fact, the greateraverage maximum activity on no-stop signal trials is more likely to exceed the threshold thanis the maximum activity on non-canceled trials. Furthermore, no stop signal prediction errorsconsisted entirely of a failure to exceed the threshold, since no stop signal trials resulted in asaccade on effectively all trials. Thus, the maximum activity for these trials essentially alwaysexceeded the threshold for pools of at least 10 trials pooled across neurons, and the thresholdderived from stop trials (canceled and non-canceled) applies as well to no-signal trials.
Brown et al. Page 10
Exp Brain Res. Author manuscript; available in PMC 2009 September 22.
NIH
-PA Author Manuscript
NIH
-PA Author Manuscript
NIH
-PA Author Manuscript

Pooling across neurons (Figure 11) allows the activation derived from the population to exceedthe limitations of the less-predictive individual neurons (Figure 10A). Notably, the predictiveaccuracy for stop signal trials pooled across neurons did not seem to reach an asymptote, evenat a pool size of 50. It may be that pooling more trials across neurons would lead asymptoticallyto 100% accuracy on stop signal trials as well as no-signal trials.
Timing of threshold crossing for pooled activationThe reliability of accounting for saccade initiation improved if the activity was pooled amongmultiple FEF movement-related neurons. These data also permit an analysis of the time ofthreshold crossing. Recall, that a trigger event should be a unique event preceding the saccadeby a period corresponding to the ballistic period. Spike density functions were sampled 10,000times among pooled activity of the 48 movement-related neurons for trials with no stop signaland for stop signal trials. The optimal discriminant threshold was determined for stop signaltrials only for each sample and then the time when the spike density function first exceededthe threshold was measured. The distributions of these times for the different trial types areshown in Figure 12. Several features of these plots should be noted. First, the distributions areunimodal with peaks around −20 to −30 ms before saccade initiation. The no-signal trials peakearlier because as noted above, the activity tended to be slightly greater on no signal than onnon-cancelled trials, and therefore the activity exceeds the threshold earlier. Second, poolingactivity across neurons produces much more reliable estimates of threshold crossing time(compare Figure 9 with Figure 12). The majority of values (75%) occur within 100 ms ofsaccade initiation, and the earliest time is 50 ms
In the pooled activation a small number (15%) of predicted saccade initiations were measuredduring canceled trials (Figure 12B). This is to be expected since even pooling 50 trials acrossneurons does not result in a perfect predictive power. The distribution of the times of apparentthreshold crossing in canceled trials was somewhat tighter than the distribution derived fromindividual trials (Figure 9B). The times are clustered between 240 to 400 ms (median: 329 ms),a period corresponding to the response times of the monkeys. This change results from thesmoothing of the neurons’ activity through the pooling. On a given trial with a single neuronsactivity, the variance in the activity is larger than the variance of the activity with 50 trialsaveraged together. Therefore, the activity is more likely to exceed the threshold due to noise,and this can happen at any point in the trial. So the time when it first happens, which is whatis shown in the distribution, is likely to be early in the trial. In contrast, when 50 trials areaveraged, there is less noise and so the activity is less likely to spuriously exceed threshold.Now, the threshold crossing is most likely around the time when the total neuron activity isclose to the threshold and most saccades are initiated.
Threshold analysis applied to visual neuronsHanes et al. (1998) showed that while movement neuron activity modulated when saccadeswere canceled early enough to contribute to the control of gaze, visual neurons did not. Toexplore further whether the activity of visual neurons contributes to saccade initiation, andverify the sensitivity of this analytical approach we applied the same analysis to a set of visualneurons from two monkeys. Figure 13 shows results for a representative neuron in FEF witha pronounced visual response but no presaccadic movement-related modulation. Themodulation observed during the saccade is due to the visual environment being swept acrossthe receptive field by the saccade; the peak activity is related to the timing of the target ratherthan the saccade (Figure 13A). The distribution of activity from canceled trials was higher thanthose from non-canceled and no stop signal trials (Figure 13B). That is opposite the FEFmovement neurons (compare Figure 7A). This was analyzed for the population of neuronsusing the optimal discriminant analysis. The maximum fraction of correct trials was 51%,corresponding to chance, at a discharge rate of 196 sp/sec, and a minimum of 17% was observed
Brown et al. Page 11
Exp Brain Res. Author manuscript; available in PMC 2009 September 22.
NIH
-PA Author Manuscript
NIH
-PA Author Manuscript
NIH
-PA Author Manuscript

at a discharge rate of 88 sp/sec (Figure 13B). In other words, discharge rates less than 88 sp/sec were more likely to occur when saccades were initiated while discharge rates greater than88 sp/sec were more likely to occur when saccades were canceled. This is the opposite of whatwould be predicted if saccades occur when neural activity exceeds a threshold. The activity ofmost visual neurons, though, was not predictive of whether a saccade would be initiated; themean value of the fractions of correctly predicted trial outcomes from the optimal discriminantthresholds of all visual neurons was 0.52 (Figure 13C); for comparison, the value for thepresaccadic movement neurons was 0.75.
This result sharply contrasts with the results in FEF and was confirmed through the analysisof the neurometric threshold. The neurometric function derived from the activity of therepresentative visual neuron was almost the perfect inverse of countermanding performance(Pearson correlation = −0.99, t = −8.69, p < 0.02) (Figure 13D), but this is the only visualneuron for which a statistically significant correlation, whether positive or negative, wasobtained. The distribution of Pearson correlations between best-fit neurometric functions forvisual neurons and inhibition functions had a median value of −0.83 (Figure 13E), which isthe opposite of the distribution of the movement neurons (compare Figure 7B). The inverserelationship between neurometric and inhibition functions was due to several trivial factors.First, peak activity in non-canceled trials is measured in the interval immediately precedingthe saccade. Second, the visual response tends to decay by the time the saccade is initiated, soit is lower when measured just before the saccade in non-canceled trials. Third, more trials arenon-canceled at longer SSDs. Together, this means that in visual cells, the measured probabilityof maximum activity exceeding a threshold tends to decrease with SSD. To sum up, unlike theactivity of movement-related neurons, the activity of visual neurons did not predict saccadeinitiation.
DISCUSSIONThe results of this study demonstrated that whether and when saccades are initiated in a stopsignal, countermanding task was predicted by whether and when the discharge rate ofmovement-related neurons but not of visual neurons in the frontal eye field (FEF) reached aparticular threshold. The reliability of this relationship improved by averaging the activity of∼10–20 trials or neurons. These findings have specific consequences for our understanding ofthe oculomotor system and demonstrate a method of determining whether any population ofneurons contributes to the control of movement initiation.
Threshold as a population phenomenonThe discharge of individual FEF movement related neurons relates reasonably closely to thetime of saccade initiation, but pooling trials within or across neurons increased the reliabilityof this relationship. In other words, FEF movement-related neurons specify not only whethera saccade will be initiated, but also when it will be initiated. The power of single FEF neuronsto predict saccade initiation time was significantly higher than by chance but not perfect. Thecombined activity of ∼20 movement-related neurons in FEF reached its threshold most oftenin the 20 ms before saccade initiation. This is the time when events in the brainstem reach apoint of no return in the inhibition of omnipause neurons and activation of burst neurons. Thethreshold is therefore the product of the simultaneous activity within a network of neurons.This result complements and extends a similar analysis of the activity of visual neurons in FEFduring visual search (Bichot et al. 2001). It might be argued that our analysis of pooling trialsacross neurons is limited by the fact that the neurons were recorded in separate sessions ratherthan simultaneously so our values underestimate the actual number because of noise correlationamong neurons. Simultaneous recording would provide the most direct test of how manyneurons are necessary to predict saccade initiation. Nonetheless, our results still show that both
Brown et al. Page 12
Exp Brain Res. Author manuscript; available in PMC 2009 September 22.
NIH
-PA Author Manuscript
NIH
-PA Author Manuscript
NIH
-PA Author Manuscript

individual neurons and the population as a whole reach a particular threshold of activity toinitiate a saccade, and that the timing of the threshold crossing predicts when as well as whethera saccade will be initiated.
The finding that a few (∼101) neurons are sufficient to predict behavior contrasts with theobservation that many neurons (∼105–106) within the oculomotor network encompassingcortical areas, superior colliculus, basal ganglia, thalamus, the brainstem and most likelycerebellum are necessary to generate a saccade. Since no single neuron is necessary to producea movement, neurons within and across structures contributing to a given movement seem tohave coordinated activity so that each neuron reaches its idiosyncratic threshold at close to thesame time. One hypothesis for how this may be achieved is through rapid interactions thatcoordinate the growth of movement activation between oculomotor structures such thatneurons lagging behind are accelerated and those speeding ahead are decelerated. Currentevidence already demonstrates that the FEF in opposite hemispheres (Schlag et al. 1998) orthe FEF and the SC (Schlag-Rey et al. 1992; Sommer and Wurtz 2000) engage in pronouncedinteractions during saccade preparation and execution. Transmission times between the FEFand the SC are on the order of 2–3 ms (Sommer and Wurtz 2004), easily fast enough to allowinfluence within the 80–100 ms interval of movement preparation. Another hypothesis (whichis not mutually exclusive) is that a neuromodulatory system may influence the state ofactivation of the whole system so that on some trials all neurons are more or less active together(Clayton et al., 2004; Aston-Jones and Cohen, 2005). Consistent with this hypothesis, recentwork has shown that norepinephrine may modulate synchronized activity in neural oscillators(Viemari and Ramirez, 2006).
Relevance for general models of response timeThe evidence that response times in choice tasks are the outcome of at least two successivestages is incontrovertible (reviewed by Sternberg 2001; see also Schall 2003). The first encodesand categorizes stimuli, and the second prepares and initiates responses. Both stages occupyintervals that can be more or less variable depending on stimulus conditions (clarity and numberof potential targets) and response complexity (compatibility of stimulus-response mapping andnumber of alternatives). Hence, overt response time is some combination of these two randomintervals. Unfortunately, determining the respective contributions of mixtures of stochasticprocesses to overall response time is problematic using only overt measures (e.g., Dzhafarov1993; Luce 1986; Marley and Colonius 1992; Ratcliff et al. 1995; Townsend 1976).
Neurophysiology with behaving monkeys provides a solution to this dilemma if particularcognitive operations can be identified with distinct populations of neurons (Schall 2004). Theactivity of neurons in monkeys performing response time tasks can reveal the durations ofsuccessive stages. Sequential sampling models explain the variability in choice response timeas arising from variability in a diffusion or race process that is driven by the quality of evidencederived from the stimuli (Usher and McClelland, 2001; Ratcliff and Smith, 2004; Smith andRatcliff, 2004; Bogacz et al., 2006). Previous work has characterized the duration of theencoding and categorization stage (Thompson et al., 1996; Sato et al., 2001; Cook andMaunsell, 2002; Krauzlis and Dill, 2002; McPeek and Keller, 2002; Roitman and Shadlen,2002). Other work has identified the growth of activity of movement-related neurons in theFEF and superior colliculus with the diffusion process described by sequential sampling models(Hanes and Schall, 1996; Ratcliff et al., 2003; Ratcliff, 2006). The variability of response timein this stop signal task can be accounted for almost entirely by the movement-related activitybecause the stimulus encoding time is so brief due to the presence of a single, suprathresholdtarget stimulus.
This collection of empirical and theoretical results suggests to us the hypothesis that themodulation of visually-responsive sensorimotor neurons maps onto stimulus encoding and
Brown et al. Page 13
Exp Brain Res. Author manuscript; available in PMC 2009 September 22.
NIH
-PA Author Manuscript
NIH
-PA Author Manuscript
NIH
-PA Author Manuscript
categorization while the modulation of movement-related neurons maps onto responsepreparation. This hypothesis is consistent with several recent neurophysiological results. First,if encoding is made more difficult, then variability in the time to encode and categorize stimuliwill contribute more to variability in response time (Sato et al., 2001; Roitman and Shadlen,2002); however, the variability of response preparation remains. In fact, new research using avisual search for a target that was easier or harder to locate has found that the beginning of thegrowth of movement-related activity is delayed by the amount of time needed to encode andcategorize the search array (Woodman et al., 2008). Second, stochastic variability in responsepreparation provides a mechanism by which speeded errors can be produced in choice taskseven though the sensory representation is correct as evidenced by correction of the errors earlierthan sensory or error-monitoring feedback would permit (Murthy et al., 2001; Holroyd et al.,2005; Murthy et al., 2007). Accordingly, the particular contribution of response preparation toresponse time also provides a means by which executive control can influence the trade-offbetween speed and accuracy (Stuphorn and Schall, 2006). Finally, the flexible relationshipbetween sensory processing and response preparation that is necessary for arbitrary stimulus-response mapping affords an explanation for how transformations within and the transmissionbetween stages can appear to be continuous or discrete (Bichot et al., 2001; Sternberg, 2001;Woodman et al., 2008).
ConclusionThe present study in combination with an earlier study using the countermanding task (Haneset al. 1998) demonstrates the usefulness of the countermanding paradigm in determiningwhether neurons or ensembles of neurons control movement initiation. The fact that visualneurons in FEF fail to provide a satisfactory fit to the threshold model and also fail to respondto the countermanding command in sufficient time to drive saccade interruption verifies thatthis approach can distinguish between neurons that are or are not involved in movementinitiation. Accordingly, the stop signal paradigm can be used to explore other areas. Forexample, this approach can contribute to the debate about the role of parietal cortex inproducing saccades (Andersen and Buneo 2002; Colby and Goldberg 1999). In the companionpaper we investigated the hypothesis that neurons in the supplementary eye field with saccade-related activity participate in the process of saccade initiation (Stuphorn et al. 2007). We foundevidence that this is not the case at least for visually guided saccades.
AcknowledgmentsWe are grateful to A. Evans, J. Jewett, K. Reis and C. Wiley for assistance preparing the manuscript. This work wassupported by Robin and Richard Patton through the E. Bronson Ingram Chair of Neuroscience and grants RO1-MH55806, P30-EY08126, P30-HD015052.
ReferencesAston-Jones G, Cohen JD. An integrative theory of locus coeruleus-norepinephrine function: adaptive
gain and optimal performance. Annu Rev Neurosci 2005;28:403–450. [PubMed: 16022602]Bichot NP, Thompson KG, Chenchal Rao S, Schall JD. Reliability of macaque frontal eye field neurons
signaling saccade targets during visual search. J Neurosci 2001;21:713–725. [PubMed: 11160450]Bogacz R, Brown E, Moehlis J, Holmes P, Cohen JD. The physics of optimal decision making: a formal
analysis of models of performance in two-alternative forced-choice tasks. Psychol Rev 2006;113:700–765. [PubMed: 17014301]
Braitenberg, V.; Schüz, A. Anatomy of the Cortex: Statistics and Geometry. Berlin: Springer-Verlag;1991.
Britten KH, Shadlen MN, Newsome WT, Movshon JA. The analysis of visual motion: a comparison ofneuronal and psychophysical performance. J Neurosci 1992;12:4745–4765. [PubMed: 1464765]
Brown et al. Page 14
Exp Brain Res. Author manuscript; available in PMC 2009 September 22.
NIH
-PA Author Manuscript
NIH
-PA Author Manuscript
NIH
-PA Author Manuscript

Clayton EC, Rajkowski J, Cohen JD, Aston-Jones G. Phasic activation of monkey locus ceruleus neuronsby simple decisions in a forced-choice task. J Neurosci 2004;24:9914–9920. [PubMed: 15525776]
Cook EP, Maunsell JH. Dynamics of neuronal responses in macaque MT and VIP during motiondetection. Nat Neurosci 2002;5:985–994. [PubMed: 12244324]
Fisher RA. The Use of Multiple Measurements in Taxonomic Problems. Annals of Eugenics 1936;7:179–188.
Hanes DP, Schall JD. Countermanding saccades in macaque. Vis Neurosci 1995;12:929–937. [PubMed:8924416]
Hanes DP, Schall JD. Neural control of voluntary movement initiation. Science 1996;274:427–430.[PubMed: 8832893]
Hanes DP, Patterson WF 2nd, Schall JD. Role of frontal eye fields in countermanding saccades: visual,movement, and fixation activity. J Neurophysiol 1998;79:817–834. [PubMed: 9463444]
Herculano-Houzel S, Collins CE, Wong P, Kaas JH. Cellular scaling rules for primate brains. Proc NatlAcad Sci U S A 2007;104:3562–3567. [PubMed: 17360682]
Hikosaka O, Takikawa Y, Kawagoe R. Role of the basal ganglia in the control of purposive saccadic eyemovements. Physiol Rev 2000;80:953–978. [PubMed: 10893428]
Holroyd CB, Yeung N, Coles MG, Cohen JD. A mechanism for error detection in speeded response timetasks. J Exp Psychol Gen 2005;134:163–191. [PubMed: 15869344]
Krauzlis R, Dill N. Neural correlates of target choice for pursuit and saccades in the primate superiorcolliculus. Neuron 2002;35:355–363. [PubMed: 12160752]
Logan GD, Cowan WB. On the ability to inhibit thought and action: A theory of an act of control.Psychological Review 1984;91:295–327.
Luna R, Hernandez A, Brody CD, Romo R. Neural codes for perceptual discrimination in primarysomatosensory cortex. Nat Neurosci 2005;8:1210–1219. [PubMed: 16056223]
McPeek RM, Keller EL. Superior colliculus activity related to concurrent processing of saccade goals ina visual search task. J Neurophysiol 2002;87:1805–1815. [PubMed: 11929902]
Murthy A, Thompson KG, Schall JD. Dynamic dissociation of visual selection from saccadeprogramming in frontal eye field. J Neurophysiol 2001;86:2634–2637. [PubMed: 11698551]
Murthy A, Ray S, Shorter SM, Priddy EG, Schall JD, Thompson KG. Frontal eye field contributions torapid corrective saccades. J Neurophysiol 2007;97:1457–1469. [PubMed: 17135479]
Pare M, Hanes DP. Controlled movement processing: superior colliculus activity associated withcountermanded saccades. J Neurosci 2003;23:6480–6489. [PubMed: 12878689]
Ratcliff R. Modeling response signal and response time data. Cognit Psychol 2006;53:195–237.[PubMed: 16890214]
Ratcliff R, Smith PL. A comparison of sequential sampling models for two-choice reaction time. PsycholRev 2004;111:333–367. [PubMed: 15065913]
Ratcliff R, Cherian A, Segraves M. A comparison of macaque behavior and superior colliculus neuronalactivity to predictions from models of two-choice decisions. J Neurophysiol 2003;90:1392–1407.[PubMed: 12761282]
Rockel AJ, Hiorns RW, Powell TP. The basic uniformity in structure of the neocortex. Brain1980;103:221–244. [PubMed: 6772266]
Roitman JD, Shadlen MN. Response of neurons in the lateral intraparietal area during a combined visualdiscrimination reaction time task. J Neurosci 2002;22:9475–9489. [PubMed: 12417672]
Sato T, Murthy A, Thompson KG, Schall JD. Search efficiency but not response interference affectsvisual selection in frontal eye field. Neuron 2001;30:583–591. [PubMed: 11395016]
Schall JD, Stuphorn V, Brown JW. Monitoring and Control of Action by the Frontal Lobes. Neuron2002;36:309–322. [PubMed: 12383784]
Smith PL, Ratcliff R. Psychology and neurobiology of simple decisions. Trends Neurosci 2004;27:161–168. [PubMed: 15036882]
Sternberg S. Separate modifiability, mental modules, and the use of pure and composite measures toreveal them. Acta Psychol (Amst) 2001;106:147–246. [PubMed: 11256336]
Stuphorn V, Schall JD. Executive control of countermanding saccades by the supplementary eye field.Nat Neurosci 2006;9:925–931. [PubMed: 16732274]
Brown et al. Page 15
Exp Brain Res. Author manuscript; available in PMC 2009 September 22.
NIH
-PA Author Manuscript
NIH
-PA Author Manuscript
NIH
-PA Author Manuscript
Thompson KG, Hanes DP, Bichot NP, Schall JD. Perceptual and motor processing stages identified inthe activity of macaque frontal eye field neurons during visual search. J Neurophysiol 1996;76:4040–4055. [PubMed: 8985899]
Usher M, McClelland JL. The time course of perceptual choice: the leaky, competing accumulator model.Psychological Review 2001;108:550–592. [PubMed: 11488378]
Viemari JC, Ramirez JM. Norepinephrine differentially modulates different types of respiratorypacemaker and nonpacemaker neurons. J Neurophysiol 2006;95:2070–2082. [PubMed: 16394066]
Woodman GF, Kang MS, Thompson K, Schall JD. The effect of visual search efficiency on responsepreparation: neurophysiological evidence for discrete flow. Psychol Sci 2008;19:128–136. [PubMed:18271860]
Brown et al. Page 16
Exp Brain Res. Author manuscript; available in PMC 2009 September 22.
NIH
-PA Author Manuscript
NIH
-PA Author Manuscript
NIH
-PA Author Manuscript
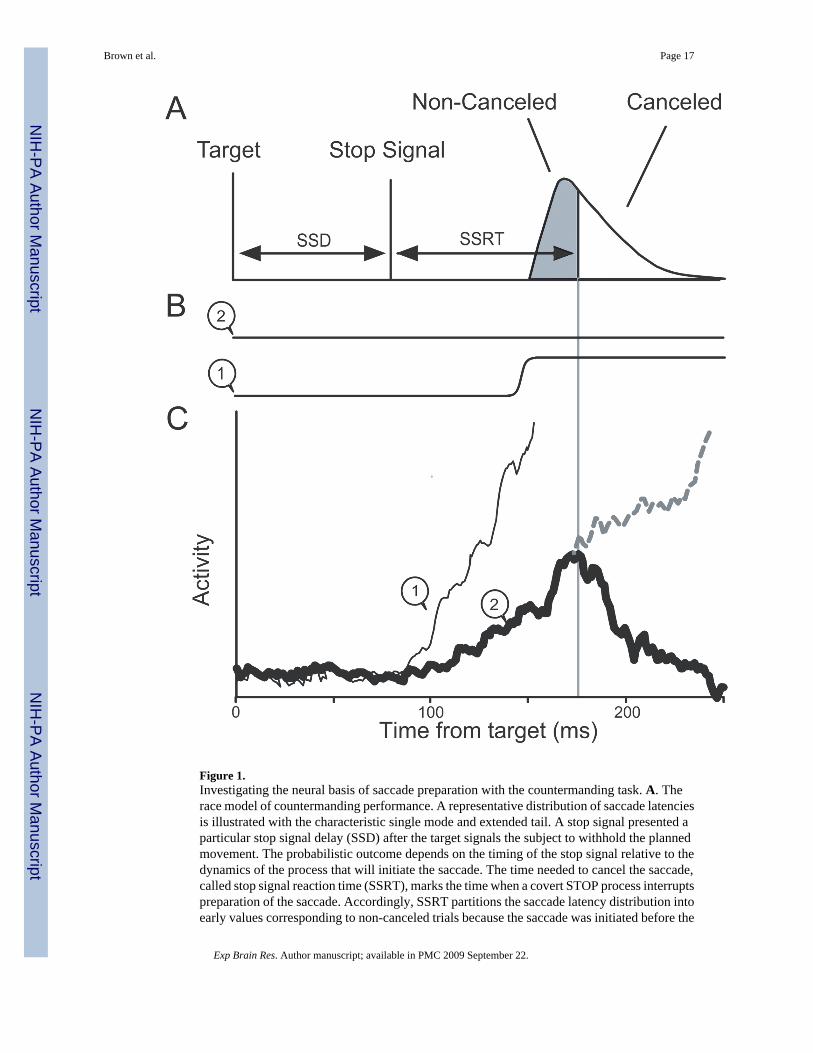
Figure 1.Investigating the neural basis of saccade preparation with the countermanding task. A. Therace model of countermanding performance. A representative distribution of saccade latenciesis illustrated with the characteristic single mode and extended tail. A stop signal presented aparticular stop signal delay (SSD) after the target signals the subject to withhold the plannedmovement. The probabilistic outcome depends on the timing of the stop signal relative to thedynamics of the process that will initiate the saccade. The time needed to cancel the saccade,called stop signal reaction time (SSRT), marks the time when a covert STOP process interruptspreparation of the saccade. Accordingly, SSRT partitions the saccade latency distribution intoearly values corresponding to non-canceled trials because the saccade was initiated before the
Brown et al. Page 17
Exp Brain Res. Author manuscript; available in PMC 2009 September 22.
NIH
-PA Author Manuscript
NIH
-PA Author Manuscript
NIH
-PA Author Manuscript

STOP process could exert influence and later values corresponding to canceled trials becausethe saccade was initiated late enough to allow the STOP process to interrupt preparation. B.Eye position for canceled (1) and noncanceled (2) trials. C. Activity of a representative FEFmovement neuron in the different types of trials. Saccades are initiated when the activity ofthese neurons reaches a fixed threshold. If the movement-related activity increases quickly toreach the threshold before the SSRT, a non-canceled trial results (1, thin line). If the activityincreases slower so that it would reach the threshold later (2, dashed line), then the STOPprocess invoked by the stop signal interrupts the growth of activity (thick solid line), preventingit from reaching the threshold so that the saccade is not initiated.
Brown et al. Page 18
Exp Brain Res. Author manuscript; available in PMC 2009 September 22.
NIH
-PA Author Manuscript
NIH
-PA Author Manuscript
NIH
-PA Author Manuscript

Figure 2.Countermanding task. At the beginning of each trial, monkeys fixate a central spot until itdisappears and a peripheral target appears. On most trials monkeys are reinforced for shiftinggaze to the target. On less than half of trials at random the fixation spot reappears after a variablestop signal delay. Monkeys are reinforced for canceling the planned saccade to the peripheraltarget and maintaining fixation. On some trials, though, monkeys shift gaze in error; these non-canceled responses are not reinforced.
Brown et al. Page 19
Exp Brain Res. Author manuscript; available in PMC 2009 September 22.
NIH
-PA Author Manuscript
NIH
-PA Author Manuscript
NIH
-PA Author Manuscript

Figure 3.Neurometric threshold. A. Saccades are more likely to be canceled if the stop signal appearsafter a shorter delay (left) than after a longer delay (right) because preparation progressesthrough time. Thin black line plots activity on trials with no stop signal. Red lines plot activityon trials with a stop signal and the saccade was canceled. One can measure the fraction of trialswith and without a stop signal on which discharge rate exceeds some criterion. The fraction of28 trials that do not exceed a criterion discharge rate decreases as the criterion increases. Threerepresentative criteria are illustrated, very low (1), intermediate (2) and very high (3) (lightblue lines). Gray fill indicates duration of SSRT within which the activity is modulated oncanceled trials. B. The probability that the build-up activity exceeds a criterion discharge rate
Brown et al. Page 20
Exp Brain Res. Author manuscript; available in PMC 2009 September 22.
NIH
-PA Author Manuscript
NIH
-PA Author Manuscript
NIH
-PA Author Manuscript

is plotted as a function of the criterion for short (thin) and long (thick) stop signal delays. Twotrends are clear. First, obviously, the probability of the discharge rate exceeding the criteriondecreases as the criterion increases. Second, because presaccadic movement-related activityincreases with time, the probability of the discharge rate exceeding the criterion increases withSSD C. Inhibition function (solid points) plots probability of not canceling the saccade as afunction of stop signal delay. If saccades are initiated when the activity of movement-relatedneurons reaches a threshold, then the probability of producing a saccade on a stop signal trialshould equal the probability that the activity reaches a threshold. In other words, if a neuroncontributes to controlling saccade initiation, then a neurometric function should exist thatcorresponds to the psychometric inhibition function. Neurometric functions for low (1),intermediate (2) and high (3) criterion discharge rates are plotted. Criterion discharge rates thatare too low (1) result in a neurometric function falling above the inhibition function becauseall discharge rates exceed the criterion. Criterion discharge rates that are too high (3) result ina neurometric function falling below the inhibition function because no discharge rate exceedsthe criterion. Criterion discharge rates that are just right (2) result in a neurometric functionthat increases with stop signal delay paralleling the inhibition function.
Brown et al. Page 21
Exp Brain Res. Author manuscript; available in PMC 2009 September 22.
NIH
-PA Author Manuscript
NIH
-PA Author Manuscript
NIH
-PA Author Manuscript

Figure 4.Optimal discriminant threshold. Theoretical distributions of maximum activity for canceled(thick solid) and non-canceled (thick dashed) trials. If saccades are initiated when activityexceeds a threshold, then the distribution of activity on non-canceled trials should be greaterthan that on canceled trials. A criterion discharge rate (vertical line) correctly predicts nosaccade for all canceled trials with activity less than the criterion, and it correctly predictssaccade initiation for all non-canceled trials with activity greater than the criterion. However,it incorrectly predicts saccade initiation for canceled trials with activity greater than thecriterion, and it incorrectly predicts saccade withholding for non-canceled trials with activityless than the criterion. For each criterion discharge rate, the predictive accuracy can bequantified as the percent of stop signal trials whose outcome is correctly predicted. Thispercentage is plotted as a function of discharge rate (thin gray line). The optimal discriminantthreshold is the maximum of this function.
Brown et al. Page 22
Exp Brain Res. Author manuscript; available in PMC 2009 September 22.
NIH
-PA Author Manuscript
NIH
-PA Author Manuscript
NIH
-PA Author Manuscript

Figure 5.Activity of a typical movement-related neuron. A. Activity in all trials with no stop signal withthe target in the movement field. Activity is shown in rasters for each trial sorted by saccadelatency, with saccade initiation time marked by the spot in each raster, and in a plot of the spikedensity function averaged across the trials. This neuron exhibited a pause in discharging afterpresentation of the target followed by the characteristic increase of discharge rate before andduring saccades. B. Activity in trials with stop signal presented after a particular delay (thickvertical line) and the saccade was canceled. C. Activity in trials with no stop signal with saccadelatency equal to or greater than the stop signal delay plus the stop signal reaction time.According to the race model, these trials have latencies long enough that if the stop signal had
Brown et al. Page 23
Exp Brain Res. Author manuscript; available in PMC 2009 September 22.
NIH
-PA Author Manuscript
NIH
-PA Author Manuscript
NIH
-PA Author Manuscript

occurred, the saccade would have been inhibited. These are referred to as latency-matched tothe canceled trials. Note the lower peak discharge rate in canceled trials (B) compared tolatency-matched no stop signal trials (C). D. Activity in trials with stop signal presented aftera particular delay and the saccade was not canceled. E. Activity in trials with no stop signalwith saccade latency less than the stop signal delay plus the stop signal reaction time. Accordingto the race model, these trials have latencies short enough that if the stop signal had occurred,the saccade would have initiated anyway. Note that the peak discharge in noncanceled trials(D) is as high as that in latency-matched no stop signal trials (E).
Brown et al. Page 24
Exp Brain Res. Author manuscript; available in PMC 2009 September 22.
NIH
-PA Author Manuscript
NIH
-PA Author Manuscript
NIH
-PA Author Manuscript

Figure 6.Fitting neurometric and psychometric functions for neuron shown in Figure 5. A. Probabilitythat activation exceeds a criterion discharge rate decreases with criterion. Thin lines plot actualvalues. Thick lines plot best fit Weibull function. The curves shift to right for progressivelylonger stop signal delays (distinguished by grayscale as indicated in legend) because theactivation of the neuron builds up with time. The vertical cyan line marks the particular criteriondischarge rate at which the probability that the activation exceeds that criterion corresponds tothe probability that a saccade was initiated at the respective stop signal delays. B. Inhibitionfunction (solid points) measured while the activity of the neuron was recorded and neurometricfunction (cyan) derived from the criterion discharge rate that minimized the sum-squared
Brown et al. Page 25
Exp Brain Res. Author manuscript; available in PMC 2009 September 22.
NIH
-PA Author Manuscript
NIH
-PA Author Manuscript
NIH
-PA Author Manuscript

difference between the neurometric and psychometric functions. The Pearson correlationbetween this neurometric function and the inhibition function was 0.9997, and the neurometricthreshold was 117 sp/sec. (C) Distribution of Pearson correlation coefficients across thepopulation of movement-related neurons sampled (median r = 0.92).
Brown et al. Page 26
Exp Brain Res. Author manuscript; available in PMC 2009 September 22.
NIH
-PA Author Manuscript
NIH
-PA Author Manuscript
NIH
-PA Author Manuscript
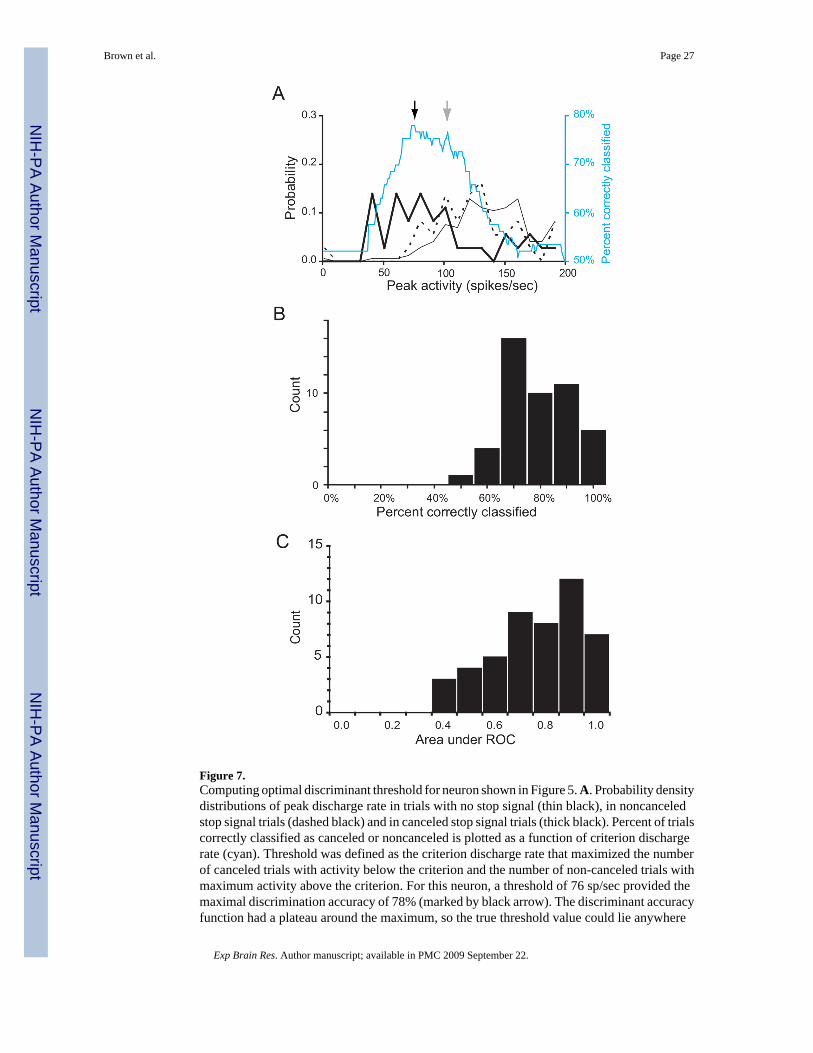
Figure 7.Computing optimal discriminant threshold for neuron shown in Figure 5. A. Probability densitydistributions of peak discharge rate in trials with no stop signal (thin black), in noncanceledstop signal trials (dashed black) and in canceled stop signal trials (thick black). Percent of trialscorrectly classified as canceled or noncanceled is plotted as a function of criterion dischargerate (cyan). Threshold was defined as the criterion discharge rate that maximized the numberof canceled trials with activity below the criterion and the number of non-canceled trials withmaximum activity above the criterion. For this neuron, a threshold of 76 sp/sec provided themaximal discrimination accuracy of 78% (marked by black arrow). The discriminant accuracyfunction had a plateau around the maximum, so the true threshold value could lie anywhere
Brown et al. Page 27
Exp Brain Res. Author manuscript; available in PMC 2009 September 22.
NIH
-PA Author Manuscript
NIH
-PA Author Manuscript
NIH
-PA Author Manuscript
within this range. A threshold of 103 sp/sec, which agrees more closely with the neurometricthreshold, yielded a predictive accuracy of 77% (marked by gray arrow). B. Distribution ofvalues of percent correctly classified by a particular threshold for the 48 movement-relatedneurons. The median value was 75% correctly classified trials. C. Histogram of areas underthe ROC curve for the 48 FEF movement-related cells, using cancelled vs. non-cancelled trials.
Brown et al. Page 28
Exp Brain Res. Author manuscript; available in PMC 2009 September 22.
NIH
-PA Author Manuscript
NIH
-PA Author Manuscript
NIH
-PA Author Manuscript

Figure 8.Comparison of neurometric and discriminant thresholds for the sample of FEF neurons withmovement-related activity. Data points with perfect agreement between the methods would liealong the diagonal.
Brown et al. Page 29
Exp Brain Res. Author manuscript; available in PMC 2009 September 22.
NIH
-PA Author Manuscript
NIH
-PA Author Manuscript
NIH
-PA Author Manuscript

Figure 9.Time of threshold crossing in single trials. A. Distribution of the time when activation firstexceeded the threshold measured relative to saccade initiation in non-canceled trials.Activation first exceeded the threshold most commonly 20 ms prior to saccade initiation asexpected of a neural event that triggered a saccade. B. Distribution of the time when activationfirst exceeded the threshold measured relative to target presentation in canceled trials. Overall,activation did not exceed the threshold on canceled trials. However, the distributions ofmaximum activity for canceled and non-canceled trials overlapped slightly, so even with theoptimal discriminant threshold, activity on canceled trials sometimes exceeded the threshold
Brown et al. Page 30
Exp Brain Res. Author manuscript; available in PMC 2009 September 22.
NIH
-PA Author Manuscript
NIH
-PA Author Manuscript
NIH
-PA Author Manuscript

even though no saccade was produced. This occasional threshold crossing in single trialsoccurred at no particular time, though, suggesting that it constitutes measurement noise.
Brown et al. Page 31
Exp Brain Res. Author manuscript; available in PMC 2009 September 22.
NIH
-PA Author Manuscript
NIH
-PA Author Manuscript
NIH
-PA Author Manuscript
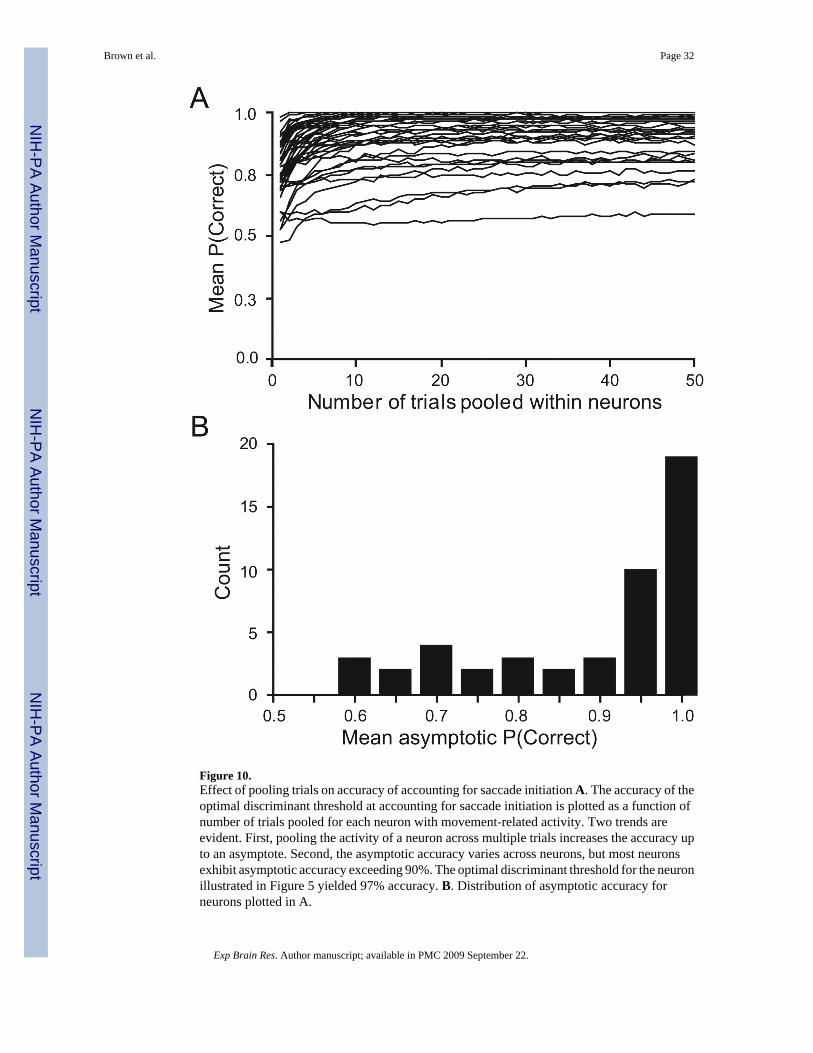
Figure 10.Effect of pooling trials on accuracy of accounting for saccade initiation A. The accuracy of theoptimal discriminant threshold at accounting for saccade initiation is plotted as a function ofnumber of trials pooled for each neuron with movement-related activity. Two trends areevident. First, pooling the activity of a neuron across multiple trials increases the accuracy upto an asymptote. Second, the asymptotic accuracy varies across neurons, but most neuronsexhibit asymptotic accuracy exceeding 90%. The optimal discriminant threshold for the neuronillustrated in Figure 5 yielded 97% accuracy. B. Distribution of asymptotic accuracy forneurons plotted in A.
Brown et al. Page 32
Exp Brain Res. Author manuscript; available in PMC 2009 September 22.
NIH
-PA Author Manuscript
NIH
-PA Author Manuscript
NIH
-PA Author Manuscript

Figure 11.Effect of pooling trials across neurons on accuracy of accounting for saccade initiation.Average probability that optimal discriminant threshold correctly accounted for saccadeinitiation as a function of number of no stop signal trials or stop signal trials pooled acrossneurons. Error bars plot the standard deviation from 10 random samples. On no stop signaltrials (thin line) pooling across six neurons yielded 95% accuracy and 100% accuracy with 10neurons. On stop signal trials (thick line) the accuracy asymptotically approached 95%accuracy as the pool size approached 50.
Brown et al. Page 33
Exp Brain Res. Author manuscript; available in PMC 2009 September 22.
NIH
-PA Author Manuscript
NIH
-PA Author Manuscript
NIH
-PA Author Manuscript

Figure 12.Time of threshold crossing of pooled activity. A. Time that pooled spike density functionscrossed optimal discriminant threshold for no stop signal (thin) and noncanceled (thick dashed)is plotted as a function of time relative to saccade. The threshold was crossed in 99% of poolednon-canceled trials with a modal value of −21 ms before saccade onset. The threshold wascrossed in 100% of pooled no stop signal trials with a modal value of −29 ms before saccadeonset. B. Time that pooled spike density functions crossed optimal discriminant threshold forcanceled stop signal trials is plotted as a function of time relative to target. The threshold wascrossed in 15% of pooled trials with a modal value of 324 ms after target onset which
Brown et al. Page 34
Exp Brain Res. Author manuscript; available in PMC 2009 September 22.
NIH
-PA Author Manuscript
NIH
-PA Author Manuscript
NIH
-PA Author Manuscript

corresponds to the range of saccade latencies. Note the difference in ordinate scale betweenpanels A and B.
Brown et al. Page 35
Exp Brain Res. Author manuscript; available in PMC 2009 September 22.
NIH
-PA Author Manuscript
NIH
-PA Author Manuscript
NIH
-PA Author Manuscript

Figure 13.Lack of relation of activity of visual neurons in FEF to movement initiation. A. Raster andaverage spike density of visually responsive neuron aligned on saccade initiation. Trials aresorted by saccade latency. Target presentation time indicated by red dot in raster. Themodulation during the saccade is elicited by the visual image swept across the retina by thesaccade. B. Frequency distributions of maximum activity on canceled (thick), non-canceled(dotted), and no-stop signal (thin solid) trials. Note that activity is higher on trials without asaccade than on trials with a saccade, because when a saccade occurs, the activity in the intervalmeasured just before movement initiation is less than the visual activity measured after targetonset when no saccade occurs. Percent of trials correctly classified as canceled or noncanceledis plotted as a function of criterion discharge rate (cyan). The optimal discriminant thresholdfor this cell was 196 sp/sec and yielded a predictive accuracy of 51% which was not differentfrom chance.C. Distribution of percent correctly predicted trials for the visual cells. Thedistribution is not significantly different from chance of 50%. D. Comparison of inhibition
Brown et al. Page 36
Exp Brain Res. Author manuscript; available in PMC 2009 September 22.
NIH
-PA Author Manuscript
NIH
-PA Author Manuscript
NIH
-PA Author Manuscript
function (solid points) and neurometric function derived from the activity of this neuron (cyan).The neurometric and psychometric functions are negatively correlated (R = −0.99), becausewith longer SSDs, more non-cancelled trials are generated with activity measured immediatelyprior to saccade initiation. The presaccadic activity is weaker than the visual activity, which iswhy the cell fails to reliably predict saccade initiation. Thus, for longer SSDs in visual cells,a smaller proportion of trials show measured activity above the threshold . E. Distribution ofcorrelations between neurometric functions from all visual neurons and inhibition functionswhile those neurons were recorded. A tendency for negative correlations was evident.
Brown et al. Page 37
Exp Brain Res. Author manuscript; available in PMC 2009 September 22.
NIH
-PA Author Manuscript
NIH
-PA Author Manuscript
NIH
-PA Author Manuscript