Neural Control of Visual Search by Frontal Eye Field: Effects of Unexpected Target Displacement on...
22
Neural Control of Visual Search by Frontal Eye Field: Effects of Unexpected Target Displacement on Visual Selection and Saccade Preparation Aditya Murthy, 1 Supriya Ray, 2 Stephanie M. Shorter, 2 Jeffrey D. Schall, 2 and Kirk G. Thompson 3 1 National Brain Research Centre, Manesar, Haryana, India; 2 Vanderbilt Vision Research Center, Center for Integrative and Cognitive Neuroscience, Department of Psychology, Vanderbilt University, Nashville, Tennessee; and 3 Laboratory of Sensorimotor Research, National Eye Institute, National Institutes of Health, Bethesda, Maryland Submitted 26 July 2008; accepted in final form 26 February 2009 Murthy A, Ray S, Shorter SM, Schall JD, Thompson KG. Neural control of visual search by frontal eye field: effects of unexpected target displacement on visual selection and saccade preparation. J Neurophysiol 101: 2485–2506, 2009. First published March 4, 2009; doi:10.1152/jn.90824.2008. The dynamics of visual selection and saccade preparation by the frontal eye field was investigated in macaque monkeys performing a search-step task combining the clas- sic double-step saccade task with visual search. Reward was earned for producing a saccade to a color singleton. On random trials the target and one distractor swapped locations before the saccade and monkeys were rewarded for shifting gaze to the new singleton location. A race model accounts for the probabilities and latencies of saccades to the initial and final singleton locations and provides a measure of the duration of a covert compensation process—target- step reaction time. When the target stepped out of a movement field, noncompensated saccades to the original location were produced when movement-related activity grew rapidly to a threshold. Com- pensated saccades to the final location were produced when the growth of the original movement-related activity was interrupted within target-step reaction time and was replaced by activation of other neurons producing the compensated saccade. When the target stepped into a receptive field, visual neurons selected the new target location regardless of the monkeys’ response. When the target stepped out of a receptive field most visual neurons maintained the represen- tation of the original target location, but a minority of visual neurons showed reduced activity. Chronometric analyses of the neural re- sponses to the target step revealed that the modulation of visually responsive neurons and movement-related neurons occurred early enough to shift attention and saccade preparation from the old to the new target location. These findings indicate that visual activity in the frontal eye field signals the location of targets for orienting, whereas movement-related activity instantiates saccade preparation. INTRODUCTION To investigate the neural basis of the decision processes of saccade target selection, we have recorded neural activity in the frontal eye field (FEF) of macaque monkeys trained to perform visual search tasks (Bichot and Schall 1999; Bichot et al. 2001; Sato and Schall 2003; Sato et al. 2001; Schall 2004; Schall and Hanes 1993; Schall et al. 1995; Thompson et al. 1996, 1997). When monkeys have generalized experience with different search arrays, the initial response of visually respon- sive neurons does not discriminate between a target and dis- tractors, but subsequently the activation of neurons with the target in their response field evolves to exceed the activity of neurons with a distractor in their response field. The target of the search array can be said to be selected when the activity becomes different. However, the visual search tasks in these experiments used static displays, so it remains unknown how the decision processes in FEF, or in other visuomotor areas, account for unexpected changes of salience in the image so that subjects can react effectively to the changing image. To address this question, we used a perturbation task called search-step that combines visual singleton search with the classic double-step saccade manipulation (Becker and Ju ¨rgens 1979; Lisberger et al. 1975; Westheimer 1954; Wheeless et al. 1966). In no-step trials, monkeys shift their gaze to a color singleton in an array of homogeneous distractors. On random trials the target changes location before the saccade. If the target is presented in a visual search array with distractors, the target and one distractor are exchanged through an isoluminant color change, referred to as search-step. If the target is pre- sented alone, the target is simply removed at one location and appears at another; this will be referred to as double-step. We will use the term target-step to refer to either the search-step or double step conditions. In these target-step trials, two outcomes are possible. Monkeys could shift gaze in error to the original target location (these are referred to as noncompensated sac- cades) or they could cancel the initial saccade and shift gaze directly to the final target location (these are referred to as compensated saccades). In target-step trials monkeys are rein- forced only for producing compensated saccades. The proba- bility of not compensating for the target step increases with the delay between presentation of the target (alone or in a search array) and the target step. Performance in the target-step task has been understood as the outcome of a race between processes producing the alter- native saccades (Becker and Ju ¨rgens 1979; Lisberger et al. 1975) in a manner paralleling the model of stop signal (coun- termanding) task performance as a race between a GO process that initiates movement and a STOP process that interrupts the GO process (Boucher et al. 2007; Logan and Cowan 1984). The mathematical model of countermanding performance pro- vides the means to estimate the duration of the stop process; this is referred to as the stop signal reaction time (SSRT). The same analysis can be applied to double-step or search-step task performance to estimate target-step reaction time (TSRT). Subsequently, a formal race model was developed for double- step and search-step performance (Camalier et al. 2007). This model consists of three processes with stochastically indepen- dent finish times: 1) a GO process producing the saccade to the initial target location, 2) a STOP process interrupting the preparation of the saccade to the initial target, and 3) a second Address for reprint requests and other correspondence: J. D. Schall, Depart- ment of Psychology, 301 Wilson Hall, 111 21st Avenue South, Vanderbilt University, Nashville, TN 37203 (E-mail: [email protected]). J Neurophysiol 101: 2485–2506, 2009. First published March 4, 2009; doi:10.1152/jn.90824.2008. 2485 www.jn.org on May 26, 2009 jn.physiology.org Downloaded from
-
Upload
vanderbilt -
Category
Documents
-
view
4 -
download
0
Transcript of Neural Control of Visual Search by Frontal Eye Field: Effects of Unexpected Target Displacement on...

Neural Control of Visual Search by Frontal Eye Field: Effects of UnexpectedTarget Displacement on Visual Selection and Saccade Preparation
Aditya Murthy,1 Supriya Ray,2 Stephanie M. Shorter,2 Jeffrey D. Schall,2 and Kirk G. Thompson3
1National Brain Research Centre, Manesar, Haryana, India; 2Vanderbilt Vision Research Center, Center for Integrative and CognitiveNeuroscience, Department of Psychology, Vanderbilt University, Nashville, Tennessee; and 3Laboratory of Sensorimotor Research,National Eye Institute, National Institutes of Health, Bethesda, Maryland
Submitted 26 July 2008; accepted in final form 26 February 2009
Murthy A, Ray S, Shorter SM, Schall JD, Thompson KG. Neuralcontrol of visual search by frontal eye field: effects of unexpectedtarget displacement on visual selection and saccade preparation. JNeurophysiol 101: 2485–2506, 2009. First published March 4, 2009;doi:10.1152/jn.90824.2008. The dynamics of visual selection andsaccade preparation by the frontal eye field was investigated inmacaque monkeys performing a search-step task combining the clas-sic double-step saccade task with visual search. Reward was earnedfor producing a saccade to a color singleton. On random trials thetarget and one distractor swapped locations before the saccade andmonkeys were rewarded for shifting gaze to the new singletonlocation. A race model accounts for the probabilities and latencies ofsaccades to the initial and final singleton locations and provides ameasure of the duration of a covert compensation process—target-step reaction time. When the target stepped out of a movement field,noncompensated saccades to the original location were producedwhen movement-related activity grew rapidly to a threshold. Com-pensated saccades to the final location were produced when thegrowth of the original movement-related activity was interruptedwithin target-step reaction time and was replaced by activation ofother neurons producing the compensated saccade. When the targetstepped into a receptive field, visual neurons selected the new targetlocation regardless of the monkeys’ response. When the target steppedout of a receptive field most visual neurons maintained the represen-tation of the original target location, but a minority of visual neuronsshowed reduced activity. Chronometric analyses of the neural re-sponses to the target step revealed that the modulation of visuallyresponsive neurons and movement-related neurons occurred earlyenough to shift attention and saccade preparation from the old to thenew target location. These findings indicate that visual activity in thefrontal eye field signals the location of targets for orienting, whereasmovement-related activity instantiates saccade preparation.
I N T R O D U C T I O N
To investigate the neural basis of the decision processes ofsaccade target selection, we have recorded neural activity inthe frontal eye field (FEF) of macaque monkeys trained toperform visual search tasks (Bichot and Schall 1999; Bichotet al. 2001; Sato and Schall 2003; Sato et al. 2001; Schall 2004;Schall and Hanes 1993; Schall et al. 1995; Thompson et al.1996, 1997). When monkeys have generalized experience withdifferent search arrays, the initial response of visually respon-sive neurons does not discriminate between a target and dis-tractors, but subsequently the activation of neurons with thetarget in their response field evolves to exceed the activity ofneurons with a distractor in their response field. The target of
the search array can be said to be selected when the activitybecomes different. However, the visual search tasks in theseexperiments used static displays, so it remains unknown howthe decision processes in FEF, or in other visuomotor areas,account for unexpected changes of salience in the image so thatsubjects can react effectively to the changing image.
To address this question, we used a perturbation task calledsearch-step that combines visual singleton search with theclassic double-step saccade manipulation (Becker and Jurgens1979; Lisberger et al. 1975; Westheimer 1954; Wheeless et al.1966). In no-step trials, monkeys shift their gaze to a colorsingleton in an array of homogeneous distractors. On randomtrials the target changes location before the saccade. If thetarget is presented in a visual search array with distractors, thetarget and one distractor are exchanged through an isoluminantcolor change, referred to as search-step. If the target is pre-sented alone, the target is simply removed at one location andappears at another; this will be referred to as double-step. Wewill use the term target-step to refer to either the search-step ordouble step conditions. In these target-step trials, two outcomesare possible. Monkeys could shift gaze in error to the originaltarget location (these are referred to as noncompensated sac-cades) or they could cancel the initial saccade and shift gazedirectly to the final target location (these are referred to ascompensated saccades). In target-step trials monkeys are rein-forced only for producing compensated saccades. The proba-bility of not compensating for the target step increases with thedelay between presentation of the target (alone or in a searcharray) and the target step.
Performance in the target-step task has been understood asthe outcome of a race between processes producing the alter-native saccades (Becker and Jurgens 1979; Lisberger et al.1975) in a manner paralleling the model of stop signal (coun-termanding) task performance as a race between a GO processthat initiates movement and a STOP process that interrupts theGO process (Boucher et al. 2007; Logan and Cowan 1984).The mathematical model of countermanding performance pro-vides the means to estimate the duration of the stop process;this is referred to as the stop signal reaction time (SSRT). Thesame analysis can be applied to double-step or search-step taskperformance to estimate target-step reaction time (TSRT).Subsequently, a formal race model was developed for double-step and search-step performance (Camalier et al. 2007). Thismodel consists of three processes with stochastically indepen-dent finish times: 1) a GO process producing the saccade to theinitial target location, 2) a STOP process interrupting thepreparation of the saccade to the initial target, and 3) a second
Address for reprint requests and other correspondence: J. D. Schall, Depart-ment of Psychology, 301 Wilson Hall, 111 21st Avenue South, VanderbiltUniversity, Nashville, TN 37203 (E-mail: [email protected]).
J Neurophysiol 101: 2485–2506, 2009.First published March 4, 2009; doi:10.1152/jn.90824.2008.
2485www.jn.org
on May 26, 2009
jn.physiology.orgDownloaded from

GO process producing the saccade to the final target location.This model was fit to search-step and double-step performanceby monkeys and humans and was found to predict the proba-bility and latency of correct and error saccades under differentstimulus conditions. The model demonstrated that TSRT doesindeed measure the duration of the covert stop process. There-fore the measure of TSRT from search-step task performanceprovides critical leverage for determining whether a particularneuron produces a signal sufficient to select the new location ofa target and to control saccade production. Specifically, onlyneurons that modulate within TSRT can contribute to changinggaze behavior.
Other neurophysiological studies have used the double-steptask to dissociate retinal from motor error signals by requiringmonkeys to produce a sequence of saccades to the original andthen the final location after the target is displaced (Gnadt andAndersen 1988; Goldberg and Bruce 1990; Mays and Sparks1980; Tian et al. 2000). The emphasis on producing a sequenceof two saccades is different from the emphasis on accuracy ofthe first saccade in the task we use. In fact, we have found thatfollowing as opposed to redirecting gaze in the double-steptask results in different patterns of performance (Ray et al.2004). Other investigators described the activity of neurons inthe superior colliculus (SC) of monkeys responding to double-step targets (Lunenburger et al. 2003; Mohler and Wurtz 1976;Sparks 1978). However, ours is the first description of neuralactivity collected with systematic variation of target-step delay(TSD) to control the production of compensated and noncom-pensated saccades and analyzed in the context of the racemodel of performance. The results extend previous findingsusing this search-step task (Murthy et al. 2001, 2007) and havebeen presented in preliminary form (Murthy et al. 2000).
M E T H O D S
Search and step tasks
Using positive reinforcement, three macaque monkeys were trainedto perform visual search tasks in which they shifted gaze to a colorsingleton to receive fluid reward. Monkeys initiated each trial byfixating a central square for a variable amount of time (500–800 ms).This fixation stimulus disappeared simultaneously with the appear-ance of the target alone or in a search array, an eight-element circulararray of isoluminant red and green squares. Across blocks of trials, thearray consisted of a green singleton among red distractors or viceversa. For monkey F, the green was CIE x ! 283, y ! 612 and redwas CIE x ! 655, y ! 327, with a luminance of 11.1 cd/m2. For theother monkeys, the green was CIE x ! 281, y ! 609 and red was CIEx ! 632, y ! 338, with a luminance of 13.4 cd/m2. Eccentricity of thestimuli was adjusted according to the location of the response field ofeach isolated neuron. To equate visibility, stimuli were scaled foreccentricity according to cortical magnification (Rovamo and Virsu1979). In !50% of trials the color singleton target remained at itsoriginal location (no-step trials) and monkeys were reinforced forshifting gaze to it (Fig. 1). In other trials, the search array waspresented but then, following a variable TSD, the target appeared at anew location in the array. In other words, after the TSD, the target andone distractor swapped positions through an isoluminant color change.We refer to these trials as target-step trials. This target displacementmanipulation was done when the target was presented in a searcharray (search-step) or when the target was presented alone (double-step). To prevent monkeys from withholding saccades, no more than50% of trials were target-step trials (Emeric et al. 2007). In a typicaldaily session the color of the target did not switch. Across sessions,
the target and distractor colors were switched by using the comple-mentary search array. The search-step and double-step conditionswere performed in blocks, one after another when spike isolationpersisted for a long enough duration.
When the target stepped to a new location, performance wasprobabilistic with two possible responses. A compensated saccade(also referred to as a “final angle response” in the literature) to thefinal target location was reinforced. A noncompensated saccade(“initial angle response”) to the original target location was notreinforced. The probability of executing a compensated or noncom-pensated saccade varied with the TSD, which was titrated to ensure anapproximately equal number of compensated (correct) and noncom-pensated (error) responses. The TSD was increased following acompensated saccade and decreased following a noncompensatedsaccade in a staircase procedure typically involving the use of five to
DOUBLE-STEP
No-Step
Compensated
Noncompensated
Target-Step
TargetStep Delay
Compensated
Noncompensated
No-Step
Target-Step
TargetStep Delay
SEARCH-STEP
FIG. 1. Search-step and double-step tasks. Following fixation of a centralspot a color singleton was presented with 7 distractors (top) or alone (bottom).On random trials the singleton stepped to a different location across the arrayafter a variable delay. Performance on these target-step trials was probabilistic.Monkeys were rewarded for canceling the original saccade and producing acompensated saccade to the new singleton location. Noncompensated saccadesto the original singleton location were errors; such errors were almost alwaysfollowed by unrewarded corrective saccades to the final singleton location.
2486 MURTHY, RAY, SHORTER, SCHALL, AND THOMPSON
J Neurophysiol • VOL 101 • MAY 2009 • www.jn.org
on May 26, 2009
jn.physiology.orgDownloaded from

seven delays at 16.6-ms (refresh rate) intervals. Given idiosyncrasiesacross monkeys and demand differences across tasks, TSDs typicallyvaried between 50 and 300 ms to achieve 50% correct target-steptrials. However, the value of target-step reaction time was not affectedby the staircasing procedure used (Nelson et al. 2008).
During neurophysiological data collection, the target appeared withequal probability at each of the eight possible array positions. How-ever, in target-step trials the number of initial and final target locationswas restricted to increase the yield of data. This was accomplishedthrough the following procedure. The response field of the neuron waslocalized; the response fields of FEF neurons commonly occupy twoor three array positions. Therefore on target-step trials the initial andfinal target locations were restricted to the three array positionscentered on the response field and the three positions symmetricallyopposite in the array. The target never stepped within or beside theresponse field. This amounts to 18 target-step combinations (6 possi-ble initial target locations " 3 possible final locations for each initiallocation). Consequently, the target only stepped into or out of theresponse field. Target-step combinations were randomized and inter-leaved with no-step trials. In preliminary sessions during which onlyperformance was monitored, target steps were completely randomizedacross all array locations. Performance did not differ from thatobtained in the neurophysiological sessions. The behavioral dataindicated that the monkeys could not predict the location of the targetor the occurrence of target-step trials.
Data collection
Data were collected from three adult monkeys (two Macaca mu-latta and one Macaca radiata) weighing 7–12 kg. The animals werecared for in compliance with the Guide for the Care and Use ofLaboratory Animals and the guidelines of the Vanderbilt Animal Careand Use Committee. Surgical and data collection methods have beendescribed in detail elsewhere (Schall et al. 1995). Briefly, monkeyswere seated within a magnetic field to monitor eye movements usingthe scleral search coil technique. Experiments were under the controlof a computer running TEMPO VideoSync (Reflective Computing)that controlled stimulus presentation (Sony Trinitron 500-PS moni-tor), recorded eye movements (250 Hz) and single-unit activity (1kHz), and delivered the juice reward. Saccades were detected off-lineby an algorithm that first detected a significant elevation in velocity(#30°/s), then defined the beginning and end of the monotonic changein eye position lasting !12 ms before and after this high-velocitymovement. Neural activity was recorded with insulated tungstenmicroelectrodes (1–5 M$; FHC) that were introduced to the cortexthrough guide tubes positioned in a grid (Crist et al. 1988) andadvanced with a hydraulic microdrive (FHC). Action potentials wereamplified, filtered, and discriminated using a BAK analog time-amplitude window discriminator. Single units were included in thepresent sample if the amplitude of the action potential was sufficientlyabove background to reliably trigger the time-amplitude windowdiscriminator, the wave shape was invariant, and the neuron isolationwas sustained for a sufficient time to allow behavioral data to becollected.
Race model analysis of behavior
Performance in target-step trials has been described as the outcome ofa race between a process producing the noncompensated saccade and aprocess producing the compensated saccade (Becker and Jurgens 1979;Lisberger et al. 1975). Performance in a saccade-countermanding (stopsignal) task that requires only canceling a planned saccade can beaccounted for by a formal race model (Logan and Cowan 1984). Wehave recently shown that double-step and search-step performance ofmacaques and humans can be accounted for quantitatively by thesame formal model of finish times, but with two processes producingthe alternative saccades and a stop process that interrupts the first
process (Camalier et al. 2007). This race model defines a quantitycalled target-step reaction time (TSRT), which is the time needed tocancel the partially prepared initial movement in response to thedisplacement of the target. TSRT is formally equivalent to the stopsignal reaction time defined in the stop signal (countermanding) task(Logan and Cowan 1984). In an interactive race model of counter-manding saccades, we have found that stop signal reaction timemeasures the latency of an active inhibition process (Boucher et al.2007). Likewise, the independent race model of double-step andsearch-step performance confirms that TSRT measures the latency ofthe stop process that interrupts the process that would produce thenoncompensated saccade to the initial target location (Camalier et al.2007).
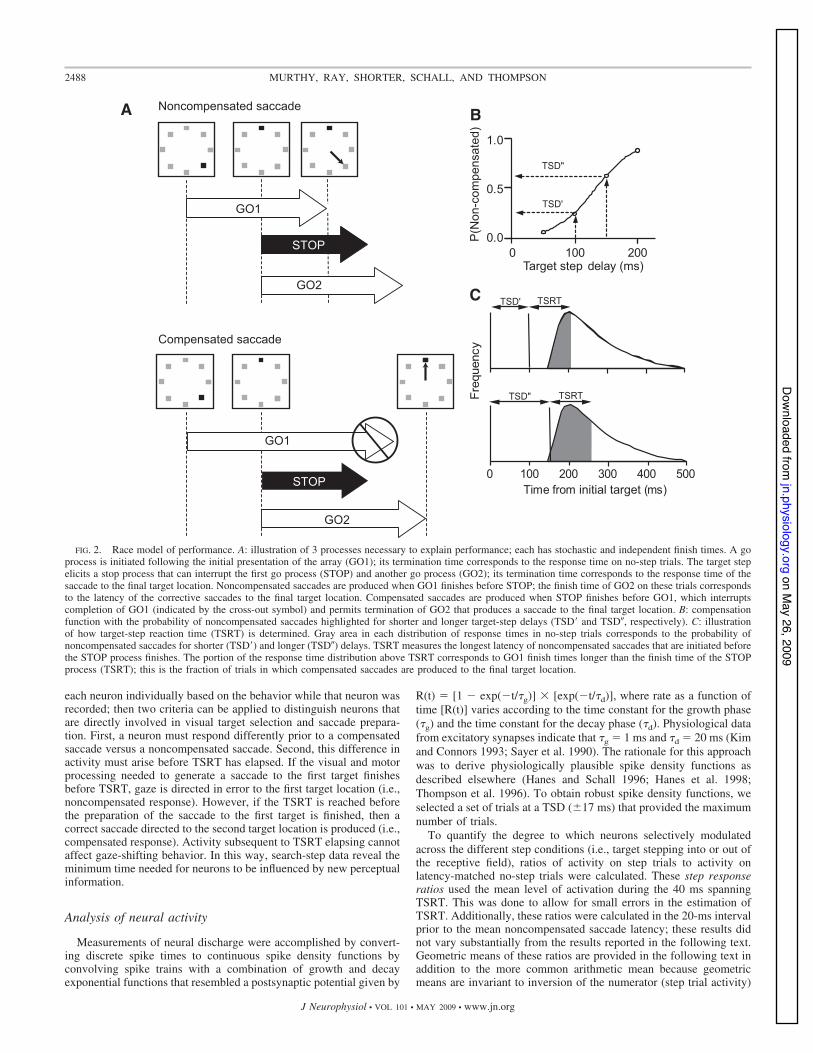
According to the race model, TSRT demarcates the time at whicha subject changes from producing erroneous noncompensated sac-cades to producing correct compensated saccades to the final targetlocation. Figure 2 illustrates how TSRT is derived from the compen-sation function and the response time distribution. The portion of thedistribution before TSRT represents those trials in which the saccadewas produced before the time required inhibiting that response be-cause of the target step. Consequently, these target-step trial responsesare those noncompensated saccades that would have been directed tothe initial target location. The portion of the distribution followingTSRT contains trials in which adequate time elapsed to cancel thepartially prepared saccade to the initial target location and produce acompensated saccade to the new target location following its step.Generally speaking, the moment that TSRT elapses measures themaximum noncompensated saccade latency and the minimum com-pensated saccade latency.
The fraction of noncompensated saccades plotted as a function ofTSD is referred to as the compensation function, which shows therelation between the primary independent variable—the TSD—and itseffects on behavior, which also depend on the form of the responselatency distributions. Shorter response latencies translate into greaterprobabilities of errantly committing a noncompensated response. Theprobability of making a noncompensated response is drawn from thiscompensation function to calculate the TSRT at a particular TSD. Thetime at which this probability equals the proportion of saccades madein the no-step distribution subtracted from the TSD gives the TSRT atthat delay. In other words, the no-step latency giving that proportionis equivalent to the minimum latency of no-step saccades that wouldhave been reprogrammed had a target step occurred; this latencyrepresents the finish time of interrupting the preparation of the firstsaccade process. TSRT for a particular TSD is calculated by integrat-ing the no-step saccade latency distribution from 0 ms until theintegral equals the proportion of noncompensated saccades at thatTSD. The no-step latency value at the limit of that integral defines theminimum no-step saccade latency that could have been compensatedif the target had stepped, thus representing the completion of thecompensation process. This method of calculation assumes that TSRTis constant. Violation of this implausible assumption does not changethe outcome if TSRT does not covary with the no-step saccade latency(Band et al. 2003; DeJong et al. 1990). We also calculated TSRT witha second method that does not assume that TSRT is constant. Here thedifference between the mean no-step saccade latency and the TSD atwhich 50% of the noncompensated responses are generated (i.e., meanof the compensation function) is used to estimate the mean TSRT. Themean of the compensation function was determined by fitting acumulative Weibull function, W(t), to the compensation function. Anestimate of the mean of the best-fit compensation function was given byW(t) ! " % (" % #) " exp[%(t/$)%], where t ranges from the minimumto the maximum step delay, $ is the time at which the compensationfunction reaches 64% of its maximum value ", % is the slope, and # is theminimum value.
Estimating TSRT from the behavioral data provided an unprece-dented opportunity to relate the time course of neural modulation tovisual selection and motor preparation. A TSRT value is derived for
2487NEURAL CONTROL OF VISUAL SEARCH BY FEF
J Neurophysiol • VOL 101 • MAY 2009 • www.jn.org
on May 26, 2009
jn.physiology.orgDownloaded from
each neuron individually based on the behavior while that neuron wasrecorded; then two criteria can be applied to distinguish neurons thatare directly involved in visual target selection and saccade prepara-tion. First, a neuron must respond differently prior to a compensatedsaccade versus a noncompensated saccade. Second, this difference inactivity must arise before TSRT has elapsed. If the visual and motorprocessing needed to generate a saccade to the first target finishesbefore TSRT, gaze is directed in error to the first target location (i.e.,noncompensated response). However, if the TSRT is reached beforethe preparation of the saccade to the first target is finished, then acorrect saccade directed to the second target location is produced (i.e.,compensated response). Activity subsequent to TSRT elapsing cannotaffect gaze-shifting behavior. In this way, search-step data reveal theminimum time needed for neurons to be influenced by new perceptualinformation.
Analysis of neural activity
Measurements of neural discharge were accomplished by convert-ing discrete spike times to continuous spike density functions byconvolving spike trains with a combination of growth and decayexponential functions that resembled a postsynaptic potential given by
R(t) ! [1 % exp(%t/&g)] " [exp(%t/&d)], where rate as a function oftime [R(t)] varies according to the time constant for the growth phase(&g) and the time constant for the decay phase (&d). Physiological datafrom excitatory synapses indicate that &g ! 1 ms and &d ! 20 ms (Kimand Connors 1993; Sayer et al. 1990). The rationale for this approachwas to derive physiologically plausible spike density functions asdescribed elsewhere (Hanes and Schall 1996; Hanes et al. 1998;Thompson et al. 1996). To obtain robust spike density functions, weselected a set of trials at a TSD (&17 ms) that provided the maximumnumber of trials.
To quantify the degree to which neurons selectively modulatedacross the different step conditions (i.e., target stepping into or out ofthe receptive field), ratios of activity on step trials to activity onlatency-matched no-step trials were calculated. These step responseratios used the mean level of activation during the 40 ms spanningTSRT. This was done to allow for small errors in the estimation ofTSRT. Additionally, these ratios were calculated in the 20-ms intervalprior to the mean noncompensated saccade latency; these results didnot vary substantially from the results reported in the following text.Geometric means of these ratios are provided in the following text inaddition to the more common arithmetic mean because geometricmeans are invariant to inversion of the numerator (step trial activity)
GO1
GO2
STOP
A Noncompensated saccade
Compensated saccade
0 100 200
0.5
Target step delay (ms)
P(N
on-c
ompe
nsat
ed)
1.0
0.0
TSD"
2000 400Time from initial target (ms)
100 300 500Fr
eque
ncy
TSD' TSRT
TSD"
TSD'
B
C
TSRT
GO2
GO1
STOP
FIG. 2. Race model of performance. A: illustration of 3 processes necessary to explain performance; each has stochastic and independent finish times. A goprocess is initiated following the initial presentation of the array (GO1); its termination time corresponds to the response time on no-step trials. The target stepelicits a stop process that can interrupt the first go process (STOP) and another go process (GO2); its termination time corresponds to the response time of thesaccade to the final target location. Noncompensated saccades are produced when GO1 finishes before STOP; the finish time of GO2 on these trials correspondsto the latency of the corrective saccades to the final target location. Compensated saccades are produced when STOP finishes before GO1, which interruptscompletion of GO1 (indicated by the cross-out symbol) and permits termination of GO2 that produces a saccade to the final target location. B: compensationfunction with the probability of noncompensated saccades highlighted for shorter and longer target-step delays (TSD' and TSD(, respectively). C: illustrationof how target-step reaction time (TSRT) is determined. Gray area in each distribution of response times in no-step trials corresponds to the probability ofnoncompensated saccades for shorter (TSD') and longer (TSD() delays. TSRT measures the longest latency of noncompensated saccades that are initiated beforethe STOP process finishes. The portion of the response time distribution above TSRT corresponds to GO1 finish times longer than the finish time of the STOPprocess (TSRT); this is the fraction of trials in which compensated saccades are produced to the final target location.
2488 MURTHY, RAY, SHORTER, SCHALL, AND THOMPSON
J Neurophysiol • VOL 101 • MAY 2009 • www.jn.org
on May 26, 2009
jn.physiology.orgDownloaded from

and denominator (no-step trial activity) that generate a step responseratio and are less affected by outliers.
Besides the magnitude we also quantified the time course of thedifferential activity during step trials and latency-matched no-steptrials. The average spike density functions in step trials and latency-matched no-step trials were compared as a function of time fromtarget presentation. To perform this time-course analysis, we sub-tracted the average spike density function for step trials from theaverage spike density function during latency-matched no-step trials.This subtraction was performed for neurons with visually evokedactivity and for neurons with movement-related activity. The resultingspike density functions will be referred to as differential spike densityfunctions. The time at which significant differential activity beganduring step trials and latency-matched no-step trials was defined as theinstant when the differential spike density function exceeded by 2SDsthe mean difference in activity during the 200-ms interval beforetarget presentation, provided the difference reached 6SDs and re-mained above the 2SD threshold for 50 ms. Estimation of the time ofdifferential activity allows us to establish a criterion that identifiesneurons that play an active role in target selection and control of eyemovements. Such neurons must modulate with the behavior and mustoccur prior to the TSRT. Otherwise these neurons would not be ableto control the performance as demanded by the task. The time intervalbetween the defined onset of differential activity and the averageTSRT was then determined and is referred to as neural discriminationtime.
The time of modulation of neurons was also determined usingreceiver operating characteristic (ROC) analysis (Green and Swets1966), as previously described (Thompson et al. 1996). The spikedensity functions from sets of either compensated or noncompensatedstep trials were compared with those from latency-matched no-steptrials. Spike trains from the original sets of trials were bootstrapped to
construct 500 simulated spike trains in each set for reliable compar-ison. Comparisons were conducted by calculating ROC curves forsuccessive 1-ms bins, starting at the time of array or target presenta-tion and continuing until all saccades were initiated. The area underthe ROC curve provides a quantitative measure of the separationbetween two distributions of activity. An area under the ROC curvevalue of 0.5 signifies that the two distributions being compared arecompletely overlapped, whereas an extreme value of 0.0 or 1.0 signifiesthat the two distributions do not overlap. To describe the growth in thearea under the ROC curve over time, the data were fit with a cumulativeWeibull distribution function. The time of differential activity was deter-mined from the growth of the ROC area over time and was defined as thetime when the ROC area reached a value of 0.7.
R E S U L T S
Search-step and double-step behavioral performance
In a previous report we described in detail the performanceof individual monkey and human subjects (Camalier et al.2007). Figure 3 and Table 1 summarize the behavioral resultsobtained, which collectively validate the applicability of therace model to explain monkeys’ performance in search-stepand double-step tasks. Figure 4 plots the compensation func-tions averaged across all the search-step and double-step trialsseparately for each monkey. Following the shortest TSDs,monkeys more often canceled saccades to the original targetlocation and produced compensated saccades to the final targetlocation. As the TSD increased, monkeys increasingly failed towithhold the saccades to the original target location and pro-duced noncompensated saccades.
Saccade latency (ms)
P (L
aten
cy)
0 200 400
DOUBLE-STEPSEARCH-STEPMonkey C
0.0
0.5
1.0
Saccade latency (ms)
0.0
0.5
1.0
0 200 400
Monkey F
0 200 400
Monkey F
0.0
0.5
1.0
0 200 400
Monkey L
0.0
0.5
1.0
0 200 4000.0
0.5
1.0 Monkey L
0 200 4000.0
0.5
1.0 Monkey C
NO-STEP
TARGET-STEP:NoncompensatedCompensatedCompensated-TSD
P (L
aten
cy)
FIG. 3. Saccade latencies. Left: no-step (thinlines) and target-step latency distributions (thicklines) in the search-step task in which compensated(solid black) and noncompensated saccades (dottedblack) were made. Gray line shows the distributionof compensated saccade latencies relative to corre-sponding TSDs. Right: double-step latencies withconventions as above.
2489NEURAL CONTROL OF VISUAL SEARCH BY FEF
J Neurophysiol • VOL 101 • MAY 2009 • www.jn.org
on May 26, 2009
jn.physiology.orgDownloaded from

According to the race model, a compensated saccade isproduced if the process producing the original saccade isinterrupted. The latency of this interruption is TSRT. TSRTwas estimated from the mean of the compensation function andby the method of integration applied to the data for eachsession. TSRTs estimated by the two methods can vary de-pending on the particular distribution of the no-step reactiontimes and the shape of the compensation function. Becausethere is no a priori reason to weight one method of estimationover the other, we averaged both estimates to obtain a singleTSRT for each session. Across the three subjects, TSRT(&SD) was 123 (&19) ms for search-step and 96 (&33) ms fordouble-step trials. TSRT values for double-step trials tended tobe less than those for search-step trials (Fig. 5, Table 2) [t(87) !4.32, P ) 0.001]. More details about performance can be foundin Camalier et al. (2007).
Overview of physiological analyses
FEF units were recorded from the rostral bank of the arcuatesulcus, which was determined by sulcal landmarks duringcraniotomies for monkeys C and F and confirmed via structuralmagnetic resonance imaging scans and microstimulation inmonkey L. In all, 76 neurons exhibiting task-related modula-tion were recorded from five hemispheres while the threemonkeys performed the search-step task. For 14 of theseneurons, data were also collected during performance of thedouble-step task using a blocked design. The FEF containsdiverse neurons that can be distinguished functionally, with themajority of neurons exhibiting visual responses and manyothers associated with saccade preparation (Bruce and Gold-berg 1985; DiCarlo and Maunsell 2005; Hanes et al. 1998;Helminski and Segraves 2003; Schall 1991; Segraves andGoldberg 1987; Sommer and Wurtz 2001). Recent evidencefor biophysical differences among cell types in FEF has beenprovided (Cohen et al. 2009). Neurons with visual responsesand presaccadic movement-related activity were distinguishedwith the conventional memory-guided saccade task (Bruce andGoldberg 1985; Hikosaka and Wurtz 1983) and visual inspec-tion of patterns of modulation before visually guided saccades.Visual activity was a brisk response following the presentationof a flashed visual stimulus. Movement-related activity wasidentified as a progressively increasing discharge rate preced-ing saccade initiation and a return to baseline following thesaccade. Many neurons with visual responses lack the buildupof activity before a saccade into the response field. Mostneurons with movement-related activity also have a measure ofa visual response, but a fraction sampled did not. To quantifythe relative magnitude of visual and movement activity in thememory-guided saccade task, a visual-movement index (VMI)was calculated for each neuron. Visual activity (VA) was
defined as the mean firing rate above the spontaneous activityof the neuron in a time window 0 to 200 ms after stimulusonset. Movement activity (MA) was defined as the mean firingrate above the same spontaneous activity of a time window 50to 0 ms before saccade onset. The spontaneous activity wasmeasured as the mean firing rate in a span of 800 to 400 msbefore the stimulus onset. VMI was calculated as VMI !(VA % MA)/(VA * MA). Therefore neurons with compara-tively higher movement activity yield negative VMI and neu-rons with greater visual activity yield positive VMI. Visuo-movement neurons that responded to the target onset anddischarged before saccade onset yield VMI values betweenpure visual and pure movement neurons. The average VMI(&SE) for movement, visuomovement, and visual neuronswere %0.19 (&0.06), 0.16 (&0.07), and 0.17 (&0.07), respec-tively, which were significantly different from each other[ANOVA, F(2,75) ! 8.53, P ) 0.001].
For this report, we analyzed the activity of 24 visual, 28visuomovement, and 24 movement neurons that provided suf-ficient data to accomplish the range of analyses. The events inthe task and the performance of the monkeys results in severaldifferent kinds of trials. Thus the results of a progression ofanalyses will be presented. We will describe the pattern ofmodulation when the target stepped into the receptive field andmonkeys either compensated by shifting gaze directly to thefinal target location or failed to compensate by shifting gaze tothe original target location outside the receptive field. We willalso describe the pattern of modulation when the target steppedout of the receptive field and monkeys either compensated byshifting gaze directly to the final target location or failed tocompensate by shifting gaze to the original target locationinside the receptive field. In addition to describing how neuralrepresentations in FEF respond to unexpected changes ofsalience in the image so that monkeys can react effectively, thedissociation between the target location and saccade directionthat is created by target steps enhances cell classificationbeyond that provided by the conventional memory-guided task.The theoretical thrust of the analyses is guided by the previoussuccess applying the race model of stopping to analyze neuralactivity in the FEF (Hanes et al. 1998) and SC (Pare and Hanes2003) of monkeys performing a saccade-countermanding task.One of the key results of those studies was that neurons withmovement-related activity, but not neurons with only visualresponses, modulated activity within the stop signal reactiontime. This result demonstrated that neurons with only visualresponses did not produce activity sufficient to control saccadeinitiation. In contrast, neurons with the presaccadic movement-related buildup of activity and fixation neurons did produceactivity sufficient to control whether and when a saccade wasinitiated. We will analyze the data collected during search-step
TABLE 1. Saccade latencies (ms)
No-step Target-noncompensated Target-compensated—TSD
Monkey Search-Step Double-Step Search-Step Double-Step Search-Step Double-Step
C 215 & 44 194 & 49 204 & 27 179 & 28 216 & 37 200 & 31F 229 & 66 221 & 49 201 & 32 199 & 27 217 & 54 232 & 42L 229 & 41 262 & 48 219 & 27 245 & 32 222 & 38 246 & 37
Values are mean & SD. Compensated saccade latencies were measured relative to the target step.
2490 MURTHY, RAY, SHORTER, SCHALL, AND THOMPSON
J Neurophysiol • VOL 101 • MAY 2009 • www.jn.org
on May 26, 2009
jn.physiology.orgDownloaded from

and double-step performance in the same manner, using TSRTas a measure of the interval in which the critical events musttranspire to encode the target step and to cancel the originalsaccade plan to produce the compensated saccade to the finaltarget location. As in these previous studies, we will distin-guish visual responses from movement-related activity.
Visual response when the target steps into the receptive field
Figure 6 shows the activity of a representative visuallyresponsive neuron. This neuron responded robustly when a
visual stimulus was presented in its response field. Figure 6Aillustrates the selection process by which this neuron’s activitycan distinguish the presence of a target or a distractor in itsreceptive field. The neural representation of the target waselevated relative to a distractor representation that was reducedor suppressed. Activity was recorded on no-step trials in whichthe monkey correctly shifted gaze to the target. As shownbefore (Thompson et al. 1996), the initial increase of activitywas identical when the stimulus in the response field was atarget or a distractor. Activity continued to increase when thetarget was in the response field, whereas the spike rate de-creased for a distractor. The point at which the two rates ofactivity began to diverge significantly defines the target selec-tion time. This neuron selected the target in its response field110 ms following the presentation of the search array.
Measuring the neural response during no-step saccades doesnot rule out the possibility that the high maintained spike rateassociated with the target being in the response field is becausethat stimulus will be the endpoint of the impending saccade.Distinguishing visual and movement-related processes is dif-ficult because the target and the saccade are in the samelocation in space. The search-step task, however, creates thedissociation of selecting the target and preparing saccadeswhen the monkey shifts gaze away from the singleton targetlocation. Modulation on target-step trials is contrasted withactivity recorded during no-step trials when the monkey cor-
Target step delay (ms)
Prob
abilit
y of
non
com
pens
ated
sac
cade
Search-StepDouble-Step
0 50 100 150 200 250 300
Monkey L
0 50 100 150 200 250 300
Monkey F
0 50 100 150 200 250 3000.0
0.5
1.0
Monkey C
0.0
0.5
1.0
0.0
0.5
1.0
FIG. 4. Performance in search-step (black) and double-step (gray) tasksfrom combined experimental sessions for each monkey. Each data pointrepresents the probability of making a noncompensated saccade at a givenTSD. Corresponding data points are fitted with a cumulative Weibull distri-bution function (see METHODS) to generate a compensation function.
0
2
468
10
12
0 40 80 120 160 200
0
2
468
10
12
0 40 80 120 160 200
0
2
468
10
12
0 40 80 120 160 200
Target step reaction time (ms)
C
B
AMonkey C
Monkey F
Monkey L
Search-step
Double-step
FIG. 5. Distributions of target-step reaction times for each monkey duringthe search-step (black) and double-step (white) tasks.
2491NEURAL CONTROL OF VISUAL SEARCH BY FEF
J Neurophysiol • VOL 101 • MAY 2009 • www.jn.org
on May 26, 2009
jn.physiology.orgDownloaded from

rectly shifted gaze to the target location (Fig. 6, B and C).Activity when the target steps into the neuron’s response fieldis compared with activity in no-step trials in which a distractorremained in the response field for the duration of the trial. Inthis way, the moment that differential activity arises showshow quickly FEF neurons can respond to new visual input.Activity on other trials in which the target steps out of theresponse field is compared with correct no-step trials in whichthe target occupied the response field throughout the trial.Differential activity in this comparison reveals that the neuronresponds to the disappearance of the target by reducing therepresentation of the original target location. Critically, thesecomparisons require matching for saccade latency. As shownearlier, target-step trials with compensated and noncompen-sated saccades differ in saccade latency. Therefore to ensurevalid comparisons, activity on target-step trials must be com-pared with that subset of no-step trials that have an equivalentrange of saccade latencies; we will refer to this subset ofno-step trials as latency-matched trials.
Figure 6, B and C compares the activity of this visual neuronon trials in which the target stepped into the receptive field 67ms after the presentation of initial array with the activity duringlatency-matched no-step trials when the distractor remained inthe receptive field. Selection of the stepped target at its newlocation within the neuron’s receptive field occurred irrespec-tive of whether the monkey shifted gaze to the initial or to thefinal target location, as reported previously (Murthy et al.2001). On step trials in which the monkey shifted gaze cor-rectly to the final target location (Fig. 6B) the activity becamedifferent 180 ms after array presentation, 113 ms after thetarget step, and 37 ms before TSRT. On step trials in which themonkey failed to compensate for the target step and shiftedgaze incorrectly to the initial target location outside the recep-tive field (Fig. 6C) the activity became different 199 ms afterarray presentation, 132 ms after the target step, and 18 msbefore TSRT. The modulation was similar on step trials re-gardless of where the monkey shifted gaze in the array.
The pattern of visual activity observed in double-step trialswas comparable to what was observed in search-step trials(Fig. 7). In both search-step and double-step tasks this neuronselected the new target in the receptive field within TSRT. Inthe absence of distractors, target selection times tended tooccur earlier. Similarly, the response to the target stepping intothe receptive field was earlier and more pronounced than thatobserved in search-step trials. On no-step trials (Fig. 7A) thisvisual neuron selected the target 65 ms after target presenta-tion, which corresponds to the visual latency of the neuron. Ondouble-step trials in which the monkey made a compensatedsaccade to the final target location (Fig. 7B) this neuronmodulated 155 ms after initial target presentation, 71 ms afterthe step, but 29 ms before TSRT. On double-step trials in
which the monkey made a noncompensated saccade to theinitial target location (Fig. 7C) the activity became different158 ms after initial target presentation, 74 ms after the step, but26 ms before TSRT.
To quantify the modulation selecting the target, the ratio ofthe discharge rate in compensated step trials to the discharge
chfe
fss1
_4
-100 0 100 200 300 4000
50
100
150
-100 0 100 200 300 4000
50
100
150
TSRT
chfe
fss1
_4
TSRT
C
B
-100 0 100 200 300 4000
50
100
150
A
chfe
fss1
_4
Time from search array (ms)
Spik
es/s
ecSp
ikes
/sec
Spik
es/s
ec
FIG. 6. Visually responsive neuron during target-step trials in the search-step task when a distractor in the receptive field became the target. Stimulusconditions and saccade direction are diagrammed above the spike densityfunctions; the solid gray circle indicates the location of the neuron’s receptivefield that shifted to a location where the receptive field would reside after thesaccade. The range of saccade latencies is marked on the time axis by the openbar. The vertical red arrow marks the time of differential activity during (A)no-step trials when the target was in the receptive field (thick line) comparedwith no-step trials when distractors were in the receptive field (thin line).B: compensated step trials when the target stepped into the receptive field 67ms after array presentation (blue solid line) compared with latency-matchedno-step trials with distractors in the receptive field (thin black line). The solidvertical line indicates TSD. TSRT is indicated by the dashed vertical line. Thehorizontal bar on the time axis indicates the range of compensated saccadelatencies. C: noncompensated step trials when the target stepped into thereceptive field 67 ms after array presentation (blue dotted line) compared withlatency-matched no-step trials with distractors in the receptive field (thin blackline). The horizontal bar on the time axis indicates the range of noncompen-sated saccade latencies.
TABLE 2. Target-step reaction time (ms)
Search-step Double-step
Monkey Mean Integration Mean Integration
C 116 & 15 114 & 15 103 & 10 103 & 10F 130 & 16 128 & 15 89 & 6 82 & 13L 116 & 27 125 & 26 69 & 11 72 & 23
Values are mean & SD.
2492 MURTHY, RAY, SHORTER, SCHALL, AND THOMPSON
J Neurophysiol • VOL 101 • MAY 2009 • www.jn.org
on May 26, 2009
jn.physiology.orgDownloaded from

rate during the same interval for latency-matched no-step trialswas determined.1 Values #1.0 indicate that the neuron sig-naled the presence of the new target in its receptive field. Thisratio, which we will refer to as step response ratio, wascalculated in the 40 ms interval spanning TSRT. Unusuallyhigh values of the step response ratio (#7) were consideredunreliable because of relatively low discharge rates and so
were not included in the statistical tests. The distribution ofthese ratios across individual session at a given TSD (&17 ms)that yielded maximum number of trials, which was no less than10 trials, is illustrated in Fig. 8.
For the search-step task, the step response ratio for theexample visual neuron at the 67 ms TSD was 2.07 for com-pensated trials and 2.17 for noncompensated trials. The distri-bution of these ratios across the sample of visual neurons ispresented in Fig. 8A. The mean & SE of the step responseratios for all visual neurons was 1.72 & 0.19 (geometricmean ! 1.55, 95% confidence interval [CI] ! 0.66) forcompensated trials and 1.51 & 0.21 (geometric mean ! 1.35,95% CI ! 0.58) for noncompensated trials, indicating activitywas significantly higher when a distractor became the targetversus when it remained a distractor, irrespective of whethermonkeys shifted gaze to it directly for both compensated[t(20) ! 3.69, P ) 0.001] and noncompensated saccades[t(20) ! 2.47, P ! 0.01]. Across all sessions, the step responseratio exceeded 1.0 for 81% of the compensated values and 86%of the noncompensated values. However, the distribution of thestep response ratios in compensated trials was not differentfrom the distribution of the step response ratios in noncom-pensated trials [paired t-test, t(20) ! 1.94; P ! 0.07].
1 According to the race model, the probability of reprogramming a saccadewhen the target is displaced depends on TSRT, the target-step delay, and theform of the distribution of response times on no-step trials. To ensure the mostvalid comparisons between neural activity on target-step trials and no-steptrials, it is necessary to equate trials on the basis of response latency. The logicis that compensated saccades to the final target location must be compared withthe latest portion of the no-step distribution, those saccades that were lateenough that, had the target step occurred, there would be sufficient time toreprogram the saccade to the final target location. Likewise, noncompensatedsaccades must be compared with the no-step saccades with latencies so shortthat had the target step occurred, there would not be enough time to inhibit thesaccade to the original target location.
0
2
4
6
8
10
12
14
1.0 2.0 3.0 4.0 5.0 6.0 7.00
2
4
6
8
10
SStep CompSStep NonComp
DStep CompDStep NonComp
1.0 2.0 3.0 4.0 5.0 6.0 7.0
Visual
Visuomovement
Step response ratio
0.0
0.0
FIG. 8. Visual target selection in the search-step and double-step conditionsin which the target stepped into the receptive field of the neuron. Step responseratios, i.e., ratios of activity of (A) visual and (B) visuomovement neurons at&20 ms TSRT during compensated target-step trials compared with latency-matched no-step trials (open black) and during noncompensated target-steptrials compared with latency-matched no-step trials (solid black) in the search-step task. Ratios of activity of visual and visuomovement neurons at &20 msTSRT during compensated target-step trials compared with latency-matchedno-step trials (open gray) and during noncompensated target-step trials com-pared with latency-matched no-step trials (solid gray) in the double-step taskare stacked in the corresponding bin. Step response ratios are measured at aTSD (&17 ms) that provided the maximum number of trials.
-100 0 100 200 300 4000
50
100
150
-100 0 100 200 300 4000
50
100
150
B
C
Time from target onset (ms)
Spik
es/s
ec
TSRT
TSRT
Spik
es/s
ec
chfe
fss1
_4ch
fefs
s1_4
chfe
fss1
_4Spik
es/s
ec
0
50
100
150
-100 0 100 200 300 400
A
FIG. 7. Visually responsive neuron during double-step trials when thetarget stepped into the receptive field 84 ms following array presentation. Sameneuron and conventions as in Fig. 6.
2493NEURAL CONTROL OF VISUAL SEARCH BY FEF
J Neurophysiol • VOL 101 • MAY 2009 • www.jn.org
on May 26, 2009
jn.physiology.orgDownloaded from

The mean & SE of the step response ratios for visuomove-ment neurons was 1.77 & 0.22 (geometric mean ! 1.53, 95%CI ! 0.43) for compensated trials and 1.72 & 0.23 (geometricmean ! 1.47, 95% CI ! 0.46) for noncompensated trials (Fig.8B). Activity was significantly higher when a distractor be-came the target versus when it remained a distractor, irrespec-tive of whether monkeys shifted gaze to it directly for bothcompensated [t(24) ! 3.51, P ) 0.001] and noncompensatedsaccades [t(24) ! 3.08, P ! 0.002]. Across all sessions, thestep response ratio exceeded 1.0 for 84% of the compensatedvalues and 76% of the noncompensated values. Like visualneurons, visuomovement neurons did not show any difference inthe distributions of the step response ratio of compensated andnoncompensated values [paired t-test, t(24) ! 0.47; P ! 0.64].
Although derived from fewer samples, similar results wereobtained during the double-step task. Activity significantlyincreased when a target suddenly appeared in the receptivefield. The step response ratio for the example visual neuron at84 ms TSD was 3.12 for compensated trials and 4.61 fornoncompensated trials. The mean & SE of the step responseratios derived at a TSD that provided maximum trials in asession for all visual neurons was 1.68 & 1.15 (geometricmean ! 0.78, 95% CI ! 2.26) for compensated trials and1.94 & 1.12 (geometric mean ! 1.41, 95% CI ! 2. 20) fornoncompensated trials (Fig. 8A). Likewise, the mean & SE ofthe step response ratios for visuomovement neurons was1.20 & 0.22 (geometric mean ! 1.13, 95% CI ! 0.43) forcompensated trials and 1.22 & 0.08 (geometric mean ! 1.21,95% CI ! 0.17) for noncompensated trials (Fig. 8B).
To summarize, in both step tasks, activity became greaterwhen the target stepped into the receptive field relative to whenthe distractor or no stimulus remained in the receptive field.The majority of the visually responsive neurons respondedsignificantly to the unexpected appearance of the target in thereceptive field, irrespective of whether the monkeys shiftedgaze to it. This forms the basis of their classification as visualcells.
Visual response when the target steps outof the receptive field
Figure 9 compares the activity of the representative visualneuron during search-step trials when the target stepped out ofthe receptive field 67 ms following array presentation with theactivity during no-step trials when the target remained in thereceptive field. This neuron had a pattern of discharge rate intarget-step trials that was indistinguishable from that in no-steptrials. In other words, this neuron maintained a lingeringrepresentation of the target that had already stepped from theresponse field, as evidenced by step response ratio values closeto 1.0. The step response ratio for the example visual neuron atthe 67 ms TSD was 0.87 for compensated trials and 0.98 fornoncompensated trials. Across the sample of visual neurons,the means & SE of the step response ratio was 0.95 & 0.04(geometric mean ! 0.93, 95% CI ! 0.38) for compensatedtrials and 0.98 & 0.05 (geometric mean ! 0.95, 95% CI !0.39) for noncompensated trials (Fig. 11A). The step responseratio was )1.0 for 61% of the compensated values and 70% ofthe noncompensated values. The modulation was not signifi-cantly less in step trials versus no-step trials, either for com-pensated saccades [t(22) ! %1.4, P ! 0.08] or for noncom-
pensated saccades [t(22) ! %0.41, P ! 0.34]. This means thatthe majority of visual neurons did not show differential mod-ulation in response to the disappearance of the target from thereceptive field, either when the monkey correctly shifted gazeor when the monkey performed incorrectly.
Across the sample of visuomovement neurons, the mean &SE of the step response ratio was 0.98 & 0.06 (geometricmean ! 0.93, 95% CI ! 0.12) for compensated trials and0.93 & 0.03 (geometric mean ! 0.91, 95% CI ! 0.06) fornoncompensated trials (Fig. 11B). The step response ratio was)1.0 for 56% of the compensated values and 70% of thenoncompensated values. This distribution was not significantly)1.0 when monkeys compensated after the target disappearedfrom the receptive field [t(26) ! %0.30, P ! 0.38]. Althoughwhen monkeys failed to compensate and shifted gaze to theoriginal target location in the receptive field the distribution ofstep response ratios was significantly )1.0 [t(26) ! %2.38,P ! 0.01], but a paired t-test shows the distribution in non-compensated trials was not different from the distribution incompensated trials [t(26) ! 0.82, P ! 0.42].
Modulation by the example neuron in double-step trials wasqualitatively similar to that of the search-step activity. In theabsence of distractors, this neuron did not represent the disap-pearance of the target from its response field when the monkeycorrectly shifted gaze elsewhere to the final target location(Fig. 10A) or incorrectly shifted gaze to the original targetlocation in the response field (Fig. 10B), which then containedno visual stimulus at all. The lingering representation of theshifted target by this neuron resulted in a discharge rate in
-100 0 100 200 300 4000
50
100
150
Time from search array (ms)
A
B
-100 0 100 200 300 4000
50
100
150
Spik
es/s
ec
TSRT
TSRT
Spik
es/s
ec
chfe
fss1
_4ch
fefs
s1_4
FIG. 9. Visual activity during target-step trials in the search-step task inwhich the target stepped out of the neuron’s receptive field 67 ms after arraypresentation. A: compensated target-step trials (red solid) and latency-matchedno-step trials (black). B: noncompensated target-step trials (red dotted) andlatency-matched no-step trials (black). Same neuron and conventions as in Fig. 6.
2494 MURTHY, RAY, SHORTER, SCHALL, AND THOMPSON
J Neurophysiol • VOL 101 • MAY 2009 • www.jn.org
on May 26, 2009
jn.physiology.orgDownloaded from

target-step trials similar to that in no-step trials. The mean &SE of the step response ratio for the example visual neuron indouble-step trials at the 84 ms TSD was 0.89 for compensatedtrials and 1.1 for noncompensated trials. Across the sample ofvisual neurons, the mean & SE of the step response ratios was0.90 & 0.07 (geometric mean ! 0.90, 95% CI ! 0.14) forcompensated trials and 0.87 & 0.15 (geometric mean ! 0.84,95% CI ! 0.30) for noncompensated trials (Fig. 11A). Forvisuomovement neurons, the mean & SE step response ratiowas 0.83 & 0.12 (geometric mean ! 0.79, 95% CI ! 0.23) forcompensated trials and 0.89 & 0.04 (geometric mean ! 0.89,95% CI ! 0.08) for noncompensated trials (Fig. 11B).
To summarize, when the target stepped out of the receptivefield, visually responsive neurons either did not register thischange or modestly decreased their spike rate. This indicatesthat FEF visual activity alone may be inadequate to predictsaccade choice. This is consistent with the nature of modula-tion of FEF neurons when monkeys make natural errors invisual search (Thompson et al. 2005a). After FEF visualneurons select a target, they maintain a high level of activityfor that target location even when it becomes invalid.
Movement-related activation when the target steps intothe movement field
Figure 12 illustrates the activity of a representative move-ment neuron in no-step trials and in search-step trials when thetarget stepped into the movement field. This neuron exhibiteda pronounced increase of discharge rate before and duringmemory-guided saccades but little modulation following targetpresentation (not shown). When the target of the search array
appeared in the movement field in no-step trials, this neuron’sactivity began to increase on average 84 ms following presen-tation of the search array (Fig. 12A). This time demarcates thebeginning of the saccade preparation process that concludeswith initiation of the saccade when the activity reaches aspecific threshold discharge rate (Hanes and Schall 1996). Theremaining panels in this figure demonstrate the neuron’s re-sponse on target-step trials in which the target stepped into themovement field 84 ms following the initial presentation of thesearch array. The activity on these step trials is compared withlatency-matched no-step trials when the distractor remained inthe movement field. When the monkey correctly shifted gaze tothe new target in the movement field this neuron’s activitybegan to increase 201 ms after array presentation, 117 ms afterthe step, which was 12 ms before TSRT elapsed (Fig. 12B).Similarly, when the monkey failed to reprogram the saccadeand shifted gaze to the initial target location in error thedischarge rate began to increase 208 ms after array presenta-tion, 124 ms after the step, which was 5 ms before TSRT (Fig.12C). It is important to note that the target-step activity shownin Fig. 12C does not correspond to the initial noncompensatederrant saccade. Instead, this activity is related to the correctivesaccade made subsequent to the initial noncompensated errantsaccade. Although not reinforced, monkeys made quick cor-
-100 0 100 200 300 4000
50
100
150
A
-100 0 100 200 300 4000
50
100
150
B
Spik
es/s
ec
Time from target onset (ms)
TSRT
TSRT
Spik
es/s
ec
chfe
fds1
_4ch
fefd
s1_4
FIG. 10. Visual activity during target-step trials in the double-step task inwhich the target stepped out of the receptive field 84 ms after array presenta-tion. A: compensated target-step trials (red solid) and latency-matched no-steptrials (black). B: noncompensated target-step trials (red dotted) and latency-matched no-step trials (black). Same neuron and conventions as in Fig. 6.
0
2
4
6
8
10
12
14
0.2 0.4 0.6 0.8 1.0 1.2 1.4 1.6 1.8 2.00
2
4
6
8
10
12
14
SStep CompSStep NonComp
Visual
Visuomovement
16
18
DStep CompDStep NonComp
Step response ratio0.2 0.4 0.6 0.8 1.0 1.2 1.4 1.6 1.8 2.0
0.0
0.0
FIG. 11. Visual target selection in the search-step and double-step tasks inwhich the target stepped out of the receptive field. Step response ratios, i.e.,ratios of activity of (A) visual and (B) visuomovement neurons at &20 msTSRT during compensated target-step trials compared with latency-matchedno-step trials (open) and during noncompensated target-step trials comparedwith latency-matched no-step trials (solid). Conventions are the same as thosein Fig. 8.
2495NEURAL CONTROL OF VISUAL SEARCH BY FEF
J Neurophysiol • VOL 101 • MAY 2009 • www.jn.org
on May 26, 2009
jn.physiology.orgDownloaded from

rective saccades on nearly all noncompensated trials. Thepreparation of the corrective saccade occurred in parallel withthe preparation of the initial errant saccade and was the subjectof a previous study (Murthy et al. 2007).
The pattern of activity was similar during the double-step taskas in the search-step task. When a single target was presented andremained in the movement field this neuron began saccade prep-aration 69 ms after target presentation (Fig. 13A). On correcttarget-step trials the activity became different 168 ms afterarray presentation, 84 ms after the step, but 28 ms before TSRT
(Fig. 13B). On incorrect trials, when the monkey shifted gazeto where the target had previously been, the neuron modulated201 ms after array presentation, 117 ms after the step, 5 msfollowing TSRT (Fig. 13C). Again, note that the neural activityfollowing errors in Fig. 13C for the double-step task is in-volved in the production of a corrective saccade following theinitial errant noncompensated saccade.
The step response ratio for the example movement neuron at84 ms TSD was 5.84 for compensated trials and 2.74 fornoncompensated trials. Across the entire movement neuronsample, the mean & SE of the step response ratios was 2.15 &0.34 (geometric mean ! 1.64, 95% CI ! 0.66) for compen-sated trials and 1.26 & 0.12 (geometric mean ! 1.13, 95%CI ! 0.24) for noncompensated trials (Fig. 14). The stepresponse ratio was #1.0 for 71% of the compensated values
Time from target onset (ms)
B
TSRT
TSRT
C
Spik
es/s
ecSp
ikes
/sec
Spik
es/s
ec
-100 0 100 200 300 400
-100 0 100 200 300 400
0
50
100
150
0
50
100
150
A
-100 0 100 200 300 4000
50
100
150
chfe
fss1
_20
chfe
fss1
_20
chfe
fss1
_20
FIG. 13. Movement activity during target-step trials in the double-step taskin which the target stepped into the response field 84 ms after array presen-tation. A: correct no-step trials when the target was in (thick) and out (thin) ofthe response field. B: compensated trials (blue solid) and latency-matchedno-step trials (black). C: noncompensated trials (blue dotted) and latency-matched no-step trials (black). Same neuron and conventions as in Fig. 12.
TSRT
TSRT
B
C
Spik
es/s
ecSp
ikes
/sec
TSRT
TSRT
-100 0 100 200 300 400
-100 0 100 200 300 400
Time from search array (ms)
0
50
100
150
0
50
100
150
A
0
50
100
150
-100 0 100 200 300 400
Spik
es/s
ec
chfe
fss1
_20
chfe
fss1
_20
chfe
fss1
_20
FIG. 12. Movement activity during target-step trials in the search-step taskin which the target stepped into the neuron’s response field 84 ms after arraypresentation. Stimulus conditions and saccade direction are diagrammed in therectangular boxes. A solid gray circle indicates the location of the neuron’sresponse field. The vertical red arrow marks the time of differential activityduring (A) correct no-step trials when the target was in (thick) the responsefield compared with correct no-step trials when the target was out (thin) of theresponse field. B: compensated target-step trials (blue solid) compared withlatency-matched no-step trials (black). The horizontal bar indicates the rangeof compensated saccade latencies. C: noncompensated trials (blue dotted)compared with latency-matched no-step trials (black). The horizontal barindicates the range of noncompensated saccade latencies.
2496 MURTHY, RAY, SHORTER, SCHALL, AND THOMPSON
J Neurophysiol • VOL 101 • MAY 2009 • www.jn.org
on May 26, 2009
jn.physiology.orgDownloaded from

but for 67% of the noncompensated values. When the targetstepped into the movement field, the step response ratio wassignificantly #1.0 for both compensated [t(23) ! 3.40, P !0.001] and noncompensated saccades [t(23) ! 2.11, P ! 0.02].Modulation in step trials at a given TSD was greater forcompensated saccades than that for noncompensated saccades[paired t-test, t(23) ! 3.03, P ! 0.003].
In double-step trials this example movement neuron had astep response ratio 5.74 for compensated trials and 1.49 fornoncompensated trials. Across the population of movementneurons tested with the double-step task, the average stepresponse ratio for the double-step task was 2.66 & 1.40(geometric mean ! 2.04, 95% CI ! 2.75) for compensatedsaccades and 1.62 & 0.57 (geometric mean ! 1.45, 95% CI !1.11) for noncompensated saccades (Fig. 14).
To summarize, movement-related neurons contribute to sac-cade production by increasing their discharge rates when atarget appeared in their movement fields such that monkeysshift gaze to it. However, in contrast to visual neurons, move-ment neurons exhibited weaker or no modulation before TSRTif monkeys made noncompensated gaze shifts to the target atits original location outside the movement field. In other words,noncompensated saccades were produced because the activityof the movement neurons producing the saccade to the originaltarget location reached the threshold to trigger the saccade.
Movement-related activation when the target steps outof the movement field
The experimental condition in which the target steps out ofthe movement field provides an opportunity to distinguishneurons that play an active role in saccade control. Activityduring target-step trials was compared with that in latency-matched no-step trials when the target remained in the move-ment field. If a neuron’s discharge rate becomes significantlyless in the compensated target-step trials than that in thelatency-matched no-step trials before TSRT, then that neuroncan be said to directly control saccade initiation (Hanes et al.1998; Pare and Hanes 2003). A step response ratio significantly)1.0 when the target steps away from the movement field
identifies neurons that instantiate the process of canceling thepartially prepared saccade toward the initial target locationsuch that the monkey compensates for the target step byshifting gaze to the new target location outside of the move-ment field.
Figure 15 compares the activity of a representative move-ment neuron during target-step trials in the search-step taskwhen the target stepped out of the movement field 84 msfollowing array presentation. When the monkey correctlyshifted gaze to the new target outside of the movement fieldthis neuron ceased its growth of activity 208 ms after arraypresentation, 124 ms after the target-step, which was 5 msbefore TSRT elapsed (Fig. 15A). From this point, the activitycontinued to diminish, indicating that the saccade to the targetthat had originally appeared in the movement field was can-celed. In contrast, when the monkey failed to reprogram thesaccade and shifted gaze to the initial target location in errorthe discharge rate steadily increased after array presentation tothe threshold to trigger the saccade, seemingly uninfluencedby the target step so that gaze was errantly shifted to thestimulus into the movement field that, by then, was a distractor(Fig. 15B). Similar patterns of activity were produced by thismovement neuron during double-step trials when the targetstepped out of the movement field. When the monkey re-sponded correctly and shifted gaze outside of the movementfield the neuron began to diminish its firing rate 202 ms afterpresentation of the initial target, which was 118 ms after thetarget step and 5 ms after TSRT (Fig. 16A). In contrast, whenthe monkey failed to control gaze appropriately and made an
-100 0 100 200 300 400
0
50
100
150
0
50
100
150
-100 0 100 200 300 400Time from search array (ms)
A
B
TSRT
TSRT
Spik
es/s
ecSp
ikes
/sec
chfe
fss1
_20
chfe
fss1
_20
FIG. 15. Movement activity during target-step trials in the search-step taskin which the target stepped out of the neuron’s response field 84 ms after arraypresentation. A: compensated step trials (red solid) and latency-matchedno-step trials (black). B: noncompensated step trials (red dotted) and latency-matched no-step trials (black). Same neuron and conventions as in Fig. 12.
1.0 2.0 3.0 4.0 5.0 6.0 7.00
2
4
6
8
10
Step response ratio
12SStep CompSStep NonComp
DStep CompDStep NonComp
Movement
0.0
FIG. 14. Saccade preparation in the search-step and double-step tasks inwhich the target stepped into the movement field. Ratios of activity ofmovement neurons at &20 ms TSRT during compensated target-step trialscompared with latency-matched no-step trials (open) and during noncompen-sated target-step trials compared with latency-matched no-step trials (solid).
2497NEURAL CONTROL OF VISUAL SEARCH BY FEF
J Neurophysiol • VOL 101 • MAY 2009 • www.jn.org
on May 26, 2009
jn.physiology.orgDownloaded from

errant saccade to the initial target location the neuron’s activityfailed to subside (Fig. 16B). The pattern of modulation of FEFmovement neurons during target-step trials in the search-stepand double-step tasks was effectively identical to that observedin FEF and SC during the saccade stop signal task (Hanes et al.1998; see also Pare and Hanes 2003).
The step response ratio for the example movement neuron at84 ms TSD was 0.39 for compensated trials and 1.12 fornoncompensated trials in the search-step task. Across the entiremovement neuron sample, the mean & SE of the step responseratios was 0.74 & 0.06 (geometric mean ! 0.69, 95% CI ! 0.11)for compensated trials and 1.02 & 0.03 (geometric mean ! 1.01,95% CI ! 0.05) for noncompensated trials (Fig. 17). The stepresponse ratio was )1.0 for 86% of the compensated valuesand 50% of the noncompensated values. As expected, theseratios were significantly less for compensated saccades[t(21) ! %4.68, P ) 0.001] but not for noncompensatedsaccades [t(21) ! 0.86, P ! 0.8]. The average step responseratio for noncompensated saccades was higher than that forcompensated saccades across the sample of neurons [pairedt-test, t(21) ! 4.45, P ) 0.001].
In the double-step task, the step response ratio for theexample movement neuron at 84 ms TSD was 0.47 forcompensated trials and 1.08 for noncompensated trials.Across the entire movement neuron sample, the mean & SEof the step response ratios was 0.62 & 0.08 (geometricmean ! 0.60, 95% CI ! 0.17) for compensated trials and1.01 & 0.02 (geometric mean ! 1.01, 95% CI ! 0.03) fornoncompensated trials (Fig. 17).
Temporal modulation of FEF neurons during search-step
Among neurons with significant modulation in target-steptrials, measuring the time of modulation of activity relative tothe behavioral TSRT yields useful information concerning therole that visual and movement neurons can play in search-stepperformance. Concurrent measurements of TSRT and the timeof modulation allow us to establish a criterion that identifiesneurons that can play an active role in selecting targets,specifying saccade endpoints, and controlling saccade initia-tion. Such neurons must modulate prior to TSRT; otherwise,they would not be able to contribute to these processes asrequired by the race model. In this section we summarize thepopulation results from target-step trials in the search-step task.Because of the small sample sizes the summary statistics fromthe double-step task were not as stable and so are not reported;however, results were in general agreement with the patternsobserved in the search-step data.
For this study we selected only data from sessions in whichneurons modulated after the target step because modulationearlier than TSD cannot be considered relevant to the task.Figure 18A plots cumulative distributions of the modulationtimes for visual, visuomovement, and movement neurons rel-ative to the TSRT when monkeys compensated for the targetstepping into their response field. These data reveal threerelationships. First, the pie charts indicate that a high fractionof visual (83%), visuomovement (89%), and movement(100%) neurons were modulated. Thus nearly all such neuronsin FEF respond when a distractor becomes a target in theirresponse field. Second, the distributions of the modulationtimes were not significantly different from each other [one-wayANOVA, F(68) ! 1.27, P ! 0.29]. Thus the response to thetarget stepping into the response field occurred simultaneouslyacross all neurons recorded in FEF. Finally, the median mod-ulation time relative to TSRT across the population of neuronswas 0 ms. The mean & SE modulation time relative to TSRTfor visual, visuomovement, and movement neurons was %5 &6, %1 & 8, and 11 & 8 ms, respectively. Across the populationthe mean & SE modulation time (2 & 4 ms) was not signifi-cantly different from TSRT [t(68) ! 0.4, P ! 0.69]. In otherwords, when monkeys compensated for the target stepping intoneurons’ response fields, the neural modulation in FEF coin-
0.2 0.4 0.6 0.8 1.0 1.2 1.4 1.6 1.8 2.00
2
4
6
8
10
12
Movement
Step response ratio
SStep CompSStep NonComp
DStep CompDStep NonComp
0.0
FIG. 17. Saccade preparation in the search-step and double-step tasks inwhich the target stepped out of the neuron’s movement field. Ratios of activityof movement neurons at &20 ms TSRT during compensated target-step trialscompared with latency-matched no-step trials (open) and during noncompen-sated target-step trials compared with latency-matched no-step trials (solid).Conventions are the same as those in Fig. 8.
-100 0 100 200 300 4000
50
100
150
-100 0 100 200 300 4000
50
100
150
Spik
es/s
ec
Time from target onset (ms)
A
B
TSRT
TSRT
Spik
es/s
ec
chfe
fss1
_20
chfe
fss1
_20
FIG. 16. Movement activity during target-step trials in the double-step taskin which the target stepped out of the neuron’s response field 84 ms after arraypresentation. A: compensated trials (red solid) and latency-matched no-steptrials (black). B: noncompensated step trials (red dotted) and latency-matchedno-step trials (black). Same neuron and conventions as in Fig. 12.
2498 MURTHY, RAY, SHORTER, SCHALL, AND THOMPSON
J Neurophysiol • VOL 101 • MAY 2009 • www.jn.org
on May 26, 2009
jn.physiology.orgDownloaded from

cided with the TSRT calculated from the race model applied tothe performance while each neuron was sampled. The variabil-ity of the times of neural modulation relative to TSRT isprobably due largely to irreducible measurement error andintrinsic randomness of the race processes described by TSRT.
Furthermore, as indicated by the range of latencies of thecompensated saccades, all of the neural modulation precededthe initiation of the compensated saccade.
Figure 18B plots the times of modulation of visual, visuo-movement, and movement neurons relative to TSRT whenmonkeys compensated for the target stepping out of theirresponse field. Several results are evident. First, relative towhat was observed when the target stepped into responsesfields, substantially lower fractions of visual neurons (58%)and visuomovement neurons (36%), but only a somewhatlower fraction of movement neurons (71%), were modulated. Itshould be noted that a higher fraction of movement neuronswere modulated than were visually responsive neurons. Sec-ond, the distributions of modulation times were not signifi-cantly different from each other [one-way ANOVA, F(40) !2.44, P ! 0.10]. Thus the response to the target’s beingreplaced by a distractor occurred simultaneously across thepopulation of FEF neurons sampled. Finally, the means & SEmodulation times for visual (%38 & 13 ms), visuomovement(%60 & 10 ms), and movement neurons (%28 & 5 ms)preceded TSRT. Across the population this time (%39 & 6 ms)was significantly earlier than TSRT [one-tailed t-test, t(40) !%6.83, P ) 0.001]. These data indicate that when monkeyscompensated for the target stepping away from their responsefield, a smaller fraction of neurons was modulated comparedwith when the target stepped into the response field. Theprocesses of identifying that the target is no longer the targetand inhibiting the original saccade started before TSRT, thetime at which the original saccade was actively inhibited(Boucher et al. 2007; Camalier et al. 2007). Furthermore, asindicated by the range of latencies of the compensated sac-cades, all of the neural modulation preceded the initiation ofthe compensated saccade.
These results were quantitatively but not qualitatively dif-ferent if the time of the difference in neural activity wasmeasured from the area under the receiver operating charac-teristic (ROC) curve calculated from sets of compensated steptrials compared with the latency-matched no-step trials. Weconsidered only those neurons that provided at least five trialsin both sets. According to this approach when a distractorbecame the target in their response field, the majority ofneurons (75% visual, 79% visuomovement, and 92% move-ment) in FEF responded. The means & SE modulation timesmeasured relative to TSRT were 12 & 6 ms for visual neurons,16 & 8 ms for visuomovement neurons, and 25 & 6 ms formovement neurons; these distributions were not significantlydifferent from each other [F(2,61) ! 0.9, P ! 0.41]. Across thepopulation the mean & SE modulation time (18 & 4 ms) wasgreater than TSRT [t(61) ! 4.4, P ) 0.001]. When the targetwithin the neuron’s response field became a distractor, accord-ing to the ROC analysis 33% of visual neurons, 39% ofvisuomovement neurons, and 67% of movement neurons re-sponded. The mean & SE modulation times relative to TSRTfor visual neurons (10 & 21 ms), visuomovement neurons(%38 & 19 ms), and movement neurons (16 & 8 ms) weresignificantly different from each other [F(2,34) ! 3.9, P !0.03]. Across the population the average time of modulation onthese trials (%3 & 9 ms) was not different from TSRT [t(34) !%0.3, P ! 0.8]. Compared with the more sensitive method ofmeasuring the presence and time of neural modulation, theROC analysis measured a lower fraction of neurons modulated
-150 -100 -50 0 50 100 150
step in
Visual
Visuomovement
Movement
0%
50%
100%
-150 -100 -50 0 50 100 1500%
50%
100%step out
Visual
Visuomovement
Movement
A
B
-150 -100 -50 0 50 100 1500%
50%
100% Step InStep Out
Time of modulation relative to TSRT (ms)
C
Visual
Visuomovement
Movement
FIG. 18. Distributions of times of modulation of activity for visual (graysolid), visuomovement (black dotted), and movement (black solid) neuronswhen the target stepped into (A) or away from (B) the response field.Distributions are aligned on TSRT. Vertical bar indicates time of target step.Horizontal bar delimits the 5th to 95th percentile of compensated saccadelatencies; median time is indicated by arrow. Pie charts indicate the fraction ofneurons that were modulated. C: distributions of times of modulation ofactivity for visual (red), visuomovement (green), and movement (blue) neu-rons, when the target stepped into (solid) or away from (dotted) the responsefield, that were modulated in both trial conditions. When monkeys compen-sated for the target stepping into the response field, frontal eye field (FEF)neurons were modulated concomitantly with TSRT. When monkeys compen-sated for the target stepping away from the response field, FEF neurons weremodulated before TSRT.
2499NEURAL CONTROL OF VISUAL SEARCH BY FEF
J Neurophysiol • VOL 101 • MAY 2009 • www.jn.org
on May 26, 2009
jn.physiology.orgDownloaded from

with later modulation times. This outcome is entirely consis-tent with the original observation that the beginning of theselection process precedes the midpoint of the selection pro-cess (see Fig. 12; Thompson et al. 1996) and highlights whythe more sensitive procedure is preferred for this analysis.
The comparison illustrated in Fig. 18, A and B consists ofsamples from individual neurons including neurons that weremodulated only when the target stepped inside the neuron’sresponse field but not when the target stepped out from theneuron’s response field; therefore the comparison across timesof modulation is confounded by a comparison across neurons.This limitation was addressed in the data illustrated in Fig.18C, which shows the cumulative distributions of modulationtimes relative to TSRT for the different conditions for thesubset of neurons that exhibited modulation in both types oftrials. Overall, FEF neurons modulated on average 43 msearlier when the target stepped out of the neuron’s responsefield compared with when the target stepped into the responsefield [paired t-test, t(40) ! 5.56, P ) 0.001]. To test whetherthe earlier modulation was mediated by visual neurons orsaccade-related neurons or both, we compared each class ofneurons separately. The mean & SE time at which visualneurons signaled that a target became a distractor (%38 & 13ms) was not different from the mean & SE time at which theseneurons signaled that a distractor became the target (%10 & 7ms) [paired t-test, t(13) ! 1.83, P ! 0.09]. On the other hand,the means & SE time taken by visuomovement and movementneurons (visuomovement: %60 & 10 ms; movement: %28 & 5ms), to inhibit the saccade directed to the original targetlocation preceded the time taken (visuomovement: 4 & 8 ms;movement: 14 & 10 ms) to initiate the saccade directed to thefinal location of the target [paired t-test, visuomovement:t(9) ! 4.8, P ) 0.001; movement: t(16) ! 4.0, P ) 0.001].These results suggest several conclusions. First, a group ofneurons in FEF participate only in selection of the location ofthe target and program a saccade to that location, but do notrespond differentially when the target leaves their responsefield. Second, a group of movement-related neurons thatrespond in both types of trials cancel preparation of theoriginal saccade before they initiate the preparation of thefinal saccade. Third, visual neurons register the appearance andthe disappearance of the target through the same range oftimes.
D I S C U S S I O N
Since the introduction of the double-step task by Westhei-mer (1954) oculomotor control has been explored in muchdetail using this perturbation (Aslin and Shea 1987; Becker andJurgens 1979; Findlay and Harris 1984; Hallett and Lightstone1976a,b; Hou and Fender 1979; Komoda et al. 1973; Levy-Schoen and Blanc-Garin 1974; Lisberger et al. 1975; Wheelesset al. 1966). However, unlike many other double-step studiesfor which the focus was on coordinate transformations used bythe oculomotor system (Gnadt and Andersen 1988; Goldbergand Bruce 1990; Guthrie et al. 1983; Hallett and Lightstone1976a,b; Honda 1989) or the adaptive properties of the oculo-motor system (e.g., Deubel et al. 1986), we used the double-step and search-step tasks to study the dynamic interaction ofvisual processing and saccade programming, consistent withthe motivation of the original behavioral studies (Hou and
Fender 1979; Komoda et al. 1973; Westheimer 1954; see alsoCorneil and Munoz 1996). The conceptual framework thatperformance is the outcome of a race between a GO processthat initiates a saccade and a STOP process that inhibits thesaccade enhanced our application. The race model has beenused successfully to explain performance in countermanding(stop signal) tasks in which subjects withhold gaze shifts inresponse to a stop-signal (Hanes and Schall 1995). Therequirement of the countermanding task to withhold a sac-cade in response to the stop signal was somewhat differentfrom that in the double-step and search-step tasks to both with-hold the original saccade and redirect gaze to the current positionof the target, although the core motivation was the same (e.g., DeJong et al. 1995; Verbruggen et al. 2008). However, unlike thesaccade stop signal task used in previous electrophysiologicalinvestigations (Hanes et al. 1998; Pare and Hanes 2003) inwhich the focus was on the relation between gaze holding(mediated by fixation neurons) and gaze shifting (mediated bymovement neurons) processes, the search-step task can clarifythe relation between the activity of visual neurons that performtarget selection and the activity of movement neurons thatrealize saccade production to the selected target.
In this study we reported in more detail how saccades can beerroneously directed to the original location of the target evenwhen most visual neurons select the new target stepping intotheir response field early enough to have been used for saccadeplanning (Murthy et al. 2001). We also report several newobservations. First, unlike the clear response to the changefrom a distractor to a target, we observed that a lower fractionof visual neurons responded to the replacement by a distractoror outright disappearance of the target from their receptive fieldand were modulated by the removal of the target did soconcomitant with the selection of the new target location.Second, we report on how the production of either erroneous orcorrect saccades is correlated with the modulation times acrossthe populations of movement-related neurons. As observedpreviously (Brown et al. 2008; Hanes and Schall 1996; Wood-man et al. 2008), saccades are initiated when the activity ofmovement-related neurons grows stochastically to a specificthreshold. When the target steps to a new location, incorrectnoncompensated saccades to the original location were pro-duced when the activity of the movement neurons preparingthe first saccade reached their threshold despite the targetstep. Correct compensated saccades to the final target loca-tion were produced when the activity of the movementneurons preparing the first saccade was prevented fromreaching the threshold and the activity of the movementneurons preparing the compensated saccade instead grew tothe threshold. Thus whereas visual neurons signal onlyweakly the removal of the target from their response fieldwhen compensated saccades are produced, movement neu-rons signal the change of status of the stimulus in a pro-nounced manner so as not to produce the erroneous saccade.Also, we found that the inhibition of the incorrect saccadepreceded the preparation of the correct saccade began. Theseresults highlight the distinct roles that FEF visual and move-ment-related neurons play during the control of target selectionand provide new insights into the control of target selection andsaccade production during visual search.
2500 MURTHY, RAY, SHORTER, SCHALL, AND THOMPSON
J Neurophysiol • VOL 101 • MAY 2009 • www.jn.org
on May 26, 2009
jn.physiology.orgDownloaded from

Race model of target-step saccade performance
Earlier investigators suggested that performance of the clas-sic saccade double-step task, in which subjects are expected toredirect gaze to the final target location, can be accounted forin terms of a race between two processes (Becker and Jurgens1979; Lisberger et al. 1975). Recently, we have shown thatperformance in the saccade double-step and search-step taskscan be analyzed in the same manner as performance in the stopsignal task to yield a measure corresponding to SSRT that werefer to as target-step reaction time (TSRT); we also showedthrough formal stochastic modeling that only certain racemodel architectures can account for saccade double-step andsearch-step performance of macaques and humans (Camalieret al. 2007). A race simply between two GO processes pro-ducing the alternative saccades could not fit the data. Anexplicit STOP process is needed to interrupt the first GOprocess producing the saccade to the original target location.Taken all together, the probability and latencies of compen-sated and noncompensated saccades as well as the incidenceand latency of corrective saccades after errors could be ac-counted for most effectively by an architecture in which theSTOP process that races to interrupt the first GO process runsin parallel with the second GO process that produces thecompensated saccade. The characteristic of the STOP processhas been elaborated in the results of Kapoor and Murthy (2008)who observed an additive interaction between the inhibitionthat withholds memory-guided saccades and TSRT. Thus re-directing saccades in double-step and search-step tasks requiresa presumably inhibitory interruption process. The duration ofthis process can be derived from performance data in the formof TSRT. In other words, TSRT measures the time at which theinterruption process is effective. The TSRT measured in dou-ble-step trials (+100 ms) is comparable to what is measured inthe saccade stop signal task with comparable stimulus lumi-nance values. The value of TSRT tends to be longer forsearch-step (+125 ms) especially if the target and distractor aremore similar, thus making the target step less salient. Thelonger TSRT in search-step trials compared with double-step(or stop signal) trials can be understood as simply due todelayed encoding and selection of the stimulus signaling thechange of saccade (compare Figs. 6 and 7).
To summarize, the experimental design of the target-steptask creates a condition in which visual selection and saccadeproduction can be dissociated. Moreover, the measurement ofTSRT affords an ability to distinguish neurons with activitymodulating in time to effect target selection or saccade prep-aration. Thus for our purpose, the most critical feature of theproposed race model is the ability to estimate the TSRT andrelate it to the pattern of activity in visual and movementneurons to understand the relationship between visual targetselection and saccade production during visual search.
Visual response to the target step
An abrupt change in planning of a saccade in response to thevisual perturbation provided a means to investigate the rela-tionship between the modulation of visual activity associatedwith target selection and saccade production. In this report weprovide a thorough description of how the time course of visualselection of the target stepped into neuron’s receptive field
influenced preparation of the correct saccade to that target andhow quickly visually responsive neurons responded to theremoval or replacement of the target from its receptive field forthe prevention of error. We observed that the majority of thevisually responsive neurons registered the step of the target intothe receptive field by increasing their discharge rate. This modu-lation was concomitant with the TSRT when the preparation ofthe saccade to the original target location was interrupted. Thisobservation notwithstanding, another important result is that thevisual target selection process by itself did not reliably predictwhether the original saccade would be canceled. In otherwords, the step of the target into neurons’ receptive field wasregistered regardless of whether a compensated saccade wasultimately produced to the final target location (Murthy et al.2001). Thus although selecting the new target location isnecessary for producing an accurate, compensated saccade, it isnot sufficient.
If the neural representation of the new target location doesnot specify saccade production, perhaps the neural representa-tion of the old target location would suffice. In fact, though, wefound that when the target became a distractor (search-step) oreven disappeared (double-step), fewer visually responsive neu-rons were significantly modulated. This result is useful tocompare with what these visual neurons in FEF do during thestop signal task when the target in the receptive field does notchange when the stop signal appears at the fixation spot (Haneset al. 1998). Under this condition, few of the visual neuronswere modulated at all and those that were did so well afterSSRT. The fact that in this study some of the visual neuronsresponded to the replacement of the target by a distractor intheir receptive field before TSRT is consistent with reports thatsome FEF neurons can signal stimulus features in the searcharray (e.g., Bichot et al. 1996; Peng et al. 2008; Xiao et al.2006).
These results have several implications. First, this pattern ofresults provides further evidence that the activity of visuallyresponsive neurons in FEF is not sufficient to specify saccadeproduction. This general conclusion is consistent with previousstudies showing that the timing of target selection by mostvisual neurons in FEF or other structures does not predict thetiming of saccade initiation during a pop-out search (McPeekand Keller 2002a; Sato and Schall 2003; Thompson et al. 1996;see also Ipata et al. 2006; Shen and Pare 2007; Thomas andPare 2007) and that these neurons select the target of a searcharray when no saccade is produced (Thompson et al. 1997,2005b).
Second, by instructing subjects to follow the sequence ofstimuli instead of redirecting gaze, the double-step task hasbeen used extensively to investigate how the visual and ocu-lomotor system update representations and perform coordinatetransformations both psychophysically (Awater and Lappe2006; Dassonville et al. 1995; Guthrie et al. 1983; Hallett andLightstone 1976a,b; Park et al. 2003; Schlag and Schlag-Rey2002) and physiologically (Goldberg and Bruce 1990; Maysand Sparks 1980; Tian et al. 2000). In particular, previousstudies have indicated that visual neurons in sensorimotorstructures respond to a stimulus flashed just before a saccade ata location that will be in the receptive field of a neuron after thesaccade. Neurons that exhibit this kind of modulation wereinitially found in the lateral intraparietal area (Duhamel et al.1992; Heiser and Colby 2006) and, subsequently, in FEF
2501NEURAL CONTROL OF VISUAL SEARCH BY FEF
J Neurophysiol • VOL 101 • MAY 2009 • www.jn.org
on May 26, 2009
jn.physiology.orgDownloaded from

(Sommer and Wurtz 2006; Umeno and Goldberg 1997, 2001).This pattern of modulation has been referred to as remapping.In monkeys performing a pop-out visual search task it has beenreported that visually responsive neurons in the SC representthe location of the salient object in a search array even ifmonkeys shift gaze to a distractor before producing a correc-tive saccade to the overlooked target (McPeek and Keller2002b). These authors suggested that the sustained represen-tation by these visual neurons remapped the location of thetarget in the reference frame of the errant saccade to affordrapid error correction. If it is the case that visual targetselection is necessary but not sufficient for saccade production,then the functional role of this remapping relative to saccadeproduction is uncertain. However, using this search-step taskwe have previously described how movement-related neuronsin FEF produce activity in time and pattern sufficient toproduce corrective saccades (Murthy et al. 2007).
Third, to the extent that visual neurons in FEF correspond toattention allocation (Corbetta and Shulman 2002; Juan et al.2004; Schall 2004), these results can be related to recentobservations about the allocation of attention in visual searchtasks that include abrupt or competing stimuli (Schreij et al.2008; Theeuwes and Burger 1998). First, an influential modelof visual attention proposed that attention is disengaged fromone location before it engages at another location (e.g., Posneret al. 1984); in contrast to this, the fact that FEF neuronsselected vigorously the target at the new location, whereasmany other neurons were still active for the old target location,indicates that visual attention can be directed to a new locationbefore it is removed from an old location (Sato and Schall2003; Schall 2004; see also Khayat et al. 2006; Kusunoki andGoldberg 2003). Second, the lingering representation of the oldtarget location after the new location has been selected byneurons in FEF leads to the prediction that attention may be atleast momentarily split between the two target locations (e.g.,Bichot et al. 1999).
Response of movement-related neurons to the target step
The observation that saccades are initiated when the activity ofFEF movement neurons increases stochastically to a thresholdwas confirmed in this study (Brown et al. 2008; Hanes and Schall1996; Woodman et al. 2008). Movement neurons produced higherdischarge rates when monkeys made correct saccades to thetarget that stepped into their movement field compared withwhen saccades were directed elsewhere. Furthermore, as ob-served previously in monkeys performing the saccade stopsignal task (Brown et al. 2008; Hanes et al. 1998; Pare andHanes 2003), preparation of the saccade to the initial targetlocation through the gradual growth of activity can be inter-rupted to permit production of the compensated saccade byother movement neurons. This modulation of movement-re-lated activity occurred coincident with TSRT and before thecompensated saccade latency, demonstrating in another taskthat the signal produced by these neurons is sufficient tocontrol saccade initiation. What is the origin of the signal thatinterrupts the growth of the movement-related activity in com-pensated trials? One possibility is that the replacement of thetarget by distractor in visual neurons’ receptive field. Thedistribution of visual target deselection times that started con-siderably earlier than TSRT was statistically indistinguishable
from the distribution of movement neuron modulation times.This suggests that the interruption of movement activity in FEFmay occur as soon as the target displacement is identified byvisual neurons. However, a lower proportion of visual neuronsexhibited deselection of the target compared with the majorityof visual neurons that selected the target, indicating that analternate source of stop signal could also be the selection of thenew target location that occurred concomitant with TSRT. Thepresent study corroborates the general finding that the inter-ruption of activity of FEF movement neurons might be medi-ated by visual neurons encoding target step; whether selectionor deselection of the target exclusively play a critical role insaccade choice is a subject of further investigation.
A recent study by Ludwig et al. (2007) describes a stochasticaccumulator model of double-step saccade performance. Thismodel included the following characteristics: saccade directionis coded by pools of units with broad movement fields; thepresentation of a target results in increased activation of theunit centered on the target location with progressively lessactivation in neighboring units; the activation of each unitcorresponds to evidence in favor of the target being in itsresponse field; the activation of each unit is subject to leakagesuch that if the target steps out of the movement field, activa-tion passively decays; a saccade is generated to the locationcoded by the unit with activation that reaches a specificthreshold; the latency of the saccade is determined by the timethat the threshold is reached plus a constant efferent delay; therate of accumulation varies randomly across target onsets andwithin a trial; the within-trial noise is independent across units.This model could account for major features of the dataincluding the production of averaging saccades. Although thismodel is probably correct in many respects, the current find-ings highlight a potentially major shortcoming. The reductionof activation exclusively through leakage appears insufficientto account for the appearance of the activity of FEF movementneurons when the original saccade is canceled. In fact, a recentinteractive race model of saccade stopping shows that activeinhibition is necessary to turn off the units that would haveproduced the original saccade (Boucher et al. 2007). Based onthe chronometric analysis shown in Fig. 18, the likely source ofsuch inhibition to movement neurons, which is presumablymediated by inhibitory interneurons, is from the activity ofvisual neurons representing the new target location. The pro-posed physiological model is consistent with the GO–GO–STOP model that explains behavioral performance in target-step tasks (Camalier et al. 2007; Kapoor and Murthy 2008).
Does such chronometry necessarily imply that visual selec-tion instantiates the STOP process? We do not think this to bethe case for three reasons. First, if visual selection were todisrupt movement preparation directly, then this would requirethe STOP process to be spatially specific. However, in aseparate behavioral study we have shown that the STOPprocess is additive with a gaze control process that withholdsa planned saccade (Kapoor and Murthy 2008). Such additivityis more consistent with a STOP process that is either spatiallynonspecific or that has a foveal location. Second, a directvisual-to-motor suppression implies that visual neurons wouldneed to have extensive inhibitory connections with motorrepresentations encompassing all incongruent or nonmatchedspatial locations. Such connectivity is unlikely to foster flexiblevisual-to-motor mapping that is the hallmark of adaptive sen-
2502 MURTHY, RAY, SHORTER, SCHALL, AND THOMPSON
J Neurophysiol • VOL 101 • MAY 2009 • www.jn.org
on May 26, 2009
jn.physiology.orgDownloaded from

sorimotor behavior. Instead it is more parsimonious to thinkthat movement interruption occurs through a nonspecific STOPprocess that suppresses potential saccades to all other objects inthe visual field. Such a global signal need not be confined to asingle brain structure but probably encompasses a distributednetwork with nodes including the FEF, SC, prefrontal cortex,thalamus, basal ganglia, and brain stem. These areas have beenshown to possess signals related to visual fixation and togetherare likely to instantiate the STOP process. Third, chronometricanalysis of the current study provides evidence in support of aglobal STOP architecture. Because such a signal should not beable to distinguish between GO processes producing the non-compensated saccade and the compensated saccade, the time ofselection of the compensated saccade is expected to be delayedrelative to the time of movement deselection. This prediction isborne out by the measurement of modulation times (Fig. 18).Interestingly the nearly 30-ms delay between responding to thetarget leaving response field and responding to the targetentering the response field matches well with simulations of aninteractive race model architecture of countermanding saccadeperformance that predicts the duration of the active phase ofthe STOP process is about 30 ms (Boucher et al. 2007). Suchan architecture does not necessarily imply that subsequentcorrective saccades need to be slow. We suggest that executivecontrol during error correction may selectively enhance cor-rective saccades programming such that the reaction times ofthe corrective saccades may be sufficiently fast to producerapid or even predictive correction (Camalier et al. 2007;Murthy et al. 2007; Ray et al. 2004).
On the classification of neuron types
The adaptability and arbitrariness of macaque and humanbehavior cannot be explained without a distinction between sen-sory and motor processes. In fact the hallmark of the double-steptask, for which it has been extensively used by physiologists, is itsuse as a paradigm to dissociate neurons coding stimuli in retinalcoordinates, presumably reflecting sensory processing, from thoseneurons coding stimuli in spatial coordinates, presumably formotor preparation (Bracewell et al. 1996; Guthrie et al. 1983;Mazzoni et al. 1996). Although in this study we focus on thecontrol of target selection, interpretation of the results alsohinges on the distinction between visually evoked and move-ment-related activity. Although the complexity of identifyingneural activity with cognitive processes (Schall 2004) is acomplex issue, we do not see how some such identification canbe avoided to interpret the results. Implicit in the descriptionsof most studies describing sensorimotor processing, numerousinvestigators have described visual, visuomovement, andmovement neurons in FEF (Bruce and Goldberg 1985; DiCarloand Maunsell 2005; Helminski and Segraves 2003; Segravesand Goldberg 1987; Umeno and Goldberg 1997, 2001) and SC(Horwitz and Newsome 1999; Mays and Sparks 1980; McPeekand Keller 2002a) and have identified visual neurons in FEFand SC with visual processing but not saccade programming(Horwitz and Newsome 1999; Horwitz et al. 2004; McPeekand Keller 2002b; Sato and Schall 2003; Sato et al. 2001;Thompson et al. 1996, 1997). In fact, a biophysical correlate ofthe fundamental neuron types in FEF has been reported (Cohenet al. 2009). Data from the stop-signal task show that saccade-related but not visual activity in FEF and SC can be identified
with saccade programming that specifies whether and whensaccades will be initiated (Hanes et al. 1998; Pare and Hanes2003). Differential anatomical connectivity also provides fur-ther evidence for distinguishing neuron types. For example, itis well known that neurons in different layers of the cortexentertain different afferents and efferent targets and, conse-quently, have more or less distinct functional properties. Com-bined recording and electrical stimulation studies have shownthat neurons in FEF with movement-related activity project tothe SC (Segraves and Goldberg 1987; Sommer and Wurtz2001) and brain stem (Segraves 1992) and are likely to corre-spond to pyramidal neurons in layer 5 (Fries 1984). However,it is uncertain whether neurons with exclusive visual responsesthroughout project to the SC (Segraves and Goldberg 1987;Sommer and Wurtz 2001). Certainly, neurons in the supra-granular layers of FEF that do not project to the SC subservevisual target selection (Thompson et al. 1996). Thus the weightof the evidence seems to us to support the distinction betweenvisually responsive and movement-related neurons.
The distinction between visual and movement-related neu-rons is also reinforced by the distinct patterns of activationobserved in the search-step and double-step data discussedpreviously; whereas neural selection in visual neurons did notdistinguish between the type of response that would ensue,movement related neurons did. More problematic to this notionof a strict dichotomy are the neurons that seem to have aresponse pattern reflecting a composite of visual and move-ment patterns. Although in the selection of targets appearing intheir response fields their pattern of discharge are like visualneurons, when targets disappear from their response fields theyappear to behave like movement neurons displaying a decreasein their activity reminiscent of countermanding-like activity.Even though these data suggest that these so-called visuomove-ment neurons might reflect a continuum between sensory andmotor processing, the activity of most visuomovement neuronsin noncompensated trials continued to exhibit deselection al-beit after the saccade. Since deselection in these neurons wasnot dependent on whether monkeys made a compensated ornoncompensated response, unlike in movement neurons, wesuggest that deselection is more reflective of sensory process-ing. Visual neurons that display such hybrid activity have alsobeen reported previously from our lab in a different task thatrequired monkeys to direct their saccades away from an odd-ball target (Sato and Schall 2003). In this task, in addition totarget selection, a response-selection stage that maps the loca-tion of the target to a saccade is required for successfulperformance. Although the majority of visual neurons ap-peared to encode the location of the oddball target, irrespectiveof the endpoint of the saccade, the additional requirement ofresponse selection, however, was reflected in the modulationpattern of some visual neurons. A similar remapping of retinalto spatial or oculomotor coordinates was also observed in aclass of visual neurons (quasi-visual) described in the SC(Mays and Sparks 1980) and in the FEF (Goldberg and Bruce1990). These data together lead us to believe that the pattern ofvisuomovement neurons we observed may be equivalent to thequasi-visual neurons (Mays and Sparks 1980) and type IIneurons (Sato and Schall 2003) previously described and mayrepresent a stage that selects the endpoint of the saccade, a stepof processing that is more than visual processing but less thanmotor programming.
2503NEURAL CONTROL OF VISUAL SEARCH BY FEF
J Neurophysiol • VOL 101 • MAY 2009 • www.jn.org
on May 26, 2009
jn.physiology.orgDownloaded from

Mechanistic account of failures of inhibition
Normal visual behavior is accomplished through a continu-ous cycle of fixation and visual analysis interrupted by sac-cades. The loose coupling between fixation duration and end-point accuracy in visual search (e.g., Hooge and Erkelens1996) provides the basis for distinguishing between the processresponsible for specifying where gaze will be directed from theprocess specifying when gaze will shift and provides an ex-planation of how errors of search can occur. One account forerrors in the search-step task is that the visual neurons simplydo not signal the location of the target after it steps to a newlocation. In fact, more naturalistic studies have shown thatmisjudgments can happen due to failure to update the repre-sentation of a changed feature of fixated objects (Droll et al.2005). However, we found that visually responsive neurons inFEF did commonly select the new location of the target (seealso Murthy et al. 2001). Thus the production of a compensatedsaccade was not an automatic consequence of the selection ofthe new target location. There are two possible explanations forthis result that may not be mutually exclusive. One explanationis that on some trials the STOP process was not effectivelyengaged by the visual selection. The second explanation is thatfor some trials visual selection may not be sufficiently strong toovercome the strong activation of movement neurons thatproduce the noncompensated saccades. In such trials we imag-ine that the response of movement neurons that instantiates theGO process producing the noncompensated saccade is tooadvanced to be interrupted by the STOP process.
Both of these explanations are consistent with the generalhypothesis that there are at least two levels or stages ofrepresentation in FEF, one for visual selection and the other formotor preparation. The visual selection stage corresponds tothe formation of the visual salience map of the location ofpotential targets for orienting of attention. The motor represen-tation stage corresponds to the development of activity that willproduce a saccade unless it is interrupted. Such a multilayerarchitecture of sensory–motor transformation affords flexibil-ity of stimulus response mapping at the cost of occasionaldisagreements between the two stages. However, these dis-agreements create opportunities to investigate the neural mech-anisms of sensory–motor transformations.
A C K N O W L E D G M E N T S
We thank C. Camalier for assistance with the analysis of behavior, E.Gotcher-Priddy for assistance in manuscript preparation, S. Hoffman forassistance with TEMPO, and M. Feurtado for animal care. A. Murthy, J. D.Schall, and K. G. Thompson conceived and designed the experiment;A. Murthy carried out the experiment; S. M. Shorter analyzed behavioral data;S. Ray analyzed physiology data; S. M. Shorter and S. Ray prepared illustrations;and A. Murthy, J. D. Schall, S. M. Shorter, and S. Ray wrote the manuscript.
G R A N T S
This work was supported by Robin and Richard Patton through the E.Bronson Ingram Chair in Neuroscience and National Institutes of HealthGrants T32 EY-08126, F32 EY-14502, R01 EY-8890, P30 EY-08126, and P30HD-015052.
R E F E R E N C E S
Aslin RN, Shea SL. The amplitude and angle of saccades to double-step targetdisplacements. Vision Res 27: 1925–1942, 1987.
Asrress KN, Carpenter RHS. Saccadic countermanding: a comparison ofcentral and peripheral stop signals. Vision Res 41: 2645–2651, 2001.
Awater H, Lappe M. Mislocalization of perceived saccade target positioninduced by perisaccadic visual stimulation. J Neurosci 26: 12–20, 2006.
Band G, van der Molen M, Logan G. Horse-race model simulations of thestop-signal procedure. Acta Psychol 112: 105–142, 2003.
Becker W, Jurgens R. An analysis of the saccadic system by means of doublestep stimuli. Vision Res 19: 967–983, 1979.
Bichot NP, Cave KR, Pashler H. Visual selection mediated by location:feature-based selection of noncontiguous locations. Percept Psychophys 61:403–423, 1999.
Bichot NP, Schall JD. Saccade target selection in macaque during feature andconjunction visual search. Vis Neurosci 16: 81–89, 1999.
Bichot NP, Thompson KG, Rao SC, Schall JD. Reliability of macaquefrontal eye field neurons signaling saccade targets during visual search.J Neurosci 21: 713–725, 2001.
Boucher L, Palmeri TJ, Logan GD, Schall JD. Inhibitory control in mindand brain: an interactive race model of countermanding saccades. PsycholRev 114: 376–397, 2007.
Brown JW, Hanes DP, Schall JD, Stuphorn V. Relation of frontal eye fieldactivity to saccade initiation during a countermanding task. Exp Brain Res190: 135–151, 2008.
Bruce CJ, Goldberg ME. Primate frontal eye fields. I. Single neuronsdischarging before saccades. J Neurophysiol 53: 603–635, 1985.
Bullock D, Rhodes B. Competitive queuing for planning and serial perfor-mance. In: The Handbook of Brain Theory and Neural Networks, edited byArbib MA. Cambridge, MA: MIT Press, 2003, p. 241–248.
Cabel D, Armstrong I, Reingold E, Munoz D. Control of saccade initiationin a countermanding task using visual and auditory stop signals. Exp BrainRes 133: 431–441, 2000.
Camalier CR, Gotler A, Murthy A, Thompson KG, Logan GD, PalmeriTJ, Schall JD. Dynamics of saccade target selection: race model analysis ofdouble step and search step saccade production in human and macaque.Vision Res 47: 2187–2211, 2007.
Cohen JY, Pouget P, Heitz RP, Woodman GF, Schall JD. Biophysicalsupport for functionally distinct cell types in the frontal eye field. J Neuro-physiol 101: 912–916, 2009.
Corbetta M, Shulman GL. Control of goal-driven and stimulus drivenattention in the brain. Nat Rev Neurosci 3: 201–215, 2002.
Corneil BD, Munoz DP. The influence of auditory and visual distractors onhuman orienting gaze shifts. J Neurosci 16: 8193–8207, 1996.
Crist CF, Yamasaki DS, Komatsu H, Wurtz RH. A grid system and amicrosyringe for single cell recording. J Neurosci Methods 26: 117–122,1988.
Dassonville P, Schlag J, Schlag-Rey M. The use of egocentric and exocentriclocation cues in saccadic programming. Vision Res 35: 2191–2199, 1995.
DeJong R, Coles MGH, Logan GD, Gratton G. Searching for the point of noreturn: the control of response processes in speeded choice reaction perfor-mance. J Exp Psychol Hum Percept Perform 16: 164–182, 1990.
DeJong R, Coles MGH, Logan GD, Gratton G. Strategies and mechanismsin nonselective and selective inhibitory motor control. J Exp Psychol HumPercept Perform 21: 498–511, 1995.
Deubel H, Wolf W, Hauske G. Adaptive gain control of saccadic eyemovements. Hum Neurobiol 5: 245–253, 1986.
DiCarlo JJ, Maunsell JHR. Using neuronal latency to determine sensory–motor processing pathways in reaction time tasks. J Neurophysiol 93:2974–2986, 2005.
Droll JA, Hayhoe MM, Triesch J, Sullivan BT. Task demands controlacquisition and storage of visual information. J Exp Psychol 31: 1416–1438,2005.
Duhamel JR, Colby CL, Goldberg ME. The updating of the representationof visual space in parietal cortex by intended eye movements. Science 255:90–92, 1992.
Emeric EE, Brown JW, Boucher L, Carpenter RHS, Hanes DP, Harris R,Logan GD, Mashru RN, Pare M, Pouget P. Influence of history onsaccade countermanding performance in humans and macaque monkeys.Vision Res 47: 35–49, 2007.
Findlay JM, Harris LR. Small saccades to double-stepped targets moving intwo dimensions. In: Theoretical and Applied Aspects of Eye MovementResearch, edited by Gale AG, Johnson F. Amsterdam: Elsevier, 1984,p. 71–78.
Fries W. Cortical projections to the superior colliculus in the macaquemonkey: a retrograde study using horseradish peroxidase. J Comp Neurol230: 55–76, 1984.
Gnadt JW, Andersen RA. Memory related motor planning activity in pos-terior parietal cortex of macaque. Exp Brain Res 70: 216–220, 1988.
2504 MURTHY, RAY, SHORTER, SCHALL, AND THOMPSON
J Neurophysiol • VOL 101 • MAY 2009 • www.jn.org
on May 26, 2009
jn.physiology.orgDownloaded from

Goldberg ME, Bruce CJ. Primate frontal eye fields. III. Maintenance of aspatially accurate saccade signal. J Neurophysiol 64: 489–508, 1990.
Green DM, Swets JA. Signal Detection Theory. Psychophysics. New York:Wiley, 1966.
Guthrie BL, Porter JD, Sparks DL. Corollary discharge provides accurateeye position information to the oculomotor system. Science 221: 1193–1195, 1983.
Hallett PE, Lightstone AD. Saccadic eye movements to flashed targets.Vision Res 16: 107–114, 1976a.
Hallett PE, Lightstone AD. Saccadic eye movements towards stimuli trig-gered during prior saccades. Vision Res 16: 99–106, 1976b.
Hanes DP, Carpenter RHS. Countermanding saccades in human. Vision Res39: 2777–2791, 1999.
Hanes DP, Patterson WF, Schall JD. Role of frontal eye fields in counter-manding saccades: visual, movement, and fixation activity. J Neurophysiol79: 817–834, 1998.
Hanes DP, Schall JD. Countermanding saccades in macaque. Vis Neurosci 12:929–937, 1995.
Hanes DP, Schall JD. Neural control of voluntary movement initiation.Science 274: 427–430, 1996.
Heiser LM, Colby CL. Spatial updating in area LIP is independent of saccadedirection. J Neurophysiol 95: 2751–2767, 2006.
Helminski JO, Segraves MA. Macaque frontal eye field input to saccade-related neurons in the superior colliculus. J Neurophysiol 90: 1046–1062,2003.
Hikosaka O, Wurtz RH. Visual and oculomotor functions of monkey sub-stantia nigra pars reticulata. III. Memory-contingent visual and saccaderesponses. J Neurophysiol 49: 1268–1284, 1983.
Holroyd CB, Yeung N, Coles MGH, Cohen JD. A mechanism for errordetection in speeded response time tasks. J Exp Psychol Gen 134: 163–191,2005.
Honda H. Perceptual localization of visual stimuli flashed during saccades.Percept Psychophys 45: 162–174, 1989.
Hooge ITC, Erkelens CJ. Control of fixation duration in a simple search task.Percept Psychophys 58: 969–976, 1996.
Horwitz GD, Newsome WT. Separate signals for target selection and move-ment specification in the superior colliculus. Science 284: 1158–1161, 1999.
Hou RL, Fender DH. Processing of direction and magnitude by the saccadiceye-movement system. Vision Res 19: 1421–1426, 1979.
Ipata AE, Gee AL, Goldberg ME, Bisley JW. Activity in the lateralintraparietal area predicts the goal and latency of saccades in a free-viewingvisual search task. J Neurosci 26: 3656–3661, 2006.
Juan CH, Shorter-Jacobi SM, Schall JD. Dissociation of spatial attentionand saccade preparation. Proc Natl Acad Sci USA 101: 15541–15544, 2004.
Kapoor V, Murthy A. Covert inhibition potentiates online control in adouble-step task. J Vis 8: 1–16, 2008.
Khayat PS, Spekreijse H, Roelfsema PR. Attention lights up new objectrepresentations before the old ones fade away. J Neurosci 26: 138–142,2006.
Kim HG, Connors BW. Apical dendrites of the neocortex: correlationbetween sodium-and calcium-dependent spiking and pyramidal cell mor-phology. J Neurosci 13: 5301–5311, 1993.
Komoda MK, Festinger L, Phillips LJ, Duckman RH, Young RA. Someobservations concerning saccadic eye movements. Vision Res 13: 1009–1020, 1973.
Kornylo K, Dill N, Saenz M, Krauzlis RJ. Cancelling of pursuit and saccadiceye movements in humans and monkeys. J Neurophysiol 89: 2984–2999,2003.
Kusunoki M, Goldberg ME. The time course of perisaccadic receptive fieldshifts in the lateral intraparietal area of the monkey. J Neurophysiol 89:1519–1527, 2003.
Lappin JS, Eriksen CW. Use of a delayed signal to stop a visual reaction-time response. J Exp Psychol 72: 805–811, 1966.
Levy-Schoen A, Blanc-Garin J. On oculomotor programming and perception.Brain Res 71: 443–450, 1974.
Lisberger SG, Fuchs AF, King WM, Evinger LC. Effect of mean reactiontime on saccadic responses to two-step stimuli with horizontal and verticalcomponents. Vision Res 15: 1021–1025, 1975.
Logan G, Cowan WB. On the ability to inhibit thought and action: a theoryof an act of control. Psycholo Rev 91: 295–327, 1984.
Logan GD, Irwin DE. Don’t look! Don’t touch! Inhibitory control of eye andhand movements. Psychon Bull Rev 7: 107–112, 2000.
Ludwig CJH, Mildinhall JW, Gilchrist ID. A population coding account forsystematic variation in saccadic dead time. J Neurophysiol 97: 795–805,2007.
Lunenburger L, Lindner W, Hoffmann KP. Neural activity in the primatesuperior colliculus and saccadic reaction times in double-step experiments.Neural control of space coding and action production. Prog Brain Res 142:91–107, 2003.
Mays LE, Sparks DL. Saccades are spatially, not retinotopically coded.Science 208: 163–161, 1980.
McPeek RM, Keller EL. Saccade target selection in the superior colliculusduring a visual search task. J Neurophysiol 88: 2019–2034, 2002a.
McPeek RM, Keller EL. Superior colliculus activity related to concurrentprocessing of saccade goals in a visual search task. J Neurophysiol 87:1805–1815, 2002b.
Mohler CW, Wurtz RH. Organization of monkey superior colliculus: inter-mediate layer cells discharging before eye movements. J Neurophysiol 39:722–744, 1976.
Murthy A, Ray S, Shorter SM, Priddy EG, Schall JD, Thompson KG.Frontal eye field contributions to rapid corrective saccades. J Neurophysiol97: 1457–1469, 2007.
Murthy A, Thompson KG, Schall JD. Neural control of saccade targetselection: a comparison of search-step and double-step tasks. Soc NeurosciAbstr 26: 966, 2000.
Murthy A, Thompson KG, Schall JD. Dynamic dissociation of visualselection from saccade programming in frontal eye field. J Neurophysiol 86:2634–2637, 2001.
Nelson MJ, Boucher L, Logan GD, Palmeri TJ, Schall JD. Nonstationarityof saccade response time in stopping and stepping tasks. Program No.770.11. 2008 Neuroscience Meeting Planner. Washington, DC: Society forNeuroscience, 2008, Online.
Osman AM, Kornblum S, Meyer DE. The point of no return in choicereaction time: controlled and ballistic stages of response preparation. J ExpPsychol Hum Percept Perform 12: 243–258, 1986.
Osman AM, Kornblum S, Meyer DE. Does motor programming necessitateresponse execution? J Exp Psychol Hum Percept Perform 16: 183–198,1990.
Pare M, Hanes DP. Controlled movement processing: superior colliculusactivity associated with countermanded saccades. J Neurosci 23: 6480–6489, 2003.
Park J, Schlag-Rey M, Schlag J. Spatial localization precedes temporaldetermination in visual perception. Vision Res 43: 1667–1674, 2003.
Peng X, Sereno ME, Silva AK, Lehky SR, Sereno AB. Shape selectivity inprimate frontal eye field. J Neurophysiol 100: 796–814, 2008.
Posner MI, Walker JA, Friedrich FJ, Rafal RD. Effects of parietal injury oncovert orienting of attention. J Neurosci 4: 1863–1874, 1984.
Pouget P, Emeric EE, Stuphorn V, Reis K, Schall JD. Chronometry ofvisual responses in frontal eye field, supplementary eye field, and anteriorcingulate cortex. J Neurophysiol 94: 2086–2092, 2005.
Ray S, Schall JD, Murthy A. Programming of double-step saccade se-quences: modulation by cognitive control. Vision Res 44: 2707–2718, 2004.
Rovamo J, Virsu V. An estimation and application of the human corticalmagnification factor. Exp Brain Res 37: 495–510, 1979.
Sato T, Murthy A, Thompson KG, Schall JD. Search efficiency but notresponse interference affects visual selection in frontal eye field. Neuron 30:583–591, 2001.
Sato TR, Schall JD. Effects of stimulus-response compatibility on neuralselection in frontal eye field. Neuron 38: 637–648, 2003.
Sayer RJ, Friedlander MJ, Redman SJ. The time course and amplitude ofEPSPs evoked at synapses between pairs of CA3/CA1 neurons in thehippocampal slice. J Neurosci 10: 826–836, 1990.
Schall JD. Neuronal activity related to visually guided saccades in the frontaleye fields of rhesus monkeys: comparison with supplementary eye fields.J Neurophysiol 66: 559–579, 1991.
Schall JD. On the role of frontal eye field in guiding attention and saccades.Vision Res 44: 1453–1467, 2004.
Schall JD, Hanes DP. Neural basis of saccade target selection in frontal eyefield during visual search. Nature 366: 467–469, 1993.
Schall JD, Hanes DP, Thompson KG, King DJ. Saccade target selection infrontal eye field of macaque. I. Visual and premovement activation. J Neu-rosci 15: 6905–6918, 1995.
Schlag J, Schlag-Rey M. Through the eye, slowly: delays and localizationerrors in the visual system. Nat Rev Neurosci 3: 191–215, 2002.
2505NEURAL CONTROL OF VISUAL SEARCH BY FEF
J Neurophysiol • VOL 101 • MAY 2009 • www.jn.org
on May 26, 2009
jn.physiology.orgDownloaded from

Schmolesky MT, Wang Y, Hanes DP, Thompson KG, Leutgeb S, SchallJD, Leventhal AG. Signal timing across the macaque visual system.J Neurophysiol 79: 3272–3278, 1998.
Schreij D, Owens C, Theeuwes J. Abrupt onsets capture attention indepen-dent of top-down control settings. Percept Psychophys 70: 208–218, 2008.
Segraves MA. Activity of monkey frontal eye field neurons projecting tooculomotor regions of the pons. J Neurophysiol 68: 1967–1985, 1992.
Segraves MA, Goldberg ME. Functional properties of corticotectal neuronsin the monkey’s frontal eye field. J Neurophysiol 58: 1387–1419, 1987.
Shen K, Pare M. Neuronal activity in superior colliculus signals both stimulusidentity and saccade goals during visual conjunction search. J Vis 7: 1–13,2007.
Smith DT, Schenk T. Enhanced probe discrimination at the location of acolour singleton. Exp Brain Res 181: 367–375, 2007.
Sommer MA, Wurtz RH. Frontal eye field sends delay activity related tomovement, memory, and vision to the superior colliculus. J Neurophysiol85: 1673–1685, 2001.
Sommer MA, Wurtz RH. Influence of the thalamus on spatial visual pro-cessing in frontal cortex. Nature 444: 374–377, 2006.
Sparks DL. Functional properties of neurons in the monkey superior collicu-lus: coupling of neuronal activity and saccade onset. Brain Res 156: 1–16,1978.
Theeuwes J, Burger R. Attentional control during visual search: the effect ofirrelevant singletons. J Exp Psychol Hum Percept Perform 24: 1342–1353,1998.
Thomas NWD, Pare M. Temporal processing of saccade targets in parietalcortex area LIP during visual search. J Neurophysiol 97: 942–947, 2007.
Thompson KG, Bichot NP, Sato TR. Frontal eye field activity before visualsearch errors reveals the integration of bottom-up and top-down salience.J Neurophysiol 93: 337–351, 2005a.
Thompson KG, Bichot NP, Schall JD. Dissociation of visual discriminationfrom saccade programming in macaque frontal eye field. J Neurophysiol 77:1046–1050, 1997.
Thompson KG, Biscoe KL, Sato TR. Neuronal basis of covert spatialattention in the frontal eye field. J Neurosci 25: 9479–9487, 2005b.
Thompson KG, Hanes DP, Bichot NP, Schall JD. Perceptual and motorprocessing stages identified in the activity of macaque frontal eye fieldneurons during visual search. J Neurophysiol 76: 4040–4055, 1996.
Tian J, Schlag J, Schlag-Rey M. Testing quasi-visual neurons in the mon-key’s frontal eye field with the triple-step paradigm. Exp Brain Res 130:433–440, 2000.
Umeno MM, Goldberg ME. Spatial processing in the monkey frontal eyefield. I. Predictive visual responses. J Neurophysiol 78: 1373–1383, 1997.
Umeno MM, Goldberg ME. Spatial processing in the monkey frontal eyefield. II. Memory responses. J Neurophysiol 86: 2344–2352, 2001.
Verbruggen F, Schneider DW, Logan GD. How to stop and change aresponse: the role of goal activation in multi-tasking. J Exp Psychol HumPercept Perform 34: 1212–1228, 2008.
Vince MA. The intermittency of control movements and the psychologicalrefractory period. Br J Psychol 38: 149–157, 1948.
Westheimer G. Eye movements to horizontally moving visual stimulus. ArchOphthalmol 52: 932–941, 1954.
Wheeless LL, Boynton RM, Cohen GH. Eye-movement responses to stepand pulse-step stimuli. J Opt Soc Am 56: 956–960, 1966.
Woodman GF, Kang MS, Thompson KG, Schall JD. The effect of visualsearch efficiency on response preparation: neurophysiological evidence fordiscrete flow. Psychol Sci 19: 128–136, 2008.
Xiao Q, Barborica A, Ferrera VP. Radial motion bias in macaque frontal eyefield. Vis Neurosci 23: 49–60, 2006.
2506 MURTHY, RAY, SHORTER, SCHALL, AND THOMPSON
J Neurophysiol • VOL 101 • MAY 2009 • www.jn.org
on May 26, 2009
jn.physiology.orgDownloaded from