Technology shocks, structural breaks and the effects on the business cycle

Ri
Ya
b
a
ARR1AA
KBCADB
1
tutpsaorDl[trebtbSr
h1
Mutation Research 778 (2015) 6–11
Contents lists available at ScienceDirect
Mutation Research/Genetic Toxicology andEnvironmental Mutagenesis
jo ur nal homep ag e: www.elsev ier .com/ locate /gentoxComm u ni t y add ress : www.elsev ier .com/ locate /mutres
ejoining kinetics of bleomycin-induced DNA single-strand breaksn agarose-bound human blood cells
uquan Lu a,∗, Ryoichi Matsuse b, Tomotaka Sobue a
Department of Social and Environmental Medicine, Osaka University Graduate School of Medicine, 2-2 Yamada-Oka Osaka 565-0871, JapanKyoto Medical Science Laboratory, Furukawa-cho 328, Hazukashi Fushimi-ku, Kyoto 812, Japan
r t i c l e i n f o
rticle history:eceived 28 October 2014eceived in revised form1 December 2014ccepted 22 December 2014vailable online 2 January 2015
a b s t r a c t
The rejoining kinetics of individual DNA single-strand breaks (SSBs) are difficult to measure, in biomon-itoring studies, because SSB rejoining is rapid and hard to control. We have detected early (0, 1, 2, 5,10 and 30 min) events in SSB rejoining in human leukocytes, with the alkaline comet assay, at a lowconcentration of bleomycin (BLM; 0.5 �g/ml). Background Tail DNA% (percentage of DNA that remainedin the comet tail) of the subjects was 1.23% (25th–75th percentile: 0.72–1.64). BLM treatment increasedthis to 62.4% (25th–75th percentile: 57.8–70.4) at t = 0, decreasing to the background level by 30 min.
eywords:leomycinomet assaygarose-bound cell cultureNA repair
Analysis of 45 subjects showed that the fastest return to the background level occurred in 5 min, whereasthe slowest return took approximately 30 min. The early rejoining kinetics of SSBs may show multiplepatterns, varying among individuals.
© 2014 Elsevier B.V. All rights reserved.
atch processing
. Introduction
Since the introduction of the alkaline single-cell gel elec-rophoresis (or alkaline comet) assay in 1988 [1], scientists havesed this method for assessment of DNA damage and repair in geno-oxicology [2–4] and biomonitoring studies [5–7]. However, a basicroblem remains: precise control of the rejoining of induced DNAingle-strand breaks (SSBs). Singh et al. [1] noticed this problem andttempted to solve it by exposing agarose-embedded lymphocytesn microslides to X-ray or H2O2 before cell lysis. However, theseesearchers did not explain how one might control the rejoining ofNA SSBs. In the following years, some studies have applied a simi-
ar method, but failed to observe early kinetics of DNA SSB rejoining8–12]. To date, most researchers treat samples one-by-one in cul-ure dishes that contain the test substance (possibly allowing DNAepair in fresh medium at 37 ◦C), collect cells by centrifugation, stopxposure to the test substance by washing, and adjust the cell num-ers before sandwiching the cells in a microgel (37 ◦C∼42 ◦C) forhe alkaline comet assay [13]. Because the manipulation of cells
efore cell lysis usually requires at least 30 min, rejoining of DNASBs could occur, and the measured results represent what damageemains after such rejoining [14]. To observe a significant influ-∗ Corresponding author. Tel. +81 6 6879 3923; fax: +81 6 6879 3923.E-mail address: [email protected] (Y. Lu).
ttp://dx.doi.org/10.1016/j.mrgentox.2014.12.005383-5718/© 2014 Elsevier B.V. All rights reserved.
ence of the test substance, researchers are forced to use higherconcentrations of test substances.
This problem may be important in biomonitoring studies,because the concentrations of substances in the environment areusually low. When blood samples are used, the isolation of nucle-ated blood cells would be laborious [15] and likely to allow theisolated cells to rejoin their DNA SSBs in a buffer environment. Insome cases, the isolation itself may induce unpredictable DNA dam-age [16]. Thus, some scientists suggest the use of whole blood ratherthan isolated lymphocytes in biomonitoring studies [17].
In the present study, we directly sandwiched fresh whole bloodcells obtained from 45 male Japanese adults in agarose, before BLMtreatment; processed the agarose-bound blood samples in batch;and observed DNA rejoining (mainly of SSBs) kinetics in the leuko-cytes by use of the alkaline comet assay.
2. Subjects and methods
2.1. Subjects
All subjects signed an informed consent form, and the studywas approved by the Ethics Committee of Osaka University Med-
ical School. The subjects were 45 Japanese male factory workersat a hard-metal industry in Osaka. 44 individuals were clerks ortechnicians and one was a manufacturing worker. Average age was43.8 ± 10.9y.
Y. Lu et al. / Mutation Research 778 (2015) 6–11 7
Table 1Alteration in TailDNA% during different rejoining periods after BLM treatment of agarose-bound peripheral blood leukocytes from 45 subjects.a
TailDNA% Rejoining Period
0∼1 min (%) 1∼2 min (%) 2∼5 min (%) 5∼10 min (%) 10∼30 min (%)
Decreased 30 (66.7) 25 (55.6) 43 (95.6) 26 (57.8) 43 (95.6)Unchanged 4 (8.9) 5 (11.1) 2 (4.4) 3 (6.7) 2 (4.4)Increased 11 (24.4) 15 (33.3) 0 (0) 16 (35.6) 0 (0)Total 45 (100) 45 (100) 45 (100) 45 (100) 45 (100)
judged by comparison with the adjacent median of the TailDNA% of 80∼120 leukocytesu
2
aIyvHBtbms7i81CemPsoWgap4wtmirmwi5eibtsfimia“e
2
aa
Fig. 1. Scheme for detecting bleomycin (BLM)-induced DNA damage and rejoining
a The decreases, lack of changes and increases in the TailDNA% of a subject weresing the Kolmogorov–Smirnov test at p ≤ 0.05.
.2. Alkaline comet assay, in batch mode
Blood samples were collected in the morning and sandwiched ingarose on microslides, using a previously described method [18].n brief, we collected blood (5 mL) from fasting workers (20∼63ears of age) during their annual health check-up via a peripheralein, using coded heparinized vacuum tubes (VENOJECT®II VP-050 K, Terumo, Tokyo, Japan) between 8:30 a.m. and 10:30 a.m.lood samples were maintained in an ice-box until preparation ofhe microslides between 2:00 and 6:00 p.m. on the same day. Beforeinding the blood cells to agarose on 76 × 26-mm frosted glassicroslides (Matsunami, Osaka, Japan), we precoated the frosted
ides with 0.75% normal-melting agarose, 20 �L, (Sigma) in PBS (pH.2, Ca++- and Mg++-free) and dried the microslides. Before load-
ng the blood samples, we spread 0.75% normal-melting agarose,0 �L, with a 50 × 24-mm cover glass. After solidification at 4 ◦C for0 min, we sealed the glass microslides with a piece of an 8-welloverWellTM perfusion chamber (Funakoshi, Tokyo, Japan). Forach sample, we gently mixed whole blood, 2.5 �L, with 0.75% low-elting agarose (Cambrex Bio Science, Rockland, USA), 147.5 �L, in
BS (pH 7.2, Ca++- and Mg++-free) and sandwiched the cell suspen-ion layer (10 �L) between the preloaded agarose and another layerf 0.75% low-melting agarose (theoretically 500∼1500 cell/well).e loaded four samples, each in duplicate, on each microslide. After
ently removing the piece of CoverWellTM perfusion chamber, werranged the microslides in a rack that could hold 20 microslideieces. We prepared seven batches of microslides; each batch had5 samples. For the untreated batch (negative control, background),e directly put the microslides into lysis buffer at 4 ◦C. For the BLM-
reated batch (positive control, repair time zero), we immersed theicroslides in ice-cold (4 ◦C) RPMI 1640 (Sigma) solution contain-
ng 0.5 �g/mL bleomycin (BLM) within 1 s, treated them for 5 min,emoved them and dipped them twice into ice-cold ddH20 and
oved them to lysis buffer at 4 ◦C within 5 s. For the repair batches,e removed the BLM-treated microslides, dipped them twice into
ce-cold RPMI 1640, and moved them to RPMI 1640 at 37 ◦C within s. The microslides were maintained in RPMI 1640 at 37 ◦C forxactly 1, 2, 5, 10, and 30 min. The microslides were then removed,mmediately dipped twice into ice-cold ddH2O, and moved to lysisuffer at 4 ◦C within 5 s. The microslides were then denatured, elec-rophoresed and neutralized as previously described [18]. Aftertaining with 10 �g/mL ethidium bromide for 1 min, we quanti-ed the DNA damage of 40∼60 leukocytes from each well under aicroscope at 100×magnification using a Comet Assay IV imag-
ng system (Perceptive Instruments, Haverhill, UK) attached to fluorescent microscope (Olympus, Tokyo, Japan) and used theTail%DNA” (tail intensity) to present the nuclear DNA damage forach leukocyte (Fig. 1).
.3. Data
For each subject at each observation time point (background andfter 0, 1, 2, 5, 10, and 30 min of DNA SSB rejoining), we obtainedpproximately 80∼120 leukocyte “Tail%DNA” data points and used
kinetics in human whole blood bound to agarose on microslides. The number next tothe down-facing arrow is the time interval between adjacent steps. BG: background;LMA: low-melting agarose.
the median (25th–75th percentile) of the data to represent the indi-vidual DNA damage level (defined as individual “TailDNA%”). Forall of the subjects at each observation time point, we obtained 45individual “Tail%DNA” data points and used the median (25th–75thpercentile) to represent the total DNA damage level of the 45 sub-jects (defined as group “TailDNA%”). In the study, we collected atotal of 37,403 “Tail%DNA” data points to obtain 315 individual“TailDNA%” and seven total “TailDNA%” data points for analysis.
2.4. Statistics
All of the data were analyzed using Stata12 (StataCorp LP, Col-lege Station, TX, USA). The level of statistical significance betweenthe medians was set at p ≤ 0.05 in the Kolmogorov–Smirnov test(K-S test). All statistical tests were two-sided.
3. Results
The seven total “TailDNA%” results represent the DNA damagelevels of the subjects at each observation time point (back-ground and after 0, 1, 2, 5, 10, and 30 min of DNA SSBrejoining). Background “TailDNA%” was 1.23% (25th–75th per-

8 Y. Lu et al. / Mutation Research 778 (2015) 6–11
Fig. 2. Whole-blood leukocyte TailDNA% of 45 male Japanese adults before and afterbiT
crn(bnirs
vnfm2i0I(
rgKlal
iwTi
TwbjPm(
rlPiptai
Fig. 3. Three patterns of kinetic alteration in the whole blood leukocyte TailDNA%of 45 male Japanese adults after bleomycin treatment (0.5 �g/mL for 5 min at 4 ◦C)and subsequent rejoining in RPMI 1640 (0∼30 min, 37 ◦C). Pattern 1: the TailDNA%monotonously decreased to the background level after BLM treatment (14 subjects,31.1%). Pattern 2: the TailDNA% increased before 5 min of rejoining culture and thendecreased to the background level (15 subjects, 33.3%). Pattern 3: the TailDNA%increased after 5 min of rejoining culture and then decreased to the backgroundlevel (16 subjects, 35.6%). The increases, lack of changes and decreases were judged
leomycin (BLM) treatment (0.5 �g/mL for 5 min at 4 ◦C) at different rejoining timesn RPMI1640 (0∼30 min, 37 ◦C). The solid circles (�) represent the median of theailDNA% of 80∼120 leukocyte, whereas the lines (−) represent the subjects.
entile = 0.72–1.64, n = 45). BLM treatment (rejoining time = 0 min)esulted in “TailDNA%” = 62.4% (25th–75th percentile = 57.8–70.4,
= 45), which was significantly higher than the backgroundp < 0.05, K–S test), and this level decreased with time to theackground level (median = 0.32, 25th–75th percentile = 0.24–0.43,
= 45, p < 0.05, K–S test) within 30 min of transfer to the rejoin-ng culture medium. The fastest subject’s sample completed DNAejoining in 5 min (Appendix 1, Subject No. 9), and the slowestubject’s required about 30 min (Appendix 1, Subject No. 24).
We drew a line to illustrate the kinetic alteration in the indi-idual “TailDNA%” for each subject (Fig. 2), which showed thatot all individual “TailDNA%” data points monotonically decreased
rom 0 min through 30 min of DNA rejoining. Division of the 30-in rejoining period into five rejoining periods (0∼1 min, 1∼2 min,
∼5 min, 5∼10 min, and 10∼30 min) revealed that the follow-ng numbers of subjects increased their individual “TailDNA%”:–1 min, 11; 1–2 min, 15; 2–5 min, 0; 5–10 min, 16; 10–30 min, 0.
n each of the five time periods, some data points showed no changeTable 1).
Based on the kinetic alterations, we identified three patterns ofejoining kinetics (Fig. 3). Pattern 1: monotonic decrease to back-round level (p < 0.05, K–S test); pattern 2, initial increase (p < 0.05,–S test) and then a decrease (p < 0.05, K–S test) to background
evel; pattern 3, initial decrease, then an increase (p < 0.05, K–S test)nd subsequently a decrease (p < 0.05, K–S test) to the backgroundevel after 30 min.
Further analysis of the data presented in Table 1 showed thatncreased individual TailDNA%” in the 0–1 and 1–2 min periods
as only found in patterns 2 and 3 (Table 2). The sole increase inailDNA% in the 5–10 min period shown in Table 1 was character-
stic of pattern 3 (Table 2).In pattern 1, twelve subjects continued to present a decrease in
ailDNA% at 30 min, and two subjects showed a decrease at 10 minith a constant level later. The subjects that presented pattern 2
egan to decrease TailDNA% starting after 2 min, but all of the sub-ects presented at least a one-time increase within the first 2 min.attern 3 was characterized by a varied phenotype in the first twoinutes but showed a distinct increase after approximately 10 min
Table 2).The three kinetic patterns shown in Fig. 3 accompanied a cor-
esponding alteration in the cellular distribution of the 80∼120eukocyte TailDNA%. Three typical distributions are shown in Fig. 4.attern 1: BLM treatment (rejoining time = 0) induced an increase
n the dispersion of the leukocyte TailDNA%, and all of the data
oints shifted to the right. After the start of the rejoining culture,he dispersion monotonically decreased to the background levelnd shifted to the left. Pattern 2: BLM treatment also induced anncrease in the dispersion of the TailDNA%. However, when theusing the Kolmogorov–Smirnov test at p ≤ 0.05. BLM: bleomycin; the solid circles(�) represent the median TailDNA% of 80∼120 leukocytes, whereas the lines (−)represent the subjects.
dispersion time- decreased during the first 2 min of the rejoiningculture, the curve shifted to the right. From 5–30 min, the again-increased dispersion began to decrease to the background leveland shift to the left. Pattern 3: BLM treatment induced an increase,which subsequently decreased and shifted to the left, within 5 minof culture. After 10 min, however, an increased dispersion and ashift to the right were observed, before the final reduction to thebackground level.
4. Discussion
DNA repair is complex and thus influences the results of thecomet assay in a complex manner. Ongoing repair (e.g., excisionof bleomycin-induced oxidative DNA damage) will increase DNAmigration, whereas, only completely removed lesions (and sealedstrand breaks) decrease DNA migration. This makes it very difficultto interpret repair kinetics unequivocally, because it is difficult todetect DNA migration in real time.
Most ion radiation- or BLM-induced DNA lesions are SSBs, which
are rejoined rapidly. To interpret the rejoining kinetics unequivo-cally, it is necessary to precisely detect the ongoing DNA repair inreal time. For example, when comparing two cell types, or leuko-cytes from two subjects, care must be taken to ensure that the
Y. Lu et al. / Mutation Research 778 (2015) 6–11 9
Table 2Kinetic pattern-based alteration in the TailDNA% during different rejoining periods after BLM treatment of agarose-bound peripheral blood leukocytes from 45 subjects.a
Kinetics TailDNA% Rejoining Period
0∼1 min (%) 1∼2 min (%) 2∼5 min (%) 5∼10 min (%) 10∼30 min (%)
Pattern 1 Decreased 14 (100) 14 (100) 14 (100) 14 (100) 12 (85.7)Unchanged 0 (0) 0 (0) 0 (0) 0 (0) 2 (14.3)Increased 0 (0) 0 (0) 0 (0) 0 (0) 0 (0)
Total 1 14 (100) 14 (100) 14 (100) 14 (100) 14 (100)
Pattern 2 Decreased 7 (46.7) 3 (20) 13 (86.7) 12 (80) 15 (100)Unchanged 1 (6.6) 1 (6.6) 2 (13.3) 3 (20) 0 (0)Increased 7 (46.7) 11 (73.3) 0 (0) 0 (0) 0 (0)
Total 2 15 (100) 15 (100) 15 (100) 15 (100) 15 (100)
Pattern 3 Decreased 9 (56.2) 9 (56.2) 16 (100) 0 (0) 16 (100)Unchanged 3 (18.8) 3 (18.8) 0 (0) 0 (0) 0 (0)Increased 4 (25) 4 (25) 0 (0) 16 (100) 0 (0)
Total 3 16 (100) 16 (100) 16 (100) 16 (100) 16 (100)
judgeu
itdts
crv6rtfclmdint
F1t0
a The decreases, lack of changes and increases in the TailDNA% of a subject weresing the Kolmogorov–Smirnovtest at p ≤ 0.05.
nitial repair events are not missed. Even a short period of incuba-ion at 37 ◦C before the sample is collected can lead to a significantecrease from the initial level of damage. A solution is to observehe DNA damage and repair of cells imbedded in agarose and totrictly control the cell treatment time and DNA repair time.
In several previous studies, researchers treated agarose-boundells, using the alkaline comet assay [1,8] but did not examine DNAejoining kinetics. In 1999, Alapetite et al. reported their obser-ation of DNA rejoining kinetics in agarose-bound cells, 0, 15, 30,0 and 120 min after irradiation with 5-Gy gamma rays [12]. Thisesult provided virtually the same repair kinetics as the conven-ional incubation [19] and did not find a wide application in theollowing years because of the possible difficulties associated withontrolling the induced oxidative damage during lymphocyte iso-ation [19]. In 2013, Azqueta and Collins described this method in
ore details in their review paper [20] but provided few advanced
ata. The latest application of the method occurred in a studyntended to prove that “hedgehogs” of H2O2-treated HeLa cells areot always dead [10]. However, the researchers set their earliestime point for the observation of DNA repair at 15 min without pro-
ig. 4. Cellular distribution of three typical kinetic patterns of whole-blood leukocyte Tail: the BLM-induced TailDNA% monotonously decreased to the background level. Patternhen decreased to the background level. Pattern 3: the BLM-induced TailDNA% decrease
min∼30 min: DNA rejoining time in RPML1640 at 37 ◦C after BLM treatment.
d by comparison with the adjacent median of the TailDNA% of 80∼120 leukocytes
viding a detailed description of their control of the time intervalsduring cell manipulation.
In the present study, we improved the agarose-bound cell cul-ture method by treating all samples in batch, from cell exposurethrough cell lysis and electrophoresis. This method decreased thetime associated with the laborious and mistake-prone processesused for cell isolation, collection, and culture. It allowed us tocontrol the exposure and rejoining times precisely; ensured thetreatment of all of the samples in the BLM exposure and rejoiningcultures without operational bias; and allowed the effective controlof the spontaneous rejoining of DNA SSBs. Moreover, the procedurecan be used in a high-throughput manner for the comet assay.
Using the improved method, we used a low concentra-tion of BLM (0.5 �g/mL), to induce a significantly higher levelof TailDNA% (median = 62.4, 25th–75th percentile = 57.8–70.4,minimum–maximum = 39.2 − 85.2, n = 45). This concentration was
chosen based on several previous tests (data not shown) and wasin line with our previous results [8,11]. To the best of our knowl-edge, it is the lowest concentration of BLM used in similar studies ofDNA% after BLM treatment and subsequent rejoining in RPMI1640 at 37 ◦C. Pattern 2: the BLM-induced TailDNA% increased after initiation of rejoining culture and
d, then increased and finally decreased to the background level. BLM: bleomycin;
1 Resea
n[
ttl5rwtm
irusos1irsi
cbtpssmDtwpcetDcots
daTcdcr(
ibiipia
5
f
[
[
[
[
[
[
[
[
[
0 Y. Lu et al. / Mutation
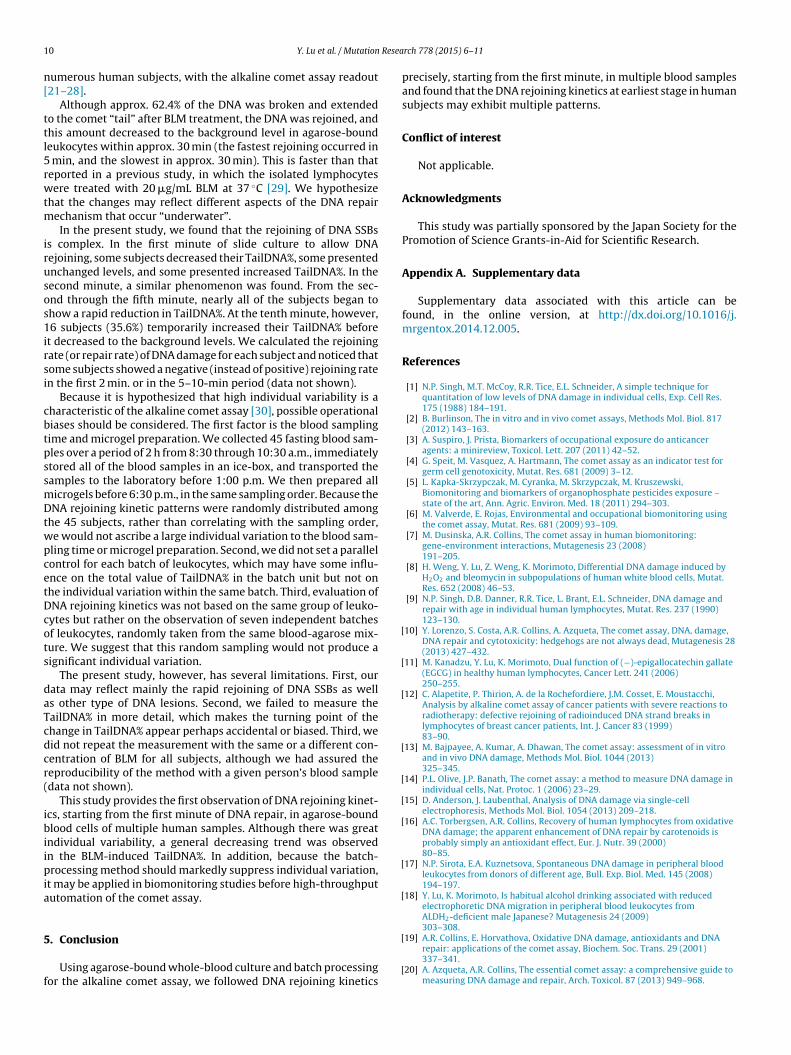
umerous human subjects, with the alkaline comet assay readout21–28].
Although approx. 62.4% of the DNA was broken and extendedo the comet “tail” after BLM treatment, the DNA was rejoined, andhis amount decreased to the background level in agarose-boundeukocytes within approx. 30 min (the fastest rejoining occurred in
min, and the slowest in approx. 30 min). This is faster than thateported in a previous study, in which the isolated lymphocytesere treated with 20 �g/mL BLM at 37 ◦C [29]. We hypothesize
hat the changes may reflect different aspects of the DNA repairechanism that occur “underwater”.
In the present study, we found that the rejoining of DNA SSBss complex. In the first minute of slide culture to allow DNAejoining, some subjects decreased their TailDNA%, some presentednchanged levels, and some presented increased TailDNA%. In theecond minute, a similar phenomenon was found. From the sec-nd through the fifth minute, nearly all of the subjects began tohow a rapid reduction in TailDNA%. At the tenth minute, however,6 subjects (35.6%) temporarily increased their TailDNA% before
t decreased to the background levels. We calculated the rejoiningate (or repair rate) of DNA damage for each subject and noticed thatome subjects showed a negative (instead of positive) rejoining raten the first 2 min. or in the 5–10-min period (data not shown).
Because it is hypothesized that high individual variability is aharacteristic of the alkaline comet assay [30], possible operationaliases should be considered. The first factor is the blood samplingime and microgel preparation. We collected 45 fasting blood sam-les over a period of 2 h from 8:30 through 10:30 a.m., immediatelytored all of the blood samples in an ice-box, and transported theamples to the laboratory before 1:00 p.m. We then prepared allicrogels before 6:30 p.m., in the same sampling order. Because theNA rejoining kinetic patterns were randomly distributed among
he 45 subjects, rather than correlating with the sampling order,e would not ascribe a large individual variation to the blood sam-
ling time or microgel preparation. Second, we did not set a parallelontrol for each batch of leukocytes, which may have some influ-nce on the total value of TailDNA% in the batch unit but not onhe individual variation within the same batch. Third, evaluation ofNA rejoining kinetics was not based on the same group of leuko-ytes but rather on the observation of seven independent batchesf leukocytes, randomly taken from the same blood-agarose mix-ure. We suggest that this random sampling would not produce aignificant individual variation.
The present study, however, has several limitations. First, ourata may reflect mainly the rapid rejoining of DNA SSBs as wells other type of DNA lesions. Second, we failed to measure theailDNA% in more detail, which makes the turning point of thehange in TailDNA% appear perhaps accidental or biased. Third, weid not repeat the measurement with the same or a different con-entration of BLM for all subjects, although we had assured theeproducibility of the method with a given person’s blood sampledata not shown).
This study provides the first observation of DNA rejoining kinet-cs, starting from the first minute of DNA repair, in agarose-boundlood cells of multiple human samples. Although there was great
ndividual variability, a general decreasing trend was observedn the BLM-induced TailDNA%. In addition, because the batch-rocessing method should markedly suppress individual variation,
t may be applied in biomonitoring studies before high-throughpututomation of the comet assay.
. Conclusion
Using agarose-bound whole-blood culture and batch processingor the alkaline comet assay, we followed DNA rejoining kinetics
[
[
rch 778 (2015) 6–11
precisely, starting from the first minute, in multiple blood samplesand found that the DNA rejoining kinetics at earliest stage in humansubjects may exhibit multiple patterns.
Conflict of interest
Not applicable.
Acknowledgments
This study was partially sponsored by the Japan Society for thePromotion of Science Grants-in-Aid for Scientific Research.
Appendix A. Supplementary data
Supplementary data associated with this article can befound, in the online version, at http://dx.doi.org/10.1016/j.mrgentox.2014.12.005.
References
[1] N.P. Singh, M.T. McCoy, R.R. Tice, E.L. Schneider, A simple technique forquantitation of low levels of DNA damage in individual cells, Exp. Cell Res.175 (1988) 184–191.
[2] B. Burlinson, The in vitro and in vivo comet assays, Methods Mol. Biol. 817(2012) 143–163.
[3] A. Suspiro, J. Prista, Biomarkers of occupational exposure do anticanceragents: a minireview, Toxicol. Lett. 207 (2011) 42–52.
[4] G. Speit, M. Vasquez, A. Hartmann, The comet assay as an indicator test forgerm cell genotoxicity, Mutat. Res. 681 (2009) 3–12.
[5] L. Kapka-Skrzypczak, M. Cyranka, M. Skrzypczak, M. Kruszewski,Biomonitoring and biomarkers of organophosphate pesticides exposure –state of the art, Ann. Agric. Environ. Med. 18 (2011) 294–303.
[6] M. Valverde, E. Rojas, Environmental and occupational biomonitoring usingthe comet assay, Mutat. Res. 681 (2009) 93–109.
[7] M. Dusinska, A.R. Collins, The comet assay in human biomonitoring:gene-environment interactions, Mutagenesis 23 (2008)191–205.
[8] H. Weng, Y. Lu, Z. Weng, K. Morimoto, Differential DNA damage induced byH2O2 and bleomycin in subpopulations of human white blood cells, Mutat.Res. 652 (2008) 46–53.
[9] N.P. Singh, D.B. Danner, R.R. Tice, L. Brant, E.L. Schneider, DNA damage andrepair with age in individual human lymphocytes, Mutat. Res. 237 (1990)123–130.
10] Y. Lorenzo, S. Costa, A.R. Collins, A. Azqueta, The comet assay, DNA, damage,DNA repair and cytotoxicity: hedgehogs are not always dead, Mutagenesis 28(2013) 427–432.
11] M. Kanadzu, Y. Lu, K. Morimoto, Dual function of (−)-epigallocatechin gallate(EGCG) in healthy human lymphocytes, Cancer Lett. 241 (2006)250–255.
12] C. Alapetite, P. Thirion, A. de la Rochefordiere, J.M. Cosset, E. Moustacchi,Analysis by alkaline comet assay of cancer patients with severe reactions toradiotherapy: defective rejoining of radioinduced DNA strand breaks inlymphocytes of breast cancer patients, Int. J. Cancer 83 (1999)83–90.
13] M. Bajpayee, A. Kumar, A. Dhawan, The comet assay: assessment of in vitroand in vivo DNA damage, Methods Mol. Biol. 1044 (2013)325–345.
14] P.L. Olive, J.P. Banath, The comet assay: a method to measure DNA damage inindividual cells, Nat. Protoc. 1 (2006) 23–29.
15] D. Anderson, J. Laubenthal, Analysis of DNA damage via single-cellelectrophoresis, Methods Mol. Biol. 1054 (2013) 209–218.
16] A.C. Torbergsen, A.R. Collins, Recovery of human lymphocytes from oxidativeDNA damage; the apparent enhancement of DNA repair by carotenoids isprobably simply an antioxidant effect, Eur. J. Nutr. 39 (2000)80–85.
17] N.P. Sirota, E.A. Kuznetsova, Spontaneous DNA damage in peripheral bloodleukocytes from donors of different age, Bull. Exp. Biol. Med. 145 (2008)194–197.
18] Y. Lu, K. Morimoto, Is habitual alcohol drinking associated with reducedelectrophoretic DNA migration in peripheral blood leukocytes fromALDH2-deficient male Japanese? Mutagenesis 24 (2009)303–308.
19] A.R. Collins, E. Horvathova, Oxidative DNA damage, antioxidants and DNArepair: applications of the comet assay, Biochem. Soc. Trans. 29 (2001)337–341.
20] A. Azqueta, A.R. Collins, The essential comet assay: a comprehensive guide tomeasuring DNA damage and repair, Arch. Toxicol. 87 (2013) 949–968.

Resea
[
[
[
[
[
[
[
[
[Dienemann, K.W. Kayser, V. Schulz, H. Bartsch, Rapid screening assay formutagen sensitivity and DNA repair capacity in human peripheral bloodlymphocytes, Mutagenesis 16 (2001) 25–30.
[30] I. Decordier, K.V. Loock, M. Kirsch-Volders, Phenotyping for DNA repair
Y. Lu et al. / Mutation
21] J. Cheng, S. Leng, H. Li, C. Huang, Y. Niu, L. Zhang, X. Liang, H. Lin, Y. Zheng,Suboptimal DNA repair capacity predisposes coke-oven workers toaccumulate more chromosomal damages in peripheral lymphocytes, CancerEpidemiol. Biomarkers Prev. 18 (2009) 987–993.
22] H. Duan, Z. He, J. Ma, B. Zhang, Z. Sheng, P. Bin, J. Cheng, Y. Niu, H. Dong, H. Lin,Y. Dai, B. Zhu, W. Chen, Y. Xiao, Y. Zheng, Global and MGMT promoterhypomethylation independently associated with genomic instability oflymphocytes in subjects exposed to high-dose polycyclic aromatichydrocarbon, Arch. Toxicol. 87 (2013) 2013–2022.
23] V.A. Ehrlich, A.K. Nersesyan, K. Atefie, C. Hoelzl, F. Ferk, J. Bichler, E. Valic, A.Schaffer, R. Schulte-Hermann, M. Fenech, K.H. Wagner, S. Knasmuller,Inhalative exposure to vanadium pentoxide causes DNA damage in workers:results of a multiple end point study, Environ. Health Perspect. 116 (2008)1689–1693.
24] M. Gajecka, M. Rydzanicz, R. Jaskula-Sztul, M. Wierzbicka, W. Szyfter, K.Szyfter, Reduced DNA repair capacity in laryngeal cancer subjects. Acomparison of phenotypic and genotypic results, Adv. Otorhinolaryngol. 62
(2005) 25–37.25] B. Laffon, V. Valdiglesias, E. Pasaro, J. Mendez, The organic seleniumcompound selenomethionine modulates bleomycin-induced DNA damageand repair in human leukocytes, Biol. Trace Elem. Res. 133 (2010)12–19.
rch 778 (2015) 6–11 11
26] N. Rajaee-Behbahani, P. Schmezer, A. Risch, W. Rittgen, K.W. Kayser, H.Dienemann, V. Schulz, P. Drings, S. Thiel, H. Bartsch, Altered DNA repaircapacity and bleomycin sensitivity as risk markers for non-small cell lungcancer, Int. J. Cancer 95 (2001) 86–91.
27] V. Valdiglesias, J. Mendez, E. Pasaro, E. Cemeli, D. Anderson, B. Laffon,Assessment of okadaic acid effects on cytotoxicity, DNA damage and DNArepair in human cells, Mutat. Res. 689 (2010) 74–79.
28] Y. Wang, J. Cheng, D. Li, H. Duan, H. Yang, P. Bin, Y. Dai, C. Huang, X. Liang, S.Leng, W. Chen, Y. Zheng, Modulation of DNA repair capacity by ataxiatelangiectasia mutated gene polymorphisms among polycyclic aromatichydrocarbons-exposed workers, Toxicol. Sci. 124 (2011)99–108.
29] P. Schmezer, N. Rajaee-Behbahani, A. Risch, S. Thiel, W. Rittgen, P. Drings, H.
capacity, Mutat. Res. 705 (2010) 107–129.
Copyright © 2022 FDOKUMEN