Regulatory Framework for Investments in Renewable Energy ...
333
REGULATORY FRAMEWORK FOR INVESTMENTS IN RENEWABLE ENERGY IN INDIA WITH SPECIAL REFERENCE TO THE ELECTRICITY ACT 2003: A CRITICAL ANALYSIS A thesis submitted to the University of Petroleum and Energy Studies For the Award of Doctor of Philosophy in Law BY Sujith P. Surendran May 2020 SUPERVISOR Prof. (Dr.) Tabrez Ahmad School of Law University of Petroleum and Energy Studies Dehradun – 248007: Uttarakhand
-
Upload
khangminh22 -
Category
Documents
-
view
1 -
download
0
Transcript of Regulatory Framework for Investments in Renewable Energy ...

REGULATORY FRAMEWORK FOR INVESTMENTS IN
RENEWABLE ENERGY IN INDIA WITH SPECIAL
REFERENCE TO THE ELECTRICITY ACT 2003:
A CRITICAL ANALYSIS
A thesis submitted to the
University of Petroleum and Energy Studies
For the Award of
Doctor of Philosophy
in
Law
BY
Sujith P. Surendran
May 2020
SUPERVISOR
Prof. (Dr.) Tabrez Ahmad
School of Law
University of Petroleum and Energy Studies
Dehradun – 248007: Uttarakhand
ii
DECLARATION
I declare that the thesis entitled “Regulatory Framework for Investments in
Renewable Energy in India with Special Reference to the Electricity Act
2003: A Critical Analysis” has been prepared by me under the guidance of
Prof. (Dr.) Tabrez Ahmad, Pro Vice Chancellor and Dean, School of Law, G
D Goenka University, Sohna, Haryana, India. No part of this thesis has formed
the basis for the award of any degree or fellowship previously.
Sujith P Surendran (SAP ID 500016210)
School of Law
University of Petroleum and Energy Studies
Dehradun – 248007: Uttarakhand
Date: 02.06.2020
GD Goenka University, G D Goenka Education City, Sohna Gurgaon Road, Sohna, Haryana India- 122103,
+91-9871600048/51/53 (General), [email protected] (General)
Prof. (Dr.) Tabrez Ahmad Pro Vice Chancellor & Dean Vice President (India Law Teachers) International Council of Jurists, UK London School of Law, GD Goenka University Chair (Legal Education) Indian National Bar Association B.Sc. (Hons.), LLB, LLM (Commercial Law) Member, International Internet Society, Geneva DIM, PhD. (Cyber law/IPR). Member, Lead Group on IPR, ALS ICANN, ISOC Member Editorial Board International Journal of WRBR Australia Referee, Journal of IPR, CSIR, ISSN: 0975-1076
Member Editorial Team, Journal of Politics and Law, Canada, ISSN-1913-9047
Date: 02/06/2020
CERTIFICATE
I certify that Sujith P Surendran has prepared his thesis entitled “Regulatory Framework For Investments In
Renewable Energy In India With Special Reference To The Electricity Act 2003: A Critical Analysis”, for the
award of PhD degree of the University of Petroleum & Energy Studies, under my guidance. He/she has carried
out the work at the School of Law, University of Petroleum & Energy Studies.
Guide
Prof. (Dr.) TABREZ AHMAD
iv
ABSTRACT
REGULATORY FRAMEWORK FOR INVESTMENTS IN RENEWABLE
ENERGY IN INDIA WITH SPECIAL REFERENCE TO THE ELECTRICITY
ACT 2003: A CRITICAL ANALYSIS
There are many renewable energy sources. Some sources are used to produce
bio-fuels while some are used to create electricity. This study focuses on
renewable electricity. Renewable Electricity in India is produced mainly from
wind and solar. Wind energy do not have a nationwide potential for
generation. The states like Tamil Nadu, which has high wind energy potential
has already adopted measures for the promotion of the same. Solar Energy on
the other hand is available across all states.
Considering the universal nature of solar energy and the potential to be the
future of our energy resources, the research is focused on solar energy
investment and the regulatory framework dealing with solar in India. The
thesis chapters are arranged for discussion of various aspects of the enquiry
and addressing various research questions in the following manner.
CHAPTER 1: INTRODUCTION
Introduction to the Thesis. The chapter sets out the research problem, hypothesis,
and literature review.
CHAPTER 2: REVIEW OF LITERATURE
A detailed review of literature has helped to identify the research gap. Many
researchers have approached the law for renewable energy as a piece of
legislation to fix a favorable tariff and to enable competition in the market. To
achieve an optimum level of renewable energy generation, the potential
capacity needs to be exploited by an optimum investment in the sector. There
are various barriers to for investors which can be addressed by a
comprehensive legislation to promote renewable energy.
v
CHAPTER 3: ACCESS TO ENERGY AND THE ELECTRICITY ACT 2003
This chapter examines the constitutional background of the Electricity Act
2003. The chapter will explore the fundamental rights concerning various
essential amenities of life, the constitutional mandate under the Directive
Principles of State Policy and the center- state relations concerning the
division of various legislative powers. After analyzing the constitutional
background, the chapter will try to explore the competing claims where the
state is under obligation to provide clean and cheaper energy with the
sustainability attributes and also ensure equitable distribution of the resources
of the nation. The chapter also examines how the Electricity Act 2003 can
meet the demand for energy by ensuring an adequate supply of energy
throughout the year and also for future generations. According to neo-classical
economic theories, the optimum utilization of resources is possible only by
bringing competition to the market. Competition in the market is possible only
when there are private players in the market. Private players will be interested
in investments in the electricity sector only if there is a level playing field with
already existing government players and the sector is profitable. This chapter
thus examines the attractiveness of the sector under the current regulation
under the Electricity Act 2003.
The objective of the chapter is to identify various advantages and
shortcomings from a legal perspective in the existing regulations under the
Electricity Act 2003. This chapter examines the constitutional provisions and
various court judgments regarding electricity, access to electricity, and the
division of legislative power between the states and center. It details the
regulatory mechanism for electricity.
CHAPTER 4: LEGISLATIONS COMPLEMENTING THE GROWTH OF
THE SECTOR
The growth of renewable energy sector depends on various other legislation in
addition to the Electricity Act 2003. This chapter will explore the business
environment in India based on the ease of doing parameters adopted by the World
Bank. These other legislations, regulations and policies have a direct or indirect
vi
impact on the promotion and development of renewable energy sector. The first
part of this chapter analyses the general business environment in India which will
impact any business activity including the renewable energy sector. The second
part of this chapter will examine how the central state government policies and
measures have helped the renewable energy sector, especially solar.
CHAPTER 5: BARRIERS TO RENEWABLE ENERGY DEVELOPMENT
India has adopted a comprehensive approach to energy security which is set
out in the proposed energy policy. The policy is ambitious of achieving the
huge energy targets in the future through the proposed energy mix. The
proposed energy mix envisages to have a major role to be played buy the
renewable energy technologies. But there are various barriers to be removed
for the government to achieve the ambitious energy targets. The barriers to
development of RE in India, in general, are described in this chapter. A careful
review of existing literature by eminent scholars in the area have identified
various barriers to renewable energy development. The scholars have adopted
various methods of study to identify various barriers. This chapter is an
enquiry into various such barriers. Some of these may be specific to a
technology, while some may be specific to a policy, site or a region.
CHAPTER 6: THE STRUCTURAL ANALYSIS OF THE RENEWABLE
ELECTRICITY SECTOR AND INVESTMENT DECISION
The investment decision situation is broken into its elements using a
framework developed with inspiration from the Institutional Analysis and
Development framework. The elements are identified and the key actors, the
investors are approached for a survey through questionnaire. The survey has
helped to identify the main detractors and the main promoting measures for
renewable energy.
The method of study is inspired from various frameworks suggested by
various authors including the Institutional Analysis and Development
framework developed by Nobel Laureate late Dr. Elinor Ostrom. According to
the framework used in the study, the action situation is deconstructed into
various elements influencing the decision making. Here the investment
vii
decision by a developer is considered for the study.The framework is used to
identify all the factors which are having an impact on the investment decision
and to understand those factors which can be modified through formal law.
The factors which affects the decision can be broadly classified as those which
can be changed by rules and those which cannot be changed by rules. The
researcher propose to identify the intensity and impact of a factor on the
decision making process and propose changes through formal rules.
CHAPTER 7: THE CONCLUSION
The research questions are answered and the Hypothesis is tested. Conclusions
and suggestions from the research are set out with further area for future
research.
There are many factors which are influencing an investment decision. But the
average of the responses clearly suggest that it is the economic and financial
concerns which are the determinant of all the investment decision making.
Though this looks obvious to any prudent man, the survey has helped to rank
various financial factors and non-financial which are impacting the investment
decision. The factors which are positively impacting the investment decision
include the consideration of reduced electricity bills as the primary factor with
4.09 score average, followed by subsidies with 3.51, tax benefits with 3.49,
profitability with 3.37. All other factors have an average below 3, suggesting
that the respondents do not consider them as a major influencing factor.
Among the negatively influencing, the following factors have a higher impact
on the investment decision. Access to debt finance and the cost of the debt
fiancé and the strict regulation for the credit worthiness, and the lack of
understanding of the banking officials about the valuation of the project are
causing the developers to get financing. Lack of financing with 4.06 average
score is the major challenge in investment. Other major detracting factors
include lack of multiple buyers with 3.58, lack of consistency of policy with
3.53, lack of government incentives, lack of electricity infrastructure, and lack
of single window clearance all the three factors with 3.4 average score, and

viii
low profit margin with 3.22 average score has been identified as major
detractors. Other factors have an average score less than three.
The study has revealed that India lacks an optimal legal framework to promote
investments in renewable energy sector. It is also understood that there is lack
of coordination between the ministries, its agencies and state governments.
Hence the hypothesis is proved.
ix
ACKNOWLEDGEMENTS
I am profoundly grateful for the constant support, motivation, understanding,
guidance and encouragement by my guide Prof. (Dr.) Tabrez Ahmad. My
research would have been impossible without his guidance to sail through the
difficult phases of the work, instilling confidence and strength to pass each
stage of the research program.
I also thank Prof. (Dr.) S.G. Sreejith, Prof. (Dr.) B. Venugopal and
Dr. Rosewine Joy for their constant help at various stages of the research. I
also thank all the key officials at Presidency University, for allowing me the
time and support to complete this thesis.
I thank all the volunteers who participated in the survey, the participants in the
conferences at NLSIU Bangalore and AIT Bangkok for the constructive
feedback. I would like to thank all regulators, state agencies, central
government officials, officials of International Solar Alliance and company
representatives at RE Invest 2018, for sharing their views, suggestions and
recommendations.
My sincere thanks to Mr. Sambabu, UPES Ph.D. program staff, UPES library
Staff, IT staff, hostel staff and office staff. My heartfelt thanks to my wife and
son for letting me complete the thesis at a time when I was most needed with
them, my family, friends, students and colleagues for their help and support.
Sujith P Surendran
x
TABLE OF CONTENTS
List of Figures ................................................................................................ xvi
List of Tables .............................................................................................. xviii
List of Appendices ......................................................................................... xix
List of Abbreviations ...................................................................................... xx
List of Cases ................................................................................................. xxiv
Chapter 1 Introduction ..................................................... 01 - 41
1.1 Introduction........................................................................................ 01
1.2 The Need for the Study ...................................................................... 02
1.3 Present Energy Scenario .................................................................... 03
1.3.1 Global Energy Scenario .......................................................... 04
1.3.1.1 World Energy Supply ................................................ 04
1.3.1.2 World Energy Consumption ...................................... 06
1.3.2 Energy Scenario in India ......................................................... 07
1.3.2.1 Electricity .................................................................. 09
1.3.3 Energy Demand Forecast ........................................................ 10
1.4 Present Energy Challenges ................................................................ 11
1.4.1 The Energy Gap ...................................................................... 13
1.4.2 Rural Electrification ................................................................ 15
1.4.2.1 Definition of Electrified Village ............................... 15
1.4.3 Environment Challenges ......................................................... 16
1.4.4 Depletion of Fossil Fuels ......................................................... 18
1.4.5 Balance of Payments ............................................................... 19
1.4.6 Energy Security ....................................................................... 19
1.4.7 Economic Development .......................................................... 20
1.5 Future Energy Scenario ..................................................................... 21
1.5.1 Future Energy Forecast ........................................................... 21
1.5.2 Least Effort Scenario ............................................................... 23
1.5.3 Determined Effort Scenario .................................................... 24
1.5.4 Aggressive Effort Scenario ..................................................... 25
1.5.5 Heroic Effort Scenario ............................................................ 26
1.5.6 The Electricity Sector Current Scenario .................................. 27
1.5.7 Economic Growth Scenarios ................................................... 29
1.5.8 The GDP Growth Scenarios .................................................... 30
1.5.9 Demand Analysis And Forecast .............................................. 30
1.5.9.1 Electric Vehicles ........................................................ 33
1.6 Future Energy Challenges.................................................................. 35
1.6.1 Existing Definitions Of Sustainable Energy ........................... 36
1.6.1.1 Solar Energy as a Sustainable Source of Energy ....... 38
1.7 The Energy Gap And Energy Planning ............................................. 38
1.8 Investments In The Energy Sector ..................................................... 40
1.8.1 Lack of Government Resources .............................................. 40
1.8.2 Need for Private Investment .................................................... 41
1.8.3 Need for Regulatory Framework To Promote Business
In Solar .................................................................................... 41
xi
Chapter 2 Review of Literature ..................................... 42 - 60
2.1 Survey of Literature ........................................................................... 42
2.2 Research Gap ..................................................................................... 52
2.3 Research Methodology ...................................................................... 54
2.4 Research Questions ............................................................................ 55
2.5 Research Objectives........................................................................... 55
2.6 Hypothesis ......................................................................................... 56
2.7 Limitations of the Study .................................................................... 56
2.8 Arrangement of Chapters ................................................................... 56
2.8.1 Chapter 1: Introduction ........................................................... 56
2.8.2 Chapter 2: Review of Literature .............................................. 57
2.8.3 Chapter 3: Access Energy and the Electricity Act
2003 ......................................................................................... 57
2.8.4 Chapter 4: Legislations Complementing the Growth
of the Sector ............................................................................ 58
2.8.5 Chapter 5: Barriers to Renewable Energy
Development....................................................................................... 58
2.8.6 Chapter 6: The Structural Analysis of the Renewable
Electricity Sector and Investment Decision .......................................... 59
2.8.7 Chapter 7: The Conclusion ...................................................... 59
2.9 Conclusion ............................................................................................ 59
Chapter 3 Access to Energy and the Electricity
Act, 2003 ....................................................... 61 - 121 3.1 Introduction........................................................................................ 61
3.2 The Electricity Act 2003 and the Constitution of India ............................. 62
3.2.1 Constitution of India and Basic Human Rights ....................... 62
3.2.1.1 Right to Live with Human Dignity ........................... 62
3.2.1.2 Right to Shelter ......................................................... 63
3.2.1.3 The Right of Access to Electricity ............................ 63
3.2.2 Constitution and Other Fundamental Rights ........................... 64
3.2.2.1 Right to Clean Environment ........................................ 64
3.2.3 International Commitments for Protection of Environment ... 65
3.2.4 Sustainable Development Goals .............................................. 67
3.2.5 Goal 7 Targets ......................................................................... 68
3.2.6 Electricity Act 2003 and the Right to Carry on Economic
Activities ................................................................................. 69
3.2.6.1 Right to Carry on Economic Activities ..................... 70
3.2.7 The Duty of the State .............................................................. 71
3.2.8 The Duty of the Citizen of India ............................................. 72
3.2.9 Constitution of India and Distribution of Powers ................... 73
3.2.10 Constitution of India and Electricity....................................... 73
3.2.11 History of Legislations Governing Electricity Sector ............ 74
3.2.11.1 Evolution of the Electricity Act 2003 ..................... 77
3.2.11.2 The Structure of the Act .......................................... 78 3.2.12 The Balancing of Interests ...................................................... 79
3.3 The Electricity Act 2003 .................................................................... 79
3.3.1 Regulatory Framework for Electricity Sector........................... 81
xii
3.3.1.1 The Institutional Regulatory Mechanism .................. 81
3.3.1.2 Ministry of Power ..................................................... 82
3.3.1.3 Statutory Bodies ........................................................ 86
3.3.1.3.1 Central Electricity Authority (CEA) .......... 86
3.3.1.3.2 State Electricity Boards (SEB) ................ 88
3.3.1.3.3 Central Electricity Regulatory
Commission ............................................. 91
3.3.1.3.4 State Electricity Regulatory
Commission (SERC) ............................... 92
3.3.1.3.5 Appellate Tribunal for Electricity ............ 93 3.3.2 Regulatory Framework for Renewable Energy Under
Electricity Act 2003 ................................................................ 94
3.3.2.1 Electricity Act 2003 and the Renewable
Energy ....................................................................... 94
3.3.2.1.1 National Electricity Policy and
Tariff Policy, Sections 3(1) ...................... 95
3.3.2.1.2 National Policy for Stand-alone
Systems, Section 4 .................................... 96
3.3.3 Renewable Energy Agencies ................................................. 103
3.3.3.1 Ministry of New and Renewable Energy ................ 103
3.3.3.2 National Institute of Solar Energy .......................... 103
3.3.3.3 National Institute of Wind Energy (Niwe) .............. 104
3.3.3.4 The Indian Renewable Energy
Development Agency (Ireda) ................................. 104
3.3.3.5 Solar Energy Corporation of India (Seci) ............... 104
3.4 Whether the Electricity Act 2003 Has Been Successful
in Attracting the Investors to the Renewable Energy
Sector in India? ................................................................................ 104
3.4.1 The Global Investment Trend in Energy Sector .................... 105
3.4.2 Global Trends in Investments in the Energy Sector .................. 105
3.4.2.1 World Energy Efficiency Investments .................... 108
3.4.2.2 Buildings & Air Conditioning ................................. 109
3.4.2.3 Electricity and Renewables Investment .................. 110
3.4.2.4 Financing and Funding of Electricity
Supply Investment ................................................... 112
3.4.2.5 Investments in Storage ............................................ 115
3.4.2.6 Investments in Power Generation ........................... 116
3.4.2.7 Investments in Research and Development ............ 117
3.4.3 Renewable Energy Investment Trends in India .................... 118
3.4.4 Conclusion ............................................................................. 120
Chapter 4 Laws Complementing the Growth of
Renewable Energy ..................................... 122 - 172 4.1 Introduction...................................................................................... 122
4.2 Ease of Doing Business in India ...................................................... 122
4.2.1 Starting a Business ................................................................ 123
4.2.1.1 Dealing with Construction Permits ......................... 125
4.2.2 Getting Electricity ................................................................. 126
xiii
4.2.3 Registering Property .............................................................. 127
4.2.4 Getting Credit ........................................................................ 128
4.2.5 Protecting Minority Investors ................................................ 129
4.2.6 Paying Taxes ......................................................................... 132
4.2.7 Trading Across Borders ........................................................ 133
4.2.8 Enforcing Contracts ............................................................... 136
4.2.9 Resolving Insolvency ............................................................ 137
4.2.10 Labor Market Regulation ...................................................... 139
4.2.10.1 Legislative Initiatives ............................................. 140
4.2.10.2 Governance Reforms .............................................. 140
4.3 Various Laws Complimenting the Growth of the Sector ..................... 141
4.3.1 Banking and Financial Sector Regulations ............................. 141
4.3.1.1 The Regulatory Framework for Banking and
Finance a Brief Overview ....................................... 141
4.3.1.2 Renewable Energy and Banking Regulations ......... 142
4.3.1.2.1 Priority sector lending ............................ 142
4.3.1.2.2 Priority sector certificates ....................... 143
4.4 State Government Regulations on Renewable Energy .................... 144
4.4.1 Solar Resource-Rich States in India ...................................... 145
4.4.2 Andhra Pradesh ..................................................................... 146
4.4.2.1 Andhra Pradesh Solar Wind Hybrid Policy ............ 147
4.4.3 Gujarat ................................................................................... 149
4.4.4 Karnataka .............................................................................. 151
4.4.5 West Bengal .......................................................................... 153
4.4.5.1 Green Energy Fund ................................................. 154
4.4.5.2 Other Incentives ...................................................... 154
4.4.5.3 Role of Wbgedcl ..................................................... 155
4.4.5.4 Challenges ............................................................... 157
4.4.6 Uttar Pradesh ......................................................................... 158
4.4.7 Tamil Nadu ............................................................................ 160
4.4.8 Rajasthan ............................................................................... 162
4.4.9 Telangana .............................................................................. 163
4.4.10 Maharashtra .......................................................................... 165
4.4.11 Madhya Pradesh.................................................................... 166
4.4.12 Assam ................................................................................... 168
4.4.13 Punjab ................................................................................... 169
4.5 Other Legislations Which Promoting Development of
Renewable Energy ........................................................................... 170
4.5.1 Central Pollution Control Laws .............................................. 170
4.6 Conclusion ....................................................................................... 171
Chapter 5 Barriers to Renewable Energy
Development .............................................. 173 - 216 5.1 Introduction ..................................................................................... 173
5.2 Policy Barriers ................................................................................. 173
5.2.1 Lack of Adequate Government Policies ................................ 175
5.2.2 Lack of Political Commitment .............................................. 177
5.3 Regulatory Barriers .......................................................................... 178
5.3.1 Regulatory Framework for Promotion of Re. ....................... 178
xiv
5.4 Legal Barriers .................................................................................. 183
5.4.1 Renewable Energy and Developments in Law ..................... 185
5.4.1.1 Sovereignty over natural resources. .......................... 185
5.4.2 Lack of Public Interest Litigations ........................................ 188
5.5 Institutional Barriers ........................................................................ 189
5.5.1 Lack of Single Window Clearance System ........................... 189
5.6 Fiscal and Financial Barriers ........................................................... 190
5.6.1 Budgetary Constraints ........................................................... 190
5.6.2 Lack of Financing of Re Projects .......................................... 191
5.6.3 Lack of Subsidies .................................................................. 193
5.7 Market-Related Barriers .................................................................. 193
5.7.1 Level Playing Field For Re ................................................... 195
5.7.1.1 Market for RE ............................................................ 195
5.7.2 Inadequate Market Prices ...................................................... 197
5.7.3 Transmission Network .......................................................... 198
5.7.4 Transmission and Distribution Losses .................................. 199
5.7.5 High Equipment Costs .......................................................... 199
5.7.6 Inputs for Re Plants ............................................................... 200
5.7.7 Market Failures ..................................................................... 201
5.7.8 Lack of Sufficient Market Base ............................................ 201
5.7.9 Lack of Paying Capacity ....................................................... 202
5.7.10 Unable to Meet Electricity Power Demand .......................... 203
5.7.11 Split Benefit .......................................................................... 204
5.8 Technological Barriers..................................................................... 204
5.8.1 Technology Risk ................................................................... 204
5.8.2 R&D And Manufacturing Capabilities ................................. 205
5.8.2.1 Ds456: India — Certain Measures Relating to
Solar Cells and Solar Modules ................................. 206
5.8.3 Non-Availability of Local Technology ................................ 207
5.8.4 Inefficient Technology .......................................................... 207
5.8.5 Need for Backup or Storage Device ...................................... 207
5.8.6 Lack of Information Technology Resources ......................... 208
5.8.7 Lack of Trained People and Training Institutes .................... 208
5.8.8 Lack of Local Infrastructure .................................................. 209
5.8.9 Lack of National Infrastructure ............................................. 209
5.9 Information Barriers ........................................................................ 209
5.9.1 Lack of Skilled Manpower .................................................... 209
5.9.2 Lack of Information and Awareness ..................................... 210
5.9.3 Lack of Consumer Awareness to Technology ...................... 210
5.9.4 Unavailability of Solar Radiation Data ................................. 211
5.9.5 Lack of Experience ................................................................ 211
5.10 Socio Cultural Barriers ..................................................................... 212
5.10.1 Social Acceptance ............................................................... 212
5.10.2 Rehabilitation Issues ........................................................... 212
5.10.3 Faith and Belief ................................................................... 213
5.10.4 Consumer Behavior Barriers ............................................... 213
5.11 Ecological and Geographical Barriers ............................................. 214
5.11.1 Scarcity of Natural and Renewable Resources ................... 214
5.11.2 Geographic Conditions ....................................................... 214
xv
5.11.3 Ecological Issues ................................................................. 215
5.12 Conclusion ....................................................................................... 215
Chapter 6 The Structural Analysis of the Renewable
Electricity Sector and Investment Decision ... 217-246
6.1 Introduction ....................................................................................... 217
6.2 Investment Decision Situation .......................................................... 217
6.2.1 Biophysical Environment ...................................................... 218
6.2.2 Socioeconomic Conditions .................................................... 218
6.2.3 Policy Support ....................................................................... 219
6.2.4 Public Interest and Local Development ................................ 219
6.2.5 Economics and Profitability .................................................. 220
6.2.5.1 Institutional Arrangements ........................................ 221
6.2.6 Action Arena and the Actors ................................................. 221
6.2.6.1 Action Situation ......................................................... 222
6.2.7 State Wise Distribution of Respondents ................................ 222
6.2.7.1 Evaluative Criteria ..................................................... 224
6.3 The Factors that Influence the Investment Decision............................. 224
6.4 Factors Positively Influencing the Investment Decision ................. 224
6.4.1 Reduced Electricity Bills ....................................................... 225
6.4.2 Subsidies ................................................................................ 226
6.4.3 Tax Benefits .......................................................................... 227
6.4.4 Appreciation in the Value of the Building ............................ 228
6.4.5 Advantage of No Additional Space Requirement for
Rooftop Solar ........................................................................ 228
6.4.6 Reduced Carbon Footprint as an Influencing Factor ............ 229
6.4.7 Government Compulsion as an Influencing Factor ................... 230
6.4.8 Suitability for All Weather Climate ...................................... 231
6.4.9 Energy of the Future .............................................................. 232
6.4.10 Low Maintenance Cost as an Influencing Factor ................. 232
6.4.11 Profit ..................................................................................... 233
6.4.12 Experimental Investment ...................................................... 233
6.4.13 Brand Value as an Influencing Factor .................................. 234
6.4.14 Investors Want To Move with the Trend .............................. 234
6.4.15 Socio Environmental Considerations ................................... 235
6.5 Factors Negatively Influencing an Investment Decision ................. 237
6.5.1 Inconsistent Policy Measures ................................................. 237
6.5.2 Lack of Single Window Clearance ......................................... 238
6.5.3 Lack of Financing Solutions ................................................... 239
6.5.4 Lack of Subsidies .................................................................... 240
6.5.5 Lack of Buyers ........................................................................ 241
6.5.6 Lack of Evacuation Infrastructure .......................................... 241
6.5.7 Risk of Technology Getting Outdated .................................... 242
6.5.8 Lack of Skilled Manpower ..................................................... 243
6.5.9 Low Profit Margin .................................................................. 243
6.5.10 Geographical Conditions ...................................................... 244
6.6 Conclusion ....................................................................................... 245
xvi
Chapter 7 Conclusion .......................................................... 247 -256
7.1 Result of Hypothesis ........................................................................ 253
7.2 Suggestions ...................................................................................... 253
Bibliography ..................................................................... 257 - 287
Appendix .................................................................................... 288
xvii
TABLE OF FIGURES
Figure 1.1 World and OECD Total Primary Energy Supply ...........................05
Figure 1.2 World and OECD Energy Consumption by Fuel. ................... 06
Figure 1.3 Generating Capacity Addition .................................................. 13
Figure 3.1 Global Power Sector Investment and Electricity
Demand Growth ...................................................................... 111
Figure 3.2 Innovations Trend in Renewable Energy .............................. 118
Figure 3.3 Annual Renewable Energy Capacity Addition ...................... 119
Figure 4.1 Solar Resource-Rich States in India ........................................ 145
Figure 4.2 Focus States ............................................................................. 146
Figure 5.1 Average Cost of Supply and Average Revenue of State
Power Utilities ................................................................................ 197
Figure 6.1 Solar Irradiation Map .............................................................. 218
Figure 6.2 Actors in the Action Arena ..................................................... 221
Figure 6.3 State wise distribution of respondents ..................................... 222
Figure 6.4 Reduced Electricity Bills ......................................................... 225
Figure 6.5 Subsidies ................................................................................. 226
Figure 6.6 Tax benefits ............................................................................. 227
Figure 6.7 Appreciation in the Building Value ........................................ 228
Figure 6.8 No additional Space Required ................................................. 228
Figure 6.9 Reduced Carbon Footprint ...................................................... 229
Figure 6.10 Government Compulsion ........................................................ 230
Figure 6.11 All Weather Suitable ............................................................... 231
Figure 6.12 Energy of the Future ................................................................ 232
Figure 6.13 Low Maintenance Cost ........................................................... 232
Figure 6.14 Profit ........................................................................................ 233
Figure 6.15 Experimental Investment ........................................................ 233
Figure 6.16 Brand Value ............................................................................ 234
Figure 6.17 Moving With the Trend ........................................................... 235
Figure 6.18 Socio-Environmental Considerations ...................................... 235
Figure 6.19 Key Factors Influencing the Investment Decision .................. 236
Figure 6.20 Inconsistent Policies ................................................................ 237
Figure 6.21 Lack of Single Window Clearance ......................................... 238
Figure 6.22 Lack of Financing ................................................................... 239
Figure 6.23 Lack of Subsidies .................................................................... 240
Figure 6.24 Lack of Buyers ........................................................................ 241
Figure 6.25 Lack of Electricity Infrastructure ............................................ 241
xviii
Figure 6.26 Risk of Technological Change ................................................ 242
Figure 6.27 Lack of Skilled Manpower ...................................................... 243
Figure 6.28 Low Profit Margin ................................................................... 244
Figure 6.29 Geographical Conditions ......................................................... 244
Figure 5.30 Factors Negatively Influencing the Investor Decision ............ 245
xix
TABLE OF TABLES
Table 1.1 Actual and Projected Energy Consumption ............................... 11
Table 1.2 Mismatch between RE capacity envisaged under
polity and capacity addition targeted ......................................... 14
Table 1.3 Least Effort Scenario ................................................................. 24
Table 1.4 Determined Effort Scenario ....................................................... 25
Table 1.5 Aggressive Effort Scenario ........................................................ 26
Table 1.6 Heroic Effort Scenario ............................................................... 27
Table 1.7 Power Supply Position 2018-19 ................................................ 29
Table 1.8 The Energy Gap ......................................................................... 39
Table 4.1 Comparison of Findings with Doing Business Data ............... 134
Table 4.2 Solar RPO ............................................................................... 156
Table 7.1 Total number of respondents ................................................... 223

xx
LIST OF APPENDICES
1. Survey Questionnaire ......................................................... 288
xxi
TABLE OF ABBREVIATIONS
AC Air Conditioners
ACS Average Cost of Supply
AD Accelerated Depreciation
BAU Business as Usual
BCM Billion Cubic Meters
BEE Bureau of Energy Efficiency
CAGR Compounded Annual Growth Rate
CBET Cross Border Electricity Trade
CBM Coal Bed Methane
CCS Carbon Capture and Storage
CEA Central Electricity Authority
CGD City Gas Distribution
CIL Coal India Limited
CMPDI Central Mine Planning and Design Institute
CO2 Carbon Dioxide
CSP Concentrated Solar Power
CTL Coal to Liquid
CTO Chief Technical Officer
DBT Direct Benefit Transfer
DBT-L Direct Benefit Transfer – Liquefied Petroleum Gas
DDG Decentralized Distributed Generation
DDUGJY Deen Dayal Upadhyaya Grameen Jyoti Yojana
DELP Domestic Efficient Lighting Programme
DME Dimethyl Ether
DSR Demand Side Reduction
DST Department of Science and Technology
E&P Exploration and Production
EESL Energy Efficiency Services Limited
ESCO Energy Service Company
EV Electric Vehicles
xxii
FBR Fast Breeder Reactor
FSA Fuel Supply Agreement
GAIL Gas Authority of India Limited
GDP Gross Domestic Product
GHG Greenhouse Gas
GSI Geological Survey of India
HDI Human Development Index
HDV Heavy Duty Vehicle
HELE High Efficiency Low Emission
HRD Human Resource Development
IAEA International Atomic Energy Agency
IBM Indian Bureau of Mines
IEA International Energy Agency
IESS India Energy Security Scenarios
IGCC Integrated Gas Combined Cycle
IREDA Indian Renewable Energy Development Agency Limited
Kgoe Kilogram of Oil Equivalent
kWh Kilo Watt Hours
LCOE Levelized Cost of Electricity
LDV Light Duty Vehicle
LED Light Emitting Diode
LNG Liquefied Natural Gas
LPG Liquefied Petroleum Gas
LWR Light Water Reactor
Mboe Million Barrel of Oil Equivalent
MDO Mine Developer cum Operator
MoEF&CC Ministry of Environment, Forests and Climate Change
MoPNG Ministry of Petroleum and Natural Gas
MoSPI Ministry of Statistics and Program Implementation
Mtce Million Tons of Coal Equivalent
Mtoe Million Tons of Oil Equivalent
MW Mega Watts
MNRE Ministry of New and Renewable Energy
xxiii
NAPCC National Action Plan on Climate Change
NDCs Nationally Determining Contributions
NELP New Exploration Licensing Policy
NEP National Energy Policy
NGO Non-Governmental Organization
NISE National Institute of Solar Energy
NIWE National Institute of Wind Energy
NMCC National Mission on Clean Cooking
NMEEE National Mission on Enhanced Energy Agency
NMT Non-motorized transport
NOC National Oil Company
NPCIL Nuclear Power Corporation of Indian Ltd.
NRDC National Research Development Corporation
NSS National Sample Survey
NTPC National Thermal Power Corporation
OALP Open Acreage Licensing Policy
OECD Organization for Economic Cooperation and Development
OIDB Oil Industry Development Board
OMC Oil Marketing Companies
ONGC Oil and Natural Gas Corporation
PAT Perform, Achieve and Trade
PCRA Petroleum Conservation Research Association
PGCIL Power Grid Corporation of India
PHWR Pressurized Heavy Water Reactor
PLF Plant Load Factor
PMUY Prime Minister Ujjwala Yojana
PNG Piped Natural Gas
PNGRB Petroleum and Natural Gas Regulatory Board
PPA Power Purchase Agreements
PPP Public Private Partnership
PSU Public Sector Undertaking
PWD Public Works Department
R&D Research and Development
xxiv
R&R Resettlement & Rehabilitation
RE Renewable Energy
RESCO Renewable Energy Service Company
RPO Renewable Purchase Obligation
SAARC South Asian Association for Regional Cooperation
SDA State Nodal Agency
SECI Solar Energy Corporation of India
SERC State Electricity Regulatory Commission
SUVs Sport Utility Vehicles
T&D Transmission and Distribution
TEC Telecommunication Engineering Centre
TWh Terwatt Hour
UDAY Ujwal Discom Assurance Yojana
ULB Urban Local Bodies
UMPP Ultra Mega Power Project
UNFCCC United Nations Framework Convention on Climate Change
US United States of America
VGF Viability Gap Funding
xxv
TABLE OF CASES
Francis Coralie v. Administrator, Union Territory of Delhi
State of Karnataka v. Narasimhamurthy
Chameli Singh v. State of Uttar Pradesh
TM Prakash and Others v The District Collector and The Superintending
Engineer, Tamil Nadu Electricity Board
Chottelal Yadav v Chattisgarh State Power Distribution Company Ltd
State of MP v Kedia Leather & Liquor Ltd
M.C. Mehta v Union of India (2003)
Vellore Citizens Welfare Forum v. Union of India
Essar oil Limited v Halar Utkarsh Samiti, and Ors.
Excel Wear v Union of India,
Arjun Gopal and Ors. v Union of India and Ors
Essar oil Limited v Halar Utkarsh Samiti and Others
Indian Council for Enviro-Legal Action v. Union of India The Supreme Court
GMR Energy Ltd v Government of Karnataka
Chhattisgarh Biomass Energy Developers Association and Ors. v.
Chhattisgarh State Electricity Regulatory Commission
V.Srinivasan v. Secretary to Tamil Nadu Generation and Distribution Corpn
Ptc India Ltd. v. Central Electricity Regulatory Commission Thr. Secy
Ptc India Ltd. v. Central Electricity Regulatory Commission Thr. Secy.,
Transmission Corporation of A.P. v. Andhra Pradesh State Electricity
Citizen Forum Through Its Secretary Shri Rajiv S/O Gajanan Jagtap, v. State
of Maharashtra Through Its Secretary, Department of Energy (Excluding
Non-conventional Energy) and ors
T.Bhuvaneswari v. District Collector Cum District Magistrate of Erode Dist
R.Santhana Raj vs The Chief Engineer
Transmission Corporation of Andhra Pradesh Ltd. and Anr. v. Sai Renewable
Power Pvt. Ltd. and Ors.
1
CHAPTER - 1
INTRODUCTION
1.1 INTRODUCTION
More than six billion of the 7.3 billion inhabitants on earth today are living in
the less developed regions of the world1. People from the developed nations
enjoy the fruits of development and lead quality life compared to their
counterparts in less developed regions2. The less developed nations thrive to
perform in the economic arena with increased investment in industrial and trade
activities. Better economic conditions are inevitable for them to eradicate poverty
and increase life expectancy. The economic performance of a country is greately
influenced and depended on the availability of energy resources3.
The major share of the energy produced and consumed today is from fossil
fuels. Coal, Oil and Gas occupy a key position in the global energy mix.
Almost 85% of today’s commercial energy need is met by them4. There is a
higher energy demand from developing nations when they embrace
development and progress in that trajectory. The energy which these nations
largely depend is fossil fuels. This will not only accelerate the depletion of
such fuels, but also result in the generation of greenhouse gases at
unprecedented levels. The global warming is also a major concern of this
1 IGOR RIBEIRO, KEY FINDINGS WPP 2015 (2015), https://esa.un.org/unpd/wpp/ Publications
/Files/Key_Findings_WPP_2015.pdf (last visited Jul 22, 2018)
2 U.N.D.P., 2015 HUMAN DEVELOPMENT REPORT, http://report.hdr.undp.org/ (last visited Jul
22, 2018)
3 David I. Stern, The Role of Energy in Economic Growth, (Crawford School Centre for
Climate Economics & Policy Paper No. 3.10, 2011) http://ccep.anu.edu.au/data/2010/pdf/
wpaper/CCEP-3-10.pdf (last visited Jul 22, 2018)
4 INTERNATIONAL ENERGY AGENCY, KEY WORLD ENERGY STATISTICS 2015 (2015),
https://www.iea.org/ publications/freepublications/publication/KeyWorld_Statistics_2015.pdf
(last visited Jul 22, 2018)
2
scenario. Thus it is important that the world energy production and
consumption move towards a more sustainable energy systems and
consumption patterns.
The global warming and the depleting fossil fuel resources have made us to
think about sustainable energy. Maintaining economic growth and achieving
sustainability are conflicting claims at times. Economic growth depends to a
large extent on the availability of cheaper sources of energy. Currently the
cheaper sources of energy are fossil fuels. Fossil fuels cannot meet the
sustainability standards. Creating an energy policy and devising an energy mix
is a challenging exercise in this context. Yet, the New Energy Policy 20175 is
making an attempt to meet all standards and demands to secure India’s energy
future. There are various factors affecting an energy policy decision.
Availability and cost of resources, geopolitical situations, international
commitments and the objectives to be achieved are some of the determining
factors. The energy policy and energy mix of the countries vary accordingly.
For example, India has more thermal power plants while France has most of
its electricity produced from nuclear plants and Scotland from wind farms.
1.2 THE NEED FOR THE STUDY
If the world population doesn’t make a shift to sustainable energy systems6,
the resultant climate and environmental challenges and the future energy
security challenges can lead to deteriorate the conditions for sustaining life on
earth. Any attempt to mitigate the greater risks will still leave us short of
achieving economic and development goals. It is thus imperative to
aggressively plan our future with attaining sustainable development goals. The
goal seven of the UN Sustainable Development Goals focuses on Energy7.
5 DRAFT NATIONAL ENERGY POLICY NITI AAYOG, GOVERNMENT OF INDIA, https://niti.gov.in/
writereaddata/files/new_initiatives/NEP-ID_27.06.2017.pdf (last visited Dec 6, 2018).
6 A ‘Sustainable Energy System’ is where the sustainable energy is produced and consumed
efficiently. See Sujith Surendran & Tabrez Ahmad, The Need for a Legal Definition of
Sustainable Energy for a Sustainable Future, 2016 1–14, (2016) at 14.
7 THE GENERAL ASSEMBLY & THE GOALS, UN RESOLUTION 2020 AGENDA FOR SUSTAINABLE
DEVELOPMENT 2015.09.25, 16301 1–35 (2015).
3
Across the government and international agencies there has been a consensus
that the climate change is real and they have to act immediately to protect the
earth from the future devastating destructions the climate change can bring.
This consensus can be seen in the new Paris agreement on Climate Change
and the creation of International Solar Alliance8. Governments need to plan
and make investments for the future energy needs as well as a complete shift
of current energy sources to clean technology is also inevitable. This task is so
huge and the investment requirements cannot be met by the governments and
government agencies alone. Private energy investors at small and large scale,
micro and macro scale are required to mobilize their resources to achieve the
energy goals of the world. Private entities like Microsoft and Facebook are
also leading the investment drive in clean energy9.
Since government resources are limited, it is crucial to attract more private
investments to fund the shifting to clean technologies. We need to ensure a
legal framework that can attract more investments in the clean energy
technologies, including the technologies in the energy production,
consumption transmission. This research is primarily focused on examining
the existing laws that regulate the investment and doing business in the
renewable energy sector with focus on solar energy being on source of energy
available throughout the country.
1.3 PRESENT ENERGY SCENARIO
Energy is one of the forces that will shape the world of tomorrow. The way we
generate and consume energy will have a profound effect on the living
conditions as well as on environment. Identifying the forces which shape our
8 MINISTRY OF NEW AND RENEWABLE ENERGY, INTERNATIONAL SOLAR ALLIANCE WILL BE
THE FIRST INTERNATIONAL AND INTER-GOVERNMENTAL ORGANISATION OF 121 COUNTRIES
TO HAVE HEADQUARTERS IN INDIA WITH UNITED NATIONS AS STRATEGIC PARTNER (Jan
25. 2016), http://pib.nic.in/newsite/ PrintRelease.aspx?relid=135794 (last visited Dec 14,
2018).
9 Mark Zuckerberg, Priscilla and I are joining Bill Gates in launching the Breakthrough
Energy Coalition to invest in new clean energy technologies, FACEBOOK (NOV. 29, 2015)
https://www.facebook.com/photo.php?fbid=10102500936699601&set=a.52923770
6231.2034669.4&type=3&theater (last visited Dec 14, 2018).
4
energy scenarios of the future is crucial to control and manage those forces.
Only then we may drive our energy future through the path we decide. We
need to identify the present scenario and the forces involved as well as the
future scenario.
1.3.1 GLOBAL ENERGY SCENARIO
Global Energy Scenario is the reflection of how the energy is produced and
consumed across the nations. The global energy scenario is the sum total of
energy demand, energy supply, energy consumption and energy mix that each
nation is currently dealing with. There are drastic differences in the energy
demand, energy supply, energy consumption and energy mix in a developed
nation from that of a developing nation. Due to this difference it is logical to
consider the details of the current energy scenarios in the developed nation and
developing nations separately.
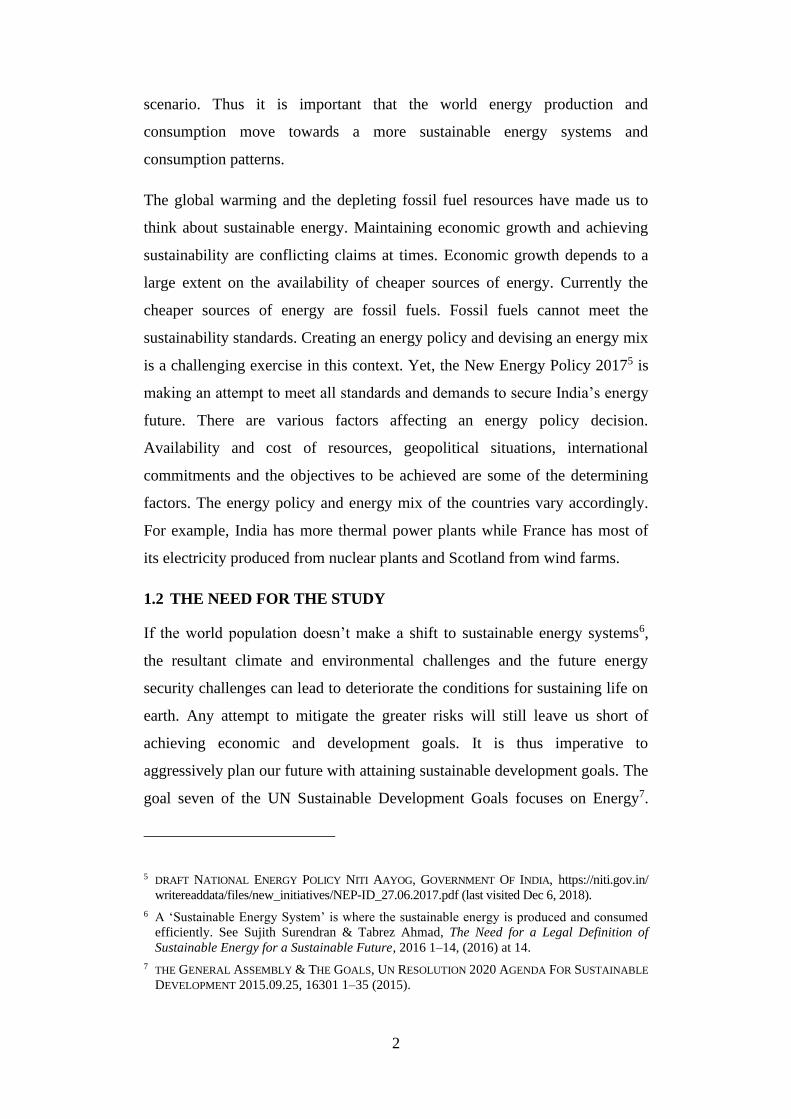
1.3.1.1 World Energy Supply
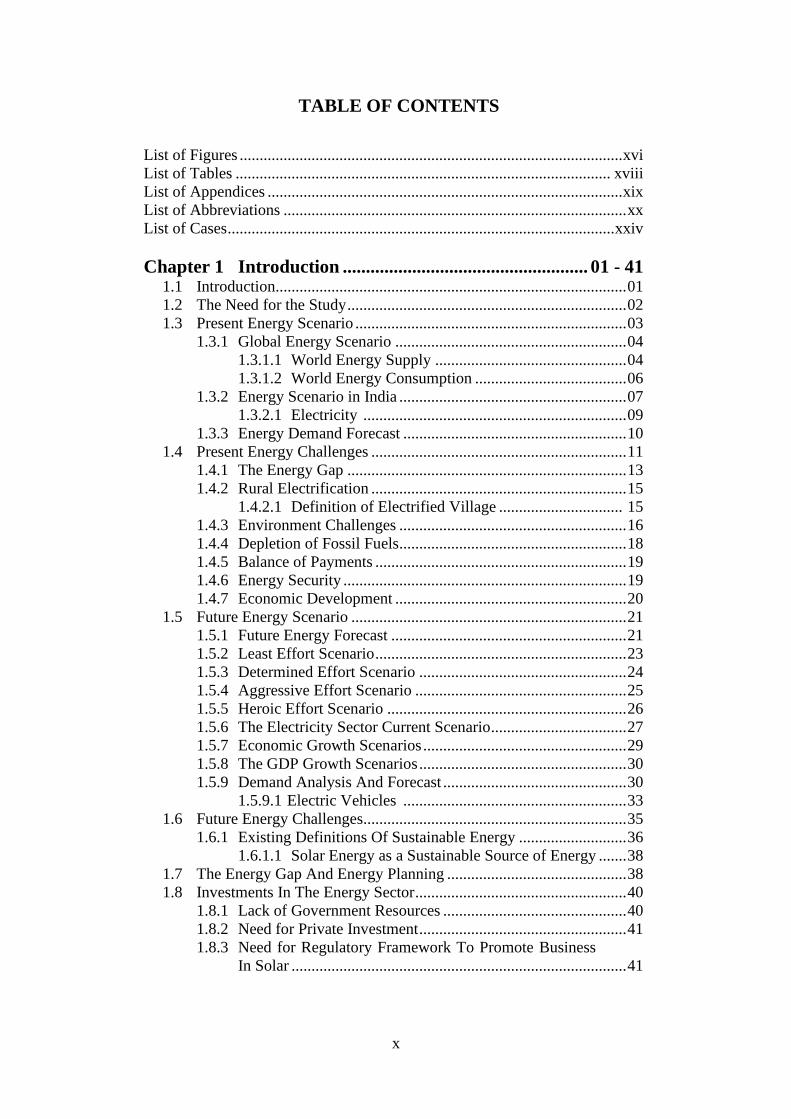
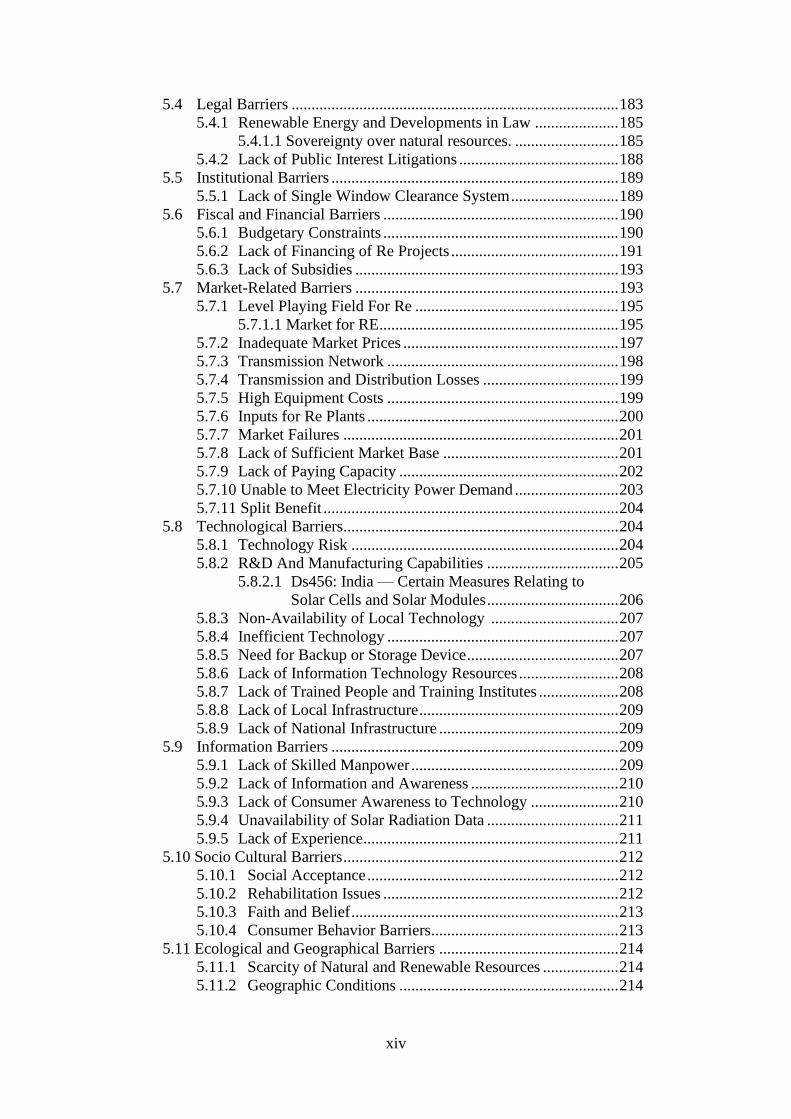
In the year 2016 the world Total Primary Energy Supply (TPES) was 13761
Metric Ton Equivalent of Oil (Mtoe). 31.9 percentage of the total energy
supply came from oil10. Coal contributed 27.1 percent, Natural gas 22.1%,
nuclear 4.9 %, hydro 2.5 %, biofuels and reached 9.8 % and others 1.7 % 11.
The 1.7 % of energy supply from other sources include geothermal, solar,
wind, tidal wave, heat and others. More than 80% of the world primary
energy supply is from fossil fuels. The contribution of renewable energy is
less than to percentage. Compared to 1973, the share of oil and natural gas has
increased in the total energy mix whereas, the oil share has reduced from
46.2 percent to 31.9 percent12. The total energy supply has increased from
6101 Mtoe in the year 1973 to 13761 Mtoe in 201613.
10 INTERNATIONAL ENERGY AGENCY, KEY WORLD ENERGY STATISTICS 2018,
www.iea.org/statistics/. (last visited Dec 15, 2018).
11 Id.
12 Id.
13 Id.
5
Source: World Energy Statistics 2018
Fig. 1.1 World and OECD Total Primary Energy Supply
It was in 1973 International Energy agency started the Global statistics on energy
production and consumption. This was the result of the major oil shock in the
1970s. The international community recognised the need for developing
alternative energy sources after the energy stock of 1970s. This is result today
commencement of research and innovation in Renewable Energy Technologies
which national governments thought can be produced independent of fossil
fuels14.
In the OECD Countries, the total primary energy supply is 5303 Mtoe in the
year 2017. It was 3740 Mtoe in 1973. While 52.6% of the primary energy
supply came from oil in 1973, the share of oil is 35.9 percent in 2017. The
share of renewables is just 2.4 % in 2017. It was 0.2 percentage in 197315.
The crude oil production has increased from 2869 Mt in 1973 to 4365 Mt in 2017,
with major share coming from Middle East, OECD and Europe. The natural gas
production in 2017 was 3768 BCM compared to 1973 when it was 1224 BCM.
The coal production stood at 7549 Metric Ton (Mt) which was 3074 Mt 197316.
14 INTERNATIONAL RENEWABLE ENERGY AGENCY, RENEWABLE ENERGY STATISTICS 2018,
http://www.irena.org/publications/2018/Jul/Renewable-Energy-Statistics-2018 (last visited Aug
29, 2018).
15 supra note 10 ENERGY AGENCY.
16 Id.
6
1.3.1.2 World Energy Consumption
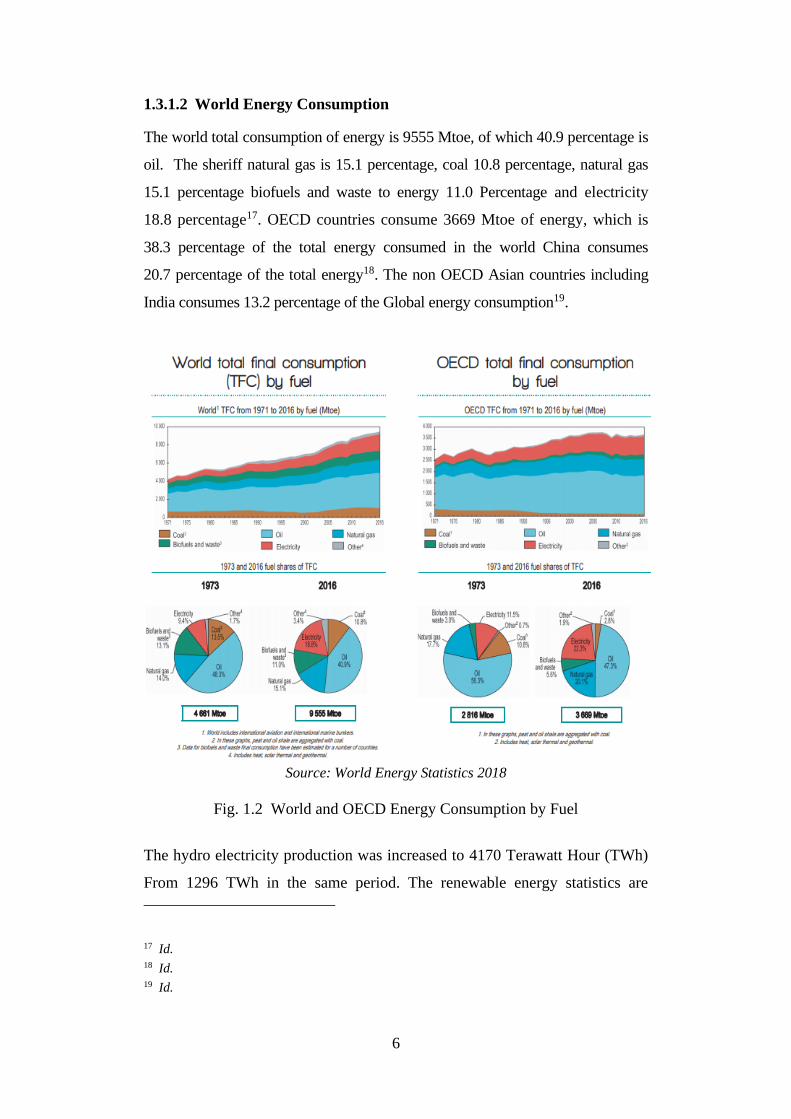
The world total consumption of energy is 9555 Mtoe, of which 40.9 percentage is
oil. The sheriff natural gas is 15.1 percentage, coal 10.8 percentage, natural gas
15.1 percentage biofuels and waste to energy 11.0 Percentage and electricity
18.8 percentage17. OECD countries consume 3669 Mtoe of energy, which is
38.3 percentage of the total energy consumed in the world China consumes
20.7 percentage of the total energy18. The non OECD Asian countries including
India consumes 13.2 percentage of the Global energy consumption19.
Source: World Energy Statistics 2018
Fig. 1.2 World and OECD Energy Consumption by Fuel
The hydro electricity production was increased to 4170 Terawatt Hour (TWh)
From 1296 TWh in the same period. The renewable energy statistics are
17 Id. 18 Id. 19 Id.
7
available from 2005 onwards20. In 2005 the total wind energy produced was
104TWh. This is increased to 958 TWh in 201621.
The share of oecd countries were 90.2 % in 2005 which is reduced to
63.1 percentage in 2016 due to increased capacity addition in wind energy by
China claiming 24.8 Percentage share in the total wind energy production22.
The contribution of solar photovoltaic electricity to the Global energy mix in
2005 was 4 TWh. This is increased to 328 TWh in 2016. The total Global
Electricity production is at 24973 TWh in 2016. In 1973 the Global Electricity
production was 6131 TWh23.
1.3.2 ENERGY SCENARIO IN INDIA
The Compound Annual Growth Rate (CAGR) of Coal & Lignite production in
2016-17 are 3.79% & 2.9% respectively and the consumption was increased by
5.29% and 2.22% respectively for the period24 during the past decade. Crude Oil
and Natural Gas, the Production increased by 0.54% and (-) 0.16% but
consumption grew by 4.63% & (-) 2.47% in the period of 2007-08 to 2016-1725.
Generation of Electricity enhanced by 4.05 % with a consumption increase of
7.82% in the decade ending 2016-1726. The period 2007-08 to 2016-17, the
Natural gas and Crude Oil has witnessed an increase in imports by 15.42% and
5.46%27. Electricity import from Nepal and Bhutan also increased to 7.11%
and we also exported with an increase of 30.29%28. Industrial sector which is
an energy intensive sector consumes 58 % of the total energy consumed
20 Id.
21 Id.
22 Id.
23 Id.
24 ENERGY STATISTICS 2018 (TWENTY FIFTH ISSUE) CENTRAL STATISTICS OFFICE MINISTRY OF
STATISTICS AND PROGRAMME IMPLEMENTATION GOVERNMENT OF INDIA NEW DELHI,
http://mospi.nic.in/ sites/default/files/publication _reports/Energy_Statistics_2018.pdf (last
visited Dec 15, 2018).
25 Id.
26 Id.
27 Id.
28 Id.
8
during the period. The per capita energy use also increased with A CAGR of
3.54% 29.
Coal deposits are mainly found in the states of Jharkhand, Odisha,
Chhattisgarh, West Bengal, Madhya Pradesh, Telangana and Maharashtra
constituting 98.20% of the coal reserves in India. It is estimated have a 315.14
billion tonnes of coal reserves in India. Lignite on the other hand is estimated
to be 44.70 billion tonnes as on 31.03.201730.
India produced 662.79 million tonne (MTs) of coal in 2016-17 and 45.23
million tonnes of Lignite31. The trend of production from 2007-08 to 2016-17,
suggest that coal production in India increased from 457.08 MTs during 2007-
08 to 662.79 MTs during 2016-17 at a CAGR of 3.79% and Lignite at 2.90%
with an increased production from 33.98 MTs in 2007-08 to 45.23 MTs in
2016-1732. Crude oil production was 34.12 MTs during 2007-08 which was
increased to 36.01 MTs by 2016-17, at a CAGR of 0.54%. The lack of sufficient
oil reserves in India is the main reason for the slow growth of this sector. The
cumulative growth of natural gas (-) 0.16% and electricity was 4.05%33. The
highest growth of all the energy sources was that of the electricity.
The crude oil reserves in India is estimated at 604.10 million tonnes (MT) with
Western Offshore having 39.60% of share followed by Assam (26.48%)34.
Natural Gas reserves stood at 1289.81 Billion Cubic Meters (BCM).
It is estimated to have a high potential for renewable energy from wind, solar,
biomass, small hydro and cogeneration bagasse. The potential estimated is at
10,01,132 MW with solar power of 649342 MW (64.86%) and wind power
29 Id. 30 Id. 31 C.E.A., POWER SECTOR, GOVERNMENT OF INDIA MINISTRY OF POWER CENTRAL ELECTRICITY
AUTHORITY NEW DELHI 1–52 (2018), http://www.cea.nic.in/ reports/monthly/executivesummary/
2018/exe_summary-05.pdf. 32 Id. 33 Id. 34 Id.
9
potential of 3,02,251 MW (30.19%) and remaining other sources including Small
Hydro35.
1.3.2.1 Electricity
India Currently has an installed capacity of 346047.57 MW of power
generation as on 31 October 201836. The coal fired power plants contribute
the highest sharein the sector with 193466.50 MW of installed capacity. The
other fossil fuels which contribute to India’s power generation are gas with an
installed capacity of 25185.38 MW and diesel having an ins8talled capacity of
837.63 MW37. The installed capacity of nuclear power plants is 6780 MW,
hydro 45487.42 MW and Renewable Energy Sources (RES) 72012.81 MW38.
Electricity generation capacity addition witnessed a 6.70% growth of 23680 MW
from 2015-16 to 2016-1739. The highest growth rate was for Other Renewable
Sources (ORS) (24.08%) and Thermal Power (3.73%)40. The total Installed
capacity raised from 1,43,061 MW in 31.3.2008 to 3,26,833 MW as on
31.3.2017, at a CAGR of 8.61%41.
The thermal power plants constitute 70.83% of the total installed capacity, with
an installed capacity of 267129 MW. Other renewable Sources (excluding
hydro) has an installed capacity of 58680 MW, and 15.56% share in the total
installed capacity. The Hydro and Nuclear energy are 11.81% and 1.80%
respectively. Power generated by entities other than electricity utilities are at
13.34% (50,289 MW).
35 Id.
36 CENTRAL ELECTRICITY AUTHORITY EXECUTIVE SUMMARY ON POWER SECTOR
GOVERNMENT OF INDIA MINISTRY OF POWER (OCT. 18, 2018). http://www.cea.nic.in/
reports/monthly/executivesummary/2018/exe_summary-10.pdf(last visited Dec 15, 2018).
37 supra note 31 C.E.A.
38 Id.
39 Id.
40 Id.
41 Id.
10
The total grid connected renewable power was 42849.38MW as on
31.03.201642, and increased to 57244.23 MW as on 31.03.2017 with a growth
rate of 33.59. Wind power is the major contributor with 56.39%, solar power
(21.47%) and Biomass power (14.29%) are the other major renewable energy
sources. Tamil Nadu was the leading state in the renewable energy contribution
with high installed capacity of wind power in the state which has been
overtaken with solar power by Karnataka recently. As on 31.03.2017 Tamil
Nadu had grid connected renewable power of 10562.39 MW, Maharashtra
7647.60 MW, and Karnataka 7457.97 MW. Rural electrification is one of the
major challenges of the government. A total of 5,92,972 villages were
electrified accounting for 99.2% of the total villages in the country.
Coal and Lignite formed the major portion of the total energy consumption
with 45.16% of the total consumption during 2016-17. Crude Petroleum with
35.05% and Electricity with 13.11% was followed. The total consumption
increased from 28,337petajoules during 2015-16 to 29,279petajoules during
2016-17 marking 3.32% increase in consumption. Per-capita Energy
Consumption (PEC) was 19579 Mega Joules in 2011-12 which has increased
to 22351 Mega Joules in 2016-17 at an annual growth rate of 1.89%43.
Energy Intensity is defined as the amount of energy consumed for generating
one unit of Gross Domestic Product at constant prices. Per-Capita Energy
Consumption and Energy intensity are the indicators for policy formulation in
the energy sector. The Energy Intensity decreased from 0.2732 Mega Joules
per rupee in 2011-12 to 0.2401 Mega Joules per rupee in 2016-17.
1.3.3 ENERGY DEMAND FORECAST
During the last decade of 2000/01 to 2010/11 the industry sector in India has
shown a consistent average growth of 7%. This sector has consumed 45% of
the total commercial energy consumed during the period. India has a
42 Supra note 24.
43 CENTRAL STATISTICS OFFICE MINISTRY OF STATISTICS AND PROGRAMME IMPLEMENTATION
GOVERNMENT OF INDIA, www.mospi.gov.in2017 (last visited Aug 29, 2018).
11
population of 18% of the total global population but is consuming an energy
share of only 5.7%. The energy demand in India has grown 46% since 2000..
The per capita energy consumption of India is much lower than the developed
nations. The India Energy Security Scenarios 204744, which has created
various future energy scenarios and has made a forecast that the energy
demand under the least effort scenario in 2047 will be 22140 TWh45. The
forecast suggests that with determined effort to bring energy efficiency and
energy conservation, the demand can be estimated at 18634 TWh from the
current demand of 4929TWh (2012)46. According to the forecast, the per
capita demand also increases from 4053 KWh to 12991 KWh under least
effort scenario and to 10934KWh. All these forecasts suggest that there is
going to be a huge requirement of capacity addition in the energy sector.
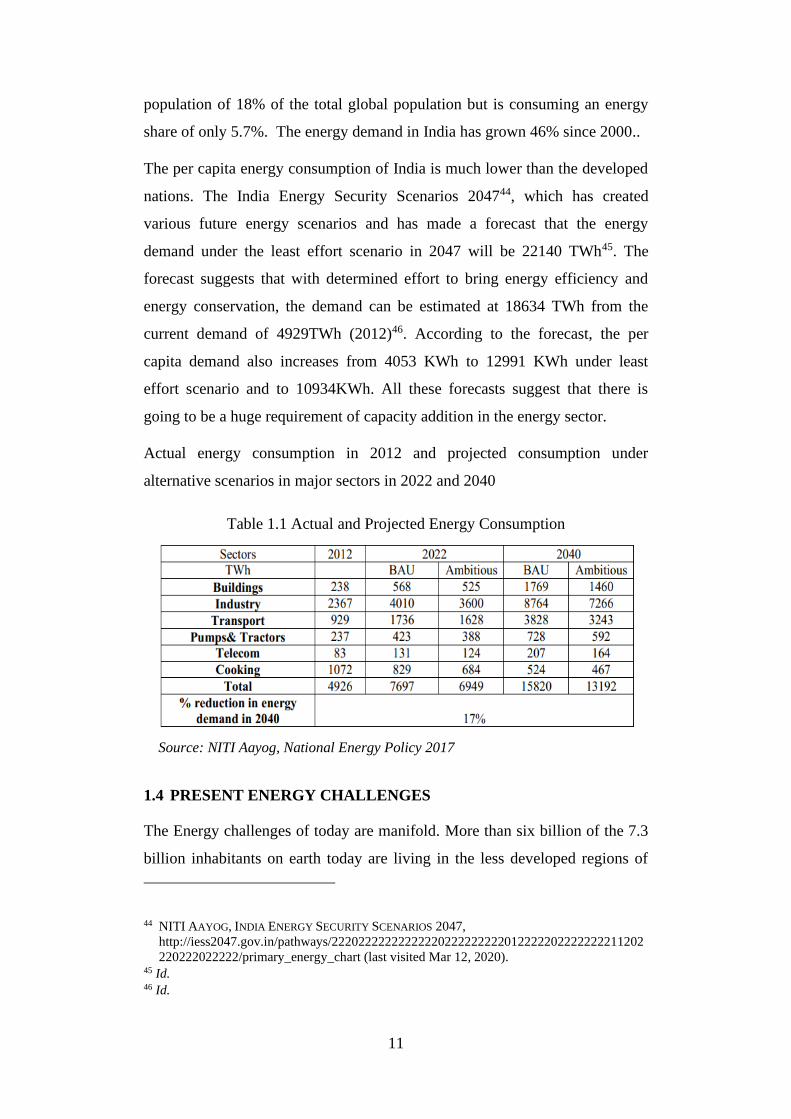
Actual energy consumption in 2012 and projected consumption under
alternative scenarios in major sectors in 2022 and 2040
Table 1.1 Actual and Projected Energy Consumption
Source: NITI Aayog, National Energy Policy 2017
1.4 PRESENT ENERGY CHALLENGES
The Energy challenges of today are manifold. More than six billion of the 7.3
billion inhabitants on earth today are living in the less developed regions of
44 NITI AAYOG, INDIA ENERGY SECURITY SCENARIOS 2047,
http://iess2047.gov.in/pathways/22202222222222220222222222012222202222222211202
220222022222/primary_energy_chart (last visited Mar 12, 2020). 45 Id. 46 Id.
12
the world47. People from the developed nations enjoy the fruits of
development and lead quality life compared to their counterparts in less
developed regions48. The less developed nations thrive to perform in the
economic arena with increased investment in industrial and trade activities.
Better economic conditions are inevitable for them to eradicate poverty and
increase life expectancy. The economic performance of a country is greately
depended on the availability of energy resources49.
Eradicating poverty is directly related to generation of income50. To end
starvation and poverty people required to have access to any kind of income.
Income generation is directly connected to the available sources of energy.
Farming, local businesses and the transportation of goods to markets depend
largely on the availability of energy in different forms. Affordable energy is
inevitable to have an income and lead a decent life. The UN and the World Bank
have initiated many programs to reduce poverty across the globe. Accessible and
affordable energy is one of the key ingredients of those initiatives51.
The major share of the energy produced and consumed today is from fossil
fuels. Coal, Oil and Gas occupy a key position in the global energy mix.
Almost 85% of today’s commercial energy need is met by them52. There is a
greater demand for energy from developing nations when they embrace
development and progress in that trajectory. The energy which these nations
largely depend is fossil fuels. This will not only accelerate the depletion of such
fuels, but also result in the generation of greenhouse gases at unprecedented
levels. The global warming is also a major concern of this scenario. Thus it is
47 supra note 1, Igor Ribeiro.
48 supra note 2, 2015 HUMAN DEVELOPMENT REPORT.
49 supra note 3 David Stern
50 EUROPEAN UNION, THE EUROPEAN UNION ENERGY INITIATIVE FOR POVERTY ERADICATION
AND DEVELOPMENT, http://ec.europa.eu/environment/archives/wssd/ documents/energy_
initiative.pdf (last visited Jul 22, 2018).
51 GLOBAL MONITORING REPORT 2015/2016: DEVELOPMENT GOALS IN AN ERA OF
DEMOGRAPHIC CHANGE 25–86, http://pubdocs.worldbank.org/en/1097014 43800596288/
PRN03-Oct2015-TwinGoals.pdf (last visited Jul 22, 2018).
52 supra note 4 KEY WORLD ENERGY STATISTICS 2015.
13
important that the world energy production and consumption move towards a
more sustainable energy systems and consumption patterns. But what are
sustainable energy systems is not defined in the policy documents of any
governments. Some international agencies have defined but ignored many
important aspects which are discussed later in this article.
1.4.1 THE ENERGY GAP
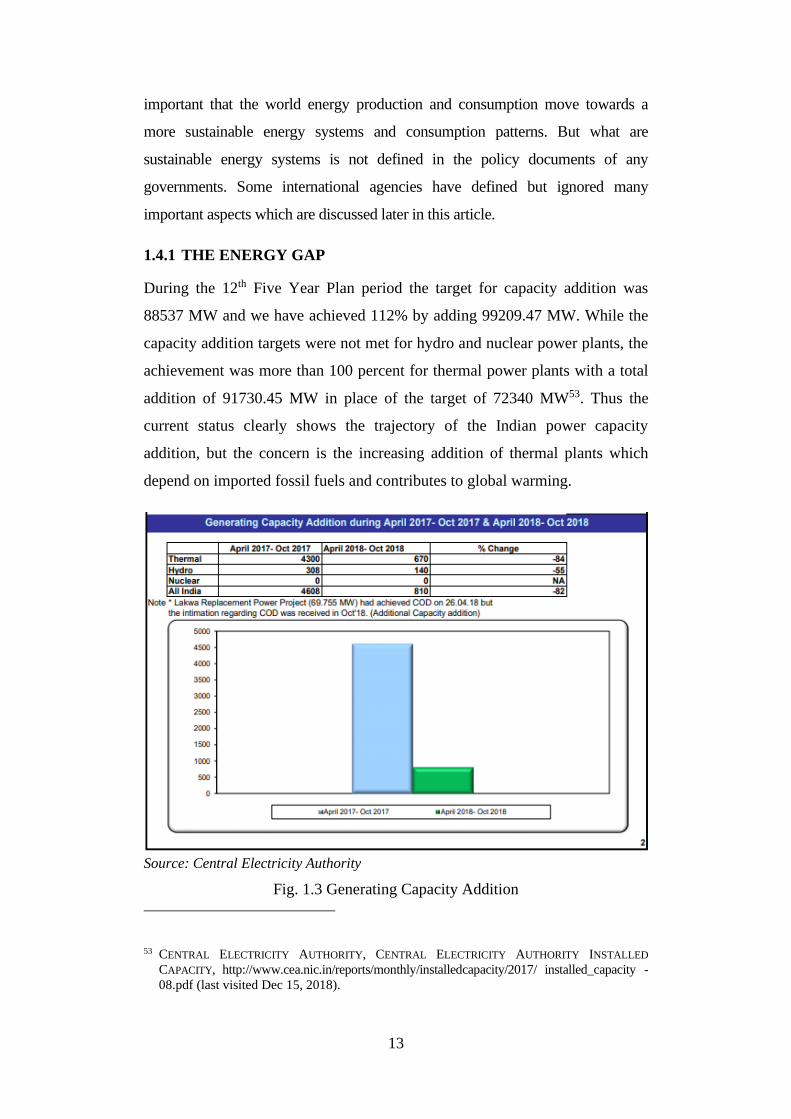
During the 12th Five Year Plan period the target for capacity addition was
88537 MW and we have achieved 112% by adding 99209.47 MW. While the
capacity addition targets were not met for hydro and nuclear power plants, the
achievement was more than 100 percent for thermal power plants with a total
addition of 91730.45 MW in place of the target of 72340 MW53. Thus the
current status clearly shows the trajectory of the Indian power capacity
addition, but the concern is the increasing addition of thermal plants which
depend on imported fossil fuels and contributes to global warming.
Source: Central Electricity Authority
Fig. 1.3 Generating Capacity Addition
53 CENTRAL ELECTRICITY AUTHORITY, CENTRAL ELECTRICITY AUTHORITY INSTALLED
CAPACITY, http://www.cea.nic.in/reports/monthly/installedcapacity/2017/ installed_capacity -
08.pdf (last visited Dec 15, 2018).
14
There is a decline in the power generation capacity additions made during
April to October 2018 compared to the capacity addition made in the same
period of the previous year. The government is now not encouragin the
estableishment of new thermal power plants due to climate change and energy
security reasosns.
There is an increasing gap in the electricity generation target from RES and
the actual capacity addition. In case of thermal power plants we have achieved
more than the target. This will accelerate the global warming and our
dependency on fossil fuels. When we make a capacity addition in the thermal
plant we are create an entire economic system depending on that. The
resulting economic activity chain bear the carbon footprint and we need such
planning for our future energy needs, that we minimize the carbon footprint54.
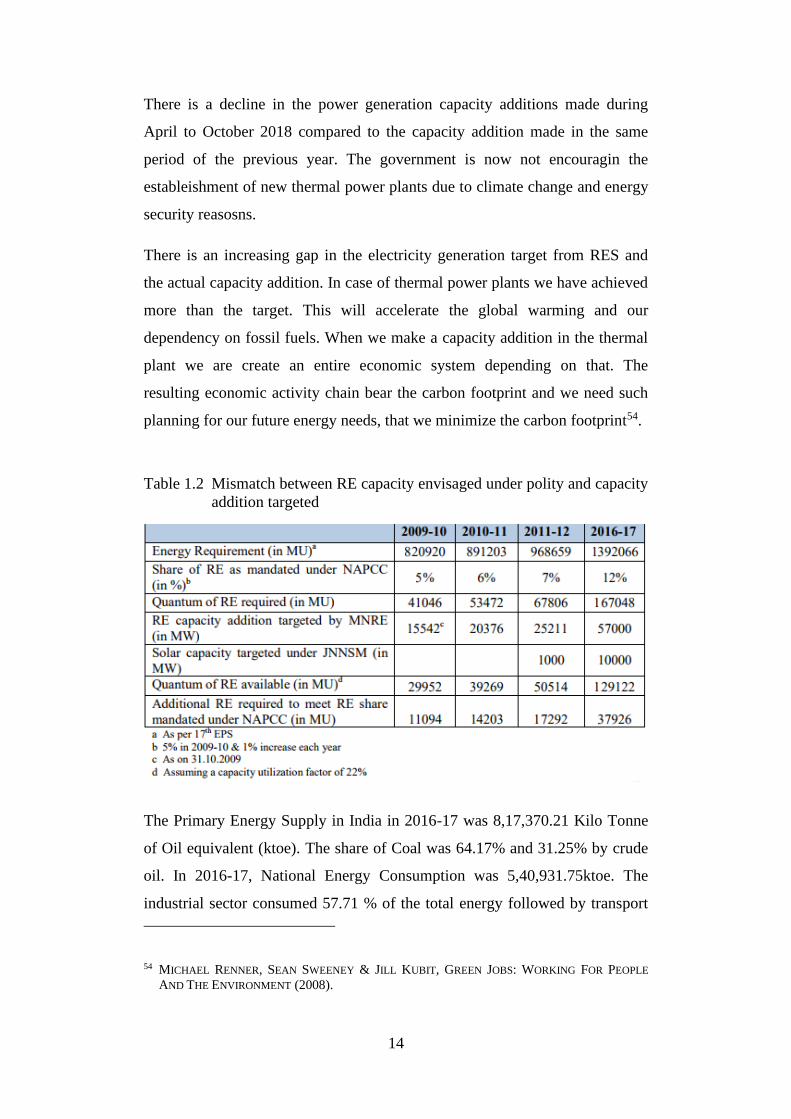
Table 1.2 Mismatch between RE capacity envisaged under polity and capacity
addition targeted
The Primary Energy Supply in India in 2016-17 was 8,17,370.21 Kilo Tonne
of Oil equivalent (ktoe). The share of Coal was 64.17% and 31.25% by crude
oil. In 2016-17, National Energy Consumption was 5,40,931.75ktoe. The
industrial sector consumed 57.71 % of the total energy followed by transport
54 MICHAEL RENNER, SEAN SWEENEY & JILL KUBIT, GREEN JOBS: WORKING FOR PEOPLE
AND THE ENVIRONMENT (2008).
15
sector with 8.44%, residential, agriculture/forestry, commercial and public
sectors together another 13.90%55.
1.4.2 RURAL ELECTRIFICATION
The shortage of power has adversely affected the rural electrification and
universal electrification, an ambitious policy target of the government under
the Rajiv Gandhi Gramin Vaidyutikaran Yojana (RGGVY), now rechristened
as Deen Dayal Upadhyay Gramin Jyoti Yojana (DDUGJY)56.
There is a clear gap in rural electrification from the target and actual
achievement. The government fund allocation was only 47% of the required
cost57. Thus it is inevitable to attract private investments to the sector to
achieve universal provision of electricity.
1.4.2.1 Definition of Electrified Village
Prior to October 1997 the definition for an electrified village was “A Village
should be classified as electrified if electricity is being used within its revenue
area for any purpose whatsoever.” After October 1997 it was redefined as “A
village will be deemed to be electrified if the electricity is used in the
inhabited locality, within the revenue boundary of the village for any 58
purpose whatsoever59.” The definition was modified as “Basic infrastructure
such as Distribution Transformer and Distribution lines are provided in the
inhabited locality as well as the Dalit Basti hamlet where it exists. Electricity
is provided to public places like Schools, Panchayat Office, Health Centers,
Dispensaries, Community centers etc. The number of households electrified
55 supra note 5 DRAFT NATIONAL ENERGY POLICY NITI AAYOG, GOVERNMENT OF INDIA.
56 DEEN DAYAL UPADHYAYA GRAM JYOTI YOJANA, RURAL ELECTRIFICATION CORPORATION
EXECUTIVE SUMMARY (2018) http://www.ddugjy.gov.in/mis/portal/ memo/executive_
summary/executive_ summary.pdf (last visited Nov 10, 2018).
57 DEEN DAYAL UPADHYAYA GRAM JYOTI YOJANA, GOV. INDIA 140356 (2017),
http://www.ddugjy.gov.in/mis/portal/index.jsp.
58 Id.
59 Herath Gunatilake, Narasimhamurty Maddipati & Sumeet Patil, Willingness to Pay for
Electricity Supply Improvements in Rural India, 10 J. Resour. Energy Dev. 55–78 (2013),
http://www.medra.org/servlet/aliasResolver?alias=iospress&doi=10.3233/RED-120104.
16
should be at least 10% of the total number of households in the village60.” To
eradicate energy poverty, it is important to redefine the term electrified village
ensuring access to clean energy for all.
1.4.3 ENVIRONMENT CHALLENGES
World energy council pointed out that there exist many myths and
misconceptions in the field of energy sector61. If not challenged that “may lead
us down a path of complacency and missed opportunities as current pathways
may fall short of delivering on the global aspirations of energy access, energy
security, and environmental sustainability – the three dimensions that must be
balanced in the energy trilemma.”62
The sustainability index created by the world energy council highlights those
countries, which through their energy policies have extended such policy
measures that assure delivery of sustainable energy and economic development.
It is the national energy policy of each country that defines the energy mix
in that country. There are various factors affecting the policy decision. The
availability of resources, the geo political situations, cost of the fuel,
international commitments etc., are factors which determines the energy
mix of a nation63. India has more thermal power plants while France has
most of its electricity produced from nuclear plants and Scotland from wind
farms64.
60 MINISTRY OF POWER, LETTER NO. 42/1/2001-D(RE) (feb. 5th 2004); CORRIGENDUM VIDE
LETTER NO. 42/1/2001-D(RE) (Feb. 17th 2004).
61 WORLD ENERGY COUNCIL, WORLD ENERGY TRILEMMA TIME TO GET REAL – THE MYTHS
AND REALITIES OF FINANCING ENERGY SYSTEMS (2014), https://www.worldenergy.org/
wp-content/uploads/2014/11/20141105-Main-report.pdf (last visited Jul 22, 2018)
62 Id
63 DEUTSCHE BANK, CURRENT ISSUES NATURAL RESOURCES (2014), http://www.dbresearch.in/
PROD/DBR_INTERNET_EN-PROD/PROD0000000000337663/
The_changing_energy_mix_in_Germany%3A_The_drivers_ar.PDF (last visited Jul 23,
2016)
64 INTERNATIONAL ENERGY AGENCY, MONTHLY ELECTRICITY STATISTICS (2016), http://www.
iea.org/media/statistics/surveys/electricity/mes.pdf (last visited Jul 23, 2018)
17
Different countries use the earth’s resources differently and the pollution
impact by each country on the ecosystem is different. Whether all nations can
equally contribute to the cause of protecting the natural resources and
protecting the environment depends on whether the national policies reflect
the ideology of sustainable energy systems. To bring the nations policies for
the litmus test of sustainable energy systems, it is imperative to have a
commonly understood definition for sustainable energy.
Based on various factors like geopolitical bargain of a nation and availability
of natural resources, what a country may treat sustainable to them may not be
sustainable to other nations. This is because sustainability has been understood
to mean only the tradeoff between certain positive and negative factors of a
particular energy system. For example, India is having huge energy
requirement. It is also under international obligation to minimize the carbon
footprint. More than 70% of its electricity production is using gas and coal65.
India has more coal fired power plants to meet the demand66. We are polluting
environment and exhausting the resources, but are attempting to meet the
needs of the present generation.
Those countries which are relying on fossil fuels also can achieve certain other
aspects of sustainability. They are increased efficiency, reduced consumption
and proper management of greenhouse gas emissions67. We can also explore
the means to use fossil fuels in a climate friendly way. Thus defining the term
sustainable energy with its widest scope of the term and compelling the
nations to meet most of the conditions of sustainability would be the ideal
future of energy policy.
65 INTERNATIONAL ENERGY AGENCY, INDIA ENERGY OUTLOOK - WORLD ENERGY OUTLOOK
SPECIAL REPORT 2015 (2015), http://www.worldenergyoutlook.org/ media/weowebsite/
2015/IndiaEnergyOutlook_WEO2015.pdf (last visited Jul 22, 2018)
66 GOVERNMENT OF INDIA, MINISTRY OF POWER, http://powermin.nic.in/content/xii-plan (last
visited Jul 22, 2018)
67 Karl R. Rábago, Efficiency and Renewable Energy are the Only Future We Can Afford,
RENEWABLE ENERGY WORLD, July 22, 2016, http://www.renewableenergyworld.com/
articles/2016/07/efficiency-and-renewable-energy-are-the-only-future-we-can-afford.html
(last visited Jul 26, 2018)
18
Once the concept is exhaustively defined, various energy technologies,
policies and energy intensive goods and services can be evaluated on the basis
of sustainability for decision making. The evaluation based on sustainability
provides better perspective of the tradeoffs between the derived benefits and
adverse consequences to decide whether a particular technology or goods shall
be preferred over the other.
By defining sustainable energy with the most relevant sustainability
attributes of today, we can create the awareness among the students and new
generations and pave a pathway for future policy decisions. It can create
market conditions conducive for attracting investments and encourage
initiatives that foster research and development in all areas of energy
technology. The definition may give policy makers the vision to establish
holistic policies to encourage the production and consumption of energy
which meets the standards of sustainability. This will lead to the creation of
energy infrastructure that supports and promotes sustainability. Countries
providing high subsidies for fossil fuels68 to their citizens and contributing to
the accelerated pollution of the eco system can focus on achieving cheaper
and cleaner energy sources and the funds used for subsidy can be diverted to
other areas.
1.4.4 DEPLETION OF FOSSIL FUELS
The fossil fuels will get exhausted in another century69. The increased
greenhouse gas emission from the fossil fuels is not going to make the world
a better place than we found it70. It is going to degrade the environment
considerably. Considering the growth in the energy demand, the fuel we burn
68 CAMBRIDGE, THE POLITICS OF FOSSIL FUEL SUBSIDIES AND THEIR REFORM,
https://www.cambridge.org/core/services/aop-cambridge-core/content/view/B8CB7D383F33
AD9AF9CC82EB50A74DE5/9781108416795AR.pdf/The_Politics_of_Fossil_Fuel_Subsidie
s_and_their_Reform.pdf?event-type=FTLA (last visited Sep 8, 2018). 69 BHARAT RAJ SINGH & ONKAR SINGH, GLOBAL TRENDS OF FOSSIL FUEL RESERVES AND
CLIMATE CHANGE IN THE 21ST CENTURY, FOSSIL FUEL AND THE ENVIRONMENT (D. S.
Khan ed., 2004). 70 Id
19
annually is increasing year after year71. The quantities of greenhouse gases we
emit also make an upward growth in this process.
Thus we need energy sources which shall not exhaust and shall not degrade
the biosphere, to be called as sustainable. This problem actually been
attempted addressing by the development of renewable energy sources. Solar
and wind has addressed the issues above to a great extent. They don’t generate
greenhouse gases and are not exhaustible. But these forms of energy are not
affordable to a large section of the society as renewable energy is comparatively
costly72. Need to think beyond fossil fuels
1.4.5 BALANCE OF PAYMENTS
The Draft National Energy Policy 2017 acknowledges the over dependence of
India on imported fossil fuels. We are at huge risk if the import is disrupted,
and will undermine our energy security. It will also impact our balance of
payment if the oil prices are increased in the international market. To
overcome this situation, the new policy proposes to enhance the energy
security through increased domestic production and efficiency73.
1.4.6 ENERGY SECURITY
As long as fossil fuels remain cheapest energy source, sustainability concerns
will take a back stage when it comes to addressing energy accessibility at
affordable prices. Solar and wind technologies are yet not the cheapest sources
of energy. They also cannot provide a stable supply of electricity unless
supported by another source of power. It is inevitable that within a century,
the fossil fuel deposits on earth will be completely consumed and burned into
greenhouse gases. The energy sources will be completely non fossil fuel
based. The transition is inevitable and it has begun.
71 BRITISH PETROLEUM, ENERGY OUTLOOK 2030 (2016), https://www.bp.com/content/
dam/bp/pdf/energy-economics/energy-outlook-2016/bp-energy-outlook-2016.pdf (last visited
Jul 22, 2018)
72 K. Branker, M. J. M. Pathak & J. M. Pearce, A review of solar photovoltaic levelized cost of
electricity, 15 RENEW. SUSTAIN. ENERGY REV 4470–4482 (2011).
73 supra note 5 DRAFT NATIONAL ENERGY POLICY NITI AAYOG.
20
India is over dependent on fossil fuels. More than 60% of its electricity is
generated by thermal power plants. The Thermal Generation capacity will
increase significantly in the coming decades according to NITI Ayog, the
policy making body. According to the reports it has published74 the thermal
generation capacity to go up from the current 149GW (2012) to 290 GW in
2047. The coal based power generation will account for 253 GW while the
remaining 37GW will be fired with gas75. This is 25.3% of the total electricity
requirement and this is possible only if the other major sources of energy such
as renewable, large hydro and nuclear power make their contribution of the
remaining 74.7% of power generation. The policy clearly envisages a
reduction in the share of the carbon fuels in the energy mix, but it is also
pertinent to note that the quantity of fossil fuels required for power generation
is almost double to the current levels of consumption.
1.4.7 ECONOMIC DEVELOPMENT
The National Energy Policy of India, 2017 proposes to achieve 100 per cent
electrification of all census villages by 2018 and universal electrification with
24 × 7 electricity by 202276. The Policy states that the primary objective is to
banish energy poverty in India by making access to energy at affordable prices
to the whole population of India. The other objectives of the policy are to
achieve energy security, sustainability and economic growth through planning
the energy future of India. Since all the energy forecasts suggest a huge surge in
energy demand, the government of India shall plan its policy measures carefully
to meet the future requirements. In addition to meet the energy demand, the
government is also responsible to create demand for energy from the rural
poor who have no access to clean energy.77
74 USER GUIDE FOR THERMAL POWER GENERATION SECTOR, http://indiaenergy.gov.in,
http://indiaenergy.gov.in/iess/docs/Thermal-power-generation-documentation.pdf (last visited Sep
2018)
75 supra note 5 DRAFT NATIONAL ENERGY POLICY NITI AAYOG.
76 Id.
77 Id.
21
1.5 FUTURE ENERGY SCENARIO
India is one of the fastest growing economies with second largest population
fourth largest energy consumer and third largest economy. India houses 18
percentage of the world population which consumes only 6% is off the
primary energy produced in the world. One of the most diversified sector in
India is electricity. India targets to achieve 175 GW by 2022 and 275 DW by
202778. India also plan to reduce its dependence on crude oil import by
10 percentage by 2022. India is also ambitious to make all car sales in the country
by 2030 to be electric cars. Energy Efficiency is also given due importance
towards attaining sustainability79.
The GDP of India is growing at 6.3 % in 2nd quarter of the financial year
2018. India is also one of the top FDI destinations with 60.1 billion foreign
direct investment in the year 2016-17. The World bank has improved India's
ranking and it's 2019 ease of doing business. India is currently at 77 position.
The GDP is expected to grow Apple 7 percentage in financial years 2018 and
2019. India is the fastest growing energy market in the world and currently the
third largest energy consumer80.
1.5.1 FUTURE ENERGY FORECAST
The India Energy Security Scenarios 204781 allows users to choose various
pathways to create future energy scenarios. The future energy scenarios are
examined using the NITI Aayog webtool.
India Energy Security Scenarios 2047 calculator (IESS 2047) is a web based
open source tool for calculating potential future energy scenarios for India.
The tool was launched by NITI Aayog In August 2015. The web tool explores
78 Id.
79 DELOITTE, THE EVOLVING ENERGY LANDSCAPE IN INDIA OPPORTUNITIES FOR INVESTMENTS,
(2018), https://www2.deloitte.com/content/dam/Deloitte/in/Documents/ energy-resources/in-
enr-the-evolving-energy-landscape-india-april-2018-noexp.pdf (last visited Dec 15, 2018).
80 Id.
81 NITI AAYOG & INDIA SMART GRID FORUM, INDIA ENERGY SECURITY SCENARIOS 2047 33
(2014), http://iess2047.gov.in/pathways/11101111111111110111 111111011111101121
111111101110111022222/my_story (last visited Dec 15, 2018).
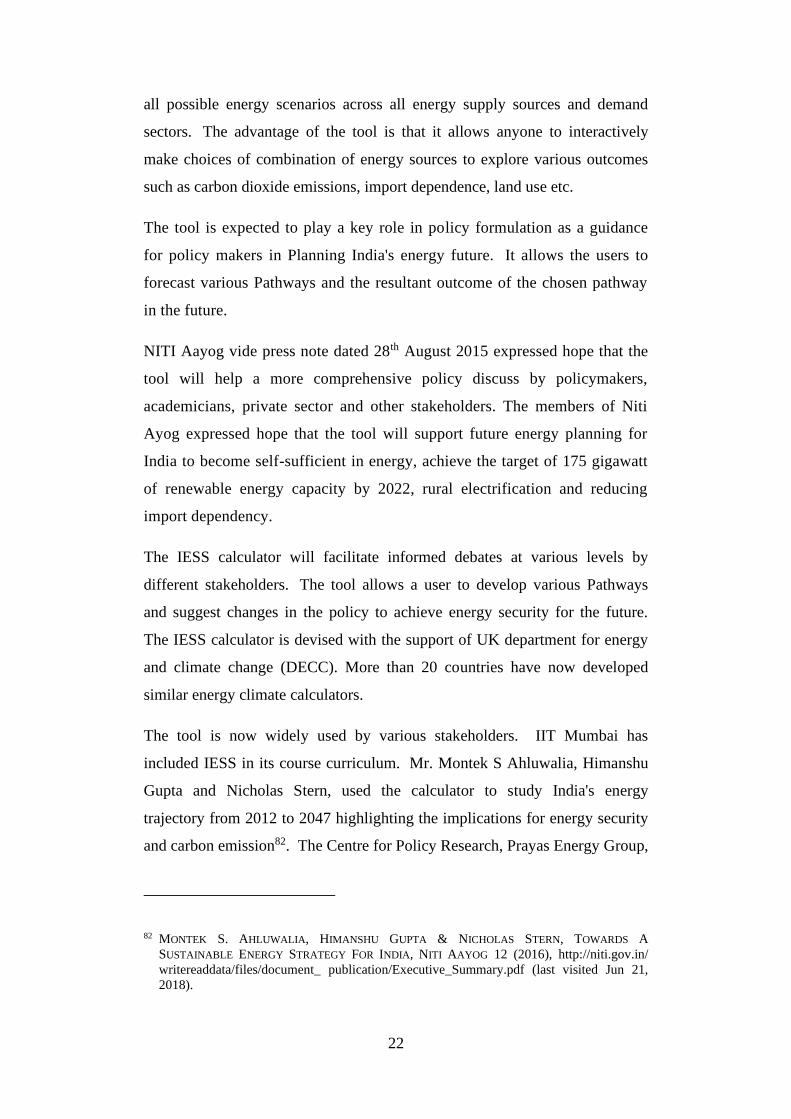
22
all possible energy scenarios across all energy supply sources and demand
sectors. The advantage of the tool is that it allows anyone to interactively
make choices of combination of energy sources to explore various outcomes
such as carbon dioxide emissions, import dependence, land use etc.
The tool is expected to play a key role in policy formulation as a guidance
for policy makers in Planning India's energy future. It allows the users to
forecast various Pathways and the resultant outcome of the chosen pathway
in the future.
NITI Aayog vide press note dated 28th August 2015 expressed hope that the
tool will help a more comprehensive policy discuss by policymakers,
academicians, private sector and other stakeholders. The members of Niti
Ayog expressed hope that the tool will support future energy planning for
India to become self-sufficient in energy, achieve the target of 175 gigawatt
of renewable energy capacity by 2022, rural electrification and reducing
import dependency.
The IESS calculator will facilitate informed debates at various levels by
different stakeholders. The tool allows a user to develop various Pathways
and suggest changes in the policy to achieve energy security for the future.
The IESS calculator is devised with the support of UK department for energy
and climate change (DECC). More than 20 countries have now developed
similar energy climate calculators.
The tool is now widely used by various stakeholders. IIT Mumbai has
included IESS in its course curriculum. Mr. Montek S Ahluwalia, Himanshu
Gupta and Nicholas Stern, used the calculator to study India's energy
trajectory from 2012 to 2047 highlighting the implications for energy security
and carbon emission82. The Centre for Policy Research, Prayas Energy Group,
82 MONTEK S. AHLUWALIA, HIMANSHU GUPTA & NICHOLAS STERN, TOWARDS A
SUSTAINABLE ENERGY STRATEGY FOR INDIA, NITI AAYOG 12 (2016), http://niti.gov.in/
writereaddata/files/document_ publication/Executive_Summary.pdf (last visited Jun 21,
2018).
23
and the Energy Research Centre, University of Cape Town used a ‘multi-
criteria decision analysis’ (MCDA) approach with the help of the tool83.
The new version of IESS 204784, version 2.0 was released by NITI Aayog with
features like more user friendly, addition of analytical tools, accommodating
different growth scenarios etc. According to NITI Aayog the new version
takes into account the elasticity of energy demand across different sectors, cost
scenarios, new policy measures, and new sources of energy85.
Erstwhile Planning Commission, now NITI Aayog commenced the exercise of
building energy security scenarios 2047 in the year 2013. The scenario takes
into account the behaviour aspects, energy-related emissions, local resources
and the women's, all sources of energy supply and demand, Technologies of
global scale et cetera.
The first version of the web tool allows a user to observe the implications of a
chosen pathway for energy scenarios depending on import dependence land
use and carbon dioxide emissions. The new version allows a user to observe
the implications of his choice on cost to the economy and greenhouse gas
emissions. It has a large set of value additions in terms of Technologies
sectors intensive modelling approaches etc.
The web tool has envisaged four levels of efforts in the energy sector. These
four levels represents various policy efforts from the government to achieve
the best possible results. These levels include least effort, determined effort,
aggressive effort and heroic effort.
1.5.2 LEAST EFFORT SCENARIO
Least effort scenario assumes that there will be no effort in terms of policy
interventions will be made on the demand and supply side. The energy
83 RADHIKA KHOSLA, NAVROZ K. DUBASH, ET AL., AN APPROACH TO SUSTAINABLE
DEVELOPMENT BASED ENERGY AND CLIMATE POLICY (2015). 84 supra note 44 NITI AAYOG. 85 NATIONAL INSTITUTION FOR TRANSFORMING INDIA, REPORT OF THE EXPERT GROUP ON
175 GW RE BY 2022, https://niti.gov.in/writereaddata/files/ writereaddata/files/document_
publication/report-175-GW-RE.pdf (last visited Dec 4, 2018).
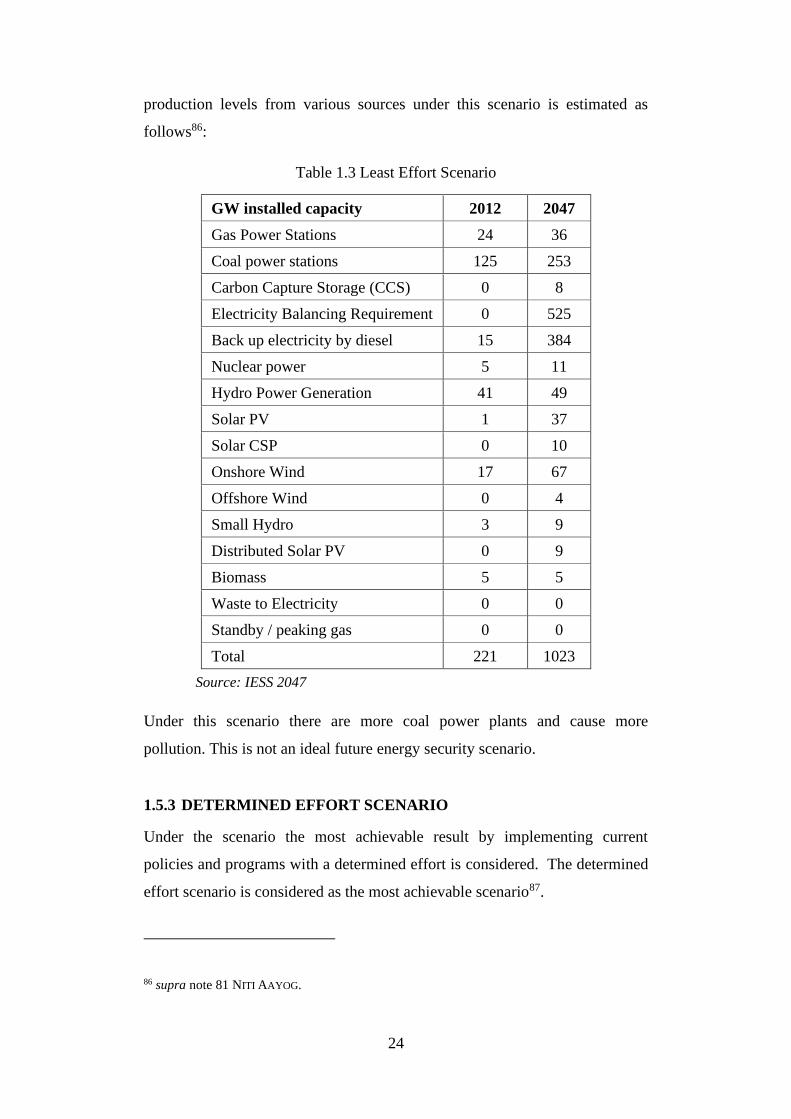
24
production levels from various sources under this scenario is estimated as
follows86:
Table 1.3 Least Effort Scenario
GW installed capacity 2012 2047
Gas Power Stations 24 36
Coal power stations 125 253
Carbon Capture Storage (CCS) 0 8
Electricity Balancing Requirement 0 525
Back up electricity by diesel 15 384
Nuclear power 5 11
Hydro Power Generation 41 49
Solar PV 1 37
Solar CSP 0 10
Onshore Wind 17 67
Offshore Wind 0 4
Small Hydro 3 9
Distributed Solar PV 0 9
Biomass 5 5
Waste to Electricity 0 0
Standby / peaking gas 0 0
Total 221 1023
Source: IESS 2047
Under this scenario there are more coal power plants and cause more
pollution. This is not an ideal future energy security scenario.
1.5.3 DETERMINED EFFORT SCENARIO
Under the scenario the most achievable result by implementing current
policies and programs with a determined effort is considered. The determined
effort scenario is considered as the most achievable scenario87.
86 supra note 81 NITI AAYOG.
25
Table 1.4 Determined Effort Scenario
GW installed capacity 2012 2047
Gas Power Stations 24 50
Coal power stations 125 333
Carbon Capture Storage (CCS) 0 35
Electricity Balancing Requirement 0 271
Back up electricity by diesel 15 0
Nuclear power 5 26
Hydro Power Generation 41 75
Solar PV 1 150
Solar CSP 0 46
Onshore Wind 17 202
Offshore Wind 0 20
Small Hydro 3 15
Distributed Solar PV 0 47
Biomass 5 11
Waste to Electricity 0 4
Standby / peaking gas 0 0
Total 221 1285
Source: IESS 2047
The energy requirement based on the demand forecast under this scenario is
higher due to higher levels of income and economic growth. There is more
renewable wind and solar addition along with coal power plants can be seen in
this scenario. Since there are more coal power plants added in this scenario, it
cannot be an ideal future energy scenario88.
1.5.4 AGGRESSIVE EFFORT SCENARIO
This scenario describes as significantly improved effort from that of the
determinant of a scenario which is likely to achieve and deliverable but
difficult without a focused aggressive effort. There require an all-round effort
87 Id.
88 USER GUIDE FOR INDIA’S 2047 ENERGY CALCULATOR TRANSPORT SECTOR CONTENTS,
http://indiaenergy.gov.in/iess/docs/Transport-doc.pdf (last visited Aug 10, 2018).
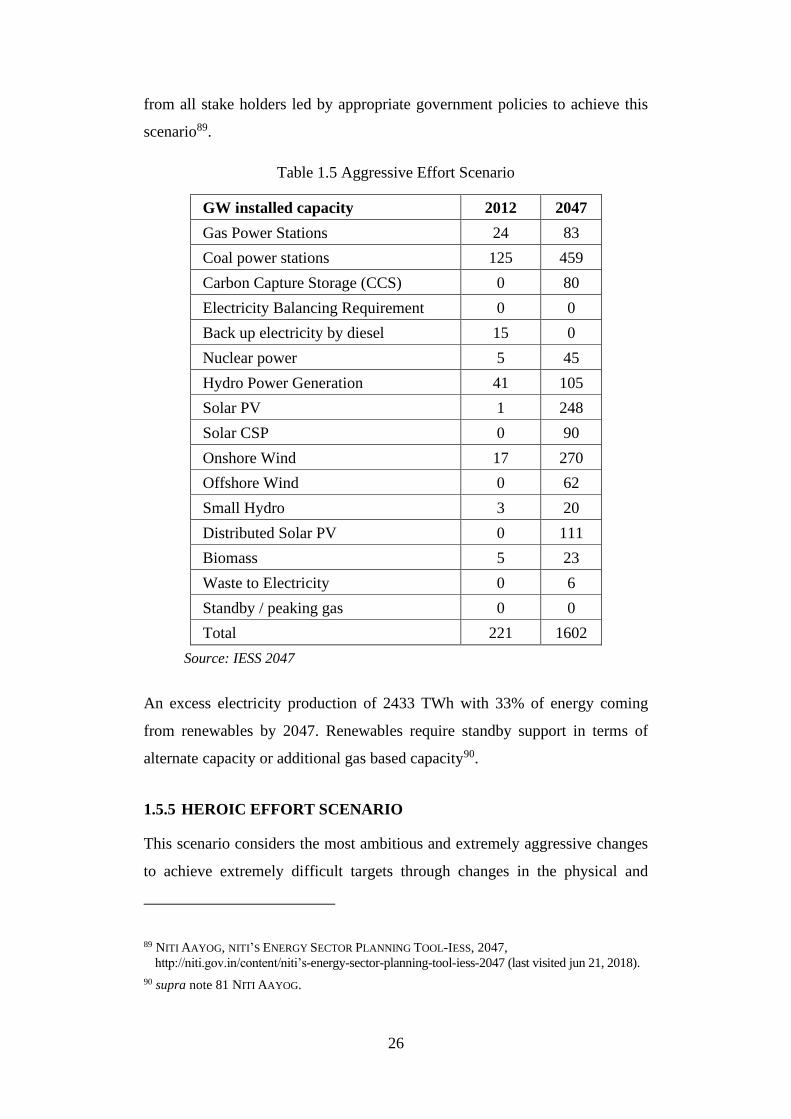
26
from all stake holders led by appropriate government policies to achieve this
scenario89.
Table 1.5 Aggressive Effort Scenario
GW installed capacity 2012 2047
Gas Power Stations 24 83
Coal power stations 125 459
Carbon Capture Storage (CCS) 0 80
Electricity Balancing Requirement 0 0
Back up electricity by diesel 15 0
Nuclear power 5 45
Hydro Power Generation 41 105
Solar PV 1 248
Solar CSP 0 90
Onshore Wind 17 270
Offshore Wind 0 62
Small Hydro 3 20
Distributed Solar PV 0 111
Biomass 5 23
Waste to Electricity 0 6
Standby / peaking gas 0 0
Total 221 1602
Source: IESS 2047
An excess electricity production of 2433 TWh with 33% of energy coming
from renewables by 2047. Renewables require standby support in terms of
alternate capacity or additional gas based capacity90.
1.5.5 HEROIC EFFORT SCENARIO
This scenario considers the most ambitious and extremely aggressive changes
to achieve extremely difficult targets through changes in the physical and
89 NITI AAYOG, NITI’S ENERGY SECTOR PLANNING TOOL-IESS, 2047,
http://niti.gov.in/content/niti’s-energy-sector-planning-tool-iess-2047 (last visited jun 21, 2018).
90 supra note 81 NITI AAYOG.
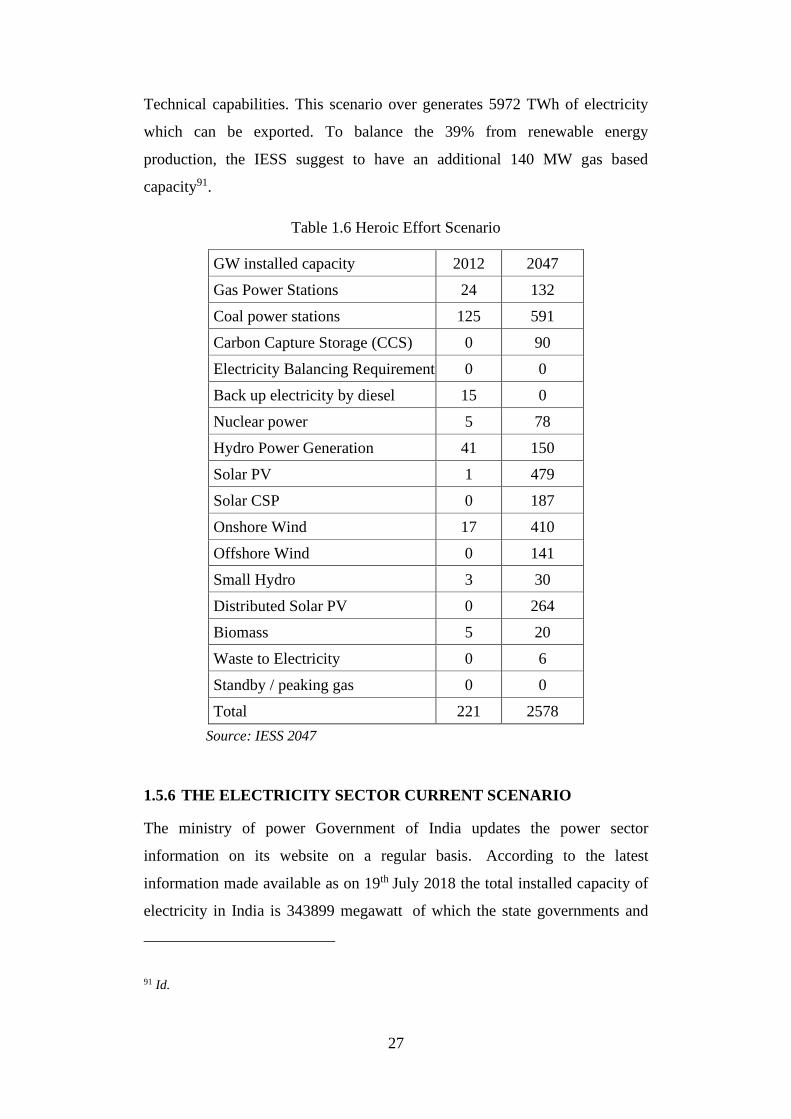
27
Technical capabilities. This scenario over generates 5972 TWh of electricity
which can be exported. To balance the 39% from renewable energy
production, the IESS suggest to have an additional 140 MW gas based
capacity91.
Table 1.6 Heroic Effort Scenario
GW installed capacity 2012 2047
Gas Power Stations 24 132
Coal power stations 125 591
Carbon Capture Storage (CCS) 0 90
Electricity Balancing Requirement 0 0
Back up electricity by diesel 15 0
Nuclear power 5 78
Hydro Power Generation 41 150
Solar PV 1 479
Solar CSP 0 187
Onshore Wind 17 410
Offshore Wind 0 141
Small Hydro 3 30
Distributed Solar PV 0 264
Biomass 5 20
Waste to Electricity 0 6
Standby / peaking gas 0 0
Total 221 2578
Source: IESS 2047
1.5.6 THE ELECTRICITY SECTOR CURRENT SCENARIO
The ministry of power Government of India updates the power sector
information on its website on a regular basis. According to the latest
information made available as on 19th July 2018 the total installed capacity of
electricity in India is 343899 megawatt of which the state governments and
91 Id.
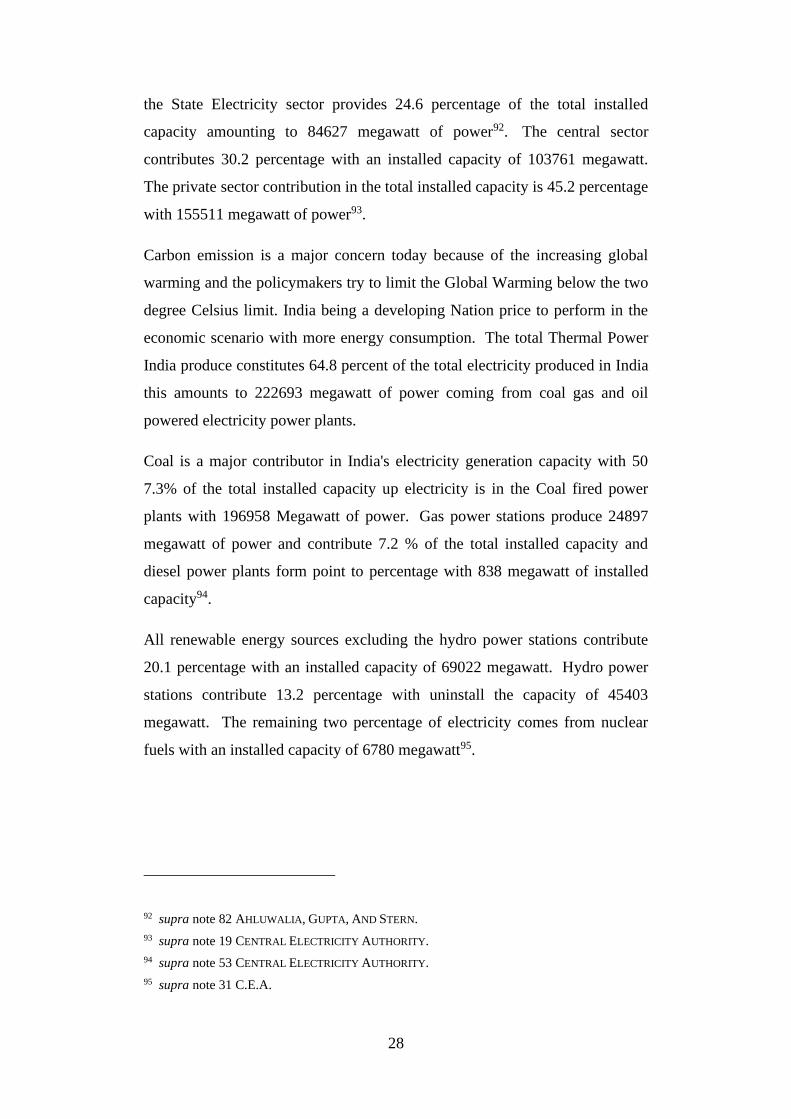
28
the State Electricity sector provides 24.6 percentage of the total installed
capacity amounting to 84627 megawatt of power92. The central sector
contributes 30.2 percentage with an installed capacity of 103761 megawatt.
The private sector contribution in the total installed capacity is 45.2 percentage
with 155511 megawatt of power93.
Carbon emission is a major concern today because of the increasing global
warming and the policymakers try to limit the Global Warming below the two
degree Celsius limit. India being a developing Nation price to perform in the
economic scenario with more energy consumption. The total Thermal Power
India produce constitutes 64.8 percent of the total electricity produced in India
this amounts to 222693 megawatt of power coming from coal gas and oil
powered electricity power plants.
Coal is a major contributor in India's electricity generation capacity with 50
7.3% of the total installed capacity up electricity is in the Coal fired power
plants with 196958 Megawatt of power. Gas power stations produce 24897
megawatt of power and contribute 7.2 % of the total installed capacity and
diesel power plants form point to percentage with 838 megawatt of installed
capacity94.
All renewable energy sources excluding the hydro power stations contribute
20.1 percentage with an installed capacity of 69022 megawatt. Hydro power
stations contribute 13.2 percentage with uninstall the capacity of 45403
megawatt. The remaining two percentage of electricity comes from nuclear
fuels with an installed capacity of 6780 megawatt95.
92 supra note 82 AHLUWALIA, GUPTA, AND STERN.
93 supra note 19 CENTRAL ELECTRICITY AUTHORITY.
94 supra note 53 CENTRAL ELECTRICITY AUTHORITY.
95 supra note 31 C.E.A.
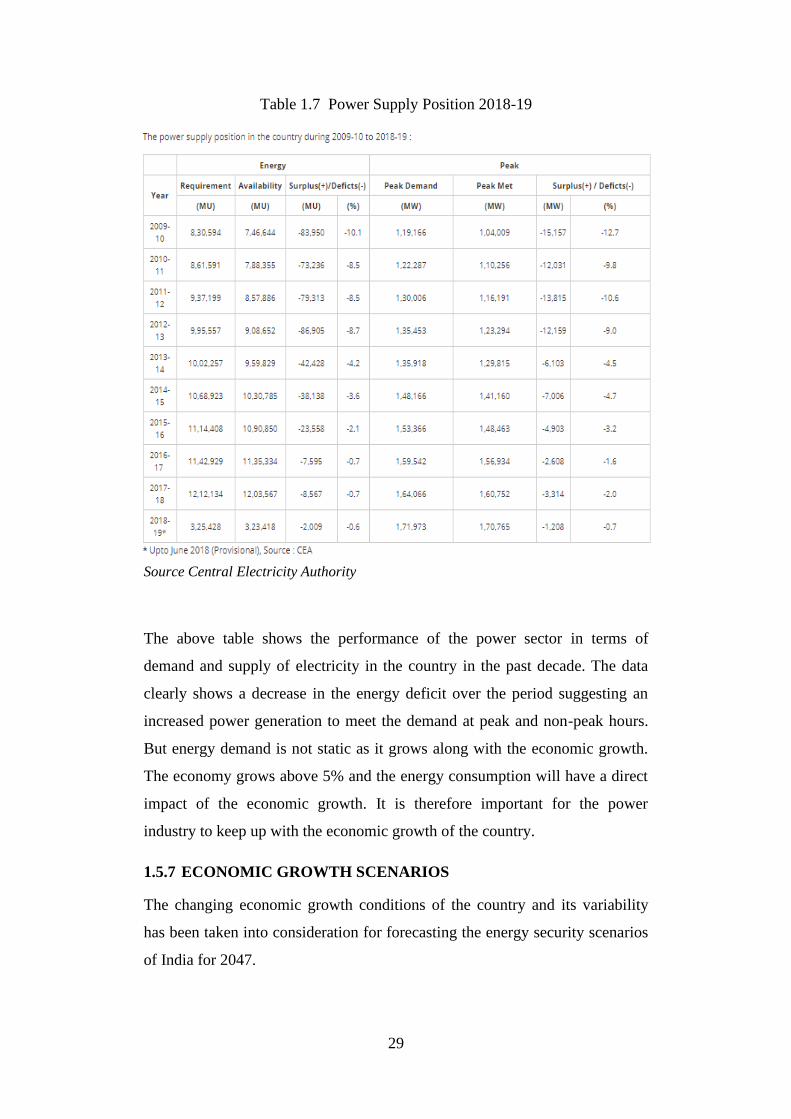
29
Table 1.7 Power Supply Position 2018-19
Source Central Electricity Authority
The above table shows the performance of the power sector in terms of
demand and supply of electricity in the country in the past decade. The data
clearly shows a decrease in the energy deficit over the period suggesting an
increased power generation to meet the demand at peak and non-peak hours.
But energy demand is not static as it grows along with the economic growth.
The economy grows above 5% and the energy consumption will have a direct
impact of the economic growth. It is therefore important for the power
industry to keep up with the economic growth of the country.
1.5.7 ECONOMIC GROWTH SCENARIOS
The changing economic growth conditions of the country and its variability
has been taken into consideration for forecasting the energy security scenarios
of India for 2047.
30
1.5.8 THE GDP GROWTH SCENARIOS
There are three levels of security scenarios envisaged. In level 1 which is
called as scenario A assumes a Compounded Annual Growth Rate (CAGR) of
7.4% till the year 2047 which is a projection done by TERI for Indian GDP till
205296. Scenario B assumes a CAGR of 6.7% which is adopted from the
assumptions of the International Monetary Fund for the 12th Five year Plan
and Scenario C which assumes a 5.8% CAGR from the growth rate assumptions
of the International Energy Agency.
The future energy demand is forecasted based on these GDP assumptions and
the elasticity of activity levels in various sectors. The tool also allows to know
the cost implications of the scenarios.
1.5.9 DEMAND ANALYSIS AND FORECAST
NITI Aayog has identified 6 sectors which will drive the energy demand. The six
sectors identified by NITI Aayog to forecast the future energy demand are
transport, industry, cooking, buildings, agriculture and replacement of diesel in
telecom sector. The decade ending 2010-11 has witnessed an annual growth rate
of 7% and the Industry sector has doubled during the period. The sector has
consumed 45% of the total energy demand. Within this sector there are seven
major sub industries which consume the highest proportion of energy. They
are aluminum, cement, chloralkali, fertilizer, iron and steel, pulp and paper,
and textiles97.
At the core of the proposed energy policy for industries is energy efficiency.
The huge energy demand that may arise from the industrial sector in 2047 is
proposed to be addressed through four levels of technology options with
efforts to achieve extreme levels of energy efficiency. The Bureau of Energy
Efficiency has rolled out policy mechanisms to improve Energy Efficiency.
The Perform-Achieve-Trade scheme of the bureau penalizes noncompliance
96 supra note 81 NITI AAYOG. 97 supra note 89 NITI AAYOG.
31
of Energy Efficiency targets and incentives energy savings through a
mechanism of trading excess energy savings.
The four levels of technology options include combination of energy sources
with increased levels of energy efficiency. All improved technology options
suggest an increased consumption of electricity from grid or other sources to
reduce carbon emission. An increased electricity share in the energy
consumption even in an energy efficient scenario requires more electricity
being produced to meet the scenario. Industry can be seen moving
forward with increased energy efficiency and increased consumption of
electricity.
There will be significant changes in the transport sector for the coming future.
The demand and mode of transport will consider Valley change when the
economy grows and fossil fuels start to decline. The motorized transport in
India moves on roads, rail and air. Transport sector is the second highest
energy consuming sector after industry and India. The booming vehicle
industry market and the increased vehicle population in India will create high
demand for energy in the future. It is the transport sector which is responsible
for the highest consumption of Petroleum products.
Even though there is an increase in movement of goods through pipelines,
coastal shipping and inland waterways, Road Transport remain the major
means of transport in India. The lack of a strong public transport system
increases the dependency on private vehicles for passenger transport. Road
transport accounted for 85% of the total passenger traffic98 while 14% was
through rail and remaining 1% through air in the year 201299. The major
source of energy fueling the transport sector is fossils. The energy demand
scenarios predict an increase in demand in this sector.
98 NITI AAYOG, DOMESTIC PASSENGER TRANSPORT MODE, http://iess2047.gov.in /assets/ onepage/
Domestic Passenger Transport Mode.pdf (last visited Dec 16, 2018).
99 Id.
32
The Railways have moved from diesel engines to electric engines100. The total
trunk roads extending to 64460 kilometres will be electrified in the coming
future. Currently the total electrified routes accident 20275 km. It took a
decade from 2001 to 2011 to electrify 6000 km. But to keep up with the
economic growth the railway need to increase the pace at which their rectification
activities are being carried out and the enter freight and passenger transport salary
shifted to electric transport. This is soon going to increase electricity
consumption by the Railways. The Railways are well documented the electricity
consumption for abs electricity traction providing a reliable data.
Electric traction as a mode of transport has several merits such as higher
motor efficiency is compared to petroleum fuel engines, the vehicles are
highly expensive trending because Thomas to make shift electric vehicles. The
electric vehicles population is thus very less in India and in future the
increased cost of fossil fuels and improved technological innovations may
reduce the cost forces vehicles. Private vehicles offer more energy efficient
solutions such as hybrid, plug-in hybrid, and electric and plug in electric
vehicles. This options provides four levels of efficient vehicle population in
the future. Energy security scenario tool allows the user to choose from any of
these four levels of vehicle population. The below table shows the penetration
of electric vehicles by 2051-52 under various levels of trajectories101.
The above levels shows the use of electric vehicles for passenger transport and
level 1 envisages the least proportion of electric vehicles in the total number of
vehicles while level 4 assumes the maximum. The electric vehicles are
considered to be the most energy efficient modes of transport and are
classified into three categories of Cars, Two Wheelers and Buses. Two
wheelers are expected to have an increased share in all the four scenarios
assumed above102.
100 Id.
101 supra note 98 NITI AAYOG.
102 supra note 99 NITI AAYOG.
33
In 2011-12 the share of electric vehicles in the market was only 1% and was
mainly in the two wheeler segment. At level 1 the electric two wheelers are
expected to reach 18% by 2046-47 due to lack of government incentives for
promotion. Though Electric Trucks are now being introduced in the western
countries, it can be observed that such possibilities have not been considered
in the India Energy Scenarios 2047. The electricity consumption in the freight
transport is assumed to be mainly in the railways. But it is important to create
infrastructure for road transport with electric trucks as a future option103.
1.5.9.1 Electric Vehicles
The Electric Vehicles (EVs) in the passenger car segment grew by 38% in
2016 reaching to 750,000 units of which 340,000 was in China. But the total
share of the EVs in the car sales worldwide is 1.1% and share in the car stock
is 0.2%. The EVs sold in 2016 will reduce the demand for oil by 10,000
barrels per day and impact electricity demand by 1 TWh. According to IEA, it
is vital to maintain a steady sales growth till 2025 in the EVs to meet the
required deployment levels of EVs to keep the global warming at below 2
degree Celsius climate mitigation scenario. There need to be decarbonizing of
electricity generation and charging facilities. The IEA data shows that there
was an investment of USD 6 billion in over 880,000 charging points in 2016
showing a 42% growth compared to 2015.
In 2017 the market share has increased due to the USD 43 billion spending on
passenger vehicles by consumers104. The impact of such increase in electric
vehicles have not impacted the demand for fossil fuels in the transportation
sector.
The growth of the EVs sales is driven by government encouragement to
encourage consumers to buy EVs and incentivize manufacturers to invest in its
development and commercialization. According to the IEA estimates the
103 supra note 98 NITI AAYOG.
104 Bloomberg, State of Clean Energy Investment 2018, BLOOMBERG NEF,
https://about.bnef.com/clean-energy-investment/ (last visited Aug 29, 2018).
34
governments spent around USD 6 billion on incentives globally mostly in the
form of fiscal incentives such as grants, tax credits and tax exemptions and
spending on public charging infrastructure105. Norway has the highest EV
sales share with strong government purchase incentives to consumers and the
public charging facilities deployed by the government is supporting sales in
Netherlands, which has the second highest share of EVs sales106. Other
promotional measures include privileged access to certain areas and lanes of
the road network and parking spots. In China, additionally, EVs are exempt
from certain licensing restrictions. The prices of the EVs are expected to
decline in the future due to economies of scale and decreased battery prices.
Even though the recent decline in the battery prices have been translated in to
distance range of the vehicles rather than a reduction in the prices. The
average distance range of EVs in China is 200 km and in United States
290 km107. The ambitious target of the automakers is to have 10 million sales
per year in the next decade.
Chinese manufacturers lead the table with 350 thousand sales in 2016 while
others are lagging way behind. There is no Indian manufacturer being listed in
the table. A 20% reduction in the subsidy levels to guide the market away
from the small law speed EVs has resulted in sales reduction in the early
quarters of 2017. China also recorded 116,000 electric buses in 2016108. This
accounts for the 95% of the global market. This displaces a massive oil
consumption in China. China has also believed to have sold 25 million two-
wheelers also during this period.
The launch of Tesla Model X BEV has pushed the sales of EVs by 40% in
2016. The policy outlook for EVs in United States are not bright with
governments reducing incentives and increasing taxes for such vehicles by
105 INTERNATIONAL ENERGY AGENCY, WORLD ENERGY INVESTMENT 2017, www.iea.org/t&c/
(last visited Sep 8, 2018).
106 supra note 14 RENEWABLE ENERGY STATISTICS 2018.
107 supra note 105 INTERNATIONAL ENERGY AGENCY.
108 Id.
35
mid-2015. The Corporate Average Fuel Economy (CAFÉ) standards compels
the automakers to increase the sales in EVs segment to compensate for sales of
conventional vehicles. There is uncertainty on the future of this program in
United States.
The changes in the tax incentives in Netherland has resulted in a dip in the
sales in Europe, though there is an absolute sales growth by 25 thousand EVs.
Whereas few other countries have introduced new policy measures have
helped to keep up the hopes. Polish Government has announced to invest in a
domestic EV manufacturer and has a target to put one million EVs on the road
by 2025109. Germany has a policy for purchase incentives, Austria is creating a
nationwide network of charging points, and United Kingdom is providing
public support to a factory to build 20000 PHEV taxis and aims to achieve the
target that all new taxis be electric by 2018. Japan has reduced the subsidy for
EVs which has affected the growth of sales in EVs in 2016, though the share
in BEVs has raised with the introduction of Leaf by Nissan in the market.
South Korea has announced a target of EVs of 30% of total car sales by 2020
and has subsidies of USD 11 000 for BEVs. They also provide city level
incentives and tax breaks.
Indian conditions were different from that of the world scenario. The sales of
EVs in the car segment were under 1000, which is the direct reflection of
publicly accessible chargers and affordability of EVs for the middle class.
Whereas electric two-wheelers has recorded a sales of 25000 in the year 2016.
The government offers a subsidy of USD 2000 to car buyers but is comparatively
a less attractive incentive.
1.6 FUTURE ENERGY CHALLENGES
Whichever scenarios we discussed, have a good contribution of electricity
from renewable energy sources. If the renewables fails to provide the
electricity supply as mentioned in each scenario, it will lead to more gas or
coal based capacity addition. Any thermal power plant will accelerate the
109 supra note 14 RENEWABLE ENERGY STATISTICS 2018.
36
global warming and climate change. The sustainability of the human race and
all the life on earth will be in danger if there are more thermal power plants
and fossil fuel consumption.
1.6.1 EXISTING DEFINITIONS OF SUSTAINABLE ENERGY
Although there are no attempts to provide a legal definition to the phrase
‘sustainable energy’ can be traced, a small town in New Hampshire has
attempted to define ‘unsustainable energy’ and banned ‘unsustainable energy’
development within its jurisdiction. Section 2e of the local ordinance (Grafton
Community Bill of Rights Ordinance) defines ‘unsustainable energy’ as
“Unsustainable energy systems means those systems that are controlled by state
and federal energy policies, rather than community controlled energy policies;
hydroelectric power and industrial scale wind power when it is not locally or
municipally owned and operated; energy systems using fossil fuels, including but
not limited to coal, natural gas, petroleum products, nuclear and radioactive
materials, and other fuel sources that are non-renewable, or which produce toxins
and substances that cause injury to humans or natural communities and
ecosystems, or that are in violation of residents’ rights to a sustainable energy
future. The phrase shall also include any energy system which violates the rights
secured under this Ordinance or under other laws. The term shall not include the
use of propane, kerosene, heating oil, coal, or natural gas when combustion of
those fossil fuels is used solely to generate on-site heat or power and the energy
produced is not commercially sold, transmitted, or distributed.110”
The above definition cannot be relied on for ascertaining the sustainable
energy sources. The definition is too limited to serve the local political
situation. The definition states that all commercial energy production within
the local limits unsustainable, even if it is environmental friendly and all
energy sources are sustainable, even if it is not environmental friendly, if
produced for their own consumption and not at commercial levels.
110 COOS COUNTY, ESTABLISHING A COMMUNITY BILL OF RIGHTS PROVIDING FOR A
SUSTAINABLE ENERGY FUTURE (2014), http://celdf.org/wp-content/uploads/ 2015/10/
Coos_County_OR_ Ordinance.pdf (last visited Jul 22, 2018)
37
There are diverse views on what sustainable energy means. One such
definition states that “sustainable energy: a dynamic harmony between the
equitable availability of energy-intensive goods and services to all people and
the preservation of the earth for future generations111.”
This definition is the more realistic definition of the concept so far. The
definition has ignored the efficiency aspect of sustainability. The authors have
but discussed some of the limitations of this definition in these words: “We
treat energy technologies as being sustainable if their net effects upon the
biosphere do not significantly degrade its capabilities for supporting existing
species in their current abundance and diversity. This definition is inherently
conservative and favorable to the status quo. It reflects our ignorance in
assessing the quality of alternative ecosystems (some of which might be
preferable to what exists now) and in understanding our effects upon them.”112
Any source of energy which is not degrading the current ecosystem can be
treated as sustainable because we have not yet discovered a system that can
actually improve the ecosystem from what it is today.
As far as renewable energy is concerned, the international organizations and
governments are broadly on consensus. But when it comes to sustainability
attributes of the energy, every nation and organization has different
approaches. While some have expressly included sustainability concerns in
defining renewable energy some did not. The International Renewable Energy
Agency (IRENA) has defined renewable energy as: “renewable energy
includes all forms of energy produced from renewable sources in a sustainable
manner, including bioenergy, geothermal energy, hydropower, ocean energy,
solar energy and wind energy113.”
111 JEFFERSON W. TESTER, ELISABETH M. DRAKE, MICHAEL J. DRISCOLL, MICHAEL W.
GOLAY & WILLIAM A. PETERS, SUSTAINABLE ENERGY: CHOOSING AMONG OPTIONS 10
(2005).
112 supra note 33 C.E.A.
113 WORLD BANK & INTERNATIONAL ENERGY AGENCY, SUSTAINABLE ENERGY FOR ALL
2013-2014: GLOBAL TRACKING FRAMEWORK 164 (2014), http://hdl.handle.net/10986/16537
(last visited Jul 24, 2018)
38
Some agencies have defined renewable energy and included the sustainability
aspects in it. The definition provided by International Energy Agency (IEA)
for renewable energy resources as those “derived from natural processes” and
“replenished at a faster rate than they are consumed” (IEA 2002, OECD, IEA
and Eurostat, 2005). The IEA definition of renewable energy includes the
following sources: “electricity and heat derived from solar, wind, ocean,
hydropower, biomass, geothermal resources, and biofuels and hydrogen
derived from renewable resources” (IEA 2002)114.
These definitions vary in the type of sources included and in whether
sustainability considerations are explicitlyincorporated. These differences
illustrate the fact that there is no common or global definition of sustainable
energy.
The world moves in the direction of renewables and it is taking into account the
environmental aspect and the renewability aspect. Energy production from these
sources is comparatively low and is more costly and depends on the uncertain
natural factors like sunlight and wind. There are no internationally accepted
sustainability criteria covering the major technologies, and it is therefore very
difficult to distinguish between sustainable and less sustainable deployment.
1.6.1.1 Solar Energy as a sustainable source of energy
Solar energy is one such source of energy which will meet most of the
sustainability attributes of the sustainable energy as defined above. It is thus
the source of energy the world policy makers may give attention to. Creating a
robust legal framework to achieve the abundance of energy production
through sustainable solar is the primary objective of policy makers.
1.7 THE ENERGY GAP AND ENERGY PLANNING
India is over dependent on fossil fuels. More than 60% of its electricity is
generated by thermal power plants. The Thermal Generation capacity will
increase significantly in the coming decades according to NITI Ayog, the
114 Id
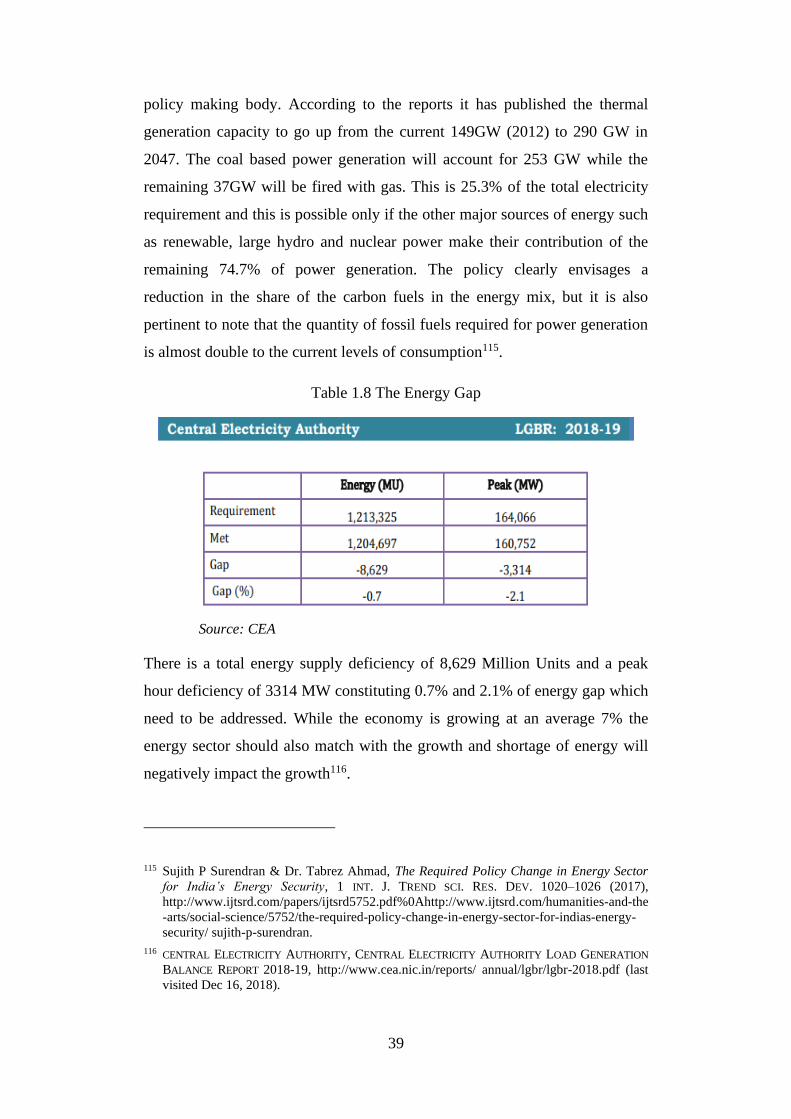
39
policy making body. According to the reports it has published the thermal
generation capacity to go up from the current 149GW (2012) to 290 GW in
2047. The coal based power generation will account for 253 GW while the
remaining 37GW will be fired with gas. This is 25.3% of the total electricity
requirement and this is possible only if the other major sources of energy such
as renewable, large hydro and nuclear power make their contribution of the
remaining 74.7% of power generation. The policy clearly envisages a
reduction in the share of the carbon fuels in the energy mix, but it is also
pertinent to note that the quantity of fossil fuels required for power generation
is almost double to the current levels of consumption115.
Table 1.8 The Energy Gap
Source: CEA
There is a total energy supply deficiency of 8,629 Million Units and a peak
hour deficiency of 3314 MW constituting 0.7% and 2.1% of energy gap which
need to be addressed. While the economy is growing at an average 7% the
energy sector should also match with the growth and shortage of energy will
negatively impact the growth116.
115 Sujith P Surendran & Dr. Tabrez Ahmad, The Required Policy Change in Energy Sector
for India’s Energy Security, 1 INT. J. TREND SCI. RES. DEV. 1020–1026 (2017),
http://www.ijtsrd.com/papers/ijtsrd5752.pdf%0Ahttp://www.ijtsrd.com/humanities-and-the
-arts/social-science/5752/the-required-policy-change-in-energy-sector-for-indias-energy-
security/ sujith-p-surendran.
116 CENTRAL ELECTRICITY AUTHORITY, CENTRAL ELECTRICITY AUTHORITY LOAD GENERATION
BALANCE REPORT 2018-19, http://www.cea.nic.in/reports/ annual/lgbr/lgbr-2018.pdf (last
visited Dec 16, 2018).
40
1.8 INVESTMENTS IN THE ENERGY SECTOR
There are various barriers which prevent an increased deployment of
renewable energy technologies. The barriers include market and social
barriers, information barriers, regulatory barriers and financial barriers. Some
of these barriers can be overcome through adopting an appropriate business
model. By “business model” we mean “a strategy to invest in renewable energy
technology which creates value and leads to an increased penetration of
renewable energy technology in the energy sector”. One of the factors of
investment attractiveness of any country is the stability of legal conditions for
investing. In the legal terms it is provided with two ways: the guarantee from the
unfavorable change of legislation ("grandfather's" clause) and the change of an
investment contract in connection with the change of legislation117.
1.8.1 LACK OF GOVERNMENT RESOURCES
The Investment requirement for future energy security in India is huge. The
government alone cannot achieve the huge investment requirement. Private
investors should be allowed to invest and build the sector. For any private
investor to invest, the sector should be commercially viable. There shall be
minimum market risks and lesser hurdles to invest. As a measure to promote
investments in the sector, governments have offered subsidies. The Frank Furt
School-UNEP Centre, in its study titled “Global Trends in Renewable Energy
Investments 2013” analyzed renewables investment in European Union,
United States and emerging markets. It also discusses overall energy trends,
technical costs, subsidies etc. The study finds that many countries have
adopted subsidies as a measure to promote renewable energy. Subsidies are
not a long term solution for attracting investments. Subsidies are not viable in
long term. Thus it is time for the governments to move further to devise
mechanisms which are sustainable in long run118.
117 Sujith Surendran & Tabrez Ahmad, Need for a comprehensive renewable energy law, 2
INT. J. MANAG. LAW SCI. STUD. 19–26 (2017), https://drive.google.com/drive/u/ 0/folders/
1Ugp_52bQI1McfFSidaAxTWUGaltYmAbt (last visited Dec 15, 2018).
118 Id.
41
1.8.2 NEED FOR PRIVATE INVESTMENT
The promotion of renewable energy is negatively impacted by the
unavailability of non-recourse financing and is a critical hurdle in the
expansion plans of developers. They cannot continue to accumulate recourse
on their balance sheet without adequate financing. Various institutions like
Bank of Baroda, Axis Bank, ICICI, IFC, ADB etc. are the major financiers in
the Indian renewable energy sector. Lenders have concerns with regard to
debt recovery and the legal enforceability of claims in India. The cost of
debt finance in India is 13-14% and the disputed debt to be recovered is
` 2 Trillion. The debt –equity ratio in renewable energy projects are
70:30. The debt finance required for solar projects alone in 2013 was ` 60
Billion119.
1.8.3 NEED FOR REGULATORY FRAMEWORK TO PROMOTE
BUSINESS IN SOLAR
This study examines the current law and policy affecting the renewable
energy deployment in India. The Study has identified that the focus of law
and policy to promote renewable energy is at the point of market access. But
the thesis argues that we should make the investment and regulations
regarding accumulation of funds and investments more investor friendly to
attract investments in the sector. The Study concludes that there requires a
comprehensive renewable energy law which addresses all the aspects of
renewable energy generation, from investment finance to market access120.
119 BRIDGE TO INDIA, BRIDGE TO INDIA SOLAR HAND BOOK CEO SURVEY 2017,
Https://Www.Bridgetoindia.Com/Wp-Content/Uploads/2017/05/Bridge-To-India_India-
Solar-Handbook_2017-1.Pdf (Last Visited Dec 4, 2018).
120 supra note 117 Sujith Surendran & Tabrez Ahmad.
42
CHAPTER 2
REVIEW OF LITERATURE
2.1 SURVEY OF LITERATURE
1) M. R. Mallick, Commentaries on the Electricity Act, 2003, with All
Rules, Regulations & Orders, Kamal Law House, 2006
The Book is a commentary of the Electricity Act 2003 and discusses the
provisions of the Act with latest case laws. The objective of the legislation and
mandate it has can be understood from the discussion of the preamble to the
Act. The Preamble to the Electricity Act 2003 states the objectives of the act
as:
An Act to consolidate the laws relating to generation, transmission,
distribution, trading and use of electricity and generally for taking
measures conducive to development of electricity industry, promoting
competition therein, protecting interest of consumers and supply of
electricity to all areas, rationalization of electricity tariff , ensuring
transparent policies regarding subsidies, promotion of efficient and
environmentally benign policies constitution of Central Electricity
Authority, Regulatory Commissions and establishment of Appellate
Tribunal and for matters connected therewith or incidental thereto.
It is clear from the commentary given in the book that one of the mandates of
the Act is to develop the electricity sector and promote competition. Thus, the
existing primary legislation on the subject, which is the Electricity Act 2003,
promotes competition in the market which is a precursor for private
investments in the sector. It also envisages the “promotion of efficient and
environmentally benign policies”, which can be understood to mean the
promotion of technologies like solar for power generation.
43
2) S.K. Chatterjee, Electricity laws of India, ed.2012, Delhi Law House.
The Book is a commentary of the Act which discusses the provisions of the
Electricity Act with latest case laws. The Act has only very few provisions
which directly deals with the renewable energy. The provision which has a
direct impact on the promotion of renewable energy is section 86. (1) which
states as follows:
The State Commission shall discharge the following functions, namely: -
(e) promote cogenration and generation of electricity from renewable
sources of energy by providing suitable measures for connectivity with
the grid and sale of electricity to any person, and also specify, for
purchase of electricity from such sources, a percentage of the total
consumption of electricity in the area of a distribution licence.
Though section 86 (1)(e), is a small provision in the entire Electricity Act
2003, it has laid down the foundation for entire policy and regulatory
framework for development of renewable energy. It mandates the state
electricity commission to adopt suitable measures for promoting generation
and cogeneration of renewable power, grid connectivity, Open Access,
Renewable Purchase Obligation, and Consumption Obligations on Distribution
Licensees.
3) J. Jeslin Drusila Nesamalar, P. Venkatesh & S. Charles Raja, The drive
of renewable energy in Tamilnadu: Status, barriers and future prospect,
73 Renew. Sustain. Energy Rev. 115–124 (2017).
This article focuses on the southernmost state of India Tamilnadu when its
endeavor to harness renewable energy. The article acknowledges the efforts at the
government level by bringing various policies for encouraging renewable energy
in the state. The article also credit such policies success to the extent that
Tamilnadu is one of the states with highest Renewable energy capacity. The also
criticize the lack of a comprehensive approach to promote renewable energy
through more public awareness and enhanced research and development in the
sector. They also warn the government in having consistency in policy measures
and falling short of action beyond bringing policy measures.
44
4) Tedd Moya Mose, toward a harmonized framework for international
regulation of renewable energy, Advance Article Unif. Law Rev. 1 (2018)
The author proposes harmonization of doctrinal and functional International
legal Framework for renewable energy. The authors suggest that there need
not be a new renewable energy law (lex renewabilia) created at the
international level but overarching International Energy Law combining
normative and functional elements to create a good matrix to assess the
operative issues and prospects and balancing promotion of renewable energy.
The article recognise the prominent role of soft law in a harmonised renewable
energy framework. Soft law can play an important role in interpreting hard
law. This adds teleological value to soft law. It also will help building broad
consensus among various stakeholders through development of operative
guidelines in the sector. This will result in a dynamic Legal Framework for
the renewable energy sector.
The author concludes that the lack of harmonized international renewable
energy law creates the need for an International Energy law overarching all
sources of energy.
5) Venkata Ramana, C.S. Sinha & P.R. Shukla, Renewable energy
technologies and climate change policies in India, 15 Int. J. Glob. Energy
Issues 97–116 (2001)
The authors in this article review renewable energy Technologies and the
policies from 1980 till the end of 1998. The Solar Energy can be seen as a
clear winner and evolved technology towards achieving the status of global
leader in renewable energy technologies.
6) Sunil Luthra et al., Barriers to renewable/sustainable energy technologies
adoption: Indian perspective, 41 Renew. Sustain. Energy Rev. 762–776
(2015)
The main objectives of this research paper are:
Identify various barriers to adoption of renewable or sustainable energy
Technologies in the Indian context and rank the identified barriers based on
45
analytic hierarchy process. The paper has identified 28 barriers to renewable
or sustainable energy Technologies adoption and they have been further
classified into 7 representative dimensions based on the nature of barrier.
7) Sudhakar Reddy & J. P. Painuly, Diffusion of renewable energy
technologies-barriers and stakeholders’ perspectives, 29 Renew. Energy
1431–1447 (2004)
The authors of the paper present the results of a survey conducted among
households, personal belong to industry and commercial establishments, and
policy Experts. The objective of the paper is to understand the consumer
perspective to help develop policies to intervene in areas of concern by
defining each barrier and its influence on the consumers. The survey reveals
how the consumers perceive information regarding renewable energy
technology and make decisions using there limited understanding. The survey
was conducted in the state of Maharashtra.
This study used a multiphase, stakeholder-based research. Stakeholder
representatives participated in working groups formed to discuss the mode of
survey and identify critical obstacles to data-collection.
8) Bridge to India Energy Pvt. Ltd., India Solar Decision Brief: Bankability
and Debt Financing For Solar Projects in India (2013)
The report states that, unavailability of non-recourse financing is a critical
hurdle in the expansion plans of developers as they cannot continue to
accumulate recourse on their balance sheet. Various institutions like Bank of
Baroda, Axis Bank, ICICI, IFC, ADB etc. are the major financiers in the
Indian renewable energy sector. Lenders have concerns with regard to debt
recovery and the legal enforceability of claims in India. The cost of debt
finance in India is 13-14% and the disputed debt to be recovered is ` 2 Trillion.
The debt –equity ratio in renewable energy projects are 70:30. The debt
finance required for solar projects alone in 2013 was ` 60 Billion.
46
9) IEA-RETD, Business Models For Renewable Energy In The Built
Environment (2012)
The report provides an insight into the way new and innovative business
models can stimulate renewable energy technologies and energy efficiency.
The report identifies various barriers which prevent an increased deployment
of renewable energy technologies. The barriers include market and social
barriers, information barriers, regulatory barriers and financial barriers. The
report defines “business model” as “a strategy to invest in renewable energy
technology which creates value and leads to an increased penetration of
renewable energy technology in the energy sector”.
10) Institute For Building Efficiency, Financing Models For Energy
Efficiency And Renewable Energy In Existing Buildings
The report provides a summary of several financial models in use for energy
efficiency and renewable energy projects. The study analyses various
financing models in use today and those with greatest potential for growth in
future.
11) Sustainable Energy Regulation and Policy Making Training Manual:
Financing Options For Renewable Energy And Energy Efficiency
The report examines what kind of laws, policies, regulations and incentives
could better facilitate or convince these financial institutions to actively
participate and support the renewable energy sector in Africa.
12) CPI-ISB, Meeting India’s Renewable Energy Targets: The Financing
Challenge (December 2012)
The rapid progress in wind energy and ambitious goals set by the National
Action Plan for Climate Change (NAPCC) raise the questions regarding the
sources and costs of investment that will be needed to install and operate the
renewable energy infrastructure in India. Interviews with investors suggest
that the major problem today is the less attractive nature of debt finance in
India. The general Indian financial market conditions are the main cause of
high interest rates for renewable energy. The report also states that being a
47
growing economy India has competing investment needs and which also
contributes to the financial challenges.
13) WISE, Achieving 12% Green Electricity By 2017 (June 2011)
The study discusses the evolution of policy environment for renewables in
India. Various barriers such as financial, policy, regulatory, institutional and
human resources barriers are identified. The report also lays down the road
map of actions needed such as planning, financing, policy, regulation, capacity
building, human resources etc.
14) APP Project REDG-06-09: Identifying Optimal Legal Frameworks For
Renewable Energy In India (November 2008)
The report provides a fundamental and basic understanding of India’s legal
system and energy market. It also discusses the existing national energy laws
and regulating bodies. It further discusses the existing renewable energy laws
and policies at the national level and state level. The report discusses the
proposed national renewable energy law by WISE. The report emphasizes on
the need for a national renewable energy law. It gives the outline of two types
of commonly used laws for renewable energy. The quota system and the
pricing system and compares the both.
15) GIZ, Legal Framework for Renewable Energy: Policy Analysis For 15
Developing And Emerging Countries
A theoretical overview of the existing renewable energy support instruments is
provided in this document. The report analyses the spread sheet data and
provides analysis. The report has adopted ‘policy design cycle’ originating
from the scientific approach of “theory based policy analysis”, a scientific
approach developed under the European Union Project AID-EE.
The policy design cycle defines pragmatic categories for consistency and
effectiveness of RE support schemes in different national contexts, following
policy makers to derive concrete action out of a complex set of influencing
factors.
48
16) Deepa Badrinarayana, India’s Constitutional Challenge: A Less Visible
Climate Change Catastrophe,(2010)
India has taken the stand that it cannot be equitably required to accept legal
obligations on climate change given its economic problems and its historically
low contribution to the climate change problem. The author suggests that the
current position of the Indian government needs to be reviewed, and will, it is
hoped be reviewed in the negotiations to revise the Kyoto protocol for the
period beyond 2012 in the light of the climate change induced catastrophes
that would directly deprive many Indians their right to life and livelihood.
17) World Bank, Doing Business 2014: Understanding Regulations for small
and medium size enterprises (2014)
Doing business 2014 is the 11th in a series of annual reports that enhance
business activity and those constrain it. The World Bank report compares the
business regulations for domestic firms in 189 economies. The report through
case studies analyses why the minimum capital requirements are a concern for
entrepreneurs. The report analyses the regulatory and procedural aspects with
regards to starting a business, dealing with construction permits, getting
electricity, registering property, getting credit, protecting investors, paying
taxes, trading across borders, enforcing contracts, resolving insolvency.
18) Earnest & Young India, India Attractiveness Survey 2014 (July 2013)
The report analyses the key features of India’s attractiveness in doing business
in India. The report suggests that in order to attract more FDI, India needs to
improve its operating environment, and of concern are complex taxation
system and stringent FDI regulations
19) Review: OECD Multilateral Agreement on Investment and why it never
happened
This review attempts to identify the reasons behind the failure of OECD MAI.
There is now an undeniable need for universal hard law on foreign direct
investment since the system of BITs excludes potential investment
relationships which potentially could contribute to a more equal distribution of
49
wealth in the world. Also, the disappointment of the sympathizers of the
investment liberalisation was surely one of the factors contributing to the launch
of MAI negotiations. The latter, surely was to become to be a great influence to
the drafting process of MAI which was initiated in these circumstances.
20) Frank Furt School-UNEP Centre, Global Trends In Renewable Energy
Investments 2013
The report focus is on the evolution policies to support renewables investment
in European Union, United States and emerging markets. It also discusses
overall energy trends, technical costs, subsidies etc.
a) Policy Documents
21) Government Of India, Prime Ministers Council On Climate Change,
National Action Plan On Climate Change (NAPCC)
The national action plan hinges on the development of new technologies.
NAPCC identifies measures that promote the development objectives while
yielding co-benefits for addressing climate change effectively. It outlines a
number of steps to simultaneously advance India’s development and climate
change related objectives of adaptation and mitigation.
b) Articles
22) Needed: A Renewable Energy Law For India, G M Pillai
The Author emphasizes the importance of bringing a comprehensive renewable
energy law. The target of 15% by 2020 set by the NAPCC requires that we will
have to add close to 90000 MW of renewable power (Wind, Solar, Biomass and
Small Hydro combined) by 2020, over and above the 16817 MW installed as of
March 2010. Even if we take a flat average, this would mean that for the next ten
years, we have to add 9000 MW of R.E. power every year. This is a monumental
task for which our human resource sector, our banking and financial sector, our
manufacturing sector, our electric utilities and other institutions are not yet
prepared. All-round activities will have to be launched on a war footing to achieve
this national target. Legal empowerment through an R.E. law will go a long way
in facilitating this much desired gradual transition to a sustainable energy system.
50
23) The Role of BITs in the Law of Foreign Investment, Marvin Rowe
Author describes the advantages and disadvantages of Bilateral Investment
Treaties (BIT). The advantages of BITs are many for both developing and
developed nations. One fundamental advantage, especially for developing
nations, is the improved credibility gained by standing out as a cooperative
international actor, receptive to FI and the responsibilities that accompany it.
The large increase in BITs has been accompanied by a whopping five-fold
increase inFI in a mere ten-year period from 1990 to 2000. Arguably, FI raises
wages, results in new technologies and techniques, improves quality control
and management skills, and improves access to markets for export. BITs also
served as a solution to the conflicting doctrines of the developed and
developing nations that came about after the colonial era. By entering into
BITs with developed nations, developing nations not only gain strength in the
relationship but they may improve internal governance and rule of law, the
theory being that by signing a BIT, developing nations not only prevent
themselves from acting in an abusive manner towards FIs but, as a byproduct,
such action also leads to less abuse of their own citizens.
BITs create substantive rights for FIs, which translates into substantial
obligations and risks for governments, including increased risk of litigation,
the potential for ‘ultimate liability’ and the sacrifice of ‘sovereign immunity’.
This loss of sovereignty over national investment disputes is hard for many
developing countries to swallow. For example, the US-Hondura BIT was
delayed for several years in the 1980s because of the loss of sovereignty issue,
with the Honduras refusing to sign in 1984, even though by signing they
would receive $5 billion in US investment.
24) Jurisdiction and Applicable Law Clauses: where does a Tribunal find the
principal norms applicable to the case before it?, Lorand Bartels
It is not uncommon, particularly in investment disputes, for a tribunal to be
asked to resolve a ‘dispute’ without any further reference to the norms to be
applied by the tribunal. In these cases, the principal norms applicable to the
51
case will be found in a relevant applicable law clause, such as Article 38(1) of
the International Court of Justice (ICJ) Statute or Article 42(1) of the
International Centre for Settlement of Investment Disputes (ICSID)
Convention, which purport to instruct tribunals on the norms.
25) Renewable Energy policies and Barries, Frederick.
The Article discusses various barriers including, cost and pricing, subsidy to
competing fuels, high initial capital costs, difficulty in fuel price risk
assessment, unfavourable power pricing rules, environmental externalities,
transaction costs, lack of legal framework, lack of access to credit, lack of
technical and commercial skills etc.
26) Souvik Sen & Sourav Ganguly, Opportunities, barriers and issues with
renewable energy development – A discussion, 69 Renew. Sustain.
Energy Rev. 1170–1181 (2017)
This paper explore the opportunities, barriers and related issues in relation to
renewable energy development in the context of present scenario. By present
scenario the authors mean technological advancements happening in the
renewable energy sector, improved understanding of renewable energy
knowledge, policies promoting renewable energy and renewable energy forms
are developing by meeting energy demands in a much cleaner way. The
authors approach energy as a strategic commodity. The authors emphasis that
“Sustainable socio economic development needs secure energy supplies in an
affordable rate which have low environmental impacts and low Greenhouse
gas emissions.”
The authors conclude by saying that renewable energy policies cannot perform
at its best without other ancillary and related areas like land use, agriculture,
water, food security, employment, transportation etc. also have policies which
support renewable energy. This may create some sort of tradeoff between
various sectors resulting in either a win-win situation or win lose situation. So
a comprehensive policy taking care of all these is the need of the hour. The
authors also suggest that to mitigate climate change and increase the
52
renewable energy production there shall be a “structural shift in today's energy
systems.” They are envisaging a world energy system with renewable energy
and Energy Efficiency playing a prominent role.
27) Akash Kumar Shukla et al., Solar PV and BIPV system: Barrier, challenges
and policy recommendation in India, 82 Renew. Sustain. Energy Rev.
3314–3322 (2018)
The article discuss solar PV and building integrated PV adoption in India. It
identifies various barriers for adoption of solar energy and suggest policy
measures for change.
2.2 RESEARCH GAP
Many researchers have approached the law for renewable energy as a piece of
legislation to fix a favorable tariff and to enable competition in the market. To
achieve an optimum level of renewable energy generation, the potential
capacity needs to be exploited by an optimum investment in the sector. There
are various barriers to for investors which can be addressed by a
comprehensive legislation to promote renewable energy. The perception of
the investors about the sector is thus very crucial to understand the
requirements of a facilitating legal framework.
The Objective of the Electricity Act 2003 is clear from its preamble which
intends to develop the electricity sector through environment friendly policies
and measures. Though this mandate is crucial for the development of the
sustainable energy technologies, the Act has only section 86(1)(e) which
directs the state commission to adopt appropriate measures. The irony is that,
all hurdles in the development of renewable energy also stems from the same
provision. This is a mandate to the state electricity commissions, where all
other agencies and government bodies are outside the scope of it.
The researcher examines the Electricity Act 2003 from two primary
perspectives. One from the perspective of human rights aspect of access to
energy and the other from the economic perspective of development. This
examination will reveal whether the Act is brought forth for meeting any one
53
of the objectives or both. Critique of a human rights document from business
perspective wouldn’t be a justifiable and balanced approach.
Jeslin Drusila Nesamalar, P. Venkatesh & S. Charles Raja also suggested
in their article that there is lack of comprehensive approach to promote
renewable energy, inconsistency in policy measures, and inaction beyond
bringing policy measures, in the state of Tamilnadu. According to Tedd Moya
Mose, the lack of harmonized international renewable energy law creates the
need for an International Energy law overarching all sources of energy. This is
true and the central government shall assume responsibility for bringing the
laws and policies which can be in harmony with international energy law.
Since Solar energy has evolved as the global leader in renewable technologies,
the laws shall focus on promoting the same.
Sunil Luthra et al, have identified 28 barriers for the development of the
adoption of renewable or sustainable energy Technologies in the Indian
context and rank the identified barriers based on analytic hierarchy process.
The survey conducted by Sudhakar Reddy & J. P. Painuly, among
households, personal belong to industry and commercial establishments, and
policy Experts reveals how the consumers perceive information regarding
renewable energy technology and make decisions using there limited
understanding. This gives an insight into the stakeholder’s mind from the
perspective of a consumer but lacks the finest nuances of an investor’s
perspective.
As discussed above, researchers have identified barriers and promoters of
renewable energy deployment in India. This research is an attempt to classify
those barriers and promoting factors which are already identified into those
influencing an investment decision negatively or positively. This thesis will
endeavor to understand the legal environment for business and the investors
mind regarding investing in solar energy for both commercial and domestic
purposes. The research also tries to understand which factors are highly influential
in the decision making and propose changes in the legal environment based on
the understanding of those factors which can be altered by law.
54
2.3 RESEARCH METHODOLOGY
There will be a library-based research to review the existing literature. There
after the socio-legal research methodology is used to conduct a survey in
which practitioners, investors, academicians etc will be interviewed. The
questionnaire will be designed understanding the problem and basic standards
for potential solutions, after the literature review and library-based research.
The Engineering Procurement and Construction (EPC) Contractors121 play a
major role in the development of solar business. There are individuals and
companies involved in the business of setting up solar plants and most these
ventures identify themselves as EPC contractors. They approach domestic,
commercial and industrial customers and convince them to install solar plants.
These EPC contractors do their business by coordinating with various stake
holders in the sector and are at the center of these transactions. They interact
with hundreds of their customers convincing them to install solar power
modules. They can provide the filtered and consolidated opinion as to the
factors which would convince anyone to invest in solar energy. They can
appropriately represent hundreds of customers who have decided to invest in
solar and those whom they have failed to convince to do business. I have taken
EPC contractors as proxy for investors in the sector as each EPC contractor
represents the more reliable opinion of hundreds of real investors.
The research takes the following course of actions:
i) In-depth analysis of primary sources such as existing legislation,
investment contracts, and judgments by various adjudicating bodies.
ii) In-depth analysis of secondary sources such as books, articles,
newspaper reports, policy papers, conference papers, and published
statistics.
iii) To gain further information, several discussion groups, blogs etc. will
be monitored
121 SOLAR MANGO, EPC DIRECTORY (2017), http://www.solarmango.com/rooftop-guide/
India_Solar_EPC_Directory_from_Solar_Mango_Edition_2017.pdf (Accessed 1 Mar.
2018).
55
iv) Sending questionnaire to persons and organizations in the field of
renewable energy, climate change and investments
v) In-depth interviews with specialist lawyers, as well as energy
companies, domestic & commercial investors and academicians.
vi) Conducting an emailed survey among EPC contractors to identify and
classify factors promoting and detracting investments on the level of
its influence over investment decision in solar sector.
2.4 RESEARCH QUESTIONS
The Research Question: Is there an optimal legal framework to promote
investments in renewable energy sector in India?
A. Whether the Electricity Act 2003 has been successful in attracting
investors to the renewable energy sector in India?
B. What other legislations complement the growth of the sector by
promoting investments?
C. Are there legislations that dissuade otherwise potential investors in
the sector?
D. Whether the structural changes to the Electricity Act 2003 will
achieve the desired objectives?
E. Vision 2047: How the sector is expected to perform under an
improved framework of the Electricity Act 2003?
2.5 RESEARCH OBJECTIVES
The Objective of the study is to identify the gaps in the existing legal
framework for the comprehensive development of the sector with special
reference to the Electricity Act 2003.
A. To study whether the Electricity Act 2003 is making sufficient
payoffs to attract investors to renewable energy sector in India.
B. To identify and evaluate the laws that are complementing the growth
of the sector by promoting investments
C. To analyze laws those are acting as a barrier to investors in the sector.
56
D. To study whether the structural changes could achieve the desired
objectives.
E. To study the implications on the sector if the Electricity Act 2003 had
not been implemented.
F. To study how the sector will perform under the present Electricity
Act 2003 in the future.
G. To assess the impact if the provisions of the Electricity Act 2003
were modified or a separate comprehensive legislation brought into
existence.
2.6 HYPOTHESIS
Hypothesis: India lacks an optimal legal framework to promote investments
in renewable energy sector.
2.7 LIMITATIONS OF THE STUDY
There are many renewable energy sources. Some sources are used to produce
bio-fuels while some are used to create electricity. This study focuses on
renewable electricity. Renewable Electricity in India is produced mainly from
wind and solar. Wind energy do not have a nationwide potential for
generation. The states like Tamil Nadu, which has high wind energy potential
has already adopted measures for the promotion of the same. Solar Energy on
the other hand is available across all states.
Considering the universal nature of solar energy and the potential to be the
future of our energy resources, the research is focused on solar energy
investment and the regulatory framework dealing with solar in India.
2.8 ARRANGEMENT OF CHAPTERS
The thesis chapters are arranged for discussion of various aspects of the
enquiry and addressing various research questions in the following manner.
2.8.1 CHAPTER 1: INTRODUCTION
Introduction to the Thesis. The chapter sets out the research problem,
hypothesis, and literature review.
57
2.8.2 CHAPTER 2: REVIEW OF LITERATURE
A detailed review of literature has helped to identify the research gap. Many
researchers have approached the law for renewable energy as a piece of
legislation to fix a favorable tariff and to enable competition in the market. To
achieve an optimum level of renewable energy generation, the potential
capacity needs to be exploited by an optimum investment in the sector. There
are various barriers to for investors which can be addressed by a
comprehensive legislation to promote renewable energy.
2.8.3 CHAPTER 3: ACCESS TO ENERGY AND THE ELECTRICITY
ACT 2003
This chapter examines the constitutional background of the Electricity Act
2003122. The chapter will explore the fundamental rights concerning various
essential amenities of life, the constitutional mandate under the Directive
Principles of State Policy and the center- state relations concerning the
division of various legislative powers. After analyzing the constitutional
background, the chapter will try to explore the competing claims where the
state is under obligation to provide clean and cheaper energy with the
sustainability attributes and also ensure equitable distribution of the resources
of the nation. The chapter also examines how the Electricity Act 2003 can
meet the demand for energy by ensuring an adequate supply of energy
throughout the year and also for future generations. According to neo-classical
economic theories, the optimum utilization of resources is possible only by
bringing competition to the market. Competition in the market is possible only
when there are private players in the market. Private players will be interested
in investments in the electricity sector only if there is a level playing field with
already existing government players and the sector is profitable. This chapter
thus examines the attractiveness of the sector under the current regulation
under the Electricity Act 2003.
122 Act 38 of 2003
58
The objective of the chapter is to identify various advantages and
shortcomings from a legal perspective in the existing regulations under the
Electricity Act 2003. This chapter examines the constitutional provisions and
various court judgments regarding electricity, access to electricity, and the
division of legislative power between the states and center. It details the
regulatory mechanism for electricity.
2.8.4 CHAPTER 4: LEGISLATIONS COMPLEMENTING THE
GROWTH OF THE SECTOR
The growth of renewable energy sector depends on various other legislation in
addition to the Electricity Act 2003. This chapter will explore the business
environment in India based on the ease of doing parameters adopted by the World
Bank. These other legislations, regulations and policies have a direct or indirect
impact on the promotion and development of renewable energy sector. The first
part of this chapter analyses the general business environment in India which will
impact any business activity including the renewable energy sector. The second
part of this chapter will examine how the central state government policies and
measures have helped the renewable energy sector, especially solar.
2.8.5 CHAPTER 5: BARRIERS TO RENEWABLE ENERGY
DEVELOPMENT
India has adopted a comprehensive approach to energy security which is set
out in the proposed energy policy123. The policy is ambitious of achieving the
huge energy targets in the future through the proposed energy mix. The
proposed energy mix envisages to have a major role to be played buy the
renewable energy technologies. But there are various barriers to be removed
for the government to achieve the ambitious energy targets. The barriers to
development of RE in India, in general, are described in this chapter. A careful
review of existing literature by eminent scholars in the area have identified
various barriers to renewable energy development. The scholars have adopted
various methods of study to identify various barriers. This chapter is an
123 supra note 5 NITI Aayog.
59
enquiry into various such barriers. Some of these may be specific to a
technology, while some may be specific to a policy, site or a region.
2.8.6 CHAPTER 6: THE STRUCTURAL ANALYSIS OF THE RENEWABLE
ELECTRICITY SECTOR AND INVESTMENT DECISION
The investment decision situation is broken into its elements using a
framework developed with inspiration from the Institutional Analysis and
Development framework. The elements are identified and the key actors, the
investors are approached for a survey through questionnaire. The survey has
helped to identify the main detractors and the main promoting measures for
renewable energy.
The method of study is inspired from various frameworks suggested by
various authors including the Institutional Analysis and Development
framework developed by Nobel Laureate late Dr. Elinor Ostrom. According to
the framework used in the study, the action situation is deconstructed into
various elements influencing the decision making. Here the investment
decision by a developer is considered for the study. The framework is used to
identify all the factors which are having an impact on the investment decision
and to understand those factors which can be modified through formal law.
The factors which affects the decision can be broadly classified as those which
can be changed by rules and those which cannot be changed by rules. The
researcher propose to identify the intensity and impact of a factor on the
decision making process and propose changes through formal rules.
2.8.7 CHAPTER 7: THE CONCLUSION
The research questions are answered and the Hypothesis is tested. Conclusions
and suggestions from the research will be set out with further area for future
research.
2.9 CONCLUSION
This study examines the current law and policy affecting the renewable energy
deployment in India. The focus of law and policy to promote renewable energy is
at the point of market access. But we should make the investment and regulations
regarding accumulation of funds and investments more investor friendly to attract

60
investments in the sector. Most of these studies and proposed legal frameworks
are limited to the creation of a market access for renewable energy once it is
generated. There are a lot more hurdles and barriers an investor may have to
overcome to take the benefit of the markets created through quota or pricing
regulations. An analysis of Electricity Act 2003 which is the regulating legislation
will help to identify the shortcomings in the regulation.
61
CHAPTER 3
ACCESS TO ENERGY AND THE ELECTRICITY ACT, 2003
3.1 INTRODUCTION
This chapter examines the constitutional background of the Electricity Act
2003124 (The 2003 Act). The chapter will explore the fundamental rights
concerning various essential amenities of life, the constitutional mandate under
the Directive Principles of State Policy and the center- state relations
concerning the division of various legislative powers. After analyzing the
constitutional background, the chapter will try to explore the competing claims
where the state is under obligation to provide clean and cheaper energy with
the sustainability attributes and also ensure equitable distribution of the
resources of the nation. The chapter also examines how the Electricity Act
2003 can meet the demand for energy by ensuring an adequate supply of
energy throughout the year and also for future generations. According to
neo-classical economic theories, the optimum utilization of resources is
possible only by bringing competition to the market. Competition in the
market is possible only when there are private players in the market. Private
players will be interested in investments in the electricity sector only if there is
a level playing field with already existing government players and the sector is
profitable. This chapter thus examines the attractiveness of the sector under
the current regulation under the 2003 Act.
The objective of the chapter is to identify various advantages and shortcomings
from a legal perspective in the existing regulations under the Electricity Act
2003. This chapter examines the constitutional provisions and various court
judgments regarding electricity, access to electricity, and the division of
124 supra note 122 ELECTRICITY ACT.
62
legislative power between the states and center. It details the regulatory
mechanism for electricity.
3.2 THE ELECTRICITY ACT 2003 AND THE CONSTITUTION OF INDIA
The constitutional provisions can be classified into rights, duties and powers
based on its impact on the Electricity Act 2003. Constitution has conferred
rights upon the citizens concerning access to energy, living conditions and
environment. It also has conferred various economic rights such as the right to
do business, right for equitable distribution of resources et cetera. The
Directive Principles of State Policy mandates the state to adopt specific policy
measures through legislation for the best interest of the nation. The federal
structure of the government provides for distribution of the legislative powers
between the center and the state governments.
3.2.1 CONSTITUTION OF INDIA AND BASIC HUMAN RIGHTS
Indian Constitution is one of the largest written constitutions in the world.
Indian constitution is also revered globally as a great human rights document.
Though the rights for electricity are not clearly written in the provisions of the
constitution, various rights embodied there will make the right to energy a
right without which the enjoyment of other rights will become futile.
3.2.1.1 Right to Live with Human Dignity
The Supreme Court of India has taken a grand step by expanding the scope of
Article 21 beyond the administration of criminal justice through various
landmark judgments. The court stated that life in Article 21 does not mean
merely animal existence but living with human dignity. In Francis Coralie v.
Administrator, Union Territory of Delhi125, the Supreme Court observed that
“the right to life includes the right to live with human dignity and all that goes
along with it126.” The court also stated that “the magnitude and content of the
components of this right would depend upon the extent of the economic
125 AIR 1981 SC 746, 753
126 Id.
63
development of the country” and includes “such functions and activities as to
constitute the bare minimum expression of the human self.”
3.2.1.2 Right to Shelter
In State of Karnataka v. Narasimhamurthy127, the court held that right to
shelter is a fundamental right under Article 19(1) of the Constitution of India.
In Chameli Singh v. State of Uttar Pradesh128 the court explained the
constituent elements of right to shelter and stated that “Right to shelter,
therefore, includes adequate living space, safe and decent structure, clean and
decent surroundings, sufficient light, pure air and water, electricity, sanitation
and other civic amenities like roads, etc.” Court through the above judgment
has recognized that electricity is fundamental to the enjoyment of a dignified
life and constitutes part of the right to shelter.
3.2.1.3 The right of Access to Electricity
In the matter of TM Prakash and Others v The District Collector and The
Superintending Engineer, Tamil Nadu Electricity Board129 the Madras High
Court has held that “access to electricity supply should also be considered as
part of the right to life in terms ofArticle 21 of the Constitution”. Court also
observed that “lack of Electricity supply is one of the determinative factors,
affecting education, health, cause for economic disparity and consequently,
inequality in the society, leading to poverty.”
In Chottelal Yadav v Chattisgarh State Power Distribution Company Ltd130
the court has held that “Access to Electricity should be construed as a human
right, of course, to the requirements to be satisfied under the Electricity laws.
Denial of the same, upon even satisfying the requirements, would amount to a
violation of human rights.”
127 AIR1996 SC 90.
128 AIR 1996 SC 1051.
129 MANU/TN/2091/2013.
130 Chottelal Yadav v Chattisgarh State Power Distribution Company Ltd, W.P.(C)Nos.3341.
64
3.2.2 CONSTITUTION AND OTHER FUNDAMENTAL RIGHTS
The constitution of India has set out individual as well as collective rights
which a citizen as well as in certain cases any person can enjoy. Some of these
rights suggesting the need for deploying sustainable energy technology for the
benefit all are discussed here.
3.2.2.1 Right to Clean Environment
India is one of the first nations in the world to enshrine environmental
protection as a state goal in the constitution. The constitution of India
envisages a clean environment. The Supreme Court has extended the
application of Article 21 for the wellbeing of the society as a whole
recognizing that the individual rights can be enjoyed in the presence of other
vital aspects such as a clean environment, which affects the entire population
in a geographical area. The two principles governing environment are (i) the
principle of sustainable development and (ii) precautionary principle131. The
right to a healthy environment is an internationally recognized essential for a
quality life. The Supreme Court has also accepted the Doctrine of Public
Trust132. It stated that ‘the State is a trustee, and the general public the
beneficiary of natural resources.’133 In State of MP v Kedia Leather & Liquor
Ltd.134, The Supreme Court said that ‘right to live with human dignity
becomes illusory in the absence of humane and healthy environment.’
Court also held that the government should exercise its discretion under
various legislations concerning the environment, subject to international
conventions to which it has acceded to at the international arena135. In
M.C. Mehta v Union of India (2003)136 court has expressed its concern on
131 M. P. JAIN, INDIAN CONSTITUTIONAL LAW 44-5 (2014).
132 Id.
133 M C Mehta v Kamal Nath (1997) 1 SCC 388
134 (2003) 7 SCC 389.
135 T. N. GovardhanThirumulpad v. Union of India, (2002) 10 SCC 606.
136 (2003) 10 SCC 389.
65
vehicular pollution from the burning of fuels with high Sulphur and high
benzene content and the emission of greenhouse gases causing climate change.
In Vellore Citizens Welfare Forum v. Union of India137, the Court observed
that "the Precautionary Principle" and "the Polluter Pays Principle" adopted into
the Indian environmental jurisprudence are essential features of "Sustainable
Development" and necessary to achieve “Intergenerational Equity.”
3.2.3 INTERNATIONAL COMMITMENTS FOR PROTECTION OF
ENVIRONMENT
The Declaration of the 1972 Stockholm conference138 has articulated the
importance of environment in development. The Supreme Court of India in its
judgment on Essar oil Limited v HalarUtkarshSamiti, and Ors.139 hasobserved
that the Stockholm Declaration is the Magna Carta of our environment. In
1987, the Brundtland Report, ‘Our Common Environment’ stimulated debate on
development and environment again. The World Commission on Environment
and Development' propounded concept of sustainable development, which very
aptly and comprehensively defined it as 'development that meets the needs of the
present without compromising the ability of future generations to meet their own
needs.'
The United Nations Conference on Environment and Development, informally
known as “The Earth Summit,” was held in Rio de Janeiro in 1992. The
conference provided the fundamental principles for achieving sustainable
development140. The Principle, 3 of the conference, recognizes the right to
develop to ‘equitably meet developmental and environmental needs of the
present and future generations’ while Principle 4 states that ‘environmental
protection shall constitute an integral part of the development process to
achieve sustainable development, and cannot be considered in isolation from
137 (1996) 5 SCC 647.
138 U.N. GENERAL ASSEMBLY, UNITED NATIONS CONFERENCE ON THE HUMAN ENVIRONMENT,
(Dec. 15, 1972), A/RES/2994.
139 MANU/SC/0037/2004.
140 1992 Rio Declaration on Environment and Development, 31 ILM 874 (1992).

66
it141. Principle 1 declares that human beings ‘are entitled to a healthy and
productive life in harmony with nature.’
The obstacles to achieving the sustainable development objectives laid down
in the Rio conference was evaluated in the World Summit on Sustainable
Development held in Johannesburg in 2002. The United Nations Conference
on Sustainable Development in Rio de Janeiro has resulted in the creation of
Sustainable Development Goals (SDGs) in 2012 with the objective of creating
a set of universal goals that can address the urgent challenges of the world142.
While the global focus is moved from the Millennium Development Goals
(MDGs) to SDGs, the achievements of the MDGs have boosted the confidence of
the UN to adopt a more comprehensive SDGs. MDGs were successful in
achieving targets like lifting more than 1 billion people out of extreme poverty,
reduce child mortality, education for children and reduction in HIV infections143.
The United Nations has adopted Sustainable Development Goals in its
seventieth session on 25th September 2015144. In the preamble to the resolution
titled- Transforming Our World: the 2030 Agenda for Sustainable Development,
it is stated that the Agenda is a plan of action for people, planet, and
prosperity. It has announced 17 Sustainable Development Goals and 169
targets. These goals and targets are expected to stimulate actions over the next
15 years in areas of critical importance to humanity and the planet. The
Resolution further states that “We are determined to end poverty and hunger,
in all their forms and dimensions, and to ensure that all human beings can
fulfill their potential in dignity and equality and a healthy environment.”
The UN has set out a ‘supremely ambitious and transformational vision’
envisaging a world ‘free of poverty, hunger, disease, and want.’ It also
141 Id.
142 U.N.D.P., BACKGROUND OF THE SUSTAINABLE DEVELOPMENT GOALS (2018)
http://www.undp.org/content/undp/en/home/sustainable-development-goals/background/
143 Id.
144 UNITED NATIONS, TRANSFORMING OUR WORLD: THE 2030 AGENDA FOR SUSTAINABLE
DEVELOPMENT (2015).
67
envisages a world where “there is universal access to affordable, reliable and
sustainable energy.”
3.2.4 SUSTAINABLE DEVELOPMENT GOALS
The United Nations have revised and improvised the Millennium
Development Goals by including new entries like climate change, economic
inequality and sustainable consumption. It has created the new list of Global
Goals known as the Sustainable Development Goals (SDGs)145. The following
are the seventeen Sustainable Development Goals.
Goal 1. End poverty in all its forms everywhere
Goal 2. End hunger, achieve food security and improved nutrition and
promote sustainable agriculture
Goal 3. Ensure healthy lives and promote well-being for all at all ages
Goal 4. Ensure inclusive and equitable quality education and promote
lifelong learning opportunities for all
Goal 5. Achieve gender equality and empower all women and girls
Goal 6. Ensure availability and sustainable management of water and
sanitation for all
Goal 7 Ensure access to affordable, reliable, sustainable and modern energy
for all
Goal 8. Promote sustained, inclusive and sustainable economic growth, full
and productive employment and decent work for all
Goal 9. Build resilient infrastructure, promote inclusive and sustainable
industrialization and foster innovation
Goal 10. Reduce inequality within and among countries
Goal 11. Make cities and human settlements inclusive, safe, resilient and
sustainable
Goal 12. Ensure sustainable consumption and production patterns
Goal 13. Take urgent action to combat climate change and its impacts
145 supra note 142 U.N.D.P.
68
Goal 14. Conserve and sustainably use the oceans, seas and marine resources
for sustainable development
Goal 15. Protect, restore and promote sustainable use of terrestrial ecosystems,
sustainably manage forests, combat desertification, and halt and
reverse land degradation and halt biodiversity loss
Goal 16. Promote peaceful and inclusive societies for sustainable development,
provide access to justice for all and build effective, accountable and
inclusive institutions at all levels
Goal 17. Strengthen the means of implementation and revitalize the Global
Partnership for Sustainable Development
Goal 7 focuses on ensuring ‘access to affordable, reliable, sustainable and
modern energy for all.’ However, a closer look at other goals will reveal the
critical fact that the achievement of all other goals depends on the way we
create and consume energy146. Whether it is ending poverty, providing quality
education, removing economic disparity or combating climate change, it all
has the energy consumption as one core aspect147. The availability of clean,
affordable and reliable modern energy is so critically important that without
which most of the other goals may remain unattainable.
3.2.5 GOAL 7 TARGETS
The SDGs came into force from January 2016 and has clear targets to achieve
by 2030. UNDP the lead agency for the implementation of the SDGs has their
presence in 170 countries and territories through the participation of
government agencies, private players and civil society148.
By 2030, ensure universal access to affordable, reliable and modern energy
services
146 U.N.D.P., ENERGISING HUMAN DEVELOPMENT-HUMAN DEVELOPMENT REPORTS (2016),
http://hdr.undp.org/en/content/energising-human-development, (last accessed 17 November
2018).
147 supra note 142 U.N.D.P.
148 Id.
69
By 2030, increase substantially the share of renewable energy in the global
energy mix
By 2030, double the global rate of improvement in energy efficiency
By 2030, enhance international cooperation to facilitate access to clean energy
research and technology, including renewable energy, energy efficiency and
advanced and cleaner fossil-fuel technology, and promote investment in
energy infrastructure and clean energy technology
By 2030, expand infrastructure and upgrade technology for supplying modern
and sustainable energy services for all in developing countries, in particular,
least developed countries, small island developing States, and land-locked
developing countries, in accordance with their respective programmes of
support
The government of India thus has international commitment to achieve these
targets outlined in the SDGs. UNDP also suggest the mobilization of resources
from the private sector will be crucial to achieve these development targets.
3.2.6 ELECTRICITY ACT 2003 AND THE RIGHT TO CARRY ON
ECONOMIC ACTIVITIES
The Electricity sector, once considered as a government monopoly was
privatized and liberalized through the enactment of Electricity Act, 2003. It is
essential to consider the freedoms guaranteed under the Constitution of India
to carry on various economic activities. The 2003 Act and the freedom of
economic activities envisaged under it shall agree with the constitutional
freedoms and restrictions.
3.2.6.1 Right to Carry on Economic Activities
Article 19(1)(g) of the Constitution of India149 guarantees to all citizens the
right to practice any profession or to carry on any occupation, trade or
149 Article 19(1)(g) in The Constitution Of India 1949, (g) to practice any profession, or to
carry on any occupation, trade or business
70
business. The state is empowered to bring in reasonable restriction on the basis
ofthe interest of the general public150.
Historically India believed in a controlled economy. The government had a
Monopoly over various economic activities. Electricity sector was entirely under
the Monopoly of State Electricity Boards. The constitutional provisions under
Directive Principles of State Policy also promoted the philosophy of regulated
control and planned economy to minimize the concentration of economic
resources in few hands. The 44th Amendment of the Constitution in the year 1978,
has inserted the word socialist into the Preamble to the constitution. The 44th
Amendment of the constitution gave the central government unequivocal power
to go against private investors and bring various business activities and astringent
regulation or government monopoly. In Excel Wear v Union of India,151 the
court recognized private ownership of industries and their rights and rights of
various stakeholders dealing with such private entities. Art. 19 (6) (ii) enable the
state to make laws for creating state monopolies. It is difficult to take any
objection if the state is carrying on any business as a monopoly.
The Electricity Act 2003 is in that respect and enabling legislation which has
created competition in the sector by allowing private participation and
investment in the electricity sector152. It has brought to an end the age-old
150 Article 19(6) Nothing in sub clause (g) of the said clause shall affect the operation of any
existing law in so far as it imposes, or prevent the State from making any law imposing, in the
interests of the general public, reasonable restrictions on the exercise of the right conferred by
the said sub clause, and, in particular, nothing in the said sub clause shall affect the operation of
any existing law in so far as it relates to, or prevent the State from making any law relating to,
(i) the professional or technical qualifications necessary for practicing any profession or
carrying on any occupation, trade or business, or
(ii) the carrying on by the State, or by a corporation owned or controlled by the State, of
any trade, business, industry or service, whether to the exclusion, complete or partial, of
citizens or otherwise. 151 AIR 1979 SC 25. 152 See Preamble to the Electricity Act 2003 which reads as follows:
An Act to consolidate the laws relating to generation, transmission, distribution, trading
and use of electricity and generally for taking measures conducive to development of
electricity industry, promoting competition therein, protecting interest of consumers and
supply of electricity to all areas, rationalisation of electricity tariff, ensuring transparent
policies regarding subsidies, promotion of efficient and environmentally benign policies,
constitution of Central Electricity Authority, Regulatory Commissions and establishment
of Appellate Tribunal and for matters connected therewith or incidental thereto.
71
monopoly enjoyed by the State Electricity Board in the sector. The Act also
protects the interest of the investor by assuring the private players through its
provisions creating a level playing field.
3.2.7 THE DUTY OF THE STATE
The state must protect the environment as well as ensure a dignified life to its
subjects. Article 48A of the Indian Constitution states that ‘the state shall
endeavor to protect and improve the environment and to safeguard the forest
and wildlife of the country153.’ Delhi has recently witnessed alarming levels of
air pollution which will have lasting implications in the health of the people
living there. Government has tried various measures like the odd-evenrule154
to reduce the air pollution, but it has deteriorated every year155 due to
vehicular emissions, factories, constructions and burning of agricultural
stubbles in the neighboring states156, though some of the studies have
suggested this as a bold move from the government which has resulted in the
reduction of Particulate Matter (PM) in the air157. The Supreme Court has
reiterated the duty of the government to adopt measures to protect the
environment in Arjun Gopal and Ors. v Union of India and Ors158 while
considering the pollution caused by Diwali celebrations in Delhi and whether
any direction can be issued to ban it.
153 See Article 48A in The Constitution Of India which reads as follows:
Article 48A. Protection and improvement of environment and safeguarding of forests and
wild life. The State shall endeavour to protect and improve the environment and to
safeguard the forests and wild life of the country
154 GOVERNMENT OF NATIONAL CAPITAL TERRITORY OF DELHI NOTIFICATION NO.F.3
(218)/MRTS/Tpt./2015/302 (Dec 28th, 2015) http://it.delhigovt.nic.in/ writereaddata/
egaz20157544.pdf, (last accessed on 19th Nov. 2018)
155 CENTRAL POLLUTION CONTROL BOARD, DELHI ASSESSMENT OF IMPACT OF ODD-EVEN
SCHEME ON AIR QUALITY OF DELHI, http://cpcbenvis.nic.in/pdf/CPCB Report on Odd-
Even Scheme.pdf (last visited Nov 19, 2018).
156 Keshav Singhania, G P Girish & Nnaemeka Vincent, Impact of Odd-Even Rationing of
Vehicular Movement in Delhi on Air Pollution Levels, 7(4) LOW CARBON ECONOMY
151–160 (2016), http://www.scirp.org/journal/lce (last visited Nov 19, 2018).
157 ENERGY POLICY INSTITUTE AT THE UNIVERSITY OF CHICAGO, ODD-EVEN PROGRAM:
ANALYSIS: A SUMMARY, https://epic.uchicago.edu/sites/default/files/ Odd.Even Pogram
Analysis Q&A.pdf (last visited Nov 19, 2018).
158 MANU/SC/1276/2017
72
3.2.8 THE DUTY OF THE CITIZEN OF INDIA
The Constitution of India has included fundamental duties for its citizens in
the constitution. Article 51A (g) which has imposed the fundamental duty on
the citizen of India to protect the environment reads as follows:
It shall be the fundamental duty of every citizen of India to protect and
improve the natural environment including forest lakes, rivers and wildlife and
to have compassion for living creatures.
The Courts in India also has indicated this as one of the paramount duty of the
citizen to protect the environment and leave the planet safe for the coming
generations159. Keeping the planet safe for living and to meet the needs of the
current and future generations in a sustainable manner the entire population on
this earth shall work in tandem with the same environmental goals and
standards.
The Developed world has moved far in the sustainable ways of production,
living, and consumption which the developing nations are still reluctant to
embrace due to substantial investment requirements. The World Bank, United
Nations, and other international and intergovernmental organizations have
identified the need of mobilizing the private capital to meet the developmental
investments sustainably. Being a country housing 1/6th of the global
population, India needs to act in the same direction to save the planet from an
environmental disaster. India needs to mobilize investments for the sustainable
development of this country. Energy the core feature of human activity today
is the key to sustainability. We need to create sustainable energy and ways of
sustainable consumption of it.
The government mustbring such policies to ensure the clean environment. The
citizen also shares the duty to protect it. However, sometimes the government
measures fail to achieve the desired objective as it happened in Diwali in
159 Arjun Gopal and Ors. vs. Union of India (UOI) and Ors. (09.10.2017 - SC) : MANU/SC/
1276/2017
73
Delhi and during the odd-even rule160. People flouted these rules in favor of
selfish motives.
3.2.9 CONSTITUTION OF INDIA AND DISTRIBUTION OF POWERS
A closer look at the division of power adopted in the Indian Constitution
suggests that functions of national importance have been given to the central
government and the functions of local interest to the state governments.
However, the problem lies in deciding what functions are of national
importance and what functions are of local importance.
Article 1 of the constitution of India states that India is a Union of States.
However, Supreme Court has pointed out its federal nature in some
instances161. According to Article 245, the Parliament is empowered to make
laws for the whole of India, or a part thereof. A state Legislature is allowed to
make laws only for the concerned state.
However, it is important how we prioritize and classify the functions. It is easy
to identify specific functions such as defense and foreign affairs as having
national importance; it is difficult to prioritize and suggest about electricity
sector since it has its significance at the national level and local level.
The pivotal point in the machinery of a working federal constitution is the
division of legislative powers between the federal government and the
governments of the constituent federal units. The foundations of the federal
system of government can be traced back to the Government of India Act,
1935.
3.2.10 CONSTITUTION OF INDIA AND ELECTRICITY
The Constitution of India which has established a quasi-federal governance
system in India has vested the legislative powers for some subjects with the
160 Sumit Sharma et al., ANALYSIS OF ODD-EVEN SCHEME PHASE-II,
https://pdfs.semanticscholar.org/6ccc/fe6af7cc7d8247e2b15fbd8a35ce4730c620.pdf (last
visited Nov 19, 2018).
161 State of West Bengal v. Committee for Protection of Democratic Rights, West Bengal,
AIR 2010 SC 1476 (India Supreme Court 2010)
74
federation and some with the states. In respect of some other subjects, the
power is given to both the Federation and the states162. Electricity is a subject
listed in the Concurrent List of the Constitution. Therefore, both the Centre
and States have the power to legislate and thereby regulate the electricity
sector. However, the overall national policy and legislation are controlled and
determined by the Central Government whereas the powers of State
Governments remain restricted to their respective state territories163. In case
of any inconsistency between the state and central legislation, Article 254
provides that the central law has the supremacy164.
The three functional areas thus created by the Constitution of India has thus
kept electricity in the third list, the Concurrent List in the Seventh Schedule.
Entry 38 of the Concurrent List is Electricity. The entry does not elaborate on
the functions falling under it. The sector but comprise of all the activities from
generation to consumption of electricity. Thus matters concerning production
or generation of electricity, transmission, distribution, and consumption are
matters which comes within the legislative competencies of both the states and
the center.
The government of India has enacted various legislations in the past
concerning electricity, its generation, transmission, and supply, providing a
comprehensive legal framework to regulate and promote the sector.
3.2.11 HISTORY OF LEGISLATIONS GOVERNING ELECTRICITY
SECTOR
The Indian Electricity Act, 1903 was one of the earliest legislation in the area
which has brought significant legislative changes in the history of the
electricity sector. This lawwas subsequently reenacted as the Indian Electricity
162 INDIA CONST. Seventh Schedule, List I contains entries which has the central government
has exclusive legislative power, List II has entries with only state government has the
power to make the law and List III contains entries where both the center and state are
empowered to make law.
163 supra note 131 M.P. Jain.
164 INDIA CONST. art. 254.
75
Act 1910 (hereinafter the 1910 Act). This legislation was made applicable to
the whole of India and had an overriding effect on other provincial legislation.
The 1910 Act created a basic framework for laying down wires and other
works relating to the supply of electricity. It also provided for private licensees
for the supply of electricity in a specified area165.
Major significant year in the history of the electricity sector is 1948. The
Electricity (Supply) Act 1948 which regulated distribution and supply of
electricity before the 2003 Act came into existence. In 1948 the State Electricity
boards were created through The Electricity (Supply) Act 1948. The State
Electricity boards had a mandate of rapid electrification of rural India. They
utilized The Five Year Plans and the fund allotted under those five-year plans for
electrification and creation of the basic structure in rural India.
The general duties of the State Electricity Boards (SEB) include to arrange for
the transmission and supply of electricity within the state, control generation
distribution and utilization of electricity within the state, collect the data
regarding generation, supply and demand166. The SEBs also exercised such
other functions to carry out the powers and duties provided under the 1948
Act. Those other functions include regulatory and safety measures167. The
safety and security of the people were given paramount importance, and the
court have mentioned it has to be addressed by the government rather than
leaving for the court to recommend168.
Due to excessive politicizing of electricity tariff and resource allocation, the
State Electricity boards went into deteriorating condition. This deterioration
has stopped the development of the sector and eventually hindering the
development of the nation as a whole. Liberalization and globalization have
165 Anjali Bhide & Carlos Rodríguez Monroy, Energy poverty: A special focus on energy
poverty in India and renewable energy technologies, 15 Renew. Sustain. Energy Rev.
1057–1066 (2011), https://www.sciencedirect.com/science/article/pii/S1364032110004132
(last visited Jun 13, 2018).
166 The Electricity (Supply) Act, 1948 [Repealed], Sec. 18
167 The Delegated Legislation Provisions (Amendment) Act, 1983 (20 of 1983).
168 G. Sundarrajan Vs. Union of India and Others, Supreme Court, legalcrystal.com/954206
76
boosted the economic activities and demand for more electricity. However, this
state electricity boards incapable of catering to the growing demand.
Understanding the situation the central government initiated dialogue with
industry to bring reforms in the electricity sector. Meanwhile few States such as
Orissa Haryana Andhra Pradesh Karnataka Rajasthan and UP have initiated
reforms on their own.
The Electricity Act 2003 replaced the Indian Electricity Act 1910 and The
Electricity (Supply) Act 1948. The act of 2003 has brought in a Paradigm
shift in the electricity sector in India. The act allowed private participation in
the sector and liberalized electricity generation. Section 185 of the 2003 Act
has specifically repealed the Electricity (Supply) Act, 1948 (54 of 1948), and
the provisions of the Indian Electricity Act, 1910 (9 of 1910), and the
Electricity Regulatory Commissions Act, 1998 (14 of 1998).
Private participation in the electricity sector was brought initially with an
amendment to the 1948 legislation in the year 1991. The government brought
in the significant change of privatization and liberalization in the sector
through government notifications which was later incorporatedcomprehensively
under the Electricity Act 2003.
To meet the growing need for power demand, the government required more
investments, advanced infrastructure, and greater coverage. The samewould
not have been possible without channeling private investment into the sector.
The Electricity Act 2003 established a regulatory mechanism to Cater to the
industry where private players are willing to invest169.
The electricity act 2003 ended the Monopoly of State Electricity boards buy
unbundling those entities into three different companies undertaking the three
different roles of power generation, transmission, and distribution.
169 Gisèle Schmid, The development of renewable energy power in India: Which policies have
been effective?, 45 Energy Policy 317–326 (2012), https://www.sciencedirect.com/science/
article/pii/S0301421512001565#s0055 (last visited Jun 13, 2018).
77
With a growing need of encouraging private sector participation in generation,
Transmission and distribution the government created regulatory commissions
to regulate the sector and fix electricity tariff through establishing regulatory
commissions with the enactment of the electricity regulatory commissions act,
1998.
The role of electricity as the central factor for industrialization and modern
living standards made it to the top priorities of the governments across the
developing countries. During the post independent era, the government was
the only capable entity to mobilize substantial human and financial capital to
establish a nationwide electric grid. Various international development
agencies like the World Bank also supported the state-led development
approach in the post-world war period170.
The oil shocks of the 1970s have fueled the reforms in the electricity sector.
The neoliberal political ideologies resulted in the deregulation, privatization,
free trade, and unrestricted capital movement in the energy sector as well171. It
was the 1990s the nation had witnessed economy-wide liberalizations
supported by the international financial institutions of IMF and World Bank
that have removed all the barriers for the reform172.
3.2.11.1 Evolution of the Electricity Act 2003
Electricity Act 2003 repudiated all the previous legislation and promised to
create a future meeting the demands of the time and came into force on 10th
June 2003. The journey of the 2003 Act began with the introduction of the
electricity bill, 2001 on 30th August 2001. The believers subsequently referred
to the standing committee on energy. This standing committee submitted its
170 James H. Williams & Navroz K. Dubash, Asian Electricity Reform in Historical
Perspective, 77(3) PACIFIC AFFAIRS 412, 411–36, https://www.jstor.org/stable/ 40022909
(last visited Nov 23, 2018).
171 Id 420.
172 John Cubbin & Jon Stern, The Impact of Regulatory Governance and Privatization on
Electricity Industry Generation Capacity in Developing Economies, 20 WORLD BANK
ECON. REV. 115–141 (2006), https://academic.oup.com/wber/article/20/1/115/1680456
(last visited Nov 23, 2018).
78
report on 19th December 2002. The Loksabha passed electricity bill 2001
along with amendments suggested by the standing committee on 9th April
2003173. Repeal for subsequently passed by Rajya Sabha on 5th May 2003. It
has got the assent of the president on 26th May 2003 and was notified in the
Gazette of India on 2nd June 2003. All the provisions of the act except section 121
came into force with effect from 10th June 2003. Section 121 of the earth bikini
effective from 27th January 2004 along with the amended provisions of the act
which was executed by electricity Amendment Act 2003 was further amended in
the year 2007, and an amendment bill was introduced in the parliament in 2014.
3.2.11.2 The Structure of the Act
The Act of 2003 has 18 Parts and one schedule. The first part (Part I) deals
with preliminary aspects; Part II covers the national electricity policy and plan.
Part III contains provisions concerning the generation of electricity. The
provisions related to licensing have been provided in Part IV. There are
provisions to deal with theft of electricity prescribing penalties. The schedule
contains enactment of the States which have been saved from repeal with
specific qualifications. The Central Regulatory Commission has been
empowered to constitute an advisory committee for any part of the territory to
which the Act extends174.
The State Regulatory Commission can constitute an advisory committee for a
whole State or any part thereof. The Act provides for the constitution of a
Central Electricity Authority consisting of members nominated by the Central
Government. The Central Government makes rules for the purpose of
regulation of the generation, transmission and use of energy and generally to
carry out the purposes and objects of the Act. In the discharge of their
function, the Central Government, as well as State Regulatory Commission,
shall be guided by the National Electricity Policy, National Electricity Plan
and Tariff Policy published under Sec. 3 of the Act. The Act also enjoins that
173 ALOK KUMAR & SUSHANTA K. CHATTERJEE, ELECTRICITY SECTOR IN INDIA: POLICY AND
REGULATION (2012), https://books.google.co.in/books?id=PpEqViahEpEC.
174 supra note 122 ELECTRICITY ACT.
79
the State Electricity Boards will function as State Transmission Utilities175.
The Act also provides that the Indian Electricity Rules, 1956 shall continue to
be in force till alternative regulations under Sec. 53 of the Act are made.
3.2.12 THE BALANCING OF INTERESTS
The Supreme Court of India in its judgment on Essar oil Limited v Halar Utkarsh
Samiti and Others176 stated that the aim of the Stockholm declaration is ‘to
balance economic and social needs on the one hand with environmental
considerations on the other.’ In Indian Council for Enviro-Legal Action v. Union
of India The Supreme Court177, the court has stated about the requirement of
having the equilibrium and balance in development and environment as:
While economic development should not be allowed to take place at the
cost of ecology or by causing widespread environmental destruction and
violation; at the same time, the necessity to preserve ecology and
environment should not hamper economic and other developments. Both
development and environment must go hand in hand, in other words, there
should not be developed at the cost of environment and vice versa, but
there should be development while taking, due care and ensuring the
protection of the environment.
3.3 THE ELECTRICITY ACT 2003
Electricity Act 2003 is the legislation with the mandate of electrifying the
nation. The preamble178 to the Act reads as follows:
An Act to consolidate the laws relating to generation, transmission,
distribution, trading and use of electricity and generally for taking
175 S. K. CHATTERJEE, S.K. CHATTERJEE'S COMMENTARY ON ELECTRICITY LAWS OF INDIA:
THE ELECTRICITY ACT, 2003, AN INSIGHT WITH THE ELECTRICITY RULES, 2005
ALONGWITH THE ELECTRICITY (AMENDMENT) ACT, 2007, ALLIED RULES, REGULATIONS,
ORDERS, NOTIFICATIONS, RESOLUTION AND NATIONAL ELECTRICITY POLICY, TARIFF
POLICY & STATE REFORMS (2010).
176 MANU/SC/0037/2004 (India Supreme Court 2004)
177 1996 AIR 1446, 1996 SCC (3) 212
178 PREAMBLE, ELECTRICITY ACT 2003
80
measures conducive to development of electricity industry, promoting
competition therein, protecting interest of consumers and supply of
electricity to all areas, rationalisation of electricity tariff, ensuring
transparent policies regarding subsidies, promotion of efficient and
environmentally benign policies, constitution of Central Electricity
Authority, Regulatory Commissions and establishment of Appellate
Tribunal and for matters connected therewith or incidental thereto.
The preamble suggest that the Act has the objective of consolidating all the
legislation governing the sector and also to establish independent regulatory
and adjudicating agencies. The Act also aims to enable the government to take
measures for the ‘development of the electricity industry’ and ‘promote
competition.’ The Act also responds to the ground realities of energy poverty
and is also for ensuring ‘supply of electricity of all areas.’ The environmental
externalities are also taken into consideration in the preamble itself and thus
has stated to promote ‘efficient and environmentally benign policies.’
In GMR Energy Ltd v Government of Karnataka179, The state government has
directed the petitioners to operate and maintain generating stations owned by
them to supply electricity to the state grid to meet the “extraordinary
circumstances” of “severe scarcity of electricity” falling under section 11 of
the Act. The order and the power of the government to issue such an order was
challenged by the petitioners. It was held that to ensure the availability of
power and to address the scarcity of electricity the government has the
authority to issue such a direction to private investors under the broad mandate
of the comprehensively devised Electricity Act 2003.
Though the appellate tribunal has decided in favour of the state government, it
is vital that the Electricity Act 2003 shall have clear legislative provisions to
address similar situations which may arise in other states as well. The Act
shall be amended to mean “extraordinary circumstances” under section 11 to
179 MANU KA 0200 2010
81
include “severe scarcity of electricity” or add a new provision to enable the
relevant authorities and agencies to meet the scarcity of electricity situations.
Even though the preamble of the Act has very clearly laid down the spirit of
the legislation to promote the environmentally benign sources of electricity,
the state boards and regulatory commissions have overlooked the noble
intentions of the legislature at times by creating unfavourable business
conditions for the renewable energy developers180. In Chhattisgarh Biomass
Energy Developers Association and Ors. v. Chhattisgarh State Electricity
Regulatory Commission181, The APTEL has rightly pointed out that while 3
percent of the electricity input being the reasonable wheeling and transmission
charges for a biomass plant, the decision of the Chhattisgarh Electricity
Regulatory Commission, to levy 6 per cent has defeated the spirit of the
legislation. It was also observed by the tribunal that the regulatory commission
has to exercise its powers when the PPAs are one-sided and not in conformity
with the guidelines of the MNES (now MNRE).
3.3.1 REGULATORY FRAMEWORK FOR ELECTRICITY SECTOR
The Regulatory Mechanism for electricity sector in India is a combination of
central and state government legislations, policies and agencies. The
institutional framework is detailed out here in the following paragraph of this
chapter.
3.3.1.1 The Institutional Regulatory Mechanism
The regulatory mechanism for electricity exists both at the central as well as
the state level. There are various institutional and regulatory framework
created under the 2003 Act which are carrying out various duties and exercise
the regulatory powers. The authorities forming part of this structure consist of
the following:
180 Chhattisgarh Biomass Energy Developers Association and Ors. vs. Chhattisgarh State
Electricity Regulatory Commission, (07.09.2006 - APTEL) : MANU/ET/0041/2006
181 Chhattisgarh Biomass Energy Developers Association and Ors. vs. Chhattisgarh State
Electricity Regulatory Commission, (07.09.2006 - APTEL) : MANU/ET/0041/2006
82
3.3.1.2 Ministry of Power
The Ministry of Power is the apex body regulating the electricity sector. Ministry
of Power became an independent ministry from 2ndJuly 1992. The ministry was
earlier known as the Ministry of Energy Sources. Ministry of Power is primarily
responsible for the development of electrical energy in India182.
The Ministry is bestowed with the primary responsibility of creating policy in
the field of electricity. The roles and responsibilities of the Ministry of Power
are183:
1. General Policy in the electric power sector and issues relating to energy
policy and coordination thereof. (Details of short, medium and long-term
policies in terms of formulation, acceptance, implementation and review
of such policies, cutting across sectors, fuels, regions and intra-country
and inter-country flows
2. All matters relating to hydro-electric power (except small/mini/micro
hydel projects of and below 25 MW capacity) and thermal power and
transmission & distribution system network;
3. Research, development and technical assistance relating to hydro-
electric and thermal power, transmission system network and
distribution systems in the States/UTs;
4. Administration of the Electricity Act, 2003, (36 of 2003), the Energy
Conservation Act, 2001 (52 of 2001), the Damodar Valley Corporation
Act, 1948 (14 of 1948) and Bhakra Beas Management Board as provided
in the Punjab Reorganisation Act, 1966 (31 of 1966).
5. All matters relating to Central Electricity Authority, Central Electricity
Board and Central Electricity Regulatory Commission;
(a) Rural Electrification;
182 GOVERNMENT OF INDIA, MINISTRY OF POWER, available at https://powermin.nic.in/
183 MINISTRY OF POWER, RESPONSIBILITIES, available at
https://powermin.nic.in/en/content/responsibilities
83
(b) Power schemes and issues relating to power supply/ development
schemes/ programmes/ decentralized and distributed generation in
the States and Union Territories;
6. Matters relating to the following Undertakings/Organizations:-
(a) The Damodar Valley Corporation (DVC)
The Damodar Valley Corporation was created in the year 1948
pursuant the recommendations made by the inquiry committee
appointed after the 1947 floods. The corporation is bestowed with
the responsibility of developing suitable measures for controlling
the wild and erratic Damodar river in the states of Bihar (now
Jharkhand and West Bengal)
(b) The Bhakra Beas Management Board (BBMB)
Pursuant to the Indus water treaty between India and Pakistan the
waters of Sutlej, Beas and Ravi were allotted exclusively for India.
Bhakra Management Board came into existence under section 79 of
the Punjab Reorganisation Act, 1966. This was named as Bhakra
and Beas Management Board in 1976 with the transfer of the Beas
project on completion184.
(c) National Thermal Power Corporation Limited (NTPC)
National Thermal Power Corporation (NTPC) is the largest power
utility in India185. The corporation aims to become a 130 GW
company by 2032. India depends the corporation to provide
majority of its electricity produced in the country through thermal
power corporation.
184 BHAKRA BEAS MANAGEMENT BOARD FORMATION OF BBMB (2020) available at:
https://bbmb.gov.in/formation-of-bbmb.htm (last accessed 1 Mar. 2020).
185 N.T.P.C., ABOUT US (2020) available at: https://www.ntpc.co.in/en/about-us (last accessed
1 Mar. 2020).
84
(d) National Hydro-electric Power Corporation Limited;
National Hydro-electric Power Corporation (NHPC) is mandated
with the development of Hydro Power throughout India. It has
achieved the status of miniratna in the year 2008186.
(e) Rural Electrification Corporation Limited (REC)
REC is a Navaratna company under the Ministry of Power. Rural
electrification is considered as utmost exigency in India where large
number of populations depend on agriculture. Rural electrification has
played a key role in Indias food security by making agricultural
irrigation independent of monsoons187. The rural electrification has
helped farmers to install water pumps in the fields with lesser
operating costs.
(f) North Eastern Electric Power Corporation Limited (NEEPC)
North Eastern Electric Power Corporation Limited is the largest
power utility in the north eastern region of India operating since
1976. This is the only corporation in India which own and operate
both thermal and hydro power188.
(g) Power Grid Corporation of India Limited (PGCI)
Power Grid Corporation of India Limited is a Maharatna company
under the ministry of Power. It is the Central Transmission Utility
(CTU) of India and is also the largest Electric Power Transmission
Utility of the country. The corporation is a Listed Company since
2007.
186 Id.
187 R.E.C., CORPORATE PROFILE (2020) available at: https://www.recindia.nic.in/corporate-
profile (last accessed 1 Mar. 2020).
188 NORTH EASTERN ELECTRIC POWER CORPORATION LIMITED, COMPANY PROFILE (2020)
available at: https://neepco.co.in/about-us/company-profile (last accessed: 1 March 2020).
85
(h) Power Finance Corporation Limited (PFC)
Power Finance Corporation is a Navaratna Central Public Sector
Enterprice since June 2007. With the mandate to play a key role in
the infrastructure financing in the power sector, it is the largest
NBFC in India. It is the Nodal Agency for development of
integrated power development scheme, ultra-mega power projects,
and independent transmission projects189.
(i) Tehri Hydro Development Corporation (THDC)
THDC is a joint venture between Govt. of India and Govt. of Uttar
Pradesh with administrative control under the ministry of Power,
Government of India. It is registered as a company under the
Companies Act 1956. The sole objective of the company is to develop,
operate and maintain the 2400 MW Tehri Hydro Electric Project190.
(j) National Power Training Institute (NPTI)
This is the national apex body for training and human resources
development in power sector. More than three lakh professionals
have completed training from the institute191.
(k) Bureau of Energy Efficiency (BEE)
Bureau of Energy Efficiency came into being on 1st March 2002
under the provisions of the Energy Conservation Act 2001. The
Energy Conservation Act is aimed at improving energy efficiency
standards in India. BEE is the empowered agency to look after the
energy efficiency measures in India192.
189 POWER FINANCE CORPORATION, PROFILE available at:
https://www.pfcindia.com/Home/VS/4 (last accessed: 1 March 2020).
190 THDC INDIA LTD, ABOUT US (2020) available at: https://www.thdc.co.in/ (last accessed: 1
March 2020).
191 NPTI, ABOUT NPTI, available at https://npti.gov.in/about-npti (last accessed: 1 March
2020).
192 BUREAU OF ENERGY EFFICIENCY, ABOUT BEE (2020) available at:
https://beeindia.gov.in/content/about-bee (last accessed: 1 March 2020).
86
7. All matters concerning energy conservation and energy efficiency
pertaining to Power Sector.
The Ministry of Power carryout its functions with the assistance of the
following constituent bodies namely193.
1) Investment Promotion Cell;
2) Administration and Hydroelectric Power;
3) Planning, Co-ordination & Energy Management;
4) Thermal;
8. Systems and External Assistance; and Finance
3.3.1.3 Statutory Bodies
There are various statutory bodies that have been created under the Electricity
Act 2003194. These authorities carry out various functions and duties bestowed
on them. The regulatory experience will be the compound effect of the
activities of these regulatory and administrative bodies.
a) Central Electricity Authority
b) The State Electricity Boards
c) Central Electricity Regulatory Commission
d) Electricity Regulatory Commissions of the State
e) Appellate Tribunal for Electricity.
3.3.1.3.1 Central Electricity Authority (CEA)
The Central Electricity Authority (CEA) was established under section 3 of
the Electricity (Supply) Act 1948195. Section 70 of the Electricity Act 2003
provides for the continuation of the authority under the new regime of the
Electricity Act 2003. It also provides for the constitution and functions of the
193 MINISTRY OF POWER, UNIT WISE WORK ALLOCATION, https://powermin.nic.in/en/ content/unit-
wise-work-allocation-ministry-power-0
194 See Sections 70, 76, 80 and 82 of the Electricity Act 2003.
195 Act 54 of 1948
87
authority196. The CEA is primarily responsible for planning and creation of
national power policy on behalf of the Central Government. It advises the
Ministry of Power on technical and economic matters directly related to the
control and management national power resources. Since regulatory powers
with respect to hydro generating station vest in the CEA, it governs the entry
of new hydro generating stations to all major projects. It sets safety standards
and carries out overall technical regulation.
The Chairman of the CEA is the ex-officio secretary to the government of
India, and six full-time members of the rank of additional secretary to the
government of India representing thermal, hydro, economic and commercial,
power systems, planning and grid operation and distribution. It is important to
note that there is no member designated for the renewable energy in the
highest electricity authority, while there are members for thermal and hydro.
The CEA prepares and notifies the National Electricity Plan in accordance
with the National Electricity Policy in every five years. According to the
Section 73 of the Electricity Act 2003197, the CEA has the following functions
to perform.
i) Advise the Central Government on formulation of national electricity
policy, development of the electricity sector through coordination of
planning agencies with the objective of providing reliable and
affordable electricity to the nation.
ii) CEA specifies the technical standards for electrical plants and
transmission lines and grid connectivity.
iii) The safety standards are specified by the CEA for construction,
operation and maintenance of power plants
iv) Specifies the standards for transmission lines’ operation and
maintenance for grid connectivity.
196 See Sec 73, Electricity Act 2003
197 See Sec 73, Electricity Act 2003
88
v) CEA specifies the conditions for installation of meters for transmission
and supply of electricity
vi) Promote and assist the promotion and augmentation of the electricity
system
vii) Skill development of personnel
viii) Advice the central government on any matters related to the electricity
sector
ix) Data collection and monitoring the sector regularly to improve
conditions relating to cost, efficiency and completion in the sector.
x) Promote research and development of all matters relating to the sector
xi) Carry out or cause to carry out investigations on any of the matters
relating to generation, transmission and distribution of electricity.
xii) Advice the state governments or other licensees or generating
companies on matters regarding the operation of the systems under
their ownership.
xiii) Advice governments and regulatory commissions on technical matters
of the sector.
xiv) Any other function as may be provided under the Electricity Act 2003.
It can be observed that the functions does not reflect the requirements for
promoting sustainable and clean energy for India. It also does not mention the
requirement of the authority to coordinate with the agencies under MNRE.
3.3.1.3.2 State Electricity Boards (SEB)
The State Electricity Boards were constituted by the State Governments in the
exercise of powers under the Electricity (Supply) Act, 1948198. Section 12
states that the Board shall bea body corporate having perpetual succession and
a common seal. The board like any other corporate entity was entitled to hold
movable and immovable property in its name and can sue and be sued in its
198 Sec.5 The Electricity (Supply) Act [Repealed]1948 Act No.54 of 1948
89
own name199. The SEBs have regulatory functions such as the grant of
licenses, fixing of terms and conditions, revocation of licenses, etc.
SEBs along with State Governments exercised recommendatory powers
regarding. The clearance for captive generating units that require the approval
of the Central Electricity Board. The State Electricity Board in coordination
with Generating Companies arranged the supply, transmission, and
distribution to areas where it was deficient in power. The unbundling was
aimed at achieving the objectives200 of arm’s length relation between the state
government and the utilities with a view to bring transparency and create
space for commericalisation.
According to section 131 of the Electricity Act 2003, the state government
shall prepare a scheme of transfer and publish in the official gazette for the
transfer of the assets and liabilities of the state electricity boards. Such assets
will be vested in the respective state governments and the state governments
shall create and transfer the assets to separate generation transmission and
distribution companies. The unbundling is expected to achieve operational
transparency and arm’s length relation between state governments and the
utilities.
SEBs also exercised powers in relation to control over generation and
distribution operations. The members, officers and other employees of the
board were deemed as public servants under the 1948 Act, while acting in
pursuance of the provisions of that legislation201. The interesting question of
whether the officials of the corporations carved out of the SEBs continue to be
public servants, even after the coming into the force of the Electricity Act,
2003 or not came up in V. Srinivasan Vs. Secretary to Tamil Nadu Generation
199 Sec. 12 The Electricity (Supply) Act [Repealed]1948 Act No.54 of 1948
200 SHEOLI PARGAL, KRISTY MAYER, GOVERNANCE OF INDIAN STATE POWER UTILITIES: AN
ONGOING JOURNEY 11 (2014).
201 V.Srinivasan Vs. Secretary to Tamil Nadu Generation and Distribution Corpn,
legalcrystal.com/965220 https://www.legalcrystal.com/case/965220/v-srinivasan-vs-
generation-distribution
90
and Distribution Corpn202. After considering the definition of the term “public
servant” under section 21 of the Indian Penal Code203 and section 2(c) of the
Prevention of Corruption Act, 1988204 and section 169 of the 2003 Act, the
court has observed the striking departure the 2003 Act has made from the
1948 Act by not including the officers of the new corporations within the
purview of the definition under the 2003 Act.
The High Court of Chennai has held in this case that an employee of the
electricity corporation which is falling within the definition of Government
Company under section 617 of the Companies Act 1956205, shall be deemed to
be a public servant for the purpose of any corruption charges. For other
purposes and offences the 2003 Act has clearly defined the term public servant
which include the chairperson, members, officers and other employees of the
Appellate Tribunal and appropriate commission, secretary of appropriate
commission and assessing officer while acting or purporting to act in
pursuance of the provisions of the 2003 Act within the meaning of section 21
of the Indian Penal Code, 1860.
The Philosophy behind the legislations are hidden in the mere fact that under
the 1948 Act the officers were deemed as the public servant whereas under the
2003 Act the officers of the new corporations carved out of SEBs do not enjoy
that status. Thus, the government wanted to make the new corporations as just
like any other private entity and wanted to keep it open for competition. This
also reflects the fact how the government is now approaching the electricity
supply. The government has moved the electricity supply as a sovereign
function to a commercial activity. Thus, the new Electricity Act 2003 has
cleared the air for a level playing field for private investors. But the officers
are not immune to any corruption charges.
202 Id.
203 No 45, Acts of Parliament 1860
204 No.49, Acts of Parliament 1988
205 No. 1, Acts of Parliament 1956
91
3.3.1.3.3 Central Electricity Regulatory Commission
The Central Electricity Regulatory Commission (CERC) was initially constituted
on 24th July 1998 pursuant to the Electricity Regulatory Commissions Act,
1998206 (hereinafter the 1998 Act). The central commission along with various
State Electricity Regulatory Commissions (SERC) were established with the
objective of rationalization of electricity tariff, transparency in subsidies,
promotion of policies which are focused on efficiency and environment
friendliness. The statements of objects and reasons given in the 1998 Act
suggest that the deepening problem of the electricity sector due to the
increased demand and shortage of supply can be addressed through the
creation of an independent regulator. The independent regulator will be
helpful to attract more private investments into the sector.
The Electricity Act 2003 has repealed the 1998 Act vide section 185, but
allowed the electricity commissions to continue under the Act, as a body
corporate with perpetual succession207. The primary functions of the Central
Commission are:
a) To regulate the tariff of generating companies owned or controlled
by the Central Government
b) To regulate the tariff of generating companies other than those
owned or controlled by the Central Government, if such generating
companies enter into or otherwise have a composite scheme for
generation and sale of electricity in more than one State
c) To regulate the inter-State transmission of electricity including the
tariff of the transmission utilities
d) To regulate the inter-State trading of electricity and to aid and advise
the Central Government in the formulation of National Electricity
Policy and Tariff Policy.
206 No. 14, Acts of Parliament 1998
207 Sec 76, The Electricity Act, 2003, No. 36, Acts of Parliament 2003
92
The Electricity Act 2003 has been acknowledged scholars as a significant
revolutionary step in the Indian electricity market. It has liberalized the
power market. The role of the Central Electricity Regulatory Commission
(CERC)208.
The CERC endeavours to improve the electricity transmission systems
through mechanisms like Availability Based Tariff (ABT) and Indian
Electricity Grid Code (IEGC). It also facilitate open access in interstate
transmission and interstate trading. Other major role CERC play in the
electricity market is to advise the central and state governments regarding the
entry and exit of market players and removal of barriers to entry and exit209.
3.3.1.3.4 State Electricity Regulatory Commission (SERC)
The State Governments are empowered to establish an Electricity Regulatory
Commission of State as a body corporate with perpetual succession. These
Commissions have been allowed to continue under the Electricity Act, 2003.
The Regulatory Commissions have been set up in more than 20 States and is
expected that other States will follow suit. The primary functions of the SERC
are:
a) To determine the tariff for electricity, wholesale, bulk, retail
b) To determine the tariff payable for use by the transmission facilities
c) To regulate the power purchase and procurement process of distribution
licensees
d) To promote competition, efficiency, and economy in the activities of
the electricity industries and discharge such other functions assigned
to the State Electricity Regulatory Commissions under the Electricity
Act, 2003.
208 DLA Piper, RENEWABLE ENERGY IN THE ASIA PACIFIC: A LEGAL OVERVIEW (3rd ed.
2014).
209 CENTRAL ELECTRICITY REGULATORY COMMISSION, MISSION,
http://www.cercind.gov.in/Mission.html (last visited Nov 26, 2018).
93
3.3.1.3.5 Appellate Tribunal for Electricity
The Appellate Tribunal for Electricity (APTEL) was established vide section
110 of the Electricity Act 2003. The tribunal is authorized to hear appeals
against the orders of the adjudicating officer or the appropriate commission
under the Act, 2003. A bench of the APTEL may consist of minimum two
members with at least one judicial member and one technical member each210.
The Chairperson of the APTEL shall be a Judge of the Supreme Court or
Chief Justice of a high court. The Judicial member of the APTEL shall be a
judge of the High Court or qualified to be one. Technical member shall be a
person who has been a Secretary for at least one year dealing with economic
and infrastructure matters in any of the department or ministry of central
government211.
The critical question of whether CERC can cap trading margins through
regulation was raised in Ptc India Ltd. Vs. Central Electricity Regulatory
Commission Thr. Secy.212 It also raised other vital issues such as whether the
APTEL has the jurisdiction to examine the validity of Central Electricity
Regulatory Commission (Fixation of Trading Margin) Regulations, 2006
(2006 Regulation) and whether the APTEL has the power of judicial review
under section 121 of the 2003 Act.
On the issue of judicial review of 2006 regulations by APTEL, the Supreme
Court held that the tribunal cannot exercise any power of judicial review of the
2006 regulations under section 121 of the Electricity Act 2003.
The supreme court of India in Ptc India Ltd. Vs. Central Electricity Regulatory
Commission Thr. Secy.,213 observed that the powers of the central commission
to make regulations provided under section 178 of the 2003 Act is broader in
scope than the regulatory functions enlisted under section 79 (1) of the Act.
210 Sec 112 (b), Electricity Act 2003
211 Sec 113 (b), Electricity Act 2003
212 Ptc India Ltd. Vs. Central Electricity Regulatory Commission Thr. Secy,
https://www.legalcrystal.com/case/842307/ptc-india-ltd-vs-electricity-regulatory
213 Id.
94
The regulations are placed before the parliament and is a subordinate
legislation while the duties under section 79 is discharged by orders. A
regulation under section 178 is part of the regulatory framework and can
override existing contracts between regulated entities. Section 178 gives
authority of delegated legislation and its validity can be tested only by a
judicial review by the court under Art.226 and not by the tribunal. Supreme
Court has further stated that section 121 of the 2003 Act does not confer the
powers of judicial review on the APTEL. The APTEL has the jurisdiction to
hear matters regarding a dispute arising out of the adjudication or
interpretation of a regulation made under section 178 through an appeal
preferred before it. But it cannot review the validity of the regulation itself.
3.3.2 REGULATORY FRAMEWORK FOR RENEWABLE ENERGY
UNDER ELECTRICITY ACT 2003
The Electricity Act 2003 provides for regulatory interventions for the
promotion of renewable energy (RE) sources. It has adopted a regulatory
mechanism which can cater for the needs of a new technology or energy
solution. The regulatory measures and administrative mechanisms envisaged
in the 2003 Act generally applies for all types of electricity sources. In
addition to the general provisions and measures, the 2003 Act has provided for
special treatment to RE through:
a) Determination of tariff;
b) Specifying renewable purchase obligation (RPO);
c) Facilitating grid connectivity; and
d) Promotion of development of the market.
3.3.2.1 Electricity Act 2003 and the Renewable Energy
There are various provisions in the Electricity Act 2003 which directly or
indirectly promotes the development of the renewable electricity sector. All
those provisions and its pros and cons from the perspective of the renewable
energy investment is discussed in the following paragraphs.
95
3.3.2.1.1 National Electricity Policy and Tariff Policy, Sections 3(1)
Section 3 (1) of the Electricity Act 2003214 provides that the central
government shall prepare a National Electricity Policy and Tariff Policy in
consultation with the Central Electricity Authority and state governments. The
government is also mandated to ensure the optimal utilization of resources
including renewable sources while making such policy. The central
government shall also revise the policy from time to time. The Central
Electricity Authority shall prepare a National Electricity Plan for the
implementation of the national electricity policy.
In Transmission Corporation of A.P. Vs. Andhra Pradesh State Electricity215,
the second who is a private electricity generating company applied to the
Andhra Pradesh State Electricity Regulatory Commission (APSERC) for sale
of surplus electricity due to reduced consumption from the captive facility to
the state utility, by way of an enhancement in supply under the already
existing power purchase agreement. Also, there existed an order by the
commission that directed that the power surplus shall be supplied to state
transmission utility or DISCOMs only216. The transmission utility, the first
appellant, prayed to the commission not to order an increase in the purchase
from the respondent.
The second respondent who have established a 6MW biomass cogeneration
plant in pursuance of the policy of government of India and policy of the state
government of Andhra Pradesh with the objective of selling the surplus in the
market. These policies encouraged the private investments in renewable
energy.
The order of the commission stating that the surplus energy shall be supplied
to the state utility and the unwillingness of the state utility to purchase the
214 Sec 3, National Electricity Policy and Plan
215 Transmission Corporation of A.P. Vs. Andhra Pradesh State Electricity,
www.legalcrystal.com/case/52551/transmission-corporation-p-vs-pradesh-electricity
216 APSERC order dated 20th June, 2001 in O.P. 1075/2000
96
surplus has created an unfavourable market condition for the renewable energy
developer. The commission’s order has created barriers to sell electricity
under open access and is against the spirits of the 2003 Act and National
Electricity Policy.
The APTEL has held that if the power purchase agreements which are one-sided
and are not in consonance with the policy guidelines for the promotion of the
renewable energy, it is the duty of the appropriate commission to invoke section
86 (1) (e)217 of the Electricity Act 2003 and make necessary amendments in the
power purchase agreements. The commission shall ensure that such amendments
would help sustain the operational stability of the renewable energy projects and
are in conformity with section 86 (1)(e) and section 61 (h) of the 2003 Act.
In Citizen Forum Through Its Secretary Shri Rajiv S/O Gajanan Jagtap, Vs. State
of Maharashtra Through Its Secretary, Department of Energy (Excluding Non-
conventional Energy) and ors218., the High Court of Bombay has observed that
appointment of distribution franchisee in pursuance of the 2003 Act and National
Electricity policy to promote private participation is valid.
The above-stated cases clearly suggest that the market is still not entirely
ready for the competition and the authorities also in some cases not taking
necessary steps to implement the pure spirits and objectives of the 2003 Act.
3.3.2.1.2 National Policy for Stand-alone Systems, Section 4
Section 4219 states that “the Central Government shall, after consultation with
the state governments, prepare and notify a national policy, permitting stand-
217 Sec 86 (1) Functions of State Commission:….(e)promote cogeneration and generation of
electricity from renewable sources of energy by providing suitable measures for
connectivity with the grid and sale of electricity to any person, and also specify, for
purchase of electricity from such sources, a percentage of the total consumption of
electricity in the area of a distribution licensee;
218 (2008)110BOMLR598; 2008LC(BOM)309, legalcrystal.com/341215 available at
https://www.legalcrystal.com/case/341215/citizen-forum-secretary-shri-rajiv-s-o-gajanan-
jagtap-vs-maharashtra-conventional
219 Sec 4, Electricity Act 2003
97
alone systems (including those based on renewable sources of energy and
other non-conventional sources of energy) for rural areas.”
In T. Bhuvaneswariv. District Collector Cum District Magistrate of Erode
Dist.220, the Chennai High Court has held that the use of the land for erecting
towers or poles or drawing lines above it does not amount to acquisition of
land and therefore the landowner is entitled for compensation only to the
extent of usage of the land by the licensee.
In R. Santhana Raj vs The Chief Engineer, the grievance of the petitioner was
that the respondent has decided to establish a storage wind farm substation and
have made preparations to erect high tension wire linking towers on the lands
of petitioner. The petitioners contended on two grounds that is “(i) that the
consent of the petitioners as required by Section 12(2) of the Indian Electricity
Act, 1910, was not obtained; and (ii) that there is alternative land available in
the form of public roads, through which the high tension wires can be carried.”
The Madras High Court observed that, even if the prayer for mandamus was
allowed by the court, it is still open to the respondents to approach and get an
order under section 16 (1) of the Telegraph Act, 1885. If the district magistrate
exercise his discretion under the said provision, the power of judicial review is
limited over such exercise of discretion. On the other hand if the prayer is
refused, the petitioner can approach district magistrate under section 16 (3) of
the Telegraph Act, 1885 for sufficient compensation and under section 17 (1)
for requiring to remove or alter the line or post to the respondent or under 17
(2) to apply to the District Magistrate to direct the removal.
One of the significant challenges for the rural electrification is the building of
network lines for transmission which require to draw electric lines above the
lands of multiple owners inviting delay in due to many disputes being raised.
Section 4 of the 2003 Act provides for the creation of standalone systems
including for non-conventional and renewable systems. This is a motivational
220 T.Bhuvaneswari Vs. District Collector Cum District Magistrate of Erode Dist. ,
https://www.legalcrystal.com/case/1169286/t-bhuvaneswari-vs-collector-magistrate
98
factor for remote villages to adopt solar powered standalone power plants.
This also helps the government to avoid the delay and cost due to litigation in
rural electrification.
Promotion of cogeneration and generation of electricity from renewable
sources of energy Sections 61, 61(h) and 61(i)
Sections 221 61, 61(h) and 61(i) state that:
..the appropriate commission shall, subject to the provision of this Act,
specify the terms and conditions for the determination of tariff, and in
doing so, shall be guided by the following, namely:-
(h) the promotion of cogeneration and generation of electricity from
renewable sources of energy; and
(i) the National Electricity Policy and Tariff Policy.
Section 61 thus creates the framework for fixation of preferential tariff for
renewable and non-conventional energy sources. It is the duty of the
appropriate commission to adhere to the mandate of this provision and specify
the terms and conditions for determination of tariff taking into consideration
the promotion and sustainability of the renewable energy sources.
In Transmission Corporation of Andhra Pradesh Ltd. and Anr. Vs. Sai
Renewable Power Pvt. Ltd. and Ors.,222 the Andhra Pradesh Electricity
Regulatory Commission initiated suomotu proceedings for the determination
of tariff applicable to the non-conventional energy generation projects of
Andhra Pradesh which was to be applicable with effect from 1st April 2004.
The commission after hearing the parties fixed the energy purchase at base
unit price of ` 2.25 per kW has on 1st April 1994 and the escalation index of
5% p.a. noncompounded. This resulted in a base price of 3.37 per kWhas on
1st April 2004. It was also given that as these power projects has no or
221 Electricity Act 2003
222 Transmission Corporation of Andhra Pradesh Ltd. and anr. Vs. Sai Renewable Power Pvt.
Ltd. and ors., https://www.legalcrystal.com/case/842727/transmission-corporation-andhra-
pradesh-ltd-vs-renewable-power
99
minimal variable costs, the tariff will be frozen for a period of five years and
will be reviewed thereafter. It also restricted the sale, procurement and
distribution of electricity by the developers to only Transmission Corporation
of Andhra Pradesh Ltd (APTRANSCO). The order was confirmed again after
hearing a review before the commission.
Aggrieved by these orders, the developers filed appeal before the APTEL and
the tribunal has allowed the appeal in most of the contentions holding that
there is some amount of duress in the power purchase agreements executed
with the state transmission utility, APTRANSCO223.
One of the critical finding of the APTEL was that the APERC has neither the
power nor the jurisdiction to compel the developers to sell the power
generated by them to APTRANSCO224.
The Supreme Court held that Andhra Pradesh Electricity Regulatory
Commission225 has the jurisdiction to determine tariff which includes the
purchase price for procurement of the electricity generated by the non-
conventional energy developers. It further directed the state commission to fix
the tariff in accordance with law taking into consideration the particular
circumstances of the non-conventional energy developers. They were also
directed to re-examine whether it would be feasible to permit sale of generated
electricity to third parties, in the larger interest of the state and the public.
Even when the law is clear on the Renewable Energy Purchase Obligations
Section 86(1)(e)
Section 86(1)(e)226 mandates the state commissions to discharge the functions
of promotion of “cogeneration and generation of electricity from renewable
sources of energy by providing, suitable measures for connectivity with the
223 Id.
224 Id.
225 Constituted under sec of the Electricity Regulatory Commission Act 1998 and continuing
under sec of the Electricity Act 2003.
226 Electricity Act 2003
100
grid and sale of electricity to any person, and also specify, for purchase of
electricity from such sources, a percentage of the total consumption of
electricity in the area of a distribution license.”
The Tamil Nadu Solar Energy Policy, 2012 was challenged in Tamil Nadu
Electricity Consumers and trade Association (Represented by Its President)
and Another Vs. Tamil Nadu Electricity Regulatory Commission, Tidco and
Others227. The Tamil Nadu Electricity Regulatory Commission (TNERC)
notified the Renewable Energy Purchase Obligation Regulation 2010 making
it obligatory for entities under clause 86(1)(e) of the 2003 Act to purchase not
less than the specified minimum percentage of its consumption of energy from
renewable sources. The regulation was further amended in 2011 to prescribe
the minimum quantum of solar energy purchase within the minimum
renewable purchase obligation making it compulsory for the obligated entities
to meet both the targets. Accordingly, the obligated entities shall purchase not
less than 9% of the total annual consumption from the renewable energy
sources, of which 0.05% has to be procured from solar energy sources and the
remaining 8.95% shall be procured from non-solar renewable sources. In 2011
the commission had reduced the Solar Purchase Obligation (SPO) from 0.15%
to 0.05% due to the insufficient availability of solar energy.
In 2012 the government of Tamil Nadu brought into force the Tamil Nadu
Solar Energy Policy 2012 and issued policy directive to the TNERC under
section 108 of 2003 Act for necessary action. Pursuant to which the TNERC
issued its order notifying various procedures for administration of the scheme
and notified the obligated consumers. TNERC increased the solar obligation to
3% in 2013 and 6% in 2014 which would require 720 MW and 1500 MW
solar energy which was not existing in 2014. The definition of the obligated
consumer was also varied in the commission’s 2010 regulation and state
government regulation of 2012. The state government regulation stipulated
227 Tamil Nadu Electricity Consumersâandeuro;andtrade; Association (Represented by Its
President) and Another Vs. Tamil Nadu Electricity Regulatory Commission, Tidco and Others,
https://www.legalcrystal.com/case/1150172/tamil-nadu-electricity-consumers-andeuro-a
ndtrade-association-represented-president-vs-regulatory-commission
101
High Tension (HT) and Low (Tension) LT commercial consumers as the
obligated entities and did not include distribution licensees.
The appellants contended that the state commission has acted under the
mistaken belief that the state government directive is binding on them and did
not make any independent evaluation of the scheme before implementing.
Tamil Nadu Generation and Distribution Corporation Ltd. (TANGEDCO)
contended that the National Tariff Policy prescribed for solar specific RPO to
be increased to 3% by 2022. National Electricity Policy also provided for
adopting adequate promotional measures for a sustained growth of the
renewable energy sources. The state government directives are in line with the
national objective and the regulatory commission has the obligation and
responsibility to ensure that the regulatory measures also help attain these
objectives.
The following vital questions came for consideration:
i) Whether the policy directive issued by the State Government to the
State Commission under Section 108 of the Electricity Act, 2003
regarding the implementation of the Solar Policy was binding on the
State Commission?
ii) Whether the State Commission was correct in specifying the Solar
Purchase Obligation for the HT and LT Commercial category of
consumers of the distribution licensee in consonance with the State
Governments directive without considering its own Renewable
Purchase Obligation Regulations, 2010?
iii) Whether the impugned order regarding Solar Purchase Obligation
on some category of consumers of the distribution licensee is
discriminatory and is contrary to its Renewable Purchase Obligation
Regulations, 2010?
iv) Whether the State Commission could have stipulated the Solar
Purchase Obligation consequent upon the policy directive issued by
the State Commission u/s 108 independent of exercising the powers
102
vested with the State Commission under Section 86(1)(e) of the
2003 Act?
v) Whether the impugned order has been passed simply to implement
the directions of State Government u/s 108 without appreciating the
position of law and without application of mind?
The APTEL held that the state commission shall be guided by the directions of
the state government under section 108228 of the 2003 Act to discharge its
functions under the 2003 Act but not in a general way outside the functional
scope of the state commission. Thus state commission has no power to issue
an SPO order as per the directions of the State Government under section 108
in addition and contrary to the RPO obligations mandated in the 2010
regulation of the commission. The commission should not have created two
dispensation for RPO, one as per 2010 regulations under section 86 (1) (e)229
and the other under the policy directive of the state government under section
108.
The Supreme Court of India has held230 that the state commission is not bound
by any policy directions issued by the government under the 2003 Act if such
directions if such directions hamper the statutory functions of the commission.
The APTEL also has held231 that the State Commission is independent
statutory body. The policy directions by the State Government are not binding
on them and curtail the power of the State Commission in the matter of
determination of tariff.”
228 See Sec 108 Directions by State Government: (1) In the discharge of its functions, the
State Commission shall be guided by such directions in matters of policy involving public
interest as the Central Government may give to it in writing.
(2) If any question arises as to whether any such direction relates to a matter of policy
involving public interest, the decision of the State Government thereon shall be final.
229 See Sec 86(1)(e) (e) promote cogeneration and generation of electricity from renewable
sources of energy by providing suitable measures for connectivity with the grid and sale of
electricity to any person, and also specify, for purchase of electricity from such sources, a
percentage of the total consumption of electricity in the area of a distribution licensee;
230 APTRANSCO vs Sai Renewable Energy Pvt. Ltd.: (2011)11SCC34
231 Polyplex Corporation vs Uttrakhand Electricity Regulatory Commission in Appeal no.
41,42 and 43 of 2010
103
There multiple agencies responsible with the regulatory and policy
formulation for renewable energy and the lack of coordination and
understanding of the functions are raising various barriers in the development
of renewable energy.
3.3.3 RENEWABLE ENERGY AGENCIES
There Various Agencies mandated with the responsibility of transforming
India into a clean energy nation. At the helm of the affairs is the Ministry of
New and Renewable Energy (MNRE), flocked with strong support from
National Institute of Solar Energy (NISE), National Institute of Wind Energy
(NIWE), Indian Renewable Energy Development Agency (IREDA) and Solar
Energy Corporation of India (SECI).
3.3.3.1 Ministry of New and Renewable Energy
The Ministry of New and Renewable Energy (MNRE) is mandated to be the
nodal Ministry of the Government of India for matters in the domain of new
and renewable energy. The role of the ministry is to develop energy from new
and renewable sources of energy to ensure energy security for the nation.
The Commission for Additional Sources of Energy (CASE) was established in
1981 followed by Department of Non-Conventional Energy Sources (DNES)
in 1982 and Ministry of Non-Conventional Energy Sources (MNES) in 1992.
The Ministry of Non-Conventional Energy Sources (MNES) was renamed in
the year 2006 as Ministry of New and Renewable Energy (MNRE).
3.3.3.2 National Institute of Solar Energy
National Institute of Solar Energy (NISE) is created by converting the Solar
Energy Centre (SEC) as an autonomous body under the aegis of Ministry of
New and Renewable (MNRE), with the mandate to spearhead the National
R&D in the field Solar Energy, in the year 2013. NISE coordinates the research
in science and technology relating to solar power. Other major responsibility
of NISE is to assist the ministry for the implementation of National Solar
Mission.
104
3.3.3.3 National Institute of Wind Energy (NIWE)
National Institute of Wind Energy (NIWE) was established the year 1998 with
head office in Chennai, for R&D in the field of wind energy. It seeks to provide
solutions for the wind energy sector by carrying out research and development
activities for improvements of technology and remove difficulties.
3.3.3.4 The Indian Renewable Energy Development Agency (IREDA)
The Indian Renewable Energy Development Agency (IREDA) is established
as a Non-Banking Financial Institution for enhancing the fund flows in the
renewable energy sector by providing loans to renewable energy developers at
reasonable interest rates. IREDA functions under the administrative controls
of the MNRE.
3.3.3.5 Solar Energy Corporation of India (SECI)
Solar Energy Corporation of India (SECI), is incorporated as a non-profit
company under Section 25 of Companies Act, 1956, with the administrative
control vested at the Ministry of New & Renewable Energy (MNRE). Currently
Dr. Anil Kakodkar is the Chairman of the Corporation. SECI is bestowed with the
responsibility of implementation of JNNSM Phase-II. It is expected to implement
the installation of 3000 MW of power plants in various phases.
3.4 WHETHER THE ELECTRICITY ACT 2003 HAS BEEN
SUCCESSFUL IN ATTRACTING THE INVESTORS TO THE
RENEWABLE ENERGY SECTOR IN INDIA?
The Energy Crisis of 1970s have made the United States of America to think
in terms of renewable and domestic sources of energy. Policymakers encouraged
the funding for research on developing ethanol, biodiesel, solar, and wind
power. In 1990s, there were major price shocks in oil in US triggering the
energy security concerns.232
232 James A. Duffield and Keith Collins, Evolution of Renewable Energy Policy, CHOICES (2006),
http://www.choicesmagazine.org/2006-1/biofuels/2006-1-02.htm (last visited Nov 28, 2018).
105
The other major policy push for the renewables was the promotion of rooftop
solar installations from the state governments. Attractive schemes of capital
subsidies have attracted many investors into the rooftop segment.
The remaining discussion in this chapter will be focused on this central idea of
whether the Electricity Act 2003 has been successful in attracting the investors
to the renewable energy sector in India.
3.4.1 THE GLOBAL INVESTMENT TREND IN ENERGY SECTOR
Energy business was traditionally in the hands of the state and government
institutions due to the considerableinvestment requirement and strategic
importance. The entry of renewable energy made energy production and
consumption a more localized activity with increased private participation233.
The energy sector was dominated by big power companies and National Oil
Companies. The renewable energy market today has thousands of small
companies, NGOs and social businesses which are involved in generation and
distribution of renewable energy.
The current energy market is carefully crafted by the government initiatives
primarily through the Electricity Act, 2003. The 2003 Act has established a
market for the rural electrification to decentralised and distributed generation
systems. This has witnessed an acceleration in investments in decentralised
generation and distribution of electricity with the active roles and involvement
from local self-government, consumer associations, cooperative societies and
NGOs. Private investors are also allowed to set up standalone systems in the
rural areas.
3.4.2 GLOBAL TRENDS IN INVESTMENTS IN THE ENERGY SECTOR
In the year 2016, the total global investments in the electricity sector has
surpassed the oil and gas sector. One of the primary reasons is the 36% drop in
two years of oil and gas investments. Even though there was a 5% drop in
233 Chandra Bhushan, Growth of renewable energy in India, DOWN TO EARTH (2018)
https://www.downtoearth.org.in/news/growth-of-renewable-energy-in-india-43605 (last
accessed Aug. 30th 2018).
106
investments in power generation, the 6% increase in investments network
assets has balanced out the final investment figures. The overall energy
investment has fell 12% in 2016234. The primary reason being the drop in the
investment in oil and gas sector due to the fall in revenues and oil prices since
mid-2014.
In 2017 the global energy investments was at USD 1.8 trillion. The investment
in real terms fell by 2% due to lower levels of fossil fuel spending and lower
capacity additions in thermal, nuclear and hydropower plants235.
According to the study conducted by UN Environment Programme and
Bloomberg, the renewable energy market makes remarkable progress but not
up to the mark236. In 2017 the renewables accounted only 12.1% of the
electricity produced. This was just 1.1% more than the 2016 status. China,
India and Brazil, the big three have accounted for over half of the global
investment in renewables, with China alone contributing 45% of the total
investment in 2017 and was 35% in 2016.
While China makes progress in leaps and bounds, India has witnessed an
increased investment in the energy sector by 7% behind China and United
States backed by the strong push by the government to augment the power
systems237.
The fossil fuel investments had a share above 60% in the total energy supply
investments since 2000. For the first time, the total share in the fossil fuel
investments in the total energy supply investments has dropped below 60%
mark. This suggests the shift of focus for energy solutions to the non-fossil
fuel sources.
234 supra note 105 International Energy Agency.
235 International Energy Agency, WORLD ENERGY INVESTMENT 2018, www.iea.org/t&c/ (last
visited Nov 28, 2018).
236 UN ENVIRONMENT PROGRAMME, GLOBAL TRENDS IN RENEWABLE ENERGY INVESTMENT
2018, https://europa.eu/capacity4dev/unep/documents/global-trends-renewable-energy-
investment-2018 (last visited Nov 29, 2018).
237 supra note 105 International Energy Agency.
107
The drop of fossil fuel and nuclear-based power generation from the 2015
figures amounted to 17%, and this has impacted the worldwide drop of
investments in power generation to 5%. The investments in the renewable
electricity was also affected during this period due to lesser investments in
hydropower. The policy push for solar and wind, uncertain demand outlook,
In OECD region the investments in power generation is 144 trillion USD in
renewables, 8 trillion USD in nuclear and 38 trillion USD in thermal power
plants. Whereas during the same period in the Non-OECD countries it is 153
trillion USD, 18 trillion USD and 79 trillion USD respectively in the year
2016238. In all these figures the investments in the renewable energy sector is
much higher than the investments made in the thermal power plants. There is
an apparent shift in the focus of energy planning and energy mix towards
clean and renewable energy. But the same period the investments in India was
still lead by thermal power stations for power generation. The investments in
India is 10 trillion USD in Renewables, 3 trillion USD in nuclear and 21
trillion USD in thermal power plants. South East Asia and Middle East also
had shown similar trend during the same period with more investments in the
thermal power generation than in renewable energy. Both the regions had
zero investments in the nuclear power plants in 2016. South East Asia has
invested seven trillion USD in renewables and 9 trillion in thermal plants.
Middle East has made an investment of one trillion in the renewables and six
trillion in thermal plants. China, on the other hand, had made the 90 trillion
USD investments in the region out of the total 153 trillion. Their investments
in thermal power and nuclear were 34 and 10 trillion USD respectively.
While the whole world was moving towards green energy and embracing
sustainability and energy efficiency, India is lagging behind and moves in the
wrong path with additions being made in thermal power plants239.
238 supra note 96 UN ENVIRONMENT PROGRAMME.
239 supra note 105 International Energy Agency.
108
The share of conventional energy including thermal power and fossil fuels
rose to 59% in the year 2017 which is has witnessed a marginal increase after
2014 for the first time.
3.4.2.1 World Energy Efficiency Investments
Energy saved is energy generated. The International Energy Agency defines
an energy-efficient investment as “the incremental spending on relatively
efficient equipment or on building refurbishments that reduce energy use240.”
Compared with 2015 there was an increase of 9% investments in energy
efficiency in 2016. This is majorly from investments worldwide in
improving energy efficiency by businesses, households and public sector
with China showing the fastest growth with 63 trillion USD investments in
energy efficiency. The significant investments in the largest sector for energy
efficiency, the buildings contributed to the growth of the energy efficient
measures. The investments amounting to USD 133 billion in 2016.
China accounted for the sales of most number of Light-Duty Vehicles (LDVs)
and Electric Vehicles reflecting a 5% growth in the transport sector. Most of
the public spending in energy efficiency was effected through direct grants
and tax exemptions.
The overall downward trend of investments in the energy sector in 2017 was
reflected in the energy efficiency investments241. The sector has witnessed an
investment of USD 236 billion which is an increase of 3% compared to the
previous year.
Energy Efficiency is an important aspect of Energy Sustainability and the
objectives of energy sustainability cannot be achieved if there is no effort
which go hand in hand with the clean energy development. Energy saved is
energy generated.
240 Id.
241 supra note 235 International Energy Agency.
109
In a recent press note the government of India has stated that “The Asian
Development Bank (ADB) and the Government of India on 16th December
2019 signed a $250 million loan to Energy Efficiency Services Limited
(EESL) to expand energy efficiency investments in India that will benefit
agricultural, residential and institutional consumers. In addition, $46 million
financing will be provided from the Clean Technology Fund (CTF), to be
administered by ADB242.”
3.4.2.2 Buildings & Air Conditioning
According to the IEA India will witness a surge in the air conditioner sales in
the coming decades. It is expected to grow at 8% per year to 2040. Growing
urban population, hot climatic conditions, and the growing income levels will
push the growth in this sector adding to the energy demand for the future243.
The air conditioner sales grew at 6% in the last decade in India, and most of
the sales are to the new users making the electricity demand high. The
electricity demand boost caused by air conditioners in the year 2016 was more
than 10 TWh.
This is where the solar investments in India should match up with. The air-
cooling demand and the energy production will be concurrent in the case of air
conditioners and solar matching the timing of solar energy production. Using
more solar to meet this will help CO2 emissions. The IEA envisages that the
output from solar may not catch up with the demand from the air conditioning
in India. Also, the cooling demand is high in the evening while the solar
output is low. The increase of EER (ratio of output to input energy) from a
minimum of 2.7 in 2016 to 3.1 in 2018 through tightening of the efficiency
standards for air conditioners in India will help manage the demand side.
According to IEA an increased EER of 4 as that of the United States or 5 that
242 MINISTRY OF FINANCE, ADB, INDIA SIGN $250 MILLION LOAN TO EXPAND ENERGY
EFFICIENCY INVESTMENTS IN INDIA (Dec. 17th 2019) https://pib.gov.in/ newsite/
PrintRelease.aspx?relid=195939.
243 supra note 104 Bloomberg.
110
of Japan and European Union would avoid 2TWh of demand and 1-2 GW of
peak load being added to the system per year244.
The air conditioner prices are also falling globally due to economies of scale
and competition in the market due to an increased demand. IEA in its report
states that there is a decline of 16% in the prices on an average in the 47
countries from which they collected the price information245.
In the year 2016, the number of units of air conditioners sold is 125 million
and will consume around 200 to 250 TWh of electricity each year246. The new
cooling demand accounts for 90TWh,and the rest is consumed by replacement
units. The demand addition through the sales of air conditioners will amount
to 15% of the annual demand growth in India and many other countries
including China. If all the air conditioning units sold in the world had met the
Energy Efficiency Ratio of Japan, the additional load demand would have
been just 50 TWh instead of 90 TWh.
3.4.2.3 Electricity and Renewables Investment
The year 2016 has witnessed higher spending in the electricity transmission
networks and weaker spending in generation. This has resulted in drop of
global investments into the sector below USD 720 billion247. The reduction of
spending in coal-fired plants throughout the world has impacted overall
investments in the sector. The period 2015-17 is considered to have achieved
the peak in coal power plant investments. The year has also witnessed
comparatively lesser investments in the wind power and hydropower
additions, and the cost of solar PVs have dropped considerably. The decline of
coal power plants in China was a significant incident with slowing down of
244 OECD/IEA, TACKLING INVESTMENT CHALLENGES IN POWER GENERATION IN IEA
COUNTRIES 1–210 (2007), https://www.iea.org/publications/freepublications/ publication/
tackling_investment.pdf.
245 Id.
246 Id.
247 supra note 96 International Energy Agency.
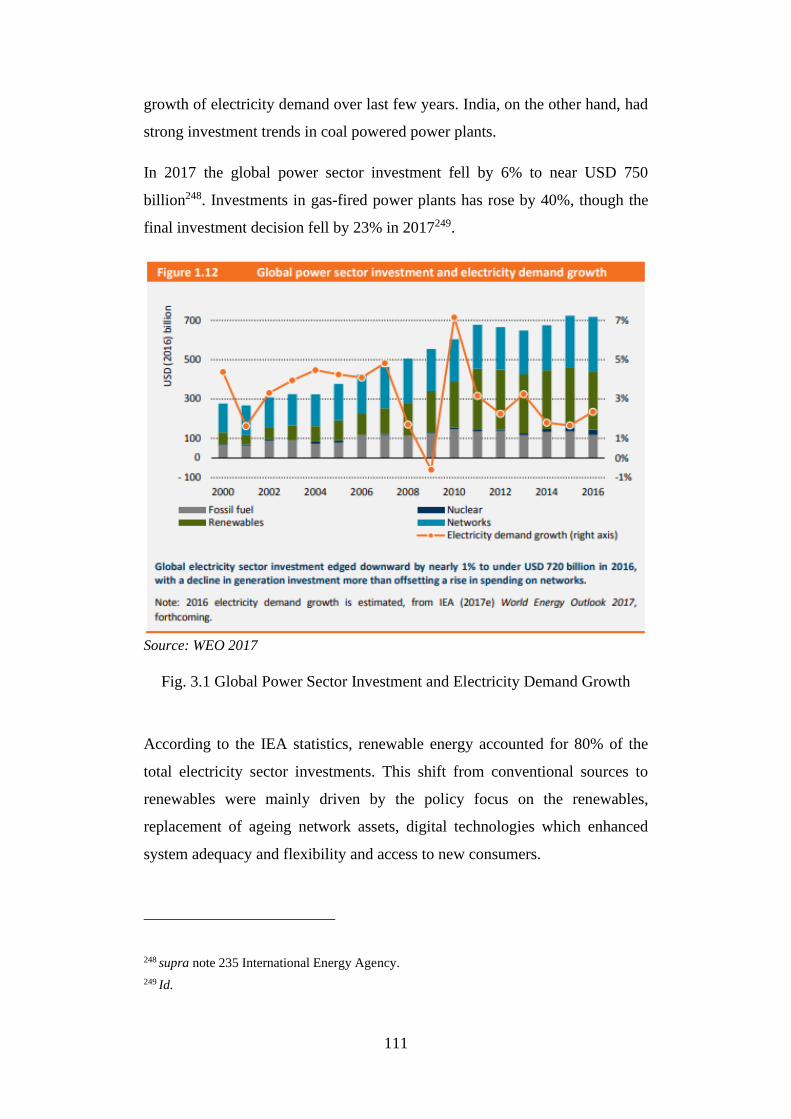
111
growth of electricity demand over last few years. India, on the other hand, had
strong investment trends in coal powered power plants.
In 2017 the global power sector investment fell by 6% to near USD 750
billion248. Investments in gas-fired power plants has rose by 40%, though the
final investment decision fell by 23% in 2017249.
Source: WEO 2017
Fig. 3.1 Global Power Sector Investment and Electricity Demand Growth
According to the IEA statistics, renewable energy accounted for 80% of the
total electricity sector investments. This shift from conventional sources to
renewables were mainly driven by the policy focus on the renewables,
replacement of ageing network assets, digital technologies which enhanced
system adequacy and flexibility and access to new consumers.
248 supra note 235 International Energy Agency.
249 Id.
112
The trend in investment growth in the renewables are in line with growth in
the energy demand. The renewable investment in capacity addition 2016 will
be able to meet 90% of the demand increase during the same period.
3.4.2.4 Financing and Funding of Electricity Supply Investment
Electricity supply funding is critical to the overall growth of the sector.
Various business models and government policies have impacted the way the
capital is made available for investment in electricity supply. Companies
operating entirelyunder-regulated revenue mechanisms to manage the risks of
wholesale price volatility have made 94% of investments in power generation
in the year 2016, and the same was 92% in 2011250. Twenty destinations in
terms of market and technology had contracted pricing to secure long-term
cost recovery of assets. The power markets all over the world are mostly
dominated by the business model where public utility companies that own and
operate the network assets purchase electricity produced by independent
power producers (IPPs) at regulated or contracted prices. These mechanisms
are responsible for the 50% of the increase in the total installed capacity
globally251.
In the past, most of the investments in the electricity networks were made by
independent network operators who relied on regulated tariffs and government
entities with administrative investment budget. The business models in
distributed generation are on the other hand determined by the retail tariff
design. Investments in the sector by unbundled grid companies are stable with
replacements of ageing assets and modernization252. In 2016 60% of the total
investments were made in the single buyer markets by the utilities from the
administrative investment budgets. This is an increase from the 2011, where
the same was at 50%. The increase of 10% has mainly happened due to the
250 supra note 105 International Energy Agency.
251 Id.
252 FRANKFURT SCHOOL-UNEP CENTRE/BNEF, GLOBAL TRENDS IN RENEWABLE ENERGY
INVESTMENT 2017 (2018), http://www.fs-unep-centre.org (Frankfurt am Main),
http://www.fs-unep-centre.org (last visited Aug 29, 2018).
113
investments happened in China, India and Southeast Asia. The IEA opines that
the role of Public Private Partnership can play a better role in augmenting
investments in the sector253.
The evolving electricity markets are creating more investment opportunities
through policy reforms enabling more private players to step in. One key
policy challenge faced by all the markets was to innovate a policy design to
balance affordability and return on investment in the renewable electricity
sector. Policies focused more on ensuring energy supply, though the price
indication was low resulting in creation of complex business models which
may not be sustainable in the long run. It is important to note that the major
investors in the sector such as China, Japan, Mexico and Korea are moving
towards competition in the market with wholesale and retail players to have
market opportunities254.
China initiated measures to adopt direct power purchase (DPP) between IPPs
and large consumers, and the grid prices will be stabilized through
transparency in pricing or fixed prices for DPPs to carryout. China is also
making policy changes to augment investments in the distribution sector from
the private investors255.
Japan opened up the market for new entrants through liberalization in the year
2016. Mexico has unbundled the state-owned vertically integrated utilities
(VIUs) and introduced a national wholesale market, though the trading is very
nascent. Korea has announced that it will unbundle the state-owned VIU and
list the subsidiaries in the stock exchange. The subsidiaries will have their
investments oriented towards renewables256.
The renewables are changing the electricity markets impacting the financing
of projects. New business models are being introduced and tried to recover the
253 supra note 105 International Energy Agency.
254 supra note 252 UNEP Centre/BNEF.
255 supra note 105 International Energy Agency.
256 supra note 104 Bloomberg.
114
costs and to improve efficiency with advanced technology, operation and
locations.
Utility-scale investments were made to the tune of 60% of the total
investments in the renewable power in 2016. The increased policy support for
determining the pricing has helped the sector to achieve this milestone.
Majority of the investments are made in the markets where there is a feed-in
tariff mechanism adopted through regulated pricing. One-third of the
investments were but made in the jurisdictions where contracts were awarded
by auctions and independently negotiated power purchase agreements (PPAs).
There is an increased level of investment to the extent of 36% of the total
utility-scale renewable investment in 2016 through competitive mechanisms
compared to 2011 when it was only 28%. This surge is mainly due to the
combination of policy mechanisms such as wholesale pricing and renewable
certificates which censured a fair remuneration. Though it is a positive signal to
see more investments are becoming ready to face the market risks, it is not
entirely correct to conclude so. This is mainly because of the subsidies and tax
credits which influenced the price discoveries. It is also influenced by fixed-
price contracts to drive down the investment risks. It is essential in future the
investment models adjust to the changing demand and supply situations.
The conventional power plants are struggling to recover their investment costs in
wholesale markets. Renewables have lower marginal costs which are usually
covered in the regulated and contracted pricing mechanisms. Some markets are
working to enhance the reliability on spot markets to ensure adequate rewards.
Obtaining finances for power generation in wholesale market mechanisms
depends on providing incremental revenue streams257. These mechanisms
include:
i. Contracts for multiple allied services and products such as electricity,
heat, steam and compressed air in a locality
257 Laurie Van Der Burg & Shelagh Whitley, RETHINKING POWER MARKETS: CAPACITY
MECHANISMS AND DECARBONISATION (2016).
115
ii. Tolling agreements where energy input and output are exchanged
iii. Capacity mechanisms to make capacity available to deliver electricity
at specific periods.
iv. Provision for grid and ancillary services.
Capacity mechanisms have attracted appreciation from the regulators and
policymakers as a mechanism to assure supply during the scarcity period. But
the lack of coordination of such measures impacts the price discovery in the
wholesale markets. The mechanisms works with the remuneration to
generators and demand-side response by-
i. Targeted payments for strategic reserves in tight supply situations as in
the markets of Belgium and Sweden
ii. Market-wide payments auctioned by a single central buyer like United
Kingdom and the US PJM Interconnection which is an independent
system operator (ISO)
iii. Market-wide capacity obligation on suppliers like in France, who can
purchase certificates.
iv. Capacity providers receive a fixed payment in exchange for giving up
peak prices during scarcity like in US ISO New England
3.4.2.5 Investments in Storage
Grid-scale storage is an important area which need attention to ensure reliable
and flexible supply of electricity. The recent growth of technology and
decreasing costs have made it an attractive investment option in the sector.
The total investments in the storage is as low as 0.4% of network investment
in 2016258. There are various business models in which storage investments
are made. They rely on combination of models that can generate revenues for
a project corresponding to the multiple services. Changes in the policy and
rules that limited wholesale participation and improved capability of
258 INTERNATIONAL RENEWABLE ENERGY AGENCY, GLOBAL ENERGY TRANSFORMATION: A
ROADMAP TO 2050 (2018), www.irena.org (last visited Aug 29, 2018).
116
developers to monetize system services. The primary use of this storage is to
provide grid and ancillary services by regulating frequency with demand259.
There is a considerable growth in the investment in battery and its applications
since 2012. The investment has reached above 500 MW in 2016 from a total
investment of less than 100 MW capacity in 2012260. The main applications of
the storage investments include energy demand shifting, demand-side
management and microgrids, grid and ancillary services, avoiding network
constraints and investments and reliability events. Battery storage is a capital-
intensive investment which the regulators are trying to stimulate with long-
term contracts and capacity contracts and with centralized competitive
auctions and utility procurement obligations261. In California, the regulators
held an emergency tender in the year 2016 for commissioning 70 MW of grid-
scale batteries to manage severe supply constraints due to Aliso Canyon gas
storage leak. The investment in battery comes as an immediate response to
supply variations and demand pressure.
3.4.2.6 Investments in Power Generation
The investment figures in power generation came down to USD 440 billion
which is 5% drop from the previous year. One of the reasons which is
attributed for the fall in the prices is the fall in the cost of technologies for
generation of power. The below chart shows the comparison of increase
investments at the capital cost at the levels of 2010 prices.
Investment in thermal power plants dropped by 12% to USD 117 billion in
2016. The steep slowdown in commissioning of coal power plants in China
has resulted in such massive drop. While India recorded a rise in investments
in coal-fired power plants offsetting a rise in investment. Even though there
was a drop in investment coal remained the third most popular option among
259 supra note 236 UN ENVIRONMENT PROGRAMME.
260 supra note 258 Renewable Energy Agency.
261 STATISTA, GLOBAL RENEWABLE ENERGY INDUSTRY-STATISTICS & FACTS, https://www.
statista.com/topics/2608/global-renewable-energy-industry/ (last visited Aug 29, 2018).
117
the countries for power generation investments after solar PV and wind at
nearly USD 80 billion investments.
The IEA is of the opinion that, the extent of decline and relatively younger age
of existing plants which averages nearly 20 years suggest that the investment
in coal power plants have reached its all-time peak in 2015-17. China and
Europe have made clear policy shifts not to invest more in new build power
plants with coal as fuel.
Investment in gas-fired power plants also dropped to USD 34 billion in 2016
to its lowest level in a decade. While the investments slowed down in China
and the Middle East, it has increased in United States, Europe, Southeast Asia
and Japan. Oil fired plants also witnessed its lowest investment in 2016 with
less than USD 4billion mainly from Middle East, Africa and Latin America.
Unites States and China led the investments in nuclear power plants.
Investments in nuclear power were highest in 25 years with United States
commissioning the first nuclear plant in the last 20 years. The total investment
in nuclear plants have added 10 GW of power capacity to the existing. Though
the investment in terms of capacity addition was similar to that of 2015, the
higher overnight capital costs in countries like United States have increased
the investment figures262.
The USD 297 billion investment in 2016 is the largest source of electricity
investment. Though the figures show a decline of 3% from the previous years.
The capacity additions were 50% higher than 2011263. The decrease in the
investment costs has helped the renewable sector to grow in terms of the
capacity addition.
3.4.2.7 Investments in Research and development
Renewable energy technologies are still an evolving segment in the energy
sector with improvements in the technology and innovations are continuously
262 supra note 105 International Energy Agency.
263 supra note 258 Renewable Energy Agency.
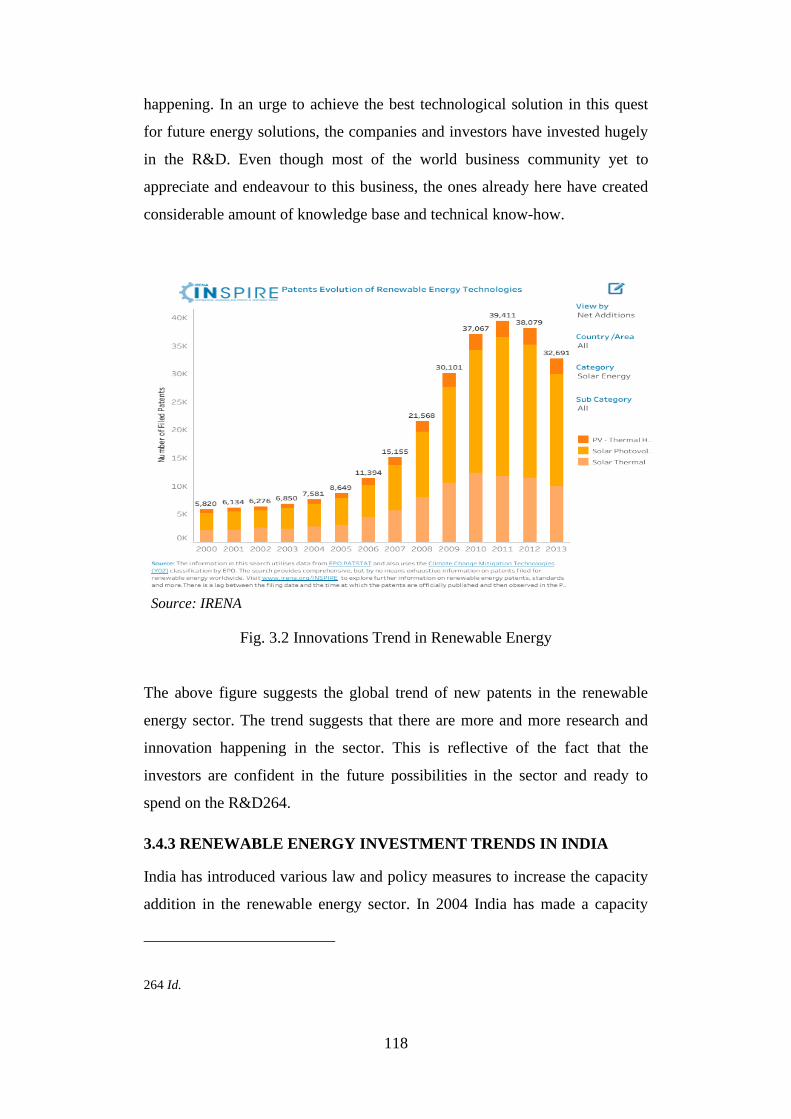
118
happening. In an urge to achieve the best technological solution in this quest
for future energy solutions, the companies and investors have invested hugely
in the R&D. Even though most of the world business community yet to
appreciate and endeavour to this business, the ones already here have created
considerable amount of knowledge base and technical know-how.
Source: IRENA
Fig. 3.2 Innovations Trend in Renewable Energy
The above figure suggests the global trend of new patents in the renewable
energy sector. The trend suggests that there are more and more research and
innovation happening in the sector. This is reflective of the fact that the
investors are confident in the future possibilities in the sector and ready to
spend on the R&D264.
3.4.3 RENEWABLE ENERGY INVESTMENT TRENDS IN INDIA
India has introduced various law and policy measures to increase the capacity
addition in the renewable energy sector. In 2004 India has made a capacity
264 Id.
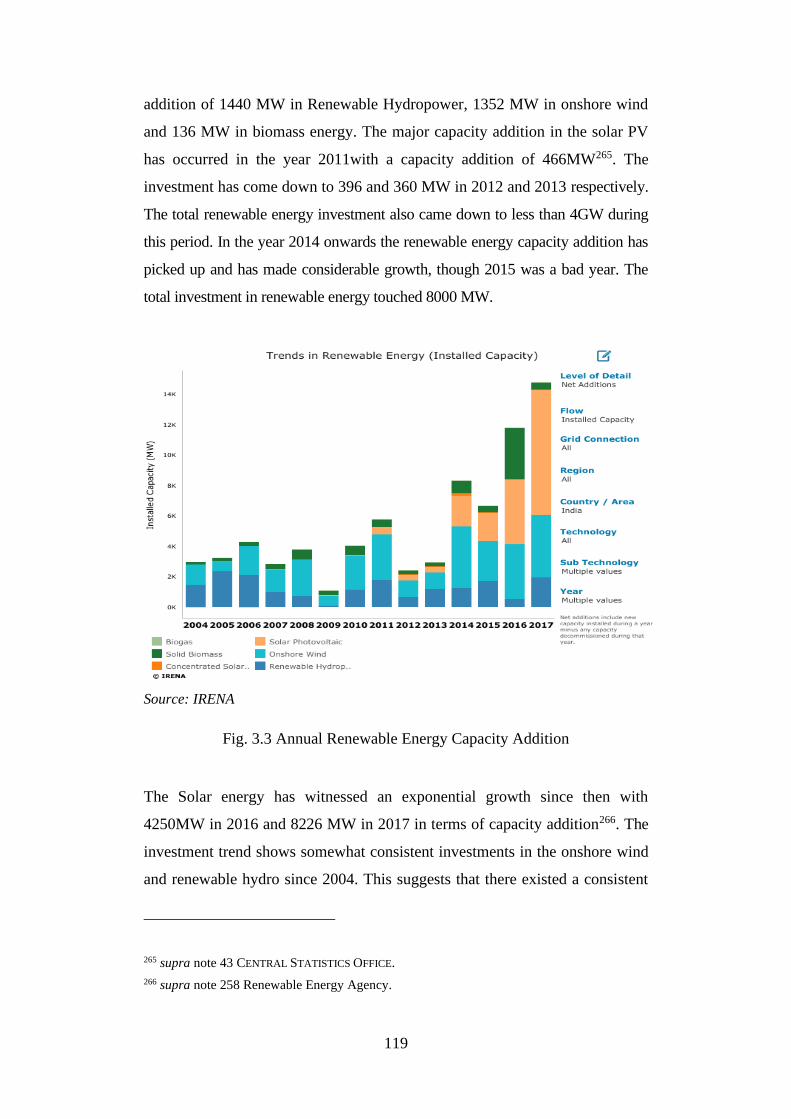
119
addition of 1440 MW in Renewable Hydropower, 1352 MW in onshore wind
and 136 MW in biomass energy. The major capacity addition in the solar PV
has occurred in the year 2011with a capacity addition of 466MW265. The
investment has come down to 396 and 360 MW in 2012 and 2013 respectively.
The total renewable energy investment also came down to less than 4GW during
this period. In the year 2014 onwards the renewable energy capacity addition has
picked up and has made considerable growth, though 2015 was a bad year. The
total investment in renewable energy touched 8000 MW.
Source: IRENA
Fig. 3.3 Annual Renewable Energy Capacity Addition
The Solar energy has witnessed an exponential growth since then with
4250MW in 2016 and 8226 MW in 2017 in terms of capacity addition266. The
investment trend shows somewhat consistent investments in the onshore wind
and renewable hydro since 2004. This suggests that there existed a consistent
265 supra note 43 CENTRAL STATISTICS OFFICE.
266 supra note 258 Renewable Energy Agency.
120
conducive environment for investments in the sector. Whereas solar energy
investments have shot up only since 2014.
There are multiple reasons for the recent growth of the investments in solar
energy267. They are the growth in the innovation and technological
advancements in the sector and the policy push for investments in the sector
under various government schemes. In 2017 the investments in renewable
power outpaced the investments in fossil fuels based power generation with
nearly USD 20 billion. The solar photovoltaic capacity in India has grown
from 3GM in 2014 to 22GW in 2018, an eight-fold growth268. The recalibrated
highly ambitious renewable energy target of 175GW by 2022 can be achieved
with more aggressive investments in the sector.
The Ministry of New and Renewable Energy, Government of India, has come
up with the latest policy document269 which suggest the establishment of
Wind-Solar hybrid projects. The policy also propose for AC and DC
integration into the grid. The government entities are allowed under the new
policy to invite bid for the hybridization of the current wind and solar power
projects.
3.4.4 CONCLUSION
The boost for renewable electricity from solar PV was resulted from the
Jawaharlal Nehru National Solar Mission which was launched in 2010. The
capacity addition and investment data shows that the growth of the solar
energy sector was nor positively or negatively affected by the Electricity Act
2003,even though the lack of coordination of various agencies and the lack of
267 IRENA, CORPORATE SOURCING OF RENEWABLE ENERGY: MARKET AND INDUSTRY TRENDS
(2018), https://www.irena.org/publications/2018/May/Corporate-Sourcing-of-Renewable-
Energy (last visited Nov 30, 2018).
268 Kanika Chawla et al., CLEAN ENERGY INVESTMENT TRENDS EVOLVING LANDSCAPE FOR
GRID-CONNECTED RENEWABLE ENERGY PROJECTS IN INDIA (2018), http://www.ceew.in/
sites/default/files/CEEW-Clean-Energy-Investment-Trends-Report-27Jun18.pdf (last visited
Nov 30, 2018).
269 Ministry of New & Renewable Energy, AMENDMENT IN NATIONAL WIND-SOLAR HYBRID
POLICY, https://static.investindia.gov.in/s3fs-public/2018-09/%28Amendment %29 %2B
National Hybrid wind solar policy_0.pdf (last visited Nov 30, 2018).
121
importance given to it by various state government policies and commissions
has curtailed its growth in many states. The need for additional policy push
and promotion for investments required to be relooked at since it does not
offer consistency. The way forward is to incorporate the consistent policy
measures in the legislation to enhance growth in the sector.
The Electricity Act 2003 has laid down a comprehensive legal framework to
ensure and protect the investors. In addition to the general framework for
regulating the sector and creating a conducive environment for investment; the
act has included general provisions which may be helpful to promote and
protect investors in the renewable energy sector. Since those provisions were
enacted at a time when the renewable energy industry was at an infant stage,
and many of the complexities of the sector were unknown to the lawmakers, it
is expedient to have a more specific legislation instilling confidence in the
investors.
Since we can find from the detailed discussion of the legal provisions that,
there need a more coordinated mechanism at the national level is required to
improve investment conditions. Some of the measures adopted by the
government entities and regulators are discouraging the investors. It is
essential to understand what other laws may be complementing the growth of
the sector. The next chapter will discuss the other laws which are affecting
investments in the sector.
122
CHAPTER 4
LAWS COMPLEMENTING THE GROWTH OF
RENEWABLE ENERGY
4.1 INTRODUCTION
The growth of renewable energy sector depends on various other legislation in
addition to the Electricity Act 2003. This chapter will explore the business
environment in India based on the ease of doing parameters adopted by the
World Bank. These other legislations, regulations and policies have a direct or
indirect impact on the promotion and development of renewable energy sector.
The first part of this chapter analyses the general business environment in India
which will impact any business activity including the renewable energy sector.
The second part of this chapter will examine how the central state government
policies and measures have helped the renewable energy sector, especially solar.
4.2 EASE OF DOING BUSINESS IN INDIA
Ease of doing business is an annual report published by the World Bank after
evaluating the ease of doing business in every nation by 10 parameters.
Commencing from the year 2003 the report has achieved an overwhelming
response from various countries by adopting such measures to improve the
ease of doing business score270.
According to the World Bank Report on Ease of Doing Business in India
2019, India stands at 77th Position in ease of doing business. According to
World Bank, it is for the first time that India has moved into the top 80 list.
270 WORLD BANK GROUP, DOING BUSINESS 2018, 15 CESifo Forum 312 (2017),
http://www.worldbank.org/en/news/press-release/2017/10/31/doing-business-2018-fact-
sheet-india (last visited Jun 3, 2018).
123
The report also recognized India as one of the top performers and among the
top 10 nations who have made considerable improvements in the last year’s
assessment. Out of the ten indicators of doing business India has implemented
reforms in 8 areas. The total score India achieved in the 2018 doing business
report of the World Bank is 60.76 compared to 56.05 in the same period in the
year of 2017.
The Department of Industrial Policy and Promotion (DIPP) Under the
Ministry of Commerce and Industry along with the World Bank Group,
released the Business Reform Action Plan (BRAP) 2017 on 13th April 2017. It
had a total of 405 recommendations concerning regulatory processes, policies,
practices, and procedures. The 12 major areas which required the Reform include
“Labour Regulation enablers, contract enforcement, registering property,
inspection reform enablers, single window clearance system, land availability and
allotment, construction permit enablers, environmental registration enablers,
obtaining utility permits, paying taxes, access to information and transparency
enablers and sector specific reforms spanning the life cycle of a typical
business271.” The BRAP was circulated to all the states and Union Territories,
and an assessment of implementation of reforms was published on 31st
October 2016. The national average stood at 48.93% on implementation of the
suggested reforms272.
The implementation average shows that most of the state governments have
not taken the reforms as a priority. This will adversely affect the investment
and business environment in the country.
4.2.1 STARTING A BUSINESS
India has merged the application procedure for various tax compliance
requirements. The Permanent Account Number (PAN) and the Tax Account
Number (TAN) are allotted through a single application. This has reduced the
271 MINISTRY OF COMMERCE & INDUSTRY, BUSINESS REFORM ACTION PLAN 2017,
http://pib.nic.in/newsite/PrintRelease.aspx?relid=161017 (last visited Jun 4, 2018).
272 Id.
124
processing time and red-tapism. Some states have also merged the GST
registration and professional tax registrations along with the PAN and TAN
Registrations.
The ministry of Corporate Affairs, Government of India, has notified
Simplified Proforma for Incorporating Company Electronically (spice) on 16th
December 2016. The objective of the new form is providing speedy
incorporation of companies facilitating ease of doing business in line with
international best practices273.
Spice form replaces multiple application forms and procedures required earlier
for obtaining Director Identification Number (DIN), Permanent Account
Number (PAN) Tax Account Number (TAN), application for reservation of
name and incorporation of new company274.
India improved starting a business score by merging the applications for the
Permanent Account Number (PAN) and the Tax Account Number (TAN)
through an improved online process. In Mumbai the application for the value-
added tax and the profession tax are also merged to speed up the process275. In
2016 report India improved score by eliminating the minimum capital
requirement for incorporation the requirement of certificate of commencement
of business276. Some of the other important changes were made in the year
2015, 2013 and 2011. In 2015 the registration fees were reduced, in 2013 the
Companies Act 2013 was introduced and in 2011established online VAT
registrations to promote startups.
273 MCA, SIMPLIFIED PROFORMA FOR INCORPORATING COMPANY ELECTRONICALLY (SPICe),
http://pib.nic.in/newsite/PrintRelease.aspx?relid=155584 (last visited Jun 4, 2018).
274 COMPANIES (INCORPORATION) FOURTH AMENDMENT RULES, 2016 (2016),
http://www.mca.gov.in/Ministry/pdf/CompaniesIncorporationFourthAmendmentRules_01
102016.pdf (last visited Jun 4, 2018).
275 WORLD BANK GROUP, BUSINESS REFORMS MADE IN THE ENFORCING CONTRACTS - DOING
BUSINESS, (2018), http://www.doingbusiness.org/reforms/ overview/topic/Enforcing-
Contracts (last visited Jun 5, 2018).
276 WORLD BANK, INDIA JUMPS DOING BUSINESS RANKINGS WITH SUSTAINED REFORM FOCUS
2016 (2017), http://www.worldbank.org/en/news/press-release/ 2017/10/ 31/india-jumps-
doing-business-rankings-with-sustained-reform-focus (last visited Jun 3, 2018).
125
4.2.1.1 Dealing with Construction Permits
Obtaining construction permits from the local authorities are always difficult
due to rampant corruption and red tapism at the local governments. An online
process implemented at the municipalities have streamlined the process
avoiding delays and an opportunity for the applicant to track the status of the
application. This has considerable reduced the time required to obtain the
building permit.
The three Municipal corporations in Delhi, have completed integration with all
external agencies through a common application form to eliminate manual
applications for building permits. They have also introduced an online
automatic calculator for estimation of different charges to be paid277.
Applicants can now make one single online application too concerned urban
local body instead of approaching multiple offices for Obtaining building
permits. The new policy enables an applicant to receive approvals within 30
days by reducing human interface278.
India made dealing with construction permits easierin 2018 through
digitalization of processes at the local governing bodies. The online system
played a key role in streamlining the process of obtaining building permit.
This has reduced the time and cost of obtaing such permits as it has resulted in
the reduction of number of procedures279. This was an advanced step in this
direction after the introduction of strict timelimits for obtaining building
permits and preconstruction approvals in 2013280.
277 MINISTRY OF HOUSING & URBAN AFFAIRS, NDMC TO END MANUAL APPLICATIONS FOR
BUILDING PERMITS BY MAY 15; MCDS BY MAY END (Apr. 28th 2016), http://pib.nic.in/
newsite/mbErel.aspx?relid=142442 (last visited Jun 4, 2018).
278 MINISTRY OF HOUSING & URBAN AFFAIRS, USER FRIENDLY UNIFIED, SIMPLIFIED
BUILDING BYE-LAWS FOR DELHI ANNOUNCED, (Mar. 30th 2016), http://pib.nic.in/
newsite/PrintRelease.aspx?relid=138407 (last visited Jun 5, 2018).
279 supra note 270 WORLD BANK.
280 World Bank Group, DOING BUSINESS 2013 SMARTER REGULATIONS FOR SMALL AND
MEDIUM-SIZE ENTERPRISES (2004), www.worldbank.org (last visited Dec 17, 2018).
126
4.2.2 GETTING ELECTRICITY
Electricity being basic necessity of a dignified life, the government has taken
various measures for universal access to electricity281. The Government of
India and way the state governments have rolled out different schemes to
provide electricity to the rural and urban population living without access to
electricity.
The schemes for commercial use of electricity are different from that for the
domestic use. So the procedure also slightly vary for obtaining electricity
force business and commercial activities. The Electricity Act 2003 is one of
the earlier legislations in India which has absorbed the principles of a right to
timely provision of services to the consumer.
Ease of doing business 2018 has considered the procedures, time and cost
required for a business or commercial entity to obtain a permanent electricity
connection 4 and newly constructed warehouse. The Other parameters
included in the survey are transparency of tariffs, price of electricity and the
reliability of supply of electricity. India stands at the 29th position in the
world ranking of 190 Nations according to the latest doing business report of
2018. The electricity sector is a star performer for India along with minority
investor protection to achieve an improvement in the world rankings and reach
the 100th position282.
India was in the 99th position in this category during 2015. The continuous
efforts to reform the electricity sector has made India to improve its ranking to
26 in 2017, which is at 29 in the year 2018. The procedure for obtaining and
new connection has been reduced to three procedures such as an online
submission of application and conduct of site inspection, demand note
281 Shashank Bengali, Inside India’s epic effort to bring electricity to millions of people for
the first time, LATIMES (Dec. 29th 2017), http://www.latimes.com/world/la-fg-india-
electricity-2017-htmlstory.html (last visited Jun 5, 2018).
282 Sudheer Singh, How electricity reforms boosted India’s stellar performance on Ease of Doing
Business, Energy News, ET ENERGYWORLD (Nov. 1st 2017) , https://energy.economictimes.
indiatimes.com/news/power/how-electricity-reforms-boosted-indias-stellar-performance-
on-ease-of-doing-business/61401939 (last visited Jun 5, 2018).
127
generation if required, and the external connection and installation of meter.
Electrical connections up to 150 KVA will be provided within 7 days.
In Delhi getting electricity was made faster and cheaper by streamlining the
process283. The requirement of internal wiring inspection by the Electrical
Inspectorate was removed in 2016. The internal work processes and
coordination was also improved during this period284.The security deposit for
new connection were slashed in 2015 reducing the cost.
4.2.3 REGISTERING PROPERTY
Entry 18 of a list II, the state list, States that “Land, that is to say, rights in or
over land, land tenures including the relation of landlord and tenant, and the
collection of rents; transfer and alienation of agricultural land; land
improvement and agricultural loans; colonization.” Land ownership and the
evolution of rights on immovable property has its historical relevance. Land
and land rights have been the core of legendary disputes in the courts285. Land
being a subject for state regulation and complexities involved in land
ownership and titles the central government has not been successful inbringing
uniform reforms throughout the nation.
There is no uniform Legal procedure and documentation to claim ownership
as soon as to prove ownership of land and immovable property286.
Sale deed is a primary document used in India to establish ownership of
immovable property. Other documents which is used to prove ownership
include property tax receipts and survey documents. However, these
documents does not establish the ownership rights in immovable property
283 supra note 279 World Bank.
284 World Bank Group, DOING BUSINESS 2016 MEASURING REGULATORY QUALITY AND
EFFICIENCY (2016), www.worldbank.org (last visited Dec 17, 2018).
285 His Holiness KesavanandaBharatiSripadagalvaru and Ors. v. State of Kerala and Anr.
(1973) 4 SCC 225)
286 WORLD BANK, INDIA LAND POLICIES FOR GROWTH AND POVERTY REDUCTION (Jul 9th 2007),
http://siteresources.worldbank.org/INTKNOWLEDGEFORCHA NGE/ Resources/491519-
1199818447826/landpoliciesforgrowthandpovertyreduction.pdf (last visited Jun 6, 2018).
128
conclusively287. It is possible that a person holding all this document may still
have an inadequate or improper title to the immovable property he claims.
This is because the owners of ensuring the proper title to the property of the
previous owner vests on the buyer288. In most of the cases, due to lack of
awareness and multiplicity of procedures and documentation required even
educated people failed to verify the previous ownership properly289. Land
ownership in India is presumptive in nature and can be challenged before the
court of law.
The situation has in further worse condition when it comes to the land records
maintained by government departments. Until recently all land records relating
to immovable property were recorded and maintained in poor state of
conditions without updating at the district or village level. These departments
work in silos, and the data and information was never synchronised or verified
creating multiple layers of data adding to the confusion already created in the
mind of the property owner with the multiple documents and procedures.
According to the Doing Business 2018 report, India has not made any progress
in the area of registering property is concerned.
4.2.4 GETTING CREDIT
The banking and financial sector in India is regulated by the Reserve Bank of
India (RBI). RBI has issued various guidelines and circulars for the banks to
follow while functioning in the market. The master circular on priority lending
is one such document which lists out some key sectors which the banks shall
consider for lending on priority. Priority sector lending suggests to the banks
287 FAO, WHY LAND TENURE IS IMPORTANT, http://www.fao.org/docrep/005/y4307e/
y4307e04.htm (last visited Jun 6, 2018).
288 MINISTRY OF RURAL DEVELOPMENT, STANDING COMMITTEE ON RURAL DEVELOPMENT
TWENTY SECOND REPORT LOK SABHA SECRETARIAT (2015), http://164.100.47.193/
lsscommittee/Rural Development/16_Rural_Development_22.pdf (last visited Jun 6,
2018).
289 D. C. Wadhwa, Guaranteeing Title to Land, 37 ECON. POLIT. WKLY. 4699–4722 (2002),
http://www.jstor.org/stable/4412872%5Cnhttp://www.jstor.org/stable/pdfplus/4412872.pdf
?acceptTC=true (last visited Jun 6, 2018).
129
to comply with certain lending norms. The banks are required to meet lending
targets in those sectors which are listed in the priority sector290.
The New Insolvency law has amended the priority of secured creditors outside
the reorganization proceedings. The new insolvency law as strengthened the
credit market in India.
Doing Business Report 2018suggested that the amendment to the laws making
priority of secured creditors outside corporate reorganization proceedings has
improved the access to credit ranking291. The new Insolvency Code provides
for time bound and clear grounds for relief to the automatic stay for secured
creditors during reorganization proceedings. The launch of unified and
geographically centralized collateral registry to provide credit information has
also strengthened the secured transactions system.
4.2.5 PROTECTING MINORITY INVESTORS
India has strong investor protection laws concerning minority investors. The
parameter measures the “strength of minority shareholder protections against
misuse of corporate assets by directors for their personal gain as well as
shareholder rights, governance safeguards and corporate transparency
requirements that reduce the risk of abuse292.” India has been ranked fourth in
the world ranking in this parameter due to its strict regulations on investor
protection.
The common law principle of majority rule laid down in Foss v Harbottle293
can be traced as the guiding principle in the business freedom allowed to the
directors under the Companies Act, 2013. Indian Judiciary also followed the
similar philosophy by restricting itself in interfering with shareholders’
290 WORLD BANK, India Jumps Doing Business Rankings with Sustained Reform Focus 2016
(2017), http://www.worldbank.org/en/news/press-release/2017/10/31/india-jumps-doing-
business-rankings-with-sustained-reform-focus (last visited Jun 3, 2018).
291 supra note 279 WORLD BANK.
292 WORLD BANK, PROTECTING MINORITY INVESTORS-DOING BUSINESS (2016), http://www.
doingbusiness.org/data/exploretopics/protecting-minority-investors (last visited Jun 5, 2018).
293 (1843) 67 ER 189
130
internal matters as it is evident in Rajahmundry Electric Supply Corporation v.
A. Nageshwara Rao294 and Bagree Cereals v. Hanuman Prasad Bagri295
Chapter XVI of the Companies Act, 2013 deals with protection of minority
shareholders. Sections 241 to 246 of the Act, lays down detailed provisions to
deal with oppression and mismanagement. To strike the proper balance
between the majority rule and minority protection, and to ensure that frivolous
complaints are not made against the management of any company, section 244
of the Act lays down the required minimum number of shareholders to sign
the application to be filed before the company law tribunal296. Section 245 of
the Act recognises the novel concept of Class Action suits. Section 245 reads
as follows:
Such number of member or members, depositor or depositors or any class of
them, as the case may be, as are indicated in sub-section (2) may, if they are of
the opinion that the management or conduct of the affairs of the company are
being conducted in a manner prejudicial to the interests of the company or its
members or depositors, file an application before the Tribunal on behalf of the
members or depositors for seeking all or any of the following orders,
namely:—
(a) to restrain the company from committing an act which is ultra vires
the articles or memorandum of the company;
(b) to restrain the company from committing breach of any provision of
the company’s memorandum or articles;
(c) to declare a resolution altering the memorandum or articles of the
company as void if the resolution was passed by suppression of
material facts or obtained by misstatement to the members or
depositors;
(d) to restrain the company and its directors from acting on such resolution;
294 1955 SCR (2)1066
295 2001 105 CompCas 465 Cal
296 Arunachala Ramaiya & Arvind P. Datar, Guide to the Companies Act (2010).
131
(e) to restrain the company from doing an act which is contrary to the
provisions of this Act or any other law for the time being in force;
(f) to restrain the company from taking action contrary to any resolution
passed by the members;
(g) to claim damages or compensation or demand any other suitable
action from or against—
(i) the company or its directors for any fraudulent, unlawful or wrongful
act or omission or conduct or any likely act or omission or conduct on
its or their part;
(ii) the auditor including audit firm of the company for any improper
or misleading statement of particulars made in his audit report or
for any fraudulent, unlawful or wrongful act or conduct; or
(iii) any expert or advisor or consultant or any other person for any
incorrect or misleading statement made to the company or for
any fraudulent, unlawful or wrongful act or conduct or any likely
act or conduct on his part;
(h) to seek any other remedy as the Tribunal may deem fit.
The Act also has provided exit options to the minority shareholders during a
merger, or amalgamation vide section 235 and 236 of the Act.
The World Bank has evaluated the following measures as improvements in the
area297:
The remedies for the minority shareholders were increased in cases of
prejudicial transactions between interested parties298. Minority investor
protections were improved with greater disclosure of conflicts of interest by
board members, increasing the remedies available in case of prejudicial
related-party transactions.
297 supra note 290 WORLD BANK.
298 supra note 279 WORLD BANK.
132
4.2.6 PAYING TAXES
India was host to a complex indirect tax regime. There were multiple taxes
ranging from Central and state excise duties taxes on interstate sale of goods
intra State sale of goods entry tax on imports into States luxury tax et cetera.
The introduction of GST from 1st July 2017 has subsumed most of the
complex indirect taxes that over existing at the state and Central level299. The
incidence of tax is also made simpler as supply of goods or services. India has
adopted AC dual GST model where the state government impose state GST
and Central Government impose Central GST on a transaction which happens
within the state. All interstate transactions are levied by the central
government under IGST. The new tax regime has brought paradigm shift in
the taxation sector in India. The Indian Constitution was amended to
incorporate the dual GST model. There was shift and changes in the taxing
powers and the revenue of the center as well as the states under the new
regime. Previously Taxes were levied based on origin of the goods or services.
This has been shifted to a consumption-based tax system under the GST
regime where tax is levied at the place of supply. The major criticism about
this taxation regime is that it incentives consumption and not production. The
states which are investor friendly and promotes business and manufacture are
losers due to the shift of revenue to consumer states.
Tax payment procedures have been now completely computerized and has
been made less cumbersome300. By adopting some administrative measures
India has made corporate income tax compliance easier. The technology
enabled taxation regime under GST has played an important role in making
the indirect tax experience of taxpayers easy and convenient.
299 MINISTRY OF FINANCE, RECOMMENDATIONS REGARDING DATA ANALYTICS MADE DURING
THE 26TH MEETING OF THE GST COUNCIL (Mar. 28th 2018), http://www.pib.nic.in/
PressReleseDetail.aspx?PRID=1523711 (last visited Jun 5, 2018).
300 PWC, PAYING TAXES 2018: IN-DEPTH ANALYSIS ON TAX SYSTEMS IN 190 ECONOMIES,
https://www.pwc.com/gx/en/services/tax/publications/paying-taxes-2018.html (last visited Jun
5, 2018).
133
There are three parameters based on which the World Bank assess ease of
paying taxes. They are time to comply in hours, the number of payments in a
year and the total tax rate. India has head corporate income tax rate of 30 %
which is comparatively moderate, and it is proposed to bring down to
25 percent in a phased manner. The number of taxes as far as the income tax
and GST are concerned is on par with International standards. The labour
taxes comprising of professional tax Employee Provident Fund employee
insurance are not on an International standard with multiple payments in a
year. The time taken to comply with tax payment is measured in hours. It
takes 45 hours to comply with corporate income tax where 91 hours to comply
with labor taxes is. The time taken for compliance under GST regime is
comparatively lesser.
The reforms in the taxation in the past include making EPF payment
electronically and easing the compliance requirement of corporate income tax.
The corporate income tax was reduced from 30% to 25% from the financial
year 2017-18. Abolition of fringe benefit tax in the year 2011 and the
introduction of value added tax in 2012 were some other major reforms India
has made in the past.
4.2.7 TRADING ACROSS BORDERS
The World Bank group Asus the cost and time associated with the process
involved in exporting and importing goods. It takes into consideration the
documentary compliance, border compliance and domestic transport301.
On July 15, 2014, A committee was constituted by the secretary, Department
of Commerce, Government of India To make recommendations for reduction
in number of mandatory documents required for exports and imports. The
scope of the committee was later expanded to include all the aspects relating
to improve the ease of doing business in relation to trading across borders.
301 WORLD BANK, METHODOLOGY FOR TRADING ACROSS BORDERS-DOING BUSINESS (2016),
http://www.doingbusiness.org/Methodology/trading-across-borders (last visited Jun 5,
2018).
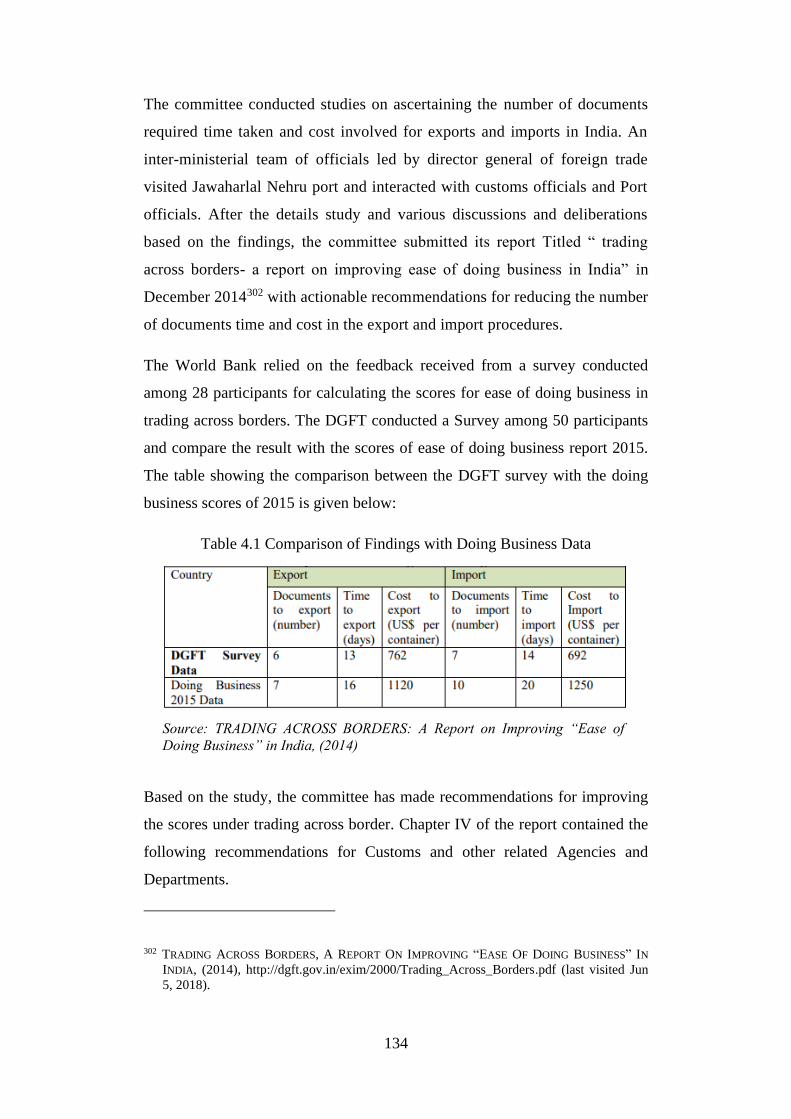
134
The committee conducted studies on ascertaining the number of documents
required time taken and cost involved for exports and imports in India. An
inter-ministerial team of officials led by director general of foreign trade
visited Jawaharlal Nehru port and interacted with customs officials and Port
officials. After the details study and various discussions and deliberations
based on the findings, the committee submitted its report Titled “ trading
across borders- a report on improving ease of doing business in India” in
December 2014302 with actionable recommendations for reducing the number
of documents time and cost in the export and import procedures.
The World Bank relied on the feedback received from a survey conducted
among 28 participants for calculating the scores for ease of doing business in
trading across borders. The DGFT conducted a Survey among 50 participants
and compare the result with the scores of ease of doing business report 2015.
The table showing the comparison between the DGFT survey with the doing
business scores of 2015 is given below:
Table 4.1 Comparison of Findings with Doing Business Data
Source: TRADING ACROSS BORDERS: A Report on Improving “Ease of
Doing Business” in India, (2014)
Based on the study, the committee has made recommendations for improving
the scores under trading across border. Chapter IV of the report contained the
following recommendations for Customs and other related Agencies and
Departments.
302 TRADING ACROSS BORDERS, A REPORT ON IMPROVING “EASE OF DOING BUSINESS” IN
INDIA, (2014), http://dgft.gov.in/exim/2000/Trading_Across_Borders.pdf (last visited Jun
5, 2018).
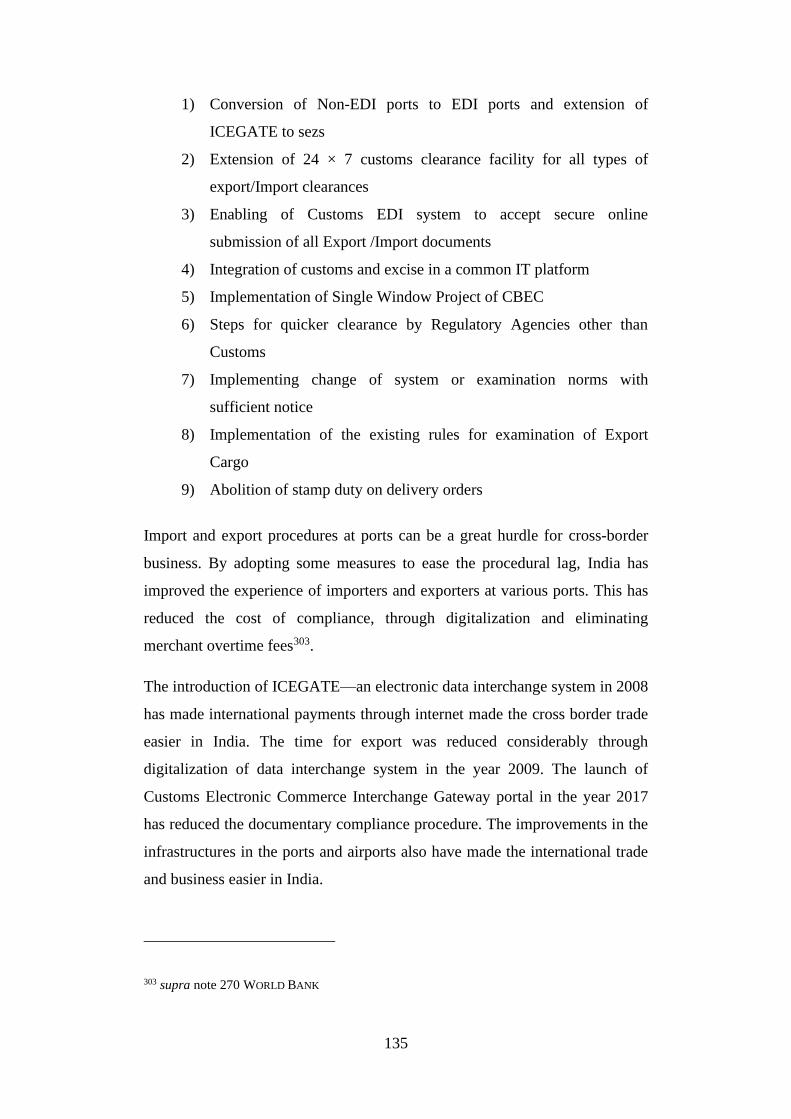
135
1) Conversion of Non-EDI ports to EDI ports and extension of
ICEGATE to sezs
2) Extension of 24 × 7 customs clearance facility for all types of
export/Import clearances
3) Enabling of Customs EDI system to accept secure online
submission of all Export /Import documents
4) Integration of customs and excise in a common IT platform
5) Implementation of Single Window Project of CBEC
6) Steps for quicker clearance by Regulatory Agencies other than
Customs
7) Implementing change of system or examination norms with
sufficient notice
8) Implementation of the existing rules for examination of Export
Cargo
9) Abolition of stamp duty on delivery orders
Import and export procedures at ports can be a great hurdle for cross-border
business. By adopting some measures to ease the procedural lag, India has
improved the experience of importers and exporters at various ports. This has
reduced the cost of compliance, through digitalization and eliminating
merchant overtime fees303.
The introduction of ICEGATE—an electronic data interchange system in 2008
has made international payments through internet made the cross border trade
easier in India. The time for export was reduced considerably through
digitalization of data interchange system in the year 2009. The launch of
Customs Electronic Commerce Interchange Gateway portal in the year 2017
has reduced the documentary compliance procedure. The improvements in the
infrastructures in the ports and airports also have made the international trade
and business easier in India.
303 supra note 270 WORLD BANK
136
4.2.8 ENFORCING CONTRACTS
The National Judicial Data Grid, introduced recently by the government of
India helps to generate case measurement reports on local courts. After
measuring the exact procedures used by litigants and courts to evict a tenant
for nonpayment of rent and to collect a bounced cheque, in 109 countries the
World Bank team has constructed and index of procedural Formalism of
dispute resolution for each country304. The article suggest that the formal
requirements systematically greater in civil law countries then common law
countries. It is also associated with higher duration of judicial proceedings,
less consistency, less honesty, less wireless in judicial decisions, and more
corruption. They have also observed that developing countries are more
suffered due to inefficient levels of procedural Formalism which they carry as
a legacy of legal transplantation from their colonial rulers.
The methodology takes into account the time taken for filing and service, trial
and judgment, and enforcement of the decision. The Other variables which
are considered include the cost of litigation covering the average attorney fees
Court fees and other related payments made to the court. The quality of
judicial process index measures the good practices adopted in the court system
in four major areas of court structure and proceedings, case management,
courtroom automation and alternative dispute resolution305.
The Energy sector entirely depends on the efficient enforcement of power
purchase agreements. The poor enforcement mechanisms has raised the
concerns for an investor regarding the dishonor of power purchase
agreements.
304 S. Djankov et al., Courts, 118 Q. J. ECON. 453–517 (2003), https://academic.oup.com/qje/
article-lookup/doi/10.1162/003355303321675437 (last visited Jun 5, 2018).
305 WORLD BANK, METHODOLOGY FOR ENFORCING CONTRACTS-DOING BUSINESS,
http://www.doingbusiness.org/Methodology/Enforcing-Contracts (last visited Jun 5, 2018).
137
4.2.9 RESOLVING INSOLVENCY
The Insolvency and Bankruptcy Code 2016 is a Landmark legislation which
will bring systematic reforms in India's insolvency regime and the quantum
leap in the functioning of India's credit market. The historic legislation was
passed by Lok Sabha on 5th May 2016 and was subsequently passed 11th May
2016 by the Rajya Sabha.
Prior to the new code, the Indian insolvency landscape was ruled by multiple
legislations. The recovery action by creditors work done through the Indian
Contract Act 1872 or Transfer of Property Act 1882. There were few special
legislation which were enacted during the last century which also did not
reduce the peril of the creditor and the lender306. These legislations include:
1) Recovery of Debts Due to Banks and Financial Institutions Act, 1993
2) Securitisation and Reconstruction of Financial Assets and Enforcement
of Security Interest Act, 2002,
3) Sick Industrial Companies (Special Provisions) Act, 1985
4) Companies Act, 1956
5) Presidential Towns Insolvency Act, 1909
6) Provincial Insolvency Act. 1920.
The average time taken by these legislations to resolve insolvency matters in India
was about 4.3 years as on 2015. This was much higher compared to advanced
economies like United Kingdom and the United States of America where it took
only 1 year and 1.5 years respectively. The procedural lags in the court and the
lack of clarity on the bankruptcy framework caused much of the delay.
The new code envisages to promote entrepreneurship availability of credit and
balance the interests of debtors and creditors. It consolidates all the existing
laws relating to reorganization and insolvency resolution of Corporate persons
partnership firms and individuals. Another important feature of the new law is
306 PRS Blog, The Insolvency and Bankruptcy Code: All you need to know, PRS INDIA,
http://www.prsindia.org/theprsblog/?p=3642 (last visited Jun 6, 2018).
138
the maximization of the value of the assets through at time-bound resolution of
insolvency disputes307.
According to the Ministry of Finance, Government of India the salient features
of the new insolvency and bankruptcy code are as follows308:
i. Clear, coherent and speedy process for early identification of financial
distress and resolution of companies and limited liability entities if the
underlying business is found to be viable.
ii. Two distinct processes for resolution of individuals, namely- “Fresh
Start” and “Insolvency Resolution.”
iii. Debt Recovery Tribunal and National Company Law Tribunal to act as
Adjudicating Authority and deal with the cases related to insolvency,
liquidation and bankruptcy process in respect of individuals and
unlimited partnership firms and in respect of companies and limited
liabilities entities respectively.
iv. Establishment of an Insolvency and Bankruptcy Board of India to
exercise regulatory oversight over insolvency professionals, insolvency
professional agencies and information utilities.
v. Insolvency professionals would handle the commercial aspects of
insolvency resolution process. Insolvency professional agencies will
develop professional standards, code of ethics and be first level
regulator for insolvency professionals members leading to development
of a competitive industry for such professionals.
vi. Information utilities would collect, collate, authenticate and disseminate
financial information to be used in insolvency, liquidation and
bankruptcy proceedings.
vii. Enabling provisions to deal with cross-border insolvency.
307 The Insolvency and Bankruptcy Code, 2015, , http://www.prsindia.org/uploads/media/
Bankruptcy/Insolvency and Bankruptcy code, 2015.pdf (last visited Jun 6, 2018).
308 MINISTRY OF FINANCE, PARLIAMENT PASSES THE INSOLVENCY AND BANKRUPTCY CODE
(May 11th, 2016), http://www.pib.nic.in/newsite/ PrintRelease. aspx?relid=145286 (last
visited Jun 6, 2018).
139
Corporate reorganizations were earlier dealt by the provisions of companies
Acts enacted from time to time. Today India has a more specific legislation on
the subject. The Insolvency Act is an attempt to provide a legal framework to
facilitate corporate insolvency. The law helps corporate to reorganize itself
and allowing to restructure debts.
4.2.10 LABOR MARKET REGULATION
India has witnessed some important amendments to many of its archaic labor and
industrial laws. This has improved the conditions of many industries which were
otherwise threatened by the more liberal and employee focused labor laws309.
Indian Labour Markets are regulated by more than 30 legislation.310
A comprehensive Labour Law reform involves substantial reforms in existing
legislation, administrative mechanism, and e-governance initiatives to
generate job and facilitate ease of doing business. The government envisages
Legislative reforms through codification of laws relating to wages, social,
security, and welfare, occupational safety, health and working conditions311.
Based on the recommendations of the second National Commission on labour
the existing labour laws will be grouped into four labour codes. They are
labour code on wages, code of Industrial Relations, Code of social security &
welfare, and occupational safety, health and working conditions. The labour
code on wages has been introduced in Lok Sabha on 10 8 2017 which is refer
to the parliamentary standing committee on labour.
According to the Ministry of Labour and Employment, there are a number of
measures being taken to improve the labour market conditions312.
309 World Bank Group, Reforming to Create Jobs, http://www.doingbusiness.org/~/media/
WBG/DoingBusiness/Documents/Annual-Reports/English/DB2018-Full-Report.pdf (last
visited Jun 2, 2018).
310 P. K. PADHI, LABOUR AND INDUSTRIAL LAWS 15 (2011)
311 MINISTRY OF LABOUR & EMPLOYMENT, LABOUR LAW REFORMS-EMPLOYMENT,
https://labour.gov.in/labour-law-reforms (last visited Jun 6, 2018).
312 MINISTRY OF LABOUR & EMPLOYMENT, INITIATIVES OF CENTRAL GOVERNMENT,
https://labour.gov.in/initiatives-central-government (last visited Jun 6, 2018).
140
4.2.10.1 Legislative Initiatives
Payment of Bonus Amendment Act has amended and increased the eligibility
limit for payment of bonus from ` 10000/- to ` 21000/- per month and the
Calculation Ceiling from ` 3500/- to ` 7000/- or the minimum wages. Payment
of Wages (Amendment) Act, 2017 was introduced for enabling the payment of
Wages to employees by Cash or Cheque or crediting it to their bank account.
Child Labour (Prohibition and Regulation) Amendment Act, 2016 has brought a
complete ban on employment of children below 14 years in any occupation or
process in line with the government policy for universal compulsory education for
children below the age of 14. Maternity Benefit Amendment Act, 2017, increased
the paid maternity leave from 12 weeks to 26 weeks and the Employee
Compensation (Amendment) Act has rationalized penalties and strengthened the
rights of the workers under the Act. The Payment Of Gratuity (Amendment) Act,
2018, ensured flexibility in ceiling limit of gratuity and the calculation of
continuous service for the purpose of gratuity in case of female employees who
are on maternity leave. Vide Notification dated 29th March 2018, the ceiling
limit of gratuity has been increased from ` 10 Lakh to 20 Lakh and this period of
maternity leave for calculation purpose has been enhanced from 12 weeks to 26
weeks.
4.2.10.2 Governance Reforms
Ease of Compliance to maintain Registers under various Labour Laws Rules,
2017 was notified on 21st February 2017 replacing 56 Registers/Forms under 9
Central Labour Laws and Rules into 5 common Registers/Forms. This
measure is expected to ease compliance requirements under the Labour laws
and social security regime in India.
The Model Shops and Establishments (RE&CS) Bill, 2016 has been prepared
and circulated to all States governments and Union territories for adoption in
their respective states which will bring uniformity in the processes and
procedures. Establishments can function for 365 days in a year without any
restriction on opening/closing time under the proposed bill.
141
The Industrial Employment (Standing Orders) Act, 1946, extended the Fixed
Term Employment, with all Statutory Benefits, to all Sectors. This will give
some amount of flexibility to the employers to employ workers through the
Industrial Employment (Standing Orders) Central (Amendment) Rules,
2018.The number of Forms / Returns under 3 Central Acts / Rules were
reduced from 36 to 12 by through notification dated 28.03.2017 in the year
2017.
4.3 VARIOUS LAWS COMPLIMENTING THE GROWTH OF THE
SECTOR
A detailed evaluation of the above parameters and various other legislations
complimenting the growth of the sector will be examined and evaluated in the
context of investments in renewable energy sector.
4.3.1 BANKING AND FINANCIAL SECTOR REGULATIONS
Since the focus of the chapter is how various legislation, government policies,
and regulations make it easy for the investor to do the business in the sector,
the banking and financial sector regulations play an important role. It is the
financial sector regulations which will affect the way an investor can mobilize
his finances. It is thus important to keep the financial regulations in pace with
the growing requirements of the economy.
4.3.1.1 The Regulatory Framework for Banking and Finance a brief
overview
Banks are fundamental to differential system of a country. Reserve Bank of
India being the central bank is bestowed with the responsibility of ensuring the
safety and security of the banking system in India. Reserve Bank has been
successful throughout its years of spearheading the financial sector regulation
in maintaining the stability and public confidence in the system. The Reserve
Bank of India is mandated to protect the interest of the depositor”s,
development and orderly conduct of the banking operations and fostering the
health of the banking system and its stability. Indian banking sector regulation
142
Hollywood with the development in the Indian and international banking
system and also through adoption of and best practices313.
The Reserve Bank of India apply various tools of regulations such as statutory,
prudential norms and other regulatory guidelines. A bank need to obtain licenses
for opening its business in India. It also requires authorizations from the Reserve
Bank for opening branches across India. Reserve Bank of India also given the
entry and expansion of foreign banks into India. The key functions of Reserve
Bank include policy formulation review and implementation of prudential norms
market and operational risk etc. Reserve Bank also monitor the requirements of
SLR and CRR by the banks. Anti-money laundering and financial terrorism are
tackled by stringent KYC norms. Reserve Bank also regulate other non-banking
Financial Institutions involved in the financial market.
4.3.1.2 Renewable Energy and Banking Regulations
Reserve Bank of India has recognized the importance of renewable energy
sector and its growing financial requirements. In order to Promote Investments
in the sector Reserve Bank has promulgated directives. Reserve Bank through
its notification dated 23rd April 2015 has included renewable energy sector as
7th item in the list of priority lending sectors.
4.3.1.2.1 Priority sector lending
Reserve Bank of India from time to time issues guidelines for priority sector
lending. On April 23rd, 2015 Reserve Bank of India has issued new
guidelines for priority sector lending. The Master Circular on priority sector
lending- targets and classification has consolidated all the current instructions
on priority sector lending314.
The new guidelines Issued on April 2015 has brought renewable energy sector
under priority sector lending vide regulation 4 of the master circular. According
to the new guidelines enshrined under regulation 12 of the Master Circular.
313 Reserve Bank of India, Reserve Bank of India - Function Wise Monetary (2018),
https://www.rbi.org.in/scripts/FS_Overview.aspx?fn=2752# (last visited Jun 3, 2018).
314 RBI priority sector lending targets and classification, Priority sector Lending Guidelines,
April 23, 2015 Reserve Bank of India 1–17 (2015).
143
Borrowers installing various renewable energy power plants can avail up
to rupees 15 crore as bank loans. Remote village electrification and non-
conventional energy based public utilities such as Street lighting systems are
also eligible under this scheme. Individual household can avail loans up to
rupees 10 lakh per borrower.
Priority sector lending targets are fixed based on adjusted net bank credit
(ANBC) or credit equivalent amount of-of balance sheet exposure. ABC
denotes the outstanding bank credit in India as prescribed in item number VI
of form a under section 42 close to of The Reserve Bank of India Act 1934
reduced by bills discounted with Reserve Bank of India and other approved
Financial Institutions added by permitted non SLR bonds or debentures which
are eligible to be treated as part of priority sector lending.
According to the new guidelines, domestic commercial banks have a Priority
sector lending target of 40% of a ANBC or credit equivalent amount of
balance sheet exposure whichever is higher.
Commercial banks are obligated to provide an acknowledgment for loan
applications and also communicate with the applicant the time within which a
decision on the application will be intimated to the applicant. This measure
ensure that timely availability of credit for the investors and allows them to
plan their business activities accordingly.
4.3.1.2.2 Priority sector lending certificates
Assets originated by banks classified under the respective categories of
priority sector are eligible for the fulfillment of priority sector lending. Banks
which purchase priority sector lending certificates from other banks can use
them to meet priority sector lending targets, as per regulation 18 of the Master
Circular. Priority sector lending certificates PSLC is a mechanism whereby the
banks can achieve the targets fixed under priority sector lending guidelines in
the event of any short form through purchase of these certificates. The
mechanism is beneficial to other banks as well who have achieved more than
the required targets under the priority sector lending scheme. Under the PSLC
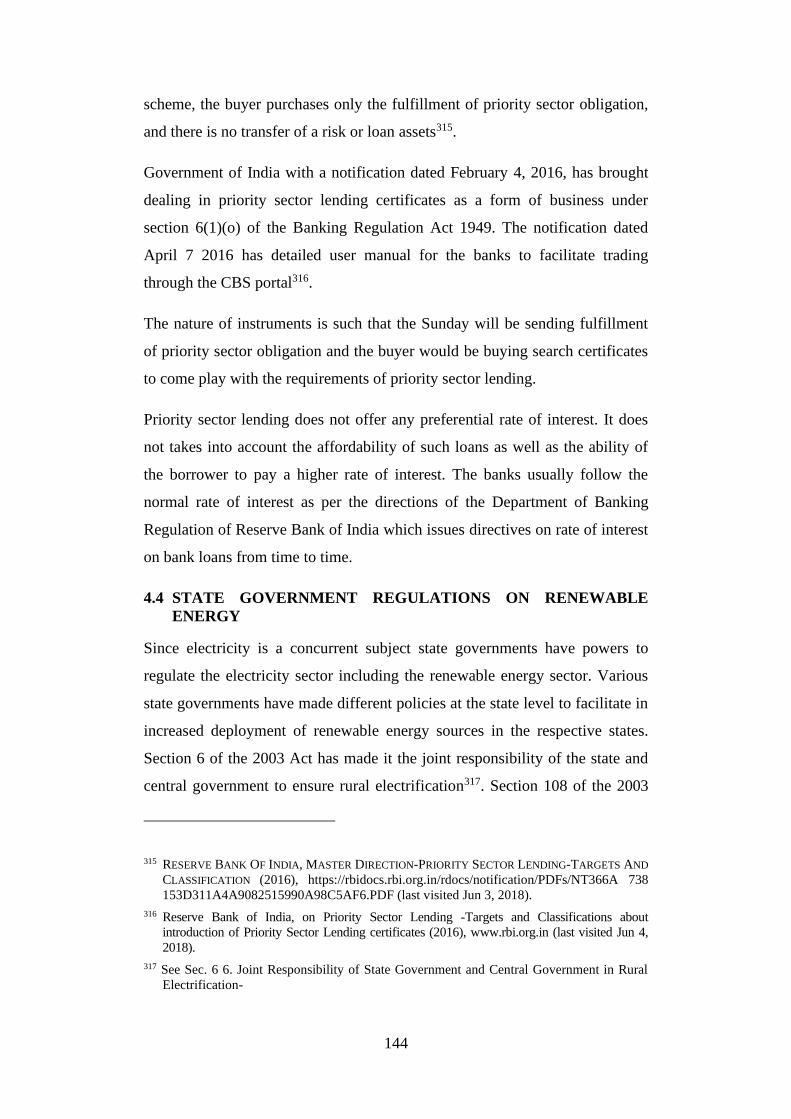
144
scheme, the buyer purchases only the fulfillment of priority sector obligation,
and there is no transfer of a risk or loan assets315.
Government of India with a notification dated February 4, 2016, has brought
dealing in priority sector lending certificates as a form of business under
section 6(1)(o) of the Banking Regulation Act 1949. The notification dated
April 7 2016 has detailed user manual for the banks to facilitate trading
through the CBS portal316.
The nature of instruments is such that the Sunday will be sending fulfillment
of priority sector obligation and the buyer would be buying search certificates
to come play with the requirements of priority sector lending.
Priority sector lending does not offer any preferential rate of interest. It does
not takes into account the affordability of such loans as well as the ability of
the borrower to pay a higher rate of interest. The banks usually follow the
normal rate of interest as per the directions of the Department of Banking
Regulation of Reserve Bank of India which issues directives on rate of interest
on bank loans from time to time.
4.4 STATE GOVERNMENT REGULATIONS ON RENEWABLE
ENERGY
Since electricity is a concurrent subject state governments have powers to
regulate the electricity sector including the renewable energy sector. Various
state governments have made different policies at the state level to facilitate in
increased deployment of renewable energy sources in the respective states.
Section 6 of the 2003 Act has made it the joint responsibility of the state and
central government to ensure rural electrification317. Section 108 of the 2003
315 RESERVE BANK OF INDIA, MASTER DIRECTION-PRIORITY SECTOR LENDING-TARGETS AND
CLASSIFICATION (2016), https://rbidocs.rbi.org.in/rdocs/notification/PDFs/NT366A 738
153D311A4A9082515990A98C5AF6.PDF (last visited Jun 3, 2018).
316 Reserve Bank of India, on Priority Sector Lending -Targets and Classifications about
introduction of Priority Sector Lending certificates (2016), www.rbi.org.in (last visited Jun 4,
2018).
317 See Sec. 6 6. Joint Responsibility of State Government and Central Government in Rural
Electrification-
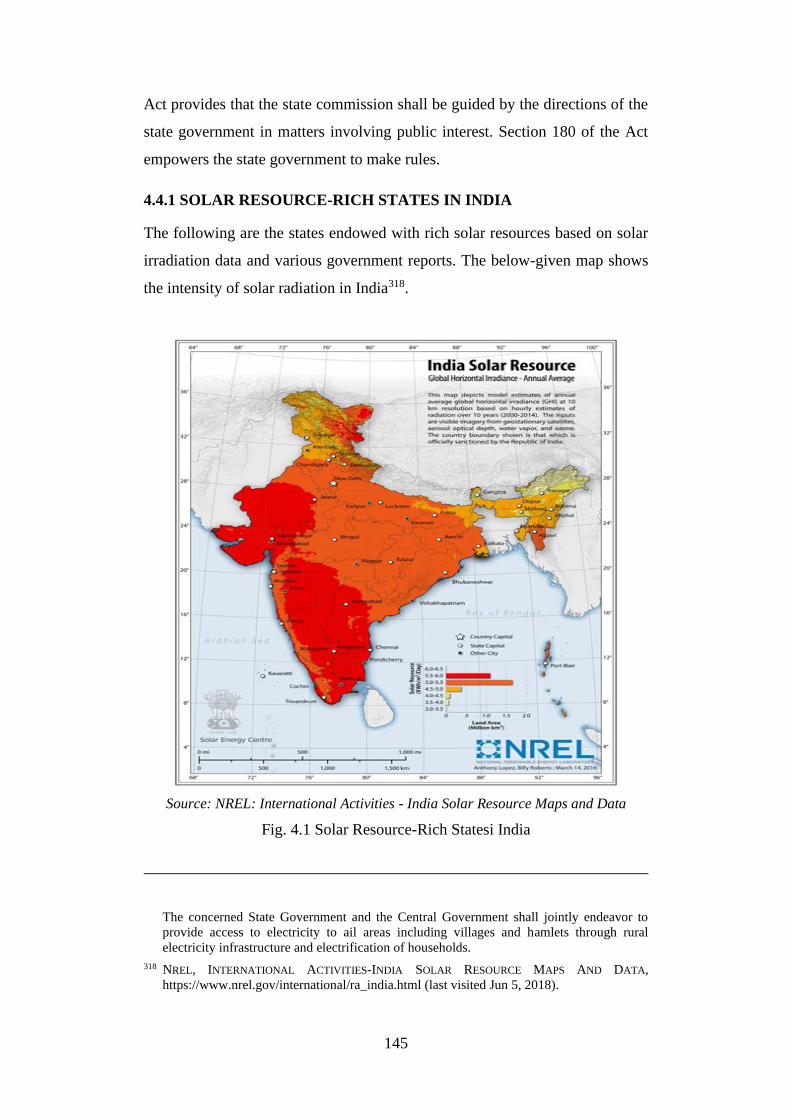
145
Act provides that the state commission shall be guided by the directions of the
state government in matters involving public interest. Section 180 of the Act
empowers the state government to make rules.
4.4.1 SOLAR RESOURCE-RICH STATES IN INDIA
The following are the states endowed with rich solar resources based on solar
irradiation data and various government reports. The below-given map shows
the intensity of solar radiation in India318.
Source: NREL: International Activities - India Solar Resource Maps and Data
Fig. 4.1 Solar Resource-Rich Statesi India
The concerned State Government and the Central Government shall jointly endeavor to
provide access to electricity to ail areas including villages and hamlets through rural
electricity infrastructure and electrification of households.
318 NREL, INTERNATIONAL ACTIVITIES-INDIA SOLAR RESOURCE MAPS AND DATA,
https://www.nrel.gov/international/ra_india.html (last visited Jun 5, 2018).
146
Source: NITIAyog, State Renewable Energy Capacity Addition Roadmap
Fig. 4.2 Focus States
NITI Ayog the planing and policy making body of the government of India, in
its report titled “State Renewable Energy Capacity Addition Roadmap,” has
identified the following states as resource-rich states319.
4.4.2 ANDHRA PRADESH
Andhra Pradesh initiated Power sector reforms in the year 1998 .The current
installed capacity of electricity in the state is 16294 megawatt, of which
44.4 percent comes from coal-fired power plants 10.6 percent from hydro
7 percent from gas and 37.1 percent of electricity is produced from renewable
energy sources320.
The national renewable energy target for 2022 has apportioned 8 percent of
the contribution from Andhra Pradesh amounting to 14000 megawatt of
renewable energy. But the state has fixed itself a higher target of 10000-
319 State Renewable Energy Capacity Addition Roadmap, (2018), http://indiaenergy.gov.in/
wp-content/uploads/2017/10/Executive-Summary.pdf (last visited Jun 5, 2018).
320 Res, ALL INDIA INSTALLED CAPACITY (IN MW) OF POWER STATIONS 1155 (2016),
http://www.cea.nic.in/reports/monthly/installedcapacity/2016/installed_capacity-03.pdf (last
visited Jun 7, 2018).
147
megawatt solar power and 8000 megawatt of wind power321. Ministry new
and renewable energy Government of India has estimated a total of 82.5
gigawatt of renewable power from the state. This shall be the combined output
of 44 gigawatt of wind and 38.5 gigawatt of solar power.
At micro level, the renewable energy purchase obligation target met in the
state with 10 percent of the electricity consumed in the state coming from
renewable energy sources. The state is expected to achieve 15 percent of its
Total energy demand to be met through solar by the year 2022.
The solar policy 2015322 is an initiative by the Andhra Pradesh government in
order to increase the deployment of solar energy projects has created a
favorable environment in the state. The state has made considerable
improvements in the sector by introducing solar Park scheme, e-auction and
successfully reduced the Solar tariffs below Rupees 4 per kwh.
After the successful bidding of large solar parks with thousand megawatt
capacities, the state is now considering deployment of mini-grids, to augment
the renewable energy capacity.
The key policy initiatives of the state which contributed for the growth of the
sector in the state include exemption from electricity duty, wheeling and
transmission charges for captive uses within the state, CSS, 100 percent banking
facility, CDM benefits and PCB clearances323.
4.4.2.1 Andhra Pradesh solar wind hybrid policy
Even though the policy is in a draft form it offers great hope for the growth of
the industry. The policy has many objectives for the promotion of grid-
321 Jawaharlal Nehru National Solar Mission Towards Building SOLAR INDIA,
https://mnre.gov.in/sites/default/files/uploads/mission_document_JNNSM.pdf (last visited
Jun 7, 2018).
322 MINISTRY OF NEW AND RENEWABLE ENERGY, SOLAR AND WIND POWER POLICIES, 2015
OF ANDHRA PRADESH RELEASED AT RE-INVEST 2015 (Feb. 15th, 2015) http://pib.nic.in/
newsite/PrintRelease.aspx?relid=115480 (last visited Jun 7, 2018).
323 Centre for Sustainable Agriculture, Andhra Pradesh state policy on organic farming, INDIA
ENVIROMENT PORTAL (July 26th 2008), http://www.indiaenvironmentportal. org.in/content/
269874/andhra-pradesh-state-policy-on-organic-farming/ (last visited Jun 7, 2018).
148
connected wind solar PV systems for the optimal utilization of the land and
infrastructure. The policy envisages to achieve better grid stability with
cogeneration of wind and solar targeting 3000 megawatt of hybrid grid
integrated power plants by 2019-20324. The policy on this is categorized into
three parts where the first part proposes to combine generation of power at
existing or new solar or wind power projects. The second category is big
located addition of wind or solar at in the connection points of pooling stations
of the existing solar or wind installations. The third category consist of adding
Windows 16 after interconnection. Of pooling of the existing wind or solar
installations and this is called co-injection. To make this policy attractive the
government has offered exemption of distribution losses IV injection of power
at 33 kilowatt voltage or below, exemption of T&D charges for wheeling,
100 percent banking of energy for the period of 12 months, exemption of CSS
for third party sale within the state for a period of 5 years in cases of power
sale to an Andhra Pradesh Distribution Company325.
The steering committee of the state for this state roadmap for renewable
energy for 2022 has held It’s last meeting at Amravati on May 23rd 2017.
The committee has identified the following measures required for the state to
achieve the target for 2022326.
1) The state will focus more on the energy storage with subsidy support
from the central government to meet the high cost of batteries in the
initial stages
2) The state require more incentives from the central government to
meet RPO targets
324 ANDHRA PRADESH WIND-SOLAR HYBRID POWER Policy–2016, http://nredcap.in/
PDFs/Downloads/Draft_modified_wind_solar_hybrid_policy_10_08_2016.pdf (last visited
Jun 7, 2018).
325 Hoskote Nagabhushanam, Andhra Pradesh’s solar-wind park is largest, DECCAN
CHRONICLE (Dec. 2nd 2017), https://www.deccanchronicle.com/nation/current-
affairs/021217/andhra-pradeshs-solar-wind-park-is-largest.html (last visited Jun 7, 2018).
326 supra note 321 SOLAR INDIA.
149
3) The state will make provision for power system development fund
and encourage pumped storage scheme 4 natural storage of green
intermittent power
4) The stage will reconsider further addition of conventional power
sources in the background of reduced demand growth and twin
corporate more Green Power in the capacity addition
5) The excess renewable power produced in the state will be sold to
Central Agencies to distribute to renewable energy deficit States
4.4.3 GUJARAT
Gujarat is one state which is rich in Renewable Energy potential. The radiation
data suggest that Gujarat is receiving 300 days of sunshine and abundant land
resource. Gujarat has limited hydropower potential and thermal power plants
based on coal is not a viable option because the coal is sourced from the
eastern parts of India about thousand 500 km away.
Currently about 52.8 percent of the installed capacity is based on coal-fired
thermal power plants. Hydropower contributes a mere 2.9 percent, nuclear
2.1 % and the gas 17.2 percent. 25 percent of the installed capacity of electricity
is from renewable energy327.
The state is expecting to expand the renewable energy at an average
annualized rate of 7.1 %. This would help the state to increase its renewable
energy capacity to 17133 megawatt by 2022328. The state has a renewable
purchase obligation of 19 % which is a driving force for capacity addition. To
meet the RPO the state require 16 gigawatt of renewable energy by 2022. The
annualized growth rate of renewable energy in the state is 22 % since 2011329.
The challenges the sector face in the state include the need to strengthen areas
like ease of doing business, incentives to the renewable sector and revised
327 supra note 320 RES.
328 supra note 321 SOLAR INDIA.
329 supra note 320 RES.
150
RPO as per National tariff policy. The non compliance of RPO by DISCOMshas
increased the of take risk for developers. The lack of stability in the system
due to increased Renewable Energy share in the electricity mix need to be
addressed.
The past measures like feed-in tariff fast approvals and clearances exemption
from electricity duty has helped the growth of the sector in this state. Today
the state is providing policy and regulatory support along with financial
incentives. The Gujarat electricity regulatory Commission has issued requirement
of renewable energy regulation, which has established RPO targets in each
category of renewable source for the obligated entities. As per this solar
rooftop net metering regulation and Solar pump schemes power generated can
be used for captive consumption and the excess power generated can be sold
to distribution companies or third parties.
In the future the state will focus on meeting its own RPO target and also on a
excess renewable energy to other states. The working group of the state has
made some suggestions for the growth of the sector. Improve the ease of
doing bye notifying RPO trajectory, strengthen the incentives identify and
address operational challenges while implementing renewable energy projects.
The group also recommended to improve flexibility in the system to observe
17 gigawatt of renewable energy India grid. Renewable energy forecasting
tools and monitoring tools for grid management and reduce errors in
scheduling the generation is considered an important measure to be
implemented. The state also will focus on developing CTU connected
renewable energy projects to facilitate interstate trade of renewable energy.
State recommends document the transmission network at the state and Central
level for efficient evacuation of renewable energy produced. The working
group also suggest to move away from subsidy based Business models. It is
also proposed faster implementation of renewable generation obligation and
development of distributed solar projects the balance regional demand
requirements through innovation Business models.
151
4.4.4 KARNATAKA
Karnataka has an installed capacity of 21208 megawatt, of which 45.1 percent
thermal energy 17 percent hydro, 3.3 % nuclear and 34.7 percent comes from
renewable energy sources. The Karnataka Electricity Reforms Act 1999 made
major reforms in the power sector including separation of entities for
generation and distribution. State was successful in bringing down peak
demand energy deficits from 13.5 percent in 2013 to 0.2 percent in 2017330.
Karnataka is also blessed with hydro and wind sources. 52 percent of the
renewable energy produced in the state is contributed by windmills and 16-18
percent from solar and cogeneration plants.
The state has announced solar and renewable energy policy to augment the
renewable energy capacity in the state. The state is also planning to add at
2000 megawatt solar capacity through a mega solar park in 2018-19. The
national renewable energy target for 2022 has decided the share of Karnataka
as 8.5 percent331. The Solar will contribute 38 percent and wind 42 percent.
Renewable energy constitutes 8 percent of the states energy supply. However,
the Loafer threshold of RPO at 3 percent need to be increased to 8 percent to
meet the renewable energy targets for 2022332.
Various challenges faced by the state include the possible surplus energy that
may be generated due to additional 2 GW of conventional sources of energy
which is planned. Balancing the demand and the resources through proper
planning is required. Do the state has planned for huge capacity addition, it
cannot exploit its renewable energy potential to the fullest due to challenges in
grid integration and lack of infrastructure for evacuation of energy produced.
The need of a long-term energy security is recognized by the Karnataka
renewable energy policy 2009-14. The policy has set ambitious targets for
330 supra note 320 RES.
331 supra note 321 SOLAR INDIA.
332 Id.
152
renewable energy. Government of Karnataka promotes setting up of
renewable energy projects under 3 categories
1) Feed-intariff-based or competitive bidding based projects
2) Captive and independent power producers mechanism
3) REC mechanism
Karnataka renewable energy policy 2014- 2021 provides for a comprehensive
solar policy 2014-2021. Renew policy envisages to achieve 3 percent
contribution from solar energy. The new policy has established the following
targets by 2021.
1) Capacity addition of 2000 megawatt from solar
2) Translate Karnataka into an investor-friendly state
3) Encourage PPP model in renewable energy sector
4) Pramod new technologies and Solar rooftop power plants
5) Off-grid decentralized generation and distribution of electricity
6) Develop skill promote R and d and innovation.
Karnataka currently promotes net and gross metering and grid-connected solar
rooftop projects. Karnataka electricity regulatory Commission has issued
tariff orders for net and gross metering. Other incentives include exemption
from pollution control board clearance, deemed conversion of land for solar
projects, and reduction of supervision charges to 5 percent by electricity
supply companies (escoms)333.
The government has also meet the draught of Karnataka renewable energy
policy 2016-22. The policy envisages capacity addition of 4000 megawatt by
2022 in a phased manner with no contribution from wind power. Develop
infrastructure for interstate and intrastate Business models.
The new policy focuses on solar projects including large-scale solar parks. The
state also plans interstate balancing facilities and industrial power supply to
333 GOVERNMENT OF KARNATAKA, SOLAR POLICY 2014-2021, https://mnre.gov.in/ file-
manager/UserFiles/state-power-policies/Karnatava-Solar-Power-Policy_2014-2021. pdf
(last visited Dec 4, 2018).
153
contribute significantly to support renewable energy deficit States utilizing the
rich potential of renewable energy it has.
The status looking for subsidy support from the central government to focus
on energy storage on large scale. State also recommend the central
government to provide incentives to the states to meet the renewable
purchase obligation target. It also demand the central government to provide
air corridor for better inter-State Power transfer.
4.4.5 WEST BENGAL
The policy on cogeneration and generation of electricity from renewable
sources of energy a policy document issued by the department of power and
non-conventional energy sources, government of West Bengal, envisages
ensuring in green generation of electricity for future generations. West Bengal
electricity regulatory Commission (WBERC) has come up with the cogeneration
and generation of electricity from renewable sources of energy regulations 2013
to facilitate growth in renewable energy sector. The set regulations mandates that
a consumer of electricity can install a grid-connected rooftop solar PV plant if the
installed capacity is at least 5 kilowatt334.
Solar photovoltaic as one of the focus areas under the new policy. Government
has set targets for itself for achieving Rooftop And grid Connected power
generation targets. The policy envisages decentralized distributed generation
for all remote and non-electrified villages. Projects shall be under Rajiv
Gandhi GrameenVidyutikaranYojana in the 11th plan and other related
directors issued by the Ministry of Power Government of India in this regard.
The policy provides for competitive building for allotment of projects. Bidders
who qualify by fulfilling the Minimum requirements will be I”ll Tibet for
various projects. The policy also allows bidding for part capacity of a
334 Department of Power & Nonconventional Energy Sources & Govt. of West Bengal, Policy
on Co-generation and Generation of Electricity from Renewable Sources of Energy
Department of Power & Nonconventional Energy Sources, Govt. of West Bengal (2012),
http://www.wbreda.org/wp-content/uploads/2012/06/policy-renewable-wb.pdf (last visited
Jun 4, 2018).
154
specified project. For facilitating deployment of renewable energy projects the
government land vested with the government for a period of 30 years or for
the entire project life whichever is less. The nodal agency for all clearances
through a single window system is the West Bengal Green Energy Development
Corporation Limited (WBGEDCL)335.
A successful bidder shall commence the project installation within six months
after getting all clearances. The nodal agency is empowered to closely monitor
the progress of the work. The developer is also under an obligation to
commission the project within such period as stipulated in the agreement.
4.4.5.1 Green Energy Fund
The nodal agency is responsible to setup a green energy fund for providing
financial assistance to renewable energy projects in the state. The seed capital
for the fund comes from the contributions of the state government and
international agencies. The nodal agency is mandated to ensure the self-
sustainability of the fund by generating adequate revenue using the initial seed
capital336.
In addition to the above, the following benefits are also extended to the
developer by the policy. All the concessions and incentives, generation based
incentives etc allowed by the MNRE, GoIwill ipso facto extended to the
developer by the government of west bengal. The distribution utilities will
extend the letter of credit facility to the developer for financial requirements.
The cost for such letter of credits are met by the green energy fund.
4.4.5.2 Other incentives
Other incentives provided by the government of West Bengal include
exemption of demand cut up to 50 percent of the installed capacity assigned
335 WBREDA, WELCOME, http://www.wbreda.org/ (last visited Nov 30, 2018).
336 WEST BENGAL ELECTRICITY REGULATORY COMMISSION, West Bengal Electricity
Regulatory Commission (Cogeneration and Generation of Electricity from Renewable
Sources of Energy) Regulations, 2013 (2013), https://mnre.gov.in/file-manager/
UserFiles/Grid-Connected-Solar-Rooftop-policy/West_Bengal_ERC_ Notification_ 2013.pdf
(last visited Jun 4, 2018).
155
for captive use. Distribution utilities are obligated to provide revolving letter
of credit from a nationalized bank asset payment security mechanism for the
developers337. Where projects are located at remote places the government is
under obligation to provide infrastructural support including approach roads.
Net metering support is available to solar rooftop systems connected with the
grid.
West Bengal Renewable Energy Development Agency (WBREDA) was
formed in the year 1993 and is empowered with the mandate to develop
renewable energy in the state338. The West Bengal policy on renewable energy
was introduced in 2012 and is still in force339. The West Bengal green energy
Development Corporation Limited (WBGEDCL) is the nodal agency for
development of renewable energy in the state.
4.4.5.3 Role of WBGEDCL
The nodal agency is responsible to maintain a database of all the RE projects
in the state. They are mandated to promote private sector investment and
involvement. Vishal also assest the developers in getting various incentives
for implementation of projects340. WBGEDCL conducts studies for renewable
energy resource assessment, Identification and creation of land Bank,
manage green energy fund and solicitation of the project based competitive
bidding341.
The WBSERC has set the following RPOs from time to time to promote the
market for RE
337 Id.
338 supra note 335 WBREDA,
339 Department of Power & Nonconventional Energy Sources & Govt. of West Bengal,
POLICY ON CO-GENERATION AND GENERATION OF ELECTRICITY FROM RENEWABLE
SOURCES OF ENERGY (2012), http://www.wbreda.org/wp-content/uploads/2012/06/policy-
renewable-wb.pdf (last visited Jun 4, 2018).
340 Id.
341 WBREDA, RENEWABLE ENERGY POLICY OF WEST BENGAL, http://www.wbreda.org/renewable-
energy-policy-of-west-bengal/ (last visited Jun 4, 2018).
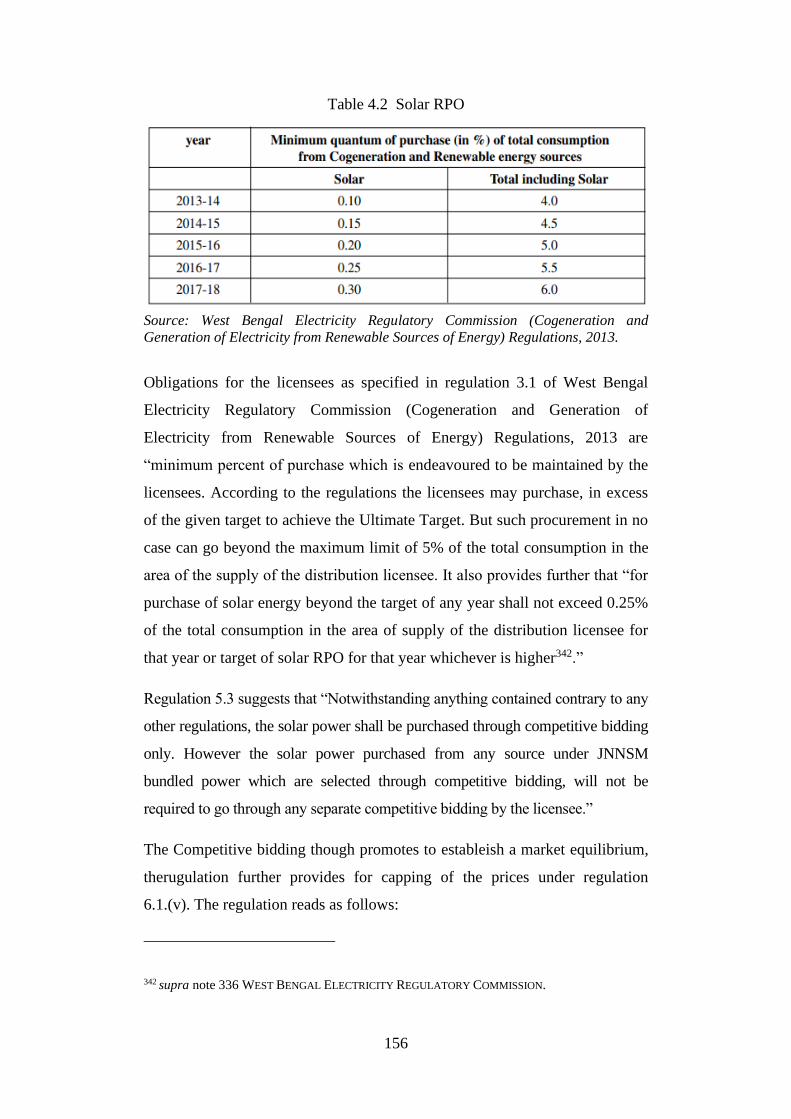
156
Table 4.2 Solar RPO
Source: West Bengal Electricity Regulatory Commission (Cogeneration and
Generation of Electricity from Renewable Sources of Energy) Regulations, 2013.
Obligations for the licensees as specified in regulation 3.1 of West Bengal
Electricity Regulatory Commission (Cogeneration and Generation of
Electricity from Renewable Sources of Energy) Regulations, 2013 are
“minimum percent of purchase which is endeavoured to be maintained by the
licensees. According to the regulations the licensees may purchase, in excess
of the given target to achieve the Ultimate Target. But such procurement in no
case can go beyond the maximum limit of 5% of the total consumption in the
area of the supply of the distribution licensee. It also provides further that “for
purchase of solar energy beyond the target of any year shall not exceed 0.25%
of the total consumption in the area of supply of the distribution licensee for
that year or target of solar RPO for that year whichever is higher342.”
Regulation 5.3 suggests that “Notwithstanding anything contained contrary to any
other regulations, the solar power shall be purchased through competitive bidding
only. However the solar power purchased from any source under JNNSM
bundled power which are selected through competitive bidding, will not be
required to go through any separate competitive bidding by the licensee.”
The Competitive bidding though promotes to estableish a market equilibrium,
therugulation further provides for capping of the prices under regulation
6.1.(v). The regulation reads as follows:
342 supra note 336 WEST BENGAL ELECTRICITY REGULATORY COMMISSION.
157
The capped price of energy for grid connected Solar PV power plants
(including those plants which are availing accelerated depreciation benefit
under section 32 of the Income Tax Act, 1961) which are not eligible for any
incentive declared by MNRE, shall be ` 8.90 / kwh for sale to the licensees and
such price will be applicable for the grid connected Solar PV power projects
commissioned upto 2012-13 and shall remain valid for 25 years. The capped
price of energy and period of validity for grid connected Solar PV power
plants (including those plants which are availing accelerated depreciation
benefit under section 32 of the Income Tax Act, 1961) which are
commissioned after 2012-13 shall also be ` 8.90/ kwh for the projects
commissioned upto 2015 - 2016 or till the date as notified by the Commission,
whichever is earlier and shall remain valid for 25 years343.
Though the caping has been made at a higher price of 8.90, the existence of
such a mechanism in the policy framework itself poses a threat to the future
growth of the sector. Consequence of Non-compliance of Renewable &
Cogeneration Purchase Obligation is an action being initiated under section
142 of the Electricity Act 2003.
It can be seen that the penalties and punishments are not sufficient to enforce
the RPO in a stringent manner.
4.4.5.4 Challenges
The capacity requirement of 5 kilowatt required are higher investment and
higher space requirement a 5 kilowatt Solar Power Plant with 12 percent panel
efficiency may require 625 square feet of Shadow free a rooftop space. So the
benefit of this regulation cannot be availed buy small-scale investors. Only
investors with a higher generation capacity above 5 kilowatt are eligible to get
grid connectivity. The initial cost of Renewable energy projects like solar is
very high, and the requirement of security deposit with the government makes
343 Id.
158
the investor to mobilize more funds for his initial investments reducing the
return on capital.
4.4.6 UTTAR PRADESH
The new mini grid policy of the Government of Uttar Pradesh adopted in
2016344 has sped up electrification process in rural areas the new policy
facilitates electrification of rural areas through renewable energy and mini-
grid deployment. These Mini gifts will not have access to the national grid.
The benefit of the policy is extended only to unelectrified areas and not even
to low levels of electrified areas. The policy has Limited the maximum
capacity of each project to 500 kilowatt.
The meaning in IT project of the Government of Uttar Pradesh has laid down
comprehensive policy framework for the developers and operators to deploy
Mini grid projects under 2 models envisage by the policy.
In the first model, the state government or the Distribution Company will
identify the project location fix the customer tariff and specify the technical
requirements of the project. The developers in such cases will be entitled to a
30 percent of capital grant support. The developers are supposed to fulfilled
conditions such as 8 hours of supply of electricity for residential units and 6
hours of supply of electricity to commercial units. The developer shall also
confirm to the technical standards and specifications issued by the central
electricity authority and UPPCL. It is also mandatory that the developer
strictly follows electrical safety and security standards.
The second model does not provide any capital grant support to the developer.
The developer can choose a project location of his choice with the tariff at
which the power is distributed to the customer. The development of this
344 Government of Uttar Pradesh, UTTAR PRADESH MINI GRID POLICY 2016, http://www.
upneda.org.in/mediagallery/Mini-Grid-Policy-2016.pdf (last visited Nov 30, 2018).
159
scheme may avail the benefits of the industrial policy and exit process which
is available in case of conventional grid access345.
1) Mini grid projects must be executed within certain time frames
2) 6 months in case of projects based on solar PV panels
3) Biomass and biogas plants within 9 months
4) Wind and other small scale power projects shall be completed
within one year
Uttar Pradesh net metering regulations came into force from 20th of March
2015.
Uttar Pradesh Solar Energy Policy 2017346 came into force in the year 2017 with
the objectives of encouraging private sector participation, providing affordable
and environment friendly power for all, promote research and development and
achieve 8% Solar RPO. The policy will be implemented as follows:
A. Utility Scale Grid-Connected Solar Projects
The utility Scale power projects will be of the following categories
a. Category-1 Solar Parks with a minimum size of 100 MW Capacity
i.Public Sector Solar Parks
ii.Private Sector Solar Parks
b. Category-2 Large Scale Standalone Solar Projects
The state government will bear the cost for construction of transmission
lines subject to the power produced.
c. Category-3 Large Scale Power Projects on Canals or Lakes
d. Category-4 Large Scale standalone solar projects for third party
captive purpose
B. Grid Connected Solar Rooftop Projects
345 UTTAR PRADESH NEW AND RENEWABLE ENERGY DEVELOPMENT AGENCY, MAJOR
PROGRAMMES UNDER GRID CONNECTION, http://www.upneda.org.in/ programmes-under-grid-
connection.aspx (last visited Nov 30, 2018).
346 Government of UTTAR PRAdesh, Uttar Pradesh Solar Energy Policy 2017,
http://www.upneda.org.in/MediaGallery/Uttar_Pradesh_Solar_Energy_Policy-
2017_English__0.pdf (last visited Nov 30, 2018).
160
The project developers will be incentivized through net metering or gross
metering. This policy will be largely focused on government/semi
government/public institutions with UPNEDA as the nodal agency347. For
Residential and private institutions the government will provide a subsidy
of ` 15000/KW up to a maximum of ` 30000/-.
C. Ease of Doing Business
a. To improve the ease of doing business the government has
introduced the following.
b. Single Window clearance for all solar power projects
c. Energy banking in every financial year subject to the inspection by
the state distribution company.
d. Electricity duty exempted for sale to distribution licensee, captive
consumption or third party sale within the state. This exemption is
not available if the sale is made outside the state.
4.4.7 TAMIL NADU
The Tamil Nadu Energy Development Agency (TEDA) was established as a
registered society, as early as in 1985348. The objectives of the agency were to
promote the use of renewable energy, energy conservation and research and
development in renewable energy349. The Tamil Nadu Solar Energy Policy
2012 was the major policy document till date which has driven the growth of
the solar in the state350.
Government of Tamilnadu provides subsidy of rupees 20000 per kilowatt for
individual or group applications with a plant capacity of 1 kilowatt. The
subsidy scheme can be availed by grid connected rooftop solar systems
347 Id.
348 G.O.Ms.No.163, P.&D. (EC) Department. Dated 29.11.1984.
349 T.E.D.A., INTRODUCTION https://teda.in/ (last visited Dec 1, 2018).
350 MINISTRY OF NEW AND RENEWABLE ENERGY, TAMIL NADU SOLAR ENERGY POLICY
2012, https://mnre.gov.in/file-manager/UserFiles/state-power-policies/Tamilnadu- Solar-
Power-Policy.pdf (last visited Dec 1, 2018).
161
comprising of solar PV modules rooftop support structure solar grid inverter
cabling and protective devices.
The unconsumed solar power exported into the TANGEDCO Grid will be
eligible for net metering. Under net metering scheme the net energy imported
or exported into the grid is metered.
Institute for Energy Economics and Financial Analysis (IEEFA), studied top
15 countries and power markets in the world by their share of renewable
energy in the net electricity mix. Denmark was at the top with 53% and Tamil
Nadu, the only Asian market with 14% share of renewables in the electricity
mix found a place in the list351. According to the report the availability of rich
wind and solar resources, demand and supply gap, and robust government
policies have made this feat possible for the state. The government has
improved the transmission networks, infrastructure and also encouraged firms
to expand. Tamil Nadu has applied forecasting energy supply to deal with the
fluctuations in power generation from the renewables352.
In 2018 the TEDA has formulated the draft Solar Energy Policy 2018353 and
has invited public comments on the draft policy. The policy envisages to
create an ecosystem to transform the energy vision into policy and processes
framework.
The new draft policy envisages to install 8884 MW of solar power by 2022.
All public building, street lighting and water supply shall meet 30% of their
351 Power-Industry Transition, Here and Now Wind and Solar Won’t Break the Grid: Nine
Case Studies, (2018), http://ieefa.org/wp-content/uploads/2018/02/Power-Industry-
Transition-Here-and-Now_February-2018.pdf (last visited Dec 1, 2018).
352 Sushma, How Tamil Nadu became one of the world’s leading renewable energy markets,
QUARTZ INDIA (Feb. 19th 2018) https://qz.com/india/1208222/how-tamil-nadu-became-
one-of-the-worlds-leading-renewable-energy-markets/ (last visited Dec 1, 2018).
353 Inviting Comments & Inputs on Draft Tamilnadu Solar Energy Policy-2018,
http://teda.in/wp-content/uploads/2018/09/Draft-Policy-note-2018.pdf (last visited Dec 1,
2018).
162
energy requirement from solar energy. It also mandates that 10% of the
government vehicles to be replaced by electric vehicles354.
The incentives offered for encouraging investments in the solar include
exemption from electricity tax, grid connectivity, open access, wheeling, and
banking and cross-subsidy charges. The policy has also proposed to create
suitable incentive schemes for energy generation in the agricultural sector. The
policy not only encourages developers, being one of the major manufacturing
states in the country, Tamil Nadu is promoting manufacturing of the solar
installation components including solar modules in the state. The policy also
envisages to develop a scheme where there is co-utilization of land for solar
energy projects, crop cultivation and rainwater harvesting. It is also proposed
to relax property taxes for those domestic building owners who install solar
energy systems. There will also be schemes to promote research and
development in the field of solar energy355.
4.4.8 RAJASTHAN
Rajasthan is the largest state in India and has witnessed improvements in
strengthening generation capacity and network infrastructure. The state has at
portal installed capacity of 18 GW of which 50 % comes from power plants
and renewable energy contributes 30 %. The state has only 0.2 % power
deficit and 75.4 percent of its households are electrified356.
Rajasthan is one of the high potential States with an estimated capacity of 142
for solar and 18.7 GW for wind. Rajasthan Solar Energy Policy 2014357 has
estimated a target of 25 GW by 2022358. Rajasthan has an installed capacity of
6198 MW renewable energy.
354 Id.
355 Id.
356 supra note 320 RES.
357 Rajasthan Renewable Energy Corporation, RAJASTHAN SOLAR ENERGY POLICY, 2014
(2014), http://rips.rajasthan.gov.in/menupdf/Rajasthan-Solar-Energy-Policy-2014-10.pdf
(last visited Dec 1, 2018).
358 supra note 321 SOLAR INDIA.
163
Major challenges faced by the state are balancing services, back down by
DISCOMs, delay in availing MNRE subsidy, Limited capacity of state
agencies in terms of Manpower, awareness etc.
Rajasthan solar Park Development Company limited has been appointed as the
SPV develop and manage solar parks in Rajasthan. The project is expected to
make a capacity addition of 4505 megawatt of electricity. The large
agriculture base of the state constitutes 42 percent of the power consumed in
the state. To give more flexibility to farmers for irrigation purposes the
government has planned installation of 1 lakh solar pumps. The state is also
developing and evacuation infrastructure for transmission of 9.6 GW interstate
electricity and 4.5 GW intrastate electricity. Rajasthan will be and net
exporting state of renewable energy due to its rich resources.
The state is proposing to develop a Framework for Regional balancing of
renewable energy, real time monitoring of generation, forecasting tools,
developing CTU connected renewable energy projects, restructuring
renewable energy contacts, renegotiate power purchasing agreements develop
distributed solar projects and hybrid power plants. The state also recommends
dedicated programs to develop innovative business models359.
From 26 to February in 2015 the net metering policy is implemented and
Rajasthan. Rooftop solar PV installations are eligible for net metering at a
tariff rate of 7.5 rupees per install the unit. The lower threshold of a grid
connected Solar Plant is 1 kilowatt and the upper limit is 1 megawatt. An
individual consumer cannot exceed solar rooftop plant having a capacity of
more than 80 percent of the sanctioned connected load.
4.4.9 TELANGANA
Telangana has a current installed capacity of 12672 megawatt of power of
which 7476 megawatt is generated from thermal power plants using coal.
359 Government of Rajasthan, RAJASTHAN SOLAR ENERGY POLICY 2011 (AMENDMENT
2011), https://mnre.gov.in/file-manager/UserFiles/state-power-policies/ First-Amendment-
Rajasthan-Solar-Power-Policy.pdf (last visited Dec 4, 2018).
164
Coal power plants constitute 59 percent of the total installed capacity.
The remaining electricity is generated through hydro power plants with
17.7 percent contribution, gas 12.4 percent, nuclear 1.2 %, and renewable
energy constituting the remaining 9.7 percent360.
Telangana has a target of 3.7 percent of the total renewable energy production
at the national level with 69 percent contribution from solar361. The state has
renewable energy potential of 20.4 GW of which only 4.27 % has been
realized so far.
The Telangana solar policy 2015362 provides the basic policy framework for
promoting solar energy in the state. Telangana uses solar pumps to use the
excess renewable power generated during the daytime which help set balance
the energy demand and supply. The new policy envisages to aggressively
pursue and expand the rooftop solar capacity.
Some key incentives offered by the state include electricity duty exemption,
exemption from VAT, wheeling and transmission charges, stamp duty, Clean
Development Mechanisms (CDM) benefits and PCB clearances, land ceiling,
100 percent credit, Compact Sub Stations (CSS)363, single window clearance364
etc.
Telangana has the following recommendations to improve the renewable
energy sector in the state. The state proposes to promote the use of electric
vehicles to augment the demand and incentivize the consumption through
tariff based plans. It also proposes to promote interstate power supply
agreements. To address the technical issues related to solar pumps the state is
360 supra note 330 RES.
361 supra note 321 SOLAR INDIA.
362 Government of Telengana, TELANGANA SOLAR POWER POLICY 2015, https://mnre.gov.in/
file-manager/UserFiles/Grid-Connected-Solar-Rooftop-
policy/Telangana_Solar_Power_Policy_2015.pdf (last visited Dec 1, 2018).
363 supra note 319 State Renewable Energy Capacity Addition Roadmap.
364 Government of Telangana, SINGLE WINDOW MECHANISM FOR SOLAR POWER PROJECTS,
https://www.tssouthernpower.com/ShowProperty/CP_CM_REPO/Pages/Hotlinks/ Telangana
SolarPowerPolicy/Single Window Mechanism for Solar PP (last visited Dec 1, 2018).
165
envisaging to create a pool of skilled local technicians in every village. The
state is also demanding the central government to compensate it for the high
tariffs of solar projects located during the initial stages of Jawaharlal Nehru
Solar Mission. The state also recommends for installation of renewable
energy storage Technology throughout the state for deployment of battery
storage based solar power plants.
4.4.10 MAHARASHTRA
The largest electricity consumer base is located in the state of Maharashtra.
The state has made substantial improvement incapacity edition and
distribution infrastructure. Maharashtra has 41 GW of installed capacity with
60 percent of the electricity produced from thermal power plants using coal365.
Renewable energy contributions constitute 18 percent of the total installed
capacity. There is lack of demand growth creating the problem of large
payouts as fixed charges under power purchasing agreements.
The state has a renewable energy potential of 114 GW. The state also has 6.9
gigawatt potential for distributed solar projects. Renewable energy in the state
has grown at 15 percent to reach 7.4 GW in November 2016. The renewable
energy target for Maharashtra under the state policy is 14.4 GW by 2020.
The state managers the variability of renewable energy generation with the
help of hydroelectricity. It has a flexible capacity of 2250 MW. Maharashtra
is one of the top States with the percent of their RPO compliance.
Maharashtra Renewable Energy Policy 2015366 announced a focus on
development of 14.4 GW renewable energy by 2020. The policy envisages
7.5 GW solar energy capacity addition. The state provides incentives switches
capital subsidy electricity duty exemption etc.
365 supra note 320 RES.
366 Government of Maharashtra, MAHARASHTRA RENEWABLE ENERGY POLICY 2015,
https://www.mahaurja.com/meda/data/grid_solar_power/Policy for Grid Connected Solar
Power Projects - English.pdf (last visited Dec 1, 2018).
166
Maharashtra has a scheme for supporting agricultural consumers through a
solar irrigation pump scheme. The scheme proposes to install 5 lakh solar
irrigation pumps with only 5% contribution by the farmers and the remaining
by state government contributing 5 percent of the pump cost, central
government with 30 percent contribution and loan from banks for the
remaining 60 percent.
Maharashtra is also propose to develop rooftop solar by developing and net
metering framework. This state nodal agency for this is accepting subsidy
applications online. Maharashtra has one of the strongest intrastate
transmission networks which can absorb 14 GW of RE under green energy
corridor367.
The state recommends to develop hybrid power plants using wind and Solar
Technology, innovative business models for agricultural consumers to move
away from subsidy driven model, real time monitoring of demand and
generation of renewable energy along with forecasting tools.
The state also propose for exploring this thermal plants using as backup
arrangements to balance capacity. It also proposes a faster implementation of
renewable generation obligation (RGO)
The Maharashtra Electricity Regulatory Commission (Net Metering for Roof-
top Solar Photo Voltaic Systems) (First Amendment) Regulations, 2017 has
amended the New and Renewable (Nonconventional) Energy Sources 2015 to
expand the scope from solar energy to renewable energy368.
367 MAHARASHTRA ENERGY DEVELOPMENT AGENCY, POLICY/GOVERNMENT RESOLUTIONS,
https://www.mahaurja.com/meda/off_grid_power/solar_energy/policy
_government_resolutions (last visited Dec 1, 2018).
368 SAUR ENERGY INTERNATIONAL, MAHARASHTRA SOLAR ENERGY POLICY, (Apr. 27th 2017)
http://www.saurenergy.com/solar-energy-policy-india/maharashtra-solar-energy-policy
(last visited Dec 1, 2018).
167
4.4.11 MADHYA PRADESH
The State Government of Madhya Pradesh has adopted an innovative
decentralized solar policy 2016369. The policy has proposed three categories of
grid connected power systems, such as net metering, no export, and third party
consumption with wheeling and banking. It also permits multiple configurations.
A rooftop system can be owned by the beneficiary or a Renewable Energy
Service Company (RESCO). The new policy supports the installation of
rooftop solar, small scale wind, small biogas project or a combinations of
these370.
The state has current installed capacity of 19849 MW of electricity. The coal
fired thermal power plants constitutes 62.3 percent of the total installed
capacity 18.2 percent of hydro and 3.2 percent of nuclear and gas are other
major sources371. Renewables constitute 18.2 %.
Madhya Pradesh is rich with renewable resources and the ministry of New and
renewable energy sources has estimated a potential of 74.33 GW of power.
The state is one of the leaders in Renewable Energy installed capacity with
18.2 percent of energy coming from Renewable Sources.
Madhya Pradesh has are renewable energy target of 6.8 % of the national
renewable energy production by 2022372. 47 percent of the targeted 11979
megawatt power will be generated from solar. The state has realised only 4.4
percent of its total renewable energy capacity. The state meet 8.5 percent of its
energy demand from renewable energy sources.
369 Madhya Pradesh Policy for Decentralized Renewable Energy Systems, 2016,
http://www.mprenewable.nic.in/Decentralized RE Policy in English 24.09.2016.pdf (last
visited Dec 1, 2018).
370 Saumy Prateek, Madhya Pradesh Introduces Innovative Decentralized Solar Policy,
MERCOM INDIA (Oct. 1st 2018) https://mercomindia.com/madhya-pradesh-introduces-
decentralized-solar-policy/ (last visited Dec 3, 2018).
371 supra note 320 RES.
372 supra note 321 SOLAR INDIA.
168
Some of the challenges faced by the state include the capacity additions plant
in non-conventional power which may create huge surplus in the state. The
green energy corridor, availability of credit, energy balancing for future and a
higher target for a rooftop solar are some other challenges faced by the state.
The state need to promote power consumption through tariff based incentives
and device interstate power supply arrangements to match demand and supply.
The state has recommended to the central government for incentivizing the
energy surplus states for supply of power. It also recommends to give more
focus to night banking. A dedicated department for pumped hydro storage is
also considered.
4.4.12 ASSAM
The Assam Solar Energy Policy, 2017 was notified in the official gazette on
16th January 2018373. Assam has one of the lowest rate of electrification in the
country at 53 %. Floods, insurgency and in accessible terrains how caused the
poor electrification of rural Assam. The state has a total installed capacity of
1440 6 MW of which 67 % is conventional energy followed by 30 percent
from hydropower and only 3 percent of energy is being generated from
renewable energy sources. The state is improving its energy supply by
meeting various targets374.
The state has a renewable energy potential of 45 GW with a maximum
capacity in solar. Due to the lack of renewable energy capacity Assam
continuously lives in meeting its renewable energy purchase obligation targets.
The Assam electricity regulatory Commission has notified 8.5 % of RPO till
2020, which was later reduced to 5 % till 2019.
In addition to the Limited renewable energy potential of the state it faces are
the challenges such as Limited availability of land for setting up solar power
373 Government of Assam, ASSAM SOLAR ENERGY POLICY, 2017,
http://www.aegcl.co.in/06022018Gazette-Solar_Policy.pdf (last visited Dec 3, 2018).
374 supra note 320 RES.
169
plants, lower irradiation leading to low yield of solar power plants, lack of
state Agencies capacity to implement and manage bigger projects etc.
The strategies adopted by the state to improve the renewable energy situation
include requiring renewable energy from other states, promoting grid
connected rooftop solar projects, promoting solar pump, strengthen regulatory
framework for net metering and regulation of tariff and purchase obligations.
The state has planned a capacity addition of 270 megawatt in Renewable
Energy.
The state has made some key recommendations for improving the situation
which include developing at clear policy framework to encourage entities to
meet RPO target, develop distributed solar projects, capacity building of
discounts and other and that is in the state, encourage renewable energy in the
tea sector and real time monitoring of demand and generation of renewable
energy for managing the grid.
4.4.13 PUNJAB
Punjab has and installed capacity of 14000 megawatt of electricity of which
59.9 percent is produced by coal based thermal power plants375. Hydro
projects contribute 26 percent, nuclear 1.4 %, gas 2.7 percent and renewable
energy 9.8 %.
Panchayat has and a portion to target of 2.9 percent of the national renewable
energy target. Of this 93 % will be contributed by solar. The state has
exploited only 22 percent of its renewable energy potential. Solar energy
constitutes 56 percent of the installed renewable energy capacity in the state.
It is also difficult for the state to achieve 8 percent National solar target376
given the non-availability of land.
Other challenges faced by the state include issues in grid integration, lack of
balancing reserves in the state and lack of adequate subsidies. The mass
375 Id.
376 supra note 321 SOLAR INDIA.
170
awareness programme of the government has also launched with the aim of
educating the masses about the renewable energy377.
Punjab renewable energy sector in Punjab is governed by the Punjab New and
Renewable Sources of Energy Policy 2012378. The policy envisages to develop
and promote new and renewable sources of energy, energy conservation and
promote Clean Energy and reduce pollution. The fiscal and Technical
incentives under the new policy include grid interfacing, power wheeling,
open access, and various other fiscal assistant by the state government.
4.5 OTHER LEGISLATIONS WHICH PROMOTING DEVELOPMENT
OF RENEWABLE ENERGY
The pollution control legislations compel industres to go green. thus they
provide an essential momentum required for the sector to grow on the green
wings of other businesses.
4.5.1 CENTRAL POLLUTION CONTROL LAWS
The ministry of environment, forest and climate change has developed criteria
of categorization of industrial sectors based on the pollution index. The
pollution index is derived as a function of air pollutants water pollutants
hazardous waste and consumption of resources. The legislations which
governed the pollution standards include the Water (Prevention and Control of
Pollution) Cess (Amendment) Act 2003379 and the Environment Protection
Act 1986380. The pollution index is on a scale of zero to hundred and the
increase in value of pollution index denotes and increase in degree of pollution
from the particular industrial sector.
377 MASS AWARENESS AND PUBLICITY PROGRAMME, The development and application of
New and Renewable, http://peda.gov.in/main/images/MAP_progress_report. pdf (last
visited Dec 5, 2018).
378 GOVERNMENT OF PUNJAB, NEW AND RENEWABLE SOURCES OF ENERGY (NRSE) POLICY
2012, http://peda.gov.in/main/tenders/nrse pol 2012.pdf (last visited Dec 5, 2018).
379 Government of India, THE WATER (PREVENTION AND CONTROL OF POLLUTION) CESS
(AMENDMENT) ACT, 2003, No.19 of 2003 http://bombayhighcourt.nic.in/ libweb/actc/
yearwise/2003/2003.19.pdf (last visited Dec 6, 2018).
380 THE ENVIRONMENT (PROTECTION) ACT, 1986, No. 29 of 1986, http://envfor.nic.in
/legis/env/env1.html (last visited Dec 6, 2018).
171
The range of pollution index for the purpose of industrial sectors categorization
are as follows
1) Industrial sectors having pollution index score of 60 and above is
classified as Red category
2) Industrial sectors having pollution index score of 41 to 59 Orange
category
3) Industrial sectors having pollution index score of 21 to 40 green
category
4) Industrial sectors having pollution index score after 20 weight
category.
Any industry falling under the classification of white category need not
require a prior consent to operate from the state or central pollution control
board. Any intimation to the respective state pollution control board or
pollution control board shall be sufficient. There are 36 industrial sectors
which are falling under the white category.
The pollution control board has classified renewable energy sector comprising
of solar wind and small hydro as White category. The purpose of the
categorization is to ensure that the industry established are inconsistent with
environmental objectives. The policy is expected to promote industries to
adopt cleaner Technologies and generate sure pollutants.
4.6 CONCLUSION
The Business Reform Action Plan released by the Department of Industrial
Policy and Promotion (DIPP) along with World Bank Group in April 2017 had
405 recommendations for improving the ease of doing business in India. The
assessment carried out on the attainment has revealed a national average of
48.93% implementation. This suggests that we are lacking at the
implementation and not at having appropriate policies for developing the
business environment.
The advancements in the company registration process through simplified
forms and online registrations are welcome moves from the government. The
172
single window clearance system adopted by the Delhi administration has
successfully eliminated the manual application process about construction
permits. Delhi also has a streamlined process for providing electricity
connectivity within 7 days. But other parts of the country need to match up to
this. Getting land is a major concern. India has not made any progress in the
area of registering property is concerned. Land being a state subject the state
governments also have a major role to play in this. Streamlining the property
registration is a major step the governments should focus upon for attracting
investments to the country.
Getting credit for business, especially for solar is very critical to the
development of the sector. Concerns of being a new lending sector, and lack
of knowledge of managers are adversely affecting the credit availability. The
environment for paying taxes and enforcing contracts have been generally
improved in India. Honoring power purchase agreements by DISCOMS is
depended on the efficacy in its enforcement. The existing enforcement
mechanisms through electricity regulatory commission and electricity appellate
tribunal are better ways compared to normal civil court. In Lanco Budhil
Hydro Power Private Ltd. v. Haryana Electricity Regulatory Commission381 it
was held that the central electricity commission has the exclusive jurisdiction
over Interstate Power Purchase Agreements. Another recent development from
United States of America is the ruling given by the Bankruptcy court. It has
held that the Bankruptcy court has exclusive jurisdiction decide the honoring
of power purchase agreements of companies undergoing bankruptcy
proceedings. A question yet to arise in India.
The policies of the state governments can be observed to have uniformity and
coherence. Most of the state government policies have adopted exemption
from electricity duty (UP, Rajasthan, Andhra Pradesh) Exemption from
wheeling charges within the state. RPO serves another major driver for
promotion of renewable energy a state level. States like Karnataka provides an
381 Appellate Tribunal for Electricity, Order dated 9-8-2012 in Appeal No. 188 of 2011
173
efficient feed in tariff mechanism. The states promote competitive bidding-
based projects and development by independent power producers.
The categorization system also facilitates as self-assessment by industries.
This also satisfies the objective of ease of doing business asset simplify the
procedure for obtaining environmental clearances if an industry falls in less
polluting category.
CHAPTER 5
BARRIERS TO RENEWABLE ENERGY DEVELOPMENT
5.1 INTRODUCTION
The correlation between energy consumption and Human Development Index
suggests the importance of energy in the everyday life of human being. It is thus
important to have robust policy measures to achieve energy access for all. While
the government plans for access to energy, some times that may result in creating
policy and regulatory barriers to investors. The policies and programs were
limited to targets and allocated budget which were successful in providing the
initial ‘push’ but failed to achieve the utilization of the complete resource
potential. Various policy and regulatory barriers are discussed in detail here.
5.2 POLICY BARRIERS
Policy framework for RE There is no single comprehensive policy statement
for RE in the country382. Policies have been issued as and when necessary to
facilitate the growth of specific rets. Further, the plans for development of RE
do not match up to these policies. The Jawaharlal Nehru National Solar
382 MINISTRY OF NEW AND RENEWABLE ENERGY, STATES WHICH HAVE NOTIFIED THE STATE
SOLAR POLICIES, https://mnre.gov.in/file-manager/UserFiles/ state-solar-power-policies.htm
(last visited Dec 4, 2018).
174
Mission (JNNSM), also known as Solar India, is inadequate to meet the target
for RE generation mandated under the National Action Plan on Climate
Change (NAPCC)383.
The policy framework at the state level is no better. In fact, in many states
policies have only created uncertainty for investments in RE. For example, in
Madhya Pradesh, the policy for promotion of nonconventional energy sources
waived wheeling charges and cross subsidy charge for renewable energy. The
government will provide subsidies to distribution companies by way of
wheeling charges at 4 percent of the prevailing energy charges384. Wind
farms are exempted from electricity duty for a period of five years from the
date of commencement of operations if the actual generation of electricity is at
least 70 percent of the energy generation declared in the detailed project
report. Thus, the conditions attached to the policy benefits make it uncertain
for developers to avail the benefits declared by these policy documents.
Biomass plants face the challenge of sourcing the fuel from the locality. This
is because of lack of clarity in the policy measures of various States with
regard to the radius within which the Biomass plants can be established.
multiple Biomass plants commissioned within the Limited radius affected the
availability of fuel to each other. This has rendered those plans unviable since
they had to procure the required fuel from faraway places.
Wind power has achieved exponential growth due to the accelerated
depreciation of 80% of the capital investment made in the windmills.
Corporates which had excess funds in the balance sheets took the opportunity
to set up windmills without proper scientific studies385. The projects were
383 Vikas Khare, Savita Nema & Prashant Baredar, Status of solar wind renewable energy in India,
27 Renew. Sustain. Energy Rev. 1–10 (2013), https://www.sciencedirect.com/science/
article/pii/S136403211300395X (last visited Jun 13, 2018).
384 MINISTRY OF POWER, TARIFF POLICY-THE GAZETTE OF INDIA 1–21 (2006),
http://powermin.nic.in/sites/default/files/uploads/Tariff_Policy_1.pdf (last visited Jun 13,
2018).
385 id
175
mostly thus set up in low wind locations and became commercially unviable.
Foreign investors on the other hand was reluctant to invest since the tax
benefit of accelerated depreciation did not benefitted them. This in effect
created inequitable conditions of investment for the foreign investors.
The tax incentive also made the wind power project investors at the last
minute of the closure of the financial year, expecting to reduce the tax
liability. Since the objective was only to save the payment of tax and the
urgency to make investment before the closure of the financial year, the wind
projects suffered from lack of planning and preparation in implementation. It
has also resulted in the evolution of equipment manufacturers as project
developers.
The suppliers of equipment generally carryout development activities such as
acquisition of land, construction, Power Purchase Agreement finalization and
transmission contracts. Equipment suppliers bought huge acres of land in in
advance at the high wind potential sites and sold these lands to the
investors/buyers the land along with the projects. Post commissioning, some
of the equipment suppliers undertook operation and maintenance (O&M) of
the same projects on behalf of the buyers. Thus, it so happened that the power
projects were readymade projects and sold off the shelf by equipment
suppliers. This created premium pricing for the wind power projects and
became more expensive whereas the conventional fuels enjoyed financial
support from the government by way of subsidies.
The push policy failed to create conducive market develop and renewable
energy development mostly reminders Government induced programs rather
than maturing into commercially viable products and services386.
386 P. Venkata Ramana, C.S. Sinha & P.R. Shukla, Renewable energy technologies and
climate change policies in India, 15 Int. J. Glob. Energy Issues 97–116 (2001),
http://www.scopus.com/inward/record.url?eid=2-s2.0-0034956686&partnerID=40&
md5=c08acc5bcdba9bfa968f0323f7b08342 (last visited Jun 11, 2018).
176
5.2.1 LACK OF ADEQUATE GOVERNMENT POLICIES
Even though renewable energy programs commenced as early as 1980 the lack
of focused an adequate policy with reliability continuity and stability has
entered the growth over the years. The government needs to bring
comprehensive law and policy addressing all the aspects of renewable energy
adoption creating an environment which promises adequate return to the
investors. Even though the Solar Energy has reached grid parity in the year
2017, there requires more focus to develop improved technology through
promoting research and development. India need policy measures directed at
developing R&D in the sector387.
Renewable based rural electrification programmes are not supported by adequate
policy and legal frameworks. Instead is burdensome with requirements to be
fulfilled for a small-scale producer388. It is also true the development in the sector
happened only due to the policy support. Some authors suggest such policy
support was the reason for development of renewable energy as it is today, and
more innovative policy measures should be introduced to continue the support
with changing circumstances389. Some feel that the Carbon Finance Mechanisms
have the potential to promote the rapid expansion of solar market. The Clean
Development Mechanism (CDM) could have been a success if the policy
measures have adequately supported390. Policy incentives of premium for solar
based cars could have been another policy measure.
The current policy instruments globally used to promote solar energy include feed
in tariff (FIT), Investment tax credits, Subsidies, Renewable Energy Portfolio
(RPS) or Purchase Obligation (RPO) and Renewable Energy Certificates (REC),
Financing facilitation, Public Investment, Net Metering, Government Mandates
387 supra note 383 Khare, Nema, and Baredar.
388 supra note 165 Bhide and Monroy.
389 Govinda R. Timilsina, Lado Kurdgelashvili & Patrick A. Narbel, Solar energy: Markets,
economics and policies, 16 Renew. Sustain. Energy Rev. 449–465 (2012),
https://www.sciencedirect.com/science/article/pii/S1364032111004199 (last visited Jun
13, 2018).
390 Id.
177
and Regulations and a combination of the above policies. One Successful policy
example could be of Germany and Spain where the FIT guarantee attractive
return on investment with 100% grid access and power purchase391.
Sustainable Energy can be further developed only through the harmonization
of research policy and energy policy392. Energy efficiency policies are another
area to be focused and brought in consonance with the energy policy. There
are multiple policy dimensions possible based on the priority of the
government. Any policy shall address the energy trilemma and a market
oriented policy may address it in a better way. Some authors have suggested
that community based participatory planning could be the right way to
approach by bringing all other stakeholders also under the same roof through
consultation393. A carefully evolved and structured policy framework with
national and international integration and coordination is required to transfer
new technologies in the sector to the developing countries394. This fact
underlines the need to create a global policy for further development of
sustainable energy.
5.2.2 LACK OF POLITICAL COMMITMENT
Political commitment and vision is a major factor which drives the sector.
Unless and until the political leaders demonstrate the political will true strong
policies and legal measures the society and it's attitude towards renewable
energy will not improve in a favorable direction. Political intervention
lobbying by various interest groups and the resistance from the local
population courses for the barriers for renewable energy adoption. An
Empirical study conducted in some of the states in India shows how the
391 Id.
392 Kamil Kaygusuz, Energy for sustainable development: A case of developing countries, 16
Renew. Sustain. Energy Rev. 1116–1126 (2012), https://www.sciencedirect.com/science/
article/pii/S1364032111005491 (last visited Jun 13, 2018).
393 Id.
394 David G. Ockwell et al., Key policy considerations for facilitating low carbon technology
transfer to developing countries, 36 Energy Policy 4104–4115 (2008),
https://www.sciencedirect.com/science/article/pii/S0301421508003091 (last visited Jun
13, 2018).
178
political will can be instrumental in bringing successful policies and promote
renewable energy in the state395. A recent study by NITI Ayog, also shows the
performance of various states396, which varies according to the political will
and the policies the states have adopted.
5.3 REGULATORY BARRIERS
Regulatory barriers include those barriers in the regulatory framework for
electricity and allied matters. Some regulatory measures adopted by various
SERCs and state governments on various matters affect the renewable energy
developments adversely. There are regulatory restrictions on open access
third party sale since the SERCs restrict sale energy produced only to the
state distribution licensees. Restrictions are also placed on the quantity of
energy that can be uploaded to the grid due to the poor capacity of the grid to
withstand the heavy load. All these barriers which are due to the regulations
in place in various states and at national level are discussed in detail below.
5.3.1 REGULATORY FRAMEWORK FOR PROMOTION OF RE.
The varying disparities in the Renewable Purchase Obligations (RPO) by
various SERCs are a major regulatory challenge faced in the promotion of
renewable energy. There is no consensus for a nationwide single RPO for
various states. This is primarily because of the overall conditions of each state
is different from the other. It is also argued that there should be technology
specific RPO mandate throughout the nation.
If a technology-specific RPO is specified and there is limited availability of a
specific RE source within a year, will SERC allow such a shortfall in the RE
repository to be met by another type of RE source? Otherwise, concerned
DISCOMs may have little incentive to explore other RE sources; Other RE
sources are the indirect limitation of investments.
395 supra note 169 Schmid.
396 supra note 319 State Renewable Energy Capacity Addition Roadmap.
179
If DISCOM is able to meet its RPO through SETC-specified RETS / RE
sources, it should not be liable for penalties for non-achievement. Another
issue is the RPO level. SERCs should carefully determine the RPO level. A
high RPO target encourages DISCOMs to buy more RE energy, thereby
promoting investments, such that goals may be ambitious in the short term397.
On the other hand, a lower target may impose a discomfort on the energy
purchased by DISCOM from RE sources.
This is the case in Gujarat, where it has been reported that discoms have
stopped signing fuel purchase agreements with wind developers (2.28% as
mandatory 2% for 2007-08).398. In addition, current discoms have little
incentive to exceed their RPO. Finally, some states such as Maharashtra,
Gujarat, Madhya Pradesh and Karnataka do not allow RE to collect power
from outside the state399. This is detrimental to the overall development of the
RE in the country. The application of Section 86 (1) (e) of the EPA 2003 RPO
provides the RPO specification on the use of a range of discoms. This implies
that the RPO should be applied over the entire use of the discoms area and not
the energy from the discoms alone. Currently, only Maharashtra, Rajasthan
and Andhra Pradesh impose RPO on open access (OA) and captive
customers400.
RPO Enforcement To date, only a few states, such as Rajasthan and
Maharashtra, have imposed penalties on issuers of licenses if the RPO is not
met. In Rajasthan, the penalty is called the RE surcharge and must be paid to
the State Transmission Utility (STU). The additional fees thus raised will be
funded to be used for the creation of RE plants' dispersal system infrastructure.
397 supra note 169 Schmid.
398 Mohit Goyal & Rakesh Jha, Introduction of Renewable Energy Certificate in the Indian
scenario, 13 Renew. Sustain. Energy Rev. 1395–1405 (2009), https://www.sciencedirect.com/
science/article/pii/S1364032108001470 (last visited Jun 13, 2018). 399 Id
400 Id
180
So far, there have been some instances where distributors (discoms) have been
penalized for not performing Arposhev. So far, only the Maharashtra Electricity
Control Commission (MERC) has fined Maharashtra's discoms for not fulfilling
mandatory RPS.401 In the financial year 2007-08, MERC has introduced
enforcement charges for the deficit at the rate of 5.00 / kWh, 6.00 / kWh in 2008-
09 and 7.00 / kWh in the financial year 2009-10. It was further clarified that
this enforcement fee, when approving the DISCOM's Annual Revenue
Requirement (ARR), would not be allowed as a passing expense.402.
The role of FITS / tariff orders provides an analysis of the impact of the sound
regulatory framework on RET intelligent capacity at the state level. The table
maps the RET intelligent capacity additions with tariff orders / fits. Almost all
biomass and wind are potential additions in states that have determined FIT. In
the case of small hydroelectricity, about 83.4% of capacity is added in states
that have issued tariffs403.
While the determination of FIT is one aspect of the regulatory framework, the
adequacy of this FIT is another important factor to be addressed. TNERC, in
May 2006, decided on FIT for wind at ` 2.9 per unit in 2006. This tariff was
often perceived as inadequate and was reflected in the speed with which wind
energy was added to the state. The state added 858 megawatts of wind
capacity in 2005-06, while capacity additions dropped to 577 megawatts in
2006-07 and 381 megawatts in 2007-08404 . TNERC, in March 2009, issued
FIT ` 3.39 / unit for windmills deployed after April 1, 2009. Another case of
inadequate FIT can be found in the AP 405. FIT ceiling tariff as decided by the
401 Id
402 supra note 319 State Renewable Energy Capacity Addition Roadmap. 403 Id
404 T V Ramachandra, Rishabh Jain & Gautham Krishnadas, Hotspots of solar potential in
India, 15 Renew. Sustain. Energy Rev. 3178–3186 (2011), http://www.ces.iisc.ernet.in/
energy/paper/hotspots_solar_potential/RSER_hotspots.pdf (last visited Jun 5, 2018). 405 Id
181
Andhra Pradesh Electricity Regulatory Commission (APERC) in 2004. As a
result, the discoms in the AP tended to get electricity from the RE projects at a
lower rate than that set by the APERC. Because these tariffs were not
financially viable, several developers abandoned their investment plans. To
illustrate this point provides an overview of the inclusion of wind power
potential in the AP.
Many SERCs use tariffs as proxies instead of working on a cost-effective
basis. For example, of the 9 SERCs that issued tariff orders for solar PV-based
power generation, only 2 gave details of the parameters used for determining
tariffs (Chhattisgarh and Uttar Pradesh). Some SERCs have taken the tariff of
other RE technologies in the state as a reference point and added the level of
subsidy (as declared by MNRE) to arrive at the tariff for solar PV based IPPPS
(West Bengal). Similarly, there are SERCs that have provided details of
parameters used for determination of FIT of some other rates. There are two
issues here. First, if the FIT does not reflect the underlying costs, no capacity
additions are made. Secondly, subsidies - where MNRE is declared - are paid
for a limited time; FIT beyond that is inadequate. Finally, many SERCs
determine fits for a limited time. For example, the West Bengal Electricity
Regulatory Commission (WBERC) has fixed FIT for five years from the date
of implementation 406. This FIT is clearly inadequate as the lifetime of power
plants is 20 years, leading to regulatory uncertainty and impact on project
bankability. For any project developer and lender, it is important to know the
project revenue flow in advance, at least for the duration of the loan service
(10-12 years). Although the CERC has issued rules on the terms and conditions of
determining tariffs for various countries, many states are yet to adopt CERC
tariffs 407. Many states and developers have argued that the tariff standards
adopted by the CERC are inadequate.
406 M. Felix, Enhancing the Investor Appeal of Renewable Energy 42 ENV. L. 681-734
(2012).
407 CENTRAL ELECTRICITY AUTHORITY, CENTRAL ELECTRICITY AUTHORITY NEW DELHI
EXECUTIVE SUMMARY POWER SECTOR 1–52 (2014), http://www.cea.nic.in/reports/
monthly/executive_rep/feb14.pdf.
182
For example, in the case of solar projects, the CERC does not differentiate
between PLF / location or technology. PLF varies across locations / regions
and technologies. The same is true of wind projects. Therefore, he argued for a
review of the CERC's one-size-fits-all tariff framework. The regulation and
the impact of fits deserve particular mention in the context of SHPs. Almost
all states determine the cost and tariff for SHPs. As a result, to ensure higher
returns through higher tariffs, developers are not increasing capital expenditures
or allowing capital expenditures to be reduced.
The sale of a third party by section 39 of the 2003 Act directs the State
Government to establish the STU, which must have a transmission network in
the state and provide non-discriminatory free access (OA) to its network.
Section 42 of the Act provides for non-discriminatory OA to its distribution
network for eligible customers when they pay wheeling fees and other
applicable surcharges.408. It is embedded in the regulatory framework in many
states. However, state sources are hesitant to allow OA to RE sources. In fact, it
has been seen on many occasions that distribution utilities are resentful of RE
power exports to other states and are trying to block OA to RE based generators
in order to force this power to be sold to state utilities at a fixed price.
In some states, OA for RE generators is limited to low-tariff customer
categories. For example, in Gujarat, although the state's wind power policy
allows third party sales (TPS) to any customer in the state, practically the RE
generators can sell electricity only to industrial customers and not to
commercial customers.409. Commercial customers have higher tariffs than
industrial consumers and the state does not want to lose more paying
customers to OA. In this type of case, developers / investors have no
incentives through dividend to serve industrial customers. Apart from the
408 supra note 175 Chatterjee.
409 Government of Gujarat, GUJARAT SOLAR POWER POLICY 2015, https://mnre.gov.in/ file-
manager/UserFiles/state-power-policies/Gujarat-Solar-Power-Policy-2015.pdf (last visited
Dec 4, 2018).
183
above problem, due to the unpredictable nature of such a generation, states are
obliged by OA to cite difficulties in scheduling410.
In addition, although RE can be produced with 70%, utilities demand
generation capacity with 90% probability. Another problem is the absence of
firm policies or regulatory frameworks for wheeling fees for RE. The Madhya
Pradesh case has already highlighted the lack of regulatory certainty over
wheeling fees for OA in the case of RE. In the case of SHP, TPS is not viable
after considering wheeling charges and free electricity for the state
government.
The energy industry has a small number of players that create a monopoly on
several levels, and such monopolies are highly concentrated and unacceptable
for distribution technologies such as solar. Such monopolies create
institutional barriers and lead to policy barriers because most policies are
created around it. This requires the formulation and modification of policies
and laws for the integration of renewable energy with the existing power
system.
Providing adequate protection for intellectual property rights promotes
research and development in the field. Intellectual property laws must be
strengthened. Proper allocation of financial assistance from the government,
investment friendly regulations, liberalized market policies etc. Could promote
the progress of the renewable energy sector.
5.4 LEGAL BARRIERS
The foundations of energy law lie in the interaction between petroleum
industry and the law411. Even after a century there was no International
consensus on a unified harmonised petroleum law at the international level.
This is due to disconnect between various legal and institutional frameworks
410 Daljit Singh, Newer Challenges for Open Access in Electricity Need for Refinements in the
Regulations 6 (2017).
411 Tedd Moya Mose, Toward a harmonized framework for international regulation of
renewable energy, Advance Ar Unif. Law Rev. 1 (2018), https://academic.oup.
com/ulr/advance-article/doi/10.1093/ulr/uny016/4992864 (last visited Jun 11, 2018)
184
governing the energy sector412. The incoherence and Lack of uniformity
existed in the petroleum sector at the foundations of the energy law is
transplanted with the same philosophies to the renewable energy sector as
well413. The reasons for the incoherence in the laws was since the law was
primarily governed by the administrative mechanisms of the governments. The
supply of electricity was considered as a sovereign function under the
Electricity Act 1948414. This situation has dwarfed the development of the
jurisprudence in the sector.
There are more private investments and private players involved in the
renewable energy sector. The involvement of more private parties increases
the disputes which makes it necessary to develop strong jurisprudential
foundations for the sector. The governments still consider the provision of
electricity is their prerogative as a sovereign function and continue to issue
directions as it used to do while the sector was directly under the control of the
government.
Researchers in the field has proposed three pathways which are
complementary to each other for the development of an international energy
law different from the existing based on the philosophies that suit the present
conditions415.
1) Development of International Energy law to govern our energy
resources
2) Renewable energy law framework is developed using the energy
trilemma416
412 Id.
413 Id.
414 Rajasthan State Electricity Board v Mohan Lal and Others. 1967 AIR 1857
415 supra note 406 Moya Mose.
416 Boris Lopicich, Equity and the energy trilemma Delivering sustainable energy access in
low-income communities, Equity energy trilemma Deliv. Sustain. energy access low-
income communities 26–36 (2015), http://pubs.iied.org/pdfs/16046IIED.pdf (last visited
Jun 13, 2018).
185
3) Elevate existing renewable energy law principles and practices into
mainstream international law
The current international renewable energy framework can be further
classified as the hard law and soft law. The hard law on international
renewable energy law include-
1. The statute of the international renewable energy agencyted Nations Framework convention on climate changeEnergy charter treaty1
2.
The soft law international renewable energy law include-
1) International Energy charter
2) Rio declaration on environment and development
3) Johannesburg declaration
4) Sustainable energy for all initiative
5.4.1 RENEWABLE ENERGY AND DEVELOPMENTS IN LAW
Geo thermal and hydroelectric power will fall under the sovereign
jurisdictions on natural resources since these resources r connected with land.
Can a state claim permanent sovereignty over the flow of wind over their
Territory or rays of sun? Some authors dean solar energy as res communis-
for the enjoyment of all. Others dim it as a part of the bundle of benefits
derived from the use of natural environment which falls under the powers of
the states sovereign authority. The United Nations also have mid expression
energy resources weekly in the resolution on permanent Sovereignty over
natural resources.
5.4.1.1 Sovereignty over natural resources.
Extending the principle of permanent sovereignty417 over natural resources to
the renewable energy sector may hinder the development of renewable energy.
The geopolitical reality has moved towards cooperation rather than state
417 G.A. Res. XVII/1803, ¶ 29 PERMANENT SOVEREIGNTY OVER NATURAL RESOURCES (Dec.
14, 1962)
186
control over natural resources. This lack of clarity makes it necessary to have
an hour walking International law and regulation for renewable energy sector.
In India the sovereignty ultimately resides in the people where the principle
res communisalso rests. Renewable energy law need to be normative and
based on consistent principles mainly due to the existence of energy
trilemma418.
Different laws to deal with different sources of energy will be problematic. So
it is important to have a Framework which can accommodate all sources of
energy. This is the basic preposition to recommend for an international
renewable energy law incorporating doctrinal and practical Pathways.
There is no International Treaty specifically regulating renewable energy. The
International Love in this subject consists of a mixture of legally binding
applications and other instruments that could develop a global energy law and
policy.
The trade aspects applicable in case of renewable energy outlined in the general
agreement on tariffs and trade, WTO agreement on trade related investment
measures and general principles and the WTO governing international trade are
currently the major regulatory Framework at the international level.
There is a need for establishing renewable energy logos on the foundations of
international law. Some authors prescribes energy trilemma as the substantive
and methodological prism for designing the international renewable energy law
framework419. Energy trilemma addresses political economic and environmental
challenges while formulating the renewable energy law.
EA challenge in the trilemma is dealt by analyzing the specific problems involved
in and the rationale for legal and policy intervention420. It is also important to
418 International Energy Agency, INTERNATIONAL ENERGY AGENCY ANNUAL REPORT (2012),
https://www.iea.org/publications/freepublications/publication/2013_AnnualReport.pdf
(last visited Jun 13, 2018).
419 supra note 406 Moya Mose.
420 supra note 410 Boris.
187
create International Energy markets for the development of the sector. The
International Energy market integration of national markets is possible when the
domestic soft law comprising of principles and practices conforms to an
International standard. This can be done only by mainstreaming soft Law
principles on renewable energy at International law level.
Petroleum law developed along with the industry based on the contracts
interpretation of those contracts the commercial practices and weed is arbitral
awards. Petroleum law varied in principle practices and content from country
to country and was best perceived as a branch of National Law rather than
international law. Where is renewable energy development is important
globally due to climate change and every Nation on earth is concerned about
how any other nation is consuming energy and the level of pollution
contributed by them. Thus there is an international law aspect where every
nation of a duty to another Nation to gradually shift to clean our ways of
energy production and consumption
The major challenge is using the existing International platforms like the
United Nations to negotiate and formulate and international Energy law while
the key stakeholders are private players. The authors suggest the ideal
mechanism as harmonization of International Energy law and measuring the
regulations through the prism of energy trilemma and giving greater credence
to the energy regulation evolved through soft law.
Renewable energy is are currently the cleanest energy source available on
Earth but they do not satisfy that test under the energy trilemma regarding
affordability and stable availability.
The investment choices in any sector will be influenced by cost, benefits,
revenue, profit, and availability of finance. The same factors influence
investments in renewable energy sector. But one advantage of an energy
188
installation is that it usually create natural monopolies due to highly expensive
Investments and lack of competitor in particular locality421.
There exist dichotomy between profit maximization and environmental
benefit. Environmental finance firms focus on low cost Investments and
benefit to largest number of people422, whereas Investments are huge in
renewable energy sector and the direct beneficiaries are few.
There is no finance policy specifically for sustainable environment and there is
no finance policy for renewable energy423. Since there is lack of search
policies it is the Economics of finance which determine the investment
decision. The dichotomy existing in both the sectors makes it difficult for
someone to invest in Renewable Energy infrastructure within environment
objective.
If financing regimes operate based on traditional models of finance driven by
profit motive, The chances of fund flows getting attracted into renewable
energy sector is lowest. The traditional debt and equity methods of Financing
projects without considering the environmental cost expects lowest cost and
maximum return, which is lacking in renewable energy sector.
Where one of the greatest threat to humanity and the existence of life on earth
is posed by climate change, there lacks and international legal framework for
developing sustainable energy. There is a common goal of need of embracing
sustainable energy sources is a sufficient ground for international agencies to
focus on developing an International Energy law.
421 Rick van der Ploeg & Cees Withagen, Is There Really a Green Paradox ? CESifo Working
Paper Series No. 2963 1–38 (2010).
422 Andrea S. Kramer & Peter C. Fusaro, Energy and environmental project finance law and
taxation : new investment techniques, https://store.lexisnexis.com/products/energy-
environmental-project-finance-law-taxation-skuusSku-us-oxf-04610-Hardbound (last visited
Jun 11, 2018).
423 Yannick Glemarec, Financing off-grid sustainable energy access for the poor, 47 Energy
Policy 87–93 (2012).
189
The withdrawal of United States of America from the Paris agreement suggest
the need of more stronger renewable energy law making countries bound to
create environment sensitive policies in the energy sector.
The lack of harmonized international renewable energy law creates the need
for an International Energy law overarching all sources of energy.
5.4.2 LACK OF PUBLIC INTEREST LITIGATIONS
Public interest litigations reflect the thoughts of the society and the judiciary
about a particular issue. Public interest litigations brings to the forefront and to
the attention of the general public some important aspects which the society as
a whole need to consider and address. Sometimes where the government, the
society and the business community fail to address issues properly424. In such
situations publicly spirited citizens take charge of things and bring the matters
of concerns before the Supreme Court and high courts for issuing directions to
the government as well as other stakeholders through Public Interest
Litigation. There need to be more public interest litigation in the field of
energy consumption, energy conservation and pollution due to fossil fuels.
Public interest litigations will attract the attention of media, public and
governments. It will help the people to think in the direction to address the
problem and create the public awareness in a better way.
5.5 INSTITUTIONAL BARRIERS
Inter-organizational coordination Lack of coordination and coordination
among and across various ministries, agencies, agencies and other
stakeholders will delay and impede progress in RE development425. One
example is the implementation of the GBI announcement for wind projects by
MNRE. Soon after the announcement of the scheme, Ireda began accepting
424 Yerramsetti, V.S., Sharma, A.R., Navlur, G.N., Rapolu, V., Dhulipala, N.S.K.C. and Sinha,
P.R., The Impact Assessment of Diwali Fireworks Emissions on the Air Quality of a
Tropical Urban Site, Hyderabad, India, during Three Consecutive Years, 185 ENVIRON.
MON. ASSESS. 7309-7325. (2013) https://doi.org/10.1007/s10661-013-3102-x
425 Fredric Beck & Eric Martinot, Renewable Energy Policies and Barriers, 34 Encyclopedia
of Energy 365–383 (2004), http://www.martinot.info/Beck_Martinot_AP.pdf.
190
applications from wind projects under the GBI scheme. However, GoI has
rejected applications made before the notification of the project through the
Gazette and is only considering applications made after such notification.
Although this assertion is in principle grounded, it is not necessary to begin
receiving applications prior to notification through the IREDA Gazette. Such
gaps in the implementation of policies in the absence of inter-institutional
coordination can diminish investor confidence in the investment environment
for RE.
5.5.1 LACK OF SINGLE WINDOW CLEARANCE SYSTEM
Several states have implemented a single window project approval and
clearance system for RE. These include Punjab, Himachal Pradesh, Haryana,
Rajasthan and Uttarakhand. However, the effectiveness of this system is
questionable. This problem is sometimes compounded by the fact that delays
in obtaining approval for projects offered through competitive bidding (such
as SHP) can lead to the developer being fined. 426. Punjab is one of the few
states where the system is upheld (setting a 60-day period specified by Punjab)
and RE developers are not required to comply differently with state
government departments.
There is a lack of uniformity in the country with regard to counters and offices
and departments, in which investors will eventually have to set up their own
solar plant. Permissions and permissions have similarities but processes and
procedures and forms change427. Some states have established a single
window clearance system for setting up power plants, but the efficiency of
such offices is very poor due to lack of internal coordination between the
various state government departments for processing applications. , According
to some investors.
426 Akash Kumar Shukla et al., Solar PV and BIPV system: Barrier, challenges and policy
recommendation in India, 82 Renew. Sustain. Energy Rev. 3314–3322 (2018),
http://linkinghub.elsevier.com/retrieve/pii/S1364032117313862 (last visited Jun 12, 2018).
427 supra note 422 SUMMARY OF STATE POLICIES.
191
5.6 FISCAL AND FINANCIAL BARRIERS
Fiscal and financial barriers are those barriers which are creating the
challenges to the investors in terms of mobilizing the capital and also in terms
of generating revenue. If there exists barriers in cash flows and revenue
generation the investors will find the sector unattractive for investment.
Various fiscal and financial barriers are discussed in detail below.
5.6.1 BUDGETARY CONSTRAINTS
The Government of India has announced Generation Based Incentive (GBI)
for wind, roof top PV and for solar power plants that do not qualify under the
JNNSM and sell to the state utilities. For solar power projects in the capacity
range of 100 KW to 2 MW connected to a HT grid below 33 KV are given the
benefit. This makes the government to find additional funds to finance the
power generation incentive. It may not be an ideal situation for the
government to have many developers falling in the eligible category claiming
huge amount of incentives over and above the SERC set tariffs. In a worst
case scenario of low cost reduction for renewable energy from a budgetary
exposure for the Government of India perspective, the year wise GBI per kWh
reduces from ` 2.12/kWh to 0.36/kWh from 2015-16 to 2021-22 in case of
solar PV428. In a best case scenario of lowest incremental costs from a higher
coal prices the absolute payments to be made by government of India for solar
and wind combined will be 177 crore in 2015-16, and 1768 crore in 2018-19.
Which is estimated as high as 8,359 crores in the worst case scenario for the
year 2020-21429.
5.6.2 LACK OF FINANCING OF RE PROJECTS
There is lack of government incentives schemes and financing mechanism to
promote Renewable Energy Technologies (RETs)by businesses and
428 supra note 85 National Institution for Transforming India.
429 Id.
192
industries430. The poor availability of credit for the purchase of renewable
energy technology is a major barrier to the slow growth of the renewable
energy sector.
RE projects face many difficulties in financial matters. In general, the
development of RE faces difficulties in obtaining competitive forms of
financing due to uncertainties related to technology know-how, risk perception
and resource evaluation.
These are described below: RE projects have little or no energy costs and
lower operating and maintenance (O&M) costs, but their initial unit capital
costs are higher than fossil production systems. High ratios of capital
expenditures to O&M costs are significant because they indicate that these
projects have an unequal burden of initial burden that must be financed over
the life of the project431. This makes exposure to risk a long-term challenge
(which also has policy and regulatory-risk implications).
The risk of not providing subsidies is also significant because of the limited or
unavailability of resources with the government because these subsidies may
be the lifeblood of the project. The generally small nature of RE projects can
lead to lower gross returns, although the return rate may well outweigh the
market criteria that are considered attractive investment. The developers of RE
projects are usually small, independent and newly established developers with
a lack of corporate track record and financial inputs. So lenders perceive them
as high risk and hesitate to provide unhelpful project financing432. They would
like to see experienced construction contractors, suppliers and experienced
operators with proven equipment.
430 Jeremiah Doner, Barriers to Adoption of Renewable Energy Technology, Inst. Regul.
Policy Stud. Illinois State 32 (2007), http://irps.illinoisstate.edu/downloads/research/
documents/IRPSDonerWorkingPaper050707.pdf.
431 supra note 421 Shukla et al.
432 Sunil Luthra et al., Barriers to renewable/sustainable energy technologies adoption: Indian
perspective, 41 Renew. Sustain. Energy Rev. 762–776 (2015), http://linkinghub.elsevier.com/
retrieve/pii/S1364032114007631 (last visited Jun 11, 2018).
193
Some RETs are newly commercialized and subsequently not widely known
among lenders (although this is changing rapidly). This leads to misinterpretations
of risk in relation to these schemes among lenders, making financing difficult.
The intermediate generation characteristics of the RETs may put them at a
disadvantage when it comes to creating contracts for power transmission
compared to conventional power projects. For small and local developers who
want to implement RE projects, lack of funding to meet working capital
requirements prevents equipment O&M. The development and operation of
small-scale RE projects involves business and financial risks just like any
other business. The difference in earnings and therefore does not motivate
many local entrepreneurs to engage in such projects in return for equity
investors. Documents and soft costs associated with identifying and obtaining
financing for small and medium-sized RE projects are high compared to
financial needs433. Issues related to performance or low PLFs and
uncertainties inherent to such projects (such as hydrology or wind-mediated
winds) are a barrier to project financing. Because any delay in payments
through the off-taking state utility has a direct impact on the credit service,
lenders generally prefer credit enhancement procedures such as a credit
service reserve account (DSRA) or bank guarantee (BG), which may exceed
the capacity of small and local developers.434. Limited knowledge / expertise
on RE in financial institutions serves as a barrier to the financial system.
5.6.3 LACK OF SUBSIDIES
For many years the competing fossil fuels in India where heavily subsidized
through administrative pricing mechanism which was dismantled in the recent
years. The petroleum products for domestic use suggest LPG kerosene etc.
Are subsidised event today. The subsidy given to competing fuels and lack of
433 supra note 388 Timilsina, Kurdgelashvili, and Narbel.
434 supra note 417 Glemarec.
194
subsidy for renewable energy makes it difficult for renewable energy
technology to penetrate the market by creating a customer base435.
5.7 MARKET-RELATED BARRIERS
Most of the renewable energy technologies are research developed and
patented in advanced industrialized economies. Importing search technology,
knowhow, and equipment requires hi initial investment. The land requirement
for renewable energy Technologies are usually very high increasing the initial
capital investment436. The investors in the energy sector prefer low cost initial
investment to achieve a higher rate of return and leisure break even period.
The central electricity regulatory Commission has notified the terms and
conditions for determining tariff for renewable energy from time to time. The
lifespan of solar panels are considered as 25 years for the purpose of tariff
calculation.
Ministry of power, Government of India issues tariff Policy under section 3
(1) of the Electricity Act 2003. The Central electricity regulatory Commission
and State Electricity regulatory Commission are guided by such tariff policy
while fixing tariff. The government has formulated the electricity tariff policy
2006 after consultations with state governments and Central electricity
authority437. The general approach tariff in the said policy is to introduce
competition in different segments of electricity industry in continuation of the
regime envisaged under Electricity Act 2003438. The policy recommends that a
balance need to be maintained between the requirements of return on
investment and Consumers interest. It also suggest that return on investment
should be ensured to attract Investments. It directs to ensure that the rate of
435 Union of Concerned Scientists, Barriers to Renewable Energy Technologies, Powerful
Solut. 1–9 (2017), http://www.ucsusa.org/clean_energy/smart-energy-solutions/increase-
renewables/barriers-to-renewable-energy.html#.WSVJHGgrKMo.
436 supra note 429 Luthra et al.
437 MINISTRY OF POWER, TARIFF POLICY THE GAZETTE OF INDIA 1–21 (2006),
http://powermin.nic.in/sites/default/files/uploads/Tariff_Policy_1.pdf (last visited Jun 13,
2018).
438 supra note 175 S. K. CHATTERJEE.
195
return should be reasonable and enough surplus to be produced for the growth
of the sector according to the policy.
The Other factors which need to be taken into consideration for fixing tariff
include the debt equity ratio, depreciation, cost of debt, cost of management
of foreign exchange risk, operations cost at normative levels, cost of
renovation and modernization extra will be taken into consideration. The
policy also suggest that the State Electricity Regulatory Commissions shall fix
minimum percentage for renewable purchase obligation under section 86(1)(e)
of the Electricity Act 2003 and the distribution companies share procure
electricity at preferential tariff determined by appropriate Commission. It also
direct that switch procurement should be done for future requirements through
competitive bidding process under section 63439. The objective is to make
the new renewable energy Technologies to be competitive with conventional
sources of energy in the long term.
Considering the in high initial capital investment requirement the tariff policy
suggest a higher tariff for renewable energy. This increases the cost of
electricity produced from Renewable Sources which makes it an attractive to
distribution licensee. This discourage them from procuring energy beyond the
renewable energy purchase obligation. So even as per theory the sectors
should develop to the extent of the renewable purchase obligation of various
discounts in various States depending on the RPO target440. But many states
have failed to meet their renewable purchase obligation by purchasing less than
their determined target. There were instances where states like Assam revised
their renewable energy obligation and reduced it. This and attractiveness is mainly
due to the initial capital investment requirement which impacts the deployment of
renewable energy sources in particular states and the high cost of electricity at the
initial years to make the investment break even.
439 Electricity Act 2003, No. of 2003
440 supra note 388 Timilsina, Kurdgelashvili, and Narbel.
196
Economic feasibility being considered as a determining factor for supply of
energy requirements may not stay for long as energy resources are scarce and
price inelastic. When conventional sources of energy start deplete and become
scarce, the prices also will go up.
5.7.1 LEVEL PLAYING FIELD FOR RE
Structure of current subsidies in the power sector, where subsidies are effectively
provided to conventional fossil fuel resources. These provide an unfair advantage
over conventional fuels, giving the impression that the difference between
conventional energy prices and RE-based energy is too high441.
5.7.1.1 Market for RE
The market for RE projects/products in India can be classified into four segments:
i. Government Markets: where the government purchases the output out
of projects as consumers, often with budgetary support.
ii. Government driven market: For social reasons the government pursues
the use of RE in organizations outside its control, often providing
budgetary support or financial incentives. For example, the government
promotes the use of solar applications in schools, malls and hospitals.
iii. Debt market: People are financing RE based applications because
self-financing is limited
iv. Cash Market: High Net worth Individuals (HNIs) can purchase RE
based applications to meet individual energy needs. India is currently
in the early stages of the first two divisions.
The Indian government is not focused on promoting the third and fourth
classes of RE, which makes it more capable for RE-based applications. Fuel
costs for biomass Biomass based projects, unreliable biomass supply, non-
existence of an integrated fuel market and frequent price fluctuations threaten
project viability. In the early 2000s, biomass costs were low (300-400 per
441 RAJYA SABHA, PARLIAMENT OF INDIA DEPARTMENT-RELATED PARLIAMENTARY STANDING
COMMITTEE RAJYA SABHA ONE HUNDRED TWENTY SECOND REPORT EASE OF DOING BUSINESS
(2015), http://164.100.47.5/ newcommittee/reports/EnglishCommittees/Committee on
Commerce/ 122.pdf (last visited Jun 6, 2018).
197
tonne) in most states. Over the years, increased demand for biomass for power
generation and alternative uses has caused demand-supply gaps in the sector
and has led to increased biomass prices. The type of biomass available varies
from state to state and makes alternative uses for biomass. For example, in
Andhra Pradesh, the rice bran fisheries industry uses it for packaging purposes
for export purposes. But the large biomass substitutes the SME sector for
heating coal (operating boilers), cattle feed, and rural areas for domestic use.
The availability of biomass and coal in a state determines the change in the
price of biomass. For example, coal is abundantly available in hattis, and the
cost elasticity of biomass is very low compared to coal, with no transportation
cost. The price of biomass is ` 1615 per metric compared to the coal price of `
2100 per metric (including transportation costs).442.
On the other hand, due to their geographical location, the northern states of
Punjab and Haryana have a critical constraint on the supply of coal to small
scale industries, so biomass demand and price elasticity are very high.
Biomass prices in these states have reached ` 3500 per tonne. It could be
argued that the efficiency of biomass-based power projects has increased
significantly in both these states. While that is true, the alternative use of such
biomass is also high. For example, the sheer volume of stored wheat stems is
used as livestock feed in both states.
5.7.2 INADEQUATE MARKET PRICES
The cost of RE energy is determined on a cost-plus basis in order to ensure
cost recovery for RE projects. The price does not reflect environmental costs,
thus obscuring the significant environmental benefits of new and switched
energy options. Invariably, carrying out the life cycle assessment cost of fossil
442 International Energy Agency, INDIA ENERGY OUTLOOK-WORLD ENERGY OUTLOOK
SPECIAL REPORT 2015 (2015), https://www.iea.org/publications/ freepublications/
publication/IndiaEnergyOutlook_WEO2015.pdf (last visited Sep 12, 2017).
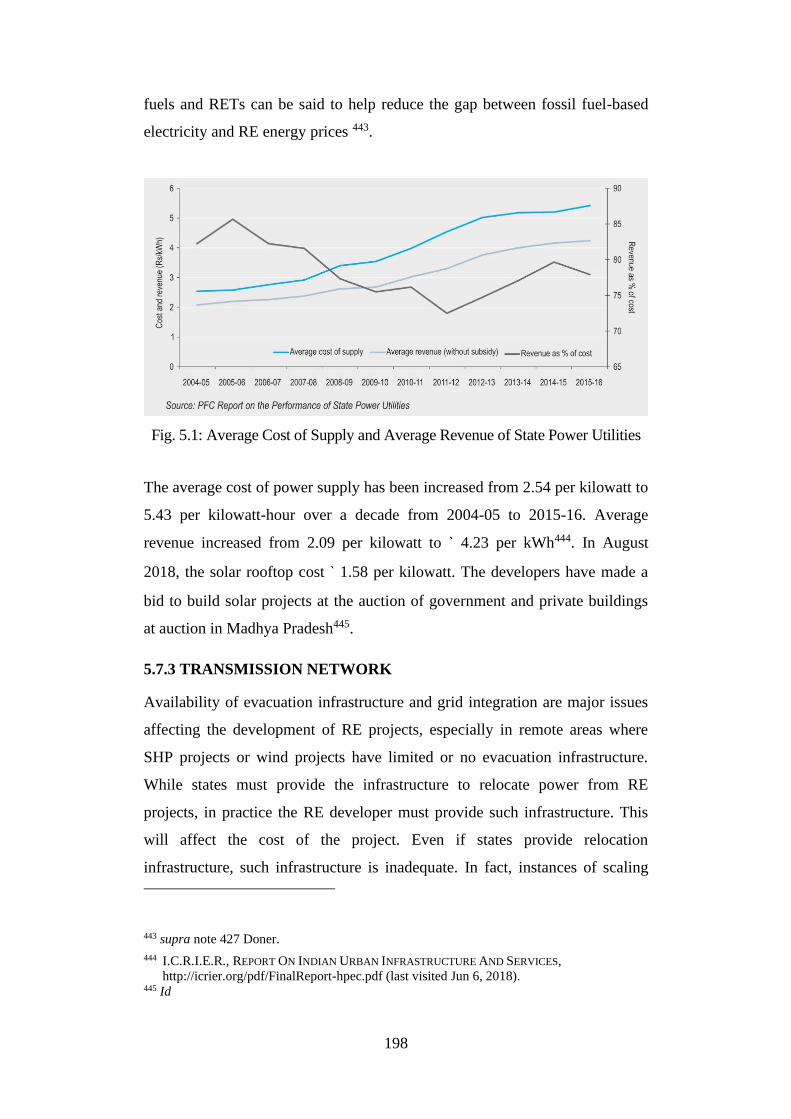
198
fuels and RETs can be said to help reduce the gap between fossil fuel-based
electricity and RE energy prices 443.
Fig. 5.1: Average Cost of Supply and Average Revenue of State Power Utilities
The average cost of power supply has been increased from 2.54 per kilowatt to
5.43 per kilowatt-hour over a decade from 2004-05 to 2015-16. Average
revenue increased from 2.09 per kilowatt to ` 4.23 per kWh444. In August
2018, the solar rooftop cost ` 1.58 per kilowatt. The developers have made a
bid to build solar projects at the auction of government and private buildings
at auction in Madhya Pradesh445.
5.7.3 TRANSMISSION NETWORK
Availability of evacuation infrastructure and grid integration are major issues
affecting the development of RE projects, especially in remote areas where
SHP projects or wind projects have limited or no evacuation infrastructure.
While states must provide the infrastructure to relocate power from RE
projects, in practice the RE developer must provide such infrastructure. This
will affect the cost of the project. Even if states provide relocation
infrastructure, such infrastructure is inadequate. In fact, instances of scaling
443 supra note 427 Doner.
444 I.C.R.I.E.R., REPORT ON INDIAN URBAN INFRASTRUCTURE AND SERVICES,
http://icrier.org/pdf/FinalReport-hpec.pdf (last visited Jun 6, 2018). 445 Id
199
down of RE projects due to inadequate evacuation infrastructure have come to
light. For example, Sai Engineering's 20 MW project at Toots of Kullu (HP)
was scaled to 10 MW due to lack of adequate evacuation infrastructure.
Similarly, Tamil Nadu was unable to utilize all the energy generated by the
wind due to lack of adequate evacuation capacity in 2007-08446. It had to
consequently buy more expensive power from other states to meet its needs.
The small size and ality threshold of many RE projects add another dimension
to the problem because the size of the project does not adequately justify the
economic viability of extending the transmission lines to such projects.
Nevertheless, the problem needs to be adequately addressed447. The development
of evacuation infrastructure and linking the grid to the RE sources are considered
to be the responsibility of the transmission utility. However, distribution licensees
have an important role in shifting RE production, as many RE sources are
connected to distribution voltages. The Forum of Regulators (FOR) has noted
that barring few utilities, such as Maharashtra State Electricity Transmission
Company Ltd. (MSETCL), Rajasthan Vidyut Prasaran Nigam (RVPN) and
Himachal Pradesh State Electricity Board, others have not included evacuation
infrastructure for RE as part of their overall transmission or distribution capex
plans448. Even for these utilities, the lack of funds to embody such projects is a
major issue. It is also understood that utilities are not well aware of RE-based
power evacuation transmission requirements.
5.7.4 TRANSMISSION AND DISTRIBUTION LOSSES
The location of generation and consumption very in the case of electricity.
The inefficient transmission lines may cause Transmission and distribution
losses. Improved infrastructure is a basic necessity for evacuation of
intermittently produced renewable energy to the national grid with least
446 supra note 388 Timilsina, Kurdgelashvili, and Narbel.
447 I.C.R.I.E.R., REPORT ON INDIAN URBAN INFRASTRUCTURE AND SERVICES,
http://icrier.org/pdf/FinalReport-hpec.pdf (last visited Jun 6, 2018).
448 supra note 251 20 January.
200
amount of Transmission loss449. An increase in the difference of electricity
produced and consumed results in revenue loss for the renewable energy
producer450. Acute power shortages are a regular phenomenon in some parts of
India even after having an installed capacity exceeding the demand. This is
mainly due to the poor infrastructure causing excessive Transmission and
Distribution losses (T&D)451. It is suggested to improve the condition by
policy intervention at various levels. Upgradation and digitization of
transmission and distribution grid, Advanced Metering Infrastructure
deployment by utilities and High Voltage Direct Current (HVDC) for long
distance transmissions are expected to reduce the T&D losses452.
5.7.5 HIGH EQUIPMENT COSTS
It is generally believed that technology levels and advances reduce the cost of
capital. However, this is not always true. There are many examples of this -
the automobile sector is perhaps the best example. Similarly, the capital
expenditure of commercially deployed rents has not decreased over the years
despite the increase in capacity. On the contrary, it has been observed that
developers or equipment providers are quoting rising capital costs over the
past few years. For example, a trend based on the movement of capital
expenditures for wind projects funded by IREDA for the period 2004-05 to
2008-09 indicates that average capital expenditures range from ` 4.79 Cr / MW
to 76 5.76 Cr / MW14 for several reasons., Due to exports, insufficient
capacity in the Indian RE equipment industry, and the cartelization of
equipment suppliers, there is a large gap in demand supply. As a result,
electricity costs from these rents remain high.
449 Hiroaki Nagayama, Impacts on investments, and transmission/distribution loss through
power sector reforms, 38 Energy Policy 3453–3467 (2010), http://linkinghub.elsevier.
com/retrieve/pii/S030142151000100X (last visited Jun 13, 2018).
450 supra note 421 Shukla et al.
451 supra note 85 National Institution for Transforming India.
452 supra note 82 Ahluwalia, Gupta, and Stern.
201
A grid-connected solar power plant can cost between ` 50,000 and ` 70000 per
kWh. The cost of setting up an off-grid plant is ` 1 lakh per kWh 453.
5.7.6 INPUTS FOR RE PLANTS
Many RE projects suffer from problems similar to those faced by conventional
power plants. Wind and solar thermal projects require huge amounts of
land454. To establish a 1 MW thermal power plant nearly 5 acres of land is
required. If a developer want to establish a utility scale power plant, it requires
huge land holdings to be acquired under the strict laws of land acquisition. The
land reforms which resulted in the farmers having small parcels of land makes
it more complicated to acquire huge land since it has to be acquired from a
huge number of persons, causing delays in the execution of the project. In
addition to land, solar thermal also requires huge quantities of water. The
absence of water in several states having high solar power potential such as
Rajasthan may complicate the task of capacity addition455.
5.7.7 MARKET FAILURES
Market failures can be classified as external benefits or external cost. External
benefits lead to decrease in supply because of lower price and external cost
lead to higher demand for other energy sources. Market failures can happen
due to Lack of investment in research and development as investors not
benefiting from efforts456.
The external cost due to environmental degradation are not reflected in the pricing
mechanism of competing fossil fuels. Transmission grids in a given area becomes
natural monopolies and reduces the competition in the market affecting the
453 Abhishek Jain, Solar Panel Price in India, BIJLI BACHAO , https://www.bijlibachao.
com/solar/solar-panel-cell-cost-price-list-in-india.html (last visited Dec 6, 2018).
454 LAND ACQUISITION CHALLENGES, INSIGHT ON CHALLENGES FACED BY EPC CONTRACTORS
34–35.
455 Davida Wood et al., 10 Questions To Ask About Scaling on-Grid Renewable Energy
Frameworks for Designing Good, WORLD RESOURCES INSTITUTE 1–28 (2014).
456 S. M. Johnson, Economics v. equity: do market-based environmental reforms exacerbate
environmental injustice, 56 Wash.& Lee L.Rev. 111, 121 (1999).
202
opportunity for free market entry and exit. Renewable energy becomes
unaffordable due to a high price resulting from high initial investment cost.
The uncertainties in the future electricity prices makes investments in the
sector riskier than other investments. The investor expects higher returns for
risky Investments. This increases the cost of capital.
Many renewable energy policies and technologies are implemented without
much International experience which resulted in a ‘too much too soon’
approach leading to unrealistic expectations and subsequent failures.
5.7.8 LACK OF SUFFICIENT MARKET BASE
The lack of awareness of the end consumers and their unwillingness to opt for
renewable energy makes it harder for any producer to create a customer base.
There is no natural demand existing for renewable energy. It's all created
through push mechanism put in place by various renewable energy policies.
Being the cost for initial investments are too high for renewable energy
products it may not be a viable option further to create a customer base
through marketing campaigns spending more. The nature of the product is
such that a proper marketing strategy with sound theoretical background need
to be developed for marketing renewable energy.
The lack of such customer base makes renewable energy companies
comparatively smaller in size and financial capabilities. This eventually make
them not competent to actively participate and contribute in defining of
electricity market rules.
In some states it has been made mandatory for the developers to supply the
electricity generated only to the state utilities. This distorts the competition in
the market and imposes unfair market conditions for the developers 457. Some
state policies have provided exemptions for wheeling to promote open access
sale and purchase of electricity. But the benefit is restricted to those who sell
457 APSERC order dated 20^th June, 2001 in O.P. 1075/2000
203
the electricity produced with in the state. This discourages the power
producers to have access to the consumers outside the state 458.
5.7.9 LACK OF PAYING CAPACITY
Due to the intermittent nature and small scale production renewable energy
was mainly targeted to rural areas and poor consumers. The lack of awareness
coupled with the high price of renewable energy made it unaffordable to the
rural consumers. Both users and the manufactures had very low capital. The
unwillingness to pay more main result not only from higher cost but also the
physical distance to the place where renewable energy projects are situated,
low levels of income less priority given to environmental issues.
State governments due to severe power shortages have mandated independent
power producers and captive producers to supply the power produced to the
Government owned DISCOMs and the regulatory commissions in those states
have also mandated the state requirement as discussed in chapter II. These
DISCOMs are running under severe financial stress. The financial stress of
DISCOMs results in delay in payments by the utilities to the producers and
adversely affects the revenue flow459.
5.7.10 UNABLE TO MEET ELECTRICITY POWER DEMAND
It is impossible for renewable energy sources to meet the entire electricity
demand of the country460. The peak electricity demand can be met only with
other sources of energy461. Integration of large renewable energy generation
systems with smart grids will make it more complex since the power supply
from various systems vary from time to time.
458 FORUM OF REGULATORS REPORT ON OPEN ACCESS, (2017), http://www. forumofregulators.
gov.in/Data/WhatsNew/Open_Access.pdf (last visited Dec 9, 2018).
459 PwC, Renewable energy’s transformation of the Indian electricity landscape Message from
Mytrah (2015).
460 NATIONAL INSTITUTION FOR TRANSFORMING INDIA, REPORT ON INDIA’S RENEWABLE
ELECTRICITY ROADMAP 2030: TOWARDS ACCELERATED RENEWABLE ELECTRICITY
DEPLOYMENT (2016), http://niti.gov.in/writereaddata/ files/document_publication/Report_
on_India%27s_RE_Roadmap_2030-full_report-web.pdf.
461 B. Mohan, Energy Carriers for Energy Security of India – Investigation for an Optimum
Mix (2014) (PhD. thesis, Rajagiri College of Social Sciences).
204
Solar and the wind are dominating the sustainable energy policies across the
globe. Based on various factors like geopolitical bargain of a nation and
availability of natural resources, what a country may treat sustainable to them
may not be sustainable to other nations. This is because sustainability has been
understood to mean only the tradeoff between certain positive and negative
factors of a particular energy system. For example, India is having huge
energy requirement. It is also under international obligation to minimize the
carbon footprint. More than 70% of its electricity production is using gas and
coal462. We are polluting environment and exhausting the resources, but are
attempting to meet the needs of the present generation. Thus it is important to
have an internationally acknowledged legal definition for sustainable energy.
Renewable energy is intermittent in nature. Since solar energy depends on the
sun light, the climatic conditions will affect the power generation to a large
extent. The seasonal differences also cast an important impact in the energy
production. The energy production during summer will be greater, but the
same level of production cannot be obtained during winter.
Solar power also uses huge area of land. To produce 1MW of solar power, it
requires 2 hectares of land. Solar panels thus may actually affect the
ecosystem of the area of installation. This makes it difficult to deploy huge
solar power plants in population dense states.
5.7.11 SPLIT BENEFIT
The commonly used example to demonstrate the barrier of split benefit is the
landlord tenant scenario. Installing solar energy will reduce the energy prices
for the tenant where as it will cost for the landlord. The landlord will not
install solar panel for the benefit of the tenant. A tenant will not install solar
462 International Energy Agency, India Energy Outlook - World Energy Outlook Special
Report 2015 (2015), http://www.worldenergyoutlook.org/media/weowebsite/2015/
IndiaEnergyOutlook_WEO2015.pdf (last visited Jul 22, 2016).
205
systems as it involves capital investment which he may not be able to realize
over the period of time of his stay at the place463.
While looking at this problem from a best value for the building perspective,
an environment friendly building can be branded at a higher value with the
benefit of reduced electricity bills for the tenant464. Bringing building codes
with mandatory installation of solar water heater and solar panels for
electricity will be a politically difficult decision but necessary for todays
energy requirement and environment protection.
5.8 TECHNOLOGICAL BARRIERS
Technological barriers are those barriers which arise due to various risks
involved in adopting the existing technology. The RETs are still in the
developing stage the possibility of the existing technologies to get obsolete in
the coming years is very high. Other technology related risks and barriers
include the absence of minimum standards, inefficient technology etc.
5.8.1 TECHNOLOGY RISK
In case of many new rets such as solar thermal, the risks related to technology
are high. Since the technology is at a development stage, the risks remain are
not clearly known. Further, even though the technology may have been
deployed elsewhere in the work, the expected performance of such technology
under Indian conditions not known465. Moreover, the risk of technology
obsolescence is high. Renewable energy sources involve multiple technologically
complicated devices and equipment optimizing for multiple conflicting
objectives. Asian Development Bank (ADB) is promoting the development of
right energy technology and accelerate their commercialization. ADB consider
463 Sudhakar Reddy & J. P. Painuly, Diffusion of renewable energy technologies-barriers and
stakeholders’ perspectives, 29 Renew. Energy 1431–1447 (2004), http://linkinghub.
elsevier.com/retrieve/pii/S0960148103003975 (last visited Jun 12, 2018).
464 John Kelly et al., Best value in construction 165 (2002).
465 supra note 169 Schmid.
206
that it is very important to identify the right technologies to mitigate the
technological risks while funding the gap to promote clean energy466.
5.8.2 R&D AND MANUFACTURING CAPABILITIES
One of the biggest problems confronting RETs such as solar is the high
upfront cost of establishing a solar plant. Investments in R&D with the
objective of cost reduction and scaling up of operations to utilize economies of
scale have long been advocated as the solutions to these problems. Around the
world companies and government backed research projects are engaged in
advanced R&D and are continuously setting up bigger, more advanced
manufacturing facilities. In India however, manufacturing facilities are only
focused on replicating the existing technologies and are limited to small
processing units. Currently we have more than 3 GW solar PV cells
manufacturing capacity and 9 GW solar modules manufacturing capacity467.
India do not have manufacturing base for Poly-silicon, Ingots/wafers and
upstream stages of solar manufacturing. The cost of production is also high in
India due to lack of economies of scale and modern technology. This makes
the domestic manufactured solar prices uncompetitive with the international
sellers. The lending rates in India are also quite high increasing the cost of
borrowed capital.
India’s manufacturing capacity is about 700MW for PV modules as compared
to facilities in countries like USA, China, Germany, Malaysia etc. Capable of
multi-giga watt production. India is relying on international suppliers for
equipment as well as technology. However, there is no indigenous capacity/
capability for solar thermal power projects. Explanatory Memorandum issued by
CERC for draft terms and conditions for determination of tariff for renewable
energy sources, may 2009.
466 FERENC L. TOTH, ENERGY FOR DEVELOPMENT: RESOURCES, TECHNOLOGIES, ENVIRONMENT
199 (2012).
467 Annexure-I Concept Note on Solar PV Manufacturing Scheme, https://www.indiansma.
com/wp-content/uploads/2018/01/MNRE-NMP-GSPD-concept-Dec-2017.pdf (last visited
Dec 9, 2018).
207
5.8.2.1 DS456: India — Certain Measures Relating to Solar Cells and
Solar Modules
In DS456: India — Certain Measures Relating to Solar Cells and Solar
Modules, the panel and the appellate body rejected India’s measures on solar
energy procurement under the Jawaharlal Nehru National Solar Mission
(JNNSM). A part of the JNNSM the government of India has promised to
procure electricity produced from the solar energy producers for a period of 25
years to promote solar energy in India. But one of the conditions of the said
procurement undertaking was that the solar energy producers shall use a
certain percentage of the modules manufactured by local manufacturers468.
The United States have challenged this claiming that the measure has violated
the principle of national treatment under Article III:4the General Agreement
on Tariffs and Trade 1994 and Art. 2 of the TRIMS agreement. According to
Art.III:4 GATT, the members shall provide to the goods originating from any
other nation treatment no less favorable than that accorded to the like domestic
products. Art.2 of the TRIMS also refers to the national treatment principles in
investment related measures.
India relied on Art.XX(j) and Art.XX(d) GATT for its defense. India argued
that solar cells and modules are the products in general or local short supply as
covered under XX(j) GATT. India also argued that XX(d) allows India to have
domestic content requirement to secure compliance with the international
obligations requiring promotion of sustainable development in energy security.
Both the panel and the appellate body rejected both the arguments and held
that the domestic content requirement was in violation of the principles of
WTO. They held that none of the documents listed by India are ‘law or
regulation’ satisfying relevant factors or makes a direct obligation on India for
energy security and the shortage of supply shall be considered after taking into
account supply from all sources including foreign sources.
468 DS456: India — Certain Measures Relating to Solar Cells and Solar Modules
208
5.8.3 NON-AVAILABILITY OF LOCAL TECHNOLOGY
In many cases, the technology or equipment is imported. This implies that
spare and replacement parts when required may not necessarily be readily
available especially in more remote locations.
Since renewable energy Technologies and investment and renewable energy
were not considered as viable business opportunities business houses did not
allocate much resources for research and development in Renewable Energy
Technology469.
5.8.4 INEFFICIENT TECHNOLOGY
Inefficient Technology leads to technological risk and may lead to rejection by
investors. Renewable energy technologies are in development stage and the
lack of Reliability for such Technologies creates lack of confidence in such
Technologies in the mind of investors470. The continued resource and
development programs in the renewable energy Technology are also important
improve the reliability of the technology. In comparison with other energy
resources the cost and energy required for renewable energy sources is higher.
People perceive it as a sacrifice to opt for renewable energy Technology471.
5.8.5 NEED FOR BACKUP OR STORAGE DEVICE
Renewable energy are produced intermittently depending on the weather
conditions. Solar energy is produced only during the daytime and windmills
work only when there is wind with sufficient strength472. This makes it to have
additional Investments to be made in batteries increasing the cost further.
Without storage devices renewable energy cannot be relied for adequate
reliable study supply of electricity. Disposal of batteries are also creates
469 supra note 385 Venkata Ramana, Sinha, and Shukla.
470 Felix Mormann, Requirements for a Renewables Revolution, 38 Ecol. Law Q. 903–966
(2011).
471 supra note 420 Beck and Martinot.
472 Nathaniel J. Williams et al., Enabling private sector investment in microgrid-based rural
electrification in developing countries: A review, 52 Renew. Sustain. Energy Rev. 1268–
1281 (2015), http://dx.doi.org/10.1016/j.rser.2015.07.153.
209
environmental issues. Disposal of batteries without environmental impact may
also become a huge concern.
5.8.6 LACK OF INFORMATION TECHNOLOGY RESOURCES
Lack of in integration of Information Technology resources into the renewable
energy systems limits the experience of Technology transfer. A comprehensive
information and communication systems provide better coordination and linkages
of renewable energy resources473. Free flow of Information and Communication
is Paramount for the development of the sector.
5.8.7 LACK OF TRAINED PEOPLE AND TRAINING INSTITUTES
Availability of skilled personals are and other challenge. There are no
educational institutions training institutions and training courses because the
geographical locations of India which can import education skill and training
for the purpose of creating skilled personals474.
Lack of awareness and apprehensions about the sector mix young candidates
to choose careers other than renewable energy. Many people will not opt for
renewable energy as a career option ignoring traditional careers 475. The lack
of money circulation within the sector also gets reflected in the salaries of
employees in the sector which does not offer a high reward for people to
choose renewable energy sector.
5.8.8 LACK OF LOCAL INFRASTRUCTURE
In India there are lots of villages which is still not electrified. This suggest that the
basic infrastructure for laying down the lines for transporting electricity to the
end consumers has not been achieved in many parts of the country476. This
lack of infrastructure is reflected in the higher levels of infrastructure
473 supra note 429 Luthra et al.
474 supra note 432 Union of Concerned Scientists.
475 INFRASTRUCTURE DEVELOPMENT FINANCE COMPANY LTD., DRAFT: BARRIERS TO
DEVELOPMENT OF RENEWABLE ENERGY IN INDIA & PROPOSED RECOMMENDATIONS
(2010), http://www.idfc.com/pdf/publications/ Discussion-paper-on-Renewable-Energy.
pdf%5CnEnergy Advisory Board 4 12 2012 - Barriers to development of renewable.pdf.
476 supra note 421 Shukla et al.
210
requirements such as various grids. Since renewable energy installations are
located at places far away from grid connectivity, more investments required
to create a conducive infrastructure do you work with renewable energy when
produced.
5.8.9 LACK OF NATIONAL INFRASTRUCTURE
Lack of national infrastructure like a strong national grid, roads,
communication and other Logistics makes it difficult for renewable energy
sector as a business to grow477. Lack of infrastructure is another major reason
for the slow growth of renewable energy sector
5.9 INFORMATION BARRIERS
Lack of awareness and knowledge about the renewable energy technologies,
its importance, and the environmental challenges, lack of skilled and educated
manpower trained in the particular technology, unavailability of resources data
etc pose various barriers and challenges in the solar energy development.
These barriers are discussed in detail below.
5.9.1 LACK OF SKILLED MANPOWER
Lack of trained personnel for training, demonstration, maintenance and
operations along with inadequate awareness and information programs for
technology dissemination impedes renewable energy penetration. Experience
indicates that subsequent to installation of RE projects/applications, no proper
follow-up or assistance was available for their maintenance thereby impacting
their working478. The impression that has permeated from such experiences is
that RE installations don't work.
477 Soma Bhattacharya & Maureen L Cropper, Options for Energy Efficiency in India and
Barriers to Their Adoption: A Scoping Study, SSRN Electron. J. 3–7 (2010), http://www.
ssrn.com/abstract=1590510.
478 J. Jeslin Drusila Nesamalar, P. Venkatesh & S. Charles Raja, The drive of renewable
energy in Tamilnadu: Status, barriers and future prospect, 73 Renew. Sustain. Energy
Rev. 115–124 (2017), http://linkinghub.elsevier.com/retrieve/pii/S1364032117301326
(last visited Jun 10, 2018).
211
5.9.2 LACK OF INFORMATION AND AWARENESS
General information and awareness in relation to new technologies and
understanding the practical problems in implementing and maintaining RE
projects is limited. The lack of awareness among the rural population who
forms the customer base for renewable energy sources about renewable energy
systems and technologies makes it difficult for the producer to educate and
disseminate renewable energy related information479. The lack of skilled
personnel in maintaining the renewable energy Technologies at the rural areas
compel the investors to search for search skilled personnel from other places.
The operation and management of Technology driven renewable energy
sources become thus more challenging.
5.9.3 LACK OF CONSUMER AWARENESS TO TECHNOLOGY
Societal consensus for the adoption of renewable energy Technologies will be
the product of generation of interest in the minds of individuals towards
renewable energy480. Such interest can be generated only true awareness
creation about the cost and benefits of renewable energy.
Society moves towards sustainable ways of energy consumption only
when they appreciate the bad effects of climate change and environmental
degradation and alternate renewable energy sources are available to them at
cheaper rates481. Average consumer still consider energy being a product to
be supplied to them by the government or government authorized agencies.
Lack of awareness that it can be produced at home with the help of solar
panels to meet domestic requirements may hinder the growth of this sector.
Lack of awareness regarding the market where the hardware for solar
installations are sold to the consumers hold them back from trying for such
experiments.
479 supra note 421 Shukla et al.
480 supra note 460 Reddy and Painuly.
481 D. G. Ockwell et al., Key policy considerations for facilitating low carbon technology
transfer to developing countries, Energy Policy (2008).
212
5.9.4 UNAVAILABILITY OF SOLAR RADIATION DATA
The Government of India has published are solar radiation data which is
accessible online. This data is not sufficient to clearly calculate the radiation
which may be available at the site where solar installation is planned482. Solar
energy incident depends on Earth Sun movement, atmospheric attenuation
Earth tilt on the axis etc. The production of electricity at the site of installation
of solar panels depends on a number of factors which effects the radiation. A
data which is prepared without taking into consideration switch minute details
is a not reliable data for installation. India lacks a database of radiation
prepared with data inputs at the micro level.
5.9.5 LACK OF EXPERIENCE
Customers of reluctant to undertake renewable energy as a source of energy
for their names because of lack of experience with a new source of energy483.
The lack of reliable information and apprehension towards adapting new energy
sources Hinder the growth of the sector. Most of the rooftop developers have no
primary information other than from the vendors and other sales personnel about
the benefits of the installation of the power plant. This makes it difficult for them
to form an informed opinion. Also the prices of the solar modules vary depending
on the quality and other features. A normal residential roof plant, the owner will
be completely unaware of the price differences of the solar modules and other
equipment and the contractor tend to cheat the roof top owner with cheap
installation at a higher cost and resulting in eventual losses for the investor.
5.10 SOCIO CULTURAL BARRIERS
Businesses succeed and fail depending on the attitude of the society as well. A
society which is not willing to adopt new technology or disregards the
482 Francesco Nicolli & Francesco Vona, Heterogeneous policies, heterogeneous
technologies: The case of renewable energy, Energy Econ. (2016), http://www.mendeley.
com/research/heterogeneous-policies-heterogeneous-technologies-case-renewable-energy.
483 Souvik Sen & Sourav Ganguly, Opportunities, barriers and issues with renewable energy
development – A discussion, 69 Renew. Sustain. Energy Rev. 1170–1181 (2017),
http://linkinghub.elsevier.com/retrieve/pii/S1364032116306487 (last visited Jun 9, 2018).
213
environmental concerns cannot be the right ground for renewable energy
technologies to grow.
5.10.1 SOCIAL ACCEPTANCE
Solar being a renewable energy source has a higher land footprint. Land is
valued as one of the precious assets by local communities. They demand
higher compensation for giving away the land for renewable energy projects
even if they are the beneficiaries of the project.
The social acceptance of rooftop solar panels is gradually improving even
though many have still not appreciated the emerging need of it. An improved
communication exchanges within the society regarding solar and renewable
energy sources may improve the situation484.
5.10.2 REHABILITATION ISSUES
Rehabilitation is a major issue in the case of hydropower projects. As far as
wind and Solar are concerned rehabilitation need not be a major constraint for
the development of the sector485.Though the solar parks requires huge parcels
of land, usually the government and developers procure barren land or
agricultural field for setting up the new plant. The JNNSM guidelines suggest
that the rehabilitation of the project affected people shall ensure either an
improvement in the living conditions or at least regain the previous standards
after displacement for the project486. The ministry has prepared a detailed
rehabilitation and resettlement policy in line with the National Rehabilitation
and Resettlement Policy, 2007.
5.10.3 FAITH AND BELIEF
The general nature of human being is to demonstrate resistance to change.
The resistance increases with lack of understanding and awareness about new
484 supra note 429 Luthra et al.
485 supra note 54 Renner, Sweeney, and Kubit.
486 Ministry of New and Renewable Energy, JAWAHARLAL NEHRU NATIONAL SOLAR MISSION
GUIDELINES FOR DEVELOPMENT OF SOLAR PARKS (2016), https://mnre.gov.in/file-
manager/UserFiles/Solar-Park-Guidelines.pdf (last visited Dec 9, 2018).
214
technology and development. Renewable energy Technology may have n
number of benefits but all switch benefits cannot be communicated to the
consumers because of lack of receptivity due to resistance to change and lack
of understanding of new technological development.
Minute and detailed quality data regarding irradiation may not be available
and such lack of reliable irradiation data makes it difficult to calculate the
energy output as well as the return on investment. Lack of skilled human
resources to operate and maintain renewable energy assets is another major
barrier for investments in the sector.
People consider renewable energy as an alternate energy source. Creation of
public and institutional awareness regarding the sustainable transition from
fossil fuels to environment friendly renewable Technologies is required487.
People have faith in the traditional time tested energy resources but, investors
and consumers alike are skeptical about a new technology or source of energy
made available to them.
5.10.4 CONSUMER BEHAVIOR BARRIERS
Consumer perceptions of the usefulness of solar systems compared to
conventional Technologies and the quality of Renewable Energy Technologies
are causing Barrier for deployment of renewable energy Technologies488.
People have inhibitions about the working of the solar panels and they consider it
as a costly alternative to the conventional source of energy was revealed in a
study conducted among the people in the state of Andhra Pradesh489. Another
study reveals that about 55% of the people who have responded to the survey
conducted have still not used any renewable energy application490.
487 supra note 480 Sen and Ganguly.
488 Id.
489 AN OVERVIEW OF PUBLIC PERCEPTION ABOUT THE SUITABILITY OF SOLAR POWER PANELS AS
AN ALTERNATIVE ENERGY SOURCE IN ANDHRA PRADESH, www.aptransco.gov.in.This (last
visited Dec 10, 2018).
490 People’s Perception Study, http://awsassets.wwfindia.org/ downloads/peoples_ perception_
study__renewable_energy_in_india_2014.pdf (last visited Dec 10, 2018).
215
5.11 ECOLOGICAL AND GEOGRAPHICAL BARRIERS
Ecological and geographical barriers include the scarcity of resources,
geographic conditions and the impact of the power plants on the ecology and
related issues.
5.11.1 SCARCITY OF NATURAL AND RENEWABLE RESOURCES
The huge population makes it important Porcupine huge land area 4 various
home and business Constructions hospitals and schools entertainment facilities
etc. Providing food security to search was population is another major
challenge. Huge area of land need to be cultivated to meet the food
requirements of the country491. Renewable energy depend on natural resources
such as wind, solar radiation etc. The human Occupancy of what areas of land
and other resources makes it impossible for renewable energy developer to
choose locations with optimal renewable resource availability.
Solar irradiation resources vary according to the location. Thus the same
equipment may deliver different levels of power output depending on the
location and irradiation. The climatic conditions are also an important factor as
the number of days of sunlight greatly vary from location to location492.
5.11.2 GEOGRAPHIC CONDITIONS
Solar and wind energy are intermittent depending upon the weather
conditions. The geographical locations are important in such cases. Some
part of the country receive more hours of Daylight while others receive less493.
The number of hours of solar radiation is a factor which determines the
efficiency of solar panels. Investors will be reluctant to invest in Renewable
Energy Technology like solar if the preferred geographical conditions does not
exist.
491 supra note 460 Reddy and Painuly.
492 Literature Review of Market Barriers to Solar Technologies, http://www.durban.gov.za/
City_Services/energyoffice/Documents/Market Barriers to Solar Technologies v1.pdf (last
visited Dec 10, 2018).
493 Williams et al., supra note 469.
216
Though sun rays reach everywhere, but the number of days of bright light
available in a year is a determinant factor while deciding on investing in a
particular location. The number of days of sun light availability varies from
state to state. Some states are for that reason are considered to be solar rich
states. The states like Tamil Nadu, Gujrat and Madhya Pradesh are blessed
with rich resources of wind energy.494
5.11.3 ECOLOGICAL ISSUES
Renewable energy sources also have ecological impacts which has adverse
impact on surrounding ecology. The noise created by wind mills, land required
for renewable energy such as solar installations where ecology is affected with
loss of habitat for human and other living creatures495. Our Ecological
footprint, the book published in 1996 opened the door of new researches in
area based sustainability studies which has brought into light various
ecological challenges of development through research496.
5.12 CONCLUSION
The current legal Framework in India is scattered without uniformity having
no currents and lacks stability. The Framework has failed to gain the
confidence of investors due to abrupt policy changes causing losses for the
investors. The national energy lotion also be developed by assessing and
evaluating through the prism of energy trilemma. Global Institutional and
policy framework addressing all the aspects of energy is required for the
development of the energy sector.
The general investment environment in India is improving as evidenced by the
ease of doing business ranking. But there are many areas of concern which
makes it difficult for doing business in India. In order to improve Investments
494 Mayank Aggarwal, Wind , solar will be cheapest power source in G20 countries by 2030 ,
says Greenpeace study LIVEMINT (Jul. 8th 2017).
495 supra note 393 Ockwell et al.
496 N. Chambers, C Simmons & M Wackernagel, Sharing nature’s interest: ecological
footprints as an indicator of sustainability (2014), https://content.taylorfrancis.com/
books/download?dac=C2011-0-08011-1&isbn=9781317972174&format=googlePreviewP
df (last visited Dec 10, 2018).
217
in solar energy sector specifically and renewable energy generally, the ease of
doing business has to be improved. Even though various Central Government
Ministries and many state governments have taken measures to improve the
scenario, the renewable energy rich States lag behind in the index.
While the state governments have adopted policy measures to improve the
renewable energy generation and capacity addition in the respective states,
only few states which are bestowed with the abundance of resources in
Renewable Energy has clear policies and plans to generate more electricity
than their renewable purchase obligation.
There are lot of variations in the policy measures adopted by various states.
There is no uniformity across the country. An investor who wish to invest in
different states may find that his experience in one state need not help him in
another.
The state policies focus on meeting local energy demand and supply which
doesn’t promote the national interest. It is thus necessary to have a
comprehensive mechanism comprising of law, policies, infrastructure and
governmental machinery to create a conducive environment for attracting
private investments in the sector to meet National ambitions. We need new
investment models and new commercial instruments to deal with renewable
energy sector Investments.
218
CHAPTER 6
THE STRUCTURAL ANALYSIS OF THE RENEWABLE
ELECTRICITY SECTOR AND INVESTMENT DECISION
6.1 INTRODUCTION
The investment decision situation is broken into its elements using a
framework developed with inspiration from the Institutional Analysis and
Development framework497. The elements are identified and the key actors,
the investors are approached for a survey through questionnaire. The survey
has helped to identify the main detractors and the main promoting measures
for renewable energy.
The method of study is inspired from various frameworks suggested by
various authors including the Institutional Analysis and Development
framework developed by Nobel Laureate late Dr. Elinor Ostrom. According to
the framework used in the study, the action situation is deconstructed into
various elements influencing the decision making. Here the investment
decision by a developer is considered for the study.
6.2 INVESTMENT DECISION SITUATION
The framework is used to identify all the factors which are having an impact on
the investment decision and to understand those factors which can be modified
through formal law. The factors which affects the decision can be broadly
classified as those which can be changed by rules and those which cannot be
changed by rules. The researcher propose to identify the intensity and impact of a
factor on the decision making process and propose changes through formal rules.
497 Elinor Ostrom, Response: The institutional analysis and development framework and the
commons, 95 Cornell Law Rev. 807–815 (2010), http://scholarship.law.cornell.edu/
cgi/viewcontent.cgi?article=3170&context=clr.
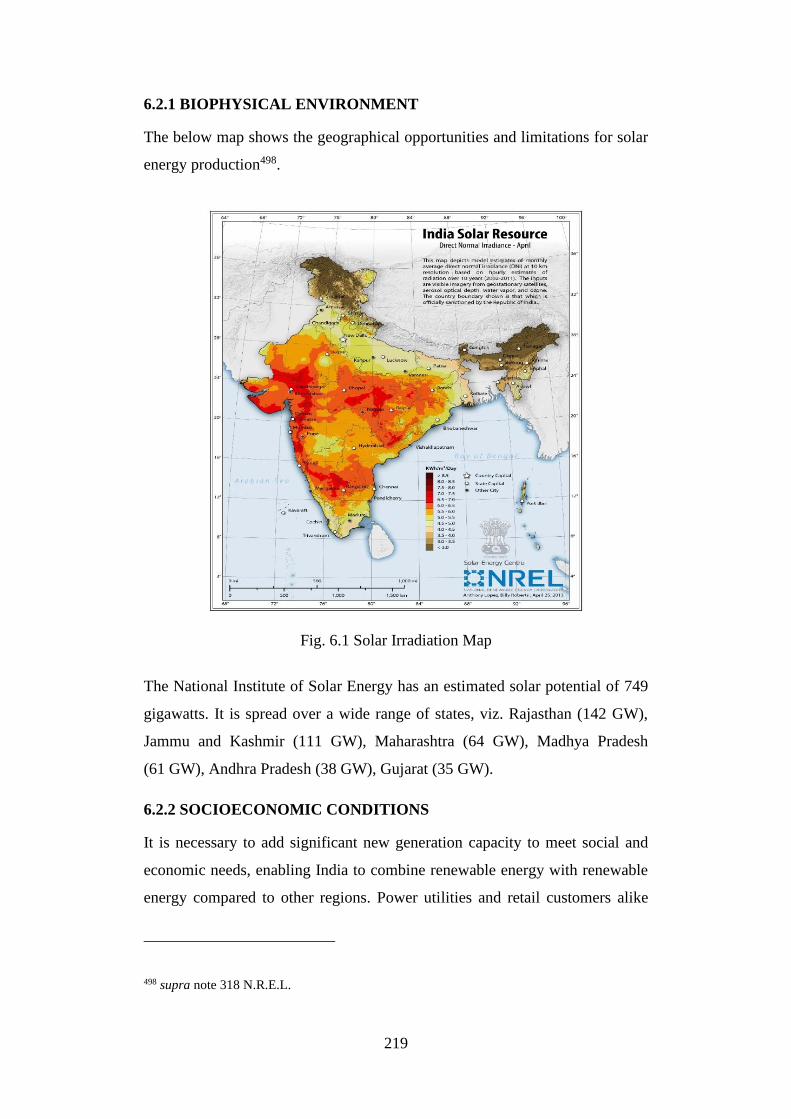
219
6.2.1 BIOPHYSICAL ENVIRONMENT
The below map shows the geographical opportunities and limitations for solar
energy production498.
Fig. 6.1 Solar Irradiation Map
The National Institute of Solar Energy has an estimated solar potential of 749
gigawatts. It is spread over a wide range of states, viz. Rajasthan (142 GW),
Jammu and Kashmir (111 GW), Maharashtra (64 GW), Madhya Pradesh
(61 GW), Andhra Pradesh (38 GW), Gujarat (35 GW).
6.2.2 SOCIOECONOMIC CONDITIONS
It is necessary to add significant new generation capacity to meet social and
economic needs, enabling India to combine renewable energy with renewable
energy compared to other regions. Power utilities and retail customers alike
498 supra note 318 N.R.E.L.
220
have large-scale renewable energy suppliers that meet their basic energy
needs. India's per capita energy consumption is very low, in fact it is less than
one third of the world average and lower than other comparable developing
countries. Recent growth in the last decade (2005-2015) increased from
612 kWh to 1,010 kWh - an increase of 5.1% per annum.
6.2.3 POLICY SUPPORT
Energy security is a major policy concern. Primary fuels are India’s single largest
importer, accounting for 37-40% of total imports (2013-2015) and the period of
high commodity prices led to restricted supplies, budget deficits and ash fuel.
Coal is responsible for 76% of the electricity generated. The government's drive
to create 175 GW of renewable energy by 2022 will help improve energy security
and improve the energy mix. The policy recommends using RPO and RGO
targets to develop this, and regulators see measures to improve enforcement.
The government has established a strong procurement model in the form of
auctions and standard bidding documents (RFQ, RFP and PPA) to facilitate a
quick, harmonious and transparent bidding process for solar development.
Rural electrification and 24X7 power distribution is a top priority of the
government. Based on the available statistics, 19,706 villages have no access
(2015), and a large number of households (33%) have no electricity connection
(Census 2010).
In most states, rural electricity supply is intermittent and poor quality. New
generation capacity must be built, and the affordable costs and concerns of
nominal customers are the best, and the cost of renewable energy is the best.
Urban centers have also grown rapidly, moving in the direction of China (50%
of the urban population) and Brazil (87%) of relatively non-urbanized India,
with only 31% of the city's population. Urban areas are more energy-intensive
and are a key component of demand growth.
6.2.4 PUBLIC INTEREST AND LOCAL DEVELOPMENT
Public opinion supports sustainable energy in India, which has helped the
states maintain a positive and stable policy environment for many years. In a
221
similar vein, many private companies are setting up renewable energy projects
for their own use, or commit to 100% of their consumption from green
sources. State-owned organizations have been tasked with setting up 10
gigawatts of solar power projects.
The courts have also taken a positive stand. Recently (May 2015), the
Supreme Court ruled that renewable liabilities are of great public interest and
can be imposed on hostage users and open access customers. Renewable
energy projects are often located in remote, remote areas and, in some cases,
arid areas. Improving the social and economic prospects of the workforce even
in limited numbers. Decentralized energy ventures such as the roof-top solar
power plant and solar-powered agricultural pump sets offer the potential to
generate electricity at the tail end of the grid, and net-metering policies offer a
moderate source of income.
6.2.5 ECONOMICS AND PROFITABILITY
As described earlier, renewable energy generation competes with electricity
from mainstream fossil fuels such as coal and natural gas. It is driven by a
variety of global factors (e.g. technology, module prices, optimization) and
regional factors (competition in capital goods and EPC, financial engineering,
new entrants and captive users).
Competition is a powerful force. There are over 20 wind turbine manufacturers in
India with an annual output of 11 gigawatts. Most of them (Suzlon, WindWorld,
Inox Wind, Region PowerTech, GameSa) offer a complete turnkey solution,
while others (GE and Vestus) focus on products.
The supply of solar modules mainly comes from imports, while the balance of
plant and inverters is available locally. The solar EPC market is also highly
competitive as it offers competitive pricing and turnkey solutions for developers.
State electricity regulators maintain a 14-16% after-tax income in determining
the tariffs for relevant renewable energy technologies such as wind, biomass,
waste-to-energy or small hydro. Where auctions like Solar Power are held,
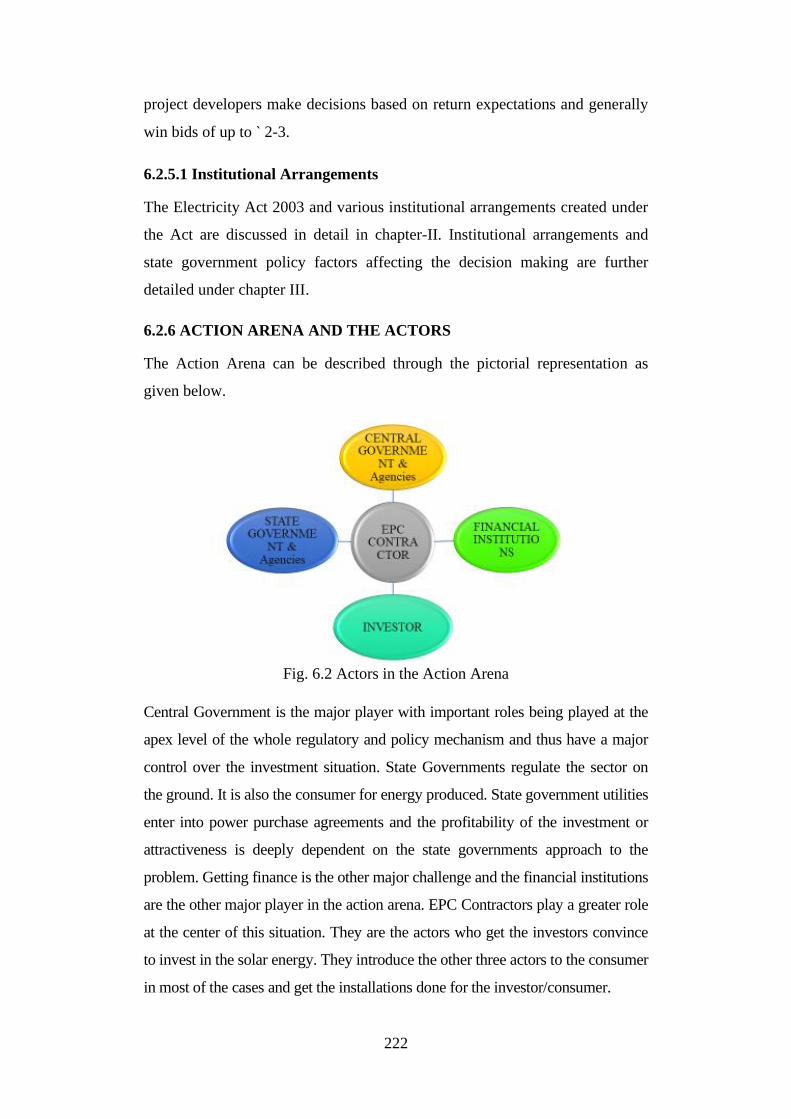
222
project developers make decisions based on return expectations and generally
win bids of up to ` 2-3.
6.2.5.1 Institutional Arrangements
The Electricity Act 2003 and various institutional arrangements created under
the Act are discussed in detail in chapter-II. Institutional arrangements and
state government policy factors affecting the decision making are further
detailed under chapter III.
6.2.6 ACTION ARENA AND THE ACTORS
The Action Arena can be described through the pictorial representation as
given below.
Fig. 6.2 Actors in the Action Arena
Central Government is the major player with important roles being played at the
apex level of the whole regulatory and policy mechanism and thus have a major
control over the investment situation. State Governments regulate the sector on
the ground. It is also the consumer for energy produced. State government utilities
enter into power purchase agreements and the profitability of the investment or
attractiveness is deeply dependent on the state governments approach to the
problem. Getting finance is the other major challenge and the financial institutions
are the other major player in the action arena. EPC Contractors play a greater role
at the center of this situation. They are the actors who get the investors convince
to invest in the solar energy. They introduce the other three actors to the consumer
in most of the cases and get the installations done for the investor/consumer.
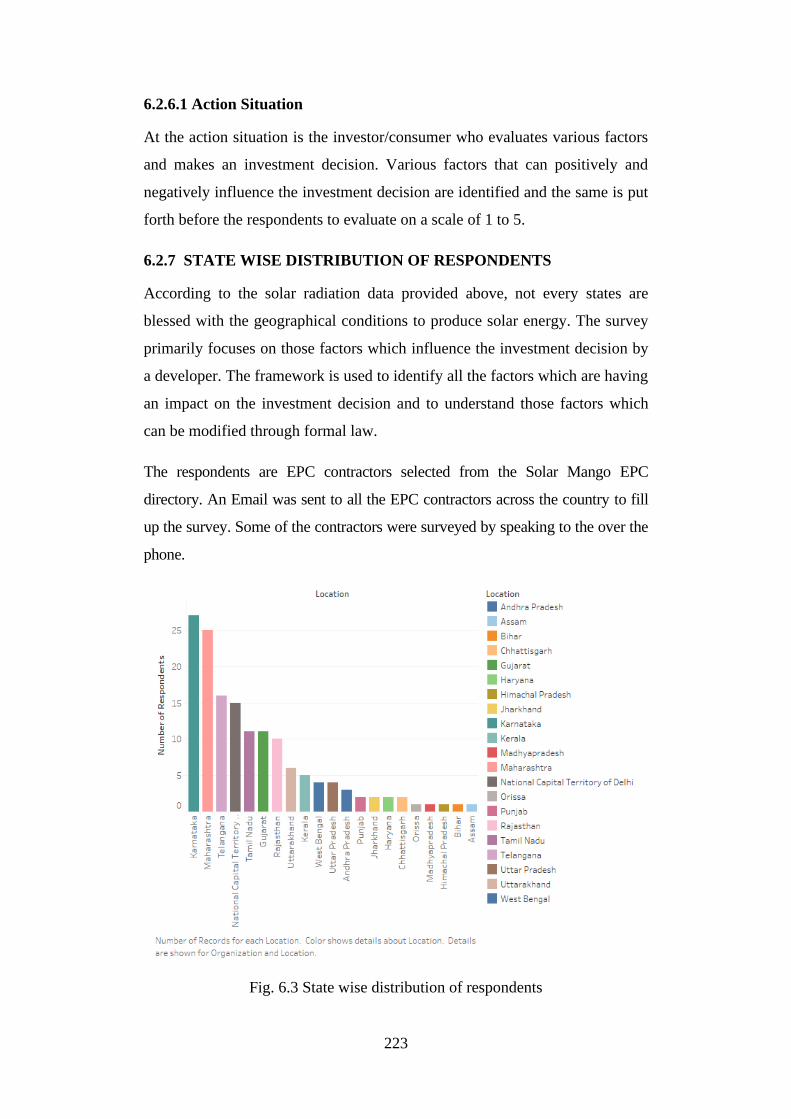
223
6.2.6.1 Action Situation
At the action situation is the investor/consumer who evaluates various factors
and makes an investment decision. Various factors that can positively and
negatively influence the investment decision are identified and the same is put
forth before the respondents to evaluate on a scale of 1 to 5.
6.2.7 STATE WISE DISTRIBUTION OF RESPONDENTS
According to the solar radiation data provided above, not every states are
blessed with the geographical conditions to produce solar energy. The survey
primarily focuses on those factors which influence the investment decision by
a developer. The framework is used to identify all the factors which are having
an impact on the investment decision and to understand those factors which
can be modified through formal law.
The respondents are EPC contractors selected from the Solar Mango EPC
directory. An Email was sent to all the EPC contractors across the country to fill
up the survey. Some of the contractors were surveyed by speaking to the over the
phone.
Fig. 6.3 State wise distribution of respondents
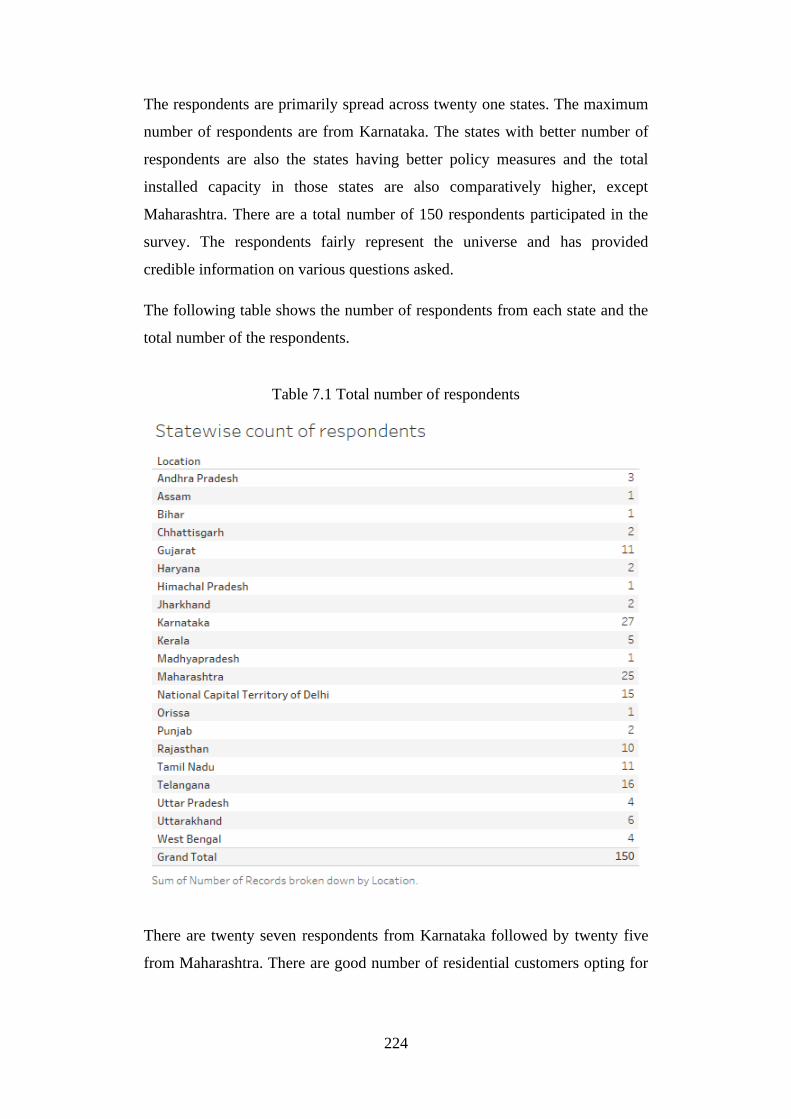
224
The respondents are primarily spread across twenty one states. The maximum
number of respondents are from Karnataka. The states with better number of
respondents are also the states having better policy measures and the total
installed capacity in those states are also comparatively higher, except
Maharashtra. There are a total number of 150 respondents participated in the
survey. The respondents fairly represent the universe and has provided
credible information on various questions asked.
The following table shows the number of respondents from each state and the
total number of the respondents.
Table 7.1 Total number of respondents
There are twenty seven respondents from Karnataka followed by twenty five
from Maharashtra. There are good number of residential customers opting for
225
standalone roof top solar in Maharashtra which has not reflected in the
installed capacity statistics.
The total number of respondents are 150. The questionnaire is given in
APPENDIX. Since the number of respondents are spread across various states
the survey data fairly represents the trend in the country. The more number of
participants from some of the states will balance the national trend with the
exposure of those respondents to the better policy and business environments
of their respective states.
6.2.7.1 Evaluative Criteria
The evaluation criteria is classified as positively and negatively influencing
factor at a scale of influence of 1 to 5. The details of the evaluation criteria is
detailed below.
6.3 THE FACTORS THAT INFLUENCE THE INVESTMENT DECISION
The survey was conducted to understand the elements of the investment
decision making process. Investment decision is arrived at after considering
various factors. There are key drivers and detractors in the investment
decision. Various promoters and detractors of the investment decision
identified through survey of numerous literatures on the subject have been
listed and asked the respondents to score on a scale of 5 about the nature of
influence each item cause on the investment decision.
6.4 FACTORS POSITIVELY INFLUENCING THE INVESTMENT
DECISION
There are many factors that influence an investment decision. The factors that
are positively influencing an investment decision in solar energy are listed
below. The percentage scores in the level of influence is also given below.
The responses have been recorded on Likert Scale of 1 to 5 on the degree of
influence each factor has on the investment decision. The responses with
Extremely Influential has a score of 5, Very Influential has 4, Moderately
Influential has 3, Slightly influential has 2 and the least score is marked for the
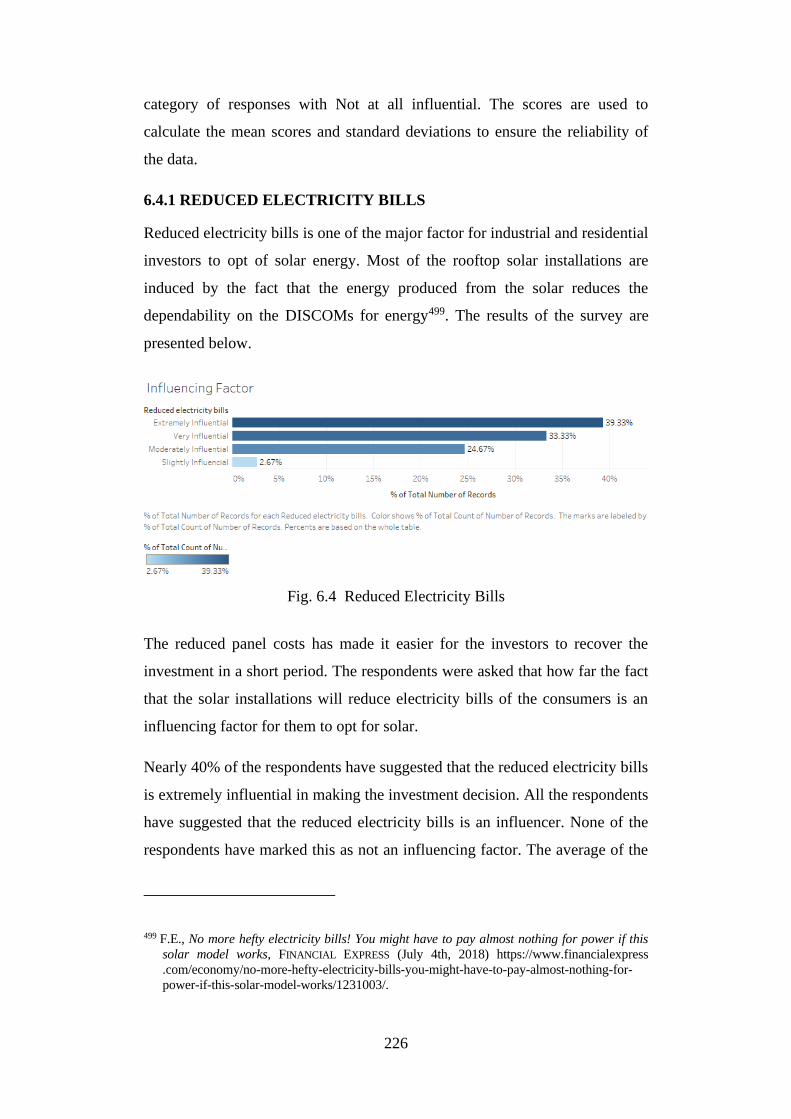
226
category of responses with Not at all influential. The scores are used to
calculate the mean scores and standard deviations to ensure the reliability of
the data.
6.4.1 REDUCED ELECTRICITY BILLS
Reduced electricity bills is one of the major factor for industrial and residential
investors to opt of solar energy. Most of the rooftop solar installations are
induced by the fact that the energy produced from the solar reduces the
dependability on the DISCOMs for energy499. The results of the survey are
presented below.
Fig. 6.4 Reduced Electricity Bills
The reduced panel costs has made it easier for the investors to recover the
investment in a short period. The respondents were asked that how far the fact
that the solar installations will reduce electricity bills of the consumers is an
influencing factor for them to opt for solar.
Nearly 40% of the respondents have suggested that the reduced electricity bills
is extremely influential in making the investment decision. All the respondents
have suggested that the reduced electricity bills is an influencer. None of the
respondents have marked this as not an influencing factor. The average of the
499 F.E., No more hefty electricity bills! You might have to pay almost nothing for power if this
solar model works, FINANCIAL EXPRESS (July 4th, 2018) https://www.financialexpress
.com/economy/no-more-hefty-electricity-bills-you-might-have-to-pay-almost-nothing-for-
power-if-this-solar-model-works/1231003/.
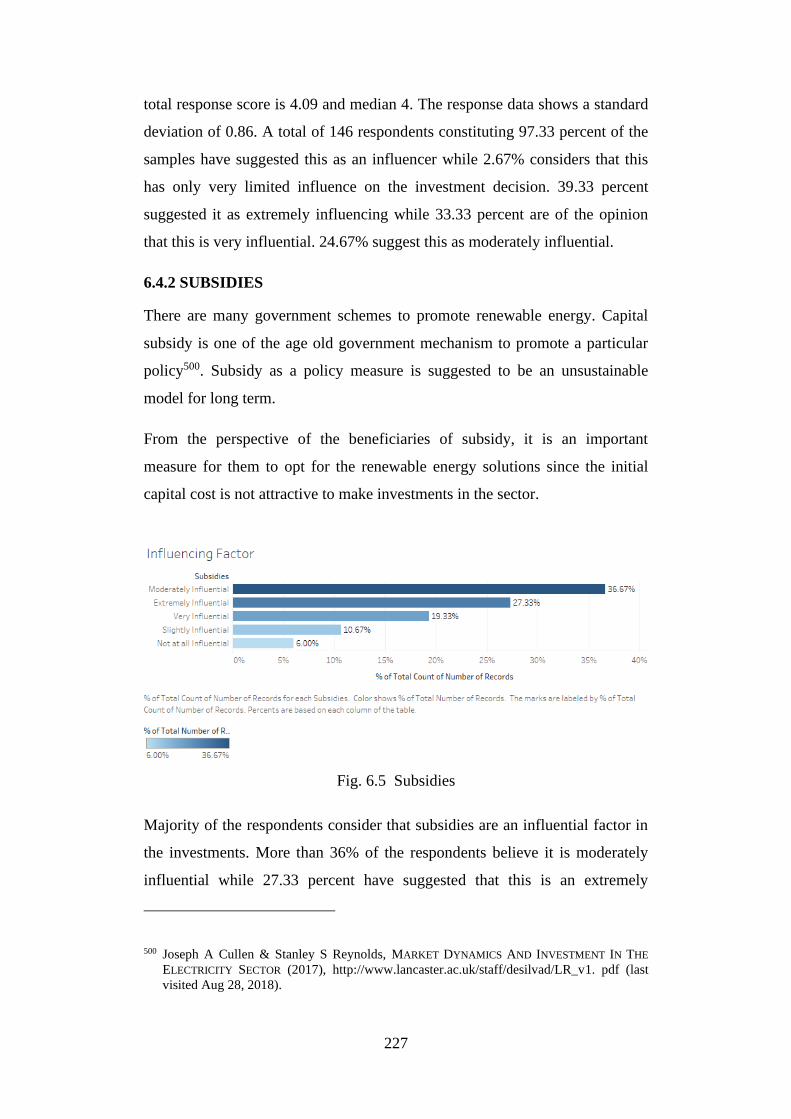
227
total response score is 4.09 and median 4. The response data shows a standard
deviation of 0.86. A total of 146 respondents constituting 97.33 percent of the
samples have suggested this as an influencer while 2.67% considers that this
has only very limited influence on the investment decision. 39.33 percent
suggested it as extremely influencing while 33.33 percent are of the opinion
that this is very influential. 24.67% suggest this as moderately influential.
6.4.2 SUBSIDIES
There are many government schemes to promote renewable energy. Capital
subsidy is one of the age old government mechanism to promote a particular
policy500. Subsidy as a policy measure is suggested to be an unsustainable
model for long term.
From the perspective of the beneficiaries of subsidy, it is an important
measure for them to opt for the renewable energy solutions since the initial
capital cost is not attractive to make investments in the sector.
Fig. 6.5 Subsidies
Majority of the respondents consider that subsidies are an influential factor in
the investments. More than 36% of the respondents believe it is moderately
influential while 27.33 percent have suggested that this is an extremely
500 Joseph A Cullen & Stanley S Reynolds, MARKET DYNAMICS AND INVESTMENT IN THE
ELECTRICITY SECTOR (2017), http://www.lancaster.ac.uk/staff/desilvad/LR_v1. pdf (last
visited Aug 28, 2018).
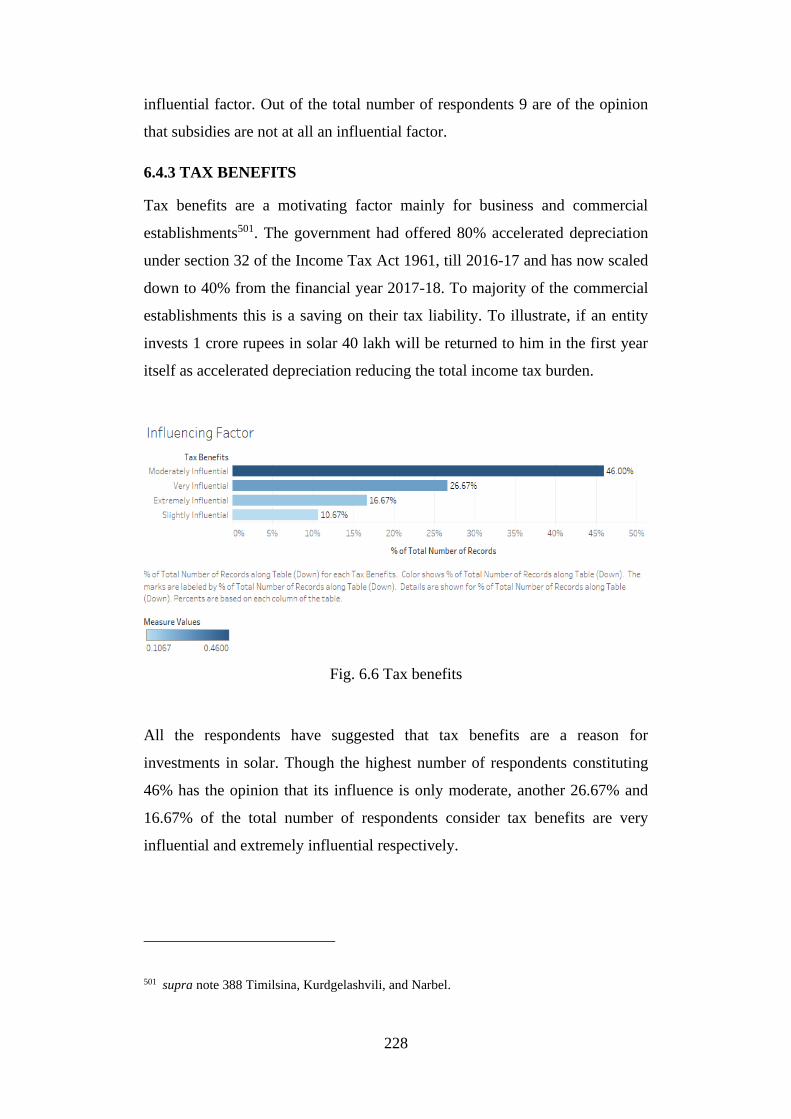
228
influential factor. Out of the total number of respondents 9 are of the opinion
that subsidies are not at all an influential factor.
6.4.3 TAX BENEFITS
Tax benefits are a motivating factor mainly for business and commercial
establishments501. The government had offered 80% accelerated depreciation
under section 32 of the Income Tax Act 1961, till 2016-17 and has now scaled
down to 40% from the financial year 2017-18. To majority of the commercial
establishments this is a saving on their tax liability. To illustrate, if an entity
invests 1 crore rupees in solar 40 lakh will be returned to him in the first year
itself as accelerated depreciation reducing the total income tax burden.
Fig. 6.6 Tax benefits
All the respondents have suggested that tax benefits are a reason for
investments in solar. Though the highest number of respondents constituting
46% has the opinion that its influence is only moderate, another 26.67% and
16.67% of the total number of respondents consider tax benefits are very
influential and extremely influential respectively.
501 supra note 388 Timilsina, Kurdgelashvili, and Narbel.
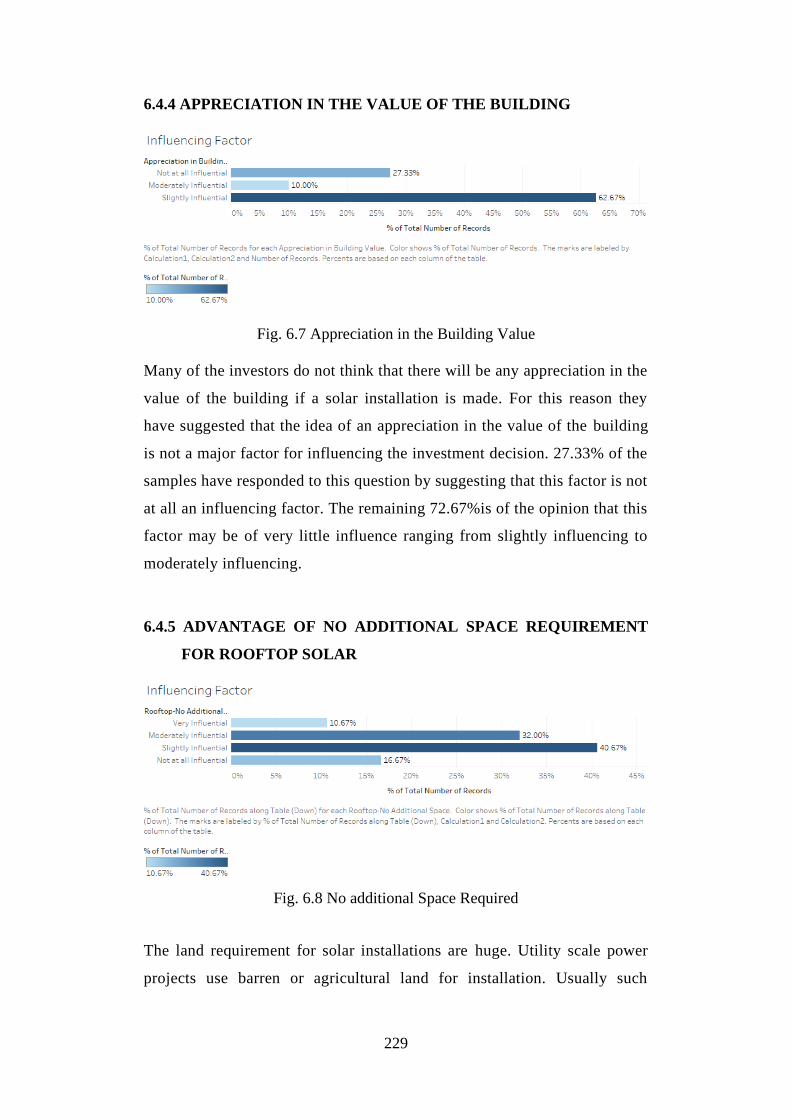
229
6.4.4 APPRECIATION IN THE VALUE OF THE BUILDING
Fig. 6.7 Appreciation in the Building Value
Many of the investors do not think that there will be any appreciation in the
value of the building if a solar installation is made. For this reason they
have suggested that the idea of an appreciation in the value of the building
is not a major factor for influencing the investment decision. 27.33% of the
samples have responded to this question by suggesting that this factor is not
at all an influencing factor. The remaining 72.67%is of the opinion that this
factor may be of very little influence ranging from slightly influencing to
moderately influencing.
6.4.5 ADVANTAGE OF NO ADDITIONAL SPACE REQUIREMENT
FOR ROOFTOP SOLAR
Fig. 6.8 No additional Space Required
The land requirement for solar installations are huge. Utility scale power
projects use barren or agricultural land for installation. Usually such
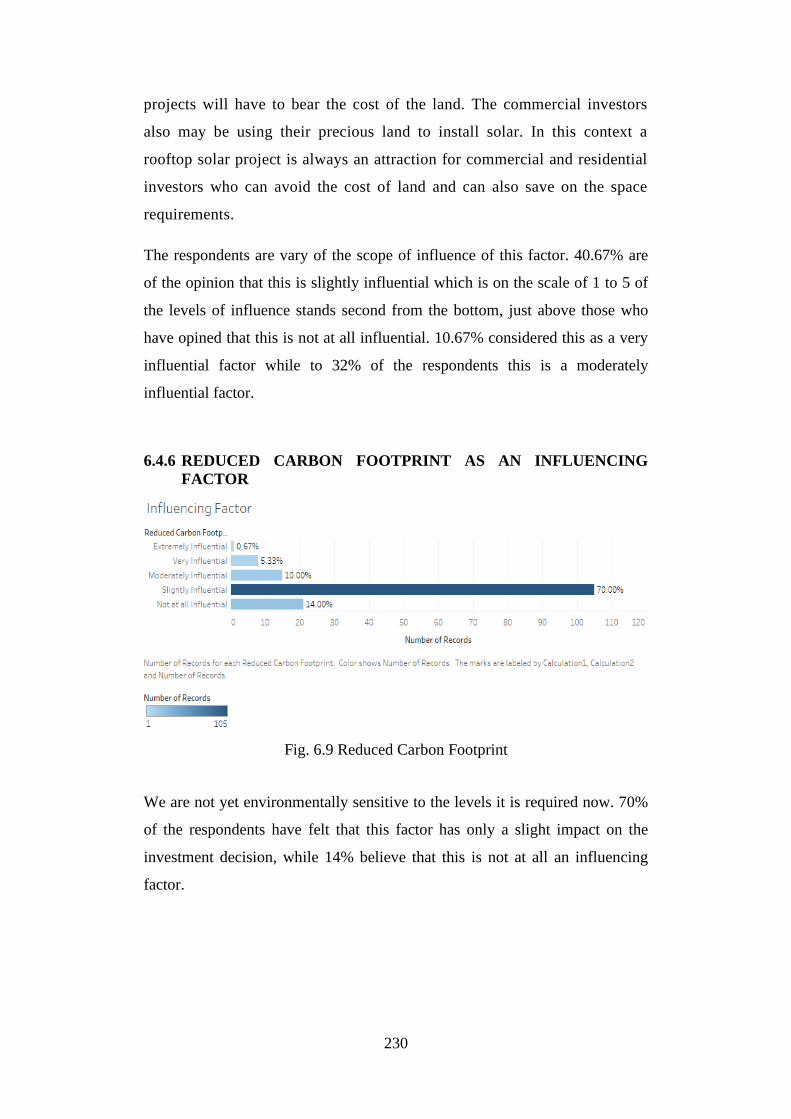
230
projects will have to bear the cost of the land. The commercial investors
also may be using their precious land to install solar. In this context a
rooftop solar project is always an attraction for commercial and residential
investors who can avoid the cost of land and can also save on the space
requirements.
The respondents are vary of the scope of influence of this factor. 40.67% are
of the opinion that this is slightly influential which is on the scale of 1 to 5 of
the levels of influence stands second from the bottom, just above those who
have opined that this is not at all influential. 10.67% considered this as a very
influential factor while to 32% of the respondents this is a moderately
influential factor.
6.4.6 REDUCED CARBON FOOTPRINT AS AN INFLUENCING
FACTOR
Fig. 6.9 Reduced Carbon Footprint
We are not yet environmentally sensitive to the levels it is required now. 70%
of the respondents have felt that this factor has only a slight impact on the
investment decision, while 14% believe that this is not at all an influencing
factor.
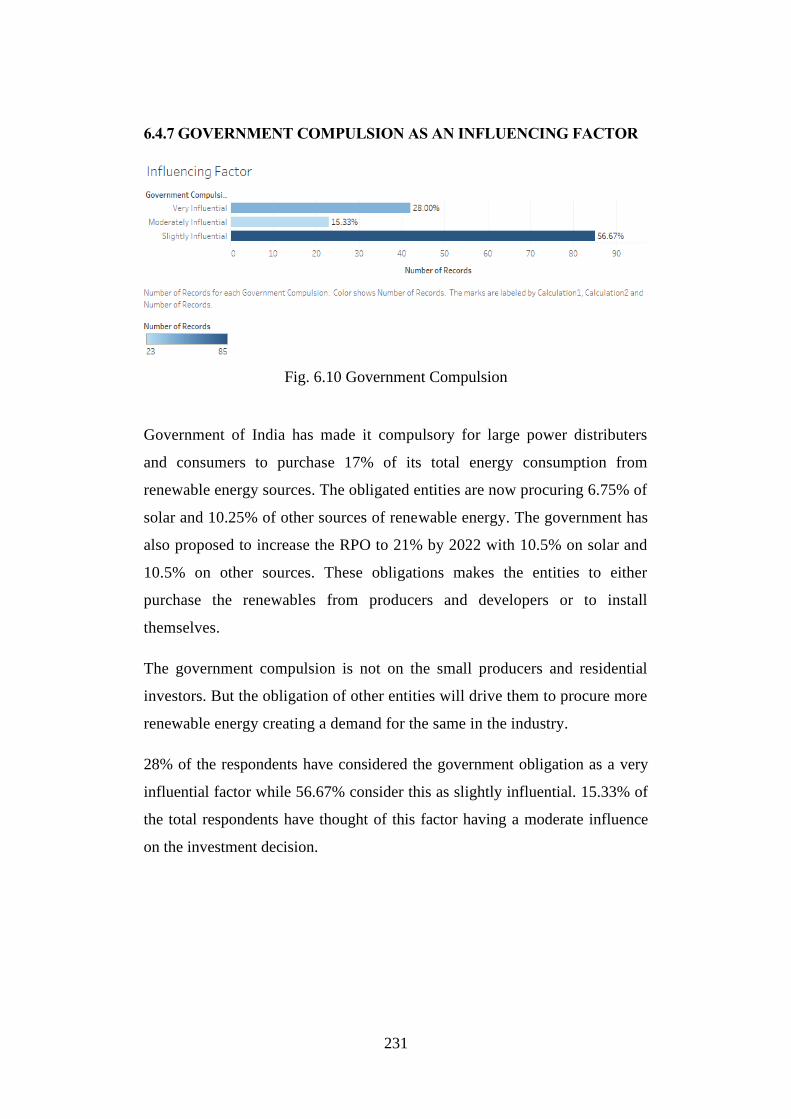
231
6.4.7 GOVERNMENT COMPULSION AS AN INFLUENCING FACTOR
Fig. 6.10 Government Compulsion
Government of India has made it compulsory for large power distributers
and consumers to purchase 17% of its total energy consumption from
renewable energy sources. The obligated entities are now procuring 6.75% of
solar and 10.25% of other sources of renewable energy. The government has
also proposed to increase the RPO to 21% by 2022 with 10.5% on solar and
10.5% on other sources. These obligations makes the entities to either
purchase the renewables from producers and developers or to install
themselves.
The government compulsion is not on the small producers and residential
investors. But the obligation of other entities will drive them to procure more
renewable energy creating a demand for the same in the industry.
28% of the respondents have considered the government obligation as a very
influential factor while 56.67% consider this as slightly influential. 15.33% of
the total respondents have thought of this factor having a moderate influence
on the investment decision.
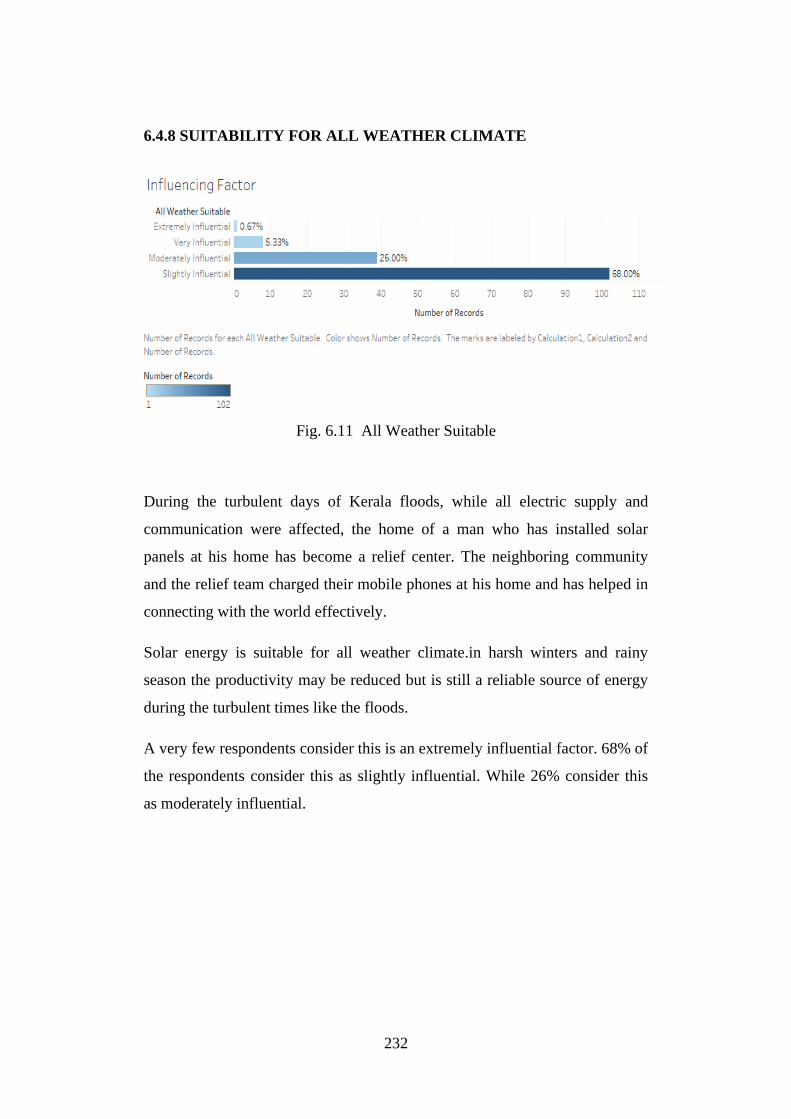
232
6.4.8 SUITABILITY FOR ALL WEATHER CLIMATE
Fig. 6.11 All Weather Suitable
During the turbulent days of Kerala floods, while all electric supply and
communication were affected, the home of a man who has installed solar
panels at his home has become a relief center. The neighboring community
and the relief team charged their mobile phones at his home and has helped in
connecting with the world effectively.
Solar energy is suitable for all weather climate.in harsh winters and rainy
season the productivity may be reduced but is still a reliable source of energy
during the turbulent times like the floods.
A very few respondents consider this is an extremely influential factor. 68% of
the respondents consider this as slightly influential. While 26% consider this
as moderately influential.
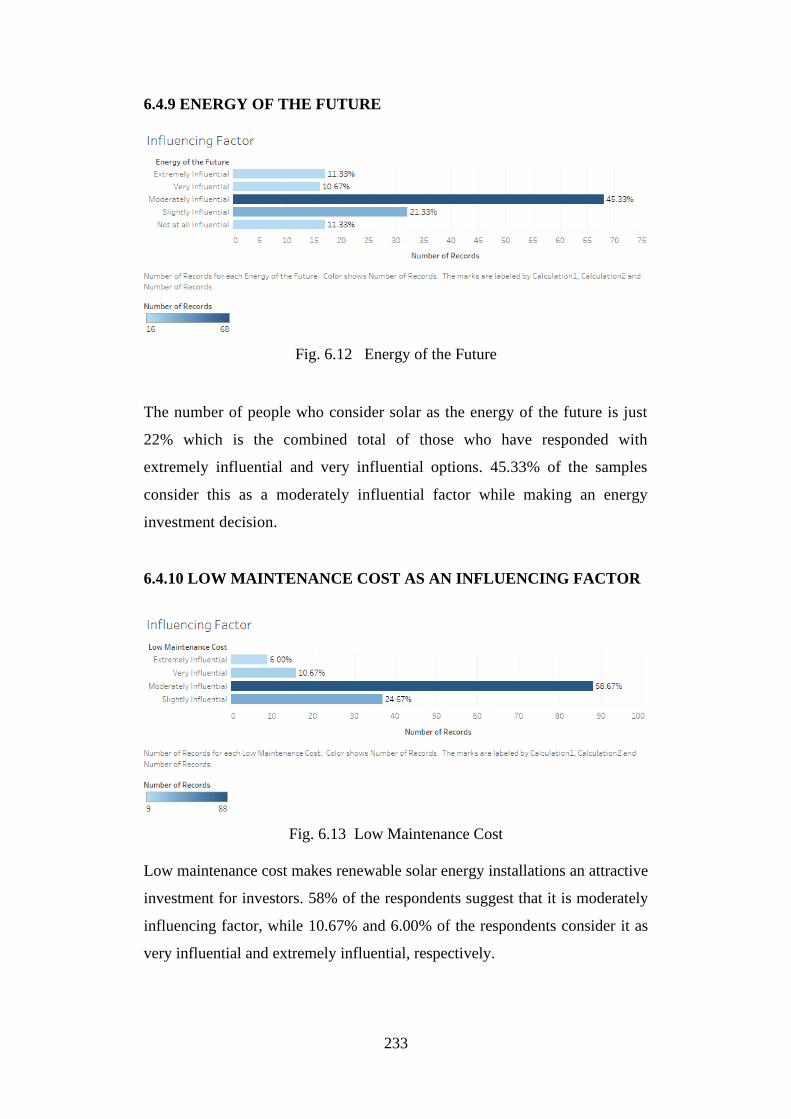
233
6.4.9 ENERGY OF THE FUTURE
Fig. 6.12 Energy of the Future
The number of people who consider solar as the energy of the future is just
22% which is the combined total of those who have responded with
extremely influential and very influential options. 45.33% of the samples
consider this as a moderately influential factor while making an energy
investment decision.
6.4.10 LOW MAINTENANCE COST AS AN INFLUENCING FACTOR
Fig. 6.13 Low Maintenance Cost
Low maintenance cost makes renewable solar energy installations an attractive
investment for investors. 58% of the respondents suggest that it is moderately
influencing factor, while 10.67% and 6.00% of the respondents consider it as
very influential and extremely influential, respectively.
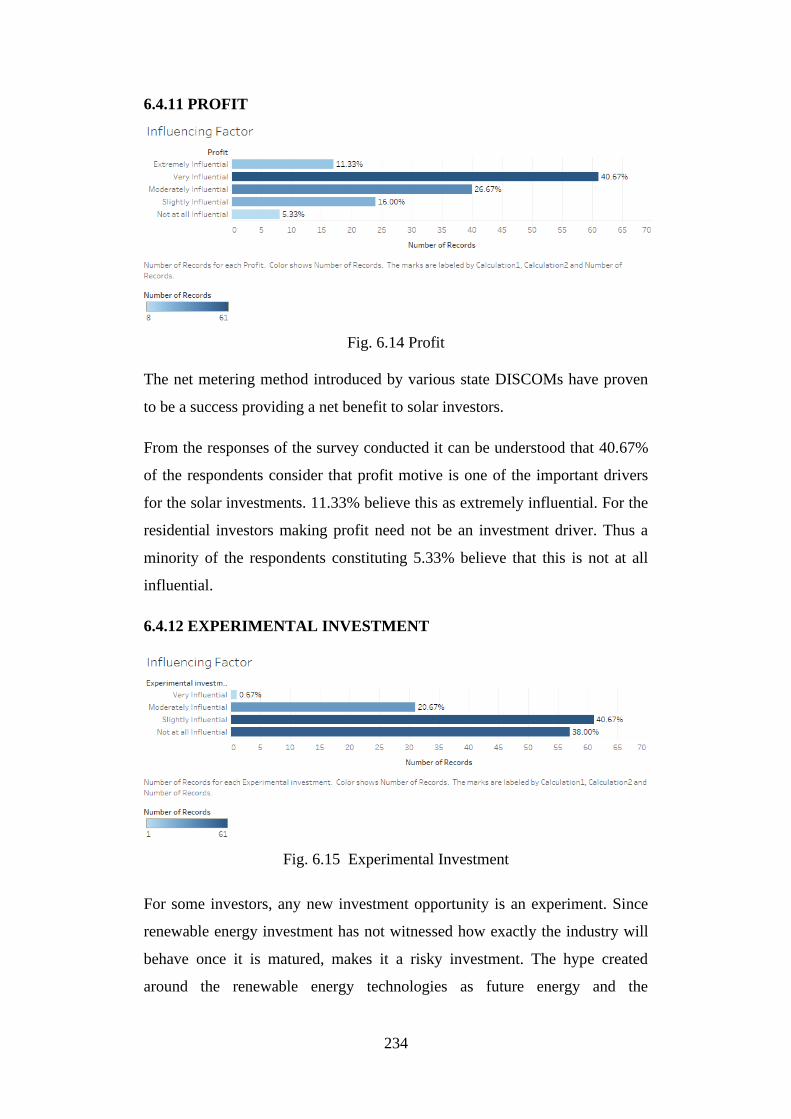
234
6.4.11 PROFIT
Fig. 6.14 Profit
The net metering method introduced by various state DISCOMs have proven
to be a success providing a net benefit to solar investors.
From the responses of the survey conducted it can be understood that 40.67%
of the respondents consider that profit motive is one of the important drivers
for the solar investments. 11.33% believe this as extremely influential. For the
residential investors making profit need not be an investment driver. Thus a
minority of the respondents constituting 5.33% believe that this is not at all
influential.
6.4.12 EXPERIMENTAL INVESTMENT
Fig. 6.15 Experimental Investment
For some investors, any new investment opportunity is an experiment. Since
renewable energy investment has not witnessed how exactly the industry will
behave once it is matured, makes it a risky investment. The hype created
around the renewable energy technologies as future energy and the
235
government push for renewables have made many to think in the direction of
making investments in the sector as an experiment. But the survey suggests
that this is not a driving force in the Indian conditions. 38% of the respondents
feel this as not at all an influencer while 40.67% consider this can be slightly
influencing the investment decision. Since such a majority of respondents
suggest this to be of not making an impact in the investment decision, this is
not a major influencer.
6.4.13 BRAND VALUE AS AN INFLUENCING FACTOR
Fig. 6.16 Brand Value
Going green is the global branding mantra today. Companies are making a
social impact and image as pro-environment and invests in the global climate
change endeavors. This question aimed at understanding the level of influence
a green branding has on the investment decision. It can be seen that this is not
a major influencer with 51.33% considering this as only moderately influential
while 37.33% suggested it is even less, at slightly influential level. 5.33%
considered this as not at all influential who majorly represented the residential
investors.
6.4.14 INVESTORS WANT TO MOVE WITH THE TREND
Investors moving with the trends in investments is common feature all around
the world. Whether the investments in renewable energy has become a trend is
still can’t be positively answered, but whether any such trend is being
influencing the Indian investors is worthless to ask in the light of any
perceivable trend in investment. The results suggests that there exists no such
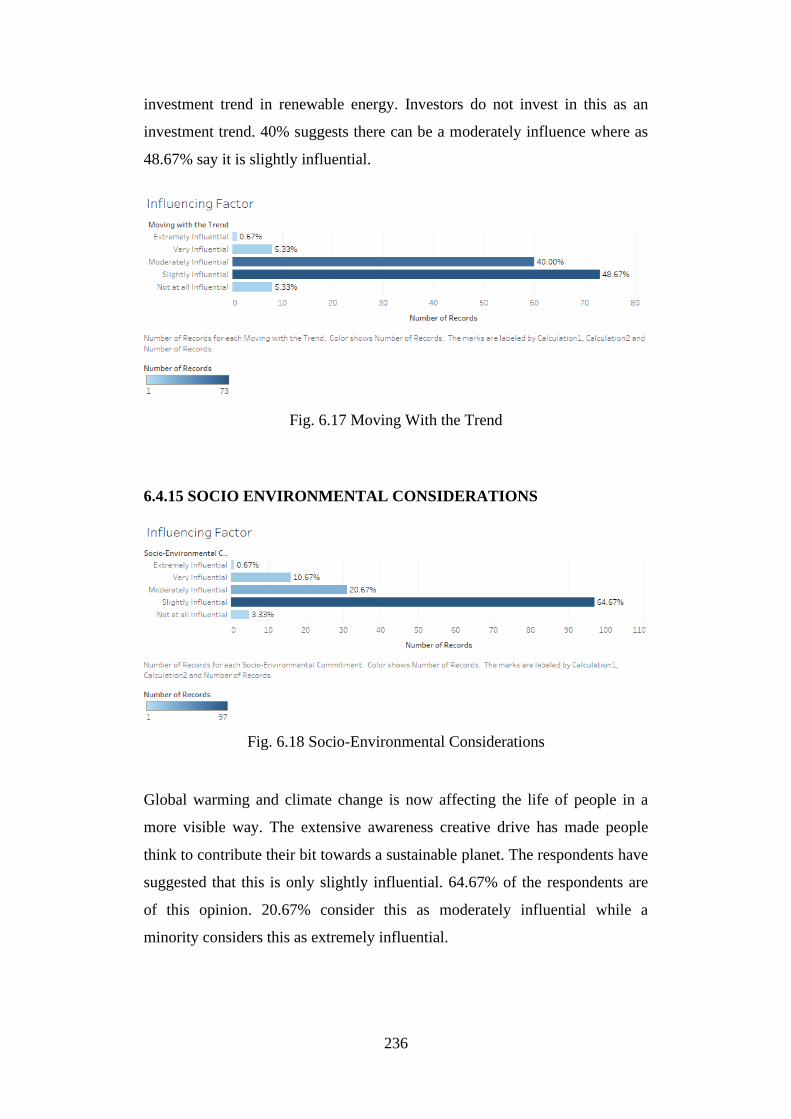
236
investment trend in renewable energy. Investors do not invest in this as an
investment trend. 40% suggests there can be a moderately influence where as
48.67% say it is slightly influential.
Fig. 6.17 Moving With the Trend
6.4.15 SOCIO ENVIRONMENTAL CONSIDERATIONS
Fig. 6.18 Socio-Environmental Considerations
Global warming and climate change is now affecting the life of people in a
more visible way. The extensive awareness creative drive has made people
think to contribute their bit towards a sustainable planet. The respondents have
suggested that this is only slightly influential. 64.67% of the respondents are
of this opinion. 20.67% consider this as moderately influential while a
minority considers this as extremely influential.
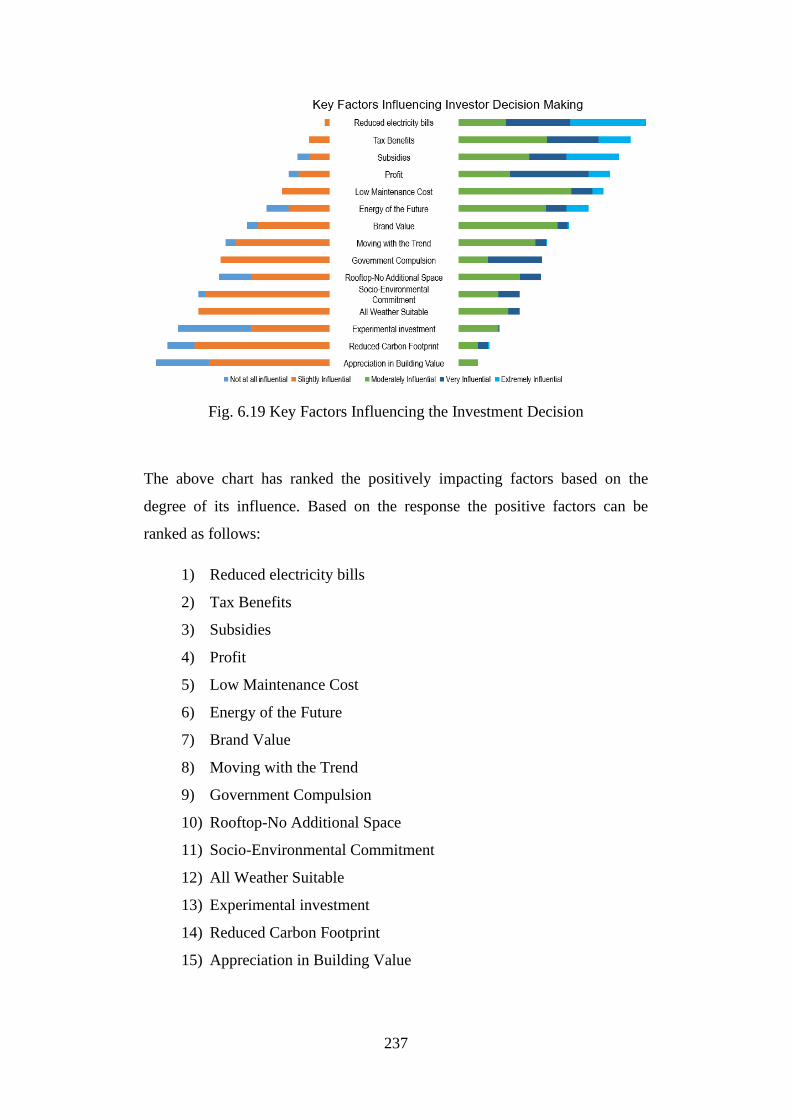
237
Fig. 6.19 Key Factors Influencing the Investment Decision
The above chart has ranked the positively impacting factors based on the
degree of its influence. Based on the response the positive factors can be
ranked as follows:
1) Reduced electricity bills
2) Tax Benefits
3) Subsidies
4) Profit
5) Low Maintenance Cost
6) Energy of the Future
7) Brand Value
8) Moving with the Trend
9) Government Compulsion
10) Rooftop-No Additional Space
11) Socio-Environmental Commitment
12) All Weather Suitable
13) Experimental investment
14) Reduced Carbon Footprint
15) Appreciation in Building Value
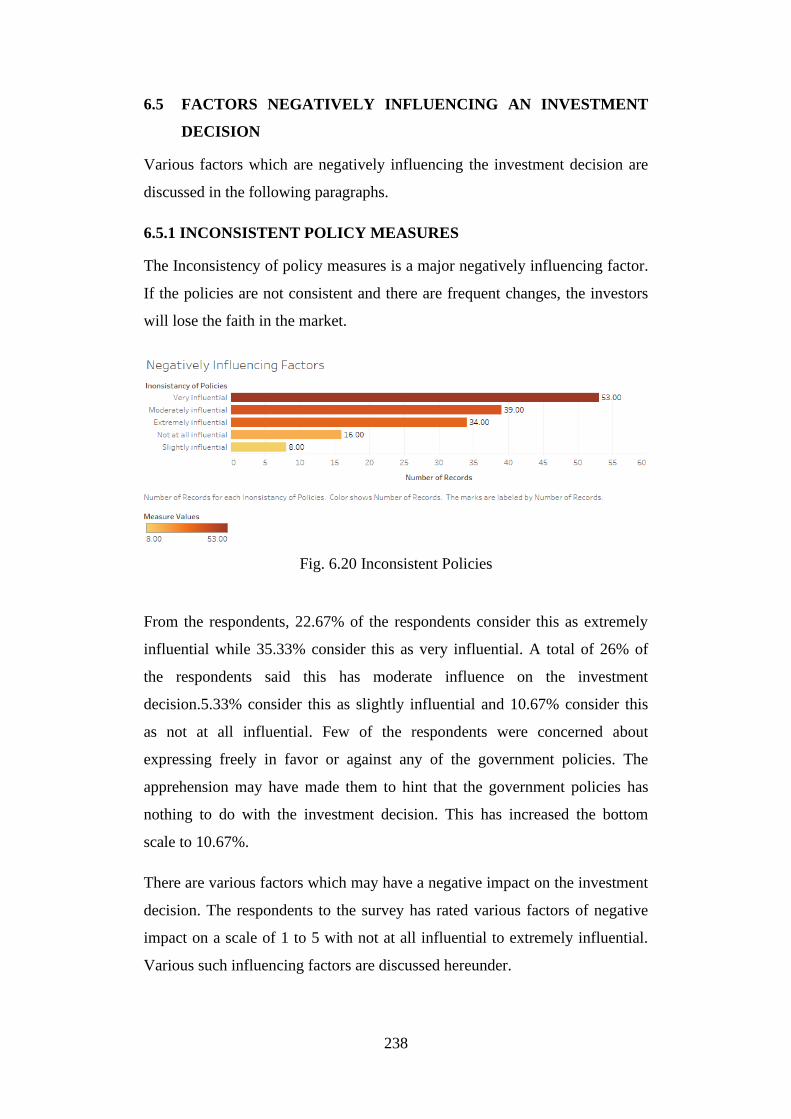
238
6.5 FACTORS NEGATIVELY INFLUENCING AN INVESTMENT
DECISION
Various factors which are negatively influencing the investment decision are
discussed in the following paragraphs.
6.5.1 INCONSISTENT POLICY MEASURES
The Inconsistency of policy measures is a major negatively influencing factor.
If the policies are not consistent and there are frequent changes, the investors
will lose the faith in the market.
Fig. 6.20 Inconsistent Policies
From the respondents, 22.67% of the respondents consider this as extremely
influential while 35.33% consider this as very influential. A total of 26% of
the respondents said this has moderate influence on the investment
decision.5.33% consider this as slightly influential and 10.67% consider this
as not at all influential. Few of the respondents were concerned about
expressing freely in favor or against any of the government policies. The
apprehension may have made them to hint that the government policies has
nothing to do with the investment decision. This has increased the bottom
scale to 10.67%.
There are various factors which may have a negative impact on the investment
decision. The respondents to the survey has rated various factors of negative
impact on a scale of 1 to 5 with not at all influential to extremely influential.
Various such influencing factors are discussed hereunder.
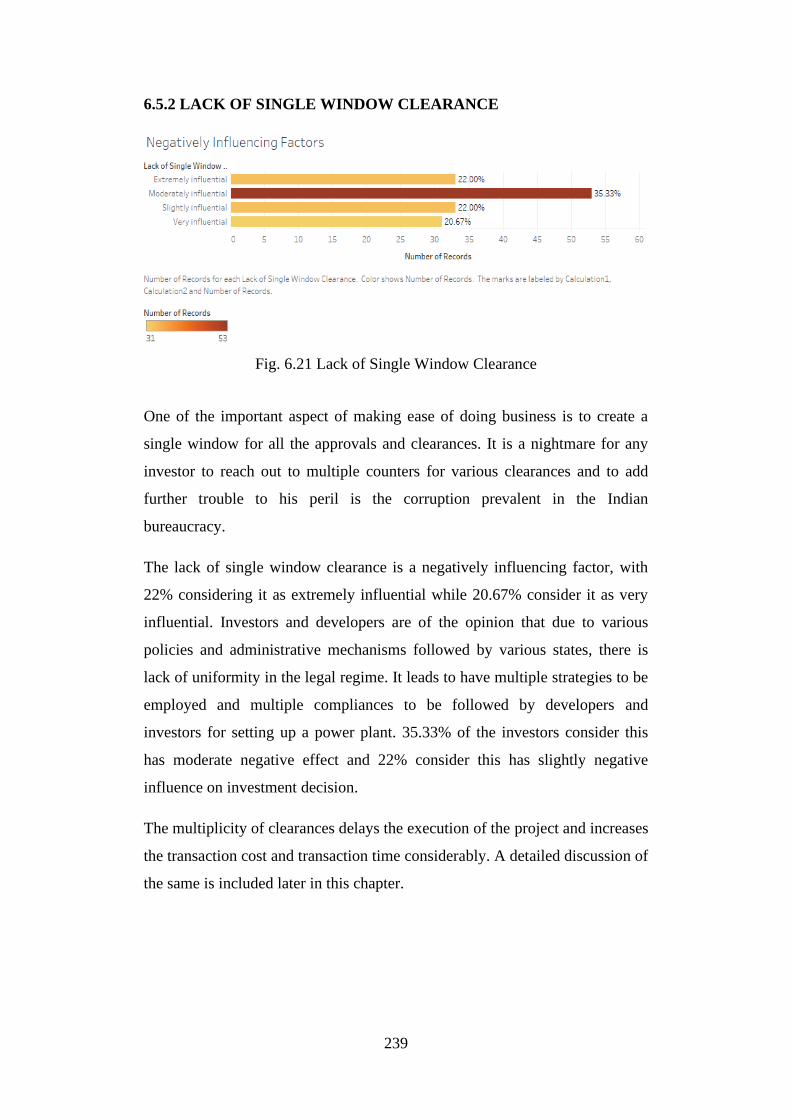
239
6.5.2 LACK OF SINGLE WINDOW CLEARANCE
Fig. 6.21 Lack of Single Window Clearance
One of the important aspect of making ease of doing business is to create a
single window for all the approvals and clearances. It is a nightmare for any
investor to reach out to multiple counters for various clearances and to add
further trouble to his peril is the corruption prevalent in the Indian
bureaucracy.
The lack of single window clearance is a negatively influencing factor, with
22% considering it as extremely influential while 20.67% consider it as very
influential. Investors and developers are of the opinion that due to various
policies and administrative mechanisms followed by various states, there is
lack of uniformity in the legal regime. It leads to have multiple strategies to be
employed and multiple compliances to be followed by developers and
investors for setting up a power plant. 35.33% of the investors consider this
has moderate negative effect and 22% consider this has slightly negative
influence on investment decision.
The multiplicity of clearances delays the execution of the project and increases
the transaction cost and transaction time considerably. A detailed discussion of
the same is included later in this chapter.
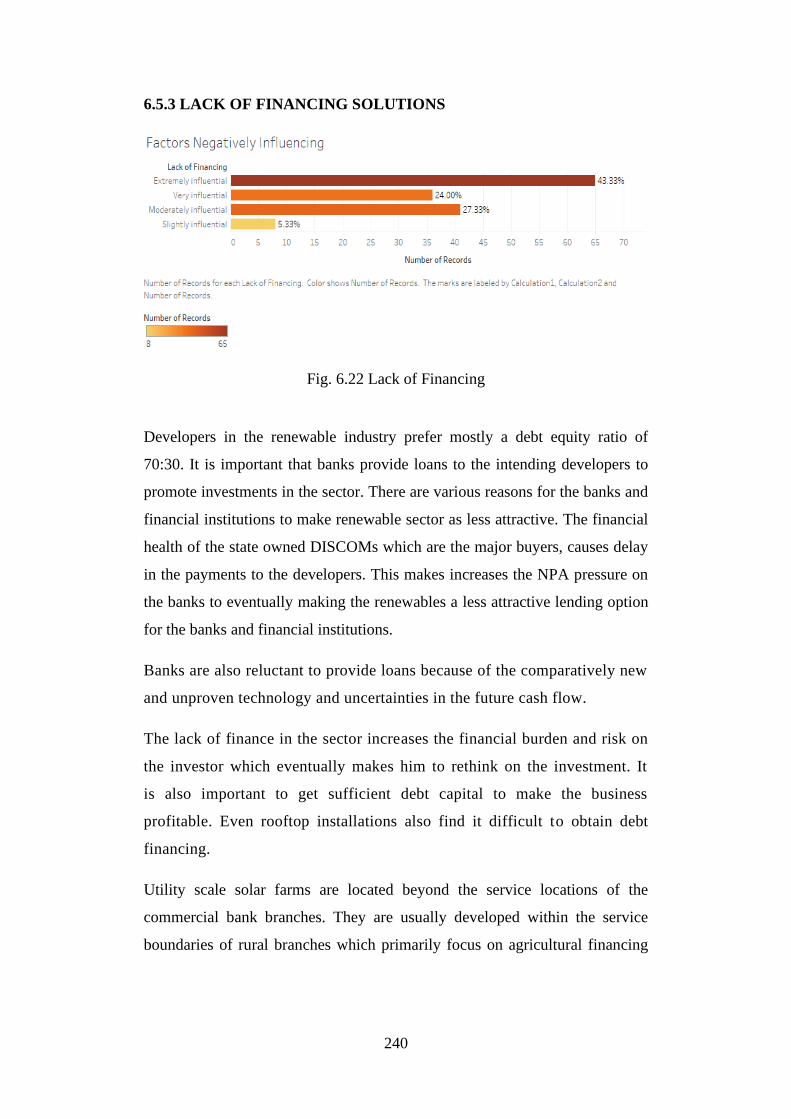
240
6.5.3 LACK OF FINANCING SOLUTIONS
Fig. 6.22 Lack of Financing
Developers in the renewable industry prefer mostly a debt equity ratio of
70:30. It is important that banks provide loans to the intending developers to
promote investments in the sector. There are various reasons for the banks and
financial institutions to make renewable sector as less attractive. The financial
health of the state owned DISCOMs which are the major buyers, causes delay
in the payments to the developers. This makes increases the NPA pressure on
the banks to eventually making the renewables a less attractive lending option
for the banks and financial institutions.
Banks are also reluctant to provide loans because of the comparatively new
and unproven technology and uncertainties in the future cash flow.
The lack of finance in the sector increases the financial burden and risk on
the investor which eventually makes him to rethink on the investment. It
is also important to get sufficient debt capital to make the business
profitable. Even rooftop installations also find it difficult to obtain debt
financing.
Utility scale solar farms are located beyond the service locations of the
commercial bank branches. They are usually developed within the service
boundaries of rural branches which primarily focus on agricultural financing
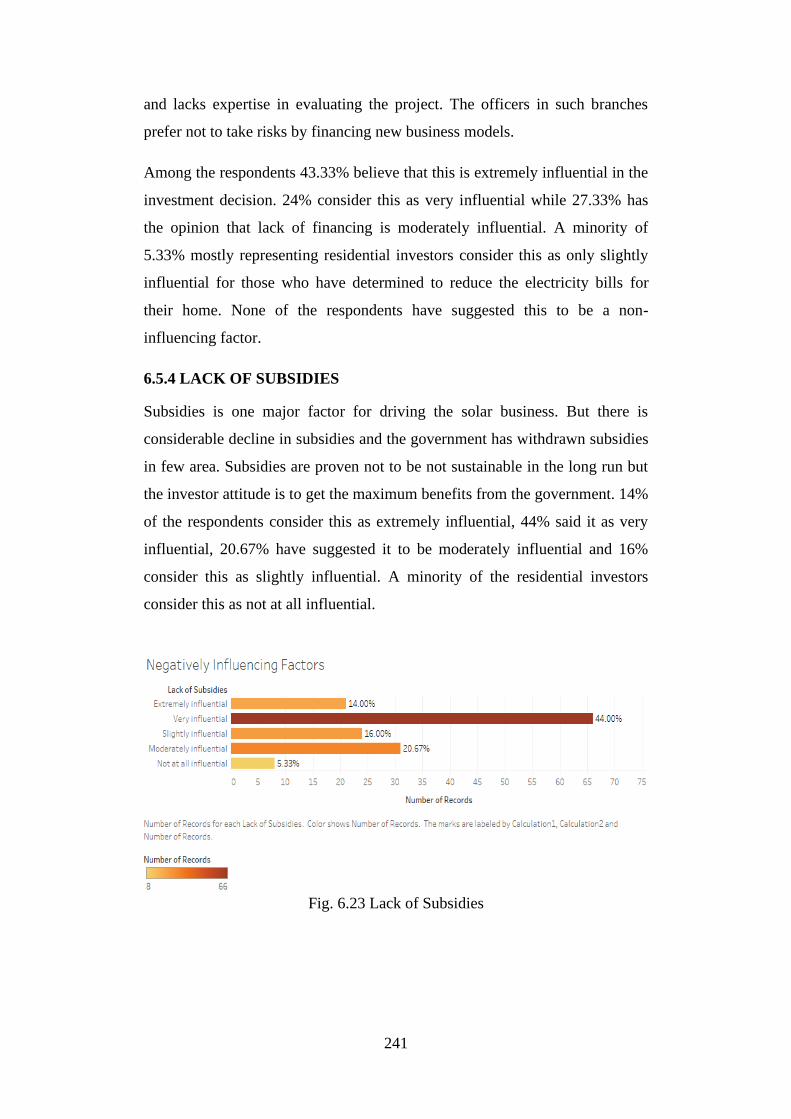
241
and lacks expertise in evaluating the project. The officers in such branches
prefer not to take risks by financing new business models.
Among the respondents 43.33% believe that this is extremely influential in the
investment decision. 24% consider this as very influential while 27.33% has
the opinion that lack of financing is moderately influential. A minority of
5.33% mostly representing residential investors consider this as only slightly
influential for those who have determined to reduce the electricity bills for
their home. None of the respondents have suggested this to be a non-
influencing factor.
6.5.4 LACK OF SUBSIDIES
Subsidies is one major factor for driving the solar business. But there is
considerable decline in subsidies and the government has withdrawn subsidies
in few area. Subsidies are proven not to be not sustainable in the long run but
the investor attitude is to get the maximum benefits from the government. 14%
of the respondents consider this as extremely influential, 44% said it as very
influential, 20.67% have suggested it to be moderately influential and 16%
consider this as slightly influential. A minority of the residential investors
consider this as not at all influential.
Fig. 6.23 Lack of Subsidies
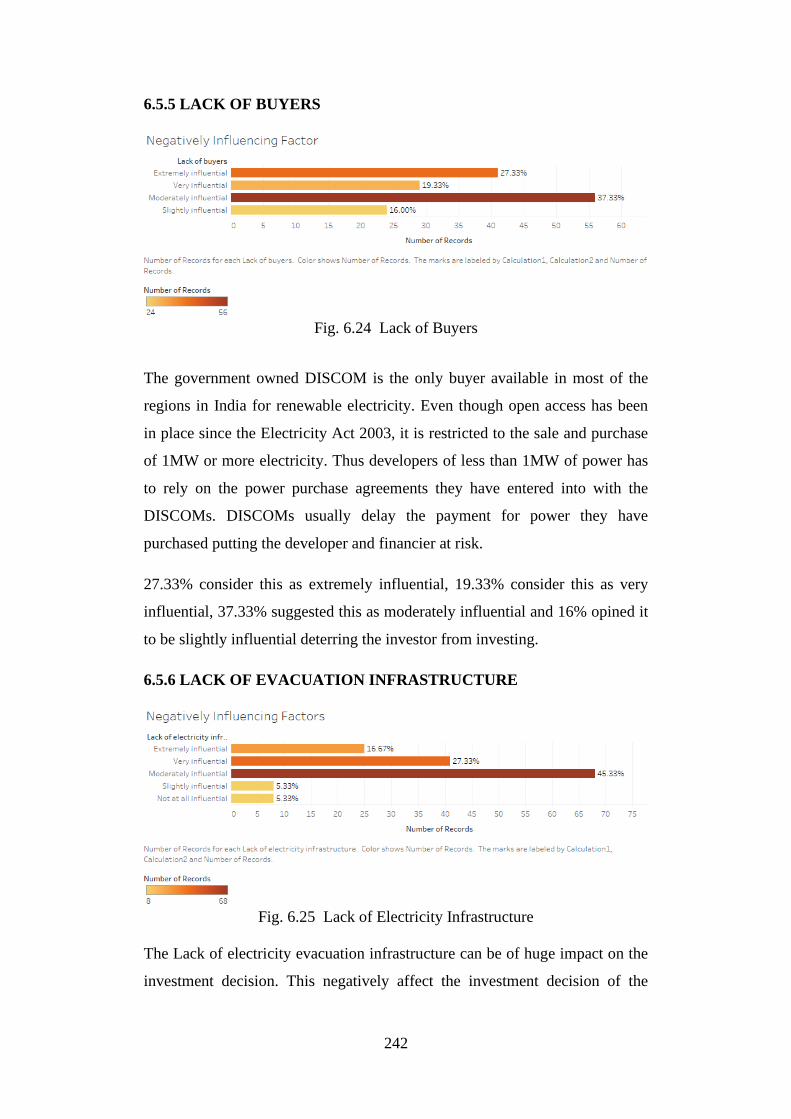
242
6.5.5 LACK OF BUYERS
Fig. 6.24 Lack of Buyers
The government owned DISCOM is the only buyer available in most of the
regions in India for renewable electricity. Even though open access has been
in place since the Electricity Act 2003, it is restricted to the sale and purchase
of 1MW or more electricity. Thus developers of less than 1MW of power has
to rely on the power purchase agreements they have entered into with the
DISCOMs. DISCOMs usually delay the payment for power they have
purchased putting the developer and financier at risk.
27.33% consider this as extremely influential, 19.33% consider this as very
influential, 37.33% suggested this as moderately influential and 16% opined it
to be slightly influential deterring the investor from investing.
6.5.6 LACK OF EVACUATION INFRASTRUCTURE
Fig. 6.25 Lack of Electricity Infrastructure
The Lack of electricity evacuation infrastructure can be of huge impact on the
investment decision. This negatively affect the investment decision of the
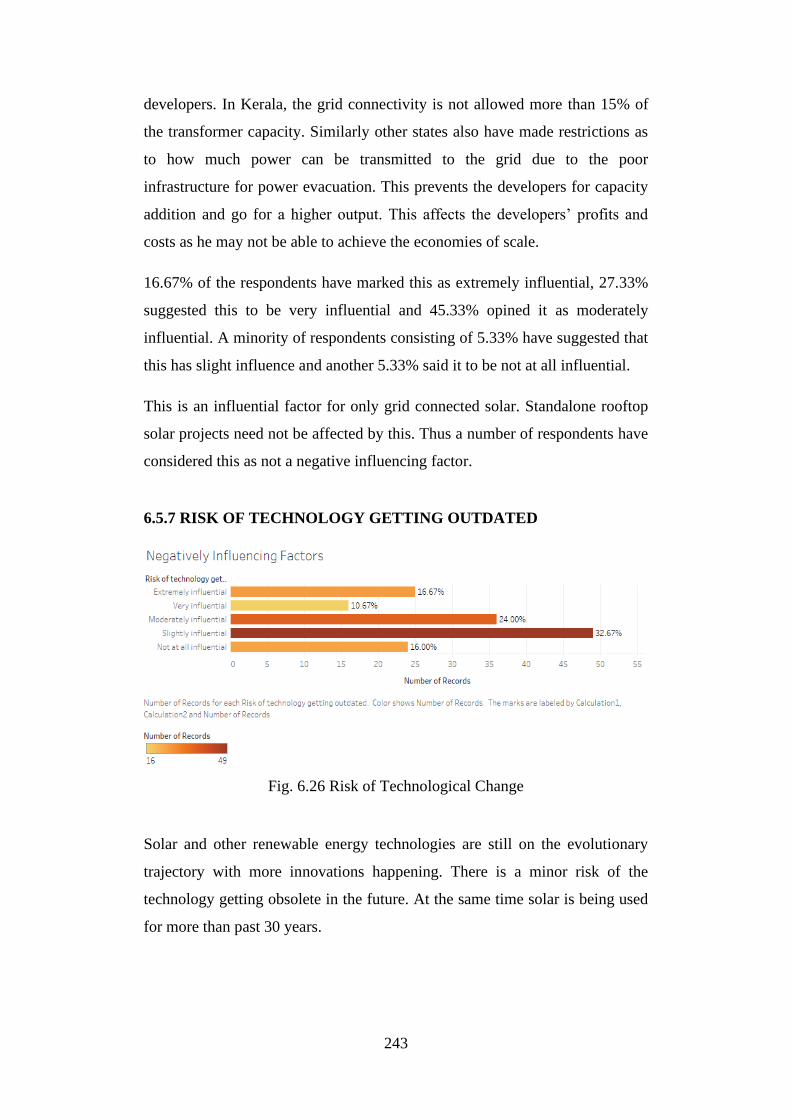
243
developers. In Kerala, the grid connectivity is not allowed more than 15% of
the transformer capacity. Similarly other states also have made restrictions as
to how much power can be transmitted to the grid due to the poor
infrastructure for power evacuation. This prevents the developers for capacity
addition and go for a higher output. This affects the developers’ profits and
costs as he may not be able to achieve the economies of scale.
16.67% of the respondents have marked this as extremely influential, 27.33%
suggested this to be very influential and 45.33% opined it as moderately
influential. A minority of respondents consisting of 5.33% have suggested that
this has slight influence and another 5.33% said it to be not at all influential.
This is an influential factor for only grid connected solar. Standalone rooftop
solar projects need not be affected by this. Thus a number of respondents have
considered this as not a negative influencing factor.
6.5.7 RISK OF TECHNOLOGY GETTING OUTDATED
Fig. 6.26 Risk of Technological Change
Solar and other renewable energy technologies are still on the evolutionary
trajectory with more innovations happening. There is a minor risk of the
technology getting obsolete in the future. At the same time solar is being used
for more than past 30 years.
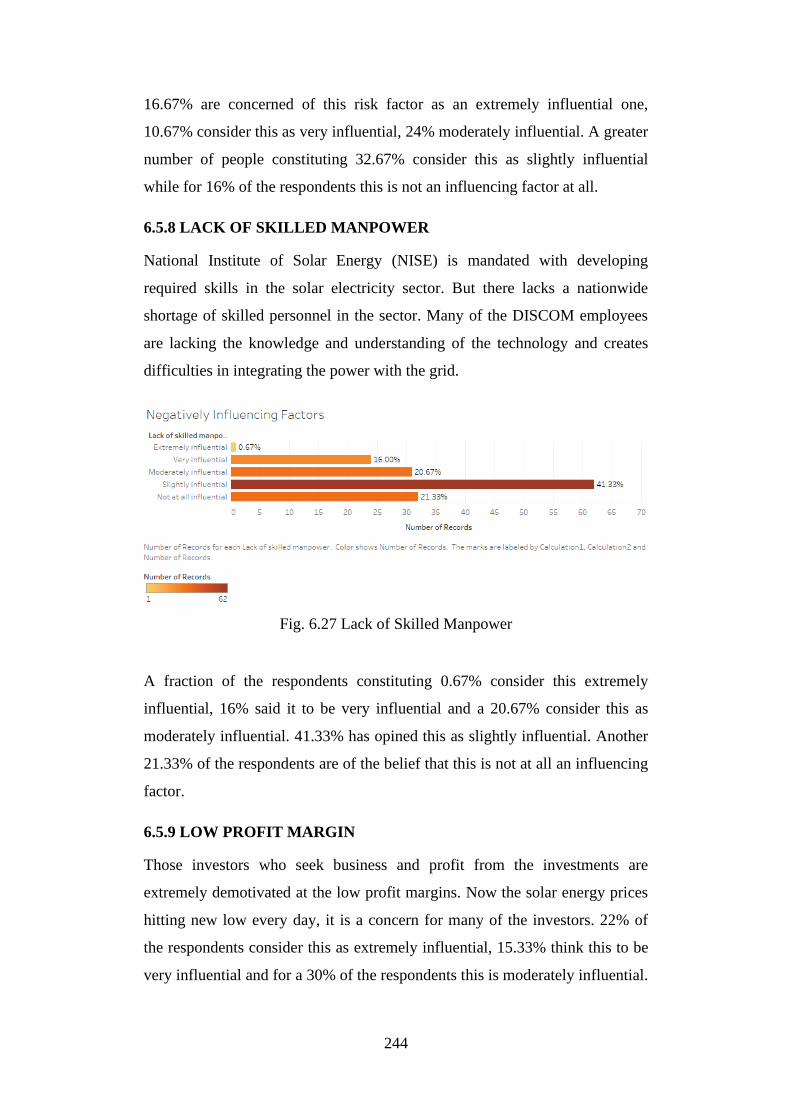
244
16.67% are concerned of this risk factor as an extremely influential one,
10.67% consider this as very influential, 24% moderately influential. A greater
number of people constituting 32.67% consider this as slightly influential
while for 16% of the respondents this is not an influencing factor at all.
6.5.8 LACK OF SKILLED MANPOWER
National Institute of Solar Energy (NISE) is mandated with developing
required skills in the solar electricity sector. But there lacks a nationwide
shortage of skilled personnel in the sector. Many of the DISCOM employees
are lacking the knowledge and understanding of the technology and creates
difficulties in integrating the power with the grid.
Fig. 6.27 Lack of Skilled Manpower
A fraction of the respondents constituting 0.67% consider this extremely
influential, 16% said it to be very influential and a 20.67% consider this as
moderately influential. 41.33% has opined this as slightly influential. Another
21.33% of the respondents are of the belief that this is not at all an influencing
factor.
6.5.9 LOW PROFIT MARGIN
Those investors who seek business and profit from the investments are
extremely demotivated at the low profit margins. Now the solar energy prices
hitting new low every day, it is a concern for many of the investors. 22% of
the respondents consider this as extremely influential, 15.33% think this to be
very influential and for a 30% of the respondents this is moderately influential.
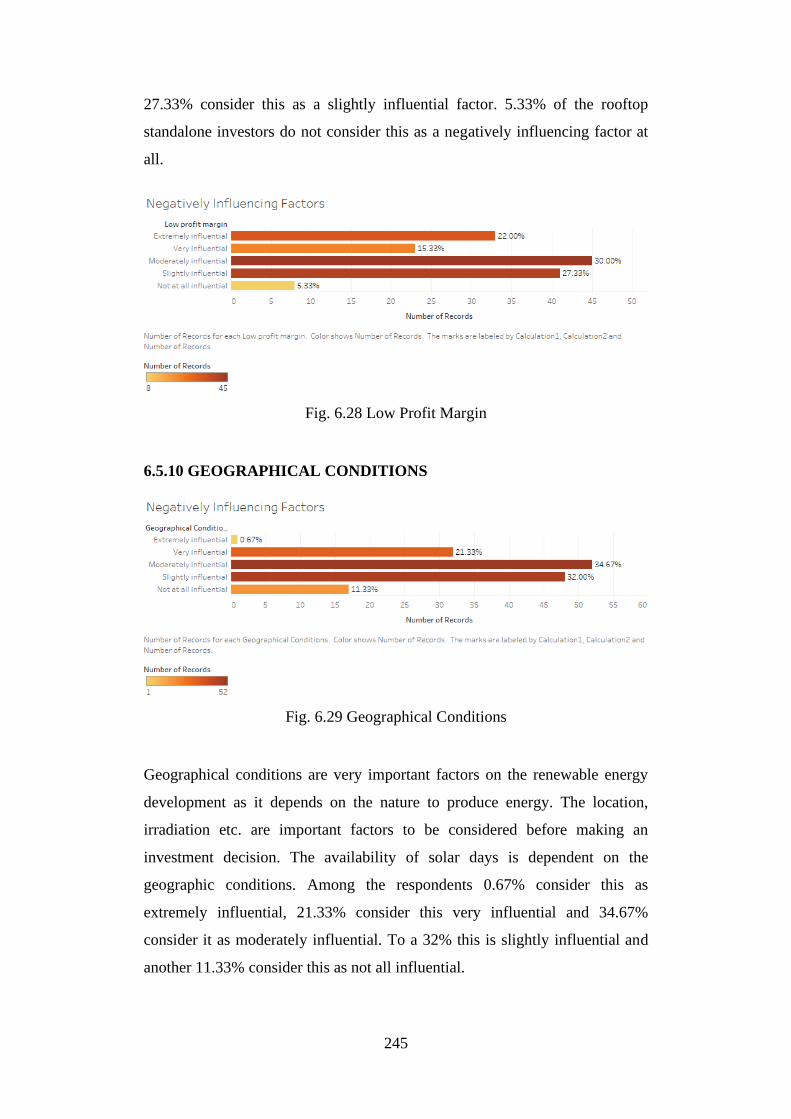
245
27.33% consider this as a slightly influential factor. 5.33% of the rooftop
standalone investors do not consider this as a negatively influencing factor at
all.
Fig. 6.28 Low Profit Margin
6.5.10 GEOGRAPHICAL CONDITIONS
Fig. 6.29 Geographical Conditions
Geographical conditions are very important factors on the renewable energy
development as it depends on the nature to produce energy. The location,
irradiation etc. are important factors to be considered before making an
investment decision. The availability of solar days is dependent on the
geographic conditions. Among the respondents 0.67% consider this as
extremely influential, 21.33% consider this very influential and 34.67%
consider it as moderately influential. To a 32% this is slightly influential and
another 11.33% consider this as not all influential.
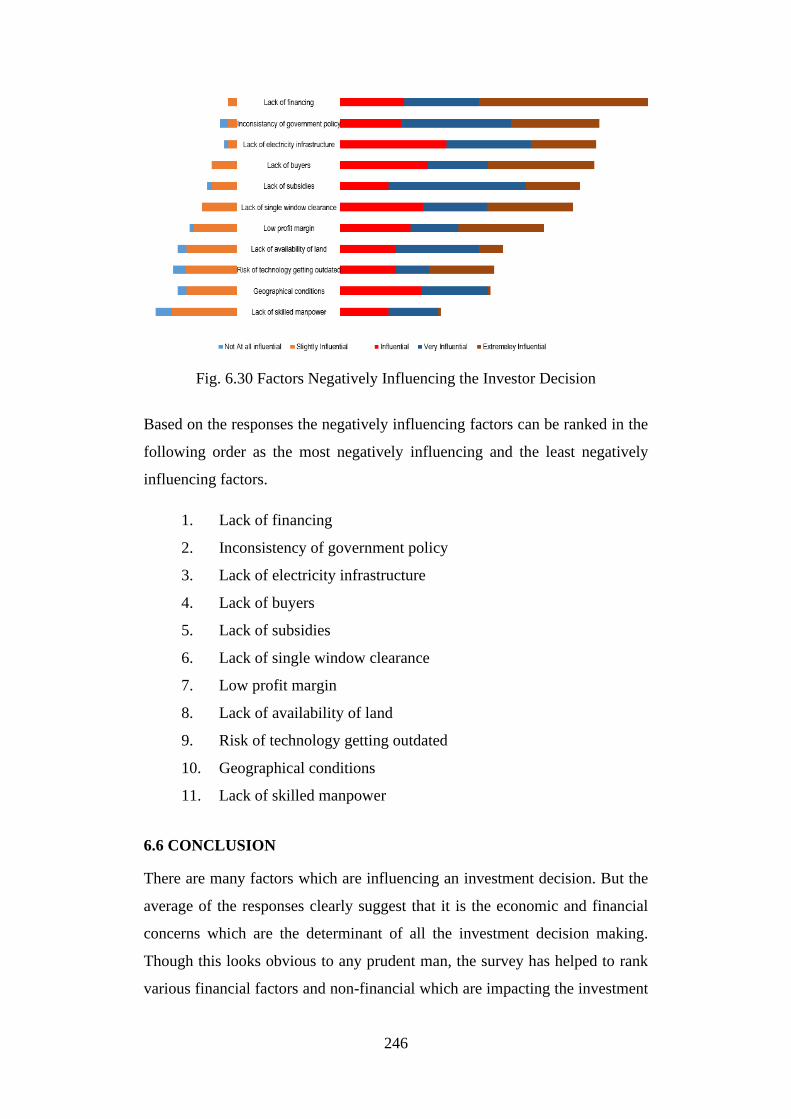
246
Fig. 6.30 Factors Negatively Influencing the Investor Decision
Based on the responses the negatively influencing factors can be ranked in the
following order as the most negatively influencing and the least negatively
influencing factors.
1. Lack of financing
2. Inconsistency of government policy
3. Lack of electricity infrastructure
4. Lack of buyers
5. Lack of subsidies
6. Lack of single window clearance
7. Low profit margin
8. Lack of availability of land
9. Risk of technology getting outdated
10. Geographical conditions
11. Lack of skilled manpower
6.6 CONCLUSION
There are many factors which are influencing an investment decision. But the
average of the responses clearly suggest that it is the economic and financial
concerns which are the determinant of all the investment decision making.
Though this looks obvious to any prudent man, the survey has helped to rank
various financial factors and non-financial which are impacting the investment
247
decision. The factors which are positively impacting the investment decision
include the consideration of reduced electricity bills as the primary factor with
4.09 score average, followed by subsidies with 3.51, tax benefits with 3.49,
profitability with 3.37. All other factors have an average below 3, suggesting
that the respondents do not consider them as a major influencing factor.
Among the negatively influencing, the following factors have a higher impact
on the investment decision. Access to debt finance and the cost of the debt
fiancé and the strict regulation for the credit worthiness, and the lack of
understanding of the banking officials about the valuation of the project are
causing the developers to get financing. Lack of financing with 4.06 average
score is the major challenge in investment. Other major detracting factors
include lack of multiple buyers with 3.58, lack of consistency of policy with
3.53, lack of government incentives, lack of electricity infrastructure, and lack
of single window clearance all the three factors with 3.4 average score, and
low profit margin with 3.22 average score has been identified as major
detractors. Other factors have an average score less than three.
248
CHAPTER - 7
CONCLUSION
The solar energy development in India gained strength from Jawaharlal Nehru
National Solar Mission which was launched in 2010. The capacity addition
and investment data shows that the growth of the solar energy sector was nor
positively or negatively affected by the Electricity Act 2003 though the lack of
coordination of various agencies and the lack of importance given to it by
various state government policies and commissions has curtailed its growth in
many states. The need for additional policy push and promotion for
investments required to be relooked at since it does not offer consistency. The
way forward is to incorporate the consistent policy measures in the legislation
to enhance growth in the sector.
The Electricity Act 2003 has laid down a comprehensive legal framework to
ensure and protect the investors. In addition to the general framework for
regulating the sector and creating a conducive environment for investment; the
2003 Act has included general provisions which may be helpful to promote
and protect investors in the renewable energy sector. Since those provisions
were enacted at a time when the renewable energy industry was at an infant
stage, and many of the complexities of the sector were unknown to the
lawmakers, it is expedient to have a more specific legislation instilling
confidence in the investors.
Since we can find from the detailed discussion of the legal provisions that,
there need a more coordinated mechanism at the national level is required to
improve investment conditions. Some of the measures adopted by the
government entities and regulators are discouraging the investors. It is
important to understand what other laws may be complementing the growth of
the sector.
249
It is vital that the Electricity Act 2003 shall have clear legislative provisions to
address situations which may arise in the states where the investors are
discouraged from selling the energy produced to entities other than the state
utilities. It shall only in extra ordinary circumstances such a compulsion be
made. The Act shall be amended to mean “extraordinary circumstances” under
section 11 to include “severe scarcity of electricity” or add a new provision to
enable the relevant authorities and agencies to meet the scarcity of electricity
situations.
The failure of the utilities to make payments on time to the developers have
affected their cash flow and has failed to meet the loan payout to various
banking and finance firms which has resulted in reducing confidence of such
institutions in providing loans to solar plants. Obtaining debt finance is a big
challenge due to various factors and this need to be addressed by the
government through new regulations in the banking sector for priority lending
and allowing experiments in business models.
The major financing g challenge is to create security for the loans the banks
give. Banks are not willing to give loans unless sufficient security is crated in
favor of them. Roof top solar doesn’t use any land for installations, which
makes it necessary to mortgage other immovable property to obtain the loan.
It can be observed that the functions of various authorities does not reflect the
requirements for promoting sustainable and clean energy for India. The 2003
Act or any other rules and regulations which created various authorities under
the 2003 Act does not mention the requirement of the authority to coordinate
with the agencies under MNRE.
The state government and state regulatory commission measures do not
sometimes go in consonance with the national renewable energy development
program. The lack of communication and lack of coordination in planning
further creates difficulties in the renewable energy sphere.
The cases discussed in the thesis clearly suggest that the market is still not
entirely ready for the competition and the authorities also in some cases not
250
taking necessary steps to implement the pure spirits and objectives of the 2003
Act. Improving the conditions of the market is vital for any sector to develop.
With only the state distribution utility as the only buyer and the state
governments makes mandatory requirements of selling the power produced
only to the state utility is not an ideal market condition for any sector to
develop into a competitive market place. It would be ideal to have more
buyers and sellers to develop the sector and discover the true potential of the
sector to energize the future India.
The general investment environment in India is improving as evidenced by the
ease of doing business ranking. But there are many areas of concern which
makes it difficult for doing business in India. In order to improve Investments
in solar energy sector specifically, and in renewable energy generally, the ease
of doing business has to be improved. Even though various central government
ministries and many state governments have taken measures to improve the
scenario, many of the renewable energy rich states lag behind in the ease of
doing business in India index.
While the state governments have adopted policy measures to improve the
renewable energy generation and capacity addition in the respective states,
only few states which are bestowed with the abundance of resources in
Renewable Energy has clear policies and plans to generate more electricity
than their renewable purchase obligation.
The state policies focus on meeting local energy demand and supply which
minute promote the national interest. It is thus necessary to have a
comprehensive mechanism comprising of law policies infrastructure and
governmental machinery to create a conducive environment for attracting
private investments in the sector to meet National ambitions.
We need new investment models and new commercial instruments to deal
with renewable energy sector investments. The current legal and policy
framework in India is scattered without uniformity having no concurrency and
lacks stability. The framework has failed to gain the confidence of investors
due to abrupt policy changes causing losses for the investors. A robust
251
national energy law should also be developed by assessing and evaluating
various challenges addressing the energy trilemma.
Utility scale power plants require huge areas of land. The land requirements
makes it impossible to establish huge power plants in cities. They find remote
villages for installation of the power plants. The huge land requirement in such
case is met by either getting barren land allotted from the government or taken
on lease. Acquiring the land will increase the project cost, which is not ideal
for developers since the energy cost will shoot up.
Understanding the particular interests of various stake holders like, the
developer, the land owners and the financiers and tempering it against
mutually agreed benefits of energy production at local levels can lead to
creating more sector specific business models catering to the need to generate
energy throughout India.
Global Institutional and policy framework addressing all the aspects of energy
is required for the development of the energy sector in order to create a global
order in the energy sector. Since climate change is s global phenomena, the
world community cannot ignore creating such national legal and policy
measures for the development of clean energy technologies and enabling
world support system for those nations which lack resources to meet the clean
energy adoption challenge their own.
There requires an overarching international energy law and policy framework,
which is independent of the oil and gas legal and jurisprudential framework,
that rests on the conflicting theory of ownership of the resources completely
with the state, but failed to make the benefit reach to the masses. We need a
new approach with legal and regulatory mechanism, which ensure abundant
clean energy available, accessible and affordable to masses living in energy
poverty and fuel economic growth.
There are many factors which are influencing an investment decision. But the
average of the responses clearly suggest that it is the economic and financial
concerns which are the determinant of all the investment decision making.
252
Though this looks obvious to any prudent man, the survey has helped to rank
various financial factors and non-financial which are impacting the investment
decision. The factors which are positively impacting the investment decision
include the consideration of reduced electricity bills as the primary factor with
4.09 score average, followed by subsidies with 3.51, tax benefits with 3.49,
profitability with 3.37. All other factors have an average below 3, suggesting
that the respondents do not consider them as a major influencing factor.
Among the negatively influencing, the following factors have a higher impact
on the investment decision. Access to debt finance and the cost of the debt
fiancé and the strict regulation for the credit worthiness, and the lack of
understanding of the banking officials about the valuation of the project are
causing the developers to get financing. Lack of financing with 4.06 average
score is the major challenge in investment. Other major detracting factors
include lack of multiple buyers with 3.58, lack of consistency of policy with
3.53, lack of government incentives, lack of electricity infrastructure, and lack
of single window clearance all the three factors with 3.4 average score, and
low profit margin with 3.22 average score has been identified as major
detractors. Other factors have an average score less than three.
The Electricity Act 2003 has provisions which delicensed and deregulated
generation of electricity. But this was not sufficient to promote the clean
energy technology investment. It was the financial incentives in the form of
capital subsidies and accelerated depreciation which has given the adequate
push to the sector to kick start. Still there are some major areas of concern in
the electricity Act 2003, which the MNRE has recommended to amend,
including the provisions relating to open access and renewable purchase
obligation, the major provisions which facilitate renewable energy.
The general business environment in India is still need to improve. We have
gained 77th rank in ease of doing business for 2019, but there are major areas
of concern, including the enforcement of contracts. Renewable energy
development depend on the power purchase agreements and the general trend
in the sector for dishonoring power purchase agreements and the resultant
253
litigation which further delays the business. Renewable energy production is
not something which can be stopped or controlled. It need to be evacuated and
the existence of a valid power purchase agreement at the time of generation of
power is an essential condition.
There are some state government policies which mandate the sale of
renewable energy produced only to the state utilities reduces completion in the
market and is not allowing the producer or developer to seek out for other
power buyers in the market. State government policies also deny the
exemption from tax, wheeling charges and other duties if the electricity
produced is sold outside the state, restricting the developers to sell the energy
produced only within the state. This is not ideal for the development of the
sector at the national level.
Structural changes in the Electricity Act 2003 alone is not sufficient. The
Electricity Act 2003 is a comprehensive legislation which has provide the
required foundation for the electricity industry to grow. What is required is the
structural changes to the institutional arrangements in the sector. There should
be a single ministry dealing with electricity and renewable energy. The
proposed Electricity Act 2003 Amendment bill 2018 is delayed due to the lack
of coordination between the Ministry of power and Ministry of New and
Renewable Energy and various other authorities working under these
ministries.
An improved electricity Act dealing with open access and renewable purchase
obligations and a new institutional structure called National Energy Council,
at the central level with state government participation in the model of GST
Council is required to create the organizational and implementation
framework for the improved law to achieve the desired results. In the absence
of a National Energy Council in the GST Council model, the policies will vary
from state to state and the creation of a successful national grid will be far
from reality as the state governments will create islands of policies and
regulations contradicting with other states making it difficult for large scale
investors to invest throughout the country.
254
7.1 RESULT OF HYPOTHESIS
The existence of multiple agencies working with lack of coordination and
inconsistent policy measures have failed to instill confidence in investors.
Though some of the states are performing well in generating solar energy,
optimization of such policy measures all over India is required to promote
solar energy throughout the country. The study has revealed that India lacks an
optimal legal framework to promote investments in renewable energy sector.
Hence the thesis is proved. Hence the hypothesis is proved.
7.2 SUGGESTIONS
After analyzing the sector and various challenges it is facing now the
following suggestions and recommendations are made.
1. The Electricity Act 2003 is a path breaking legislation. The 2003 Act
was created at least a decade before the solar energy boom which started
to unfold in the country. The Act requires amendment to accommodate
the peculiar features of the solar and wind power with more detailed
provisions dealing with the regulation, promotion and development of
such sources of energy.
2. Open Access is the key to develop the sector. A more flexible cost
effective and easily accessible open access environment need to be
created. The Electricity Act 2003 need to create a robust legal
framework for encouraging Open Access in the sector.
3. Barriers for open access from outside the state shall be removed. The tax
benefits and duty exemptions providing to developers in the state only if
the power generated is sold to state utility or within the state shall be
removed to encourage a national market for open access.
4. There need to be a strong primary and secondary market created for
strengthen the renewable purchase obligation mechanism and
Renewable Energy Certificates. A real time energy market will help
understand the power generation and pricing trends at real time. This
will help the consumers to arrange their activities according to the power
supply.
255
5. A real time data availability of energy production and consumption
through extremely digitalized smart meter networks across the country
will cater to a better energy exchange market.
6. Create and facilitate real time power generation monitoring throughout
the country for real time power trade through a nationwide online market
and digital system to manage the load on the transmission and
distribution system.
7. We need to envisage an electricity market where a consumer, logs into
his account purchase some units of power, makes prepayment or post
payment and the power starts flowing to his premises. The consumer
should be able to choose the suppliers of his choice.
8. Strengthen the infrastructure that can evacuate an increased power
generation. The strengthening of the infrastructure is so important that
during the day time when the energy production is high from
renewables, the network should be strong enough to evacuate the whole
of the power generated.
9. A strong system of energy storage need to be developed to store the
excess energy produced. More investments in this area is required and
the government need to provide an incentive mechanism for the
development of storage systems.
10. Once the entire vehicle population get converted into electric vehicles by
2030 as envisaged in the draft national energy policy 2017, there require
a network of charging stations. As the new technological development
suggest, there will be fuel cell replacement centers across the nation. The
existing petrol pumps may get converted into such fuel cell stations,
which can also be the centers for storage of locally produced solar
power. A nation Wide network of fuel cell centers can be the nationwide
storage network, with the vehicle owners paying for such storage
facilities of the excess power produced in a day.
11. Establish a single ministry for electricity with various departments to
deal with each renewables. This will remove the inordinate delay in the
256
communication between the ministries and the electricity sector and its
administrative mechanisms will be on the same page as that of the
renewable energy sector and its administration.
12. Create a National Energy Council for policy making and regulation
making for energy related aspects. The spirit of the Electricity Act 2003,
is not yet trickled down to the bottom level. The state governments have
their own political priorities which sometimes makes the clean energy
technology development take a back seat. In the context of energy
becoming national priority and the entire machinery need to move in
tandem there require a unified policy making and implementation
system.
13. A GST model National Energy Council becomes relevant when
electricity is a concurrent subject and both center and state are
empowered for its administration. It is vital to have concurrence among
the state and central governments and policy decisions to avoid the
complications of diverse legal framework to generate power. Currently
an investor cannot predict to have the same experience he had in one
state in another state.
14. Association for Renewable Energy Agencies of States (AREAS), a
society registered under the Society Registration Act 1860 by MNRE
and the Forum of Regulators notified under Section 166(2) of the
Electricity Act 2003 points to the need to have a national level integrated
mechanism for policy making and regulation of the sector to achieve
high growth and move in the same direction. These bodies have no
actual authority to drive the energy progress with the lack of legislative
backing. A National Energy Council will address this issue.
15. There are research and development promoted in the technological
development in renewable energy. More experiments in new business
models and investment methods need to be carried out in the renewable
energy sector.

257
16. More research is required to create the institutional and organizational
arrangement of the National Energy Council. There is also scope for
developing new business models in the sector through further research.
Generally all commercial laws follow the developments in the business
and try to regulate them. In the case of renewables, we need the business
to grow by following the law we create in advance for its promotion.
Thus we need to create a robust legislative and institutional framework
for the sustainable energy future of this nation.
258
SELECT BIBLIOGRAPHY
BOOKS AND SCHOLARLY ARTICLES
1. S K Chatterjee, S.K. Chatterjee’s Commentary on Electricity Laws of
India: The Electricity Act, 2003, an Insight with the Electricity Rules,
2005 Alongwith the Electricity (Amendment) Act, 2007, Allied Rules,
Regulations, Orders, Notifications, Resolution and National El (2010)
2. K K Mitra, Commentaries on the electricity act, 2003 (With Annotated
Upto date Case Law and also Appellate Tribunal Decisions) Along with
Rules, Regulations. Orders and Notifications. Asia Law House
3. S. Krishnamurthi Aiyar, Law Relating to Electricity in India. Universal
Law Publishing Co Pvt Ltd.
4. M P JAIN, INDIAN CONSTITUTIONAL LAW, LexiNexis (2014).
5. Akash Kumar Shukla et al., Solar PV and BIPV system: Barrier,
challenges and policy recommendation in India, 82 Renew. Sustain.
Energy Rev. 3314“3322 (2018), http://linkinghub.elsevier.com/retrieve/
pii/S1364032117313862 (last visited Jun 12, 2018).
6. Alok Kumar &; Sushanta K. Chatterjee, Electricity Sector in India:
Policy and Regulation (2012), https://books.google.co.in/books?id=Pp
EqViahEpEC.
7. Alok Kumar &; Sushanta K. Chatterjee, Electricity Sector in India:
Policy and Regulation (2012), https://books.google.co.in/books?id=
PpEqViahEpEC.
8. Andrea S. Kramer &; Peter C. Fusaro, Energy and environmental project
finance law and taxation¯: new investment techniques, https://store.
lexisnexis.com/products/energy-environmental-project-finance-law-
taxation-skuusSku-us-oxf-04610-Hardbound (last visited Jun 11, 2018).
259
9. Anjali Bhide &; Carlos RodrÃguez Monroy, Energy poverty: A special
focus on energy poverty in India and renewable energy technologies, 15
Renew. Sustain. Energy Rev. 1057“1066 (2011), https://www.sciencedirect.
com/science/article/pii/S1364032110004132 (last visited Jun 13, 2018).
10. B Mohan, ENERGY CARRIERS FOR ENERGY SECURITY OF
INDIA “ INVESTIGATION FOR AN OPTIMUM MIX Thesis
submitted to Doctor of Philosophy in Management Studies Under the
Faculty of Management Studies By RAJAGIRI COLLEGE OF SOCIAL
SCIENCES , KALAMASSERY, (2014).
11. Boris Lopicich, Equity and the energy trilemma Delivering sustainable
energy access in low-income communities,  Equity energy trilemma
Deliv. Sustain. energy access low-income communities 26“36 (2015),
http://pubs.iied.org/pdfs/16046IIED.pdf (last visited Jun 13, 2018).
12. Brett (Energy Research Centre) Cohen et al., An Approach to
Sustainable Development Based Energy and Climate Policy (2015).
13. D G Ockwell et al., Key policy considerations for facilitating low carbon
technology transfer to developing countries, Energy Policy (2008).
14. Daljit Singh, Newer Challenges for Open Access in Electricity Need for
15. David G. Ockwell et al., Key policy considerations for facilitating low
carbon technology transfer to developing countries, 36 Energy Policy
4104“4115 (2008), https://www.sciencedirect.com/science/article/pii/
S0301421508003091 (last visited Jun 13, 2018).
16. Davida Wood et al., 10 Questions To Ask About Scaling on-Grid
Renewable Energy Frameworks for Designing Good, 1“28 (2014).
17. DLA Piper, Renewable Energy in the Asia Pacific: A Legal Overview.
18. Elinor Ostrom, Response: The institutional analysis and development
framework and the commons, 95 Cornell Law Rev. 807“815 (2010),
http://scholarship.law.cornell.edu/cgi/viewcontent.cgi?article=3170&;co
ntext=clr.
19. Energy in India, 27 Renew. Sustain. Energy Rev. 1“10 (2013),
260
20. exacerbate environmental injustice, 56 Wash.&; Lee L.Rev. 111 (1999).
21. Felix Mormann, Requirements for a Renewables Revolution, 38 Ecol.
Law Q. 903“966 (2011).
22. Francesco Nicolli &; Francesco Vona, Heterogeneous policies,
heterogeneous technologies: The case of renewable energy, Energy
Econ. (2016), http://www.mendeley.com/research/heterogeneous-policies -
heterogeneous-technologies-case-renewable-energy.
23. Fredric Beck &; Eric Martinot, 34 Renewable Energy Policies and Barriers
Encyclopedia of Energy 365“383 (2004), http://www.martinot.info/
Beck_Martinot_AP.pdf.
24. Gisèle Schmid, The development of renewable energy power in India:
Which policies have been effective?, 45 Energy Policy 317“326 (2012),
https://www.sciencedirect.com/science/article/pii/S0301421512001565#
s0055 (last visited Jun 13, 2018).
25. Govinda R. Timilsina, Lado Kurdgelashvili &; Patrick A. Narbel, Solar
energy: Markets, economics and policies, 16 Renew. Sustain. Energy
Rev. 449“465 (2012), https://www.sciencedirect.com/science/article/
pii/S1364032111004199 (last visited Jun 13, 2018).
26. Herath Gunatilake, Narasimhamurty Maddipati &; Sumeet Patil,
Willingness to Pay for Electricity Supply Improvements in Rural India,
10 J. Resour. Energy Dev. 55“78 (2013),
27. J. Jeslin Drusila Nesamalar, P. Venkatesh &; S. Charles Raja, The drive of
renewable energy in Tamilnadu: Status, barriers and future prospect, 73
Renew. Sustain. Energy Rev. 115“124 (2017), http://linkinghub.
elsevier.com/retrieve/pii/S1364032117301326 (last visited Jun 10, 2018).
28. James A. Duffield and Keith Collins, Evolution of Renewable Energy
Policy, (2006), http://www.choicesmagazine.org/2006-1/biofuels/2006-
1-02.htm (last visited Nov 28, 2018).
29. James H. Williams &; Navroz K. Dubash, 77 Asian Electricity Reform
in Historical Perspective Pacific Affairs 411“436, https://www.jstor.org/
stable/40022909 (last visited Nov 23, 2018).
261
30. Jeremiah Doner, Barriers to Adoption of Renewable Energy Technology,
Inst. Regul. Policy Stud. Illinois State 32 (2007), http://irps.illinoisstate.
edu/downloads/research/documents/IRPSDonerWorkingPaper050707.pdf.
31. John Cubbin &; Jon Stern, The Impact of Regulatory Governance and
Privatization on Electricity Industry Generation Capacity in
Developing Economies, 20 World Bank Econ. Rev. 115“141 (2006),
https://academic.oup.com/wber/article/20/1/115/1680456 (last visited
Nov 23, 2018).
32. Kamil Kaygusuz, Energy for sustainable development: A case of
developing countries, 16 Renew. Sustain. Energy Rev. 1116“1126
(2012), https://www.sciencedirect.com/science/article/pii/S136403211
1005491 (last visited Jun 13, 2018).
33. Kanika Chawla et al., Clean Energy Investment Trends EVOLVING
LANDSCAPE FOR GRID-CONNECTED RENEWABLE ENERGY
PROJECTS IN INDIA (2018), http://www.ceew.in/sites/default/files/
CEEW-Clean-Energy-Investment-Trends-Report-27Jun18.pdf (last visited
Nov 30, 2018).
34. Keshav Singhania, G P Girish &; Nnaemeka Vincent, Impact of Odd-
Even Rationing of Vehicular Movement in Delhi on Air Pollution
Levels, 7 151“160 (2016), http://www.scirp.org/journal/lce (last visited
Nov 19, 2018).
35. Laurie Van Der Burg &; Shelagh Whitley, Rethinking power markets:
capacity mechanisms and decarbonisation (2016), www.odi.org/twitter
(last visited Nov 29, 2018).
36. Mayank Aggarwal, Wind , solar will be cheapest power source in G20
countries by 2030 , says Greenpeace study, 9“11 (2017).
37. Michael Renner, Sean Sweeney &; Jill Kubit, Green jobs: Working for
people and the environment, Worldwatch Pap. (2008), http://www.
mendeley.com/research/green-jobs-working-people-environment-8.
262
38. Mohit Goyal &; Rakesh Jha, Introduction of Renewable Energy
Certificate in the Indian scenario, 13 Renew. Sustain. Energy Rev.
1395“1405 (2009), https://www.sciencedirect.com/science/article/pii/
S1364032108001470 (last visited Jun 13, 2018).
39. Montek S Ahluwalia, Himanshu Gupta &; Nicholas Stern, Towards a
Sustainable Energy Strategy for India, NITI Aayog 12 (2016),
http://niti.gov.in/writereaddata/files/document_publication/Executive_S
ummary.pdf (last visited Jun 21, 2018).
40. N Chambers, C Simmons &; M Wackernagel, Sharing nature™s
interest: ecological footprints as an indicator of sustainability (2014),
https://content.taylorfrancis.com/books/download?dac=C2011-0-08011-
1&;isbn=9781317972174&;format=googlePreviewPdf (last visited Dec
10, 2018).
41. Nathaniel J. Williams et al., Enabling private sector investment in
microgrid-based rural electrification in developing countries: A review, 52
Renew. Sustain. Energy Rev. 1268“1281 (2015), http://dx.doi.org/ 10.1016/
j.rser .2015.07.153.
42. P. Venkata Ramana, C.S. Sinha &; P.R. Shukla, Renewable energy
technologies and climate change policies in India, 15 Int. J. Glob. Energy
Issues 97 “116 (2001), http://www.scopus.com/inward/record. url?eid=2-
s2.0-
43. Refinements in the Regulations (2017), www.brookings.in (last visited
Dec 6, 2018).
44. Rick van der Ploeg &; Cees Withagen, Is There Really a Green
Paradox¯? Frederick van der Ploeg Is There Really a Green Paradox¯?
Abstract, 1“38 (2010).
45. S M Johnson, Economics v. equity: do market-based environmental reforms
46. Soma Bhattacharya &; Maureen L Cropper, Options for Energy
Efficiency in India and Barriers to Their Adoption: A Scoping Study,
SSRN Electron. J. 3“7 (2010), http://www.ssrn.com/abstract=1590510.
263
47. Souvik Sen &; Sourav Ganguly, Opportunities, barriers and issues with
renewable energy development “ A discussion, 69 Renew. Sustain. Energy
Rev. 1170“1181 (2017), http://linkinghub.elsevier.com/retrieve/pii/
S1364032116306487 (last visited Jun 9, 2018).
48. Sudhakar Reddy &; J. P. Painuly, Diffusion of renewable energy
technologies-barriers and stakeholders™ perspectives, 29 Renew.
Energy 1431“1447 (2004), http://linkinghub.elsevier.com/retrieve/pii/
S0960148103003975 (last visited Jun 12, 2018).
49. Sujith P Surendran | Dr. Tabrez Ahmad, The Required Policy Change in
Energy Sector for India™s Energy Security, 1 Int. J. Trend Sci. Res.
Dev. 1020“1026 (2017),
50. Sujith Surendran &; Tabrez Ahmad, Need for a comprehensive
renewable energy law, 02 Int. J. Manag. Law Sci. Stud. 19“26 (2017),
https://drive.google.com/drive/u/0/folders/1Ugp_52bQI1McfFSidaAxT
WUGaltYmAbt (last visited Dec 15, 2018).
51. Sujith Surendran &; Tabrez Ahmad, The Need for a Legal Definition of
Sustainable Energy for a Sustainable Future, 2016 1“14 (2016).
52. Sumit Sharma et al., Analysis of Odd-Even scheme phase-II,
https://pdfs.semanticscholar.org/6ccc/fe6af7cc7d8247e2b15fbd8a35ce47
30c620.pdf (last visited Nov 19, 2018).
53. Sumit Sharma et al., Analysis of Odd-Even scheme phase-II,
https://pdfs.semanticscholar.org/6ccc/fe6af7cc7d8247e2b15fbd8a35ce47
30c620.pdf (last visited Nov 19, 2018).
54. Sunil Luthra et al., Barriers to renewable/sustainable energy technologies
adoption: Indian perspective, 41 Renew. Sustain. Energy Rev. 762“776
(2015), http://linkinghub.elsevier.com/retrieve/pii/S13640 32114007631
(last visited Jun 11, 2018).
55. T V Ramachandra, Rishabh Jain &; Gautham Krishnadas, Hotspots of
solar potential in India, 15 Renew. Sustain. Energy Rev. 3178“3186 (2011),
http://www.ces.iisc.ernet.in/energy/paper/hotspots_solar_potential/
RSER_hotspots.pdf (last visited Jun 5, 2018).
264
56. Tedd Moya Mose, Toward a harmonized framework for international
regulation of renewable energy, Advance Ar Unif. Law Rev. 1 (2018),
https://academic.oup.com/ulr/advance-
article/doi/10.1093/ulr/uny016/4992864 (last visited Jun 11, 2018).
57. U.R. Prasad, Analysing Tariffs - Welcome to Power Line,
https://powerline.net.in/ 2017/12/07/analysing-tariffs/ (last visited Dec 9,
2018).
58. Union of Concerned Scientists, Barriers to Renewable Energy
Technologies, Powerful Solut. 1“9 (2017), http://www.ucsusa.org/clean
_energy/ smart-energy-solutions/increase-renewables/barriers-to-renewable
-energy.html#.WSVJHGgrKMo.
59. Vikas Khare, Savita Nema &; Prashant Baredar, Status of solar wind
renewable
60. Yannick Glemarec, Financing off-grid sustainable energy access for the
poor, 47 Energy Policy 87“93 (2012).
REPORTS AND WEB SOURCES
Sujith Surendran & Tabrez Ahmad, <i>The Need for a Legal Definition
of Sustainable Energy for a Sustainable Future</i>, 2016 1–14 (2016).
The General Assembly & The Goals, <i>UN Resolution 2020 Agenda for
Sustainable Development 2015.09.25</i>, 16301 1–35 (2015).
Ministry of New and Renewable Energy, <i>International Solar Alliance will
be the First International and Inter-Governmental Organisation of 121
Countries to have Headquarters in India with United Nations as Strategic
Partner</i>, http://pib.nic.in/newsite/PrintRelease.aspx?relid=135794 (last
visited Dec 14, 2018).
Mark Zuckerberg - Priscilla and I are joining Bill Gates... | Facebook, ,
https://www.facebook.com/photo.php?fbid=10102500936699601&set=a.
529237706231.2034669.4&type=3&theater (last visited Dec 14,
2018).
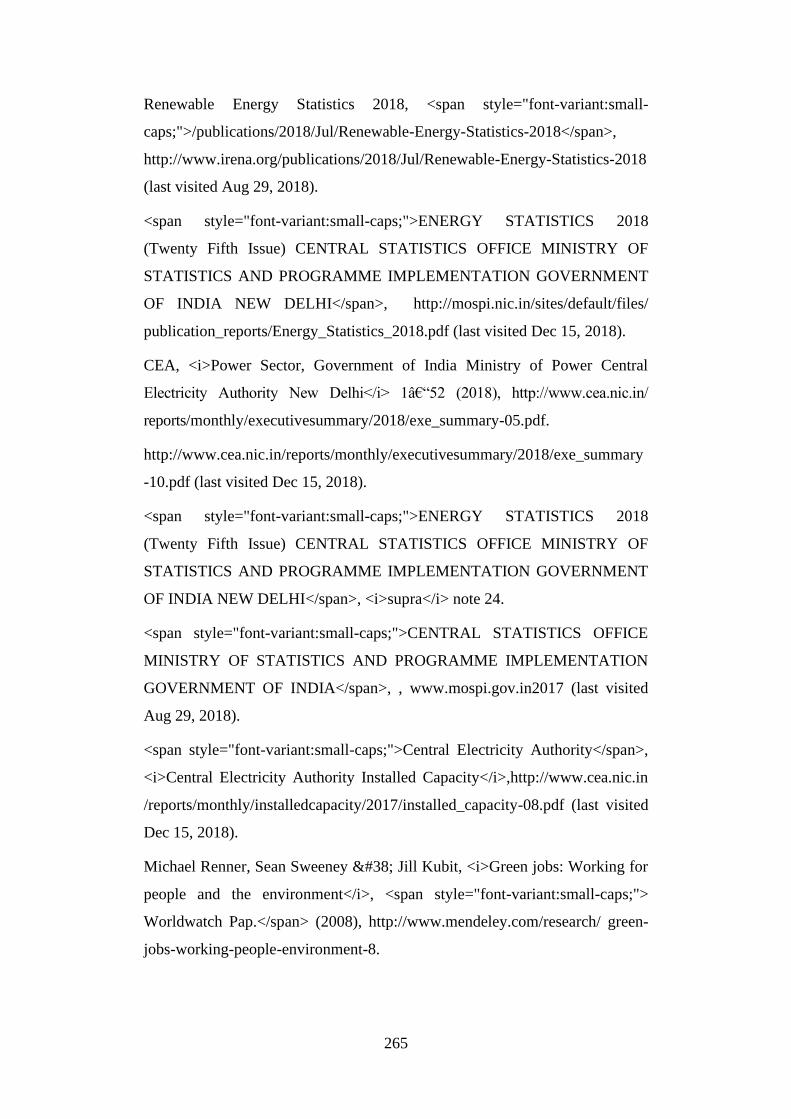
265
Renewable Energy Statistics 2018, <span style="font-variant:small-
caps;">/publications/2018/Jul/Renewable-Energy-Statistics-2018</span>,
http://www.irena.org/publications/2018/Jul/Renewable-Energy-Statistics-2018
(last visited Aug 29, 2018).
<span style="font-variant:small-caps;">ENERGY STATISTICS 2018
(Twenty Fifth Issue) CENTRAL STATISTICS OFFICE MINISTRY OF
STATISTICS AND PROGRAMME IMPLEMENTATION GOVERNMENT
OF INDIA NEW DELHI</span>, http://mospi.nic.in/sites/default/files/
publication_reports/Energy_Statistics_2018.pdf (last visited Dec 15, 2018).
CEA, <i>Power Sector, Government of India Ministry of Power Central
Electricity Authority New Delhi</i> 1–52 (2018), http://www.cea.nic.in/
reports/monthly/executivesummary/2018/exe_summary-05.pdf.
http://www.cea.nic.in/reports/monthly/executivesummary/2018/exe_summary
-10.pdf (last visited Dec 15, 2018).
<span style="font-variant:small-caps;">ENERGY STATISTICS 2018
(Twenty Fifth Issue) CENTRAL STATISTICS OFFICE MINISTRY OF
STATISTICS AND PROGRAMME IMPLEMENTATION GOVERNMENT
OF INDIA NEW DELHI</span>, <i>supra</i> note 24.
<span style="font-variant:small-caps;">CENTRAL STATISTICS OFFICE
MINISTRY OF STATISTICS AND PROGRAMME IMPLEMENTATION
GOVERNMENT OF INDIA</span>, , www.mospi.gov.in2017 (last visited
Aug 29, 2018).
<span style="font-variant:small-caps;">Central Electricity Authority</span>,
<i>Central Electricity Authority Installed Capacity</i>,http://www.cea.nic.in
/reports/monthly/installedcapacity/2017/installed_capacity-08.pdf (last visited
Dec 15, 2018).
Michael Renner, Sean Sweeney & Jill Kubit, <i>Green jobs: Working for
people and the environment</i>, <span style="font-variant:small-caps;">
Worldwatch Pap.</span> (2008), http://www.mendeley.com/research/ green-
jobs-working-people-environment-8.
266
<span style="font-variant:small-caps;">Draft National Energy Policy NITI
Aayog, Government of India</span>, <i>supra</i> note 5.
DDUJY, <i>Deendayal Upadhyaya Gram Jyoti Yojana</i>, <span
style="font-variant:small-caps;">Gov. India</span> 140356 (2017),
http://www.ddugjy.gov.in/mis/portal/index.jsp.
Herath Gunatilake, Narasimhamurty Maddipati & Sumeet Patil,
<i>Willingness to Pay for Electricity Supply Improvements in Rural
India</i>, 10 <span style="font-variant:small-caps;">J. Resour. Energy
Dev.</span> 55–78 (2013), http://www.medra.org/servlet/aliasResolver?
alias=iospress&doi=10.3233/RED-120104.
<span style="font-variant:small-caps;">subject to the Cambridge Core terms
of</span>, https://www.cambridge.org/core/services/aop-cambridge-core/content/
view/B8CB7D383F33AD9AF9CC82EB50A74DE5/9781108416795AR.pdf/T
he_Politics_of_Fossil_Fuel_Subsidies_and_their_Reform.pdf?event-
type=FTLA (last visited Sep 8, 2018).
<span style="font-variant:small-caps;">The Evolving Energy Landscape in
India Opportunities for investments</span>, (2018), https://www2.deloitte.com/
content/dam/Deloitte/in/Documents/energy-resources/in-enr-the-evolving-
energy-landscape-india-april-2018-noexp.pdf (last visited Dec 15, 2018).
NITI AAYOG & India Smart Grid Forum, <i>India Energy Security
Scenarios 2047</i> 33 (2014), http://iess2047.gov.in/pathways/ 111011111
11111110111111111011111101121111111101110111022222/my_story (last
visited Dec 15, 2018).
Montek S Ahluwalia, Himanshu Gupta & Nicholas Stern, <i>Towards a
Sustainable Energy Strategy for India</i>, <span style="font-variant:small-
caps;">NITI Aayog</span> 12 (2016), http://niti.gov.in/writereaddata/
files/document_publication/Executive_Summary.pdf (last visited Jun 21,
2018).
<span style="font-variant:small-caps;">Brett (Energy Research Centre) Cohen
et al.</span>, <i>An Approach to Sustainable Development Based Energy and
Climate Policy</i> (2015).
267
NITI AAYOG, <i>supra</i> note 44.
<span style="font-variant:small-caps;">National Institution for Transforming
India</span>, <i>Report of the Expert Group on 175 GW RE by 2022</i>,
https://niti.gov.in/writereaddata/files/writereaddata/files/document_publication
/report-175-GW-RE.pdf (last visited Dec 4, 2018).
NITI AAYOG and India Smart Grid Forum, <i>supra</i> note 81.
<span style="font-variant:small-caps;">User Guide for India’s 2047 Energy
Calculator Transport Sector Contents</span>, http://indiaenergy.gov.in/
iess/docs/Transport-doc.pdf (last visited Aug 10, 2018).
NITI’s energy sector planning tool — IESS, 2047 | NITI Aayog,
(National Institution for Transforming India), Government of India, ,
http://niti.gov.in/content/niti’s-energy-sector-planning-tool-iess-2047 (last
visited Jun 21, 2018).
NITI Aayog, <i>DOMESTIC PASSENGER TRANSPORT MODE</i>,
http://iess2047.gov.in/assets/onepage/Domestic Passenger Transport Mode.pdf
(last visited Dec 16, 2018).
NITI Aayog, <i>DOMESTIC PASSENGER TRANSPORT DEMAND</i>,
http://iess2047.gov.in/assets/onepage/Domestic Passenger Transport Demand.
pdf (last visited Dec 16, 2018).
NITI Aayog, <i>DOMESTIC FREIGHT TRANSPORT DEMAND</i>,
http://iess2047.gov.in/assets/onepage/Domestic Freight Transport demand.pdf
(last visited Dec 16, 2018).
Clean Energy Investment 2018 | Bloomberg NEF, , https://about.bnef.com/
clean-energy-investment/ (last visited Aug 29, 2018).
<span style="font-variant:small-caps;">Iea - International Energy
Agency</span>, <i>World Energy Investment 2017</i>, www.iea.org/
t&c/ (last visited Sep 8, 2018).
Renewable Energy Statistics 2018, <i>supra</i> note 14.
Renewable Energy Statistics 2018, <i>supra</i> note 14.
Sujith P Surendran | Dr. Tabrez Ahmad, <i>The Required Policy Change in
268
Energy Sector for India’s Energy Security</i>, 1 <span style="font-
variant:small-caps;">Int. J. Trend Sci. Res. Dev.</span> 1020–1026 (2017),
http://www.ijtsrd.com/papers/ijtsrd5752.pdf%0Ahttp://www.ijtsrd.com/human
ities-and-the-arts/social-science/5752/the-required-policy-change-in-energy-
sector-for-indias-energy-security/sujith-p-surendran.
<span style="font-variant:small-caps;">Central Electricity Authority</span>,
<i>Central Electricity Authority Load Generation Balance Report</i>,
http://www.cea.nic.in/reports/annual/lgbr/lgbr-2018.pdf (last visited Dec 16,
2018).
Sujith Surendran & Tabrez Ahmad, <i>Need for a comprehensive
renewable energy law</i>, 02 <span style="font-variant:small-caps;">Int. J.
Manag. Law Sci. Stud.</span> 19–26 (2017), https://drive.google.com/ drive/
u/0/folders/1Ugp52bQI1McfFSidaAxTWUGaltYmAbt (last visited Dec 15, 2018).
<span style="font-variant:small-caps;">BRIDGE TO INDIA</span>,
<i>BRIDGE TO INDIA SOLAR HAND BOOK CEO SURVEY 2017</i>,
https://www.bridgetoindia.com/wp-content/uploads/2017/05/BRIDGE-TO-
INDIA_India-Solar-Handbook_2017-1.pdf (last visited Dec 4, 2018).
Surendran and Ahmad, <i>supra</i> note 117.
Chottelal Yadav v Chattisgarh State Power Distribution Company Ltd, .
<span style="font-variant:small-caps;">M P Jain</span>, <span style="font-
variant:small-caps;">Indian Constitutional Law</span> (2014).
United Nations, <i>Declaration of the United Nations Conference on the
Human Environment</i>.
United Nations, <i>Rio Declaration on Environment and Development</i>.
United Nations, <i>Transforming our world: the 2030 Agenda for Sustainable
Development</i>.
<span style="font-variant:small-caps;">Central Pollution Control Board, Delhi
Assessment of impact of Odd-Even Scheme on air quality of Delhi</span>
http://cpcbenvis.nic.in/pdf/CPCB Report on Odd-Even Scheme.pdf (last
visited Nov 19, 2018).
269
Keshav Singhania, G P Girish & Nnaemeka Vincent, <i>Impact of Odd-
Even Rationing of Vehicular Movement in Delhi on Air Pollution Levels</i>, 7
151–160 (2016), http://www.scirp.org/journal/lce (last visited Nov 19, 2018).
<span style="font-variant:small-caps;">Odd-Even Program: Analysis Q&
amp; A Summary</span>,https://epic.uchicago.edu/sites/default/files/Odd. Even
Pogram Analysis Q&A.pdf (last visited Nov 19, 2018).
<span style="font-variant:small-caps;">Sumit Sharma et al.</span>, <i>Analysis
of Odd-Even scheme phase-II</i>, https://pdfs.semanticscholar. org/6ccc/
fe6af7cc7d8247e2b15fbd8a35ce4730c620.pdf (last visited Nov 19, 2018).
Anjali Bhide & Carlos RodrÃguez Monroy, <i>Energy poverty: A
special focus on energy poverty in India and renewable energy technologies</ i>,
15 <span style="font-variant:small-caps;">Renew. Sustain. Energy Rev.</span>
1057–1066 (2011), https://www.sciencedirect.com/ science/article/ pii/
S1364032110004132 (last visited Jun 13, 2018).
Gisèle Schmid, <i>The development of renewable energy power in India:
Which policies have been effective?</i>, 45 <span style="font-variant:small-
caps;">Energy Policy</span> 317–326 (2012), https://www.sciencedirect.com/
science/article/pii/S0301421512001565#s0055 (last visited Jun 13, 2018).
James H. Williams & Navroz K. Dubash, <i>Asian Electricity Reform in
Historical Perspective</i>, 77 <span style="font-variant:small-caps;">Pacific
Affairs</span> 411–436, https://www.jstor.org/stable/40022909 (last visited
Nov 23, 2018).
John Cubbin & Jon Stern, <i>The Impact of Regulatory Governance and
Privatization on Electricity Industry Generation Capacity in Developing
Economies</i>, 20 <span style="font-variant:small-caps;">World Bank Econ.
Rev.</span> 115–141 (2006), https://academic.oup.com/wber/article/20/1/
115/1680456 (last visited Nov 23, 2018).
<span style="font-variant:small-caps;">Alok Kumar & Sushanta K.
Chatterjee</span>, <span style="font-variant:small-caps;">Electricity Sector
in India: Policy and Regulation</span> (2012), https://books.google.co.in/
books?id=PpEqViahEpEC.
270
Part Iii, Generation O F Electricity & Part Iv, <i>the Electricity Act , 2003
Introductory</i> 1–2 (2003).
<span style="font-variant:small-caps;">S K Chatterjee</span>, <span
style="font-variant:small-caps;">S.K. Chatterjee’s Commentary on
Electricity Laws of India: The Electricity Act, 2003, an Insight with the
Electricity Rules, 2005 Alongwith the Electricity (Amendment) Act, 2007,
Allied Rules, Regulations, Orders, Notifications, Resolution and National
El</span> (2010), https://books.google.co.in/books?id=Y4oGcgAACAAJ.
<span style="font-variant:small-caps;">DLA Piper</span>, <i>Renewable
Energy in the Asia Pacific: A Legal Overview</i>.
http://www.cercind.gov.in/Mission.html (last visited Nov 26, 2018).
James A. Duffield and Keith Collins, <i>Evolution of Renewable Energy
Policy</i> (2006), http://www.choicesmagazine.org/2006-1/biofuels/2006-1-
02.htm (last visited Nov 28, 2018).
<span style="font-variant:small-caps;">International Energy Agency</span>,
<i>WORLD ENERGY INVESTMENT 2018</i>, www.iea.org/t&c/ (last
visited Nov 28, 2018).
Global Trends in Renewable Energy Investment 2018 | capacity4dev.eu, ,
https://europa.eu/capacity4dev/unep/documents/global-trends-renewable-
energy-investment-2018 (last visited Nov 29, 2018).
<span style="font-variant:small-caps;">- International Energy Agency</
span>, <i>supra</i> note 105.
Global Trends in Renewable Energy Investment 2018 | capacity4dev.eu,
<i>supra</i> note 236.
Clean Energy Investment 2018 | Bloomberg NEF, <i>supra</i> note 104.
OECD/IEA, <i>Tackling Investment Challenges in Power Generation in IEA
Countries</i>, <span style="font-variant:small-caps;">Int. Energy Agency</
span> 1–210 (2007), https://www.iea.org/publications/ freepublications/
publication/tackling_investment.pdf.
<i>Id.</i>
271
<i>Id.</i>
<span style="font-variant:small-caps;">- International Energy
Agency</span>, <i>supra</i> note 105.
<span style="font-variant:small-caps;">International Energy Agency</span>,
<i>supra</i> note 235.
<i>Id.</i>
<span style="font-variant:small-caps;">- International Energy Agency</
span>, <i>supra</i> note 105.
20 <span style="font-variant:small-caps;">January /</span>, <span
style="font-variant:small-caps;">Market Outlook Facts, Figures, Data and
Stats You Can Count On</span> (2017).
<span style="font-variant:small-caps;">Frankfurt School-UNEP Centre/
BNEF. 2017. Global Trends in Renewable Energy Investment 2017,
http://www.fs-unep-centre.org (Frankfurt am Main)</span>, , http://www.fs-
unep-centre.org (last visited Aug 29, 2018).
<span style="font-variant:small-caps;">- International Energy Agency</
span>, <i>supra</i> note 105.
<span style="font-variant:small-caps;">Frankfurt School-UNEP Centre/ BNEF.
2017. Global Trends in Renewable Energy Investment 2017, http://www.fs-unep-
centre.org (Frankfurt am Main)</span>, <i>supra</i> note 252.
<span style="font-variant:small-caps;">- International Energy Agency</span>,
<i>supra</i> note 105.
Clean Energy Investment 2018 | Bloomberg NEF, <i>supra</i> note 104.
<span style="font-variant:small-caps;">Laurie Van Der Burg & Shelagh
Whitley</span>, <i>Rethinking power markets: capacity mechanisms and
decarbonisation</i> (2016), www.odi.org/twitter (last visited Nov 29, 2018).
<span style="font-variant:small-caps;">International Renewable Energy
Agency</span>, <span style="font-variant:small-caps;">Global Energy
Transformation: A Roadmap to 2050</span> (2018), www.irena.org (last
visited Aug 29, 2018).
272
Global Trends in Renewable Energy Investment 2018 | capacity4dev.eu,
<i>supra</i> note 236.
<span style="font-variant:small-caps;">Renewable Energy Agency</span>,
<i>supra</i> note 258.
Global Renewable Energy Industry - Statistics &amp; Facts | Statista, ,
https://www.statista.com/topics/2608/global-renewable-energy-industry/ (last
visited Aug 29, 2018).
<span style="font-variant:small-caps;">- International Energy Agency</
span>, <i>supra</i> note 105.
<span style="font-variant:small-caps;">Renewable Energy Agency</span>,
<i>supra</i> note 258.
<span style="font-variant:small-caps;">CENTRAL STATISTICS OFFICE
MINISTRY OF STATISTICS AND PROGRAMME IMPLEMENTATION
GOVERNMENT OF INDIA</span>, <i>supra</i> note 43.
<span style="font-variant:small-caps;">Renewable Energy Agency</span>,
<i>supra</i> note 258.
Corporate Sourcing of Renewable Energy: Market and Industry Trends, ,
<span style="font-variant:small-caps;">/publications/2018/May/Corporate-
Sourcing-of-Renewable-Energy</span>,
https://www.irena.org/publications/2018/May/Corporate-Sourcing-of-
Renewable-Energy (last visited Nov 30, 2018).
<span style="font-variant:small-caps;">Kanika Chawla et al.</span>,
<i>Clean Energy Investment Trends EVOLVING LANDSCAPE FOR GRID-
CONNECTED RENEWABLE ENERGY PROJECTS IN INDIA</i> (2018),
http://www.ceew.in/sites/default/files/CEEW-Clean-Energy-Investment-
Trends-Report-27Jun18.pdf (last visited Nov 30, 2018).
<span style="font-variant:small-caps;">Ministry of New & Renewable
Energy</span>, <i>Amendment in National Wind-Solar Hybrid Policy</i>,
https://static.investindia.gov.in/s3fs-public/2018-09/%28Amendment%29
%2B National Hybrid wind solar policy_0.pdf (last visited Nov 30, 2018).
273
Business reforms made in the Enforcing Contracts - Doing Business - World
Bank Group, (2018), http://www.doingbusiness.org/reforms/overview/topic/
Enforcing-Contracts (last visited Jun 5, 2018).
World bank, <i>India Jumps Doing Business Rankings with Sustained Reform
Focus 2016</i> (2017), http://www.worldbank.org/en/news/press-release/2017/
10/31/india-jumps-doing-business-rankings-with-sustained-reform-focus (last
visited Jun 3, 2018).
World Bank Group, <i>Doing business 2018</i>, 15 <span style="font-
variant:small-caps;">CESifo Forum</span> 312 (2017), http://www.
doingbusiness.org/~/media/WBG/DoingBusiness/Documents/Annual-
Reports/English/DB2018-Full-Report.pdf (last visited Jun 3, 2018).
<span style="font-variant:small-caps;">World Bank Group</span>,
<i>DOING BUSINESS 2013 Smarter Regulations for Small and Medium-
Size Enterprises</i> (2004), www.worldbank.org (last visited Dec 17, 2018).
World Bank Group, <i>supra</i> note 279.
<span style="font-variant:small-caps;">World Bank Group</span>, <i>Doing
Business 2016 Measuring Regulatory Quality and Efficiency</i> (2016),
www.worldbank.org (last visited Dec 17, 2018).
World Bank Group, <i>supra</i> note 279.
World Bank Group, <i>supra</i> note 279.
NREL: International Activities - India Solar Resource Maps and Data, ,
https://www.nrel.gov/international/ra_india.html (last visited Jun 5, 2018).
<span style="font-variant:small-caps;">State Renewable Energy Capacity
Addition Roadmap</span>, (2018), http://indiaenergy.gov.in/wp-content/
uploads/2017/10/Executive-Summary.pdf (last visited Jun 5, 2018).
<span style="font-variant:small-caps;">Jawaharlal Nehru National Solar
Mission Towards Building SOLAR INDIA</span>, https://mnre.gov.in/
sites/default/files/uploads/mission_document_JNNSM.pdf (last visited Jun 7,
2018).
Solar and Wind Power Policies, 2015 of Andhra Pradesh Released at Re-
274
Invest 2015, , http://pib.nic.in/newsite/PrintRelease.aspx?relid=115480 (last
visited Jun 7, 2018).
Andhra Pradesh state policy on organic farming - India Environment Portal |
News, reports, documents, blogs, data, analysis on environment &
development | India, South Asia , http://www.indiaenvironmentportal.org.in/
content/269874/andhra-pradesh-state-policy-on-organic-farming/ (last visited
Jun 7, 2018).
<span style="font-variant:small-caps;">ANDHRA PRADESH WIND-
SOLAR HYBRID POWER POLICY – 2016</span>, http://nredcap.in/
PDFs/Downloads/Draft_modified_wind_solar_hybrid_policy_10_08_2016.pd
f (last visited Jun 7, 2018).
Andhra Pradesh’s solar-wind park is largest, https://www.deccanchronicle
.com/nation/current-affairs/021217/andhra-pradeshs-solar-wind-park-is-largest.
html (last visited Jun 7, 2018).
<span style="font-variant:small-caps;">Jawaharlal Nehru National Solar
Mission Towards Building SOLAR INDIA</span>, <i>supra</i> note 321.
<span style="font-variant:small-caps;">Jawaharlal Nehru National Solar
Mission Towards Building SOLAR INDIA</span>, <i>supra</i> note 321.
<span style="font-variant:small-caps;">Res</span>, <i>ALL INDIA
INSTALLED CAPACITY (IN MW) OF POWER STATIONS</i> (1155),
http://www.cea.nic.in/reports/monthly/installedcapacity/2016/installed_capacit
y-03.pdf (last visited Jun 7, 2018).
<span style="font-variant:small-caps;">Jawaharlal Nehru National Solar
Mission Towards Building SOLAR INDIA</span>, <i>supra</i> note 321.
government of karnataka, <i>Solar Policy 2014-2021</i>, https://mnre.gov.in/
file-manager/UserFiles/state-power-policies/Karnatava-Solar-Power-Policy_
2014-2021.pdf (last visited Dec 4, 2018).
Welcome to WBREDA: Department of Power and NES, Govt. of West
Bengal :: conventional energy, renewable energy, India, Kolkata, non
conventional energy sources, energy and environment, energy efficiency,
275
energy policies, Solar Home Systems(SHS), solar, biomass, hydro and wind
energy, Sundarban ::, , http://www.wbreda.org/ (last visited Nov 30, 2018).
Welcome to WBREDA: Department of Power and NES, Govt. of West
Bengal :: conventional energy, renewable energy, India, Kolkata, non
conventional energy sources, energy and environment, energy efficiency,
energy policies, Solar Home Systems(SHS), solar, biomass, hydro and wind
energy, Sundarban ::, <i>supra</i> note 335.
<span style="font-variant:small-caps;">Department of Power &
Nonconventional Energy Sources & Govt. of West Bengal</span>,
<i>Policy on Co-generation and Generation of Electricity from Renewable
Sources of Energy</i>, <span style="font-variant:small-caps;">Department of
Power & Nonconventional Energy Sources, Govt. of West Bengal</span>
(2012), http://www.wbreda.org/wp-content/uploads/2012/06/policy-
renewable-wb.pdf (last visited Jun 4, 2018).
<span style="font-variant:small-caps;">Government of Uttar Pradesh</span>,
<i>Uttar Pradesh Mini Grid Policy 2016</i>, http://www.upneda.org.in/
mediagallery/Mini-Grid-Policy-2016.pdf (last visited Nov 30, 2018).
Programmes Under Grid Connection - Uttar Pradesh New and Renewable
Energy Development Agency, , http://www.upneda.org.in/programmes-under-
grid-connection.aspx (last visited Nov 30, 2018).
<span style="font-variant:small-caps;">Government of UTTAR ORAdesh</
span>, <i>Uttar Pradesh Solar Energy Policy 2017</i>, http://www.upneda.
org.in/MediaGallery/Uttar_Pradesh_Solar_Energy_Policy-
2017_English__0.pdf (last visited Nov 30, 2018).
TEDA | Tamilnadu Energy Development Agency, , https://teda.in/ (last visited
Dec 1, 2018).
<span style="font-variant:small-caps;">TAMIL NADU SOLAR ENERGY
POLICY 2012</span>, , https://mnre.gov.in/file-manager/UserFiles/state-
power-policies/Tamilnadu-Solar-Power-Policy.pdf (last visited Dec 1, 2018).
<span style="font-variant:small-caps;">Power-Industry Transition, Here and
Now Wind and Solar Won’t Break the Grid: Nine Case Studies</span>,
276
(2018), http://ieefa.org/wp-content/uploads/2018/02/Power-Industry-Transition-
Here-and-Now_February-2018.pdf (last visited Dec 1, 2018).
How Tamil Nadu became one of the world’s leading renewable energy
markets — Quartz India, https://qz.com/india/1208222/how-tamil-nadu-
became-one-of-the-worlds-leading-renewable-energy-markets/ (last visited
Dec 1, 2018).
<span style="font-variant:small-caps;">Inviting Comments &amp; Inputs
on Draft Tamilnadu Solar Energy Policy-2018</span>, http://teda.in/wp-
content/uploads/2018/09/Draft-Policy-note-2018.pdf (last visited Dec 1,
2018).
<span style="font-variant:small-caps;">Rajasthan Renewable Energy
Corporation</span>, <i>Rajasthan Solar Energy Policy, 2014</i> (2014),
http://rips.rajasthan.gov.in/menupdf/Rajasthan-Solar-Energy-Policy-2014-
10.pdf (last visited Dec 1, 2018).
<span style="font-variant:small-caps;">Jawaharlal Nehru National Solar
Mission Towards Building SOLAR INDIA</span>, <i>supra</i> note 321.
<span style="font-variant:small-caps;">Government of Rajasthan</span>,
<i>Rjasthan Solar Energy Policy 2011 (Amendment 2011)</i>, https://mnre.
gov.in/file-manager/UserFiles/state-power-policies/First-Amendment-
Rajasthan-Solar-Power-Policy.pdf (last visited Dec 4, 2018).
<span style="font-variant:small-caps;">Res</span>, <i>supra</i> note 330.
<span style="font-variant:small-caps;">Jawaharlal Nehru National Solar
Mission Towards Building SOLAR INDIA</span>, <i>supra</i> note 321.
<span style="font-variant:small-caps;">Government of Telengana</span>,
<i>Telangana Solar Power Policy 2015</i>, https://mnre.gov.in/file-
manager/UserFiles/Grid-Connected-Solar-Rooftop-
policy/Telangana_Solar_Power_Policy_2015.pdf (last visited Dec 1, 2018).
<span style="font-variant:small-caps;">State Renewable Energy Capacity
Addition Roadmap</span>, <i>supra</i> note 319.
<span style="font-variant:small-caps;">Government of Telangana</span>,
277
<i>Single Window Mechanism for Solar Power Projects</i>, https://www.
tssouthernpower.com/ShowProperty/CP_CM_REPO/Pages/Hotlinks/Telangan
aSolarPowerPolicy/Single Window Mechanism for Solar PP (last visited Dec
1, 2018).
<span style="font-variant:small-caps;">Res</span>, <i>supra</i> note 330.
<span style="font-variant:small-caps;">Government of Maharashtra</span>,
<i>Maharashtra Renewable Energy Policy 2015</i>, https://www.mahaurja.
com/meda/data/grid_solar_power/Policy for Grid Connected Solar Power
Projects - English.pdf (last visited Dec 1, 2018).
Policy / Government Resolutions | Maharashtra Energy Development Agency
(Govt. of Maharashtra Institution), India, https://www.mahaurja.com/meda/
off_grid_power/solar_energy/policy_government_resolutions (last visited Dec
1, 2018).
Maharashtra Solar Energy Policy, , http://www.saurenergy.com/solar-energy-
policy-india/maharashtra-solar-energy-policy (last visited Dec 1, 2018).
<span style="font-variant:small-caps;">Madhya Pradesh Policy for Decentralized
Renewable Energy Systems, 2016</span>, http://www.mprenewable.
nic.in/Decentralized RE Policy in English 24.09.2016.pdf (last visited Dec 1,
2018).
Madhya Pradesh Introduces Innovative Decentralized Solar Policy - Mercom
India, https://mercomindia.com/madhya-pradesh-introduces-decentralized-
solar-policy/ (last visited Dec 3, 2018).
<span style="font-variant:small-caps;">Res</span>, <i>supra</i> note 330.
<span style="font-variant:small-caps;">Jawaharlal Nehru National Solar
Mission Towards Building SOLAR INDIA</span>, <i>supra</i> note 321.
<span style="font-variant:small-caps;">Government of Assam</span>,
<i>Assam Solar Energy Policy, 2017</i>, http://www.aegcl.co.in/
06022018Gazette-Solar_Policy.pdf (last visited Dec 3, 2018).
<span style="font-variant:small-caps;">Res</span>, <i>supra</i> note 330.
<i>Id.</i>
278
<span style="font-variant:small-caps;">Jawaharlal Nehru National Solar
Mission Towards Building SOLAR INDIA</span>, <i>supra</i> note 321.
<span style="font-variant:small-caps;">MASS AWARENESS AND
PUBLICITY PROGRAMME The development and application of New and
Renewable</span>, ,
http://peda.gov.in/main/images/MAP_progress_report.pdf (last visited Dec 5,
2018).
<span style="font-variant:small-caps;">Government of Punjab</span>,
<i>New and Renewable Sources of Energy (NRSE) Policy 2012</i>,
http://peda.gov.in/main/tenders/nrse pol 2012.pdf (last visited Dec 5, 2018).
<span style="font-variant:small-caps;">Government of India</span>, <i>THE
WATER (PREVENTION AND CONTROL OF POLLUTION) CESS
(AMENDMENT) ACT, 2003</i>, http://bombayhighcourt.nic.in/libweb/
actc/yearwise/2003/2003.19.pdf (last visited Dec 6, 2018).
THE ENVIRONMENT (PROTECTION) ACT, 1986, , http://envfor.nic.in/
legis/env/env1.html (last visited Dec 6, 2018).
Ministry of New and Renewable Energy, <i>States which have notified the
State Solar Policies</i>, https://mnre.gov.in/file-manager/UserFiles/state-
solar-power-policies.htm (last visited Dec 4, 2018).
Vikas Khare, Savita Nema & Prashant Baredar, <i>Status of solar wind
renewable energy in India</i>, 27 <span style="font-variant:small-caps;">Renew.
Sustain. Energy Rev.</span> 1–10 (2013), https://www.sciencedirect.
com/science/article/pii/S136403211300395X (last visited Jun 13, 2018).
<span style="font-variant:small-caps;">Ministry of Power</span>, <i>Tariff
Policy</i>, <span style="font-variant:small-caps;">The Gazette of India</
span> 1–21 (2006), http://powermin.nic.in/sites/default/files/uploads/ Tariff_
Policy_1.pdf (last visited Jun 13, 2018).
P. Venkata Ramana, C.S. Sinha & P.R. Shukla, <i>Renewable energy
technologies and climate change policies in India</i>, 15 <span style="font-
variant:small-caps;">Int. J. Glob. Energy Issues</span> 97–116 (2001),
http://www.scopus.com/inward/record.url?eid=2-s2.0-
279
0034956686&partnerID=40&md5=c08acc5bcdba9bfa968f0323f7b08
342 (last visited Jun 11, 2018).
Khare, Nema, and Baredar, <i>supra</i> note 383.
Bhide and Monroy, <i>supra</i> note 165.
Govinda R. Timilsina, Lado Kurdgelashvili & Patrick A. Narbel, <i>Solar
energy: Markets, economics and policies</i>, 16 <span style="font-
variant:small-caps;">Renew. Sustain. Energy Rev.</span> 449–465 (2012),
https://www.sciencedirect.com/science/article/pii/S1364032111004199 (last
visited Jun 13, 2018).
Kamil Kaygusuz, <i>Energy for sustainable development: A case of
developing countries</i>, 16 <span style="font-variant:small-caps;">Renew.
Sustain. Energy Rev.</span> 1116–1126 (2012), https://www.sciencedirect.
com/science/article/pii/S1364032111005491 (last visited Jun 13, 2018).
David G. Ockwell et al., <i>Key policy considerations for facilitating low
carbon technology transfer to developing countries</i>, 36 <span style="font-
variant:small-caps;">Energy Policy</span> 4104–4115 (2008), https://www.
sciencedirect.com/science/article/pii/S0301421508003091 (last visited Jun 13,
2018).
Schmid, <i>supra</i> note 169.
<span style="font-variant:small-caps;">State Renewable Energy Capacity
Addition Roadmap</span>, <i>supra</i> note 319.
Schmid, <i>supra</i> note 169.
Mohit Goyal & Rakesh Jha, <i>Introduction of Renewable Energy
Certificate in the Indian scenario</i>, 13 <span style="font-variant:small-
caps;">Renew. Sustain. Energy Rev.</span> 1395–1405 (2009),
https://www.sciencedirect.com/science/article/pii/S1364032108001470 (last
visited Jun 13, 2018).
<span style="font-variant:small-caps;">State Renewable Energy Capacity
Addition Roadmap</span>, <i>supra</i> note 319.
T V Ramachandra, Rishabh Jain & Gautham Krishnadas, <i>Hotspots of
280
solar potential in India</i>, 15 <span style="font-variant:small-caps;">Renew.
Sustain. Energy Rev.</span> 3178–3186 (2011), http://www.ces.iisc.ernet.in/
energy/paper/hotspots_solar_potential/RSER_hotspots.pdf (last visited Jun 5,
2018).
Faculty Fellow et al., <i>Enhancing the Investor Appeal</i> (2012).
Central Electricity Authority, <i>Government Of India Ministry of Power
Central Electricity Authority New Delhi Executive Summary Power
Sector</i> 1–52 (2014), http://www.cea.nic.in/reports/monthly/executive_
rep/feb14.pdf.
<span style="font-variant:small-caps;">Government of Gujarat</span>,
<i>GUJARAT SOLAR POWER POLICY 2015</i>, https://mnre.gov.in/file-
manager/UserFiles/state-power-policies/Gujarat-Solar-Power-Policy-2015.pdf
(last visited Dec 4, 2018).
<span style="font-variant:small-caps;">Daljit Singh</span>, <i>Newer
Challenges for Open Access in Electricity Need for Refinements in the
Regulations</i> (2017), www.brookings.in (last visited Dec 6, 2018).
Tedd Moya Mose, <i>Toward a harmonized framework for international regulation
of renewable energy</i>, Advance Ar <span style="font-variant:small-caps;">Unif.
Law Rev.</span> 1 (2018), https://academic.oup.com/ulr/advance-article/doi/
10.1093/ulr/uny016/4992864 (last visited Jun 11, 2018).
Moya Mose, <i>supra</i> note 406.
Boris Lopicich, <i>Equity and the energy trilemma Delivering sustainable
energy access in low-income communities</i>, <span style="font-
variant:small-caps;">Equity energy trilemma Deliv. Sustain. energy access
low-income communities</span> 26–36 (2015), http://pubs.iied.org/
pdfs/16046IIED.pdf (last visited Jun 13, 2018).
<span style="font-variant:small-caps;">International Energy Agency
(IEA)</span>, <i>International Energy Agency Annual Report</i> (2012),
https://www.iea.org/publications/freepublications/publication/2013_AnnualRe
port.pdf (last visited Jun 13, 2018).
281
Moya Mose, <i>supra</i> note 406.
Lopicich, <i>supra</i> note 410.
Rick van der Ploeg & Cees Withagen, <i>Is There Really a Green
Paradox ? Frederick van der Ploeg Is There Really a Green Paradox ?
Abstract</i> 1–38 (2010).
<span style="font-variant:small-caps;">Andrea S. Kramer & Peter C.
Fusaro</span>, <span style="font-variant:small-caps;">Energy and environmental
project finance law and taxation : new investment techniques</span>,
https://store.lexisnexis.com/products/energy-environmental-project-finance-law-
taxation-skuusSku-us-oxf-04610-Hardbound (last visited Jun 11, 2018).
Yannick Glemarec, <i>Financing off-grid sustainable energy access for the
poor</i>, 47 <span style="font-variant:small-caps;">Energy Policy</span>
87–93 (2012).
<span style="font-variant:small-caps;">Draft National Energy Policy NITI
Aayog, Government of India</span>, <i>supra</i> note 5.
Fredric Beck & Eric Martinot, <i>Renewable Energy Policies and
Barriers</i>, 34 <span style="font-variant:small-caps;">Encyclopedia of
Energy</span> 365–383 (2004), http://www.martinot.info/Beck_Martinot_AP.
pdf.
Akash Kumar Shukla et al., <i>Solar PV and BIPV system: Barrier,
challenges and policy recommendation in India</i>, 82 <span style="font-
variant:small-caps;">Renew. Sustain. Energy Rev.</span> 3314–3322
(2018), http://linkinghub.elsevier.com/retrieve/pii/S1364032117313862 (last
visited Jun 12, 2018).
<span style="font-variant:small-caps;">COMBINED SUMMARY OF
STATE POLICIES FOR SOLAR POWER Sl. No. Name of State/ Description
Andaman and Nicobar Island (From RE policy of State) Andhra Pradesh Bihar
(From RE policy of State) Chhattisgarh</span>, http://www.ireda.in/
writereaddata/CompendiumStatePolicyRE/Data/Solar.pdf (last visited Dec 4,
2018).
282
<span style="font-variant:small-caps;">International Renewable Energy
Agency</span>, <span style="font-variant:small-caps;">REmap: Renewable
Energy Prospects for India</span> (2017), www.irena.org/remap (last visited
Aug 29, 2018).
<span style="font-variant:small-caps;">COMBINED SUMMARY OF
STATE POLICIES FOR SOLAR POWER Sl. No. Name of State/ Description
Andaman and Nicobar Island (From RE policy of State) Andhra Pradesh Bihar
(From RE policy of State) Chhattisgarh</span>, <i>supra</i> note 422.
<span style="font-variant:small-caps;">National Institution for Transforming
India</span>, <i>supra</i> note 85.
<i>Id.</i>
Jeremiah Doner, <i>Barriers to Adoption of Renewable Energy
Technology</i>, <span style="font-variant:small-caps;">Inst. Regul. Policy
Stud. Illinois State</span> 32 (2007), http://irps.illinoisstate.edu/
downloads/research/documents/IRPSDonerWorkingPaper050707.pdf.
Shukla et al., <i>supra</i> note 421.
Sunil Luthra et al., <i>Barriers to renewable/sustainable energy technologies
adoption: Indian perspective</i>, 41 <span style="font-variant:small-
caps;">Renew. Sustain. Energy Rev.</span> 762–776 (2015),
http://linkinghub.elsevier.com/retrieve/pii/S1364032114007631 (last visited
Jun 11, 2018).
Timilsina, Kurdgelashvili, and Narbel, <i>supra</i> note 388.
Glemarec, <i>supra</i> note 417.
Union of Concerned Scientists, <i>Barriers to Renewable Energy
Technologies</i>, <span style="font-variant:small-caps;">Powerful
Solut.</span> 1–9 (2017), http://www.ucsusa.org/clean_energy/smart-
energy-solutions/increase-renewables/barriers-to-renewable-
energy.html#.WSVJHGgrKMo.
Luthra et al., <i>supra</i> note 429.
Timilsina, Kurdgelashvili, and Narbel, <i>supra</i> note 388.
283
Rajya Sabha, <i>PARLIAMENT OF INDIA DEPARTMENT-RELATED
PARLIAMENTARY STANDING COMMITTEE RAJYA SABHA ONE
HUNDRED TWENTY SECOND REPORT Ease of Doing Business</i>
(2015),
http://164.100.47.5/newcommittee/reports/EnglishCommittees/Committee on
Commerce/122.pdf (last visited Jun 6, 2018).
<span style="font-variant:small-caps;">International Energy Agency</span>,
<i>India Energy Outlook - World Energy Outlook Special Report 2015</i> (2015),
https://www.iea.org/publications/freepublications/publication/IndiaEnergyOutl
ook_WEO2015.pdf (last visited Sep 12, 2017).
Doner, <i>supra</i> note 427.
U.R. Prasad, <i>Analysing Tariffs - Welcome to Power Line</i>,
https://powerline.net.in/2017/12/07/analysing-tariffs/ (last visited Dec 9, 2018).
India rooftop solar power tariff drop to record lows - Livemint, ,
https://www.livemint.com/Industry/cYZ78fnbiNFt1ppRtRm3JP/India-rooftop-
solar-power-tariff-drop-to-record-lows.html (last visited Dec 9, 2018).
Timilsina, Kurdgelashvili, and Narbel, <i>supra</i> note 388.
Report on Indian Urban Infrastructure and Services, http://icrier.org/
pdf/FinalReport-hpec.pdf (last visited Jun 6, 2018).
20 <span style="font-variant:small-caps;">January /</span>, <i>supra</i>
note 251.
Hiroaki Nagayama, <i>Impacts on investments, and transmission/distribution
loss through power sector reforms</i>, 38 <span style="font-variant:small-
caps;">Energy Policy</span> 3453–3467 (2010), http://linkinghub.elsevier.
com/retrieve/pii/S030142151000100X (last visited Jun 13, 2018).
Shukla et al., <i>supra</i> note 421.
<span style="font-variant:small-caps;">National Institution for Transforming
India</span>, <i>supra</i> note 85.
Ahluwalia, Gupta, and Stern, <i>supra</i> note 82.
Solar Panel Price in India : Bijli Bachao, , https://www.bijlibachao.com
284
/solar/solar-panel-cell-cost-price-list-in-india.html (last visited Dec 6, 2018).
Land Acquisition Challenges, <i>Insight on Challenges Faced by EPC
Contractors</i> 34–35.
Davida Wood et al., <i>10 Questions To Ask About Scaling on-Grid
Renewable Energy Frameworks for Designing Good</i> 1–28 (2014).
S M Johnson, <i>Economics v. equity: do market-based environmental
reforms exacerbate environmental injustice</i>, 56 <span style="font-
variant:small-caps;">Wash.& Lee L.Rev.</span> 111 (1999).
<span style="font-variant:small-caps;">FORUM OF REGULATORS
REPORT ON OPEN ACCESS</span>, (2017), http://www.forumofregulators.
gov.in/Data/WhatsNew/Open_Access.pdf (last visited Dec 9, 2018).
<span style="font-variant:small-caps;">PwC</span>, <i>Renewable energy
’ s transformation of the Indian electricity landscape Message from
Mytrah</i> (2015).
National Institution for Transforming India, <i>Report on India’s
Renewable Electricity Roadmap 2030: Towards Accelerated Renewable
Electricity Deployment</i> (2016), http://niti.gov.in/writereaddata/files/
document_publication/Report_on_India%27s_RE_Roadmap_2030-
full_report-web.pdf.
B Mohan, <i>ENERGY CARRIERS FOR ENERGY SECURITY OF INDIA
– INVESTIGATION FOR AN OPTIMUM MIX Thesis submitted to Doctor
of Philosophy in Management Studies Under the Faculty of Management
Studies By RAJAGIRI COLLEGE OF SOCIAL SCIENCES,
KALAMASSERY</i> (2014).
Sudhakar Reddy & J. P. Painuly, <i>Diffusion of renewable energy
technologies-barriers and stakeholders’ perspectives</i>, 29 <span
style="font-variant:small-caps;">Renew. Energy</span> 1431–1447 (2004),
http://linkinghub.elsevier.com/retrieve/pii/S0960148103003975 (last visited
Jun 12, 2018).
285
<span style="font-variant:small-caps;">John Kelly et al.</span>, <span
style="font-variant:small-caps;">Best value in construction</span> (2002),
https://books.google.co.in/books?id=wh9d9weMCQsC&pg=PA163&
lpg=PA163&dq=tenant+landlord+dichotomy+solar&source=bl&
ots=LiQsmDUVqT&sig=4gKfIAz-mkOfXYDw0i0CsAim3dg&hl
=en&sa=X&ved=2ahUKEwjtneSHqZLfAhXch3AKHcphCHoQ6AE
wFXoECAoQAQ#v=onepage&q=tenant landlord dichotomy solar&
f=false (last visited Dec 9, 2018).
Schmid, <i>supra</i> note 169.
<span style="font-variant:small-caps;">Energy For Development</span>,
((International Atomic Energy Agency) L.Toth, Ferenc ed., ).
<span style="font-variant:small-caps;">Annexure-I Concept Note on Solar PV
Manufacturing Scheme</span>, https://www.indiansma.com/wp-content/uploads/
2018/01/MNRE-NMP-GSPD-concept-Dec-2017.pdf (last visited Dec 9, 2018).
Venkata Ramana, Sinha, and Shukla, <i>supra</i> note 385.
Felix Mormann, <i>Requirements for a Renewables Revolution</i>, 38 <span
style="font-variant:small-caps;">Ecol. Law Q.</span> 903–966 (2011).
Beck and Martinot, <i>supra</i> note 420.
Nathaniel J. Williams et al., <i>Enabling private sector investment in
microgrid-based rural electrification in developing countries: A review</i>, 52
<span style="font-variant:small-caps;">Renew. Sustain. Energy Rev.</span>
1268–1281 (2015), http://dx.doi.org/10.1016/j.rser.2015.07.153.
Luthra et al., <i>supra</i> note 429.
Union of Concerned Scientists, <i>supra</i> note 432.
Infrastructure Development Finance Company Ltd., <i>Draft: Barriers to
development of renewable energy in India & proposed recommendations</i>
(2010), http://www.idfc.com/pdf/publications/ Discussion- paper-on-Renewable-
Energy.pdf%5CnEnergy Advisory Board 4 12 2012 - Barriers to development
of renewable.pdf.
Shukla et al., <i>supra</i> note 421.
286
Soma Bhattacharya & Maureen L Cropper, <i>Options for Energy
Efficiency in India and Barriers to Their Adoption: A Scoping Study</i>,
<span style="font-variant:small-caps;">SSRN Electron. J.</span> 3–7
(2010), http://www.ssrn.com/abstract=1590510.
J. Jeslin Drusila Nesamalar, P. Venkatesh & S. Charles Raja, <i>The
drive of renewable energy in Tamilnadu: Status, barriers and future
prospect</i>, 73 <span style="font-variant:small-caps;">Renew. Sustain.
Energy Rev.</span> 115–124 (2017), http://linkinghub.elsevier.com/
retrieve/pii/S1364032117301326 (last visited Jun 10, 2018).
Shukla et al., <i>supra</i> note 421.
Reddy and Painuly, <i>supra</i> note 460.
D G Ockwell et al., <i>Key policy considerations for facilitating low carbon
technology transfer to developing countries</i>, <span style="font-variant:small-
caps;">Energy Policy</span> (2008).
Francesco Nicolli & Francesco Vona, <i>Heterogeneous policies,
heterogeneous technologies: The case of renewable energy</i>,
<span style="font-variant:small-caps;">Energy Econ.</span> (2016),
http://www.mendeley.com/research/heterogeneous-policies-heterogeneous-
technologies-case-renewable-energy.
Souvik Sen & Sourav Ganguly, <i>Opportunities, barriers and issues with
renewable energy development – A discussion</i>, 69 <span style="font-
variant:small-caps;">Renew. Sustain. Energy Rev.</span> 1170–1181
(2017), http://linkinghub.elsevier.com/retrieve/pii/S1364032116306487 (last
visited Jun 9, 2018).
Luthra et al., <i>supra</i> note 429.
Renner, Sweeney, and Kubit, <i>supra</i> note 54.
<span style="font-variant:small-caps;">Ministry of New and Renewable
Energy</span>, <i>JAWAHARLAL NEHRU NATIONAL SOLAR
MISSION GUIDELINES FOR DEVELOPMENT OF SOLAR PARKS</i>
(2016), https://mnre.gov.in/file-manager/UserFiles/Solar-Park-Guidelines.pdf
(last visited Dec 9, 2018).
287
Sen and Ganguly, <i>supra</i> note 480.
<span style="font-variant:small-caps;">AN OVERVIEW OF PUBLIC
PERCEPTION ABOUT THE SUITABILITY OF SOLAR POWER PANELS
AS AN ALTERNATIVE ENERGY SOURCE IN ANDHRA PRADESH</
span>, , www.aptransco.gov.in.This (last visited Dec 10, 2018).
<span style="font-variant:small-caps;">People’s Perception Study</span>, ,
http://awsassets.wwfindia.org/downloads/peoples_perception_study__renewab
le_energy_in_india_2014.pdf (last visited Dec 10, 2018).
Reddy and Painuly, <i>supra</i> note 460.
<span style="font-variant:small-caps;">Literature Review of Market Barriers
to Solar Technologies</span>, http://www.durban.gov.za/City_Services/
energyoffice/Documents/Market Barriers to Solar Technologies v1.pdf (last
visited Dec 10, 2018).
Williams et al., <i>supra</i> note 469.
Mayank Aggarwal, <i>Wind , solar will be cheapest power source in G20
countries by 2030 , says Greenpeace study</i> 9–11 (2017).
Ockwell et al., <i>supra</i> note 393.
<span style="font-variant:small-caps;">N Chambers, C Simmons & M
Wackernagel</span>, <span style="font-variant:small-caps;">Sharing
nature’s interest: ecological footprints as an indicator of sustainability<
/span> (2014), https://content.taylorfrancis.com/books/ download? dac=C201
1-0-08011-1&isbn=9781317972174&format=googlePreviewPdf (last
visited Dec 10, 2018).
Elinor Ostrom, <i>Response: The institutional analysis and development
framework and the commons</i>, 95 <span style="font-variant:small-
caps;">Cornell Law Rev.</span> 807–815 (2010), http://scholarship
.law.cornell.edu/cgi/viewcontent.cgi?article=3170&context=clr.
NREL: International Activities - India Solar Resource Maps and Data,
<i>supra</i> note 318.
288
Imported from https://www.financialexpress.com/economy/no-more-hefty-
electricity-bills-you-might-have-to-pay-almost-nothing-for-power-if-this-
solar-model-works/1231003/,https://www.financialexpress.com/economy /no-
more-hefty-electricity-bills-you-might-have-to-pay-almost-nothing-for-power-
if-this-solar-model-works/1231003/.
<span style="font-variant:small-caps;">Joseph A Cullen & Stanley S
Reynolds</span>, <i>Market Dynamics and Investment in the Electricity
Sector *</i> (2017), http://www.lancaster.ac.uk/staff/desilvad/LR_v1.pdf (last
visited Aug 28, 2018).
Timilsina, Kurdgelashvili, and Narbel, <i>supra</i> note 388.

289
APPENDIX
QUESTIONNAIRE
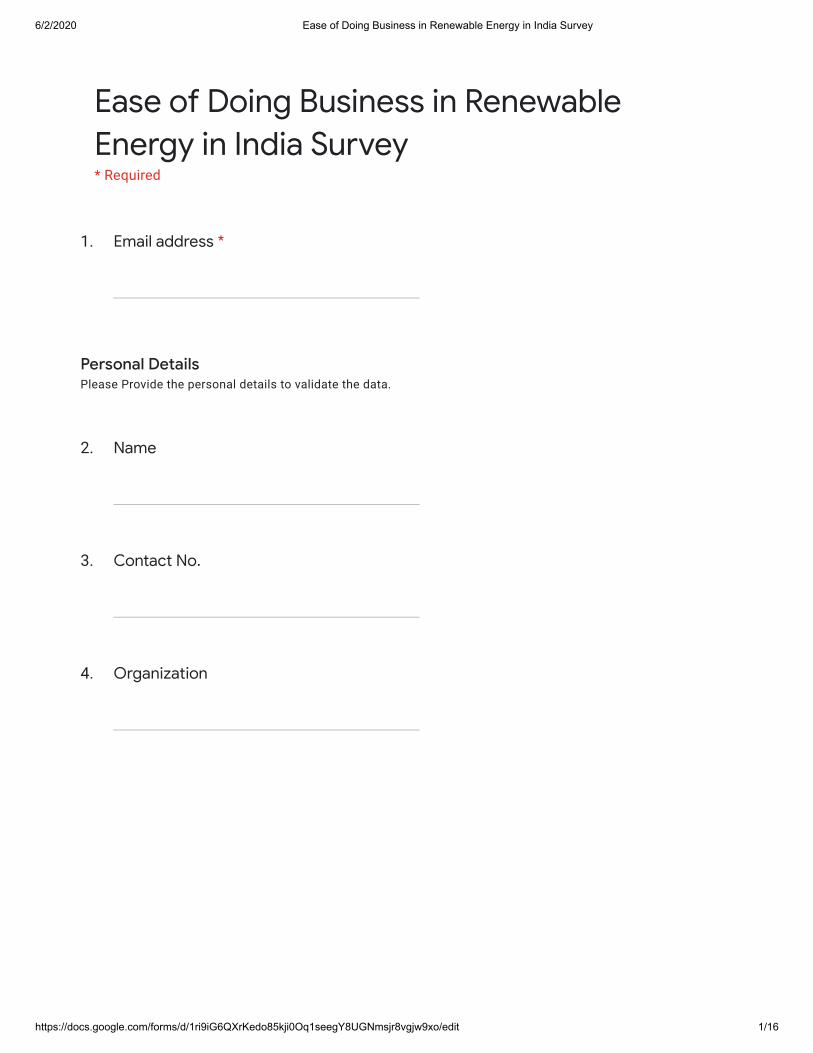
6/2/2020 Ease of Doing Business in Renewable Energy in India Survey
https://docs.google.com/forms/d/1ri9iG6QXrKedo85kji0Oq1seegY8UGNmsjr8vgjw9xo/edit 1/16
1. Email address *
Personal DetailsPlease Provide the personal details to validate the data.
2.
3.
4.
Ease of Doing Business in RenewableEnergy in India Survey* Required
Name
Contact No.
Organization

6/2/2020 Ease of Doing Business in Renewable Energy in India Survey
https://docs.google.com/forms/d/1ri9iG6QXrKedo85kji0Oq1seegY8UGNmsjr8vgjw9xo/edit 2/16
5.
Mark only one oval.
Other:
Manufacturing
Engineering Procurement and Construction (EPC)
Project Development
Financing
Consulting/Advisory/Academic
Government/Regulatory
Please describe the area of your expertise *

6/2/2020 Ease of Doing Business in Renewable Energy in India Survey
https://docs.google.com/forms/d/1ri9iG6QXrKedo85kji0Oq1seegY8UGNmsjr8vgjw9xo/edit 3/16
6.
Mark only one oval.
Andhra Pradesh
Andaman and Nicobar Islands
Arunachal Pradesh
Assam
Bihar
Chandigarh
Chhattisgarh
Dadra and Nagar Haveli
Daman and Diu
Goa
Gujarat
Haryana
Himachal Pradesh
Jammu and Kashmir
Jharkhand
Karnataka
Kerala
Lakshadweep
Madhya Pradesh
Maharashtra
Manipur
Meghalaya
Mizoram
Nagaland
National Capital Territory of Delhi
Odisha
Puducherry (Pondicherry)
Punjab
Rajasthan
Sikkim
Location of majority of your projects/office/Work
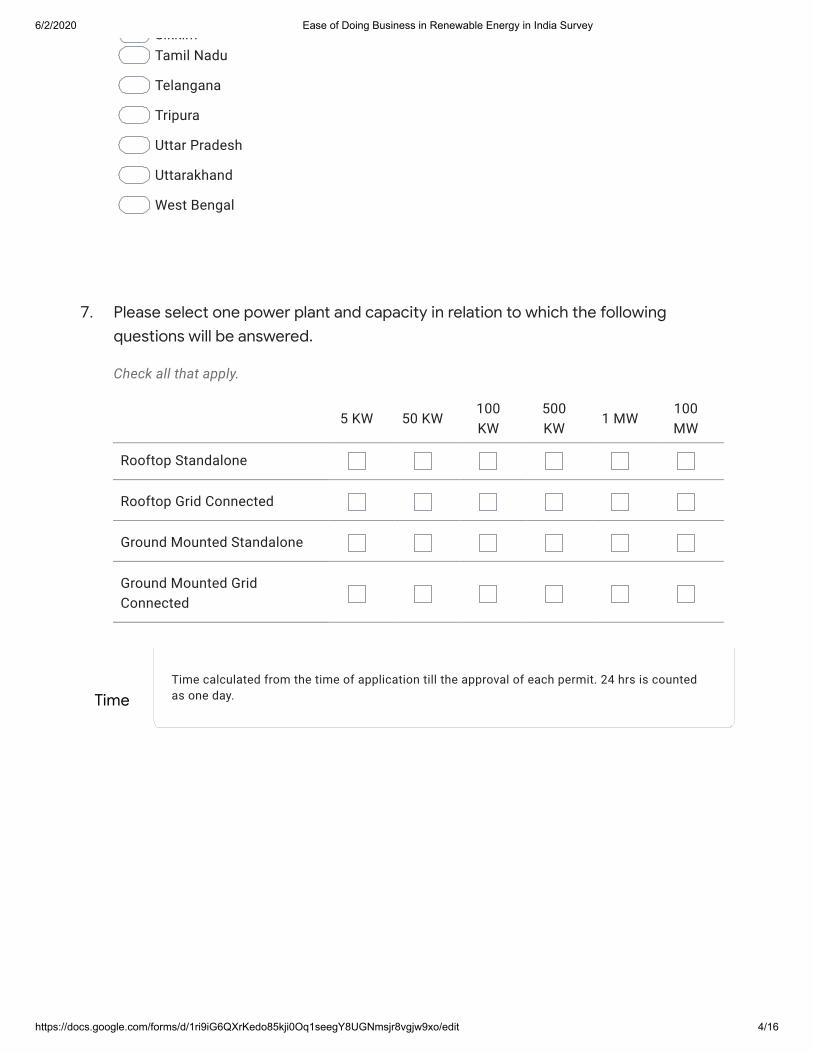
6/2/2020 Ease of Doing Business in Renewable Energy in India Survey
https://docs.google.com/forms/d/1ri9iG6QXrKedo85kji0Oq1seegY8UGNmsjr8vgjw9xo/edit 4/16
SikkimTamil Nadu
Telangana
Tripura
Uttar Pradesh
Uttarakhand
West Bengal
7.
Check all that apply.
TimeTime calculated from the time of application till the approval of each permit. 24 hrs is counted as one day.
Please select one power plant and capacity in relation to which the followingquestions will be answered.
5 KW 50 KW100KW
500KW
1 MW100MW
Rooftop Standalone
Rooftop Grid Connected
Ground Mounted Standalone
Ground Mounted GridConnected
Rooftop Standalone
Rooftop Grid Connected
Ground Mounted Standalone
Ground Mounted GridConnected
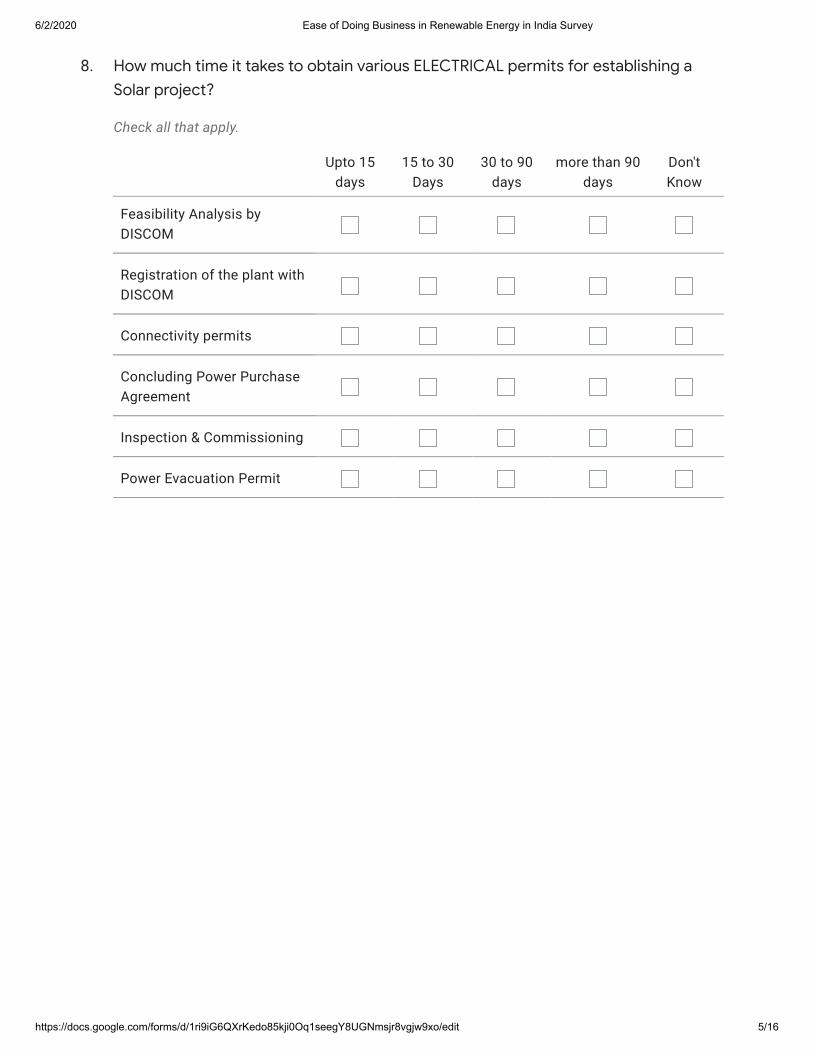
6/2/2020 Ease of Doing Business in Renewable Energy in India Survey
https://docs.google.com/forms/d/1ri9iG6QXrKedo85kji0Oq1seegY8UGNmsjr8vgjw9xo/edit 5/16
8.
Check all that apply.
How much time it takes to obtain various ELECTRICAL permits for establishing aSolar project?
Upto 15days
15 to 30Days
30 to 90days
more than 90days
Don'tKnow
Feasibility Analysis byDISCOM
Registration of the plant withDISCOM
Connectivity permits
Concluding Power PurchaseAgreement
Inspection & Commissioning
Power Evacuation Permit
Feasibility Analysis byDISCOM
Registration of the plant withDISCOM
Connectivity permits
Concluding Power PurchaseAgreement
Inspection & Commissioning
Power Evacuation Permit

6/2/2020 Ease of Doing Business in Renewable Energy in India Survey
https://docs.google.com/forms/d/1ri9iG6QXrKedo85kji0Oq1seegY8UGNmsjr8vgjw9xo/edit 6/16
9.
Check all that apply.
10.
Mark only one oval per row.
Cost
How much time it takes to obtain OTHER permits (mark which ever is relevant) forestablishing a Solar project?
Don'tKnow
Upto 15days
15 to 30Days
30 to 90days
more than 90days
Building Permit
Land Conversion Certificate
Contract Labor License
Environmental Clearances
Sewage Treatment Approval
Fire and Safety Certificate
Clearance from ForestDepartment
Permit from MNRE for TaxExemption
Building Permit
Land Conversion Certificate
Contract Labor License
Environmental Clearances
Sewage Treatment Approval
Fire and Safety Certificate
Clearance from ForestDepartment
Permit from MNRE for TaxExemption
How much time it takes to obtain a loan to FINANCE Solar project?
7 daysUp to
15days
Up to30
days
morethan 30
days
Morethan 90
days
Don'tKnow
Time Taken for gettingcredit from a financialinstitution
Time Taken for gettingcredit from a financialinstitution
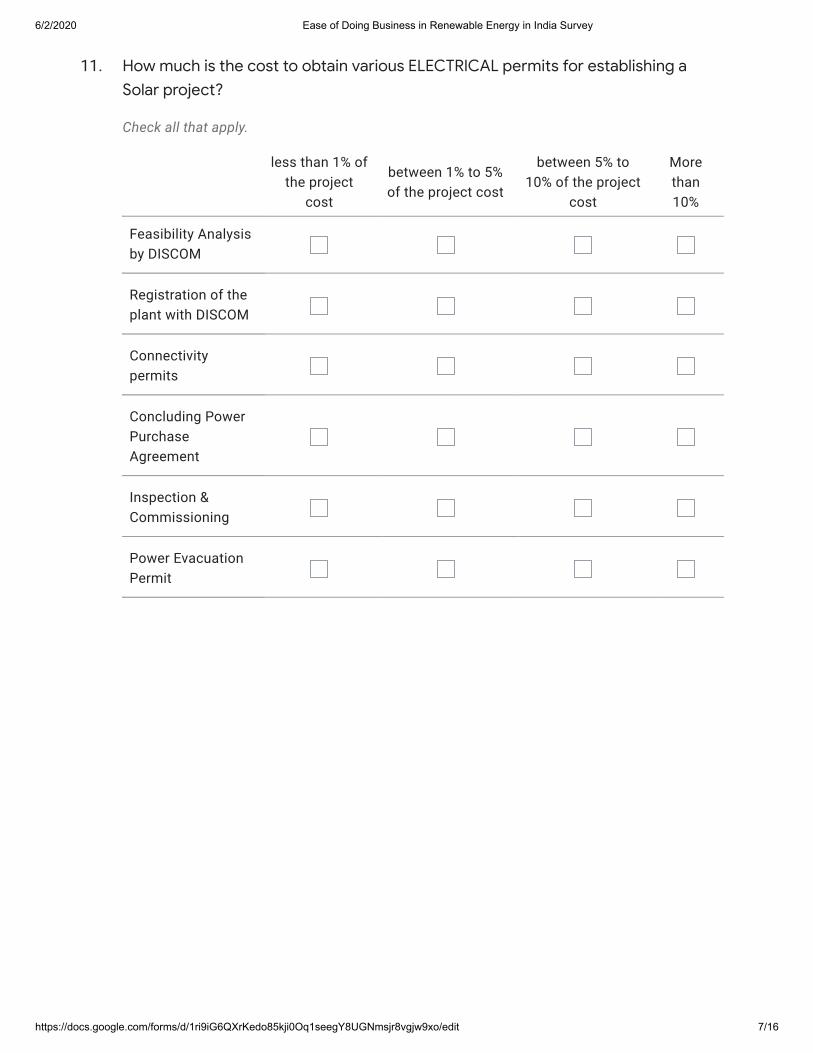
6/2/2020 Ease of Doing Business in Renewable Energy in India Survey
https://docs.google.com/forms/d/1ri9iG6QXrKedo85kji0Oq1seegY8UGNmsjr8vgjw9xo/edit 7/16
11.
Check all that apply.
How much is the cost to obtain various ELECTRICAL permits for establishing aSolar project?
less than 1% ofthe project
cost
between 1% to 5%of the project cost
between 5% to10% of the project
cost
Morethan10%
Feasibility Analysisby DISCOM
Registration of theplant with DISCOM
Connectivitypermits
Concluding PowerPurchaseAgreement
Inspection &Commissioning
Power EvacuationPermit
Feasibility Analysisby DISCOM
Registration of theplant with DISCOM
Connectivitypermits
Concluding PowerPurchaseAgreement
Inspection &Commissioning
Power EvacuationPermit
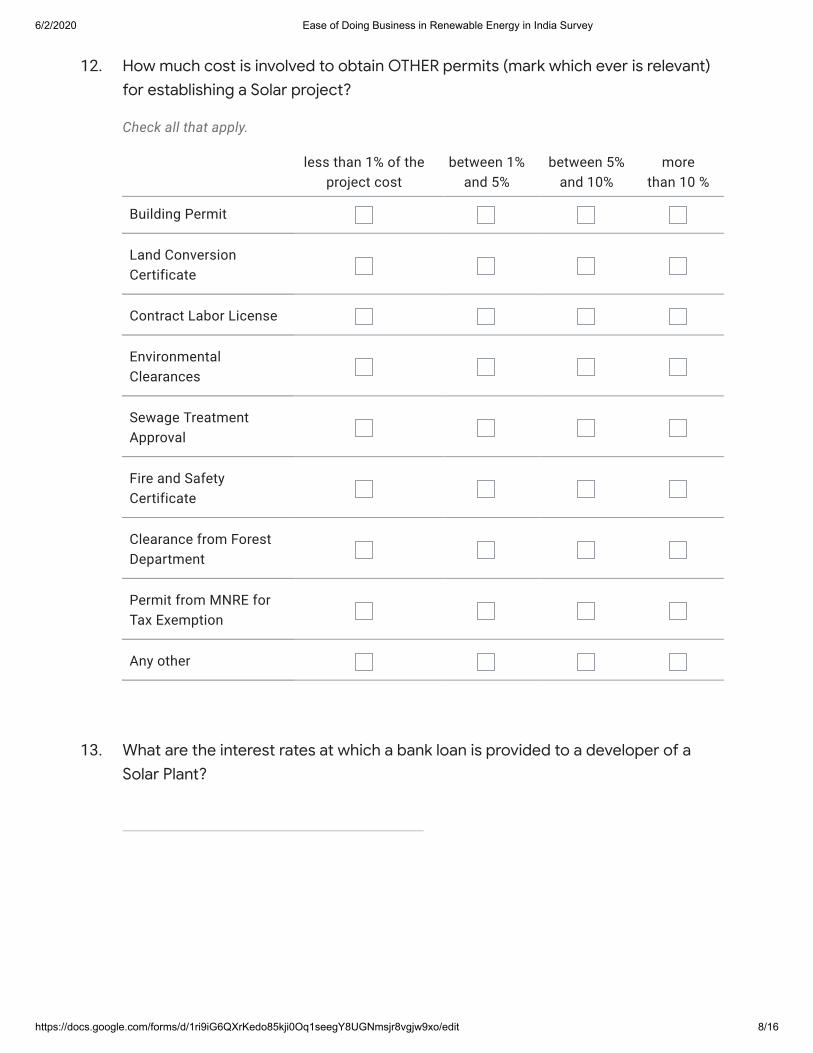
6/2/2020 Ease of Doing Business in Renewable Energy in India Survey
https://docs.google.com/forms/d/1ri9iG6QXrKedo85kji0Oq1seegY8UGNmsjr8vgjw9xo/edit 8/16
12.
Check all that apply.
13.
How much cost is involved to obtain OTHER permits (mark which ever is relevant)for establishing a Solar project?
less than 1% of theproject cost
between 1%and 5%
between 5%and 10%
morethan 10 %
Building Permit
Land ConversionCertificate
Contract Labor License
EnvironmentalClearances
Sewage TreatmentApproval
Fire and SafetyCertificate
Clearance from ForestDepartment
Permit from MNRE forTax Exemption
Any other
Building Permit
Land ConversionCertificate
Contract Labor License
EnvironmentalClearances
Sewage TreatmentApproval
Fire and SafetyCertificate
Clearance from ForestDepartment
Permit from MNRE forTax Exemption
Any other
What are the interest rates at which a bank loan is provided to a developer of aSolar Plant?
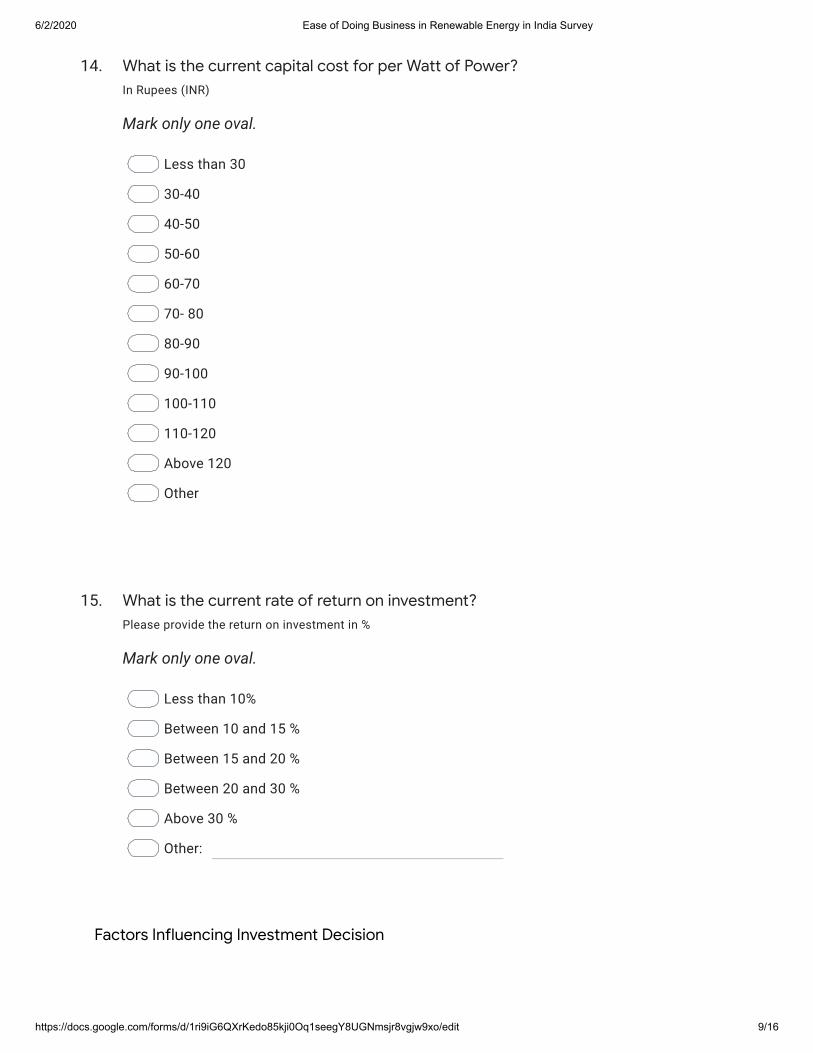
6/2/2020 Ease of Doing Business in Renewable Energy in India Survey
https://docs.google.com/forms/d/1ri9iG6QXrKedo85kji0Oq1seegY8UGNmsjr8vgjw9xo/edit 9/16
14.
Mark only one oval.
Less than 30
30-40
40-50
50-60
60-70
70- 80
80-90
90-100
100-110
110-120
Above 120
Other
15.
Mark only one oval.
Other:
Less than 10%
Between 10 and 15 %
Between 15 and 20 %
Between 20 and 30 %
Above 30 %
Factors Influencing Investment Decision
What is the current capital cost for per Watt of Power?In Rupees (INR)
What is the current rate of return on investment?Please provide the return on investment in %
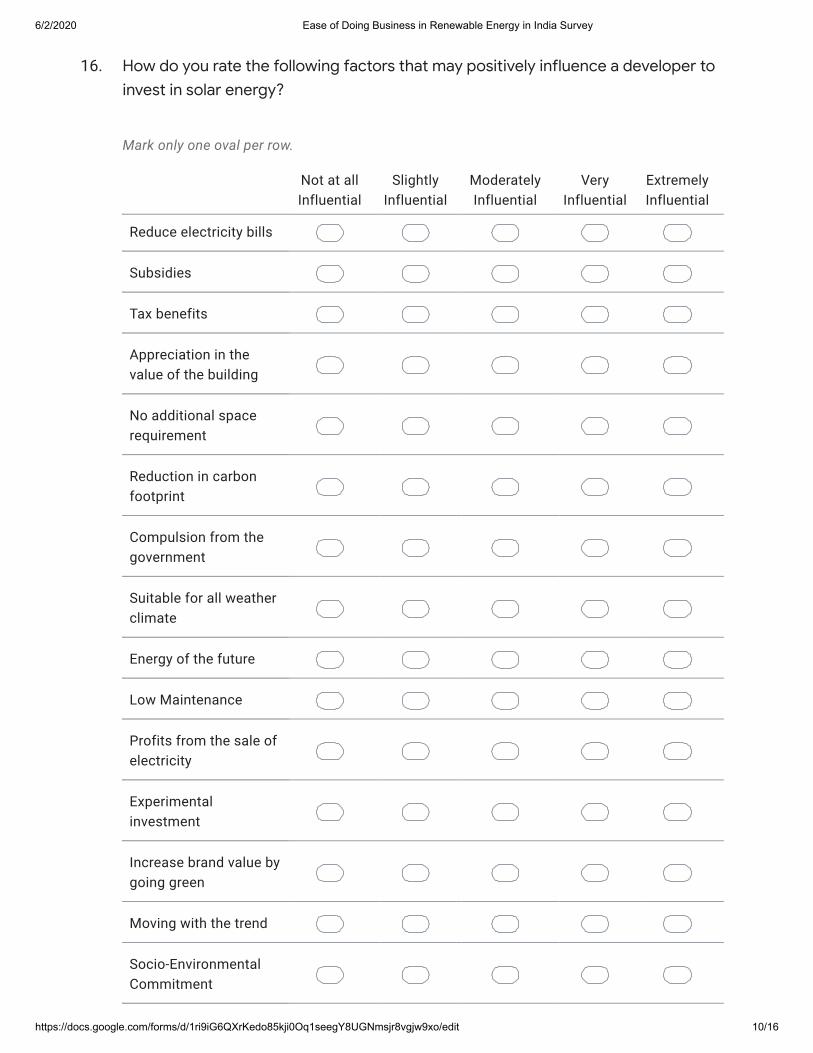
6/2/2020 Ease of Doing Business in Renewable Energy in India Survey
https://docs.google.com/forms/d/1ri9iG6QXrKedo85kji0Oq1seegY8UGNmsjr8vgjw9xo/edit 10/16
16.
Mark only one oval per row.
How do you rate the following factors that may positively influence a developer toinvest in solar energy?
Not at allInfluential
SlightlyInfluential
ModeratelyInfluential
VeryInfluential
ExtremelyInfluential
Reduce electricity bills
Subsidies
Tax benefits
Appreciation in thevalue of the building
No additional spacerequirement
Reduction in carbonfootprint
Compulsion from thegovernment
Suitable for all weatherclimate
Energy of the future
Low Maintenance
Profits from the sale ofelectricity
Experimentalinvestment
Increase brand value bygoing green
Moving with the trend
Socio-EnvironmentalCommitment
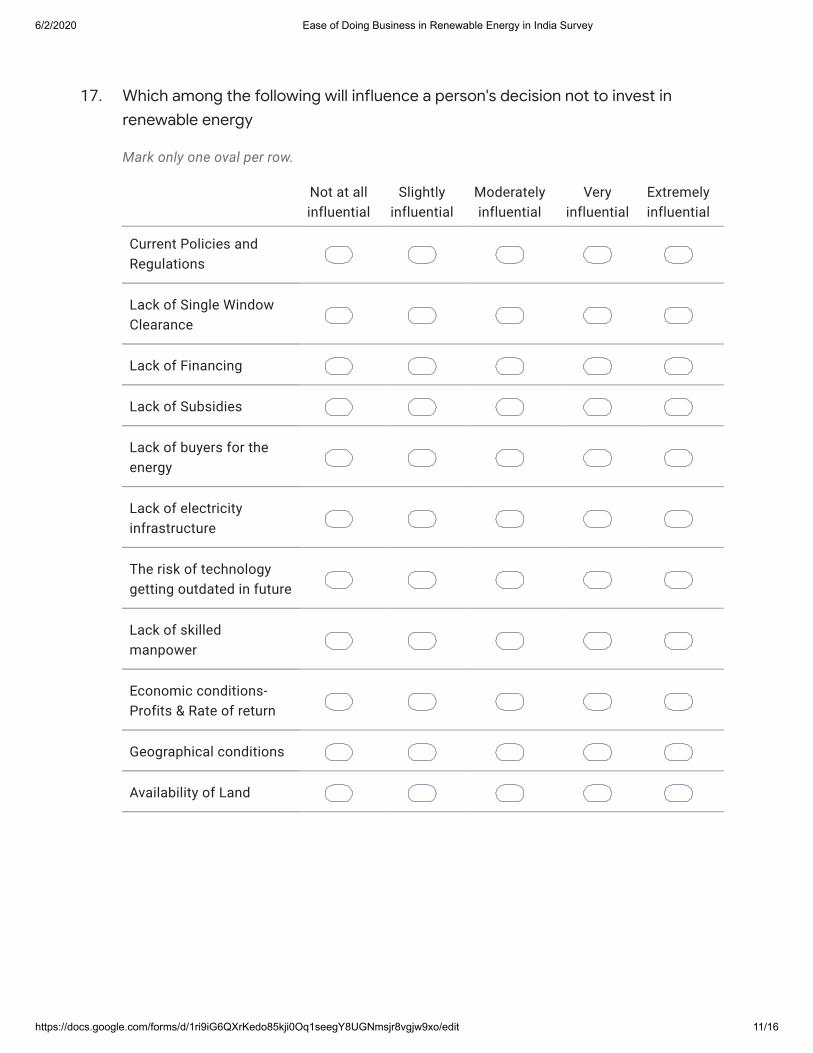
6/2/2020 Ease of Doing Business in Renewable Energy in India Survey
https://docs.google.com/forms/d/1ri9iG6QXrKedo85kji0Oq1seegY8UGNmsjr8vgjw9xo/edit 11/16
17.
Mark only one oval per row.
Which among the following will influence a person's decision not to invest inrenewable energy
Not at allinfluential
Slightlyinfluential
Moderatelyinfluential
Veryinfluential
Extremelyinfluential
Current Policies andRegulations
Lack of Single WindowClearance
Lack of Financing
Lack of Subsidies
Lack of buyers for theenergy
Lack of electricityinfrastructure
The risk of technologygetting outdated in future
Lack of skilledmanpower
Economic conditions-Profits & Rate of return
Geographical conditions
Availability of Land
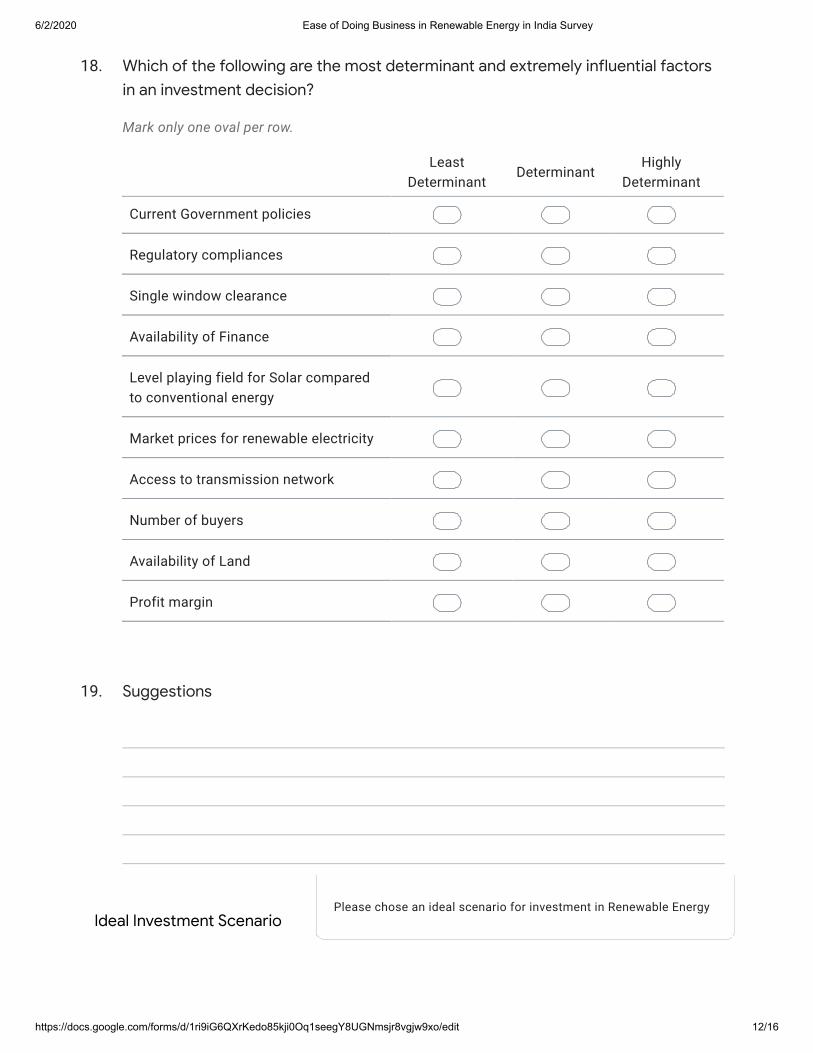
6/2/2020 Ease of Doing Business in Renewable Energy in India Survey
https://docs.google.com/forms/d/1ri9iG6QXrKedo85kji0Oq1seegY8UGNmsjr8vgjw9xo/edit 12/16
18.
Mark only one oval per row.
19.
Ideal Investment ScenarioPlease chose an ideal scenario for investment in Renewable Energy
Which of the following are the most determinant and extremely influential factorsin an investment decision?
LeastDeterminant
DeterminantHighly
Determinant
Current Government policies
Regulatory compliances
Single window clearance
Availability of Finance
Level playing field for Solar comparedto conventional energy
Market prices for renewable electricity
Access to transmission network
Number of buyers
Availability of Land
Profit margin
Current Government policies
Regulatory compliances
Single window clearance
Availability of Finance
Level playing field for Solar comparedto conventional energy
Market prices for renewable electricity
Access to transmission network
Number of buyers
Availability of Land
Profit margin
Suggestions

6/2/2020 Ease of Doing Business in Renewable Energy in India Survey
https://docs.google.com/forms/d/1ri9iG6QXrKedo85kji0Oq1seegY8UGNmsjr8vgjw9xo/edit 13/16
20.
Check all that apply.
21.
Mark only one oval.
Other:
Less than 15 Days
One Month
3 Months
6 Months
22.
Mark only one oval.
Other:
No Costs
Less than 1% of the total investments
Less than 5% of the total investments
Select One power plant and capacityPlease answer all other queries in this section in relation to the plant type and capacity you are selecting
5 KW 50 KW100KW
500KW
1 MW100MW
Rooftop Standalone
Rooftop Grid Connected
Ground Mounted Standalone
Ground Mounted GridConnected
Rooftop Standalone
Rooftop Grid Connected
Ground Mounted Standalone
Ground Mounted GridConnected
What is the ideal time within which all Preliminary and Pre-operational clearancesneed to be completed?
What is the ideal cost to obtain all Preliminary and Pre-operational clearances?Only fees and other legally payable charges are considered
6/2/2020 Ease of Doing Business in Renewable Energy in India Survey
https://docs.google.com/forms/d/1ri9iG6QXrKedo85kji0Oq1seegY8UGNmsjr8vgjw9xo/edit 14/16
23.
Mark only one oval.
Less than 30
30-40
40-50
50-60
60-70
70- 80
80-90
90-100
100-110
110-120
Above 120
24.
Mark only one oval.
Other:
Less than 10%
Between 10 and 15 %
Between 15 and 20 %
Between 20 and 30 %
Above 30 %
What is the ideal capital cost for per Watt of Power?In Rupees (INR)
What is the expected return on investment?Please provide the return on investment in %
6/2/2020 Ease of Doing Business in Renewable Energy in India Survey
https://docs.google.com/forms/d/1ri9iG6QXrKedo85kji0Oq1seegY8UGNmsjr8vgjw9xo/edit 15/16
25.
Mark only one oval.
Other:
70:30
80: 20
60:40
26.
Mark only one oval.
Other:
Less Than 5%
Less Than 10%
Less Than 15%
Less Than 20%
27.
This content is neither created nor endorsed by Google.
What is the preferred debt equity ratioDebt Capital : Equity Capital (D : E)
Please suggest an ideal interest rate for debt capitalRate of interest
Any other suggestion
Forms
6/1/2020 https://mail-attachment.googleusercontent.com/attachment/u/1/?ui=2&ik=5cb161c1a3&attid=0.2&permmsgid=msg-f:16682917826311795…
https://mail-attachment.googleusercontent.com/attachment/u/1/?ui=2&ik=5cb161c1a3&attid=0.2&permmsgid=msg-f:1668291782631179587&th=172… 1/97
Turnitin Originality Report
Dissertation by Sujit P
From Seminar Aparna (Seminar 2019)
Processed on 28-May-2020 2:11 PM ISTID: 1333302362Word Count: 72943
Similarity Index10%Similarity by Source
Internet Sources:4%
Publications:0%
Student Papers:6%
sources:1
4% match (student papers from 08-May-2015)
Submitted to University of Petroleum and Energy Studies on 2015-05-082
3% match (student papers from 23-Jul-2016)
Submitted to University of Petroleum and Energy Studies on 2016-07-233
3% match (Internet from 18-May-2014)
http://www.idfc.com/pdf/Compendium-of-EAB-Agenda-Notes-Vol-2.pdf4
2% match (Internet from 15-Apr-2018)
https://www.idfc.com/pdf/publications/Discussion-paper-on-Renewable-Energy.pdfpaper text:1REGULATORY FRAMEWORK FOR INVESTMENTS IN RENEWABLE ENERGY IN INDIA WITHSPECIAL REFERENCE TO THE ELECTRICITY ACT 2003: A CRITICAL ANALYSIS By SUJITH P.SURENDRAN 500016210 SCHOOL OF LAW 1SUBMITTED IN PARTIAL FULFILLMENT OF THEREQUIREMENT OF THE DEGREE OF DOCTOR OF PHILOSOPHY TO 1UNIVERSITY OF PETROLEUMAND ENERGY STUDIES DEHRADUN December, 2018 UNDER THE GUIDANCE OF PROFESSOR (DR.)TABREZ AHMAD DEAN SCHOOL OF LAW Dedicated to Shri Ghati Subrahmanya SwamiACKNOWLEDGEMENTS I am profoundly grateful for the constant support, motivation, understanding,guidance and encouragement by my guide Prof. (Dr.) Tabrez Ahmad. My research would have been impossiblewithout his guidance to sail through the difficult phases of the work, instilling confidence and strength to passeach stage of the research program. I also thank Dr. S.G. Sreejith, Prof. (Dr.) B. Venugopal and Dr. Rosewine
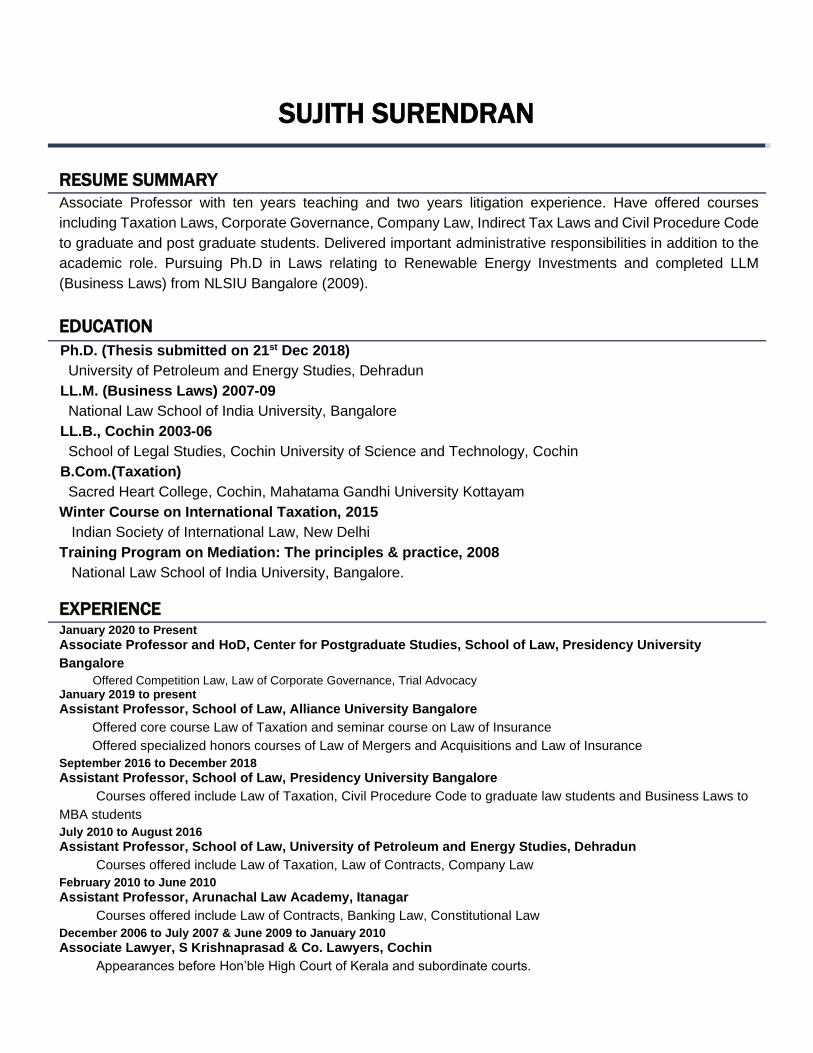
SUJITH SURENDRAN
RESUME SUMMARY
Associate Professor with ten years teaching and two years litigation experience. Have offered courses
including Taxation Laws, Corporate Governance, Company Law, Indirect Tax Laws and Civil Procedure Code
to graduate and post graduate students. Delivered important administrative responsibilities in addition to the
academic role. Pursuing Ph.D in Laws relating to Renewable Energy Investments and completed LLM
(Business Laws) from NLSIU Bangalore (2009).
EDUCATION
Ph.D. (Thesis submitted on 21st Dec 2018)
University of Petroleum and Energy Studies, Dehradun
LL.M. (Business Laws) 2007-09
National Law School of India University, Bangalore
LL.B., Cochin 2003-06
School of Legal Studies, Cochin University of Science and Technology, Cochin
B.Com.(Taxation)
Sacred Heart College, Cochin, Mahatama Gandhi University Kottayam
Winter Course on International Taxation, 2015
Indian Society of International Law, New Delhi
Training Program on Mediation: The principles & practice, 2008
National Law School of India University, Bangalore.
EXPERIENCE January 2020 to Present
Associate Professor and HoD, Center for Postgraduate Studies, School of Law, Presidency University
Bangalore
Offered Competition Law, Law of Corporate Governance, Trial Advocacy January 2019 to present
Assistant Professor, School of Law, Alliance University Bangalore
Offered core course Law of Taxation and seminar course on Law of Insurance
Offered specialized honors courses of Law of Mergers and Acquisitions and Law of Insurance
September 2016 to December 2018
Assistant Professor, School of Law, Presidency University Bangalore
Courses offered include Law of Taxation, Civil Procedure Code to graduate law students and Business Laws to
MBA students
July 2010 to August 2016
Assistant Professor, School of Law, University of Petroleum and Energy Studies, Dehradun
Courses offered include Law of Taxation, Law of Contracts, Company Law
February 2010 to June 2010
Assistant Professor, Arunachal Law Academy, Itanagar
Courses offered include Law of Contracts, Banking Law, Constitutional Law
December 2006 to July 2007 & June 2009 to January 2010
Associate Lawyer, S Krishnaprasad & Co. Lawyers, Cochin
Appearances before Hon’ble High Court of Kerala and subordinate courts.
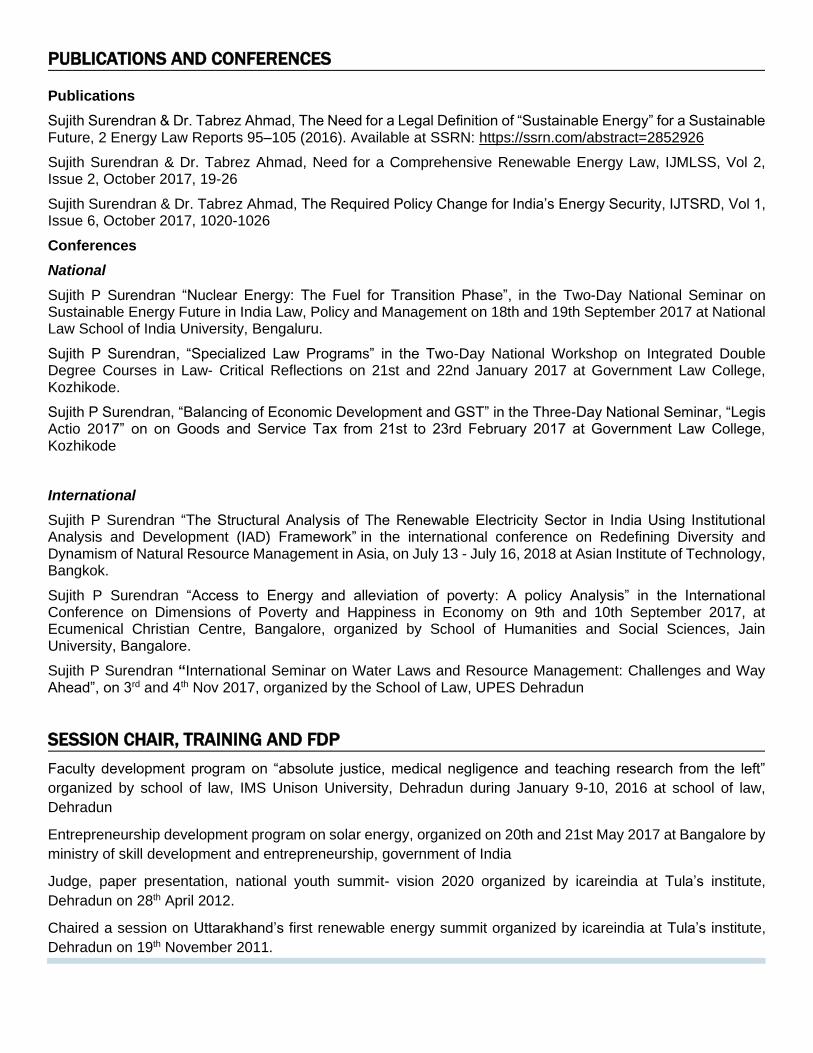
PUBLICATIONS AND CONFERENCES
Publications
Sujith Surendran & Dr. Tabrez Ahmad, The Need for a Legal Definition of “Sustainable Energy” for a Sustainable Future, 2 Energy Law Reports 95–105 (2016). Available at SSRN: https://ssrn.com/abstract=2852926
Sujith Surendran & Dr. Tabrez Ahmad, Need for a Comprehensive Renewable Energy Law, IJMLSS, Vol 2, Issue 2, October 2017, 19-26
Sujith Surendran & Dr. Tabrez Ahmad, The Required Policy Change for India’s Energy Security, IJTSRD, Vol 1, Issue 6, October 2017, 1020-1026
Conferences
National
Sujith P Surendran “Nuclear Energy: The Fuel for Transition Phase”, in the Two-Day National Seminar on Sustainable Energy Future in India Law, Policy and Management on 18th and 19th September 2017 at National Law School of India University, Bengaluru.
Sujith P Surendran, “Specialized Law Programs” in the Two-Day National Workshop on Integrated Double Degree Courses in Law- Critical Reflections on 21st and 22nd January 2017 at Government Law College, Kozhikode.
Sujith P Surendran, “Balancing of Economic Development and GST” in the Three-Day National Seminar, “Legis Actio 2017” on on Goods and Service Tax from 21st to 23rd February 2017 at Government Law College, Kozhikode
International
Sujith P Surendran “The Structural Analysis of The Renewable Electricity Sector in India Using Institutional Analysis and Development (IAD) Framework” in the international conference on Redefining Diversity and Dynamism of Natural Resource Management in Asia, on July 13 - July 16, 2018 at Asian Institute of Technology, Bangkok.
Sujith P Surendran “Access to Energy and alleviation of poverty: A policy Analysis” in the International Conference on Dimensions of Poverty and Happiness in Economy on 9th and 10th September 2017, at Ecumenical Christian Centre, Bangalore, organized by School of Humanities and Social Sciences, Jain University, Bangalore.
Sujith P Surendran “International Seminar on Water Laws and Resource Management: Challenges and Way Ahead”, on 3rd and 4th Nov 2017, organized by the School of Law, UPES Dehradun
SESSION CHAIR, TRAINING AND FDP
Faculty development program on “absolute justice, medical negligence and teaching research from the left”
organized by school of law, IMS Unison University, Dehradun during January 9-10, 2016 at school of law,
Dehradun
Entrepreneurship development program on solar energy, organized on 20th and 21st May 2017 at Bangalore by
ministry of skill development and entrepreneurship, government of India
Judge, paper presentation, national youth summit- vision 2020 organized by icareindia at Tula’s institute,
Dehradun on 28th April 2012.
Chaired a session on Uttarakhand’s first renewable energy summit organized by icareindia at Tula’s institute,
Dehradun on 19th November 2011.