Regulation of reactive oxygen species, DNA damage, and c-Myc function by peroxiredoxin 1
13
Regulation of reactive oxygen species, DNA damage, and c-Myc function by peroxiredoxin 1 Rachel A Egler 1 , Elaine Fernandes 1 , Kristi Rothermund 1 , Susan Sereika 2 , Nadja de Souza-Pinto 3 , Pawel Jaruga 4,5 , Miral Dizdaroglu 4 and Edward V Prochownik* ,1,6,7 1 Department of Pediatrics, Section of Hematology/Oncology, Children’s Hospital of Pittsburgh, Rangos Research Center, 3460 Fifth Ave., USA; 2 The University of Pittsburgh School of Nursing and Graduate School of Public Health, Pittsburgh, PA 15213, USA; 3 Laboratory of Molecular Gerontology, National Institutes of Health, Baltimore, MD 21224, USA; 4 Department of Chemical and Biochemical Engineering, University of Maryland, Baltimore County, Baltimore, MD 21250, USA; 5 Chemical Science and Technology Laboratory, National Institute of Standards and Technology, Gaithersburg, MD 20899, USA; 6 Department of Molecular Genetics and Biochemistry, The University of Pittsburgh Medical Center, Pittsburgh, PA 15213, USA; 7 The University of Pittsburgh Cancer Institute, Pittsburgh, PA 15213, USA Overexpression of c-Myc results in transformation and multiple other phenotypes, and is accompanied by the deregulation of a large number of target genes. We previously demonstrated that peroxiredoxin 1 (Prdx1), a scavenger of reactive oxygen species (ROS), interacts with a region of the c-Myc transcriptional regulatory domain that is essential for transformation. This results either in the suppression or enhancement of some c-Myc functions and in the altered expression of select target genes. Most notably, c-Myc-mediated transformation is inhibited, implying a tumor suppressor role for Prdx1. Consistent with this, prdx1/ mice develop age-dependent hemolytic anemias and/or malignancies. We now show that erythrocytes and embryonic fibroblasts from these animals contain higher levels of ROS, and that the latter cells show evidence of c-Myc activation, including the ability to be transformed by a ras oncogene alone. In contrast, other primary cells from prdx1/ mice do not have elevated ROS, but nonetheless show increased oxidative DNA damage. This apparent paradox can be explained by the fact that ROS localize primarily to the cytoplasm of prdx1 þ / þ cells, whereas in prdx1/ cells, much higher levels of nuclear ROS are seen. We suggest that increased DNA damage and tumor susceptibility in prdx1/ animals results from this shift in intracellular ROS. prdx1/ mice should be useful in studying the role of oxidative DNA damage in the causation of cancer and its prevention by antioxidants. They should also help in studying the relationship between oncogenes such as c-Myc and DNA damage. Oncogene (2005) 24, 8038–8050. doi:10.1038/sj.onc.1208821; published online 19 September 2005 Keywords: peroxiredoxin 1; c-Myc; c-Abl; reactive oxygen species; DNA damage; Ras; Omnibank s Introduction Deregulation of the C-MYC oncogene, which encodes a general transcription factor of the basic-helix-loop- helix-leucine zipper family, is among the most com- monly encountered molecular aberrations in human cancer. A variety of mechanisms account for the loss of C-MYC control (Nesbit et al., 1999; www.myc-cancer- gene.org). For example, C-MYC overexpression in Burkitt’s lymphoma is invariably due to chromosomal translocations involving the C-MYC locus on chromo- some 8q24 and immunoglobulin genes located on chromosomes 2, 14, or 22 (Boxer and Dang, 2001). In prostate and breast cancers, a significant fraction of tumors demonstrate amplification of an otherwise unrearranged C-MYC locus (Pietilainen et al., 1995; Bubendorf et al., 1999; Sato et al., 1999; Naidu et al., 2002). In contrast, the c-Myc mRNA and protein overexpression that is observed in 70–80% of colon carcinomas (Smith and Goh, 1996) results from aberrant transcriptional control of the C-MYC locus involving mutations in APC-b-catenin-TCF-4 pathway members (Barker et al., 2000). Apart from its role in tumorigenesis, the proper regulation of C-MYC gene transcription and c-Myc function is important for a variety of normal processes, including cell cycle progression, differentiation, maintenance of cell size, and regulation of programmed cell death (Coppola and Cole, 1986; Prochownik and Kukowska, 1986; Stern et al., 1986; Prochownik et al., 1988; Henriksson and Luscher, 1996; Johnston et al., 1999; Li and Dang, 1999; Prendergast, 1999; Yin et al., 1999, 2001; Fest et al., 2002; Iritani et al., 2002; Obaya et al., 2002; Schorl and Sedivy, 2003; Maines et al., 2004). The ability to influence such a broad spectrum of normal functions, and to promote transformation when deregulated, is a consequence of c-Myc’s role as a general bHLH-ZIP transcription factor, whose target genes, both positive and negative, currently number well over 1000 (Fernandez et al., 2003; Levens, 2003; Li et al., 2003). Positive regulation Received 9 December 2004; revised 27 April 2005; accepted 27 April 2005; published online 19 September 2005 *Correspondence: EV Prochownik, Section of Hematology/Oncology, Children’s Hospital of Pittsburgh, Rangos Research Center, Room 2100, 3460 Fifth Ave., Pittsburgh, PA 15213, USA; E-mail: [email protected] Oncogene (2005) 24, 8038–8050 & 2005 Nature Publishing Group All rights reserved 0950-9232/05 $30.00 www.nature.com/onc
-
Upload
independent -
Category
Documents
-
view
6 -
download
0
Transcript of Regulation of reactive oxygen species, DNA damage, and c-Myc function by peroxiredoxin 1

Regulation of reactive oxygen species, DNA damage, and c-Myc function
by peroxiredoxin 1
Rachel A Egler1, Elaine Fernandes1, Kristi Rothermund1, Susan Sereika2, Nadja de Souza-Pinto3,Pawel Jaruga4,5, Miral Dizdaroglu4 and Edward V Prochownik*,1,6,7
1Department of Pediatrics, Section of Hematology/Oncology, Children’s Hospital of Pittsburgh, Rangos Research Center, 3460 FifthAve., USA; 2The University of Pittsburgh School of Nursing and Graduate School of Public Health, Pittsburgh, PA 15213, USA;3Laboratory of Molecular Gerontology, National Institutes of Health, Baltimore, MD 21224, USA; 4Department of Chemical andBiochemical Engineering, University of Maryland, Baltimore County, Baltimore, MD 21250, USA; 5Chemical Science andTechnology Laboratory, National Institute of Standards and Technology, Gaithersburg, MD 20899, USA; 6Department of MolecularGenetics and Biochemistry, The University of Pittsburgh Medical Center, Pittsburgh, PA 15213, USA; 7The University of PittsburghCancer Institute, Pittsburgh, PA 15213, USA
Overexpression of c-Myc results in transformation andmultiple other phenotypes, and is accompanied by thederegulation of a large number of target genes. Wepreviously demonstrated that peroxiredoxin 1 (Prdx1), ascavenger of reactive oxygen species (ROS), interacts witha region of the c-Myc transcriptional regulatory domainthat is essential for transformation. This results either in thesuppression or enhancement of some c-Myc functions and inthe altered expression of select target genes. Most notably,c-Myc-mediated transformation is inhibited, implying atumor suppressor role for Prdx1. Consistent with this,prdx1�/� mice develop age-dependent hemolytic anemiasand/or malignancies. We now show that erythrocytes andembryonic fibroblasts from these animals contain higherlevels of ROS, and that the latter cells show evidence ofc-Myc activation, including the ability to be transformed bya ras oncogene alone. In contrast, other primary cells fromprdx1�/� mice do not have elevated ROS, but nonethelessshow increased oxidative DNA damage. This apparentparadox can be explained by the fact that ROS localizeprimarily to the cytoplasm of prdx1þ /þ cells, whereas inprdx1�/� cells, much higher levels of nuclear ROS areseen. We suggest that increased DNA damage and tumorsusceptibility in prdx1�/� animals results from this shift inintracellular ROS. prdx1�/� mice should be useful instudying the role of oxidative DNA damage in the causationof cancer and its prevention by antioxidants. They shouldalso help in studying the relationship between oncogenessuch as c-Myc and DNA damage.Oncogene (2005) 24, 8038–8050. doi:10.1038/sj.onc.1208821;published online 19 September 2005
Keywords: peroxiredoxin 1; c-Myc; c-Abl; reactiveoxygen species; DNA damage; Ras; Omnibanks
Introduction
Deregulation of the C-MYC oncogene, which encodes ageneral transcription factor of the basic-helix-loop-helix-leucine zipper family, is among the most com-monly encountered molecular aberrations in humancancer. A variety of mechanisms account for the loss ofC-MYC control (Nesbit et al., 1999; www.myc-cancer-gene.org). For example, C-MYC overexpression inBurkitt’s lymphoma is invariably due to chromosomaltranslocations involving the C-MYC locus on chromo-some 8q24 and immunoglobulin genes located onchromosomes 2, 14, or 22 (Boxer and Dang, 2001). Inprostate and breast cancers, a significant fraction oftumors demonstrate amplification of an otherwiseunrearranged C-MYC locus (Pietilainen et al., 1995;Bubendorf et al., 1999; Sato et al., 1999; Naidu et al.,2002). In contrast, the c-Myc mRNA and proteinoverexpression that is observed in 70–80% of coloncarcinomas (Smith and Goh, 1996) results fromaberrant transcriptional control of the C-MYC locusinvolving mutations in APC-b-catenin-TCF-4 pathwaymembers (Barker et al., 2000).Apart from its role in tumorigenesis, the proper
regulation of C-MYC gene transcription and c-Mycfunction is important for a variety of normal processes,including cell cycle progression, differentiation,maintenance of cell size, and regulation of programmedcell death (Coppola and Cole, 1986; Prochownikand Kukowska, 1986; Stern et al., 1986; Prochowniket al., 1988; Henriksson and Luscher, 1996; Johnstonet al., 1999; Li and Dang, 1999; Prendergast, 1999;Yin et al., 1999, 2001; Fest et al., 2002; Iritani et al.,2002; Obaya et al., 2002; Schorl and Sedivy, 2003;Maines et al., 2004). The ability to influence such abroad spectrum of normal functions, and to promotetransformation when deregulated, is a consequence ofc-Myc’s role as a general bHLH-ZIP transcriptionfactor, whose target genes, both positive and negative,currently number well over 1000 (Fernandez et al., 2003;Levens, 2003; Li et al., 2003). Positive regulation
Received 9 December 2004; revised 27 April 2005; accepted 27 April2005; published online 19 September 2005
*Correspondence: EV Prochownik, Section of Hematology/Oncology,Children’s Hospital of Pittsburgh, Rangos Research Center, Room2100, 3460 Fifth Ave., Pittsburgh, PA 15213, USA;E-mail: [email protected]
Oncogene (2005) 24, 8038–8050& 2005 Nature Publishing Group All rights reserved 0950-9232/05 $30.00
www.nature.com/onc

involves the initial binding of c-Myc, in association withits obligate heterodimeric bHLH-ZIP partner proteinMax, to consensus binding sites (E-boxes) generallylocated within 1–2 kb of the transcription initiation site(Grandori et al., 2000; Fernandez et al., 2003; Levens,2003). This is then followed by the activation of thebound gene, which is mediated by a transcriptionalregulatory domain (TRD) of c-Myc in association witha number of ancillary transcription and chromatinremodeling cofactors (Grandori et al., 2000; Eisenman,2000-1). Negative regulation by c-Myc is more diversebut in at least some cases appears to involve c-Myc’sassociation with and inhibition of positive transcriptionfactors such as Miz-1 (Staller et al., 2001; Oster et al.,2003; Wanzel et al., 2003). All known biologicalactivities of c-Myc require the intactness of its bHLH-ZIP dimerization domain and the TRD (Evan et al.,1994; Xiao et al., 1998; Luscher and Larsson, 1999;Oster et al., 2003).The functional dissection of c-Myc’s TRD and the
proteins with which it interacts have been the subject ofintense study (reviewed in Oster et al., 2002). Severalreports have confirmed that a small segment of theTRD, comprised of amino acids 135–150, and termedMyc Box II (MBII), is required for transformation (Liet al., 1994; McMahon et al., 1998). A number ofproteins that interact with the TRD and with MBII, andthat reduce or enhance c-Myc’s transcriptional activityand/or biological function, have been described (Osteret al., 2002).Peroxiredoxin 1 (Prdx1), also known as pag (‘pro-
liferation-associated gene’) or MSP23 (Ishii et al., 1993;Prosperi et al., 1993), is a ubiquitously expressed andhighly conserved member of a family of antioxidantproteins that utilize thioredoxin as an electron donor(Hofmann et al., 2002; Wood et al., 2003). In addition tobeing induced by reactive oxygen species (ROS), PrdxI isalso induced by serum stimulation and by RASoncogene transformation (Prosperi et al., 1993). Byscavenging H2O2 and other ROS, Prdx1 protects cellsfrom oxidant-mediated damage to cellular DNA, lipidsand proteins, and from the potentially carcinogenicconsequences of the former (Toyokuni, 1999; Mu et al.,2002). By virtue of its role in maintaining the redox statein vivo, Prdx1 and other members of the Prdx family,may also serve to regulate normal growth factorsignaling pathways (Rhee et al., 2003).We have previously shown that Prdx1 interacts
specifically with MBII and alters key aspects of c-Myc’sfunction (Mu et al., 2002). This most likely occurs as theresult of a selective ability to modulate c-Myc’stranscriptional activity. However, the functional con-sequences of this interaction are complex. On the onehand, Prdx1 overexpression can mimic certain proper-ties of c-Myc such as the ability to increase the overallmass and size of some cells (Mu et al., 2002). On theother hand, Prdx1 overexpression substantially reducesthe in vitro clonogenic growth and in vivo tumorigeniccapacity of c-Myc-transformed fibroblasts. This latterproperty, together with the previously described abilityof Prdx1 to inhibit the tyrosine kinase activity of the
c-Abl oncoprotein (Wen and Van Etten, 1997), led us topostulate that Prdx1 might represent a new class oftumor suppressors (Mu et al., 2002). Although theinteraction between MBII and Prdx1 has been demon-strated in vivo, it remains unclear as to whether Prdx1’seffects on c-Myc function are the direct result of itsinteraction with MBII.A mouse strain lacking Prdx1 has recently been
described (Neumann et al., 2003). These animals,although viable and fertile, develop a variety of age-related cancers and/or Heinz body-positive hemolyticanemia. The latter is associated with an increase inerythrocyte ROS, and a high level of oxidized, unstablehemoglobin, which probably contributes to a shortenedred cell lifespan. Taken together, these results areconsistent with the notion that, by scavenging ROS,Prdx1 limits oxidative damage to various macromole-cules.We have independently developed a mouse strain
lacking Prdx1 as a result of retroviral-mediated muta-tional inactivation. We now report that primaryembryonic fibroblasts from these animals contain higherlevels of ROS and show evidence of c-Myc deregulation.This includes changes in growth rate, cell size, suscept-ibility to RAS oncogene-mediated transformation, andalterations in c-Myc target gene expression. Otherprimary tissues from prdx1�/� mice contain signifi-cantly higher levels of oxidatively damaged DNA asdetermined by liquid chromatography/mass spectro-scopy (LC/MS) and gas chromatography/mass spectro-scopy (GC/MS). Although the total levels of ROS arenot altered in most tissues from prdx1�/� mice, they doshow dramatic shifts in their subcellular localization,which might account for the greater degree of DNAdamage. Taken together, these results provide evidencefor a global increase in oxidative DNA damage intissues from prdx1�/� mice due to abnormal localiza-tion of ROS.
Results
Derivation of prdx1�/� mice
Derivation of prdx1 gene ‘knockout’ mice was per-formed in collaboration with Lexicon Genetics Incor-porated. This approach capitalized on the well-knowntendency of murine retroviruses to integrate at diversesites in the genome, resulting, in some cases, ininsertional inactivation of genes (Robertson et al.,1986; Mikkers and Berns, 2003). Sequencing of thegenomic regions flanking several thousand viral integra-tion sites from independently infected clones revealedthat the prdx1 locus had been targeted on severaloccasions (not shown). One such banked ES clone wastherefore used to generate mice heterozygous for thisinsertion. Figure 1 shows the structure of the murineprdx1 gene, the site of integration of the mutagenicretrovirus, the strategy used to identify the threepossible genotypes, results of genetic analyses of onegroup of mice, and Northern and western blots of Prdx1
Regulation of ROS and c-Myc function by Prdx1RA Egler et al
8039
Oncogene
expression. These results showed perfect correlationbetween genotypes and Prdx1 mRNA and proteinexpression, and confirmed that prdx1�/� andprdx1þ /� mice were viable and fertile.
Characterization of primary embryo fibroblasts fromprdx1�/� mice
Primary embryo fibroblasts murine embryonic fibro-blasts (MEFs), derived from E10.5 prdx1þ /þ or �/�embryos, were studied between passages 2 and 5. Asshown in Figure 2a, prdx1�/� cells grew at asignificantly slower rate than did their prdxþ /þcounterparts. However, cells of both genotypes showedidentical cell cycle profiles (Figure 2b) as well as low andindistinguishable rates of apoptosis (o10% in all cases)as determined by TUNEL and trypan blue exclusionassays and by quantification of subdiploid DNA contentby flow cytometry (not shown). Additional studiesperformed with cells synchronized in Go by density
arrest showed that, upon replating at low density,prdx1�/� cells traversed all phases of the subsequentcell cycle with a lag of 3–5h compared to their prdx1þ /þcounterparts (not shown). Taken together, these resultsindicate that the slower growth rate of prdx1�/� cellswas not attributable to a block of cell cycle progressionat any specific point or to intrinsic differences in basalapoptotic rates.We have previously shown that, like c-Myc,
Prdx1 overexpression can increase the size of certainestablished cell types (Mu et al., 2002). If this heldtrue for MEFs, then prdx1�/� cells would be predictedto be smaller than prdx1þ /þ cells. To examine this,we determined the average cellular diameters of thetwo MEF populations. As seen in Figure 2c,prdx1�/� MEFs were indeed significantly smaller thanprdx1þ /þ cells. When the diameters of the twopopulations were used to calculate volumes, prdx1�/�cells were, on average, nearly 40% smaller thanprdx1þ /þ cells.
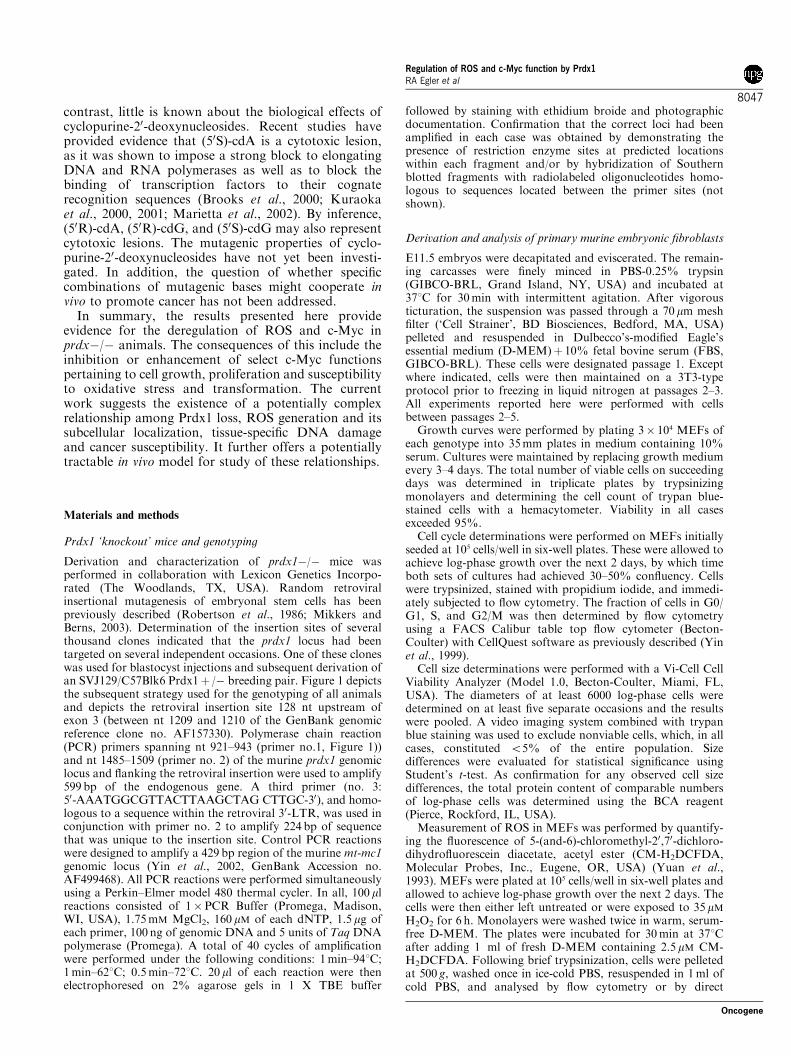
Figure 1 Characterization of prdx1�/� mice. (a) Retroviral insertion site and genotyping strategy (not to scale). Dark boxes indicatemurine prdx exons. The stippled box depicts the mutagenic retroviral vector with its insertion site 128 nt upstream of exon 3 (betweennt 1209 and 1210 of the GenBank genomic reference clone no. AF157330). Numbered arrows indicate the three PCR primers used forgenotyping. (b) Genotyping of an eight-pup litter from prdx1þ /� parents. The first panel depicts the amplification products of theendogenous prdx1 locus, using PCR primers 1 and 2 (Endog. Prdx1). The second panel depicts the amplification products of theretrovirally targeted prdx1 locus using PCR primers 2 and 3 (LTR-Prdx1). Note that lanes 5 and 8 show the presence of Endog-Prdx1products only, indicating prdx1þ /þ animals. Lane 6 shows an absence of the Endog-Prdx1 product and the presence of an LTR-Prdx1 product, thus indicating a prdx1�/� genotype. Lanes 1–4 and 7 show the presence of both PCR products, indicating prdx1þ /�animals. Lane 9 served as a control lane for each PCR reaction with no added genomic DNA. (c) Northern analyses of liver RNAsfrom each of the three genotypes shown in (a). A membrane containing 5mg of total liver RNA was hybridized with a Prdx1 codingregion probe (upper panel). The lower panel shows the ethidum bromide-stained membrane prior to hybridization. (d) Westernanalyses of total protein from livers of mice of the indicated genotypes. In all, 25 mg of total protein was subjected to SDS–PAGE andtransfer. The membrane was probed with a rabbit polyclonal antibody raised against murine Prdx1 (left-most panel), or an anti-actinmonoclonal antibody as a control for protein loading (right-most panel)
Regulation of ROS and c-Myc function by Prdx1RA Egler et al
8040
Oncogene

The increased cell volume that accompanies Prdx1overexpression also results in an increase in total proteincontent (Mu et al., 2002). Therefore, to confirm theabove results, the total protein content from comparablenumbers of prdx1þ /þ and prdx1�/� cells wasdetermined. As seen in Figure 2d, the latter cellscontained, on average, 62% of the protein of prdx1þ /þ
cells, which is in excellent agreement with the previouslydescribed cell volume determinationsWe next measured the levels of ROS in logarithmi-
cally growing MEFs, either under basal conditions orfollowing a 6 h challenge with a sublethal dose (35 mM)of H2O2. ROS were quantified by measuring the amountof intracellular CM-H2DCFDA that is cleaved by
Figure 2 Characterization of MEFs. (a) Growth rates of prdx1þ /þ and prdx1�/� MEFs. Cultures at passage 2–3 were seeded intriplicate into 35mm wells on day 0. Growth medium was changed every 3–4 days. At the indicated times, cells were trypsinized and thetotal number of viable cells per plate was determined. Asterisks indicate significant differences between prdx1þ /þ and prdx1�/� cellnumbers (Po0.05). TUNEL assays showed no differences in the rates of apoptotic death, which in both cases were o10% (notshown). (b) Cell cycle profiles of prdx1þ /þ and prdx1�/� cells. Logarithmically growing MEFs were stained with propidium iodide,and the fraction of cells in G0/G1, S, and G2/M was determined by flow cytometry as previously described (Yin et al., 1999). Theresults shown depict the averages of six determinations for each genotype. Standard errors in all cases were o2%. (c) Sizedeterminations of MEFs. The sizes of logarithmically growing MEFs of each of the indicated genotypes were determined using aVi-Cell Cell Viability Analyzer. prdx1�/� cells were smaller than prdx1þ /þ cells by a highly significant margin (Po10�4). (d)Relative protein content of prdxþ /þ and prdx�/� MEFs. Triplicate aliquots of 3� 106 cells of each genotype were washed threetimes in PBS, followed by sonication and boiling in PBSþ 0.1% SDS. Total protein content was determined using the BCA reagent aspreviously described (Mu et al., 2002). (e) ROS levels in MEFs. Uptake of CM-H2DCFDA was determined in logarithmically growingMEFs, either untreated or following exposure to 35 mM H2O2 for 30min. The results shown represent the average of triplicatedeterminations 7 1s.e. All results are compared relative to untreated prdx1þ /� MEFs whose ROS levels were arbitrarily set at 1
Regulation of ROS and c-Myc function by Prdx1RA Egler et al
8041
Oncogene

intracellular esterases and rendered fluorescent underoxidizing conditions (Yuan et al., 1993). As seen inFigure 2e, untreated prdx1þ /þ cells contained lowlevels of ROS, which increased dramatically followingexposure to H2O2. In contrast, prdx1�/� cells did notshow a significant increase in ROS, possibly owing tothe fact that basal levels were already very high. Thissuggests that there is an upper limit to ROS levels thatcan be generated in Prdx1’s absence.
Susceptibility of prdx1�/� MEFs to ras transformation
We have previously shown that Prdx1 overexpressionsignificantly reduces the in vitro clonogenic growth andin vivo tumorigenicity of c-Myc-transformed fibroblasts(Mu et al., 2002). We proposed that this results fromPrdx1’s interaction with the MBII region of c-Myc’sTRD. These results, together with more recent studies(Neumann et al., 2003), indicated that Prdx1 mightfunction as a tumor suppressor. This further suggestedthat a consequence of Prdx1 loss in primary cells mightbe the functional deregulation of endogenous c-Mycprotein.Primary embryonic fibroblasts are generally resistant
to transformation with individual c-Myc or ras onco-genes but can be readily transformed when the two arecoexpressed (Parada et al., 1985; Land et al., 1986). Wetherefore reasoned that if c-Myc were indeed deregu-lated in prdx1�/� MEFs, they might be susceptible totransformation by a Ras oncogene alone. Monolayercultures of prdx1þ /þ and prdx1�/� MEFs weretherefore infected with a retroviral vector encodingmutant v-Ha-ras oncogene, together with a 1 : 1 mix of acontrol vector encoding GFP that had been packaged inparallel. The latter vector served as a direct visual meansof comparing the infection efficiencies of the two celltypes. As seen in Figure 3a and b, endogenous c-MycRNA and protein were expressed at equivalent levels inboth prdx1þ /þ and prdx1�/� cells. However, thelatter were easily transformed following infection with aretrovirus encoding a mutant (G12V) v-Ha-ras onco-gene (Figure 3c–e). In contrast, prdx1þ /þ cells wereresistant to v-H-ras transformation, despite the fact thatthey were infected approximately 2–3 times moreefficiently than prdx1�/� cells based on GFP fluores-cence (not shown). In other experiments, we have shownthat these ras expressing cells form anchorage-indepen-dent colonies in soft agar, although with only about10% the efficiency with which they form adherent foci(not shown). Taken together, these results are consistentwith our previous suggestion that Prdx1 loss results in aderegulation of c-Myc function without altering itslevels (Mu et al., 2002).The interaction between the MBII domain of
c-Myc and Prdx1 can lead to the altered expressionof some, but not all, c-Myc target genes (Mu et al.,2002). To determine whether this was also true in MEFs,we compared the gene expression profiles of severalpreviously described c-Myc targets in prdx1þ /þ andprdx1�/� MEFs by Northern blotting. As seen inFigure 3f, differences in the transcript levels of several of
these genes were indeed identified. In particular,prdx1�/� cells showed lower levels of expression ofthe positive c-Myc targets cyclin B1, Id2, ODC, andHMG-IY (Yin et al., 2001; Lasorella et al., 2000; Woodet al., 2000), whereas they showed higher levels ofexpression of the negative target gadd45 (Marhin et al.,1997). A second negative target, Gas1 (Lee et al., 1997),was expressed at higher levels in wild-type than inprdx1�/� cells. Finally, two additional positive targets,LDH-A and a1-prothymosin (Eilers et al., 1991; Shimet al., 1997), showed no differences in expressionbetween the two cell lines. These results lend furthersupport to the idea that Prdx1 deficiency is associatedwith the deregulation of c-Myc, leading to a failure toproperly regulate a subset of its target genes.
Prdx1 controls ROS levels in some tissues
The finding that prdx1�/� MEFs contain higher levelsof ROS (Figure 2e) is consistent with the notion thatPrdx1 protects against oxidative stress. However,because these cells had been maintained in a highlyoxidative in vitro environment (Parrinello et al., 2003), itwas not clear whether these finding necessarily reflectedthe true in vivo state of all tissues. In order to explorethis in more depth, we measured ROS levels in severaladditional tissues, including erythrocytes, splenocytes,and hepatocytes. The former were chosen because of thedocumented hemolytic anemias that develop in someprdx1�/� animals beginning at approximately 9 monthsof age, whereas splenocytes and hepatocytes wereexamined because of the high incidence of lymphomasand hepatocellular carcinomas (Neumann et al., 2003).ROS determinations were performed on erythrocytesobtained by peripheral venous sampling from age-matched, nonanemic animals. That nonanemic animalswere used was a particularly important consideration, aselevated ROS levels in anemic animals could be asecondary consequence of membrane damage and thusmight not provide an accurate assessment of the role ofPrdx1. For ROS determinations in hepatocytes and spleno-cytes, animals were also age-matched (1.5–7months),and showed no evidence of neoplasms. As seen inFigure 4, basal levels of ROS were 27% higher inerythrocytes from prdx1�/� animals (Po0.001),whereas no significant differences were observed ineither splenocytes or hepatocytes. Interestingly, therelative ROS increase in prdx1�/� erythrocytes wasrelatively constant and age-independent, indicating thatfactors other than Prdx1 loss contribute to the onset ofhemolytic anemia.
DNA damage in prdx1�/� mice
High levels of ROS are associated with increasedintracellular oxidation of lipids, proteins, and nucleicacids. If not repaired, oxidatively modified DNA basescan generate heritable and cancer predisposing muta-tions (reviewed in Marnett et al., 2003). The highincidence of neoplasms in prdx1�/� mice (Neumannet al., 2003) is consistent with the idea that the tumors
Regulation of ROS and c-Myc function by Prdx1RA Egler et al
8042
Oncogene

arise as a consequence of lifelong oxidative assault uponthe genome with the final outcome reflecting the balancebetween DNA damage and its repair. Similarly, thedevelopment of Heinz body-positive hemolytic anemiasis consistent with the idea that high levels of ROS inerythrocytes lead to oxidation and precipitation ofhemoglobin, membrane damage, and premature de-struction of the cell.We used both LC/MS and GC/MS to measure the
levels of oxidatively modified DNA nucleosides in threedifferent tissues from prdx1þ /þ and prdx1�/� mice.As discussed in the previous section, the spleen and liverwere chosen because of the high incidence of tumorsarising from these organs, whereas brain was selected
because central nervous system malignancies are rarely,if ever, encountered (Neumann et al., 2003). In all cases,we evaluated the same animals as used for the previouslydescribed ROS determinations. For each data point,tissues from three different animals were used. Figure 5shows the average levels of modified DNA nucleosidesfrom these two groups of animals. From these analyses,as well as from the data shown in Figure 4, severalpoints are apparent. First, each prdx1�/� tissuedemonstrated a signature DNA damage profile. Forexample, we found twice as much 8-OH-dG in liverDNA samples than in spleen samples, whereas twice asmuch (50S)-dG was observed in spleen DNAs than inliver DNAs. Second, although we were unable to
Figure 3 Prdx1 loss leads to functional deregulation of c-Myc. (a) c-Myc transcript and protein levels. (b) In prdx1þ /þ and prdx1�/�MEFs. As controls for RNA and protein loading, Northern blots were also hybridized with a probe for GAPDH and Western blotswere probed with a monoclonal antibody for actin. (c) Infection of prdx1�/� MEFs with a v-H-ras-encoding retrovirus leads totransformation. The indicated MEF strains were infected with a v-H-ras-encoding retrovirus or a control retrovirus loacking ras.After12–14 days, transformed colonies were stained with methylene blue and counted. The results shown here represent the results oftriplicate experiments. (d) Appearance of methylene blue-stained plates at days 12–14. (e) Microscopic appearance of monolayercultures of the cell lines shown in (d). (f) Northern analyses of RNAs from prdx1þ /þ and prdx1�/� MEFs. Total RNAs wereextracted from MEFs that had been grown in parallel under identical conditions. 5mg of each sample was then used in Northern blotanalyses using coding region probes for the indicated c-Myc target genes. Hybridization with a probe for GAPDH was used as acontrol for RNA loading. The numbers adjacent to each blot represent the relative level of expression of that transcript followingnormalization to the GAPDH control
Regulation of ROS and c-Myc function by Prdx1RA Egler et al
8043
Oncogene

demonstrate significant differences in ROS levels be-tween the two groups of animals (excluding erythrocytesand MEFs), the levels of specific modified DNAnucleosides were often significantly higher in prdx1�/�animals than in prdx1þ /þ animals although again,these differences were both DNA base- and tissue-specific. Third, no single modified DNA nucleoside wasnecessarily predictive of the levels of the other five.Finally, even though central nervous system tumors arerare in prdx1�/� mice (Neumann et al., 2003),substantially higher levels of modified nucleoside baseswere nonetheless detected in their brain DNAs. Fromthese studies, we conclude that Prdx1 loss results in asignificant accumulation of oxidatively modified DNAnucleosides in genomic DNA of at least three differenttissues of prdx1�/� mice. They also indicate that thereexist tissue-specific differences in the generation and/orrepair of each type of lesion and that tumor susceptibiltydoes not simply reflect overall levels of DNA damage.Loss of Prdx1 might compromise the integrity of
DNA repair, either through c-Myc or c-Abl-dependentpathways or through pathways which were independentof these oncoproteins (Shaul, 2000; Hironaka et al.,2003; Karlsson et al., 2003). This might explain whyprdx1�/� tissues demonstrate higher levels of DNAdamage in the absence of elevated ROS. 8-OH-dG (andpossibly 8-OH-dA) is repaired by base-excision (BE)(reviewed in Cooke et al., 2003), whereas (50S)-cdA isrepaired by nucleotide excision (NE) (Brooks et al.,2000; Kuraoka et al., 2000). Other cyclopurine-20-deoxynucleosides such as (50R)-cdA, (50R)-cdG, and(50S)-cdG are also likely to be processed by NE becauseof a covalent bond between the sugar and base moietiesof the same nucleoside, thus excluding repair by BE(Dizdaroglu, 1986). However, we have found equivalentactivities of uracil DNA glycosylase, oxoguanine DNA
glycosylase, and endonuclease III homologue I inprdx1þ /þ and prdx1�/� liver and kidney extracts(data not shown) (de Souza-Pinto et al., 2001; Karahalilet al., 2003). These findings therefore do not account forthe higher levels of DNA damage in prdx1�/� mice.
Subcellular re-distribution of ROS in prdx�/� tissues
The foregoing results presented an apparent paradox;namely, how could prdx1�/� tissues contain higherlevels of damaged DNA yet demonstrate no differencesin either ROS levels or DNA repair? One possibleexplanation was that prdx1�/� tissues might differ intheir subcellular distribution of ROS. Thus, higher levelsof ROS in prdx1�/� nuclei might generate more DNAdamage even though total cellular ROS levels wereequivalent to those in prdx1þ /þ cells. To examine thisdirectly, logarithmically growing MEFs, or single-cellsuspensions from the lung, kidney, and liver wereincubated briefly with CM-H2DCFDA, fixed withparaformaldehyde, and examined by fluorescence mi-croscopy. As seen in Figure 6, prdx1þ /þ cells showeda diffuse and largely cytoplasmic pattern of activatedCM-H2DCFDA whereas prdx1�/� cells showed muchmore intense nuclear staining. These differences weremost striking in MEFs in which there was almost acomplete shift of ROS from the cytoplasm to thenucleus. In cells derived from the lung, kidney, and liverof prdx1�/� mice, ROS were also significantly re-localized to the nucleus, although not as strikingly as inthe case of MEFs. These findings indicate that Prdx1loss results in significant shifts in the subcellularlocalization of ROS (Figure 6).
Discussion
In mammals, the Prdxs comprise a highly conservedfamily of six proteins. Prdxs1–5 utilize thioredoxin as anelectron donor to reduce H2O2, which may be producedas a result of oxidative stress, carcinogens, environ-mental toxin exposure, or normal growth factor signal-ing (Kang et al., 1998). Significant functionalredundancy exists within this family whose membersmay also regulate cellular growth, differentiation,apoptosis, and transformation (Szatrowski and Nathan,1991; Pentland et al., 1992; Nakahara et al., 1998;Esposito et al., 1999). More recently, an unanticipatedand novel function for yeast Prdx1 and Prdx2 inresponse to ROS has been described, which involvesthe formation of high molecular weight toroidalstructures by these proteins, which then function asmolecular chaperones (Jang et al., 2004).The cancer-prone phenotype of prdx1�/� mice is
distinctly different from those of knockouts of othergenes involved in maintaining the redox state. Theselatter animals are either susceptible to cancer only uponexposure to exogenous carcinogens or are not tumorprone at all (Henderson et al., 1998; Ramos-Gomezet al., 2001; Lee et al., 2003). The idea that Prdx1 alsoplays a central role in integrating potentially harmful,
Figure 4 ROS in primary tissues of prdx1þ /þ and prdx1�/�mice. Animals of the indicated genotypes were killed in parallel andsingle-cell suspensions from the indicated organs were prepared asdescribed in ‘Materials and methods’. Flow cytometry was used todetermine the relative basal levels of ROS following incubationwith CM-H2DCFDA. In the case of erythrocytes, the values are theaverages of 29 prdx1þ /þ and 32 prdx1�/� animals, all of whichwere nonanemic and age-matched (1.5–18months). In the case ofhepatocyes and splenocytes, the values are the averages of fiveanimals/group. Standard error bars and significant P-values, asdetermined by Student’s t-test are indicated
Regulation of ROS and c-Myc function by Prdx1RA Egler et al
8044
Oncogene

but critically important, proliferative signals is sup-ported by the observation that it can interact with andmodulate the activities of two key cellular oncoproteins,c-Abl and c-Myc (Wen and Van Etten, 1997; Mu et al.,2002).Our prior observation that Prdx1 overexpression
could mimic the growth-promoting activity of c-Mycwhile simultaneously inhibiting its transforming poten-tial (Mu et al., 2002) is independently confirmed in thecurrent work. The finding that prdx1�/� MEFs aresusceptible to ras transformation, despite possessingunaltered levels of c-Myc RNA and protein (Figure 3a–c)is consistent with our previous proposal that some,although not necessarily all, c-Myc functions aremodulated by Prdx1 (Mu et al., 2002). One suchfunction is that of transformation, which can be inducedin prdx1�/� MEFs via the action of an activated rasoncogene alone. In addition to producing foci under low
serum conditions (Figure 3d), these cells can also formanchorage-independent colonies in soft agar, albeit witha 90% reduced efficiency compared to focus formation(not shown). This suggests that the massive c-Mycderegulation that is necessary to achieve efficientanchorage-independent growth (Land et al., 1986) hasnot been achieved in prdx1�/� cells, which expressnormal levels of c-Myc mRNA and protein (Figure 3aand b). Selective alteration of c-Myc function and targetgene regulation has subsequently been described forother proteins that bind to specific subregions of the c-Myc transcriptional regulatory domain including MBII(Nikiforov et al., 2002; Qi et al., 2004). Similarly, thesmaller size, reduced growth rate, and altered expressionof a subset of c-Myc target genes in prdx1�/� MEFs(Figures 2 and 3) is also consistent with the idea thatPrdx1 controls some c-Myc functions. These findingsprovide reason to question whether the tumor-prone
6
5
4
3
2
1
0Brain
WTp<0.04
p<0.02
p<0.02
p=0.0001
p=0.03
p=0.001
p<0.03
p<0.02
p<0.01
p<0.001
p<0.01
p<0.01 p<0.004
p<0.004
KO
Liver Spleen Brain Liver Spleen
Brain Liver Spleen Brain Liver Spleen
Brain Liver Spleen Brain Liver Spleen
8-OH-dG
(5'R)-cdA (5'S)-cdA
(5'R)-cdG (5'S)-cdG
8-OH-dA
0.8
0.6
0.4
0.4
0.3
0.2
0.1
0
0.2
0
0.06
0.04
0.02
0
1.0
0.8
0.6
0.4
0.2
0
4
3
2
1
0
No
.of
Bas
es/1
06 b
pN
o.o
f B
ases
/106
bp
No
.of
Bas
es/1
06 b
p
Figure 5 Basal levels of DNA damage in prdx1 þ /þ and prdx1�/� mouse tissues. Following complete hydrolysis, total cellularDNAs were analyzed by LC/MS and GC/MS in order to quantify the indicated modified DNA nucleosides. Three animals of eachgroup were analyzed, with all animals being between 1.5 and 7 months of age. The mean value of each modified nucleoside is shown,7 1s.e. Statistically significant P-values, as determined by Student’s unpaired t-test, are indicated above the appropriate paired samples
Regulation of ROS and c-Myc function by Prdx1RA Egler et al
8045
Oncogene

nature of prdx1�/� mice is due exclusively to thestochastic accumulation of oxidatively induced muta-tions or whether c-Myc (and perhaps c-Abl) deregula-tion may not also contribute to the phenotype. Indeed,the ras sensitivity of prdx1�/� MEFs suggests that, atleast in the in vitro environment, transformation per se isnot dependent upon the mutational consequences ofROS-mediated DNA damage. Recent findings thatelevated intracellular H2O2 is associated with constitu-tive activation of NF-kB (Kang et al., 1998) and thatNF-kB itself is a potential oncogene when deregulated(Hu et al., 2004) suggests that Prdx1 loss may predisposeto cancer susceptibility via yet additional and mechan-istically distinct DNA damage-independent pathways.A central finding of our current work is the lack of
elevated ROS in prdx1�/� hepatocytes and splenocytes.This, together with the finding that prdx1�/� cells donot possess defective DNA repair activity, raised thequestion as to why the former contain higher levels ofdamaged DNA (Figure 5). This question was resolvedwith the finding that prdx1�/� cells redistribute theirROS, with much higher concentrations localizing tonuclei (Figure 6). These findings are consistent with ourprevious observations that a considerable fraction ofprdx1 resides in the nucleus (Mu et al., 2002) and thatother ROS scavengers are less able to substitute forPrdx1. As it has been previously shown that thederegulation of c-Myc can lead to ROS generation(Vafa et al., 2002), it is tempting to speculate that thehigh levels of ROS seen in the nuclei of prdx1�/� cells isrelated to the functional deregulation of c-Myc as well
as to the loss of ROS scavenging that accompaniesprdx1 knockout (Figure 7).Another important finding of the current study
concerned the tissue-specific nature of oxidative DNAdamage. This implies that tumorigenesis in prdx1�/�mice may not be explainable by a simple model in whichtransformation is directly related to ROS levels, whichin turn induce quantitatively and qualitatively identicallevels of DNA damage in all tissues. This poorcorrelation might be explained by the presence of othertissue-specific ROS scavengers, differences in the effi-ciencies of DNA repair of particular damaged nucleo-side species, or by differential levels of deregulatedc-Myc or c-Abl.Of the DNA lesions identified in this work, 8-OH-dG
is the most potent mutagen by virtue of its promotingG-T transversions (reviewed in Grollman and Moriya,1993). 8-OH-dA is also mutagenic in mammalian cellswhere it generates A-G and A-C alterations(Guschlbauer et al., 1991; Wang et al., 1998). Theabnormal accumulation of these two lesions in at leastsome tissues of prdx�/� animals might contribute totheir cancer-prone phenotype (Neumann et al., 2003). In
Figure 6 Relocalization of ROS in prdx1�/� cells. prdx1þ /þand prdx1�/� MEFs were grown on glass coverslip for 1–2 daysand were then exposed for 30min to 2.5 mM CM-H2DCFDA asdescribed in ‘Materials and methods’. Single-cell suspensions fromthe indicated organs of age-matched prdx1þ /þ and prdx1�/�mice were prepared as described in ‘Materials and methods’. Thecells were then resuspended in D-MEM, incubated with 2.5 mMCM-H2DCFDA for 30min and Cytospun onto glass microscopeslides. All cells were then fixed in paraformaldehyde and viewed byfluorescence microscopy as previously described (Rothermundet al., 2005)
Figure 7 Model depicting the roles of Prdx1 and c-Myc ingenerating ROS and damaged DNA. Prdx1 normally scavengesROS, which may be generated by intracellular signaling pathwaysor by various environmental insults. In prdx1�/� animals, thederegulation of c-Myc itself may independently contribute to thegeneration of ROS in some tissues (Thorgeirsson et al., 2000; Vafaet al., 2002). Prdx1’s ability to promote shifts in the subcellularlocalization of ROS (Figure 6) provides an explanation for theincreased DNA damage found in tissues of prx1�/� mice, despiteunaltered levels of total ROS. Other factors account for the tissue-specific nature of the type of DNA damage, and its tendency, alongwith that of c-Myc, to promote neoplastic progression (Vafa et al.,2002; Karlsson et al., 2003)
Regulation of ROS and c-Myc function by Prdx1RA Egler et al
8046
Oncogene
contrast, little is known about the biological effects ofcyclopurine-20-deoxynucleosides. Recent studies haveprovided evidence that (50S)-cdA is a cytotoxic lesion,as it was shown to impose a strong block to elongatingDNA and RNA polymerases as well as to block thebinding of transcription factors to their cognaterecognition sequences (Brooks et al., 2000; Kuraokaet al., 2000, 2001; Marietta et al., 2002). By inference,(50R)-cdA, (50R)-cdG, and (50S)-cdG may also representcytotoxic lesions. The mutagenic properties of cyclo-purine-20-deoxynucleosides have not yet been investi-gated. In addition, the question of whether specificcombinations of mutagenic bases might cooperate invivo to promote cancer has not been addressed.In summary, the results presented here provide
evidence for the deregulation of ROS and c-Myc inprdx�/� animals. The consequences of this include theinhibition or enhancement of select c-Myc functionspertaining to cell growth, proliferation and susceptibilityto oxidative stress and transformation. The currentwork suggests the existence of a potentially complexrelationship among Prdx1 loss, ROS generation and itssubcellular localization, tissue-specific DNA damageand cancer susceptibility. It further offers a potentiallytractable in vivo model for study of these relationships.
Materials and methods
Prdx1 ‘knockout’ mice and genotyping
Derivation and characterization of prdx1�/� mice wasperformed in collaboration with Lexicon Genetics Incorpo-rated (The Woodlands, TX, USA). Random retroviralinsertional mutagenesis of embryonal stem cells has beenpreviously described (Robertson et al., 1986; Mikkers andBerns, 2003). Determination of the insertion sites of severalthousand clones indicated that the prdx1 locus had beentargeted on several independent occasions. One of these cloneswas used for blastocyst injections and subsequent derivation ofan SVJ129/C57Blk6 Prdx1þ /� breeding pair. Figure 1 depictsthe subsequent strategy used for the genotyping of all animalsand depicts the retroviral insertion site 128 nt upstream ofexon 3 (between nt 1209 and 1210 of the GenBank genomicreference clone no. AF157330). Polymerase chain reaction(PCR) primers spanning nt 921–943 (primer no.1, Figure 1))and nt 1485–1509 (primer no. 2) of the murine prdx1 genomiclocus and flanking the retroviral insertion were used to amplify599 bp of the endogenous gene. A third primer (no. 3:50-AAATGGCGTTACTTAAGCTAG CTTGC-30), and homo-logous to a sequence within the retroviral 30-LTR, was used inconjunction with primer no. 2 to amplify 224 bp of sequencethat was unique to the insertion site. Control PCR reactionswere designed to amplify a 429 bp region of the murine mt-mc1genomic locus (Yin et al., 2002, GenBank Accession no.AF499468). All PCR reactions were performed simultaneouslyusing a Perkin–Elmer model 480 thermal cycler. In all, 100 mlreactions consisted of 1�PCR Buffer (Promega, Madison,WI, USA), 1.75mM MgCl2, 160 mM of each dNTP, 1.5mg ofeach primer, 100 ng of genomic DNA and 5 units of Taq DNApolymerase (Promega). A total of 40 cycles of amplificationwere performed under the following conditions: 1min–941C;1min–621C; 0.5min–721C. 20ml of each reaction were thenelectrophoresed on 2% agarose gels in 1 X TBE buffer
followed by staining with ethidium broide and photographicdocumentation. Confirmation that the correct loci had beenamplified in each case was obtained by demonstrating thepresence of restriction enzyme sites at predicted locationswithin each fragment and/or by hybridization of Southernblotted fragments with radiolabeled oligonucleotides homo-logous to sequences located between the primer sites (notshown).
Derivation and analysis of primary murine embryonic fibroblasts
E11.5 embryos were decapitated and eviscerated. The remain-ing carcasses were finely minced in PBS-0.25% trypsin(GIBCO-BRL, Grand Island, NY, USA) and incubated at371C for 30min with intermittent agitation. After vigorousticturation, the suspension was passed through a 70 mm meshfilter (‘Cell Strainer’, BD Biosciences, Bedford, MA, USA)pelleted and resuspended in Dulbecco’s-modified Eagle’sessential medium (D-MEM)þ 10% fetal bovine serum (FBS,GIBCO-BRL). These cells were designated passage 1. Exceptwhere indicated, cells were then maintained on a 3T3-typeprotocol prior to freezing in liquid nitrogen at passages 2–3.All experiments reported here were performed with cellsbetween passages 2–5.Growth curves were performed by plating 3� 104 MEFs of
each genotype into 35mm plates in medium containing 10%serum. Cultures were maintained by replacing growth mediumevery 3–4 days. The total number of viable cells on succeedingdays was determined in triplicate plates by trypsinizingmonolayers and determining the cell count of trypan blue-stained cells with a hemacytometer. Viability in all casesexceeded 95%.Cell cycle determinations were performed on MEFs initially
seeded at 105 cells/well in six-well plates. These were allowed toachieve log-phase growth over the next 2 days, by which timeboth sets of cultures had achieved 30–50% confluency. Cellswere trypsinized, stained with propidium iodide, and immedi-ately subjected to flow cytometry. The fraction of cells in G0/G1, S, and G2/M was then determined by flow cytometryusing a FACS Calibur table top flow cytometer (Becton-Coulter) with CellQuest software as previously described (Yinet al., 1999).Cell size determinations were performed with a Vi-Cell Cell
Viability Analyzer (Model 1.0, Becton-Coulter, Miami, FL,USA). The diameters of at least 6000 log-phase cells weredetermined on at least five separate occasions and the resultswere pooled. A video imaging system combined with trypanblue staining was used to exclude nonviable cells, which, in allcases, constituted o5% of the entire population. Sizedifferences were evaluated for statistical significance usingStudent’s t-test. As confirmation for any observed cell sizedifferences, the total protein content of comparable numbersof log-phase cells was determined using the BCA reagent(Pierce, Rockford, IL, USA).Measurement of ROS in MEFs was performed by quantify-
ing the fluorescence of 5-(and-6)-chloromethyl-20,70-dichloro-dihydrofluorescein diacetate, acetyl ester (CM-H2DCFDA,Molecular Probes, Inc., Eugene, OR, USA) (Yuan et al.,1993). MEFs were plated at 105 cells/well in six-well plates andallowed to achieve log-phase growth over the next 2 days. Thecells were then either left untreated or were exposed to 35mMH2O2 for 6 h. Monolayers were washed twice in warm, serum-free D-MEM. The plates were incubated for 30min at 371Cafter adding 1 ml of fresh D-MEM containing 2.5 mM CM-H2DCFDA. Following brief trypsinization, cells were pelletedat 500 g, washed once in ice-cold PBS, resuspended in 1ml ofcold PBS, and analysed by flow cytometry or by direct
Regulation of ROS and c-Myc function by Prdx1RA Egler et al
8047
Oncogene

visualization by fluorescence microscopy. In the former case,mean CM-H2DCFDA fluorescence was determined on tripli-cate samples, with at least 10 000 events being recorded persample. CM-H2DCFDA has an excitation maximum of495 nm and an emission maximum of 529 nm. Excitation wasachieved with a 488 nm laser wavelength, and read through a530/30 filter.
Determination of ROS in other primary cells
To measure ROS in peripheral blood erythrocytes, approxi-mately 15 ml of whole blood was obtained from the tail vein ofeach animal and separated via a 5min spin at 3000 r.p.m.Erythrocytes were then diluted into 5ml of phosphate-bufferedsaline (PBS), pelleted and washed again. Cells were thenresuspended in 1ml of D-MEM containing 2.5 mM CM-H2DCFDA and incubated for 30min at 371C. Fluorescencewas then measured as described above for MEFs.To measure ROS in single-cell suspensions from solid
organs, age-matched prdx1þ /þ and prdx1�/� animals werekilled concurrently by cervical dislocation. Organs of interestwere removed immediately and finely minced with a razorblade in Hank’s basic salt solution (HBSS). Liver and kidneysamples were incubated in Type II collagenase (1mg/ml,Gibco) in HBSS for 90min at 371C, and then passedsequentially through 70 and 40 mM disposable mesh filters(Falcon, Becton Dickinson). Splenocytes were passed twicethrough a 70mM filter and subsequently washed in HBSS. Inorder to limit red cell contamination of the samples, followingthe above described isolation procedures, all cell suspensionswere centrifuged at 1000 g for 5min and were resuspended in20ml red cell lysis buffer (0.15M ammonium chloride, 10mMpotassium bicarbonate, 0.1mM EDTA, pH 7.2) with 3mlHBSS and 2% FBS for 5min at room temperature. Followingred cell lysis, cell suspensions were again centrifuged andwashed once with HBSS. They were then resuspended inwarm, serum-free D-MEM containing 2.5 mM CM-H2DCFDAand incubated at 371C for 30min. Cells were then pelleted,washed with ice-cold PBS, resuspended in 0.5ml of PBScontaining 1 mg/ml of propidium iodide, and processed for flowcytometry. At least 2� 104 cells were evaluated and gated usingside and forward scatter to identify live populations. Low PIintensity (o102) was used to further identify viable cellscapable of excluding the dye. This population was furtherseparated into two groups depending on the CM-H2DCFDAintensity. For cells with a CM-H2DCFDA intensity of at least101, the mean was determined as described in the previoussection.
Isolation of DNA
Genomic DNAs were purified from the same organs used forROS determinations, with prdx1þ /þ and prdx1�/� tissuesbeing processed simultaneously. In brief, 100–200mg of freshorgan fragments were immediately placed into 3ml of ice-coldlysing solution (500mM Tris-HCl, pH 8.0; 20mM EDTA;10mM NaCl, 1% SDS and 1.75mM b-mercaptoethanol). Thecontents were disrupted for 5 s using a PowerGen 700 tissuehomogenizer (Fisher Scientific, Pittsburgh, PA, USA). Protei-nase K (Invitrogen, Inc., Carlsbad, CA, USA) was added to afinal concentration of 200 mg/ml and the homogenates wereincubated overnight at 371C followed by an additional 1–2 hincubation with 10mg/ml ribonuclease A (Sigma). The digestswere then extracted with phenol : chloroform/isoamlyl alcoholthat had been equilibrated with 250mM Tris-HCl and 1.75mMb-mercaptoethanol followed by an additional extraction withchloroform/isoamyl alcohol only. One-tenth volume of 3M
sodium acetate was then added and the DNA was precipitatedby the addition of three volumes of cold absolute ethanol.DNA was spooled, washed with 70% ethanol and allowed toair dry briefly before being redissolved in 0.5ml of water. Theconcentration of DNA in aqueous samples was determined byUV spectroscopy (absorbance 1¼ 0.05mg of DNA/ml), andalso by GC/MS with acid hydrolysis and isotope-dilutiontechniques using 20deoxyguanosine-15N5 as an internal stan-dard. Upon acid hydrolysis, this compound yields guani-ne-5N5, which is used as an internal standard for thedetermination of the guanine content in DNA (Senturkerand Dizdaroglu, 1999). The results obtained by UV spectro-scopy and GC/MS were in excellent agreement.
Measurement of oxidative DNA damage
For the measurement of modified nucleosides, DNA sampleswere hydrolysed to nucleosides using a combination of exo andendonucleases as described previously (Jaruga et al., 2004).Hydrolysed samples were analysed by LC/MS with isotope-dilution techniques to identify and quantify 8-hydroxy-20-deoxyguanosine (8-OH-dG), 8-hydroxy-20-deoxyadenosine(8-OH-dA), (50R)-cyclo-20-deoxyadenosine ((50R)-cdA) and(50S)-cyclo-20-deoxyadenosine ((50S)-cdA) (Dizdaroglu et al.,2001a, b; Jaruga et al., 2001). Internal standards consisted of 8-OH-dG-15N5, (5
0S)8-OH-dA-15N5, and (50S)-cdA-15N5, respec-
tively (Birincioglu et al., 2003; Trzeciak et al., 2004). Both(50S)-cyclo-20-deoxyguanosine [(50R)-cdG] and (50S)-cyclo-20-deoxyguanosine [(50)-cdG] were identified and quantified byGC/MS with isotope dilution techniques using (50R)-cdG-15N5and (50S)-cdG-15N5, respectively, as internal standards (Jarugaet al., 2002).
Retroviral vectors and MEF transformation assays
A pZIPneo retroviral vector encoding a mutant (G12V) Ha-rasoncogene was a gift from Dr Larry Feig (Tufts New EnglandMedical Center, Boston, MA, USA). Retroviral packaging ofthis or a control vector lacking the ras insert was performed inPhoenix-A cells as previously described (Landay et al., 2000).Supernatents were harvested 2 days after transfection and werethen combined at a 1 : 1 ratio with supernatents from Phoenix-A cells that had been separately transfected with the pBAB-MN-IRES GFP retroviral vector (Landay et al., 2000). Thesewere then immediately applied to 105 prdx1þ /þ and prdx1�/�MEFs that had been plated in 60mm dishes the previous day.Infections were allowed to proceed for 4 h in the presence of8mg/ml Polybrene (Sigma). Immediately after infection, plateswere washed twice in D-MEM-10% FBS and then incubatedin the same medium for an additional 2 days. The serumcontent of the medium was then reduced to 1% for theduration of the experiment with medium being changed every3–4 days. Parallel plates examined at this time for theexpression of green fluorescent protein (GFP) indicated thatprdxþ /þ MEFs were infected approximately 2–3 times asefficiently as their prdx�/� counterpart MEFs. After 12–14days, transformed colonies were stained with 2% methyleneblue-50% methanol and enumerated.
Northern and Western analyses
RNA purification and Northern blotting has been previouslydescribed (Yin et al., 1999, 2002; Mu et al., 2002). All blotscontained 5mg of total RNA per lane. Probes consisted of a32P-labeled fragment of murine Prdx1 containing the entirecoding region or coding region probes for the indicated c-Myctarget genes. Quantification of each transcript was performedwith an AlphaImager 2200 (Alpha Innotech Corp., San
Regulation of ROS and c-Myc function by Prdx1RA Egler et al
8048
Oncogene
Leandro, CA, USA) following normalization of GAPDHcontrol signals. Western blotting was performed as previouslydescribed (Yin et al., 2002) using 50mg of total protein/lane.Western blots of whole-liver lysates were probed with a rabbitpolyclonal antibody against Prdx1, which was a generous giftfrom Dr Soo Goo Rhee (National Institutes of Health).
Acknowledgements
We are grateful to Dr Soo Goo Rhee for generously supplyinganti-Prdx1 antibody and to Bob Lakomy for advice on
fluorescence-activated cell sorting. RE was supported byNIH training Grant T32 HD042987 awarded to Children’sHospital of Pittsburgh. This work was further supported byNIH grant HL33741 awarded to EVP. Certain commercialequipment or materials are identified in this paper in order tospecify adequately the experimental procedure. Such identifi-cation does not imply recommendation or endorsement by theNational Institute of Standards and Technology, nor does itimply that the materials or equipment identified are necessarilythe best available for the purpose.
References
Barker N, Morin PJ and Clevers H. (2000). Adv. Cancer Res.,77, 1–24.
Birincioglu M, Jaruga P, Chowdhury G, Rodriguez H,Dizdaroglu M and Gates KS. (2003). J. Am. Chem. Soc.,125, 11607–11615.
Boxer LM and Dang CV. (2001). Oncogene, 20, 5595–5610.Brooks PJ, Wise DS, Berry DA, Kosmoski JV, Smerdon MJ,Somers RL, Mackie H, Spoonde AY, Ackerman EJ,Coleman K, Tarone RE and Robbins JH. (2000). J. Biol.Chem., 275, 22355–22362.
Bubendorf L, Kononen J, Koivisto P, Schraml P, Moch H,Gasser TC, Willi N, Mihatsch MJ, Sauter G and Kallionie-mi OP. (1999). Cancer Res., 59, 803–806. Erratum in: CancerRes. (1999) 59, 1388.
Cooke MS, Evans MD, Dizdaroglu M and Lunec J. (2003).FASEB J., 17, 1195–1214.
Coppola JA and Cole MD. (1986). Nature, 320, 760–763.de Souza-Pinto NC, Eide L, Hogue BA, Thybo T, Stevnsner T,Seeberg E, Klungland A and Bohr VA. (2001). Cancer Res.,61, 5378–5381.
Dizdaroglu M. (1986). Biochem. J., 238, 247–254.Dizdaroglu M, Jaruga P and Rodriguez H. (2001a). Nucleic
Acids Res., 29, E12.Dizdaroglu M, Jaruga P and Rodriguez H. (2001b). Free
Radic. Biol. Med., 30, 774–784.Eilers M, Schirm S and Bishop JM. (1991). EMBO J., 10,133–141.
Eisenman RN. (2000-1). Harvey Lect., 96, 1–32.Esposito LA, Melov S, Panov A, Cottrell BA and Wallace DC.(1999). Proc. Natl. Acad. Sci. USA, 96, 4820–4825.
Evan G, Harrington E, Fanidi A, Land H, Amati B andBennett M. (1994). Philos. Trans. R. Soc. London B. Biol.Sci., 345, 269–275.
Fernandez PC, Frank SR, Wang L, Schroeder M, Liu S,Greene J, Cocito A and Amati B. (2003). Genes Dev., 17,1115–1129.
Fest T, Mougey V, Dalstein V, Hagerty M, Milette D, Silva Sand Mai S. (2002). Oncogene, 21, 2981–2990.
Grandori C, Cowley SM, James LP and Eisenman RN. (2000).Annu. Rev. Cell Dev. Biol., 16, 653–699.
Grollman AP and Moriya M. (1993). Trends Genet., 9,246–249.
Guschlbauer W, Duplaa AM, Guy A, Teoule R andFazakerley GV. (1991). Nucleic Acids Res., 19, 1753–1758.
Henderson CJ, Smith AG, Ure J, Brown K, Bacon EJand Wolf CR. (1998). Proc. Natl. Acad. Sci. USA, 95,5275–5280.
Hironaka K, Factor VM, Calvisi DF, Conner EA andThorgeirsson SS. (2003). Lab. Invest., 83, 643–654.
Henriksson M and Luscher B. (1996). Adv. Cancer Res., 68,109–182.
Hofmann B, Hecht HJ and Flohe L. (2002). J. Biol. Chem.,383, 347–364.
Hu J, Nakano H, Sakurai H and Colburn NH. (2004).Carcinogenesis, 25, 1991–2003.
Iritani BM, Delrow J, Grandori C, Gomez I, Klacking M,Carlos LS and Eisenman RN. (2002). EMBO J., 21,4820–4830.
Ishii T, Yamada M, Sato H, Matsue M, Taketani S,Nakayama K, Sugita Y and Bannai S. (1993). J. Biol.Chem., 268, 18633–18636.
Jang HH, Lee KO, Chi YH, Jung BG, Park SK, Park JH, LeeJR, Lee SS, Moon JC, Yun JW, Choi YO, Kim WY, KangJS, Cheong GW, Yun DJ, Rhee SG, Cho MJ and Lee SY.(2004). Cell, 117, 625–635.
Jaruga P, Birincioglu M, Rodriguez H and Dizdaroglu M.(2002). Biochemistry, 41, 3703–3711.
Landay M, Oster SK, Khosravi F, Grove LE, Yin X, Sedivy J,Penn LZ and Prochownik EV. (2000). Cell Death Differ., 7,697–705.
Jaruga P, Theruvathu J, Dizdaroglu M and Brooks PJ. (2004).Nucleic Acids Res., 32, e87.
Jaruga P, Rodriguez H and Dizdaroglu M. (2001). Free Radic.Biol. Med., 31, 336–344.
Johnston LA, Prober DA, Edgar BA, Eisenman RN andGallant P. (1999). Cell, 98, 779–790.
Kang SW, Chae HZ, Seo MS, Kim K, Baines IC and RheeSG. (1998). J. Biol. Chem., 273, 6297–6302.
Karahalil B, de Souza-Pinto NC, Parsons JL, Elder RH andBohr VA. (2003). J. Biol. Chem., 278, 33701–33707.
Karlsson A, Deb-Basu D, Cherry A, Turner S, Ford Jand Felsher DW. (2003). Proc. Natl. Acad. Sci. USA, 100,9974–9979.
Kuraoka I, Bender C, Romieu A, Cadet J, Wood RDand Lindahl T. (2000). Proc. Natl. Acad. Sci. USA, 97,3832–3837.
Kuraoka I, Robins P, Masutani C, Hanaoka F, Gasparutto D,Cadet J, Wood RD and Lindahl T. (2001). J. Biol. Chem.,276, 49283–49288.
Land H, Chen AC, Morgenstern JP, Parada LF and WeinbergRA. (1986). Mol. Cell. Biol., 6, 1917–1925.
Lasorella A, Noseda M, Beyna M, Yokota Y and Iavarone A.(2000). Nature, 407, 592–598.
Lee TC, Li L, Philipson L and Ziff EB. (1997). Proc. Natl.Acad. Sci. USA, 94, 12886–12891.
Lee TH, Kim SU, Yu SL, Kim SH, Park do S, Moon HB, DhoSH, Kwon KS, Kwon HJ, Han YH, Jeong S, Kang SW,Shin HS, Lee KK, Rhee SG and Yu DY. (2003). Blood, 101,5033–5038.
Levens DL. (2003). Genes Dev., 17, 1071–1077.Li LH, Nerlov C, Prendergast G, MacGregor D and Ziff EB.(1994). EMBO J., 13, 4070–4079.
Li Q and Dang CV. (1999). Mol. Cell. Biol., 19, 5339–5351.Li Z, Van Calcar S, Qu C, Cavenee WK, Zhang MQ and RenB. (2003). Proc. Natl. Acad. Sci. USA, 100, 8164–8169.
Luscher B and Larsson LG. (1999). Oncogene, 18, 2955–2966.
Regulation of ROS and c-Myc function by Prdx1RA Egler et al
8049
Oncogene

Maines JZ, Stevens LM, Tong X and Stein D. (2004).Development, 131, 775–786.
Marhin WW, Chen S, Facchini LM, Fornace Jr AJ and PennLZ. (1997). Oncogene, 14, 2825–2834.
Marietta C, Gulam H and Brooks PJ. (2002). DNA Repair(Amsterdam)., 1, 967–975.
Marnett LJ, Riggins JN and West JD. (2003). J. Clin. Invest.,111, 583–593.
McMahon SB, Van Buskirk HA, Dugan KA, Copeland TDand Cole MD. (1998). Cell, 94, 363–374.
Mikkers H and Berns A. (2003). Adv. Cancer Res., 88, 53–99.Mu ZM, Yin XY and Prochownik EV. (2002). J. Biol. Chem.,277, 43175–43184.
Naidu R, Wahab NA, Yadav M and Kutty MK. (2002). Int. J.Mol. Med., 9, 189–196.
Nakahara H, Kanno T, Inai Y, Utsumi K, Hiramatsu M, MoriA and Packer L. (1998). Free Radic. Biol. Med., 24, 85–89.
Neumann CA, Krause DS, Carman CV, Das S, Dubey DP,Abraham JL, Bronson RT, Fujiwara Y, Orkin SH and VanEtten RA. (2003). Nature, 424, 561–565.
Nesbit CE, Tersak JM and Prochownik EV. (1999). MYCOncogene, 18, 3004–3016.
Nikiforov MA, Chandriani S, Park J, Kotenko I, Matheos D,Johnsson A, McMahon SB and Cole MD. (2002). Mol. Cell.Biol., 22, 5054–5063.
Obaya AJ, Kotenko I, Cole MD and Sedivy JM. (2002).J. Biol. Chem., 277, 31263–31269.
Oster SK, Ho CS, Soucie EL and Penn LZ. (2002). CancerRes., 84, 81–154.
Oster SK, Mao DY, Kennedy J and Penn LZ. (2003).Oncogene, 22, 1998–2010.
Parada LF, Land H, Chen A, Morganstern J and WeinbergRA. (1985). Prog. Med. Virol., 32, 115–128.
Parrinello S, Samper E, Krtolica A, Goldstein J, Melov S andCampisi J. (2003). Nat. Cell Biol., 5, 741–747.
Pentland AP, Morrison AR, Jacobs SC, Hruza LL, Hebert JSand Packer L. (1992). J. Biol. Chem., 267, 15578–15584.
Pietilainen T, Lipponen P, Aaltomaa S, Eskelinen M, KosmaVM and Syrjanen K. (1995). Anticancer Res., 15, 959–964.
Prendergast GC. (1999). Oncogene, 18, 2967–2987.Prochownik EV and Kukowska J. (1986). Nature, 322,848–850.
Prochownik EV, Kukowska J and Rodgers C. (1988). Mol.Cell. Biol., 8, 3683–3695.
Prosperi MT, Ferbus D, Karczinski I and Goubin G. (1993).J. Biol. Chem., 268, 11050–11056.
Qi Y, Gregory MA, Li Z, Brousal JP, West K and Hann SR.(2004). Nature, 431, 712–717.
Ramos-Gomez M, Kwak MK, Dolan PM, Itoh K, YamamotoM, Talalay P and Kensler TW. (2001). Proc. Natl. Acad. Sci.USA, 98, 3410–3415.
Rhee SG, Chang TS, Bae YS, Lee SR and Kang SW. (2003).J. Am. Soc. Nephrol., 14, S211–S215.
Robertson E, Bradley A, Kuehn M and Evans M. (1986).Nature, 323, 445–448.
Rothermund K, Rogulski K, Fernades E, Whiting A, Sedivy J,Pu L and Prochownik EV. (2005). Cancer Res, 65,2097–2107.
Sato K, Qian J, Slezak JM, Lieber MM, Bostwick DG,Bergstralh EJ and Jenkins RB. (1999). J. Natl. Cancer Inst.,91, 1574–1580.
Schorl C and Sedivy JM. (2003). Mol. Biol. Cell, 14,823–835.
Senturker S and Dizdaroglu M. (1999). Free Radic. Biol. Med.,27, 370–380.
Shaul Y. (2000). Cell Death Differ., 7, 10–16.Shim H, Dolde C, Lewis BC, Wu CS, Dang G, Jungmann RA,Dalla-Favera R and Dang CV. (1997). Proc. Natl. Acad. Sci.USA, 94, 6658–6663.
Smith DR and Goh HS. (1996). Clin. Cancer Res., 2,1049–1053.
Staller P, Peukert K, Kiermaier A, Seoane J, Lukas J,Karsunky H, Moroy T, Bartek J, Massague J, Hanel Fand Eilers M. (2001). Nat. Cell Biol., 3, 392–399.
Stern DF, Roberts AB, Roche NS, Sporn MB and WeinbergRA. (1986). Mol. Cell. Biol., 6, 870–877.
Szatrowski TP and Nathan CF. (1991). Cancer Res., 51,794–798.
Thorgeirsson SS, Factor VM and Snyderwine EG. (2000).Toxicol. Lett., 112–113, 553–555.
Toyokuni S. (1999). Pathol. Int., 49, 91–102.Trzeciak AR, Nyaga SG, Jaruga P, Lohani A, Dizdaroglu Mand Evans MK. (2004). Carcinogenesis, 25, 1359–1370.
Vafa O, Wade M, Kern S, Beeche M, Pandita TK, HamptonGM and Wahl GM. (2002). Mol. Cell, 9, 1031–1044.
Wang D, Kreutzer DA and Essigmann JM. (1998). MutatRes., 400, 99–115.
Wanzel M, Herold S and Eilers M. (2003). Trends Cell Biol.,13, 146–150.
Wen ST and Van Etten RA. (1997). Genes Dev., 11,2456–2467.
Wood LJ, Mukherjee M, Dolde CE, Xu Y, Maher JF, BuntonTE, Williams JB and Resar LM. (2000). Mol. Cell. Biol., 20,5490–5502.
Wood ZA, Schroder E, Robin Harris J and Poole LB. (2003).Trends Biochem. Sci., 28, 32–40.
Xiao Q, Claassen G, Shi J, Adachi S, Sedivy J and Hann SR.(1998). Genes Dev., 12, 3803–3808.
Yin X, Grove L, Rogulski K and Prochownik EV. (2002).J. Biol. Chem., 277, 19998–20010.
Yin XY, Grove L, Datta NS, Katula K, Long MW andProchownik EV. (2001). Cancer Res., 61, 6487–6493.
Yin XY, Grove L, Datta NS, Long MW and Prochownik EV.(1999). Oncogene, 18, 1177–1184.
Yuan L, Inoue S, Saito Y and Nakajima O. (1993). Exp. CellRes., 209, 375–381.
Regulation of ROS and c-Myc function by Prdx1RA Egler et al
8050
Oncogene