Modulating the Formation of Meili Wine Aroma by Prefermentative Freezing Process

Levodopa modulating effects of inducible nitric oxide synthase
and reactive oxygen species in glioma cells
Mark K. Soliman, Elizabeth Mazzio, Karam F.A. Soliman*
College of Pharmacy and Pharmaceutical Sciences, Florida A&M University, Tallahassee, FL 32307, USA
Received 27 March 2002; accepted 24 July 2002
Abstract
Neurological injury and Parkinson disease (PD) are often associated with the increase of nitric oxide (NO) and
free radicals from resident glial cells in the brain. In vitro, exposure to L-3-4-dihydroxyphenylalanine (L-DOPA),
one of the main therapeutic agents for the treatment of PD, can lead to neurotoxicity. In this study,
lipopolysaccharide (LPS) and interferon-gamma (IFN-g) were used to stimulate C6 glioma cells in the presence of
varying concentrations of L-DOPA (1 AM-1 mM). The results indicated a slight augmentation of NO2� production
at low concentrations of L-DOPA (<100 AM) and complete inhibition of NO2� at higher concentrations (500 AM, 1
mM), (p < 0.001). Western blot analysis corroborated that L-DOPA effects on iNOS was at the level of its protein
expression. Total reactive oxygen species (ROS) were detected using 2V, 7V-dichlorofluorescein diacetate
fluorescence dye (2V, 7V-DCFC) and there was an increase of intensity with the increasing concentrations of L-
DOPA. Furthermore, large amounts of superoxide (O2�) and hydrogen peroxide (H2O2) were generated from the
autoxidation of L-DOPA. C6 cells contain high levels of catalase, with inadequate levels of superoxide dismutase
(SOD); therefore, there was an accumulation of O2�, tantamount to elevation in 2V7V-DCFC intensity. Simultaneous
accumulation of O2� and NO2
� would propel formation of peroxynitrite (ONOO-). SOD completely attenuated the
autoxidation of L-DOPA and significantly reversed the inhibitory effects on iNOS at high concentrations. The data
obtained confirmed that the observed effects on iNOS were not due to the activation of the D1 or h1 adrenergic
receptors by L-DOPA. It was concluded from this study that L-DOPA contributed to the modulation of iNOS and
to the increase of O2� production in the stimulated glioma cells in vitro.
D 2002 Elsevier Science Inc. All rights reserved.
Keywords: Levodopa; Nitric oxide; C6 glioma cells; iNOS
0024-3205/02/$ - see front matter D 2002 Elsevier Science Inc. All rights reserved.
PII: S0024 -3205 (02 )02204 -X
* Corresponding author. Tel.: +850-599-3306; fax: +850-599-3667.
E-mail address: [email protected] (K.F.A. Soliman).
www.elsevier.com/locate/lifescie
Life Sciences 72 (2002) 185–198
Introduction
One of the major therapeutic agents used for the treatment of Parkinson’s disease (PD) is L-3-4-
dihydroxyphenylalanine (L-DOPA). L-DOPA is molecularly unstable and can rapidly autoxidize in the
presence of oxygen or light to yield toxic free radicals. Therefore, there has been considerable concern that
this drugmay accelerate neuronal loss in the substantia nigra. In vitro exposure to L-DOPAwas found to be
toxic in several neuronal cell lines including PC12 and SH-SY5Y cells [1–3]. L-DOPA through its
autoxidation and by enzymatic oxidation can produce semiquinones, O-quinone derivatives and several
free radicals such as hydrogen peroxide (H2O2) and superoxide (O2�). The produced free radicals can lead
to oxidative stress and cellular damage. In addition, free radical formation can cause lipid peroxidation of
membranes and mitochondrial dysfunction leading to cell injury and death [4,5].
On the other hand, glial cells may contribute to Parkinson’s disease since they are a potential source of
neurotoxic factors. Glial cells may transform inactive compounds to active neurotoxins, as in the case of
MPTP, which is converted to MPP+ by astrocytes [6]. Moreover, cytokine activation of glial cells often
leads to neurotoxicity and neurodegeneration [7–11]. The elevation of neurotoxic oxygen free radicals and
NO generated from glia [7,8] has been implicated in the pathology of PD [8].
In general, research on L-DOPA has largely targeted the control of symptoms and not the pathological
degeneration that occurs with time. Although there is substantial evidence to support toxicity of L-DOPA
in vitro, studies have failed to demonstrate in vivo that levodopa can exert neurotoxicity to nigral cells in
human, rat and mouse models [12]. Although there is a need to examine the toxicity of L-DOPA, there is
meager data available regarding the effects of L-DOPA on glial cell free radical production during
inflammation. Therefore, the current study was designed to investigate the effect of L-DOPA on nitric
oxide (NO), inducible nitric oxide synthase (iNOS) expression and free radical handling by the glioma
cells.
Materials and methods
Materials
C6 rat glioma cells were obtained from American Type Culture Collection (Manassas, VA, USA).
Dulbecco’s modified Eagle medium (DMEM), L-glutamine, fetal bovine serum – heat inactivated (FBS),
phosphate buffered saline (PBS), Hank’s balanced salt solution (HBSS) and penicillin/streptomycin were
supplied by Fischer Scientific, Mediatech (Pittsburgh, PA). Tris (hydroxymethyl) aminomethane hydro-
chloride (Tris)/glycine 10 � buffer, sodium dodecyl sulfate (SDS) buffer, Laemmli sample buffer, gels
and ready gel blotting – (0.2 Am nitrocellulose) were purchased from Biorad (Hercules, CA, USA). All
other chemicals and supplies were purchased from Sigma Chemical (St. Louis, MO, USA).
Cell culture
C6 glioma cells were grown in DMEM with phenol red supplemented with 10% FBS (v/v), 4 mM L-
glutamine and penicillin/streptomycin (100 Units/0.1 mg per ml). The culture medium was changed
every 2–3 days, and cells were trypsinized (sterile trypsin 0.25%/ethylenediaminetetraacetic acid
M.K. Soliman et al. / Life Sciences 72 (2002) 185–198186
(EDTA)/0.1% in HBSS) and subcultured at confluence every 3–5 days. Experimental plating media
consisted of DMEM minus phenol red, 1.8% FBS (v/v), penicillin/streptomycin (100 Units/0.1 mg per
ml) and 4 mM L-glutamine. Cells (100 Al), were plated at 1.0 � 106 cells/ml in 96 well plates. A stock
solution for each experimental compound was prepared in HBSS + 10 mM (N-(2-hydroxyethylpiper-
azine-NV-(2-ethanesulfonic acid]) (HEPES) and adjusted to a pH of 7.4. Six concentrations of L-DOPA
were prepared fresh daily, to span a 1000-fold dilution range.
Nitrite determination
Quantification of nitrite (NO2�) was determined by a spectrophotometric procedure [13]. Briefly, the
Griess reagent was prepared by mixing an equal volume of 1% sulfanilamide in 0.5 N HCl and 0.1%
N-(1-naphthyl) ethylenediamine in deionized water. The Griess reagent was added directly to the cell
suspension and incubated under reduced light at room temperature for 10 minutes. Samples were
analyzed at 550 nm on a UV microplate spectrophotometer – model 7600, version 5.02, Cambridge
Technologies (Watertown, MA, USA). Controls and blanks were measured simultaneously, and
subtracted from the final value to eliminate interference. A standard curve was generated from a
range of dilutions of sodium nitrite (1–100 AM) prepared in the plating medium. Protein level of each
sample was determined using the Lowry method [14]. The data were calculated as nM NO�2/mg
protein.
iNOS Western blot analysis
Western blot analysis was done using a previously described method [15] with minor modifications.
The supernatant for each sample was removed and discarded. The cell monolayer was washed with
PBS and placed in a lysis buffer. The lysis buffer consisted of 5% glycerol, 1 mM sucrose, 200 AMphenylmethylsulfonyl fluoride, 10 mM Tris, 5 Ag/ml pepstatin A, 1 mM EDTA, 10 Ag/ml apoprotin,
10 Ag/ml leupeptin, 2 mM DL-dithiothreitol, 3 mM urea prepared in 18 megaV water. Samples were
stored at � 80 jC for 24 H and lysed by freeze thaw. The cell lysate was placed in Laemmli sample
buffer containing 3% mercaptoethanol. Samples were then boiled for 5 minutes and centrifuged at
13,000 g for 5 minutes. The supernatant was removed for Western blot and protein analysis. Proteins
were separated on a 10% SDS – polyacrylamide gel using the buffer system of Laemmli and
transferred to nitrocellulose at 125 V for 1 hour in Towbin-SDS transfer buffer 25 mM Tris, 192 mM
glycine and 20% methanol. After transfer, the blot was washed once with PBS containing 0.05%
Tween 20 (TTBS).
For determination of iNOS, 2 hr protocol for immunostaining developed by R&D Systems
(Minneapolis, MN, USA) was used. Briefly, the blot was thoroughly dried. The primary antibody
used was specific for iNOS, macNOS and was developed in rabbit using the synthetic peptide
FSYGAKKGSALEEPKATRL corresponding to the C-terminus of iNOS of mouse macrophage origin
(amino acids 1126–1144) conjugated to keyhole limpet hemocyanin as the immunogen, Sigma
Chemical (St. Louis, MO, USA). This sequence is highly conserved in rat macNOS. Whole antiserum
was fractionated and then further purified by ion exchange chromatography to provide the IgG fraction
of antiserum that was free of other rabbit serum proteins, Sigma Chemical (St. Louis, MO, USA). The
1j antibody was diluted 1:6000 in a diluent buffer containing 1% bovine serum albumin (Fraction V)
in TTBS and 0.2% sodium azide. 20 ml of diluted primary antibody was added to the membrane and
M.K. Soliman et al. / Life Sciences 72 (2002) 185–198 187
incubated on a rocker/shaker at room temperature for 1 hour. The membrane was washed and 20 ml of
diluted secondary antibody (anti-rabbit IgG (whole molecule) peroxidase conjugate) 1:4000 was added
and incubated on a rocker/shaker at room temperature for 1 hour. After a final wash, peroxidase was
detected with SIGMA FASTk DAB (3,3V-diaminobenzidine tetrahydrochloride) with a metal enhancer
cobalt chloride.
Superoxide assay
Production of superoxide radical was assayed using cytochrome C reduction [16]. Briefly, after
experimental treatment, sample supernatant was added to an equal volume of cytochrome C (from
horse heart) prepared in PBS – (final working concentration: 160 AM). Samples were then
incubated for 35 minutes at 37 jC in 5% CO2/atmosphere. Samples were analyzed at 550 nm
on a UV Microplate Spectrophotometer – Model 7600, version 5.02, Cambridge Technologies
(Watertown, MA, USA). Protein concentration was determined by the Lowry method (Lowry et al.,
1951) and the data were calculated as nM O�2/mg protein or volume equivalent for autoxidation
studies.
Hydrogen peroxide assay
Hydrogen Peroxide (H2O2) was assessed by the modification of a previously described method [17].
After experimental treatment, sample supernatants were assessed for H2O2 content based on a peroxidase
linked continuous assay. The chromogenic solution contained (final working concentration) 1 mM
vanillic acid, 500 AM 4-aminoantipyrine and horseradish peroxidase (4 units/ml) in PBS with 2 mM of
HEPES (pH 7.4). The chromogenic reagent was added to each sample and incubated for 10 minutes at
37 jC. Samples were analyzed at 490 nm on a UV Microplate Spectrophotometer – Model 7600,
version 5.02, Cambridge Technologies (Watertown, MA, USA). Controls and blanks were measured
simultaneously, and subtracted from the final value to eliminate interference. Protein was assessed by the
Lowry method [14]. Final data were expressed as nM H2O2/mg protein or volume equivalent for
autoxidation studies.
Cell viability assessment
Cell viability was assessed by resazurin oxidoreduction indicator dye [18]. A working solution of
resazurin was prepared in PBS minus phenol red (0.5 mg/ml). Reduction of the dye by viable cells
reduces the amount of oxidized form and increases the amount of its bright red fluorescent
intermediate (resorufin). The dye solution was added (15% v/v equivalent) to the samples. Cultures
were returned to the incubator for 6–8 H. Quantitative analysis of dye conversion was measured on
a Cambridge microplate fluorometer – model 7620-version 5.02, Cambridge Technologies (Water-
town, MA, USA) set at (550/580] (excitation/emission].
Total reactive oxygen species determination
Quantification of ROS was determined using a fluorescence procedure with 2V, 7V-dichlorofluoresceindiacetate (2V, 7V-DCFC) [19]. In this assay, a stock solution of 2V, 7V-DCFC was prepared in absolute
M.K. Soliman et al. / Life Sciences 72 (2002) 185–198188
ethanol (10 mg/ml) and stored at 0 jC. 40 Al of the stock solution was diluted in 10 ml of PBS to achieve
a working concentration of 40 Ag/ml. The dye solution was added (15% v/v equivalent) to the original
culture medium. Cultures were returned to the incubator for 1 H. Samples were analyzed on a Nikon
Eclipse TE300 inverted microscope with a SPOT cooled CCD color digital camera (Diagnostic
Instruments, Sterling Hts, MI, USA). Images were captured by SPOT imaging software version 2.2
and analyzed using IP Lab Scientific Processing software (Scanalytics, Fairfax, VA, USA).
Catechols oxidation
The oxidative pathway for L-DOPAwas assessed by quantifying color formation over time. Samples
were analyzed at 550 nm on a UV Microplate Spectrophotometer – Model 7600, version 5.02,
Cambridge Technologies (Watertown, MA, USA).
Statistical analysis
Statistical analysis was performed using Graphpad Prism (version 3.0)-Graphpad Software (San
Diego, CA, USA). Data were expressed as the meanF S.E.M. for each group. Significance of difference
between the groups was assessed using a one-way or two-way analysis of variance (ANOVA), followed
by a Tukey post-hoc means comparison test.
Results
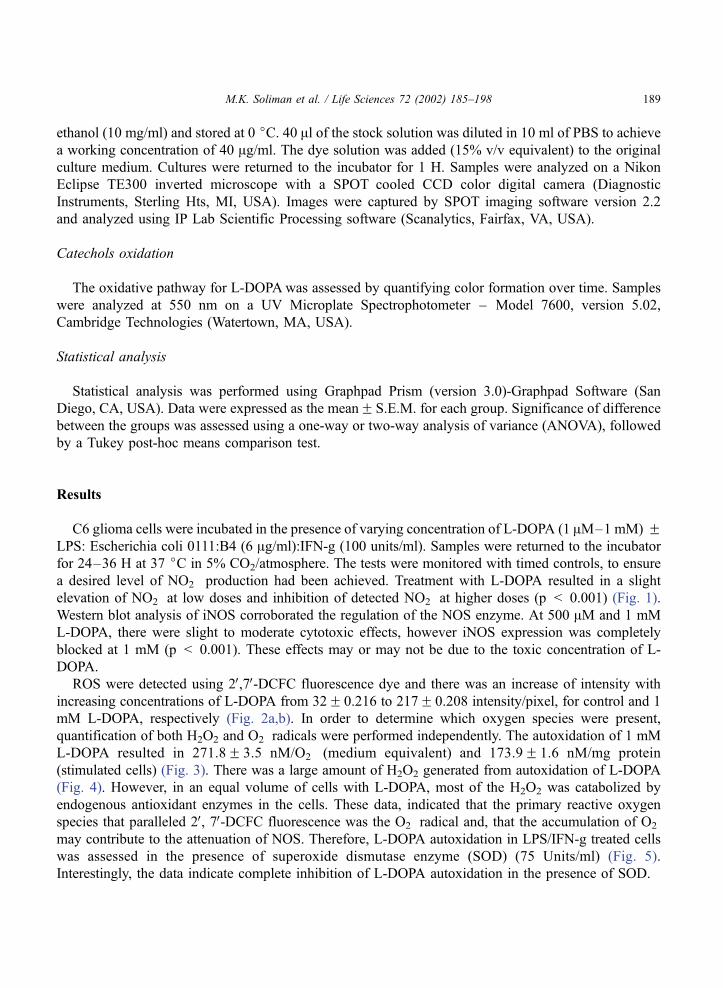
C6 glioma cells were incubated in the presence of varying concentration of L-DOPA (1 AM–1 mM) FLPS: Escherichia coli 0111:B4 (6 Ag/ml):IFN-g (100 units/ml). Samples were returned to the incubator
for 24–36 H at 37 jC in 5% CO2/atmosphere. The tests were monitored with timed controls, to ensure
a desired level of NO2� production had been achieved. Treatment with L-DOPA resulted in a slight
elevation of NO2� at low doses and inhibition of detected NO2
� at higher doses (p < 0.001) (Fig. 1).
Western blot analysis of iNOS corroborated the regulation of the NOS enzyme. At 500 AM and 1 mM
L-DOPA, there were slight to moderate cytotoxic effects, however iNOS expression was completely
blocked at 1 mM (p < 0.001). These effects may or may not be due to the toxic concentration of L-
DOPA.
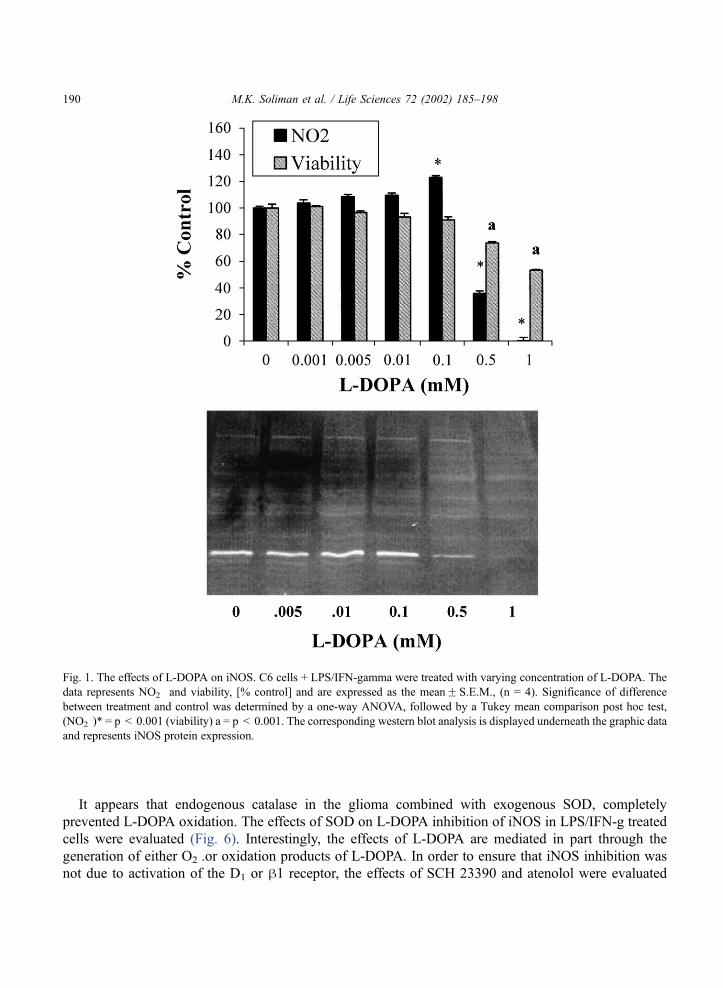
ROS were detected using 2V,7V-DCFC fluorescence dye and there was an increase of intensity with
increasing concentrations of L-DOPA from 32F 0.216 to 217F 0.208 intensity/pixel, for control and 1
mM L-DOPA, respectively (Fig. 2a,b). In order to determine which oxygen species were present,
quantification of both H2O2 and O2� radicals were performed independently. The autoxidation of 1 mM
L-DOPA resulted in 271.8F 3.5 nM/O2� (medium equivalent) and 173.9F 1.6 nM/mg protein
(stimulated cells) (Fig. 3). There was a large amount of H2O2 generated from autoxidation of L-DOPA
(Fig. 4). However, in an equal volume of cells with L-DOPA, most of the H2O2 was catabolized by
endogenous antioxidant enzymes in the cells. These data, indicated that the primary reactive oxygen
species that paralleled 2V, 7V-DCFC fluorescence was the O2� radical and, that the accumulation of O2
�
may contribute to the attenuation of NOS. Therefore, L-DOPA autoxidation in LPS/IFN-g treated cells
was assessed in the presence of superoxide dismutase enzyme (SOD) (75 Units/ml) (Fig. 5).
Interestingly, the data indicate complete inhibition of L-DOPA autoxidation in the presence of SOD.
M.K. Soliman et al. / Life Sciences 72 (2002) 185–198 189
It appears that endogenous catalase in the glioma combined with exogenous SOD, completely
prevented L-DOPA oxidation. The effects of SOD on L-DOPA inhibition of iNOS in LPS/IFN-g treated
cells were evaluated (Fig. 6). Interestingly, the effects of L-DOPA are mediated in part through the
generation of either O2�.or oxidation products of L-DOPA. In order to ensure that iNOS inhibition was
not due to activation of the D1 or h1 receptor, the effects of SCH 23390 and atenolol were evaluated
Fig. 1. The effects of L-DOPA on iNOS. C6 cells + LPS/IFN-gamma were treated with varying concentration of L-DOPA. The
data represents NO2� and viability, [% control] and are expressed as the meanF S.E.M., (n = 4). Significance of difference
between treatment and control was determined by a one-way ANOVA, followed by a Tukey mean comparison post hoc test,
(NO2�)* = p < 0.001 (viability) a = p < 0.001. The corresponding western blot analysis is displayed underneath the graphic data
and represents iNOS protein expression.
M.K. Soliman et al. / Life Sciences 72 (2002) 185–198190
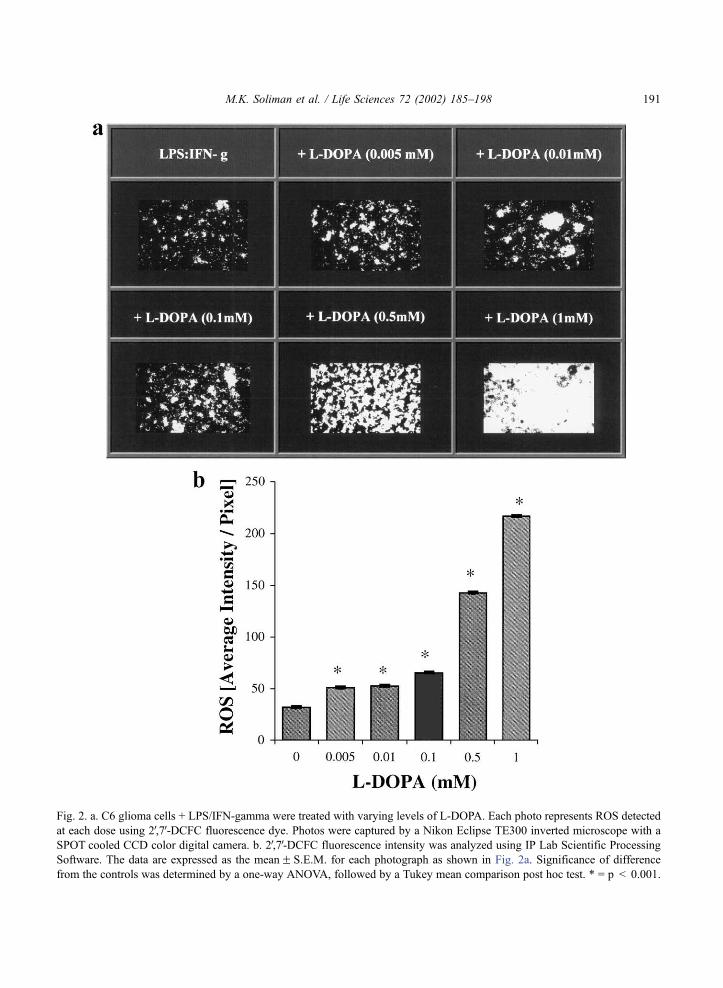
Fig. 2. a. C6 glioma cells + LPS/IFN-gamma were treated with varying levels of L-DOPA. Each photo represents ROS detected
at each dose using 2V,7V-DCFC fluorescence dye. Photos were captured by a Nikon Eclipse TE300 inverted microscope with a
SPOT cooled CCD color digital camera. b. 2V,7V-DCFC fluorescence intensity was analyzed using IP Lab Scientific Processing
Software. The data are expressed as the meanF S.E.M. for each photograph as shown in Fig. 2a. Significance of difference
from the controls was determined by a one-way ANOVA, followed by a Tukey mean comparison post hoc test. * = p < 0.001.
M.K. Soliman et al. / Life Sciences 72 (2002) 185–198 191
Fig. 3. Autoxidation of L-DOPA into O2�. C6 cells + LPS/IFN-gamma or a blank medium control were treated with varying
concentration of L-DOPA. The data are expressed as nM-02/mg prot. or volume equivalent at 24 H and plotted as the meanFS.E.M., (n = 4). Significance of difference from the controls was determined by a one-way ANOVA, followed by a Tukey mean
comparison post hoc test, * = p < 0.001, (Medium), + = p < 0.001, (Cells).
Fig. 4. Autoxidation of L-DOPA into H2O2. C6 cells + LPS/IFN-gamma or a blank medium control were treated with varying
concentration of L-DOPA. The data are expressed as nM H2O2/mg protein or volume equivalent at 24 H and plotted as the
meanF S.E.M., (n = 4). Significance of difference from the controls was determined by a one-way ANOVA, followed by a
Tukey mean comparison post hoc test, * = p < 0.001, (Medium), + = p < 0.001, (Cells).
M.K. Soliman et al. / Life Sciences 72 (2002) 185–198192
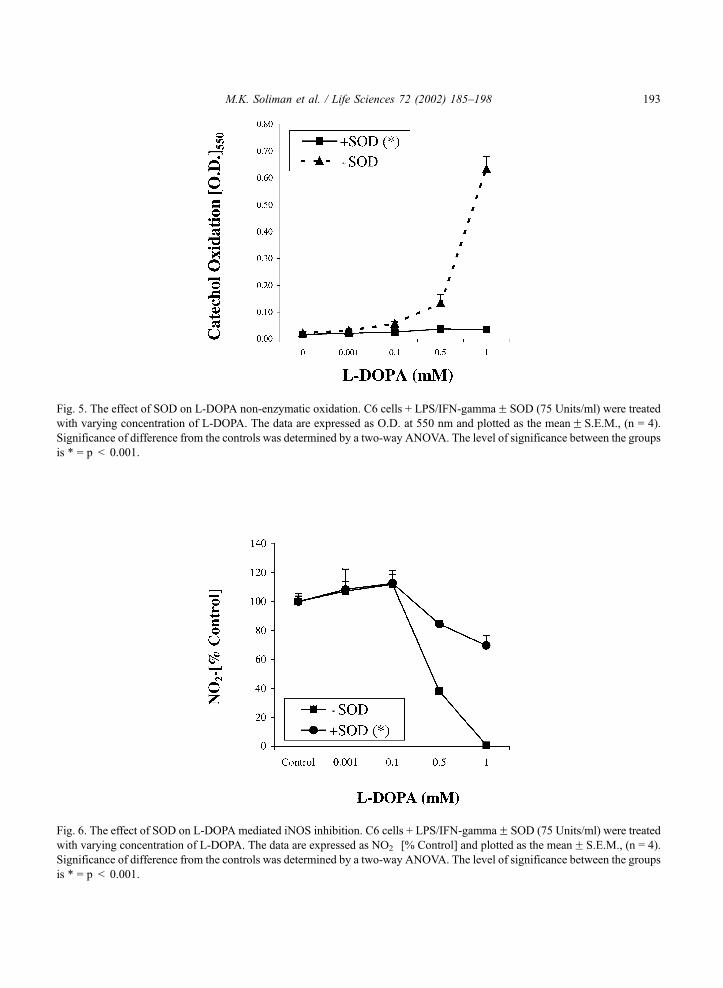
Fig. 6. The effect of SOD on L-DOPA mediated iNOS inhibition. C6 cells + LPS/IFN-gammaF SOD (75 Units/ml) were treated
with varying concentration of L-DOPA. The data are expressed as NO2� [% Control] and plotted as the meanF S.E.M., (n = 4).
Significance of difference from the controls was determined by a two-way ANOVA. The level of significance between the groups
is * = p < 0.001.
Fig. 5. The effect of SOD on L-DOPA non-enzymatic oxidation. C6 cells + LPS/IFN-gammaF SOD (75 Units/ml) were treated
with varying concentration of L-DOPA. The data are expressed as O.D. at 550 nm and plotted as the meanF S.E.M., (n = 4).
Significance of difference from the controls was determined by a two-way ANOVA. The level of significance between the groups
is * = p < 0.001.
M.K. Soliman et al. / Life Sciences 72 (2002) 185–198 193
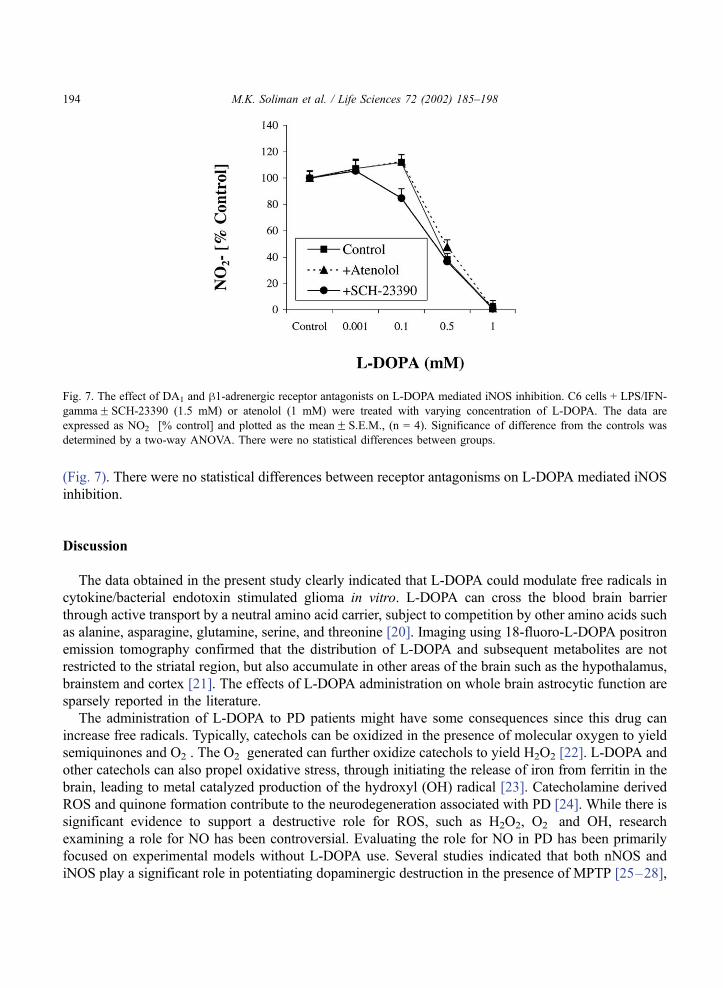
(Fig. 7). There were no statistical differences between receptor antagonisms on L-DOPA mediated iNOS
inhibition.
Discussion
The data obtained in the present study clearly indicated that L-DOPA could modulate free radicals in
cytokine/bacterial endotoxin stimulated glioma in vitro. L-DOPA can cross the blood brain barrier
through active transport by a neutral amino acid carrier, subject to competition by other amino acids such
as alanine, asparagine, glutamine, serine, and threonine [20]. Imaging using 18-fluoro-L-DOPA positron
emission tomography confirmed that the distribution of L-DOPA and subsequent metabolites are not
restricted to the striatal region, but also accumulate in other areas of the brain such as the hypothalamus,
brainstem and cortex [21]. The effects of L-DOPA administration on whole brain astrocytic function are
sparsely reported in the literature.
The administration of L-DOPA to PD patients might have some consequences since this drug can
increase free radicals. Typically, catechols can be oxidized in the presence of molecular oxygen to yield
semiquinones and O2�. The O2
� generated can further oxidize catechols to yield H2O2 [22]. L-DOPA and
other catechols can also propel oxidative stress, through initiating the release of iron from ferritin in the
brain, leading to metal catalyzed production of the hydroxyl (OH) radical [23]. Catecholamine derived
ROS and quinone formation contribute to the neurodegeneration associated with PD [24]. While there is
significant evidence to support a destructive role for ROS, such as H2O2, O2� and OH, research
examining a role for NO has been controversial. Evaluating the role for NO in PD has been primarily
focused on experimental models without L-DOPA use. Several studies indicated that both nNOS and
iNOS play a significant role in potentiating dopaminergic destruction in the presence of MPTP [25–28],
Fig. 7. The effect of DA1 and h1-adrenergic receptor antagonists on L-DOPA mediated iNOS inhibition. C6 cells + LPS/IFN-
gammaF SCH-23390 (1.5 mM) or atenolol (1 mM) were treated with varying concentration of L-DOPA. The data are
expressed as NO2� [% control] and plotted as the meanF S.E.M., (n = 4). Significance of difference from the controls was
determined by a two-way ANOVA. There were no statistical differences between groups.
M.K. Soliman et al. / Life Sciences 72 (2002) 185–198194
whereas others find no evidence of this relationship [29]. It is believed that during brain injury, glial cell
iNOS releases large amounts of NO for extended periods. Moreover, the elevated levels of NO have
been correlated to the extensive injury associated with CNS viral infections [30], Alzheimer’s disease
[31] multiple sclerosis [32], ischemia and closed head injury [33–35]. However, as in the case with the
study of PD and NO, recent reports indicated a neuroprotective effect of NO during toxic conditions. It
has been reported that NO can act as an antioxidant and provide protection against neuronal injury
during encephalitis, ischemia and reperfusion [36,37], iron induced lipid peroxidation [38] and Ca+ 2
overload [39].
A precaution to consider regarding the findings of this study is that the concentrations of L-DOPA
required to mediate the downregulation of iNOS were extremely high. In the human body, L–DOPA has
a low bioavailability, is not lipid soluble, and an active transport process is required for its delivery from
intestine to the blood and from the blood to the brain [40]. In human subjects, a typical dose of Sinemet
(250 mg L-DOPA and 25 mg carbidopa), can lead to a peak L-DOPA plasma concentrations (21.7 Ag/ml) at 1 H and peak CSF concentrations (1.14 Ag/ml) at 8 H [41]. The concentration of L-DOPA required
in this study to downregulate iNOS was 500 AM, which is equal to 98.6 Ag/ml, significantly higher than
the applicable therapeutic concentration range.
From the data in this study, it appears that at the therapeutic range (< 100 AM), treatment with L-
DOPA resulted in the simultaneous elevation of both NO2� and O2, which together would lead to the
formation of peroxynitrite (ONOO-). Although C6 cells express MnSOD mRNA, the level of SOD was
inadequate to dispose of the vast O2� produced from L-DOPA autoxidation [42]. The dual presence of
both O2� and NO2
� can lead to a neurotoxic environment as elevated levels of ONOO�can mediate
destructive effects on thiols, amines and proteins and inhibitory effects on cellular respiration [43].
Moreover, the toxicity of astrocytic iNOS on neurons is attenuated with treatment of exogenous SOD,
indicating a paramount destructive role for ONOO�and inadequate SOD levels in glia [44]. On the other
hand, evidence from this study indicated that C6 glioma have a robust capacity to rapidly dispose of
H2O2 generated from the autoxidation of L-DOPA. These findings corroborate previous research [45].
Moreover, while L-DOPA can lead to accumulation of O2�, the addition of SOD resulted in higher levels
of NO2�. This may be due to either the toxic effects of L-DOPA or the reduced accumulation of ONOO�,
which would exert toxic effects on respiration.
Interestingly, previous research from our lab has discovered that dopamine (DA) and norepinephrine
can inhibit LPS/cytokine iNOS protein expression in glioma cells (data not published). Although DA is
thought to be autoxidized similar to L-DOPA, O2� generated from the autoxidation of DA, had no effect
on iNOS. The difference between the autoxidation of DA and L-DOPA defines a specific role of O2�
involvement in L-DOPA mediated effects. For example, the toxic effects of L-DOPA are mediated by
both H2O2 and O2�, as both SOD and catalase are protective against L-DOPA mediated toxicity in
neurons [1,46]. However, DA toxicity is only mediated via its autoxidative product H2O2, and despite
the elevation in O2�, SOD is not protective against this type of toxicity [1]. Similarly, O2
� generated by 6-
hydroxydopamine autoxidation is also not lethal, only H2O2 appears to be the substance responsible for
toxicity [47]. These research findings, indicate a specific modulatory component of the O2� generated
from L-DOPA, which is different from that generated by oxidation of typical catechols. Furthermore, it
has been reported that effects of DA on iNOS expression are receptor mediated, ruling out effects by
ROS [48].
It was concluded from this study that L-DOPA contributed to the modulation of iNOS and to the
increase of O2� in stimulated glioma cells in vitro. Collectively, the data presented here, along with other
M.K. Soliman et al. / Life Sciences 72 (2002) 185–198 195
research work, point out to the fact that prolong use of L-DOPA might be associated with the production
of neurotoxic substances that can speed the neurodegeneration process of the striatal tissue.
Acknowledgements
This work was supported by National Institutes of Health grants GM 08111 and RR03020.
References
[1] Lai CT, Yu PH. Dopamine and L-beta, 3,4-dihydroxy-phenylalaninehydrochlorid (L-DOPA)-induced cytotoxicity towards
catecholaminergic neuroblastoma S14-SY5Y cells. Effect of oxidative stress and antioxidative factors. Biochemical
Pharmacology 1997;53(3):363–72.
[2] Offen D, Ziv I, Brazilai A, Gorodin S, Glatr E, Hoshman A, Melmed E. Dopamine-melanin induced apoptosis in PC12
cells; possible implications for the etiology of Parkinson’s disease. Neurochemistry International 1997;2(2):207–16.
[3] Kim-Han JS, Sun AY. Protection of PC12 cells glutathione peroxidase in L-DOPA induced toxicity. Free Radical Biology
and Medicine 1998;25(4–5):512–8.
[4] Olano CW. A radical hypothesis for neurodegeneration. Trends in Neuroscience 1993;16(11):439–44.
[5] Pardo B, Mena MA, DeYobenes JG. L-DOPA inhibits complex IV of the electron transport chain in catecholamine-rich
human neuroblastoma NB69 cells. Journal of Neurochemistry 1995;64(2):576–82.
[6] DiMonte DA, Wu EY, Langston JW. Role of astrocytes in MPTP metabolism and toxicity. Annals of the New York
Academy of Sciences 1992;648(2):219–28.
[7] Banati RB, Gehrmann J, Schubert P, Kreutzberg GT. Cytotoxicity of microglia. Glia 1993;7(1):111–8.
[8] Giulian D. Reactive glia as rivals in regulating neuronal survival. Glia 1993;7(1):102–10.
[9] Giulian D, Vaca K, Corpuz M. Brain Glia release factors with opposing actions upon neuronal survival. Journal of
Neuroscience 1993;13(1):29–37.
[10] McGeer P, Itagaki S, Akiyama H, McGeer EG. Rate of cell death in Parkinsonism indicates active neuropathological
process. Annals of Neurology 1998;24(4):574–6.
[11] Vaca K, Wendt E. Divergent effects of astroglial and microglial secretion on neuron growth and survival. Experimental
Neurology 1992;118(1):62–72.
[12] Jenner PG, Brin MF. Levodopa neurotoxicity: experimental studies versus clinical relevance. Neurology 1998;50(6 Suppl
6):S39–43 [discussion S44-48].
[13] Park SK, Murphy S. Duration of expression of inducible nitric oxide synthase in glial cells. Journal of Neuroscience
Research 1994;39(4):405–11.
[14] Lowry OH, Rosenbrough NJ, Farr AL, Innis RB. Protein measurement with Folin phenol reagent. Journal of Biological
Chemistry 1951;193:265–75.
[15] Chandler LJ, Kopnisky K, Richards E, Crews FT, Sumners C. Angiotensin II decreases inducible nitric oxide synthase
expression in rat astroglial cultures. American Journal of Physiology 1995;268(3 Pt 1):700–7.
[16] Pick E, Mizel D. Rapid microassays for the measurement of superoxide and hydrogen peroxide production by macrophages
in culture using an automatic enzyme immunoassay reader. Journal of Immunological Methods 1981;46(2):211–26.
[17] Holt A, Sharman DF, Baker GB, Palcic MM. A continuous spectrophotometric assay for monoamine oxidase and related
enzymes in tissue homogenates. Analytical Biochemistry 1997;244(2):384–92.
[18] Magnani E, Bettini E. Resazurin detection of energy metabolism changes in serum-starved PC12 cells and of neuro-
protective agent effect. Brain Research. Brain Research Protocols 2000;3:266–72.
[19] Oyama Y, Hayashi A, Ueha T, Maekawa K. Characterization of 2V,7V-dichlorofluorescin fluorescence in dissociated
mammalian brain neurons: Estimation on intracellular content of hydrogen peroxide. Brain Research 1994;635(1–2):
113–7.
[20] Kageyama T, Nakamura M, Matsuo A, Yamasaki Y, Takakura Y, Hashida M, Kanai Y, Naito M, Tsuruo T, Minato N,
Shimohama S. The 4F2hc/LAT1 complex transports L-DOPA across the blood-brain barrier. Brain Research 2000;879
(1–2):115–21.
M.K. Soliman et al. / Life Sciences 72 (2002) 185–198196

[21] Brown WD, Taylor MD, Roberts AD, Oakes TR, Schueller MJ, Holden JE, Malischke LM, DeJesus OT, Nickles RJ.
Fluorodopa PET shows the non-dopaminergic as well as dopaminergic destinations of levodopa. Neurology 1999;53(6):
1212–8.
[22] Li CL, Werner P, Cohen G. Lipid peroxidation in brain: interactions of L-DOPA/dopamine with ascorbate and iron.
Neurodegeneration 1995;4(2):147–53.
[23] Linert W, Jameson GN. Redox reactions of neurotransmitters possibly involved in the progression of Parkinson’s disease.
Journal of Inorganic Biochemistry 2000;79(1–4):319–26.
[24] Chiueh CC, Wu RM, Mohanakumar KP, Sternberger LM, Krishna G, Obata T, Murphy DL. In vivo generation of
hydroxyl radicals and MPTP-induced dopaminergic toxicity in the basal ganglia. Annals of the New York Academy of
Sciences 1994;738:25–36.
[25] Klivenyi P, Andreassen OA, Ferrante RJ, Lancelot E, Reif D, Beal MF. Inhibition of neuronal nitric oxide synthase
protects against MPTP toxicity. Neuroreport 2000;11(6):1265–8.
[26] Przedborski S, Jackson-Lewis V, Yokoyama R, Shibata T, Dawson VL, Dawson TM. Role of neuronal nitric oxide in 1-
methyl-4-phenyl-1,2,3,6-tetrahydropyridine (MPTP)-induced dopaminergic neurotoxicity. Proceedings of the National
Academy of Sciences of the United States of America 1996;93(10):4565–71.
[27] Dehmer T, Lindenau J, Haid S, Dichgans J, Schulz JB. Deficiency of inducible nitric oxide synthase protects against
MPTP toxicity in vivo. Journal of Neurochemistry 2000;74(5):2213–6.
[28] Hantraye P, Brouillet E, Ferrante R, Palfi S, Dolan R, Matthews RT, Beal MF. Inhibition of neuronal nitric oxide synthase
prevents MPTP-induced Parkinson’s in baboons. Nature Medicine 1996;2(9):965–6.
[29] Mackenzie GM, Jackson MJ, Jenner P, Marsden CD. Nitric oxide synthase inhibition and MPTP-induced toxicity in the
common marmoset. Synapse 1997;26(3):301–16.
[30] Koprowski H, Zheng YM, Heber-Katz E, Fraser N, Rorke L, Fu ZF, Hanlon C, Dietzschold B. In vivo expression of
inducible nitric oxide synthase in experimentally induced neurological diseases. Proceedings of the National Academy of
Sciences of the United States of America 1993;90(3):3024–7.
[31] Goodwin JL, Uemura E, Cunnick JE. Microglial release of nitric oxide by the synergistic action of beta-amyloid and IFN-
gamma. Brain Research 1995;692(1–2):207–14.
[32] Bagasra O, Michaels FH, Zheng YM, Bobroski LE, Spitsin SV, Fu ZF, Tawadros R, Koprowski H. Activation of the
inducible form of nitric oxide synthase in the brains of patients with multiple sclerosis. Proceedings of the National
Academy of Sciences of the United States of America 1995;92:12041–5.
[33] Peng ZC, Pietra C, Sbarbati A, Ziviani L, Yan XB, Osculati F, Bentivoglio M. Induction of NADPH-diaphorase activity in
the rat forebrain after middle cerebral artery occlusion. Experimental Neurology 1996;138(1):105–20.
[34] Nowicki JP, Duval D, Poignet H, Scatton B. Nitric oxide mediates neuronal death after focal cerebral ischemia in the
mouse. European Journal of Pharmacology 1991;204(3):339–40.
[35] Clark RS, Kochanek PM, Obrist WD, Wong HR, Billiar TR, Wisniewski SR, Marion DW. Cerebrospinal fluid and plasma
nitrite and nitrate concentrations after head injury in humans. Critical Care Medicine 1996;24(7):1243–51.
[36] Saxena SK, Mathur A, Srivastava RC. Induction of nitric oxide synthase during Japanese encephalitis virus infection:
evidence of protective role. Archives of Biochemistry and Biophysics 2001;391(1):1–7.
[37] Dobrucki LW, Kalinowski L, Uracz W, Malinski T. The protective role of nitric oxide in the brain ischemia. Journal of
Physiology and Pharmacology 2000;51(4 Pt 1):695–703.
[38] Nara K, Konno D, Uchida J, Kiuchi Y, Oguchi K. Protective effect of nitric oxide against iron-induced neuronal damage.
Journal of Neural Transmission 1999;106(9–10):835–48.
[39] Hotta Y, Otsuka-Murakami H, Fujita M, Nakagawa J, Yajima M, Liu W, Ishikawa N, Kawai N, Masumizu T, Kohno M.
Protective role of nitric oxide synthase against ischemia-reperfusion injury in guinea pig myocardial mitochondria.
European Journal of Pharmacology 1999;380(1):37–48.
[40] Furlanut M, Furlanut Jr M, Benetello P. Monitoring of L-dopa concentrations in Parkinson’s disease. Pharmacological
Research 2001;43(5):423–7.
[41] Benetello P, Furlanut M, Fortunato M, Pea F, Baraldo M. Levodopa and 3-O-methyldopa in cerebrospinal fluid after
levodopa-carbidopa association. Pharmacological Research 1997;35(4):313–5.
[42] Pahan K, Dobashi K, Ghosh B, Singh I. Induction of the manganese superoxide dismutase gene by sphingomyelinase and
ceramide. Journal of Neurochemistry 1999;73(2):513–20.
[43] Heales SJ, Bolanos JP, Stewart VC, Brookes PS, Land JM, Clark JB. Nitric oxide, mitochondria and neurological disease.
Biochim Biophys Acta 1999;1410(2):215–28.
M.K. Soliman et al. / Life Sciences 72 (2002) 185–198 197
[44] Skaper SD, Facci L, Leon A. Inflammatory mediator stimulation of astrocytes and meningeal fibroblasts induces neuronal
degeneration via the nitridergic pathway. Journal of Neurochemistry 1995;64(1):266–76.
[45] Desagher S, Glowinski J, Premont J. Astrocytes protect neurons from hydrogen peroxide toxicity. Journal of Neuroscience
1996;16(8):2553–62.
[46] Basma AN, Morris EJ, Nicklas WJ, Geller HM. L-dopa cytotoxicity to PC12 cells in culture is via its autoxidation. Journal
of Neurochemistry 1995;64(2):825–32.
[47] Blum D, Torch S, Nissou MF, Benabid AL, Verna JM. Extracellular toxicity of 6-hydroxydopamine on PC12 cells.
Neuroscience Letters 2000;283(3):193–6.
[48] Boomershine CS, Lafuse WP, Zwilling BS. Beta 2-adrenergic receptor stimulation inhibits nitric oxide generation by
Mycobacterium avium infected macrophages. Journal of Neuroimmunology 1999;101(1):68–75.
M.K. Soliman et al. / Life Sciences 72 (2002) 185–198198
Copyright © 2022 FDOKUMEN