Regulation of esophageal epithelial function in Eosinophilic ...
191
-
Upload
khangminh22 -
Category
Documents
-
view
0 -
download
0
Transcript of Regulation of esophageal epithelial function in Eosinophilic ...


Regulation of esophageal epithelial function in Eosinophilic Esophagitis
A dissertation submitted to the
Graduate School of the University of Cincinnati
In partial fulfillment of the requirement of the degree of
DOCTOR OF PHILOSOPHY
In the Department of Pharmacology & Systems Physiology
of the College of Medicine
2018
By
Chang Zeng
B.S. Sun Yat-sen University, 2012
Committee Chair: Anjaparavanda P. Naren, Ph.D.
Mentor: Simon P. Hogan, Ph.D.

ii
Abstract
Eosinophilic Esophagitis (EoE) is an allergic inflammatory disorder with increasing prevalence in the
western world. Patients with EoE demonstrate symptoms including vomiting, dysphagia and food
impaction which decreased the quality of life.
One of the histopathological features of EoE is esophageal tissue remodeling, including dilated
intercellular spaces (DIS) and basal zone hyperplasia (BZH). However, the underlying molecular s that
drive these features is largely unknown. Here, we investigate the 1) involvement of sodium‐hydrogen
exchanger 3 (NHE3) in esophageal epithelium remodeling and 2) the role of the transcription factors,
signal transducer and activator of transcription (STAT), in the regulation of gene networks that control
esophageal epithelial proliferation and histopathological features of EoE.
By analyzing RNA sequencing comparing transcriptome difference in esophageal biopsies from normal
control (NL) and EoE patients, we identified NHE3 as the most upregulated transmembrane transporters
in patients with active EoE. We found that the expression pattern of NHE3 closely correlated with the
disease severity and DIS. Functional analyses demonstrated that NHE3 activity is upregulated in IL‐13
treated primary esophageal epithelial cells derived from EoE patients, as well as in IL‐13‐induced
stratified squamous epithelium generated by the air‐liquid interface (EPC2‐ALI). Pharmacological
Inhibition of NHE3 activity protected from IL‐13 induced DIS in esophageal epithelium. Thus, we
concluded that NHE3 plays a functional role in DIS formation and pharmacologic interventions targeting
SLC9A3 function may suppress the histopathologic manifestations in EoE
IL‐13 has previously been shown to activate STAT proteins, particularly STAT3 and STAT6 and regulate
the transcriptome changes in EoE patients. Using transcription factor binding site (TFBS) analysis, we
identified STAT protein binding motif is one of the most enriched transcription factor binding site (TFBS)
in the dysregulated genes in both EoE biopsies and IL‐13 treated EPC2‐ALI cultures. In particular, we

iii
identified the STAT3 binding site as the most enriched TFBS in IL‐13 induced upregulated genes in EPC‐
ALI. By knocking down STAT3 in EPC2 cells, we revealed a role for STAT3 in the regulation of epithelium
barrier function and IL‐13‐induced proliferation. In contrast, we show that STAT6 plays a pro‐
inflammatory role regulating cytokine and chemokine production in esophageal epithelium.
Together, we identified several molecular targets in the esophageal epithelium that are important in
modulating the esophageal epithelium remodeling in EoE. This dissertation, for the first time, uncovers
the role of transmembrane transporters in the pathogenesis of EoE. Also, we provide valuable
information on the two distinct divergent pathways regulated by STAT3 and STAT6 driving IL‐13‐
mediated transcriptome changes in EoE. Further investigations into the contribution of these
mechanisms in the clinical manifestations of EoE will facilitate the evolvement of new therapeutic
approaches in EoE treatment.

iv

v
Acknowledgements
First, I would like to express my utmost gratitude to my mentor Dr. Simon Hogan. I had a tough
beginning for my graduate study, but it all paid off when I ended up joined Simon’s laboratory. Simon is
an excellent mentor. He showed me his enthusiasm and passion for science, guided me of how to do
science correctly and efficiently, and told me to explore all the possibility of life in the future. These are
all valuable assets and shaped me into who I am right now.
Next, I would like to thank my thesis committee members. All of my committee members, Drs.
Anjaparavanda Naren, Hong‐Sheng Wang, Gary Shull, Marshall Montrose and Robert Rapoport have
provided me invaluable support and advice, which are essential for my completion of the dissertation.
Primarily, I want to thank Dr. Naren for the guidance on experimental techniques and preparedness to
assist with completion of my thesis dissertation. Also, I am grateful to Dr. Rapoport for being supportive
not only as my committee member but also my graduate program director.
I would like to offer my special thanks to Dr. Ronald Millard. He helped and guided me to get through
the most terrible time of my graduate study. I would not be able to join Simon’s lab and achieve what I
have made now without him. I would also like to thank Nancy for her endless help during both my
graduate program transition and process towards graduation.
During the past four years, I have met amazing people in Hogan Lab, and I would like to express my
thankfulness individually. Taeko, thank you for sharing your experiences and stupid videos with me all
the time, I always enjoyed the time we spent together. Simone, thank you for your guidance on
experiments and your company to different places in Cincinnati. It is sort of sad that we are not going to
drink KSFM when I graduate. Amna, we have been together to go through both foundation and
numerous dreadful lab meetings, I think this would be enough to keep our friendship for a long time.
Lisa, thank you for always being like a mom and take care of me, I wish I could bring you more exotic

vi
food to try. Now I’m starting to run out of spaces, but I still want to thank Jazib, Yanfen, Sunil, Varsha,
Andy, Justin, Heather, Nianrong, David, Ania, and Marjan. We have shared amazing memories together,
and thank you all for your friendship.
I would also like to thank the great people in Division of Allergy and Immunology at Cincinnati Children’s
Hospital Medical Center who offered me help and friendship during my training as a graduate student.
Special thanks to Julie, Nurit and Mark Rochman, who have given me useful advice on both scientific
problems and career development.
Finally, I would like to thank my mom Zhi, my aunt Tun, my boyfriend Yongkun, my friend Yu and
Jiuzhou, and all my other friends and families for their unconditional support and love.

vii
Table of Contents
Regulation of esophageal epithelial function in Eosinophilic Esophagitis ..................................................... i
Abstract ......................................................................................................................................................... ii
Acknowledgements ....................................................................................................................................... v
Table of Contents ........................................................................................................................................ vii
List of Abbreviations .................................................................................................................................... xi
List of Figures and Tables ............................................................................................................................xiii
1 Chapter I: Introduction ....................................................................................................................... 15
1.1 Eosinophilic Esophagitis .............................................................................................................. 15
1.1.1 Introduction ........................................................................................................................ 15
1.1.2 Pathogenesis of EoE ............................................................................................................ 15
1.1.3 Therapy ............................................................................................................................... 25
1.1.4 Summary ............................................................................................................................. 28
1.2 Interleukin‐13 (IL‐13) .................................................................................................................. 29
1.2.1 Introduction ........................................................................................................................ 29
1.2.2 Production of IL‐13 .............................................................................................................. 29
1.2.3 IL‐13 signaling pathway ....................................................................................................... 29
1.2.4 IL‐13 function under physiological and pathological conditions ........................................ 32
1.2.5 IL‐13 in EoE .......................................................................................................................... 33
1.2.6 IL‐13‐related treatment ...................................................................................................... 34

viii
1.2.7 Summary ............................................................................................................................. 34
1.3 Ion transporters .......................................................................................................................... 36
1.3.1 Introduction of Ion transporters ......................................................................................... 36
1.3.2 Ion transporters in the esophagus ...................................................................................... 37
1.3.3 Summary ............................................................................................................................. 38
1.4 Sodium hydrogen exchangers (NHEs) ......................................................................................... 39
1.4.1 Introduction ........................................................................................................................ 39
1.4.2 NHE3 ................................................................................................................................... 39
1.4.3 Summary ............................................................................................................................. 41
1.5 Summary ..................................................................................................................................... 42
2 Chapter II: SLC9A3/NHE3 dysregulation and dilated intercellular spaces in eosinophilic esophagitis
43
2.1 Copyright and Student Contribution ........................................................................................... 45
2.2 Abstract ....................................................................................................................................... 45
2.3 Introduction ................................................................................................................................ 47
2.4 Material and Methods ................................................................................................................ 50
2.5 Results ......................................................................................................................................... 58
2.5.1 Transmembrane transporter SLC9A3/NHE3 specifically upregulated and correlated with
eosinophil count and DIS in EoE ......................................................................................................... 58
2.5.2 Increased NHE3 function in IL‐13–stimulated primary esophageal epithelial cells. ........... 59
ix
2.5.3 IL‐13 induces an EoE‐like transcriptome including increased transmembrane transporter
activity and SLC9A3 overexpression in an in vitro, matured esophageal epithelium model system. 60
2.5.4 IL‐13–induced NHE3 expression and function in differentiated esophageal epithelial cells.
61
2.5.5 Increased SLC9A3 expression and activity is linked with DIS formation............................. 62
2.6 Discussion .................................................................................................................................... 64
2.7 Figures ......................................................................................................................................... 69
3 Chapter III: IL‐13 activated STAT3 and STAT6 pathways in Eosinophilic Esophagitis ....................... 104
3.1 Copyright and Student Contribution ......................................................................................... 105
3.2 Abstract ..................................................................................................................................... 105
3.3 Introduction .............................................................................................................................. 107
3.4 Materials and methods ............................................................................................................. 110
3.5 Results ....................................................................................................................................... 115
3.5.1 STAT binding site is one of the most enriched TFBS in EoE dysregulated genes .............. 115
3.5.2 STAT binding site is the most enriched in both dysregulated genes and transcriptionally
active genes following 4 hours incubation with IL‐13 in EPC2‐ALI ................................................... 115
3.5.3 STAT3 is the most enriched TFBS in IL‐13‐induced upregulated genes. ........................... 116
3.5.4 STAT3 and STAT3‐related genes regulate barrier integrity of the esophageal epithelium
117
3.5.5 IL‐13 induced STAT3‐dependent genes are involved in IL‐13 induced cell proliferation . 118

x
3.5.6 IL‐13 induced STAT6‐dependent genes are involved in cytokine production but not IL‐13
induced cell proliferation .................................................................................................................. 119
3.6 Discussion .................................................................................................................................. 121
3.7 Figures ....................................................................................................................................... 125
4 Chapter IV: General Discussion and Summary ................................................................................. 144
4.1 Alteration of transmembrane transporters expression in EoE ................................................. 145
4.2 SLC9A3/NHE3 dysregulation in esophageal epithelium ........................................................... 149
4.3 STAT involvement in EoE transcriptome ................................................................................... 153
4.4 STAT3 regulates tissue remodeling in esophageal epithelium ................................................. 155
4.5 STAT6 regulates cytokine production in esophageal epithelium ............................................. 157
4.6 Summary ................................................................................................................................... 158
4.7 Figures ....................................................................................................................................... 160
5 References ........................................................................................................................................ 166

xi
List of Abbreviations
Abbreviation Full Name
AD‐HIES Autosomal‐dominant hyper‐IgE syndrome
ALI air‐liquid interface
AR allergic rhinitis
BE Barrett’s esophagus
BrdU 5‐Bromo‐2’‐deoxyuridine
BZH basal zone hyperplasia
CAPN14 Calpain 14
CCL26 Chemokine ligand 26
CRAC calcium release‐activated calcium
CRLF2 Cytokine receptor‐like factor 2
DIS dilated intercellular spaces
DSG1 Desmoglein‐1
EA Esophageal adenocarcinoma
ECP eosinophil cationic protein
EDN Eosinophil‐derived neurotoxin
EDP EoE diagnostic panel
EMT epithelial‐mesenchymal transition
ENaC epithelium sodium channel
EoE Eosinophilic Esophagitis
ERK Extracellular signal‐regulated kinase
FLG Filaggrin
GERD gastroesophageal reflux disease
GO gene ontology
GWAS genome‐wide association study
H&E hematoxylin and eosin
H3K4me3 trimethylation of lysine 4 on histone H3
IF immunofluorescence
ILC2 Group 2 Innate lymphoid cells
iNKT invariant natural killer T cell
JAK Janus kinase
KD knockdown
KLK kallikrein
LRRC31 leucine‐rich repeat‐containing protein 31
MBP major basic protein
NHE sodium‐hydrogen exchanger
NL Normal healthy control
pHi intracellular pH
PPI Proton pump inhibitor
PPI‐REE proton pump inhibitor‐ responsive eosinophilic esophagitis

xii
RNAseq RNA sequencing
SFED Six‐food elimination diet
SLC Solute carrier family
SNP single nucleotide polymorphisms
STAT Signal transduction and activator of transcription
TEER Trans‐epithelial electrical resistance
TFBS transcription factors binding site
TGFB1 Transforming growth factor, beta 1
TSLP Thymic stromal lymphopoietin

xiii
List of Figures and Tables
Figure 2‐1. SLC9A3 is the most upregulated transmembrane transporter activity gene in the EoE
transcriptome, and levels correlate with EoE severity and DIS .................................................................. 69
Figure 2‐2. Increased SLC9A3/NHE3 expression and activity in primary esophageal epithelial cells derived
from EoE biopsy in response to IL‐13. ........................................................................................................ 72
Figure 2‐3. Mature stratified squamous esophageal epithelium model using EPC‐ALI culture system. .... 74
Figure 2‐4. Increased SLC9A3/NHE3 expression and activity in IL‐13–stimulated EPC2‐ALI. ..................... 76
Figure 2‐5. Blockade of NHE3 protected EPC2‐ALI from IL‐13–induced dilated intercellular spaces (DIS).
.................................................................................................................................................................... 78
Figure 2‐6. Demographics of patient cohorts examined in RNAseq analysis or qPCR. .............................. 80
Figure 2‐7. GO analysis of dysregulated genes in EoE patients .................................................................. 82
Figure 2‐8. IL‐13–induced proliferation in EPC2‐ALI is attenuated by NHE3 inhibitor EIPA. ...................... 84
Table 2‐1. Expression level of 572 genes dysregulated in mature EPC2‐ALI by IL‐13. ................................ 86
Table 2‐2. GO analysis of IL‐13–induced dysregulated genes in mature EPC2‐ALI. ................................. 101
Figure 3‐1. STAT binding site is one of the most enriched TFBS in EoE dysregulated genes .................... 125
Figure 3‐2. STAT binding site is the most enriched in both dysregulated genes and transcriptionally active
genes following 4hr incubation with IL‐13 in EPC2‐ALI ............................................................................ 128
Figure 3‐3. STAT3 is the most upregulated STAT protein in 4hr IL‐13 treated EPC2‐ALI. And STAT3 binding
site is the most enriched TFBS in IL‐13‐induced upregulated genes. ....................................................... 130
Figure 3‐4. STAT3 and STAT3‐related genes regulate barrier integrity of esophageal epithelium .......... 132
Figure 3‐5. IL‐13 induced STAT3‐dependent genes are involved in IL‐13 induced cell proliferation ....... 135
Figure 3‐6. IL‐13 induced STAT6‐dependent genes are involved in cytokine production but not IL‐13
induced cell proliferation .......................................................................................................................... 138

xiv
Figure 3‐7. Proposed mechanism of IL‐13 driven STAT3 and STAT6 dependent transcriptome alteration in
esophageal epithelium .............................................................................................................................. 142
Figure 4‐1. Acid protection mechanism in esophagus .............................................................................. 160
Figure 4‐2. JAK/STAT signaling pathway ................................................................................................... 162
Figure 4‐3. Proposed Mechanism of IL‐13 induced NHE3‐dependent DIS formation in EoE ................... 164

15
1 Chapter I: Introduction
1.1 Eosinophilic Esophagitis
1.1.1 Introduction
In the past 20 years, Eosinophilic Esophagitis (EoE) has been increasing in prevalence worldwide. Its
prevalence reached 0.5‐1 in 1000 in 20141, which is similar to diseases including the inflammatory bowel
diseases, Ulcerative colitis and Crohn’s Disease. Observed in both pediatrics and adults, EoE is
characterized by esophageal eosinophilia, leading to symptoms such as dysphagia, food impaction, and
abdominal pain2. In 2015, patients with EoE cost an estimated $1.4 billion per year in United States3.
However, with such high health‐care cost, the current therapeutic options for EoE is still not optimal.
EoE patients who are on a food elimination diet still suffered from the low quality of life, with chances of
disease remission. As a result, better therapeutic strategies need to be developed. The following section
will focus on the current knowledge of the pathogenesis of EoE and the available therapeutic options.
1.1.2 Pathogenesis of EoE
1.1.2.1 Food allergens
Food is considered as one of the major triggers for EoE4. Different than usual food allergy, EoE patients
are usually hypersensitized with multiple food allergens5,6. However, a case study on 30 children
identified close association with food allergies with EoE occurrences7. Also, direct food allergen extract
injection in the esophagus in EoE patients caused acute EoE symptoms including luminal obstruction and
mucosal blanching8. The causative role of food allergens in EoE is further supported by the success of
food elimination diet in the treatment of EoE9. Multiple clinical studies showed that elimination of
positive foods identified in skin prick or patch testing led to resolution or partial improvement of

16
symptom in confirmed in EoE patients while introducing these foods back to diet caused the re‐
emergence of esophageal eosinophilia10‐13.
1.1.2.2 Environmental factors
Multiple clinical investigations have reported that a high percentage of EoE patients are sensitized to
both food allergens and aeroallergens5,14, suggesting the involvement of environmental factors like
aeroallergen as risk factors to induce EoE. To further support for this argument, a case study reported an
EoE patient hypersensitized to an aeroallergen but did not have food allergy15. In addition, three other
patients reported the onset of EoE following exposure to a large volume of aeroallergen16, suggesting
potential that environmental antigens can induce EoE. Consistent with this argument, repetitive
challenge of mice with Aspergillus. Fumigatus intranasally17 or epicutaneously18 could prime pathological
changes including eosinophils infiltration and epithelial hyperplasia in the esophagus, similar to the
histological phenotype of EoE patients19.
Aside from aeroallergens, other environmental factors including insects, season and early life exposure
have also been shown to correlate with the incidence rate with EoE. Furthermore, epidemiology studies
have reported that EoE occurrence is related to geographical regions20 and climate zone20, indicating EoE
prevalence being significantly higher in urban and suburban areas within the cold climate zone.
1.1.2.3 Genetic Predisposition
Although a non‐Mendelian pattern of heritance in EoE patients, epidemiology studies have reported a
high occurrence of EoE in European descent, male individuals suggesting a potential genetic
predisposition21,22. A clinical study investigating five families of EoE patients found that 40% of patient’s
first‐generation offspring showed EoE or EoE‐like symptoms23. Furthermore, twin and family analysis
within 914 families with genetic risk showed the heritability of EoE within first‐degree relative is as high
as 72%, and the recurrence risk ratios are higher in male relatives24.

17
One of the explanations for family inheritability of EoE is the genetic susceptibility. By performing
genome‐wide association (GWAS) studies comparing EoE patients and healthy controls, genome
associated single nucleotide polymorphisms (SNPs) have identified in several EoE‐related genes25.
Variants of both inflammatory‐related genes (Thymic stromal lymphopoietin (TSLP)26,27, Cytokine
receptor‐like factor 2 (CRLF2)27, Chemokine ligand 26 (CCL26)28 and Transforming growth factor, beta 1
(TGFB1)29) and barrier‐forming gene (Filaggrin (FLG)30 and Calpain 14 (CAPN14)31) are found genome‐
wide associated with EoE patient cohorts. Other studies such as Phenome‐wide association study
identified more SNPs in EoE patients32. However, the involvement of these SNPs in EoE need further
confirmation32.
1.1.2.4 Immunological pathways
Although being induced by food allergens, different from most common food allergic disorders, EoE is a
Type‐2 T‐cell‐mediated, eosinophils‐predominant immunological disorder33. Also, one crucial histological
observation in EoE is more than 15 eosinophils infiltration per high power field (Eos/HPF) in esophageal
biopsies, suggesting the contribution of immunological responses in the pathogenesis of EoE34.
Immunoglobulin
Different than 80% of food allergic disorders, EoE is considered as a non‐IgE‐mediated hypersensitivity35.
Experimental studies in mouse model systems have revealed that allergen‐induced EoE phenotypes such
as esophageal eosinophilia do not require B cells36 and IgE37. Also, a clinical study reported no alteration
of eosinophil counts on patients receiving anti‐IgE therapy, while discovered increased serum level of
IgG4 against food allergen38. Furthermore, a recent study found increased IgG4 plasma cell density in
pediatric EoE patients’ esophageal biopsies compared to normal healthy control39. Together with the
finding that food‐specific IgG4 is decreased in EoE patients after receiving diet elimination therapy40,
IgG4 is considered associated with the development of EoE.

18
Immune cells
Eosinophils
Under physiological condition, eosinophils are absent in esophagus. While in EoE patients, eosinophils
present in both the proximal and distal esophagus41 and often associated with morphologic
abnormalities42. Activation of eosinophils leads to the release of granule contents including major basic
protein (MBP), Eosinophil‐derived neurotoxin (EDN), and eosinophil cationic protein (ECP), which have
proinflammatory and cytotoxic effects43. Increased EDN deposition is observed in adult EoE patients44,
and its activation effect on dendritic cells may lead to the production of immunological mediators45.
Also, activated eosinophils can generate inflammatory cytokines (including IL‐5, IL‐13, TGF‐beta 1)43,
which modulate the polarization, recruitment, and homeostasis of lymphoid cells like T cells46. Also,
eosinophils could act as antigen presenting cells and induce antigen‐specific T cell proliferation47.
Overall, increased intraepithelial eosinophils could regulate both innate and adaptive immune responses
in the esophagus, thus directly affect pathological development in EoE.
T Cells (T helper cells, T regulatory cells)
T cell involvement in EoE is derived from the observation of increased T cell number and Th2 cytokine
secretion in patients’ esophageal epithelium48,49. It is further supported by T‐cell deficient murine model,
which was protected from EoE phenotype, while B‐cell deficient mice developed EoE as wild‐type36.
More specifically, CD8‐deficient mice are not protected from the induction of experimental EoE while
CD4‐deficient mice showed less EoE phenotype36, indicating T helper cell involvement rather than
cytotoxic T cell. A clinical evaluation comparing nonatopic children with pediatric EoE patients showed
increased IL‐5 expressing CD4+ T cells, but not IFN‐γ CD4+ T cells, indicating a skewed immunological
pathway toward Th2 immunity50. These increased Th2 cells in EoE patients then led to increased
secretion of Th2 cytokines including IL‐5 and IL‐1351. IL‐5 regulates genes that are essential for

19
eosinophil growth, survival and effectors functions52, which is critical for the accumulation of
intraepithelial eosinophils53 in the esophagus. IL‐13 contributes to increased expression of Eotaxin‐328,
which is a chemokine that is important for eosinophils activation and recruitment, and alteration of
esophageal epithelium transcriptome54.
Regulatory T cells (Treg) are a subset of T cells that negatively regulate immune responses55. Previous
studies indicated a protective role of Treg in allergic disorders56. Decreased Treg numbers have been
observed in adult EoE patients57. Also, in an experimental murine model of EoE, Treg number were
reported to be decreased in mice following allergen challenge58, suggesting a negative regulation of anti‐
inflammatory effect in EoE. However, increased Treg numbers were reported in pediatric EoE
patients59,60. It is speculated that these Tregs in EoE patients are defective33. Also, previous study
indicated Th2 cell sensitivity in responding to Treg regulatory effect in allergic patients61, which might
explain the reason of increased Tregs in pediatric EoE. However, further studies to compare the
difference of Tregs in pediatric and adult EoE patients are needed to characterize the role of Treg in EoE
better.
Basophils
Basophils, as the least abundant granulocyte in peripheral blood, have been reported deeply involved in
allergic disorders such as atopic dermatitis62, acute hypersensitivity63, and asthma64. In EoE patients,
basophil numbers were increased in PPI‐non‐responsive EoE patients37,65 and positively correlated with
severity of eosinophilia in esophageal biopsies37. Patients who underwent steroid treatment and
showed relief of symptoms showed reduced basophil counts65. Basophils are known to generate Th2
cytokines including IL‐4 and IL‐13, and basophil‐secreted IL‐4 is essential for T cell differentiation into
Th2 cells66. Studies using experimental EoE mice model further validate the importance of basophils in
Type‐2 inflammatory responses, as mice depleted of basophils showed decreased eosinophil population

20
and Th2‐cytokine skewed transcriptome compared to wild‐type mice37,67. Together, basophils may serve
as a therapeutic target for EoE based on its effect on the development and progression of Th2
inflammatory responses68.
Mast cells
Although EoE is an IgE‐independent allergic disorder, mast cells are still deeply involved in the
immunological pathways of EoE69. Mast cell number and degranulation are significantly increased in
esophageal mucosa in both EoE patients70 and experimental EoE murine models71 and could be reversed
by steroid treatment69 and food elimination therapy72. Human mast cells are shown to produce IL‐13,
which is an important cytokine for EoE pathogenesis, upon high‐affinity IgE‐crosslinking73. Mast cells
could also form “allergic effector unit” together with eosinophils, which resulted in augment of activity
of both cells, increase expression of soluble mediators like TNF‐α and promote allergic responses74,75. By
comparing mast cell‐deficient and mast cell‐reconstituted mice, a recent study indicated that mast cells
contribute to the pathogenesis of allergen‐induced EoE in mice by promoting smooth muscle
hyperplasia and hypertrophy71. It is also suggested that the mast cells contribute to the pathogenesis of
EoE by influencing KIT ligand expression69, secreting cytokine that leads to increasing esophageal
contractility76.
ILC2s
In EoE patients, Group 2 Innate lymphoid cells (ILC2s) percentage is much higher than normal healthy
control and is correlated with the level of esophageal eosinophilia77. ILC2s are linage‐negative cells that
produce Type‐2 inflammatory cytokines and contribute to human allergic diseases78. Activated by
epithelial secreted cytokines such as IL‐33 and TSLP79,80, ILC2 cells are considered to play a pathogenic
role in EoE81 due to its ability to secrete type 2 cytokines IL‐5 and IL‐1382, which are previous
characterized contribute to the progression of EoE.

21
iNKT Cells
Another cellular source for Th2 cytokines is invariant natural killer T cells (iNKTs). In pediatric EoE
patients, increased iNKTs are observed in esophageal biopsies, while decreased in peripheral blood83.
CCL5 is a member of C‐C chemokine family, and previous studies showed that CCL5 important for
eosinophil recruitment and activation84,85. Upon stimulation of food allergen, iNKTs isolated from EoE
biopsies are activated and producing higher CCL5 compared to normal healthy control83. Consistent with
other cells that contribute to EoE, patients received elimination diet therapy showed reduction of iNKTs
in esophageal epithelium86. Moreover, the failure of inducing EoE phenotype in iNKT cell‐deficient mice
further support the crucial effect of iNKTs in EoE pathogenesis87.
Cytokines
A variety of cytokines are elevated in EoE patients, especially Th2 cytokines including IL‐4, IL‐5, and IL‐
1349. In this section, we will focus on other cytokines, and discuss IL‐13 in the next section.
IL‐4
IL‐4 is known to activate naïve T cells and promote its proliferation and differentiation into Th2 cells88. In
EoE patients, the blood level of IL‐4 is significantly higher than healthy controls51. However, multiple
studies showed no significant increase of the mRNA level of IL‐4 in biopsy samples from EoE patients51,54.
These different observations might be explained by the allergic status of EoE patients recruited. A study
comparing EoE patients with or without allergic symptoms showed the increased IL‐4 level is attributed
to the presence of allergy but not EoE51. Given the critical role of IL‐4 in CD4+ Th2 differentiation, it
could mainly act to induce naïve T cells differentiation in EoE as in other allergic disorders89.
IL‐5

22
Similar to IL‐4, IL‐5 levels are increased in EoE patients90 and significantly higher in EoE patients with
allergic symptoms51. One of the main contributions of IL‐5 in the pathogenesis of EoE is its function of
recruiting eosinophils into the esophageal epithelium, which is partially dependent on eotaxin
expression53. Also, recent generated transgenic mice with specific epithelial IL‐5 overexpression
successfully resembled an EoE phenotype that is not restricted to eosinophilia91, but also tissue
remodeling. Comparison between T cell‐specific IL‐5 transgenic mice and eosinophil linage‐deficient
mice suggested that IL‐5 induced eosinophilia is important for tissue remodeling including collagen
deposition in lamina propria, basal layer thickening in epithelium90, while IL‐5 induces esophageal
dysmotility92 is independent of eosinophilic inflammation in the esophagus. However, although clinical
trial testing Anti‐IL‐5 antibody (mepolizumab) showed a significant decrease of esophageal eosinophilia,
minimal symptomatic remission was observed in EoE patients93. Taken together, IL‐5 drives eosinophil
recruitment and induces esophageal epithelium remodeling in EoE, but both IL‐5 and eosinophils are not
the only key driver of the disease.
IL‐33
IL‐33 is a newly discovered cytokine that belongs to IL‐1 cytokine superfamily. It could be secreted by
stromal cells like endothelial and epithelial cells94, as well as immune cells like macrophages95. After
binding to its receptor ST2 (IL‐1RL1), IL‐33 could either act as a traditional cytokine that mediates
intracellular signaling pathways like NF‐κB or serves as a nuclear factor that mediates transcription of
downstream genes96. ST2 is ubiquitously expressed in all human tissue97 and was upregulated after
allergen challenge98. The activation of the IL‐33/ST2 axis is known to induce Th2 cytokines secretion
including IL‐4, IL‐5, and IL‐13, which are critical cytokines in EoE pathogenesis99.
Not surprisingly, the expression level of IL‐33 and ST2, are upregulated in pediatric EoE patients67,100, and
IL‐33 is primarily located in CD45‐ cells, mast cell, and epithelial cells101. Experimental murine EoE model

23
also showed elevated IL‐33 and ST2 level67, which is critical for basophil‐induced esophageal
inflammation. Mice treated with rIL‐33 for a week developed early stage phenotype of EoE and showed
elevated Th2 inflammatory response101. IL‐33‐deficient and ST2 deficient mice showed decreased
eosinophil counts in peripheral blood compared to wild‐type mice, indicating the role of IL‐33 in the
early development of eosinophils102.
Thymic stromal lymphopoietin (TSLP)
TSLP is an IL‐7 like cytokine that functions through binding to its receptor TSLPR. It is expressed by
epithelial cells and could prime dendritic cells to differentiate naïve T cells into Th2 cells103. It is also
showed to target NKT cells, mast cells and basophils, thus contribute to the development of various
allergic disorders104,105. In EoE patients, TSLP is upregulated and primarily expressed in the suprabasal
layer of esophageal epithelium106, but not elevated in serum107. The level of TSLP is dependent on NF‐kB‐
inducing kinase (NIK), as NIK knockout model which mimics EoE phenotype showed elevated TSLP
level108. Interestingly, TSLP polymorphism was identified in EoE patients109 and a recent study linked this
risk polymorphism with food allergen susceptibility110 and increased basophil activation in EoE37. Also,
employing experimental murine model investigators demonstrate that inhibition of TSLP and basophil
interaction was protective against EoE‐phenotype37, suggesting the importance of TSLP‐basophil axis in
EoE. Furthermore, TSLP is shown to induce the formation of eosinophil extracellular traps (EET)105. EET is
a protective mechanism against bacteria and pathogens, a recent study indicated a possible contribution
of increased EET numbers and impaired epithelial barrier in the esophagus in EoE111.
Tumor Growth Factor‐beta 1 (TGF‐β1)
TGF‐β1 secreted by eosinophils, mast cells, and epithelial cells can induce extracellular matrix secretion
of fibronectin and collagen I in primary fibroblasts derived from biopsies from EoE patients112. TGF‐β1 is
thought to promote subepithelial fibrosis and vascularity through phosphorylation of SMAD2/3113 and

24
p38 mitogen‐activated protein kinase (MAPK)112. TGF‐β1 is also thought to promote epithelial‐
mesenchymal transition (EMT) which contributes to fibrosis often observed in the EoE esophagus114. The
lamina propria fibrosis occurring in both pediatric115 and adult116 EoE patients is thought to contribute to
strictures and esophagus narrowing117.
1.1.2.5 Epithelium Involvement
Normal esophageal epithelium is composed of non‐keratinized stratified squamous epithelial cells.
Under physiological conditions, esophageal epithelial cells form a functional barrier and protect the
esophagus from injury118. Under allergic conditions such as EoE, epithelium formed barrier is disrupted
by protease‐active allergens or altered intrinsic proteases119, lead to antigen penetration and initiate
inflammatory responses through antigen presenting cells120. This disruption of epithelium also leads to
activation of the immune response of esophageal epithelial cells. Esophageal epithelial cells are capable
of producing inflammatory cytokines and chemokines including CCL5, CCL26, TSLP and IL‐33 upon
allergen challenges28,101,121. These molecules are important in mediating pathogenesis of EoE, which are
discussed in later sections.
Transcriptome analysis comparing esophageal biopsies from EoE patients and normal healthy control
using RNAseq showed 1607 dysregulated genes122 that might have related to EoE pathogenesis. Gene
cluster and ontology analysis indicated that immune response and immune effector process are the two
most enriched gene ontology (GO) nodes within these dysregulated genes122. Consistent with this
analysis, multiple studies showed the inflammatory contribution by the esophageal epithelium123. The
expression level of eotaxin‐3 is 53‐fold higher in EoE patients compared to normal health control28.
Encoded by CCL26 gene, Eotaxin‐3 is a chemokine secreted by esophageal epithelium upon the
activation of IL‐1354 The local secretion of CCL26 is known to promote the recruitment of
eosinophils124,125, which is a hallmark characteristic of EoE. Mice deficient of the eotaxin‐3 receptor

25
(CCR3) are protected from aeroallergen induced eosinophilia in esophagus28, implicating the importance
of CCR3/CCL26 axis in esophageal eosinophilia. Other immune response‐related genes, tumor necrosis
factor alpha‐induced protein 6 (TNFAIP6) and arachidonate 15‐lipoxygenase (ALOX15), are also found
highly expressed in the esophageal epithelium in EoE biopsies. The previous study in cancer research
suggested a potential role of ALOX15 in suppressing inflammation126. Meanwhile, TNFAIP6 was also
thought to play a protective role in inflammation in rheumatoid arthritis127. It is possible that they
counteract with other immune responses in esophageal epithelium. However, their actual mechanism in
inducing EoE phenotype are still unclear128.
Another group of genes that are significantly altered are epithelial barrier related genes. Several genes
encode for junctional proteins, adhesion molecules and structural barrier proteins are downregulated in
EoE patients129. Two major components of the epithelial barrier, E‐cadherin and claudin‐1 are decreased
in expression in EoE patients, while occludin is increased123. Interestingly, occludin is showed to regulate
cytokine‐induced barrier permeability in epithelial cells130. Other molecules related to epithelium barrier
functions such as filaggrin (FLG)128,131,132 and Desmoglein‐1 (DSG1)133 are also found decreased in
expression in EoE patients. The downregulation of these barrier related genes contributes to the loss of
barrier integrity and epithelium remodeling133,134. These alterations in epithelium may then lead to
increased penetration of antigens in esophageal mucosa120, and lead to further immunological
responses. However, either the epithelial barrier disruption in EoE is causative or consequential of
immunological activation is still debatable.
1.1.3 Therapy
1.1.3.1 Steroids
Corticosteroids are the first‐line medical therapies in EoE patients135. Administration of systemic
corticosteroid therapy to 20 EoE patients Induced significant remission of esophageal eosinophilia and

26
improvement of clinical symptoms in 19 out 20 patients 136. The most common steroids used to treat
EoE are fluticasone and budesonide137, all of which are topical administered steroids. A clinical study
investigating the long‐term effect of steroids demonstrated that swallowed fluticasone is effective in
maintaining histological, endoscopic and symptomatic improvement in pediatric EoE patients over two
years, without significant adverse effect138. In the meantime, double‐blind, placebo‐controlled clinical
trial suggested the effectiveness of budesonide in treating EoE in adolescent and adult EoE patients116.
The systemic steroids are now not recommended for EoE treatment, as it has no advantage on
treatment efficacy compared to the topical steroid while producing systemic adverse effects such as
hyperphagia and weight gain139. While topical steroids are supported by 11 randomized clinical trials for
its effectiveness on histological remission in EoE140, its efficacy on resolving EoE symptoms is still
debatable. A Recent clinical study showed EoE patients receiving fluticasone treatment had no
significant improvement in dysphagia compared to patients receiving placebo, however also developed
esophageal candidiasis141. This lack of symptomatic resolution may be related to the lack of mucosal
contact time and the formulation of steroid137,142. The other caveat of this treatment is that the
cessation of taking topical steroid will lead to the recurrence of disease143. However, current clinical
trials showed that long‐term use of topical steroids is relatively safe and could maintain EoE in
remission140.
1.1.3.2 Dietary Intervention
Food allergen or aeroallergen are used in the experimental murine model to induce EoE17, and most EoE
patients showed hypersensitivity to various foods, different dietary antigen removal methods to treat
EoE are tested over last two decades.
Use dietary intervention to treat EoE was described in 1995. Ten patients with esophageal eosinophilia
receiving protein‐free, amino based elemental diet and demonstrated remission of EoE symptoms144.

27
Since then numerous clinical trials have supported the effectiveness of this elemental diet and
demonstrated significant improvements in both histological and symptomatic scores in EoE in all age
groups145‐147. Also, elemental diet sometimes requires the insertion of nasogastric (NG) tube in pediatric
and adolescent patients, which negatively impact patients’ quality of life148. Together, elemental diets
are not recommended for long‐term therapy of EoE140 until other treatment options were proven
ineffective.
Food elimination diet is an alternative to elemental diet for EoE therapy. Six‐food elimination diet (SFED)
and food allergy testing‐directed diet are found effective to induce EoE remission149. Six foods, including
dairy, wheat, egg, soy, nuts, and seafood, are known as the most common inducer for food allergy and
esophageal mucosal injury10,12. A recent study indicated SFED is more cost‐efficient than steroids,
combined with their similarity on efficacy, SFED might be a better option for treatment of EoE150. Food
allergy testing‐directed diet is based on either skin prick tests (SPTs) or atopy patch tests (APT)10, which
are based on IgE‐mediated skin response. Together with the relatively low specificity of these tests,
testing‐based food elimination diet showed relatively less effectiveness compared to SFED147.
1.1.3.3 Proton Pump Inhibitor
Proton pump inhibitor (PPI) was first used as a diagnostic tool for EoE to distinguish the disease from
gastroesophageal reflux disease (GERD), as earlier criteria for EoE is its unresponsiveness to PPI
treatment151. In 2011, a clinical study in adults with high esophageal eosinophilia and EoE‐like symptoms
reported that 50% of these patients had clinicopathologic remission152. This discovery, together with
prior success cases using PPI to resolve EoE‐like symptoms153, define a new subtype of EoE, proton pump
inhibitor‐ responsive eosinophilic esophagitis (PPI‐REE). PPI‐REE patients showed similar disease
phenotypes immunological mechanisms and transcriptome154,155. Long‐term application of PPI in PPI‐REE
showed sustained remission of EoE phenotype with no substantial side effect156. Analyses of 94 EoE

28
related genes based on EoE diagnostic panel (EDP), the patient cohort with PPI‐REE showed similar
molecular overlap with patients with PPI‐unresponsive EoE155. Interestingly, comparing the
transcriptional change before and after PPI‐treatment, PPI showed an effect on Th2‐inflammation‐
related gene expression157. The mechanism of how PPI influences inflammatory response is unclear. In
vitro study using primary esophageal epithelial cells showed the inhibitory effect of PPI on IL‐13 induced,
STAT6‐dependent eotaxin‐3 expression158. However, this does not explain the different responses to PPI
between PPI‐REE and EoE patients. Interestingly, a recent study showed that EoE patients showed
remission of disease after elimination diet therapy also respond to PPI treatment159. Together with its
clinically proved safety profile and easy oral administration, PPI is now used as first‐line anti‐
inflammatory therapy for EoE, although the underlying mechanism still yet to be elucidated140.
1.1.4 Summary
To summarize, EoE is a chronic, Th2‐inflammatory response‐mediated, allergic disorder in the esophagus
with increasing prevalence. Multiple factors are involved in the pathogenesis of this disease, so targeting
only one component always lead to the unsatisfied therapeutic outcome. Further understanding of the
underlying molecular pathways that drive disease development will help to create more specific and
efficient therapeutic options for EoE.

29
1.2 Interleukin‐13 (IL‐13)
1.2.1 Introduction
IL‐13 is a pleiotropic cytokine that was first described as a protein secreted abundantly by Th2 cells and
influences growth and inflammatory pathways160. IL‐13 is 132 amino acids long protein that contains a
four α‐helical bundle “up‐up‐down‐down”, which is characteristic of type‐I cytokine161. Structural studies
have found 25% homology in amino acid sequences between IL‐4 and IL‐13 which is likely to contribute
to the similar tertiary structure162. These shared homologies also explain the functional resemblance
between these two cytokines. For instance, both IL‐4 and IL‐13 could signal through Type II IL4
receptor163.
1.2.2 Production of IL‐13
IL‐13 is secreted by activated Th2 cells, and later studies found additional sources of IL‐13. mRNA
transcript analysis indicated that, under allergic conditions, IL‐13 could be released by mast cells,
basophils, and eosinophils, and acted as an early source of Th2 cytokines164. ILC2 cells, which are
recently identified as another major source for Th2 cytokine, are a prodigious source of Il‐13165. Other
cell types also contribute to the production of IL‐13 during type‐2 inflammation. For example, in an
oxazolone colitis model IL‐13 is produced by natural killer T (NKT) cells166 when stimulated by α‐
galactosylceramide (α‐GalCer).
1.2.3 IL‐13 signaling pathway
1.2.3.1 IL‐13 Receptors
IL‐13 achieve its biological function through binding to an IL‐13 receptor on the surface of effector
cells167. IL‐13 can bind to two receptors; Type II IL4 receptor which is composed of two subunits, IL‐4
receptor α chain (IL‐4Rα)168 and IL‐13 receptor α1 chain (IL‐13Rα1)169. It can bind to both IL‐4 and IL‐13,

30
explaining the overlapping biological of IL‐4 and IL‐13161. Interestingly, the cross‐competition experiment
showed that IL‐13Rα1 is specific to IL‐13 but not IL‐4, and IL‐13Rα1/IL‐4Rα receptor heterodimer
showed higher affinity to IL‐13 than IL‐4170. Also, IL‐13Rα1 expression level could be regulated by
microRNA‐31 and microRNA‐155, and downregulation of the receptor expression leads to an inhibitory
effect on IL‐13 signaling171.
IL‐13 can also bind Type II IL‐13 receptor which is encoded by IL13RA2 gene. IL‐13Rα2 is 380 amino acid
long and share some homology with IL‐5 receptor172. Different than ubiquitously expressed IL‐13Rα1, its
transcript was observed in human liver, lung, thymus, placenta, brain, and heart173. Research studying
murine IL‐13Rα2 (mIL‐13Rα2), which shared 59% amino acid identity with human version, showed an
inhibitory effect of mIL‐13Rα2 on IL‐13 induced splenocyte activation173. The fact that injection of
soluble IL‐13Rα2‐Fc fusion protein failed to expulse parasite N. brasiliensis from mice further supported
the neutralizing effect of IL‐13Rα2 on IL‐13, as this parasite expulsion is dependent on IL‐13 activation174.
Human IL‐13Rα2 is proved to be an IL‐13 decoy receptor, which internalized after binding to its ligand175.
1.2.3.2 JAK/STAT pathway
When IL‐13 is secreted, it first binds to IL‐13Rα1 and leads to heterodimerization with IL‐4Rα chain,
which forms Type II IL4 receptor complex. After the formation of Type II IL4 receptor, IL‐13 could signal
through activating Janus kinase (JAK)/ Signal transduction and activator of transcription (STAT)
pathway176.
JAKs are a group of tyrosine kinases which consists of 4 family members, JAK1‐3, and Tyk2177. IL‐13
signaling through Type II IL4 receptor activates JAK1 and Tyk2178, which results in phosphorylation in the
cytoplasmic domain of IL‐4Rα chain provide docking sites for signaling molecules such as STATs179. STAT
proteins are transcription factors that are presented in cytoplasmic compartments. When recruited by
activated JAKs, STAT proteins are phosphorylated and form homodimers180. This activated form of STAT

31
complex will then recruited into the nucleus, binding to conserved gamma‐activated sites (GAS) motif in
the promoter area of cytokine‐inducible genes and activate gene transcription181.
In 1996, IL‐13 was shown that not able to increase MHCII expression and decrease Nitro Oxide (NO)
production in macrophages derived from STAT6 knockout mice, suggesting its signaling dependency on
STAT6182. When STAT6 gets recruited to IL‐4Rα chain, it will be phosphorylated and activated. The
activated STAT6 monomers will then dimerized and translocate to nuclei, where it will bind to promoter
areas of genes that have pro‐inflammatory functions161.
Close investigation on the cytoplasmic domain of IL‐13Rα1 chain identified tyrosine residue that had a
consensus sequence for binding of STAT3 docking domain. IL‐13 treatment of myeloid cells showed an
increase of STAT3 phosphorylation and activation, that was dependent on the presence of IL13Rα183,184.
IL‐13 induced STAT3 activation is thought to be dependent on p38 MAPK phosphorylation, as
pharmacological inhibition of p38 MAPK leads to significant decrease of STAT3 phosphorylation and DNA
binding185. The importance of IL‐13 dependent STAT3 activation remains unclear. One of its potential
roles is the regulation of keratinocyte differentiation, as demonstrated by a study using JAK inhibitor
that blocks STAT3 activation186.
Other stat proteins, including STA1α, 5A, 5B, are also showed increased phosphorylation in human
monocytes upon IL‐13 treatment187. IL‐13‐induced STAT1 α activation is related to 15‐lipoxygenase
expression, which is essential for inflammatory mediator generation in atherosclerosis185. The role of
STAT5a/b in IL‐13 signaling pathway is unclear, but the activation of STAT5 contribute to B cell
proliferation and gene regulation when induced by IL‐4188.
Extracellular signal‐regulated kinase (ERK)
ERK1 and ERK2 are two protein kinases that belong to MAPK family. These two proteins share 84%
sequence homology and have similar functions, thus generally referred to as ERK1/2. As most MAP

32
kinases, ERK1/2 catalyzes phosphorylation of different substrates and initiates activation of downstream
pathways189. In pancreatic and ovarian cancer cells, IL‐13 promotes cancer metastasis in a STAT6‐
independent pathway, through its interactions with IL‐13Rα2 and activation of ERK1/2 pathway190,191.
Furthermore, the similar signaling pathway is observed in IL‐13 induced lung inflammation192.
1.2.3.3 Other regulators of IL‐13 signaling
IL‐13 could induce NF‐κB activation in different types of cells. In human bronchial smooth muscle cells,
IL‐13 induces NF‐κB p65 translocation in IκB kinase (IKK)‐dependent pathway193. In the meantime, in
pancreatic stellate cells, IL‐13 is shown to regulate TGF‐β1 expression by suppressing NF‐κB transcription
activity194.
IL‐13 can induce increased IL‐13Rα2 expression in human keratinocytes. This process is dependent on
ERK, p38 MAPK, JAK2 and STAT6 activation, which is an IL‐13Rα1‐dependent pathway195. As a result, it is
fair to speculate this pathway acts as a negative feedback pathway that controls the level of IL‐13
activation. This statement is further supported by TGF‐β1’s augment effect on IL‐13, which is achieved
through decreasing IL‐13Rα2 expression196.
1.2.4 IL‐13 function under physiological and pathological conditions
The primary function of IL‐13 is to promote inflammatory responses197. Under physiological conditions,
IL‐13 and other Th2 cytokines are essential for parasite expulsion198. By employing experimental murine
model, a study showed IL‐13’s protective role against a variety of intestinal nematode parasite through
activating both bone marrow‐derived and non‐bone marrow‐derived cells199.
Under pathological conditions, in most immunological disorders, the IL‐13 level is significantly elevated.
The increased circulating IL‐13 can promote B cell activation, induce immunoglobulin isotype switching
and synthesis, and contribute to IgE‐mediate allergic diseases200 like asthma. It could also activate non‐

33
hematopoietic cells like airway epithelial cells, and lead to increased mucus secretion and airways
hyperresponsiveness201.
Different than its function in promoting immune responses, IL‐13 serves as a suppressor for tumor
immunosurveillance. Mouse tumor models identified IL‐13’s inhibitory role in cytotoxic T cells‐mediated
tumor clearance. Also, IL‐13 is also showed to decrease E‐cadherin expression in colon cancer cell line,
which decreases cell adhesion and contribute to tumor metastasis202.
Not only altered IL‐13 level leads to disease progression, but altered expression of IL‐13 receptor also
causes diseases. In glioblastoma, IL‐13Rα2 is highly expressed and associated with increased malignancy
grade and poor patient prognosis203. Recently, immunotherapeutic approaches targeting IL‐13Rα2 have
been widely developed, and clinical trials showed positive outcomes in improving patients’ survival rate
and quality of life204.
1.2.5 IL‐13 in EoE
The potential pathogenic role of IL‐13 in EoE is first suggested by the increased IL‐13 production T cells
and eosinophils in EoE patients compared to normal healthy controls48,205. It is further supported by
experimental mice experiments, as intratracheal IL‐13 treatment led to increased eosinophil infiltration
and epithelial hyperplasia in a STAT6‐dependent manner206. In addition, transcriptome analysis
comparing EoE‐specific dysregulated genes and IL‐13 induced genes in primary cells derived from EoE
patients established IL‐13’s role in EoE pathogenesis54. This study not only demonstrated that IL‐13
directly regulates EoE‐associated genes, but it also explained the previous established eotaxin‐3
overexpression in EoE28. A study using EoE mice model showed that the deletion of decoy receptor IL‐
13Rα2 exacerbated collagen deposition and circumference in the esophageal epithelium, supporting the
role of IL‐13 in epithelium remodeling in EoE207.

34
Over the last decade, more genes induced by IL‐13 have established their contribution in the
pathogenesis of EoE. Increased IL‐13 in EoE patients lead to the upregulation of Leucine‐rich repeat‐
containing protein 31 (LRRC31)208 and CAPN14209. Also, Adherent proteins such as DSG‐1133, FLG131 and
SPRR330 were all decreased in EoE and downregulated by IL‐13. Together, these genes, altered by IL‐13,
that contribute to barrier disruption and formation suggested the direct role of IL‐13 in influencing
esophageal epithelium barrier in EoE.
1.2.6 IL‐13‐related treatment
Over last decades, different drugs have been developed to target IL‐13 in IL‐13 mediated diseases. IL‐13
IgG4 monoclonal antibody established its ability to decrease eosinophilia in both airway and esophageal
epithelium210. In 2015, clinical trial using intravenous anti‐IL‐13 antibody QAX576 indeed showed
improvement in esophageal eosinophilia and change in disease‐related transcriptome change211.
However, the primary endpoint for this therapy was not met. In 2017, RPC4046, a new antibody against
IL‐13 receptors, established its ability to reduce esophageal eosinophil counts in EoE patients in its phase
II clinical trial212. Also, treatment using antibody Dupilumab, that blocks IL‐4Rα subunit, also showed
relief of intraepithelial eosinophilia, improved symptoms and quality of life compared to the placebo
group in EoE patients213. A small number of clinical trials have been conducted and indicated its safety
and potential ability to relieve symptoms like dysphagia212. More information like the clinical trial result
from larger cohorts is needed, but this new antibody showed a promising result in anti‐IL‐13 therapy in
EoE.
1.2.7 Summary
IL‐13 is a Th2 cytokine that is elevated in EoE patients. It leads to transcriptome changes in EoE, which
contribute to pathological phenotypes such as esophageal eosinophilia and epithelium remodeling.
Targeting IL‐13 in clinical trials showed some positive outcomes in treating EoE. As a result, further

35
understanding IL‐13 signaling pathways in EoE will be beneficial in discovering accurate treatment
options.

36
1.3 Ion transporters
1.3.1 Introduction of Ion transporters
Ion channels and transporters are essential for almost all types of cells due to their functions in
regulating electrolyte concentration inside and outside cells. The concentration of ions is important for
generating electric potential, mediating fluid transport, adjusting cell volume and activating signaling
pathways214,215. Dysregulation of ion transporter activities is pathogenic in many diseases especially in
the lung, gastrointestinal tract, and kidney216‐218.
One of the critical functions of ion transporters is regulating fluid movement through changing ion
concentrations219. Mucociliary clearance (MCC) plays an important role in maintaining lung functions.
Impaired MCC in juvenile mice showed increased Th2 inflammation in the airway, which contributes to
the development of diseases such as asthma220. Efficient MCC requires the right volume of airway
surface liquid (ASL), which is regulated by the concentration of different electrolytes221. Alteration in
transportation proteins for Na+, K+, Cl‐ or Ca2+ could lead to volume changes of ASL. For instance,
epithelium sodium channel (ENaC) is one of the primary mediators for sodium reabsorption in lung
epithelium. In patients with cystic fibrosis, ENaC is hyper‐activated which lead to depletion of sodium
and then ASL in the surface of airway epithelium, thus cause a decrease of MCC and contribute to the
progression of disease222.
Ion transporters are also known to regulate intracellular signaling pathway. Calcium concentration is
essential for lymphocyte functions, including mast cell degranulation, T cell proliferation and cytokine
production and B cell differentiation223. One of the important calcium concentration regulators in
lymphocytes is calcium release‐activated calcium (CRAC) channel. Patients with CRAC channels mutation
fail to maintain sustained calcium level in lymphocytes, thus unable to induce T cell activation. This yield
to immunodeficiency in patients which lead to life‐threatening infections224.

37
1.3.2 Ion transporters in the esophagus
Unlike other parts of the gastrointestinal tract, the esophagus does not undergo significant secretion
and absorption which requires the deep involvement of multiple ion transportation pathways, as it
mainly acts as conduct for food to pass to the lower GI tract225. However, one of the major functions of
esophageal epithelium is to prevent gastric acids damage the outer esophageal epithelium. As a result, a
set of ion transporters that provides buffering capacity is expressed in esophageal epithelium226,227.
Postprandial acid reflux occasionally happens in esophageal epithelium of normal individuals under
physiological conditions228‐230. To prevent the acid from causing tissue injury, esophageal submucosal
glands and acid‐base transporters in esophageal epithelial cells are activated, which neutralize or
remove acid in the lumen by HCO3‐ delivery or H+ uptake231,232. When esophageal epithelium is exposed
with prolonged episodes of acid refluxate due to dysregulation of the lower esophageal sphincter (LES),
the acid amount might exceed the acid clearance capacity of the esophagus and lead to diseases like
gastroesophageal reflux disease (GERD) and Barrett’s esophagus (BE)233.
BE is a medical condition caused by repeated exposure to gastric acids234, it usually presents with long‐
term GERD symptoms and may progress into esophageal cancer235. The esophageal epithelial cells of BE
patients changed from normal stratified squamous epithelium (ESSE) to specialized columnar epithelium
(BSCE). These two different forms of esophageal epithelium have different electrical parameters, as
BSCE has lower transmembrane electrical resistance and higher secretory capacity236. Further
investigation found decrease activity of sodium‐hydrogen exchanger 1 (NHE1)237,238. The inhibition of
NHE1 leads to increased intracellular acidity, which causes DNA damage that could contribute to cancer
progression239.
Esophageal adenocarcinoma (EA) is one of the most prevalent cancers worldwide with low five‐year
survival rate. Under physiological condition, the apoptosis pathway in esophageal epithelial cells will be

38
activated after long‐term exposure to bile acid240. In cancerous esophageal epithelium, the resistance of
bile acid‐induced apoptosis is dependent on its inhibitory effect on NHE activity241. It is suggested that
NHE‐mediated intracellular sodium increase induce the caspase 3/9 activation, which leads to cell
apoptosis under physiological condition242.
1.3.3 Summary
Ion channels and transporters are expressed in the esophageal epithelium and are predominantly
involved in the regulation of luminal acid. Dysregulation of ion transporters is involved in multiple
diseases including esophagus related diseases. As a result, it is important and necessary to understand
the involvement of ion transporters in the disease context, so they could potentially serve as therapeutic
targets in esophageal diseases.

39
1.4 Sodium hydrogen exchangers (NHEs)
1.4.1 Introduction
NHEs are a group of sodium‐proton exchangers encoded by SLC9 (Solute carrier family 9) gene
families243. Currently, the SLC9 family consists of 9 different isoforms, NHE1 – NHE9. These exchangers
are known for their roles in regulating intracellular pH, and osmotic force mediates by sodium, as they
function through exchanging extracellular Na+ with intracellular H+244.
NHE1, encoded by SLC9A1 gene, is the most widely studied isoform within the SLC9 family. NHE1
consists of 815 amino acids with 12 transmembrane domains245. In humans, it is ubiquitously expressed
and important for pHi regulation246. It is also shown to regulate cell volume by altering osmotic force
through influence sodium concentration247. In myocardial cells, NHE1 is activated by ischemia‐induced
acidosis, which leads to accumulation of intracellular sodium248. This increased sodium concentration
activates the Na+/Ca2+ exchanger NCX, led to cell death due to increased intracellular calcium249.
Consistent with this observation, deletion of NHE1 protects mice from ischemia/reperfusion (I/R) injury,
indicating the pathogenic role of NHE1 in this process250. NHE1 is also involved in cancer progression and
metastasis due to its role in regulating pH of cancer microenvironment251. In light of this, NHE1 inhibitors
including Cariporide are thought to be potent anti‐cancer drugs252. However, no clinical trials have
established this use of NHE1 inhibitors yet.
Other isoforms of NHEs are all restricted expressed in specific tissue types. NHE2‐5 are cytoplasmic
binding proteins, while NHE6‐ NHE9 are specifically expressed on the membranes of organelles. Since
most NHEs shared certain homology with NHE1, although regulated by different molecules, NHE2‐9
proteins all contribute to pH regulation in either cytoplasm or organelle compartments253.
1.4.2 NHE3

40
NHE3 is isoform 3 of SLC9 family, encoded by SLC9A3 gene. It was discovered in 1992 and shared 39%
amino acid sequence to NHE1254. Different than NHE1, NHE3 is majorly expressed in the gastrointestinal
tract and renal tissue255, with some expression in human ovary and testes256.
To distinguish the contribution of NHE3 from other NHEs in disease phenotypes, mice with functional
ablation of NHE3 were generated257. Global NHE3 knockout mice showed slight diarrhea, acidotic blood
and decreased blood pressure, suggesting the role of NHE3 in regulating fluid absorption and acid‐base
homeostasis especially in kidney and gastrointestinal tract257,258.
Located in luminal side of the cellular membrane, NHE3 is responsible for Na+‐mediated fluid
reabsorption in the proximal tubule of kidney259. Also, the NHE3‐dependent H+ secretion is important for
bicarbonate reabsorption in the proximal tubule260. Increased NHE3 expression and activity lead to
increased Na+‐reabsorption, which promotes extracellular fluid volume expansion, thus ended up
causing increased blood flow261. This constant increased blood flow then leads to a supply‐demand
mismatch of blood flow, causing vascular remodeling and resulted in hypertension262. As a result, the
increased NHE3 expression is observed during hypertension in rat models263. Moreover, a study
suggested an elevated NHE3 function in rat with heart failure, suggesting the role of NHE3 in mediating
cardiac dysfuction264. In contrast, mice lacking NHE3 exhibited phenotypes such as urinary salt wasting,
acidosis, reduced blood pressure and hypervolemic shock, indicating the importance of NHE3 in renal
fluid volume homeostasis265.
NHE3 is also shown to be essential for the intestinal Na+ absorption and fluid volume regulation266.
Different than patients with hypertension, patients with diarrhea showed decreased NHE3 expression
and activity267. This could be induced by bacteria secreted enterotoxin, which inhibited NHE3 activity in
cAMP‐dependent pathway261. This decrease in NHE3 activity leads to disrupted osmolarity between
intestinal epithelium, causing the fluid move to intestinal lumen268.

41
Recently, microbiota has been identified to influence the immune and metabolic homeostasis in
gastrointestinal tract269. Previous studies suggested that luminal pH and altered ion transport influence
the composition of gut microbiota270,271. Interestingly, recent studies indicated that altered Na+ and H+
concentration caused by inhibition of NHE3 function not only changes fluid homeostasis but also alters
microbiota composition in GI tract272. This suggests the regulation of NHE3 activity could serve as a
target for alteration of gut microbiota.
NHE3 expression and functions could be regulated by several factors such as hormones and growth
factors273. Parathyroid hormone is shown to inhibit NHE3 activity through phosphorylation and
endocytosis of the protein274, while dopamine can inhibit NHE3 expression and activity via a PKA‐
mediated pathway275,276. In contrast, Angiotensin II, glucocorticoids, and insulin are able to activate
NHE3 activity277.
1.4.3 Summary
In summary, sodium‐proton exchangers are involved in multiple physiological and pathological
conditions. However, the study of their involvement in tissue aside from kidney and intestine are
limited. Considering their role in regulating fluid movement and pH, NHEs could be related to
pathogenesis and histological changes in other diseases, especially in the gastrointestinal tract.

42
1.5 Summary
EoE is a chronic allergic inflammatory disorder with unknown etiology. Esophageal epithelium
remodeling including DIS and BZH is prominent in EoE patients. Clinical studies suggested these changes
could contribute to disease pathogenesis and correlate with symptomatic remission in EoE. However,
the molecular mechanisms underlie the formation of esophageal epithelium remodeling are unclear.
The Type‐2 inflammatory cytokine IL‐13 expression is elevated in EoE and is thought to drive the
transcriptome changes and contributes to histopathological alterations in EoE patients. However, the
molecular mechanisms of how IL‐13 regulates these histopathological changes in esophageal epithelium
remains poorly understood.
The central hypothesis of this dissertation is that IL‐13 causes alteration of the transcriptome in
esophageal epithelial cells and regulates esophageal epithelium remodeling in EoE. The specific aims of
this dissertation are:
1. To examine the expression of SLC9A3 in EoE and the relationship between expression and onset
histopathological features of disease.
2. To determine the functional impact of IL‐13 induced SLC9A3 expression in esophageal epithelial
cells.
3. To determine the requirement of SLC9A3 in the formation of DIS in the esophageal epithelium.
4. To define the divergent roles of IL‐13‐induced STAT3 and STAT6 signaling pathways in
modulation of EoE transcriptome gene expression.
5. To determine the involvement of STAT3 and STAT6‐dependent genes in regulating IL‐13 induced
esophageal epithelium remodeling.

43
2 Chapter II: SLC9A3/NHE3 dysregulation and dilated intercellular spaces
in eosinophilic esophagitis
Chang Zeng B Sc1, Simone Vanoni PhD1, 5, David Wu PhD 1, Julie M. Caldwell PhD 1, Justin C. Wheeler MD3,
Kavisha Arora PhD2, Taeko K. Noah PhD1, Lisa Waggoner B Sc1, John A. Besse B Sc1, Amnah N. Yamani B
Sc1, Jazib Uddin B Sc1, Mark Rochman PhD1, Ting Wen PhD1, Mirna Chehade MD6, Margaret Collins MD3,
Vincent Mukkada MD4, Philip Putnam MD4, Anjaparavanda P. Naren PhD2, Marc E. Rothenberg MD PhD1
and Simon P. Hogan PhD1,7
1Division of Allergy and Immunology, 2Division of Pulmonary Medicine, 3Division of Pathology and
Laboratory Medicine, 4Division of Gastroenterology, Nutrition and Hepatology, Cincinnati Children’s
Hospital Medical Center, 3333 Burnet Ave, Cincinnati, OH, 45229; 5Institute of Pharmacology and
Toxicology, Paracelsus Medical University, Salzburg, Austria. 6Mount Sinai Center for Eosinophilic
Disorders, Jaffe Food Allergy Institute, Icahn School of Medicine at Mount Sinai, New York, NY.
7Department of Pathology, Mary H Weiser Food Allergy Center, Michigan Medicine, University of
Michigan, 109 Zina Pitcher Place, Ann Arbor, MI 48109‐2200.
Correspondence: Simon P. Hogan, Ph.D., Department of Pathology, Mary H Weiser Food Allergy Center,
Michigan Medicine, University of Michigan, 109 Zina Pitcher Place
Ann Arbor, MI 48109‐2200; Email: [email protected]; Phone: 734‐647‐9923.
Disclosures: M.E.R. is a consultant for Immune Pharmaceuticals, NKT Therapeutics, Pulm One, Celgene,
Shire, GlaxoSmith Kline, Astra Zeneca and Novartis and has an equity interest in the first three companies
listed and royalties from reslizumab (Teva Pharmaceuticals). M.E.R. is an inventor of several patents,
owned by Cincinnati Children’s, and a set of these patents relates to molecular diagnostics. M.C. is a

44
consultant for Shire and Actelion and has received research grant support from Shire, Regeneron, and
Nutricia. The other authors have declared that they have no conflict of interest.

45
2.1 Copyright and Student Contribution
This chapter is from a publication accepted by the Journal of Allergy Immunology, which is an Elsevier
Journal. Elsevier states “Authors can include their articles in full or in part in a thesis or dissertation for
non‐commercial purposes.”
Authorship is listed on the title page. I designed and performed most of the experiments and analyzed
all the datasets used in this manuscript. TKN performed immunofluorescent staining of human
esophageal biopsy samples, and JCW performed electron microscopy of EPC2‐ALI culture. Also, I wrote
the manuscript and modified it under the guidance of other co‐authors.
2.2 Abstract
Background: Eosinophilic esophagitis (EoE) is characterized by histopathologic modifications of
esophageal tissue including eosinophil‐rich inflammation, basal zone hyperplasia (BZH) and dilated
intercellular spaces (DIS). The underlying molecular processes that drive the histopathologic features of
EoE remain largely unexplored.
Objective: To investigate the involvement of SLC9A3 in esophageal epithelial [pH]i and DIS formation and
the histopathological features of EoE.
Methods: We examined the expression of esophageal epithelial gene networks associated with
regulation of intracellular pH ([pH]i) in the EoE transcriptome of primary esophageal epithelial cells and
an in vitro esophageal epithelial 3D model system (EPC2‐ALI). Molecular and cellular analyses and ion
transport assays were employed to evaluate expression and function of SLC9A3.
Results: We identified altered expression of gene networks associated with regulation of intracellular pH
([pH]i) and acid protective mechanisms in esophageal biopsies from pediatric patients with EoE (normal
n = 6, EoE n = 10). The most dysregulated gene central to regulating [pH]i was SLC9A3. SLC9A3

46
expression was increased within the basal layer of esophageal biopsies from patients with EoE and that
expression positively correlated with disease severity (eosinophils/HPF) and DIS (normal n = 10, EoE n =
10). Analyses of esophageal epithelial cells revealed IL‐13–induced, STAT6‐dependent SLC9A3 expression
and Na+‐dependent proton secretion and that SLC9A3 activity positively correlated with DIS formation.
Finally, we showed that IL‐13–mediated Na+‐dependent proton secretion was the primary intracellular
acid protective mechanism within the esophageal epithelium and that blockade of SLC9A3 transport
abrogated IL‐13–induced DIS formation.
Conclusions: SLC9A3 plays a functional role in DIS formation, and pharmacologic interventions targeting
SLC9A3 function may suppress the histopathologic manifestations in EoE.

47
2.3 Introduction
Eosinophilic esophagitis (EoE) is a food allergen‐induced inflammatory disease that is increasing in
incidence (5 – 10 cases per 100,000) and prevalence (0.5 to 1 case per 1000)278‐281. Common symptoms of
EoE include vomiting, dysphagia, chest pain, food impaction and upper abdominal pain282 and decrease
the health‐related quality of life283.
Corroborative clinical and experimental studies indicate that an underlying allergic sensitization to dietary
food antigens and development of a CD4+ Th2 and ILC2 inflammatory response in the esophageal mucosa
drive the eosinophilic inflammation and esophageal remodeling in EoE, which includes basal zone
hyperplasia (BZH) and dilated intercellular spaces (DIS)19,77,284,285. Dietary modification (i.e., complete or
targeted food antigen avoidance) and swallowed glucocorticoids alleviate much of the disease
pathology116,286, suggesting a food‐induced CD4+ Type‐2 allergic inflammatory response54,136,144,287‐289.
Consistent with this, animal‐based studies have revealed important roles for CD4+ Th2 cells, pro‐allergic
cytokines [interleukin 5 (IL‐5), IL‐13] and eosinophils in the histopathologic manifestations of
disease17,53,206. One cytokine that seems to be central in orchestrating the EoE phenotype is IL‐1330,51,122.
IL‐13 is highly upregulated in the esophageal tissue of patients with EoE and is sufficient to alter gene
expression in esophageal epithelial cells in vitro and in vivo, and the IL‐13–induced transcriptome
significantly overlaps with the transcriptional changes observed in esophageal biopsies of patients with
EoE30,51,122. Importantly, treating patients with EoE with a humanized antibody against IL‐13 led to a
significant decrease in esophageal eosinophil count and had a normalizing effect on the dysregulated
transcriptome observed in patients with EoE211. IL‐13 has been shown to dysregulate the expression of
several key epithelial barrier regulatory genes including desmosomal cadherin, desmoglein‐1 (DSG‐1),

48
Leucine‐rich repeat‐containing protein 31 (LRRC31), kallikrein (KLK) serine proteases and calpain 14
(CAPN14), which have been linked with EoE133,208,209.
Though there have been significant advances in our understanding of a link between allergic inflammation
and EoE, there is a paucity of data revealing the underlying pathways that regulate epithelial BZH and DIS
in EoE. DIS, also described as spongiosis, is a morphologic feature that has been identified in multiple
forms of esophagitis including lymphocytic esophagitis290, gastroesophageal reflux disease (GERD)291 and
EoE19,292. Histologic comparison between GERD and EoE suggested that DIS is significantly more intense in
EoE than GERD293. Steroid therapy or elimination diet significantly decreases DIS in patients with EoE, and
this decrease is associated with improvement of patients’ symptoms292, indicating an association between
DIS and the etiology of EoE. The underlying molecular pathways that drive DIS formation are currently
unknown.
We recently performed RNA sequencing (RNAseq) on esophageal mucosal biopsies from normal healthy
control patients (NL) and patients with active, proton pump inhibitor (PPI)–confirmed EoE. We identified
a total of 1607 significantly dysregulated transcripts (1096 upregulated, 511 downregulated), with 66% of
the gene signature being similar to the EoE transcript signature identified by microarray‐based expression
profiling122. We have performed gene ontology enrichment network analysis of the 1607 significantly
dysregulated transcripts and identified dysregulation of transmembrane transporter activity genes
associated with regulation of [pH]i and acid protective mechanisms. The most dysregulated
transmembrane transporter activity gene in the EoE transcriptome was the solute carrier family 9,
subfamily A, member 3 (SLC9A3), which encodes sodium‐hydrogen exchanger member 3 (NHE3)294 (33‐
fold increase). We demonstrate a significant increase of SLC9A3 in the esophageal epithelium in two
independent, confirmatory patient cohorts with PPI‐confirmed EoE. We show that the expression level of

49
NHE3 positively correlated with the level of inflammation and the area of DIS. IL‐13 treatment of
esophageal epithelial primary cells derived from patients with EoE and in a differentiated squamous
esophageal epithelium model (EPC2‐ALI) increased NHE3 expression and ion transport activity.
Pharmacologic inhibition of NHE3 function substantially decreased the area of IL‐13–induced DIS. These
collective data suggest that increased expression and activity of NHE3 contribute to the formation of DIS
in the esophageal epithelium in EoE.

50
2.4 Material and Methods
Human subjects. NL (healthy control patients) were defined as having no history of EoE diagnosis, 0
esophageal eosinophils per high‐power field (HPF) and no evidence of esophagitis within distal esophageal
biopsies obtained during the same endoscopy procedure as the analyzed samples. EoE was defined as
described in the recent consensus guidelines. Specifically, patients needed to have ≥15 eosinophils in at
least 1 high‐power field (Eos/HPF) in a distal esophageal biopsy with other causes of esophageal
eosinophilia excluded, and without a response to acid suppression. Normal control patient cohort consists
of patients with a variety of non‐specific upper GI complaints including vomiting, loose stools, abdominal
pain, nausea who underwent endoscopy were biopsied and demonstrated to have no histological
evidence of esophageal disease. RNAseq and validation qRT‐PCR analyses and histology (Eos/hpf and DIS
quantification) studies were performed on the esophageal biopsies. RNAseq and qRT‐PCR analyses and
histology (Eos/hpf and DIS) were performed on human esophageal biopsy samples (normal, n = 6; EoE, n
= 10) as previously described (NCBI Gene Expression Omnibus (GEO) database under accession
GSE58640)122 (Cohort 1). The demographics of the normal control and EoE patients are described in Fig.
2‐6. The qRT‐PCR and histopathology (Eos/hpf) analyses was performed on a second independent cohort
(normal, n = 10; EoE, n = 10) (Cohort 2). The demographics of the patients and controls are described in
Fig. 2‐6.
RNA‐sequencing of human Biopsy Samples: Esophageal biopsy RNA was isolated from controls and EoE
patients with active disease using the RNeasy kit (QIAGEN Incorporated, Germantown, MD) per the
manufacturer's protocol. RNA libraries were prepared using standard Illumina protocols (TrueSeq RNA LS
Sample Prep V2) at the CCHMC Genetic Variation and Gene Discovery Core. RNA sequencing acquiring
100bp reads from paired‐end libraries was performed at the Genetic Variation and Gene Discovery Core
Facility at CCHMC using Illumina HiSeq 2500. The paired‐end sequencing reads were aligned against the

51
GRCh37 genome model using TopHat 2.04 with Bowtie 2.03295,296. The separate alignments were then
merged using Cuffmerge297 with UCSC gene models as a reference. Raw data were assessed for statistical
significance using a Welch t‐test with Benjamini‐Hochberg false discovery rate and a threshold of P < 0.05
and a 2.0‐fold cut‐off filter in GeneSpring® GX (Agilent Technologies Incorporated, Clara, CA).
RNA‐sequencing of mature EPC2‐ALI: RNA was isolated using the RNeasy kit (QIAgen Incorporated,
Germantown, MD, USA) per manufacturer instructions. Assessment of RNA quality was performed using
the Agilent 2100 Expert bioanalyzer (Agilent Technologies Incorporated, Clara, CA, USA) and only those
samples getting an RNA Integrity Number (RIN) above 8 were chosen for sequencing. Next‐generation
sequencing analyses were performed by the CCHMC Genetic Variation and Gene Discovery Core with
Illumina HiSeq 2500. Raw data was uploaded on Biowardrobe298 and RPKM values were calculated.
Differentially expressed genes were assessed using DEseq2.
Gene Ontology Analysis: Gene list enrichment analysis and candidate gene prioritization based on
molecular function using ToppGene299 with FDR B&H correction and p‐Value cutoff at 0.05. Heatmaps
were generated using RStudio.
Pathology analysis.
Biopsy preparation. Formalin‐fixed, paraffin‐embedded esophageal biopsies were sectioned into 5‐mm
slides. After removal of paraffin and serial hydration, sections were stained with hematoxylin and eosin
(H&E). H&E‐stained slides were then imaged using an Olympus DP‐72 microscope (Olympus Corporation,
Semrock, New York, NY, USA).
Quantification of intercellular space. Intercellular space was quantified as the percentage of the
intercellular area of the total area of the biopsy sample using Image‐Pro Plus software (Media Cybernetics,
Rockville, MD, USA) automated space measurement function and calculated by the ratio of intercellular
area / total tissue area.

52
qPCR analysis. RNA samples were extracted from esophageal biopsy, cultured primary cells or EPC2‐ALI
cultures using the RNeasy kit (QIAGEN Sciences Incorporated, Germantown, MD, USA) according to the
manufacturer’s protocol. Purified RNA (300 – 500 ng) was DNase treated and reversed transcribed to
cDNA using Superscript II RNase H Reverse Transcriptase (Thermo Fisher Scientific Incorporated, Rockford,
IL, USA) per the manufacturer’s instructions. cDNA for SLC9A3 and 18S were quantified by real‐time PCR
using TaqMan Universal supermix with the CFX96 Real‐Time PCR Detection System. qPCR analysis was
performed using the Bio‐Rad CFX Manager Software version 3.1. Primers for SLC9A3 and 18S were
purchased from TaqMan (Thermo Fisher Scientific, Waltham, MA).
Immunofluorescence (IF) staining. For IF staining, formalin‐ or paraformaldehyde‐fixed, paraffin‐
embedded esophageal biopsies or EPC2‐ALI cultures were sectioned, mounted on slides and de‐
paraffinized using standard histological procedures. Slides were then permeabilized in Tris‐EDTA (1 mM,
pH 9.0) with 0.1% Tween‐20, and antigen exposure was performed at 125°C for 30 s in a decloaking
chamber using a pressure cooker. Slides were then blocked by 10% normal donkey serum for 1 h followed
by overnight incubation of primary antibodies diluted in 10% normal donkey serum: NHE3 (Novus,
Littleton, CO) and CK13 (Invitrogen, Carlsbad, CA). Slides were then washed and incubated with secondary
antibody at room temperature for 1 h. Slides were mounted with Fluoromount‐G (SouthernBiotech,
Birmingham, AL) mounting solution. Fluorescent imaging was performed using the Zeiss Apotome
fluorescent microscope using NIKON elements software.
Primary cell preparation. Distal esophageal biopsy was obtained from NL or EoE patients who underwent
routine endoscopy, suspended in 1 mL keratinocyte serum‐free media (KSFM) (Invitrogen, Carlsbad, CA)
containing supplements [human epidermal growth factor (EGF) (1 ng/mL), bovine pituitary extract (50
mg/mL), and 1X penicillin/streptomycin (Invitrogen, Carlsbad, CA)] and subsequently placed in 60‐mm
dish in 3 mL of filter‐sterilized (0.2 mm) Leibovitz’s L‐15 media (Invitrogen, Carlsbad, CA) containing 115
U/mL collagenase, 1.2 U/mL dispase and 1.25 mg/mL BSA. The biopsy was mechanically dispersed using

53
scissors to pieces less than 1 mm in size and then incubated at 37ºC for 1 h. The cell suspension was
centrifuged at 500 g for 5 min at 4ºC and the pellet washed twice with 5 mL of supplemented KSFM media.
Cells were suspended in 1 mL of 0.05% trypsin/EDTA for 10 min at 37ºC and agitated every 2 min. Trypsin
activity was inhibited with soybean trypsin inhibitor (STI) (250 mg/L in 1X DPBS; 5 mL). Cells were pelleted
by centrifugation, suspended in 1 mL KSFM containing supplements, transferred to a 35‐mm dish
containing irradiated NIH 3T3 J2 fibroblasts (162,500 cells) and cultured at 37ºC and 5% CO2. Media was
changed at day 5 and every other day thereafter using KSFM containing supplements. After epithelial cells
became 60‐70% confluent, they were dispersed from the plate using 0.05% trypsin/EDTA for 10 min at
37ºC and agitated every 2 min. Trypsin digestion was inactivated by STI, and cells were then passaged in
KSFM containing supplements at 1‐2 x 10⁵ cells per 3 mL in a 60‐mm dish.
pHi assay. Primary esophageal epithelial cells were cultured on Ibidi ‐Slide 4 well (ibidi GmbH, Germany)
with a concentration of 25,000 cells/well. After 24 h of equilibration period, cells were stimulated with or
without 100 ng/mL recombinant human IL‐13 (PeproTech, Rocky Hill, NJ) for another 48 h. pHi changes in
these primary cells were measured with the pH‐sensitive fluorescent dye BCECF AM (2',7'‐bis‐(2‐
carboxyethyl)‐5‐(and‐6)‐carboxyfluorescein, acetoxymethyl ester) or SNARF‐5F AM (SNARF‐5F 5‐(and‐6)‐
carboxylic acid, acetoxymethyl ester) (Invitrogen, Carlsbad, CA). Cells were loaded with 10 M BCECF AM
or SNARF‐5F AM in HCO3‐‐free Ringer’s solution [mM, 110 NaCl, 25 Na‐Gluconate, 5 KCl, 0.5 MgSO4.7H2O,
1 CaCl2.2H2O, 10 HEPES, 4 Glucose; to pH 7.4] at 37°C for 30 min prior to the experiment. To remove the
extracellular dye, cells were washed two times with HCO3‐‐free Ringer’s solution at the end of the
incubation period. To acidify the intracellular compartment of cells and generate the necessary H+
gradient (high [H+] inside vs. low [H+] outside cell) to measure pHi recovery rate, 20 mM of NH4Cl was
added to the chamber after the first 5‐min recording of the baseline pHi (Fig. 2‐2C. Stage II). To measure
the Na+‐dependent pHi recovery rate, Na+ was first removed from the cells by replacing the buffer with
Na+‐free Ringer’s solution [mM, 135 NMDG‐Cl, 5 KCl, 0.5 MgSO4.7H2O, 1 CaCl2.2H2O, 10 HEPES, 4 Glucose;

54
to pH 7.4] for 5 min (Fig. 2‐2C. Stage III). Na+‐dependent pHi recovery rate was measured by replacing
extracellular solution to HCO3‐‐free Ringer’s solution containing 135 mM Na+ (Fig. 2‐2C. Stage IV) and
determination of the slope of the Na+‐dependent pHi change. The pHi values are derived from the
calibration curves described below. The statistical significance of Na+‐dependent pHi change was
determined using a Students t‐test (two‐tailed). To record the BCECF AM fluorescence change, cells were
imaged by a Nikon Spectra X inverted fluorescent microscope with the excitation wavelength of 512 nm /
440 nm and emission at 535 nm. To record the SNARF‐5F AM fluorescence change, cells were imaged by
Zeiss LSM710 LIVE DUO confocal microscope with excitation wavelength at 488 nm and the emission
wavelength of 640 nm / 580 nm. To inhibit NHE3 activity, 30 M of S3226 or 0.01% DMSO (vehicle) was
applied throughout the experiment. % S3226‐sensitive Na+‐dependent pHi recovery rate was calculated
as Recovery rate of (DMSO‐treated ‐ S3226‐treated) *100/DMSO‐treated %. Quantification was
performed on 10‐20 cells randomly picked in each sample, and the fluorescence intensity was measured
using Nikon Elements microscope imaging software or ImageJ software. These fluorescence intensity
values were then converted into pH values per calibration curves. A calibration curve was generated at
the end of each experiment; BCECF AM or SNARF‐5F AM intensity was calibrated against pHi when cells
were exposed to the K+/H+ ionophore nigericin (10 mM) and valinomycin (10 mM) (Invitrogen, Carlsbad,
CA) in high‐K+ solution at four different pH values. High‐K+ solution [mM, 20 NaCl, 130 KCl, 1 MgCl2, 1
CaCl2.2H2O, 5 HEPES] was prepared and titrated to a pH ranging from 6.5 to 7.9. Fitting was performed
with GraphPad Prism software.
EPC2‐ALI culture. The hTERT‐EPC2 cells (hTERT‐immortalized human esophageal keratinocytes) were a
kind gift from Dr. Anil Rustgi (University of Pennsylvania, Philadelphia, PA, USA) as previously described300.
The air‐liquid interface (ALI) culture system was previously described and characterized together with
EPC2 cells133. EPC2 cells were grown to fully submerge on 0.4‐mM pore size, permeable transwell inserts
(Corning Incorporated, Corning, NY)) in KSFM (Life Technologies, Carlsbad, CA, USA). As depicted in Fig. 2‐

55
3A, (i) Day 0, cells were seeded on permeable membrane support and grown to single submerged layer
after three days. (ii) Cells were then shifted to medium containing high [Ca2+] to induce tight junction
formation ([Ca2+] = 1.8mM). (iii) On Day 7, media were removed from the top chamber in order to induce
differentiation and epithelial stratification in ALI. (iv) Day 12 (5 days post‐ALI), cells were then treated with
vehicle or cytokine (IL‐13) in the presence and absence of SLC9A3 inhibitor (30mM)301 as described in
figure legends.
Lentiviral Transduction. EPC2 cells at 60‐70% confluence were transduced with lentiviral particles
containing Mission® STAT6 shRNA TRC 0000019409 shRNA, Mission® STAT3 (TRCN0000329887) shRNA
(Sigma; St. Louis, MO, USA) or Mission® non‐target control shRNA (Sigma; St. Louis, MO, USA). All the three
shRNA lentivirus were generated by the Cincinnati Children’s Hospital Medical Center Viral Core using a
4‐plasmid packaging system. Lentiviral particles were incubated with EPC2 cells for 6 hours with a
Multiplicity of Infection (MOI) from 0.5 to 10 for STAT3 or CTRL shRNA. For STAT6 shRNA, 10µL to 50µL
viral particles were added to the cells. All the viral particles were added in the presence of 5µg/mL
Hexadimethrine Bromide (Polybrene®) (Sigma; St. Louis, MO, USA). During the first hour of incubation,
cells were spun down at 1000*g for 1 hour at room temperature. 6 hours following transduction cells
were put in fresh KSFM media, and 24 hours later media containing 1µg/mL of Puromycin (Thermo Fisher
Scientific Incorporated; Rockford, IL, USA) was used for selection. Cells were grown under selective
pressure and cultured as regular EPC2 cells. Stable knockdown of STAT6 and STAT3 in EPC2‐ALI cultures
were evaluated by Western blot. The results indicated an 80% reduction of STAT6 and 90% reduction of
STAT3, relatively, compared to empty control transduced cells.
Western blot. EPC2‐ALI cultures were lysed using protein lysis buffer (10% Glycerol, 20 mM Tris HCl pH 7,
137 mM NaCl, 2 mM EDTA, 1% NP40 in H2O) supplemented with Halt protease inhibitor cocktail (Thermo
Fisher Scientific Incorporated, Rockford, IL, USA). Proteins were then quantified with BCA assay, and 20

56
g of protein extracted together with protein‐reducing buffer was loaded and separated on a 4%‐12%
Bis‐Tris gel and transferred to a nitrocellulose membrane (Life Technologies, Carlsbad, CA). Antibody of
NHE3 and ‐actin were used for protein detection. The IRDye 800 CW goat anti‐rabbit IgG (H+L) (Li‐Cor,
Lincoln, NE) was used as the secondary antibody for detection. Western Blot quantification was performed
using Image Studio Lite (Li‐Cor, Lincoln, NE).
pH‐STAT assay. Acid secretion by confluent epithelium was quantitated using pH‐STAT (TIM856,
Radiometer Analytical, Loveland, CO) connected to an Ussing chamber system as previously described302.
EPC2‐ALI cultures were mounted into an Ussing chamber containing unbuffered Ringer’s solution [mM,
145 NaCl, 2 KCl, 1 MgCl2, 2 CaCl2, 5 Glucose] while gassed with 99.5% oxygen. Both the pH electrode and
the titrating burette are placed in the apical side chamber. To measure the equilibrium extracellular pH,
without any titration, the extracellular pH was measured for 10 min or until a stable pH was achieved
(<0.002 pH unit change/min). After the equilibrium period and extracellular pH measurements were
obtained, the mucosal pH was adjusted by titration to a set pH (pH 7.6) to keep the extracellular pH slightly
alkalized. Titration rate (amount of alkaline injected by the machine to neutralize the acid secreted by
EPC2‐ALI culture to maintain the set pH) was used to measure the acid secretion rate.
Histologic analysis for EPC2‐ALI. EPC2‐ALI cultures were treated as indicated in experiments and then
fixed on transwell supports with 4% paraformaldehyde for 1 h at room temperature. Fixed membranes
underwent a series of dehydration steps, cleared in Histoclear solution, embedded in paraffin and
sectioned into 5‐mm slides. The slides were stained using H&E staining and imaged using an Olympus DP‐
72 microscope (Olympus Corporation, Semrock, New York, NY, USA).
Electron microscopy. EPC2‐ALI cultures were treated as indicated in experiments, fixed with 3%
glutaraldehyde and submitted to CCHMC Pathology Research Core for processing, sectioning, and

57
transmission electron microscopy using a Hitachi model H‐7650 electron microscope, at 80 kV, using the
AMT‐600 image capture engine software.
BrdU assay. After EPC2‐ALI cultures were treated as indicated in the experiment, BrdU reagents dissolved
in DMSO (final concentration 10 µM) were added to both the upper and lower chambers of transwells for
2 h. EPC2‐ALI cultures were then washed with PBS and fixed with 4% paraformaldehyde for another 2 h.
Statistical analysis. The statistical significance of EPC2‐ALI samples was established using an unpaired t‐
test (two‐tailed), or two‐way ANOVA if there were more than one variable. For non‐normally distributed
data from patient biopsies and primary cells derived from patient biopsies, the Mann‐Whitney test was
used, and the correlation analyses were assessed with a Spearman correlation test. Graphs and statistical
analyses were performed using GraphPad Prism 7.02 (GraphPad Software Incorporated, La Jolla, CA, USA).

58
2.5 Results
2.5.1 Transmembrane transporter SLC9A3/NHE3 specifically upregulated and correlated with
eosinophil count and DIS in EoE
To begin to determine the potential involvement of transmembrane transporter activity in the
histopathologic alterations of the esophageal epithelium in EoE, we applied gene ontology (GO)
enrichment analysis of the 1607 differentially expressed RNA transcripts identified by RNAseq analyses of
pediatric NL and EoE biopsy samples122. GO analysis revealed 50 individual GO nodes significantly
dysregulated in the EoE transcriptome based on functional annotations and protein interaction networks
(FDR‐corrected p < 0.05, Fig. 2‐7). Of these GO nodes, 5 were related to transmembrane transporter
activity (Fig. 2‐1A). A combinatory comparison of all 62 genes within these 5 GO nodes revealed that the
most upregulated transmembrane transporter activity gene was SLC9A3, which encodes for the sodium‐
hydrogen exchanger family member 3 (NHE3) (Fig. 2‐1B). SLC9A3 was induced 33‐fold in patients with EoE
compared to NL (Fig. 2‐1C). In contrast, expression of other members of the SLC9 family, including the
ubiquitously expressed sodium‐proton exchanger SLC9A1, also referred to as sodium‐hydrogen exchanger
family member 1 (NHE1), were not dramatically different in expression between EoE and NL (Fig. 2‐1D).
Correlation analyses revealed a positive correlation between the level of peak distal esophageal
eosinophils and SLC9A3 expression (Fig. 2‐1E, r = 0.7167, p < 0.05. Notably, this was specific to SLC9A3, as
we did not observe any correlation with SLC9A1 (Fig. 2‐1E, r = 0.3201, p > 0.05), revealing a specific link
between SLC9A3 expression and disease severity in EoE. To confirm these observations, we examined a
second independent pediatric cohort [NL n = 10, active EoE n = 10] for which we had paired RNA and
histologic biopsy samples from the same day of endoscopy. Consistent with our RNAseq analyses, qPCR
analyses revealed significant SLC9A3 overexpression in the pediatric EoE cohort (Fig. 2‐1F). Furthermore,
we observed a positive Pearson correlation between SLC9A3 expression level and distal peak esophageal
eosinophil numbers (Fig. 2‐1G, r = 0.9172, p < 0.0001).

59
We next performed immunofluorescence (IF) analyses to determine the cellular and spatial expression of
NHE3 in NL and EoE esophageal biopsy samples. Consistent with our RNAseq and PCR analyses, we
observed very little expression of NHE3 in the healthy esophageal epithelium (Fig. 2‐1H, upper panel). The
positive staining observed was restricted to the CK13‐ single‐cell basal esophageal epithelial layer (Fig. 2‐
1H, upper panel). In EoE, NHE3 protein expression was remarkably increased, localized to the esophageal
basal cell layer and also expanded into the CK13+ suprabasal layer (Fig. 2‐1H, lower panel). The localization
of NHE3 to the suprabasal zone, an area associated with DIS formation, lead us to examine the relationship
between SLC9A3 expression and DIS in EoE esophageal biopsies. Notably, SLC9A3, but not SLC9A1,
expression positively correlated with the percentage of DIS area in EoE individuals (r = 0.8095, p < 0.05)
(Fig. 2‐1I). These cumulative data indicate a specific upregulation of SLC9A3/NHE3 in the suprabasal layer
of esophageal epithelium in patients with EoE and that SLC9A3 levels correlate with esophageal
eosinophilic inflammation and DIS.
2.5.2 Increased NHE3 function in IL‐13–stimulated primary esophageal epithelial cells.
The epithelial sodium‐proton exchanger, NHE3, is predominantly expressed in the apical membrane of
epithelial and is the principal mechanism for the electroneutral exchange of (Apical Baso) Na+ and (Baso
Apical) H+ and plays an important role in the maintenance of intracellular pH (pHi) and regulation of
cell volume303. Given IL‐13’s known role in upregulating the EoE transcriptome54 and that humanized anti–
IL‐13 monoclonal antibody (QAX576) has been shown to modulate expression of an anion transport
activity node211, we examined the impact of IL‐13 exposure on SLC9A3 expression in primary esophageal
epithelial cells. We demonstrate upregulation of SLC9A3 expression in primary esophageal epithelial cells
following IL‐13 stimulation (Fig. 2‐2A). To determine whether increased SLC9A3 expression was associated
with altered NHE3 activity, we examined the effect of IL‐13 exposure on intracellular pH ([pH]i) in primary
esophageal epithelial cells. Notably, increased SLC9A3 expression coincided with a significant increase in

60
baseline pHi (Fig. 2‐2B) and Na+‐dependent pHi recovery rate (Fig. 2‐2C‐D), supporting an overall increase
of Na+/H+ exchange activity. Notably, the recovery rate positively correlated with SLC9A3 expression in
primary esophageal epithelial cells (r = 0.9503 p < 0.01; Fig. 2‐2E), suggesting that the increase of pHi
recovery rate in IL‐13–treated primary esophageal epithelial cells is predominantly due to increased NHE3
expression. Addition of the NHE3‐specific inhibitor S3226 (30 mM) confirmed that the IL‐13–induced
increase in Na+‐dependent pHi recovery rate was predominantly mediated by NHE3 (Fig. 2‐2F).
2.5.3 IL‐13 induces an EoE‐like transcriptome including increased transmembrane transporter
activity and SLC9A3 overexpression in an in vitro, matured esophageal epithelium model
system.
In order to define the involvement of SLC9A3/NHE3 in the regulation of [pH]i and DIS formation in a
mature esophageal epithelial model system, we adapted an in vitro model developed from keratinocyte
esophageal epithelial cells (EPC2) grown in air‐liquid interface (ALI)133. EPC2 cells were grown under
submerged conditions in low‐calcium media (0.09 mM; days 0‐3), changed to high‐calcium media (1.8
mM, days 3‐7) and then exposed to the ALI for 5 days in the presence of high calcium (1.8 mM, days 7‐12)
to induce differentiation and formation of a mature, stratified epithelium (Fig. 2‐3A). Following
maturation, EPC2‐ALI cells were stimulated with vehicle or IL‐13 and RNAseq analyses performed (Fig. 2‐
3A, days 12‐14). We show that IL‐13 significantly dysregulated a total of 572 genes (p < 0.05, fold change
> 2.0); notably, many of the most highly dysregulated genes included inflammatory genes associated with
EoE, including CCL26 (7‐fold), TNFAIP6 (9‐fold), CDH26 (3‐fold) and CAPN14 (5‐fold), and also gene families
located in the epidermal differentiation cluster (EDC) on chromosome 1q21 (e.g., IVL, LOR, S100A4,
S100A6) (Fig. 2‐3B and Fig. 2‐6). Consistent with these findings, comparative analyses of the IL‐13–induced
transcriptome changes in EPC2‐ALI cells with that of the EoE‐specific transcriptome revealed significant
overlap with the EoE‐specific transcriptome (Fig. 2‐3B, p < 0.0001). GO analysis based on the biological
process on IL‐13–dysregulated genes revealed the most significant 15 individual GO biological process

61
nodes were associated with keratinization, epidermis development, skin development, keratinocyte
differentiation, epidermal cell differentiation and inflammatory response and GO Pathways associated
with formation of the cornified envelope, keratinization and interleukin‐4 and 13 signaling (Table 2‐2, FDR‐
corrected p < 0.05). To examine the effect of IL‐13 on transmembrane transporter activity, we performed
GO analysis based on the molecular function of the 572 genes and identified 6 nodes significantly
dysregulated related to transmembrane transport activity (Fig. 2‐3C, FDR‐corrected p < 0.05). Of the 28
differentially expressed transmembrane transport activity genes in these 6 GO nodes, SLC9A3 was one of
the most highly upregulated genes (Fig. 2‐3D).
IL‐13 is known to signal through the JAK/STAT pathway, in particular through a STAT3‐ and STAT6‐
dependent signaling pathway304. To determine the involvement of STAT‐3 and STAT‐6 in the IL‐13
induction of SLC9A3, we examined SLC9A3 mRNA expression in STAT3 and STAT6 shRNA–transduced
EPC2‐ALI cells following IL‐13 stimulation. Notably, STAT‐3 knockdown in EPC2‐ALI cells caused no
significant reduction in IL‐13–induced SLC9A3 expression compared to control shRNA–transduced EPC2‐
ALI cells (Fig. 2‐3E). In contrast, STAT6 knockdown in EPC2‐ALI cells significantly ablated IL‐13–induced
SLC9A3 expression (50% reduction), suggesting that IL‐13–induced STAT6 signaling is important for
SLC9A3 expression in EPC2‐ALI cells (Fig. 2‐3E). These studies demonstrate that IL‐13 induces SLC9A3
expression in EPC2‐ALI cells in part by the STAT6‐dependent mechanism.
2.5.4 IL‐13–induced NHE3 expression and function in differentiated esophageal epithelial cells.
Employing this mature EPC2‐ALI model system, we show that IL‐13 stimulation of EPC2‐ALI cells induced
an increase in SLC9A3 mRNA (Fig. 2‐4A) and NHE3 protein (Fig. 2‐4B‐C) expression. Immunofluorescence
analyses revealed that NHE3 was barely expressed in vehicle‐treated EPC2‐ALI cells (Fig. 2‐4D, top panel).
In contrast, we observed a significant increase in NHE3 expression in EPC2‐ALI cells following IL‐13
62
exposure; comparable to what we observed in EoE biopsy samples, NHE3 was predominantly localized to
the basal and suprabasal layer of epithelium in IL‐13–treated EPC2‐ALI cultures (Fig. 2‐4D, lower panel).
To examine NHE3 function in the mature EPC2‐ALI cultures, we measured proton secretion rates in an
Ussing chamber system fitted with pH‐STAT (Fig. 2‐4E). We show that IL‐13 stimulation reduced the
extracellular pH (pHe) compared with vehicle‐treated control (pHe 6.82 vs. 6.97, respectively, p < 0.05),
indicating altered acid‐base transport. Notably, the reduction in pHe was abrogated with exposure to the
specific NHE3 inhibitor S3226 (Fig. 2‐4F), indicating NHE3‐dependent proton extrusion. To measure the
rate of acid extrusion by the mature EPC2‐ALI, the apical side buffer was adjusted to an alkaline pH [pH
7.6; Ba(OH)2] to generate an ion concentration gradient and the amount of alkali [Ba(OH)2] required to
maintain this condition (pH 7.6) was continuously monitored using a pH‐STAT (Fig. 2‐4G). We show that
IL‐13 stimulation of the mature EPC2‐ALI cells led to increased Ba(OH)2 injection to counterbalance H+
secretion from the tissue and maintain pH 7.6 (Fig. 2‐4G). To determine the involvement of NHE3 in apical
acid secretion function in the mature EPC2‐ALI, S3226 was added to the apical side of the buffer to identify
the NHE3‐mediated fraction of acid secretion. Notably, the acid‐secretion rate in IL‐13–stimulated mature
EPC2‐ALI cells was significantly abrogated with S3226, indicating NHE3‐dependent secretion (Fig. 2‐4H).
These observations indicate an IL‐13–induced increase in NHE3‐dependent acid secretion in EPC2‐ALI
cells.
2.5.5 Increased SLC9A3 expression and activity is linked with DIS formation.
Given the observed association between NHE3 and acid secretion in EPC2‐ALI cells and the correlation
between SLC9A3 expression and DIS formation in esophageal biopsy samples from patients with EoE (Fig.
2‐4H and 2‐1I, respectively), we examined the relationship between NHE3 function and DIS formation in
the mature EPC2‐ALI cells. IL‐13 stimulation of EPC2‐ALI cells induced DIS formation within the basal and
suprabasal layer of EPC2‐ALI cells as evidenced by spaces between cells (Fig. 2‐5A). Electron microscopy
analyses revealed alteration to the intercellular junctional structures of esophageal cells, with the

63
appearance of expanded or dilated intercellular areas (Fig. 2‐5B). Notably, the DIS is sealed by lateral
membranes that are of close apposition and tethered by intercellular junctional proteins such as
desmosomes (Fig. 2‐5B). To determine the requirement of NHE3 activity in DIS formation, we stimulated
EPC‐ALI cells with IL‐13 in the presence of the NHE3 inhibitor S3226 (Fig. 2‐5C‐D). Notably, we show that
the IL‐13–induced DIS within the suprabasal layer in EPC2‐ALI cells were diminished in the presence of
S3226 (Fig. 2‐5C‐D). Collectively, we concluded that NHE3 has an important role in IL‐13–induced DIS
formation in esophageal cells.

64
2.6 Discussion
EoE is characterized by histopathologic manifestations including BZH and DIS. The underlying molecular
processes that drive these pathologic manifestations remain largely unexplored. Herein, we demonstrate
1) dysregulation of transmembrane transporter activity gene networks in esophageal biopsies from
patients with EoE; 2) increased expression of the Na+‐H+ exchanger SLC9A3/NHE3 in EoE esophageal
biopsies and positive correlation of this increased expression with DIS area and eosinophil infiltration; 3)
increased SLC9A3 expression and NHE3 activity in primary esophageal epithelial cells and in response to
IL‐13 stimulation in a mature EPC2‐ALI model system; and 4) reduction of IL‐13–induced DIS formation in
EPC2‐ALI cells by pharmacological antagonism of NHE3 activity. Collectively, we have identified a role for
SLC9A3/NHE3 in IL‐13–induced DIS formation in the esophageal epithelium and provide evidence for the
involvement of this pathway in EoE.
The cytokine IL‐13 has an important role in driving the underlying allergic inflammatory cascade and the
histopathologic features of EoE30,51,122. This notion is supported by the observations that stimulating
esophageal cells with IL‐13 leads to a transcript signature that partially overlaps the esophageal EoE
transcriptome54. Furthermore, while the primary outcome of greater than 75% decrease in peak
eosinophil counts at week 12 was not met, treating patients with EoE with anti–IL‐13 (QAX576) reduced
intraepithelial esophageal eosinophil counts and led to an improvement in the EoE transcriptome and
clinical symptom such as dysphagia in adults with EoE211. Our observation of elevated SLC9A3 and NHE3
expression in EoE tissue samples and in both primary esophageal epithelial and EPC2‐ALI cultures
following IL‐13 stimulation was surprising given that SLC9A3/NHE3 expression and function is
predominantly associated with induction of Th1 proinflammatory cytokines, including IFN‐ and TNF305.
IFN‐ and TNF are thought to modulate SLC9A3 expression by PKA‐mediated phosphorylation of Sp1 and
Sp3 transcription factors305. TNF has also been shown to alter NHE3 activity by stimulating PKCa‐

65
dependent internalization of NHE3306. Stimulation of EPC2‐ALI cultures with other pro‐Type 2 cytokines
such as IL‐25 and IL‐33 did not lead to induction of SLC9A3/NHE3 mRNA expression. Notably, a recent
study in kidney and intestinal epithelial cells (Caco‐2) reported a STAT3‐dependent increase in SLC9A3
expression through the recruitment of transcriptional factor Sp1 and Sp3307. IL‐13 is known to signal
through the JAK/STAT pathway, in particular through a STAT3‐ and STAT6‐dependent signaling
pathway304. We reveal that STAT6 signaling plays a significant role in IL‐13–induced SLC9A3 expression in
EPC2‐ALI cells. Examining the SLC9A3 promoter did not reveal the presence of STAT6 gamma‐interferon‐
activation site (GAS) elements, suggesting that STAT6 may indirectly modulate SLC9A3 expression.
Notably, there are recent reports of IL‐13–induced, STAT6‐dependent activation of EGR1 signaling
pathways in EoE308,309, and previous studies in intestinal epithelial cells have revealed that overexpression
of EGR1 promotes SLC9A3/NHE3 expression and activity310. We are currently further pursuing the
molecular basis of IL‐13 transcriptional regulation of SLC9A3 expression.
SLC9A3, as a member of the Na+/H+ exchanger family, drives Na+‐dependent extrusion of H+ and is
primarily involved in the regulation of [pH]i and acid protective mechanisms256,257,311,312. A consequence of
Na+‐dependent acid extrusion in a multilayered stratified epithelium such as the esophageal epithelium is
acidification of the intercellular spaces313. In well‐perfused tissues where there are short diffusion
distances and good cell‐to‐capillary diffusive coupling, the acid is rapidly buffered by phosphates, proteins,
and HCO3‐314. However, in the stratified epithelium that is undergoing rapid and sustained cellular
proliferation, the diffusion distances are increased leading to often‐inadequate capillary perfusion, which
limits the capacity of the intercellular acid‐protective mechanisms and neutralization of the acidified
intercellular spaces. The accumulation of acid [H+] in the intercellular spaces permits the formation of an
electrochemical gradient and Cl‐ diffusion, creating an osmotic force for water flux and dilation of the
intercellular spaces315,316. In EoE, there is significant esophageal epithelial basal zone (BZ) expansion, and

66
the basal cell layer can exceed 15% of the total epithelial thickness317. We speculate that the esophageal
proliferative response and the thickening of the suprabasal layer of the esophageal epithelium in EoE
increase the diffusion distances, thus causing a loss in the intercellular acid‐protective mechanisms and
leading to DIS. Consistent with the concept of esophageal epithelial intercellular acid as a primary driver
for DIS in EoE, luminal acid has been shown to drive acidification of the intercellular spaces and DIS in non‐
erosive reflux disease314‐316,318. Further, support for this concept, a recent study reports a strong positive
correlation between BZH and DIS (r2 ≥ 0.67) in both proximal and distal biopsy samples from pediatric
patients with EoE319. Interestingly, the increased esophageal intercellular acid in non‐erosive reflux
disease is thought to activate afferent neurons (nociceptors) within the esophageal epithelium leading to
the development of heartburn318,320. Intriguingly, though not common, EoE is also associated with the
development of heartburn4.
SLC9A3’s role in the regulation of [pH]i may not simply in response to dysregulation of [pH]i but also in
part fulfilling a larger role in the regulation of esophageal epithelial proliferation. Moreover, intracellular
pH plays an important role in many cellular functions including proliferation321 and apoptosis322. In tumor
cells, the [pH]i is often elevated as compared to normal cells, and it is thought that the alkaline [pH]i
provides an optimal environment for DNA synthesis relative to enzyme function323. Consistent with this,
growth factors such as EGF and PDGF stimulate a rapid rise in [pH]i that is a critical requirement for entry
of mitogen‐stimulated quiescent cells into the S phase of the cell cycle324,325. Experimental studies have
identified an important role for NHE family members in the growth factor‐induced increase in [pH]i and
cellular proliferation326,327. The pharmacologic abrogation of mitogen‐stimulated, Na+‐dependent
extrusion of H+ and increase in [pH]i‐inhibited growth factor‐induced mouse bone marrow‐derived
macrophage DNA synthesis and prevents progression into the S phase326. Furthermore, the rapid and
transient mitogen‐induced increase in NHE1 activity and [pH]i during G2/M entry and transition is ablated

67
in NHE1 mutant fibroblasts327. Notably, increasing the [pH]i in the absence of NHE1 activity was sufficient
to restore CDC2 activity and cyclin B1 expression and to promote G2/M entry and transition and cellular
proliferation, indicating that the NHE1‐driven increase in [pH]i at the completion of S phase is an important
checkpoint for progression to G2 and mitosis327. We speculate that IL‐13 induction of SLC9A3/NHE3 may
be a critical requirement for esophageal epithelial cell proliferation via regulating [pH]i. Notably, we have
previously demonstrated that overexpression of IL‐13 in mice leads to esophageal cell proliferation207.
Herein, we show co‐localization of NHE3 expression within the esophageal basal proliferative zone in EoE
esophageal biopsy samples and IL‐13–treated EPC2‐ALI cultures. Furthermore, we show that stimulating
EPC2‐ALI cells with IL‐13 induces SLC9A3, but not SLC9A1, expression and that treating mature EPC2‐ALI
cells with the pan NHE inhibitor ethylisopropyl amiloride (EIPA) attenuated IL‐13–induced proliferation
(Fig. 2‐8). These findings support the necessity of an NHE in IL‐13–induced proliferation in an esophageal
epithelial model system in vitro and given the overexpression, localization, and function of NHE3, we
conjecture that [pH]i balance and regulation is a critical component of the observed proliferative effect
that is induced by IL‐13 and mediated by an NHE in esophageal epithelial cells.
Multiple compensatory mechanisms regulate [pH]i in mammalian cells and involve Na+/H+ exchangers,
HCO3‐ transporters, lactate‐H+ transporters and vacuolar H+‐ATPase328,329. Our gene ontology analysis
supports dysregulation of these mechanisms in EoE, identifying that 5 out of the 50 individual GO nodes
generated from genes significantly dysregulated in EoE are tightly correlated with the transmembrane ion
transport activity. Notably, several of the most dysregulated genes were part of the [pH]i regulatory
circuit, including Cl‐/HCO3‐ exchangers (SLC26A4, SLC4A2, SLC4A8) and carbonic anhydrases (CA2). These
functional analyses support the concept of [pH]i pathways being active in the primary esophageal
epithelial cells in EoE.

68
The significant decrease in DIS with steroid therapy or elimination diet in patients with EoE being
associated with symptom improvement292 indicates an association between DIS and the etiology of EoE.
We demonstrate a role for SLC9A3/NHE3 and Na+/H+ exchange in DIS formation, one of the
histopathologic manifestations of EoE. Given our observations, one would predict that utilizing NHE3
antagonists (systemically or topically) may be a therapeutic approach for reducing DIS and thus normalize
associated esophageal caliber dimensions in EoE. Notably, an NHE3‐specific inhibitor, tenapanor, is in
phase 3 clinical trials for the treatment of cardiorenal and gastrointestinal disease330. Tenapanor has been
shown to reduce sodium uptake, resulting in a reduction in [pH]i330. Given the contribution of DIS to
esophageal barrier dysfunction and facilitating food allergen exposure, considering the potential usage of
NHE3 inhibitors for EoE is warranted.
In summary, we identified a relationship between SLC9A3/NHE3 expression and activity with DIS in EoE.
Mechanistically, we show that IL‐13 stimulates SLC9A3 expression and NHE3 activity (via [pH]i) and that
these were associated with esophageal epithelial DIS. Inhibiting NHE activity attenuated esophageal
epithelial DIS formation, providing a rationale for the therapeutic utilization of NHE3 antagonists for
reducing DIS and DIS‐associated esophageal pathophysiologic manifestations in EoE.

69
2.7 Figures
Figure 2‐1. SLC9A3 is the most upregulated transmembrane transporter activity gene in the EoE
transcriptome, and levels correlate with EoE severity and DIS

70

71
Figure 2‐1. SLC9A3 is the most upregulated transmembrane transporter activity gene in the EoE
transcriptome, and levels correlate with EoE severity and DIS. A) GO nodes associated with
transmembrane transporter activity‐related genes identified by Gene Ontology (GO) enrichment
analysis of 1610 dysregulated genes from RNA sequencing. B) Heatmap depicting the expression level of
62 individual genes within the transmembrane transporter activity GO nodes. C) Individual FPKM values
of SLC9A3 and D) Heatmap depicting expression level of SLC9A1‐9, E) Correlation analysis of SLC9A3 or
SLC9A1 expression and matched peak distal eosinophil counts/HPF in esophageal biopsies (NL = 6; EoE =
10). F) qPCR analysis of SLC9A3 expression and G) Spearman correlation relating SLC9A3 expression and
eosinophil count/HPF in an independent validation cohort (NL = 10; EoE = 10). H) Immunofluorescence
staining of esophageal biopsy sections from NL (top panel) and patients with EoE (lower panel). NHE3
(red), CK13 (green) and nuclei (DAPI, blue) are shown. Images are representative of 7 patients per group.
Magnification x40. I) Spearman correlation between SLC9A3 or SLC9A1 expression and percentage of
dilated intercellular spaces (DIS) in esophageal biopsies from patients with active EoE (n = 8). (C, F) Data
are represented as the average ± S.E.M. (E, G, I) Data are presented as relative expression over 18S. (C,
E‐G, I) Individual symbols represent an individual patient **p < 0.01, ***p < 0.001.

72
Figure 2‐2. Increased SLC9A3/NHE3 expression and activity in primary esophageal epithelial cells
derived from EoE biopsy in response to IL‐13.

73
Figure 2‐2. Increased SLC9A3/NHE3 expression and activity in primary esophageal epithelial cells
derived from EoE biopsy in response to IL‐13. A) qPCR analysis of SLC9A3, B) Baseline intercellular pH
(pHi), C) Representative curves of pHi change over time and D) Na+‐dependent pHi recovery rate of cells
derived from biopsies of patients with active EoE (n = 6) treated with vehicle (Veh) or IL‐13. E) Spearman
correlation analysis comparing the SLC9A3 expression level and Na+‐dependent pHi recovery rate (n = 5
individual patients stimulated with vehicle and IL‐13). F) Percentage of S3226‐sensitive Na+‐dependent
intracellular recovery rate in cells treated with vehicle or IL‐13. See Material and Methods for a detailed
protocol. B) Data represent the average pHi ± S.E.M of cells from patients with active EoE (n = 8). C)
Each data point represents the average value of 40 individual cells from 2 individual experiments. Data
points for D) represent the average value of 120 individual cells from 6 different patients with active EoE
and F) 50 individual cells from 5 different patients with active EoE. (A‐B, D, F) Data are represented as
the average ± S.E.M. *p < 0.05, **p < 0.01, ****p < 0.0001.

74
Figure 2‐3. Mature stratified squamous esophageal epithelium model using EPC‐ALI culture system.

75
Figure 2‐3. Mature stratified squamous esophageal epithelium model using EPC‐ALI culture system. A)
Schematic diagram of the esophageal epithelium (EPC2) air‐liquid interface (ALI) (EPC2‐ALI)
differentiation protocol (See Material and Methods). B) Gene expression change of IL‐13–stimulated
EPC2‐ALI versus non‐treated EPC2‐ALI compared to that of patients with active EoE versus normal
control (NL) patients. Fold changes were calculated from RNA sequencing of EPC2‐ALI and patient
samples. Spearman correlation analysis was applied to analyze these 23660 genes. C) Gene ontology
analysis of 572 genes that were significantly dysregulated by IL‐13 treatment of EPC2‐ALI cells (Fold
change > 2, p < 0.05) identified 6 GO nodes related to transmembrane transporter activity. D) Heatmap
depicting expression level of 46 individual genes within the transmembrane transporter activity GO
nodes that are significantly dysregulated in EPC2‐ALI cells following IL‐13 stimulation. E) RPKM value is
indicating SLC9A3 expression level in empty control (CTRL), STAT3 lentiviral knockdown (STAT3KD) and
STAT6 lentiviral knockdown (STAT6KD) EPC2‐ALI cultures treated with vehicle (Veh) or IL‐13; n = 3 per
treatment. **padj < 0.01, ***padj < 0.001.

76
Figure 2‐4. Increased SLC9A3/NHE3 expression and activity in IL‐13–stimulated EPC2‐ALI.

77
Figure 2‐4. Increased SLC9A3/NHE3 expression and activity in IL‐13–stimulated EPC2‐ALI. A) qPCR, B)
Western blot analysis and C) Western blot quantification of SLC9A3/NHE3 expression in EPC2‐ALI
following a 72 h–treatment with vehicle (Veh) or IL‐13 (100 ng/mL). D) Immunofluorescence staining of
the vehicle (top panel) or 100 ng/mL of IL‐13 (lower panel) stimulated EPC2‐ALI cultures. NHE3 (red) and
nuclei (blue) are shown. Images are presentative of 3 samples per group. Magnification X400 E)
Schematic view of the pH‐STAT assay. See Material and Methods for a detailed protocol. F) Baseline
extracellular pH (pHe) of EPC2‐ALI cells treated with vehicle or IL‐13 for 72 h. DMSO (0.1%) or S3226 (30
mM) was added to both sides of the solution during the experiment (n = 6‐11 samples per group from 5
individual experiments). G) Amount of Ba(OH)2 injection over time and H) Ba(OH)2 injection rate
measured for EPC2‐ALI cells treated with vehicle or IL‐13 (100 ng/mL) for 72 h. DMSO (0.1%) or S3226
(30 mM) is added to both sides of the solution during the experiment (n = 6‐11 samples per group from
5 individual experiments). (A, C, F, H) Data are represented as the average ± S.E.M. *p < 0.05; n.s. not
significant

78
Figure 2‐5. Blockade of NHE3 protected EPC2‐ALI from IL‐13–induced dilated intercellular spaces (DIS).

79
Figure 2‐5. Blockade of NHE3 protected EPC2‐ALI from IL‐13–induced dilated intercellular spaces (DIS).
A) H&E staining and B) electron microscopy of EPC2‐ALI cultures stimulated with vehicle or IL‐13 (100
ng/mL) for 72 h and showing DIS (black arrows) in only IL‐13–treated cells. C) H&E staining of EPC2‐ALI
cultures stimulated with vehicle or IL‐13 (100 ng/mL) in the presence and absence of S3226 (30 mM) for
72 h. D) DIS formation (% of total area) was quantitated by morphometric analyses and expressed as the
mean ± S.E.M; n = 3 independent experiments; ****p < 0.0001. Magnification A) X200, B) X5000 and C)
X300.

80
Figure 2‐6. Demographics of patient cohorts examined in RNAseq analysis or qPCR.
Biopsy set 1 (Cohort 1): RNAseq cohort (NL=6, EoE=10)
Biopsy set 2 (Cohort 2): qPCR cohort (NL=10, EoE=10)
Age Male Female Max Eosinophils per
high powered field (hpf)
NL 12.7 ± 6.0 50% 50% 0 ± 0
EoE 15.1 ± 12.4 60% 40% 163.6 ± 92.4
Age Male Female Max Eosinophils per
high powered field (hpf)
NL 9.7 ± 3.1 50% 50% 0 ± 0 EoE 10.7 ± 5.3 80% 20% 124. 4 ± 73.5

81
Figure 2‐6. Patient characteristics of EoE and control patients in cohort 1 and cohort 2. Description of
the age of biopsy collected, gender percentage and maximum eosinophils per high power field of the
patient in cohort 1 (Biopsy set 1) and 2 (Biopsy set 2).

82
Figure 2‐7. GO analysis of dysregulated genes in EoE patients
83
Figure 2‐7. The 1610 genes that were identified to be specifically dysregulated by RNA sequencing of
esophageal biopsies from patients with eosinophilic esophagitis (EoE) (n = 10) and normal controls (NL)
(n = 6) underwent gene ontology (GO) enrichment analysis and were clustered into 50 individual GO
nodes per their molecular function (with FDR‐corrected p < 0.05). GO enrichment based on molecular
function is shown, 50 individual GO nodes are identified with FDR B&H p < 0.05. Blue indicates the total
number of genes as part of the GO annotation; red indicates number of genes common between EoE
transcriptome and GO node. Red line indicates FDR B and H p‐value cutoff; orange dotted line indicates
FDR B and Y p‐value; light green dotted line indicates FDR B and H p‐value. Figure is generated by
Toppgene.
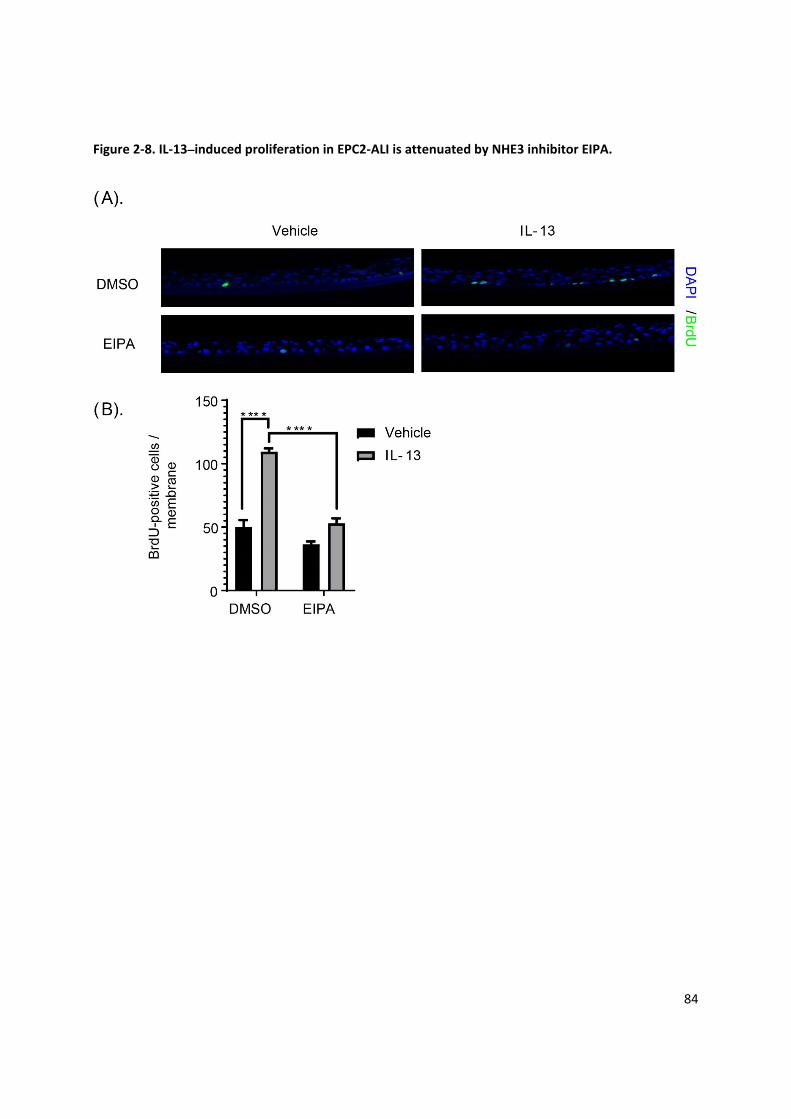
84
Figure 2‐8. IL‐13–induced proliferation in EPC2‐ALI is attenuated by NHE3 inhibitor EIPA.

85
Figure 2‐8. IL‐13–induced proliferation in EPC2‐ALI is attenuated by NHE3 inhibitor EIPA. A) EPC2‐ALI
cultures treated with the four combinations of vehicle (Veh) or IL‐13 (100 ng/mL) with DMSO or EIPA (20
M) for 72 h and stained for BrdU incorporation and DAPI (nuclei). B) Quantification of BrdU‐positive
cells in EPC2‐ALI cultures. Data are presented as mean ± SEM; n = 6 per treatment. ****p < 0.0001.
Magnification X300.

86
Table 2‐1. Expression level of 572 genes dysregulated in mature EPC2‐ALI by IL‐13.
gene_id 48hr Veh 48hr IL‐13 LOGFC pvalue
NTRK1 0 12.8962 12.0048 7.72E‐25
ATP5J2‐PTCD1 0 2.89614 10.92178 4.59E‐15
TREML2 0 1.59001 9.500339 1.66E‐07
FGF19 0 2.40941 9.285919 9.07E‐07
DYX1C1‐CCPG1 0 0.996634 9.175073 2.04E‐06
PPT2‐EGFL8 0 1.44493 8.900974 1.26E‐05
TNFAIP6 0.417235 183.29 8.662212 2.90E‐45
ARPC4‐TTLL3 0 0.708783 8.407443 0.000188
ZNF20 0 0.923428 8.407443 0.000188
CSF3 0 1.32101 7.949604 0.001337
SHC4 0 0.446474 7.949604 0.001337 C17orf61‐PLSCR3 0 0.896016 7.757792 0.002667
FAM26D 0 1.11879 7.65139 0.003799
C8orf44‐SGK3 0 0.348911 7.595093 0.004545
NELL2 0 0.479493 7.475448 0.006542
SERPINB4 1.15211 214.884 7.426299 6.27E‐40
SLC5A5 0 0.337742 7.201519 0.013904
MAOB 0 0.391933 6.955428 0.025126
CCDC103 0 0.597608 6.863093 0.030786
LRRC31 0 0.386815 6.863093 0.030786
CADM2 0 0.10635 6.764443 0.037847
CCL26 0.37199 21.8657 6.751451 7.30E‐11
ALOX15 0 0.307886 6.658548 0.046698
TMEM191A 0 0.422046 6.658548 0.046698
FAM26E 0.111923 8.87311 6.192024 1.08E‐19
ANO1 0.233214 10.1932 5.662446 8.53E‐23
CAPN14 11.5813 546.537 5.443614 5.67E‐15
LBH 0.337045 13.5442 5.211747 1.96E‐19
DPP4 0.964848 23.7153 4.502532 9.19E‐22
BCL2L15 0.0199123 0.48573 4.491584 0.002442
FCGBP 0.0120834 0.259852 4.309746 0.000157
OSR1 0.104566 2.08085 4.197853 0.000294
C1QTNF1 0.457086 7.90129 4.14251 9.17E‐12
SOCS1 0.488605 8.46859 3.998544 3.81E‐07
EML5 0.0828536 1.35625 3.916082 8.80E‐07
SLCO2A1 0.0937948 1.35472 3.735509 8.01E‐05
GLDC 0.0519947 0.734296 3.703088 0.003112
NFE2 0.17579 1.58641 3.601208 0.004677
LMO2 0.1237 0.836398 3.565584 0.04179
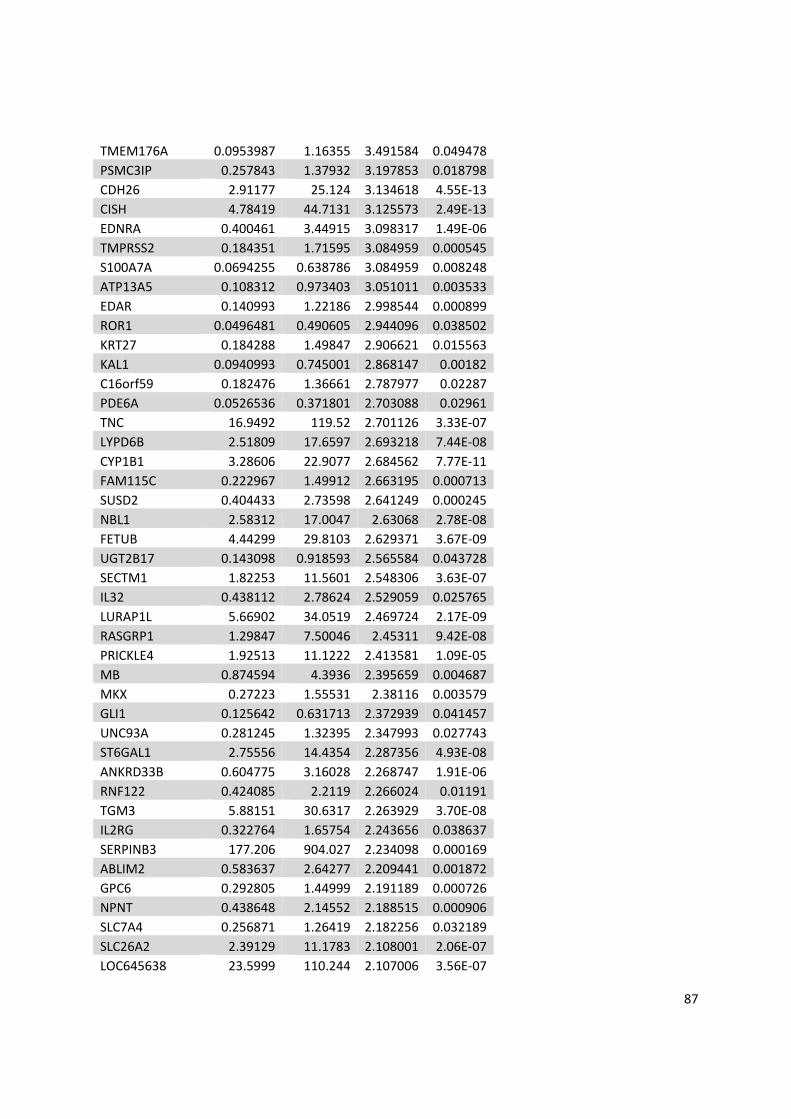
87
TMEM176A 0.0953987 1.16355 3.491584 0.049478
PSMC3IP 0.257843 1.37932 3.197853 0.018798
CDH26 2.91177 25.124 3.134618 4.55E‐13
CISH 4.78419 44.7131 3.125573 2.49E‐13
EDNRA 0.400461 3.44915 3.098317 1.49E‐06
TMPRSS2 0.184351 1.71595 3.084959 0.000545
S100A7A 0.0694255 0.638786 3.084959 0.008248
ATP13A5 0.108312 0.973403 3.051011 0.003533
EDAR 0.140993 1.22186 2.998544 0.000899
ROR1 0.0496481 0.490605 2.944096 0.038502
KRT27 0.184288 1.49847 2.906621 0.015563
KAL1 0.0940993 0.745001 2.868147 0.00182
C16orf59 0.182476 1.36661 2.787977 0.02287
PDE6A 0.0526536 0.371801 2.703088 0.02961
TNC 16.9492 119.52 2.701126 3.33E‐07
LYPD6B 2.51809 17.6597 2.693218 7.44E‐08
CYP1B1 3.28606 22.9077 2.684562 7.77E‐11
FAM115C 0.222967 1.49912 2.663195 0.000713
SUSD2 0.404433 2.73598 2.641249 0.000245
NBL1 2.58312 17.0047 2.63068 2.78E‐08
FETUB 4.44299 29.8103 2.629371 3.67E‐09
UGT2B17 0.143098 0.918593 2.565584 0.043728
SECTM1 1.82253 11.5601 2.548306 3.63E‐07
IL32 0.438112 2.78624 2.529059 0.025765
LURAP1L 5.66902 34.0519 2.469724 2.17E‐09
RASGRP1 1.29847 7.50046 2.45311 9.42E‐08
PRICKLE4 1.92513 11.1222 2.413581 1.09E‐05
MB 0.874594 4.3936 2.395659 0.004687
MKX 0.27223 1.55531 2.38116 0.003579
GLI1 0.125642 0.631713 2.372939 0.041457
UNC93A 0.281245 1.32395 2.347993 0.027743
ST6GAL1 2.75556 14.4354 2.287356 4.93E‐08
ANKRD33B 0.604775 3.16028 2.268747 1.91E‐06
RNF122 0.424085 2.2119 2.266024 0.01191
TGM3 5.88151 30.6317 2.263929 3.70E‐08
IL2RG 0.322764 1.65754 2.243656 0.038637
SERPINB3 177.206 904.027 2.234098 0.000169
ABLIM2 0.583637 2.64277 2.209441 0.001872
GPC6 0.292805 1.44999 2.191189 0.000726
NPNT 0.438648 2.14552 2.188515 0.000906
SLC7A4 0.256871 1.26419 2.182256 0.032189
SLC26A2 2.39129 11.1783 2.108001 2.06E‐07
LOC645638 23.5999 110.244 2.107006 3.56E‐07

88
PPYR1 0.405006 1.8849 2.101637 0.022824
CTSC 86.6005 389.937 2.090948 5.58E‐05
DNER 0.423696 1.92332 2.065658 0.006451
HECW2 0.157272 0.67917 1.993678 0.01682
LINC00476 0.562423 2.07078 1.959863 0.048518
MAP3K14 2.10046 8.56304 1.920289 1.37E‐05
AKAP2 3.79869 15.4173 1.90406 1.94E‐06
CHI3L2 1.64993 6.31169 1.900004 0.003662
LOX 0.400767 1.55909 1.899008 0.005648
GCNT3 19.0739 76.0969 1.8794 2.98E‐06
PTCHD4 1.25931 4.84785 1.85371 0.000866
HS3ST1 3.88032 14.8807 1.82236 7.76E‐05
DPYD 1.37435 4.88437 1.815443 0.00029
PRR9 3.30348 12.4651 1.798994 0.001009
SEMA3A 0.22748 0.853696 1.791144 0.026732
NMI 3.21376 12.0343 1.787977 0.000618
ALDH9A1 18.1412 67.8892 1.787077 8.53E‐06
LAMP3 1.24484 4.60435 1.770202 0.00116
CFB 0.678504 2.49234 1.760232 0.015186
PDCD1LG2 0.73715 2.70776 1.760232 0.015186
TGM2 1.99162 7.11691 1.751657 0.000158
DIO2 2.24815 8.1191 1.724783 3.73E‐05
SFRP1 7.29323 25.9703 1.715393 1.57E‐05
SLC16A14 0.382766 1.34418 1.695352 0.023025
RPTN 130.765 456.312 1.686209 0.005013
ZNF860 0.432419 1.48748 1.66512 0.037828
C1S 0.619963 1.97069 1.653047 0.03097
SLC9A3 3.1023 10.3236 1.617697 0.000391
PKD2 4.13331 13.1789 1.556026 0.000116
CLGN 0.831392 2.55356 1.552409 0.025808
SCLY 1.12276 3.49355 1.544826 0.016068
ADAM8 3.94848 12.3019 1.529059 0.000355
PPP1R3C 2.694 8.4245 1.528001 0.001579
SLC45A4 3.43181 10.5442 1.502575 0.00055
ID3 22.8578 69.6206 1.48999 0.000173
PHF17 1.05748 3.16967 1.48615 0.004017
PAPSS2 0.927162 2.72897 1.471925 0.014292
CDC45 1.45115 4.32246 1.466049 0.025636
EHD3 5.62808 16.7135 1.453461 0.000308
CDC6 0.746004 2.20703 1.448015 0.037464
MUTED‐TXNDC5 2.10105 6.20834 1.447056 0.002885
PPP1R3D 12.3208 36.1941 1.438288 0.000267
SLC16A9 0.620917 1.78567 1.407155 0.038559

89
NUDT3 1.61044 4.5133 1.396608 0.01802
BTBD3 6.46411 18.8548 1.395777 0.000416
SDSL 1.84296 5.18726 1.376107 0.041176
PGBD5 1.62383 4.56755 1.375186 0.008955
MME 9.26011 25.6182 1.355959 0.000607
ST8SIA1 0.417951 1.15826 1.35371 0.019406
TNFRSF19 0.992628 2.7798 1.345536 0.020287
TRIM16L 3.04766 8.33872 1.335287 0.009187
PDZK1IP1 30.0173 81.8403 1.330179 0.000825
NCF1 4.03745 11.0037 1.32963 0.011062
MAOA 11.7049 31.5023 1.311863 0.000988
PPARGC1B 1.25664 3.36902 1.309424 0.002308
CA2 345.751 919.198 1.293803 0.03045
IRF1 2.47978 6.4926 1.271749 0.006422
BARD1 1.48879 3.89634 1.271137 0.032774
PP7080 8.46504 21.9548 1.258108 0.002991
CALCRL 0.753184 1.9467 1.253117 0.037427
NNMT 4.89472 12.5683 1.243656 0.010111
CAT 22.1727 56.8231 1.240852 0.001614
EEF1E1‐MUTED 2.22758 5.6761 1.238263 0.01409
LTA4H 75.9864 193.943 1.235562 0.00523
ITPRIPL2 5.03939 12.7608 1.217592 0.001929
CANT1 23.4506 59.2563 1.214236 0.002587
SAA1 15.5576 39.0059 1.212913 0.011045
FAM217B 7.83605 19.6528 1.21259 0.001995
SGK1 24.1875 60.2575 1.20568 0.002264
DDX58 1.31171 3.27457 1.203014 0.019629
PIK3R3 1.39546 3.36954 1.196038 0.014162
MSRB1 7.53364 18.6003 1.187073 0.008886
ORAI1 7.44987 18.2405 1.175021 0.008484
CDCA5 1.61452 3.94824 1.173267 0.046253
NINJ1 12.9094 31.4112 1.166014 0.005354
SPSB1 5.59134 13.6025 1.165768 0.005048
ENTPD2 5.09431 12.1684 1.161602 0.010615
NPDC1 3.36992 8.11224 1.150547 0.036634
GPRIN2 4.34553 10.391 1.140897 0.018744
BIRC3 0.931928 2.36181 1.122155 0.02956
PARP12 3.29122 7.76348 1.121245 0.010631
CD14 5.92275 13.752 1.119566 0.01736
DUOX2 1.93491 4.53761 1.112827 0.011514
GJA9‐MYCBP 2.64351 6.47864 1.111019 0.025506
MFHAS1 2.92078 6.82238 1.107083 0.009092
RUNX2 1.15696 2.67917 1.106153 0.031511

90
ASB1 6.79675 15.787 1.098983 0.004983
NANOS1 2.05453 4.57482 1.038072 0.026567
LRP12 6.96458 15.3995 1.035181 0.009178
TMTC3 6.61259 14.676 1.033336 0.008207
RAB27A 3.6526 8.01938 1.027928 0.01993
VWF 2.3094 5.08792 1.022722 0.012611
ALOX15B 6.9515 14.6907 1.021935 0.014344
CST3 193.576 423.969 1.014224 0.01734
TXN 124.236 269.499 1.001292 0.014368
SLC22A23 33.8029 18.2844 ‐1.0035 0.013808
ID1 69.9144 37.4873 ‐1.00924 0.010038
WNT7A 15.2522 8.19617 ‐1.01284 0.020001
TNS1 1.35874 0.72994 ‐1.01325 0.044735
ANXA9 50.8149 27.2877 ‐1.01384 0.009358
ITGB6 15.0787 8.08837 ‐1.01543 0.014282
NLRX1 22.6021 12.1086 ‐1.01668 0.009196
WWC1 12.1696 6.52788 ‐1.01798 0.009139
C6orf15 56.5726 30.2725 ‐1.01893 0.009637
LDLR 93.8748 49.8872 ‐1.01944 0.026684
PLEKHA6 1.74968 0.934552 ‐1.02158 0.047762
CLIC3 132.641 70.8381 ‐1.02176 0.008955
GBA 35.577 18.5995 ‐1.022 0.008824
MANSC1 18.9684 10.1286 ‐1.022 0.011745
POF1B 67.1948 35.7603 ‐1.02683 0.014242
S100A10 407.64 216.368 ‐1.03065 0.022404
PPP1R12B 3.05278 1.72252 ‐1.03402 0.015542
PIM1 77.64 41.1106 ‐1.03412 0.011265
KLK13 18.4194 9.75228 ‐1.03425 0.020384
AKR1C2 9.38037 5.25946 ‐1.0344 0.018703
RNF222 6.36259 3.35871 ‐1.03855 0.024965
CTGF 6.55088 3.44557 ‐1.04378 0.034145
LCE3E 493.985 259.781 ‐1.04401 0.014283
LPIN1 19.0839 9.85132 ‐1.0449 0.007464
PPARD 43.0156 22.4969 ‐1.04655 0.008629
IRS1 10.6324 5.581 ‐1.0467 0.007332
KIAA1239 1.58926 0.833159 ‐1.04852 0.048315
TP53INP2 36.9779 19.3598 ‐1.05044 0.008195
ARHGEF4 72.9352 38.0041 ‐1.05271 0.012202
WNT10A 8.63071 4.49651 ‐1.05751 0.021095
TUFT1 24.4823 12.7784 ‐1.05765 0.006907
NFASC 3.93257 2.17929 ‐1.0605 0.045469
LRP1 10.7551 5.58044 ‐1.0634 0.007641
GRB7 26.5239 13.6355 ‐1.06389 0.007208

91
AIM1L 28.2062 14.6282 ‐1.0641 0.007288
TIMP3 6.37175 3.30232 ‐1.06505 0.010695
TCP11L2 16.251 8.39722 ‐1.06938 0.010085
SPIN4 5.27389 2.72075 ‐1.0717 0.018055
C9orf169 56.4704 29.1204 ‐1.0723 0.00863
TPRG1 8.4483 4.33235 ‐1.07711 0.011312
SYT8 58.2452 29.7508 ‐1.08605 0.005476
WFDC5 102.818 52.3894 ‐1.08958 0.005332
UGCG 29.0211 14.7322 ‐1.09497 0.006647
ARID5B 8.17082 3.89986 ‐1.10212 0.00538
SRPX2 6.14943 3.10577 ‐1.10234 0.031874
DUSP1 28.67 14.4784 ‐1.10248 0.005485
IGFBP3 4.24878 2.15771 ‐1.10427 0.042708
NCCRP1 96.0627 48.3596 ‐1.10701 0.006143
KAT2B 20.1373 10.0805 ‐1.11514 0.004334
CPA4 21.3155 10.6498 ‐1.11755 0.00481
PLEKHM1P 5.35447 2.6758 ‐1.11761 0.023359
KRT2 5.53779 2.76491 ‐1.11891 0.029953
SLC39A2 15.204 7.5445 ‐1.11891 0.01414
SERPINB1 67.5999 33.7513 ‐1.11891 0.004216
PLK3 28.2309 14.0973 ‐1.12076 0.004459
MYOM1 1.74526 0.868805 ‐1.12744 0.048521
GLRX 33.8623 17.0859 ‐1.12831 0.006211
AADACL2 7.19573 3.55973 ‐1.13221 0.03983
CCDC88B 3.32092 1.64085 ‐1.13398 0.02007
RORA 3.55452 1.75489 ‐1.1341 0.006191
KLK5 118.993 58.9909 ‐1.13451 0.00456
CAMK2N1 31.8426 15.7092 ‐1.13619 0.003789
HS3ST6 15.2918 7.54181 ‐1.13662 0.020009
HMOX1 53.996 26.626 ‐1.13685 0.003664
KIFC3 25.733 12.6092 ‐1.14554 0.003418
KIAA1199 3.66444 1.79567 ‐1.14591 0.009087
MYLK 2.73077 1.06278 ‐1.14919 0.017331
OTUB2 3.42608 1.6741 ‐1.15001 0.026372
ASPRV1 27.1928 13.2455 ‐1.15456 0.003652
SLC37A2 57.6277 28.055 ‐1.15551 0.005243
OSBP2 6.79934 3.29551 ‐1.16173 0.006903
SH3D21 4.31603 2.08801 ‐1.16198 0.039352
PADI3 3.88268 1.8743 ‐1.16754 0.027452
FBXO32 4.16856 2.02648 ‐1.16969 0.006959
IFITM1 20.4401 9.84087 ‐1.17138 0.020119
TRIB2 5.63118 2.47007 ‐1.17138 0.00959
LRRC20 26.212 12.6197 ‐1.17196 0.002779

92
LGALSL 60.4183 28.9347 ‐1.17902 0.004201
MAP3K9 7.74508 3.68914 ‐1.18683 0.003677
INHBA 11.2455 5.34837 ‐1.18901 0.007588
GDPD3 26.4244 12.5628 ‐1.18955 0.005881
GLTP 345.911 163.935 ‐1.19411 0.021022
IMPA2 60.4967 28.6608 ‐1.19461 0.002277
TNFAIP8L3 10.3497 4.89841 ‐1.19604 0.007817
PADI1 26.8216 12.6902 ‐1.19652 0.002251
CALML5 116.432 54.9315 ‐1.20062 0.002173
DUSP16 27.5642 12.9913 ‐1.20209 0.002739
SLC6A6 2.30587 1.27922 ‐1.2038 0.016779
SCNN1B 26.2716 12.2874 ‐1.21316 0.002117
PTPRH 2.52051 1.18113 ‐1.21578 0.033522
SRPX 4.87309 2.2492 ‐1.21578 0.040778
SASH1 17.2383 8.03138 ‐1.21873 0.002016
FOSL1 13.5356 6.28807 ‐1.22291 0.007033
DUSP6 46.8348 21.7271 ‐1.22541 0.0019
GJB4 4.39331 2.03682 ‐1.22583 0.020898
PCSK5 3.59228 1.37804 ‐1.22697 0.009194
SPARC 35.0307 16.1307 ‐1.23565 0.001705
NFATC2 2.56734 1.15494 ‐1.23715 0.009305
KRT79 5.7037 2.61528 ‐1.24177 0.021659
TMPRSS13 19.267 9.35643 ‐1.24444 0.001936
SH3TC2 0.648238 0.296549 ‐1.24509 0.010234
LIPN 18.1171 8.28438 ‐1.24573 0.006581
TINAGL1 50.7916 23.1182 ‐1.25105 0.001422
UCA1 5.30638 2.4174 ‐1.25111 0.019222
KRT78 223.834 101.964 ‐1.25121 0.004783
NDRG1 447.095 203.287 ‐1.25432 0.03493
LIPG 8.05869 3.65343 ‐1.25813 0.003009
FLG2 90.5457 41.0166 ‐1.25928 0.01509
C10orf116 70.1305 31.7259 ‐1.26011 0.001932
MALL 21.6099 9.78108 ‐1.26046 0.001456
TNFSF9 8.20738 3.70328 ‐1.26496 0.014626
LYNX1 1381.19 620.621 ‐1.26535 0.014294
MBOAT2 38.2663 17.2118 ‐1.26952 0.001376
SPRR2G 1148.07 515.868 ‐1.27097 0.011861
IL6R 8.33919 3.67472 ‐1.27134 0.001737
MATN2 2.96072 1.33777 ‐1.28289 0.017476
PNPLA1 3.27661 1.49227 ‐1.28884 0.035963
SLURP1 306.661 135.656 ‐1.29352 0.001219
KIF13B 16.4814 7.27326 ‐1.297 0.001078
IL18 43.2525 19.0087 ‐1.30428 0.001285

93
S100A12 164.048 72.024 ‐1.30441 0.000931
ADSSL1 6.82477 2.959 ‐1.30568 0.016037
HSPA2 8.0106 3.51235 ‐1.30631 0.00434
H19 153.395 67.2493 ‐1.30681 0.002661
GLUL 195.441 86.4826 ‐1.3122 0.011754
EEPD1 1.58455 0.691679 ‐1.31274 0.03769
GABRE 14.8599 6.4333 ‐1.32463 0.001158
CRCT1 846.618 364.754 ‐1.33163 0.005276
RASAL1 2.18686 0.96451 ‐1.33254 0.030061
PEG10 5.88086 2.51982 ‐1.34131 0.001307
SPON2 6.26296 2.67543 ‐1.34131 0.014396
IL22RA1 13.2388 5.62271 ‐1.35228 0.001173
ARHGAP29 9.01501 3.82781 ‐1.35265 0.000591
FGFBP1 243.257 102.98 ‐1.35696 0.001617
TRPV3 3.71045 1.56017 ‐1.36041 0.002965
GLA 26.3971 11.1174 ‐1.36439 0.001144
GNAO1 1.86537 0.805934 ‐1.3664 0.013094
FAM49A 2.44451 1.02811 ‐1.3664 0.013094
B4GALNT3 27.6506 11.5929 ‐1.37091 0.000487
DNAJB5 8.80537 3.71198 ‐1.37432 0.0029
SPNS2 70.9613 29.6095 ‐1.37812 0.001225
PNLIPRP3 75.8125 31.6181 ‐1.37852 0.000605
DSG1 75.8771 31.5732 ‐1.3818 0.001931
SMAD3 19.8634 8.22074 ‐1.38942 0.000429
CDSN 85.951 35.5609 ‐1.39006 0.000703
PRSS22 16.7898 6.92537 ‐1.39446 0.002221
GRAMD1C 6.75636 2.82685 ‐1.39575 0.002047
CLCA4 28.7374 11.7299 ‐1.4042 0.000359
RUSC2 7.6773 3.09819 ‐1.4065 0.000671
IL37 8.52204 3.3792 ‐1.4117 0.036442
ARRB1 0.765803 0.313581 ‐1.41931 0.041956
BHLHE41 1.41463 0.571764 ‐1.42377 0.045085
SLC15A1 7.34683 2.96794 ‐1.4245 0.001871
THEM5 13.0476 5.26949 ‐1.42489 0.005312
MUC20 3.88438 1.56977 ‐1.42728 0.001667
SLC16A5 6.22436 2.50965 ‐1.42728 0.00898
CRLF1 2.79946 1.12757 ‐1.42877 0.048549
CDA 24.7818 9.87636 ‐1.44407 0.001515
OVOL2 5.79497 2.28922 ‐1.45678 0.015159
CSGALNACT1 3.14939 1.32582 ‐1.46089 0.006164
NOS3 1.46849 0.581862 ‐1.47094 0.029232
SPTSSB 16.5755 6.47796 ‐1.47228 0.000464
FOS 6.79126 2.65107 ‐1.47394 0.004294

94
FHDC1 7.86995 3.07043 ‐1.47475 0.00029
C1QTNF6 5.80248 2.26082 ‐1.48217 0.002758
MYCT1 3.02636 1.16981 ‐1.48815 0.012706
KLK9 16.5958 6.40971 ‐1.48932 0.001097
FAM43A 21.1272 8.12521 ‐1.49546 0.000179
ARNT2 1.08718 0.416799 ‐1.5 0.021107
MUC21 27.0311 10.3626 ‐1.50007 0.000142
SERPINA12 10.0417 3.82449 ‐1.50951 0.001381
CCBP2 1.63925 0.622782 ‐1.51307 0.040646
RAPGEF3 1.14625 0.439459 ‐1.51377 0.020679
CEACAM6 94.2063 35.6128 ‐1.52027 0.000251
SEMA7A 4.99729 1.96415 ‐1.52188 0.002253
SHF 9.78356 3.68687 ‐1.5248 0.000803
CEACAM7 13.8434 5.19308 ‐1.53138 0.000416
LGALS1 180.302 67.5538 ‐1.53314 0.000102
CTSL2 66.0985 24.758 ‐1.53416 0.000302
KRT80 157.066 58.3824 ‐1.54012 0.0013
CLEC2B 3.0125 1.12287 ‐1.54061 0.024653
ECM1 256.631 94.7383 ‐1.54175 0.00093
MLPH 1.80645 0.674938 ‐1.55281 0.020929
KLK14 4.71958 1.73925 ‐1.55703 0.030191
MIR210HG 4.42877 1.6285 ‐1.5602 0.007271
ESYT3 2.80571 1.02919 ‐1.5637 0.004155
3‐Mar 2.94486 1.07584 ‐1.56958 0.004315
RNF39 19.5417 7.22099 ‐1.57091 0.000187
GPR111 2.62724 0.954864 ‐1.57702 0.003123
SPTBN5 0.44769 0.162672 ‐1.57737 0.029351
ZNF555 2.06264 0.75378 ‐1.58822 0.00132
SLC6A14 20.5034 7.38176 ‐1.59067 5.75E‐05
SERPINB9 4.84382 1.73085 ‐1.6015 0.000816
SLC26A9 4.24966 1.55532 ‐1.6015 0.000816
SPRR2F 27.4731 9.78694 ‐1.60593 0.001105
EMP3 13.6173 4.83076 ‐1.61195 0.004343
SLC5A1 19.0366 6.73827 ‐1.61628 4.39E‐05
SDR9C7 21.8245 7.70723 ‐1.6185 0.000132
SLC13A4 1.64241 0.57109 ‐1.64087 0.029154
PSAPL1 8.71749 3.02892 ‐1.64194 9.47E‐05
NPR2 2.20855 0.769098 ‐1.64672 0.010917
HCG22 3.35319 1.15474 ‐1.65481 0.000682
CST6 46.1786 15.8656 ‐1.65816 0.000202
LINC00319 1.91319 0.656418 ‐1.66013 0.019003
ADRB2 6.93458 2.36585 ‐1.66829 0.001631
KRT15 325.81 110.793 ‐1.67301 0.000452

95
PGLYRP4 79.4136 26.8069 ‐1.68362 2.48E‐05
VSIG10L 46.2237 15.4332 ‐1.69944 2.46E‐05
FAM25A 67.8396 22.4766 ‐1.71054 0.000201
C21orf7 1.63799 0.541671 ‐1.71327 0.046707
HSPB8 9.24948 3.04815 ‐1.71828 0.00049
LCE2A 59.0463 19.4351 ‐1.72002 6.77E‐05
AGAP11 2.52904 0.828227 ‐1.72072 0.007186
HYAL1 5.38962 1.68809 ‐1.73081 0.00257
CNFN 721.862 235.606 ‐1.73218 8.08E‐05
LGALS9B 3.34594 1.07393 ‐1.75634 0.027117
C7orf57 3.04559 1.0273 ‐1.75634 0.011893
IFI6 8.68132 2.84889 ‐1.75634 0.008246
BDKRB1 6.01298 1.90553 ‐1.77472 0.005993
TCN1 4.48672 1.4198 ‐1.77681 0.007916
FCHSD1 21.9994 6.9484 ‐1.77909 7.66E‐06
SMPD3 24.6573 7.74526 ‐1.78747 7.27E‐06
FGD2 1.39837 0.438391 ‐1.79029 0.023567
CRISP3 5.88265 1.83092 ‐1.80074 0.001026
XKRX 7.95386 2.47489 ‐1.80113 0.000133
ATG9B 23.2719 7.24138 ‐1.80132 5.86E‐06
CSPG4 0.716699 0.222368 ‐1.80525 0.010854
PTCD1 3.72798 1.15905 ‐1.80597 0.000186
IL36RN 34.2847 10.6961 ‐1.81317 5.30E‐06
SPRR2C 35.6369 10.9695 ‐1.81672 9.38E‐05
MMP2 5.50197 1.69338 ‐1.82452 0.000205
RNASE7 124.077 37.8939 ‐1.82804 6.79E‐06
KLK6 11.6747 3.60692 ‐1.83077 0.000273
C18orf26 1.85639 0.56448 ‐1.83435 0.02679
ZNF365 4.17548 1.24415 ‐1.84488 0.000319
TGM5 9.61207 2.80098 ‐1.84871 5.95E‐05
SERPINE1 38.9626 11.7549 ‐1.85007 3.46E‐06
LIPM 29.2906 8.81263 ‐1.85165 1.14E‐05
RNF223 8.20786 2.43616 ‐1.86924 0.002448
GDA 5.94488 2.17955 ‐1.87109 2.20E‐05
IL23A 2.47085 0.732054 ‐1.87182 0.049354
FN1 27.64 8.17514 ‐1.88108 5.43E‐06
NKPD1 7.52134 2.21066 ‐1.88335 1.51E‐05
DLX2 2.53577 0.744922 ‐1.8841 0.008628
CXCR7 8.3463 2.45186 ‐1.8841 0.0002
IL1R2 3.08575 0.920779 ‐1.89385 0.016743
TMEM132B 0.378951 0.109048 ‐1.91388 0.037156
LCE2B 156.558 44.944 ‐1.91734 1.58E‐06
RHBG 1.49563 0.466034 ‐1.92627 0.041236

96
GPSM1 12.1397 3.21886 ‐1.92714 6.38E‐06
FLG 47.8845 13.589 ‐1.93395 5.26E‐05
SCNN1D 1.17016 0.343151 ‐1.93692 0.025845
LCE1A 198.523 56.1421 ‐1.93899 1.23E‐06
LCE1C 117.831 33.0181 ‐1.95223 1.18E‐06
LCE1B 68.3343 19.1426 ‐1.95266 1.24E‐06
S100A6 567.321 158.126 ‐1.95993 8.86E‐06
GSDMA 67.9073 18.5941 ‐1.98556 7.94E‐07
LOXL2 2.57306 0.700711 ‐2.0135 0.001041
EGFL8 3.67043 1.06475 ‐2.01938 0.009366
ST6GALNAC1 3.46428 0.924515 ‐2.02262 0.001429
KCTD4 5.18719 1.37993 ‐2.0272 0.000595
COX6B2 1.72681 0.458689 ‐2.02936 0.028748
ABCG4 2.162 0.598133 ‐2.04392 0.001671
ELMOD1 4.00286 1.0624 ‐2.04852 0.000383
FGF5 0.513723 0.144004 ‐2.0518 0.031587
CASP14 16.315 4.24587 ‐2.05891 8.41E‐07
ALDH3A1 16.1135 4.18195 ‐2.06589 5.90E‐06
LCE2D 93.3328 24.0071 ‐2.07576 5.34E‐07
IGLON5 0.79858 0.205054 ‐2.07827 0.034776
SLC47A2 6.67977 1.75362 ‐2.08299 0.000104
KIAA1644 0.998906 0.254606 ‐2.08892 0.002732
SULT1B1 3.63113 0.922664 ‐2.09338 0.007449
CHRNA9 2.65398 0.670299 ‐2.10212 0.003647
USP2 5.23575 1.45218 ‐2.10568 3.45E‐05
DHRS9 27.3434 6.86805 ‐2.11069 7.34E‐07
ACSBG1 1.23198 0.320613 ‐2.11891 0.014395
CXCL14 105.699 26.3868 ‐2.11891 2.73E‐07
DSC1 9.08248 2.29473 ‐2.12157 1.09E‐06
IGFBP6 14.5563 3.61922 ‐2.12473 0.000115
TMEM86A 21.1973 5.26239 ‐2.12809 1.60E‐07
MSH5‐SAPCD1 0.972757 0.235653 ‐2.13486 0.011337
PSG2 1.29001 0.315467 ‐2.14866 0.042388
LCE6A 84.9878 20.3968 ‐2.17575 1.91E‐07
ENDOU 18.9507 4.59805 ‐2.17999 3.53E‐07
MT2A 203.72 48.699 ‐2.18146 7.05E‐08
CYP4F22 12.3353 2.94809 ‐2.18178 1.23E‐06
DNASE1L2 2.01632 0.479387 ‐2.1893 0.023534
CHI3L1 5.98348 1.41874 ‐2.19321 0.000249
HYAL4 2.0167 0.475561 ‐2.20113 0.005011
NDUFA4L2 5.91809 1.39119 ‐2.20565 0.001491
NPR3 0.607935 0.144264 ‐2.21578 0.006529
CCL24 6.05146 1.41259 ‐2.21578 0.034239

97
CFTR 0.403784 0.0933127 ‐2.23027 0.025522
LCE2C 101.124 23.2283 ‐2.23901 6.38E‐08
KCNE1 0.877545 0.209704 ‐2.24177 0.019355
LCE1F 146.714 32.8463 ‐2.27604 2.05E‐08
EGR3 8.70421 1.94984 ‐2.28181 2.28E‐07
DKK1 1.42638 0.316953 ‐2.28686 0.020813
ENO2 1.30779 0.288582 ‐2.29691 0.012338
ADAMTS1 10.2196 2.25511 ‐2.29691 7.51E‐08
IGFL1 138.427 30.1714 ‐2.31471 1.05E‐08
TREX2 7.57473 1.57017 ‐2.38711 0.000185
LCE1D 65.8624 13.6003 ‐2.39265 3.07E‐07
PLA2G4B 40.2165 8.30458 ‐2.39291 3.65E‐09
FRY 0.323396 0.0652453 ‐2.4262 0.007011
PLA2G4D 2.98398 0.585296 ‐2.46684 6.65E‐05
MXRA5 6.40136 1.2529 ‐2.46995 3.56E‐09
KCNMA1 1.7114 0.337059 ‐2.47059 7.61E‐05
TNFRSF6B 2.01445 0.402936 ‐2.47255 0.019084
BPIFC 11.3027 2.1831 ‐2.48906 5.53E‐07
HAL 4.9103 0.960323 ‐2.49082 1.56E‐06
KIF26A 0.2931 0.0564452 ‐2.49331 0.025404
ZNF662 4.5797 0.861328 ‐2.51964 1.76E‐07
RTN1 1.04577 0.223707 ‐2.52188 0.034496
IGFL3 11.3683 2.11249 ‐2.54484 0.000275
MMP1 5.088 0.967246 ‐2.5637 6.87E‐05
S100A4 4.25436 0.868585 ‐2.5637 0.020033
MMP9 1.78039 0.326541 ‐2.5637 0.00271
PCDHGA5 0.307647 0.0608375 ‐2.5637 0.048024
LCE5A 3.38543 0.62092 ‐2.5637 0.009517
MPP2 0.493773 0.0864461 ‐2.63081 0.015806
NGEF 0.563221 0.11282 ‐2.66323 0.036488
SLC16A6 0.516864 0.0989214 ‐2.68234 0.020781
FCHO1 0.908266 0.166263 ‐2.70388 0.007798
TIAF1 1.36314 0.220365 ‐2.75634 0.006241
PRB2 1.10951 0.178058 ‐2.75634 0.02776
RGCC 2.14492 0.344224 ‐2.75634 0.009855
AQP9 0.524456 0.0841664 ‐2.75634 0.02776
PTGER3 1.98846 0.36334 ‐2.77804 2.74E‐06
LCE1E 33.5119 5.17591 ‐2.81163 4.98E‐10
MEF2B 1.19178 0.208542 ‐2.84381 0.021148
KLHL6 0.203688 0.0301741 ‐2.87182 0.037763
LOR 80.7339 11.741 ‐2.89846 3.00E‐12
CCL22 1.66284 0.239628 ‐2.91162 0.000509
CYP26B1 0.787292 0.112309 ‐2.92627 0.001752

98
IGSF22 0.433619 0.0617884 ‐2.92627 0.016133
MMP10 2.81478 0.397518 ‐2.94077 0.000423
IVL 71.659 9.91461 ‐2.97036 9.68E‐13
NR4A1 0.586822 0.100288 ‐2.97874 0.02802
KCNN4 0.839935 0.113512 ‐3.00427 0.012324
PSG7 5.98116 0.836074 ‐3.00788 6.18E‐06
KRT37 3.91945 0.518005 ‐3.03645 6.30E‐05
KPRP 124.81 16.2759 ‐3.05576 3.66E‐12
PSG5 1.00735 0.161457 ‐3.07827 0.02084
MMP3 2.7627 0.347739 ‐3.10684 0.000224
PAPL 20.6342 2.55469 ‐3.13065 6.05E‐13
EPHA8 2.98593 0.322206 ‐3.15489 9.70E‐05
CYP4F2 1.59445 0.188545 ‐3.19692 0.000693
FRMPD1 2.41718 0.284472 ‐3.2038 4.98E‐07
KLHL30 0.295594 0.0345002 ‐3.21578 0.037528
HLA‐F‐AS1 0.675554 0.0667367 ‐3.34131 0.026904
LOC100507564 1.01634 0.116087 ‐3.34131 0.026904
STEAP1B 1.06805 0.0979456 ‐3.45678 0.019374
APOD 2.80422 0.225015 ‐3.75634 0.00042
SCNN1G 0.735816 0.0545013 ‐3.87182 0.00092
C1orf68 11.451 0.840088 ‐3.88563 4.39E‐08
GPBAR1 0.603274 0.0915109 ‐3.92627 0.034093
MYO1H 0.209304 0.0149288 ‐3.92627 0.034093
POU5F1 0.622654 0.0730543 ‐3.92627 0.034093
ARC 0.302825 0.0215993 ‐3.92627 0.034093
FAM65C 0.855848 0.0593942 ‐3.9658 0.000121
GP1BB 2.08565 0.136895 ‐4.07827 0.002148
FOSB 0.296567 0.0340534 ‐4.07827 0.023276
MYPN 0.204422 0.0221812 ‐4.07827 0.023276
LOC149086 0.847807 0.0544235 ‐4.07827 0.023276
HNRNPH2 8.45215 0.542771 ‐4.10684 1.90E‐12
GYS2 0.347785 0.0202959 ‐4.21578 0.016015
ARG1 5.60549 0.257025 ‐4.5637 2.61E‐08
SYNPO2L 0.623297 0.0387408 ‐4.66323 0.000116
FSBP 0.355492 0.0171707 ‐5.00427 0.000995
AQP5 3.15397 0.104723 ‐5.02936 3.05E‐07
CAPN8 0.989767 0.0302554 ‐5.14866 0.000518
C4orf26 0.374112 0 ‐6.30345 0.038212
LY75 0.0989903 0 ‐6.30345 0.038212
RELN 0.0513609 0 ‐6.30345 0.038212
IFNK 0.521178 0 ‐6.30345 0.038212
SYT14L 0.263222 0 ‐6.30345 0.038212
MYCBPAP 0.217294 0 ‐6.52323 0.023764

99
CACNA1D 0.116176 0 ‐6.71391 0.015043
CCL20 0.942526 0 ‐6.71391 0.015043
NPPA‐AS1 0.497653 0 ‐6.71391 0.015043
C1orf177 0.557644 0 ‐6.88231 0.009667
NWD1 0.129528 0 ‐7.03309 0.006294
KRTAP5‐4 0.838475 0 ‐7.03309 0.006294
XCR1 1.02833 0 ‐7.29428 0.002758
CA9 0.764663 0 ‐7.29428 0.002758
SENP3‐EIF4A1 0.293999 0 ‐7.29428 0.002758
C9orf131 0.489218 0 ‐7.51536 0.001255
ZNF321P 0.678821 0 ‐7.61437 0.000856
PTPN5 0.54883 0 ‐7.70702 0.000589
SLC6A2 0.649817 0 ‐7.95386 0.000198
UBE2F‐SCLY 1.60147 0 ‐9.28737 2.64E‐08
MUTED 2.36062 0 ‐9.63266 8.66E‐10
PALM2‐AKAP2 0.984738 0 ‐9.91105 3.59E‐11
TMX2‐CTNND1 1.51256 0 ‐10.2711 2.87E‐13

100
Table 2‐1. Expression level of 572 genes dysregulated in mature EPC2‐ALI by IL‐13. RPKM value of gene
expression level in mature EPC2‐ALI treated with vehicle (Veh) or IL‐13 (100 ng/mL) for 48 h. Log2 fold
change (LOGFC) indicates the gene expression fold change induced by IL‐13. n = 3 per treatment; 572
genes were selected with |LOGFC| > 1 and p < 0.05.

101
Table 2‐2. GO analysis of IL‐13–induced dysregulated genes in mature EPC2‐ALI.
GO: Molecular Function
GO: Biological Process
ID Name pValue Genes from Input Genes in Annotation
1 GO:0018149 peptide cross-linking 3.322E-21 23 57
2 GO:0031424 keratinization 1.154E-20 22 53
3 GO:0008544 epidermis development 2.465E-20 48 340
4 GO:0043588 skin development 7.283E-20 43 278
5 GO:0030216 keratinocyte differentiation 1.824E-18 30 138
6 GO:0009913 epidermal cell differentiation 1.631E-15 32 200
7 GO:0016477 cell migration 4.759E-12 82 1300
8 GO:0040011 locomotion 7.712E-12 99 1735
9 GO:0060429 epithelium development 1.047E-11 81 1296
10 GO:1901700 response to oxygen-containing compound 2.252E-11 93 1614
11 GO:0006954 inflammatory response 3.784E-10 52 711
12 GO:0051674 localization of cell 5.066E-10 82 1428
13 GO:0048870 cell motility 5.066E-10 82 1428 14 GO:0030334 regulation of cell migration 5.906E-10 53 742
15 GO:1902533 positive regulation of intracellular signal transduction 9.700E-10 62 958
GO: Pathway
ID Name P Value Genes from Input
Genes in Annotation
1 1457791 Formation of the cornified envelope 1.343E-22 27 71
2 M5889 Ensemble of genes encoding extracellular matrix and extracellular matrix-associated proteins
9.224E-18 87 1028
3 1457790 Keratinization 1.006E-15 35 214
4 M5885 Ensemble of genes encoding ECM-associated proteins including ECM-affiliated proteins, ECM regulators and secreted factors
2.839E-15 68 753
5 1470923 Interleukin-4 and 13 signaling 1.916E-8 18 114
ID Name pValue Genes from Input
Genes in Annotation
1 GO:0005509 calcium ion binding 5.388E-7 45 708
2 GO:0038024 cargo receptor activity 7.485E-7 12 71
3 GO:0008236 serine-type peptidase activity 1.986E-6 22 242
4 GO:0017171 serine hydrolase activity 2.435E-6 22 245
5 GO:0004252 serine-type endopeptidase activity 4.074E-6 20 215
6 GO:0005044 scavenger receptor activity 6.312E-6 9 47
7 GO:0004175 endopeptidase activity 2.395E-5 30 457
8 GO:0015291 secondary active transmembrane transporter activity 5.357E-5 19 236
9 GO:0042802 identical protein binding 5.841E-5 64 1359
10 GO:0005125 cytokine activity 7.640E-5 18 222
11 GO:0002020 protease binding 1.151E-4 12 115
12 GO:0016638 oxidoreductase activity, acting on the CH-NH2 group of donors
1.584E-4 5 19
13 GO:0019955 cytokine binding 1.790E-4 11 103
14 GO:0005518 collagen binding 2.090E-4 9 72
15 GO:0015075 ion transmembrane transporter activity 2.108E-4 44 873

102
6 M3468 Genes encoding enzymes and their regulators involved in the remodeling of the extracellular matrix
4.142E-8 26 238
7 1270302 Developmental Biology 1.709E-6 63 1081
8 M5883 Genes encoding secreted soluble factors 1.786E-6 29 344
9 1269310 Cytokine Signaling in Immune system 4.550E-6 48 763
10 1269318 Signaling by Interleukins 6.491E-6 37 531
11 169349 Validated transcriptional targets of AP1 family members Fra1 and Fra2
8.732E-6 8 34
12 M3008 Genes encoding structural ECM glycoproteins 1.623E-5 19 196
13 PW:0000051 histidine metabolic 4.113E-4 4 12
14 83051 Cytokine-cytokine receptor interaction 4.145E-4 20 270
15 1268755 Regulation of Insulin-like Growth Factor (IGF) transport and uptake by Insulin-like Growth Factor Binding Proteins (IGFBPs)
4.287E-4 5 21
103
Table 2‐2. GO analysis of IL‐13–induced dysregulated genes in mature EPC2‐ALI. GO enrichment
based on molecular function, biological pathway and pathway are shown. The p‐value was calculated on
the basis of probability density function

104
3 Chapter III: IL-13 activated STAT3 and STAT6 pathways in Eosinophilic
Esophagitis
Chang Zeng B Sc1, Simone Vanoni PhD1, 2, Simon P. Hogan PhD1,3
1Division of Allergy and Immunology, Cincinnati Children’s Hospital Medical Center, 3333 Burnet Ave,
Cincinnati, OH, 45229; 2Institute of Pharmacology and Toxicology, Paracelsus Medical University,
Salzburg, Austria. 3Department of Pathology, Mary H Weiser Food Allergy Center, Michigan Medicine,
University of Michigan, 109 Zina Pitcher Place, Ann Arbor, MI 48109‐2200.
Correspondence: Simon P. Hogan, Ph.D., Department of Pathology, Mary H Weiser Food Allergy Center,
Michigan Medicine, University of Michigan, 109 Zina Pitcher Place
Ann Arbor, MI 48109‐2200; Email: [email protected]; Phone: 734‐647‐9923.
Disclosures: The authors have declared that they have no conflict of interest

105
3.1 Copyright and Student Contribution
Authorship is listed on the title page. I performed all the bioinformatic analysis used in this manuscript
and experiments related to EPC2‐ALIΔSTAT6 cultures. SV generated knockout cell lines, performed western
blot analysis and BrdU assay in EPC2‐ALIΔSTAT3 cultures. Also, I generated figures, wrote the manuscript
and modified it under the guidance of SPH.
3.2 Abstract
Eosinophilic Esophagitis (EoE) is a food allergen‐related disorder driven by Type‐2 inflammatory
responses characterized by esophageal eosinophilia and epithelial remodeling. Previous studies have
demonstrated that increased Interleukin‐13 (IL‐13) level in EoE patients contributes to transcriptome
changes and led to histological changes. While anti‐IL‐13 therapy has demonstrated significant
improvement in treating EoE, the molecular mechanism of IL‐13‐driven dysregulation in EoE remains
unclear.
Janus kinases (JAK) /Signaling transducer and activator of transcription (STAT) pathways are the most
well‐known interleukin signaling pathways, and IL‐13 mainly signals through binding to IL‐4Rα/IL‐13Rα1
complex and activate JAK/STAT3 or STAT6 pathways. Herein, we identified STAT protein binding motif is
one of the most enriched transcription factors binding site (TFBS) in the dysregulated genes in both EoE
biopsies and IL‐13 treated in vitro esophageal epithelium (EPC2‐ALI). In particular, we identified the
STAT3 binding site as the most enriched TFBS in IL‐13 induced upregulated genes in EPC2‐ALI.
To study the involvement of STAT signaling in IL‐13 induced esophageal epithelial remodeling, we
employed shRNA technique to knockdown STAT3 and STAT6. Using RNA sequencing and gene ontology
(GO) analysis, we identified the involvement of STAT3‐dependent genes in regulating epithelial
development and proliferation. Experimental analysis showed that STAT3 knockdown in EPC2‐ALI led to
increased filaggrin expression and epithelial barrier resistance, suggesting the important role of STAT3 in

106
epithelial integrity. Further analysis showed that IL‐13 induced increased proliferation is abrogated in
STAT3KD cells, we thus conclude that STAT3 is essential for IL‐13 induced basal cell hyperplasia in EoE. In
contrast, we found that IL‐13‐induced STAT6‐dependent genes are related to cytokine and chemokine
production in esophageal epithelium.
Taken together, these data suggested an essential role of STAT proteins in EoE pathogenesis and defines
the distinct role of STAT3 and STAT6 in IL‐13 induced epithelium dysregulation in EoE.

107
3.3 Introduction
Eosinophilic esophagitis (EoE) is a chronic inflammatory disease of the esophagus, characterized by
upper gastrointestinal symptoms such as food impaction and dysphagia in both adults and children140,331.
Analysis of both patient biopsies and experimental murine model indicated EoE is driven by Th2‐
mediated inflammatory responses48,50,332,333.
One of the Th2 cytokines that is elevated in EoE patients is IL‐1348,51,54. Interestingly, intratracheal
delivery of IL‐13 led to eosinophils accumulation and esophageal epithelial hyperplasia in a murine
model of EoE206. Moreover, inducible, lung‐specific IL‐13 transgenic mice model showed EoE phenotypes
including esophageal eosinophilia and epithelium remodeling207.Conversely, IL‐13‐deficient mice fail to
develop histological EoE phenotypes upon repetitive epicutaneous antigen challenges to induce
experimental EoE18. Together, these experimental models have demonstrated a pathogenic role of IL‐13
in EoE. Furthermore, IL‐13 is shown to induce EoE‐like transcriptome changes in vitro54, leading to
dysregulation of inflammatory and epithelial barrier regulatory genes including Chemokine (C‐C motif)
ligand 26 (CCL26)54, cadherin‐26 (CDH26)334 desmoglein‐1 (DSG‐1)133, Leucine‐rich repeat‐containing
protein 31 (LRRC31)208, calpain‐14 (CAPN14)209 and synaptopodin (SYNPO)335.
Given the importance of IL‐13 in EoE pathogenesis, several clinical trials were performed to examine the
efficacy of anti‐IL‐13 therapy in treating EoE. In clinical trial studying anti‐IL‐13 mAb QAX576, inhibition
of IL‐13 in EoE patients showed decreased esophageal eosinophilia, together with the improvement of
EoE‐relevant transcriptome211. Aside from direct inhibition of IL‐13, antibodies against IL‐13 receptor
subunits also showed promising outcome in treating EoE. RPC4046, an antibody against both IL13Rα1
and IL13Rα2, recently established its ability to reduce esophageal eosinophil counts in EoE patients in its
phase II clinical trial212. In addition, in a recent clinical trial, treatment using antibody Dupilumab, that

108
blocks IL‐4Rα subunit, also showed relief of intraepithelial eosinophilia, improved symptoms and quality
of life compared to the placebo group in EoE patients213.
Considering the critical role of IL‐13 in the exacerbation of esophageal inflammation and remodeling, we
began to define the involvement of signaling pathways in IL‐13 effects on esophageal cells. IL‐13 mainly
signals upon binding to IL4Rα/IL13Rα1 complex. It is known to activate Janus kinase (JAK)/Signaling
transducer and activator of transcription 6 (STAT6) pathway and regulate transcription of STAT6‐
dependent genes176. In the meantime, recent studies also identified that IL‐13 could also signal through
JAK2/STAT3 pathway336,337.
Although all being STAT6 family members, STAT3 and STAT6 seem to have a distinct influence on cell
homeostasis. STAT6‐dependent signaling is critical for various allergic inflammatory disorders on both
hematopoietic and non‐hematopoietic compartments338. Mice with STAT6 knockout in eosinophils are
protected from allergic airway inflammation339. Also, epithelial STAT6 activation is essential for airway
hyperreactivity and mucus production in asthma340. Meanwhile, STAT3 signaling is proven important for
regulating barrier permeability341, epithelium differentiation342, and proliferation343. Together, both
signaling pathways could either regulate inflammatory responses or epithelial changes, which are
important pathogenic mechanisms and phenotypes in EoE. Given this, we examined the involvement of
STAT6 and STAT3 pathways in IL‐13‐mediated responses in esophageal epithelial cells.
We show that established that STAT binding site is one of the most enriched transcription factors
binding sites (TFBS) in EoE transcriptome and that STAT3 binding motif is the most significantly enriched
TFBS in IL‐13‐mediated upregulated genes. Bioinformatic and network analyses identified an enrichment
of genes that contain the STAT‐3 binding site that is involved in epithelium barrier regulation (e.g., LOR
and EMP1) and proliferation (e.g., WNT7A and IRS1). Using EPC2‐ALIΔSTAT3, we further proved the
influence of STAT3 on barrier function and IL‐13 induced proliferation in esophageal epithelium. In

109
contrast, we show that IL‐13‐induced STAT6‐dependent genes (e.g., POSTN and CCL26) are related pro‐
inflammatory esophageal function promoting cytokine production.

110
3.4 Materials and methods
RNAseq analysis of Human subjects ‐ NL (healthy control patients) were defined as having no history of
EoE diagnosis, 0 esophageal eosinophils per high‐power field (HPF) and no evidence of esophagitis
within distal esophageal biopsies obtained during the same endoscopy procedure as the analyzed
samples. EoE was defined as described in the recent consensus guidelines. Specifically, patients needed
to have ≥15 eosinophils in at least 1 high‐power field (Eos/hpf) in a distal esophageal biopsy with other
causes of esophageal eosinophilia excluded, and without a response to acid suppression. RNAseq
analyses were performed on human esophageal biopsy samples (normal, n = 6; EoE, n = 10) as
previously described (NCBI Gene Expression Omnibus (GEO) database under accession GSE58640)122.
Transcription factor binding site (TFBS) analysis – TFBS analyses were performed using the University of
California Santa Cruz transcription factor binding sites (UCSC_TFBS) database which belongs to Database
of Annotation, Visualization, and Integrated Discovery (DAVID) (https://david.ncifcrf.gov/)344,345.
EPC2‐ALI culture ‐ The cells used were immortalized human esophageal epithelial cell line (EPC2‐hTERT),
a kind gift from Dr. Anil Rustgi (University of Pennsylvania, Philadelphia, PA, USA), and were cultured as
previously described346. Air‐liquid interface (ALI) culture system was previously described and
characterized together with EPC2 cells133. EPC2‐hTERT cells were seeded onto permeable (0.4 µm)
transwell support (Corning Incorporated, Corning, NY, USA) and grown to confluence while fully
submerged in low‐calcium ([Ca2+] = 0.09 mM) keratinocyte serum‐free media (K‐SFM) (Life Technologies;
Carlsbad, CA). Epithelial differentiation was induced by culturing submerged cell monolayers in high‐
calcium K‐SFM ([Ca2+] = 1.8 mM) for 4 days (day 3 to 7). Cells were then exposed for 5 days (day 7 to 12)
at ALI by removing cell media from the top chamber, in order to induce stratification. Stimulation with
IL‐13 (100ng/mL) in the lower chamber occurred when the epithelial differentiation was complete. Cells

111
were collected for RNA or fixed for Chromatin Immunoprecipitation (ChIP) at different IL‐13 exposure
times as indicated.
H3K4me3 Histone Mark Chromatin Immunoprecipitation‐sequencing (ChIP‐seq) ‐ EPC2 cells were
stimulated at day 5 of ALI culture with IL‐13 (100 ng/mL) for 4 hours. Following exposure to IL‐13, cells
were cross‐linked with 0.8% formaldehyde for 10 minutes at RT. After lysis, cells were sonicated for 10
minutes (Peak power 175W, Duty factor 10%, Cycles/burst 200 count) at 4 °C using Covaris S series
Sonicator (Covaris; Woburn, MA, USA), yielding chromatin fragments of 200‐300 base pairs in size. To
avoid the presence of unspecific binding, pre‐clearing with 10µL Dynabeads® Protein G magnetic beads
(Life Technologies; Carlsbad, CA) was performed on each chromatin sample for 45 minutes at 4 °C on
rotating wheel. 20µL of Dynabeads® Protein G magnetic beads (Life Technologies; Carlsbad, CA, USA)
were combined for 1 hour at RT on a rotating wheel with 1 µL of anti‐H3K4me3 (cat#17‐614, Millipore
corporation; Temecula, CA, USA) per sample. Beads coated with antibody were then incubated for 14‐16
hours at 4 °C on a rotating wheel with 5µg of chromatin complexes to perform immunoprecipitation.
Chromatin‐antibody‐beads complexes were washed with 500µL of each of the following buffers in
succession: low salt wash buffer (10 mM Tris‐HCl pH7.6, 1 mM EDTA, 0.1% SDS, 0.1% sodium
Deoxycholate, 1% Triton X‐100, 150 mM NaCl), high salt wash buffer (10 mM Tris‐HCl pH7.6, 1 mM
EDTA, 0.1% SDS, 0.1% sodium deoxycholate, 1% Triton X‐100, 400 mM NaCl), LiCl wash buffer (10 mM
Tris‐HCl pH7.6, 1 mM EDTA, 250 mM LiCl, 0.5% sodium deoxycholate, 0.5% Nonidet P‐40) and Triton X‐
100 buffer (10 mM Tris‐HCl pH7.6, 1 mM EDTA, 0.2% Triton X‐100). Elution of the immunoprecipitated
chromatin was obtained following 1‐hour incubation at 37 °C with shaking using 100 uL elution buffer
(10 mM Tris‐HCl pH7.6, 1 mM EDTA, 250 mM NaCl, 0.3% SDS). 5 µL of Proteinase K solution (Life
Technologies; Carlsbad, CA, USA) was added to the eluates and incubated at 37°C for 1 hour for protein
degradation. Incubation at 65 °C for 6 hours was then performed for reversing the cross‐link. DNA was
purified with QIAquick® PCR purification kit (Qiagen; Valencia, CA, USA) and eluted in 30 µL molecular

112
biology grade water (Sigma; St. Louis, MO, USA) and processed for qPCR prior to sequencing. Libraries
were created as described previously347 and sequenced by CCHMC Gene Discovery and Genetic
Variation Core. Raw data was uploaded on Biowardrobe298, and peak values were calculated.
Differentially enrichment of binding sequences was assessed using MAnorm method348. Alteration of
H3K4me3 enrichment is identified by unique peaks in a certain group, with the criteria that log10 [p
value] > 1.3.
Lentiviral Transduction ‐ EPC2 cells were transduced at 60‐70% confluency with lentiviral particles
containing Mission® STAT6 shRNA (TRC0000019409, Sigma; St. Louis, MO, USA), Mission® STAT3 shRNA
(TRCN0000329887, Sigma; St. Louis, MO, USA) or Mission® non‐target control shRNA (Sigma; St. Louis,
MO, USA). All the shRNA lentiviruses were generated by the Cincinnati Children’s Hospital Medical
Center Viral Core using a 4‐plasmid packaging system. Lentiviral particles were incubated with EPC2 cells
for 6 hours. All the viral particles were added in the presence of 5 µg/mL Hexadimethrine Bromide
(Polybrene®) (Sigma; St. Louis, MO, USA). During the first hour of incubation, cells were spun down at
1000*g for 1 hour at room temperature. 6 hours following transduction cells were put in fresh KSFM
media, and 24 hours later media containing 1 µg/mL of Puromycin (Thermo Fisher Scientific
Incorporated; Rockford, IL, USA) was used for selection. Cells were grown under selective pressure and
cultured as regular EPC2 cells. Stable knockdown for STAT6 and STAT3 was demonstrated by western
blot and RNAseq analyses.
Western Blot ‐ EPC2 ALI cells were lysed following stimulation, using a protein extraction reagent (10%
Glycerol, 20 mM Tris HCl pH7, 137 mM NaCl, 2 mM EDTA, 1% NP‐40 in H2O) with Halt™ protease
inhibitor cocktail (Thermo Fisher Scientific Incorporated; Rockford, IL, USA). Approximately 40 μg of
protein extract were separated on a 4%‐12% Bis‐Tris gel and transferred to a nitrocellulose membrane
(Life Technologies; Carlsbad, CA). The following antibodies were used: anti‐STAT3 (1:1000, #9132, Cell
Signaling Technology; Danvers, MA), anti‐STAT6 (1:1000, sc‐621, Santa Cruz Biotechnology; Santa Cruz,

113
CA, USA), anti‐α‐actin (1:2000, A2066, Sigma; St. Louis, MO, USA) or anti‐GAPDH (1:2000, clone 2D9,
TA802519, Origene; Rockville, MD). The IRDye® 800 CW goat anti‐rabbit or goat anti‐mouse IgG (H+L)
(Li‐Cor; Lincoln, NE) were used as secondary antibody for detection.
RNAseq analyses and Gene ontology (GO) analysis ‐ RNAseq analysis was performed as previously
described. Briefly, RNA was isolated using the RNeasy kit (QIAgen Incorporated, Germantown, MD, USA)
according to manufacturer instructions. Assessment of RNA quality was performed using the Agilent
2100 Expert bioanalyzer (Agilent Technologies Incorporated, Clara, CA, USA) and only those samples
getting an RNA Integrity Number (RIN) above 8 were chosen for sequencing. Next‐generation
sequencing analyses were performed by the CCHMC Genetic Variation and Gene Discovery Core. Raw
data was uploaded on Biowardrobe298, and RPKM values were calculated. Differentially expressed genes
were assessed using DEseq2 under p<0.05 cut‐off conditions. Criteria of DEseq2 analysis for
identification of IL‐13‐induced STAT3 dependent genes: (1) RPKM>2 in any of the 4 groups (vehicle and
IL‐13 treated EPC2‐ALIctrl, vehicle and IL‐13 treated EPC2‐ALIΔSTAT3); (2) compare EPC2‐ALIctrl treated with
or without IL‐13, |Fold Change (FC)|>2, p<0.05; (3) compare EPC2‐ALIΔSTAT3 treated with or without IL‐13,
|Fold Change (FC)|<2, p>0.05. Similar criteria were applied for IL‐13‐induced STAT6 dependent genes.
Gene list enrichment analysis and candidate gene prioritization based on molecular function using
ToppGene299 with FDR B&H correction and p‐Value cutoff at 0.05.
5‐Bromo‐2’‐deoxyuridine (BrdU) assay and Immunofluorescent (IF) staining ‐ After EPC2‐ALI cultures
were treated as indicated in the experiment, BrdU reagents dissolved in DMSO (final concentration 10
µM) were added to both the upper and lower chambers of transwells for 2 hours. EPC2‐ALI cultures
were then washed with PBS and fixed with 4% paraformaldehyde for another 2 hours. To examine BrdU
incorporation, IF staining was performed as previously described349. In brief, formalin or
paraformaldehyde fixed, paraffin‐embedded EPC2‐ALI cultures were sectioned, mounted on slides and
de‐paraffinized using xylene followed by serial hydration using graded ethanol and water. Slides were

114
then permeabilized in Tris‐EDTA (1 mM, pH 9.0) with 0.1% Tween‐20, and antigen exposure performed
at 125°C for 30 seconds in a decloaking chamber using pressure cooker. Slides were then blocked by 4%
Normal Donkey serum for 1 hour followed by overnight incubation of primary antibody (mouse anti‐
BrdU (2.5 µg/mL)) diluted in 10% normal donkey serum. Slides were then washed and incubated with
secondary antibody (1:200, Donkey anti‐Mouse IgG (H+L) Secondary antibody, Alexa Fluor 488, Thermo
Fischer Scientific Inc., Waltham, MA, USA) at RT for 1hr. Slides were mounted with Fluoromount‐G
(SouthernBiotech, Birmingham, AL, USA) mounting solution. Fluorescent imaging was performed using
the Zeiss Apotome fluorescent microscope with consistent exposure time under the same excitation
wavelength.
Trans‐epithelial electrical resistance (TEER) measurement – TEER measurements were performed on
EPC2‐ALI cultures using epithelial volt/ohm meter (EVOM, World Precision Instrument, Sarasota, FL,
USA) together with chopstick electrode set (#STX2, World Precision Instrument, Sarasota, FL, USA).
Before the measurement, media was removed from the lower chamber of the transwell insert and the
inserts were washed with 1x PBS on both top and lower chamber. Fresh 1x PBS was added to both top
and lower chamber for measurement. TEER readings were recorded immediately, and three
measurements were performed for each culture insert. The TEER values were reported as ohms per
square centimeter (Ω/cm2).
Statistical Analysis ‐ Statistical significance of EPC2‐ALI samples were established using unpaired t‐test
(two‐tailed), or two‐way ANOVA when there was more than one variable. For non‐normally distributed
data from patient biopsies, Mann‐Whitney test was used. Graphs and statistical analyses were
performed using GraphPad Prism 7.02 (GraphPad Software Incorporated, La Jolla, CA, USA).

115
3.5 Results
3.5.1 STAT binding site is one of the most enriched TFBS in EoE dysregulated genes
To begin to define the Il‐13‐induced signaling pathways involved in esophageal inflammation and
remodeling in EoE, we analyzed the enrichment of transcription factor binding motifs (TFBM) in the
1607 dysregulated genes identified by RNAseq analyses comparing biopsy samples from normal healthy
controls and pediatric EoE patients122. We identified the significant enrichment of genes that possess
nuclear factor kappa‐light‐chain‐enhancer of activated B cells (NF‐κB), nuclear factor of activated T‐cells
(NFAT), peroxisome proliferator‐activated receptor gamma (PPARG), CCAAT‐enhancer‐binding proteins
(CEBP), STAT and interferon regulatory factor 1 (IRF‐1) binding motifs (Fig. 3‐1A). Notably, STAT family
binding site was one of the most enriched binding motifs (Fig. 3‐1A) within all the dysregulated genes in
EoE patients (448 genes, 27.9% of the total, p = 0.038). As the STAT family consists of seven family
members, we examined the expression of STAT proteins (STAT‐1‐STAT‐6) between NL and EoE patients,
and demonstrate significant differential expression in STAT1, STAT3 and STAT6 expression in EoE
patients (Fig. 3‐1B). Notably, we observed ~ 2‐fold increase in interferon‐induced STAT1 and IL‐4 and IL‐
13‐induced STAT3 and STAT6 mRNA in esophageal biopsy samples in patients with active EoE (Fig. 3‐1C,
D, E respectively). These studies show that IL‐13‐induced transcription factor STAT3 and STAT6 are
significantly elevated in EoE and that genes that possess STAT‐binding motifs are enriched in the EoE
transcriptome.
3.5.2 STAT binding site is the most enriched in both dysregulated genes and transcriptionally active
genes following 4 hours incubation with IL‐13 in EPC2‐ALI
In order to better understand the involvement of STAT proteins in regulating esophageal epithelium
remodeling, we employed the previously established in vitro stratified squamous epithelium model

116
(EPC2‐ALI). We have previously demonstrated that stimulation of EPC2‐ALI with IL‐13 induces an EoE like
transcriptome similar to what is observed in primary cells derived from EoE patients’ biopsies54,350.
RNAseq analysis of EPC2‐ALI showed that 4 hours treatment of IL‐13 led to significant dysregulation of
712 genes, with 39.04% upregulated and 60.96% downregulated genes (Fig. 3‐2A). TFBS analysis
indicated that STAT binding motif is the most significantly enriched binding site after short‐term IL‐13
exposure (Fig. 3‐2B, 220 genes, 30.1% of the total, p‐value 5.6e‐4). In order to better understand the cell
signaling network involved in the IL‐13 mediated transcriptome dysregulation, we also analyzed
trimethylation of lysine 4 on histone H3 (H3K4me3) modification on the chromatin of EPC2 ALI cultures.
The H3K4me3 modification is highly enriched in open chromatin regions, normally correlated with
transcriptionally active genes351. Using ChIP‐seq analysis, we identified 858 genes showing active
transcription following 4 hours IL‐13 treatment. TFBS analysis of these genes showing unique H3K4me3
modification revealed significant enrichment of genes that possess binding motifs of only STAT, ETS
domain‐containing protein (ELK1) and AP1FJ. Indeed, STAT binding motifs are the most significantly
enriched binding motif within the genes with at least one transcriptionally active region (Fig. 3‐2B, 310
genes, 36.1% of the total, p‐value 1.5e‐13).
3.5.3 STAT3 is the most enriched TFBS in IL‐13‐induced upregulated genes.
As STAT family binding motif is the most significantly enriched binding sites in both dysregulated and
transcriptionally activated genes in EPC2‐ALI cells after 4hr IL‐13 treatment, we’re interested in
identifying the specific STAT protein next involved in IL‐13‐induced dysregulation in EoE. We first
compared the expression level of STAT family members upon 4hr IL‐13 treatment. RNAseq analysis
indicated that STAT3 is the most upregulated STAT protein and also the only significantly upregulated
STAT within the family (Fig. 3‐3A, p=0.049 for STAT3). Interestingly, when analyzing subsets of IL‐13

117
dysregulated genes, we also found that STAT3 binding motif is the most significantly enriched binding
site in IL‐13 mediated upregulated genes (Fig. 3‐3B, 52% of the total, p‐value 5.9e‐9). Based on the
studies, we concluded that IL‐13 ‐induced STAT3 in esophageal epithelial cells and that IL‐13 induced the
enrichment of genes that possess STAT3 binding motifs.
3.5.4 STAT3 and STAT3‐related genes regulate barrier integrity of the esophageal epithelium
In order to better understand the role of STAT3 in esophageal epithelium, we employed the lentiviral
shRNA gene silencing system and generated stable knockdown (KD) EPC2 cell line with diminished STAT3
expression level. Western blot (Fig. 3‐4A) and RNAseq (Fig. 3‐4B) analyses indicated an 80% reduction in
both protein and mRNA level of STAT3 in STAT3 shRNA lentiviral transduced EPC2‐ALI cells (EPC2‐
ALIΔSTAT3) compared to empty control transduced group (EPC2‐ALICTRL).
We’re first examined the impact of STAT3 on EPC2‐ALI steady state function. RNAseq analysis comparing
transcriptome differences between EPC2‐ALICTRL and EPC2‐ALIΔSTAT3 cultures identified 493 genes that are
altered following STAT3 knockdown. GO analysis based on biological process annotation on these
dysregulated genes showed that within the top 5 GO nodes that were significantly dysregulated, 2 of
them are related to epidermal or skin development (Fig. 3‐4C), indicating a potential role of STAT3‐
dependent genes in the regulation of squamous epithelial differentiation maturation and barrier
integrity. Several junctional proteins, including epithelial membrane protein 1 (EMP1) and loricrin (LOR),
are significantly upregulated in EPC2‐ALIΔSTAT3 cells (Fig. 3‐4D).
To validate the altered expression of barrier integrity genes in EPC2‐ALIΔSTAT3 cells, we examined the
alteration of filaggrin (FLG) expression in EPC2‐ALI cultures. The FLG expression is significantly decreased
in EoE according to RNAseq analysis in our patient cohort (Fig. 3‐4E) and also been established in other
cohorts131. We showed that FLG expression in both mRNA and protein level are increased in EPC2‐

118
ALIΔSTAT3 cells (Fig. 3‐4F and 4G, mRNA and protein respectively), suggesting the role of STAT3 in
regulating the expression of barrier integrity genes such as filaggrin under steady state.
Given the role of STAT3 in regulating junctional proteins, we speculated that STAT3 could influence the
barrier function in esophageal epithelium. To verify this hypothesis, we compared the TEER between
EPC2‐ALICTRL and EPC2‐ALIΔSTAT3 cultures, as TEER is one of the important parameters that are used to
indicate epithelial barrier integrity. Consistent with our hypothesis, EPC2‐ALIΔSTAT3 cells showed
significantly higher TEER than the EPC2‐ALICTRL group (Fig. 3‐4H).
3.5.5 IL‐13 induced STAT3‐dependent genes are involved in IL‐13 induced cell proliferation
We next examined the contribution of STAT3 in IL‐13 induced esophageal epithelial dysregulation. By
performing DeSeq2 analysis on RNAseq results, we identified 129 genes that are regulated in an IL‐13‐
induced and STAT3‐dependent manner.
To further understand these genes, we performed GO analysis to determine gene clustering based on
biological processes. Within the top 10 individual GO nodes, there’s three GO nodes that are directly
related to proliferation, together with one node related to DNA replication, which is an essential
requirement of cellular proliferation (Fig. 3‐5A). Of the 27 IL‐13‐induced STAT3‐dependent, cell
proliferation regulation related genes included WNT7A and IRS1(Fig. 3‐5B).
To define the requirement of STAT3 in IL‐13 induced proliferation in EPC to ALI cells we performed a
BrdU assay. Consistent with previous studies IL‐13 stimulation of EPC2‐ALICTRL cells increased
proliferation rate (Fig. 3‐5C, top panel). We did not observe the IL‐13 ‐induced increase in proliferation
rate in EPC2‐ALIΔSTAT3 cultures (Fig. 3‐5C, lower panel). In the meantime, the level of EPC2‐ALI cell
proliferation at steady state was comparable between EPC2‐ALICTRL and EPC2‐ALIΔSTAT3 cultures,

119
suggesting STAT3 alteration doesn’t influence baseline proliferation rate (Fig. 3‐5D). Collectively, we
conclude that STAT3 activated gene transcription is essential for the IL‐13 induced esophageal
epithelium proliferation.
3.5.6 IL‐13 induced STAT6‐dependent genes are involved in cytokine production but not IL‐13
induced cell proliferation
We and others have previously reported a role for IL‐13‐induced STAT6 activation in allergic
inflammatory disorders206,352,353. To examine the IL‐13‐induced STAT6‐driven transcriptome in the
esophageal epithelium, we generated EPC2‐ALIΔSTAT6 cultures using lentiviral particles containing STAT6
shRNA. The efficiency of knockdown is verified by Western blot and RNAseq, showing a 70% knockdown
rate compared to EPC2‐ALICTRL (Fig. 3‐6A & 6B). RNAseq analyses were also performed to compare EPC2‐
ALIΔSTAT6 with EPC2‐ALICTRL, resulting in 166 genes that are IL‐13‐induced and STAT6‐dependent. In
contrast to the STAT3 bioinformatics analysis, GO analysis identified the top node for this group of genes
is positive regulation of cytokine production (Fig. 3‐6C), including periostin (POSTN) (Fig. 3‐6D). As
POSTN is previously showed to induced in IL‐13 JAK/STAT6 pathway in airway epithelium354, this
supported our criteria for the IL‐13‐induced STAT6 pathway. In addition, we checked several
inflammatory and cytokine‐related genes listed on EDP panels129, including CCL26 and TNFAIP6, and
found them also being induced by IL‐13 and showed repressed expression when STAT6 is knocked down
in EPC2‐ALI (Fig. 3‐6E).
Similar as STAT3, we were also interested in examining the contribution of STAT6 to the proliferation. To
understand if STAT6 contributes to IL‐13‐dependent proliferative response, we also performed
proliferation assay in EPC2‐ALICTRL and EPC2‐ALIΔSTAT6. Different from the STAT3 knockdown, knocking
down STAT6 did not prevent IL‐13 from inducing increase proliferation (Fig. 3‐6F & 6G). However,

120
interestingly, STAT6KD EPC2‐ALI showed an overall decrease of proliferation rate in absence or presence
of IL‐13. Based on these studies, we concluded that IL‐13 induced STAT6‐dependent transcriptome
changes are important for cytokine and chemokine production in esophageal epithelium.

121
3.6 Discussion
In this study, by analyzing the conserved binding motifs in both dysregulated genes in EoE transcriptome
and altered genes induced by IL‐13 in vitro model of esophageal epithelium, we identified the
involvement of STAT proteins in the regulation of EoE transcriptome and esophageal epithelial function.
Specifically, we demonstrated the role of STAT3 in modifying genes related to barrier integrity and cell
proliferation. Using genetic modification, we reveal that STAT3 negatively regulates barrier integrity
gene expression such as LOR and FLG, and suppression of STAT3 expression showed altered epithelial
barrier function. In addition, knocking down STAT3 protects against IL‐13 induced basal zone hyperplasia
(BZH) in esophageal epithelial cells. In contrast, we showed that STAT6 regulates IL‐13 dependent
cytokine and chemokine producing genes. Collectively, we showed the divergent function of IL‐13‐
induced STAT3 and STAT6 signaling pathways in influencing esophageal epithelium functions, suggesting
new potential therapeutic targets for EoE.
STAT3, a 92kDa transcription factor and a member of STAT family, is found important for regulating
intercellular permeability. STAT3 activated retinal endothelial cells have been associated with increased
endothelial permeability and decreased expression of junctional protein like Zonulin‐1 (ZO‐1) and
Occludin (OCLN)341. In lung carcinoma cells, downregulation of STAT3 led to decreased junctional
permeability, causing suppressed ability for intercellular communication355. Consistent with previous
observations, we demonstrated that, under steady state, knocking down STAT3 in esophageal epithelial
cells led to elevated expression of junctional proteins such as LOR, EMP1, and FLG. Previous studies
suggested that expressional alteration of these proteins was related to dysregulation of barrier
function356‐358. Specifically, FLG expression was decreased in the esophageal biopsies from patients with
active EoE131. We showed that downregulation of STAT3 in esophageal epithelial cells leads to increased
expression of FLG on both mRNA and protein level, as well as increased epithelial barrier function,
suggesting an important role of STAT3 in regulating barrier integrity in esophageal epithelium.

122
Interestingly, a recent study in atopic dermatitis showed that IL‐33 could also activate STAT3 and lead to
decrease expression of FLG359. IL‐33 is a cytokine that is found elevated in EoE patients101, mediating EoE
pathogenesis in experimental mice model67,101. Together with our observations, we speculated that IL‐33
could signal through STAT3 and mediate impaired barrier function in EoE. However, further experiments
are needed for further validation.
Aside from its involvement in regulating barrier function, STAT3 is widely studied in anti‐cancer
therapies360,361. Increased expression and activation of STAT3 is observed in various cancers including
colitis‐associated cancer362, neuroblastoma363and gastric carcinoma364. Upon IL‐6 activation, STAT3 is
known to promote cancer inflammation and inflammation‐induced carcinogenesis in coordination with
NF‐κB365. Clinical and experimental studies suggested that STAT3 targets a variety of genes, including
Cyclin D1 (CCND1), Vascular endothelial growth factor (VEGF) and B‐cell lymphoma‐extra large (Bcl‐xL),
which contribute to tumor proliferation, angiogenesis, and metastasis366. Specifically, in esophageal
carcinoma cell line, down‐regulation of STAT3 induced increased Caspase‐3 and promote apoptosis367.
Together, these studies suggested that activation of STAT3 pathways is tightly related to cell
proliferation. In esophageal epithelial cells, we showed that IL‐13‐mediated decrease expression of
genes like WNT7A and IRS1, which are previously showed to increase cell proliferation rate368,369.
Knockdown STAT3 in esophageal epithelial cells prevents these genes from decreasing, which contribute
to the abrogation of IL‐13 induced proliferation we observed in EPC2‐ALIΔSTAT3 cultures.
One other characteristic of esophageal remodeling in EoE is epithelial‐mesenchymal transition (EMT).
EMT occurs more frequently in patients with EoE compared to NL and is correlated with subepithelial
fibrosis in esophagus114. In esophageal epithelial cells, EMT could be induced by exposure to
transforming growth factor – beta 1 (TGF‐β1), a profibrotic factor that is increased in EoE patients113.
Interestingly, in lung cancer cells, the TGF‐β1 induced EMT is dependent on JAK/STAT3 pathway370.

123
Overall, these observations further support the role of STAT3 in regulating epithelium remodeling
induced by various cytokines involved in EoE.
Our work primarily demonstrated that STAT3’s involvement in esophageal epithelium remodeling and
other previous studies had suggested its activating role in modulating allergic inflammatory pathways in
hematopoietic cells. Autosomal‐dominant hyper‐IgE syndrome (AD‐HIES) is a disease caused by
dominant negative STAT3 mutation. Patients with AD‐HIES are characterized by skin and lung infections
and always showed increased IgE level371. A recent study comparing patients with AD‐HIES and patients
with atopic dermatitis showed that AD‐HIES patients have a significant lower rate of food allergies and
anaphylaxis372. This is proved to be related to decreased mast cell degranulation and basophil activation
caused by STAT3 deficiency372. In malignant T cells that secreted a high level of IL‐5, knockdown of STAT3
using siRNA led to decrease of IL‐5 production373, which could further decrease eosinophil infiltration in
situ. In eosinophils, STAT3 could be activated by IL‐5 and induced increased Pim‐1 and Cyclin D3
expression, which are important for eosinophil viability374. Interestingly, mast cells70, basophils65, and
eosinophils are all important effector cells in EoE with an increased level of activation and infiltration. In
light of this, further investigation of the involvement of STAT3 in hematopoietic cells would be beneficial
in understanding the pathogenesis of EoE.
Considering the role of STAT3 in modulating tissue remodeling and immunological pathways in EoE, it is
a potential target for EoE therapy. Pharmacological inhibition of STAT3 has been widely studied given its
involvement in cancer pathogenesis. A variety of natural and synthetic blockers has been established
and tested in targeting STAT3 in cancer375. A potent STAT3 specific inhibitor, C188‐9376, is currently under
clinical trial. Toxicity tests in murine models indicated that C188‐9 was well‐tolerated with good oral
bioavailability377. Importantly, a recent study using C188‐9 in mice showed significant reduction of cell
proliferation378. These extensive selections of STAT3 inhibitors, together with a proven effect on cell
proliferation, will easier allow the exploration of targeting STAT3 in esophageal epithelium.

124
In addition, we also identified the role of STAT6 in IL‐13 mediated transcriptome changes in esophageal
epithelium. JAK/STAT6 pathway is characterized as the canonical signaling pathway of IL‐13176. Previous
studies in animal models showed that STAT6 is important for inflammatory responses, as OVA‐induced
airway eosinophilia was abrogated in STAT6 KO mice, together with decreased peri‐bronchial
inflammation379‐381. Mice experiment transferring STAT6+/+ antigen‐specific Th2 cells to STAT6‐/‐ mice
failed to develop experimental allergic asthma, suggesting the importance of STAT6 in inducing
inflammatory responses in resident cells382. Consistent with it, by analyzing IL‐13‐induced STAT6‐
dependent genes in EPC2‐ALI, we showed that, in the esophageal epithelium, STAT6 is regulating the
expression of genes that are related to cytokine and chemokine production, such as CCL26, POSTN and
TNFAIP6. Collectively, our observations indicated that STAT6 is the key regulator for the production of
cytokines and chemokines in esophageal epithelium.
In conclusion, we described the transcriptome and phenotypical change of mature EPC2 ALI cells
following IL‐13 stimulation, showing correlation with some of the signatures of EoE. In particular, we
identified that barrier disruption and epithelial remodeling are driven by divergent pathways starting
with IL‐13 signaling and leading to the activation of STAT3 and STAT6, which control proliferation rate
and inflammatory chemokines production, respectively (Fig.7).

125
3.7 Figures
Figure 3‐1. STAT binding site is one of the most enriched TFBS in EoE dysregulated genes

126

127
Figure 3‐1. STAT binding site is one of the most enriched TFBS in EoE dysregulated genes. A)
Transcription factor binding site (TFBS) analysis of 1607 dysregulated genes from RNA sequencing.
Number of genes enriched with specific TFBS (grey bar) and p‐value (blue dot) is presented. B) Heatmap
depicting expression level of all family members of STAT proteins. C) Individual RPKM value of STAT1, D)
STAT3 and E) STAT6 in esophageal biopsies (NL = 6; EoE = 10). (C‐E) Data are represented as the average
± S.E.M. Individual symbols represent an individual patient ***p < 0.001

128
Figure 3‐2. STAT binding site is the most enriched in both dysregulated genes and transcriptionally
active genes following 4hr incubation with IL‐13 in EPC2‐ALI

129
Figure 3‐2. STAT binding site is the most enriched in both dysregulated genes and transcriptionally
active genes following 4hr incubation with IL‐13 in EPC2‐ALI. A) 712 genes are dysregulated in 4hr IL‐13
(100ng/mL) treated in EPC2‐ALI culture. TFBS analysis of B) these 712 significantly altered genes by RNA
sequencing and C) 858 genes highly enriched with H3K4me3 chromatin modification specific in 4hr IL‐13
(100ng/mL) treated in EPC2‐ALI culture identified by Chromatin Immunoprecipitation sequencing.
Number of genes enriched with specific TFBS (grey bar) and p‐value (blue dot) are presented in each
graph.

130
Figure 3‐3. STAT3 is the most upregulated STAT protein in 4hr IL‐13 treated EPC2‐ALI. And STAT3
binding site is the most enriched TFBS in IL‐13‐induced upregulated genes.
131
Figure 3‐3. STAT3 is the most upregulated STAT protein in 4hr IL‐13 treated EPC2‐ALI. And the STAT3
binding site is the most enriched TFBS in IL‐13‐induced upregulated genes. A) Heatmap depicting
expression level of all family members of STAT proteins in EPC2‐ALI cultures treated with vehicle (Veh)
and IL‐13 (100ng/mL) for 4 h. B) TFBS analysis of 278 upregulated genes in EPC2‐ALI treated with IL‐13
(100ng/mL) for 4 h from RNA sequencing. Number of genes enriched with specific TFBS (grey bar) and p‐
value (blue dot) are presented.

132
Figure 3‐4. STAT3 and STAT3‐related genes regulate barrier integrity of esophageal epithelium

133

134
Figure 3‐4. STAT3 and STAT3‐related genes regulate barrier integrity of esophageal epithelium. A)
Western Blot analysis and B) RNA sequencing analysis of EPC2‐ALI cultures transduced with empty
control vector (EPC2‐ALICTRL) and vector with STAT3 shRNA (EPC2‐ALIΔSTAT3). C) Gene ontology (GO)
enrichment analysis of 493 STAT3‐dependent genes from RNA sequencing. D) Heatmap depicting STAT3‐
dependent genes that are related to epidermal development. E) Filaggrin (FLG) expression level
identified by RNA sequencing in esophageal biopsies (NL = 6; EoE = 10) and F) EPC2‐ALI. G) Expression
level of filaggrin and pro‐filaggrin identified by western blot analysis in EPC2‐ALI. H) Trans‐epithelial
electrical resistance (TEER) in EPC2‐ALI. (E, H) Data are represented as the average ± S.E.M. ***p <
0.001, ****p < 0.0001.
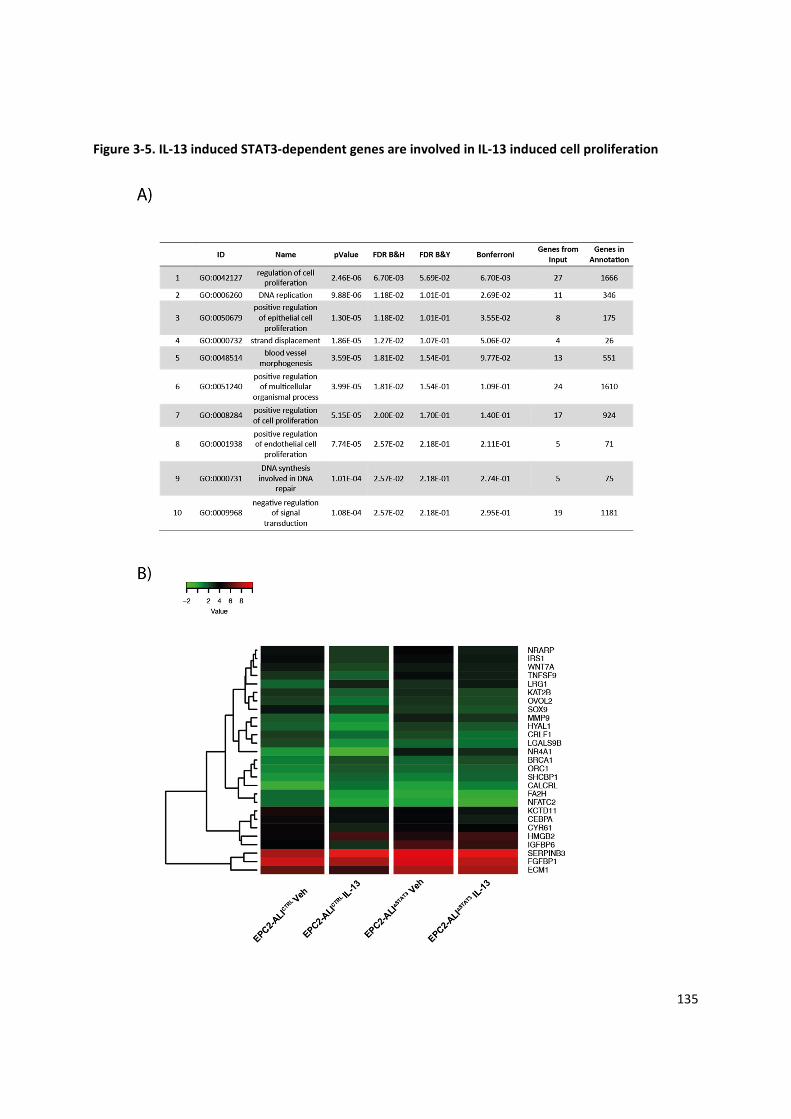
135
Figure 3‐5. IL‐13 induced STAT3‐dependent genes are involved in IL‐13 induced cell proliferation

136

137
Figure 3‐5. IL‐13 induced STAT3‐dependent genes are involved in IL‐13 induced cell proliferation. A)
Gene ontology (GO) enrichment analysis of 129 IL‐13 induced STAT3 dependent genes identified by RNA
sequencing analysis. B) Heatmap depicting 27 IL‐13‐induced STAT3‐dependent, cell proliferation
regulation related genes in EPC2‐ALICTRL and EPC2‐ALIΔSTAT3 cultures treated with or without IL‐13 (100
ng/mL) for 48 hours. C) EPC2‐ALICTRL and EPC2‐ALIΔSTAT3 cultures treated with vehicle (Veh) or IL‐13 (100
ng/mL) for 48 hours and stained for BrdU incorporation and DAPI (nuclei). D) Quantification of BrdU‐
positive cells in EPC2‐ALI cultures. Data are presented as mean ± SEM; n = 3 per treatment. **p < 0.01,
n.s. not significant. Magnification X300.

138
Figure 3‐6. IL‐13 induced STAT6‐dependent genes are involved in cytokine production but not IL‐13
induced cell proliferation

139

140

141
Figure 3‐6. IL‐13 induced STAT6‐dependent genes are involved in cytokine production but not IL‐13
induced cell proliferation. A) Western Blot analysis and B) RNA sequencing analysis of EPC2‐ALI cultures
transduced with empty control vector (EPC2‐ALICTRL) and vector with STAT6 shRNA (EPC2‐ALIΔSTAT6). C)
Gene ontology (GO) enrichment analysis of 166 genes that are IL‐13‐induced STAT6‐dependent
identified by RNA sequencing analysis. D) Heatmap depicting 27 IL‐13‐induced STAT6‐dependent,
cytokine production related genes and E) 5 representative inflammatory and cytokine‐related genes in
EPC2‐ALICTRL and EPC2‐ALIΔSTAT6 cultures treated with or without IL‐13 (100 ng/mL) for 48 hours. F) EPC2‐
ALICTRL and EPC2‐ALIΔSTAT6 cultures treated with vehicle (Veh) or IL‐13 (100 ng/mL) for 48 hours and
stained for BrdU incorporation and DAPI (nuclei). G) Quantification of BrdU‐positive cells in EPC2‐ALI
cultures. Data are presented as mean ± SEM; n = 3 per treatment. **p < 0.01. Magnification X300

142
Figure 3‐7. Proposed mechanism of IL‐13 driven STAT3 and STAT6 dependent transcriptome alteration
in esophageal epithelium

143
Figure 3‐7. Proposed mechanism of IL‐13 driven STAT3 and STAT6 dependent transcriptome alteration
in esophageal epithelium
IL‐13 signals through binding to IL4Rα/IL13Rα1 complex, which lead to the activation of Janus kinases.
Phosphorylation of JAKs lead to the phosphorylation of STAT3 and STAT6, which form homodimers,
translocated to the nuclear compartments, bind to protein‐specific DNA elements and activate
downstream gene transcription. Activation of STAT3 leads to alteration of genes related to proliferation
including WTN7A and IRS1, while STAT6 activation leads to dysregulation of genes regulating
inflammatory chemokines production.

144
4 Chapter IV: General Discussion and Summary
The aim of this dissertation was 1) to define the molecular mechanism of IL‐13‐induced epithelium
remodeling in esophageal epithelial cells; 2) to identify the underlying molecular processes that control
these cellular functions; 3) to determine the significance of these molecular processes in the histological
manifestations of EoE; and 3) to illustrate if specific targeting of these molecular pathways and functions
could serve as therapeutic target for EoE treatment. Herein, our studies demonstrated that:
1. A group of genes which are part of the transmembrane transporter function group protein
expression and function is dysregulated in EoE.
2. SLC9A3 (NHE3) is the most upregulated transmembrane transporter in esophageal biopsies from
EoE patients and is primarily expressed in the basal and suprabasal layer of esophageal
epithelium.
3. NHE3 expression level positively correlated with severity of EoE including esophageal eosinophil
numbers and histopathological features such as esophageal DIS.
4. In both primary cells derived from EoE patients and in vitro stratified squamous esophageal
epithelium model, EPC2‐ALI, IL‐13 stimulation induced an increase in NHE3 mRNA and protein
expression and function.
5. Increased expression and activity of NHE3 led to changes in intracellular pH and elevated acid‐
secretion capacity in esophageal epithelial cells.
6. IL‐13 induced DIS was abrogated by pharmacological inhibition of NHE3 function.
7. STAT binding motif is one of the most enriched TFBS within the dysregulated genes in the EoE
biopsies, and IL‐13 stimulated mature stratified squamous esophageal epithelium.
8. The STAT3 binding motif is the most enriched STAT TFBS in IL‐13‐induced upregulated genes in
the esophageal epithelium.

145
9. STAT3 plays an important role in IL‐13‐mediated dysregulation of esophageal barrier function
and esophageal epithelial proliferation.
10. IL‐13 induced STAT6 dependent genes contribute to cytokine and chemokine production by
esophageal epithelial cells.
The significances of these collective findings are further discussed below.
4.1 Alteration of transmembrane transporters expression in EoE
Performing gene ontology analysis on genes that were identified to be dysregulated in EoE patients, we
identified 5 individual GO clusters of genes that were functional related to transmembrane transporter
activities (Chapter 2). Active transmembrane transporter activities are commonly described in gastric
and intestinal epithelial cells, as they are critical for the physiological functions for the lower GI
tract383,384. However, the importance of transmembrane transporters in the esophagus is not fully
understood.
Unlike other segments of the GI tract, the esophagus is not actively involved in fluid absorption and
secretion, as the main function of the esophagus is to act as conduct for food to pass from the external
environment to the stomach385. The esophageal epithelium possesses defensive mechanisms including
luminal acid clearance that protects against toxic factors from causing esophageal tissue injury118.
Under physiological conditions, the esophageal epithelium of normal individuals is occasionally exposed
to acidic contents from the stomach especially following meals228,229. The luminal acid is neutralized by
HCO3‐ secretion or H+ uptake by esophageal submucosal glands and esophageal epithelial cells, which
protects against acid injury231,232. When the esophageal epithelium is exposed to prolonged episodes of
acid refluxate due to dysregulation of the lower esophageal sphincter (LES), the acid may exceed the
acid clearance capacity of esophagus leading to esophageal acid injury and development of esophageal
diseases including gastroesophageal reflux disease (GERD)386. In response to this acid overload, a group

146
of acid‐base transporters, including Na+/H+ exchanger isotype 1 (NHE1), Na+/HCO3‐ cotransporter (NBC)
and sodium‐dependent chloride‐bicarbonate exchanger (e.g. SLC4A8), are induced to maintain a neutral
pH in both intercellular spaces and cytosolic compartments227,237,268,387,388 (Fig. 4‐1).
Unlike GERD, an altered esophageal luminal pH is rarely observed in EoE patients389, as most EoE
patients have normal LES tone390. Also, EoE patients have much less acid reflux events compared to
GERD patients391. Somewhat paradoxically, our RNAseq analysis comparing EoE and NL transcriptome
identified that a large number of the transmembrane transporter genes that are dysregulated in EoE,
that are tightly related to acid‐base transport circuit. For example, the SLC4 family which consists of a
group of HCO3‐ transporters are involved in HCO3
‐ secretion to neutralize extracellular acid392.
Furthermore, SLC26A4 is anion transporter that is known to facilitate chloride and bicarbonate transport
and alter the acid‐base balance in kidney393,394. Given the lack of evidence to support altered esophageal
lumen acidity in EoE, we speculated that dysregulation of the acid‐base transporters is associated with
an esophageal epithelial response independent of luminal acidity.
Esophageal epithelial dilated intercellular spaces, basal zone hyperplasia, subepithelial fibrosis, and
angiogenesis, together with smooth muscle hypertrophy are some of the most representative
histopathological features related to tissue remodeling in EoE patients113,395. Previous studies suggest
that altered activities of ion transporters are tightly connected with tissue remodeling396. For example,
cytoplasmic Cl‐ concentration regulated by calcium‐activated chloride channel TMEM16A is required for
tissue architecture and junctional remodeling396, while alteration of sodium hydrogen exchanger
influences tissue proliferation and apoptosis397.
Previous study has reported that IL‐13 is able to induce EoE‐like transcriptome changes in primary
esophageal epithelial cells54, and we also identified a similar group of ion transporters that are
important for maintaining acid‐base homeostasis. Using this ex vivo model, we demonstrated that

147
intracellular pH is significantly increased in IL‐13‐treated primary esophageal cells derived from EoE
patients. The alteration of intracellular pH has been shown to initiate a variety of signaling pathways and
crucial for cell survival, function, and proliferation398. Since basal zone hyperplasia is an important
histopathological feature in EoE399, one speculation is that the altered ion transporter gene network is
related to the induction of intracellular pH change and increased esophageal epithelium proliferation .
Previous research suggested that elevated intracellular pH mediated by sodium‐proton exchanger
contributes to the initiation of DNA synthesis321, which is directly related to increased cell proliferation.
Furthermore, Na+/H+ exchanger and Na+/HCO3‐ exchanger have been shown to be important in affecting
alkalized pHi which is essential for cancer cell proliferation400. Alternatively, the alteration of acid‐base
regulating ion transporters could be a consequence of the increased proliferation of esophageal
epithelium. Cellular proliferation is energetically expensive, and in some fast proliferating cells,
anaerobic glycolytic metabolic pathways are utilized to maintain cellular proliferation which often leads
to the accumulation of lactate and H+ inside the cells401. While the accumulation of acid can cause
cellular apoptosis402,403, intracellular pH regulation is essential for continuous proliferation. As a result,
increased expression of proton pumps, HCO3‐ transporter family, Na+/H+ exchanger family and
monocarboxylate transporter (MCT) family are all observed in response to altered pH in cancer
cells404,405. Given our observations that most of these transporters are also altered in EoE transcriptome,
it is difficult to determine if these alterations are causative or consequential of basal zone hyperplasia.
To address this question, genetic overexpression or deletion of specific ion transporters and
examination of the cell proliferation rate could be examined. In addition, assessment of the cell cycle to
determine whether cells become trapped prior to proliferation or apoptosis could be performed.
Together, our findings suggested pHi mediated by these altered acid‐base transporters could play a role
in modulating esophageal epithelium remodeling in EoE.

148
Interestingly, within all the dysregulated transmembrane transporters in EoE patients, we identified
several genes in the SLC16 family that encodes proteins responsible for transporting monocarboxylic
acid. MCTs transport lactate and pyruvates across cellular membrane thus are important for energy
metabolism406. At steady state, they are highly expressed in the epithelial cells both in the small and
large intestine407, but not previously reported in the esophagus. Interestingly, SLC16A1 and SLC16A3 are
observed increased in patients with Barrett’s esophagus and esophageal adenocarcinoma (EAC) and are
thought to contribute to tumor metabolism408. Studies in other cancer cells demonstrated that the
suppression of SLC16A1 and SLC16A3 led to decreased cell proliferation due to the accumulation of
lactate inside cells which induces cell apoptosis409,410. Considering with some of EoE features especially
esophageal epithelial hyperplasia, we speculated that increased proliferation in esophageal epithelium
leads to elevated expression of these lactate transporters, which efflux lactate as a consequence of
glycolysis to maintain pHi and cellular proliferation411. However, future studies are still needed to
understand the contribution of MCTs in EoE pathogenesis.
Given the importance of pH in regulating cell physiology, one of the limitations of our research is we did
not measure the intercellular pH alteration in the esophageal epithelium in EoE. In GERD studies, the
diffusion of acid from the lumen to intercellular spaces is considered as one of the mechanisms of the
disruption of epithelial barrier and formation of dilated intercellular spaces412. Also, a previous study
indicated that increased paracellular permeability, leading to decreased pH promotes to increased tight
junction permeability413. Intraluminal impedance measurement in EoE patients showed a much lower
impedance compared to both NL and GERD patients, suggesting an increased permeability in the
esophageal epithlium412. We demonstrated that IL‐13 stimulation of esophageal epithelium resulted in
elevated intracellular pH and led to increased acid secretion. This supports the hypothesis that IL‐13
altered acid‐base transporters in esophagus could counteract the intracellular acid accumulation and
increased pHi, as a consequence led to extracellular pH changes. However, further studies are needed to

149
confirm the intercellular pH changes between esophageal epithelial cells before we could speculate the
contribution of altered pH in changing barrier permeability.
4.2 SLC9A3/NHE3 dysregulation in esophageal epithelium
Within all the dysregulated transmembrane transporters, we identified sodium hydrogen exchanger 3
(NHE3), encoded by SLC9A3 gene, as the most upregulated transporter in the esophageal biopsies
derived from EoE patients. NHE3 is widely studied in the intestinal epithelium and proximal renal tubule
due to its function in regulating ion homeostasis414. When coupled with Cl‐/HCO3‐ exchangers, NHE3 can
effectively regulate NaCl absorption which drives the water movement across the epithelium415.
However, NHE3 expression and function have never been established in esophageal epithelium. Our
study, for the first time, identified the expression pattern of NHE3 in the esophagus.
Using immunofluorescent staining, we identified that NHE3 is located primarily in the basal layer of
esophageal epithelium in normal individuals, however expression expanded to the suprabasal layers in
EoE patients. This expressional expansion of NHE3 is mirroring the thickened basal layer in esophageal
epithelium of EoE patients19. Also, we observed that the other histopathological change, dilated
intercellular spaces (DIS), is also primarily localized in the suprabasal layer of esophageal epithelium. In
light of these observations, we speculated that NHE3 is related to DIS formation and basal zone
hyperplasia in EoE.
Correlation analysis first supported that NHE3 expression positively correlated with the severity of DIS
spaces in EoE. To understand if elevated NHE3 expression directly contributes to the DIS formation,
primary esophageal epithelial cells derived from EoE patients and EPC2‐ALI were treated with IL‐13.
Surprisingly, we observed an increase of NHE3 expression in both models upon IL‐13 treatment.
Previous studies showed that NHE3 expression are usually altered by Th1 cytokines including interferon‐
gamma (IFN‐γ) and tumor necrosis factor‐alpha (TNF‐α)305. This new finding of the ability of IL‐13

150
inducing NHE3 expression might explain the differential expression pattern of NHE3 between ulcerative
colitis (UC) and Crohn’s disease (CD), two subtypes of inflammatory bowel diseases (IBD). Previous
studies have reported that NHE3 activity decreased in UC and CD. However, the NHE3 mRNA level was
only decreased in CD patients but not UC patients267,416,417. Interestingly, previous cytokine profiling
indicated that IL‐13 is only increased in biopsy samples from UC patients but not CD patients418,
potentially due to the Th2 predominance in the pathogenesis of UC419. In combination with our findings,
the elevated IL‐13 level, which counterbalances the IFN‐γ effect in decreasing NHE3 expression, might
explain the consistent NHE3 level in UC patients. Together, our observation showed an alternative
pathway for NHE3 induction, which might be important to understand NHE3‐related disordered
associated with Type‐2 inflammation.
As indicated in IBD patients, the alteration of NHE3 expression doesn’t seem necessarily correlate with
dysregulation of NHE3 activity267. The NHE3 function can be post‐translationally modified through
translocation between cytoplasmic compartments and plasma membrane as recycling endosome
compartment, thus regulating activity in the absence of protein or mRNA regulation420. NHE3 only
achieves its function of Na+ uptake and H+ secretion when binds to the plasma membrane. Previous
study showed that Ezrin, a cytoskeletal linker protein, is essential for NHE3 translocation and
activation421. Inhibition of Ezrin phosphorylation directly decreases NHE3 activity422. Also, NHE3 activity
could be directly regulated by direct kinase phosphorylation423. As a result, simple observation of
increased NHE3 expression could not conclude the functional involvement of NHE3 in EoE.
However, we also observed that NHE3 activity is increased upon IL‐13 treatment in esophageal epithelial
cells. As NHE3 is responsible for Na+ absorption, dysregulation of NHE3 activity led to the disruption of
Na+ homeostasis417,424. Previous studies examining ion transport of the esophagus have revealed that
Na+ transport accounts for the majority of potential differences in esophageal epithelium predominantly

151
through epithelial sodium channel (ENaC)425. Dysregulation of Na+ concentration leads to changes in
osmotic forces and altered fluid movement 426. Moreover, an increase of intracellular Na+ concentration,
which facilitates Cl‐ influx will cause increased water movement from outside of the cell, which lead to
fluid absorption 427. A consequence of fluid absorption and this hypertonicity causes increased cell
volume. Fluid movement and increased cell volume, possible together with the disruption of junctional
protein, will lead to the change of epithelium structure, for example, the formation of DIS. Currently, the
mechanism of DIS formation is unclear. The previous study exposing esophageal epithelium in
hypertonic NaCl solution on rabbit esophagus led to increased DIS area, suggesting that altered Na+
concentration in esophagus contributes to the DIS formation428,429. Aside from its role in regulating
water r movement, sodium concentration is also related to uptake of other ions and substance430,431.
Together, we speculated that increase NHE3 activity led to increased intracellular Na+ concentration,
which directly contributes to the increased presence of DIS in EoE patients. Indeed, we showed that IL‐
13 induction of DIS formation was NHE3‐dependent in EPC2‐ALI cells. To further validate this theory,
intracellular Na+ concentration should be measured in esophageal biopsies in NL and EoE patients. Also,
we showed that increased NHE3 activity is related to alteration of pH changes and acid‐secretion in
esophageal epithelium. In previous studies in GERD, esophageal acid perfusion is considered as one of
the drivers for DIS432. However, instead of being acidic, the pH in the esophageal lumen of EoE patients
tends to be slightly alkalined433. We speculated, together with increase NHE3 activity and its localization
in the basal and suprabasal layer of esophageal epithelium in EoE, consistent with the observation of
increased intracellular pH, there’s acidification in the intercellular spaces in the esophageal epithelium in
EoE. The decrease of intercellular pH can then contribute to the disruption of tight junction protein and
also initiate water movement caused by the change of osmotic gradient388. Together, the mechanism of
NHE3 in inducing DIS formation could be a combination of increased extracellular water accumulation
and acidification in intercellular spaces (Fig. 4‐3).

152
DIS is observed in the esophageal epithelium in both pediatric and adult EoE patients292, is associated
intraepithelial antigen exposure434. Successful treatment of EoE using corticosteroids showed a
reduction of DIS292, indicating DIS as a therapeutic marker. Our study showed that pharmacological
inhibition of NHE3 protected esophageal epithelium from IL‐13 induced DIS, suggesting NHE3 could
serve as a therapeutic target in EoE.
Basal cell hyperplasia was observed in EoE patients along the esophagus, characterized by more than
25% thickness of epithelial compared to NL19,435. Previous studies employing murine model of EoE
revealed that IL‐13 induces esophageal epithelium hyperplasia206,207. We showed that inhibition of NHE3
activity prevents the IL‐13 induced proliferation in EPC2‐ALI. We speculated that IL‐13‐induced increased
NHE3 activity could either act as a protective mechanism to neutralize proliferation generated
intracellular acid, or an initiator to generate an alkalinized intracellular environment to promote
proliferation. Previous studies on esophageal NHE1 suggest that NHE1 can contribute to the
hyperproliferation of esophageal tissue in both Barrett’s disorders and esophageal adenocarcinoma
through the regulation of intracellular pH239,436. Also, intracellular pH is essential for cell proliferation
and apoptosis437,438. As NHE3 can regulate intracellular pH, and we did show an elevated intracellular pH
in IL‐13 treated esophageal epithelial cells with overexpressed NHE3, one hypothesis could be NHE3 is
required for IL‐13 mediated proliferation in esophageal epithelium. Alternatively, the increased
expression of NHE3 could be merely a consequence of increased proliferation. Fast proliferating cells
like cancer cells have a preference towards lactic acid‐generating energy consuming pathways401. The
conversion of lactic acid will lead to accumulation of proton inside cells, which decreased the glycolytic
rate439 and induce cell apoptosis403. As a result, proton regulators that exporting intracellular H+ to
prevent intracellular acidosis play a protective role in cells, and inhibition of these proton regulators
could prevent increased cell proliferation440. Together, we conclude that IL‐13 upregulation of NHE3 is
part of the cellular proliferative response, which is related to esophageal epithelium hyperplasia.
153
However, further investigations are needed to elucidate whether this observation is causative or
consequential of increased proliferation rate.
Interestingly, previous works indicated that NHE3‐deficient mice showed alteration of inflammatory‐
related pathways. Increased IFN‐γ was observed in small intestine441, while elevated expression of TNF‐
alpha and IL‐18 were shown in distal colon442. Also, inflammatory cells including NK cells and CD8+ T cells
were elevated in NHE3KO mice443. It is still unclear how did the alteration of NHE3 expression contribute
to changes of the inflammatory response. Previous study suggested that disruption of barrier integrity
could result in the onset of inflammatory in gut444. It is possible that NHE3 alteration led to barrier
disruption, which causes inflammatory responses. However, it would be still interesting to see if the
increase of NHE3 would also cause any inflammatory changes and if it would have related to EoE
pathogenesis.
4.3 STAT involvement in EoE transcriptome
Several cytokines have been shown to be involved in EoE pathogenesis, as increased level of cytokines
including IL‐5, IL‐13, IL‐33, TNF‐α, IFN‐γ, and TSLP were observed in EoE patients48,332,445. After binding to
their receptors on effector cells, these cytokines contribute to the progression of EoE through
influencing downstream gene transcription including CCL26, CAPN14 and SLC9A3 (Chapter 2), which
contribute to different aspects of EoE pathophysiology28,209. However, the molecular pathways involved
in the regulation of the proinflammatory cytokines signaling remains unclear.
Janus kinase (JAK)‐ signal transducer and activator of transcription (STAT) pathway is a well‐
characterized pathway that plays a crucial role in a wide range of cytokines signaling, especially in
interferons and interleukins446. After phosphorylated by JAKs, STAT monomers dimerize, translocate to
nucleus and bind to conserved binding motif to activate gene transcriptions447. EoE related cytokines,

154
especially IL‐5, IL‐13 and IFN‐γ, all signaling through JAK/STAT pathway. (Fig. 4‐2) As a result, we were
interested in the contribution of JAK/STAT pathway to the dysregulation of in EoE pathogenesis.
Since conserved sequences of STAT binding motifs has been identified448, we employed transcription
factor binding site analysis among the dysregulated genes in EoE patients. Similar to what we expected,
we identified STAT binding motif as one of the most significantly enriched binding motifs (Chapter 3).
STAT pathways are involved in multiple inflammatory responses, contributing to immune cell
proliferation and differentiation, also related to the development of autoimmune and allergic
disorders449. Mice models and cell lines with genetic modification on STAT expression suggest that
alteration of STAT proteins leads to dysregulated cytokine functions and immune responses. For
example, STAT1KO mice showed severe bacterial infection in multiple organs while WT mice remain
healthy450. On the other hand, constitutively active STAT6 promoted T cell hyperproliferation451. With
the increased enrichment of STAT regulating genes in EoE patients, we speculated an increased
expression of STAT at least in mRNA level.
Further examination of RNAseq data supported our hypothesis, that increased level of STAT1 STAT3 and
STAT6 were observed in EoE patients compared to NL. Interestingly, all these three STAT proteins have
previously been showed to relate to allergic disorders452‐454. STAT1KO mice showed decreased nasal
eosinophilia compared to WT mice when sensitized with aeroallergen, and they were protected against
experimental induction of allergic rhinitis452. Also, both STAT3KO and STAT6KO mice showed decreased
airway eosinophilia and suppressed Th2 responses compared to WT mice upon antigen challenges453,455.
As IL‐13 has been previously identified as one the major driver for EoE phenotypes and transcriptome
changes54, we’re more interested in the contribution of STAT3 and STAT6 in EoE pathogenesis due to
their involvement in IL‐13 signaling pathways185,456. However, since IFN‐γ is also elevated in EoE332,
future studies on IFN/STAT1 pathway should be conducted to understand the etiology of EoE.

155
Aside from STAT proteins, the binding motifs of other transcription factors are found significantly
enriched in our analysis in dysregulated genes in EoE patients. Some of these transcription factors were
previously characterized and closely related to Th2 allergic disorders. For example, NF‐κB binding motif
is the second most significantly enriched TFBS, and its activation has been widely established in various
inflammatory disorders457. A recent study showed that the deletion of NF‐κB ‐inducing kinase (NIK), an
essential molecular for the non‐canonical NF‐κB pathway, drives spontaneous EoE in the experimental
murine model, suggesting an important role of NF‐κB in the pathogenesis of EoE108. Interestingly, NF‐κB
has previously shown to coordinate with STAT proteins to regulate cancer immunology458. In this sense,
aside from STAT proteins, it would be beneficial to explore the molecular mechanism of other enriched
transcription factors we observed in the pathogenesis of EoE.
4.4 STAT3 regulates tissue remodeling in esophageal epithelium
To better understand how STAT proteins regulated EoE‐related gene dysfunction and histopathological
changes, we employed IL‐13 induced EPC2‐ALI model, which is previously established to mimic EoE
dysregulation in transcriptome level. By applying TFBS analysis of genes that are transcriptionally active
or altered by IL‐13, we identified STAT as an important regulator in IL‐13‐induced genes. Previous GO
analysis identified these genes were important for epithelium development and inflammatory responses
(Chapter 2). As a result, we speculated that STAT signaling pathways are involved in these processes.
Closer examination of IL‐13 regulated subsets of genes, we identified the STAT3 binding site as the most
enriched TFBS in IL‐13 induced upregulated genes. Studies using tissue‐specific STAT3 knockout mice
suggested that STAT3 is important in mediating various biological process including cell survival,
apoptosis, and motility459. Specifically, previous studies indicated that STAT3 is involved in various
allergic pathways. For example, patients with the autosomal‐dominant hyper‐IgE syndrome (AD‐HIES)
with the dominant negative STAT3 mutation have a significant lower rate of food allergies and

156
anaphylaxis371,372. This is consistent with the essential role of STAT3 in mediating mast cell
degranulation460,461. STAT3 has also been shown to activate Th2 cell development and is required for Th2
cytokines expression462. Thus mice with STAT3 deficiency in T cells fail to develop allergic inflammation
in OVA‐induced mice model462. Moreover, Conditional knockout of STAT3 in mice airway epithelium led
to decrease of house dust mite‐induced airway eosinophilia, suggesting the role of STAT3 in mediating
eosinophils recruitment453. However, the role of STAT3 has never been identified in EoE. Comparing the
transcriptome differences between STAT3 knockdown and non‐transduced EPC2‐ALI cultures, we
identified a group of genes that are functionally related to the epidermis and skin development being
STAT3‐dependent. Previous studies have revealed that activation of STAT3 in endothelial cells leads to
downregulation of tight junction proteins such as zonulin‐1 (ZO‐1) and occludin together with elevated
paracellular leakage341. Also, STAT3 mediates epidermal growth factor (EGF)‐induced downregulation of
claudin‐2 and claudin‐4, which emphasized the importance of STAT3 in modulating junctional
proteins463.
One of the clinical features of EoE is the impaired barrier function of esophageal epithelium indicated by
decreased impedance412. Earlier studies have established the role of IL‐13 in decreasing epithelium
barrier functions through regulating junctional proteins like DSG‐1 and FLG133,464. The DSG‐1 expression
is previously established regulated in a STAT6‐dependent manner465, while FLG could be induced by IL‐
33 in a STAT3‐dependent manner359. As a result, we speculated that STAT3 might influence esophageal
barrier function by affecting filaggrin expression. Consistent with our hypothesis, the FLG expression is
increased upon STAT3 knocking down. In addition, STAT3KD EPC2‐ALI cultures also showed higher trans‐
epithelial electrical resistance compared to WT group. Overall, we established that STAT3 inhibition
could increase filaggrin expression contribute to epithelial barrier integrity. However, given our study is
limited due to the presence of residual STAT3 caused by the incomplete knockdown, we could not
conclude the necessity of STAT3 in epithelial function. Also, STAT3 must alter the epithelial resistance by

157
changing proteins other than filaggrin. Thus future studies should check on other STAT3‐dependent
junctional proteins.
In addition, by examine IL‐13 induced STAT3‐dependent genes in EPC2‐ALI model, we speculated that
STAT3 might contribute to IL‐13‐mediated basal cell proliferation in esophageal epithelium. A previous
study in limbal epithelial cells indicated that STAT3 is crucial for keratinocyte proliferation466. Studies on
human and mouse epithelial cells further supported the role of IL‐13 in epithelial differentiation and
proliferation342,467. In EPC2‐ALI, we showed that IL‐13/STAT3 pathway regulates oncogenes like IRS1 and
WNT7A, which are widely known to promote DNA replication and cell proliferation368,369. Our results in
IL‐13 treated STAT3KD EPC2‐ALI models further supported the role of STAT3 in regulating cell
proliferation. We showed that deletion of STAT3 in EPC2‐ALI prevented IL‐13‐induced proliferation,
suggesting a potential role of STAT3 in basal cell hyperplasia in EoE.
Furthermore, a recent investigation identified the presence epithelial‐mesenchymal transition (EMT) of
in pediatric EoE patients114, and they also suggested the contribution of EMT to tissue remodeling in
EoE. Further work indicated the development of EMT in EoE is mediated by the CXCR4/SDF‐1 axis in
experimental murine model468. Previous studies have demonstrated the role of STAT3 in promoting EMT
in different cancer cells469. Interestingly, the CXCR4/SDF‐1 pathway is tightly related to STAT3
activation470‐472. We speculated that IL‐13 induced STAT3 is contributing to EMT in EoE. However, future
experiments and analysis are required to prove this hypothesis.
4.5 STAT6 regulates cytokine production in esophageal epithelium
JAK/STAT6 pathway has long been characterized as the canonical IL‐13 signaling pathway176. Studies
showed that knocking down STAT6 resulted in significant impairment of IL‐13 effect on cells including
macrophage182 and epithelial cells473. Previous animal studies showed the alteration of inflammatory
responses in mice with STAT6 deficiency. OVA‐induced airway eosinophilia was abrogated in STAT6 KO

158
mice, together with decreased peri‐bronchial inflammation379‐381. In addition, STAT6 is also essential in
Th2 cell differentiation474. Deficiency of STAT6 that fails to induce Th2 cell differentiation led to the
development of severe experimental autoimmune encephalomyelitis (EAE) in mice475. Together, these
suggested a critical role of STAT6 in modulating inflammatory responses. In both EoE patients and IL‐13
induced EPC2‐ALI, we observed increased expression of STAT6 (Chapter 3). We speculated that this
increase of STAT6 contributes to changes in inflammatory genes.
Previous studies have suggested that esophageal epithelium secretion of CCL26, a chemokine induced
by IL‐13 that is important for eosinophil activation and recruitment in EoE28, is dependent on STAT6476.
By analyzing IL‐13‐induced STAT6‐dependent genes in EPC2‐ALI, we showed that, in the esophageal
epithelium, STAT6 is regulating CCL26 expression, as well as genes including POSTN and TNFAIP6 that
contribute to the regulation of cytokine production. Mice experiment transferring STAT6+/+ antigen‐
specific Th2 cells to STAT6‐/‐ mice failed to develop experimental allergic asthma, suggesting the
importance of STAT6 in inducing inflammatory responses in resident cells382. Consistent with it, we also
showed that the impairment of STAT6 leads to decreased expression of several IL‐13‐induced cytokine
and chemokine in esophageal epithelium.
Moreover, previous works demonstrated the primary effector cells of STAT6 functions on inflammatory
responses are hematopoietic cells such as B cell, Th2 cells, and mast cells477. Limited by our current
model, we’re not able to fully demonstrate the importance of IL‐13/STAT6 pathway in inflammatory
responses in EoE. Future works are required in a model containing hematopoietic cells to prove our
hypothesis.
4.6 Summary
In this dissertation, we identified the importance of both transmembrane transporter SLC9A3 and
transcription factor STAT3 in the pathogenesis of EoE. Comprehensive analysis of SLC9A3 in three

159
different models relevant to EoE suggests that increased SLC9A3 expression and activity induced by IL‐
13 is important for the formation of dilated intercellular spaces in EoE patients. While the SLC9A3
expression in the esophageal epithelium is dependent on STAT6, IL‐13 induced STAT3 activation is also
important for tissue remodeling in EoE, as STAT3 deletion esophageal epithelium showed increased
barrier function and is protected against IL‐13 induced esophageal hyperplasia. Together, the studies in
this dissertation provide rationales to targeting SLC9A3 and IL‐13/STAT3 pathways for the treatment of
EoE, especially in the effort to address esophageal epithelium remodeling.

160
4.7 Figures
Figure 4‐1. Acid protection mechanism in esophagus

161
Figure 4‐1. Acid protection mechanism in esophagus.
In esophageal epithelium, when exposed to excessive acidic contents, ion transporters related to H+ and
HCO3‐ transportation are activated. Some of the major transporters are Na+/H+ exchangers, Na+/HCO3‐
cotransporters, Cl‐/ HCO3‐ exchangers and sodium‐dependent chloride‐bicarbonate exchangers.

162
Figure 4‐2. JAK/STAT signaling pathway

163
Figure 4‐2. JAK/STAT signaling pathway.
After binding to their receptors on the transmembrane domain, cytokines such as IL‐13, IL‐5, and IFN‐γ
led to the phosphorylation of Janus kinases (JAKs). Phosphorylated JAKs then phosphorylate STAT
proteins, which then dimerized and translocated to the promoter area of their downstream genes. The
binding of STAT dimers will then activate or suppress gene transcription.

164
Figure 4‐3. Proposed Mechanism of IL‐13 induced NHE3‐dependent DIS formation in EoE

165
Figure 4‐3. Proposed Mechanism of IL‐13 induced NHE3‐dependent DIS formation in EoE
(Left) In normal stratified squamous epithelium cells, transmembrane transporters are not dysregulated
intracellular pH remains normal. (Right) Elevated IL‐13 secretion in EoE patients drives increased NHE3
transcription. This increased expression and activity of NHE3 on the plasma membrane, together with
other acid‐base regulating transporters, contribute to the altered concentration of H+ and Cl‐ both
intracellularly and intercellularly, which led to the changed equilibrium of osmotic balance. Alteration in
osmotic force drove water influx into intercellular spaces and formed DIS in the esophageal epithelium
in EoE.

166
5 References
1. Dellon ES, Hirano I. Epidemiology and Natural History of Eosinophilic Esophagitis. Gastroenterology. 2018;154(2):319‐332 e313.
2. Bystrom J, O'Shea NR. Eosinophilic oesophagitis: clinical presentation and pathogenesis. Postgrad Med J. 2014;90(1063):282‐289.
3. Jensen ET, Kappelman MD, Martin CF, Dellon ES. Health‐care utilization, costs, and the burden of disease related to eosinophilic esophagitis in the United States. Am J Gastroenterol. 2015;110(5):626‐632.
4. Philpott H, Kweh B, Thien F. Eosinophilic esophagitis: current understanding and evolving concepts. Asia Pac Allergy. 2017;7(1):3‐9.
5. Plaza‐Martin AM, Jimenez‐Feijoo R, Andaluz C, et al. Polysensitization to aeroallergens and food in eosinophilic esophagitis in a pediatric population. Allergol Immunopathol (Madr). 2007;35(1):35‐37.
6. Olson AA, Evans MD, Johansson MW, et al. Role of food and aeroallergen sensitization in eosinophilic esophagitis in adults. Ann Allergy Asthma Immunol. 2016;117(4):387‐393 e382.
7. Orenstein SR, Shalaby TM, Di Lorenzo C, et al. The spectrum of pediatric eosinophilic esophagitis beyond infancy: a clinical series of 30 children. Am J Gastroenterol. 2000;95(6):1422‐1430.
8. Warners MJ, Terreehorst I, van den Wijngaard RM, et al. Abnormal Responses to Local Esophageal Food Allergen Injections in Adult Patients With Eosinophilic Esophagitis. Gastroenterology. 2018;154(1):57‐60 e52.
9. Reed CC, Fan C, Koutlas NT, Shaheen NJ, Dellon ES. Food elimination diets are effective for long‐term treatment of adults with eosinophilic oesophagitis. Aliment Pharmacol Ther. 2017;46(9):836‐844.
10. Spergel JM, Beausoleil JL, Mascarenhas M, Liacouras CA. The use of skin prick tests and patch tests to identify causative foods in eosinophilic esophagitis. J Allergy Clin Immunol. 2002;109(2):363‐368.
11. Liacouras CA, Spergel JM, Ruchelli E, et al. Eosinophilic esophagitis: a 10‐year experience in 381 children. Clin Gastroenterol Hepatol. 2005;3(12):1198‐1206.
12. Kagalwalla AF, Sentongo TA, Ritz S, et al. Effect of six‐food elimination diet on clinical and histologic outcomes in eosinophilic esophagitis. Clin Gastroenterol Hepatol. 2006;4(9):1097‐1102.
13. Gonsalves N, Yang GY, Doerfler B, Ritz S, Ditto AM, Hirano I. Elimination diet effectively treats eosinophilic esophagitis in adults; food reintroduction identifies causative factors. Gastroenterology. 2012;142(7):1451‐1459 e1451; quiz e1414‐1455.
14. Simon D, Marti H, Heer P, Simon HU, Braathen LR, Straumann A. Eosinophilic esophagitis is frequently associated with IgE‐mediated allergic airway diseases. J Allergy Clin Immunol. 2005;115(5):1090‐1092.
15. Fogg MI, Ruchelli E, Spergel JM. Pollen and eosinophilic esophagitis. J Allergy Clin Immunol. 2003;112(4):796‐797.
16. Wolf WA, Jerath MR, Dellon ES. De‐novo onset of eosinophilic esophagitis after large volume allergen exposures. J Gastrointestin Liver Dis. 2013;22(2):205‐208.
17. Mishra A, Hogan SP, Brandt EB, Rothenberg ME. An etiological role for aeroallergens and eosinophils in experimental esophagitis. J Clin Invest. 2001;107(1):83‐90.

167
18. Akei HS, Mishra A, Blanchard C, Rothenberg ME. Epicutaneous antigen exposure primes for experimental eosinophilic esophagitis in mice. Gastroenterology. 2005;129(3):985‐994.
19. Collins MH. Histopathology of eosinophilic esophagitis. Dig Dis. 2014;32(1‐2):68‐73. 20. Spergel JM, Book WM, Mays E, et al. Variation in prevalence, diagnostic criteria, and initial
management options for eosinophilic gastrointestinal diseases in the United States. J Pediatr Gastroenterol Nutr. 2011;52(3):300‐306.
21. Franciosi JP, Tam V, Liacouras CA, Spergel JM. A case‐control study of sociodemographic and geographic characteristics of 335 children with eosinophilic esophagitis. Clin Gastroenterol Hepatol. 2009;7(4):415‐419.
22. Spergel JM, Brown‐Whitehorn TF, Beausoleil JL, et al. 14 years of eosinophilic esophagitis: clinical features and prognosis. J Pediatr Gastroenterol Nutr. 2009;48(1):30‐36.
23. Straumann A, Blanchard C, Radonjic‐Hoesli S, et al. A new eosinophilic esophagitis (EoE)‐like disease without tissue eosinophilia found in EoE families. Allergy. 2016;71(6):889‐900.
24. Alexander ES, Martin LJ, Collins MH, et al. Twin and family studies reveal strong environmental and weaker genetic cues explaining heritability of eosinophilic esophagitis. J Allergy Clin Immunol. 2014;134(5):1084‐1092 e1081.
25. Sleiman PM, Wang ML, Cianferoni A, et al. GWAS identifies four novel eosinophilic esophagitis loci. Nat Commun. 2014;5:5593.
26. Rothenberg ME, Spergel JM, Sherrill JD, et al. Common variants at 5q22 associate with pediatric eosinophilic esophagitis. Nat Genet. 2010;42(4):289‐291.
27. Sherrill JD, Gao PS, Stucke EM, et al. Variants of thymic stromal lymphopoietin and its receptor associate with eosinophilic esophagitis. J Allergy Clin Immunol. 2010;126(1):160‐165 e163.
28. Blanchard C, Wang N, Stringer KF, et al. Eotaxin‐3 and a uniquely conserved gene‐expression profile in eosinophilic esophagitis. J Clin Invest. 2006;116(2):536‐547.
29. Aceves SS, Newbury RO, Chen D, et al. Resolution of remodeling in eosinophilic esophagitis correlates with epithelial response to topical corticosteroids. Allergy. 2010;65(1):109‐116.
30. Blanchard C, Stucke EM, Burwinkel K, et al. Coordinate interaction between IL‐13 and epithelial differentiation cluster genes in eosinophilic esophagitis. Journal of immunology (Baltimore, Md : 1950). 2010;184(7):4033‐4041.
31. Kottyan LC, Davis BP, Sherrill JD, et al. Genome‐wide association analysis of eosinophilic esophagitis provides insight into the tissue specificity of this allergic disease. Nat Genet. 2014;46(8):895‐900.
32. Namjou B, Marsolo K, Caroll RJ, et al. Phenome‐wide association study (PheWAS) in EMR‐linked pediatric cohorts, genetically links PLCL1 to speech language development and IL5‐IL13 to Eosinophilic Esophagitis. Front Genet. 2014;5:401.
33. Hill DA, Spergel JM. The Immunologic Mechanisms of Eosinophilic Esophagitis. Curr Allergy Asthma Rep. 2016;16(2):9.
34. Dellon ES, Gonsalves N, Hirano I, et al. ACG clinical guideline: Evidenced based approach to the diagnosis and management of esophageal eosinophilia and eosinophilic esophagitis (EoE). Am J Gastroenterol. 2013;108(5):679‐692; quiz 693.
35. Simon D, Cianferoni A, Spergel JM, et al. Eosinophilic esophagitis is characterized by a non‐IgE‐mediated food hypersensitivity. Allergy. 2016;71(5):611‐620.
36. Mishra A, Schlotman J, Wang M, Rothenberg ME. Critical role for adaptive T cell immunity in experimental eosinophilic esophagitis in mice. J Leukoc Biol. 2007;81(4):916‐924.
37. Noti M, Wojno ED, Kim BS, et al. Thymic stromal lymphopoietin‐elicited basophil responses promote eosinophilic esophagitis. Nat Med. 2013;19(8):1005‐1013.
38. Clayton F, Fang JC, Gleich GJ, et al. Eosinophilic esophagitis in adults is associated with IgG4 and not mediated by IgE. Gastroenterology. 2014;147(3):602‐609.

168
39. Mohammad N, Avinashi V, Chan E, Vallance BA, Portales‐Casamar E, Bush JW. Pediatric Eosinophilic Esophagitis Is Associated With Increased Lamina Propria Immunoglobulin G4‐Positive Plasma Cells. J Pediatr Gastroenterol Nutr. 2018.
40. Wright BL, Kulis M, Guo R, et al. Food‐specific IgG4 is associated with eosinophilic esophagitis. J Allergy Clin Immunol. 2016;138(4):1190‐1192 e1193.
41. Hogan SP, Rothenberg ME. Eosinophil Function in Eosinophil‐associated Gastrointestinal Disorders. Curr Allergy Asthma Rep. 2006;6(1):65‐71.
42. Saffari H, Hoffman LH, Peterson KA, et al. Electron microscopy elucidates eosinophil degranulation patterns in patients with eosinophilic esophagitis. J Allergy Clin Immunol. 2014;133(6):1728‐1734 e1721.
43. Abonia JP, Rothenberg ME. Eosinophilic esophagitis: rapidly advancing insights. Annu Rev Med. 2012;63:421‐434.
44. Kephart GM, Alexander JA, Arora AS, et al. Marked deposition of eosinophil‐derived neurotoxin in adult patients with eosinophilic esophagitis. Am J Gastroenterol. 2010;105(2):298‐307.
45. Yang D, Chen Q, Rosenberg HF, et al. Human ribonuclease A superfamily members, eosinophil‐derived neurotoxin and pancreatic ribonuclease, induce dendritic cell maturation and activation. J Immunol. 2004;173(10):6134‐6142.
46. Wen T, Rothenberg ME. The Regulatory Function of Eosinophils. Microbiol Spectr. 2016;4(5). 47. Le‐Carlson M, Seki S, Abarbanel D, Quiros A, Cox K, Nadeau KC. Markers of antigen presentation
and activation on eosinophils and T cells in the esophageal tissue of patients with eosinophilic esophagitis. J Pediatr Gastroenterol Nutr. 2013;56(3):257‐262.
48. Straumann A, Bauer M, Fischer B, Blaser K, Simon HU. Idiopathic eosinophilic esophagitis is associated with a T(H)2‐type allergic inflammatory response. J Allergy Clin Immunol. 2001;108(6):954‐961.
49. Cianferoni A, Ruffner MA, Guzek R, et al. Elevated expression of activated TH2 cells and milk‐specific TH2 cells in milk‐induced eosinophilic esophagitis. Ann Allergy Asthma Immunol. 2018;120(2):177‐183 e172.
50. Bullock JZ, Villanueva JM, Blanchard C, et al. Interplay of adaptive th2 immunity with eotaxin‐3/c‐C chemokine receptor 3 in eosinophilic esophagitis. J Pediatr Gastroenterol Nutr. 2007;45(1):22‐31.
51. Blanchard C, Stucke EM, Rodriguez‐Jimenez B, et al. A striking local esophageal cytokine expression profile in eosinophilic esophagitis. The Journal of allergy and clinical immunology. 2011;127(1):208‐217, 217 e201‐207.
52. Takatsu K, Nakajima H. IL‐5 and eosinophilia. Curr Opin Immunol. 2008;20(3):288‐294. 53. Mishra A, Hogan SP, Brandt EB, Rothenberg ME. IL‐5 promotes eosinophil trafficking to the
esophagus. J Immunol. 2002;168(5):2464‐2469. 54. Blanchard C, Mingler MK, Vicario M, et al. IL‐13 involvement in eosinophilic esophagitis:
transcriptome analysis and reversibility with glucocorticoids. The Journal of allergy and clinical immunology. 2007;120(6):1292‐1300.
55. Taams LS, Palmer DB, Akbar AN, Robinson DS, Brown Z, Hawrylowicz CM. Regulatory T cells in human disease and their potential for therapeutic manipulation. Immunology. 2006;118(1):1‐9.
56. Hawrylowicz CM. Regulatory T cells and IL‐10 in allergic inflammation. J Exp Med. 2005;202(11):1459‐1463.
57. Stuck MC, Straumann A, Simon HU. Relative lack of T regulatory cells in adult eosinophilic esophagitis ‐ no normalization after corticosteroid therapy. Allergy. 2011;66(5):705‐707.
58. Zhu X, Wang M, Crump CH, Mishra A. An imbalance of esophageal effector and regulatory T cell subsets in experimental eosinophilic esophagitis in mice. Am J Physiol Gastrointest Liver Physiol. 2009;297(3):G550‐558.

169
59. Fuentebella J, Patel A, Nguyen T, et al. Increased number of regulatory T cells in children with eosinophilic esophagitis. J Pediatr Gastroenterol Nutr. 2010;51(3):283‐289.
60. Tantibhaedhyangkul U, Tatevian N, Gilger MA, Major AM, Davis CM. Increased esophageal regulatory T cells and eosinophil characteristics in children with eosinophilic esophagitis and gastroesophageal reflux disease. Ann Clin Lab Sci. 2009;39(2):99‐107.
61. Ling EM, Smith T, Nguyen XD, et al. Relation of CD4+CD25+ regulatory T‐cell suppression of allergen‐driven T‐cell activation to atopic status and expression of allergic disease. Lancet. 2004;363(9409):608‐615.
62. Ito Y, Satoh T, Takayama K, Miyagishi C, Walls AF, Yokozeki H. Basophil recruitment and activation in inflammatory skin diseases. Allergy. 2011;66(8):1107‐1113.
63. Siracusa MC, Kim BS, Spergel JM, Artis D. Basophils and allergic inflammation. J Allergy Clin Immunol. 2013;132(4):789‐801; quiz 788.
64. Macfarlane AJ, Kon OM, Smith SJ, et al. Basophils, eosinophils, and mast cells in atopic and nonatopic asthma and in late‐phase allergic reactions in the lung and skin. J Allergy Clin Immunol. 2000;105(1 Pt 1):99‐107.
65. Iwakura N, Fujiwara Y, Tanaka F, et al. Basophil infiltration in eosinophilic oesophagitis and proton pump inhibitor‐responsive oesophageal eosinophilia. Aliment Pharmacol Ther. 2015;41(8):776‐784.
66. Obata K, Mukai K, Tsujimura Y, et al. Basophils are essential initiators of a novel type of chronic allergic inflammation. Blood. 2007;110(3):913‐920.
67. Venturelli N, Lexmond WS, Ohsaki A, et al. Allergic skin sensitization promotes eosinophilic esophagitis through the IL‐33‐basophil axis in mice. J Allergy Clin Immunol. 2016;138(5):1367‐1380 e1365.
68. Perrigoue JG, Saenz SA, Siracusa MC, et al. MHC class II‐dependent basophil‐CD4+ T cell interactions promote T(H)2 cytokine‐dependent immunity. Nat Immunol. 2009;10(7):697‐705.
69. Abonia JP, Blanchard C, Butz BB, et al. Involvement of mast cells in eosinophilic esophagitis. J Allergy Clin Immunol. 2010;126(1):140‐149.
70. Lomazi EA, Brandalise NA, Servidoni M, Cardoso SR, Meirelles LR. Mast Cells Distinguish Eosinophilic Esophagitis in Pediatric Patients. Arq Gastroenterol. 2017;54(3):192‐196.
71. Niranjan R, Mavi P, Rayapudi M, Dynda S, Mishra A. Pathogenic role of mast cells in experimental eosinophilic esophagitis. Am J Physiol Gastrointest Liver Physiol. 2013;304(12):G1087‐1094.
72. Arias A, Lucendo AJ, Martinez‐Fernandez P, et al. Dietary treatment modulates mast cell phenotype, density, and activity in adult eosinophilic oesophagitis. Clin Exp Allergy. 2016;46(1):78‐91.
73. Toru H, Pawankar R, Ra C, Yata J, Nakahata T. Human mast cells produce IL‐13 by high‐affinity IgE receptor cross‐linking: enhanced IL‐13 production by IL‐4‐primed human mast cells. J Allergy Clin Immunol. 1998;102(3):491‐502.
74. Elishmereni M, Bachelet I, Nissim Ben‐Efraim AH, Mankuta D, Levi‐Schaffer F. Interacting mast cells and eosinophils acquire an enhanced activation state in vitro. Allergy. 2013;68(2):171‐179.
75. Galdiero MR, Varricchi G, Seaf M, Marone G, Levi‐Schaffer F, Marone G. Bidirectional Mast Cell‐Eosinophil Interactions in Inflammatory Disorders and Cancer. Front Med (Lausanne). 2017;4:103.
76. Aceves SS, Chen D, Newbury RO, Dohil R, Bastian JF, Broide DH. Mast cells infiltrate the esophageal smooth muscle in patients with eosinophilic esophagitis, express TGF‐beta1, and increase esophageal smooth muscle contraction. J Allergy Clin Immunol. 2010;126(6):1198‐1204 e1194.

170
77. Doherty TA, Baum R, Newbury RO, et al. Group 2 innate lymphocytes (ILC2) are enriched in active eosinophilic esophagitis. J Allergy Clin Immunol. 2015;136(3):792‐794 e793.
78. Doherty TA, Broide DH. Group 2 innate lymphoid cells: new players in human allergic diseases. J Investig Allergol Clin Immunol. 2015;25(1):1‐11; quiz 12p following 11.
79. Doherty TA. At the bench: understanding group 2 innate lymphoid cells in disease. J Leukoc Biol. 2015;97(3):455‐467.
80. Christianson CA, Goplen NP, Zafar I, et al. Persistence of asthma requires multiple feedback circuits involving type 2 innate lymphoid cells and IL‐33. J Allergy Clin Immunol. 2015;136(1):59‐68 e14.
81. Morita H, Moro K, Koyasu S. Innate lymphoid cells in allergic and nonallergic inflammation. J Allergy Clin Immunol. 2016;138(5):1253‐1264.
82. Geremia A, Arancibia‐Carcamo CV. Innate Lymphoid Cells in Intestinal Inflammation. Front Immunol. 2017;8:1296.
83. Jyonouchi S, Smith CL, Saretta F, et al. Invariant natural killer T cells in children with eosinophilic esophagitis. Clin Exp Allergy. 2014;44(1):58‐68.
84. Alam R, Stafford S, Forsythe P, et al. RANTES is a chemotactic and activating factor for human eosinophils. J Immunol. 1993;150(8 Pt 1):3442‐3448.
85. Emad A, Emad Y. Relationship between eosinophilia and levels of chemokines (CCL5 and CCL11) and IL‐5 in bronchoalveolar lavage fluid of patients with mustard gas‐induced pulmonary fibrosis. J Clin Immunol. 2007;27(6):605‐612.
86. Lexmond WS, Neves JF, Nurko S, et al. Involvement of the iNKT cell pathway is associated with early‐onset eosinophilic esophagitis and response to allergen avoidance therapy. Am J Gastroenterol. 2014;109(5):646‐657.
87. Rajavelu P, Rayapudi M, Moffitt M, Mishra A, Mishra A. Significance of para‐esophageal lymph nodes in food or aeroallergen‐induced iNKT cell‐mediated experimental eosinophilic esophagitis. Am J Physiol Gastrointest Liver Physiol. 2012;302(7):G645‐654.
88. Choi P, Reiser H. IL‐4: role in disease and regulation of production. Clin Exp Immunol. 1998;113(3):317‐319.
89. Cheng E. Translating new developments in eosinophilic esophagitis pathogenesis into clinical practice. Curr Treat Options Gastroenterol. 2015;13(1):30‐46.
90. Mishra A, Wang M, Pemmaraju VR, et al. Esophageal remodeling develops as a consequence of tissue specific IL‐5‐induced eosinophilia. Gastroenterology. 2008;134(1):204‐214.
91. Masterson JC, McNamee EN, Hosford L, et al. Local hypersensitivity reaction in transgenic mice with squamous epithelial IL‐5 overexpression provides a novel model of eosinophilic oesophagitis. Gut. 2014;63(1):43‐53.
92. Mavi P, Rajavelu P, Rayapudi M, Paul RJ, Mishra A. Esophageal functional impairments in experimental eosinophilic esophagitis. Am J Physiol Gastrointest Liver Physiol. 2012;302(11):G1347‐1355.
93. Straumann A, Conus S, Grzonka P, et al. Anti‐interleukin‐5 antibody treatment (mepolizumab) in active eosinophilic oesophagitis: a randomised, placebo‐controlled, double‐blind trial. Gut. 2010;59(1):21‐30.
94. Miller AM. Role of IL‐33 in inflammation and disease. J Inflamm (Lond). 2011;8(1):22. 95. Furukawa S, Moriyama M, Miyake K, et al. Interleukin‐33 produced by M2 macrophages and
other immune cells contributes to Th2 immune reaction of IgG4‐related disease. Sci Rep. 2017;7:42413.
96. Ali S, Mohs A, Thomas M, et al. The dual function cytokine IL‐33 interacts with the transcription factor NF‐kappaB to dampen NF‐kappaB‐stimulated gene transcription. J Immunol. 2011;187(4):1609‐1616.

171
97. Kumar S, Tzimas MN, Griswold DE, Young PR. Expression of ST2, an interleukin‐1 receptor homologue, is induced by proinflammatory stimuli. Biochem Biophys Res Commun. 1997;235(3):474‐478.
98. Oshikawa K, Yanagisawa K, Tominaga S, Sugiyama Y. Expression and function of the ST2 gene in a murine model of allergic airway inflammation. Clin Exp Allergy. 2002;32(10):1520‐1526.
99. Schmitz J, Owyang A, Oldham E, et al. IL‐33, an interleukin‐1‐like cytokine that signals via the IL‐1 receptor‐related protein ST2 and induces T helper type 2‐associated cytokines. Immunity. 2005;23(5):479‐490.
100. Travers J, Rochman M, Caldwell JM, Besse JA, Miracle CE, Rothenberg ME. IL‐33 is induced in undifferentiated, non‐dividing esophageal epithelial cells in eosinophilic esophagitis. Sci Rep. 2017;7(1):17563.
101. Judd LM, Heine RG, Menheniott TR, et al. Elevated IL‐33 expression is associated with pediatric eosinophilic esophagitis, and exogenous IL‐33 promotes eosinophilic esophagitis development in mice. Am J Physiol Gastrointest Liver Physiol. 2016;310(1):G13‐25.
102. Johnston LK, Hsu CL, Krier‐Burris RA, et al. IL‐33 Precedes IL‐5 in Regulating Eosinophil Commitment and Is Required for Eosinophil Homeostasis. J Immunol. 2016;197(9):3445‐3453.
103. Soumelis V, Reche PA, Kanzler H, et al. Human epithelial cells trigger dendritic cell mediated allergic inflammation by producing TSLP. Nat Immunol. 2002;3(7):673‐680.
104. Ziegler SF. The role of thymic stromal lymphopoietin (TSLP) in allergic disorders. Curr Opin Immunol. 2010;22(6):795‐799.
105. Morshed M, Yousefi S, Stockle C, Simon HU, Simon D. Thymic stromal lymphopoietin stimulates the formation of eosinophil extracellular traps. Allergy. 2012;67(9):1127‐1137.
106. Chandramouleeswaran PM, Shen D, Lee AJ, et al. Preferential Secretion of Thymic Stromal Lymphopoietin (TSLP) by Terminally Differentiated Esophageal Epithelial Cells: Relevance to Eosinophilic Esophagitis (EoE). PLoS One. 2016;11(3):e0150968.
107. Ishihara S, Shoda T, Ishimura N, et al. Serum Biomarkers for the Diagnosis of Eosinophilic Esophagitis and Eosinophilic Gastroenteritis. Intern Med. 2017;56(21):2819‐2825.
108. Eden K, Rothschild DE, McDaniel DK, Heid B, Allen IC. Noncanonical NF‐kappaB signaling and the essential kinase NIK modulate crucial features associated with eosinophilic esophagitis pathogenesis. Dis Model Mech. 2017;10(12):1517‐1527.
109. Martin LJ, He H, Collins MH, et al. Eosinophilic esophagitis (EoE) genetic susceptibility is mediated by synergistic interactions between EoE‐specific and general atopic disease loci. J Allergy Clin Immunol. 2017.
110. Fahey LM, Chandramouleeswaran PM, Guan S, et al. Food allergen triggers are increased in children with the TSLP risk allele and eosinophilic esophagitis. Clin Transl Gastroenterol. 2018;9(3):139.
111. Simon D, Radonjic‐Hosli S, Straumann A, Yousefi S, Simon HU. Active eosinophilic esophagitis is characterized by epithelial barrier defects and eosinophil extracellular trap formation. Allergy. 2015;70(4):443‐452.
112. Rieder F, Nonevski I, Ma J, et al. T‐helper 2 cytokines, transforming growth factor beta1, and eosinophil products induce fibrogenesis and alter muscle motility in patients with eosinophilic esophagitis. Gastroenterology. 2014;146(5):1266‐1277 e1261‐1269.
113. Aceves SS, Newbury RO, Dohil R, Bastian JF, Broide DH. Esophageal remodeling in pediatric eosinophilic esophagitis. J Allergy Clin Immunol. 2007;119(1):206‐212.
114. Kagalwalla AF, Akhtar N, Woodruff SA, et al. Eosinophilic esophagitis: epithelial mesenchymal transition contributes to esophageal remodeling and reverses with treatment. J Allergy Clin Immunol. 2012;129(5):1387‐1396 e1387.
172
115. Chehade M, Sampson HA, Morotti RA, Magid MS. Esophageal subepithelial fibrosis in children with eosinophilic esophagitis. J Pediatr Gastroenterol Nutr. 2007;45(3):319‐328.
116. Straumann A, Conus S, Degen L, et al. Budesonide is effective in adolescent and adult patients with active eosinophilic esophagitis. Gastroenterology. 2010;139(5):1526‐1537, 1537 e1521.
117. Lucendo AJ. Eosinophilic esophagitis: current evidence‐based diagnosis and treatment in children and adults. Minerva Gastroenterol Dietol. 2018;64(1):62‐74.
118. Gunther C, Neumann H, Vieth M. Esophageal epithelial resistance. Dig Dis. 2014;32(1‐2):6‐10. 119. Warners MJ, van Rhijn BD, Verheij J, Smout A, Bredenoord AJ. Disease activity in eosinophilic
esophagitis is associated with impaired esophageal barrier integrity. Am J Physiol Gastrointest Liver Physiol. 2017;313(3):G230‐G238.
120. Kubo A, Nagao K, Amagai M. Epidermal barrier dysfunction and cutaneous sensitization in atopic diseases. J Clin Invest. 2012;122(2):440‐447.
121. Davis BP. Pathophysiology of Eosinophilic Esophagitis. Clin Rev Allergy Immunol. 2018. 122. Sherrill JD, Kiran KC, Blanchard C, et al. Analysis and expansion of the eosinophilic esophagitis
transcriptome by RNA sequencing. Genes Immun. 2014;15(6):361‐369. 123. Abdulnour‐Nakhoul SM, Al‐Tawil Y, Gyftopoulos AA, et al. Alterations in junctional proteins,
inflammatory mediators and extracellular matrix molecules in eosinophilic esophagitis. Clin Immunol. 2013;148(2):265‐278.
124. Rankin SM, Conroy DM, Williams TJ. Eotaxin and eosinophil recruitment: implications for human disease. Mol Med Today. 2000;6(1):20‐27.
125. Zimmermann N, Hershey GK, Foster PS, Rothenberg ME. Chemokines in asthma: cooperative interaction between chemokines and IL‐13. J Allergy Clin Immunol. 2003;111(2):227‐242; quiz 243.
126. Tian R, Zuo X, Jaoude J, Mao F, Colby J, Shureiqi I. ALOX15 as a suppressor of inflammation and cancer: Lost in the link. Prostaglandins Other Lipid Mediat. 2017;132:77‐83.
127. Bayliss MT, Howat SL, Dudhia J, et al. Up‐regulation and differential expression of the hyaluronan‐binding protein TSG‐6 in cartilage and synovium in rheumatoid arthritis and osteoarthritis. Osteoarthritis Cartilage. 2001;9(1):42‐48.
128. Matoso A, Mukkada VA, Lu S, et al. Expression microarray analysis identifies novel epithelial‐derived protein markers in eosinophilic esophagitis. Mod Pathol. 2013;26(5):665‐676.
129. Wen T, Stucke EM, Grotjan TM, et al. Molecular diagnosis of eosinophilic esophagitis by gene expression profiling. Gastroenterology. 2013;145(6):1289‐1299.
130. Van Itallie CM, Fanning AS, Holmes J, Anderson JM. Occludin is required for cytokine‐induced regulation of tight junction barriers. J Cell Sci. 2010;123(Pt 16):2844‐2852.
131. Politi E, Angelakopoulou A, Grapsa D, et al. Filaggrin and Periostin Expression Is Altered in Eosinophilic Esophagitis and Normalized With Treatment. J Pediatr Gastroenterol Nutr. 2017;65(1):47‐52.
132. Simon D, Page B, Vogel M, et al. Evidence of an abnormal epithelial barrier in active, untreated and corticosteroid‐treated eosinophilic esophagitis. Allergy. 2018;73(1):239‐247.
133. Sherrill JD, Kc K, Wu D, et al. Desmoglein‐1 regulates esophageal epithelial barrier function and immune responses in eosinophilic esophagitis. Mucosal Immunol. 2014;7(3):718‐729.
134. Warners MJ, Vlieg‐Boerstra BJ, Verheij J, et al. Esophageal and Small Intestinal Mucosal Integrity in Eosinophilic Esophagitis and Response to an Elemental Diet. Am J Gastroenterol. 2017;112(7):1061‐1071.
135. Chuang MY, Chinnaratha MA, Hancock DG, et al. Topical Steroid Therapy for the Treatment of Eosinophilic Esophagitis (EoE): A Systematic Review and Meta‐Analysis. Clin Transl Gastroenterol. 2015;6:e82.

173
136. Liacouras CA, Wenner WJ, Brown K, Ruchelli E. Primary eosinophilic esophagitis in children: successful treatment with oral corticosteroids. J Pediatr Gastroenterol Nutr. 1998;26(4):380‐385.
137. Gonsalves N. Steroids versus dietary therapy for the treatment of eosinophilic esophagitis. Curr Opin Gastroenterol. 2014;30(4):396‐401.
138. Andreae DA, Hanna MG, Magid MS, et al. Swallowed Fluticasone Propionate Is an Effective Long‐Term Maintenance Therapy for Children With Eosinophilic Esophagitis. Am J Gastroenterol. 2016;111(8):1187‐1197.
139. Schaefer ET, Fitzgerald JF, Molleston JP, et al. Comparison of oral prednisone and topical fluticasone in the treatment of eosinophilic esophagitis: a randomized trial in children. Clin Gastroenterol Hepatol. 2008;6(2):165‐173.
140. Lucendo AJ, Molina‐Infante J, Arias A, et al. Guidelines on eosinophilic esophagitis: evidence‐based statements and recommendations for diagnosis and management in children and adults. United European Gastroenterol J. 2017;5(3):335‐358.
141. Alexander JA, Jung KW, Arora AS, et al. Swallowed fluticasone improves histologic but not symptomatic response of adults with eosinophilic esophagitis. Clin Gastroenterol Hepatol. 2012;10(7):742‐749 e741.
142. Dellon ES, Sheikh A, Speck O, et al. Viscous topical is more effective than nebulized steroid therapy for patients with eosinophilic esophagitis. Gastroenterology. 2012;143(2):321‐324 e321.
143. Gonsalves N. Dietary Therapy in Eosinophilic Esophagitis. Gastrointest Endosc Clin N Am. 2018;28(1):89‐96.
144. Kelly KJ, Lazenby AJ, Rowe PC, Yardley JH, Perman JA, Sampson HA. Eosinophilic esophagitis attributed to gastroesophageal reflux: improvement with an amino acid‐based formula. Gastroenterology. 1995;109(5):1503‐1512.
145. Markowitz JE, Spergel JM, Ruchelli E, Liacouras CA. Elemental diet is an effective treatment for eosinophilic esophagitis in children and adolescents. Am J Gastroenterol. 2003;98(4):777‐782.
146. Peterson KA, Byrne KR, Vinson LA, et al. Elemental diet induces histologic response in adult eosinophilic esophagitis. Am J Gastroenterol. 2013;108(5):759‐766.
147. Henderson CJ, Abonia JP, King EC, et al. Comparative dietary therapy effectiveness in remission of pediatric eosinophilic esophagitis. J Allergy Clin Immunol. 2012;129(6):1570‐1578.
148. Taft TH, Kern E, Kwiatek MA, Hirano I, Gonsalves N, Keefer L. The adult eosinophilic oesophagitis quality of life questionnaire: a new measure of health‐related quality of life. Aliment Pharmacol Ther. 2011;34(7):790‐798.
149. Cotton CC, Eluri S, Wolf WA, Dellon ES. Six‐Food Elimination Diet and Topical Steroids are Effective for Eosinophilic Esophagitis: A Meta‐Regression. Dig Dis Sci. 2017;62(9):2408‐2420.
150. Cotton CC, Erim D, Eluri S, et al. Cost Utility Analysis of Topical Steroids Compared With Dietary Elimination for Treatment of Eosinophilic Esophagitis. Clin Gastroenterol Hepatol. 2017;15(6):841‐849 e841.
151. Furuta GT, Liacouras CA, Collins MH, et al. Eosinophilic esophagitis in children and adults: a systematic review and consensus recommendations for diagnosis and treatment. Gastroenterology. 2007;133(4):1342‐1363.
152. Molina‐Infante J, Ferrando‐Lamana L, Ripoll C, et al. Esophageal eosinophilic infiltration responds to proton pump inhibition in most adults. Clin Gastroenterol Hepatol. 2011;9(2):110‐117.
153. Ngo P, Furuta GT, Antonioli DA, Fox VL. Eosinophils in the esophagus‐‐peptic or allergic eosinophilic esophagitis? Case series of three patients with esophageal eosinophilia. Am J Gastroenterol. 2006;101(7):1666‐1670.

174
154. Molina‐Infante J, Bredenoord AJ, Cheng E, et al. Proton pump inhibitor‐responsive oesophageal eosinophilia: an entity challenging current diagnostic criteria for eosinophilic oesophagitis. Gut. 2016;65(3):524‐531.
155. Wen T, Dellon ES, Moawad FJ, Furuta GT, Aceves SS, Rothenberg ME. Transcriptome analysis of proton pump inhibitor‐responsive esophageal eosinophilia reveals proton pump inhibitor‐reversible allergic inflammation. J Allergy Clin Immunol. 2015;135(1):187‐197.
156. Gutierrez‐Junquera C, Fernandez‐Fernandez S, Cilleruelo ML, et al. Long‐term Treatment With Proton Pump Inhibitors Is Effective in Children With Eosinophilic Esophagitis. J Pediatr Gastroenterol Nutr. 2018.
157. Molina‐Infante J, Rivas MD, Hernandez‐Alonso M, et al. Proton pump inhibitor‐responsive oesophageal eosinophilia correlates with downregulation of eotaxin‐3 and Th2 cytokines overexpression. Aliment Pharmacol Ther. 2014;40(8):955‐965.
158. Cheng E, Zhang X, Huo X, et al. Omeprazole blocks eotaxin‐3 expression by oesophageal squamous cells from patients with eosinophilic oesophagitis and GORD. Gut. 2013;62(6):824‐832.
159. Lucendo AJ, Arias A, Gonzalez‐Cervera J, Olalla JM, Molina‐Infante J. Dual response to dietary/topical steroid and proton pump inhibitor therapy in adult patients with eosinophilic esophagitis. J Allergy Clin Immunol. 2016;137(3):931‐934 e932.
160. Brown KD, Zurawski SM, Mosmann TR, Zurawski G. A family of small inducible proteins secreted by leukocytes are members of a new superfamily that includes leukocyte and fibroblast‐derived inflammatory agents, growth factors, and indicators of various activation processes. J Immunol. 1989;142(2):679‐687.
161. Leonard WJ, Lin JX. Cytokine receptor signaling pathways. J Allergy Clin Immunol. 2000;105(5):877‐888.
162. Tsarbopoulos A, Varnerin J, Cannon‐Carlson S, et al. Mass spectrometric mapping of disulfide bonds in recombinant human interleukin‐13. J Mass Spectrom. 2000;35(3):446‐453.
163. LaPorte SL, Juo ZS, Vaclavikova J, et al. Molecular and structural basis of cytokine receptor pleiotropy in the interleukin‐4/13 system. Cell. 2008;132(2):259‐272.
164. Gessner A, Mohrs K, Mohrs M. Mast cells, basophils, and eosinophils acquire constitutive IL‐4 and IL‐13 transcripts during lineage differentiation that are sufficient for rapid cytokine production. J Immunol. 2005;174(2):1063‐1072.
165. Klein Wolterink RG, Kleinjan A, van Nimwegen M, et al. Pulmonary innate lymphoid cells are major producers of IL‐5 and IL‐13 in murine models of allergic asthma. Eur J Immunol. 2012;42(5):1106‐1116.
166. Heller F, Fuss IJ, Nieuwenhuis EE, Blumberg RS, Strober W. Oxazolone colitis, a Th2 colitis model resembling ulcerative colitis, is mediated by IL‐13‐producing NK‐T cells. Immunity. 2002;17(5):629‐638.
167. Mueller TD, Zhang JL, Sebald W, Duschl A. Structure, binding, and antagonists in the IL‐4/IL‐13 receptor system. Biochim Biophys Acta. 2002;1592(3):237‐250.
168. Zurawski SM, Chomarat P, Djossou O, et al. The primary binding subunit of the human interleukin‐4 receptor is also a component of the interleukin‐13 receptor. J Biol Chem. 1995;270(23):13869‐13878.
169. Aman MJ, Tayebi N, Obiri NI, Puri RK, Modi WS, Leonard WJ. cDNA cloning and characterization of the human interleukin 13 receptor alpha chain. J Biol Chem. 1996;271(46):29265‐29270.
170. Miloux B, Laurent P, Bonnin O, et al. Cloning of the human IL‐13R alpha1 chain and reconstitution with the IL4R alpha of a functional IL‐4/IL‐13 receptor complex. FEBS Lett. 1997;401(2‐3):163‐166.

175
171. Gwiggner M, Martinez‐Nunez RT, Whiteoak SR, et al. MicroRNA‐31 and MicroRNA‐155 Are Overexpressed in Ulcerative Colitis and Regulate IL‐13 Signaling by Targeting Interleukin 13 Receptor alpha‐1. Genes (Basel). 2018;9(2).
172. Caput D, Laurent P, Kaghad M, et al. Cloning and characterization of a specific interleukin (IL)‐13 binding protein structurally related to the IL‐5 receptor alpha chain. J Biol Chem. 1996;271(28):16921‐16926.
173. Donaldson DD, Whitters MJ, Fitz LJ, et al. The murine IL‐13 receptor alpha 2: molecular cloning, characterization, and comparison with murine IL‐13 receptor alpha 1. J Immunol. 1998;161(5):2317‐2324.
174. Urban JF, Jr., Noben‐Trauth N, Donaldson DD, et al. IL‐13, IL‐4Ralpha, and Stat6 are required for the expulsion of the gastrointestinal nematode parasite Nippostrongylus brasiliensis. Immunity. 1998;8(2):255‐264.
175. Kawakami K, Taguchi J, Murata T, Puri RK. The interleukin‐13 receptor alpha2 chain: an essential component for binding and internalization but not for interleukin‐13‐induced signal transduction through the STAT6 pathway. Blood. 2001;97(9):2673‐2679.
176. Hershey GK. IL‐13 receptors and signaling pathways: an evolving web. J Allergy Clin Immunol. 2003;111(4):677‐690; quiz 691.
177. Yamaoka K, Saharinen P, Pesu M, Holt VE, 3rd, Silvennoinen O, O'Shea JJ. The Janus kinases (Jaks). Genome Biol. 2004;5(12):253.
178. Keegan AD, Johnston JA, Tortolani PJ, et al. Similarities and differences in signal transduction by interleukin 4 and interleukin 13: analysis of Janus kinase activation. Proc Natl Acad Sci U S A. 1995;92(17):7681‐7685.
179. Kelly‐Welch AE, Hanson EM, Boothby MR, Keegan AD. Interleukin‐4 and interleukin‐13 signaling connections maps. Science. 2003;300(5625):1527‐1528.
180. Darnell JE, Jr., Kerr IM, Stark GR. Jak‐STAT pathways and transcriptional activation in response to IFNs and other extracellular signaling proteins. Science. 1994;264(5164):1415‐1421.
181. Mitchell TJ, John S. Signal transducer and activator of transcription (STAT) signalling and T‐cell lymphomas. Immunology. 2005;114(3):301‐312.
182. Takeda K, Kamanaka M, Tanaka T, Kishimoto T, Akira S. Impaired IL‐13‐mediated functions of macrophages in STAT6‐deficient mice. J Immunol. 1996;157(8):3220‐3222.
183. Orchansky PL, Kwan R, Lee F, Schrader JW. Characterization of the cytoplasmic domain of interleukin‐13 receptor‐alpha. J Biol Chem. 1999;274(30):20818‐20825.
184. Umeshita‐Suyama R, Sugimoto R, Akaiwa M, et al. Characterization of IL‐4 and IL‐13 signals dependent on the human IL‐13 receptor alpha chain 1: redundancy of requirement of tyrosine residue for STAT3 activation. Int Immunol. 2000;12(11):1499‐1509.
185. Xu B, Bhattacharjee A, Roy B, et al. Interleukin‐13 induction of 15‐lipoxygenase gene expression requires p38 mitogen‐activated protein kinase‐mediated serine 727 phosphorylation of Stat1 and Stat3. Mol Cell Biol. 2003;23(11):3918‐3928.
186. Amano W, Nakajima S, Kunugi H, et al. The Janus kinase inhibitor JTE‐052 improves skin barrier function through suppressing signal transducer and activator of transcription 3 signaling. J Allergy Clin Immunol. 2015;136(3):667‐677 e667.
187. Roy B, Bhattacharjee A, Xu B, Ford D, Maizel AL, Cathcart MK. IL‐13 signal transduction in human monocytes: phosphorylation of receptor components, association with Jaks, and phosphorylation/activation of Stats. J Leukoc Biol. 2002;72(3):580‐589.
188. Friedrich K, Kammer W, Erhardt I, Brandlein S, Sebald W, Moriggl R. Activation of STAT5 by IL‐4 relies on Janus kinase function but not on receptor tyrosine phosphorylation, and can contribute to both cell proliferation and gene regulation. Int Immunol. 1999;11(8):1283‐1294.

176
189. Roskoski R, Jr. ERK1/2 MAP kinases: structure, function, and regulation. Pharmacol Res. 2012;66(2):105‐143.
190. Fujisawa T, Joshi B, Nakajima A, Puri RK. A novel role of interleukin‐13 receptor alpha2 in pancreatic cancer invasion and metastasis. Cancer Res. 2009;69(22):8678‐8685.
191. Fujisawa T, Joshi BH, Puri RK. IL‐13 regulates cancer invasion and metastasis through IL‐13Ralpha2 via ERK/AP‐1 pathway in mouse model of human ovarian cancer. Int J Cancer. 2012;131(2):344‐356.
192. Lee PJ, Zhang X, Shan P, et al. ERK1/2 mitogen‐activated protein kinase selectively mediates IL‐13‐induced lung inflammation and remodeling in vivo. J Clin Invest. 2006;116(1):163‐173.
193. Goto K, Chiba Y, Misawa M. IL‐13 induces translocation of NF‐kappaB in cultured human bronchial smooth muscle cells. Cytokine. 2009;46(1):96‐99.
194. Shinozaki S, Mashima H, Ohnishi H, Sugano K. IL‐13 promotes the proliferation of rat pancreatic stellate cells through the suppression of NF‐kappaB/TGF‐beta1 pathway. Biochem Biophys Res Commun. 2010;393(1):61‐65.
195. David M, Ford D, Bertoglio J, Maizel AL, Pierre J. Induction of the IL‐13 receptor alpha2‐chain by IL‐4 and IL‐13 in human keratinocytes: involvement of STAT6, ERK and p38 MAPK pathways. Oncogene. 2001;20(46):6660‐6668.
196. Zhou X, Hu H, Balzar S, Trudeau JB, Wenzel SE. MAPK regulation of IL‐4/IL‐13 receptors contributes to the synergistic increase in CCL11/eotaxin‐1 in response to TGF‐beta1 and IL‐13 in human airway fibroblasts. J Immunol. 2012;188(12):6046‐6054.
197. Bao K, Reinhardt RL. The differential expression of IL‐4 and IL‐13 and its impact on type‐2 immunity. Cytokine. 2015;75(1):25‐37.
198. Maizels RM, Holland MJ. Parasite immunology: pathways for expelling intestinal helminths. Curr Biol. 1998;8(20):R711‐714.
199. Finkelman FD, Shea‐Donohue T, Morris SC, et al. Interleukin‐4‐ and interleukin‐13‐mediated host protection against intestinal nematode parasites. Immunol Rev. 2004;201:139‐155.
200. Punnonen J, de Vries JE. IL‐13 induces proliferation, Ig isotype switching, and Ig synthesis by immature human fetal B cells. J Immunol. 1994;152(3):1094‐1102.
201. Zhu Z, Homer RJ, Wang Z, et al. Pulmonary expression of interleukin‐13 causes inflammation, mucus hypersecretion, subepithelial fibrosis, physiologic abnormalities, and eotaxin production. J Clin Invest. 1999;103(6):779‐788.
202. Terabe M, Park JM, Berzofsky JA. Role of IL‐13 in regulation of anti‐tumor immunity and tumor growth. Cancer Immunol Immunother. 2004;53(2):79‐85.
203. Brown CE, Warden CD, Starr R, et al. Glioma IL13Ralpha2 is associated with mesenchymal signature gene expression and poor patient prognosis. PLoS One. 2013;8(10):e77769.
204. Sengupta S, Thaci B, Crawford AC, Sampath P. Interleukin‐13 receptor alpha 2‐targeted glioblastoma immunotherapy. Biomed Res Int. 2014;2014:952128.
205. Schmid‐Grendelmeier P, Altznauer F, Fischer B, et al. Eosinophils express functional IL‐13 in eosinophilic inflammatory diseases. J Immunol. 2002;169(2):1021‐1027.
206. Mishra A, Rothenberg ME. Intratracheal IL‐13 induces eosinophilic esophagitis by an IL‐5, eotaxin‐1, and STAT6‐dependent mechanism. Gastroenterology. 2003;125(5):1419‐1427.
207. Zuo L, Fulkerson PC, Finkelman FD, et al. IL‐13 induces esophageal remodeling and gene expression by an eosinophil‐independent, IL‐13R alpha 2‐inhibited pathway. J Immunol. 2010;185(1):660‐669.
208. D'Mello RJ, Caldwell JM, Azouz NP, et al. LRRC31 is induced by IL‐13 and regulates kallikrein expression and barrier function in the esophageal epithelium. Mucosal Immunol. 2016;9(3):744‐756.

177
209. Davis BP, Stucke EM, Khorki ME, et al. Eosinophilic esophagitis‐linked calpain 14 is an IL‐13‐induced protease that mediates esophageal epithelial barrier impairment. JCI Insight. 2016;1(4):e86355.
210. Blanchard C, Mishra A, Saito‐Akei H, Monk P, Anderson I, Rothenberg ME. Inhibition of human interleukin‐13‐induced respiratory and oesophageal inflammation by anti‐human‐interleukin‐13 antibody (CAT‐354). Clin Exp Allergy. 2005;35(8):1096‐1103.
211. Rothenberg ME, Wen T, Greenberg A, et al. Intravenous anti‐IL‐13 mAb QAX576 for the treatment of eosinophilic esophagitis. J Allergy Clin Immunol. 2015;135(2):500‐507.
212. Tripp CS, Cuff C, Campbell AL, et al. RPC4046, A Novel Anti‐interleukin‐13 Antibody, Blocks IL‐13 Binding to IL‐13 alpha1 and alpha2 Receptors: A Randomized, Double‐Blind, Placebo‐Controlled, Dose‐Escalation First‐in‐Human Study. Adv Ther. 2017;34(6):1364‐1381.
213. Goyal A, Cheng E. Recent discoveries and emerging therapeutics in eosinophilic esophagitis. World J Gastrointest Pharmacol Ther. 2016;7(1):21‐32.
214. Seifter JL, Chang HY. Extracellular Acid‐Base Balance and Ion Transport Between Body Fluid Compartments. Physiology (Bethesda). 2017;32(5):367‐379.
215. Stock C, Ludwig FT, Hanley PJ, Schwab A. Roles of ion transport in control of cell motility. Compr Physiol. 2013;3(1):59‐119.
216. Matalon S, Bartoszewski R, Collawn JF. Role of epithelial sodium channels in the regulation of lung fluid homeostasis. Am J Physiol Lung Cell Mol Physiol. 2015;309(11):L1229‐1238.
217. Field M. Intestinal ion transport and the pathophysiology of diarrhea. J Clin Invest. 2003;111(7):931‐943.
218. Fromter E. Mechanisms and regulation of ion transport in the renal collecting duct. Comp Biochem Physiol A Comp Physiol. 1988;90(4):701‐707.
219. Bland RD. Lung epithelial ion transport and fluid movement during the perinatal period. Am J Physiol. 1990;259(2 Pt 1):L30‐37.
220. Fritzsching B, Hagner M, Dai L, et al. Impaired mucus clearance exacerbates allergen‐induced type 2 airway inflammation in juvenile mice. J Allergy Clin Immunol. 2017;140(1):190‐203 e195.
221. Bartoszewski R, Matalon S, Collawn JF. Ion channels of the lung and their role in disease pathogenesis. Am J Physiol Lung Cell Mol Physiol. 2017;313(5):L859‐L872.
222. Hobbs CA, Blanchard MG, Alijevic O, et al. Identification of the SPLUNC1 ENaC‐inhibitory domain yields novel strategies to treat sodium hyperabsorption in cystic fibrosis airway epithelial cultures. Am J Physiol Lung Cell Mol Physiol. 2013;305(12):L990‐L1001.
223. Hogan PG, Lewis RS, Rao A. Molecular basis of calcium signaling in lymphocytes: STIM and ORAI. Annu Rev Immunol. 2010;28:491‐533.
224. Feske S. ORAI1 and STIM1 deficiency in human and mice: roles of store‐operated Ca2+ entry in the immune system and beyond. Immunol Rev. 2009;231(1):189‐209.
225. Mittal RK. Motor Function of the Pharynx, Esophagus, and its Sphincters. San Rafael (CA)2011. 226. Orlando RC. Current understanding of the mechanisms of gastro‐oesophageal reflux disease.
Drugs. 2006;66 Suppl 1:1‐5; discussion 29‐33. 227. Tobey NA, Reddy SP, Khalbuss WE, Silvers SM, Cragoe EJ, Jr., Orlando RC. Na(+)‐dependent and ‐
independent Cl‐/HCO3‐ exchangers in cultured rabbit esophageal epithelial cells. Gastroenterology. 1993;104(1):185‐195.
228. Avidan B, Sonnenberg A, Schnell TG, Sontag SJ. Walking and chewing reduce postprandial acid reflux. Aliment Pharmacol Ther. 2001;15(2):151‐155.
229. Herbella FA, Sweet MP, Tedesco P, Nipomnick I, Patti MG. Gastroesophageal reflux disease and obesity. Pathophysiology and implications for treatment. J Gastrointest Surg. 2007;11(3):286‐290.

178
230. Mason RJ, Oberg S, Bremner CG, et al. Postprandial gastroesophageal reflux in normal volunteers and symptomatic patients. J Gastrointest Surg. 1998;2(4):342‐349.
231. Orlando RC. Gastroesophageal Reflux Disease. New York: CRC Press; 2000. 232. Abdulnour‐Nakhoul S, Nakhoul NL, Wheeler SA, Wang P, Swenson ER, Orlando RC. HCO3‐
secretion in the esophageal submucosal glands. Am J Physiol Gastrointest Liver Physiol. 2005;288(4):G736‐744.
233. Shaheen N, Ransohoff DF. Gastroesophageal reflux, barrett esophagus, and esophageal cancer: scientific review. JAMA. 2002;287(15):1972‐1981.
234. Martinucci I, de Bortoli N, Russo S, et al. Barrett's esophagus in 2016: From pathophysiology to treatment. World J Gastrointest Pharmacol Ther. 2016;7(2):190‐206.
235. Spechler SJ. Barrett esophagus and risk of esophageal cancer: a clinical review. JAMA. 2013;310(6):627‐636.
236. Tobey NA, Argote CM, Vanegas XC, Barlow W, Orlando RC. Electrical parameters and ion species for active transport in human esophageal stratified squamous epithelium and Barrett's specialized columnar epithelium. Am J Physiol Gastrointest Liver Physiol. 2007;293(1):G264‐270.
237. Laczko D, Rosztoczy A, Birkas K, et al. Role of ion transporters in the bile acid‐induced esophageal injury. Am J Physiol Gastrointest Liver Physiol. 2016;311(1):G16‐31.
238. Goldman A, Shahidullah M, Goldman D, et al. A novel mechanism of acid and bile acid‐induced DNA damage involving Na+/H+ exchanger: implication for Barrett's oesophagus. Gut. 2010;59(12):1606‐1616.
239. Guan B, Hoque A, Xu X. Amiloride and guggulsterone suppression of esophageal cancer cell growth in vitro and in nude mouse xenografts. Front Biol (Beijing). 2014;9(1):75‐81.
240. Zhang R, Gong J, Wang H, Wang L. Bile salts inhibit growth and induce apoptosis of human esophageal cancer cell line. World J Gastroenterol. 2005;11(33):5109‐5116.
241. Goldman A, Chen H, Khan MR, et al. The Na+/H+ exchanger controls deoxycholic acid‐induced apoptosis by a H+‐activated, Na+‐dependent ionic shift in esophageal cells. PLoS One. 2011;6(8):e23835.
242. Valles PG, Bocanegra V, Gil Lorenzo A, Costantino VV. Physiological Functions and Regulation of the Na+/H+ Exchanger [NHE1] in Renal Tubule Epithelial Cells. Kidney Blood Press Res. 2015;40(5):452‐466.
243. Donowitz M, Ming Tse C, Fuster D. SLC9/NHE gene family, a plasma membrane and organellar family of Na(+)/H(+) exchangers. Mol Aspects Med. 2013;34(2‐3):236‐251.
244. Slepkov E, Fliegel L. Regulation of expression of the Na+/H+ exchanger by thyroid hormone. Vitam Horm. 2004;69:249‐269.
245. Slepkov ER, Rainey JK, Sykes BD, Fliegel L. Structural and functional analysis of the Na+/H+ exchanger. Biochem J. 2007;401(3):623‐633.
246. Slepkov E, Fliegel L. Structure and function of the NHE1 isoform of the Na+/H+ exchanger. Biochem Cell Biol. 2002;80(5):499‐508.
247. Rotin D, Grinstein S. Impaired cell volume regulation in Na(+)‐H+ exchange‐deficient mutants. Am J Physiol. 1989;257(6 Pt 1):C1158‐1165.
248. Wu D, Kraut JA. Role of NHE1 in the cellular dysfunction of acute metabolic acidosis. Am J Nephrol. 2014;40(1):36‐42.
249. Odunewu‐Aderibigbe A, Fliegel L. The Na(+) /H(+) exchanger and pH regulation in the heart. IUBMB Life. 2014;66(10):679‐685.
250. Wang Y, Meyer JW, Ashraf M, Shull GE. Mice with a null mutation in the NHE1 Na+‐H+ exchanger are resistant to cardiac ischemia‐reperfusion injury. Circ Res. 2003;93(8):776‐782.
251. Amith SR, Fliegel L. Regulation of the Na+/H+ Exchanger (NHE1) in Breast Cancer Metastasis. Cancer Res. 2013;73(4):1259‐1264.

179
252. Harguindey S, Arranz JL, Polo Orozco JD, et al. Cariporide and other new and powerful NHE1 inhibitors as potentially selective anticancer drugs‐‐an integral molecular/biochemical/metabolic/clinical approach after one hundred years of cancer research. J Transl Med. 2013;11:282.
253. Nakamura N, Tanaka S, Teko Y, Mitsui K, Kanazawa H. Four Na+/H+ exchanger isoforms are distributed to Golgi and post‐Golgi compartments and are involved in organelle pH regulation. J Biol Chem. 2005;280(2):1561‐1572.
254. Orlowski J, Kandasamy RA, Shull GE. Molecular cloning of putative members of the Na/H exchanger gene family. cDNA cloning, deduced amino acid sequence, and mRNA tissue expression of the rat Na/H exchanger NHE‐1 and two structurally related proteins. J Biol Chem. 1992;267(13):9331‐9339.
255. Malo ME, Fliegel L. Physiological role and regulation of the Na+/H+ exchanger. Can J Physiol Pharmacol. 2006;84(11):1081‐1095.
256. Brant SR, Yun CH, Donowitz M, Tse CM. Cloning, tissue distribution, and functional analysis of the human Na+/N+ exchanger isoform, NHE3. Am J Physiol. 1995;269(1 Pt 1):C198‐206.
257. Schultheis PJ, Clarke LL, Meneton P, et al. Renal and intestinal absorptive defects in mice lacking the NHE3 Na+/H+ exchanger. Nat Genet. 1998;19(3):282‐285.
258. Pan W, Borovac J, Spicer Z, et al. The epithelial sodium/proton exchanger, NHE3, is necessary for renal and intestinal calcium (re)absorption. Am J Physiol Renal Physiol. 2012;302(8):F943‐956.
259. Vallon V, Schwark JR, Richter K, Hropot M. Role of Na(+)/H(+) exchanger NHE3 in nephron function: micropuncture studies with S3226, an inhibitor of NHE3. Am J Physiol Renal Physiol. 2000;278(3):F375‐379.
260. Wang T, Hropot M, Aronson PS, Giebisch G. Role of NHE isoforms in mediating bicarbonate reabsorption along the nephron. Am J Physiol Renal Physiol. 2001;281(6):F1117‐1122.
261. Girardi AC, Di Sole F. Deciphering the mechanisms of the Na+/H+ exchanger‐3 regulation in organ dysfunction. Am J Physiol Cell Physiol. 2012;302(11):C1569‐1587.
262. Koeners MP, Lewis KE, Ford AP, Paton JF. Hypertension: a problem of organ blood flow supply‐demand mismatch. Future Cardiol. 2016;12(3):339‐349.
263. LaPointe MS, Sodhi C, Sahai A, Batlle D. Na+/H+ exchange activity and NHE‐3 expression in renal tubules from the spontaneously hypertensive rat. Kidney Int. 2002;62(1):157‐165.
264. Inoue BH, dos Santos L, Pessoa TD, et al. Increased NHE3 abundance and transport activity in renal proximal tubule of rats with heart failure. Am J Physiol Regul Integr Comp Physiol. 2012;302(1):R166‐174.
265. Ledoussal C, Lorenz JN, Nieman ML, Soleimani M, Schultheis PJ, Shull GE. Renal salt wasting in mice lacking NHE3 Na+/H+ exchanger but not in mice lacking NHE2. Am J Physiol Renal Physiol. 2001;281(4):F718‐727.
266. Linz B, Hohl M, Reil JC, Bohm M, Linz D. Inhibition of NHE3‐mediated Sodium Absorption in the Gut Reduced Cardiac End‐organ Damage Without Deteriorating Renal Function in Obese Spontaneously Hypertensive Rats. J Cardiovasc Pharmacol. 2016;67(3):225‐231.
267. Yeruva S, Farkas K, Hubricht J, et al. Preserved Na(+)/H(+) exchanger isoform 3 expression and localization, but decreased NHE3 function indicate regulatory sodium transport defect in ulcerative colitis. Inflamm Bowel Dis. 2010;16(7):1149‐1161.
268. Gurney MA, Laubitz D, Ghishan FK, Kiela PR. Pathophysiology of Intestinal Na(+)/H(+) exchange. Cell Mol Gastroenterol Hepatol. 2017;3(1):27‐40.
269. Thursby E, Juge N. Introduction to the human gut microbiota. Biochem J. 2017;474(11):1823‐1836.
270. O'May GA, Reynolds N, Macfarlane GT. Effect of pH on an in vitro model of gastric microbiota in enteral nutrition patients. Appl Environ Microbiol. 2005;71(8):4777‐4783.

180
271. Lomasney KW, Houston A, Shanahan F, Dinan TG, Cryan JF, Hyland NP. Selective influence of host microbiota on cAMP‐mediated ion transport in mouse colon. Neurogastroenterol Motil. 2014;26(6):887‐890.
272. Engevik MA, Aihara E, Montrose MH, Shull GE, Hassett DJ, Worrell RT. Loss of NHE3 alters gut microbiota composition and influences Bacteroides thetaiotaomicron growth. Am J Physiol Gastrointest Liver Physiol. 2013;305(10):G697‐711.
273. Queiroz‐Leite GD, Peruzzetto MC, Neri EA, Reboucas NA. Transcriptional regulation of the Na(+)/H(+) exchanger NHE3 by chronic exposure to angiotensin II in renal epithelial cells. Biochem Biophys Res Commun. 2011;409(3):470‐476.
274. Collazo R, Fan L, Hu MC, Zhao H, Wiederkehr MR, Moe OW. Acute regulation of Na+/H+ exchanger NHE3 by parathyroid hormone via NHE3 phosphorylation and dynamin‐dependent endocytosis. J Biol Chem. 2000;275(41):31601‐31608.
275. Bacic D, Kaissling B, McLeroy P, Zou L, Baum M, Moe OW. Dopamine acutely decreases apical membrane Na/H exchanger NHE3 protein in mouse renal proximal tubule. Kidney Int. 2003;64(6):2133‐2141.
276. Hu MC, Fan L, Crowder LA, Karim‐Jimenez Z, Murer H, Moe OW. Dopamine acutely stimulates Na+/H+ exchanger (NHE3) endocytosis via clathrin‐coated vesicles: dependence on protein kinase A‐mediated NHE3 phosphorylation. J Biol Chem. 2001;276(29):26906‐26915.
277. Alexander RT, Grinstein S. Tethering, recycling and activation of the epithelial sodium‐proton exchanger, NHE3. J Exp Biol. 2009;212(Pt 11):1630‐1637.
278. Dellon ES, Hirano I. Epidemiology and Natural History of Eosinophilic Esophagitis. Gastroenterology. 2017.
279. Dellon ES. Epidemiology of eosinophilic esophagitis. Gastroenterol Clin North Am. 2014;43(2):201‐218.
280. Prasad GA, Alexander JA, Schleck CD, et al. Epidemiology of eosinophilic esophagitis over three decades in Olmsted County, Minnesota. Clin Gastroenterol Hepatol. 2009;7(10):1055‐1061.
281. Arias A, Perez‐Martinez I, Tenias JM, Lucendo AJ. Systematic review with meta‐analysis: the incidence and prevalence of eosinophilic oesophagitis in children and adults in population‐based studies. Alimentary pharmacology & therapeutics. 2016;43(1):3‐15.
282. Liacouras CA, Furuta GT, Hirano I, et al. Eosinophilic esophagitis: updated consensus recommendations for children and adults. The Journal of allergy and clinical immunology. 2011;128(1):3‐20 e26; quiz 21‐22.
283. Klinnert MD, Silveira L, Harris R, et al. Health‐Related Quality of Life Over Time in Children With Eosinophilic Esophagitis and Their Families. J Pediatr Gastr Nutr. 2014;59(3):308‐316.
284. Akei HS, Mishra A, Blanchard C, Rothenberg ME. Epicutaneous Antigen Exposure Primes for Experimental Eosinophilic Esophagitis in Mice. Gastroenterology. 2005;129(3):985‐994.
285. Collins MH. Histopathologic features of eosinophilic esophagitis. Gastrointestinal endoscopy clinics of North America. 2008;18(1):59‐71; viii‐ix.
286. Abu‐Sultaneh SM, Durst P, Maynard V, Elitsur Y. Fluticasone and food allergen elimination reverse sub‐epithelial fibrosis in children with eosinophilic esophagitis. Dig Dis Sci. 2011;56(1):97‐102.
287. Arora AS, Perrault J, Smyrk TC. Topical corticosteroid treatment of dysphagia due to eosinophilic esophagitis in adults. Mayo Clin Proc. 2003;78(7):830‐835.
288. Faubion WA, Jr., Perrault J, Burgart LJ, Zein NN, Clawson M, Freese DK. Treatment of eosinophilic esophagitis with inhaled corticosteroids. Journal of pediatric gastroenterology and nutrition. 1998;27(1):90‐93.
289. Liacouras CA, Ruchelli E. Eosinophilic esophagitis. Current opinion in pediatrics. 2004;16(5):560‐566.

181
290. Purdy JK, Appelman HD, Golembeski CP, McKenna BJ. Lymphocytic esophagitis: a chronic or recurring pattern of esophagitis resembling allergic contact dermatitis. Am J Clin Pathol. 2008;130(4):508‐513.
291. Caviglia R, Ribolsi M, Maggiano N, et al. Dilated intercellular spaces of esophageal epithelium in nonerosive reflux disease patients with physiological esophageal acid exposure. The American journal of gastroenterology. 2005;100(3):543‐548.
292. Ravelli A, Villanacci V, Cadei M, Fuoti M, Gennati G, Salemme M. Dilated intercellular spaces in eosinophilic esophagitis. J Pediatr Gastroenterol Nutr. 2014;59(5):589‐593.
293. Mueller S, Neureiter D, Aigner T, Stolte M. Comparison of histological parameters for the diagnosis of eosinophilic oesophagitis versus gastro‐oesophageal reflux disease on oesophageal biopsy material. Histopathology. 2008;53(6):676‐684.
294. Orlowski J, Grinstein S. Emerging roles of alkali cation/proton exchangers in organellar homeostasis. Curr Opin Cell Biol. 2007;19(4):483‐492.
295. Trapnell C, Roberts A, Goff L, et al. Differential gene and transcript expression analysis of RNA‐seq experiments with TopHat and Cufflinks. Nature protocols. 2012;7(3):562‐578.
296. Langmead B, Trapnell C, Pop M, Salzberg SL. Ultrafast and memory‐efficient alignment of short DNA sequences to the human genome. Genome biology. 2009;10(3):R25.
297. Garber M, Grabherr MG, Guttman M, Trapnell C. Computational methods for transcriptome annotation and quantification using RNA‐seq. Nat Methods. 2011;8(6):469‐477.
298. Kartashov AV, Barski A. BioWardrobe: an integrated platform for analysis of epigenomics and transcriptomics data. Genome Biol. 2015;16:158.
299. Chen J, Bardes EE, Aronow BJ, Jegga AG. ToppGene Suite for gene list enrichment analysis and candidate gene prioritization. Nucleic Acids Res. 2009;37(Web Server issue):W305‐311.
300. Harada H, Nakagawa H, Oyama K, et al. Telomerase induces immortalization of human esophageal keratinocytes without p16(INK4a) inactivation. Molecular Cancer Research. 2003;1(10):729‐738.
301. Schwark JR, Jansen HW, Lang HJ, Krick W, Burckhardt G, Hropot M. S3226, a novel inhibitor of Na+/H+ exchanger subtype 3 in various cell types. Pflugers Archiv : European journal of physiology. 1998;436(5):797‐800.
302. Iovannisci D, Illek B, Fischer H. Function of the HVCN1 proton channel in airway epithelia and a naturally occurring mutation, M91T. J Gen Physiol. 2010;136(1):35‐46.
303. Wakabayashi S, Shigekawa M, Pouyssegur J. Molecular physiology of vertebrate Na+/H+ exchangers. Physiol Rev. 1997;77(1):51‐74.
304. Liu Y, Munker S, Mullenbach R, Weng HL. IL‐13 Signaling in Liver Fibrogenesis. Front Immunol. 2012;3:116.
305. Amin MR, Malakooti J, Sandoval R, Dudeja PK, Ramaswamy K. IFN‐gamma and TNF‐alpha regulate human NHE3 gene expression by modulating the Sp family transcription factors in human intestinal epithelial cell line C2BBe1. Am J Physiol Cell Physiol. 2006;291(5):C887‐896.
306. Clayburgh DR, Musch MW, Leitges M, Fu YX, Turner JR. Coordinated epithelial NHE3 inhibition and barrier dysfunction are required for TNF‐mediated diarrhea in vivo. The Journal of clinical investigation. 2006;116(10):2682‐2694.
307. Su HW, Wang SW, Ghishan FK, Kiela PR, Tang MJ. Cell confluency‐induced Stat3 activation regulates NHE3 expression by recruiting Sp1 and Sp3 to the proximal NHE3 promoter region during epithelial dome formation. Am J Physiol Cell Physiol. 2009;296(1):C13‐24.
308. Rochman M, Kartashov AV, Caldwell JM, et al. Neurotrophic tyrosine kinase receptor 1 is a direct transcriptional and epigenetic target of IL‐13 involved in allergic inflammation. Mucosal Immunol. 2015;8(4):785‐798.

182
309. Cho SJ, Kang MJ, Homer RJ, et al. Role of early growth response‐1 (Egr‐1) in interleukin‐13‐induced inflammation and remodeling. J Biol Chem. 2006;281(12):8161‐8168.
310. Malakooti J, Sandoval R, Amin MR, Clark J, Dudeja PK, Ramaswamy K. Transcriptional stimulation of the human NHE3 promoter activity by PMA: PKC independence and involvement of the transcription factor EGR‐1. Biochem J. 2006;396(2):327‐336.
311. Praetorius J, Andreasen D, Jensen BL, Ainsworth MA, Friis UG, Johansen T. NHE1, NHE2, and NHE3 contribute to regulation of intracellular pH in murine duodenal epithelial cells. Am J Physiol Gastrointest Liver Physiol. 2000;278(2):G197‐206.
312. Wang Z, Orlowski J, Shull GE. Primary structure and functional expression of a novel gastrointestinal isoform of the rat Na/H exchanger. J Biol Chem. 1993;268(16):11925‐11928.
313. Swietach P, Vaughan‐Jones RD, Harris AL, Hulikova A. The chemistry, physiology and pathology of pH in cancer. Philosophical transactions of the Royal Society of London Series B, Biological sciences. 2014;369(1638):20130099.
314. Orlando RC. Esophageal mucosal defense mechanisms. GI Motility online. 2006. 315. Tobey NA, Gambling TM, Vanegas XC, Carson JL, Orlando RC. Physicochemical basis for dilated
intercellular spaces in non‐erosive acid‐damaged rabbit esophageal epithelium. Dis Esophagus. 2008;21(8):757‐764.
316. Orlando LA, Orlando RC. Dilated intercellular spaces as a marker of GERD. Current gastroenterology reports. 2009;11(3):190‐194.
317. Noffsinger AE. Update on esophagitis: controversial and underdiagnosed causes. Arch Pathol Lab Med. 2009;133(7):1087‐1095.
318. Barlow WJ, Orlando RC. The pathogenesis of heartburn in nonerosive reflux disease: a unifying hypothesis. Gastroenterology. 2005;128(3):771‐778.
319. Collins MH, Martin LJ, Alexander ES, et al. Newly developed and validated eosinophilic esophagitis histology scoring system and evidence that it outperforms peak eosinophil count for disease diagnosis and monitoring. Diseases of the esophagus : official journal of the International Society for Diseases of the Esophagus / ISDE. 2017;30(3):1‐8.
320. Rodrigo J, Hernandez DJ, Vidal MA, Pedrosa JA. Vegetative innervation of the esophagus III. Intraepithelial endings. Acta Anat. 1975;92:242.
321. Pouyssegur J, Franchi A, L'Allemain G, Paris S. Cytoplasmic pH, a key determinant of growth factor‐induced DNA synthesis in quiescent fibroblasts. FEBS Lett. 1985;190(1):115‐119.
322. Schelling JR, Abu Jawdeh BG. Regulation of cell survival by Na+/H+ exchanger‐1. Am J Physiol Renal Physiol. 2008;295(3):F625‐632.
323. Moolenaar WH, Defize LH, De Laat SW. Ionic signalling by growth factor receptors. J Exp Biol. 1986;124:359‐373.
324. Di Sario A, Svegliati Baroni G, Bendia E, et al. Intracellular pH regulation and Na+/H+ exchange activity in human hepatic stellate cells: effect of platelet‐derived growth factor, insulin‐like growth factor 1 and insulin. J Hepatol. 2001;34(3):378‐385.
325. Li M, Morley P, Asem EK, Tsang BK. Epidermal growth factor elevates intracellular pH in chicken granulosa cells. Endocrinology. 1991;129(2):656‐662.
326. Vairo G, Cocks BG, Cragoe EJ, Jr., Hamilton JA. Selective suppression of growth factor‐induced cell cycle gene expression by Na+/H+ antiport inhibitors. J Biol Chem. 1992;267(27):19043‐19046.
327. Putney LK, Barber DL. Na‐H exchange‐dependent increase in intracellular pH times G2/M entry and transition. J Biol Chem. 2003;278(45):44645‐44649.
328. Schreiber R. Ca2+ signaling, intracellular pH and cell volume in cell proliferation. J Membr Biol. 2005;205(3):129‐137.

183
329. Shrode LD, Tapper H, Grinstein S. Role of intracellular pH in proliferation, transformation, and apoptosis. J Bioenerg Biomembr. 1997;29(4):393‐399.
330. Spencer AG, Labonte ED, Rosenbaum DP, et al. Intestinal inhibition of the Na+/H+ exchanger 3 prevents cardiorenal damage in rats and inhibits Na+ uptake in humans. Sci Transl Med. 2014;6(227):227ra236.
331. Papadopoulou A, Koletzko S, Heuschkel R, et al. Management guidelines of eosinophilic esophagitis in childhood. J Pediatr Gastroenterol Nutr. 2014;58(1):107‐118.
332. Gupta SK, Fitzgerald JF, Kondratyuk T, HogenEsch H. Cytokine expression in normal and inflamed esophageal mucosa: a study into the pathogenesis of allergic eosinophilic esophagitis. J Pediatr Gastroenterol Nutr. 2006;42(1):22‐26.
333. Milner JD, Ward JM, Keane‐Myers A, Paul WE. Lymphopenic mice reconstituted with limited repertoire T cells develop severe, multiorgan, Th2‐associated inflammatory disease. Proc Natl Acad Sci U S A. 2007;104(2):576‐581.
334. Caldwell JM, Collins MH, Kemme KA, et al. Cadherin 26 is an alpha integrin‐binding epithelial receptor regulated during allergic inflammation. Mucosal Immunol. 2017;10(5):1190‐1201.
335. Rochman M, Travers J, Abonia JP, Caldwell JM, Rothenberg ME. Synaptopodin is upregulated by IL‐13 in eosinophilic esophagitis and regulates esophageal epithelial cell motility and barrier integrity. JCI Insight. 2017;2(20).
336. Bhattacharjee A, Shukla M, Yakubenko VP, Mulya A, Kundu S, Cathcart MK. IL‐4 and IL‐13 employ discrete signaling pathways for target gene expression in alternatively activated monocytes/macrophages. Free Radic Biol Med. 2013;54:1‐16.
337. Bhattacharjee A, Pal S, Feldman GM, Cathcart MK. Hck is a key regulator of gene expression in alternatively activated human monocytes. J Biol Chem. 2011;286(42):36709‐36723.
338. Tomkinson A, Duez C, Lahn M, Gelfand EW. Adoptive transfer of T cells induces airway hyperresponsiveness independently of airway eosinophilia but in a signal transducer and activator of transcription 6‐dependent manner. J Allergy Clin Immunol. 2002;109(5):810‐816.
339. Stokes K, LaMarche NM, Islam N, Wood A, Huang W, August A. Cutting edge: STAT6 signaling in eosinophils is necessary for development of allergic airway inflammation. J Immunol. 2015;194(6):2477‐2481.
340. Kuperman DA, Huang X, Koth LL, et al. Direct effects of interleukin‐13 on epithelial cells cause airway hyperreactivity and mucus overproduction in asthma. Nat Med. 2002;8(8):885‐889.
341. Yun JH, Park SW, Kim KJ, et al. Endothelial STAT3 Activation Increases Vascular Leakage Through Downregulating Tight Junction Proteins: Implications for Diabetic Retinopathy. J Cell Physiol. 2017;232(5):1123‐1134.
342. Wu R, Sun S, Steinberg BM. Requirement of STAT3 activation for differentiation of mucosal stratified squamous epithelium. Mol Med. 2003;9(3‐4):77‐84.
343. Sherry MM, Reeves A, Wu JK, Cochran BH. STAT3 is required for proliferation and maintenance of multipotency in glioblastoma stem cells. Stem Cells. 2009;27(10):2383‐2392.
344. Huang da W, Sherman BT, Lempicki RA. Bioinformatics enrichment tools: paths toward the comprehensive functional analysis of large gene lists. Nucleic Acids Res. 2009;37(1):1‐13.
345. Huang da W, Sherman BT, Lempicki RA. Systematic and integrative analysis of large gene lists using DAVID bioinformatics resources. Nat Protoc. 2009;4(1):44‐57.
346. Harada H, Nakagawa H, Oyama K, et al. Telomerase induces immortalization of human esophageal keratinocytes without p16INK4a inactivation. Mol Cancer Res. 2003;1(10):729‐738.
347. Barski A, Cuddapah S, Cui K, et al. High‐resolution profiling of histone methylations in the human genome. Cell. 2007;129(4):823‐837.
348. Shao Z, Zhang Y, Yuan GC, Orkin SH, Waxman DJ. MAnorm: a robust model for quantitative comparison of ChIP‐Seq data sets. Genome Biol. 2012;13(3):R16.
184
349. Noah TK, Kazanjian A, Whitsett J, Shroyer NF. SAM pointed domain ETS factor (SPDEF) regulates terminal differentiation and maturation of intestinal goblet cells. Exp Cell Res. 2010;316(3):452‐465.
350. Kc K, Rothenberg ME, Sherrill JD. In vitro model for studying esophageal epithelial differentiation and allergic inflammatory responses identifies keratin involvement in eosinophilic esophagitis. PLoS One. 2015;10(6):e0127755.
351. Calo E, Wysocka J. Modification of enhancer chromatin: what, how, and why? Mol Cell. 2013;49(5):825‐837.
352. Yang M, Hogan SP, Henry PJ, et al. Interleukin‐13 mediates airways hyperreactivity through the IL‐4 receptor‐alpha chain and STAT‐6 independently of IL‐5 and eotaxin. Am J Respir Cell Mol Biol. 2001;25(4):522‐530.
353. Neilsen CV, Bryce PJ. Interleukin‐13 directly promotes oesophagus production of CCL11 and CCL24 and the migration of eosinophils. Clin Exp Allergy. 2010;40(3):427‐434.
354. Suzaki I, Kawano S, Komiya K, et al. Inhibition of IL‐13‐induced periostin in airway epithelium attenuates cellular protein expression of MUC5AC. Respirology. 2017;22(1):93‐100.
355. Geletu M, Arulanandam R, Greer S, Trotman‐Grant A, Tomai E, Raptis L. Stat3 is a positive regulator of gap junctional intercellular communication in cultured, human lung carcinoma cells. BMC Cancer. 2012;12:605.
356. Nithya S, Radhika T, Jeddy N. Loricrin ‐ an overview. J Oral Maxillofac Pathol. 2015;19(1):64‐68. 357. Sandilands A, Sutherland C, Irvine AD, McLean WH. Filaggrin in the frontline: role in skin barrier
function and disease. J Cell Sci. 2009;122(Pt 9):1285‐1294. 358. Bangsow T, Baumann E, Bangsow C, et al. The epithelial membrane protein 1 is a novel tight
junction protein of the blood‐brain barrier. J Cereb Blood Flow Metab. 2008;28(6):1249‐1260. 359. Ryu WI, Lee H, Bae HC, Ryu HJ, Son SW. IL‐33 down‐regulates filaggrin expression by inducing
STAT3 and ERK phosphorylation in human keratinocytes. J Dermatol Sci. 2016;82(2):131‐134. 360. Zhao M, Jiang B, Gao FH. Small molecule inhibitors of STAT3 for cancer therapy. Curr Med Chem.
2011;18(26):4012‐4018. 361. Wong ALA, Hirpara JL, Pervaiz S, Eu JQ, Sethi G, Goh BC. Do STAT3 inhibitors have potential in
the future for cancer therapy? Expert Opin Investig Drugs. 2017;26(8):883‐887. 362. Grivennikov S, Karin E, Terzic J, et al. IL‐6 and Stat3 are required for survival of intestinal
epithelial cells and development of colitis‐associated cancer. Cancer Cell. 2009;15(2):103‐113. 363. Ara T, Song L, Shimada H, et al. Interleukin‐6 in the bone marrow microenvironment promotes
the growth and survival of neuroblastoma cells. Cancer Res. 2009;69(1):329‐337. 364. Kanda N, Seno H, Konda Y, et al. STAT3 is constitutively activated and supports cell survival in
association with survivin expression in gastric cancer cells. Oncogene. 2004;23(28):4921‐4929. 365. Yu H, Pardoll D, Jove R. STATs in cancer inflammation and immunity: a leading role for STAT3.
Nat Rev Cancer. 2009;9(11):798‐809. 366. Avalle L, Regis G, Poli V. Universal and Specific Functions of STAT3 in Solid Tumours. In: Decker T,
Müller M, eds. Jak‐Stat Signaling : From Basics to Disease. Vienna: Springer Vienna; 2012:305‐333.
367. Zhou C, Ma J, Su M, et al. Down‐regulation of STAT3 induces the apoptosis and G1 cell cycle arrest in esophageal carcinoma ECA109 cells. Cancer Cell Int. 2018;18:53.
368. Ramos‐Solano M, Meza‐Canales ID, Torres‐Reyes LA, et al. Expression of WNT genes in cervical cancer‐derived cells: Implication of WNT7A in cell proliferation and migration. Exp Cell Res. 2015;335(1):39‐50.
369. Machado‐Neto JA, Favaro P, Lazarini M, Costa FF, Olalla Saad ST, Traina F. Knockdown of insulin receptor substrate 1 reduces proliferation and downregulates Akt/mTOR and MAPK pathways in K562 cells. Biochim Biophys Acta. 2011;1813(8):1404‐1411.

185
370. Liu RY, Zeng Y, Lei Z, et al. JAK/STAT3 signaling is required for TGF‐beta‐induced epithelial‐mesenchymal transition in lung cancer cells. Int J Oncol. 2014;44(5):1643‐1651.
371. Yong PF, Freeman AF, Engelhardt KR, Holland S, Puck JM, Grimbacher B. An update on the hyper‐IgE syndromes. Arthritis Res Ther. 2012;14(6):228.
372. Siegel AM, Stone KD, Cruse G, et al. Diminished allergic disease in patients with STAT3 mutations reveals a role for STAT3 signaling in mast cell degranulation. J Allergy Clin Immunol. 2013;132(6):1388‐1396.
373. Fredholm S, Gjerdrum LM, Willerslev‐Olsen A, et al. STAT3 activation and infiltration of eosinophil granulocytes in mycosis fungoides. Anticancer Res. 2014;34(10):5277‐5286.
374. Stout BA, Bates ME, Liu LY, Farrington NN, Bertics PJ. IL‐5 and granulocyte‐macrophage colony‐stimulating factor activate STAT3 and STAT5 and promote Pim‐1 and cyclin D3 protein expression in human eosinophils. J Immunol. 2004;173(10):6409‐6417.
375. Siveen KS, Sikka S, Surana R, et al. Targeting the STAT3 signaling pathway in cancer: role of synthetic and natural inhibitors. Biochim Biophys Acta. 2014;1845(2):136‐154.
376. Redell MS, Ruiz MJ, Alonzo TA, Gerbing RB, Tweardy DJ. Stat3 signaling in acute myeloid leukemia: ligand‐dependent and ‐independent activation and induction of apoptosis by a novel small‐molecule Stat3 inhibitor. Blood. 2011;117(21):5701‐5709.
377. Bharadwaj U, Eckols TK, Xu X, et al. Small‐molecule inhibition of STAT3 in radioresistant head and neck squamous cell carcinoma. Oncotarget. 2016;7(18):26307‐26330.
378. Jung KH, Yoo W, Stevenson HL, et al. Multifunctional Effects of a Small‐Molecule STAT3 Inhibitor on NASH and Hepatocellular Carcinoma in Mice. Clin Cancer Res. 2017;23(18):5537‐5546.
379. Akimoto T, Numata F, Tamura M, et al. Abrogation of bronchial eosinophilic inflammation and airway hyperreactivity in signal transducers and activators of transcription (STAT)6‐deficient mice. J Exp Med. 1998;187(9):1537‐1542.
380. Tomkinson A, Kanehiro A, Rabinovitch N, Joetham A, Cieslewicz G, Gelfand EW. The failure of STAT6‐deficient mice to develop airway eosinophilia and airway hyperresponsiveness is overcome by interleukin‐5. Am J Respir Crit Care Med. 1999;160(4):1283‐1291.
381. Miyata S, Matsuyama T, Kodama T, et al. STAT6 deficiency in a mouse model of allergen‐induced airways inflammation abolishes eosinophilia but induces infiltration of CD8+ T cells. Clin Exp Allergy. 1999;29(1):114‐123.
382. Mathew A, MacLean JA, DeHaan E, Tager AM, Green FH, Luster AD. Signal transducer and activator of transcription 6 controls chemokine production and T helper cell type 2 cell trafficking in allergic pulmonary inflammation. J Exp Med. 2001;193(9):1087‐1096.
383. Gleeson D. Acid‐base transport systems in gastrointestinal epithelia. Gut. 1992;33(8):1134‐1145. 384. Shull GE, Miller ML, Schultheis PJ. Lessons from genetically engineered animal models VIII.
Absorption and secretion of ions in the gastrointestinal tract. Am J Physiol Gastrointest Liver Physiol. 2000;278(2):G185‐190.
385. Matsuo K, Palmer JB. Anatomy and physiology of feeding and swallowing: normal and abnormal. Phys Med Rehabil Clin N Am. 2008;19(4):691‐707, vii.
386. E. Diamant N. Pathophysiology of gastroesophageal reflux disease. 2006. 387. Siddique I, Khan I. Regulation of Na/H exchanger‐1 in gastroesophageal reflux disease: possible
interaction of histamine receptor. Dig Dis Sci. 2003;48(9):1832‐1838. 388. Orlando RC. The integrity of the esophageal mucosa. Balance between offensive and defensive
mechanisms. Best Pract Res Clin Gastroenterol. 2010;24(6):873‐882. 389. Dalby K, Nielsen RG, Kruse‐Andersen S, Fenger C, Durup J, Husby S. Gastroesophageal reflux
disease and eosinophilic esophagitis in infants and children. A study of esophageal pH, multiple intraluminal impedance and endoscopic ultrasound. Scand J Gastroenterol. 2010;45(9):1029‐1035.

186
390. Nurko S, Rosen R. Esophageal dysmotility in patients who have eosinophilic esophagitis. Gastrointest Endosc Clin N Am. 2008;18(1):73‐89; ix.
391. Rosen R, Furuta G, Fritz J, Donovan K, Nurko S. Role of acid and nonacid reflux in children with eosinophilic esophagitis compared with patients with gastroesophageal reflux and control patients. J Pediatr Gastroenterol Nutr. 2008;46(5):520‐523.
392. Romero MF, Chen AP, Parker MD, Boron WF. The SLC4 family of bicarbonate (HCO(3)(‐)) transporters. Mol Aspects Med. 2013;34(2‐3):159‐182.
393. Royaux IE, Wall SM, Karniski LP, et al. Pendrin, encoded by the Pendred syndrome gene, resides in the apical region of renal intercalated cells and mediates bicarbonate secretion. Proc Natl Acad Sci U S A. 2001;98(7):4221‐4226.
394. Dossena S, Rodighiero S, Vezzoli V, et al. Functional characterization of wild‐type and mutated pendrin (SLC26A4), the anion transporter involved in Pendred syndrome. J Mol Endocrinol. 2009;43(3):93‐103.
395. Rajan J, Newbury RO, Anilkumar A, Dohil R, Broide DH, Aceves SS. Long‐term assessment of esophageal remodeling in patients with pediatric eosinophilic esophagitis treated with topical corticosteroids. J Allergy Clin Immunol. 2016;137(1):147‐156 e148.
396. He M, Ye W, Wang WJ, Sison ES, Jan YN, Jan LY. Cytoplasmic Cl(‐) couples membrane remodeling to epithelial morphogenesis. Proc Natl Acad Sci U S A. 2017;114(52):E11161‐E11169.
397. Pedersen SF. The Na+/H+ exchanger NHE1 in stress‐induced signal transduction: implications for cell proliferation and cell death. Pflugers Arch. 2006;452(3):249‐259.
398. Casey JR, Grinstein S, Orlowski J. Sensors and regulators of intracellular pH. Nat Rev Mol Cell Biol. 2010;11(1):50‐61.
399. Parfitt JR, Gregor JC, Suskin NG, Jawa HA, Driman DK. Eosinophilic esophagitis in adults: distinguishing features from gastroesophageal reflux disease: a study of 41 patients. Mod Pathol. 2006;19(1):90‐96.
400. Bischof G, Cosentini E, Hamilton G, et al. Effects of extracellular pH on intracellular pH‐regulation and growth in a human colon carcinoma cell‐line. Biochim Biophys Acta. 1996;1282(1):131‐139.
401. Choi SY, Collins CC, Gout PW, Wang Y. Cancer‐generated lactic acid: a regulatory, immunosuppressive metabolite? J Pathol. 2013;230(4):350‐355.
402. Zhang ZX, Gan I, Pavlosky A, Huang X, Fuhrmann B, Jevnikar AM. Intracellular pH Regulates TRAIL‐Induced Apoptosis and Necroptosis in Endothelial Cells. J Immunol Res. 2017;2017:1503960.
403. Lagadic‐Gossmann D, Huc L, Lecureur V. Alterations of intracellular pH homeostasis in apoptosis: origins and roles. Cell Death Differ. 2004;11(9):953‐961.
404. Izumi H, Torigoe T, Ishiguchi H, et al. Cellular pH regulators: potentially promising molecular targets for cancer chemotherapy. Cancer Treat Rev. 2003;29(6):541‐549.
405. Spugnini EP, Sonveaux P, Stock C, et al. Proton channels and exchangers in cancer. Biochim Biophys Acta. 2015;1848(10 Pt B):2715‐2726.
406. Garcia CK, Goldstein JL, Pathak RK, Anderson RG, Brown MS. Molecular characterization of a membrane transporter for lactate, pyruvate, and other monocarboxylates: implications for the Cori cycle. Cell. 1994;76(5):865‐873.
407. Iwanaga T, Takebe K, Kato I, Karaki S, Kuwahara A. Cellular expression of monocarboxylate transporters (MCT) in the digestive tract of the mouse, rat, and humans, with special reference to slc5a8. Biomed Res. 2006;27(5):243‐254.
408. Huhta H, Helminen O, Palomaki S, et al. Intratumoral lactate metabolism in Barrett's esophagus and adenocarcinoma. Oncotarget. 2017;8(14):22894‐22902.
187
409. Zhu J, Wu YN, Zhang W, et al. Monocarboxylate transporter 4 facilitates cell proliferation and migration and is associated with poor prognosis in oral squamous cell carcinoma patients. PLoS One. 2014;9(1):e87904.
410. Takada T, Takata K, Ashihara E. Inhibition of monocarboxylate transporter 1 suppresses the proliferation of glioblastoma stem cells. J Physiol Sci. 2016;66(5):387‐396.
411. Pinheiro C, Longatto‐Filho A, Azevedo‐Silva J, Casal M, Schmitt FC, Baltazar F. Role of monocarboxylate transporters in human cancers: state of the art. J Bioenerg Biomembr. 2012;44(1):127‐139.
412. Ates F, Yuksel ES, Higginbotham T, et al. Mucosal impedance discriminates GERD from non‐GERD conditions. Gastroenterology. 2015;148(2):334‐343.
413. Hsu LW, Ho YC, Chuang EY, et al. Effects of pH on molecular mechanisms of chitosan‐integrin interactions and resulting tight‐junction disruptions. Biomaterials. 2013;34(3):784‐793.
414. Donowitz M, Mohan S, Zhu CX, et al. NHE3 regulatory complexes. J Exp Biol. 2009;212(Pt 11):1638‐1646.
415. Fenton RA, Poulsen SB, de la Mora Chavez S, Soleimani M, Dominguez Rieg JA, Rieg T. Renal tubular NHE3 is required in the maintenance of water and sodium chloride homeostasis. Kidney Int. 2017;92(2):397‐414.
416. Siddique I, Hasan F, Khan I. Suppression of Na+/H+ exchanger isoform‐3 in human inflammatory bowel disease: lack of reversal by 5'‐aminosalicylate treatment. Scand J Gastroenterol. 2009;44(1):56‐64.
417. Janecke AR, Heinz‐Erian P, Yin J, et al. Reduced sodium/proton exchanger NHE3 activity causes congenital sodium diarrhea. Hum Mol Genet. 2015;24(23):6614‐6623.
418. Nemeth ZH, Bogdanovski DA, Barratt‐Stopper P, Paglinco SR, Antonioli L, Rolandelli RH. Crohn's Disease and Ulcerative Colitis Show Unique Cytokine Profiles. Cureus. 2017;9(4):e1177.
419. Shah SA. Aberrant mucosal cytokines: the key to the pathogenesis of IBD? Inflamm Bowel Dis. 1999;5(2):146‐147.
420. Gens JS, Du H, Tackett L, Kong SS, Chu S, Montrose MH. Different ionic conditions prompt NHE2 and NHE3 translocation to the plasma membrane. Biochim Biophys Acta. 2007;1768(5):1023‐1035.
421. Zhao H, Shiue H, Palkon S, et al. Ezrin regulates NHE3 translocation and activation after Na+‐glucose cotransport. Proc Natl Acad Sci U S A. 2004;101(25):9485‐9490.
422. Babich V, Di Sole F. The Na+/H+ Exchanger‐3 (NHE3) Activity Requires Ezrin Binding to Phosphoinositide and Its Phosphorylation. PLoS One. 2015;10(6):e0129306.
423. No YR, He P, Yoo BK, Yun CC. Regulation of NHE3 by lysophosphatidic acid is mediated by phosphorylation of NHE3 by RSK2. Am J Physiol Cell Physiol. 2015;309(1):C14‐21.
424. Panchapakesan U, Pollock C, Saad S. Renal epidermal growth factor receptor: its role in sodium and water homeostasis in diabetic nephropathy. Clin Exp Pharmacol Physiol. 2011;38(2):84‐88.
425. Powell DW, Morris SM, Boyd DD. Water and electrolyte transport by rabbit esophagus. The American journal of physiology. 1975;229(2):438‐443.
426. Myerburg MM, Harvey PR, Heidrich EM, Pilewski JM, Butterworth MB. Acute regulation of the epithelial sodium channel in airway epithelia by proteases and trafficking. Am J Respir Cell Mol Biol. 2010;43(6):712‐719.
427. Kato A, Romero MF. Regulation of electroneutral NaCl absorption by the small intestine. Annu Rev Physiol. 2011;73:261‐281.
428. Orlando RC, Powell DW, Carney CN. Pathophysiology of acute acid injury in rabbit esophageal epithelium. The Journal of clinical investigation. 1981;68(1):286‐293.
429. Long JD, Marten E, Tobey NA, Orlando RC. Effects of luminal hypertonicity on rabbit esophageal epithelium. The American journal of physiology. 1997;273(3 Pt 1):G647‐654.

188
430. Ellison DH, Velazquez H, Wright FS. Mechanisms of sodium, potassium and chloride transport by the renal distal tubule. Miner Electrolyte Metab. 1987;13(6):422‐432.
431. Zhao Y, Gao P, Sun F, et al. Sodium Intake Regulates Glucose Homeostasis through the PPARdelta/Adiponectin‐Mediated SGLT2 Pathway. Cell Metab. 2016;23(4):699‐711.
432. Bove M, Vieth M, Dombrowski F, Ny L, Ruth M, Lundell L. Acid challenge to the human esophageal mucosa: effects on epithelial architecture in health and disease. Dig Dis Sci. 2005;50(8):1488‐1496.
433. Sant'Anna AM, Rolland S, Fournet JC, Yazbeck S, Drouin E. Eosinophilic Esophagitis in Children: Symptoms, Histology and pH Probe Results. Journal of pediatric gastroenterology and nutrition. 2004;39(4):373‐377.
434. Marietta EV, Geno DM, Smyrk TC, et al. Presence of intraepithelial food antigen in patients with active eosinophilic oesophagitis. Aliment Pharmacol Ther. 2017;45(3):427‐433.
435. Carrasco A, Machado RS, Patricio F, Kawakami E. Histological Features of Eosinophilic Esophagitis in Children and Adolescents. Arq Gastroenterol. 2017;54(4):281‐285.
436. Fitzgerald RC, Omary MB, Triadafilopoulos G. Altered sodium‐hydrogen exchange activity is a mechanism for acid‐induced hyperproliferation in Barrett's esophagus. Am J Physiol. 1998;275(1 Pt 1):G47‐55.
437. Bose U, Rauch C, Allegrucci C, Tufarelli C, Khan RN. Evaluation of the role of pH in cancer cell proliferation. Frontiers in Pharmacology.
438. Shirmanova MV, Druzhkova IN, Lukina MM, et al. Chemotherapy with cisplatin: insights into intracellular pH and metabolic landscape of cancer cells in vitro and in vivo. Sci Rep. 2017;7(1):8911.
439. Hu X, Chao M, Wu H. Central role of lactate and proton in cancer cell resistance to glucose deprivation and its clinical translation. Signal Transduct Target Ther. 2017;2:16047.
440. Feng S, Zheng Z, Feng L, et al. Proton pump inhibitor pantoprazole inhibits the proliferation, selfrenewal and chemoresistance of gastric cancer stem cells via the EMT/betacatenin pathways. Oncol Rep. 2016;36(6):3207‐3214.
441. Woo AL, Gildea LA, Tack LM, et al. In vivo evidence for interferon‐gamma‐mediated homeostatic mechanisms in small intestine of the NHE3 Na+/H+ exchanger knockout model of congenital diarrhea. J Biol Chem. 2002;277(50):49036‐49046.
442. Laubitz D, Larmonier CB, Bai A, et al. Colonic gene expression profile in NHE3‐deficient mice: evidence for spontaneous distal colitis. Am J Physiol Gastrointest Liver Physiol. 2008;295(1):G63‐G77.
443. Kiela PR, Laubitz D, Larmonier CB, et al. Changes in mucosal homeostasis predispose NHE3 knockout mice to increased susceptibility to DSS‐induced epithelial injury. Gastroenterology. 2009;137(3):965‐975, 975 e961‐910.
444. Pastorelli L, De Salvo C, Mercado JR, Vecchi M, Pizarro TT. Central role of the gut epithelial barrier in the pathogenesis of chronic intestinal inflammation: lessons learned from animal models and human genetics. Front Immunol. 2013;4:280.
445. Guarino MP, Cicala M, Behar J. Eosinophilic esophagitis: New insights in pathogenesis and therapy. World J Gastrointest Pharmacol Ther. 2016;7(1):66‐77.
446. Schindler C, Levy DE, Decker T. JAK‐STAT signaling: from interferons to cytokines. J Biol Chem. 2007;282(28):20059‐20063.
447. Rawlings JS, Rosler KM, Harrison DA. The JAK/STAT signaling pathway. J Cell Sci. 2004;117(Pt 8):1281‐1283.
448. Ehret GB, Reichenbach P, Schindler U, et al. DNA binding specificity of different STAT proteins. Comparison of in vitro specificity with natural target sites. J Biol Chem. 2001;276(9):6675‐6688.

189
449. Pfitzner E, Kliem S, Baus D, Litterst CM. The role of STATs in inflammation and inflammatory diseases. Curr Pharm Des. 2004;10(23):2839‐2850.
450. Lodige I, Marg A, Wiesner B, Malecova B, Oelgeschlager T, Vinkemeier U. Nuclear export determines the cytokine sensitivity of STAT transcription factors. J Biol Chem. 2005;280(52):43087‐43099.
451. Kaplan MH, Sehra S, Chang HC, O'Malley JT, Mathur AN, Bruns HA. Constitutively active STAT6 predisposes toward a lymphoproliferative disorder. Blood. 2007;110(13):4367‐4369.
452. Hattori H, Rosas LE, Okano M, Durbin JE, Nishizaki K, Satoskar AR. STAT1 is involved in the pathogenesis of murine allergic rhinitis. Am J Rhinol. 2007;21(2):241‐247.
453. Simeone‐Penney MC, Severgnini M, Tu P, et al. Airway epithelial STAT3 is required for allergic inflammation in a murine model of asthma. J Immunol. 2007;178(10):6191‐6199.
454. Chapoval SP, Dasgupta P, Smith EP, et al. STAT6 expression in multiple cell types mediates the cooperative development of allergic airway disease. J Immunol. 2011;186(4):2571‐2583.
455. Kuperman D, Schofield B, Wills‐Karp M, Grusby MJ. Signal transducer and activator of transcription factor 6 (Stat6)‐deficient mice are protected from antigen‐induced airway hyperresponsiveness and mucus production. J Exp Med. 1998;187(6):939‐948.
456. Rosen MJ, Frey MR, Washington MK, et al. STAT6 activation in ulcerative colitis: a new target for prevention of IL‐13‐induced colon epithelial cell dysfunction. Inflamm Bowel Dis. 2011;17(11):2224‐2234.
457. Tak PP, Firestein GS. NF‐kappaB: a key role in inflammatory diseases. J Clin Invest. 2001;107(1):7‐11.
458. Grivennikov SI, Karin M. Dangerous liaisons: STAT3 and NF‐kappaB collaboration and crosstalk in cancer. Cytokine Growth Factor Rev. 2010;21(1):11‐19.
459. Akira S. Functional roles of STAT family proteins: lessons from knockout mice. Stem Cells. 1999;17(3):138‐146.
460. Erlich TH, Yagil Z, Kay G, et al. Mitochondrial STAT3 plays a major role in IgE‐antigen‐mediated mast cell exocytosis. J Allergy Clin Immunol. 2014;134(2):460‐469.
461. Qin S, Wang X, Wu H, et al. Cell‐based phenotypic screening of mast cell degranulation unveils kinetic perturbations of agents targeting phosphorylation. Sci Rep. 2016;6:31320.
462. Stritesky GL, Muthukrishnan R, Sehra S, et al. The transcription factor STAT3 is required for T helper 2 cell development. Immunity. 2011;34(1):39‐49.
463. Garcia‐Hernandez V, Flores‐Maldonado C, Rincon‐Heredia R, et al. EGF regulates claudin‐2 and ‐4 expression through Src and STAT3 in MDCK cells. J Cell Physiol. 2015;230(1):105‐115.
464. Howell MD, Kim BE, Gao P, et al. Cytokine modulation of atopic dermatitis filaggrin skin expression. J Allergy Clin Immunol. 2009;124(3 Suppl 2):R7‐R12.
465. Omori‐Miyake M, Yamashita M, Tsunemi Y, Kawashima M, Yagi J. In vitro assessment of IL‐4‐ or IL‐13‐mediated changes in the structural components of keratinocytes in mice and humans. J Invest Dermatol. 2014;134(5):1342‐1350.
466. Hsueh YJ, Chen HC, Chu WK, et al. STAT3 regulates the proliferation and differentiation of rabbit limbal epithelial cells via a DeltaNp63‐dependent mechanism. Invest Ophthalmol Vis Sci. 2011;52(7):4685‐4693.
467. Bollrath J, Phesse TJ, von Burstin VA, et al. gp130‐mediated Stat3 activation in enterocytes regulates cell survival and cell‐cycle progression during colitis‐associated tumorigenesis. Cancer Cell. 2009;15(2):91‐102.
468. Mahadevappa CP, Venkateshaiah SU, Manohar M, Mishra A. CXCR4/SDF‐1 Axis Promotes EMT Mediated Fibrosis in Eosinophilic Esophagitis (EoE). Journal of Allergy and Clinical Immunology. 2016;137(2):AB228.

190
469. Li B, Huang C. Regulation of EMT by STAT3 in gastrointestinal cancer (Review). Int J Oncol. 2017;50(3):753‐767.
470. Pfeiffer M, Hartmann TN, Leick M, Catusse J, Schmitt‐Graeff A, Burger M. Alternative implication of CXCR4 in JAK2/STAT3 activation in small cell lung cancer. Br J Cancer. 2009;100(12):1949‐1956.
471. Li YY, Li H, Liu ZL, et al. Activation of STAT3‐mediated CXCL12 up‐regulation in the dorsal root ganglion contributes to oxaliplatin‐induced chronic pain. Mol Pain. 2017;13:1744806917747425.
472. Liu X, Xiao Q, Bai X, et al. Activation of STAT3 is involved in malignancy mediated by CXCL12‐CXCR4 signaling in human breast cancer. Oncol Rep. 2014;32(6):2760‐2768.
473. Khaled WT, Read EK, Nicholson SE, et al. The IL‐4/IL‐13/Stat6 signalling pathway promotes luminal mammary epithelial cell development. Development. 2007;134(15):2739‐2750.
474. Zhu J, Guo L, Watson CJ, Hu‐Li J, Paul WE. Stat6 is necessary and sufficient for IL‐4's role in Th2 differentiation and cell expansion. J Immunol. 2001;166(12):7276‐7281.
475. Wang Y, Evans JT, Rodriguez F, et al. A tale of two STAT6 knock out mice in the induction of experimental autoimmune encephalomyelitis. J Neuroimmunol. 2009;206(1‐2):76‐85.
476. Zhang X, Cheng E, Huo X, et al. Omeprazole blocks STAT6 binding to the eotaxin‐3 promoter in eosinophilic esophagitis cells. PLoS One. 2012;7(11):e50037.
477. Goenka S, Kaplan MH. Transcriptional regulation by STAT6. Immunol Res. 2011;50(1):87‐96.