Regular Meeting of the Board of Trustees
187
Please join us on the link at 11:50 a.m. for a pre-meeting performance by the Copperfield School Grade 3 & 4 Choir 1 | 2 Regular Meeting of the Board of Trustees Times included on this agenda are approximate and may vary during the course of the meeting. R-1: Mission | Each student, in keeping with his or her individual abilities and gifts, will complete high school with a foundation of learning necessary to thrive in life, work and continued learning. Conflict of Interest reminder: Trustees must disclose any potential pecuniary interest in any matter before the Board of Trustees, as set forth in the agenda as well as any pecuniary interest in any contract before the Board requiring the Board’s approval and/or ratification. Time Topic Who Policy Ref Attachment 12:00 p.m. 1 | Call to Order, National Anthem and Welcome 2 | Consideration/Approval of Agenda GC-2 10 mins 3 | Opening Remarks D. Stevenson / Board Chair 4 | Awards and Recognitions 15 mins 4.1 Legacy Award Board Chair GC-3 5 | Results Focus 60 mins 5.1 Results 3: Citizenship – Annual Monitoring D. Stevenson R-3 Page 5-1 60 mins 5.2 Results Policies Reasonable Interpretation D. Stevenson R-2,3,4,5 Page 5-27 6 | Operational Expectations 20 mins 6.1 OE-8: Communication With and Support for the Board – Annual Monitoring D. Stevenson OE-1, 9 Page 6-1 Max 20 mins 7 | Public Comment [ PDF ] Requirements as outlined in Board Meeting Procedures GC-3.2 March 6, 2018 12:00 p.m. Multipurpose Room, Education Centre 1221 8 Street SW, Calgary, AB
-
Upload
khangminh22 -
Category
Documents
-
view
3 -
download
0
Transcript of Regular Meeting of the Board of Trustees

Please join us on the link at 11:50 a.m. for a pre-meeting performance by the
Copperfield School Grade 3 & 4 Choir
1 | 2
Regular Meeting of the Board of Trustees
Times included on this agenda are approximate and may vary during the course of the meeting.
R-1: Mission | Each student, in keeping with his or her individual abilities and gifts, will complete high school with a foundation of learning necessary to thrive in life, work and continued learning. Conflict of Interest reminder: Trustees must disclose any potential pecuniary interest in any matter before the Board of Trustees, as set forth in the agenda as well as any pecuniary interest in any contract before the Board requiring the Board’s approval and/or ratification.
Time Topic Who Policy Ref Attachment
12:00 p.m. 1 | Call to Order, National Anthem and Welcome
2 | Consideration/Approval of Agenda GC-2
10 mins 3 | Opening Remarks D. Stevenson /
Board Chair
4 | Awards and Recognitions
15 mins 4.1 Legacy Award Board Chair GC-3
5 | Results Focus
60 mins 5.1 Results 3: Citizenship – Annual Monitoring D. Stevenson R-3 Page 5-1
60 mins 5.2 Results Policies Reasonable Interpretation D. Stevenson R-2,3,4,5 Page 5-27
6 | Operational Expectations
20 mins 6.1 OE-8: Communication With and Support for the Board – Annual Monitoring
D. Stevenson OE-1, 9 Page 6-1
Max 20 mins
7 | Public Comment [ PDF ]
Requirements as outlined in Board Meeting Procedures
GC-3.2
March 6, 2018 12:00 p.m.
Multipurpose Room,
Education Centre
1221 8 Street SW,
Calgary, AB

Public Agenda – March 6, 2018 Page 2
2 | 2
Times included on this agenda are approximate and may vary during the course of the meeting.
Time Topic Who Policy Ref Attachment
8 | Matters Reserved for Board Action Board GC-3
30 mins 8.1 Three-Year School Capital Plan 2019-2022 (THAT the Board approves the Three-Year School Capital Plan as submitted and refers the plan to Alberta Education)
D. Breton OE-7, 9 Page 8-1
9 | Consent Agenda Board GC-2.6
9.1 Items Provided for Board Information OE-8
9.1.1 Correspondence Page 9-1
10 | In-Camera Session
3:00 p.m. 11 | Adjournment
Debrief Trustees GC-2.3
Notice | This public Board meeting will be recorded & posted online. Media may also attend these meetings. You may appear in media coverage. Archives will be available for a period of two years. Information is collected under the authority of the School Act and the Freedom of Information and Protection of Privacy Act section 33(c) for the purpose of informing the public. For questions or concerns, please contact: Office of the Corporate Secretary at [email protected].

Results 3: Citizenship
Page 1 | 26
CHIEF SUPERINTENDENT CERTIFICATION
With respect to Results 3: Citizenship, the Chief Superintendent certifies that the following information is accurate and complete, and that the organization is:
☒ Making reasonable progress toward achieving the desired results.
☐ Making reasonable progress with exception.
☐ Not making reasonable progress.
Signed: Date: Feb. 20, 2018
David Stevenson, Chief Superintendent
BOARD OF TRUSTEES ACTION
With respect to Results 3: Citizenship, the Board of Trustees:
☐ Finds the organization to be making reasonable progress.
☐ Finds the organization to be making reasonable progress with exception.
☐ Finds the organization not to be making reasonable progress.
Summary statement/motion of the Board of Trustees:
Signed: Date:
Monitoring report for the school year 2016-17 Report date: March 6, 2018
5-1
Results 3: Citizenship
Page 2 | 26
Chair, Board of Trustees
Results 3: Each student will be a responsible citizen.
Introduction |
Results 3: Citizenship establishes the Board of Trustees’ values and expectations for the Calgary Board of Education’s work in contributing to the development of informed and engaged community members.
The Chief Superintendent’s Reasonable Interpretation Results 3: Citizenship was most recently approved on October 13, 2015. The Board of Trustees last monitored Results 3: Citizenship on January 10, 2017.
The report presented today represents organizational data available since the last monitoring report, for the 2016-17 school year. This report provides the Board of Trustees with three types of information:
Report Card data There are four indicators that use report card data. One of the indicators uses K-12 Social Studies report card results and the other three use K-9 Citizenship report card results.
Student report cards illustrate that over 94.9% of students enrolled in the CBE experience success as active, informed and positively contributing young citizens. Report card data specific to Citizenship from K-9 report cards (Percentage of students in kindergarten to grade 9 reported to exercise their democratic rights and responsibilities within the learning community, to demonstrate respect and appreciation for diversity, and to work and collaborate effectively with others) remain at very high levels of achievement. Chi-squared comparisons of the data for these measures are not possible due to the varying percentage of students for whom identified special needs influence the overall results.
Student Survey data The data for these indicators are gathered from students and reflect their own assessment of their skills and success.
Survey data for policy section 3.4, which speaks to students being responsible
5-2
Page 3 | 26
stewards of the environment, has been gathered from students in grades 4, 7, 10 and 12.
Other survey measures expand on available report card data and are gathered only from high school students. In the past, grade 12 students provided data for these indicators; the 2016-17 school year was the second year where data for these indicators were collected from both grade 10 and 12 students. The second indicator for policy section 3.5, which speaks to high school students working and communicating effectively with others, was expanded to gather responses from grade 10 students for the first time in 2016-17.
In 2016-17, student survey results in eight of the nine indicators range from 85.4% to 94.5%. As the majority of these indicators have only two years of data no statistical analysis has been provided. The two survey results with multiple years of data have been analyzed as statistically being Improved Significantly (policy section 3.4 indicator 1) and Improved (policy section 3.4 indicator 2) in relation to their previous three-year averages. The ninth indicator, with data on student volunteering for policy section 3.1, is best understood in relation to a national comparative data set, with CBE student results well above the national rate of volunteering for youth ages 15-24.
Student Stories In addition to the monitoring data included in this report, student stories have been added to provide examples of the ways in which individual students have experienced Citizenship. These examples are in the students’ own words and can be found in Attachment I.
Monitoring information within this report informs the Board of Trustees of the success of Calgary Board of Education students in understanding and acting within the rights and obligations of community membership in and through their learning program.
The thirteen Board-approved indicators for monitoring Results 3: Citizenship together demonstrate that the organization is making reasonable progress towards achieving the desired results.
The strong results shown by CBE students within the policy sections of Results 3: Citizenship speak to the welcoming, inclusive, open and participatory learning environments of CBE schools and to the ability of students to attend to democratic and civil values on local and global scales.
5-3

Page 4 | 26
Monitoring Information |
Evidence of Reasonable Progress |
Students will:
3.1 Participate in developing and maintaining our Canadian civil, democratic society.
Board-approved Interpretation |
The Chief Superintendent interprets the Board of Trustees’ values in this statement to mean that students will be involved members of their communities.
The Chief Superintendent interprets participate in developing and maintaining our Canadian
civil, democratic society to mean that students will exercise the democratic rights and responsibilities afforded to them by the community, including actions that help to create positive change.
Specifically, this means that students will:
act on behalf of themselves, others and the community; contribute to events of common concern; and help groups work together.
5-4

Page 5 | 26
Board-approved Indicators and 2016-17 Results |
1. Percentage of students in kindergarten to grade 9 reported to exercise their democratic
rights and responsibilities within the learning community; as measured by student report cards.
Exercises democratic rights and responsibilities within the learning community1.
2010-11
2011-12
2012-13
2013-14
2014-15
2015-16
2016-17
Exemplary Strengths 24.4 26.0 27.7 27.0 27.9 32.5 33.7
Evident Strengths 55.2 58.8 56.8 58.6 56.1 54.1 52.3
Emerging Strengths 17.0 13.1 13.5 12.8 14.3 12.1 12.4
Network of Support Required 2.9 1.6 1.7 1.4 1.5 1.2 1.3
Individual Program Plan 0.4 0.4 0.3 0.2 0.2 0.2 0.3
Overall levels of success 96.6 97.9 98.0 98.4 98.3 98.7 98.4
1 The general indicators for this stem are: contributes to events of common concern; advocates for self, others and the common good; takes responsibility and action to help the group work smoothly; and adheres to community expectations and personal convictions in conducting and representing
learning.
5-5

Page 6 | 26
2. Percentage of high school students who report that they exercise their democratic rights and responsibilities within the learning community; as measured by student surveys.
I exercise my democratic rights and responsibilities within the learning
community. (Grades 10 & 12 combined)
2015-16
2016-17
Strongly Agree 28.7 28.9
Agree 55.4 56.4
Disagree 12.8 11.4
Strongly Disagree 3.0 3.2
Overall agreement 84.1 85.4
Overall Agreement by Grade
2015-
16 2016-
17 Grade 10 80.9 82.8
Grade 12 87.4 88.0
5-6

Page 7 | 26
3. Percentage of high school students who report they have participated in community service, school service or volunteer work to help others: as measured by student surveys.
I participate in community service, school service or volunteer work to help
others. (Grades 10 & 12 combined)
2015-16
2016-17
Strongly Agree 22.3 21.6
Agree 46.6 45.4
Disagree 25.6 26.3
Strongly Disagree 5.5 6.7
Overall agreement 68.9 67.0
Overall Agreement by Grade
2015-
16 2016-
17 Grade 10 67.4 65.0
Grade 12 70.3 69.0
The participation rate for high school students in the CBE in service and volunteer work to help others is a full 10.7 percentage points above Alberta youth’s (age 15-24) rate of service/volunteer2 of 56.3%3.
2 Turcotte, M. (2015). Spotlight on Canadians: Results from the General Social Survey of Volunteering and Charitable Giving in Canada. Statistics Canada. Retrieved January 26, 2018 from http://www.statcan.gc.ca/pub/89-652-x/89-652-x2015001-eng.pdf 3 Statistics Canada (2013). Volunteer rate and distribution of volunteer hours, by age group, Canada,
provinces. Retrieved January 26, 2018 from http://www5.statcan.gc.ca/cansim/a26?lang=eng&id=1190009
5-7

Page 8 | 26
3.2 Understand the rights and responsibilities of citizenship in local, national and international contexts.
Board-approved Interpretation |
The Chief Superintendent interprets the Board of Trustees’ values in this statement to mean that students will be informed about and able to contribute to their immediate communities and the larger world.
The Chief Superintendent interprets rights and responsibilities of citizenship to mean the freedoms and obligations of all Canadian citizens.4
The Chief Superintendent interprets local, national and international contexts to include home, neighbourhood and school groups as well as Calgary, Alberta, Canada and the world.
Board-approved Indicators and 2016-17 Results |
1. Percentage of students successfully demonstrating understanding of Social Studies issues, information and ideas; as measured by school report cards.
Students demonstrating understanding of Social Studies issues, information and ideas.
2011-12
2012-13
2013-14
2014-15
2015-16
2016-17
92.4 94.2 93.0 94.4 95.1 94.9
Based on a comparison of the 2016-17 results to the Previous 3-Year Average and using Alberta Education’s Accountability Pillar chi-square range for the Improvement Measure evaluation, the results above would be considered statically Improved Significantly.
4 Government of Canada; Immigration, Refugees and Citizenship Department. (2016). Discover Canada: The rights and responsibilities of citizenship. Retrieved January 26, 2018 from https://www.canada.ca/en/immigration-refugees-citizenship/corporate/publications-manuals/discover-canada/read-online/rights-resonsibilities-citizenship.html
5-8

Page 9 | 26
2. Percentage of students who report understanding what it means to be a responsible citizen in their local and national communities; as measured by student surveys.
I understand what it means to be a responsible citizen in my local and
national communities. (Grades 10 & 12 combined)
2015-16
2016-17
Strongly Agree 35.9 36.7
Agree 58.0 56.6
Disagree 4.1 4.4
Strongly Disagree 2.0 2.2
Overall agreement 93.9 93.4
Overall Agreement by Grade
2015-
16 2016-
17 Grade 10 93.9 93.5
Grade 12 93.9 93.2
5-9

Page 10 | 26
3. Percentage of students who report understanding what it means to be a responsible global citizen; as measured by student surveys.
I understand what it means to be a responsible global citizen. (Grades 10 & 12 combined)
2015-16
2016-17
Strongly Agree 36.9 37.6
Agree 56.3 55.1
Disagree 4.7 4.9
Strongly Disagree 2.1 2.3
Overall agreement 93.2 92.7
Overall Agreement by Grade
2015-
16 2016-
17 Grade 10 93.4 93.1
Grade 12 93.0 92.3
5-10

Page 11 | 26
3.3 Respect and embrace diversity
Board-approved Interpretation |
The Chief Superintendent interprets the Board of Trustees’ values in this statement to mean that students appreciate the cultural pluralism and individual equality that are foundational to Canadian society.
The Chief Superintendent interprets respect and embrace to mean to see as equal, learn from and treat with dignity.
The Chief Superintendent interprets diversity to mean the full range of uniqueness within humanity.
5-11

Page 12 | 26
Board-approved Indicators and 2016-17 Results |
1. Percentage of students in kindergarten to grade 9 reported to demonstrate respect and appreciation for diversity; as measured by student report cards.
Demonstrates respect and appreciation for diversity5.
2010-11
2011-12
2012-13
2013-14
2014-15
2015-16
2016-17
Exemplary Strengths 28.2 30.9 31.7 31.9 32.6 38.6 40.2
Evident Strengths 56.4 57.7 56.8 57.7 55.8 52.6 50.7
Emerging Strengths 13.6 9.8 10.1 9.2 10.5 8.0 8.0
Network of Support Required 1.5 1.2 1.2 1.0 1.0 0.7 0.9
Individual Program Plan 0.4 0.4 0.3 0.2 0.1 0.1 0.2
Overall levels of success 98.2 98.4 98.6 98.8 98.9 99.2 98.9
5 The general indicators for this stem are: shows concern for the dignity and equality of all; demonstrates appreciation for individual and cultural differences; seeks to learn about and from unfamiliar ways of thinking and living; and uses diverse viewpoints in a learning context.
5-12

Page 13 | 26
2. Percentage of high school students who report they value other cultures; as measured by student surveys.
I value other cultures. (Grades 10 & 12 combined)
2015-16
2016-17
Strongly Agree 52.2 54.6
Agree 42.3 39.5
Disagree 2.9 3.1
Strongly Disagree 2.7 2.8
Overall agreement 94.5 94.1
Overall Agreement by Grade
2015-
16 2016-
17 Grade 10 95.6 94.9
Grade 12 93.3 93.4
5-13

Page 14 | 26
3. Percentage of high school students who report they appreciate and learn from the perspectives of others; as measured by student surveys.
I appreciate and learn from the perspective of others.
(Grades 10 & 12 combined)
2015-16
2016-17
Strongly Agree 45.8 46.1
Agree 48.8 48.4
Disagree 3.4 3.4
Strongly Disagree 2.0 2.2
Overall agreement 94.6 94.5
Overall Agreement by Grade
2015-
16 2016-
17 Grade 10 95.2 94.5
Grade 12 94.0 94.5
5-14

Page 15 | 26
3.4 Be responsible stewards of the environment by contributing to its quality and sustainability.
Board-approved Interpretation |
The Chief Superintendent interprets the Board of Trustees’ values in this statement to mean that students will care for the diversity and health of the land, its ecosystems and climate by minimizing the impact of their activities.
The Chief Superintendent interprets responsible stewards to mean that students will act to protect resources and minimize waste.
The Chief Superintendent interprets environment to mean the surroundings and conditions that affect the development of all living things.
The Chief Superintendent interprets quality and sustainability to mean the ability of the environment to support the needs of diverse life forms now and into the future.
5-15

Page 16 | 26
Board-approved Indicators and 2016-17 Results |
1. Percentage of students who report they take action to protect the environment; as measured by student surveys.
I take action to protect the environment.
2010-11
2011-12
2012-13
2013-14
2014-15
2015-16
2016-17
Strongly Agree 27.2 29.1 32.5 31.0 31.2 37.4 34.9
Agree 56.6 54.3 56.9 58.4 58.3 53.7 56.3
Disagree 11.7 11.7 7.3 7.2 7.5 6.8 6.8
Strongly Disagree 4.5 4.9 3.3 3.4 3.0 2.1 2.0
Overall agreement 83.8 83.4 89.4 89.4 89.5 91.1 91.2
Overall Agreement by Grade
2015-
16 2016-
17 Grade 4 97.3 97.4
Grade 7 91.2 91.4
Grade 10 86.2 87.4
Grade 12 89.5 88.5
Note | In 2015-16 the source of the survey data changed to the CBE Results Survey.
5-16

Page 17 | 26
2. Percentage of students who report they use resources responsibly; as measured by
student surveys.
I use resources responsibly.
2011-12
2012-13
2013-14
2014-15
2015-16
2016-17
Strongly Agree 30.8 45.3 41.1 41.2 41.9 41.3
Agree 58.2 47.9 51.4 52.4 52.4 52.8
Disagree 8.0 3.6 4.2 3.3 4.2 4.3
Strongly Disagree 3.1 3.2 3.3 3.1 1.5 1.6
Overall agreement 89.0 93.2 92.5 93.6 94.3 94.2
Overall Agreement by Grade
2015-
16 2016-
17 Grade 4 97.6 97.4
Grade 7 96.0 95.9
Grade 10 93.1 92.3
Grade 12 90.3 91.0
Note | In 2015-16 the source of the survey data changed to the CBE Results Survey.
5-17

Page 18 | 26
3.5 Be able to lead and follow as appropriate, and to develop and maintain positive relationships with other individuals and groups in order to manage conflict and to reach consensus in the pursuit of common goals.
Board-approved Interpretation |
The Chief Superintendent interprets the Board of Trustees’ values in this statement to mean that students will work well with others to advance individual and group learning.
The Chief Superintendent interprets lead and follow to mean that students take multiple roles in contributing to the work of a group.
The Chief Superintendent interprets develop and maintain positive relationships to mean that students communicate and interact effectively with others.
The Chief Superintendent interprets manage conflict and reach consensus to mean that students communicate and problem solve together for their shared benefit.
5-18

Page 19 | 26
Board-approved Indicators and 2016-17 Results |
1. Percentage of students in kindergarten to grade 9 reported to work and collaborate effectively with others; as measured by student report cards.
Works and collaborates effectively with others6.
2010-11
2011-12
2012-13
2013-14
2014-15
2015-16
2016-17
Exemplary Strengths 24.1 24.2 24.9 25.5 27.7 31.8 32.5
Evident Strengths 52.2 56.1 55.6 54.5 52.1 49.8 48.5
Emerging Strengths 20.3 16.6 15.3 16.2 17.3 16.0 16.2
Network of Support Required 3.0 1.7 2.2 2.3 2.5 2.0 2.3
Individual Program Plan 0.5 1.5 2.0 1.5 0.4 0.5 0.6
Overall levels of success 96.6 96.9 95.8 96.2 97.1 97.6 97.2
6 The general indicators for this stem are: assumes leadership or contributing roles to advance learning and community goals; communicates with others to build understanding; and works with others to manage conflict and reach consensus.
5-19
Page 20 | 26
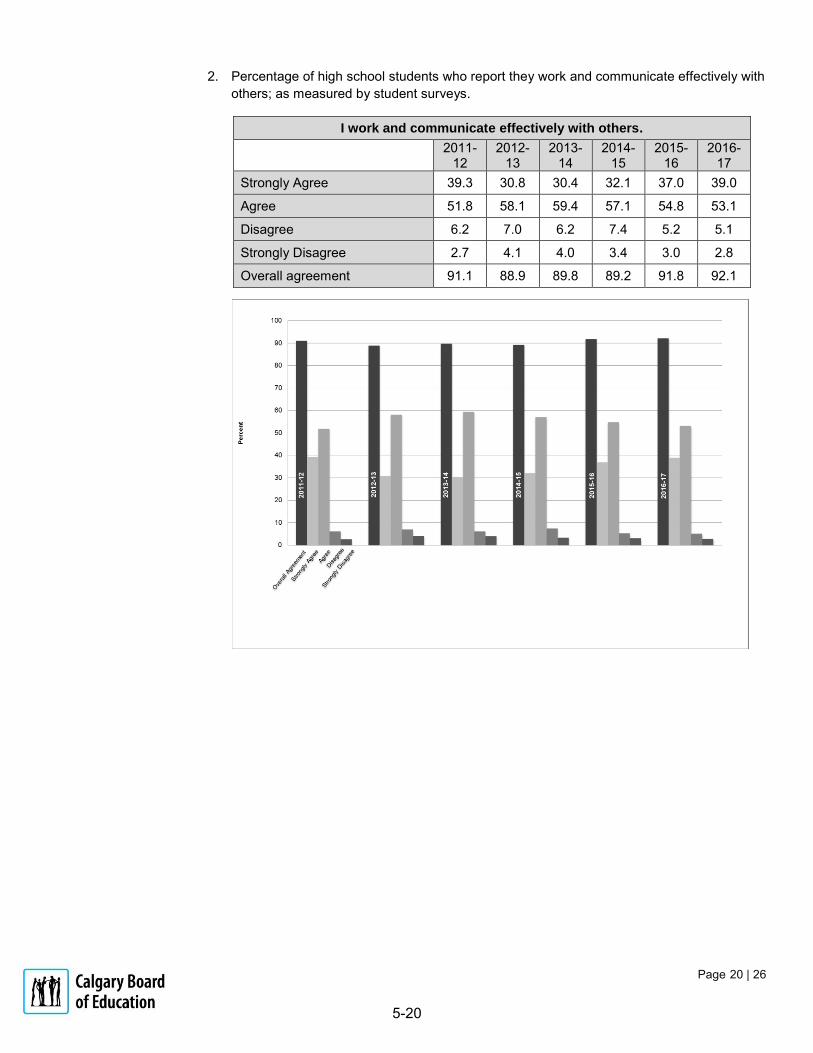
2. Percentage of high school students who report they work and communicate effectively with others; as measured by student surveys.
I work and communicate effectively with others.
2011-12
2012-13
2013-14
2014-15
2015-16
2016-17
Strongly Agree 39.3 30.8 30.4 32.1 37.0 39.0
Agree 51.8 58.1 59.4 57.1 54.8 53.1
Disagree 6.2 7.0 6.2 7.4 5.2 5.1
Strongly Disagree 2.7 4.1 4.0 3.4 3.0 2.8
Overall agreement 91.1 88.9 89.8 89.2 91.8 92.1
5-20

Page 21 | 26
The previous table and graph refer to data gathered from grade 12 students. In 2016-17, the data set for this indicator was expanded to include grade 10 as well as grade 12 students, establishing a new baseline.
I work and communicate effectively with others.
(Grades 10 & 12 combined)
2016-17
Strongly Agree 36.9
Agree 54.7
Disagree 5.9
Strongly Disagree 2.5
Overall agreement 91.6
Overall by Grade
2016-
17 Grade 10 91.2
Grade 12 92.1
5-21

Page 22 | 26
Targets |
Targets are identified where the Chief Superintendent sees an opportunity for growth or where the Board of Trustees identifies an area of concern or exception.
Chief Superintendent Targets
3.1 Indicator 2: Percentage of high school students who report that they exercise their democratic rights and responsibilities within the learning community; as measured by student surveys
Target for 2016-17 (combined grade 10 and 12 student data): 85%
This target was met
Target for 2017-18: It is expected that there will be a new data set for student survey measures in 2017-18 therefore no new targets have been set.
Board of Trustees Targets
None
ATTACHMENTS
Attachment I: Student-Contributed Examples of Personal Development in Action
GLOSSARY – Developed by the Board of Trustees
Board: Board of Trustees
Monitoring Report: The Board wants to know that its values have driven organizational performance. The Chief Superintendent will present to the Board, for its evaluation, a report that summarized how either compliance has been achieved on Operational Expectations or how reasonable progress has been made in Results. Each monitoring report requires: a re-statement of the full policy, by section; a reasonable interpretation of each section; data sufficient to prove compliance or reasonable progress; and a signed certification from the Chief Superintendent of the status.
Reasonable Interpretation: Once the Board has stated its values in policy, the Chief Superintendent is required to “interpret” policy values, saying back to the Board, “here is what the Board’s value means to me.” The Board then judges whether this interpretation is reasonable. In other words, does the Chief Superintendent “get it?” This reasonable interpretation is the first step required in monitoring compl iance on Operational Expectations and monitoring reasonable progress on Results.
Results: These are our statements of outcomes for each student in our district. The Results policies become the Chief Superintendent’s and the organization’s performance targets and form the basis for judging organization and Chief Superintendent performance.
5-22

Student-contributed examples of
Citizenship in action
Page 23 | 26
When speaking about citizenship, I believe it’s vital to consider the topic of a diverse classroom. In the past two years, social justice has been a passion of mine inside and outside of the classroom. Understanding the necessity of not only diversity, but inclusivity in education is incredibly important in order for kids to feel safe and welcomed in their classrooms. One thing I’m incredibly proud of is [my school’s] dedication to reconciliation education. As an Indigenous student, I strongly believe in the calls to action outlined by the Truth and Reconciliation Commission. Beyond that, I find that conversations about reconciliation often lead to further discussion of culture and hardship, conversations that can pave the way for a more inclusive classroom. I definitely feel that this is the case in my classes, and it’s been a very welcome change. In terms of making changes in my community, I’ve been lucky enough to be involved in the Common Ground Dinner Series (Aisinna’Kiiks), the CBE-facilitated take on a similar event hosted last year by a group called Making Treaty 7. It consisted of three dinners over the course of three months, and its purpose has been to prompt conversations about reconciliation and to bridge the ever-present gap between Indigenous and non-Indigenous communities.
Leadership has put me in the role of constantly working in groups with people of
different strengths and weaknesses. It has allowed me to adapt to my surroundings a lot easier and connect to those who have unconventional – or even conflicting - ways of thinking. I find that achieving true collaboration between all people really isn’t difficult if we just continue to be open-minded towards each other.
Student leadership this year has put me into the role of being an actual leader during meetings and school events. I am grateful for this push that has made me take more control of guiding effective group work and collaboration. I also have needed to take into account making sure that the other members of my group are doing their part so we could achieve true collaboration. Whenever someone has a new idea, I would always listen to them and do my best to let that idea be heard by others in my group. I observed that by taking the time to integrate what different students want into our school events, there has been a growth in student participation within the school.
The GATE learning classroom was always centered on students supporting one another. This experience taught me the value of inclusion and the importance of showing respect to every person. I have found that I continue to interact with people of different backgrounds, abilities and context, in and beyond the GATE program. My experience has been made richer simply by recognizing the importance of diversity and inclusion.
I had the chance to speak to some youth on testing self-care products on animals. I chose to look in-depth of this topic during my eighth grade science class. Working with a group of close friends and interpreting key ideas in order to promote the importance behind our topic was a skill that I’m glad I developed. I think that as a group of young leaders we all learned to manage conflict when we came across any and reached a consensus.
5-23

Page 24 | 26
In grade nine, I was approached to join the council of my school’s anti-bullying/(later added) LGBTQ committee. I was beyond ecstatic to join, considering I had never been prompted by anyone to join any sort of leadership position at that point in time. I would like to think that the group at least somewhat positively impacted other students; and if it was only few students that felt safer coming to school, then that was enough. We were able to arrange for speakers like Travis Price (who started “pink shirt day”), as well as to initiate several fundraisers and school-wide activities, and it was more or less rewarding to put time and effort into something that had the intent to help other people, and did lead to me more actively seeking out similar leadership opportunities, as opposed to waiting to possibly be invited to them.
An example of my volunteering efforts includes getting involved within the environmental issues facing not only Calgary, but Canada as a nation. I was able to join the Alberta Distance Learning Centre’s Climate Action group, immersing me into even more nation-wide probing environmental issues. Meetings would be held once a week and high school students that were a part of this group across Alberta would discuss the environmental issues that impacted Canadians day-to-day, and solutions to overcome this. After long discussions and planning, we would then create a presentation to convey our messages from Alberta to the many high schools across Canada that were part of this venture. I was then selected to fly to Ottawa and write a proposal to the Canadian government in order to improve upon the conditions of climate change. This proposal was then to be presented to the Minister of Environment herself, Catherine McKenna.
As a diverse school, people are responsible and respectful to groups other than
themselves even when they may not agree with others’ viewpoints. However, when sensitive topics occur, people try to understand one another's point of view and not pass judgment. Because I am an international student from China, sometimes my point of view is different from others’. Due to my unique experience in China, the Taiwan issue, other land or sea border issues and human rights are sensitive topics for me. Because of the diverse learning environment, I meet people who have a different opinions from me. By putting myself into circumstances of others, I avoid conflict with others. After understanding their point of view, and getting to know his/her past, then the perspective of the person becomes reasonable to me. Some my friends right now have different opinion from mine. As a group, we listen and strive to understand each other.
Soon after starting at my current school, I was invited to join a drumming circle. Because I hadn’t made any friends yet, I figured that it would be a good way to put myself out there and become more social at school. Although I had been in the band program at my junior high, the drum circle was unlike anything I had ever experienced. It quickly became apparent how essential communication was in that type of setting. It was beautiful watching a diverse group of relative strangers come together and make something completely new. That group taught me a lot about nonverbal communication, trust, and true collaboration despite our differences.
Being a member of Calgary’s LGBTQ+ community, as well as not being able-bodied,
has made diversity extremely important to me for many years of my life. Since starting at my current school, my eyes have really been opened to a great deal of diverse cultures and faiths, as well as people with varying abilities. The staff at my school put a lot of effort into adjusting school activities so that all students can participate. I can’t imagine living in a country where you had to hide who you are in order to survive, and I know that although Canada has its flaws and has a ways to go regarding the treatment of people of colour and nonbinary people, I am lucky to live in this country.
5-24

Page 25 | 26
An activity that I do on a weekly basis is reading to children at a local elementary school. The connection that was created by the schools is beneficial for my citizenship growth, and my experience with those who need extra help. Not only does this improve my ability to work in a group and collaborate with others, but I also experience diversity in this setting. This elementary school is very diverse, so I get to experience diversity and I have had the opportunity to participate in some of the cultural events put on by the school. I have learned so much through this time with elementary students, one of the biggest being the ability to work with children, and another being to work in groups. I have become passionate about reading with those who may need it most, and this event helped me expand and volunteer more often in other events too, strengthening my sense of community.
The school I attended had a large and diverse student body, with many different
ethnicities and cultural backgrounds. Around the end of December, before Winter Break, each class would host a potluck, where we were asked to bring in a dish from each of our unique heritages. I noticed that at every potluck, there was a wide range of cultural foods, including East Asian, African, North American and European options. It was always a delightful experience to be able to gain a greater understanding of individual cultures through their meals, and through conversation.
This school’s music teacher also helped to exhibit why diversity is such an important
aspect of Canadian identity. She would teach us world music, introduce us to traditional aspects of many cultures she had learned about in her travels and would host a yearly Chinese new-year celebration that including traditional lion dancing. Through participation in the world music club, lion dancing, as well as conversations with her and my peers, I began to feel a part of something greater and slowly came to understand how precious the diversity within Canada is. Even now, I can see this value being exhibited in the CBE through various exchange programs, language options, cultural clubs and cultural appreciation days. I am grateful for this exposure, as it has motivated me to take part in other multicultural activities and increased my awareness on many issues within our society, such as the discrimination Indigenous peoples face. The experiences that I have been a part of, and continue to be included into, have taught me that each unique culture and heritage has contributed something to the tapestry that is Canada and that this value is one of the greatest unifying factors between individuals.
Since grade 9, I have been very involved in my school's leadership programs. Within those programs I learned that volunteering and having a voice can really make a difference in someone's life. At the beginning of the 2017-18 school year, I volunteered my time to speak in front of the grade 10s. I shared my experiences with them and gave them some advice on how to be successful in their first year of high school. Since the first day of school, I have had grade 10s come up to me and ask if I had anymore advice. Teachers walked up to me and told me that their students have talked to them about my speech and how it impacted the way that the students will experience high school.
Through the leadership opportunities represented to me throughout my CBE career, it has inspired me to take leadership roles in my community and become a better citizen. Upon joining the CBE in grade six, I got the opportunity to participate in things that contributed to my school and my community. I decided to let my confidence out and join class government in grade six. We led discussions. I enjoyed governing and contributing to how my class functioned so much, that I wanted to continue to be a leader and gain experience elsewhere. From there, I was inspired to contribute to my community, and I started volunteering as a camp counsellor for the city of Calgary. My camp counsellor experience was a great opportunity, as I got to help plan activities and really help all the camp kids which I loved to do. After realizing my passion for participation, I went on to join leadership clubs and student councils, which helped do things like, plan and help out with school events and also organize fundraisers for charities.
5-25

Page 26 | 26
We were doing a science project last year in a group six. I decided to take the lead and
created an outline for the project and gave each group member one topic. I was aware of not to be too demanding because that was not the purpose of leading a group. So I took each group member’s opinion into consideration on how we should separate the work. Everyone started to be more talkative and started to express their opinions more and more. Through this process we got to know each other better, and another group member started to lead. I was very happy that she could take the lead because I know that she was capable of leading us since she knew the topic a lot better. It is not easy to strike a balance between following and leading, but it is very important as well because in that case we were able to be more efficient and to produce a higher quality of work.
An example that demonstrates my citizenship was when I had a new student in my grade attend my school and I felt that I could help her out by introducing her to our school community through a new welcoming friendship. I helped her feel welcome to a community she did not know too much about, and she gave me the opportunity to connect with new people outside of my circle of friends. Now she finds it very easy to voice her opinion with new people within the school.
We are often told in school that teamwork is essential to a good project. That was especially evident for me when I was required to work on a focus panel with a group of highly skilled and diverse students. The goal and objectives were to collectively find an alternative solution to a common problem. The task involved considered national contexts, environmental concerns and a reasonable plan of budget for all local citizens. The main objective for this project was to develop a proposal in which all members of society would function at utmost efficiency. Sitting among these students possessing a variety of different skill, I was in particular tasked with organizing each individual task and developing a speech that spoke for all these students. The collaboration among each and every student was astonishingly cohesive despite all our differences. My speech was written and delivered all within a few hours. This level of collaboration allowed for a strong and developed speech that won us “best overall project proposal” award.
5-26

Results Policies: Reasonable Interpretations
Page 1 | 20
Date March 6, 2018
Meeting Type Regular Meeting, Public Agenda
To Board of Trustees
From David Stevenson, Chief Superintendent of Schools
Purpose Decision
Originator Ronna Mosher, Acting Superintendent, Learning
Governance Policy
Reference
Results 2: Academic Success Results 3: Citizenship Results 4: Personal Development Results 5: Character
Resource Persons Elizabeth Wood, System Principal, Research & Strategy Erin Faught, Statistician, Research & Strategy
5-27

Page 2 | 20
1 | Recommendation
As part of the Chief Superintendent’s Reasonable Interpretations of the Results Policies, it is recommended:
THAT the Board of Trustees approves the new student survey indicators for Results 2: Academic Success.
THAT the Board of Trustees approves the new student survey indicators for Results 3: Citizenship.
THAT the Board of Trustees approves the new student survey indicators for Results 4: Personal Development.
THAT the Board of Trustees approves the new student survey indicators for Results 5: Character.
2 | Issue
A redesign of the Calgary Board of Education’s (CBE) student survey is being undertaken to widen the scope of information available to the Board for monitoring of the Results policies. The Board’s approval of new survey measures as part of the Chief Superintendent’s Reasonable Interpretation for each of Results 2, 3, 4 and 5 is required to support the Board’s continued annual monitoring of these policies.
3 | Background
The Chief Superintendent’s Reasonable Interpretations for each of the Board’s Results Policies currently includes indicators for which data is gathered from a survey of CBE students in grades 4, 7, 10 and 12. This information is gathered annually, in keeping with the Board’s annual monitoring cycle for the Results. A redesign of the CBE student survey has emerged from needs identified by students, school personnel, administration, and Trustees. In the Modified Monitoring of Results Survey
Measures Report on June 20, 2017 and the Student Survey Project Plan Report on September 19, 2017 to the Board of Trustees, information was provided regarding the reasons for the development of a new CBE student survey. Information was also provided about changes in the survey’s administration. It is included again here for the Board’s convenience. The administration for Results questions within the new CBE Student Survey will see questions related to Results 2: Academic Success administered each year and questions related to Results 3: Citizenship, Results 4: Personal Development and Results 5: Character administered in full once every three years and to a more minor extent during the other two years of the three-year cycle.
5-28

Page 3 | 20
This rotating, three-year cycle would begin with the 2017-18 school year, as represented in the table below. The administration cycle is modeled on the way that the Organization for Economic Co-operation and Development (OECD) administers The Programme for International Student Assessment (PISA), with a major and minor focus rotated through each testing cycle.
2017-18 2018-19 2019-20
Results 2 all survey questions administered each year
Results 3 major focus minor focus minor focus
Results 4 minor focus major focus minor focus
Results 5 minor focus minor focus major focus The new survey will be administered to students in grades 5, 6, 8, 9, 11 and 12. Students in grades 4, 7 and 10 are expected to continue to participate in Alberta Education’s Accountability Pillar Survey. A Glossary of Terms is appended to this report if clarification is required for specific terms (Appendix I).
4 | Analysis
The new CBE Student Survey serves more than one purpose. It provides a means of gathering data from students on key CBE strategies within the Three-Year Education Plans, on topics of concern in individual schools and as part of Results monitoring. Information in this report will focus on the survey from the perspective of Results monitoring. One of the criteria for the new CBE Student Survey was for it to be statistically valid and reliable. As a result, a survey design and validation study was undertaken. The following sections will describe the processes involved in the design of the survey and the completion of the validation study.
Phase 1: Pre-Pilot
Literature Review
A literature review was performed on the topics of the Results policy sections to determine if publicly-available, validated tools could be used or adapted for the new CBE Student Survey. A review of survey tools focusing on the domains of interest for the new CBE Student Survey was completed. Survey instruments that examine topics related to the policy sections of the Board of Trustees’ Results policies typically do so from a broad community lens or from the perspective of experiences offered at home. They are less likely to examine the topics of Citizenship, Personal Development or Character as outcomes of an educational program. Given the specific context of the Board of Trustees’ policies and the objective of evaluating the effectiveness of the CBE through the lens of student outcomes, the design of the new CBE Student Survey more often required an adaptation of questions used outside of the educational context or the development of original questions than the direct use of questions from other survey instruments.
5-29

Page 4 | 20
Where possible, survey questions were adapted from or informed by widely-used, validated tools, including:
PISA Global Competency Questionnaire1; Child and Youth Resiliency Measure (CYRM-12 and -28)2; Quality of Life in Schools (QoLS) Questionnaire3; REAL Kids Alberta Evaluation4; Health Behaviours in School-Aged Children (HBSC) questionnaire5; Citizenship Competences Questionnaire6, Citizenship and Social Responsibility Survey7; and Information, Communication, and Technology (ICT) Literacy Questionnaire8.
Question content was also informed by relevant resources such as the Canadian Charter of Rights and Freedoms9, the Truth and Reconciliation Commission Calls to Action10, and Alberta Education’s Programs of Study11. Where no relevant resource could be found or adapted, original questions were developed based on the CBE Results Policies.
Selection of a Survey Software Tool
Time was spent ensuring a careful decision was made regarding the selection of a Survey Software tool. Considerations for the tool included data storage capacity and location, data security, data ownership, and user experience.
1 Organization for Economic Co-operation and Development (OECD). (2017). Preparing Our Youth for an Inclusive and Sustainable World: The OECD PISA global competence framework. Retrieved from: https://www.oecd.org/education/Global-competency-for-an-inclusive-world.pdf 2 Liebenberg, L., Ungar, M., Van de Vijver, Fons. (2011). Validation of the Child and Youth Resilience Measure-28 (CYRM-28) Among Canadian Youth. Research on Social Work Practice, 22(2),219-226. Retrieved from: http://cyrm.resilienceresearch.org/about/ 3 Ghotra, S., MacIsaac, J.L., Kirk, S.F., Kuhle, S. (2016). Validation of the “Quality of Life in School” Instrument in Canadian elementary school students. PeerJ, 22, e1567. 4 Population Health Intervention Research Unit, School of Public Health, University of Alberta. (2015). REAL Kids Alberta Evaluation: Survey Tools. Retrieved from: http://www.realkidsalberta.ca/surveys 5 Freeman, J.G., King, M., Pickett, W. (2012). The Health of Canada’s Young People: a mental health focus. Retrieved from: https://www.canada.ca/en/public-health/services/health-promotion/childhood-adolescence/publications/health-canada-young-people-mental-health-focus.html 6 ten Dam, G., Geijsel, F., Reumerman, R. and Ledoux, G. (2011), Measuring Young People's Citizenship Competences. European Journal of Education, 46: 354–372. doi:10.1111/j.1465-3435.2011.01485.x 7 British Columbia Ministry of Education. (unlisted). Citizenship and Social Responsibility Survey. Retrieved from: https://www.bced.gov.bc.ca/citizen_survey/ 8 Lau, W.W.F., Yuen, A.H.K. (2014). Developing and validating of a perceived ICT literacy scale for junior secondary school students: Pedagogical and educational contributions. Computers & Education. 78, 1-9. https://doi.org/10.1016/j.compedu.2014.04.016 9 Government of Canada. (2018). Canadian Charter of Rights and Freedoms. Retrieved from: https://www.canada.ca/en/canadian-heritage/services/how-rights-protected/guide-canadian-charter-rights-freedoms.html 10 Truth and Reconciliation Commission of Canada. (2015). Truth and Reconciliation Commission of Canada: Calls to Action. Retrieved from: http://www.trc.ca/websites/trcinstitution/File/2015/Findings/Calls_to_Action_English2.pdf 11 Alberta Education. (2018). Programs of Study. Retrieved from: https://education.alberta.ca/programs-of-study/?searchMode=3
5-30

Page 5 | 20
Consultation with Staff
Staff members with expertise in the relevant content areas for the new CBE Student Survey, including Specialists (curriculum, health and well-being) and school staff were consulted to assess and refine proposed survey questions.
Throughout the piloting process, consultation took place with volunteer Survey Coordinators (Principals, Assistant Principals, Learning Leaders and Teachers) at each participating Pilot School. These coordinators provided feedback throughout the survey piloting process.
Consultation with Students
Members of the Chief Superintendent’s Student Advisory Committee (CSSAC) provided feedback on each question in the survey. This included question comprehension, whether the question was really evaluating the construct of interest, in their view, and whether any important content was either missing or irrelevant. Their contributions provide evidence for content validity. Consultation with External Methodological Advisor
An external consultant, an Assistant Professor of Measurement, Evaluation, and Cognition at the Werklund School of Education at the University of Calgary, was engaged to provide additional methodological oversight to the survey validation process. This individual was regularly consulted throughout the duration of the preparation, implementation, and analysis processes of the validation study.
Phase 2: Pilot
Pilot Study
Recruitment began for a Pilot Study in September 2017. Sample size calculations for the statistical tests to be used for validation were conducted and it was determined that a minimum of 500 students would constitute a sufficient sample size. The call for pilot schools received substantial interest with a total of 28 schools choosing to participate resulting in approximately 5000 potential student participants. At least one school from each CBE Area and one school for each eligible grade configuration participated in the pilot, resulting in a representative sample. Schools were asked to complete the survey with as many students as they could. The pilot was implemented in two rounds: the first round in October and the second in late November/early December. In between these two rounds some data analysis was done, and feedback from school staff and students was implemented, and the survey was refreshed. A total of 3400 students participated in Round 1 of the survey and 3800 participated in Round 2.
Data Analysis
Following the first round of the pilot, exploratory factor analysis was applied. This technique intends to provide evidence about the relationships between items that may cluster together, where questions may be statistically redundant and what questions do not contribute to overall themes. Following this analysis, the survey was shortened, question wording was refined and the survey was administered again. Following Round 2 of the pilot, confirmatory factor analysis using structural equation modelling was applied. This technique aims to provide evidence about how a proposed model, reflecting
5-31

Page 6 | 20
an underlying theory (in this case, the Results Policies), fits the data. Internal consistency reliability for each section of the survey was also calculated to assess survey item reliability. Test re-test reliability will be calculated using results from Round 2 of the Pilot study and results from the district-wide administration of the survey in April. Validity
“Validation refers to the process of collecting validity evidence to evaluate the appropriateness of the interpretations, uses and decisions based on assessment results. Contemporary frameworks view validity as a hypothesis, and validity evidence is collected to support of refute the validity hypothesis (i.e., that the proposed interpretations and decisions are defensible).” – Cook & Hatala, 201612.
The following table describes the various types of validity evidence, their definitions and the tasks completed throughout the validation study for the new CBE Student Survey. Together, this evidence evaluates the appropriateness of the interpretations, uses and decisions based on the new CBE Student Survey, and builds support for the survey’s validity argument. This table is adapted by Cook & Hatala (2016)12 from a validity framework first proposed by Messick (1989)13 that has been continuously adopted as the standard for the fields of educational and psychological assessment by the American Psychological Association (APA).
Validity Evidence
Type Definition
Task Completed To Provide Evidence of Validity
Content
“The relationship between the content of a test and the construct it is intended to measure”
Focus groups with Principals Feedback from Survey Coordinators
(pilot phase) Discussion with relevant content
experts (Directors, System Principals, etc.)
CSSAC student consultation
Internal structure
Relationship among data items within the assessment and how these relate to the overarching construct
Internal consistency reliability (calculation of alpha statistic)
Exploratory and Confirmatory Factor Analysis
Relationships with other variables
“Degree to which these relationships are consistent to the construct underlying the proposed test score interpretations”
No evaluative reference standards exists for the constructs being evaluated by the CBE Student Survey. As such, evaluation of relationships between survey responses and other variables would not be informative.
Response process
“The fit between the construct and the detailed nature of performance… actually engaged in”
CSSAC students Ensuring response quality – survey
only open during school hours, link to survey managed within school context and processes
Training of Survey Coordinators (SC) on how to properly lead the survey and feedback from SCs on how administration went
12 Cook, D.A., Hatala, R. (2016). Validation of educational assessments: a primer for simulation and beyond. Advances in Simulation, 1(31), 1-12. 13 Messick, S. (1989). Validity. In: Linn R.L., editor. Educational measurement. 3rd ed. New York: American Council on Education and Macmillan; 1989 p. 13-103.
5-32

Page 7 | 20
Consequences
“The impact, beneficial or harmful and intended or unintended, of assessment.”
Feedback from school administrators about the value of the data and what resulted from their receipt of reports
The indicators, measures and questions for the new CBE Student Survey can be found in the first four attachments. The fifth attachment is an example of what the board report would include for each indicator.
5 | Implementation Consequences
In keeping with feedback gathered during consultations with staff and students regarding the need to reduce survey fatigue, the new CBE student survey will be administered to students not participating in Alberta Education’s Accountability Pillar Survey. Students will be surveyed once per year to further minimize survey fatigue and in turn contribute to valid student responses. With the Board’s approval of the proposed student survey indicators as part of the Chief Superintendent’s Reasonable Interpretation for Results 2, 3, 4 and 5 the new CBE Student Survey will be administered in the spring of 2018, ensuring data is available to support school decisions and the Board’s monitoring of its Results policies. The redesigned survey questions and administration practices will be reflected in the Results Monitoring reports that include data for 2017-18 and presented to the Board in 2018-19. The Chief Superintendent will bring additional questions and indicators to the Board of Trustees for approval as indicators within the Chief Superintendent’s Reasonable Interpretations of Results 4: Personal Development and Results 5: Character in each of the next two years.
Results 4, Policy Sections 4.1 - 4.4 and 4.6 will be presented during the 2018-19 school year.
Results 5, Policy Sections 5.2 and 5.53 will be presented during the 2019-20 school year.
By using a valid and reliable tool to collect students’ assessment of the organization’s impact on their skills and successes, the Board of Trustees can be confident in the reported data on which their determination of reasonable progress is made.
5-33

Page 8 | 20
6 | Conclusion
The new CBE Student Survey is an opportunity to strengthen the quality and usefulness of the data gathered from students and present to the Board of Trustees as evidence of student and organizational success. Approval of the indicators (Attachments I – IV) for the new CBE Student Survey will ensure that survey administration proceeds in April 2018 and that data will be available for monitoring the 2017-18 school year as per the implementation schedule.
DAVID STEVENSON CHIEF SUPERINTENDENT OF SCHOOLS
ATTACHMENTS
Attachment I: Results 2: Academic Success –Indicators Attachment II: Results 3: Citizenship –Indicators Attachment III: Results 4: Personal Development –Indicators Attachment IV: Results 5: Character – Indicators Attachment V: Sample Data Presentation for an Indicator
APPENDICES
Appendix I: Definitions
GLOSSARY – Developed by the Board of Trustees
Board: Board of Trustees
Governance Culture: The Board defined its own work and how it will be carried out. These policies clearly state the expectations the Board has for individual and collective behaviour.
Board/Chief Superintendent Relationship: The Board defined in policy how authority is delegated to its only point of connection – the Chief Superintendent – and how the Chief Superintendent’s performance will be evaluated.
Operational Expectations: These policies define both the nonnegotiable expectations and the clear boundaries within which the Chief Superintendent and staff must operate. They articulate the actions and decisions the Board would find either absolutely necessary or totally unacceptable.
Results: These are our statements of outcomes for each student in our district. The Results policies become the Chief Superintendent’s and the organization’s performance targets and form the basis for judging organization and Chief Superintendent performance.
5-34

Results 2: Academic Success Indicators
Page 9 | 20
Existing Board-Approved Indicators
1. Percentage of students completing high school.
2. Percentage of students who achieve the Acceptable Standard and the Standard of Excellence on Provincial Achievement Tests and Diploma Examinations.
3. Percentage of students meeting learning expectations within each discipline; as measured by student report cards.
4. Percentage of students participating in four or more Diploma Examinations within three years of starting high school.
5. Percentage of students eligible for the Rutherford Scholarship.
New Survey Indicators
6. Percentage of students who report they can apply the knowledge, skills, attitudes, and competencies of reading; as indicated by the Overall Agreement of the Reading
Summary Measure from the CBE Student Survey.
7. Percentage of students who report they can apply the knowledge, skills, attitudes, and competencies of writing; as indicated by the Overall Agreement of the Writing Summary
Measure from the CBE Student Survey.
8. Percentage of students who report they can apply the knowledge, skills, attitudes, and competencies of mathematics; as indicated by the Overall Agreement of the Mathematics
Summary Measure from the CBE Student Survey.
9. Percentage of students who report they can apply the knowledge, skills, attitudes, and competencies of the arts; as indicated by the Overall Agreement of the Arts Summary
Measure from the CBE Student Survey.
10. Percentage of students who report they can apply the knowledge, skills, attitudes, and competencies of science; as indicated by the Overall Agreement of the Science Summary
Measure from the CBE Student Survey.
11. Percentage of students who report they can apply the knowledge, skills, attitudes, and competencies of Social Studies; as indicated by the Overall Agreement of the Social
Studies Summary Measure from the CBE Student Survey.
12. Percentage of students who report they can draw upon their learning to think critically and creatively; as indicated by the Overall Agreement of the Critical and Creative Thinking
Summary Measure from the CBE Student Survey.
5-35

Results 3: Citizenship Indicators
Page 10 | 20
3.1 Participate in developing and maintaining our Canadian civil, democratic society.
Existing Board-Approved Indicator
1. Percentage of students in kindergarten-grade 9 reported to exercise their democratic rights and responsibilities within the learning community; as measured by student report cards.
New Survey Indicators
2. Percentage of high school students who report that they exercise their democratic rights and responsibilities within the learning the learning community; as indicated by the Overall Agreement of the Learning Community Citizenship Summary Measure from the CBE Student Survey.
3. Percentage of high school students who report that they have participated in community service, school service or volunteer work to help others; as indicated by the Overall Agreement of the Service Summary Measure from the CBE Student Survey.
3.2 Understand the rights and responsibilities of citizenship in local, national and
international contexts.
Existing Board-Approved Indicators
1. Percentage of students successfully demonstrating understanding of Social Studies issues, information and ideas; as measured by school report cards.
New Survey Indicators
2. Percentage of students who report they understand what it means to be a responsible citizen in their local and national communities; as indicated by the Overall Agreement of the Local and National Citizenship Summary Measure from the CBE Student Survey.
3. Percentage of students who report they understand what it means to be a responsible global citizen; as indicated by the Overall Agreement of the Global Citizenship Summary
Measure from the CBE Student Survey.
3.3 Respect and embrace diversity.
Existing Board-Approved Indicator
1. Percentage of students in kindergarten-grade 9 reported to demonstrate respect and appreciation for diversity; as measured by student report cards.
5-36

Page 11 | 20
New Survey Indicators
2. Percentage of high school students who report they value other cultures; as indicated by the Overall Agreement of the Embracing Culture Summary Measure from the CBE Student Survey.
3. Percentage of high school students who report they appreciate and learn from the perspectives of others; as indicated by the Overall Agreement of the Diversity and
Inclusion Summary Measure from the CBE Student Survey.
3.4 Be responsible stewards of the environment by contributing to its quality and
sustainability.
New Survey Indicator
1. Percentage of students who report they take action to protect the environment and use resources responsibly; as indicated by the Overall Agreement of the Environmental
Stewardship Summary Measure from the CBE Student Survey.
3.5 Be able to lead and follow as appropriate, and to develop and maintain positive
relationships with other individuals and groups in order to manage conflict and reach
consensus in the pursuit of common goals.
Existing Board-Approved Indicator
1. Percentage of students in kindergarten-grade 9 reported to work and collaborate effectively with others; as measured by student report cards.
New Survey Indicator
2. Percentage of high school students who report they work and communicate effectively with others; as measured by the Overall Agreement of the Collaborative Skills Summary
Measure from the CBE Student Survey.
5-37

Results 4: Personal Development Indicators
Page 12 | 20
4.5 Make lifestyle choices based upon healthy attitudes and actions, and be able to assume responsibility for personal well-being.
Existing Board-Approved Indicator
1. Percentage of students experiencing success with the learning outcomes of the Health/CALM programs of study; as measured by student report cards.
New Survey Indicators
2. Percentage of students who report they make decisions that keep them physically healthy; as indicated by the Overall Agreement of the Physical Health Summary Measure from the CBE Student Survey.
3. Percentage of students who report they make decisions that keep them socially healthy; as indicated by the Overall Agreement of the Social Health Summary Measure from the CBE Student Survey.
4. Percentage of students who report they make decisions that keep them emotionally healthy; as indicated by the Overall Agreement of the Emotional Health Summary
Measure from the CBE Student Survey.
5-38

Results 5: Character Indicators
Page 13 | 20
5.1 Possess the strength of character to do what is right.
New Survey Indicators
1. Percentage of students who report they do what they believe is right even when it is difficult or unpopular to do so; as indicated by the Overall Agreement of the Doing What is
Right Summary Measure from the CBE Student Survey.
2. Percentage of students who report they respectfully challenge policies or decisions with which they may not agree; as indicated by the Overall Agreement of the Respectfully
Challenging Policies or Decisions Summary Measure from the CBE Student Survey.
3. Percentage of students who report they use technology responsibly and with integrity; as indicated by the Overall Agreement of the Technological Responsibility Summary
Measure from the CBE Student Survey.
5-39

Sample Data Presentation for the Indicators for Results Policy 4.5
Page 14 | 20
4.5 Make healthy lifestyle choices based upon healthy attitudes and actions, and be able to assume responsibility for personal well-being.
Indicator 2: Percentage of students who report they make decisions that keep them physically healthy; as indicated by the Overall Agreement of the Physical Health Summary Measure from the CBE Student Survey. Physical Health Summary Measure
Physical Health Summary Measure
2017-18
Overall Sample Size
XXXX
Overall Agreement XX.X
50
60
70
80
90
100Healthy Eating Habits
Healthy PhysicalActivity
Healthy Sleep
HealthyScreen Time
Overall Agreement for Survey Questions 2017-18
Physical Health Summary Measure Overall Agreement 2017-18 (Reference Line)
5-40

Page 15 | 20
Supplementary Information – Physical Health Grade by Grade Agreement
Physical Health Summary Measure by Grade
Overall Agreement 2017-
18
Grade 5 XX.X
Grade 6 XX.X
Grade 8 XX.X
Grade 9 XX.X
Grade 11 XX.X
Grade 12 XX.X
5-41

Page 16 | 20
Indicator 3: Percentage of students who report they make decisions that keep them socially healthy; as indicated by the Overall Agreement of the Social Health Summary Measure from the CBE Student Survey Social Health Summary Measure
Social Health Summary Measure
2017-18
Overall Sample Size
XXXX
Overall Agreement XX.X
50
60
70
80
90
100
Positive Relationshipswith Friends/Family
RetainingRelationships
RecognizingUnhealthy
Relationships
Ending UnhealthyRelationships
Overall Agreement for Survey Questions 2017-18
Social Health Summary Measure Overall Agreement 2017-18 (Reference Line)
5-42

Page 17 | 20
Supplementary Information - Social Health Summary Grade by Grade Agreement
Social Health Summary Measure by Grade
Overall Agreement 2017-
18
Grade 5 XX.X
Grade 6 XX.X
Grade 8 XX.X
Grade 9 XX.X
Grade 11 XX.X
Grade 12 XX.X
5-43

Page 18 | 20
Indicator 4: Percentage of students who report they make decisions that keep them emotionally healthy; as indicated by the Overall Agreement Emotional Health Summary Measure from the CBE Student Survey Emotional Health Summary Measure
Emotional Health Summary Measure
2017-18
Overall Sample Size
XXXX
Overall Agreement XX.X
50
60
70
80
90
100Asking for Help
Talking to SupportiveAllies
Stress ManagementStrategies
Overall Agreement for Survey Questions 2017-18
Social Health Summary Measure Overall Agreement 2017-18 (Reference Line)
5-44

Page 19 | 20
Supplementary Information - Emotional Health Grade by Grade Agreement
Social Health Summary Measure by Grade
Overall Agreement 2017-
18
Grade 5 XX.X
Grade 6 XX.X
Grade 8 XX.X
Grade 9 XX.X
Grade 11 XX.X
Grade 12 XX.X
5-45

Glossary of Terms
Page 20 | 20
Confirmatory Factor Analysis (CFA) focuses on modelling the relationship between observed indicators (e.g., responses to survey questions) and underlying latent variables (unobserved variables, e.g., Results Policies Indicators that the survey questions represent) (Gallagher & Brown, 2013)14. CFA typically follows Exploratory Factor Analysis (EFA). Exploratory Factor Analysis (EFA) is a statistical method used to identify unknown underlying factors within a set of data (Peacock & Peacock, 2011)15. It presumes that there are hidden factors (e.g., Results Policies Indicators) among the observed data (e.g., responses to survey questions) and attempts to undercover them by understanding how responses to survey questions cluster together. Pilot Study is a small-scale study conducted prior to the main study to check feasibility and/or make estimates of key parameters that are needed to design the main study (Peacock & Peacock, 2011)15. Power is related to the sample size of a data set. In order for statistical tests to provide robust results, the sample size of a dataset must be sufficiently large. The larger a sample size is, the more power a statistical test will have. Reliable (reliability) refers to whether an assessment instrument gives the same results each time it is used in the same setting with the same type of subjects. Reliability essentially means consistent or dependable results. Reliability is a part of the assessment of validity (Sullivan, 2011)16. Survey Fatigue occurs when survey respondents become bored, tired or uninterested in a survey and begin to respond substandard level or without authenticity. Structural Equation Modelling is a statistical method used to conduct CFA (see above). Valid (validity) refers to how well the assessment tool actually measures the underlying outcome of interest. Validity is not a property of the tool itself, but rather the interpretation or specific purpose of the assessment tool with particular settings or learners (Sullivan, 2011).
14 Gallagher, M.W., Brown, T.A. (2013). Introduction to Confirmatory Factor Analysis and Structural Equation Modelling. Handbook of Quantitative Methods of Educational Research, p. 289-314. 15 Peacock, J.L., Peacock, P.J. (2011) Oxford Handbook of Medical Statistics. Oxford University Press, Oxford, United Kingdom. 16 Sullivan, G.M. (2011) A primer on the validity of assessment instruments. Journal of Graduate Medical
Education, 3(2): 119-120.
5-46

Page 1 | 17
OE-8: Communication With and Support for the Board
CHIEF SUPERINTENDENT CERTIFICATION
With respect to Operational Expectations 8: Communication With and Support for the Board, the Chief Superintendent certifies that the proceeding information is accurate and complete, and is:
☒ In Compliance
☐ In Compliance with exceptions as noted in the evidence
☐ Not in Compliance
Signed: Date: February 20, 2018 David Stevenson, Chief Superintendent
BOARD OF TRUSTEES ACTION
With respect to Operational Expectations 8: Communication With and Support for the Board, the Board of Trustees:
☐ Finds the evidence to be compliant
☐ Finds the evidence to be compliant with noted exceptions
☐ Finds evidence to be not compliant
Summary statement/motion of the Board of Trustees:
Signed: Date: Chair, Board of Trustees
Monitoring for the 2016-2017 school year Report date: March 6, 2018
6-1

Page 2 | 17
OE-8: Communication With and Support for the Board
Executive Summary Operational Expectation 8: Communication With and Support for the Board establishes the Board of Trustees values and expectations for the Calgary Board of Education administration’s work in supporting Trustees through the sharing of information. This Operational Expectation speaks to the importance placed on information provided in a timely manner to the Board of Trustees in support of decision making and building understanding. The Chief Superintendent’s reasonable interpretations for OE8: Communication with and Support for the Board were initially approved on May 15, 2012. The Board of Trustees last monitored OE 8: Communication With and Support for the Board on March 7, 2017.
The Chief Superintendent shall ensure that the Board is supported in its work and is fully and adequately informed about matters relating to Board work and significant organizational concern.
Operational Expectation 8: Communication With and Support for the Board establishes:
8.1 Submit required monitoring data (see policy B/CSR-5: Monitoring Chief Superintendent Performance) in a thorough, accurate and understandable fashion, according to the Board’s annual work plan schedule, and including both Chief Superintendent interpretations and relevant data to substantiate compliance or reasonable progress.
Compliant
Indicator 1: Compliant Indicator 2: Compliant Indicator 3: Compliant
6-2

Page 3 | 17
OE-8: Communication With and Support for the Board
8.2 Provide for the Board in a timely manner, information about trends, facts and other information relevant to the Board’s work.
Compliant
Indicator 1: Compliant Indicator 2: Compliant Indicator 3: Compliant
8.3 Inform the Board of significant transfers of money within funds or other changes substantially affecting the organization’s financial condition.
Compliant
Indicator 1: Compliant Indicator 2: Compliant Indicator 3: Compliant
8.4 Ensure that the Board has adequate information from a variety of internal and external viewpoints to ensure informed Board decisions.
Compliant
Indicator 1: Compliant
8.5 Inform the Board of anticipated significant media coverage. Compliant
Indicator 1: Compliant
8.6 Inform the Board, the Board Chair or individual members
if, in the Chief Superintendent’s opinion, the Board or individual members have encroached into areas of responsibility assigned to the Chief Superintendent or if the Board or its members are non-compliant with any Governance Culture or Board/Chief Superintendent Relationship policies.
Compliant
Indicator 1: Compliant
6-3

Page 4 | 17
OE-8: Communication With and Support for the Board
8.7 Present information in simple concise form, indicating clearly whether the information is incidental, intended for decision preparation, or for formal monitoring.
Compliant
Indicator 1: Compliant
8.8 Treat all members equally and assure that all members have equal access to information. Compliant
Indicator 1: Compliant Indicator 2: Compliant
8.9 Inform the Board in a timely manner of any actual or anticipated non-compliance with any Board Operational Expectations policy or any failure to achieve reasonable progress toward any Results policy.
Compliant
Indicator 1: Compliant Indicator 2: Compliant
8.10 Provide for the Board adequate information about all
administrative actions and decisions that are delegated to the Chief Superintendent, but required by law to be approved by the Board.
Compliant
Indicator 1: Compliant
8.11 Inform the Board in advance of any deletions of, additions to, or significant modifications of any instructional program.
Compliant
Indicator 1: Compliant
6-4

Page 5 | 17
OE-8: Communication With and Support for the Board
8.12 Ensure that the Board has the support necessary for it to perform its duties in an effective manner. Compliant
Indicator 1: Compliant
The Chief Superintendent shall ensure that the Board is supported in its work and is fully and adequately informed about matters relating to Board work and significant organizational concern.
Board-approved Interpretation | Broadly, the Chief Superintendent interprets that the Board of Trustees values information about the Calgary Board of Education that:
is accurate and relevant to the Board of Trustees’ governance responsibility for the system as a whole;
is delivered to or accessible by the whole Board of Trustees to minimize significant surprises; and
enables the Board of Trustees to understand, govern and represent the system.
Specifically, the Chief Superintendent interprets:
Board work to mean governance as described in the Board of Trustees’ governance policies;
supported to mean access to appropriate resources;
fully to mean thoroughly and relevantly;
matters to mean a reportable event;
adequately to mean sufficiently but not exhaustively;
informed to mean provided with information in writing and/or verbally;
significant to mean material—if omitted or misstated it would influence or change an action or decision;
organizational concern to mean of interest to the conduct, operation and success of the CBE as a whole.
A “reportable” event satisfies the requirements contained in the interpretation of any given OE-8 sub-section.
6-5

Page 6 | 17
“Material” is the term commonly used to describe the significance of information to decision-makers. Information is material when it is probable its omission or misstatement would influence or change a decision. Materiality is a matter of professional judgment in the context of particular circumstances. For OE-8, written communication is preferred. It is an effective way to distribute consistent information efficiently. There are times when urgency may make detailed, written communication impractical. The Chief Superintendent will
8.1 Submit required monitoring data (see policy B/CSR-5: Monitoring Chief Superintendent Performance) in a thorough, accurate and understandable fashion, according to the Board’s annual work plan schedule, and including both Chief Superintendent interpretations and relevant data to substantiate compliance or reasonable progress.
Compliant
Board-approved Interpretation | The Chief Superintendent interprets:
required monitoring data to mean annual reports about Results and Operational Expectations;
thorough to mean sufficient but not exhaustive
accurate to mean correct to the best of administration’s knowledge when it is communicated;
understandable to mean the information enables the Board to easily explain the information to a typical parent of a CBE student;
Board’s annual work plan schedule to mean the outcome of policy Governance Culture 6: Annual Work Plan.
Results reports will contain the following elements: a Board-approved reasonable interpretation, baseline and targets, and evidence of reasonable progress. Operational Expectation reports will contain the following elements: a Board-approved reasonable interpretation and evidence of compliance. Board-approved Indicators and Evidence of Compliance | 1. 100 percent of annual monitoring reports will be presented in accordance
with the Board’s annual work plan schedule.
The organization is compliant with this indicator.
6-6
Page 7 | 17
Between September 13, 2016 and June 27, 2017, administration presented sixteen monitoring reports to the Board of Trustees. These reports were presented at Board of Trustees’ meetings according to the annual work plan approved by the Board.
2. 100 percent of annual monitoring reports will contain the elements listed in
the interpretation of this sub-section.
The organization is compliant with this indicator.
All sixteen annual monitoring reports presented to the Board of Trustees between September 13, 2016 and June 27, 2017 included the required elements. All Operational Expectations monitoring reports contained Board approved reasonable interpretations and evidence of compliance. All Results monitoring reports contained Board approved reasonable interpretations, baselines, targets and evidence of reasonable progress.
3. 100 percent of annual monitoring reports will contain sufficient information
for the Board to make a determination about compliance, non-compliance, reasonable progress, lack of reasonable progress and exceptions.
The organization is compliant with this indicator.
Between September 13, 2016 and June 27, 2017, the Board of Trustees made determinations regarding the disposition of all sixteen monitoring reports. In no case did the Board of Trustees find there was insufficient evidence to make a decision.
Evidence demonstrates the indicators in sub-section 8.1 are in compliance.
8.2 Provide for the Board in a timely manner, information about trends, facts and other information relevant to the Board’s work.
Compliant
Board-approved Interpretation | The Chief Superintendent interprets:
timely to mean promptly once administration becomes aware of and has validated information;
trends to mean how internal and external data or factors move over time;
facts and other information to mean qualitative and quantitative data;
relevant to the Board’s work to mean matters pertaining to governance as described in the governance policies.
Board-approved Indicators and Evidence of Compliance | 1. 100 percent of information about trends, facts and other information will be
provided in a timely manner.
6-7

Page 8 | 17
The organization is compliant with this indicator. Administration provided information, in a timely manner, to the Board of Trustees during the 2016-2017 school year on numerous occasions. Examples of trend information include:
2016-2017 School Enrolment Report presented on December 6, 2016.
Three Year System Student Accommodation Plan (2017-2020) presented on June 20, 2017.
Examples of factual and other information include:
Summary of Provincial Achievement Test and Diploma Examinations on October 11, 2016.
2016-2017 Student Enrolment Summary Report, presented on October 11, 2016.
Administrative Regulations related to Bill 1 presented on June 27, 2017.
In the examples listed above and in other communications with the Board of Trustees, administration endeavoured to give notice when the information became known.
2. A minimum of once per month, a written update report from the Chief Superintendent will be presented at a Board of Trustees meeting. The organization is compliant with this indicator. There were fourteen update reports from the Chief Superintendent during the 2016-2017 school year. All updates were written as indicated in the posted agenda and minutes of Board of Trustees meetings. There was one written update in the months September, November, December, February, March and May. There were two written updates in October, January, April and June.
3. Once per month or as required by the Board of Trustees’ meeting agendas,
administration will support the Results focus at Board of Trustees public meetings. The organization is compliant with this indicator. Administration provided a Results focus through regular individual school presentations for a total of ten presentations. Additionally, administration presented information related to other Results focussed themes on ten occasions: September 20, October 11, November 1, November 8, November 29, December 6, January 17, February 14, March 14, and April 11.
Evidence demonstrates the indicators in sub-section 8.2 are in compliance.
6-8

Page 9 | 17
8.3 Inform the Board of significant transfers of money within funds or other changes substantially affecting the organization’s financial condition.
Compliant
Board-approved Interpretation | The Chief Superintendent interprets:
transfers of money within funds to mean all transactions between reserve funds of any kind—for which administration must have Board approval in advance;
other changes substantially affecting the organization’s financial condition to mean any transaction or event that is:
1. known to materially change a revenue, expenditure, asset or liability in the current or future years; or
2. likely to materially change a revenue, expenditure, asset or liability in the current or future years.
“Likely” means the chance of the occurrence (or non-occurrence) of the future event(s) is high. With respect to financial impact, the Chief Superintendent further interprets material to be greater than 0.5 percent of gross revenues. Board-approved Indicators and Evidence of Compliance | 1. For transfers of reserves, a report summarizing requested transfers will be
submitted at the earliest quarter and not less than once a year. The organization is compliant with this indicator. Three reports were submitted to the Board of Trustees during the 2016-17 year
related to reserve or fund transfers.
Changes to Available for Use Reserves was submitted to the Board of trustees on September 13, 2016
Financial Status of Reserves and Designated Funds at August 31, 2016 was submitted to the Board of trustees on November 1, 2016
Additional Transfer / Financial Status of Reserves and Designated Funds at August 31, 2016 was submitted to the Board of trustees on November 8, 2016
2. For other changes, the Chief Superintendent’s Update will provide timely
information about reportable events. The organization is compliant with this indicator. Quarterly variance reports were presented to the Board of Trustees on the following dates through submission on the Chief Superintendent’s Consent Agenda:
6-9

Page 10 | 17
The Fourth Quarter Budget Variance Report was presented on November 29, 2016.
The First Quarter Variance Report and Fall 2016 Budget Update was presented on November 29, 2016.
The Second Quarter Budget Variance Report was presented on March 14, 2017.
The Third Quarter Budget Variance Report was presented on June 13, 2017
3. Audited financial statements will confirm that 100 percent of reportable events were communicated to the Board of Trustees in a fashion that was timely. The organization is compliant with this indicator. Audited financial statements were presented to the Board on November 29, 2016. The statements confirmed that all reportable events were included in relevant quarterly reports for the 2015-2016 fiscal year.
Evidence demonstrates the indicators in sub-section 8.3 are in compliance.
8.4 Ensure that the Board has adequate information from a variety of internal and external viewpoints to ensure informed Board decisions.
Compliant
Board-approved Interpretation | The Chief Superintendent interprets:
adequate to mean sufficient but not exhaustive;
information to mean relevant, quantitative and qualitative data;
internal to mean CBE employees;
external to mean relevant stakeholder groups such as students, parents, the provincial government, and CBE union and association leadership;
viewpoints to mean credible and significant perspectives gathered through formal methods and channels;
Board decisions to mean actions taken by the Board of Trustees that are known to administration a reasonable time in advance.
Board-approved Indicator and Evidence of Compliance | 100 percent of known Board of Trustees decisions will be supported with information gathered and presented by administration. The organization is compliant with this indicator.
6-10

Page 11 | 17
In 2016-2017, administration provided feedback and information to support the Board of Trustees as it made decisions in areas such as the following:
determination of reasonable progress toward academic success; determination of compliance for organizational performance; approval of 2016/17 Modular Classroom Plan; approval of Three Year School Capital Plan; approval of recommendations about the financial status of operating
reserves and designated funds; approval of recommendations about capital budget and reserves status; approval of the Three-Year Education Plan; approval of locally developed and/or acquired courses; approval of the capital and operating budgets; approval of closure of Juno Beach Academy of Canadian Studies; approval of revisions to Board Operational Expectations Policies;
Evidence demonstrates the indicator in sub-section 8.4 is in compliance.
8.5 Inform the Board of anticipated significant media coverage. Compliant
Board-approved Interpretation | The Chief Superintendent interprets:
anticipated to mean expected before it happens;
significant to mean material—if omitted or misstated it would influence or change an action or decision;
media to mean professional journalists and their print, broadcast and online outlets;
coverage to mean reports or commentary.
Board-approved Indicator and Evidence of Compliance | On a monthly basis, the Board of Trustees will be informed about 100 percent of reportable events in an appropriate venue. The organization is compliant with this indicator. During the 2016-2017 school year, media outlook emails were used to inform the Trustees of reportable events. There were 163 media outlooks to Trustees during this reporting period. These outlooks include and are not limited to notice of media advisories, media coverage, interviews and requests from the media for information or comment from Calgary Board of Education employees on various topics. The media outlook emails to Trustees describe actual incidents or situations as well as timely information about anticipated events. Evidence demonstrates the indicator in sub-section 8.5 is in compliance.
6-11

Page 12 | 17
8.6 Inform the Board, the Board Chair or individual members if, in the Chief Superintendent’s opinion, the Board or individual members have encroached into areas of responsibility assigned to the Chief Superintendent or if the Board or its members are non-compliant with any Governance Culture or Board/Chief Superintendent Relationship policies.
Compliant
Board-approved Interpretation | The Chief Superintendent interprets:
inform the Board, the Board Chair or individual members to mean that the Chief Superintendent may exercise judgment to determine whether the Board of Trustees, the Chair or a trustee is provided with information under specific circumstances;
opinion to mean judgment or assessment based on observation and experience;
encroached into areas of responsibility assigned to the Chief Superintendent to mean that the Board or a trustee has stepped into an operational area delegated by the Board of Trustees through its policies to the Chief Superintendent;
Board or its members are non-compliant to mean the Board or a trustee has violated the policies established by the Board of Trustees.
Furthermore, the Chief Superintendent acknowledges that notification will be prompt so that those notified have the knowledge and opportunity to assess and resolve issues before they recur or worsen. Board-approved Indicator and Evidence of Compliance | 100 percent of reportable events will be provided in an appropriate venue. The organization is compliant with this indicator. During the 2016-2017 year the Chief Superintendent provided timely information to the Board, the Board Chair and/or individual trustees. These communications initiated by the Chief Superintendent took place verbally or on a one to one basis. Evidence demonstrates the indicator in sub-section 8.6 is in compliance.
8.7 Present information in simple concise form, indicating clearly whether the information is incidental, intended for decision preparation, or for formal monitoring.
Compliant
Board-approved Interpretation |
6-12

Page 13 | 17
The Chief Superintendent interprets:
simple to mean understandable by a typical parent of a CBE student;
concise to mean adequate information provided briefly;
incidental to mean information provided for the Board’s edification;
intended for decision preparation and formal monitoring to mean information provided that is germane to Board decision-making.
Board-approved Indicator and Evidence of Compliance | 100 percent of reports from the Chief Superintendent to the Board of Trustees will indicate whether the report is for information or decision. The organization is compliant with this indicator. In 2016-2017, there were 75 written reports presented at public meetings to the Board of Trustees by administration. 28 indicated the report was presented for decision, 40 indicated the purpose was information. There were 7 reports where the purpose was for both information and decision. Evidence demonstrates the indicator for sub-section 8.7 is in compliance.
8.8 Treat all members equally and assure that all members have equal access to information. Compliant
Board-approved Interpretation | The Chief Superintendent interprets:
members to be individual trustees of the Calgary Board of Education Board of Trustees;
equal access to mean that each and all trustees have the opportunity to receive or access reportable information.
Board-approved Indicators and Evidence of Compliance | 1. 100 percent of responses to written inquiries from individual members of
the Board will be copied to all members of the Board. The organization is compliant with this indicator. A review of email responses to individual Trustee inquiries indicates that responses were copied to the Administrative Assistant to the Board of Trustees for distribution.
2. 100 percent of agendas, related documents and minutes of Board of
Trustees’ meetings will be available to all members of the Board.
6-13

Page 14 | 17
The organization is compliant with this indicator. Agendas and related documents for all Board of Trustees’ meetings are forwarded to individual trustees through a process outlined in the Board Procedures documents. Agendas and related documents are also available on the Calgary Board of Education public website.
Evidence demonstrates the indicators in sub-section 8.8 are in compliance.
8.9 Inform the Board in a timely manner of any actual or anticipated non-compliance with any Board Operational Expectations policy or any failure to achieve reasonable progress toward any Results policy.
Compliant
Board-approved Interpretation | The Chief Superintendent interprets:
timely to mean promptly once administration becomes aware of and has validated information;
actual to mean certain to occur or already occurred;
anticipated to mean expected to occur. Board-approved Indicators and Evidence of Compliance | 1. 100 percent of instances of actual (already occurred) exceptions to
compliance or reasonable progress will be indicated in the annual monitoring reports for Operational Expectations and Results policies. The organization is compliant with this indicator. 100% of all monitoring reports included any exceptions to compliance in each of the twelve Operational Expectations monitoring reports and each of the four Results monitoring reports. Two Operational Expectations monitoring reports noted exceptions to specific policy provisions. There were no exceptions noted related to entire monitoring reports.
2. 100 percent of instances of actual (certain to occur) or anticipated non-
compliance or lack of reasonable progress for an entire policy will be presented to the Board of Trustees in a timely manner. The organization is compliant with this indicator.
During the 2016-2017 school year, there were no instances of non-compliance or lack of reasonable progress for an entire policy identified by administration. Therefore, no communication of this sort took place between administration and the Board.
Evidence demonstrates the indicators in sub-section 8.9 are in compliance.
6-14

Page 15 | 17
8.10 Provide for the Board adequate information about all administrative actions and decisions that are delegated to the Chief Superintendent, but required by law to be approved by the Board.
Compliant
Board-approved Interpretation | The Chief Superintendent interprets required by law to be approved by the Board to mean Alberta Education’s requirement for submission of a formal resolution from the Board of Trustees. Administration has investigated and, at this time, only Locally Developed Courses (LDC) meet the criteria of the sub-section. Although accountability for Locally Developed Courses has been delegated to the Chief Superintendent by the Board of Trustees, the School Act requires a Board resolution authorizing LDC for use with Calgary Board of Education students. Board-approved Indicator and Evidence of Compliance |
100 percent of recommendations about Locally Developed Courses will be presented to the Board of Trustees for approval. The organization is compliant with this indicator. As required by provincial reporting timelines, reports summarizing Locally Developed Courses were submitted for approval of the Board of Trustees on April 11, 2017.
Evidence demonstrates the indicator in sub-section 8.10 is in compliance.
8.11 Inform the Board in advance of any deletions of, additions to, or significant modifications of any instructional program.
Compliant
Board-approved Interpretation | The Chief Superintendent interprets:
deletions of, additions to, or significant modifications of any instructional program to mean the removal, cancellation, introduction or extension of:
1. any prescribed programs of study in the regular education program or in alternative or special education programs that would materially impact the Board’s work; and
2. any entire alternative or special education program.
6-15

Page 16 | 17
inform the Board in advance to mean notifying the Board as soon as possible after the event is known and confirmed.
Furthermore, the Chief Superintendent interprets this requirement to apply whether changes are initiated by the Calgary Board of Education, Alberta Education or another organization unless the Board of Trustees has been previously or otherwise informed of the change. Board-approved Indicator and Evidence of Compliance | 100 percent of reportable instructional program changes will be provided to the Board of Trustees. The organization is compliant with this indicator. Significant changes to instructional programs for the 2017-2018 school year were reported to the Board of Trustees through the Three Year System Student Accommodation Plan presented on June 20, 2017. Evidence demonstrates the indicator in sub-section 8.11 is in compliance.
8.12 Ensure that the Board has the support necessary for it to perform its duties in an effective manner.
Compliant
Board-approved Interpretation | The Chief Superintendent interprets:
support to mean providing appropriate resources; and
its duties to mean Board governance responsibility for the system as a whole.
The Chief Superintendent will canvas the Board of Trustees annually to ascertain satisfaction with support received and administration’s responsiveness to evolving requirements for additions, amendments or reductions to support. Board-approved Indicator and Evidence of Compliance | In the annual canvas, the Board of Trustees confirms satisfaction. The organization is compliant with this indicator. The Chief Superintendent met with Trustees regularly over the course of the 2016-2017 school year either through Board of Trustees’ meetings or Board work sessions. Additionally, there were opportunities for individual meetings.
The following are a few examples of the level and flexibility of support provided by the Calgary Board of Education over the 2016-2017 year.
6-16

Page 17 | 17
Support for the Board of Trustees as they revised their Operational Expectations policies
Flexibility in allocating administration’s resources to support revision of the governance policies
Responsiveness to trustee inquiries Ongoing support for the Board of Trustees’ communication strategies Support in trustees’ work sessions Support in Board of Trustees’ meetings Provision of information, in written and/or presentation format, to support
the work of trustees and the Board of Trustees, including and not limited to: - school presentations at Board of Trustees’ meetings - student-led anthem at Board of Trustees’ meetings - student musical presentations prior to Board of Trustees’ meetings - Board Development Sessions on current topics - working with data for student results - Provincial Achievement Tests and Diploma Exam Results - Chief Superintendent Updates - Lighthouse Awards - Legacy Awards
Evidence demonstrates the indicator in sub-section 8.12 is in compliance.
GLOSSARY – Developed by the Board of Trustees
Board: The Board of Trustees Operational Expectations: These policies define both the nonnegotiable expectations and the clear boundaries within which the Chief Superintendent and staff must operate. They articulate the actions and decisions the Board would find either absolutely necessary or totally unacceptable. Monitoring Report: The Board wants to know that its values have driven organizational performance. The Chief Superintendent will present to the Board, for its evaluation, a report that summarized how either compliance has been achieved on Operational Expectations or how reasonable progress has been made in Results. Each monitoring report requires: a re-statement of the full policy, by section; a reasonable interpretation of each section; data sufficient to prove compliance or reasonable progress; and a signed certification from the Chief Superintendent of the status. Reasonable Interpretation: Once the Board has stated its values in policy, the Chief Superintendent is required to “interpret” policy values, saying back to the Board, “here is what the Board’s value means to me.” The Board then judges whether this interpretation is reasonable. In other words, does the Chief Superintendent “get it?” This reasonable interpretation is the first step required in monitoring compliance on Operational Expectations and monitoring reasonable progress on Results. Compliance: Evidence or data that allow the Board to judge whether the Chief Superintendent has met the standard set in the Operational Expectations values. Non-compliance: In gathering evidence and data to prove to the Board that its Operational Expectations values have been adhered to, there may be areas where the standards were not met. The policy or subsection of the policy would be found to be “non-compliant.” The Chief Superintendent would identify the capacity-building needed to come into compliance and the Board would schedule this section of policy for re-monitoring
6-17

Three-Year School Capital Plan 2019-2022
Date March 6, 2018
Meeting Type Regular Meeting, Public Agenda
To Board of Trustees
From David Stevenson, Chief Superintendent of Schools
Purpose Decision
Originator Dany Breton, Superintendent, Facilities and Environmental Services
Governance Policy
Reference Operational Expectations OE-5: Financial Planning OE-6: Asset Protection OE-7: Communication With and Support for the Board OE-8: Communicating and Engaging with the Public OE-9: Facilities
Resource Person(s) Carrie Edwards, Director, Planning & Transportation Eugene Heeger, Director, Design & Property Development Anne Trombley, Manager, Planning Leah Hartley, Senior Project Manager, Capital Projects
1 | Recommendation
It is recommended:
THAT the Board of Trustees approves the Three-Year School Capital Plan 2019-2022, as provided in the report, and refers the plan to Alberta Education.
2 | Issue
In accordance with the requirements of Alberta Education, Alberta school boards are required to submit a three-year school capital plan on an annual basis.
8-1

2 | 8
This year’s deadline for submission of the Three-Year School Capital Plan 2019-2022 to the Ministry is April 1, 2018.
As required by the Province, the plan identifies one priority capital list consisting of both “New School Construction” and “Major Modernization” requests. The plans are to be electronically submitted to Alberta Education using the Web Application Program. New modular classroom requests and modular moves are handled through a separate submission process. The last submission was due December 1, 2017.
3 | Background
School boards are required to review their needs for new space and substantiate their applications annually. Capital projects are reviewed and prioritized by Alberta Education prior to being submitted to the government’s Capital Planning Prioritization Process led by the Treasury Board. Projects are first reviewed for accuracy and clarity and Provincial staff may meet with school jurisdictions to obtain further information as required.
Eligibility Criteria In order to be considered for prioritization several eligibility criteria are applied for elementary to high school. The eligibility criteria are as follows: Eligible School Communities: All new and developing municipal communities are evaluated and ranked for new school construction. Inner-city and established communities are not ranked. In the case of middle/junior high schools, adjacent municipal communities may be combined if they do not exceed a combined projected population threshold of approximately 24,000 people. In the case of high schools communities are always combined to attain a 50,000 to 60,000 community population threshold. Accommodation Options This criterion is used to evaluate student accommodation options for eligible school communities. In some cases, an accommodation option may exist in a nearby community and a school community may not need to be ranked for new school construction. Site Availability and Readiness: High school sites require larger land parcels that will service multiple communities. As such the land required for these sites is required under the Joint Use Agreement, a tripartite agreement between the City, CBE and Calgary Catholic School District (CCSD). These sites are identified during the regional context study phase when developments that are planned for a minimum of 50,000 to 60,000 residents are considered for approval by the City of Calgary. Accordingly new high school priorities are only considered where a site is available (map 4 on page30).
Moreover, for any site irrespective of the grade configuration of the school, if a site has not been developed/serviced to the level at which construction of a school
8-2

3 | 8
would be possible within a 12 month timeframe, the school will not be ranked as a construction priority for that year’s Three-Year School Capital Plan. Site readiness is reviewed and assessed on an annual basis.
Ranking Criteria
The ranking of new school construction priorities is an important issue for all community stakeholders. The CBE first established ranking criteria for new construction priorities in January 2002. The model was designed to be transparent, objective and impart equity and fairness to all Calgary communities. Over the years, these criteria have been reviewed and adjusted periodically as necessary. The most recent criteria review began in May 2014 and revisions recommended as a result of the review were presented to the Board of Trustees and approved on October 7, 2014. The criteria used are data driven and establish a fair and equitable process for all communities. The ranking points for new schools are based on the following data sources: City of Calgary Civic Census (July 2017) Pre-School Children Summary by School District Code (July 2017) School Enrolment (September 30, 2017) School Bus Transportation Times ( Fall 2017) The City of Calgary Suburban Residential Growth 2017-2021 Calgary & Region Economic Outlook 2016-2021 (Fall 2017)
Not all priorities for new school construction are assessed through the ranking criteria: Senior high schools are not ranked using point criteria, but are recommended on
the priority list based on analysis of multiple factors such as: Availability of a site to construct a high school High school utilization rates Student enrolment Community demographics
Schools with unique settings or enrolments that do not lend themselves to the aforementioned ranking criteria may also be placed on a priority basis.
School major modernization projects provide for the renovation of whole or part of a school building for both present and future educational programs. These modernizations address physical obsolescence and/or improve functional adequacy and suitability. School major modernization projects should not exceed 75% of the replacement value of the school building as per provincial guidelines. The ranking of major school modernization priorities are based on the following: School Programming Requirements Five Year Projected School Enrolment Quality of site location to serve students Ability to upgrade in terms of teaching environment and minimizing costs Facility maintenance based on Provincial VFA assessments. VFA is a facility
assessment tool used by Alberta Infrastructure.
8-3

4 | 8
As requested by the Province, a combined ranking list of new schools and major school modernizations is also presented in the Three-Year School Capital Plan 2019-2022.
4 | Analysis
In spring 2017, CBE added two new administrative areas and changed the methodology for grouping schools into areas. The new area structure is based on relationships between schools rather than geography. The data reported in the annual Three Year School Capital Plan relies on information sources, such as the City of Calgary, that are reported using community and geographical groupings. A geographical reporting and analysis of data is required to understand where population and student enrolment growth will occur in the future. Starting with the School Capital Plan 2019-2022 CBE will use City of Calgary planning sectors for capital planning purposes. The CBE mission, vision, and values are used as an overarching umbrella for the development of the Three-Year School Capital Plan 2019-2022. The annual Three-Year School Capital Plan also supports the Three-Year Education Plan 2017-2020. This alignment supports capital funding strategies that recognize the changing needs of students and focuses on building strong ties with parents, partners, and the community.
More specifically, the CBE recognizes: Provincial funding is required for new school construction in new and
developing communities Parents desire schools be closer to home, especially for younger students Increasing public demand for alternative programs Transition for students with minimal disruption in order to provide continuity of
learning with consistent peer cohorts. The CBE strives to maintain a utilization rate in the mid-80% range. Ensuring healthy school utilization rates contributes to ensuring that facilities are optimized for educational purposes, maintaining flexibility within the system to meet demand for emergent considerations while balancing the financial obligations and sustainability of the system.
The City of Calgary’s actual and projected populations for the period 2013 to 2022 are shown on page 1 of the plan. The projected CBE school enrolments for the next five years are shown on page 4.
The new school requests are spread over three years with a goal of maintaining a mid-80% utilization rate. Actual/projected student enrolments and CBE system utilization for the period 2016 to 2023 are illustrated in Appendix IV on page 80.
8-4

5 | 8
The priorities over three years have been listed for New School Construction (Table 1) on page 31 and total $273.3 million. The full list of communities assessed through the points ranking criteria is shown on page 73. Details of the point assignments for potential new schools are shown in Appendix III (Pages 74-77). The Major Modernizations (Table 2) are on page 32 and total $130.1 million. The details of the point assignments are located in Appendix II on Pages 71-72.
As the Province requires that the three year plan has one priority capital list consisting of both “New School Construction” and “Major Modernization” requests, this list is included (Table 3) on page 33, and totals $403.4million. These requests will be submitted to the Province on the Web Application Program consistent with Attachment I to this report.
Year 1 The combined priorities for Year 1 consist of 5 new school construction projects and 3 major modernization projects for a total estimated cost of $201.2 million. Year 2 The combined priorities for Year 2 consist of 4 new school construction projects and 3 major modernization projects for a total estimated cost of $109 million. Year 3 The combined priorities for Year 3 consist of 3 new school construction projects and 4 major modernization projects for a total estimated cost of $93.2 million.
The list of new school requests is shorter this year than in previous years resulting in one request that was in Year 2 and five requests that were in Year 3 of last year’s plan not being included in this plan. This reduced number of new school requests aligns with the need to optimize learning environments for students while concurrently ensuring the efficient use of resources by maintaining a mid-80% utilization rate. In reducing the number of new school requests from 20 last year to 12 this year, the requests included in the plan represent schools/communities that have current and future populations that will ensure that a new school will immediately attain the targeted utilization rate upon opening.
If all schools on this plan were approved, CBE’s utilization is projected to reach 84% by 2023. Although the requests in the Three Year School Capital Plan are separated in to three years, the plan is updated and submitted annually. This provides the opportunity for the expansion or contraction of the list as needed when enrolment projections change.
This year, based on the point assignment, some communities have a higher point total for a second elementary school in the community than for a middle school. Constructing a middle school prior to second elementary schools is desired for several reasons. Construction of a middle school completes the K-9 continuum of learning and adds 900 additional learning spaces in comparison to 600 for a second elementary school. These 300 additional learning spaces provide space
8-5

6 | 8
for more students to attend school closer to home. When a second elementary school receives more points than a middle school within the same community, the middle school will be prioritized over the second elementary school.
5 | Financial Impact
The financing of new school construction and major modernization projects is determined by Alberta Education. Individual project applications will be submitted through the Web Application Program, following the Board’s approval of this “paper-based” Three-Year School Capital Plan 2019-2022. The plans are to be electronically submitted to Alberta Education on the Web Application Program before April 1, 2018.
For the 2016-2017 and 2017-2018 school years, the CBE generally supplemented the allocated Alberta Education funds by $799,000 for grades K-4 schools, $1,145,000 for grades 5-9 schools, and $3,890,500 for grades 10-12. These additional funds largely, but not exclusively, go toward human resources (principals etc.), technology (devices) and learning resources (curriculum) at the school level. Career and Technology Studies (CTS) at the High School level is typically further supplemented by the CBE by $1,520,000 to provide a broad and robust CTS experience for these 1,800 student capacity schools.
In addition to the abovementioned one-time capital costs, the recurring annual operating costs for new schools are:
Elementary Schools: $558,000 Middle Schools: $672,000 High Schools: $1,591,000
6 | Implementation Consequences
Over the past decade, Calgary has experienced varying levels of population growth. Over the five years from 2010 to 2015 Calgary’s population growth averaged just over 25,000 persons per year.
The population grew from 1,235,171 in April 2016 to 1,246,337 in 2017, an increase of 11,166 (0.9%). The population growth consisted of a natural increase of 10,192 people with a net migration of 974 people.
In the Calgary & Region Economic Outlook 2017-2022 (Fall 2017), the City of Calgary (the City) is forecasting that the population of Calgary will reach 1,323,000 by 2022, an increase of 76,700 people over the next five years. This five-year forecast represents a lower rate of growth than was forecast in fall 2016, with an average annual increase of 10,192 persons compared to the 15,610 average increase from fall 2016.
8-6

7 | 8
The City of Calgary population projections are not a direct factor in CBE enrolment projections but they do provide context for comparison. Trends reported by the City with respect to net migration and natural increase (births minus deaths) are considered when evaluating future student growth.
CBE’s current enrolment of 121,691 students is forecast to increase to 132,278 students by 2022. An increase of 10,587 students is projected, averaging approximately 2,100 additional students annually. The largest increase over this five-year timeframe is projected to be in Grades 7-9 and Grades 10-12.
Even with the capital funding announcements that have occurred since May 1, 2013 and new schools that have opened in the past two years, CBE still requires new schools to be built in the communities where students are living. The current system utilization rate, which includes the added capacity of new schools that opened this year, is 83% based on September 30, 2017 enrolment. This is an increase of 1% over the previous year.
The opening of the schools currently under construction is projected to result in an 88% system utilization rate by the 2022-2023 school year.
The Draft Suburban Residential Growth 2017-2021 indicates that 75% of the population growth over the years 2012-2016 has been in developing communities. Although a high level of growth continues to occur in suburban areas, the percentage of growth has declined from previous five year suburban population growth averages that were in the 90-95% range in the early 2000’s. This change in growth pattern reflects the Calgary Municipal Development Plan goal of supporting more densification in developed areas of the city. Forecasts over the next five years estimate approximately 78% of the population growth will occur in new suburbs.
As illustrated on pages 65-70 (Appendix I) of the Capital Plan, the student capacity by planning sectors within Calgary varies widely. In the North Sector for example (page 65), the utilization for K-9 students by residence is 129%, as compared to 60% in the central sector. One consequence of this disparity is that some students residing in north Calgary need to be transported to other sectors.
A similar situation exists with senior high school students. For example, the capacity for senior high students by residence in the North Sector 273%, as compared to 28% in the Centre sector where five senior high schools are located. The utilization rate, by residence, in the Centre Sector indicates that there is excess space within the sector. Although there is space, it is not located close to the growing communities in the North Sector where student enrolment is increasing and utilization by residence far exceeds the capacity. Starting in September 2018, space at James Fowler High School, Lord Beaverbrook High School and Forest Lawn High School will be used to accommodate Chinook Learning classes and the utilization rate at these schools will increase.
Without any new school approvals, CBE’s system utilization rate is projected to reach 88% by the 2022-23 school year. The approval of the additional schools identified within the plan will ensure the timely accommodation of students close to their homes while concurrently ensuring that school utilization rates are optimized for educational programming purposes.
8-7

8 | 8
7 | Conclusion
The approval of the Three-Year School Capital Plan 2019-2022 provides the Provincial government with a comprehensive analysis of CBE school capital needs and the funding required for priority projects to support student learning needs.
DAVID STEVENSON CHIEF SUPERINTENDENT OF SCHOOLS
ATTACHMENTS
Attachment I: Three-Year School Capital Plan 2019-2022 Attachment II: Three Year School Capital Summary Presentation
GLOSSARY –
Board: Board of Trustees Governance Culture: The Board defined its own work and how it will be carried out. These policies clearly state the expectations the Board has for individual and collective behaviour. Board/Chief Superintendent Relationship: The Board defined in policy how authority is delegated to its only point of connection – the Chief Superintendent – and how the Chief Superintendent’s performance will be evaluated. Operational Expectations: These policies define both the nonnegotiable expectations and the clear boundaries within which the Chief Superintendent and staff must operate. They articulate the actions and decisions the Board would find either absolutely necessary or totally unacceptable. Results: These are our statements of outcomes for each student in our district. The Results policies become the Chief Superintendent’s and the organization’s performance targets and form the basis for judging organization and Chief Superintendent performance.
8-8

Three-Year School Capital Plan
2019 – 2022 DRA
March 6, 2018
8-9

TABLE OF CONTENTS
EXECUTIVE SUMMARY .............................................................................................. i
1.0 INTRODUCTION.................................................................................................. 1
1.1 CBE Student Enrolment ................................................................................. 2
1.2 Calgary Suburban Growth and Development ................................................. 4
1.3 Framework for Growth and Change ............................................................... 6
1.4 City of Calgary Annexation ............................................................................. 6
2.0 CAPITAL STRATEGIES ................................................................................... 9
2.1 Calgary Board of Education ........................................................................... 9
2.2 Three-Year Education Plan .......................................................................... 10
2.3 Administrative Areas and Space Utilization .................................................. 11
2.4 Planning for Students ................................................................................... 15
2.5 New School Construction and School Approvals.......................................... 17
2.6 School Major Modernization ......................................................................... 19
2.7 Collaborative Initiatives with The City of Calgary .......................................... 20
3.0 NEW SCHOOL CONSTRUCTION CAPITAL PLAN CRITERIA .................. 20
3.1 Construction Planning Criteria: Kindergarten to GR9 Schools ..................... 21
3.2 Construction Ranking: Kindergarten to GR9 ............................................... 26
3.3 Construction Planning Criteria: Senior High Schools ................................... 27
3.4 Construction Priorities: Senior High Schools ............................................... 28
4.0 THREE-YEAR SCHOOL CAPITAL PLAN 2019-2022 - SUMMARY .......... 31
5.0 2019-2022 SCHOOL CAPITAL PLAN NEW CONSTRUCTION ................ 37
6.0 2019-2022 SCHOOL CAPITAL PLAN MAJOR MODERNIZATION ........... 50
APPENDIX I: Capacity and Utilization ............................................................. 66 APPENDIX II: Modernization Information .......................................................... 72 APPENDIX III: Community Ranking for New Schools ......................................... 74
APPENDIX IV: CBE System Utilizations ........................................................... 81
GLOSSARY OF TERMS .................................................................................... 82
8-10

Three-Year School Capital Plan 2019-2022 i
EXECUTIVE SUMMARY
This Three-Year School Capital Plan 2019-2022 is an analysis of the Calgary Board of Education (CBE’s) forecasted school capital needs, as assessed at the present time.
1. Calgary Population Over the past five years Calgary’s population growth has averaged just over 25,000 persons per year. In the Calgary & Region Economic Outlook 2017-2026 (Fall 2017), the City of Calgary (the City) is forecasting that the population of Calgary will reach 1,323,000 in 2022, an increase of 76,700 persons over the next five years. This five-year forecast represents a decreased rate of growth, with an average annual increase of 15,340 persons.
2. Student Enrolment The CBE’s current student enrolment of 121,691 is forecast to increase to 132,278 students by 2022. Taking into consideration the past five year average enrolment increase of just over 2,000 students per year and the City’s forecasted lower annual population growth, CBE is projecting a moderate level of growth over the next five years.
Note: Enrolment includes Home Education, Outreach/Unique Settings, Chinook Learning and CBeLearn.
8-11

Three-Year School Capital Plan 2019-2022 ii
3. Calgary Suburban Growth and Development
In spring 2017, CBE added two new administrative areas and changed the methodology for grouping schools into areas. The new area structure is based on relationships between schools rather than geography. A geographical reporting and analysis of data is required to understand where population and student enrolment growth will occur in the future. Starting with the School Capital Plan 2019-2022 CBE will use City of Calgary planning sectors for capital planning purposes. The table and map below show the City planning sectors and their projected population growth in the next few years.
4. Three-Year Education Plan Alberta Education requires school boards to maintain three-year plans, updated annually. School boards are responsible for carrying out their education plans; for reporting annually to parents, communities, and government on results and use of their resources; and, for using results information to update plans and improve education for students. The Board of Trustees approved the combined Annual Education Results Report 2016-2017 and the Three-Year Education Plan 2017-2020 on November 28, 2017.
5. Schools Under Construction and Approvals
Four new school construction projects and three high school major modernization projects are currently under development.
City Growth Trends by CBE Planning Sector
2017-2021
Planning Sector Population Forecast
Centre 17,000
East 600
Northeast 13,920
Northwest -
South 11,810
Southeast 16,700
West 2,620
8-12

Three-Year School Capital Plan 2019-2022 iii
The table below summarizes the projects under development, their approval dates and their projected opening/completion date.
Schools Under Construction and Approvals
Projected School Year
Opening School/Community Project Type Grade Approved Capacity
Approval Date
2018-2019
Joane Cardinal-Schubert High New Construction Grades 10-12 1,800 Oct. 8, 2014
James Fowler High Modernization Grades 10-12 n/a Oct. 8, 2014
Lord Beaverbrook High Modernization Grades 10-12 n/a Oct. 8, 2014
TBD
Coventry Hills/Country Hills Village Elementary (2)
New Construction Grades K-4 600 Mar. 21, 2017
Cranston Elementary (2) New Construction Grades K-4 600 Mar. 21, 2017
Evergreen Elementary (2) New Construction Grades K-4 600 Mar. 21, 2017
Forest Lawn High Modernization Grades 10-12 n/a Mar. 21, 2017
Total School Space Capacity 3,600
8-13

Three-Year School Capital Plan 2019-2022 iv
6. Capital Priorities – New School Construction There are 12 new school construction projects identified in the Three-Year School Capital Plan 2019-2022.
Note: 1 Senior high schools are not ranked using point criteria. (2) = second elementary school for the community
Number of Years
YEAR 1 Previously Listed
Grade Project Status Request Type 2018 Cost ($) in Capital Plan
C-1 Mahogany Elementary K-4 New Request Full buildout to 600 14,678,500 4
C-2 Auburn Bay Middle 5-9 New Request Full buildout to 900 27,860,000 4
C-3 1 North Calgary High 10-12 New Request Full buildout to 1800 59,128,000 5
C-4 Auburn Bay Elementary (2) K-4 New Request Full buildout to 600 14,678,500 0
C-5 Skyview Ranch Elementary/Middle K-9 New Request Full buildout to 900 27,860,000 5
YEAR 1 TOTAL 144,205,000
Grade Project Status Request Type 2018 Cost ($)
C-6 Evanston Middle 5-9 New Request Full buildout to 900 27,860,000 5
C-7 Evanston Elementary (2)K-4 New Request Full buildout to 600 14,678,500 0
C-8 Sage Hill Elementary K-4 New Request Full buildout to 600 14,678,500 4
C-9 Kincora Elementary K-4 New Request Full buildout to 600 14,678,500 6
YEAR 2 TOTAL 71,895,500
Grade Project Status Request Type 2018 Cost ($)
C-10 Sherwood/Nolan Hill Middle 5-9 New Request Full buildout to 900 27,860,000 2
C-11 Nolan Hill Elementary K-4 New Request Full buildout to 600 14,678,500 1
C-12 Cougar Ridge Elementary K-4 New Request Full buildout to 600 14,678,500 5
YEAR 3 TOTAL 57,217,000
GRAND TOTAL 273,317,500
Table 1: New School Construction
Three-Year School Capital Plan 2019-2022 Priorities
Priority Ranking – Project Description
Community/School
YEAR 2
Community/School
YEAR 3
Community/School
8-14

Three-Year School Capital Plan 2019-2022 v
7. Capital Priorities – Major Modernization Projects There are 10 major modernization projects identified in the Three-Year School Capital Plan 2019-2022.
Number of Years
Previously Listed
Grade Project Status Request Type 2018 Cost ($) in Capital Plan
M-1 John G. Diefenbaker High School 10-12 Modernization Request Major Modernization 27,000,000 9
M-2 Nickle School 5-9 Modernization Request Major Modernization 14,000,000 10
M-3 Ernest Morrow School 6-9 Modernization Request Major Modernization 16,000,000 4
YEAR 1 TOTAL 57,000,000
Grade Project Status Request Type 2018 Cost ($)
M-4 A.E. Cross School 7-9 Modernization Request Major Modernization 18,000,000 1
M-5 Janet Johnstone School K-4 Modernization Request Major Modernization 8,700,000 3
M-6 Annie Foote School K-6 Modernization Request Major Modernization 10,400,000 3
YEAR 2 TOTAL 37,100,000
Grade Project Status Request Type 2018 Cost ($)
M-7 Cedarbrae School K-6 Modernization Request Major Modernization 7,800,000 3
M-8 Altadore School K-6 Modernization Request Major Modernization 7,800,000 10
M-9 Ranchlands School K-6 Modernization Request Major Modernization 11,700,000 3
M-10 Queen Elizabeth School K-6 Modernization Request Major Modernization 8,700,000 3
YEAR 3 TOTAL 36,000,000
GRAND TOTAL 130,100,000
Table 2: School Major Modernizations
Three-Year School Capital Plan 2019-2022 Priorities
Priority Ranking – Project Description
YEAR 1
YEAR 2
Community/School
YEAR 3
Community/School
8-15

Three-Year School Capital Plan 2019-2022 vi
8. Capital Priorities – New Construction & Major Modernizations
There are 22 new construction and major modernization projects identified in the Three-Year School Capital Plan 2019-2022.
Note: 1 Senior high schools are not ranked using point criteria. (2) = second elementary school for the community
Number of Years
YEAR 1 Previously Listed
Grade Project Status Request Type 2018 Cost ($) in Capital Plan
1 Mahogany Elementary K-4 New Request Full buildout to 600 14,678,500 4
2 Auburn Bay Middle 5-9 New Request Full buildout to 900 27,860,000 4
3 1 North Calgary High 10-12 New Request Full buildout to 1800 59,128,000 5
4 Auburn Bay Elementary (2) K-4 New Request Full buildout to 600 14,678,500 0
5 Skyview Ranch Elementary/Middle K-9 New Request Full buildout to 900 27,860,000 5
6 John G. Diefenbaker High School 10-12 Modernization Request Major Modernization 27,000,000 9
7 Nickle School 5-9 Modernization Request Major Modernization 14,000,000 10
8 Ernest Morrow School 6-9 Modernization Request Major Modernization 16,000,000 4
YEAR 1 TOTAL 201,205,000
Grade Project Status Request Type 2018 Cost ($)
9 Evanston Middle 5-9 New Request Full buildout to 900 27,860,000 5
10 Evanston Elementary (2)K-4 New Request Full buildout to 600 14,678,500 0
11 A.E. Cross School 7-9 Modernization Request Major Modernization 18,000,000 1
12 Sage Hill Elementary K-4 New Request Full buildout to 600 14,678,500 4
13 Janet Johnstone School K-4 Modernization Request Major Modernization 8,700,000 3
14 Kincora Elementary K-4 New Request Full buildout to 600 14,678,500 6
15 Annie Foote School K-6 Modernization Request Major Modernization 10,400,000 3
YEAR 2 TOTAL 108,995,500
Grade Project Status Request Type 2018 Cost ($)
16 Sherwood/Nolan Hill Middle 5-9 New Request Full buildout to 900 27,860,000 2
17 Cedarbrae School K-6 Modernization Request Major Modernization 7,800,000 3
18 Altadore School K-6 Modernization Request Major Modernization 7,800,000 10
19 Nolan Hill Elementary K-4 New Request Full buildout to 600 14,678,500 1
20 Cougar Ridge Elementary K-4 New Request Full buildout to 600 14,678,500 5
21 Ranchlands School K-6 Modernization Request Major Modernization 11,700,000 3
22 Queen Elizabeth School K-6 Modernization Request Major Modernization 8,700,000 3
YEAR 3 TOTAL 93,217,000
GRAND TOTAL 403,417,500
Table 3: New School Construction and Major Modernizations
Three-Year School Capital Plan 2019-2022 Priorities
Priority Ranking – Project Description
Community/School
YEAR 2
Community/School
YEAR 3
Community/School
8-16

Three-Year School Capital Plan 1
1.0 INTRODUCTION
The Calgary Board of Education (CBE) is a global leader in public education. Recognized as the largest school district in Western Canada, the CBE provides a full range of educational services for all instructional programs from kindergarten through to Grade 12. The CBE addresses the complexity and diversity of our 121,691 students (including Adult Education) in over 245 schools with more than 14,000 staff and an operating budget of $1.4 billion. Over the past decade, Calgary has experienced varying levels of population growth. Calgary’s population has increased by 126,075 people in the last five years, an average of 25,215 people per year. The population grew from 1,235,171 in April 2016 to 1,246,337 in April 2017 (2017 Civic Census), an increase of 11,166 (0.90%). The population growth consisted of a natural increase of 10,192 people with a net migration of 974 people (2017 Civic Census). The City of Calgary’s report, Calgary and Region Economic Outlook 2017-2026 (Fall 2017), identifies continued growth for Calgary. The City forecast contained in the report projects the population of Calgary will reach 1,323,000 by 2022, an increase of 76,700 people from the 2017 total of 1,246,300. This population forecast averages 15,340 people per year during this period and is similar to the previous five-year forecast.
2013 2014 2015 2016 2017 2018 2019 2020 2021 2022
1,157 1,195 1,231 1,235 1,246 1,259 1,272 1,285 1,303 1,323
Calgary & Region Economic Outlook 2017-2026 (Fall 2017)
Calgary Total Population (,000s)
Actual Projected
8-17

Three-Year School Capital Plan 2
1.1 CBE Student Enrolment
Total enrolment of 121,691 students was reported on September 30, 2017, and consists of 116,846 pre-kindergarten to Grade 12 students plus 4,845 students enrolled in Home Education, Outreach Programs, Unique Settings, Chinook Learning and CBe-learn.
Enrolment increased by 2,544 students from September 30, 2016, to September 30, 2017, with notable increases in Grades 4-6 (1,468 students), Grades 7-9 (975 students) and Grades 10-12 (592 students).
Students continue to access program choices offered by the CBE. Enrolment in alternative programs is 24,888 which is an increase of 730 over the previous year. The alternative programs with the highest enrolment are French Immersion (8,686), Traditional Learning Centre (TLC) (6,588) and Spanish Bilingual (3,619).
The following table provides a summary of enrolments including Unique Settings, Outreach Programs, Chinook Learning, and CBe-learn from September 30, 2013, to September 30, 2017.
Five-Year History of Enrolments by Division
2013-2017
2013 2014 2015 2016 2017
Pre-Kindergarten 145 176 180 197 228
Kindergarten 8,936 9,213 9,209 9,106 9,053
Grades 1-3 25,959 27,649 28,888 29,410 29,080
Grades 4-6 22,552 23,604 24,441 25,715 27,183
Grades 7-9 21,751 22,237 22,624 23,292 24,267
Grades 10-12 26,270 26,420 26,375 26,443 27,035
Sub-Total (pre-k to grade 12) 105,613 109,299 111,717 114,163 116,846
Home Education 297 248 270 249 267
Outreach and Unique Settings 1,772 1,971 2,060 2,066 2,141
Chinook Learning Services 2,515 2,393 2,327 2,211 1,974
CBe-learn 566 589 611 458 463
Sub-Total 5,150 5,201 5,268 4,984 4,845
Total 110,763 114,500 116,985 119,147 121,691
Five-Year Enrolment Projections
The CBE uses the Cohort-Survival methodology in preparing enrolment projections. The cohort survival projection methodology uses historic birth data and historic student enrolment data to “age” a known population (cohort) through their school grades. The cohort survival ratio is calculated to see how a group of potential students first enter the system at kindergarten and Grade 1 (market share) and how this group of students grows or shrinks over time (retention rates). Enrolment patterns emerge that are used for projections.
8-18

Three-Year School Capital Plan 3
The CBE uses pre-school census information, which is collected annually for all communities, combined with historic intake rates at kindergarten and Grade 1 to project how many students will enter our system each year. The annual September 30 enrolment data is used as a base for establishing retention rates that are used to project how existing student populations move through the system from one year to the next.
City of Calgary population projections are not a direct factor in CBE’s enrolment projections but they do provide context for comparison. Trends reported by the City with respect to net migration and natural increase (births minus deaths) are considered when evaluating future student growth.
CBE’s current enrolment of 121,691 students is forecast to increase to 132,278 students by 2022. An increase of 10,587 students is projected averaging approximately 2,100 additional students annually. Taking into consideration the past five year average enrolment increase of just over 2,000 students per year and the City’s forecasted lower annual population growth, CBE is projecting a moderate level of growth over the next five years. The largest increase over this five-year timeframe is projected to be in Grades 7-9 and Grades 10-12.
Chinook Learning and CBe-learn register students continually throughout the year. The enrolment reported for both Chinook Learning and CBe-learn represent students who are only enrolled in either of those two programs and not accessing programming at another CBE school. Students enrolled in other CBE schools, that are accessing one or more courses at either Chinook Learning or CBe-learn, are reported in the pre-kindergarten to Grade 12 enrolment. The enrolment reported for Chinook Learning includes students enrolled in academic success programs (high school classes) and does not include students in Adult English Language Learning (ELL) or Continuing Education (personal and professional development).
For September 2018, CBE is implementing a new accommodation plan for Chinook Learning. As part of the model going forward Chinook Learning academic success programs (high school classes) will be transitioned into James Fowler High School and Lord Beaverbrook High School. To accommodate the smaller footprint of these facilities, student age will be limited to those who are 19 years of age by September 1 in the year they enrol in classes. This change is projected to reduce enrolment for 2018 by approximately 550 students compared to September 30, 2017 enrolment.
8-19

Three-Year School Capital Plan 4
The top ten developing communities to receive residential building permit applications in Calgary for 2016 were:
• Mahogany (SE) • Cornerstone (NE) • Saddle Ridge (NE) • Skyview Ranch (NE) • Auburn Bay (SE) • Nolan Hill (N) • Legacy (S) • Walden (S) • Evanston (N) • West Springs (W)
(Source: Suburban Residential Growth 2017-2021, p. A2-6, A2-7)
A summary of the September 2017 actual student enrolments and September 2018-2022 projected enrolments are below:
Five-Year Enrolment Projections
2018-2022
Actual Projected
2017 2018 2019 2020 2021 2022
Pre-Kindergarten 228 245 245 245 245 245
Kindergarten 9,053 8,608 8,678 7,692 8,384 8,384
Grades 1-3 29,080 28,984 28,716 28,752 28,458 28,207
Grades 4-6 27,183 28,220 28,655 28,338 28,239 27,977
Grades 7-9 24,267 25,295 26,738 28,263 29,344 29,803
Grades 10-12 27,035 27,804 28,846 30,053 31,306 33,091
Sub-Total (pre-k to grade 12) 116,846 119,155 121,878 123,342 125,976 127,707
Home Education 267 273 279 285 288 295
Outreach and Unique Settings 2,141 2,191 2,234 2,286 2,314 2,362
CBe-learn 463 468 473 478 484 489
Chinook Learning 1,974 1,425 1,425 1,425 1,425 1,425
Sub-Total 4,845 4,358 4,411 4,474 4,510 4,571
Total Student Count 121,691 123,513 126,289 127,816 130,486 132,278
totals may not add due to rounding
CBe-learn and Chinook Learning accept registrations on an on-going basis. All projections are subject to annual review and update. Projections use September 30, 2017, enrolments as a base.
1.2 Calgary Suburban Growth and Development
The City of Calgary supports an actively competitive land market in all areas of the city and there over 25 new and developing municipal communities in various stages of development. The large number of concurrently developing communities puts increased pressure on the CBE to meet the expectations of parents for school construction in their community. Although the number of communities has declined slightly over the last decade, the size of the communities being planned and built today are much larger than they have been historically. Forecasted Suburban Growth
The City of Calgary prepares a suburban residential growth forecast each year and publishes the final version of this report in May each year. As such, the suburban growth information used in the Three-Year School Capital Plan 2019-2022 is based on the City’s Suburban Residential Growth 2017-2021 published in May 2017. This document allocates future population growth to the eight city planning sectors. This information provides CBE with a context for where student population growth will be expected in the future.
8-20

Three-Year School Capital Plan 5
The largest population growth projected over the next five years is in the north, northeast and southeast. A summary of the five-year period forecast from the Suburban Residential Growth 2017-2021 for suburban locations is as follows:
8-21

Three-Year School Capital Plan 6
Four largest growing communities between 2016 and 2017:
• Auburn Bay (SE) - 1,087 people • Evanston (N) –1,621 people • Legacy (S) - 1,560 people • Nolan Hill (N) – 1,556 people Additional communities that grew by more than 1,000 residents between 2016 and 2017: • Skyview Ranch (NE) • Mahogany (SE) • The Beltline (C) • Redstone (NE)
(Source: 2017 Civic Census)
1.3 Framework for Growth and Change
The new Municipal Development Plan (MDP), Plan It Calgary, was implemented April 1, 2010, and is the overarching policy that documents municipal development and transportation. Plan It Calgary intends to reduce the amount of growth allocated to the developing communities, which is essentially 100% and to intensify the inner-city and established areas with additional population. The 30-year target of the plan for growth into established areas is 33% and the 60-year target is 50% growth to established areas.
The CBE has identified concerns over the past decade, in annual school capital plans, regarding the large number of concurrently developing communities. The City supports an actively competitive land market in all areas of the city and there are over 25 new and developing municipal communities in various stages of development. The large number of developing communities puts increased pressure on the CBE to meet the expectations of parents for new school construction in their community.
1.4 City of Calgary Annexation
Previously Annexed Lands
The majority of the 36,000 acres annexed to the City of Calgary, from the MD of Foothills in 2005 and MD of Rocky View in 2007, remain outside of the CBE’s jurisdictional boundary. The Minister of Education has identified it is in the best interest of the students to retain the existing school boundaries until urban development warrants change. The Minister has indicated that annexed lands would be brought into the CBE inventory as area structure plans are finalized and urban development proceeds. The Calgary City Council has approved regional context studies to guide development in the newly annexed lands: East Regional Context Study (April 2009) with an eventual population of
160,000 persons and approximately 22,000 jobs upon full build-out.
West Regional Context Study (April 2010) with an eventual population of 22,000 people and 7,000 jobs upon full build-out.
North Regional Context Study (June 2010) with an eventual population of 216,000 persons and approximately 69,000 jobs on full build-out.
8-22

Three-Year School Capital Plan 7
A map on page 9 identifies these locations. Detailed Area Structure Plans (ASP) have been, or are being, undertaken to guide future planning in the annexed lands. The CBE participated in meetings, discussions and plan preparation, to enable long-term school planning in following areas: The West View Area Structure Plan will accommodate a population of
approximately 8,300 persons. The ASP has been on hold since December 2010 while the Province conducts a functional study to determine the access location to the West View area.
The Keystone Hills Area Structure Plan was approved July 16, 2012 and will accommodate a population of approximately 60,000 persons.
The Belvedere Area Structure Plan on the east was approved April 8, 2013 and will accommodate a future population of approximately 61,000 persons.
The South Shepard Area Structure Plan was approved May 6, 2013 and will accommodate a population of approximately 28,000 persons.
The West Macleod Area Structure Plan was approved June 10, 2014 and will accommodate a population of approximately 34,000 persons.
The Haskayne Area Structure Plan was approved July 22, 2015 and will accommodate a population of approximately 13,000 persons.
The Glacier Ridge Area Structure Plan was approved December 7, 2015 and will accommodate a population of approximately 58,000 persons.
Once house construction begins, CBE will request, on an as required basis, that the Minister include these lands as part of CBE school boundaries. In alignment with the request by the Ministry of Education that urban development be occuring, in February 2018 the CBE requested that the west section of the Crestmont community and the northern portion of the Livingston community (north of 144 Avenue NE), that are outside the CBE boundary be incorporated into the CBE boundary. In addition, the CBE anticipates requesting the addition of Belmont and Yorkville (in the West McLeod ASP) during the 2018-2019 school year as developers have indicated home possessions are anticipated to start in January 2019.
8-23

Three-Year School Capital Plan 8
Map 1
8-24

Three-Year School Capital Plan 9
2.1 Calgary Board of Education
CBE has identified the following drivers for capital planning: Program Delivery – Projects that are required to enable the delivery of
school programs e.g. Career and Technology Studies (CTS) and Career and Technology Framework (CTF).
Community Schools – New schools required in rapidly growing communities in order to minimize student travel times and meet needs for a local school in their community.
Aging Facilities – Older schools that require modernization, rehabilitation or replacement to provide appropriate learning environments for students. It is estimated the cost for the major maintenance and repair of CBE educational facilities is in excess of $1.1 billion.
Optimizing School Utilization Rates – Ensuring appropriate school utilization rates can optimize the programming opportunities available to students within the limited public resources entrusted to the CBE.
A balanced approach for the plan is developed to ensure the CBE is pursuing capital funding opportunities that recognize the changing needs of students and are focused on building strong ties with parents, partners, and the community. More specifically, the CBE recognizes:
Provincial funding is required for new school construction in new and developing communities;
Parents desire schools to be closer to home, especially for younger students; Increasing public demand for program alternatives; Transitions for students with minimal disruption are valued as they provide
continuity of learning with consistent peer cohorts.
This approach to planning anticipates a system of core elementary feeder schools for local school communities (attendance areas), complemented with middle/junior high, and senior high schools serving larger geographic areas.
Projects are also required to ensure programming requirements are met through school modernizations. High priority program delivery projects are listed below.
Chinook Learning
CBE is implementing a new accommodation plan for Chinook Learning. The model going forward will see Chinook Learning transitioned into James Fowler High School, Lord Beaverbrook High School, Forest Lawn High School and the Career and Technology Centre (CTC). The 2017-18 James Fowler High School utilization rate is at 47%. The utilization rate for Lord Beaverbrook High School is projected to drop below 40% with the opening of Joane Cardinal-Schubert High School in the 2018-19 school year. The relocation of Chinook Learning into these schools will positively impact their utilization rate.
2.0 CAPITAL STRATEGIES
8-25

Three-Year School Capital Plan 10
Career and Technology Studies – In October 2014, CBE received funding
approval to modernize James Fowler (centre sector) and Lord Beaverbrook (south sector) high schools. As well, CBE received funding approval March 21, 2017, for Forest Lawn (northeast sector). Once complete, these modernizations will support delivery of CTS curriculum and provide access to state of the art spaces for students living within those respective sectors of Calgary.
2.2 Three-Year Education Plan
Alberta Education requires school boards to maintain three-year plans, updated annually. School boards are responsible for carrying out their education plans; for reporting annually to parents, communities, and government on results and use of their resources; and, for using results information to update plans and improve education for students. The Board of Trustees approved the combined Annual Education Results Report 2016-2017 and the Three-Year Education Plan 2017-2020 on November 28, 2017. A summary of Facilities and Capital Plans identifying new school construction projects and major modernization projects is included in the Annual Education Results Report.
Long-range education plans will continue to be developed and these plans will inform the three year School Capital Plan and the ten year Student Accommodation and Facilities Strategy to ensure that programs and services for students are provided in suitable facilities in appropriate locations. Education planning information will be based on: the Three-Year Education Plan and other program development undertaken through the Chief Superintendent’s office, Learning, and the respective Area Offices. This information, in conjunction with the Three-Year School Capital Plan, Three-Year System Student Accommodation Plan and facility information, will be used to inform school program and facility upgrade strategies for schools.
Facility and capital project plans will be developed through the Facilities and Environmental Services Unit based upon approvals obtained for new school construction, replacement schools, modernizations, facility maintenance, facility upgrades and other projects, as identified in this and other plans approved by the Board of Trustees.
8-26

Three-Year School Capital Plan 11
2.3 Administrative Areas and Space Utilization
In spring 2017, CBE added two new administrative areas and changed the methodology for grouping schools into areas. The CBE is now divided into seven administrative areas. This new area structure is based on relationships between schools rather than geography.
A geographical reporting and analysis of data is required to understand where population and student enrolment growth will occur in the future. Starting with the School Capital Plan 2019-2022 CBE will use City of Calgary planning sectors for capital planning purposes.
Within each of these planning sectors, the CBE annually reviews new and developing communities for new school construction eligibility. The Province has indicated that utilization is reviewed when evaluating a jurisdiction’s capital priorities; however the utilization rate in a sector is not a firm requirement but rather a guideline. The CBE strives to maintain a utilization rate in a mid-80% range. Ensuring healthy school utilization rates contributes to ensuring that facilities are optimized for educational purposes, maintaining flexibility within the system to meet demand for emergent considerations while balancing the financial obligations and sustainability of the system. Currently, the CBE’s overall utilization rate by enrolment is 83%. The utilization rate is 81% for K-GR9 students and 88% for Grades 10-12 students. A summary of utilization by enrolment and by residence follows below and is included in detail in Appendix I. Utilization by enrolment identifies the number of students attending schools expressed as a percentage of the total capacity. Utilization by enrolment represents the actual utilization currently experienced at schools within the planning sector. Utilization by residence identifies the number of students residing in the planning sector expressed as a percentage of the total school capacity within that planning sector. Utilization by residence represents the utilization rate that would exist if the CBE were not able to accommodate students in planning sectors but rather accommodated the students in the facilities that exist within the planning sector where they live.
8-27

Three-Year School Capital Plan 12
Projections for 2022-2023 account for additional school capacity that has been approved and is currently under construction but does not include additional capacity for schools requested in this capital plan in both the charts below:
Planning Sector Utilization by Student Enrolment (Actual & Projected)
Sector
2017-2018 Actual 2022-2023 Projections
K-12 K-12
Utilization Utilization
Centre 82.0% 92.9% East 73.6% 76.7% North 90.8% 103.5%
NorthEast 86.9% 95.6% NorthWest 86.3% 86.3%
South 79.1% 77.8% SouthEast 82.8% 101.2%
West 80.9% 80.5% Total 82.9% 88.3%
Planning Sector Utilization by Student Residence (Actual & Projected)
Sector
2017-2018 Actual 2022-2023 Projections
K-12 K-12
Utilization Utilization
Centre 47.7% 58.3% East 65.1% 68.0% North 147.2% 157.2%
NorthEast 98.0% 106.7% NorthWest 79.3% 79.3%
South 65.8% 70.1% SouthEast 138.9% 130.2%
West 80.5% 80.2% Total 82.5% 87.9%
8-28

Three-Year School Capital Plan 13
Map 2
8-29

Three-Year School Capital Plan 2019-2022 14
Municipal Community Code Definitions
ABB Abbeydale ACA Acadia ALB Albert Park/Radisson Heights ALT Altadore APP Applewood Park ARB Arbour Lake ASP Aspen Woods AUB Auburn Bay BNF Banff Trail BNK Bankview BYV Bayview BED Beddington Heights BEL Bel-Aire BLN Beltline BDO Bonavista Downs BOW Bowness BRA Braeside BRE Brentwood BRD Bridgeland/Riverside BRI Bridlewood BRT Britannia CAM Cambrian Heights CAN Canyon Meadows CAP Capitol Hill CAS Castleridge CED Cedarbrae CUR Currie Barricks CHA Chaparral CHW Charleswood CHN Chinatown CHK Chinook Park CHR Christie Park CIT Citadel CSC Cityscape CLI Cliff Bungalow COA Coach Hill COL Collingwood CPF Copperfield COR Coral Springs CGR Cougar Ridge CHV Country Hills Village COU Country Hills COV Coventry Hills CRA Cranston CRE Crescent Heights CRM Crestmont DAL Dalhousie DRG Deer Ridge DRN Deer Run DIA Diamond Cove DIS Discovery Ridge DDG Douglasdale/Glen DOV Dover DNC Downtown Commercial Core DNE Downtown East Village DNW Downtown West End EAG Eagle Ridge EAU Eau Claire EDG Edgemont EPK Elbow Park EYA Elboya ERI Erin Woods ERL Erlton EVN Evanston EVE Evergreen FAI Fairview FAL Falconridge FHT Forest Heights FLN Forest Lawn
GAG Garrison Green GAW Garrison Woods GLA Glamorgan GBK Glenbrook GDL Glendale GRV Greenview GRI Greenview Industrial Park GRE Greenwood/Greenbriar HAM Hamptons HAR Harvest Hills HAW Hawkwood HAY Haysboro HID Hidden Valley HPK Highland Park HIW Highwood HIL Hillhurst HOU Hounsfield Heights/Briar Hill HUN Huntington Hills ING Inglewood KEL Kelvin Grove KIL Killarney/Glengarry KCA Kincora KIN Kingsland LKB Lake Bonavista LKV Lakeview LEG Legacy LPK Lincoln Park LMR Lower Mount Royal LYX Lynx Ridge MAC MacEwan Glen MAH Mahogany MAN Manchester MPL Maple Ridge MRL Marlborough MPK Marlborough Park MRT Martindale MAF Mayfair MAL Mayland Heights MCK McKenzie Lake MCT McKenzie Towne MEA Meadowlark Park MID Midnapore MLR Millrise MIS Mission MOR Monterey Park MON Montgomery MOP Mount Pleasant NEB New Brighton NOL Nolan Hill NGM North Glenmore Park NHV North Haven NHU North Haven Upper OAK Oakridge OGD Ogden PAL Palliser PAN Panorama Hills PKD Parkdale PKH Parkhill PKL Parkland PAT Patterson PEN Penbrooke Meadows PIN Pineridge POI Point McKay PUM Pump Hill QPK Queen’s Park Village QLD Queensland RAM Ramsay RAN Ranchlands RED Red Carpet
RSN Redstone REN Renfrew RIC Richmond RID Rideau Park RIV Riverbend ROC Rocky Ridge RDL Rosedale RMT Rosemont RCK Rosscarrock ROX Roxboro ROY Royal Oak RUN Rundle RUT Rutland Park SAD Saddle Ridge SGH Sage Hill SAN Sandstone Valley SCA Scarboro SSW Scarboro/Sunalta West SCE Scenic Acres SET Seton SHG Shaganappi SHS Shawnee Slopes SHN Shawnessy SHW Sherwood SIG Signal Hill SIL Silver Springs SVO Silverado SKR Skyview Ranch SOM Somerset SOC South Calgary SOV Southview SOW Southwood SPH Springbank Hill SPR Spruce Cliff STA St. Andrews Heights STR Strathcona Park SNA Sunalta SDC Sundance SSD Sunnyside TAR Taradale TEM Temple THO Thorncliffe TUS Tuscany TUX Tuxedo Park UNI University Heights UOC University of Calgary UMR Upper Mount Royal VAL Valley Ridge VAR Varsity VIS Vista Heights WAL Walden WHL West Hillhurst WSP West Springs WGT Westgate WHI Whitehorn WLD Wildwood WIL Willow Park WND Windsor Park WIN Winston Heights/Mountview WBN Woodbine WOO Woodlands
8-30

Three-Year School Capital Plan 2019-2022 15
2.4 Planning for Students
Sites for New Schools The identification and establishment of school sites within any new community in Calgary is a complex process. The CBE works with The City of Calgary, the Calgary Catholic School District (CCSD) and community developers to select school sites based on catchment areas within future developments. There is a balance between population, number and type of residential units, location and land dedication. Land for high school sites, which serve a larger geographic region is purchased through the Joint Use Coordinating Committee (JUCC). The requirement to purchase land for a high school is identified during the regional context study phase when developments that are planned for a minimum of 50,000 to 60,000 residents are considered for approval by the City of Calgary. In the case land for elementary and middle schools, school boards calculate the amount of land developers must allocate for K-9 school sites. The number and type of school sites required is based on the Joint Use Site Calculation Methodology. This methodology uses the estimated number of single and multi-family units in an Area Structure Plan (ASP) multiplied by the average number of children aged 5-14 per housing unit by type. As a more general guideline to determine an approximate number of schools, a target of one elementary school for every 10,000 residents, one middle school for every 15,000 to 20,000 residents and a high school for every 50,000 to 60,000 residents is used. Many of the new communities in Calgary are large enough that once full build out has been achieved, the community will require a minimum of one elementary and one middle school to accommodate the students living in the community. Larger communities, once they are fully built-out, will require two elementary schools and one middle school to accommodate students.
Working with Stakeholders CBE is committed to working with stakeholders and has developed a Dialogue Framework to guide this work. This framework guides public engagement when CBE considers the future use of existing learning space in schools. The CBE’s dialogue framework is available at http://www.cbe.ab.ca/get-involved/public-engagement/Pages/default.aspx System Student Accommodation Plan The CBE has a Three-Year System Student Accommodation Plan to inform appropriate decision-making and timely engagement for community members and parents in CBE accommodation planning. The process applies to and informs recommendations regarding all school and program accommodation issues. The Three-Year System Student Accommodation Plan is developed to
8-31

Three-Year School Capital Plan 16
support and reflect the Three-Year Education Plan, Three-Year School Capital Plan, and the ten year Student Accommodation and Facilities Strategy. Student accommodation needs are identified by the Planning & Transportation department in consultation with Area Directors. Administration is responsible for using CBE’s Dialogue framework to engage internal and external stakeholders regarding student accommodation challenges. The Three Year System Student Accommodation Plan 2017-2020 was presented for information at the June 20, 2017, Board of Trustees meeting and is available on the CBE website at: http://www.cbe.ab.ca/FormsManuals/Three-Year-System-Student-Accommodation-Plan.pdf
Program Opportunities for Students The CBE is committed to a balance among equity, access, excellence, and choice within the school system and consequently offers a wide variety of programs for students of all ages. Programs are designed to enrich the lives of students and to promote quality learning. We recognize the many diverse ways of learning and the many interests and abilities of students. Through the Three-Year System Student Accommodation Plan, these programs are initiated where space is available and as close as possible to where demand for the programs exists. Information about programming opportunities for students can be found at: http://www.cbe.ab.ca/programs/Pages/default.aspx
8-32

Three-Year School Capital Plan 17
2.5 New School Construction and School Approvals
Five new school construction projects and two high school major modernization projects are currently under development. The table below summarizes the projects under development, their approval dates and their projected opening/completion date.
Schools Under Construction and Approvals
Projected
School Year
Opening School/Community Project Type Grade
Approved
Capacity
Approval
Date
2018-2019
Joane Cardinal-Schubert High New Construction Grades 10-12 1,800 Oct. 8, 2014
James Fowler High Modernization Grades 10-12 n/a Oct. 8, 2014
Lord Beaverbrook High Modernization Grades 10-12 n/a Oct. 8, 2014
TBD
Coventry Hills/Country Hills Village
Elementary (2) New Construction Grades K-4 600
Mar. 21, 2017
Cranston Elementary (2) New Construction Grades K-4 600 Mar. 21, 2017
Evergreen Elementary (2) New Construction Grades K-4 600 Mar. 21, 2017
Forest Lawn High Modernization Grades 10-12 n/a Mar. 21, 2017
Total School Space Capacity 3,600
8-33

Three-Year School Capital Plan 18
Map 3 identifies the location of future school openings approved between October 8, 2014 and March 21, 2017.
Map 3
8-34

Three-Year School Capital Plan 2019-2022 19
2.6 School Major Modernization
School major modernization projects provide for the renovation of whole or part of a school building for both present and future educational programs. These modernizations address physical obsolescence and/or improve functional adequacy and suitability. School major modernization projects should not exceed 75% of the replacement value of the school building as per provincial guidelines. To support the delivery of new CTS curriculum, modernizations of James Fowler, Lord Beaverbrook and Forest Lawn High schools have been approved to include the following improvements:
Focus on upgrading CTS spaces Partial mechanical and electrical systems upgrades Minor building envelope and interior upgrades Building code and barrier free access upgrades
The CBE has a current count of over 260 owned facilities of which 177 were built before 1980. This represents approximately 70% of CBE’s school building inventory. The current inventory by decade of CBE school buildings is shown in the following graph:
In 2004, the Province undertook a rolling condition assessment of schools in the Renewal Capital Asset Planning Process (RECAPP) and planned to audit CBE facilities every five years. In the spring of 2009, Alberta Infrastructure recommenced evaluations starting with the former 2004 assessments, thus continuing the five-year assessment cycle. Approximately 40 to 50 facilities are audited every year. Findings of the re-evaluation are incorporated into maintenance, modernization, and facility planning for CBE projects. This Provincial audit information, now called VFA, factors into CBE’s assessment in determining modernization priorities.
1
12
3 3 1
52
68
37
22
11
20
32
0
20
40
60
80
1900 1910 1920 1930 1940 1950 1960 1970 1980 1990 2000 2010
Age Distribution of Facilities
Number of Facilities Opened
8-35

Three-Year School Capital Plan 20
The CBE continues to rank facilities for major modernizations. The criteria used for establishing major modernization priorities are reviewed periodically. The most recent criteria review began in May 2014 and revisions recommended as a result of the review were presented to the Board of Trustees and approved on October 7, 2014. Details of major modernization ranking can be found in Appendix II on pages 79 - 80.
2.7 Collaborative Initiatives with The City of Calgary
For many years, the CBE and The City of Calgary have enjoyed a strong working relationship. This relationship involves both city-wide initiatives and specific initiatives focused on property, leasing, and infrastructure. The following initiatives are examples of the CBE working together with the City:
The CBE is party to the Joint Use Agreement and participates on the Joint Use Coordinating Committee (JUCC) with the City and the CCSD dealing with the determination of municipal and school reserve sites.
The CBE is a member of the Site Planning Team (SPT) with the City and the CCSD that meets every two weeks to review and discuss development applications and issues related to public access of City and school facilities.
CBE representatives have been involved in many city-wide initiatives such as the new Pedestrian Strategy, School Sites Review project, Green Line Thorncliffe Station Area redevelopment, and Traffic Safety Community meetings.
The CBE has also worked collaboratively with the City and CCSD on a tripartite City Charters Memorandum of Understanding. More recently, this work has grown to include the Government of Alberta’s Urban School Planning Collaboration Sub-Table with the objective of maximizing the benefits derived from school sites for students and the public.
3.0 NEW SCHOOL CONSTRUCTION CAPITAL PLAN CRITERIA
The CBE does not rank alternative programs for new school construction. As schools are opened in new suburbs, vacancies are created in the bus receiver schools where those students attended prior to the opening of the new school. Administration works to identify opportunities to expand or relocate alternative programs into these spaces as they become available.
In the new and developing municipal communities, elementary school communities generally reflect municipal community boundaries. The junior high and middle school communities can serve one large municipal community or two or more small-to-medium-sized municipal communities. In the inner-city and established areas, school communities tend to cover larger geographic areas for elementary, junior high, and middle schools, and do not always align with municipal community boundaries as there is a large range of municipal community sizes and demographics.
8-36

Three-Year School Capital Plan 21
3.1 Construction Planning Criteria
The ranking of new school construction priorities is an important issue for all community stakeholders. The CBE first established ranking criteria for new construction priorities in January 2002. The model was designed to be transparent, objective and impart equity and fairness to all Calgary communities. Over the years, these criteria have been reviewed and adjusted periodically as necessary. The most recent criteria review began in May 2014 and revisions recommended as a result of the review were presented to the Board of Trustees and approved on October 7, 2014.
There are two types of criteria in the evaluation process used to rank school communities for capital building priorities in the Three-Year School Capital Plan. These are as follows:
1. Eligibility Criteria acts as a screening filter for new capital projects and must be met before a school project proceeds to the ranking phase.
2. Ranking Criteria that will be used to further evaluate and prioritize new capital projects.
Eligibility Criteria
Eligible School Communities
All new and developing municipal communities are evaluated and ranked for new school construction. Inner-city and established communities are not ranked. Most municipal communities have an elementary site and are ranked individually as a school community. When determining whether to group communities, the CBE uses the projected population based on the full build-out of the community, not the existing population in any given year. If two communities were combined for a new school ranking based on current population, even though the projected population at build-out indicates that each community will require their own school in the longer term, one of the communities would need to be moved to a different school in the future. Past experience has shown that stakeholders are resistant to designation changes once a school exceeds capacity. In certain cases, the CBE will continue to combine communities for new school ranking when the build-out populations of the combined communities are such that the school is anticipated to accommodate the students from both communities in the long term. Two small municipal communities will be combined for elementary school ranking where they do not exceed a combined projected community population threshold of approximately 10,000 people. In the case of middle/junior high schools, adjacent municipal communities may be combined if they do not exceed a combined projected population threshold of approximately 24,000 people. Community build-out projections may vary from year to year due to ongoing adjustments to densities and other factors as determined by the City. Large municipal communities that can sustain a middle/junior high school are ranked individually as a school community.
8-37
Three-Year School Capital Plan 22
Accommodation Options
This criterion is used to evaluate student accommodation options for eligible school communities. In some cases, an accommodation option may exist in a nearby community and a school community may not need to be ranked for new school construction. One example would be the accommodation of Bridlewood GR7-9 students in Samuel W. Shaw School which is located in the adjacent community of Shawnessy. As a result of this accommodation option, the CBE does not currently rank Bridlewood as a priority for a middle/junior high school. Site Availability and Readiness
High school sites require larger land parcels that will service multiple communities. As such the land required for these sites is acquired under the Joint Use Agreement, a tripartite agreement between the City, CBE and CCSD. The requirement to purchase land for a high school is identified during the regional context study phase when developments that are planned for a minimum of 50,000 to 60,000 residents are considered for approval by the City of Calgary. Accordingly new high school construction is only considered where a site is available - see Map 4 on page 30 for locations of CBE high school sites. Moreover, for any site irrespective of the grade configuration of the school, if a site has not been developed/serviced to the level at which construction of a school would be possible within a 12 month timeframe, the school will not be ranked as a construction priority for that year’s Three-Year School Capital Plan. Site readiness is reviewed and assessed on an annual basis. Developers are required to obtain both Final Acceptance Certificate (FAC) and Construction Completion Certificate (CCC) from the City. These certificates ensure that developers have met all obligations and sites are ready for ‘turn-over’ to the future landowners which means sites are ready for building construction. Site readiness includes, but is not limited to: receiving land title for the site, complete with legal description and
appropriate zoning services (water, sewer, electricity, etc.) are in place and ready for hook up site has suitable topography and no geotechnical or foundational concerns
(for construction) environmental site assessments are complete; normally already completed
by the developer through FAC and CCC obligations to the City confirmation the site exists outside of the 1:500 year floodplain site has adequate access for both construction and usage
Typically, the CBE would like to receive sites with both FAC and CCC finalized, but, in emergent cases, where the site is required for immediate construction needs, a developer can be released from their obligations over the building envelope area, with those obligations being transferred to the CBE to complete. Examples of obligations would be site grading, landscaping, site drainage, connections to City services.
8-38

Three-Year School Capital Plan 23
Ranking Criteria:
For school communities that meet the eligibility criteria, an analysis is undertaken using criteria in three categories: Community Growth Profile, Busing and Travel Time, and Accommodation. Points for each of the profiles are totalled and used to rank priorities for new school construction. Design Only
When there has been government approval for the design of a school in a community in advance of full funding approval to construct the school, an exception to the standard ranking methodology will be made so that resources committed for the design of the school are maximized and construction occurs in a timely manner. For this reason a community with this design phase only approval will not be assessed through the points ranking criteria and will be retained at the top of the next year’s list. Preschool Census
Total preschool census numbers are used for each community not just public school supporters. This provides a true reflection of the total number of potential students in a community. Enrolment in CBE Schools (K-GR4 and GR5-9)
Actual September 30 enrolment numbers are used and include all students from the community who are accessing any CBE school. If a community already has a school, the capacity of the school will be subtracted from the number of students enrolled in the CBE. For example, in a community with 1,200 K-GR4 students and a 600 capacity K-GR4 school, the number of students counted in assessing enrolment for a second elementary school would be 600. Population Growth
A matrix is used that takes into account the five year projected population growth by sector (based on City of Calgary projections) and the ratio of the number of CBE students per housing unit in a given community. The City of Calgary does not prepare population projections for individual communities but does annually prepare a population forecast by city sector. Utilizing these sector population projections takes future growth into consideration. The use of these two measures together in a matrix results in the greatest number of points, in this category, being assigned to communities with the highest number of students per household that are located in areas of the city that are projected to have the highest growth. Travel Time
A matrix is used that takes into account median travel time as well as distance from the community to the designated school. Utilizing ArcGIS, distance is calculated from the centre of a community to the regular program designated school. The use of these two measures together in a matrix results in the greatest number of points being assigned, in this category, to communities with the longest travel time and the greatest distance travelled.
8-39

Three-Year School Capital Plan 24
Bus Receivers
Points are assigned to a community where there is a need for more than one bus receiver to accommodate the established grade configuration for the regular program (examples include but are not limited to K-GR4 and GR5-9 or K-GR6 and GR7-9). Existing or Approved School(s) in Community
The provision of a K-9 learning continuum for students within a community is desired. For middle school ranking, points are assigned to a community that has an existing K-GR4 school In some cases, this criterion is included in the K-GR4 ranking process to address completion of a full school build out, in the event that provincial approvals have been awarded in phases. This category does not apply for ranking a second elementary school within a community. Transition Points
A transition point occurs when a cohort group of students move from one school to another. Typically a cohort group of students will have one transition point and move once between kindergarten and GR9 (e.g. K-GR4 in one school and GR5-9 in another or K-GR6 in one school and GR7-9 in another). In some situations, space may be limited at either elementary or junior/middle schools and it may be necessary to accommodate a cohort of students from a new and developing community in more than two schools for K-GR9 (e.g. K-GR4 in one school, GR5-6 in a second school and GR7-9 in a third school). In some cases a K-GR9 grade configuration will be recommended. Examples of when this may occur include, but are not limited to, when community demographics demonstrate that a 900 student K-GR9 school is sufficient to accommodate students or when there is only one school site in a community and the site is sufficient in size to accommodate the building. Communities under consideration for a K-GR9 school are assessed through both the K-GR4 and GR5-9 point assessment process. The priority order is determined by the highest number of points in either of these two categories not by the combined number of points.
The option exists for the placement of priorities for new school construction.
Senior high schools are not ranked using point criteria, but are recommended on the priority list based on analysis of multiple factors such as:
availability of a site to construct a high school high school utilization rates student enrolment community demographics
Schools with unique settings or enrolments that do not lend themselves to
the aforementioned ranking criteria may also be placed on a priority basis.
8-40

Three-Year School Capital Plan 25
A flow chart summarizing the evaluation process for recommended new school construction follows:
Three-Year School Capital Plan New School Construction Evaluation Process
CBE Administration Recommends School Communities
for New School Construction
Capital Projects Submission Approved
by Board of Trustees and submitted to province for funding approval
School/Community Statistics Total Preschool Census K-GR4 Enrolment GR5-9 Enrolment Population Growth
Busing and Travel Time Median Travel Time Distance Travelled
Ranking Criteria
Eligibility Criteria
Accommodation Options Evaluate accommodation options for eligible school communities to determine final communities to be
ranked.
Eligible School Communities Identify new and developing
school communities.
Other Considerations # of Bus receiver Schools Existing or Approved School Greater than Two Transition Points
(K-9)
Site Readiness Is there a site that is ready for
development within the next 12 months
8-41

Three-Year School Capital Plan 26
3.2 Construction Ranking: Kindergarten to Grade 9
A summary of the points assigned for communities, for kindergarten to Grade 9, that are included in this year’s Plan are below:
School Communities
Rank Community Points Planning Sector
Grade
1 Auburn Bay Elementary (2) 1866 SE K-4 2 Mahogany Elementary 1499 SE K-4
3 Auburn Bay Middle 1492 SE 5-9 4 Evanston Elementary (2) 1480 N K-4 5 Skyview Ranch Elementary** 1473 NE K-4 6 Evanston Middle 1420 N 5-9 7 Sage Hill Elementary 1117 N K-4 8 Kincora Elementary 1074 N K-4 9 Sherwood/Nolan Hill Middle 1037 N 5-9
10 Nolan Hill Elementary 978 N K-4 11 Cougar Ridge Elementary 977 W K-4
Notes: (2) Indicates second K-4 school ** Combined Country Hills/Harvest Hills and Skyview Ranch into K-9 grade configuration (Communities under consideration for a K-GR9 school are assessed through both the K-GR4 and GR5-9 point assessment process. The priority order is determined by the highest number of points in either of these two categories not by the combined number of points)
Based on the point assignment, some communities have a higher point total for a second elementary school in the community than for a middle school. Constructing a middle school prior to second elementary schools is desired for several reasons. Construction of a middle school completes the K-9 continuum of learning and adds 900 additional learning spaces in comparison to 600 for a second elementary school. These 300 additional learning spaces provide space for more students to attend school closer to home. When a second elementary school receives more points than a middle school within the same community, the middle school will be prioritized over the second elementary school.
CBE school communities ranked for new school construction must have a site available and have a student population large enough to sustain an elementary or middle/junior high school per the ranking criteria. New school construction projects for the top-ranked school communities have been identified in Section 4.0.
Details of the points assignment for all eligible communities are included in Appendix III.
8-42

Three-Year School Capital Plan 27
The ranking criterion that was revised and approved in October 2014 uses actual numbers of students and potential students rather than assigning a value for a range of students as occurred with the previous criteria. This change has resulted in fewer ties for placement. In the case of a tie in ranking the following will be used to determine priority between the tied projects:
Ties will be broken on total points of the first two community ranking categories.
In the case where it is still tied, only the first community ranking category points will be used.
3.3 Construction Planning Criteria: Senior High Schools
A sector based approach is used to evaluate projects for new senior high school capital priorities. Utilization rates by planning sector are listed below:
Senior High Planning Sector Utilization
Planning Sector
2017-2018 2017-2018
Residence Utilization Enrolment Utilization
Centre 28.1% 78.5% East 52.6% 76.4% North 273.7% 103.6% NorthEast 149.9% 102.3% NorthWest 96.7% 90.3% South 69.5% 91.2% SouthEast 0.0% 0.0% West 81.0% 91.1%
Notes: • Student numbers are based on ArcView data as at September 30, 2017 • Capacity as per Alberta Infrastructure's Utilization Formula (assuming exemptions)
The greatest demand for new senior high school space based on where students are living (by residence) is in the north sector. The north sector, which is comprised of established and new communities, has a utilization rate by residence of 274%. This sector is only served by one high school, John G. Diefenbaker. The high school utilization rate, by residence, in the centre sector indicates that there is excess space within the sector. Although there is space, it is not located close to the growing communities in the north sector where student enrolment is increasing and utilization by residence exceeds the capacity. The centre sector is comprised of inner city and established communities and has a utilization rate by residence of 28%. There are five senior high schools located in this sector. Starting in September 2018, space at James Fowler High School, Lord Beaverbrook High School, Forest Lawn High School and the Career and Technology Centre (CTC) will be used to accommodate Chinook Learning Services and the utilization rate at these schools will increase. Senior high utilization by sector for all Sectors can be found in Appendix 1, Table 2 on page 74.
8-43

Three-Year School Capital Plan 28
3.4 Construction Priorities: Senior High Schools
For identified through the City of Calgary Regional Context study process and procured through the Joint Use Agreement (see Map 4) these are not ranked using point criteria but are recommended on the new school construction priority list based on an analyze of factors such as:
demographic information, including current and future student populations;
availability of space in existing high schools; proximity of that space to student populations; City of Calgary’s projected growth for the sector.
North High School
A new high school would allow CBE to accommodate high school students who live in the far northern communities at a school that is closer to where they live. The north sector is projected to be one of the fastest growing areas in the city, with an expected increase of approximately 19,000 people by 2021. This represents approximately 25% of the forecasted city growth in terms of total population. The north sector includes many new and developing communities and has a large student population by residence. There are a total of 3,689 senior high students living in the north sector enrolled at CBE schools this year. John G. Diefenbaker is the only high school in this sector and it has a provincial capacity of 1,480 student spaces. If all high school students living in this sector attended the only high school in the sector, the utilization rate would be 274%. The primary catchment population for a north high school would be the Northern Hills communities, consisting of Harvest Hills, Coventry Hills (including Country Hills Village), Country Hills (north/south) and Panorama Hills, as well as the Hidden Valley community to the west. Combined, these five communities have a population of approximately 70,000 people. There are currently 1,811 students from these areas attending CBE high schools for Grades 10 - 12. Students living in the northern hills communities currently attend four different CBE schools. Three of the schools are located in the centre sector and one is in the north sector.
Crescent Heights (Coventry Hills, including Country Hills Village, Hidden Valley);
Queen Elizabeth (Country Hills - south); James Fowler (Country Hills – north); and John G. Diefenbaker (Panorama Hills, Harvest Hills).
John G. Diefenbaker is the closest school and is located in the Huntington Hills community. Students attending Crescent Heights and Queen Elizabeth have long travel times to the inner city communities of Crescent Heights and West Hillhurst.
8-44

Three-Year School Capital Plan 29
In addition to the Northern Hills communities there are several communities further north in the sector that are travelling long distances to attend high school. These communities are Carrington, Evanston, Kincora, Livingston, Nolan Hill, Sage Hill and Sherwood. All of these communities are still developing and the total population build-out is approximately 118,000 people over the next 15 to 20 years. Currently there are 795 GR10-12 students enrolled in CBE schools from these seven communities. This number will only increase over the next five to ten years. One or more of these communities could be designated to a new north high school if it is not at capacity with students from the Northern Hills communities. A 23.6 acre senior high school site is located in the Coventry Hills community on Coventry Hills Way NE. Once constructed and open, a new high school in north Calgary that will operate at 100% capacity for many years to come.
8-45

Three-Year School Capital Plan 2019-2022 30
Map 4
8-46

Three-Year School Capital Plan 2019-2022 31
4.0 THREE-YEAR SCHOOL CAPITAL PLAN 2019-2022 – SUMMARY
Capital projects are reviewed and prioritized by the Ministry of Education prior to being submitted to the government’s Capital Planning Initiative process led by the Treasury Board. Projects are first reviewed for accuracy and clarity and Provincial staff may meet with school jurisdictions to obtain further information as required.
Alberta Education will evaluate project requests by first considering school jurisdiction priorities and then the following criteria:
Health and Safety Building Condition Utilization Rates Enrolment Projections Education Program Delivery Additional Information
Alberta Education then prepares the annual submission for the Provincial Capital Planning Initiative. All government projects are evaluated using a Project Rating System consisting of program delivery, infrastructure, performance, economic, and financial impacts.
An in-depth review of the ranking rationale assigned to each capital project is undertaken by a cross-ministry committee, resulting in a recommendation being submitted to the Deputy Minister Capital Planning Committee, and then to the Treasury Board Capital Planning Committee. Provincial Caucus reviews the Treasury Board recommendations and, ultimately, approves the Provincial Capital Plan.
This section provides a summary of recommended new school construction and major modernization projects. Table 1 (New School Construction) and Table 2 (School Modernizations) provides a summary of the recommended projects and project costs are based upon 2017 Alberta Infrastructure support prices. Sections 5.0 and 6.0 provide details of the recommended projects.
Projects are listed in order of priority. There is still a need for schools located where students live and are projected to live in the future. Details of modernization rankings are in Appendix II and details of new school construction priority rankings are identified in Appendix III.
The sections that follow this summary (Sections 5.0 and 6.0) describe the community and school profiles in order of priority. The key maps in the top right corner of the page depict the location of the community described for new construction projects. The light-shaded areas represent all the new and developing communities in Calgary.
8-47

Three-Year School Capital Plan 2019-2022 32
The following tables provide a summary of the new school construction and major modernization projects recommended for funding and these are identified on Map 5 and Map 6.
Note: 1 Senior high schools are not ranked using point criteria. (2) = second elementary school for the community
8-48

Three-Year School Capital Plan 2019-2022 33
Number of Years
Previously Listed
Grade Project Status Request Type 2018 Cost ($) in Capital Plan
M-1 John G. Diefenbaker High School 10-12 Modernization Request Major Modernization 27,000,000 9
M-2 Nickle School 5-9 Modernization Request Major Modernization 14,000,000 10
M-3 Ernest Morrow School 6-9 Modernization Request Major Modernization 16,000,000 4
YEAR 1 TOTAL 57,000,000
Grade Project Status Request Type 2018 Cost ($)
M-4 A.E. Cross School 7-9 Modernization Request Major Modernization 18,000,000 1
M-5 Janet Johnstone School K-4 Modernization Request Major Modernization 8,700,000 3
M-6 Annie Foote School K-6 Modernization Request Major Modernization 10,400,000 3
YEAR 2 TOTAL 37,100,000
Grade Project Status Request Type 2018 Cost ($)
M-7 Cedarbrae School K-6 Modernization Request Major Modernization 7,800,000 3
M-8 Altadore School K-6 Modernization Request Major Modernization 7,800,000 10
M-9 Ranchlands School K-6 Modernization Request Major Modernization 11,700,000 3
M-10 Queen Elizabeth School K-6 Modernization Request Major Modernization 8,700,000 3
YEAR 3 TOTAL 36,000,000
GRAND TOTAL 130,100,000
Table 2: School Major Modernizations
Three-Year School Capital Plan 2019-2022 Priorities
Priority Ranking – Project Description
YEAR 1
YEAR 2
Community/School
YEAR 3
Community/School
8-49

Three-Year School Capital Plan 2019-2022 34
Note: 1 Senior high schools are not ranked using point criteria. (2) = second elementary school for the community
8-50

Three-Year School Capital Plan 2019-2022 35
Map 5
8-51

Three-Year School Capital Plan 2019-2022 36
Map 6
8-52

Three-Year School Capital Plan 2019-2022 37
5.0 2019-2022 SCHOOL CAPITAL PLAN
New Construction
Priority C-1 Mahogany Elementary
School Community Profile
Mahogany Community began development in 2009 and is located in the southeast sector of the City.
As of the April 2017 Census, the total number of occupied dwelling units was 2,841 with a population of 8,444.
The community is planned for an estimated 11,348 housing units with a population capacity of 29,800 to 30,500.
The community had an average annual population growth of 1,928 persons during the past three-year period.
Enrolment Profile
As of the April 2017 Census, there were a total of 1095 preschool-aged children in Mahogany.
As of September 30, 2017, there were 314 kindergarten to Grade 4 students residing in the Mahogany community who attended CBE schools.
Site Planning and Transportation
Mahogany students are currently bused to Riverbend School, which is located in the Riverbend community in Area 6. Median travel time to Riverbend School is 24 minutes.
Recommendation
Construct a core elementary K-GR 4 school for 450 students complete with space to support a modular addition for 150 students in 6 units. The capacity of the school will be 600 student spaces.
The total project cost is budgeted at $14,678,500.
8-53

Three-Year School Capital Plan 2019-2022 38
5.0 2019-2022 SCHOOL CAPITAL PLAN
New Construction
Priority C-2 Auburn Bay Middle
School Community Profile
Auburn Bay Community began development in 2005 and is located in the southeast sector of the City.
As of the April 2017 Census, the total number of occupied dwelling units was 5,453 with a population of 16,429.
The community is planned for an estimated 6,534 housing units with a population capacity of 17,500 – 18,700.
The community had an average annual population growth of 1,767 persons during the past three-year period.
Enrolment Profile
As of the September 30, 2017, there were 889 kindergarten to Grade 4 and 483 Grades 5-9 students residing in the Auburn Bay community who attended CBE schools.
Site Planning and Transportation
Auburn Bay School (K-GR4) opened September 2016. There is one more elementary site and one middle school site in Auburn Bay.
Auburn Bay students in GR 5-9 are currently bused to Nickle School, which is located in the Lake Bonavista community in Area 5. Median travel time to Nickle School is 21 minutes.
Recommendation
Construct a core middle school for 700 GR 5-9 students complete with space to support a modular addition for 200 students in 8 units. The capacity of the school will be 900 student spaces.
The total project cost is budgeted at $27,860,000, including the construction of the new modular units, funding for CTS space and CTS equipment allowance.
8-54

Three-Year School Capital Plan 2019-2022 39
5.0 2019-2022 SCHOOL CAPITAL PLAN
New Construction
Priority C-3 North Calgary High
School Community Profile
The North Calgary High School will serve the residents of the Northern Hills communities and other select communities south of Country Hills Boulevard NW.
Currently, the north area is served by four high schools consisting of: Crescent Heights (Coventry Hills, Country Hills Village, Hidden Valley), Queen Elizabeth (Country Hills - south) James Fowler (Country Hills - north) and John G. Diefenbaker (Panorama Hills, Harvest Hills).
Enrolment Profile
There are over 3,600 high school students living in the north sector of Calgary and only one high school located in that sector. John G. Diefenbaker High School has a provincial capacity of 1,480 student spaces and a utilization of 104%.
If all high school students living in the north sector were accommodated at John G. Diefenbaker High School, the utilization rate by residence would be 274%.
Combined, the Northern Hills communities (Harvest Hills, Country Hills, Country Hills Village, Coventry Hills (north/south), Panorama Hills and Hidden Valley currently have 1,811 students attending four different CBE high schools for Grades 10 - 12. Enrolment from these communities is projected to increase over the next five years.
Site Planning and Transportation
A 23.6 acre site in the west portion of Coventry Hills is available for a new senior high school.
The bus ride is long for the more than 600 high school students living in Coventry Hills, Country Hills (south), Country Hills Village and Hidden Valley students who are currently designated to Crescent Heights and Queen Elizabeth High schools in the centre sector.
Several communities in the north are bused significant distances.
Recommendation
Construct a senior high school for 1,800 Grades 10-12 students.
The total project cost is budgeted at $59,128,000; including the CTS space allowance and an allowance for CTS equipment in the amount of $400,000.
8-55

Three-Year School Capital Plan 2019-2022 40
5.0 2019-2022 SCHOOL CAPITAL PLAN
New Construction
Priority C-4 Auburn Bay Elementary(2)
School Community Profile
Auburn Bay Community began housing construction in 2005 and is located in the southeast sector of the City.
As of the April 2017 Census, the total number of occupied dwelling units was 5,453 with a population of 16,429.
The community is planned for an estimated 6,534 housing units with an estimated population capacity of 17,500 to 18,700.
The community had an average annual population growth of 1,767 persons during the past three-year period.
Enrolment Profile
As of the April 2017 Census, there were a total of 2,065 preschool-aged children.
As of September 30, 2017, there were 889 kindergarten to Grade 4 students residing in the Auburn Bay community who attended CBE schools.
Site Planning and Transportation
Auburn Bay Elementary (K-4) opened September 2016. The school is full and starting September 2018, K-4 students who cannot be accommodated at the school will be overflowed to Andrew Sibbald School in Lake Bonavista.
There is one more elementary site, which will be used for the second elementary school.
Recommendation
Construct a core elementary K-GR4 school for 450 students complete with space to support a modular addition for 150 students in 6 units. The capacity of the school will be 600 student spaces.
The total project cost is budgeted at $14,678,500.
Note: (2) = second elementary school for the community
8-56

Three-Year School Capital Plan 2019-2022 41
5.0 2019-2022 SCHOOL CAPITAL PLAN
New Construction
Priority C-5 Skyview Ranch Elementary/Middle
School Community Profile
Skyview Ranch Community began development in 2008 and is located south of 128 Avenue NE, and east of Metis Trail NE.
As of the April 2017 Census, the total number of occupied dwelling units was 3,330 with a population of 10,043.
The community is planned for an estimated 11,127 housing units with a population capacity of 24,900 to 26,700.
The community had an average annual population growth of 1,255 persons during the past three-year period.
Enrolment Profile
As of the April 2017 Census, there were a total of 1,018 preschool-aged children.
As of September 30, 2017, there were 335 kindergarten to Grade 4 students and 256 Grades 5-9 students residing in the Skyview Ranch community who attended CBE schools.
Site Planning and Transportation
Skyview Ranch K-GR6 students are bused to Annie Foote School, which is located in the Temple community and some students in GR5-6 are continuing to phase-out of Rundle School, which is located in the Rundle community. Median travel time to these schools is 20 minutes.
Skyview Ranch GR7-9 students are currently bused to Dr. Higgins School, which is located in the Rundle community. Median travel time to Dr. Higgins School is 24 minutes.
Recommendation
Construct a core elementary/middle school for 700 kindergarten – GR 9 students complete with space to support a modular addition for 200 students in 8 units. The capacity of the school will be 900 student spaces.
The total project cost is budgeted at $27,860,000, including the construction of the new modular units, funding for CTS space and CTS equipment allowance.
8-57

Three-Year School Capital Plan 2019-2022 42
5.0 2019-2022 SCHOOL CAPITAL PLAN
New Construction
Priority C-6 Evanston Middle
School Community Profile
Evanston Community began development in 2002 and is situated in the north sector of the city, north of Stoney Trail and east of Symons Valley Road.
As of the April 2017 Census, the total number of occupied dwelling units was 4,916 with a population of 15,885.
The community is planned for an estimated 6,109 housing units with a population capacity of 17,600 to 18,600.
The community had an average annual population growth of 1,952 persons during the past three-year period.
Enrolment Profile
As of September 30, 2017, there were 793 kindergarten to Grade 4 and 497 Grades 5-9 students residing in the Evanston community who attended CBE schools.
Site Planning and Transportation
Kenneth D. Taylor School (K-GR4) opened September 2016. There is one more elementary site and one middle school site in Evanston.
Evanston GR7-9 students are currently bused to Simon Fraser, which is located in the Brentwood community. Median travel time to Simon Fraser School is 21 minutes.
Recommendation
Construct a core middle school for 700 GR 5-9 students complete with space to support a modular addition for 200 students in 8 units. The capacity of the school will be 900 student spaces.
The total project cost is budgeted at $27,860,000 including the construction of the new modular units, funding for CTS space and CTS equipment allowance.
8-58

Three-Year School Capital Plan 2019-2022 43
5.0 2019-2022 SCHOOL CAPITAL PLAN
New Construction
Priority C-7 Evanston Elementary(2)
School Community Profile
Evanston Community began housing construction in 2002 and is located in the southeast sector of the City.
As of the April 2017 Census, the total number of occupied dwelling units was 4,916 with a population of 15,885.
The community is planned for an estimated 6,109 housing units with an estimated population capacity of 17,600 to 18,600.
The community had an average annual population growth of 1,952 persons during the past three-year period.
Enrolment Profile
As of the April 2017 Census, there were a total of 1,745 preschool-aged children.
As of September 30, 2017, there were 793 kindergarten to Grade 4 students residing in the Evanston community who attended CBE schools.
Site Planning and Transportation
Kenneth D. Taylor (K-4) opened September 2016. The school is full and starting September 2018, K-4 students who cannot be accommodated at the school will be overflowed to Cambrian Heights School in Cambrian Heights.
There is one more elementary site, which will be used for the second elementary school.
Recommendation
Construct a core elementary K-GR4 school for 450 students complete with space to support a modular addition for 150 students in 6 units. The capacity of the school will be 600 student spaces.
The total project cost is budgeted at $14,678,500.
Note: (2) = second elementary school for the community
8-59

Three-Year School Capital Plan 2019-2022 44
5.0 2019-2022 SCHOOL CAPITAL PLAN
New Construction
Priority C-8 Sage Hill Elementary
School Community Profile
Sage Hill Community began development in 2006 and is located in the north sector of the City.
As of the April 2017 Census, the total number of occupied dwelling units was 2,195 with a population of 6,083.
The community is planned for an estimated 9,030 housing units with a population capacity of 21,100 – 21,900.
The community had an average annual population growth of 728 persons during the past three-year period.
Enrolment Profile
As of the April 2017 Census, there were a total of 734 preschool-aged children in Sage Hill.
As of September 30, 2017, there were 263 kindergarten to Grade 4 students residing in the Sage Hill community who attended CBE schools.
Site Planning and Transportation
Sage Hill students are currently bused to Hawkwood School, which is located in the Hawkwood community. Median travel time to Hawkwood School is 18 minutes.
Recommendation
Construct a core elementary K-GR4 school for 450 students complete with space to support a modular addition for 150 students in 6 units. The capacity of the school will be 600 student spaces.
The total project cost is budgeted at $14,678,500.
8-60

Three-Year School Capital Plan 2019-2022 45
5.0 2019-2022 SCHOOL CAPITAL PLAN
New Construction
Priority C-9 Kincora Elementary
School Community Profile
Kincora Community began development in 2006 and is located north of Stoney Trail and west of Symons Valley Road NW.
As of the April 2017 Census, the total number of occupied dwelling units was 2,065 with a population of 6,363.
The community is planned for an estimated 4,415 housing units with a population capacity of 11,100 to 11,600.
The community had an average annual population growth of 322 persons during the past three-year period.
Enrolment Profile
As of the April 2017 Census, there were a total of 599 preschool-aged children.
As of September 30, 2017, there were 355 kindergarten to Grade 4 students residing in the Kincora community who attended CBE schools.
Site Planning and Transportation
Kincora students are currently bused to Simons Valley School, which is located in the Sandstone community. Median travel time to Simons Valley is 13 minutes.
Recommendation
Construct a core elementary K-GR4 school for 450 students complete with space to support a modular addition for 150 students in 6 units. The capacity of the school will be 600 student spaces.
The total project cost is budgeted at $14,678,500.
8-61

Three-Year School Capital Plan 2019-2022 46
5.0 2019-2022 SCHOOL CAPITAL PLAN
New School Construction
Priority C-10 Sherwood/Nolan Hill Middle
School Community Profile
Sherwood Community began development in 2006 and is located in the north sector of the City.
As of the April 2017 Census, the total number of occupied dwelling units was 1,584 with a population of 5,312.
The community is planned for an estimated 2,130 housing units with an estimated population capacity of 6,400 to 6,500.
The community had an average annual population growth of 511 persons during the past three-year period.
Nolan Hill Community began development in 2009 and is located in the north sector of the City.
As of the April 2017 Census, the total number of occupied dwelling units was 1,716 with a population of 5,312.
The community is planned for an estimated 3,387 housing units with an estimated population capacity of 8,500 to 9,100.
The community had an average annual population growth of 1,587 persons during the past three-year period.
Enrolment Profile
As of September 30, 2017, there were 203 kindergarten to Grade 4 students and there were 260 Grades 5-9 students residing in the Sherwood community who attended CBE schools.
As of September 30, 2017, there were 235 kindergarten to Grade 4 students and there were 209 Grades 5-9 students residing in the Nolan Hill community who attended CBE schools.
8-62

Three-Year School Capital Plan 2019-2022 47
5.0 2019-2022 SCHOOL CAPITAL PLAN
New School Construction
Priority C-10 Sherwood/Nolan Hill Middle
Site Planning and Transportation
There is a middle school site in Sherwood which is also intended to serve the community of Nolan Hill.
Sherwood and Nolan Hill GR 7-9 students take City Transit to H.D. Cartwright School in the community of Ranchlands, and the median travel time is 21 minutes.
Recommendation
Construct a middle school for 700 kindergarten - Grade 9 students complete with space to support a modular addition for 200 students in 8 units. The capacity of the school will be 900 student spaces.
The total project cost is budgeted at $27,860,000, including the construction of the new modular units, funding for CTS space and CTS equipment allowance.
8-63

Three-Year School Capital Plan 2019-2022 48
5.0 2019-2022 SCHOOL CAPITAL PLAN
New Construction
Priority C-11 Nolan Hill Elementary
School Community Profile
Nolan Hill Community began development in 2009 and is located in the north sector of the City.
As of the April 2017 Census, the total number of occupied dwelling units was 1,716 with a population of 5,312.
The community is planned for an estimated 3,387 housing units with an estimated population capacity of 8,500 to 9,100.
The community had an average annual population growth of 1,587 persons during the past three-year period.
Enrolment Profile
As of the April 2017 Census, there were a total of 623 preschool-aged children.
As of September 30, 2017, there were 235 kindergarten to Grade 4 students residing in the Nolan Hill community who attended CBE schools.
Site Planning and Transportation
Nolan Hill students are currently bused to Ranchlands School, which is located in the Ranchlands community. Median travel time to Ranchlands School is 17 minutes.
Recommendation
Construct a core elementary K-GR4 school for 450 students complete with space to support a modular addition for 150 students in 6 units. The capacity of the school will be 600 student spaces.
The total project cost is budgeted at $14,678,500.
8-64

Three-Year School Capital Plan 2019-2022 49
5.0 2019-2022 SCHOOL CAPITAL PLAN
New School Construction
Priority C-12 Cougar Ridge Elementary
School Community Profile
Cougar Ridge Community began development in 2000 and is situated in southwest Calgary, south of Canada Olympic Road SW.
As of the April 2017 Census, the total number of occupied dwelling units in Cougar Ridge was 2,178 with a population of 7,072.
The community is planned for an estimated 2,640 housing units with an estimated population capacity of 7,100 - 7,900.
The community had an average annual population growth of 123 persons during the past three-year period.
Enrolment Profile
As of the April 2017 Census, there were a total of 648 preschool-aged children.
As of September 30, 2017, there were 299 kindergarten to Grade 4 students residing in Cougar Ridge who attended CBE Schools.
Site Planning and Transportation
There is one elementary school site in Cougar Ridge.
Cougar Ridge students are currently bused to Rosscarrock School, which is located in the Rosscarrock community. Median travel time to Rosscarrock is 13 minutes.
Accommodation Planning
Construct a core elementary K-GR4 school for 450 students complete with space to support a modular addition for 150 students in 6 units. The capacity of the school will be 600 student spaces.
The total project cost is budgeted at $14,678,500.
8-65

Three-Year School Capital Plan 2019-2022 50
6.0 2019-2022 SCHOOL CAPITAL PLAN
Major Modernizations
Priority M-1 John G. Diefenbaker High School
The school’s current CTS programs require upgrading to meet current industry and CBE standards.
CTS courses are designed to engage students in learning in authentic, relevant and personalized learning environments. Through this approach to learning, students transition from their high school experience more successfully into the world of work or into post-secondary education. Creating these personalized pathways through CTS courses and programs allow students the opportunity to examine their career goals and expand their interests in future success.
Facility Description
The original two storey building, complete with gymnasium, partial lower level (walkout) basement, performance space, and mechanical penthouse was constructed in 1971. In 1990, a single storey addition with lower level was added. Additionally, there are four dated modular units located on site. There have been several interior renovations over the years to improve existing spaces. Overall construction comprises a foundation of grade beams and strip footings complete with reinforced concrete slabs on grade. The superstructure consists of both exterior and interior masonry load bearing block, or poured in place walls and columns. Roof structure is steel deck on steel joists on bearing walls. The majority of the roof assembly is a bituminous built-up (BUR) system (last replaced in 1988). The exterior is a combination of red brick, ribbed block, and stucco. Windows are typically double glazed units and aluminum framed. Exterior doors are steel and painted. The total area of the main building is 13876 m² consisting of 54 classrooms. The classrooms range in size and have access to natural light.
8-66

Three-Year School Capital Plan 2019-2022 51
6.0 2019-2022 SCHOOL CAPITAL PLAN
Major Modernizations
Priority M-1 John G. Diefenbaker High School
Facility Description (cont’d)
In 2007, Alberta Infrastructure evaluated school facilities through RECAPP and rated the overall condition of the facility as being in acceptable condition. The evaluation made the following recommendations: Mechanical: requires upgrades (some space temperature controls require
repair or replacement; life-cycle issues are soon to be an issue) Electrical: systems require upgrading (review and replace as required all life-
cycle components)
Modernization
Due to the age and condition of the building components, a modernization will improve functionality, security, safety and will upgrade building infrastructure. There is a need to modernize instructional spaces in order to enhance the learning environment. This modernization will focus on upgrading CTS space throughout the school, and will include partial upgrading of the building envelope, mechanical and electrical systems, and replacement of worn architectural finishes and fixtures. This project will include a library to Learning Commons conversion, bringing the school into alignment with 21st century learning. Additional project items include building and code upgrades (sprinkler system), hazardous material abatement and addressing all gender washrooms and barrier-free accessibility. The total project cost is estimated to be $27 million.
8-67

Three-Year School Capital Plan 2019-2022 52
6.0 2019-2022 SCHOOL CAPITAL PLAN
Major Modernizations
Priority M-2 Nickle School
Current and Future Student Accommodation Plan
Nickle School is located in southeast Calgary in the community of Lake Bonavista, which is an established community in the south planning sector.
Regular Program
Nickle School currently accommodates the Regular program for Grades 5-9 students living in Bonavista Downs and Lake Bonavista and students from the community of Auburn Bay.
System Classes
Nickle School currently accommodates Bridges and Learning and Literacy classes.
The long-term student accommodation plan for Nickle School is to accommodate students from their home area and students residing in new and developing communities in either the south or southeast planning sector. This school has been identified as one that is required by the CBE to accommodate students into the future. It is anticipated that enrolment will be at or near capacity.
Facility Description
The original school building was completed in 1970 with masonry and steel construction. The two additions were built in 1976 and 1985.
The total area of the building is 6,951 m² consisting of 26 classrooms plus three portables for instruction. The classrooms range in size and have minimum access to natural light. The mechanical and electrical systems have exceeded their lifecycle expectancy and need upgrading or replacement.
In 2007, Alberta Infrastructure evaluated school facilities through RECAPP and rated the overall condition of the facility as being in acceptable condition. The evaluation made the following recommendations: Replace parts of roof that have not already been replaced Replace damaged caulking around perimeter Incorporate barrier-free items where applicable (i.e., automatic door openers) Mechanical features need upgrading (i.e., hot water tanks, exhaust fans,
sprinklers) Upgrade various electrical various components, i.e., lights, exit signs, etc.
Modernization
A scope for modernization improvements is required due to the age and condition of the building components. The modernization would replace some of mechanical systems and damaged lockers, upgrade electrical system, finishes and millwork, reconfigure internal spaces, and renovate washrooms. The addition of mechanical control system and start/stop automation is recommended. Barrier-free accessibility, all gender washrooms, exiting and code upgrades (sprinkler system) would be addressed as well. The scope of this modernization strategy also includes upgrading of all the interior program spaces, and a library to Learning Commons conversion. The total project cost is estimated to be $14 million.
8-68

Three-Year School Capital Plan 2019-2022 53
6.0 2019-2022 SCHOOL CAPITAL PLAN
Major Modernizations
Priority M-3 Ernest Morrow School
Current and Future Student Accommodation Plan
Ernest Morrow School is located in southeast Calgary in the community of Forest Heights which is an established community in the east planning sector.
Regular Program Ernest Morrow School currently accommodates the regular program for Grades 6-9 students living in Applewood, Forest Heights, Forest Lawn, Penbrooke Meadows and the area north of 17 Ave. S.E. and east of 52 St. S.E.
System Classes Ernest Morrow School currently accommodates students in LEAD and Paced Learning Program classes.
The long-term student accommodation plan for Ernest Morrow is to accommodate students from the home area in the regular program. This school has been identified as one that is required by the CBE to accommodate students into the future.
Facility Description
The single-storey building was originally constructed in two parts, linked via a corridor. The first part was constructed in 1964, the second in1966, and the corridor in 1976. The foundation consists of slab-on-grade floors on strip footings. The superstructure comprises concrete block walls and suspended concrete floors over the gymnasium. The roof structure consists of glulam beams complete with a bituminous membrane (SBS) system. The building is cladded in brick and pre-finished metal siding. Many classrooms have access to natural light. The total area of the building is 8,120m² consisting of 67 classrooms for instruction.
In 2011, Alberta Infrastructure evaluated school facilities through RECAPP and rated the overall condition of the facility as being in acceptable condition. The evaluation made the following recommendations:
Exterior: requires upgrades (painting, roof maintenance, etc.) Interior: requires upgrading (concrete floors in boiler room, barrier free features) Mechanical: systems require upgrading (chimney, roof drains, dampers,
exhaust fans, etc.) Electrical: systems require upgrading (light fixtures, emergency lighting system)
8-69
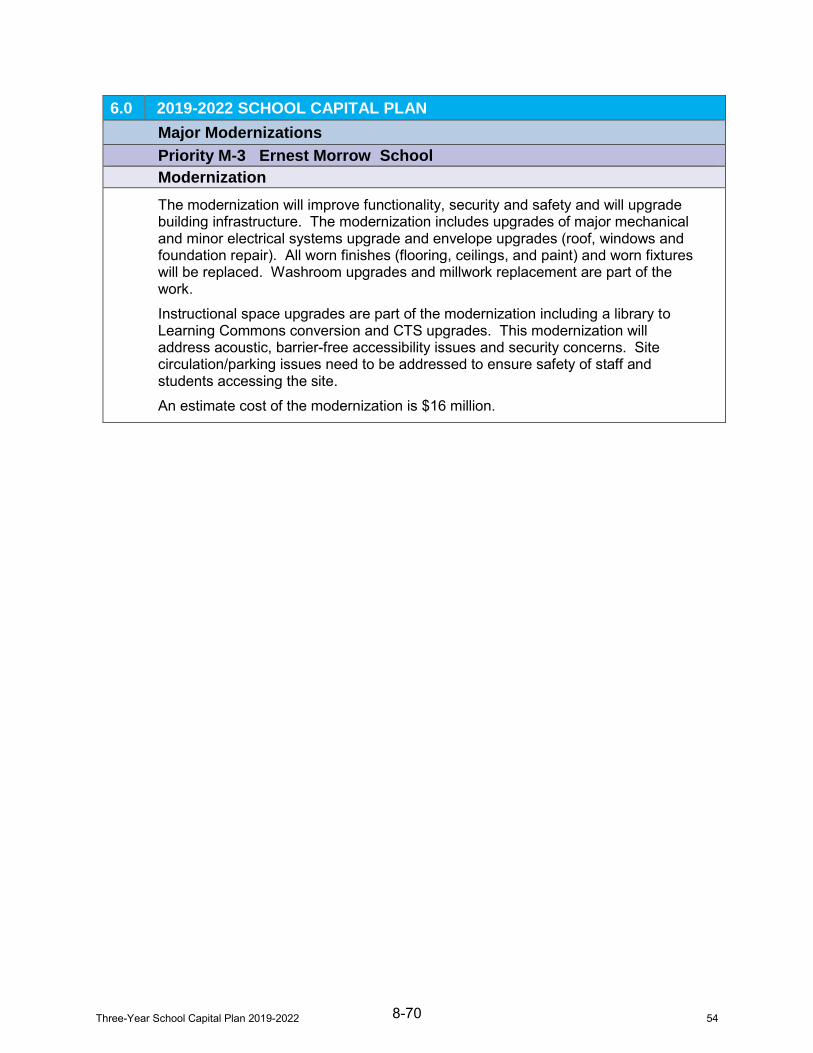
Three-Year School Capital Plan 2019-2022 54
6.0 2019-2022 SCHOOL CAPITAL PLAN
Major Modernizations
Priority M-3 Ernest Morrow School
Modernization
The modernization will improve functionality, security and safety and will upgrade building infrastructure. The modernization includes upgrades of major mechanical and minor electrical systems upgrade and envelope upgrades (roof, windows and foundation repair). All worn finishes (flooring, ceilings, and paint) and worn fixtures will be replaced. Washroom upgrades and millwork replacement are part of the work.
Instructional space upgrades are part of the modernization including a library to Learning Commons conversion and CTS upgrades. This modernization will address acoustic, barrier-free accessibility issues and security concerns. Site circulation/parking issues need to be addressed to ensure safety of staff and students accessing the site.
An estimate cost of the modernization is $16 million.
8-70

Three-Year School Capital Plan 2019-2022 55
6.0 2019-2022 SCHOOL CAPITAL PLAN
Major Modernizations
Priority M-4 A.E. Cross School
Current and Future Student Accommodation Plan
A.E. Cross School is located in southwest Calgary in the community of Glenbrook, which is an established community in the west planning sector.
Regular Program
A.E. Cross School currently accommodates the Regular program for Grades 7-9 students living in Glenbrook, Glamorgan, Killarney, Glengarry, Lincoln Park, Richmond, CFB Lincoln Park/Garrison Green, and Rutland Park. Students residing in Signal Hill are also currently designated to A.E. Cross School for Grades 7-9.
Spanish Bilingual Starting in 2017, A.E. Cross will begin accommodating Grade 7 students and the program will expand by a grade each year until it reaches Grade 9.
System Classes A.E. Cross School accommodates Paced Learning and Learning and Literacy classes for Area IV students.
The long-term student accommodation plan for A.E. Cross School is to accommodate students from their home area and to continue to accommodate students residing in new and developing communities in southwest Calgary and expand to Grades 7-9 for Spanish Bilingual students. This school has been identified as one that is required by the CBE to accommodate students into the future. It is anticipated that enrolment will be at or near capacity. A.E. Cross School also currently accommodates the Area 7 office.
Facility Description
The original building was built in 1961 with a major two-storey addition added in 1966. The building has a masonry and steel construction, wood-roof deck with masonry and curtain wall exterior. A modernization took place in 1983. The gross building area is 9,064 m2 consisting of 36 classrooms, with the majority of the classrooms being slightly smaller than current standards. The provincial capacity of A.E. Cross School has been set at 878 student spaces. The gym, library, and administration space are typical size for a school of this capacity. The ancillary spaces are quite large compared to a classroom.
The structure is considered to be in acceptable condition. Many of the classrooms have good natural lighting. Most of the building exterior is finished with low maintenance materials; however, the wood portions of the exterior are in need of maintenance. Floors are generally in acceptable condition with some needing repair/replacement.
8-71

Three-Year School Capital Plan 2019-2022 56
6.0 2019-2022 SCHOOL CAPITAL PLAN
Major Modernizations
Priority M-4 A.E. Cross School
Facility Description (cont’d)
In 2015, Alberta Infrastructure evaluated school facilities through VFA (formerly RECAPP) and rated the overall condition of the facility as being in acceptable condition. The evaluation made the following recommendations:
Exterior: minor upgrades/repairs required (caulking, etc.) Interior: requires upgrading (worn and aging finishes) Mechanical: aging systems (50+years old) require replacement (HVAC system:
steam boilers, ventilation, etc.) Electrical: systems require upgrading (expand current circuit system)
Modernization
The modernization will address replacement of major mechanical systems and electrical upgrades to improve thermal comfort and energy efficiency, and provide additional power and data outlets to address technology needs. The scope will include replacement of old and worn finishes and fixtures (e.g., vinyl-asbestos-tile flooring, wood flooring, and lockers), door and hardware replacement, and washroom upgrades. The modernization will include select program space renovations, library to Learning Commons conversion, hazardous material abatement, and building code and accessibility upgrades. The proposed project will modernize the whole facility and enhance the teaching environment. The total project cost is estimated to be $18 million.
8-72
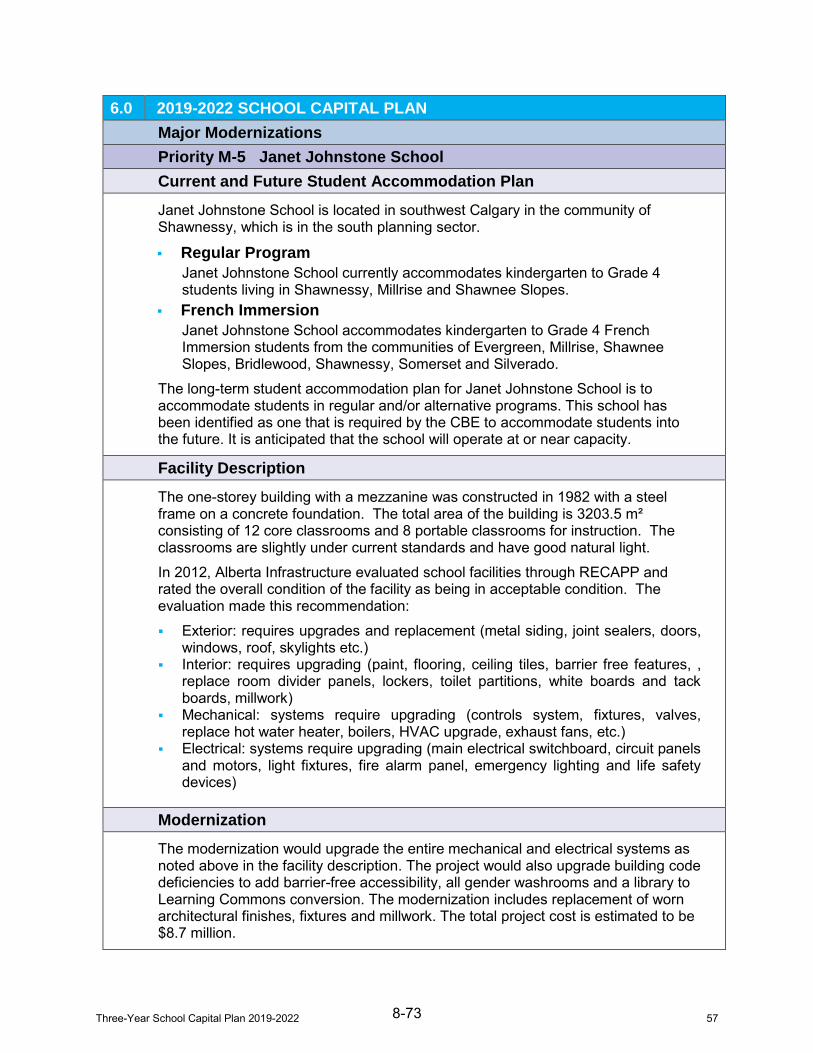
Three-Year School Capital Plan 2019-2022 57
6.0 2019-2022 SCHOOL CAPITAL PLAN
Major Modernizations
Priority M-5 Janet Johnstone School
Current and Future Student Accommodation Plan
Janet Johnstone School is located in southwest Calgary in the community of Shawnessy, which is in the south planning sector.
Regular Program
Janet Johnstone School currently accommodates kindergarten to Grade 4 students living in Shawnessy, Millrise and Shawnee Slopes.
French Immersion
Janet Johnstone School accommodates kindergarten to Grade 4 French Immersion students from the communities of Evergreen, Millrise, Shawnee Slopes, Bridlewood, Shawnessy, Somerset and Silverado.
The long-term student accommodation plan for Janet Johnstone School is to accommodate students in regular and/or alternative programs. This school has been identified as one that is required by the CBE to accommodate students into the future. It is anticipated that the school will operate at or near capacity.
Facility Description
The one-storey building with a mezzanine was constructed in 1982 with a steel frame on a concrete foundation. The total area of the building is 3203.5 m² consisting of 12 core classrooms and 8 portable classrooms for instruction. The classrooms are slightly under current standards and have good natural light.
In 2012, Alberta Infrastructure evaluated school facilities through RECAPP and rated the overall condition of the facility as being in acceptable condition. The evaluation made this recommendation:
Exterior: requires upgrades and replacement (metal siding, joint sealers, doors, windows, roof, skylights etc.)
Interior: requires upgrading (paint, flooring, ceiling tiles, barrier free features, , replace room divider panels, lockers, toilet partitions, white boards and tack boards, millwork)
Mechanical: systems require upgrading (controls system, fixtures, valves, replace hot water heater, boilers, HVAC upgrade, exhaust fans, etc.)
Electrical: systems require upgrading (main electrical switchboard, circuit panels and motors, light fixtures, fire alarm panel, emergency lighting and life safety devices)
Modernization
The modernization would upgrade the entire mechanical and electrical systems as noted above in the facility description. The project would also upgrade building code deficiencies to add barrier-free accessibility, all gender washrooms and a library to Learning Commons conversion. The modernization includes replacement of worn architectural finishes, fixtures and millwork. The total project cost is estimated to be $8.7 million.
8-73

Three-Year School Capital Plan 2019-2022 58
6.0 2019-2022 SCHOOL CAPITAL PLAN
Major Modernizations
Priority M-6 Annie Foote School
Current and Future Student Accommodation Plan
Annie Foote School is located in northeast Calgary in the community of Temple, which is an established community in the northeast planning sector.
Regular Program Annie Foote School currently accommodates kindergarten to Grade 6 students living in Temple. The school also accommodates kindergarten to Grade 6 students from the new and developing community of Skyview Ranch. The long-term student accommodation plan for Annie Foote School is to accommodate students in regular and/or alternative programs. This school has been identified as one that is required by the CBE to accommodate students into the future. It is anticipated that the school will operate at or near capacity.
Facility Description
The single storey brick building was constructed in 1980 with a total gross floor area of 3904 m2. The Provincial capacity is 473 students from pre-school through Grade 6. There are 9 relocatable classrooms with a total area of 841.5 m2, located on the northwest side of the original building. Eight of those classrooms were installed in 1980, with the 2 blocks of 4 separated by an outdoor courtyard. The final relocatable classroom was attached to the north of the east wing later. In 2012, Alberta Infrastructure evaluated school facilities through RECAPP and rated the overall condition of the facility as being in acceptable condition. The evaluation made the following recommendations:
Exterior: requires upgrades (replace wood soffit and windows, etc.) Interior: requires upgrading (painting, barrier free features, seal all fire separation
penetrations, replace gym divider and damaged doors, white boards) Mechanical: systems require upgrading (controls system, replace water heater,
condensing unit, air handling unit, etc.) Electrical: systems require upgrading (light fixtures, fire alarm panel, emergency
lighting and life safety devices)
8-74

Three-Year School Capital Plan 2019-2022 59
6.0 2019-2022 SCHOOL CAPITAL PLAN
Major Modernizations
Priority M-6 Annie Foote School
Modernization
The modernization will improve functionality, security, safety and will upgrade building infrastructure. The modernization includes upgrades of major mechanical and minor electrical systems upgrade and envelope upgrades (roof, windows and foundation repair). All worn finishes (flooring, ceilings, and paint) and worn fixtures will be replaced. Washroom upgrades and millwork replacement are part of the work. Code upgrades will be included in the modernization. Instructional space upgrades are part of the modernization including a library to Learning Commons conversion. This modernization will address acoustic, barrier-free accessibility issues, all gender washrooms and security concerns. Site circulation/parking issues need to be addressed to ensure safety of staff and students accessing the site. An estimate cost of the modernization is $10.4 million.
8-75
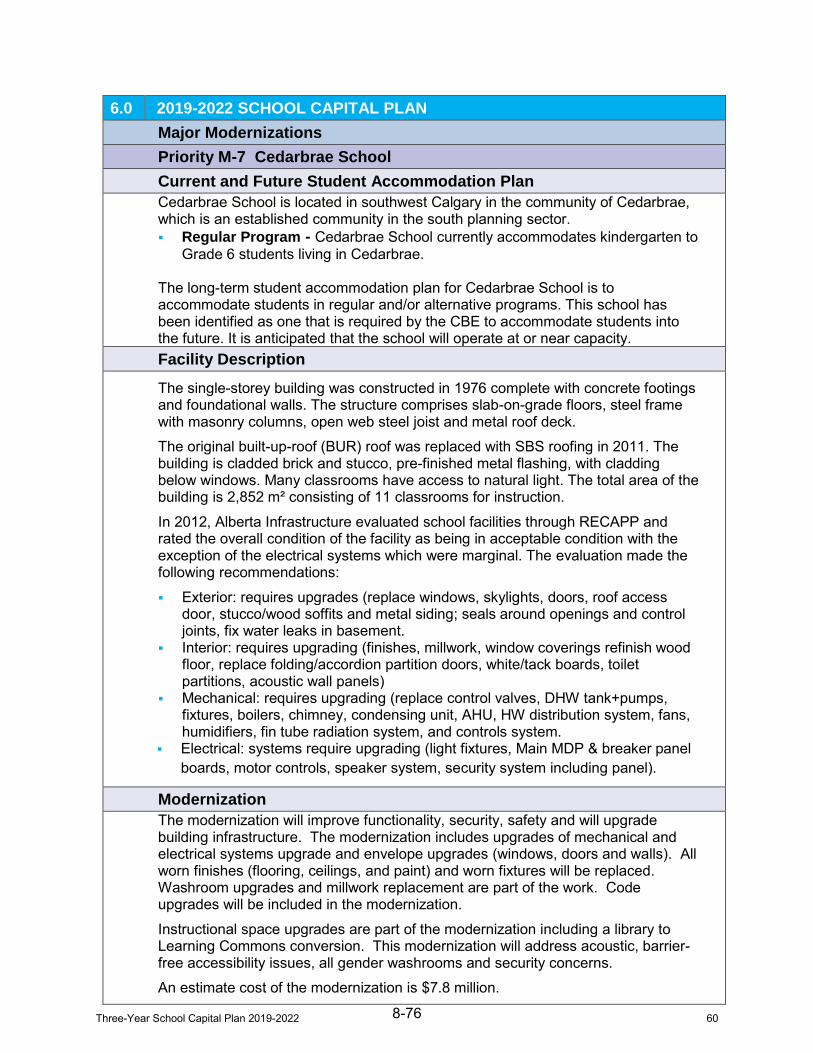
Three-Year School Capital Plan 2019-2022 60
6.0 2019-2022 SCHOOL CAPITAL PLAN
Major Modernizations
Priority M-7 Cedarbrae School
Current and Future Student Accommodation Plan
Cedarbrae School is located in southwest Calgary in the community of Cedarbrae, which is an established community in the south planning sector. Regular Program - Cedarbrae School currently accommodates kindergarten to
Grade 6 students living in Cedarbrae.
The long-term student accommodation plan for Cedarbrae School is to accommodate students in regular and/or alternative programs. This school has been identified as one that is required by the CBE to accommodate students into the future. It is anticipated that the school will operate at or near capacity. Facility Description
The single-storey building was constructed in 1976 complete with concrete footings and foundational walls. The structure comprises slab-on-grade floors, steel frame with masonry columns, open web steel joist and metal roof deck.
The original built-up-roof (BUR) roof was replaced with SBS roofing in 2011. The building is cladded brick and stucco, pre-finished metal flashing, with cladding below windows. Many classrooms have access to natural light. The total area of the building is 2,852 m² consisting of 11 classrooms for instruction.
In 2012, Alberta Infrastructure evaluated school facilities through RECAPP and rated the overall condition of the facility as being in acceptable condition with the exception of the electrical systems which were marginal. The evaluation made the following recommendations:
Exterior: requires upgrades (replace windows, skylights, doors, roof access door, stucco/wood soffits and metal siding; seals around openings and control joints, fix water leaks in basement.
Interior: requires upgrading (finishes, millwork, window coverings refinish wood floor, replace folding/accordion partition doors, white/tack boards, toilet partitions, acoustic wall panels)
Mechanical: requires upgrading (replace control valves, DHW tank+pumps, fixtures, boilers, chimney, condensing unit, AHU, HW distribution system, fans, humidifiers, fin tube radiation system, and controls system.
Electrical: systems require upgrading (light fixtures, Main MDP & breaker panel boards, motor controls, speaker system, security system including panel).
Modernization
The modernization will improve functionality, security, safety and will upgrade building infrastructure. The modernization includes upgrades of mechanical and electrical systems upgrade and envelope upgrades (windows, doors and walls). All worn finishes (flooring, ceilings, and paint) and worn fixtures will be replaced. Washroom upgrades and millwork replacement are part of the work. Code upgrades will be included in the modernization.
Instructional space upgrades are part of the modernization including a library to Learning Commons conversion. This modernization will address acoustic, barrier-free accessibility issues, all gender washrooms and security concerns.
An estimate cost of the modernization is $7.8 million.
8-76

Three-Year School Capital Plan 2019-2022 61
6.0 2019-2022 SCHOOL CAPITAL PLAN
Major Modernizations
Priority M-8 Altadore School
Current and Future Student Accommodation Plan
Altadore School is located in southwest Calgary in the community of Altadore which is in the inner city in the Centre planning sector.
Regular Program - Altadore School currently accommodates the Regular program for kindergarten to Grade 6 students living in Altadore which includes Garrison Woods.
The long-term student accommodation plan for Altadore School is to accommodate students from Altadore (including Garrison Woods). Garrison Woods is part of the Canada Lands redevelopment of the old Canadian Forces Base (CFB). This school has been identified as one that is required by the CBE to accommodate students into the future. It is anticipated that enrolment will be at or near capacity.
Facility Description
The one-storey building was constructed in 1952 with a wood frame on a concrete foundation. The school was renovated in 2002 with new exterior cladding, windows, doors, skylights and roof. A barrier-free washroom was provided in 2002; however, the remainder of the school requires barrier-free renovations. The total area of the building is 2,737 m² consisting of 14 classrooms for instruction. Most of the classrooms are similar to current standards and have good natural light.
In 2010, Alberta Infrastructure evaluated school facilities through RECAPP and rated the overall condition of the facility as being in acceptable condition. The evaluation made this recommendation:
Mechanical: systems require upgrading (hot water tanks, boiler, ventilators, etc.)
Modernization
The modernization would upgrade the entire mechanical systems: replace hot water tanks, steam boilers, breeching, steam piping, controls, exhaust fans, radiation system, and unit ventilators. Electrical upgrades would consist of cabling and electrical wiring upgrades. The project would also upgrade building code deficiencies (including sprinkler systems) with full barrier-free accessibility, and a library to Learning Commons conversion and all gender washrooms. The total project cost is estimated to be $7.8 million.
8-77

Three-Year School Capital Plan 2019-2022 62
6.0 2019-2022 SCHOOL CAPITAL PLAN
Major Modernizations
Priority M-9 Ranchlands School
Current and Future Student Accommodation Plan
Ranchlands School is located in northwest Calgary in the community of Ranchlands, which is an established community in the northwest planning sector.
Regular Program
Ranchlands School currently accommodates kindergarten to Grade 6 students living in Ranchlands. The school is also a bus receiver school for students living in the new and developing communities of Sherwood and Nolan Hill.
Complex Learning Classes
Ranchlands School accommodates PLP (Paced Learning Program) classes. PLP classes are classes for students in Grades 4-12 who have been identified with mild or moderate cognitive (intellectual) development disabilities.
The long-term student accommodation plan for Ranchlands School is to accommodate students in regular and/or alternative programs. This school has been identified as one that is required by the CBE to accommodate students into the future. It is anticipated that the school will operate at or near capacity.
Facility Description
The permanent 2-storey building was constructed in 1980. Eight relocatables (4 two-storey blocks) were included as part of the original construction.
The core building construction includes concrete footings and grade beams, load-bearing masonry perimeter and interior walls and open webbed steel joists and metal Q-deck. Boiler room is below-grade. The total area of the building is 4,285 m² consisting of 11 classrooms and 8 relocatable classrooms for instruction. Core floor area is 3,476 m² with a relocatable area of 809 m².
In 2013, Alberta Infrastructure evaluated school facilities through RECAPP and rated the overall condition of the facility as being in acceptable condition. The evaluation made the following recommendations that would need to be addressed as the building passes its 35 year:
Exterior: requires upgrades (envelope restoration, repoint mortar joints, replace metal siding, joint sealer, windows, doors, gutters & downspouts, skylights.)
Interior: requires upgrading (replace folding partitions, flooring, acoustic panels, ceiling tiles, elevator and lift, white/tack boards, toilet partitions, paint walls, fire stop penetrations through walls, millwork , window coverings)
Mechanical: requires upgrades (replace fixtures, valves, DHW Heater, boilers, chimney, condensing and air distribution units, HW distribution unit, exhaust fans, finned tube radiation units, upgrade BAS controls)
Electrical: systems require upgrading (replace light fixtures, emergency/fire and security systems, switch and panel boards, motor controls, speaker system).
8-78

Three-Year School Capital Plan 2019-2022 63
6.0 2019-2022 SCHOOL CAPITAL PLAN
Major Modernizations
Priority M-9 Ranchlands School
Modernization
The modernization will improve functionality, security, safety and will upgrade building infrastructure. The modernization includes upgrades of mechanical and electrical systems and envelope upgrades (windows, doors and walls). All worn finishes (flooring, ceilings, and paint) and worn fixtures will be replaced. Washroom upgrades and millwork replacement are part of the work.
Instructional space upgrades are part of the modernization including a library to Learning Commons conversion. This modernization will address acoustic, barrier-free accessibility issues, code issues, all gender washrooms and security concerns.
An estimate cost of the modernization is $11.7 million.
8-79

Three-Year School Capital Plan 2019-2022 64
6.0 2019-2022 SCHOOL CAPITAL PLAN
Major Modernizations
Priority M-10 Queen Elizabeth School
Current and Future Student Accommodation Plan
Queen Elizabeth School is located in north central Calgary in the community of West Hillhurst, which is an established community in the Centre planning sector.
Regular Program
Queen Elizabeth School currently accommodates kindergarten to Grade 6 students living in West Hillhurst and a portion of Hillhurst.
Complex Learning Classes
Queen Elizabeth School has accommodated DHH (Deaf and Hard of Hearing) classes for several years. These classes will be relocating to Jennie Elliott School effective September 2018. The DHH classes are for students with a diagnosis of hearing loss.
The long-term student accommodation plan for Queen Elizabeth School is to accommodate students in regular and/or alternative programs. This school has been identified as one that is required by the CBE to accommodate students into the future. It is anticipated that the school will operate at or near capacity.
Facility Description
The two-storey brick veneer building with partial basement was constructed in 1957. Structurally the building consists of poured concrete foundation walls, footings and slabs-on-grade, the crawl space & basement walls consist of masonry block or concrete assembly. The second floor has a poured concrete floor supported by masonry block walls, concrete columns and steel columns. Structural reinforced concrete block walls support the roof assembly. Open web steel joists support wood decking over second floor classrooms and gymnasium. The total area of the building is 3,197 m² consisting of 14 classrooms for instruction.
In 2009, Alberta Infrastructure evaluated school facilities through RECAPP and rated the overall condition of the facility as being in acceptable condition, except the electrical systems that are in marginal condition. The evaluation made the following recommendations:
Exterior: requires upgrades (replace metal siding, reseal all joints, seal exposed concrete, replace wood windows and shading devices, skylights, partial roof replacement, pave parking lot,)
Interior: requires upgrading (refinish wood doors, replace toilet partitions, worn stair surfaces, handrails, wall panelling and tile, flooring, acoustic panelling, and ceiling tiles, millwork, window coverings, elevator)
Mechanical: requires upgrades (replace fixtures, valves, steam boilers and entire steam distribution system, chimney, exhaust fans, gym HVAC unit, controls system)
Electrical: systems require upgrading (light fixtures and switches, panel boards, motor controls, branch wiring, emergency lighting, fire alarm and security system, speaker system).
8-80

Three-Year School Capital Plan 2019-2022 65
6.0 2019-2022 SCHOOL CAPITAL PLAN
Major Modernizations
Priority M-10 Queen Elizabeth School
Modernization
The modernization will improve functionality, security, safety and will upgrade building infrastructure. The modernization includes upgrades of mechanical and electrical systems upgrade and envelope upgrades (windows, doors and walls). All worn finishes (flooring, ceilings, and paint) and worn fixtures will be replaced. Washroom upgrades and millwork replacement are part of the work.
Instructional space upgrades are part of the modernization including a library to Learning Commons conversion. This modernization will address acoustic, barrier-free accessibility issues including an elevator, all gender washroom and security concerns and code upgrades (including a sprinkler system).
An estimate cost of the modernization is $8.7 million.
8-81

Three-Year School Capital Plan 2019-2022 66
5
APPENDIX I
Capacity and Utilization
Table 1: Capacity for K-GR9 by Residence (%)
60.4%
71.1%
129.3%
88.2% 74.5%
64.6%
109.9%
80.4%
0%
20%
40%
60%
80%
100%
120%
140%
Central East North NorthEast NorthWest South SouthEast West
% C
ap
ac
ity
Planning Sector Utilization Rates by Residence
K-GR9
K-GR9 Students by Residence 2017-2018
Elementary/Junior Elementary/Junior % Planning
Sector High Students High Capacity Utilization
Centre 8,752 14,491 60.4% East 4,260 5,988 71.1% North 13,530 10,467 129.3% NorthEast 16,446 18,644 88.2% NorthWest 13,978 18,753 74.5% South 15,706 24,329 64.6% SouthEast 10,080 9,172 109.9% West 8,668 10,784 80.4%
Total 91,420 112,628 81.2% Notes:
• Student numbers are based on ArcView data as at September 30, 2017 (K@FTE to Grade 9) • Capacity as per Alberta Infrastructure's Utilization Formula (assuming exemptions) • Under-utilized and over-utilized are shown on Map 7
8-82

Three-Year School Capital Plan 2019-2022 67
Table 2: Capacity by Residence Senior High (%)
Senior High (GR10-12) Students by Residence 2017-2018
Planning Senior High Senior High % Sector Students Capacity Utilization
Centre 2,624 9,343 28.1% East 1,509 2,871 52.6% North 4,051 1,480 273.7% NorthEast 5,275 3,520 149.9% NorthWest 5,010 5,181 96.7% South 5,539 7,969 69.5% SouthEast 2,661 0 N/A West 2,966 3,664 80.9%
Total 29,635 34,028 87.1% Notes:
• Student numbers are based on ArcView data as at September 30, 2017
• Capacity as per Alberta Infrastructure's Utilization Formula (assuming exemptions)
• Under-utilized and over-utilized are shown on Map 8.
28.1%
52.6%
273.7%
149.9%
96.7%
69.5%
N/A
80.9%
0%
50%
100%
150%
200%
250%
300%
Central East North NorthEast NorthWest South SouthEast West
% C
ap
ac
ity
Planning Sector Utilization Rates by Residence
Senior High (GR 10-12)
8-83

Three-Year School Capital Plan 2019-2022 68
5
Table 3: % Capacity for K-GR9 by Enrolment
K-GR9 Students by Enrolment 2017-2018
Planning Sector
Elementary/Junior Elementary/Junior % High Students High Capacity Utilization
Centre 12,205 14,491 84.2% East 4,329 5,988 72.3% North 9,315 10,467 89.0% NorthEast 15,659 18,644 84.0% NorthWest 15,971 18,753 85.2% South 18,283 24,329 75.1% SouthEast 7,590 9,172 82.8% West 8,346 10,784 77.4%
Total 91,698 112,628 81.4% Notes:
• Student numbers are based on ArcView data as at September 30, 2017 (K@FTE to Grade 9) • Capacity as per Alberta Infrastructure's Utilization Formula (assuming exemptions)
84.2%
72.3%
89.0% 84.0%
85.2%
75.1% 82.8%
77.4%
0%
10%
20%
30%
40%
50%
60%
70%
80%
90%
100%
Central East North NorthEast NorthWest South SouthEast West
% C
ap
ac
ity
Planning Sector Utilization Rates by Enrolment
K-GR9
8-84

Three-Year School Capital Plan 2019-2022 69
Table 4: % Capacity by Enrolment – Senior High Senior High (GR10-12) Students by Enrolment
2017-2018
Senior High Senior High %
Planning Sector Students Capacity Utilization
Centre 7,334 9,343 78.5% East 2,193 2,871 76.4% North 1,533 1,480 103.6% NorthEast 3,601 3,520 102.3% NorthWest 4,679 5,181 90.3% South 7,268 7,969 91.2% SouthEast 0 0 N/A West 3,339 3,664 91.1%
Total 29,947 34,028 88.0%
Notes:
• Student numbers are based on ArcView data as at September 30, 2017 • Capacity as per Alberta Infrastructure's Utilization Formula (assuming exemptions)
78.5% 76.4%
103.6% 102.3%
90.3% 91.2%
N/A
91.1%
0%
20%
40%
60%
80%
100%
120%
Central East North NorthEast NorthWest South SouthEast West
% C
apac
ity
Planning Sector Utilization Rate by Enrolment
Senior High (GR 10-12)
8-85

Three-Year School Capital Plan 2019-2022 70
Map 7
8-86

Three-Year School Capital Plan 2019-2022 71
Map 8
8-87

Three-Year School Capital Plan 2019-2022 72
APPENDIX II
Modernization Information
Rank Modernization Points Planning
Sector Grade
1 John G. Diefenbaker High School 78 North 10-12
2 Nickle School 59 South 5-9
3 Ernest Morrow School 53 East 6-9
4 A.E. Cross School 51 West 7-9
5 Janet Johnstone School 46 South K-4
6 Annie Foote School 40 Northeast K-6
7 Cedarbrae School 47 South K-6
8 Altadore School 43 Centre K-6
9 Ranchlands School 44 Northwest K-6
10 Queen Elizabeth School 38 Centre K-6
Major Modernization Ranking Points
2019-2022 Capital Submission
School Programming Requirements
5 Year Projected Enrolment
Quality of Site to
Serve Students
Ability to
Upgrade
Facility Maintenance
Based on RECAPP
adjusted for time
Total Points
John G. Diefenbaker High School 35 10 4 9 20 78 Nickle School 10 10 7 12 20 59 Ernest Morrow School 10 10 3 10 20 53 A.E. Cross School 10 6 6 9 20 51 Janet Johnstone School - 10 4 12 20 46 Annie Foote School - 10 4 11 15 40 Cedarbrae School - 10 4 13 20 47 Altadore School - 10 4 9 20 43 Ranchlands School - 10 3 11 20 44 Queen Elizabeth School - 10 6 7 15 38
8-88

Three-Year School Capital Plan 2019-2022 73
Programming requirements (maximum number of points = 35) Points
Superintendent's Team to identify and prioritize modernization projects that are required to meet CBE system
programming priorities
5 Year projected enrolment (maximum number of points = 10)
Projected utilization is less than 79% 0
Projected utilization is between 80 to 84% 2
Projected utilization is between 85 to 89% 4
Projected utilization is between 90 to 94% 6
Projected utilization is between 95 to 99% 8
Projected utilization is greater than 100% 10
Quality of site location to serve students (maximum number of points = 10)
Usable frontages 2
Site location 2
Site constraint factors 2
Grand-fathered clauses 2
Ability to adjust/reconfigure site 2
Ranking Range for this category: 0 (difficult to upgrade) to 2 (very easy to upgrade)
Ability to upgrade in terms of teaching environment and minimizing costs (maximum number of points = 20)
Structural characteristics - post tension slabs 2
Barrier free accessibility (e.g. # of levels, space for washrooms, ramps and elevators) 2
Services available - age, capacity 2
Mechanical systems - age, capacity 2
Electrical systems - age, capacity 2
Sprinkler system required (size of water lines) 2
Washroom count - capacity cap 2
Program space - (e.g. size of classrooms, CTS spaces) 2
Parking (bylaw compliant) - ability to expand 2
Hazardous material-abatement 2
Ranking Range for this category: 0 (difficult to upgrade) to 2 (very easy to upgrade)
Facility Maintenance based on Provincial RECAPP (maximum number of points = 25)
Excellent 5
Very Good 10
Good 15
Fair 20
Poor 25
Note: the higher the number, the poorer the facility
35
MAJOR MODERNIZATION RANKING CRITERIA
8-89

Three-Year School Capital Plan 2019-2022 74
APPENDIX III
Community Ranking for New Schools
Rank Community Points Planning Sector
Grade
1 Auburn Bay Elementary (2) 1866 SE K-4 2 Mahogany Elementary 1499 SE K-4 3 Auburn Bay Middle 1492 SE 5-9
4 Evanston Elementary (2) 1480 N K-4 5 Skyview Ranch Elementary** 1473 NE K-4 6 Evanston Middle 1420 N 5-9 7 Sage Hill Elementary 1117 N K-4 8 Kincora Elementary 1074 N K-4 9 Sherwood/Nolan Hill Middle 1037 N 5-9 10 Nolan Hill Elementary 978 N K-4 11 Cougar Ridge Elementary 977 W K-4 12 Country Hills/Harvest Hills Elementary** 927 N K-4 13 Signal Hill Middle 863 W 5-9 14 Aspen Woods Middle 745 W 5-9 15 Sherwood Elementary 714 N K-4 16 Walden Elementary 707 S K-4 17 Skyview Ranch Middle** 701 NE 5-9 18 Valley Ridge/Crestmont Elementary 638 W K-4 19 Country Hills/Harvest Hills Middle** 607 N 5-9 20 Redstone Elementary 600 NE K-4 21 Cityscape/Redstone Middle 599 NE 5-9 22 Silverado Middle 592 S 5-9 23 Legacy Elementary 587 S K-4 24 Sage Hill Middle 509 N 5-9 25 Cityscape Elementary 508 NE K-4 26 Walden Middle 390 S 5-9 27 Legacy Middle 261 S 5-9
Notes: (2) Indicates second K-4 school ** Combined Country Hills/Harvest Hills and Skyview Ranch into K-9 grade configuration (Communities under consideration for a K-GR9 school are assessed through both the K-GR4 and GR5-9 point assessment process. The priority order is determined by the highest number of points in either of these two categories not by the combined number of points)
8-90

Three-Year School Capital Plan 2019-2022 75
K-GR4 Statistics 2019-2022 Capital Submission
`
Community Growth Profile (statistics)
Busing and Travel Time
(statistics)
Community
2017 Total
Pre-school Census
Elementary (K-GR4)
Enrolment
Projected Population Growth by
Sector (%)
Ratio of K-GR4 CBE
Enrolment to # of Housing
Units in Community
(%)
Median Travel Time
(minutes)
Direct Distance Travelled (km’s)
More than one Bus Receiver
within two school years
Existing K-GR4 School
Awarded in Phases or
Design Only School
Approved
North Planning Sector
Country Hills / Harvest Hills 571 296 25 8 17 4 no no
*Evanston (2) *1156 *204 25 16 nbr nbr yes no Kincora 599 355 25 17 13 3 yes no
Nolan Hill 623 235 25 14 17 6 yes no
Sage Hill 734 263 25 12 18 6 yes no
Sherwood 391 203 25 13 16 5 yes no
Northeast Planning Sector
Cityscape 272 116 23 17 19 8 yes no
Redstone 309 151 23 16 20 11 yes no
Skyview Ranch 1018 335 23 10 20 8 yes no
South Planning Sector
Legacy 408 119 20 8 21 8 no no
Walden 417 190 20 12 12 4 yes no
Southeast Planning Sector
*Auburn Bay (2) *1461 *285 27 16 nbr nbr yes no
Mahogany 1095 314 27 11 24 11 no no
West Planning Sector
Cougar Ridge 648 299 4 14 13 6 no no
Valley Ridge / Crestmont 418 190 4 8 16 3 no no
Notes: 1. Pre-school Census is the “Total” number of pre-school children 2012-2016. (Statistics from the City of Calgary “Pre-School Children 2017”). 2. School (2) = the community has a new school constructed or approved and can support a second K-GR4 school.
3. Housing Units information from The City of Calgary “2017 Civic Census”. 4. Median Travel Time – “nbr” no bus receiver for that community.
5. More than one bus receiver school required for established grade configuration within two school years. (examples include, but are not limited to K-GR4 and GR5-9 or K-GR6 and GR7-9) (Busing and Travel Time information as per Transportation Services) *Evanston
(2) – deducted 589 (current provincial capacity) from pre-school (1745-589=1156) total & K-GR4 (793-589=204)
total, as it would be their second elementary. *Auburn Bay
(2) – deducted 604 (current provincial capacity) from pre-school (2065-604=1461) total & K-GR4 (889-604=285) total, as it would be their second elementary.
8-91

Three-Year School Capital Plan 2019-2022 76
K-GR4 Ranking Points 2019-2022 Capital Submission
Community Growth Profile (points)
Busing and Travel Time (points)
Community
2017 Total
Pre-school Census
Elementary (K-GR4)
Enrolment
Projected Population
Growth / K-GR4
Enrolment to Housing
Units
Median Travel Time / Direct
Distance Travelled
More than one Bus Receiver
within two school years
Existing K-GR4 School
Awarded in Phases or
Design Only School
Approved Total
Points
North Planning Sector
Country Hills/Harvest Hills 571 296 50 10 0 0 927
Evanston (2) 1156 204 70 0 50 0 1480
Kincora 599 355 70 0 50 0 1074
Nolan Hill 623 235 60 10 50 0 978
Sage Hill 734 263 60 10 50 0 1117
Sherwood 391 203 60 10 50 0 714
Northeast Planning Sector
Cityscape 272 116 60 10 50 0 508
Redstone 309 151 60 30 50 0 600
Skyview Ranch 1018 335 50 20 50 0 1473
South Planning Sector
Legacy 408 119 40 20 0 0 587
Walden 417 190 50 0 50 0 707
Southeast Planning Sector
Auburn Bay (2) 1461 285 70 0 50 0 1866
Mahogany 1095 314 60 30 0 0 1499
West Planning Sector
Cougar Ridge 648 299 30 0 0 0 977
Valley Ridge/Crestmont 418 190 20 10 0 0 638
Notes: 1. 0 points in Community Growth Profile = 0 points in Busing and Travel Time. 2. Pre-school Census includes “Total” number of pre-school children 2012-2016. (Statistics from the City of Calgary “Pre-School Children 2017”). 3. Communities that have a new school constructed or approved and can only support one K-GR4 school are not ranked. 4. School (2) = the community has a new school constructed or approved and can support a second K-GR4 school.
For communities that already have an elementary school, their current provincial capacity is deducted from their Pre-School and K-GR4 enrolments.
5. Bus Receivers – More than one bus receiver school required for established grade configuration within two school years (examples include, but are not limited to K-GR4 and GR5-9 or K-GR6 and GR7-9).
8-92

Three-Year School Capital Plan 2019-2022 77
Middle/Junior (Grades 5-9) Statistics 2019-2022 Capital Submission
Community Growth Profile (statistics) Busing and Travel Time
(statistics) Accommodation
Plan
Accommodation Plan
Elementary (K-GR4)
Enrolment
Middle (GR 5-9)
Enrolment
Projected Population Growth by
Sector (%)
Ratio of GR5-9 CBE Enrolment
to # of Housing Units in
Community (%)
Median Travel Time
(minutes)
Direct Distance Travelled (km’s)
More than one
Bus Receiver
within two
school years
Existing K-GR4 or Design
Only School
Approved or in
Existence
Greater Than Two Transition
Points
North Planning Sector
Country Hills/ Harvest Hills 296 251 25 6 19 7 no no no
Evanston 793 497 25 10 21 8 no yes no
Sage Hill 263 166 25 8 26 9 no no no
Sherwood/
Nolan Hill 438 469 25 14 *21 6 yes no no
Northeast Planning Sector
Cityscape/Redstone 267 202 23 12 24 10 yes no no
Skyview Ranch 335 256 23 8 24 9 yes no no
South Planning Sector
Legacy 119 92 20 6 18 9 no no no
Silverado 290 192 20 8 21 8 no yes no
Walden 190 150 20 10 6 4 no no no
Southeast Planning Sector
Auburn Bay 889 483 27 9 21 9 no yes no
West Planning Sector
Aspen Woods 383 282 4 10 11 4 no yes no
Signal Hill 427 366 4 7 14 2 no yes no
Notes: 1. Housing information from The City of Calgary “2017 Civic Census”. 2. Bus Receivers - More than one bus receiver school required for established grade configuration within two school years.
(examples include, but are not limited to K-GR4 and GR5-9 or K-GR6 and GR7-9). (Busing and Travel Time information as per Transportation Services) * City Transit
8-93

Three-Year School Capital Plan 2019-2022 78
Middle/Junior (Grades 5-9) Ranking Points 2019-2022 Capital Submission
Community Growth Profile (points) Busing and Travel Time
(points) Accommodation
Plan (points)
Community
Elementary (K-GR4)
Enrolment
Middle (GR 5-9)
Enrolment
Projected Population Growth /
GR5-9 Enrolment
to Housing
Units
Median Travel Time / Direct
Distance Travelled
Greater than one
Bus Receiver
within two school years
Existing K-GR4 or Design Only
School Approved
or in Existence
Greater Than Two Transition
Points Total
Points
North Planning Sector
Country Hills/ Harvest Hills 296 251 50 10 0 0 0 607
Evanston 793 497 60 20 0 50 0 1420
Sage Hill 263 166 50 30 0 0 0 509
Sherwood/Nolan Hill 438 469 60 20 50 0 0 1037
Northeast Planning Sector
Cityscape/Redstone 267 202 50 30 50 0 0 599
Skyview Ranch 335 256 40 20 50 0 0 701
South Planning Sector
Legacy 119 92 40 10 0 0 0 261
Silverado 290 192 40 20 0 50 0 592
Walden 190 150 50 0 0 0 0 390
Southeast Planning Sector
Auburn Bay 889 483 50 20 0 50 0 1492
West Planning Sector
Aspen Woods 383 282 30 0 0 50 0 745
Signal Hill 427 366 20 0 0 50 0 863
Notes: 1. 0 points in Community Growth Profile = 0 points in Busing and Travel Time. 2. Bus Receivers – More than one bus receiver school required for established grade configuration within two years. (examples include, but are not limited to K-GR4 and GR5-9 or K-GR6 and GR7-9).
8-94

Three-Year School Capital Plan 2019-2022 79
CBE Point Assignments
Pre-school Census (Age 1-5)
Pre-school Census (Age 1-5)* Actual Value* Prepared by the City of Calgary annually
Current K-GR4 Enrolment
Current K-GR4 Enrolment - September 30, 2017 enrolment Actual Value
Projected Population / Ratio of Enrolment to Housing Units
≤4% 5 to 9% 10 to 14% 15 to 19% 20 to 24% ≥25 %
Projected 5 Year Sector Population Growth (%)**
Less than 5% 10 points 20 points 30 points 40 points 50 points 60 points5 to 14% 20 points 30 points 40 points 50 points 60 points 70 points15 to 24% 30 points 40 points 50 points 60 points 70 points 80 pointsGreater than 25 % 40 points 50 points 60 points 70 points 80 points 90 points** Based on City of Calgary Suburban Residential Growth (Prepared Annually)
Median Travel Time / Distance Travelled
≤9 10 to 14 15 to 19 20 to 24 ≥25
Median Travel Time
15-19 minutes 10 points 20 points 30 points 40 points 50 points20-24 minutes 20 points 30 points 40 points 50 points 60 points25-29 minutes 30 points 40 points 50 points 60 points 70 points30-34 minutes 40 points 50 points 60 points 70 points 80 points35-39 minutes 50 points 60 points 70 points 80 points 90 points≥40 minutes 60 points 70 points 80 points 90 points 100 points* Distance travelled calculated using ARCGIS to determine "centre" of the community to bus receiver school
Other Considerations:
Bus Receiver - ElementaryMore than one bus receiver school required for established grade configuration within two school years 50 points(examples include but are not limited to K-GR4 and GR5-9 or K-GR6 and GR7-9)
Existing K-GR4 School or Design Only School approved or in existence 50 points
Notes: 1. If a community already has a school or a design only school, the capacity of the school will be subtracted from the number of students enrolled in the CBE.
2. When there is a design only school in a community, an exception to the standard ranking methodology will be made.
Ratio of K-GR4 Enrolment to # of Housing Units in Community (%)
(September 30th of each year)
Kindergarten - Grade 4
Distance Travelled (km's)*
8-95

Three-Year School Capital Plan 2019-2022 80
CBE Point Assignments
K-GR4 Enrolment
Current K-GR4 Enrolment - September 30, 2017 enrolment Actual Value
GR5-9 Enrolment
Current GR5-9 Enrolment - September 30, 2017 enrolment Actual Value
Projected Population / Ratio of Enrolment to Housing Units
≤4% 5 to 9% 10 to 14% 15 to 19% 20 to 24% ≥25 %
Projected 5 Year Sector Population Growth (%)*
Less than 5% 10 points 20 points 30 points 40 points 50 points 60 points5 to 14% 20 points 30 points 40 points 50 points 60 points 70 points15 to 24% 30 points 40 points 50 points 60 points 70 points 80 pointsGreater than 25 % 40 points 50 points 60 points 70 points 80 points 90 points* Based on City of Calgary Subrban Residential Growth (Prepared Annually)
Median Travel Time / Distance Travelled
≤9 10 to 14 15 to 19 20 to 24 ≥25
Median Travel Time
15-19 minutes 10 points 20 points 30 points 40 points 50 points20-24 minutes 20 points 30 points 40 points 50 points 60 points25-29 minutes 30 points 40 points 50 points 60 points 70 points30-34 minutes 40 points 50 points 60 points 70 points 80 points35-39 minutes 50 points 60 points 70 points 80 points 90 points≥40 minutes 60 points 70 points 80 points 90 points 100 points** Distance travelled calculated using GIS to determine "centre" of the community to bus receiver school
Other Considerations:
Bus Receiver More than one bus receiver school required for established grade configuration within two years 50 points(examples include but are not limited to K-GR4 and GR5-9 or K-GR6 and GR7-9)
Existing K-GR4 School or Design Only School approved or in existence 50 points
Greater than 2 Transition Points (K-GR9) 50 points
Notes: 1. If a community already has a school or a design only school, the capacity of the school will be subtracted from the number of students enrolled in the CBE.
2. When there is a design only school in a community, an exception to the standard ranking methodology will be made.
Distance Travelled (km's)**
Ratio of GR5-9 Enrolment to # of Housing Units in Community (%)
(September 30th of each year)
Middle (Grade 5-9)
8-96

Three-Year School Capital Plan 2019-2022 81
APPENDIX IV
CBE System Utilization
CBE SYSTEM UTILIZATION – (2016 – 2023)
K-GR12
Note: Assumes all schools approved in 2019-2022 Plan
8-97

Three-Year School Capital Plan 2019-2022 82
Glossary of Terms and Definitions
CBE Definitions
Additions/Expansions: Changes the gross area of building
CTS: Career and Technology Studies
Modernization: Supports modernization of a building
Provincial Net Capacity: Determined by dividing the total instructional area by an area per student grid based on their grade configuration (as per Alberta Education/Alberta Infrastructure’s School Capital Manual), plus CTS, gym and library space.
RECAPP: Renewal Capital Asset Planning Process
School Community Attendance Area Boundary
CBE Formulas
Utilization Rate = Weighted enrolment [K@FTE + enrolment + (Special Ed. × 3)] Provincial capacity (student spaces)
Weighted Enrolment = (Total kindergarten divided by 2 [K@FTE]) + Grades 1-12 enrolment + (Special Education at 3:1)
Alberta Education/Alberta Infrastructure School Capital Manual Definitions
Area Capacity and A report from Infrastructure that provides total capacity and Utilization Report utilization rates for a jurisdiction and its school facilities.
Barrier-Free The Alberta Building Code defines the requirements to ensure that a school facility can accommodate people with special needs.
Capacity The capacity of a new school and the method by which it is established as approved by Infrastructure. Records of capacity for all Alberta schools are maintained by Infrastructure and reflect the capacity established at the time of construction, minus any exclusions or exemptions subsequently approved by Infrastructure.
Capital Funding Funding provided to school jurisdictions for school building projects in accordance with Education’s approved budget schedule.
Code Requirements The minimum requirements for construction defined by the Alberta Building Code and those standards referenced in the Code.
Core School A school building that is constructed with a permanent core and can be expanded or contracted by the addition or removal of modular classrooms.
Facilities Plan A general or broad plan for facilities and facility development within a school jurisdiction.
8-98

Three-Year School Capital Plan 2019-2022 83
Facility Evaluation Assessment of facility characteristics, which includes site, architectural and engineering components, maintenance planning, safety, space adequacy and environment protection, to determine the ability of the building to accommodate current and future needs.
Full-time Equivalent Is used as a measurement of space utilization. Enrolment is Occupancy calculated on the number of student spaces occupied throughout the
school day. Part time student use is expressed in terms of full-time equivalent students (FTEs).
Furniture & Equipment Includes basic furnishings such as desks, seating, storage cabinets, tables and fixtures that are normally provided under a contract separate from the general construction contract.
Infrastructure Provides funding to (a) replace building and site components which Maintenance and have failed and pose health and safety problems for students and Renewal (IMR) program staff, (b) extend the useful life of school facilities and sites and (c)
maintain the quality of the school environment.
Instructional Area Those areas of a school building that are designated for purposes of instruction, examinations and other student activities where direct or indirect student-teacher interaction is maintained or scheduled. Also included are storage areas considered directly related to various instructional areas (i.e. gym storage, drama storage and science preparation areas).
Inventory of Space A listing of a school jurisdiction’s owned or leased facilities, which include facility area and usage.
Life Cycle Costing Process that examines all costs associated with a facility project for the extent of its lifetime.
Modernization Project The restoration of an entire or a portion of a school facility to improve its functional adequacy and suitability for present and future educational programs.
Modular Classroom Prototypical portable classroom units built at a central location and transported to schools across Alberta. These units are based on specifications that ensure significantly improved heating and ventilation, soundproofing, resistance to mould, cost of serviceability and several other factors that differentiate them from the older portables that are also part of schools across the province. The Government of Alberta’s goal is to eventually replace all the older portables with the prototypical Modular Classrooms.
New Capacity In the event that a new construction project adjusts the capacity rating, a new capacity will be incorporated to reconcile the school jurisdiction’s total capacity one year after the date of Ministerial approval of the tender or alternate to tender scheme of construction.
Right-Sizing Reduction in capacity of an existing school to provide a more efficient use of the facility due to declining enrolments.
School Building Project Means (i) the purchase, erection, relocation, renovation, furnishing or quipping of, (ii) making of structural changes in, (iii) the addition to or extension of a school building, or (iv) the building of access roads or site preparation for a school building.
8-99

Three-Year School Capital Plan 2019-2022 84
Site Development Provision of utility services, access, location of buildings, playfields and landscaping.
Utilization Ratio The ratio determined by dividing a jurisdiction’s total FTE student enrolment by its net capacity.
8-100

Attachment II: Three Year School Capital Plan Summary Presentation
8-101

Broad Overview
Province requires school jurisdiction prioritized new school/major modernization list by April 1st each year
CBE Board of Trustees reviews and approves the list
Board of Trustee approved ranking criteria is used to determine priorities
Multiple data sources inform the ranking
2 8-102

New School Criteria
3
Eligibility Criteria (p. 21-22)
Eligible School Communities
Accommodation options
Site availability and readiness
Typically, we see:
1 elementary school for every 10,000 residents
1 middle school for every 15-20,000 residents
1 high school for every 50-60,000 residents
8-103

Ranking Criteria (p.23-27)
• K-GR4 schools ranked using “K-4” criteria (p.79)
• GR5-9 schools ranked using “Middle/Junior” criteria (p.80)
• Modernizations are ranked using the “Major Modernization Ranking Criteria” (p.73)
• Placement of other projects is recommended by CBE Administration after a thorough analysis (p.27):
High Schools Schools with unique settings or enrolments that do not lend
themselves to abovementioned criteria (e.g. Christine Meikle School, Niitsitapi Learning Centre)
Extenuating circumstances may require a placement priority (e.g. school site not ready when the school should have been approved)
4 8-104

New School Criteria (K-4 and GR5-9)
5
• Ranking Criteria described on pages 23-27 of the plan
• Points assignment is detailed on pages 73-79 of the plan • Design approval • Preschool Census • Enrolment in CBE schools • Population growth • Travel time • Bus receivers • Existing or approved schools in community • Transition points
8-105

New School Data Sources
6
• The criteria used are data driven with the objective of establishing a fair and equitable process for all communities.
• The ranking points for new schools are based on information from
the following data sources: City of Calgary Civic Census Pre-School Children Summary by School District Code School Enrolment Transportation Calgary & Region Economic Outlook The City of Calgary Suburban Residential Growth
8-106

Major Modernization Ranking Criteria (p.73)
7
• The ranking points for major modernizations are based on the following data sources: Programming requirements 5 Year projected enrolment Quality of site location to serve students Ability to upgrade the teaching environment Facility Maintenance based on Provincial VFA assessments
8-107

Timelines
• City publishes annual Suburban Residential Growth Forecast
• Provincial budget and potential school announcements • Annual census
March/April
•City census data is available •CBE receives preschool census data from the City August
• CBE September 30 enrolment data is finalized October
• City of Calgary publishes annual City of Calgary and Region Economic Outlook
• CBE annual School Enrolment Report
November/ December
• CBE data analysis and preparation of Three Year School Capital Plan December/
January
• Submission of Three Year School Capital Plan to Private Board Meeting February
• Submission of Three Year School Capital Plan to Public Board Meetings: • 1st meeting in March - Information • 2nd meeting in March - Approval
March
• Electronic submission of capital priorities to the Province through online submission process (BLIMS) April
8 8-108

9 8-109

Page 1 | 1
Correspondence
Date March 6, 2018
Meeting Type Regular Meeting, Public Agenda
To Board of Trustees
From Kelly-Ann Fenney Office of the Corporate Secretary
Purpose Information
Governance Policy
Reference Operational Expectations OE-8: Communication With and Support for the Board
1 | Recommendation
The following correspondence is being provided to the Board for information: Letter dated January 26, 2018 from the Alberta Council for Environmental
Education (ACEE) to the Board of Trustees and the Chief Superintendent re: a commendation for the CBE's Sustainability initiative.
Letter dated February 8, 2018 from the Board Chair to the Hon. D. Eggen, Minister of Education, requesting an adjustment to the CBE's jurisdictional boundary.
Letter dated February 8, 2018 from the Board Chair to the Hon. D. Eggen, Minister of Education, and the Hon. S. Anderson, Minister of Municipal Affairs, re: participation in the City Charters Urban Schools Collaboration Sub-Table.
Letter dated February 12, 2018 from the Calgary Catholic School District Board Chair to the Hon. S. Anderson, Minister of Municipal Affairs, and the Hon. D. Eggen, Minister of Education, copied to the CBE Board Chair, re: the January 31, 2018 meeting about urban schools planning and the City Charter collaboration.
Attachment: Relevant Correspondence
9-1

BOARD: Brad Clute (Chair) Sustainability Coordinator, Mountain Equipment Coop Deb Rougeau-Bell Consultant and Past Principal, Rocky View Schools
Jeff Reading Independent Consultant, Energy Efficiency and Education
Andrée Iffrig Sustainability Strategist Dialog Design
Sterling Rempel Founder, Future Values Estate and Financial Planning
Tanya Doran Stantec - senior sustainability lead for Alberta
Jenn Hoffman Development and Communications Consultant
David Gowans Vice Principal, Calgary Separate School Division Alexandra O’Rourke Urban Wild Family Nature Club
Lois Wozney Corporate Community Investment Professional Melissa Easton Teacher, Calgary Board of Education
26January2018To:BoardofTrusteesandChiefSuperintendentoftheCalgaryBoardofEducationRe:LetterofCommendationforyourSustainabilityinitiativeDearBoardandSuperintendent-Ifeelcompelledsendyoua‘shoutout’foryourfabulousworkonthisfile!Our organization has a mission of working in collaboration to advance environmentaleducation inAlberta, sonaturallywearedrawn to leadership in this areawhenwe see it.OveradecadeagoIwasprivilegedtobeinvitedasanexternalresourcepersontoyourinitialmeetings and planning as you considered how to take a sustainability to the next level.Today, aftermore thanadecadeofdiligent andwell-resourcedwork in this area, it is ourview that the Calgary Board of Education is a leader in this country when it comes toeducationaroundsustainability,andisabeaconforotherschooldivisions.IcommonlyinvitestafffromyourSustainabilityofficetoco-presentwithme,helpinginspireconference or workshop participants and show them the way forward. ACEE is currentlydelivering workshops to School boards trustees and superintendents across the province,helpingthemidentifytheirnextsteptowardsenvironmentalsustainability,andIalwaysshinea light on the substantial advances and metrics that you have achieved, whether it be inreductionofwaste,greenhousegasemissions,etc.Iamparticularly impressedby youraccomplishments instudent learning,andhowyou linkstudent learning to environmental achievements. I like to quote Dr. David Orr, who says“Hope is a verb with the sleeves rolled up.” In my view, by engaging students in thisimportantwork,youshowthem that they canmakeadifference,andgive themthatmostpreciousgiftofall–hopeforthefuture.ThefuturewilldemandmoreofthisapproachfromAlberta’sschoolboards.Iwanttoletyouknow that, from our perspective, your investment is paying dividends, and youraccomplishmentstodateareexemplary.Withthegreatestrespect-
GarethThomsonExecutiveDirector,AlbertaCouncilforEnvironmentalEducation(ACEE)403-678-7746,[email protected].
9-2

Board of Trustees 1221 – 8 Street SW Calgary, AB T2R 0L4 | t | 403-817-7933 | f | 403-294-8282 | www.cbe.ab.ca
February 8, 2018 Honourable David Eggen Minister of Education 228 Legislature Building 10800 – 97 Avenue Edmonton, AB T5K 2B6 Dear Minister Eggen, Re: Calgary Board of Education (CBE) Jurisdictional Boundary
On behalf of the board of Trustees, I am writing to request an adjustment to the Calgary Board of Education’s jurisdictional boundary. The two (2) communities the CBE is requesting to be annexed are West Crestmont and part of Livingston, north of 144 Avenue NE. Both of these communities are within the City of Calgary’s municipal boundary. West Crestmont This area is located on the west side of the City of Calgary, west of Canada Olympic Park, on the south side of the Trans-Canada Highway. The area is bounded by the Trans-Canada Highway on the north, the existing Crestmont community on the east, the City of Calgary/Rocky View County Municipal Boundary on the south, and the watercourse on the west (Attachment I). The legal descriptions are a portion of SEC 31-24-2-W5, a portion of Plan 7510024 Block 2. Part of Livingston This area is located on the north side of the City of Calgary, at the northeast corner of Centre Street and 144 Avenue NE. The area is bounded by 160 Avenue NE on the north, 6 Street NE on the east, 144 Avenue NE on the south, and west of Centre Street on the west (Attachment II). The legal description is SEC 3-26-1-5 (NW 3-26-1-5, SW 3-26-1-5, NE 3-26-1-5, SE 3-26-1-5), and NE 4-26-1-5 and SE 4-26-1-5. The majority of the 36,000 acres annexed by the City of Calgary, from the MD of Foothills in 2005 and the MD of Rocky View in 2007, remain outside of the CBE’s jurisdictional boundaries. The Minister of Education, in a letter dated February 23, 2009 (Attachment III), identified that it was in the best interest of students to retain the
Board Chair
Trina Hurdman Wards 1 & 2
Vice-Chair
Marilyn Dennis Wards 5 & 10
Trustees
Althea Adams Wards 3 & 4
Lisa Davis Wards 6 & 7
Richard Hehr Wards 8 & 9
Julie Hrdlicka Wards 11 & 13
Mike Bradshaw Wards 12 & 14
9-3

2 | 2
existing school boundaries until urban development warranted change and parts of the annexed lands become subject to area structure plans and real estate development. Both West Crestmont and Livingston now meet this criteria as they are communities with approved area structure plans that are now seeing roads, underground utilities and homes in various stages of construction. In Livingston (north of 144 Ave NE), the developer is currently estimating the following home occupancies: 236 in 2017/2018, 667 in 2018/2019 and 1,352 in 2019/2020. The Rocky View School Board was notified of the CBE’s intention to request the Minister of Education to incorporate these two (2) communities into its boundaries in a letter dated January 25, 2018 to their Director of Facility Planning (Attachment IV). Based on the above information, I am respectfully requesting that the Minister of Education invoke his authority under Section 23 of the School Act and incorporate these lands into the CBE’s jurisdictional boundary. Thank you for your consideration on this matter. Yours sincerely,
Trina Hurdman, Chair Board of Trustees Attachments
9-4

Attachment IProposed West Crestmont Annexation Area
Proposed AnnexationCBE BoundaryCity Limit
Community BoundaryWater BodyGreenspace
MEDICINEHILL
SILVERSPRINGS
TUSCANY
PATTERSON
01B
GREENWOOD/GREENBRIAR
01G
01D01C
BOWNESS
06A
VALLEYRIDGE
01H
01F
CRESTMONT(East)
CANADAOLYMPIC
PARK
COUGARRIDGE
01I
SCENICACRES
CREST-MONT(West)
BOWNESS RD NW
85 S
T SW
83ST
NWNO
SEHI
LLDR
NW
34 AV NW
OLD BANFF COACH RD SW
SILVERSPRINGS BV NW
85ST
NW
TRANS CANADA HI W
S
ARCEE TRW
STON
EYTR
NW
0 300 600150Metres
1:30,000
Prepared by: Planning & TransportationMap: Prop_West_Crestmont_Annex.mxd
Date: February 08, 2018
NAD 1983 3TM 114
Water
cours
e
City of Calgary/Rocky ViewCounty Municipal Boundary
9-5

Attachment IIProposed Livingston Annexation Area
Proposed AnnexationLivingston CommunityCBE BoundaryCity Limit
Community BoundaryWater BodyGreenspace
LIVINGSTON(Inside CBE Boundary)
LIVINGSTON(Outside CBE Boundary)
02L
STONEY 1
CARRINGTON
SAGEHILL
03W
KEYSTONEHILLS
COVENTRYHILLS
STONEY 403D
PANORAMAHILLS
HIDDEN VALLEY
EVANSTON
HARV
EST
HILL
SBV
N
144 AV NW
15 S
T NE
STONEY BV NE
128 AV NE
CENT
RE S
T N
14 S
T NW
STONEY TR NE
STONEY TR NW
DEERFOOT TR NE
0 400 800200Metres
1:35,000
Prepared by: Planning & TransportationMap: Prop_Livingston_Annex.mxd
Date: February 08, 2018
NAD 1983 3TM 114
160 Avenue NE
6 Street NE
144 Avenue NE
9-6

Attachment III
9-7

Attachment IV
1221 – 8 Street S.W., Calgary, AB T2R OL4
January 25, 2018 Sent Via Email Colette Winter Director of Facility Planning Rocky View Schools 2651 Chinook Winds Drive SW Airdrie, AB T4B 0B4 Dear Ms. Winter: Re: Consideration of Changes to Jurisdictional Boundaries
I am writing to advise that the Calgary Board of Education (CBE) will be seeking to request approval from the Province of Alberta for a boundary change. Under previous governments the Minister of Education advised that it was in the best interest of students to leave school jurisdiction boundaries as they were until urban development warranted change. With urban development advancing in two (2) areas previously annexed by the City of Calgary, the CBE is now requesting corresponding boundary changes. The areas the CBE will be requesting to annex are the following, both within the City of Calgary’s municipal boundary: West Crestmont This area is located on the west side of the City of Calgary, west of Canada Olympic Park, on the south side of the Trans-Canada Highway. The area is bounded by the Trans-Canada Highway on the north, the existing Crestmont community on the east, the City of Calgary/Rocky View County Municipal Boundary on the south, and the watercourse on the west (Attachment I). The legal descriptions are a portion of SEC 31-24-2-W5, a portion of Plan 7510024 Block 2.
9-8

2 | 4
Part of Livingston
This area is located on the north side of the City of Calgary, at the northeast corner of Centre Street and 144 Avenue NE. The area is bounded by 160 Avenue NE on the north, 6 Street NE on the east, 144 Avenue NE on the south, and west of Centre Street on the west (Attachment II).
The legal description is SEC 3-26-1-5 (NW 3-26-1-5, SW 3-26-1-5, NE 3-26-1-5, SE 3-26-1-5), and NE 4-26-1-5 and SE 4-26-1-5.
The CBE wishes to continue to work in partnership with Rocky View Schools to ensure the effective planning for current and future students. If you require any further information or have any questions please contact me.
Thank you,
Carrie Edwards Director, Planning and Transportation t | 403-817-7225 f | 403-777-8769
9-9

3 | 4
9-10

4 | 4
9-11

Board of Trustees 1221 – 8 Street SW Calgary, AB T2R 0L4 | t | 403-817-7933 | f | 403-294-8282 | www.cbe.ab.ca
February 8, 2018 Honourable David Eggen Honourable Shaye Anderson Minister of Education Minister of Municipal Affairs 228 Legislature Building 132 Legislature Building 10800 – 97 Avenue 10800 – 97 Avenue Edmonton AB T5K 2B6 Edmonton AB T5K 2B6 Dear Minister Eggen and Minister Anderson: RE: City Charters Urban Schools Collaboration Sub-Table
Further to your December 20, 2017 letter requesting participation in the collaboration sub-table on urban school planning, we are pleased to convey that Dany Breton, Superintendent of Facilities and Environmental Services, will represent the Calgary Board of Education (CBE). We also wish to take this occasion to thank you for the information provided to us on January 31, 2018 by ADM Michael Walter, ADM Gary Sandberg and Exec Dir Tracy Allen. The time they invested to establish the groundwork for a mutually respectful relationship augers well for the work to come. It is our understanding that the initial work of the collaboration sub-table will be to establish the governance structure. There is a strong tradition of collaboration between school boards and the City of Calgary. This tradition is reflected in the long standing Joint Use Agreement and the successful tripartite work completed in 2016 on the City Charter Memorandum of Understanding. Through these undertakings, it has been our experience that such multiparty endeavours can be expedited by ensuring the governance framework reflects the legislated authorities and accountabilities vested with elected officials. We look forward to bringing that experience to bear in this instance as we work with the Government of Alberta, City of Calgary and our fellow metro school boards in ensuring that the governance framework fully represents all parties, this with a focus on maximizing the benefits to students and the many and diverse constituents we mutually serve. Sincerely,
Trina Hurdman Chair, Board of Trustees Calgary Board of Education cc: His Worship Naheed Nenshi, Mayor, City of Calgary His Worship Don Iveson, Mayor, City of Edmonton Cheryl Low, Chair, Calgary Catholic School District Michelle Draper, Board Chair, Edmonton Public School Board Laura Thibert, Board Chair, Edmonton Catholic Schools Nathalie Lachance, Chair, Conseil scolaire Centre-Nord Louis Arseneault, President Conseil scolaire Franco-Sud David Stevenson, Chief Superintendent of Schools Dany Breton, Superintendent, Facilities and Environmental Services
Board Chair
Trina Hurdman Wards 1 & 2
Vice-Chair
Marilyn Dennis Wards 5 & 10
Trustees
Althea Adams Wards 3 & 4
Lisa Davis Wards 6 & 7
Richard Hehr Wards 8 & 9
Julie Hrdlicka Wards 11 & 13
Mike Bradshaw Wards 12 & 14
9-12

Catholic School Centre 1000 Fifth Avenue SW, Calgary, Alberta, Canada T2P 4T9
Tel: 403-500-2761 www.cssd.ab.ca
Office of the Board of TrusteesCALGARY CATHOLIC SCHOOL DISTRICT
ChairCheryl Low
Vice-ChairPamela Rath
Myra D’Souza
Lory Iovinelli
Mary Martin
Linda Wellman
Cathie Williams
February 12, 2018
Honourable Minister Anderson Honourable Minister Eggen Minister of Municipal Affairs Minister of Education 132 Legislature Building 228 Legislature Building 10800-97 Avenue 10800-97 Avenue Edmonton, AB T5K 2B6 Edmonton, AB T5K 2B6 Dear Minister Anderson and Minister Eggen,
Re: City Charter Collaboration – Urban Schools Planning
On behalf of the Board of Trustees of the Calgary Catholic School District (CCSD), I would
like to express our appreciation for the opportunity to meet with administrative staff
from your ministries, ADM Michael Walter, ADM Gary Sandberg, and Executive Director
Tracy Allen on January 31, 2018. It was a very positive ninety-minute meeting and this
proactive approach to collaboration was greatly appreciated, as it provided an
opportunity for us to have an open and productive conversation. We know that by
working together, we can create the best outcomes and were pleased that members of
your administrative teams took the time to meet with us to truly understand our needs
and build a model of strong collaboration.
Our district looks forward to the continuation of an effective and collaborative
partnership with the Ministry of Municipal Affairs, Ministry of Education, and the City of
Calgary for the success of the City Charters and to support vibrant communities with
environments that support excellence in student learning.
Sincerely,
Cheryl Low Chair, Calgary Catholic School District cc. Honourable Rachel Notley, Premier
Board of Trustees Gary Strother, Chief Superintendent Trina Hurdman, Board Chair Calgary Board of Education
9-13