Regions of interest computed by SVM wrapped method for Alzheimer’s disease examination from...
10
METHODS ARTICLE published: 20 February 2014 doi: 10.3389/fnagi.2014.00020 Regions of interest computed by SVM wrapped method for Alzheimer’s disease examination from segmented MRI Antonio R. Hidalgo-Muñoz*, Javier Ramírez, Juan M. Górriz and Pablo Padilla Department of Signal Theory, Networking and Communications, University of Granada, Granada, Spain Edited by: Hari S. Sharma, Uppsala University, Sweden Reviewed by: Hari S. Sharma, Uppsala University, Sweden John Suckling, University of Cambridge, UK Manuel Grana, Universidad del Pais Vasco, Spain *Correspondence: Antonio R. Hidalgo-Muñoz, Department of Signal Theory, Networking and Communications, University of Granada, C/ Periodista Daniel Saucedo Aranda s/n, 18071 Granada, Spain e-mail: [email protected] Accurate identification of the most relevant brain regions linked to Alzheimer’s disease (AD) is crucial in order to improve diagnosis techniques and to better understand this neurodegenerative process. For this purpose, statistical classification is suitable. In this work, a novel method based on support vector machine recursive feature elimination (SVM- RFE) is proposed to be applied on segmented brain MRI for detecting the most discriminant AD regions of interest (ROIs).The analyses are performed both on gray and white matter tissues, achieving up to 100% accuracy after classification and outperforming the results obtained by the standard t -test feature selection.The present method, applied on different subject sets, permits automatically determining high-resolution areas surrounding the hippocampal area without needing to divide the brain images according to any common template. Keywords:Alzheimer’s disease, gray and white matter, image segmentation, MRI, SVM INTRODUCTION Alzheimer’s disease (AD) is a progressive, neurodegenerative disorder that gradually impairs memory and other cognitive skills, such as spatial orientation, judgment or language, preventing a healthy aging. Currently, scientists are interested in researching different kinds of brain imaging to detect possible dementia at a very early stage, when medical and psychological treatments are more effective. For Alzheimer’s disease, it is necessary to deter- mine the brain regions of interest (ROIs); magnetic resonance imaging (MRI) provides valuable information on that matter. Several useful atlases and templates are reported in the literature (Shen et al., 2012). However, choosing the most appropriate one is difficult and it is not possible to use only one brain map to cover every specific characteristic from each neurological disor- der. From a clinical standpoint, doctors generally require rigorous technical basis or mathematical methods (Rosenberg and Hillis, 2009). Therefore, a straightforward method is needed for discrim- inating the most relevant regions related to neurodegenerative diseases (López et al., 2011; Shen et al., 2011). In this study, an approach combining image segmentation and a wrapped classifi- cation algorithm is proposed for computing the ROIs from MRI, which differ meaningfully between AD patients and healthy elderly people. Structural MRI has been widely explored in AD, giving valu- able information about its underlying anatomical progression. For instance, the Alzheimer’s disease neuroimaging initiative (ADNI) has compiled an MRI database of AD, and mild cognitive impair- ment (MCI) that has been widely employed (Jack et al., 2010; Weiner et al., 2010). MRI and AD research goals vary. Several researchers in this field have focused on volume and integrity mea- surement of different brain tissues (Shen et al., 2011; Zhang et al., 2013) in order to find relevant early AD biomarkers or MCI onset (Desikan et al., 2009). Furthermore, much research attempts to achieve more efficient automated classification of AD patients as compared to MCI patients or healthy aging (Klöppel et al., 2008; Aguilar et al., 2013; Ortiz et al., 2013a). Overall, most of these studies determine the ROIs before the classification block accord- ing to previously delimited regions, which have been split based on any standard template (Mazziotta et al., 1995; Shattuck et al., 2008; Cuingnet et al., 2011). Determining adequate brain ROIs is an important topic in medical image processing and computer-aided diagnostics (CAD) with many applications like morphology detection (Kapur et al., 1996) or 3-D visualizations for surgical planning (Suetens et al., 1993; Clarke et al., 1995). Usually, MRI is segmented into three quantitatively distinct tissues, that is, gray matter (GM), mainly linked to the cortex, white matter (WM), mainly composed by neu- ronal axons, and cerebrospinal fluid (CSF; Salas-Gonzalez et al., 2011). Despite the recent development of new MRI segmenta- tion methods (Ortiz et al., 2013b; Salas-Gonzalez et al., 2013), the most recognized approach models intensity value distribu- tion by a mixture of Gaussian distributions (MOG; Ashburner and Friston, 2003). This method is implemented in commonly used software like statistical parametric mapping (SPM; Frack- owiak, 2004), which is utilized in diverse clinical protocols, and obtains the probability of each image voxel belonging to any tissue according to location and intensity level in a gray scale. In general, machine-learning and classification techniques are increasingly used as an alternative to other multivariate statisti- cal approaches. The aim of these pattern recognition techniques is not limited to achieving good results in classification tasks Frontiers in Aging Neuroscience www.frontiersin.org February 2014 | Volume 6 | Article 20 | 1
-
Upload
independent -
Category
Documents
-
view
1 -
download
0
Transcript of Regions of interest computed by SVM wrapped method for Alzheimer’s disease examination from...
METHODS ARTICLEpublished: 20 February 2014
doi: 10.3389/fnagi.2014.00020
Regions of interest computed by SVM wrapped method forAlzheimer’s disease examination from segmented MRIAntonio R. Hidalgo-Muñoz*, Javier Ramírez, Juan M. Górriz and Pablo Padilla
Department of Signal Theory, Networking and Communications, University of Granada, Granada, Spain
Edited by:
Hari S. Sharma, Uppsala University,Sweden
Reviewed by:
Hari S. Sharma, Uppsala University,SwedenJohn Suckling, University ofCambridge, UKManuel Grana, Universidad del PaisVasco, Spain
*Correspondence:
Antonio R. Hidalgo-Muñoz,Department of Signal Theory,Networking and Communications,University of Granada, C/ PeriodistaDaniel Saucedo Aranda s/n, 18071Granada, Spaine-mail: [email protected]
Accurate identification of the most relevant brain regions linked to Alzheimer’s disease(AD) is crucial in order to improve diagnosis techniques and to better understand thisneurodegenerative process. For this purpose, statistical classification is suitable. In thiswork, a novel method based on support vector machine recursive feature elimination (SVM-RFE) is proposed to be applied on segmented brain MRI for detecting the most discriminantAD regions of interest (ROIs). The analyses are performed both on gray and white mattertissues, achieving up to 100% accuracy after classification and outperforming the resultsobtained by the standard t -test feature selection.The present method, applied on differentsubject sets, permits automatically determining high-resolution areas surrounding thehippocampal area without needing to divide the brain images according to any commontemplate.
Keywords: Alzheimer’s disease, gray and white matter, image segmentation, MRI, SVM
INTRODUCTIONAlzheimer’s disease (AD) is a progressive, neurodegenerativedisorder that gradually impairs memory and other cognitive skills,such as spatial orientation, judgment or language, preventing ahealthy aging. Currently, scientists are interested in researchingdifferent kinds of brain imaging to detect possible dementia at avery early stage, when medical and psychological treatments aremore effective. For Alzheimer’s disease, it is necessary to deter-mine the brain regions of interest (ROIs); magnetic resonanceimaging (MRI) provides valuable information on that matter.Several useful atlases and templates are reported in the literature(Shen et al., 2012). However, choosing the most appropriate oneis difficult and it is not possible to use only one brain map tocover every specific characteristic from each neurological disor-der. From a clinical standpoint, doctors generally require rigoroustechnical basis or mathematical methods (Rosenberg and Hillis,2009). Therefore, a straightforward method is needed for discrim-inating the most relevant regions related to neurodegenerativediseases (López et al., 2011; Shen et al., 2011). In this study, anapproach combining image segmentation and a wrapped classifi-cation algorithm is proposed for computing the ROIs from MRI,which differ meaningfully between AD patients and healthy elderlypeople.
Structural MRI has been widely explored in AD, giving valu-able information about its underlying anatomical progression. Forinstance, the Alzheimer’s disease neuroimaging initiative (ADNI)has compiled an MRI database of AD, and mild cognitive impair-ment (MCI) that has been widely employed (Jack et al., 2010;Weiner et al., 2010). MRI and AD research goals vary. Severalresearchers in this field have focused on volume and integrity mea-surement of different brain tissues (Shen et al., 2011; Zhang et al.,
2013) in order to find relevant early AD biomarkers or MCI onset(Desikan et al., 2009). Furthermore, much research attempts toachieve more efficient automated classification of AD patients ascompared to MCI patients or healthy aging (Klöppel et al., 2008;Aguilar et al., 2013; Ortiz et al., 2013a). Overall, most of thesestudies determine the ROIs before the classification block accord-ing to previously delimited regions, which have been split basedon any standard template (Mazziotta et al., 1995; Shattuck et al.,2008; Cuingnet et al., 2011).
Determining adequate brain ROIs is an important topic inmedical image processing and computer-aided diagnostics (CAD)with many applications like morphology detection (Kapur et al.,1996) or 3-D visualizations for surgical planning (Suetens et al.,1993; Clarke et al., 1995). Usually, MRI is segmented into threequantitatively distinct tissues, that is, gray matter (GM), mainlylinked to the cortex, white matter (WM),mainly composed by neu-ronal axons, and cerebrospinal fluid (CSF; Salas-Gonzalez et al.,2011). Despite the recent development of new MRI segmenta-tion methods (Ortiz et al., 2013b; Salas-Gonzalez et al., 2013),the most recognized approach models intensity value distribu-tion by a mixture of Gaussian distributions (MOG; Ashburnerand Friston, 2003). This method is implemented in commonlyused software like statistical parametric mapping (SPM; Frack-owiak, 2004), which is utilized in diverse clinical protocols,and obtains the probability of each image voxel belonging toany tissue according to location and intensity level in a grayscale.
In general, machine-learning and classification techniques areincreasingly used as an alternative to other multivariate statisti-cal approaches. The aim of these pattern recognition techniquesis not limited to achieving good results in classification tasks
Frontiers in Aging Neuroscience www.frontiersin.org February 2014 | Volume 6 | Article 20 | 1
Hidalgo-Muñoz et al. MRI regions in Alzheimer’s disease
or for artificial intelligence applications, but rather to gage therelevance of some extracted features and search for differencesbetween experimental conditions (Shieh and Yang, 2008; Hidalgo-Muñoz et al., 2013a,b; Tomé et al., 2013). Following this line,methods where the feature selection algorithm is wrapped aroundthe classification algorithm recursively to identify the least rele-vant features constitutes a good option (Kohavi and John, 1997).These algorithms are suitable for dealing with high-dimensionaldata like medical images, since the parameters of the classifierserve as scores to select the ROIs and the corresponding clas-sification performance guides the iterative procedure. On theother hand, generalizing results will depend on the size of thedataset, and the cross-validation (CV) method used to evalu-ate the classification accuracy (Burges, 1998). Either way, thesemethods permit covering a whole set of initial features with-out being restricted to any specific region to check its relevance.In this work, the recursive feature elimination (RFE) algorithm,proposed by Guyon et al. (2002), and based on the supportvector machine (SVM; Ben-Hur et al., 2008), is used. Supportvector machine recursive feature elimination (SVM-RFE) hasbeen successfully implemented in various neuroscience applica-tions (De Martino et al., 2008; Chu et al., 2012; Hidalgo-Muñozet al., 2013a); nevertheless, it has hardly been used for imageanalyses.
The presented work focuses separately on GM and WM tissuesto delimit the most discriminant brain ROIs for examining ADfrom MRI. This paper presents an innovative and effective methodfor feature selection, the SVM-RFE technique, that has never beenused before for this purpose as far as authors are aware. Thisaffordable and intuitive method, easily implementable in medicalapparatuses, intends to contribute to a complete diagnosis andexamination of AD and its progression.
MATERIALS AND METHODSDATASETData used in the preparation of this article was obtained fromthe (ADNI) database (http://adni.loni.usc.edu/). The ADNI waslaunched in 2003 by the National Institute on Aging (NIA),the National Institute of Biomedical Imaging and Bioengineer-ing (NIBIB), the Food and Drug Administration (FDA), privatepharmaceutical companies and non-profit organizations, as a$60 million, 5-year public-private partnership. The primary goalof ADNI has been to test whether serial MRI, positron emissiontomography (PET), other biological markers, and the progressionof MCI, and early AD. Determining sensitive and specific markersof very early AD progression is intended to aid researchers andclinicians to develop new treatments, as well as reduce the timeand cost of clinical trials. The Principal Investigator of this initia-tive is Michael W. Weiner, MD, VA Medical Center and Universityof California, San Francisco. ADNI is the result of efforts of manyco-investigators from a broad range of academic institutions andprivate corporations, and subjects have been recruited from over50 sites across the U.S. and Canada. The initial goal of ADNI wasto recruit 800 adults, ages 55 to 90, to participate in the research:approximately 200 cognitively normal older individuals to be fol-lowed for three years, 400 people with MCI to be followed for three
years and 200 people with early AD to be followed for two years.For up-to-date information, see www.adni-info.org.
In this article, only the data from T1-weighted MR images wasconsidered. The participants were separated into two differentclasses:
– Normal. Control subjects. Clinical Dementia Rating (CDR;Morris, 1993) of zero. They were non-depressed, non-MCI andnon-demented.
– AD. CDR of 0.5 or 1, met NINCDS/ADRDA criteria forprobable AD (McKhann et al., 2011).
Table 1 shows the demographic details of the subjects whocompose the dataset used in this work.
IMAGE PRE-PROCESSINGThe SPM software was originally designed for analyzing functionalbrain images. The package also contains routines for realignment,smoothing, and spatial normalization into a standard space ofT1-weighted MR images. To this end, the template implementedwithin the VBM8 Toolbox was used, specifically DARTEL, toachieve an accurate realignment of the images and a good nor-malization (http://dbm.neuro.uni-jena.de/vbm/). It is worthwhileto stress that spatial normalization or the registration algorithm isalways a critical component to any classifier that uses voxel-wisefeatures (Cuadra et al., 2005). Within these routines, a modulationstep was implemented in order to conserve the amount of tissueand not the intensities (see Ashburner et al., 2012; p. 192). Afterthe transformation of the images from the ADNI database, theywere resized to the dimensions 121 × 145 × 121 with voxel sizes of1.5 mm (sagittal) × 1.5 mm (coronal) × 1.5 mm (axial). Neithersmoothing nor dimension reduction were performed after that.One high-quality image per subject was chosen.
IMAGE SEGMENTATIONIn this work, GM and WM image segmentation was implementedin SPM, which models the intensity value distribution of the T1-weighted MRI by a MOG (Ashburner and Friston, 2003, 2005) andtakes voxel location into consideration via a tissue probability map(TPM). Using this methodology, which is described, for example,in Ashburner et al. (2012), it has been possible to overcome thepartial volume effect (PVE), such that a voxel may not be purely ofone tissue class, but can contain signals from a number of differenttissues.
Within this work the central features are the probability valuesfor GM or WM in a given voxel, not the intensity values per se.Once the images have been segmented, the resulting dataset isready for further processing and analysis. The subsequent analyseswere carried out with MATLABTM.
SVM WRAPPED METHODAs mentioned, medical images may provide clinicians valuableinformation about disease status, diagnosis and prognosis. How-ever, extracting significant features from high-dimensional dataas an image is always a complex task. Usually, some reductionmethods, and their subsequent feature selection, greatly trans-form the original data, making eventual clinical interpretationsdifficult. The aim of this paper is to select a reasonable number of
Frontiers in Aging Neuroscience www.frontiersin.org February 2014 | Volume 6 | Article 20 | 2
Hidalgo-Muñoz et al. MRI regions in Alzheimer’s disease
ROIs with high predictive value and whose aspect could then bemedically meaningful.
In the wrapper approach, the feature selection algorithm wrapsaround the classification algorithm. The feature selection con-sists of searching high-dimensional data sets using the inductionalgorithm itself as part of the evaluating function (Kohavi andJohn, 1997). Hence the parameters of the classifier serve as scoresto select (or to eliminate) features; the consequent classificationperformance guides an iterative procedure. When this recursivefeature elimination strategy uses a linear SVM-based classifier, theresulting method is known as support vector machine-recursivefeature elimination (SVM-RFE; Guyon et al., 2002). The valida-tion method will be crucial to avoiding creating a system that isover-trained, that is, that fits well only to the experimental data,losing generality and providing misleading results.
An SVM-based classifier separates a given set of binary-labeledtraining data with what is known as the maximal margin hyper-plane, which is maximally distant from two classes (for example,AD and Normal classes). The objective is to build a function thatwill correctly classify new examples (for example, MRI-segmentedimages).
Linear SVM parameters define a decision hyperplane in themultidimensional feature space (Burges, 1998; Ben-Hur et al.,2008; Illán et al., 2011), that is:
g(x) = wTx + b = 0
where x denotes the feature vector, w is known as the weightvector and b is known as the threshold. The decision hyperplaneposition is determined by vector w and b: the vector is orthogonalto the decision plane and b determines its distance to the origin. Forlinear SVM, the vector w can be explicitly computed. The designof the classifier consists of finding the unknown parameters, thatis, w components of w (wn, n = 1. . .M, where M = number offeatures) and b, which allows building a hyperplane that separatesthe two classes optimally.
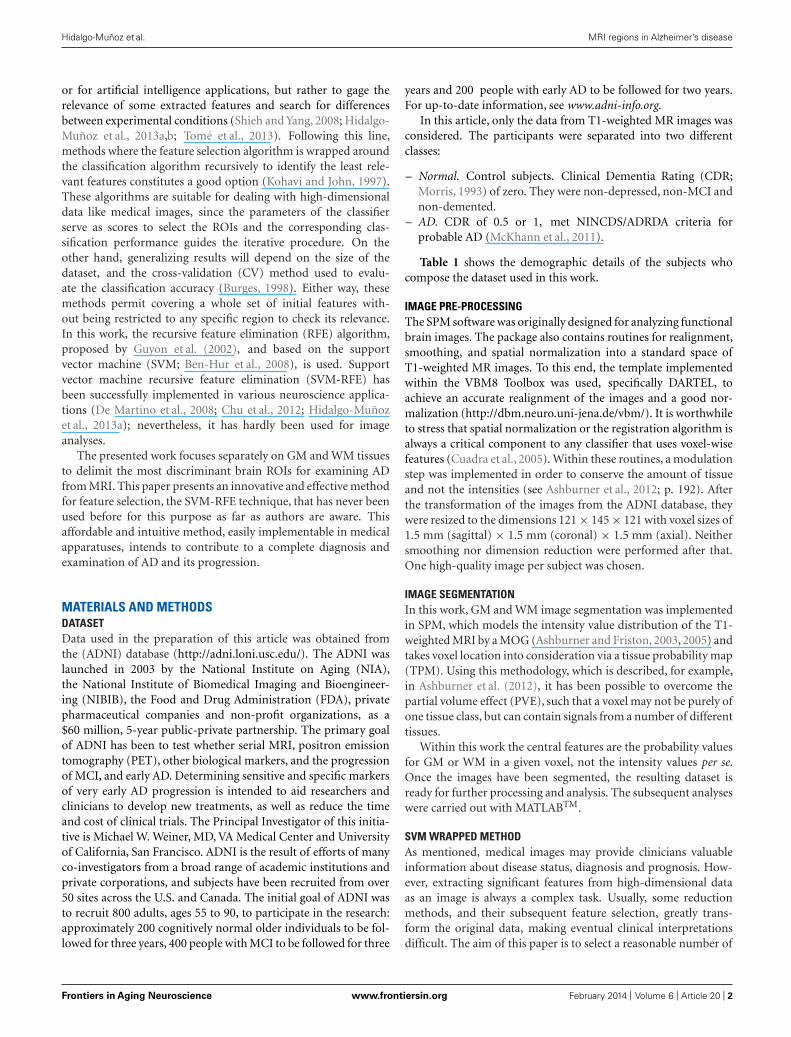
Figure 1 illustrates a 2D toy-example of a binary classifica-tion problem, where the points x=[x1 x2], marked like red circles,belong to one class, and the ones marked like blue crosses belong tothe other one. The problem is not linearly separable since it is notpossible to find a line (2D hyperplane) that perfectly separates alltraining instances of the two classes. However, if a small number ofmisclassifications are tolerated, the problem becomes linearly sep-arable. The figure shows the result of three training sessions withthe same data, but different misclassification margins (C parame-ter). The vector w = ∑Ns
1 yiλixi is a weighted sum of the supportvectors which are the Ns elements, inside the margin, chosen fromthe set used during the training phase. In Figure 1, these supportvectors are marked with circles around the training data points.λi are the corresponding Lagrangian parameters which are alsooptimized (0 < λi < C). Finally, the value of the threshold b isestimated by solving the equations related to the hyperplanes thatdefine the margin. In Ben-Hur et al. (2008), an extensive algebraicexplanation of SVM applied to biological sciences is reported.
The value of C must be assigned to run the optimization algo-rithm and represents the weight of the penalty term of the functionthat is related with the training set misclassification error. It is a
FIGURE 1 | SVM schemes using different C values. (A) C =100. (B)
C =1. (C) C =0.1. Thicker line: decision lines (hyperplane). Thinner lines:margin limits depending on the C parameter.
parameter that indirectly controls the margin width of the classifier(see Figure 1). A trade-off exists between the width of the marginand the number of accepted misclassifications. There is no opti-mal procedure to assign this parameter, but it has to be expectedthat if C is large, the misclassification errors are relevant duringthe optimization function and the margin should be narrow. Onthe other hand, if C is small, the misclassification errors are notrelevant and a large margin has is expected.
According to SVM-RFE algorithm, the relevance of the featurevector’s n–th entry is determined by the corresponding value wn
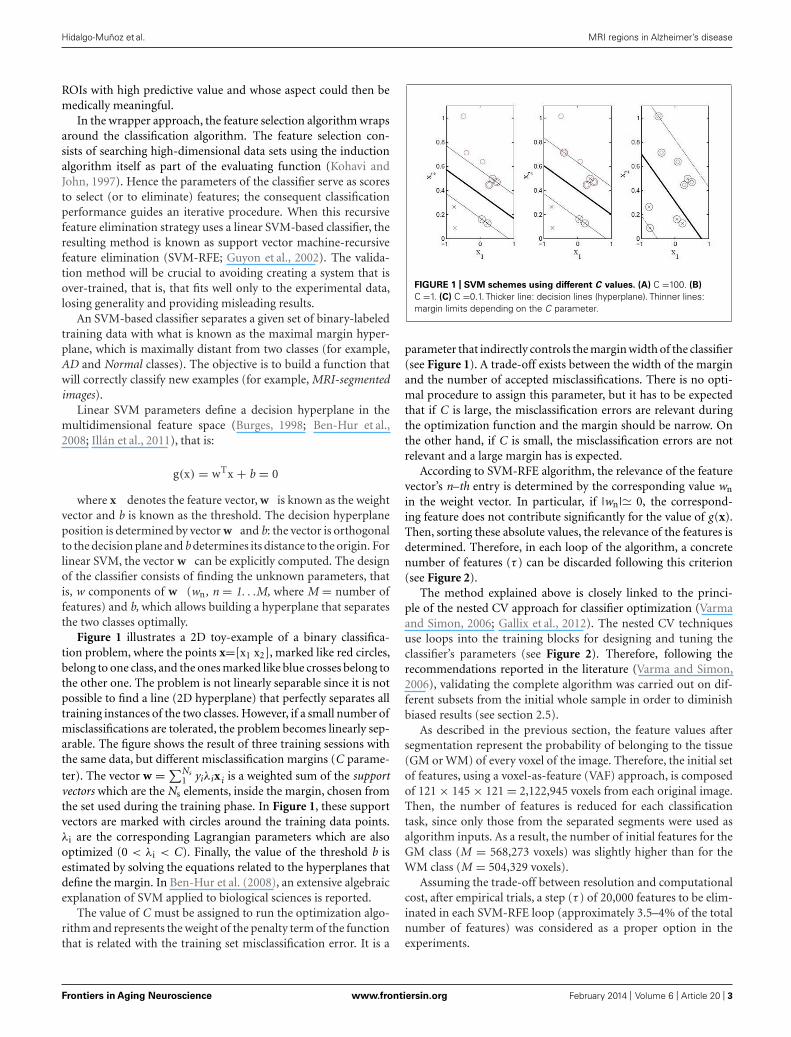
in the weight vector. In particular, if |wn|� 0, the correspond-ing feature does not contribute significantly for the value of g(x).Then, sorting these absolute values, the relevance of the features isdetermined. Therefore, in each loop of the algorithm, a concretenumber of features (τ ) can be discarded following this criterion(see Figure 2).
The method explained above is closely linked to the princi-ple of the nested CV approach for classifier optimization (Varmaand Simon, 2006; Gallix et al., 2012). The nested CV techniquesuse loops into the training blocks for designing and tuning theclassifier’s parameters (see Figure 2). Therefore, following therecommendations reported in the literature (Varma and Simon,2006), validating the complete algorithm was carried out on dif-ferent subsets from the initial whole sample in order to diminishbiased results (see section 2.5).
As described in the previous section, the feature values aftersegmentation represent the probability of belonging to the tissue(GM or WM) of every voxel of the image. Therefore, the initial setof features, using a voxel-as-feature (VAF) approach, is composedof 121 × 145 × 121 = 2,122,945 voxels from each original image.Then, the number of features is reduced for each classificationtask, since only those from the separated segments were used asalgorithm inputs. As a result, the number of initial features for theGM class (M = 568,273 voxels) was slightly higher than for theWM class (M = 504,329 voxels).
Assuming the trade-off between resolution and computationalcost, after empirical trials, a step (τ ) of 20,000 features to be elim-inated in each SVM-RFE loop (approximately 3.5–4% of the totalnumber of features) was considered as a proper option in theexperiments.
Frontiers in Aging Neuroscience www.frontiersin.org February 2014 | Volume 6 | Article 20 | 3
Hidalgo-Muñoz et al. MRI regions in Alzheimer’s disease
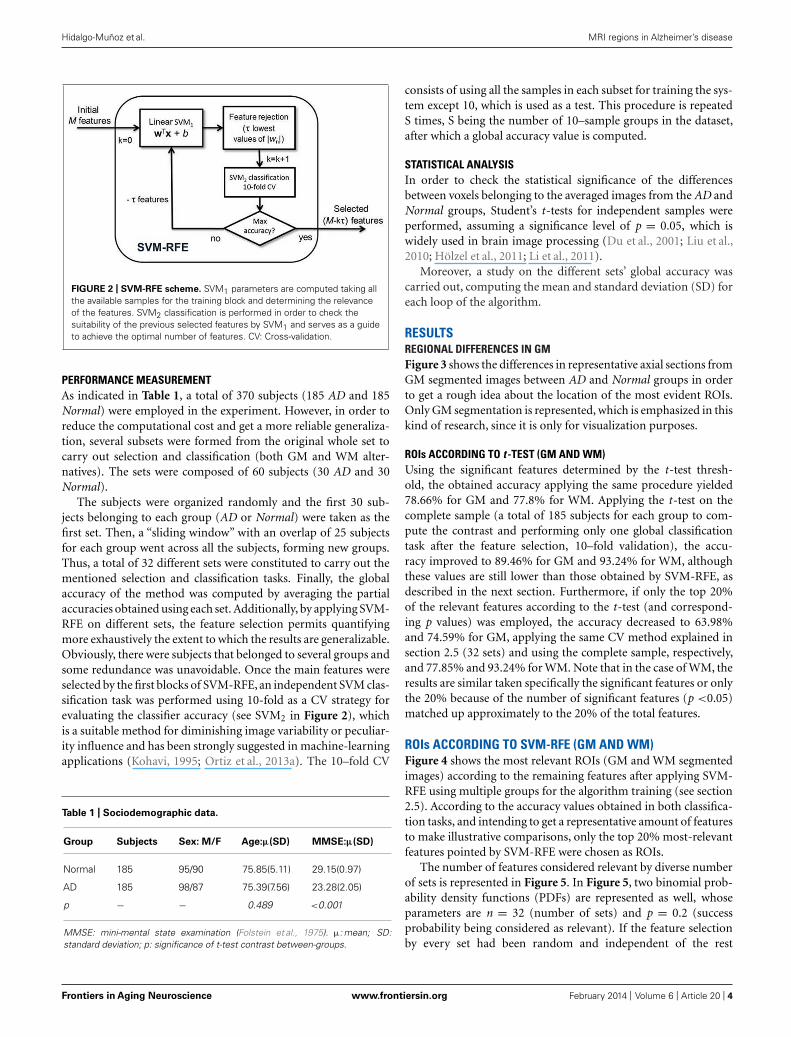
FIGURE 2 | SVM-RFE scheme. SVM1 parameters are computed taking allthe available samples for the training block and determining the relevanceof the features. SVM2 classification is performed in order to check thesuitability of the previous selected features by SVM1 and serves as a guideto achieve the optimal number of features. CV: Cross-validation.
PERFORMANCE MEASUREMENTAs indicated in Table 1, a total of 370 subjects (185 AD and 185Normal) were employed in the experiment. However, in order toreduce the computational cost and get a more reliable generaliza-tion, several subsets were formed from the original whole set tocarry out selection and classification (both GM and WM alter-natives). The sets were composed of 60 subjects (30 AD and 30Normal).
The subjects were organized randomly and the first 30 sub-jects belonging to each group (AD or Normal) were taken as thefirst set. Then, a “sliding window” with an overlap of 25 subjectsfor each group went across all the subjects, forming new groups.Thus, a total of 32 different sets were constituted to carry out thementioned selection and classification tasks. Finally, the globalaccuracy of the method was computed by averaging the partialaccuracies obtained using each set. Additionally, by applying SVM-RFE on different sets, the feature selection permits quantifyingmore exhaustively the extent to which the results are generalizable.Obviously, there were subjects that belonged to several groups andsome redundance was unavoidable. Once the main features wereselected by the first blocks of SVM-RFE, an independent SVM clas-sification task was performed using 10-fold as a CV strategy forevaluating the classifier accuracy (see SVM2 in Figure 2), whichis a suitable method for diminishing image variability or peculiar-ity influence and has been strongly suggested in machine-learningapplications (Kohavi, 1995; Ortiz et al., 2013a). The 10–fold CV
Table 1 | Sociodemographic data.
Group Subjects Sex: M/F Age:μ(SD) MMSE:μ(SD)
Normal 185 95/90 75.85(5.11) 29.15(0.97)
AD 185 98/87 75.39(7.56) 23.28(2.05)
p − − 0.489 <0.001
MMSE: mini-mental state examination (Folstein et al., 1975). μ: mean; SD:standard deviation; p: significance of t-test contrast between-groups.
consists of using all the samples in each subset for training the sys-tem except 10, which is used as a test. This procedure is repeatedS times, S being the number of 10–sample groups in the dataset,after which a global accuracy value is computed.
STATISTICAL ANALYSISIn order to check the statistical significance of the differencesbetween voxels belonging to the averaged images from the AD andNormal groups, Student’s t-tests for independent samples wereperformed, assuming a significance level of p = 0.05, which iswidely used in brain image processing (Du et al., 2001; Liu et al.,2010; Hölzel et al., 2011; Li et al., 2011).
Moreover, a study on the different sets’ global accuracy wascarried out, computing the mean and standard deviation (SD) foreach loop of the algorithm.
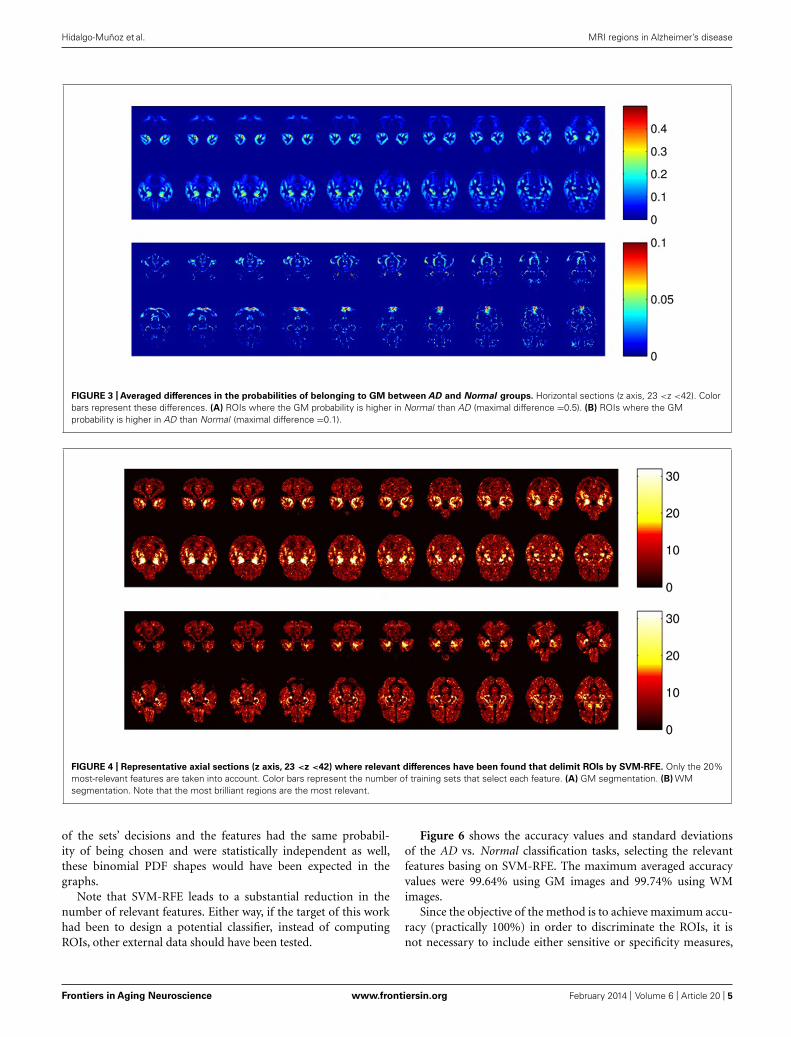
RESULTSREGIONAL DIFFERENCES IN GMFigure 3 shows the differences in representative axial sections fromGM segmented images between AD and Normal groups in orderto get a rough idea about the location of the most evident ROIs.Only GM segmentation is represented, which is emphasized in thiskind of research, since it is only for visualization purposes.
ROIs ACCORDING TO t -TEST (GM AND WM)Using the significant features determined by the t-test thresh-old, the obtained accuracy applying the same procedure yielded78.66% for GM and 77.8% for WM. Applying the t-test on thecomplete sample (a total of 185 subjects for each group to com-pute the contrast and performing only one global classificationtask after the feature selection, 10–fold validation), the accu-racy improved to 89.46% for GM and 93.24% for WM, althoughthese values are still lower than those obtained by SVM-RFE, asdescribed in the next section. Furthermore, if only the top 20%of the relevant features according to the t-test (and correspond-ing p values) was employed, the accuracy decreased to 63.98%and 74.59% for GM, applying the same CV method explained insection 2.5 (32 sets) and using the complete sample, respectively,and 77.85% and 93.24% for WM. Note that in the case of WM, theresults are similar taken specifically the significant features or onlythe 20% because of the number of significant features (p <0.05)matched up approximately to the 20% of the total features.
ROIs ACCORDING TO SVM-RFE (GM AND WM)Figure 4 shows the most relevant ROIs (GM and WM segmentedimages) according to the remaining features after applying SVM-RFE using multiple groups for the algorithm training (see section2.5). According to the accuracy values obtained in both classifica-tion tasks, and intending to get a representative amount of featuresto make illustrative comparisons, only the top 20% most-relevantfeatures pointed by SVM-RFE were chosen as ROIs.
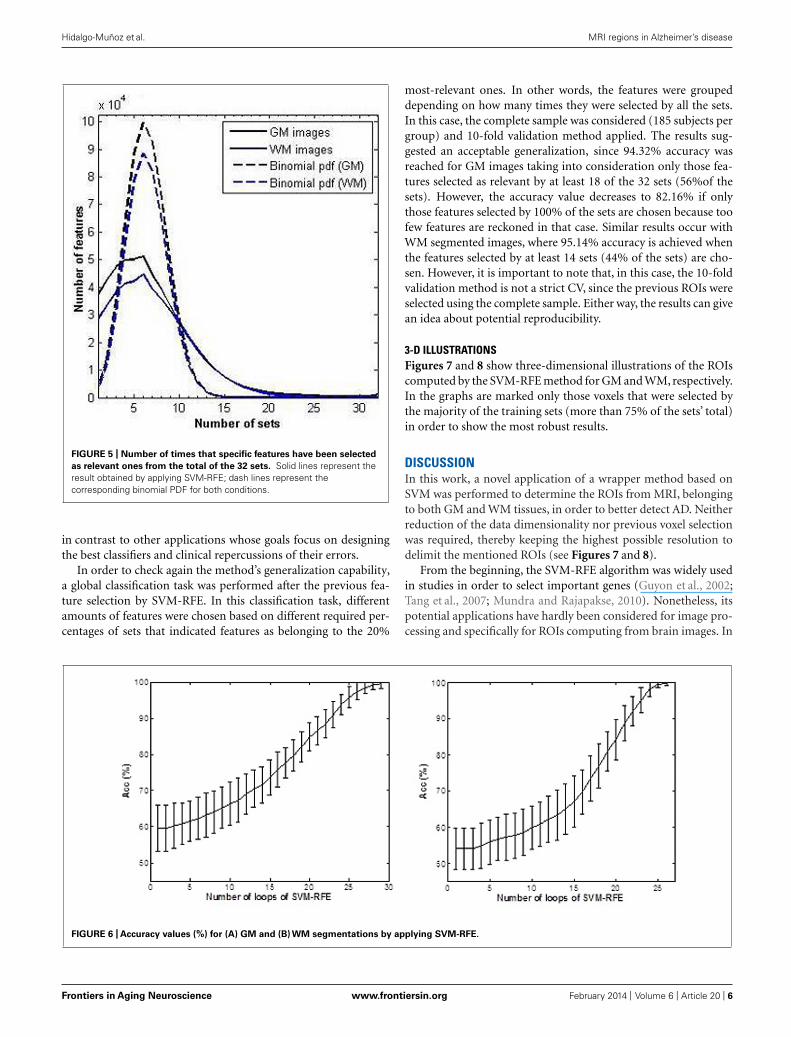
The number of features considered relevant by diverse numberof sets is represented in Figure 5. In Figure 5, two binomial prob-ability density functions (PDFs) are represented as well, whoseparameters are n = 32 (number of sets) and p = 0.2 (successprobability being considered as relevant). If the feature selectionby every set had been random and independent of the rest
Frontiers in Aging Neuroscience www.frontiersin.org February 2014 | Volume 6 | Article 20 | 4
Hidalgo-Muñoz et al. MRI regions in Alzheimer’s disease
FIGURE 3 | Averaged differences in the probabilities of belonging to GM between AD and Normal groups. Horizontal sections (z axis, 23 <z <42). Colorbars represent these differences. (A) ROIs where the GM probability is higher in Normal than AD (maximal difference =0.5). (B) ROIs where the GMprobability is higher in AD than Normal (maximal difference =0.1).
FIGURE 4 | Representative axial sections (z axis, 23 <z <42) where relevant differences have been found that delimit ROIs by SVM-RFE. Only the 20%most-relevant features are taken into account. Color bars represent the number of training sets that select each feature. (A) GM segmentation. (B) WMsegmentation. Note that the most brilliant regions are the most relevant.
of the sets’ decisions and the features had the same probabil-ity of being chosen and were statistically independent as well,these binomial PDF shapes would have been expected in thegraphs.
Note that SVM-RFE leads to a substantial reduction in thenumber of relevant features. Either way, if the target of this workhad been to design a potential classifier, instead of computingROIs, other external data should have been tested.
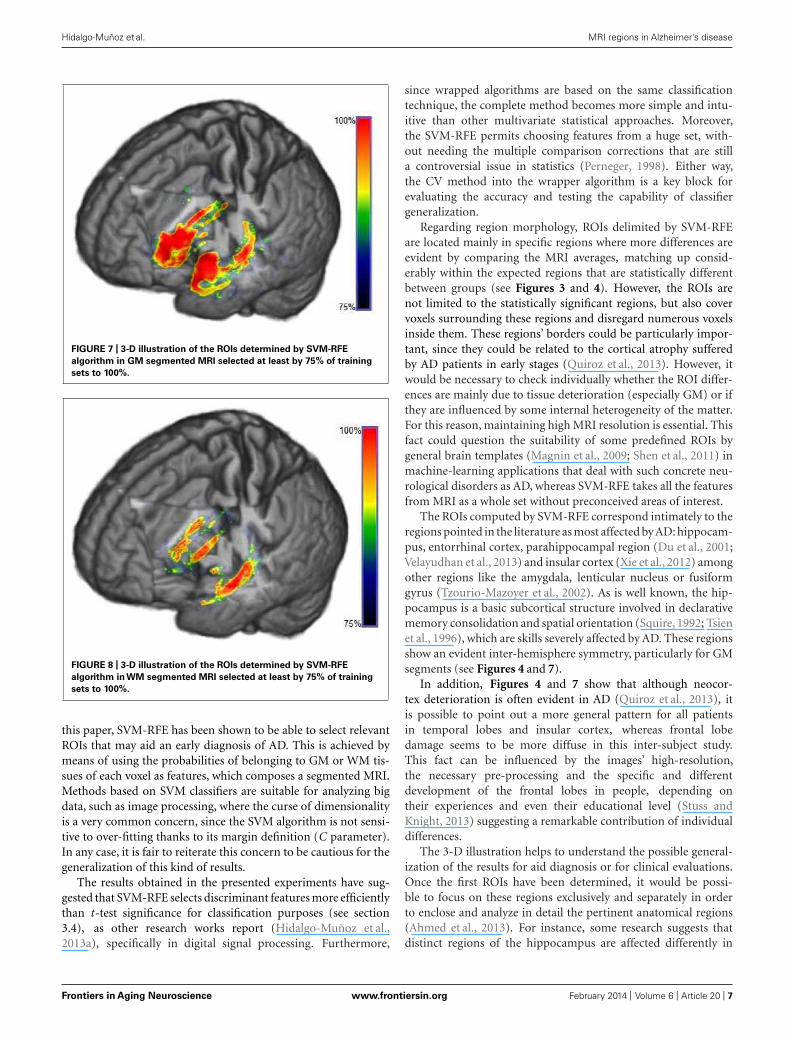
Figure 6 shows the accuracy values and standard deviationsof the AD vs. Normal classification tasks, selecting the relevantfeatures basing on SVM-RFE. The maximum averaged accuracyvalues were 99.64% using GM images and 99.74% using WMimages.
Since the objective of the method is to achieve maximum accu-racy (practically 100%) in order to discriminate the ROIs, it isnot necessary to include either sensitive or specificity measures,
Frontiers in Aging Neuroscience www.frontiersin.org February 2014 | Volume 6 | Article 20 | 5
Hidalgo-Muñoz et al. MRI regions in Alzheimer’s disease
FIGURE 5 | Number of times that specific features have been selected
as relevant ones from the total of the 32 sets. Solid lines represent theresult obtained by applying SVM-RFE; dash lines represent thecorresponding binomial PDF for both conditions.
in contrast to other applications whose goals focus on designingthe best classifiers and clinical repercussions of their errors.
In order to check again the method’s generalization capability,a global classification task was performed after the previous fea-ture selection by SVM-RFE. In this classification task, differentamounts of features were chosen based on different required per-centages of sets that indicated features as belonging to the 20%
most-relevant ones. In other words, the features were groupeddepending on how many times they were selected by all the sets.In this case, the complete sample was considered (185 subjects pergroup) and 10-fold validation method applied. The results sug-gested an acceptable generalization, since 94.32% accuracy wasreached for GM images taking into consideration only those fea-tures selected as relevant by at least 18 of the 32 sets (56%of thesets). However, the accuracy value decreases to 82.16% if onlythose features selected by 100% of the sets are chosen because toofew features are reckoned in that case. Similar results occur withWM segmented images, where 95.14% accuracy is achieved whenthe features selected by at least 14 sets (44% of the sets) are cho-sen. However, it is important to note that, in this case, the 10-foldvalidation method is not a strict CV, since the previous ROIs wereselected using the complete sample. Either way, the results can givean idea about potential reproducibility.
3-D ILLUSTRATIONSFigures 7 and 8 show three-dimensional illustrations of the ROIscomputed by the SVM-RFE method for GM and WM, respectively.In the graphs are marked only those voxels that were selected bythe majority of the training sets (more than 75% of the sets’ total)in order to show the most robust results.
DISCUSSIONIn this work, a novel application of a wrapper method based onSVM was performed to determine the ROIs from MRI, belongingto both GM and WM tissues, in order to better detect AD. Neitherreduction of the data dimensionality nor previous voxel selectionwas required, thereby keeping the highest possible resolution todelimit the mentioned ROIs (see Figures 7 and 8).
From the beginning, the SVM-RFE algorithm was widely usedin studies in order to select important genes (Guyon et al., 2002;Tang et al., 2007; Mundra and Rajapakse, 2010). Nonetheless, itspotential applications have hardly been considered for image pro-cessing and specifically for ROIs computing from brain images. In
FIGURE 6 | Accuracy values (%) for (A) GM and (B) WM segmentations by applying SVM-RFE.
Frontiers in Aging Neuroscience www.frontiersin.org February 2014 | Volume 6 | Article 20 | 6
Hidalgo-Muñoz et al. MRI regions in Alzheimer’s disease
FIGURE 7 | 3-D illustration of the ROIs determined by SVM-RFE
algorithm in GM segmented MRI selected at least by 75% of training
sets to 100%.
FIGURE 8 | 3-D illustration of the ROIs determined by SVM-RFE
algorithm in WM segmented MRI selected at least by 75% of training
sets to 100%.
this paper, SVM-RFE has been shown to be able to select relevantROIs that may aid an early diagnosis of AD. This is achieved bymeans of using the probabilities of belonging to GM or WM tis-sues of each voxel as features, which composes a segmented MRI.Methods based on SVM classifiers are suitable for analyzing bigdata, such as image processing, where the curse of dimensionalityis a very common concern, since the SVM algorithm is not sensi-tive to over-fitting thanks to its margin definition (C parameter).In any case, it is fair to reiterate this concern to be cautious for thegeneralization of this kind of results.
The results obtained in the presented experiments have sug-gested that SVM-RFE selects discriminant features more efficientlythan t-test significance for classification purposes (see section3.4), as other research works report (Hidalgo-Muñoz et al.,2013a), specifically in digital signal processing. Furthermore,
since wrapped algorithms are based on the same classificationtechnique, the complete method becomes more simple and intu-itive than other multivariate statistical approaches. Moreover,the SVM-RFE permits choosing features from a huge set, with-out needing the multiple comparison corrections that are stilla controversial issue in statistics (Perneger, 1998). Either way,the CV method into the wrapper algorithm is a key block forevaluating the accuracy and testing the capability of classifiergeneralization.
Regarding region morphology, ROIs delimited by SVM-RFEare located mainly in specific regions where more differences areevident by comparing the MRI averages, matching up consid-erably within the expected regions that are statistically differentbetween groups (see Figures 3 and 4). However, the ROIs arenot limited to the statistically significant regions, but also covervoxels surrounding these regions and disregard numerous voxelsinside them. These regions’ borders could be particularly impor-tant, since they could be related to the cortical atrophy sufferedby AD patients in early stages (Quiroz et al., 2013). However, itwould be necessary to check individually whether the ROI differ-ences are mainly due to tissue deterioration (especially GM) or ifthey are influenced by some internal heterogeneity of the matter.For this reason, maintaining high MRI resolution is essential. Thisfact could question the suitability of some predefined ROIs bygeneral brain templates (Magnin et al., 2009; Shen et al., 2011) inmachine-learning applications that deal with such concrete neu-rological disorders as AD, whereas SVM-RFE takes all the featuresfrom MRI as a whole set without preconceived areas of interest.
The ROIs computed by SVM-RFE correspond intimately to theregions pointed in the literature as most affected by AD: hippocam-pus, entorrhinal cortex, parahippocampal region (Du et al., 2001;Velayudhan et al., 2013) and insular cortex (Xie et al., 2012) amongother regions like the amygdala, lenticular nucleus or fusiformgyrus (Tzourio-Mazoyer et al., 2002). As is well known, the hip-pocampus is a basic subcortical structure involved in declarativememory consolidation and spatial orientation (Squire, 1992; Tsienet al., 1996), which are skills severely affected by AD. These regionsshow an evident inter-hemisphere symmetry, particularly for GMsegments (see Figures 4 and 7).
In addition, Figures 4 and 7 show that although neocor-tex deterioration is often evident in AD (Quiroz et al., 2013), itis possible to point out a more general pattern for all patientsin temporal lobes and insular cortex, whereas frontal lobedamage seems to be more diffuse in this inter-subject study.This fact can be influenced by the images’ high-resolution,the necessary pre-processing and the specific and differentdevelopment of the frontal lobes in people, depending ontheir experiences and even their educational level (Stuss andKnight, 2013) suggesting a remarkable contribution of individualdifferences.
The 3-D illustration helps to understand the possible general-ization of the results for aid diagnosis or for clinical evaluations.Once the first ROIs have been determined, it would be possi-ble to focus on these regions exclusively and separately in orderto enclose and analyze in detail the pertinent anatomical regions(Ahmed et al., 2013). For instance, some research suggests thatdistinct regions of the hippocampus are affected differently in
Frontiers in Aging Neuroscience www.frontiersin.org February 2014 | Volume 6 | Article 20 | 7
Hidalgo-Muñoz et al. MRI regions in Alzheimer’s disease
AD (Burger, 2010; Lee et al., 2012). Therefore, a rigorous studyusing SVM-RFE might be recommended for exhaustive anatomi-cal inspections and analyzing particular cases. On the other hand,by maintaining the high-resolution, it would be possible to exam-ine some regions that are difficult to delimit in averaged imagesdue to their location and size, such as the locus coeruleus or thefornix.
Regarding the comparison between GM and WM, the for-mer tissue provides more relevant information and delimitsmore properly the important ROIs, as is suggested in muchresearch that analyzes the GM directly (Thompson et al., 2003;Karas et al., 2004). Whereas for GM segmentation there aremore highlighted regions using SVM-RFE, for WM segmenta-tion the ROIs are distributed vaguely similarly to the resultsobtained with t-test. In any case, by means of the proposedmethodology, it is possible to achieve practically 100% accu-racy on average for both GM and WM segmentation options(Figure 6) after running a complete SVM-RFE in different featuresets.
In future works, it could be suggested to apply the same methodto GM and WM segments obtained by other sophisticated MRIprocessing approaches. In addition, it is possible to employ themethod in artificial intelligence applications in medicine for inves-tigating diverse neurological disorders linked to senescence, suchas fronto-temporal lobar degeneration, different forms of demen-tia or Parkinson’s disease among others, where an accurate MRIinformation management is crucial.
CONCLUSIONIn this paper, the main region of brain interest involved inAlzheimer’s disease has been delimited by means of a SVM-basedwrapper method applied on structural images, that is, MRI. Theproposed method, which recursively eliminates the least-relevantfeatures from the initial set (SVM-RFE), has proven to outperformt-test selection in terms of accuracy, achieving practically 100%.The high-resolution ROIs have been computed for both gray andwhite segmented matters, matching up with recent research thatdesignates the hippocampal region as one of the most importantin Alzheimer’s disease development. In addition, 3-D illustrationsof the regions have been provided in order to better understand theanatomical morphology linked to AD. Furthermore, this method,previously unexplored for MRI, could give valuable informationabout brain structures in other clinical applications on agingresearch.
AUTHOR CONTRIBUTIONSData used in preparation of this article was obtained from theAlzheimer’s Disease Neuroimaging Initiative (ADNI) database(http://adni.loni.usc.edu/). As such, the investigators within theADNI contributed to the design and implementation of ADNIand/or provided data, but did not participate in the analysis orwriting of this report.
ACKNOWLEDGMENTSThis work was partly supported by the MICINN under theTEC2012-34306 project and the Consejería de Innovación, Cien-cia y Empresa (Junta de Andalucía, Spain) under the Excellence
Projects P09-TIC-4530 and P11-TIC-7103. Data collection andsharing for this project was funded by the Alzheimer’s DiseaseNeuroimaging Initiative (ADNI; National Institutes of HealthGrant U01 AG024904). ADNI is funded by the National Insti-tute on Aging, the National Institute of Biomedical Imaging andBioengineering, and through generous contributions from thefollowing: Abbott, AstraZeneca AB, Bayer Schering Pharma AG,Bristol-Myers Squibb, Eisai Global Clinical Development, ElanCorporation, Genentech, GE Healthcare, GlaxoSmithKline, Inno-genetics, Johnson and Johnson, Eli Lilly and Co., Medpace, Inc.,Merck and Co., Inc., Novartis AG, Pfizer Inc., F. Hoffman-LaRoche, Schering-Plough, Synarc, Inc., as well as non-profit part-ners the Alzheimer’s Association and Alzheimer’s Drug DiscoveryFoundation, with participation from the U.S. Food and DrugAdministration. Private sector contributions to ADNI are facil-itated by the Foundation for the National Institutes of Health(www.fnih.org). The grantee organization is the Northern Cal-ifornia Institute for Research and Education, and the study iscoordinated by the Alzheimer’s Disease Cooperative Study at theUniversity of California, San Diego. ADNI data are disseminatedby the Laboratory for Neuro-Imaging at the University of Califor-nia, Los Angeles. This research was also supported by NIH grantsP30 AG010129, K01 AG030514, and the Dana Foundation.
REFERENCESAguilar, C., Westman, E., Muehlboeck, J., Mecocci, P., Vellas, B., Tsolaki, M., et al.
(2013). Different multivariate techniques for automated classification of MRIdata in Alzheimer’s disease and mild cognitive impairment. Psychiatry Res. 212,89–98. doi: 10.1016/j.pscychresns.2012.11.005
Ahmed, O. B., Benois-Pineau, J., Allard, M., Amar, C. B., and Catheline, G. (2013).“Alzheimer Disease detection on structural MRI,” in Proceedings of ESMRMB 2013Congress, Toulouse.
Ashburner, J., and Friston, K. (2003). Human Brain Function, 2nd Edn, eds R.Frackowiak, K. Friston, C. Frith, R. Dolan, K. Friston, C. Price, et al. (San Diego,CA: Academic Press).
Ashburner, J., and Friston, K. J. (2005). Unified segmentation. Neuroimage 26,839–851. doi: 10.1016/j.neuroimage.2005.02.018
Ashburner, J., Barnes, G., Chen, C., Daunizeau, J., Flandin, G., Friston, K., et al.(2012). “SPM8 manual,” in Functional Imaging Laboratory, Institute of Neurology,London.
Ben-Hur, A., Ong, C. S., Sonnenburg, S., Schölkopf, B., and Rätsch, G. (2008).Support vector machines and kernels for computational biology. PLoS Comput.Biol. 4:e1000173. doi: 10.1371/journal.pcbi.1000173
Burger, C. (2010). Region-specific genetic alterations in the aging hippocam-pus: implications for cognitive aging. Front. Aging Neurosci. 2:140. doi:10.3389/fnagi.2010.00140
Burges, C. (1998). A tutorial on support vector machines for pattern recognition.Data Min. Knowl. Disc. 2, 121–167. doi: 10.1023/A:1009715923555
Chu, C., Hsu, A. L., Chou, K. H., Bandettini, P., and Lin, C. (2012). Does featureselection improve classification accuracy? Impact of sample size and feature selec-tion on classification using anatomical magnetic resonance images. Neuroimage60, 59–70. doi: 10.1016/j.neuroimage.2011.11.066
Clarke, L. P., Velthuizen, R. P., Camacho, M. A., Heine, J. J., Vaidyanathan, M., Hall,L. O., et al. (1995). MRI segmentation: methods and applications. Magn. Reson.Imaging 13, 343–368. doi: 10.1016/0730-725X(94)00124-L
Cuadra, M. B., Cammoun, L., Butz, T., Cuisenaire, O., and Thiran, J. P. (2005).Comparison and validation of tissue modelization and statistical classificationmethods in T1-weighted MR brain images. IEEE Trans. Med. Imaging 24, 1548–1565. doi: 10.1109/TMI.2005.857652
Cuingnet, R., Gerardin, E., Tessieras, J., Auzias, G., Lehéricy, S., Habert, M. O., et al.(2011). Automatic classification of patients with Alzheimer’s disease from struc-tural MRI: a comparison of ten methods using the ADNI database. Neuroimage56, 766–781. doi: 10.1016/j.neuroimage.2010.06.013
Frontiers in Aging Neuroscience www.frontiersin.org February 2014 | Volume 6 | Article 20 | 8
Hidalgo-Muñoz et al. MRI regions in Alzheimer’s disease
De Martino, F., Valente, G., Staeren, N., Ashburner, J., Goebel, R., and Formisano, E.(2008). Combining multivariate voxel selection and support vector machines formapping and classification of fMRI spatial patterns. Neuroimage 43, 44–58. doi:10.1016/j.neuroimage.2008.06.037
Desikan, R. S., Cabral, H. J., Hess, C. P., Dillon, W. P., Glastonbury, C. M.,Weiner, M. W., et al. (2009). Automated MRI measures identify individuals withmild cognitive impairment and Alzheimer’s disease. Brain 132, 2048–2057. doi:10.1093/brain/awp123
Du, A. T., Schuff, N., Amend, D., Laakso, M. P., Hsu, Y. Y., Jagust, W. J., et al. (2001).Magnetic resonance imaging of the entorhinal cortex and hippocampus in mildcognitive impairment and Alzheimer’s disease. J. Neurol. Neurosurg. Psychiatry71, 441–447. doi: 10.1136/jnnp.71.4.441
Folstein, M. F., Folstein, S. E., and McHugh, P. R. (1975). “Mini-mental state”:a practical method for grading the cognitive state of patients for the clinician.J. Psychiatry Res. 12, 189–198. doi: 10.1016/0022-3956(75)90026-6
Frackowiak, R. S. (2004). Human Brain Function, eds K. J. Friston, C. D. Frith, R. J.Dolan, C. J. Price, S. Zeki, J. T. Ashburner, et al. (San Diego, CA: Academic Press).
Gallix, A., Górriz, J. M., Ramírez, J., Illan, I. A., and Lang, E. W. (2012). On theempirical mode decomposition applied to the analysis of brain SPECT images.Expert Syst. Appl. 39, 13451–13461. doi: 10.1016/j.eswa.2012.05.058
Guyon, I., Weston, J., Barnhill, S., and Vapnik, V. (2002). Gene selection for cancerclassification using support vector machines. Mach. Learn. 46, 389–422. doi:10.1023/A:1012487302797
Hidalgo-Muñoz, A. R., López, M. M., Santos, I. M., Pereira, A. T., Vázquez-Marrufo,M., Galvao-Carmona, A., et al. (2013a). Application of SVM-RFE on EEG signalsfor detecting the most relevant scalp regions linked to affective valence processing.Expert Syst. Appl. 40, 2102–2108. doi: 10.1016/j.eswa.2012.10.013
Hidalgo-Muñoz, A. R., Pereira, A. T., López, M. M., Galvao-Carmona, A., Tomé, A.M., Vázquez-Marrufo, M., et al. (2013b). Individual EEG differences in affectivevalence processing in women with low and high neuroticism. Clin. Neurophysiol.124, 1798–1806. doi: 10.1016/j.clinph.2013.03.026
Hölzel, B. K., Carmody, J., Vangel, M., Congleton, C., Yerramsetti, S. M., Gard, T.,et al. (2011). Mindfulness practice leads to increases in regional brain gray matterdensity. Psychiatry Res. 191, 36–43. doi: 10.1016/j.pscychresns.2010.08.006
Illán, I. A., Górriz, J. M., López, M. M., Ramírez, J., Salas-Gonzalez, D., Segovia, F.,et al. (2011). Computer aided diagnosis of Alzheimer’s disease using componentbased SVM. Appl. Soft Comput. 11, 2376–2382. doi: 10.1016/j.asoc.2010.08.019
Jack, Jr. C. R., Bernstein, M. A., Borowski, B. J., Gunter, J. L., Fox, N. C., Thomp-son, P. M., et al. (2010). Update on the magnetic resonance imaging core of theAlzheimer’s disease neuroimaging initiative. Alzheimer’s Demen. 6, 212–220. doi:10.1016/j.jalz.2010.03.004
Kapur, T., Grimson, W. E. L., Wells, W. M. III, and Kikinis, R. (1996). Segmentationof brain tissue from magnetic resonance images. Med. Image Anal. 1, 109–127.doi: 10.1016/S1361-8415(96)80008-9
Karas, G. B., Scheltens, P., Rombouts, S. A. R. B., Visser, P. J., Van Schijndel,R. A., Fox, N. C., et al. (2004). Global and local gray matter loss in mildcognitive impairment and Alzheimer’s disease. Neuroimage 23, 708–716. doi:10.1016/j.neuroimage.2004.07.006
Klöppel, S., Stonnington, C. M., Chu, C., Draganski, B., Scahill, R. I., Rohrer, J. D.,et al. (2008). Automatic classification of MR scans in Alzheimer’s disease. Brain131, 681–689. doi: 10.1093/brain/awm319
Kohavi, R. (1995).“A study of cross-validation and bootstrap for accuracy estimationand model selection,” in Proceedings of The International Joint Conference onArtificial Intelligence, Vol. 14. (Montreal, QC: IJCAI), 1137–1145.
Kohavi, R., and John, G. H. (1997). Wrappers for feature subset selection. Artif.Intell. 97, 273–324. doi: 10.1016/S0004-3702(97)00043-X
López, M., Ramírez, J., Górriz, J. M., Álvarez, I., Salas-Gonzalez, D.,Segovia, F., et al. (2011). Principal component analysis-based techniquesand supervised classification schemes for the early detection of Alzheimer’sdisease. Neurocomputing 74, 1260–1271. doi: 10.1016/j.neucom.2010.06.025
Lee, D. Y., Fletcher, E., Carmichael, O. T., Singh, B., Mungas, D., Reed, B., et al.(2012). Sub-regional hippocampal injury is associated with fornix degenerationin Alzheimer’s disease. Front. Aging Neurosci. 4:1. doi: 10.3389/fnagi.2012.00001
Li, X., Coyle, D., Maguire, L., Watson, D. R., and McGinnity, T. M. (2011).Gray matter concentration and effective connectivity changes in Alzheimer’sdisease: a longitudinal structural MRI study. Neuroradiology 53, 733–748. doi:10.1007/s00234-010-0795-1
Liu, Y., Paajanen, T., Zhang, Y., Westman, E., Wahlund, L. O., Simmons, A., et al.(2010). Analysis of regional MRI volumes and thicknesses as predictors of con-version from mild cognitive impairment to Alzheimer’s disease. Neurobiol. Aging31, 1375–1385. doi: 10.1016/j.neurobiolaging.2010.01.022
Magnin, B., Mesrob, L., Kinkingnéhun, S., Pélégrini-Issac, M., Colliot, O., Sarazin,M., et al. (2009). Support vector machine-based classification of Alzheimer’sdisease from whole-brain anatomical MRI. Neuroradiology 51, 73–83. doi:10.1007/s00234-008-0463-x
Mazziotta, J. C., Toga, A. W., Evans, A., Fox, P., and Lancaster, J. (1995). A prob-abilistic atlas of the human brain: theory and rationale for its development theinternational consortium for brain mapping (ICBM). Neuroimage 2, 89–101. doi:10.1006/nimg.1995.1012
McKhann, G. M., Knopman, D. S., Chertkow, H., Hyman, B. T., Jack, C. R. Jr.,Kawas, C. H., et al. (2011). The diagnosis of dementia due to Alzheimer’s disease:recommendations from the National Institute on Aging-Alzheimer’s Associationworkgroups on diagnostic guidelines for Alzheimer’s disease. Alzheimer’s Demen.7, 263–269. doi: 10.1016/j.jalz.2011.03.005
Morris, J. C. (1993). The clinical dementia rating (CDR): current version and scoringrules. Neurology 43, 2412–2414. doi: 10.1212/WNL.43.11.2412-a
Mundra, P. A., and Rajapakse, J. C. (2010). SVM-RFE with MRMR filter for geneselection. IEEE Nanobiosci. 9, 31–37. doi: 10.1109/TNB.2009.2035284
Ortiz, A., Górriz, J. M., Ramírez, J., and Martínez-Murcia, F. J. (2013a). LVQ-SVMBased CAD tool applied to structural MRI for the diagnosis of the Alzheimer’sdisease. Pattern Recogn. Lett. 34, 1725–1733. doi: 10.1016/j.patrec.2013.04.014
Ortiz, A., Palacio, A. A., Górriz, J. M., Ramírez, J., and Salas-González, D.(2013b). Segmentation of brain MRI using SOM-FCM-based method and3D statistical descriptors. Comput. Math. Methods Med. 2013,638563. doi:10.1155/2013/638563
Perneger, T. V. (1998). What’s wrong with Bonferroni adjustments. Brit. Med. J. 316,1236–1238. doi: 10.1136/bmj.316.7139.1236
Quiroz, Y. T., Stern, C. E., Reiman, E. M., Brickhouse, M., Ruiz, A., Sperling, R. A.,et al. (2013). Cortical atrophy in presymptomatic Alzheimer’s disease presenilin 1mutation carriers. J. Neurol. Neurosur. Psychiatry 84, 556–561. doi: 10.1136/jnnp-2012-303299
Rosenberg, P. B., and Hillis, A. E. (2009). Biomarkers for Alzheimer’s disease: readyfor the next step. Brain 132, 2002–2004. doi: 10.1093/brain/awp184
Salas-Gonzalez, D., Górriz, J. M., Ramírez, J., Schloegl, M., Lang, E. W., andOrtiz, A. (2013). Parameterization of the distribution of white and grey mat-ter in MRI using the α-stable distribution. Comput. Biol. Med. 43, 559–567. doi:10.1016/j.compbiomed.2013.01.003
Salas-Gonzalez, D., Schlögl, M., Górriz, J. M., Ramírez, J., and Lang, E. (2011).“Bayesian segmentation of magnetic resonance images using the α-stable dis-tribution,” in Hybrid Artificial Intelligent Systems. (Springer Berlin Heidelberg),99–106.
Shattuck, D. W., Mirza, M., Adisetiyo, V., Hojatkashani, C., Salamon, G., Narr,K. L., et al. (2008). Construction of a 3D probabilistic atlas of human corticalstructures. Neuroimage 39, 1064–1080. doi: 10.1016/j.neuroimage.2007.09.031
Shen, Q., Loewenstein, D. A., Potter, E., Zhao, W., Appel, J., Greig, M. T., et al.(2011). Volumetric and visual rating of magnetic resonance imaging scans inthe diagnosis of amnestic mild cognitive impairment and Alzheimer’s disease.Alzheimer’s Demen. 7, e101–e108. doi: 10.1016/j.jalz.2010.07.002
Shen, Q., Zhao, W., Loewenstein, D. A., Potter, E., Greig, M. T., Raj, A., et al.(2012). Comparing new templates and atlas-based segmentations in the volu-metric analysis of brain magnetic resonance images for diagnosing Alzheimer’sdisease. Alzheimer’s Demen. 8, 399–406. doi: 10.1016/j.jalz.2011.07.002
Shieh, M. D., and Yang, C. C. (2008). Multiclass SVM-RFE for product form featureselection. Expert Syst. Appl. 35, 531–541. doi: 10.1016/j.eswa.2007.07.043
Squire, L. R. (1992). Memory and the hippocampus: a synthesis from findingswith rats, monkeys, and humans. Psychol. Rev. 99, 195–231. doi: 10.1037/0033-295X.99.2.195
Stuss, D. T., and Knight, R. T. (2013). Principles of Frontal Lobe Function. OxfordUniversity Press.
Suetens, P., Bellon, E., Vandermeulen, D., Smet, M., Marchal, G., Nuyts, J.,et al. (1993). Image segmentation: methods and applications in diagnosticradiology and nuclear medicine. Eur. J. Radiol. 17, 14–21. doi: 10.1016/0720-048X(93)90023-G
Tang, Y., Zhang, Y. Q., and Huang, Z. (2007). Development of two-stageSVM-RFE gene selection strategy for microarray expression data analysis.
Frontiers in Aging Neuroscience www.frontiersin.org February 2014 | Volume 6 | Article 20 | 9
Hidalgo-Muñoz et al. MRI regions in Alzheimer’s disease
IEEE/ACM Trans. Comput. Biol. Bioinform. 4, 365–381. doi: 10.1109/TCBB.2007.70224
Thompson, P. M., Hayashi, K. M., de Zubicaray, G., Janke, A. L., Rose, S. E., Semple,J., et al. (2003). Dynamics of gray matter loss in Alzheimer’s disease. J. Neurosci.23, 994–1005.
Tomé, A. M., Hidalgo-Muñoz, A. R., López, M. M., Teixeira, A. R., Santos, I. M.,Pereira A. T., et al. (2013). “Feature extraction and classification of biosignals.Emotion valence detection from EEG signals,” in Proceedings of BIOSIGNALS2013-International Conference on Bio-inspired Systems and Signal Processing,Barcelona. 54–60.
Tsien, J. Z., Huerta, P. T., and Tonegawa, S. (1996). The essential role of hippocampalCA1 NMDA receptor–dependent synaptic plasticity in spatial memory. Cell 87,1327–1338. doi: 10.1016/S0092-8674(00)81827-9
Tzourio-Mazoyer, N., Landeau, B., Papathanassiou, D., Crivello, F., Etard,O., Delcroix, N., et al. (2002). Automated anatomical labeling of acti-vations in SPM using a macroscopic anatomical parcellation of the MNIMRI single-subject brain. Neuroimage 15, 273–289. doi: 10.1006/nimg.2001.0978
Varma, S., and Simon, R. (2006). Bias in error estimation when using cross-validation for model selection. BMC Bioinformatics 7:91. doi: 10.1186/1471-2105-7-91
Velayudhan, L., Proitsi, P., Westman, E., Muehlboeck, J. S., Mecocci, P., Vel-las, B., et al. (2013). Entorhinal cortex thickness predicts cognitive decline inAlzheimer’s disease. J. Alzheimer’s Dis. 33, 755–766. doi: 10.3233/JAD-2012-121408
Weiner, M. W., Aisen, P. S., Jack, Jr. C. R., Jagust, W. J., Trojanowski, J. Q.,Shaw, L., et al. (2010). The Alzheimer’s disease neuroimaging initiative: progress
report and future plans. Alzheimer’s Demen. 6, 202–211. doi: 10.1016/j.jalz.2010.03.007
Xie, C., Bai, F., Yu, H., Shi, Y., Yuan, Y., Chen, G., et al. (2012). Abnor-mal insula functional network is associated with episodic memory declinein amnestic mild cognitive impairment. Neuroimage 63, 320–327. doi:10.1016/j.neuroimage.2012.06.062
Zhang, Y., Schuff, N., Camacho, M., Chao, L. L., Fletcher, T. P., Yaffe, K., et al. (2013).MRI markers for mild c0ognitive impairment: comparisons between white mat-ter integrity and gray matter volume measurements. PLoS ONE 8:e66367.doi:10.1371/journal.pone.0066367
Conflict of Interest Statement: The authors declare that the research was conductedin the absence of any commercial or financial relationships that could be construedas a potential conflict of interest.
Received: 08 October 2013; paper pending published: 06 January 2014; accepted: 02February 2014; published online: 20 February 2014.Citation: Hidalgo-Muñoz AR, Ramírez J, Górriz JM and Padilla P (2014) Regions ofinterest computed by SVM wrapped method for Alzheimer’s disease examination fromsegmented MRI. Front. Aging Neurosci. 6:20. doi: 10.3389/fnagi.2014.00020This article was submitted to the journal Frontiers in Aging Neuroscience.Copyright © 2014 Hidalgo-Muñoz, Ramírez, Górriz and Padilla. This is an open-access article distributed under the terms of the Creative Commons Attribution License(CC BY). The use, distribution or reproduction in other forums is permitted, providedthe original author(s) or licensor are credited and that the original publication in thisjournal is cited, in accordance with accepted academic practice. No use, distribution orreproduction is permitted which does not comply with these terms.
Frontiers in Aging Neuroscience www.frontiersin.org February 2014 | Volume 6 | Article 20 | 10