MIddle Pleistocene hominid variability and the origin of Late Pleistocene humans
Quaternary Research 79 (2013) 175–188
Contents lists available at SciVerse ScienceDirect
Quaternary Research
j ourna l homepage: www.e lsev ie r .com/ locate /yqres
Regional variation in the terminal Pleistocene and early Holocene radiocarbon recordof eastern North America
D. Shane Miller a,⁎, Joseph A.M. Gingerich b
a School of Anthropology, University of Arizona, 1009 East South Campus Drive, P.O. Box 210030, Tucson, AZ 85721, USAb Department of Anthropology (MRC-112), Paleoindian Program, NMNH Smithsonian Institution, Washington, DC 20560, USA
⁎ Corresponding author.E-mail addresses: [email protected] (D.S. M
(J.A.M. Gingerich).
0033-5894/$ – see front matter © 2013 University of Whttp://dx.doi.org/10.1016/j.yqres.2012.12.003
a b s t r a c t
a r t i c l e i n f oArticle history:Received 17 September 2012Available online 26 January 2013
Keywords:Younger DryasEastern North AmericaPaleoindiansRadiocarbon dating
In this paper we use radiocarbon dates to evaluate the signature of the Younger Dryas Chronozone (YDC) ineastern North America. Using an approach that examines radiocarbon dates by region, we argue that thenortheastern United States shows a better overall representation of radiocarbon dates when compared tothe Mid-Atlantic and Southeast. These data result in a peak in summed probability distributions during theYDC, which is often interpreted as evidence of population growth. Further examination of these distributions,however, illustrates that differential standard deviations, varying sample size, and the effect of taphonomicand research biases likely overwhelm any demographic signatures in our study sample. Consequently, thefrequency of radiocarbon dates by itself is insufficient for understanding the relationship between climate,culture and demography in eastern North America.
© 2013 University of Washington. Published by Elsevier Inc. All rights reserved.
Introduction
Archeologists have become increasingly interested in the time periodcoinciding with the Younger Dryas chronozone (~12,900–11,600 cal yrBP) and the role of climate change in shaping the prehistory of NorthAmerica. Specifically, some cite the onset of the Younger Dryas as a factorin the demise of megafauna populations and a possible cause of a demo-graphic collapse or reorganization of human populations (Fiedel, 1999;Anderson and Faught, 2000; Anderson, 2001; Lovvorn et al., 2001;Anderson et al., 2004; Hall et al., 2004; Dansie and Jerrems, 2005;Haynes, 2005, 2008; Newby et al., 2005; Dunbar and Vojnovski, 2007;Faught, 2008; Thulman, 2009). An extra-terrestrial impact event hasalso been offered as one explanation for the downfall of these pop-ulations (e.g., Firestone et al., 2007). Despite these many claims, somecontend thatmorework needs to be done to demonstrate that the Youn-ger Dryas or other “events” had an appreciable impact on the early in-habitants of North America (e.g., Holliday and Meltzer, 2010; Meltzerand Holliday, 2010). In other words, the correlation of culture changewith climate change does not, and probably should not, automaticallyequate to causation.
Radiocarbon dates from eastern North America have previouslybeen used to support both population decline and a continuation ofdemographic growth in the region at the onset of the YoungerDryas. Using a database of radiocarbon dates from archeologicalsites, we demonstrate how regional variation in the radiocarbon re-cord may be the cause for conflicting interpretations of the Younger
iller), [email protected]
ashington. Published by Elsevier In
Dryas and its impact on prehistoric populations. Finally, we concludewith our rationale for why the radiocarbon record of eastern NorthAmerica, in and of itself, is insufficient for determining the true im-pact of climate on culture change.
The Younger Dryas debate in North America
While the Younger Dryas was first discovered in the macrofossiland pollen record of Northern Europe, in the past 20 years there hasbeen much research attempting to document its presence in NorthAmerica (Meltzer and Holliday, 2010:2). Based upon the initial pollenrecords and subsequent evidence from ice cores in Greenland, theYounger Dryas chronozone is often cited as return to near glacial con-ditions that lasted over a millennium (Alley, 2007). However, it is be-coming increasingly clear that the regional expression of the YoungerDryas was quite variable across most of North America. Some areasbecame cooler, such as the North Atlantic region, while in the south-eastern United States there is evidence for warmer, wetter conditions(Meltzer and Holliday, 2010:9–13; Strauss and Goebel, 2011 and pa-pers therein).
In eastern North America, Anderson (2001:154–158) was perhapsthe first to draw a link between the Younger Dryas and archeologicalrecord by noting that it coincided with appearance of more regional-ized projectile point styles after Clovis. A similar argument has beenmade in the Northeast, where researchers have argued that not onlydo a number of regional styles appear (e.g., Bradley et al., 2008) butthe abandonment of the fluted point tradition corresponds with theend of the Younger Dryas (Newby et al., 2005). This research also sug-gests a drop in the number of sites with early projectile point formsafter Clovis (or the hypothesized regional equivalents) (Newby et
c. All rights reserved.

176 D.S. Miller, J.A.M. Gingerich / Quaternary Research 79 (2013) 175–188
al., 2005: Fig. 4). In the southeast Goodyear (2006) and Daniel andGoodyear (2006) suggest that a drop in the frequency of presumedpost-Clovis point types, such as Redstone and Cumberland, is evi-dence of a post-Clovis demographic collapse. This argument hasbeen subsequently appropriated by those arguing for an extra-terrestrial impact as supporting evidence (Firestone et al., 2007). Itshould be noted, however, that there are many researchers in theeastern United States who argue for some Younger Dryas effect, yetdo not invoke a cosmic catastrophe (Anderson and Faught, 2000;Anderson, 2001; Anderson et al., 2004; Dunbar and Vojnovski,2007; Faught, 2008; Thulman, 2009; Ellis et al., 2011).
Holliday and Meltzer (2010) have also questioned whether thereis enough evidence available to suggest that climate change duringthe Younger Dryas chronozone happened on a scale perceptible tohumans. Drawing mostly on evidence from the Northern and South-ern Plains, Holliday and Meltzer argue that based on the frequencyof Clovis and Folsom sites there is no clear evidence of a decrease insites during the Younger Dryas. They also compiled a sample of radio-carbon dates from across North America to show that there does notappear to be a gap in the chronology at the onset of the YoungerDryas. In a more comprehensive survey of the radiocarbon dates,Buchanan et al. (2008) used the Canadian Archaeological Radiocar-bon Database (CARD) to also argue that there was no evidence foran immediate post-Clovis gap in the radiocarbon chronology. More-over, they found that, contrary to the expectations of the extra-terrestrial impact hypothesis, there are more post-Clovis dates nearthe proposed area impact than from areas farther away. This is alsoechoed by Eren (2009) who has argued for continuity in the flutedpoint occupations of the Great Lakes region, further buffering the ar-gument for a minimal, if any, effect of the onset of the Younger Dryas.
However, other researchers have analyzed the radiocarbon recordof eastern North America and have come to very different conclu-sions. For example, Anderson et al. (2008) have argued that the pat-terns described by Buchanan et al. (2008) were not representativeof the southeastern United States and, in a separate analysis, arguefor a significant decline in the frequency of radiocarbon dates afterClovis (Anderson et al., 2009; West et al., 2010; Anderson et al.,2011; Meeks and Anderson, 2012). Culleton (2008) and Steele(2010) have also questioned Buchanan et al.'s (2008) methodologyfor averaging dates and producing summed probability distributions,resulting in subsequent counter-responses (Collard et al., 2008;Buchanan et al., 2011).
What we find intriguing about these studies is that it appears thatboth proponents and detractors of a Younger Dryas effect on earlyhuman populations are appropriating the radiocarbon record as partof their arguments. Moreover, most of the “back and forth” to date be-tween the two camps concerns the sampling and statistical method-ologies employed by the other side. Instead of wading into thisaspect of the debate, we ask an alternative question: Given the re-gional variation observed in the paleoenvironmental records duringthe time period encompassing the Younger Dryas (e.g. Meltzer andHolliday, 2010:9–13), could there also be systematic geographicalvariation in the representation of radiocarbon dates, particularly ineastern North America where both sides used many of the samedates but have come to drastically different conclusions?
The Paleoindian and Early Archaic Periods in eastern North America
The study of the Paleoindian and Early Archaic periods in the east-ern United States is an exercise in contrasts. On the one hand, this re-gion has some of the highest densities of artifacts in North America(Mason, 1962; Brennan, 1982; Anderson, 1990; Buchanan, 2003;Anderson et al., 2010; Prasciunas, 2011). Despite the abundance andvariety of artifacts, there is one glaring obstacle that hampers thestudy of the terminal Pleistocene and early Holocene record of theeastern United States – the rarity of stratified sites with datable
material (Steponaitis, 1986; Dunnell, 1990; Levine, 1990; Curran,1996; Goodyear, 1999; Anderson, 2005). Most artifacts come fromshallow sites, usually from plowed contexts. Furthermore, most arti-facts are not recovered by professional archeologists, but instead re-side in private collections (Goodyear, 1999). For the Paleoindianperiod in particular, Meltzer (1988) interpreted this pattern as evi-dence of extreme mobility, whereby small groups moved rapidlyacross the landscape leaving little aside from small sites andscattered, isolated bifaces.
Dunnell (1990) argued that this pattern of shallowly buried sitesand isolates may also be due to a broad-scale geomorphologicalbias. He observed that compared to other areas in North America,the southeastern United States is situated on a much older landscapewith many upland areas receiving little to no sedimentation since theTertiary period. Additionally, the warm, mesic climate of this regionpromotes the decay of materials that can be radiocarbon dated. Thispattern is reflected in recent continental-scale databases of radiocar-bon dates which showed this region to have relatively fewer numbersof reported radiocarbon dates (Waters and Stafford, 2007; Buchananet al., 2008). Haynes (1983) and Goodyear (1999) relate the lack ofstratified sites to late Pleistocene erosive conditions that wouldhave either destroyed sites or caused them to be deeply buried.These conclusions have been supported by recent research by Leigh(2004, 2006) who has shown that the major rivers of the South Atlan-tic Coastal Plain transitioned from braided rivers during the last gla-cial maximum to large meandering rivers during the terminalPleistocene. As a result, many of the terraces that could havecontained archeological material may have been completely eroded.
Likewise, landscapes in the Northeast and Mid-Atlantic have beensubject to similar geologic processes that limit the number of stratifiedsites and datable material. For example Curran (1996:4) suggests thatmany northeastern Paleoindian sites are located on sandy landformsthat have been subject to limited deposition since the Pleistoceneepoch, resulting in shallow artifact burial through pedoturbation. This,alongwith the reworking of alluvial terraces during the late Pleistoceneand early Holocene (Haynes, 1983; Stewart et al., 1991;Wagner, 1994;Gingerich, 2007), are themain reasonswhy intact stratified deposits arerare in the region. In addition, themixing of shallowdeposits and the in-corporation of non-cultural or recent materials have produced errone-ous dates for many sites in the Northeast (e.g., Byers, 1959; Curran,1984, 1999; Bonnichsen and Will, 1999).
Consequently, eastern North America has perhaps the richest ma-terial record for the Paleoindian and Early Archaic periods, but is thepoorest in terms of context and preservation. In the western UnitedSates, stratified sites such as Blackwater Draw (Boldurian andCotter, 1999), Jake Bluff (Bement and Carter, 2010), Wilson-Leonard(Collins, 1998), Jimmy Pitts (Sellet et al., 2009), Carter/Kerr McGee(Frison, 1984), Hell Gap (Larson et al., 2009), and Lubbock Lake(Johnson and Holliday, 2004) have helped to clarify the stratigraphicrelationship between the Clovis, Folsom, and other point types(Meltzer, 2009). In the eastern United States, no such site existsthat incorporates the entire Early and Middle Paleoindian recordsand examples for the Late Paleoindian and Early Archaic time periodsare few and far between (Goodyear, 1999; Anderson, 2005; Bradley etal., 2008).
Methods
For our analysis, we selected a contiguous sample of states fromacross eastern North America and divided them into three regions:Southeast, Midwest/Mid-Atlantic, and Northeast (Fig. 1). We thenconducted a literature review to locate published radiocarbon datesolder than 8000 14C yr BP (~8900 cal yr BP), the standard terminaldate for the Early Archaic period in Eastern North America (e.g.,Steponaitis, 1986; Anderson, 2001). We started our literature reviewby first incorporating the entries listed in the “Canadian Archaeological
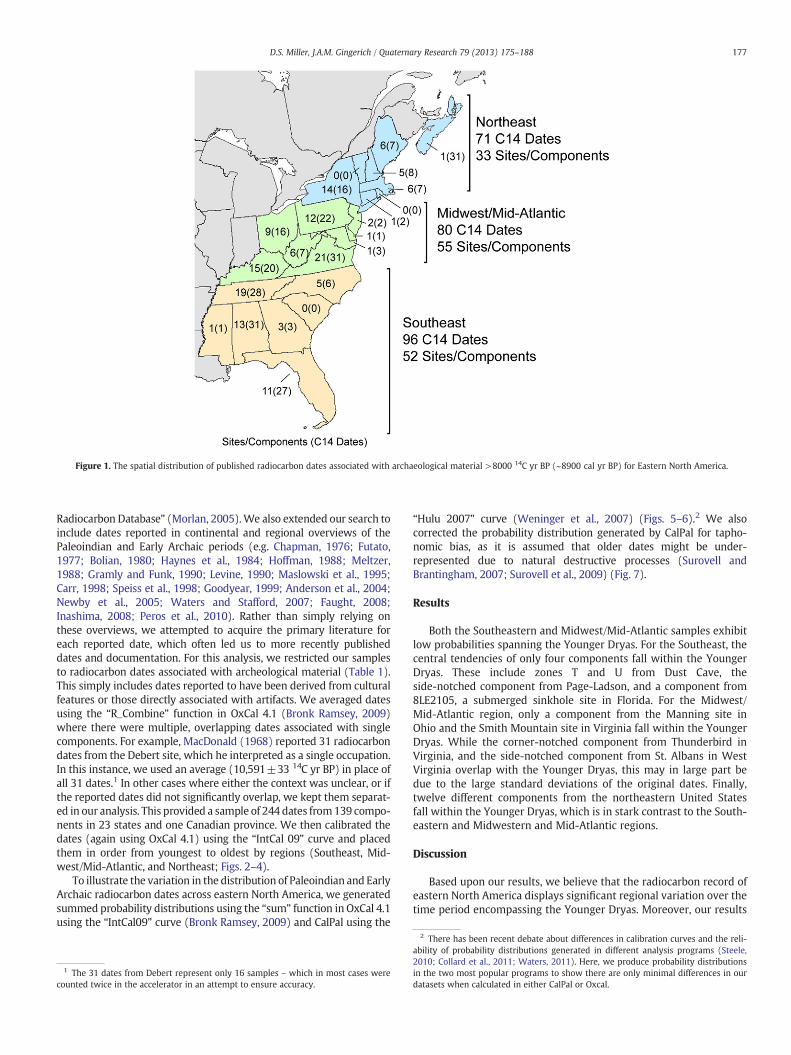
Figure 1. The spatial distribution of published radiocarbon dates associated with archaeological material >8000 14C yr BP (~8900 cal yr BP) for Eastern North America.
177D.S. Miller, J.A.M. Gingerich / Quaternary Research 79 (2013) 175–188
Radiocarbon Database” (Morlan, 2005).We also extended our search toinclude dates reported in continental and regional overviews of thePaleoindian and Early Archaic periods (e.g. Chapman, 1976; Futato,1977; Bolian, 1980; Haynes et al., 1984; Hoffman, 1988; Meltzer,1988; Gramly and Funk, 1990; Levine, 1990; Maslowski et al., 1995;Carr, 1998; Speiss et al., 1998; Goodyear, 1999; Anderson et al., 2004;Newby et al., 2005; Waters and Stafford, 2007; Faught, 2008;Inashima, 2008; Peros et al., 2010). Rather than simply relying onthese overviews, we attempted to acquire the primary literature foreach reported date, which often led us to more recently publisheddates and documentation. For this analysis, we restricted our samplesto radiocarbon dates associated with archeological material (Table 1).This simply includes dates reported to have been derived from culturalfeatures or those directly associated with artifacts. We averaged datesusing the “R_Combine” function in OxCal 4.1 (Bronk Ramsey, 2009)where there were multiple, overlapping dates associated with singlecomponents. For example, MacDonald (1968) reported 31 radiocarbondates from the Debert site, which he interpreted as a single occupation.In this instance, we used an average (10,591±33 14C yr BP) in place ofall 31 dates.1 In other cases where either the context was unclear, or ifthe reported dates did not significantly overlap, we kept them separat-ed in our analysis. This provided a sample of 244 dates from139 compo-nents in 23 states and one Canadian province. We then calibrated thedates (again using OxCal 4.1) using the “IntCal 09” curve and placedthem in order from youngest to oldest by regions (Southeast, Mid-west/Mid-Atlantic, and Northeast; Figs. 2–4).
To illustrate the variation in the distribution of Paleoindian and EarlyArchaic radiocarbon dates across eastern North America, we generatedsummed probability distributions using the “sum” function in OxCal 4.1using the “IntCal09” curve (Bronk Ramsey, 2009) and CalPal using the
1 The 31 dates from Debert represent only 16 samples – which in most cases werecounted twice in the accelerator in an attempt to ensure accuracy.
“Hulu 2007” curve (Weninger et al., 2007) (Figs. 5–6).2 We alsocorrected the probability distribution generated by CalPal for tapho-nomic bias, as it is assumed that older dates might be under-represented due to natural destructive processes (Surovell andBrantingham, 2007; Surovell et al., 2009) (Fig. 7).
Results
Both the Southeastern and Midwest/Mid-Atlantic samples exhibitlow probabilities spanning the Younger Dryas. For the Southeast, thecentral tendencies of only four components fall within the YoungerDryas. These include zones T and U from Dust Cave, theside-notched component from Page-Ladson, and a component from8LE2105, a submerged sinkhole site in Florida. For the Midwest/Mid-Atlantic region, only a component from the Manning site inOhio and the Smith Mountain site in Virginia fall within the YoungerDryas. While the corner-notched component from Thunderbird inVirginia, and the side-notched component from St. Albans in WestVirginia overlap with the Younger Dryas, this may in large part bedue to the large standard deviations of the original dates. Finally,twelve different components from the northeastern United Statesfall within the Younger Dryas, which is in stark contrast to the South-eastern and Midwestern and Mid-Atlantic regions.
Discussion
Based upon our results, we believe that the radiocarbon record ofeastern North America displays significant regional variation over thetime period encompassing the Younger Dryas. Moreover, our results
2 There has been recent debate about differences in calibration curves and the reli-ability of probability distributions generated in different analysis programs (Steele,2010; Collard et al., 2011; Waters, 2011). Here, we produce probability distributionsin the two most popular programs to show there are only minimal differences in ourdatasets when calculated in either CalPal or Oxcal.
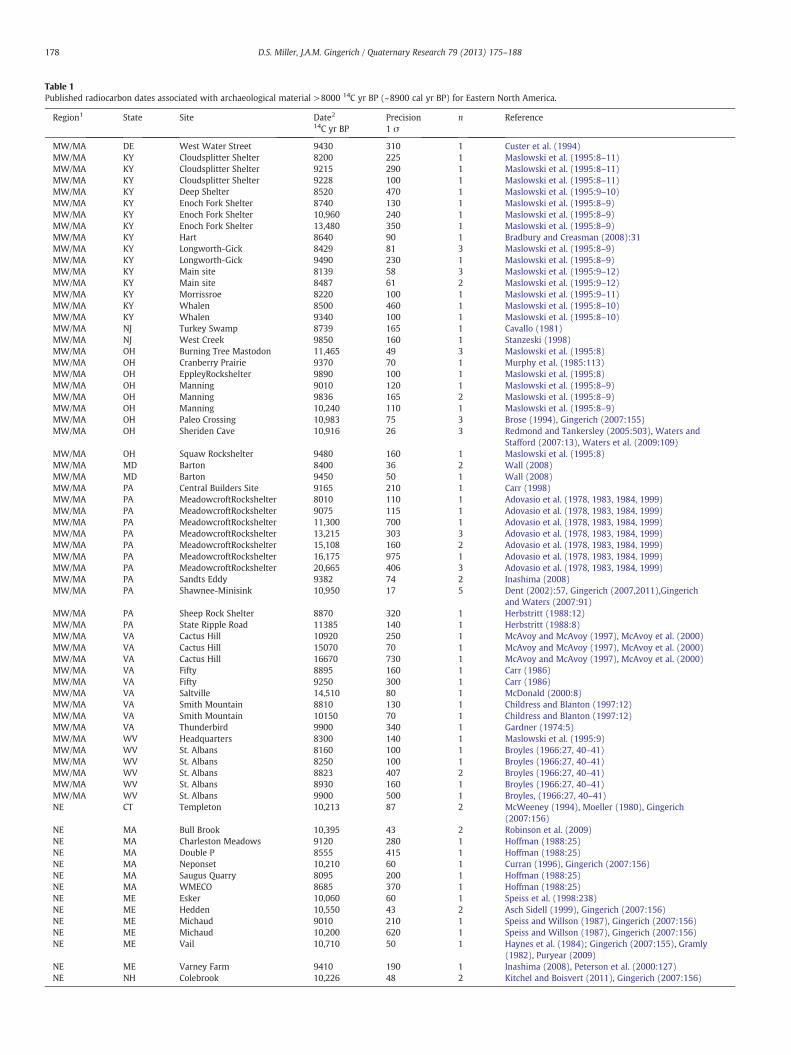
Table 1Published radiocarbon dates associated with archaeological material >8000 14C yr BP (~8900 cal yr BP) for Eastern North America.
Region1 State Site Date214C yr BP
Precision1 σ
n Reference
MW/MA DE West Water Street 9430 310 1 Custer et al. (1994)MW/MA KY Cloudsplitter Shelter 8200 225 1 Maslowski et al. (1995:8–11)MW/MA KY Cloudsplitter Shelter 9215 290 1 Maslowski et al. (1995:8–11)MW/MA KY Cloudsplitter Shelter 9228 100 1 Maslowski et al. (1995:8–11)MW/MA KY Deep Shelter 8520 470 1 Maslowski et al. (1995:9–10)MW/MA KY Enoch Fork Shelter 8740 130 1 Maslowski et al. (1995:8–9)MW/MA KY Enoch Fork Shelter 10,960 240 1 Maslowski et al. (1995:8–9)MW/MA KY Enoch Fork Shelter 13,480 350 1 Maslowski et al. (1995:8–9)MW/MA KY Hart 8640 90 1 Bradbury and Creasman (2008):31MW/MA KY Longworth-Gick 8429 81 3 Maslowski et al. (1995:8–9)MW/MA KY Longworth-Gick 9490 230 1 Maslowski et al. (1995:8–9)MW/MA KY Main site 8139 58 3 Maslowski et al. (1995:9–12)MW/MA KY Main site 8487 61 2 Maslowski et al. (1995:9–12)MW/MA KY Morrissroe 8220 100 1 Maslowski et al. (1995:9–11)MW/MA KY Whalen 8500 460 1 Maslowski et al. (1995:8–10)MW/MA KY Whalen 9340 100 1 Maslowski et al. (1995:8–10)MW/MA NJ Turkey Swamp 8739 165 1 Cavallo (1981)MW/MA NJ West Creek 9850 160 1 Stanzeski (1998)MW/MA OH Burning Tree Mastodon 11,465 49 3 Maslowski et al. (1995:8)MW/MA OH Cranberry Prairie 9370 70 1 Murphy et al. (1985:113)MW/MA OH EppleyRockshelter 9890 100 1 Maslowski et al. (1995:8)MW/MA OH Manning 9010 120 1 Maslowski et al. (1995:8–9)MW/MA OH Manning 9836 165 2 Maslowski et al. (1995:8–9)MW/MA OH Manning 10,240 110 1 Maslowski et al. (1995:8–9)MW/MA OH Paleo Crossing 10,983 75 3 Brose (1994), Gingerich (2007:155)MW/MA OH Sheriden Cave 10,916 26 3 Redmond and Tankersley (2005:503), Waters and
Stafford (2007:13), Waters et al. (2009:109)MW/MA OH Squaw Rockshelter 9480 160 1 Maslowski et al. (1995:8)MW/MA MD Barton 8400 36 2 Wall (2008)MW/MA MD Barton 9450 50 1 Wall (2008)MW/MA PA Central Builders Site 9165 210 1 Carr (1998)MW/MA PA MeadowcroftRockshelter 8010 110 1 Adovasio et al. (1978, 1983, 1984, 1999)MW/MA PA MeadowcroftRockshelter 9075 115 1 Adovasio et al. (1978, 1983, 1984, 1999)MW/MA PA MeadowcroftRockshelter 11,300 700 1 Adovasio et al. (1978, 1983, 1984, 1999)MW/MA PA MeadowcroftRockshelter 13,215 303 3 Adovasio et al. (1978, 1983, 1984, 1999)MW/MA PA MeadowcroftRockshelter 15,108 160 2 Adovasio et al. (1978, 1983, 1984, 1999)MW/MA PA MeadowcroftRockshelter 16,175 975 1 Adovasio et al. (1978, 1983, 1984, 1999)MW/MA PA MeadowcroftRockshelter 20,665 406 3 Adovasio et al. (1978, 1983, 1984, 1999)MW/MA PA Sandts Eddy 9382 74 2 Inashima (2008)MW/MA PA Shawnee-Minisink 10,950 17 5 Dent (2002):57, Gingerich (2007,2011),Gingerich
and Waters (2007:91)MW/MA PA Sheep Rock Shelter 8870 320 1 Herbstritt (1988:12)MW/MA PA State Ripple Road 11385 140 1 Herbstritt (1988:8)MW/MA VA Cactus Hill 10920 250 1 McAvoy and McAvoy (1997), McAvoy et al. (2000)MW/MA VA Cactus Hill 15070 70 1 McAvoy and McAvoy (1997), McAvoy et al. (2000)MW/MA VA Cactus Hill 16670 730 1 McAvoy and McAvoy (1997), McAvoy et al. (2000)MW/MA VA Fifty 8895 160 1 Carr (1986)MW/MA VA Fifty 9250 300 1 Carr (1986)MW/MA VA Saltville 14,510 80 1 McDonald (2000:8)MW/MA VA Smith Mountain 8810 130 1 Childress and Blanton (1997:12)MW/MA VA Smith Mountain 10150 70 1 Childress and Blanton (1997:12)MW/MA VA Thunderbird 9900 340 1 Gardner (1974:5)MW/MA WV Headquarters 8300 140 1 Maslowski et al. (1995:9)MW/MA WV St. Albans 8160 100 1 Broyles (1966:27, 40–41)MW/MA WV St. Albans 8250 100 1 Broyles (1966:27, 40–41)MW/MA WV St. Albans 8823 407 2 Broyles (1966:27, 40–41)MW/MA WV St. Albans 8930 160 1 Broyles (1966:27, 40–41)MW/MA WV St. Albans 9900 500 1 Broyles, (1966:27, 40–41)NE CT Templeton 10,213 87 2 McWeeney (1994), Moeller (1980), Gingerich
(2007:156)NE MA Bull Brook 10,395 43 2 Robinson et al. (2009)NE MA Charleston Meadows 9120 280 1 Hoffman (1988:25)NE MA Double P 8555 415 1 Hoffman (1988:25)NE MA Neponset 10,210 60 1 Curran (1996), Gingerich (2007:156)NE MA Saugus Quarry 8095 200 1 Hoffman (1988:25)NE MA WMECO 8685 370 1 Hoffman (1988:25)NE ME Esker 10,060 60 1 Speiss et al. (1998:238)NE ME Hedden 10,550 43 2 Asch Sidell (1999), Gingerich (2007:156)NE ME Michaud 9010 210 1 Speiss and Willson (1987), Gingerich (2007:156)NE ME Michaud 10,200 620 1 Speiss and Willson (1987), Gingerich (2007:156)NE ME Vail 10,710 50 1 Haynes et al. (1984); Gingerich (2007:155), Gramly
(1982), Puryear (2009)NE ME Varney Farm 9410 190 1 Inashima (2008), Peterson et al. (2000:127)NE NH Colebrook 10,226 48 2 Kitchel and Boisvert (2011), Gingerich (2007:156)
178 D.S. Miller, J.A.M. Gingerich / Quaternary Research 79 (2013) 175–188
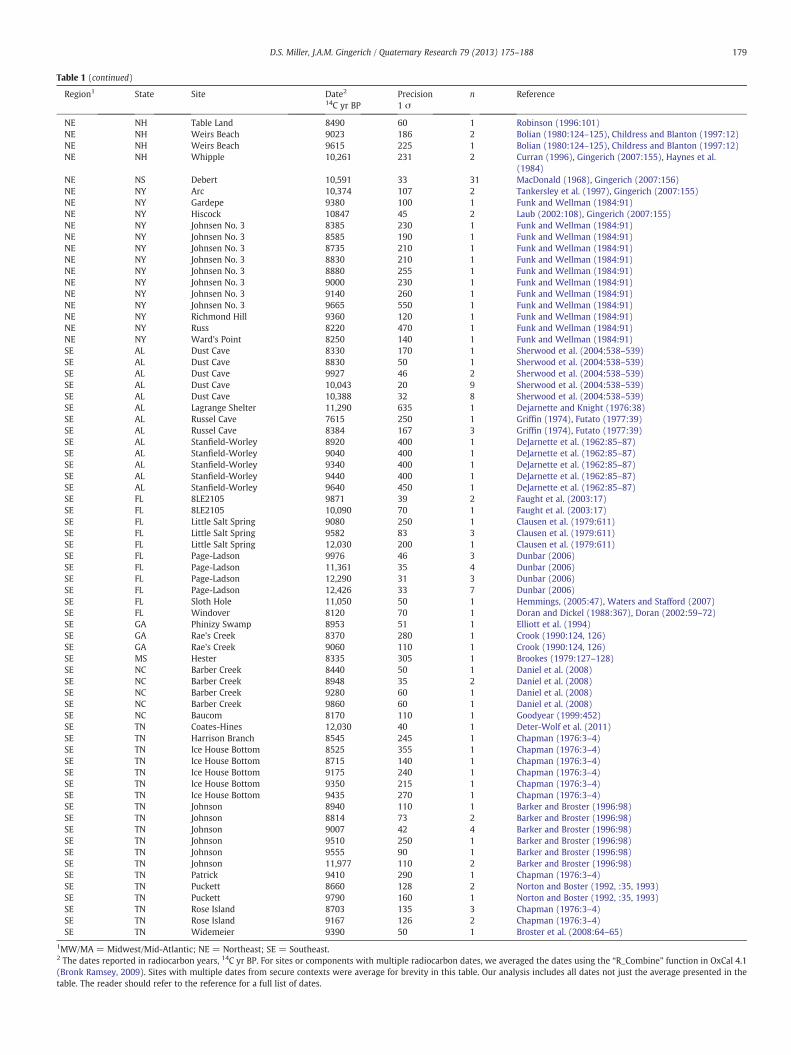
Table 1 (continued)
Region1 State Site Date214C yr BP
Precision1 σ
n Reference
NE NH Table Land 8490 60 1 Robinson (1996:101)NE NH Weirs Beach 9023 186 2 Bolian (1980:124–125), Childress and Blanton (1997:12)NE NH Weirs Beach 9615 225 1 Bolian (1980:124–125), Childress and Blanton (1997:12)NE NH Whipple 10,261 231 2 Curran (1996), Gingerich (2007:155), Haynes et al.
(1984)NE NS Debert 10,591 33 31 MacDonald (1968), Gingerich (2007:156)NE NY Arc 10,374 107 2 Tankersley et al. (1997), Gingerich (2007:155)NE NY Gardepe 9380 100 1 Funk and Wellman (1984:91)NE NY Hiscock 10847 45 2 Laub (2002:108), Gingerich (2007:155)NE NY Johnsen No. 3 8385 230 1 Funk and Wellman (1984:91)NE NY Johnsen No. 3 8585 190 1 Funk and Wellman (1984:91)NE NY Johnsen No. 3 8735 210 1 Funk and Wellman (1984:91)NE NY Johnsen No. 3 8830 210 1 Funk and Wellman (1984:91)NE NY Johnsen No. 3 8880 255 1 Funk and Wellman (1984:91)NE NY Johnsen No. 3 9000 230 1 Funk and Wellman (1984:91)NE NY Johnsen No. 3 9140 260 1 Funk and Wellman (1984:91)NE NY Johnsen No. 3 9665 550 1 Funk and Wellman (1984:91)NE NY Richmond Hill 9360 120 1 Funk and Wellman (1984:91)NE NY Russ 8220 470 1 Funk and Wellman (1984:91)NE NY Ward's Point 8250 140 1 Funk and Wellman (1984:91)SE AL Dust Cave 8330 170 1 Sherwood et al. (2004:538–539)SE AL Dust Cave 8830 50 1 Sherwood et al. (2004:538–539)SE AL Dust Cave 9927 46 2 Sherwood et al. (2004:538–539)SE AL Dust Cave 10,043 20 9 Sherwood et al. (2004:538–539)SE AL Dust Cave 10,388 32 8 Sherwood et al. (2004:538–539)SE AL Lagrange Shelter 11,290 635 1 Dejarnette and Knight (1976:38)SE AL Russel Cave 7615 250 1 Griffin (1974), Futato (1977:39)SE AL Russel Cave 8384 167 3 Griffin (1974), Futato (1977:39)SE AL Stanfield-Worley 8920 400 1 DeJarnette et al. (1962:85–87)SE AL Stanfield-Worley 9040 400 1 DeJarnette et al. (1962:85–87)SE AL Stanfield-Worley 9340 400 1 DeJarnette et al. (1962:85–87)SE AL Stanfield-Worley 9440 400 1 DeJarnette et al. (1962:85–87)SE AL Stanfield-Worley 9640 450 1 DeJarnette et al. (1962:85–87)SE FL 8LE2105 9871 39 2 Faught et al. (2003:17)SE FL 8LE2105 10,090 70 1 Faught et al. (2003:17)SE FL Little Salt Spring 9080 250 1 Clausen et al. (1979:611)SE FL Little Salt Spring 9582 83 3 Clausen et al. (1979:611)SE FL Little Salt Spring 12,030 200 1 Clausen et al. (1979:611)SE FL Page-Ladson 9976 46 3 Dunbar (2006)SE FL Page-Ladson 11,361 35 4 Dunbar (2006)SE FL Page-Ladson 12,290 31 3 Dunbar (2006)SE FL Page-Ladson 12,426 33 7 Dunbar (2006)SE FL Sloth Hole 11,050 50 1 Hemmings, (2005:47), Waters and Stafford (2007)SE FL Windover 8120 70 1 Doran and Dickel (1988:367), Doran (2002:59–72)SE GA Phinizy Swamp 8953 51 1 Elliott et al. (1994)SE GA Rae's Creek 8370 280 1 Crook (1990:124, 126)SE GA Rae's Creek 9060 110 1 Crook (1990:124, 126)SE MS Hester 8335 305 1 Brookes (1979:127–128)SE NC Barber Creek 8440 50 1 Daniel et al. (2008)SE NC Barber Creek 8948 35 2 Daniel et al. (2008)SE NC Barber Creek 9280 60 1 Daniel et al. (2008)SE NC Barber Creek 9860 60 1 Daniel et al. (2008)SE NC Baucom 8170 110 1 Goodyear (1999:452)SE TN Coates-Hines 12,030 40 1 Deter-Wolf et al. (2011)SE TN Harrison Branch 8545 245 1 Chapman (1976:3–4)SE TN Ice House Bottom 8525 355 1 Chapman (1976:3–4)SE TN Ice House Bottom 8715 140 1 Chapman (1976:3–4)SE TN Ice House Bottom 9175 240 1 Chapman (1976:3–4)SE TN Ice House Bottom 9350 215 1 Chapman (1976:3–4)SE TN Ice House Bottom 9435 270 1 Chapman (1976:3–4)SE TN Johnson 8940 110 1 Barker and Broster (1996:98)SE TN Johnson 8814 73 2 Barker and Broster (1996:98)SE TN Johnson 9007 42 4 Barker and Broster (1996:98)SE TN Johnson 9510 250 1 Barker and Broster (1996:98)SE TN Johnson 9555 90 1 Barker and Broster (1996:98)SE TN Johnson 11,977 110 2 Barker and Broster (1996:98)SE TN Patrick 9410 290 1 Chapman (1976:3–4)SE TN Puckett 8660 128 2 Norton and Boster (1992, :35, 1993)SE TN Puckett 9790 160 1 Norton and Boster (1992, :35, 1993)SE TN Rose Island 8703 135 3 Chapman (1976:3–4)SE TN Rose Island 9167 126 2 Chapman (1976:3–4)SE TN Widemeier 9390 50 1 Broster et al. (2008:64–65)
1MW/MA = Midwest/Mid-Atlantic; NE = Northeast; SE = Southeast.2 The dates reported in radiocarbon years, 14C yr BP. For sites or components with multiple radiocarbon dates, we averaged the dates using the “R_Combine” function in OxCal 4.1(Bronk Ramsey, 2009). Sites with multiple dates from secure contexts were average for brevity in this table. Our analysis includes all dates not just the average presented in thetable. The reader should refer to the reference for a full list of dates.
179D.S. Miller, J.A.M. Gingerich / Quaternary Research 79 (2013) 175–188
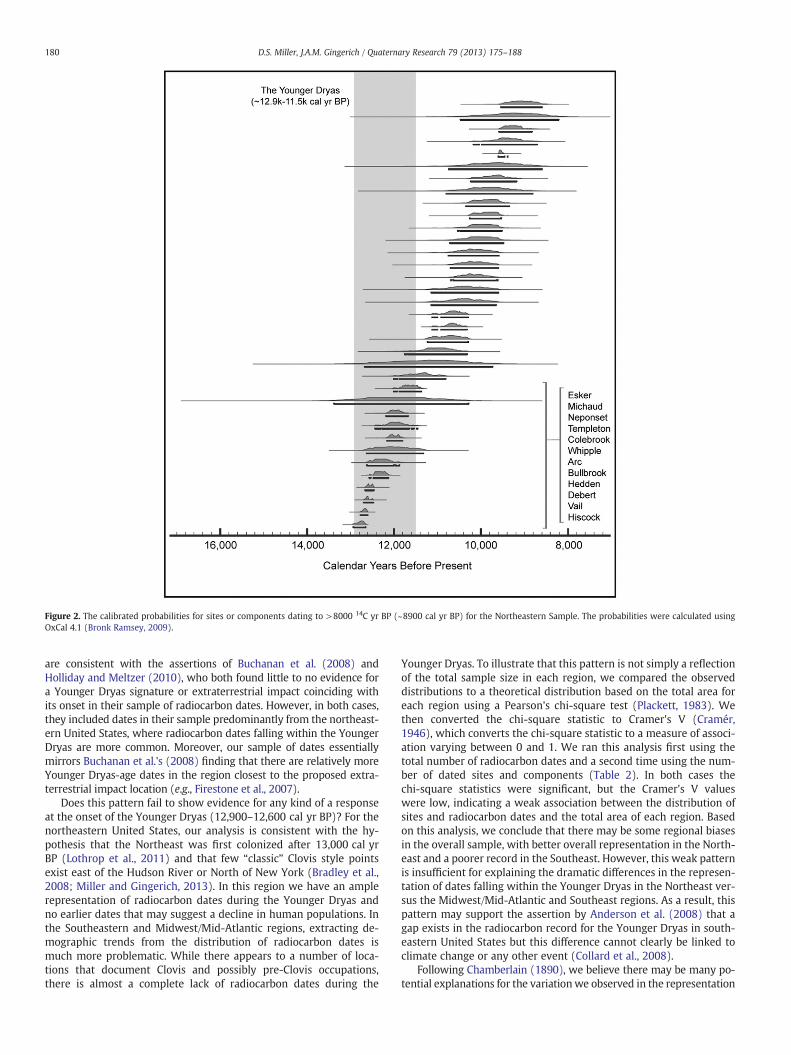
Figure 2. The calibrated probabilities for sites or components dating to >8000 14C yr BP (~8900 cal yr BP) for the Northeastern Sample. The probabilities were calculated usingOxCal 4.1 (Bronk Ramsey, 2009).
180 D.S. Miller, J.A.M. Gingerich / Quaternary Research 79 (2013) 175–188
are consistent with the assertions of Buchanan et al. (2008) andHolliday and Meltzer (2010), who both found little to no evidence fora Younger Dryas signature or extraterrestrial impact coinciding withits onset in their sample of radiocarbon dates. However, in both cases,they included dates in their sample predominantly from the northeast-ern United States, where radiocarbon dates falling within the YoungerDryas are more common. Moreover, our sample of dates essentiallymirrors Buchanan et al.'s (2008) finding that there are relatively moreYounger Dryas-age dates in the region closest to the proposed extra-terrestrial impact location (e.g., Firestone et al., 2007).
Does this pattern fail to show evidence for any kind of a responseat the onset of the Younger Dryas (12,900–12,600 cal yr BP)? For thenortheastern United States, our analysis is consistent with the hy-pothesis that the Northeast was first colonized after 13,000 cal yrBP (Lothrop et al., 2011) and that few “classic” Clovis style pointsexist east of the Hudson River or North of New York (Bradley et al.,2008; Miller and Gingerich, 2013). In this region we have an amplerepresentation of radiocarbon dates during the Younger Dryas andno earlier dates that may suggest a decline in human populations. Inthe Southeastern and Midwest/Mid-Atlantic regions, extracting de-mographic trends from the distribution of radiocarbon dates ismuch more problematic. While there appears to a number of loca-tions that document Clovis and possibly pre-Clovis occupations,there is almost a complete lack of radiocarbon dates during the
Younger Dryas. To illustrate that this pattern is not simply a reflectionof the total sample size in each region, we compared the observeddistributions to a theoretical distribution based on the total area foreach region using a Pearson's chi-square test (Plackett, 1983). Wethen converted the chi-square statistic to Cramer's V (Cramér,1946), which converts the chi-square statistic to a measure of associ-ation varying between 0 and 1. We ran this analysis first using thetotal number of radiocarbon dates and a second time using the num-ber of dated sites and components (Table 2). In both cases thechi-square statistics were significant, but the Cramer's V valueswere low, indicating a weak association between the distribution ofsites and radiocarbon dates and the total area of each region. Basedon this analysis, we conclude that there may be some regional biasesin the overall sample, with better overall representation in the North-east and a poorer record in the Southeast. However, this weak patternis insufficient for explaining the dramatic differences in the represen-tation of dates falling within the Younger Dryas in the Northeast ver-sus the Midwest/Mid-Atlantic and Southeast regions. As a result, thispattern may support the assertion by Anderson et al. (2008) that agap exists in the radiocarbon record for the Younger Dryas in south-eastern United States but this difference cannot clearly be linked toclimate change or any other event (Collard et al., 2008).
Following Chamberlain (1890), we believe there may be many po-tential explanations for the variationwe observed in the representation
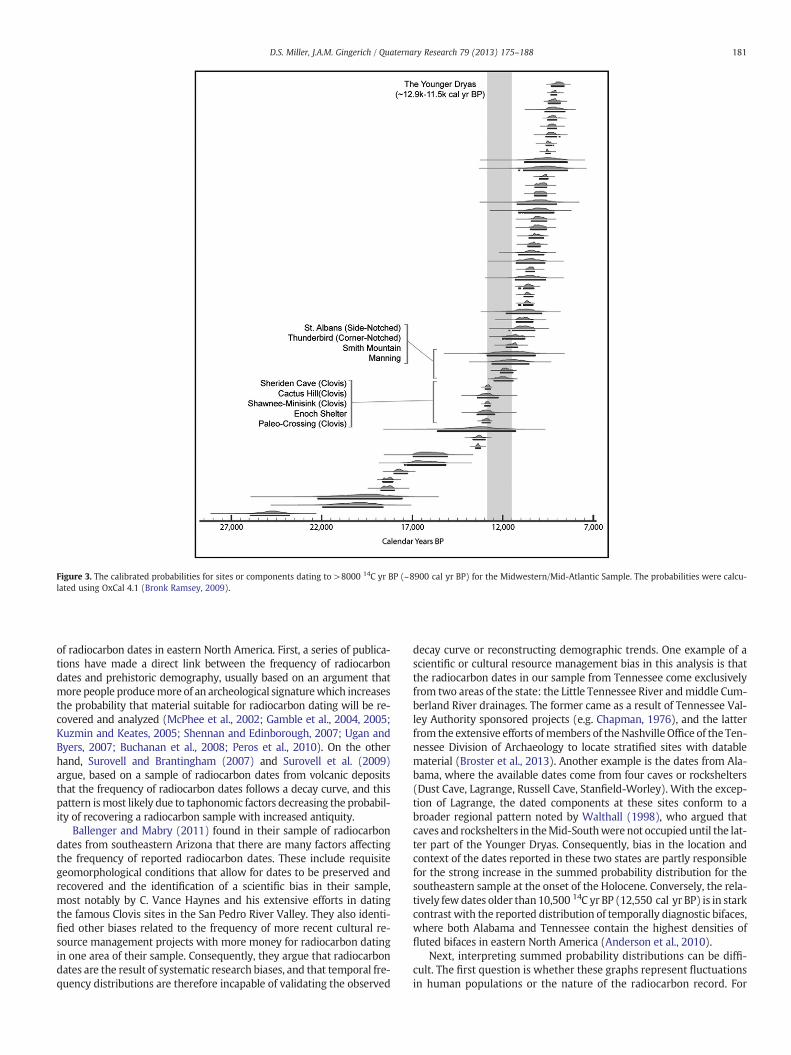
Figure 3. The calibrated probabilities for sites or components dating to >8000 14C yr BP (~8900 cal yr BP) for the Midwestern/Mid-Atlantic Sample. The probabilities were calcu-lated using OxCal 4.1 (Bronk Ramsey, 2009).
181D.S. Miller, J.A.M. Gingerich / Quaternary Research 79 (2013) 175–188
of radiocarbon dates in eastern North America. First, a series of publica-tions have made a direct link between the frequency of radiocarbondates and prehistoric demography, usually based on an argument thatmore people producemore of an archeological signaturewhich increasesthe probability that material suitable for radiocarbon dating will be re-covered and analyzed (McPhee et al., 2002; Gamble et al., 2004, 2005;Kuzmin and Keates, 2005; Shennan and Edinborough, 2007; Ugan andByers, 2007; Buchanan et al., 2008; Peros et al., 2010). On the otherhand, Surovell and Brantingham (2007) and Surovell et al. (2009)argue, based on a sample of radiocarbon dates from volcanic depositsthat the frequency of radiocarbon dates follows a decay curve, and thispattern ismost likely due to taphonomic factors decreasing the probabil-ity of recovering a radiocarbon sample with increased antiquity.
Ballenger and Mabry (2011) found in their sample of radiocarbondates from southeastern Arizona that there are many factors affectingthe frequency of reported radiocarbon dates. These include requisitegeomorphological conditions that allow for dates to be preserved andrecovered and the identification of a scientific bias in their sample,most notably by C. Vance Haynes and his extensive efforts in datingthe famous Clovis sites in the San Pedro River Valley. They also identi-fied other biases related to the frequency of more recent cultural re-source management projects with more money for radiocarbon datingin one area of their sample. Consequently, they argue that radiocarbondates are the result of systematic research biases, and that temporal fre-quency distributions are therefore incapable of validating the observed
decay curve or reconstructing demographic trends. One example of ascientific or cultural resource management bias in this analysis is thatthe radiocarbon dates in our sample from Tennessee come exclusivelyfrom two areas of the state: the Little Tennessee River andmiddle Cum-berland River drainages. The former came as a result of Tennessee Val-ley Authority sponsored projects (e.g. Chapman, 1976), and the latterfrom the extensive efforts ofmembers of theNashville Office of the Ten-nessee Division of Archaeology to locate stratified sites with datablematerial (Broster et al., 2013). Another example is the dates from Ala-bama, where the available dates come from four caves or rockshelters(Dust Cave, Lagrange, Russell Cave, Stanfield-Worley). With the excep-tion of Lagrange, the dated components at these sites conform to abroader regional pattern noted by Walthall (1998), who argued thatcaves and rockshelters in theMid-Southwere not occupieduntil the lat-ter part of the Younger Dryas. Consequently, bias in the location andcontext of the dates reported in these two states are partly responsiblefor the strong increase in the summed probability distribution for thesoutheastern sample at the onset of the Holocene. Conversely, the rela-tively fewdates older than10,500 14C yr BP (12,550 cal yr BP) is in starkcontrast with the reported distribution of temporally diagnostic bifaces,where both Alabama and Tennessee contain the highest densities offluted bifaces in eastern North America (Anderson et al., 2010).
Next, interpreting summed probability distributions can be diffi-cult. The first question is whether these graphs represent fluctuationsin human populations or the nature of the radiocarbon record. For

3 Williams (2012) suggests a database of at least 500 dates.
Figure 4. The calibrated probabilities for sites or components dating to >8000 14C yr BP (~8900 cal yr BP) for the Southeastern Sample. The probabilities were calculated usingOxCal 4.1 (Bronk Ramsey, 2009).
182 D.S. Miller, J.A.M. Gingerich / Quaternary Research 79 (2013) 175–188
example, older dates, which typically have large standard deviations,are likely to produce broader age distributions which may then pro-duce small peaks when summing a number of old dates. Likewise, sum-ming younger dates or assays with small standard deviations willproduce large peaks. In some regions of eastern North America thisproblem is reversed as a number of precise dates fromEarly Paleoindiansites in theMidwest/Mid-Atlantic region have produced a sharp spike inthe summed probability distribution around the Younger Dryas. An ex-ample of this phenomenon is shown in Figures 5 and 6where the sharpspike in the graph, taking place around 12,900 cal yr BP in theMidwest/Mid-Atlantic region, is exaggerated because of the precise dates fromShawnee-Minisink, Paleo Crossing, and Sheriden Cave. In a second ex-ample, we alter the standard deviations of only eight of the earlydates in the Northeast sample. By only changing most deviations toranges that might be expected with AMS dating versus standarddecay counting methods, the distribution is noticeably altered andremoves the small trough in the diagram that occurs just after thestart of the Younger Dryas. This also transforms the shape of the distri-bution to showwhat might be interpreted as steady growth (Fig. 8). Fi-nally, a noticeable trend in standard deviations is apparent whenplotted against the original publication date (Fig. 9). This pattern is sta-tistically significant using aMann–Whitney U test (Mann andWhitney,1947; X2=153.3, df=10; pb .0001), and likely reflects increasing
precision as a result of advances in the process of producing radiocarbondate estimates.
Another issue with extracting human demography from summedprobability distributions in eastern North America is that small data-bases comprised of dates with small standard deviations produce anumber of “peaks and valleys” during the Late Pleistocene and Youn-ger Dryas that could be interpreted as population fluctuation or insta-bility. Unfortunately, databases that are large enough to counteractthe effects of standard deviations and other errors while maintainingthe regional approach we advocate do not exist for this period(Williams, 2012).3A final problem with the radiocarbon record isthe overall structure of the calibration curve during the YoungerDryas, which causes considerable variation in the probability distri-butions (Fiedel, 1999, 2011; Fiedel and Kuzman, 2010; Meltzer andHolliday, 2010; Bamforth and Grund, 2012). These are just a few ofthe potential problems between datasets, where differences in stan-dard deviations, averaging methods, and the calibration curve canalter the shape of summed probability distributions comprised ofsmall samples.

Figure 5. The combined summed probability distributions for sites or components dat-ing to >8000 14C yr BP (~8900 cal yr BP) for each region. The probabilities were calcu-lated using OxCal 4.1 (Bronk Ramsey, 2009).
183D.S. Miller, J.A.M. Gingerich / Quaternary Research 79 (2013) 175–188
A final question relating to how demographic signals can beextracted from archeological temporal frequency distributions wasrecently tackled by Surovell and Brantingham (2007), and Surovellet al. (2009). They both argue that the “primary signal observable in
Figure 6. The combined summed probability distributions for sites or components dating tousing CalPal (Weninger et al., 2007).
most temporal frequency distributions of archeological sites anddates is not human demography but instead taphonomic bias”(Surovell et al., 2009:1715). In the case of taphonomic bias, we as-sume that older dates might be under-represented due to naturaldestructive processes, which includes localized depositional and ero-sional events that can be corrected for using a regression model(Surovell et al., 2009), assuming that other factors are not irrevocablyaltering the distribution of dates (e.g. Ballenger and Mabry, 2011),which may be difficult to demonstrate at this scale of analysis. Butagain, because of small sample sizes and the general nature of the ra-diocarbon record, we caution interpreting small-scale fluctuations inthe distributions as major changes in populations. This may especiallybe true in the Northeast where, despite ample representation of ra-diocarbon dates during the Younger Dryas, using this record aloneand in concert with summed probability distributions may magnifyerrors in small samples.
Conclusions
The Younger Dryas has become a controversial topic in recentyears due to the potential for understanding the human response toabrupt climate change. However, while the interpretation of theonset of the Younger Dryas as a punctuated event is based on datafrom ice cores from Greenland, the effect of its onset may have variedgreatly by regions throughout North America (Meltzer and Holliday,2010:9–13). This would include variation in warming and cooling,fluctuation in moisture and precipitation, regional differences inseasonality, and finally, differences in the response and change ofvegetation communities which may have been rapid or extremelystaggered. Consequently, there is reason to believe that the impacton humans groups may have been variable or even so slow in someregions that it may not have been perceptible to human populations.Finally, with the recent hypothesis that the Younger Dryas was trig-gered by an extra-terrestrial impact event (Firestone et al., 2007),there has been additional interest in what effect, if any, is detectablein the archeological record. One of the primary datasets that has thespatio-temporal breadth to address this issue is the radiocarbon re-cord of archeological sites. After compiling a database of radiocarbondates greater than 8000 14C yr BP (~8900 cal yr BP), we show that
>8000 14C yr BP (~8900 cal yr BP) for each region. The probabilities were calculated

Figure 7. Summed probability distributions for sites or components dating to >8000 14C yr BP (~8900 cal yr BP) for each region with correction for taphonomic bias using methodsdefined by Surovell and Brantingham (2007) and Surovell et al. (2009).
184 D.S. Miller, J.A.M. Gingerich / Quaternary Research 79 (2013) 175–188
there is significant regional variation with the northeastern UnitedStates displaying multiple components falling within the YoungerDryas, while the mid-Atlantic and southeastern United States beingrather meager in comparison.
We agree that in a perfect scenario, there probably is a loose cor-relation between demography and the frequency of radiocarbondates. However, there is an emerging body of research showing thisrelationship is far from straightforward due to factors affecting thepreservation and recovery of radiocarbon dates from archeologicalcontexts. These include factors such as the identification of a global
pattern of taphonomic decay in the frequency of radiocarbon dates(Surovell and Brantingham, 2007; Surovell et al., 2009), the impactof geologic visibility and recovery, and the bias introduced by partic-ular researchers repeatedly dating time periods of interest (Ballengerand Mabry, 2011). These factors may have a significant impact on thefrequency of radiocarbon dates reported in the archeological litera-ture for eastern North America. Similar to Bamforth and Grund(2012), we found that merely altering the standard deviations ofdates has a dramatic impact on the shape of the summed probabilitydistributions. This appears to be an additional source of variation

Table 2Analysis of spatial distribution of radiocarbon dates by region.
Region Area, km2 (mi2) Area (%) 14C dates (observed) 14C dates (expected) X2
Northeast 382,392 (147,522) 20.25 71 50.02 8.80Midwest/Mid-Atlantic 575,216 (221,911) 30.46 80 75.25 0.30Southeast 930,592 (359,011) 49.28 96 121.73 5.44Total 1,888,200 (728,444) 100 247 247X2 14.54df 2p b0.001Cramer's V 0.17
Region Area, km2 (mi2) Area (%) 14C dates (observed) 14C dates (expected) X2
Northeast 382,392 (147,522) 20.25 33 28.35 0.76Midwest/Mid-Atlantic 575,216 (221,911) 30.46 55 42.65 3.58Southeast 930,592 (359,011) 49.28 52 69.00 4.19Total 1,888,200 (728,444) 100 140 140X2 8.53df 2p 0.01Cramer's V 0.17
185D.S. Miller, J.A.M. Gingerich / Quaternary Research 79 (2013) 175–188
when aggregating the probabilities of dates derived from both con-ventional and accelerator mass spectrometry (AMS) methods.
Finally, the ultimate goal of many of these studies is to test for anarcheological signature of the Younger Dryas. Our results clearly indi-cate that there are few dates in Southeastern and Mid-Western/Mid-Atlantic samples during this time span. Our Northeastern sampledisplays the opposite pattern and is contrary to some expectationsthat the effects of the Younger Dryas may have been more severe innorthern latitudes. The variation in these three records could be dueto regional variability in the expression of the Younger Dryas, althoughinmany cases the demographic signature appears to be obscured by themultiple biases identified above. More pointedly, understanding the re-lationship between climate, culture and demography requires multiple
Figure 8. (A) Shows the original probability distribution of the Northeast sample generatedstandard deviations of 8 dates ranging from 10,200 to 10,900 14C yr BP. Arrows depict the
lines of evidence and the frequency of radiocarbon dates by itself is in-sufficient for understanding these processes in eastern North America.
Acknowledgments
We thank Jesse Ballenger, Vance Holliday, Todd Surovell andRandy Haas for their comments on the early drafts of this paper. Wealso appreciate the encouragement from Vance Holliday, DavidMeltzer and David Anderson, who suggested that we turn our 2010Society for American Archaeology conference paper into this article.Finally, we thank the two anonymous reviewers for their helpfulcomments and suggestions.
through CalPal. (B) Shows the same CalPal probability distribution after adjusting thearea altered.

Figure 9. The distribution of standard deviations plotted against the original publication date binned in 5-yr intervals.
186 D.S. Miller, J.A.M. Gingerich / Quaternary Research 79 (2013) 175–188
References
Adovasio, J.M., Gunn, J.D., Donahue, J., Stuckenrath, R., 1978. Meadowcroft Rockshelter,1977: an overview. American Antiquity 43, 632–651.
Adovasio, J.M., Donohue, J., Guilday, J.E., Stuckenrath, R., Gunn, J.D., Johnson, W.C., 1983.Meadowcroft Rockshelter and the peopling of the new world. In: Shutler, R.S. (Ed.),Early Man in the New World. Sage Publications, Beverly Hills, pp. 163–190.
Adovasio, J.M., Donahue, J., Carlisle, R.C., 1984. Meadowcroft Rockshelter and the Pleis-tocene/Holocene Transition in Southwest Pennsylvania. In: Genoways, H.H.,Dawson, M.R. (Eds.), Contributions in Quaternary Vertebrate Paleontology: A. :Memorial to John E. Guilday, in. Carnegie Museum of Natural History, Pittsburgh,pp. 347–369.
Adovasio, J.M., Pedler, D., Donahue, J., Stuckenrath, R., 1999. No vestiges of a beginningnor prospect for an end: two decades of debate on Meadowcroft Rockshelter. In:Bonnichsen, R., Turnmire, K.L. (Eds.), Ice Age Peoples of North America Environ-ments, Origins, and Adaptations of the First Americans. Center for the Study ofthe First Americans, Oregon State University, Corvallis, pp. 416–431.
Alley, R., 2007. Wally was right: predictive ability of the North Atlantic ‘Conveyor Belt’hypothesis for abrupt climate change. Annual Review of Earth and Planetary Sci-ences 35, 241–272.
Anderson, D.G., 1990. Paleoindian colonization of Eastern North America: a view fromthe Southeastern United States. In: Tankersley, K., Isaac, B. (Eds.), Early PaleoindianEconomies of Eastern North America. : Research in Economic Anthropology, Sup-plement, 5. JAI Press, Greenwich, pp. 163–216.
Anderson, D.G., 2001. Climate and culture change in Prehistoric and Early Historic EasternNorth America. Archaeology of Eastern North America 29, 143–186.
Anderson, D.G., 2005. Pleistocene human occupation of the Southeastern UnitedStates: research directions for the early 21st century. In: Bonnichsen, R., Lepper,B.T., Stanford, D., Waters, M.R. (Eds.), Paleoamerican Origins: Beyond Clovis.Texas A&M University Press, College Station, pp. 29–42.
Anderson, D.G., Faught, M.K., 2000. Paleoindian artifact distributions: evidence and im-plications. Antiquity 74, 507–513.
Anderson, D.G., Brose, D., Dincauze, D.F., Shott, M.J., Waldbauer, R., 2004. Earliest Americanstheme study for the eastern United States. In: Seibert, M. (Ed.), Department of theInterior, National Park Service, Washington, D.C.
Anderson, D.G., Meeks, S.C., Goodyear, A.C., Miller, D.S., 2008. Southeastern data incon-sistent with Paleoindian demographic reconstruction. Proceedings of the NationalAcademy of Sciences 105, E108.
Anderson, D.G., Goodyear, A.C., Stafford, T.W., Kennett, J., West, A., 2009. Potentialhuman population decline/reorganization during the Younger Dryas in NorthAmerica (ABSTRACT). American Geophysical Union Fall Meeting.
Anderson, D.G., Miller, D.S., Yerka, S.J., Gillam, J.C., Johanson, E.N., Anderson, D.T.,Goodyear, A.C., Smallwood, A.M., 2010. PIDBA (Paleoindian Database of theAmericas) 2010: current status and findings. Archaeology of Eastern NorthAmerica 38, 1–18.
Anderson, D.G., Goodyear, A.C., Kennett, J., West, A., 2011. Multiple lines of evidence fora possible human population decline during the early Younger Dryas. QuaternaryInternational 242, 570–583.
Asch Sidell, N., 1999. Paleoethnobotanical indicators of subsistence and settlementchange in the Northeast. New York State Museum Bulletin 496, 241–263.
Ballenger, J.A.M., Mabry, J.B., 2011. Temporal frequency distributions of alluvium in theAmerican Southwest: taphonomic, paleohydraulic, and demographic implications.Journal of Archaeological Science 38, 1314–1325.
Bamforth, D., Grund, B., 2012. Radiocarbon calibration curves, summed probability dis-tributions, and early Paleoindian population trends in North America. Journal ofArchaeological Science 39 (6), 1768–1774.
Barker, G., Broster, J.B., 1996. The Johnson Site (40Dv400): a dated Paleoindian andearly Archaic occupation in Tennessee's Central Basin. Journal of Alabama Archae-ology 42, 97–153.
Bement, L.C., Carter, B.J., 2010. Jake Bluff: bison hunting on the Southern Plains NorthAmerica. American Antiquity 75 (4), 907–934.
Boldurian, A.T., Cotter, J.L., 1999. Clovis Revisited: New Perspectives on Paleoindian Ad-aptations from Blackwater Draw, New Mexico. University Museum, University ofPennsylvania, Philadelphia.
Bolian, C.E., 1980. The Early and Middle Archaic of the Lakes Region, New Hampshire.Occasional Publications in Northeastern Anthropology 7, 115–134.
Bonnichsen, R., Will, R.F., 1999. Radiocarbon chronology of Northeastern Paleoamericansites; discriminating natural and human burn features. In: Bonnichsen, R., Turnmire,K.L. (Eds.), Ice Age Peoples of North America: Environments, Origins, and Adaptationsof the First Americans. Center for the Study of the First Americans, Oregon State Uni-versity, Corvallis, pp. 395–415.
Bradbury, A.P., Creasman, S.D., 2008. Spatial analysis and site structure of the early ar-chaic occupation of the Hart Site (15LA183), Lawrence County, Kentucky. South-eastern Archaeology 27, 31–44.
Bradley, J., Speiss, A., Boisverty, R., Boudreau, J., 2008. What's the point? Modal formsand attributes of Paleoindian bifaces in the New England-Maritimes Region. Ar-chaeology of Eastern North America, 36.
Brennan, L.A., 1982. A compilation of fluted points of Eastern North America by count anddistribution: an AENA Project. Archaeology of Eastern North America 10, 27–46.
Bronk Ramsey, C., 2009. Bayesian analysis of radiocarbon dates. Radiocarbon 51,337–360.
Brookes, S.O., 1979. The Hester Site: an Early Archaic occupation in Monroe County,Mississippi. Archaeology Report, 5. Mississippi Department of Archives andHistory.
Brose, D.S., 1994. Archaeological investigation at the Paleo Crossing Site, a Paleoindianoccupation in Medina County, Ohio. In: Dancy, W.S. (Ed.), The First Discovery ofAmerica: Archaeological Evidence of the Early Inhabitants of the Ohio Area. OhioArchaeological Council, Columbus, pp. 61–76.
Broster, J.B., Norton, M.R., Hulan, R., Durham, E., 2008. Paleoamerican and Early Archaicoccupations of the Widimeier Site (40Dv9), Davidson County, Tennessee. CurrentResearch in the Pleistocene 25, 64–65.
Broster, J., Norton, M.R., Miller, D.S., Tune, J.W., Baker, J.D., 2013. Tennessee'sPaleoindian record. In: Gingerich, J.A.M. (Ed.), In The Eastern Fluted Point Tradi-tion. University of Utah Press, Salt Lake, pp. 299–314.
Broyles, B.J., 1966. Preliminary report: the St. Albans Site (46KA27), Kanawha County.The West Virginia Archaeologist 19, 1–43.
187D.S. Miller, J.A.M. Gingerich / Quaternary Research 79 (2013) 175–188
Buchanan, B., 2003. The effects of sample bias on Paleoindian fluted point recovery inthe United States. North American Archaeologist 24, 311–338.
Buchanan, B., Collard, M., Edinborough, K., 2008. Paleoindian demography and the ex-traterrestrial impact hypothesis. Proceedings of the National Academy of Sciences105, 11,651–11,654.
Buchanan, B., Hamilton, M., Edinborough, K., O'Brien, M.J., Collard, M., 2011. A com-ment on Steele's (2010) “Radiocarbon dates as data: quantitative strategies for es-timating colonization front speeds and event densities.”. Journal of ArchaeologicalScience 38, 2116–2122.
Byers, D.S., 1959. Radiocarbon dates from the Bull Brook Site, Massachusetts. AmericanAntiquity 24 (4), 427–429.
Carr, K.W., 1986. Core reconstructions and community patterning at the Fifty Site. Jour-nal of Middle Atlantic Archaeology 2, 79–92.
Carr, K.W., 1998. The Early Archaic Period in Pennsylvania. Pennsylvania Archaeologist68 (2), 42–69.
Cavallo, J.A., 1981. Turkey Swamp: a Late Paleo-Indian Site in New Jersey's CoastalPlain. Archaeology of Eastern North America 9, 1–18.
Chamberlain, T.C., 1890. The method of multiple working hypotheses. Science 15,92–96.
Chapman, J., 1976. The Archaic Period in the Lower Little Tennessee River Valley: radio-carbon dates. Tennessee Anthropologist 1, 1–12.
Childress, W., Blanton, D.B., 1997. A radiocarbon date from a deeply buried stratumyielding a plano-like projectile point from the Smith Mountain Site in Virginia. Cur-rent Research in the Pleistocene 14, 12–14.
Clausen, C.J., Cohen, A.D., Emiliani, C., Holman, J.A., Stipp, J.J., 1979. Little Salt Spring,Florida: a unique underwater site. Science 203, 609–614.
Collard, M., Buchanan, B., Edinborough, K., 2008. Reply to Anderson et al., Jones, Kennettand West, Culleton, and Kennett et al.: further evidence against the extraterrestrialimpact hypothesis. Proceedings of the National Academy of Sciences 105, E112.
Collard, M., Buchanan, B., Hamilton, M., O'Brian, M., 2011. Testing hypotheses aboutEarly Paleoindians with radiocarbon dates. Paper Presented at the 76th AnnualMeeting for the Society for American Archaeology, Sacramento, California.
Collins, M.B., 1998. Wilson Leonard: An 11,000-Year Archaeological Record of Hunter-Gatherers in Central Texas. Texas Archaeological Research Laboratory, Universityof Texas, Austin.
Cramér, H., 1946. Mathematical Methods of Statistics. Princeton University Press, Princeton.Crook Jr., M.R., 1990. Rae's Creek: A Multicomponent Archaeological Site at the Fall Line
along the Savannah River. Department of Anthropology, Georgia State University,Atlanta.
Culleton, B.J., 2008. Crude demographic proxy reveals nothing about Paleoindian pop-ulation. Proceedings of the National Academy of Sciences 105, E111.
Curran, M.L., 1984. TheWhipple Site and Paleoindian tool assemblage variation: a com-parison of intrasite structuring. Archaeology of Eastern North America 12, 5–40.
Curran, M.L., 1996. Paleoindians in the Northeast: the problem of dating fluted pointsites. The Review of Archaeology 17, 2–11.
Curran, M.L., 1999. Exploration, Colonization and Settling In: The Bull Brook Phase, An-tecedents, and Descendants. In: Levine, M.A., Sassaman, K.E., Nassaney, M.S. (Eds.),The Archaeological Northeast. Bergin and Garvey, Westport, pp. 3–24.
Custer, J.F., Watson, S.C., Bailey, D.N., 1994. Data Recovery Investigations of the WestWater Street Site, 36Cn175, Lock Haven, Clinton County, Pennsylvania. Report sub-mitted to the U.S. Army Corps of Engineers, Baltimore District. University of Delaware,Newark.
Daniel, I.R., Goodyear, A.C., 2006. An Update on the North Carolina Fluted-Point Survey.Current Research in the Pleistocene 23, 99–101.
Daniel Jr., I.R., Seramur, K.C., Potts, T.L., Jorgenson, M.W., 2008. Searching a sand dune:shovel testing the Barber Creek Site. North Carolina Archaeology 57, 1–28.
Dansie, A., Jerrems, W., 2005. More bits and pieces: a new look at Lahontan chronologyand human occupation. In: Bonnichsen, R., Lepper, B., Stanford, D.J., Waters, M.R.(Eds.), Paleoamerican Origins: Beyond Clovis. Center for the Study of the FirstAmericans, College Station, pp. 51–79.
Dejarnette, D.L., Knight, V.J., 1976. LaGrange. Journal of Alabama archaeology 12, 1–60.Dejarnette, D.L., Kurjack, E.B., Cambron, J.W., 1962. Excavations at the Stanfield-Worley
Bluff Shelter. Journal of Alabama archaeology 8, 1–124.Dent, R.J., 2002. Paleoindian of the Upper Delaware Valley: revisiting Shawnee-Minisink
and nearby sites. In: Carr, K.W., Adovasio, J.M. (Eds.), Ice Age Peoples of Pennsylvania.The Pennsylvania Historical and Museum Commission, Harrisburg, pp. 51–78.
Deter-Wolf, A., Tune, J.W., Broster, J.B., 2011. Excavations and dating of Late Pleistoceneand Paleoindian deposits at Coats-Hines, Williamson County Tennessee. TennesseeArchaeology 5 (2), 142–156.
Doran, G.H., 2002. The Windover radiocarbon chronology. In: Doran, G.H. (Ed.),Windover. University Press of Florida, Gainesville.
Doran, G.H., Dickel, D.N., 1988. Radiometric chronology fo the Archaic Windover ar-chaeological site (8-Br-246). Florida Anthropologist 41, 365–380.
Dunbar, J.S., 2006. Pleistocene-Early Holocene climate change: chronostratigraphy andgeoclimate of the Southeast US. In: Webb, S.J. (Ed.), First Floridians and LastMastadons: The Page-Ladson Site in theAucilla River. Springer Press, TheNetherlands,pp. 103–158.
Dunbar, J.S., Vojnovski, P., 2007. Early Floridians and Late Mega Mammals: some tech-nological and dietary evidence from four North Florida Paleoindian sites. In:Walker, R., Driskell, B.N. (Eds.), Foragers in the Terminal Pleistocene in NorthAmerica. University of Nebraska Press, Lincoln, pp. 166–202.
Dunnell, R.C., 1990. The role of the southeast in American archaeology. SoutheasternArchaeology 9, 11–22.
Elliott, D.T., Ledbetter, R.J., Gordon, E.A., 1994. Data recovery at Lover's lane, PhinizySwamp, and the Old Dike Sites Bobby Jones Expressway Extension Corridor Augusta,Georgia. Southeastern Archeological Services, Inc., Athens, Georgia.
Ellis, C.J., Carr, D.H., Loebel, T.J., 2011. The Younger Dryas and Late Pleistocene peoplesof the Great Lakes Region. Quaternary International 242, 534–535.
Eren, M.I., 2009. Paleoindian stability during the Younger Dryas in the North AmericaLower Great Lakes. In: Shea, J., Lieberman, D. (Eds.), Transitions in Prehistory: Pa-pers in Honor of Ofer Bar-Yosef. Harvard University American School of PrehistoricResearch Press, Cambridge, pp. 385–417.
Faught, M.K., 2008. Archaeological roots of human diversity in the new world: a com-pilation of accurate and precise radiocarbon ages from the earliest sites. AmericanAntiquity 73, 670–698.
Faught, M.K., Hornum, M.B., Goodwin, R.C., Carter, B., Webb, S.D., 2003. The Earliest-Holocene Tool Assemblages from Northern Florida with Stratigraphically Con-trolled Radiocarbon Estiates (Sites 8LE2105 and 8JE591). Current Research in thePleistocene 20, 16–18.
Fiedel, S.J., 1999. Older than we thought: implications of corrected dates forPaleoindians. American Antiquity 64, 95–116.
Fiedel, S.J., 2011. The mysterious onset of the Younger Dryas. Quaternary International242, 262–266.
Fiedel, S.J., Kuzman, Y., 2010. Is more precise dating of Paleoindian expansion feasible?Radiocarbon 52 (2–3), 337–345.
Firestone, R.B., et al., 2007. Evidence for an extraterrestrial impact 12,900 years agothat contributed to the megafaunal extinctions and the Younger Dryas cooling.Proceedings of the National Academy of Sciences 104, 16,016–16,021.
Frison, G.C., 1984. The Carter/Kerr-McGee Paleoindian Site: cultural resource manage-ment and archaeological research. American Antiquity 79, 288–314.
Funk, R.E., Wellman, B., 1984. Evidence of Early Holocene occupations in the UpperSusquehanna Valley, New York State. Archaeology of Eastern North America 12,81–109.
Futato, E., 1977. Radiocarbon dates from the Tennessee Valley of Northern Alabama.The Tennessee Archaeological Society Newsletter 22, 35–42.
Gamble, C., Davies, W., Pettit, P., Richards, M., 2004. Climate change and evolvinghuman diversity in Europe during the Last Glacial. Philosophical Transactions ofthe Royal Society of London 359, 243–254.
Gamble, C., Davies, W., Pettit, P., Hazelwood, L., Richards, M., 2005. The archaeologicaland genetic foundations of the European population during the Late Glacial: impli-cations for “Agricultural Thinking.”. Cambridge Archaeological Journal 15,193–223.
Gardner,W.M., 1974. The Flint Run Complex: pattern and process during the Paleo-Indianto Early Archaic. In: Gardner, WilliamM. (Ed.), The Flint Run Paleoindian Complex: APreliminary Report, 1971–1973 Seasons. Catholic University of America ArchaeologyLaboratory, Washington D.C, pp. 5–47 (Occasional Publication No. 1).
Gingerich, J.A.M., 2007. Shawnee-Minisink Revisited: New Excavations of thePaleoindian Level. Anthropology, University of Wyoming, Laramie.
Gingerich, J.A.M., 2011. Down to seeds and stones: a new look at the subsistence re-mains from Shawnee-Minisink. American Antiquity 76, 127–144.
Gingerich, J.A.M., Waters, M.R., 2007. New dates from the Shawnee-Minisink Site,Pennsylvania. Current Research in the Pleistocene 24, 90–92.
Goodyear, A.C., 1999. The Early Holocene occupation of the Southeastern United States:a geoarchaeological summary. In: Bonnichsen, R., Turmire, K. (Eds.), Ice Age Peo-ples of North America. Oregon State University Press, Corvallis, pp. 432–481.
Goodyear, A.C., 2006. Recognizing the Redstone Fluted Point in the South CarolinaPaleoindian Point Database. Current Research in the Pleistocene 23, 112–114.
Gramly, R.M., 1982. The Vail Site: A Paleoindian Encampment in Maine. Buffalo Societyof Natural Sciences, Buffalo, New York.
Gramly, R.M., Funk, R.E., 1990. What is known and not known about the human occu-pation of the Northeastern United States until 10,000 B.P. Archaeology of EasternNorth America (18), 5–31.
Griffin, J.W., 1974. Investigations in Russell Cave. U.S. Government Printing Office,Washington, D.C.
Hall, R., Roy, D., Boling, D., 2004. Pleistocene migration routes in the Americas: humanbiological adaptations and environmental constraints. Evolutionary Anthroplogy13, 132–144.
Haynes Jr., C.V., 1983. Fluted Points in the East and West. Archaeology of Eastern NorthAmerica 83, 24–26.
Haynes, C.V., 2005. Clovis, pre-clovis, climate change, and extinction. In: RobsenBonnichsen, B.T.L., Stanford, Dennis, Waters, Michael R. (Eds.), Paleoamerican Ori-gins: Beyond Clovis. Center for the Study of the First Americans, Texas A&M Uni-versity Press, College Station, Texas, pp. 113–132.
Haynes Jr., C.V., 2008. Younger Dryas ‘Black Mats’ and the Rancholabrean terminationin North America. Proceedings of the National Academy of Sciences 105,6520–6525.
Haynes Jr., C.V., Donahue, J., Jull, J.T., Zabel, T.H., 1984. Application of accelerator datingto fluted point Paleoindian sites. Archaeology of Eastern North America 12,184–191.
Hemmings, C.A., 2005. An update on recent work at Sloth Hole (8JE121), Aucilla River,Jefferson County, Florida. Current Research in the Pleistocene 22, 47–48.
Herbstritt, 1988. A reference for Pennsylvania radiocarbon dates. Pennsylvania Archae-ologist 58, 1–29.
Hoffman, C., 1988. Radiocarbon dates from Massachusetts: an annotated listing, Bulle-tin of the Massachusetts. Archaeological Society 49, 21–39.
Holliday, V.T., Meltzer, D.J., 2010. The 12.9 k ET impact hypothesis and North AmericanPaleoindians. Current Anthropology 51, 575–607.
Inashima, P.Y., 2008. Establishing a radiocarbon date based framework for NortheasternVirginia Archeology. Quarterly Bulletin of the Archeological Society of Virginia 63.
Johnson, E., Holliday, V.T., 2004. Archaeology and Late Quaternary environments of theSouthern High Plains. In: Perttula, T.K. (Ed.), Prehistory of Texas. Texas A&M Uni-versity Press, College Station, pp. 283–295.

188 D.S. Miller, J.A.M. Gingerich / Quaternary Research 79 (2013) 175–188
Kitchel, N.R., Boisvert, R., 2011. New radiocarbon date from the Colebrook Paleoindiansite. New Hampshire Archaeological Society Newsletter 27 (1), 3.
Kuzmin, Y.V., Keates, S.G., 2005. Dates are not just data: Paleolithic settlement patternsin Siberia derived from radiocarbon dates. American Antiquity 70.
Larson, M.L., Kornfeld, M., Frison, G.C., 2009. Hell Gap: A Stratified Paleoindian Camp-site at the Edge of the Rockies. University of Utah Press, Salt Lake City.
Laub, R.S., 2002. The Paleoindian presence in the Northeast: a view from the Hiscocksite. In: Carr, K.W., Adovasio, J.M. (Eds.), Ice Age People of Pennsylvania. PennsylvaniaHistorical and Museum Commission, pp. 105–122.
Leigh, D.S., 2004. Late Pleistocene braided rivers of the Atlantic Coastal Plain, USA. Qua-ternary Science Reviews 23, 65–84.
Leigh, D.S., 2006. Terminal Pleistocene braided to meandering transition in rivers of theSoutheastern USA. Catena 66, 155–160.
Levine, M.A., 1990. Accomodating age: radiocarbon results and fluted point sites inNortheastern North America. Archaeology of Eastern North America 18, 33–60.
Lothrop, J.C., Newby, P., Spiess, A., Bradley, J., 2011. Paleoindians and the Younger Dryasin the New England-Maritimes Region. Quaternary International 242, 546–569.
Lovvorn, M.B., Frison, G.C., Tieszen, L.L., 2001. Paleoclimate and Amerindians: evidencefrom stable isotopes and atmospheric circulation. Proceedings of the NationalAcademy of Sciences 98, 2485–2490.
MacDonald, G., 1968. Debert: a Paleo-Indian site in Central Nova Scotia. PersimmonPress, Buffalo.
Mann, H.B., Whitney, D.R., 1947. On a test of whether one of two random variables isstochastically larger than the other. Annals of Mathematical Statistics 18, 50–60.
Maslowski, R.F., Niquette, C.M., Wingfield, D.M., 1995. The Kentucky, Ohio and WestVirginia radiocarbon database. The West Virginia Archaeologist 47, 1–75.
Mason, R.J., 1962. The Paleo-Indian tradition in Eastern North America. Current Anthro-pology 3, 227–228.
McAvoy, J.D., McAvoy, L.D., 1997. Archaeological investigations of Site 44SX202, CactusHill, Sussex County, Virginia. Virginia Department of Historic Resources ResearchReport No. 8.
McAvoy, J.D., Baker, J.C., Feathers, J.K., Hodges, R.L., McWeeney, L.J., Whyte, T.R., 2000.Summary of research at the Cactus Hill Archaeological Site, 44SX202, Sussex Coun-ty, Virginia. Report Submitted to the National Geographic Society in Compliancewith Stipulations of grant #6345-98.
McDonald, J.N., 2000. An Outline of the Pre-Clovis Archaeology of SV-2, Saltsville, Vir-ginia, with Special Attention to a Bone Tool Dated 14,510 Yrs B.P. Jeffersonia 9,1–60.
McPhee, R.D., Tikhonov, A.N., Mol, D., Marliave, C.d, van der Plict, H., Greenwood, A.D.,Flemming, C., Agenbroad, L., 2002. Radiocarbon chronologies and extinction dy-namics of the Late Quaternary mammalian megafauna of the Taimyr Peninsula,Russian Federation. Journal of Archaeological Science 29, 1017–1042.
McWeeney, L.J., 1994. Archaeological Settlment Patterns and Vegetation Dynamics inSouthern New England in the Late Quaternary. Yale University.
Meeks, S.C., Anderson, D.G., 2012. Evaluating the effect of the Younger Dryas on humanpopulation histories in the Southeastern United States. In: Eren, M. (Ed.), Hunter-Gatherer Behavior: Human Response During The Younger Dryas. Left Coast Press,Walnut Creek, pp. 111–138.
Meltzer, D.J., 1988. Late Pleistocene human adaptations in Eastern North America. Jour-nal of World Prehistory 2, 1–53.
Meltzer, D.J., 2009. The First Peoples in a New World: Colonizing Ice Age America. Uni-versity of California Press, Berkeley.
Meltzer, D.J., Holliday, V.T., 2010. Wound North American Paleoindians have noticedthe Younger Dryas age climate change? Journal of World Prehistory 23, 1–41.
Miller, D.S., Gingerich, J.A.M., 2013. Paleoindian Chronology and the Eastern FlutedPoint Tradition. In: Gingerich, J.A.M. (Ed.), In The Eastern Fluted Point Tradition.University of Utah Press, Salt Lake, pp. 9–37.
Moeller, R.W., 1980. 6LF21: A Paleoindian Site in Western Connecticut. American Indi-an Archaeological Institute, Washington, Connecticut.
Morlan, R.E., 2005. Canadian Archaeological Radiocarbon Database. http://www.canadianarchaeology.ca/.
Murphy, J.L., Dyer, D.L., Walker, D.A., 1985. Prehistoric Elk remains from CranberryPrairie, Mercer County, Ohio. Ohio Journal of Science 85, 112–115.
Newby, P., Speiss, A., Shuman, B., Leduck, P., 2005. A Paleoindian response to the Youn-ger Dryas climate change. Quaternary Science Reviews 24, 141–154.
Norton, M.R., Boster, J.B., 1992. 40HS200: the Nuckolls Extension Site. Tennessee An-thropologist 17, 13–32.
Norton, M.R., Boster, J.B., 1993. Archaeological investigations at the Puckett Site(40SW228): a Paleoindian-Early Archaic occupation on the Cumberland River,Stewart County, Tennessee. Tennessee Anthropologist 18, 45–58.
Peros, M.C., Munoz, S.E., Gajewski, K., Viau, A.E., 2010. Prehistoric demography of NorthAmerica inferred from radiocarbon data. Journal of Archaeological Science 37,656–664.
Peterson, J.B., Bartone, R.N., Cox, B.J., 2000. The Varney Farm Site and the LatePaleoindian Period in Northeastern North America. Archaeology of Eastern NorthAmerica 28, 113–139.
Plackett, R.L., 1983. Karl Pearson and the chi-squared test. International Statistics Re-view 51, 59–72.
Prasciunas, M.M., 2011. Mapping Clovis: projectile points, behavior, and bias. AmericanAntiquity 76, 107–126.
Puryear, K.A., 2009. The Late Pleistocene/Early Holocene vegetational history of the vailsite. In: Michael Gramly, R. (Ed.), Palaeo-Americans and Palaeo-Environment at theVail Sites, Maine. Persimmon Press, North Andover, pp. 9–54.
Redmond, B., Tankersley, K., 2005. Evidence of Early Paleoindian bone modification anduse at the Sheriden Cave Site (33WY252), Wyandot County, Ohio. American Antiq-uity 70 (3), 503–526.
Robinson, B.S., 1996. A regional analysis of the Moorhead burial tradition: 8500–3700B.P. Archaeology of Eastern North America 24, 95–148.
Robinson, B.S., Ort, J.C., Eldridge, W.A., Burke, A.L., Pelletier, B.G., 2009. Paleoindian ag-gregation and social context at Bull Brook. American Antiquity 74, 423–447.
Sellet, F., Donohue, J., Hill, M.G., 2009. The Jim Pitts site: a stratified Paleoindian site inthe Black Hills of South Dakota. American Antiquity 74, 735–758.
Shennan, S., Edinborough, K., 2007. Prehistoric population history: from the Late Gla-cial to the Late Neolithic in Central and Northern Europe. Journal of ArchaeologicalScience 34, 1339–1345.
Sherwood, S.C., Driskell, B.N., Randall, A.R., Meeks, S.C., 2004. Chronology and stratigra-phy at Dust Cave, Alabama. American Antiquity 69, 533–534.
Speiss, A., Willson, D., 1987. Michaud: a Paleoindian site in the New England maritimesregion. The Maine Historic Preservation Commission and the Maine ArchaeologicalSociety, Augusta.
Speiss, A.E., Wilson, D., Bradley, J., 1998. Paleoindian occupation in the New England-Maritimes region: beyond cultural ecology. Archaeology of Eastern North America26, 201–264.
Stanzeski, A., 1998. Four Paleoindian and Early Archaic sites in Southern New Jersey.Archaeology of Eastern North America 26, 41–53.
Steele, J., 2010. Radiocarbon dates as data: quantitative strategies for estimating colo-nization front speeds and event densities. Journal of Archaeological Science 37,2017–2030.
Steponaitis, V.P., 1986. Prehistoric archaeology of the southeastern U.S. Annual Reviewof Anthropology 15, 383–393.
Stewart, R.M., Custer, J.F., Kline, D., 1991. A deeply stratified archaeological and sedi-mentary sequence in the Delaware River Valley of the Middle Atlantic Region,United States. Geoarchaeology 6, 169–182.
Strauss, L., Goebel, T., 2011. Humans and Younger Dryas: dead end, short detour, oropen road to the Holocene? Quaternary International 242, 259–261.
Surovell, T.A., Brantingham, P.J., 2007. A note on the use of temporal frequency distri-butions in studies of prehistoric demography. Journal of Archaeological Science34, 1868–1877.
Surovell, T.A., Finely, J., Smith, G.M., Brantingham, P.J., Kelly, R.L., 2009. Correcting tem-poral frequency distributions for taphonomic bias. Journal of Archaeological Sci-ence 36, 1715–1724.
Tankersley, K.B., Vanderlaan, S., Holland, J.D., Bland, S., 1997. Geochronology of the arcsite: a Paleoindian habitation in the Great Lakes Region. Archaeology of EasternNorth America 25, 31–44.
Thulman, D., 2009. Freshwater availability as the constraining factor in the MiddlePaleoindian occupation of North-Central Florida. Geoarchaeology 24, 243–276.
Ugan, A., Byers, D., 2007. Geographic and temporal trends in Proboscidean and humanradiocarbon histories during the Late Pleistocene. Quaternary Science Review 26,3058–3080.
Wagner, D.P., 1994. Pedology and geomorphology of the Depew Recreation Area. In:Inashima, P.Y. (Ed.), Geomorphology, Remote Sensing, and Archaeological Moni-toring at Depew Recreation Area: Delaware Water Gap National Recreation Area,New Jersey. Department of the Interior, National Park Service, Denver ServiceCenter, Eastern Team, Eastern Applied Archaeology Center Silver Spring, Maryland,pp. 20904–27800.
Wall, R.D., 2008. Deep testing and radiocarbon dates from the Barton Site (18AG3),Allegany County, Maryland. Maryland Archaeology 44, 1–4.
Walthall, J., 1998. Rockshelters and Hunter-Gatherer adaptation to the Pleistocene/Holocene transition. American Antiquity 63, 223–238.
Waters, M.R., 2011. Clovis chronology and origins. Paper Presented at the 76th AnnualMeeting for the Society for American Archaeology, Sacramento, California.
Waters, M.R., Stafford, T.W., 2007. Redefining the Age of Clovis: implications for thepeopling of the Americas. Science 315, 1122–1126.
Waters, M.R., Stafford, T.W., Redmond, B.G., Tankersley, K.B., 2009. The Age of thePaleoindian Assemblage at Sheriden Cave, Ohio. American Antiquity 74, 107–111.
Weninger, B., Jöris, O., Danzeglocke, U., 2007. CalPal-2007. Cologne Radiocarbon Cali-bration and Palaeoclimate Research Package.
West, A., Anderson, D.G., Goodyear, A.C., Stafford, T.W., 2010.Multiple lines of evidence fora human population decline during the initial Younger Dryas. Paper Presented at the75th Annual Meeting of the Society for American Archaeology, St. Louis, Missouri.
Williams, A.N., 2012. The use of summed radiocarbon probability distributions in ar-chaeology: a review of methods. Journal of Archaeological Science 39, 578–589.
Copyright © 2022 FDOKUMEN