Gernot Minke Manual de construcción para viviendas antisísmicas de tierra
Upload
independentCategory
view
0download
0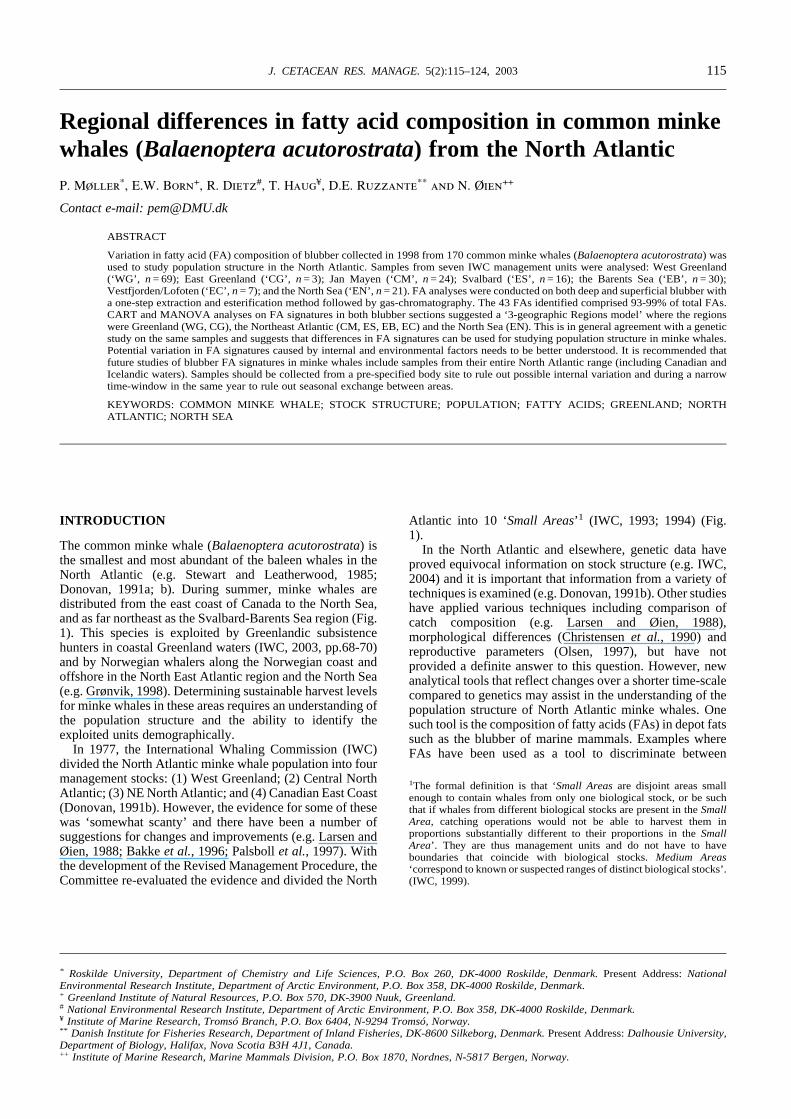
Regional differences in fatty acid composition in common minkewhales (Balaenoptera acutorostrata) from the North AtlanticP. Møller*, E.W. Born+, R. Dietz#, T. Haug¥, D.E. Ruzzante** and N. Øien++
Contact e-mail: [email protected]
ABSTRACT
Variation in fatty acid (FA) composition of blubber collected in 1998 from 170 common minke whales (Balaenoptera acutorostrata) wasused to study population structure in the North Atlantic. Samples from seven IWC management units were analysed: West Greenland(‘WG’, n = 69); East Greenland (‘CG’, n = 3); Jan Mayen (‘CM’, n = 24); Svalbard (‘ES’, n = 16); the Barents Sea (‘EB’, n = 30);Vestfjorden/Lofoten (‘EC’, n = 7); and the North Sea (‘EN’, n = 21). FA analyses were conducted on both deep and superficial blubber witha one-step extraction and esterification method followed by gas-chromatography. The 43 FAs identified comprised 93-99% of total FAs.CART and MANOVA analyses on FA signatures in both blubber sections suggested a ‘3-geographic Regions model’ where the regionswere Greenland (WG, CG), the Northeast Atlantic (CM, ES, EB, EC) and the North Sea (EN). This is in general agreement with a geneticstudy on the same samples and suggests that differences in FA signatures can be used for studying population structure in minke whales.Potential variation in FA signatures caused by internal and environmental factors needs to be better understood. It is recommended thatfuture studies of blubber FA signatures in minke whales include samples from their entire North Atlantic range (including Canadian andIcelandic waters). Samples should be collected from a pre-specified body site to rule out possible internal variation and during a narrowtime-window in the same year to rule out seasonal exchange between areas.
KEYWORDS: COMMON MINKE WHALE; STOCK STRUCTURE; POPULATION; FATTY ACIDS; GREENLAND; NORTHATLANTIC; NORTH SEA
INTRODUCTION
The common minke whale (Balaenoptera acutorostrata) isthe smallest and most abundant of the baleen whales in theNorth Atlantic (e.g. Stewart and Leatherwood, 1985;Donovan, 1991a; b). During summer, minke whales aredistributed from the east coast of Canada to the North Sea,and as far northeast as the Svalbard-Barents Sea region (Fig.1). This species is exploited by Greenlandic subsistencehunters in coastal Greenland waters (IWC, 2003, pp.68-70)and by Norwegian whalers along the Norwegian coast andoffshore in the North East Atlantic region and the North Sea(e.g. Grønvik, 1998). Determining sustainable harvest levelsfor minke whales in these areas requires an understanding ofthe population structure and the ability to identify theexploited units demographically.
In 1977, the International Whaling Commission (IWC)divided the North Atlantic minke whale population into fourmanagement stocks: (1) West Greenland; (2) Central NorthAtlantic; (3) NE North Atlantic; and (4) Canadian East Coast(Donovan, 1991b). However, the evidence for some of thesewas ‘somewhat scanty’ and there have been a number ofsuggestions for changes and improvements (e.g. Larsen andØien, 1988; Bakke et al., 1996; Palsboll et al., 1997). Withthe development of the Revised Management Procedure, theCommittee re-evaluated the evidence and divided the North
Atlantic into 10 ‘Small Areas’1 (IWC, 1993; 1994) (Fig.1).
In the North Atlantic and elsewhere, genetic data haveproved equivocal information on stock structure (e.g. IWC,2004) and it is important that information from a variety oftechniques is examined (e.g. Donovan, 1991b). Other studieshave applied various techniques including comparison ofcatch composition (e.g. Larsen and Øien, 1988),morphological differences (Christensen et al., 1990) andreproductive parameters (Olsen, 1997), but have notprovided a definite answer to this question. However, newanalytical tools that reflect changes over a shorter time-scalecompared to genetics may assist in the understanding of thepopulation structure of North Atlantic minke whales. Onesuch tool is the composition of fatty acids (FAs) in depot fatssuch as the blubber of marine mammals. Examples whereFAs have been used as a tool to discriminate between
1The formal definition is that ‘Small Areas are disjoint areas smallenough to contain whales from only one biological stock, or be suchthat if whales from different biological stocks are present in the SmallArea, catching operations would not be able to harvest them inproportions substantially different to their proportions in the SmallArea’. They are thus management units and do not have to haveboundaries that coincide with biological stocks. Medium Areas‘correspond to known or suspected ranges of distinct biological stocks’.(IWC, 1999).
* Roskilde University, Department of Chemistry and Life Sciences, P.O. Box 260, DK-4000 Roskilde, Denmark. Present Address: NationalEnvironmental Research Institute, Department of Arctic Environment, P.O. Box 358, DK-4000 Roskilde, Denmark.+ Greenland Institute of Natural Resources, P.O. Box 570, DK-3900 Nuuk, Greenland.# National Environmental Research Institute, Department of Arctic Environment, P.O. Box 358, DK-4000 Roskilde, Denmark. ¥ Institute of Marine Research, Tromsó Branch, P.O. Box 6404, N-9294 Tromsó, Norway. ** Danish Institute for Fisheries Research, Department of Inland Fisheries, DK-8600 Silkeborg, Denmark. Present Address: Dalhousie University,Department of Biology, Halifax, Nova Scotia B3H 4J1, Canada. ++ Institute of Marine Research, Marine Mammals Division, P.O. Box 1870, Nordnes, N-5817 Bergen, Norway.
J. CETACEAN RES. MANAGE. 5(2):115–124, 2003 115
populations include: ringed seals, Phoca hispida (Käkelä etal., 1993); harp seals, Phoca groenlandica (Grahl-Nielsen etal., 1993); harbour seals, Phoca vitulina (Smith et al., 1996;Iverson et al., 1997); and harbour porpoises, Phocoenaphocoena (Møller et al., 2003). In addition, Olsen andGrahl-Nielsen (2002) were able to differentiate betweenminke whales from the Norwegian Sea and the North Seausing differences in FA signatures in blubber.
In marine mammals the dietary FAs are representedmainly by long chain mono-unsaturated (e.g. C18:1n-7/n-9,C20:1n-9/n-11, C22:1n-9/n-11) and poly-unsaturated fattyacids (e.g. C18:3n-3, 18:4n-3, 20:4n-6, C20:5n-3, C22:5n-3,22:6n-3) (e.g. Ackman et al., 1975; West et al., 1979;Koopman et al., 1996; Iverson et al., 1997; Smith et al.,1997; Walton et al., 2000).
Previous genetic studies compared minke whalescollected in different years, making it difficult to distinguishbetween spatial and potential temporal differentiation (IWC,1998). To eliminate some of these uncertainties, this studyused minke whales caught during a single whaling season inseven of 10 IWC ‘Small Areas’ in the North Atlantic. Todate, the samples have been analysed for regional differencesin signatures of elements and stable isotopes (Born et al.,2003), organochlorines (Hobbs et al., 2002), genetics(Andersen et al., 2003) and caesium-137 (Born et al.,2002).
This paper provides an analysis of the fatty acids in thedeep and superficial blubber from 170 minke whalessampled in 1998 in West Greenland, the northeasternAtlantic and the North Sea with the objective of elucidatingpopulation structure. Information is presented on the FAsidentified, and on the regional variation in the compositionof the FAs in minke whales. Preliminary analyses werepresented by Møller et al. (2000).
MATERIALS AND METHODS
Field samplingBlubber samples were collected from 6 May until 31 October1998 from 170 minke whales taken during directed catchesby Greenlandic and Norwegian whalers in the North Atlanticregion (Fig. 1): West Greenland (‘WG’, n = 37); EastGreenland (‘CG’ n = 3); Jan Mayen (‘CM’, n = 24); Svalbard(‘ES’, n = 16); the Barents Sea (‘EB’, n = 30);Vestfjorden/Lofoten (‘EC’, n = 7); and the North Sea (‘EN’,n = 21). Within the same period additional samples werecollected in Greenland from 32 minke whales. Thesesamples, for which exact information on site and date wasnot available, were grouped together with the three animalsfrom CG to form a mixed CG and WG group, from here onreferred to as ‘GR’ (n = 35).
Fig. 1. Map showing the boundaries of the IWC ‘Small Areas’ and the location of sampling of tissues from a total of 170 minke whales in 1998. Theapproximate summer range of minke whales (Stewart and Leatherwood, 1985; Donovan, 1991a; b) is indicated in grey. The areas west of 57°W(i.e. the central parts of Davis Strait and the Canadian East Coast waters) have not been surveyed systematically and therefore it is not knownwhether or not the distribution of minke whales is continuous between western Greenland and Canada.] Key = WC (West Canada); WG (WestGreenland); CG (Central Greenland); CIC (Central Island Coastal); CIP (Central Iceland Pelagic); CM (Central Jan Mayen); ES (East Svalbard);EB (East Barents Sea); EC (East Coastal); EN (East North Sea).
MØLLER et al.: FATTY ACID COMPOSITION IN COMMON MINKE WHALES116

Samples for analyses were taken only if sub-samplesincluded skin or muscle for correct orientation. Thisselection procedure resulted in deep blubber samples from154 animals and superficial blubber samples from 164animals representing 170 animals. Both the deep andsuperficial blubber were sampled from 148 minke whales.
A deep blubber core including skin and muscle wascollected from each whale and stored at 220°C. The sex ofeach individual was determined genetically (Andersen et al.,2003). The overall percentage of females in the samples was79% ranging between 50% (EC) and 100% (CG).
Sample preparation and fatty acid methyl-estersIn September 1999, sub-samples representing the centre coreof an entire blubber profile were transferred to polyethyleneplastic bags where air was evacuated and samples stored at280°C until analysis. For analysis, sub-samples werethawed and placed on oil-free paper where a 2-3mm thickblubber layer was dissected from (a) immediately under theskin, and (b) adjacent to the muscle core.
Following this procedure, the individual layers weretransferred to thick-walled glass tubes to be sealed withscrew-caps fitted with a silicone-PTFE cap-membrane.Lipids were extracted and FAs trans-esterified to produceFA methyl-esters (FAME) using a one-step method (Sukhijaand Palmquist, 1988) as modified by Møller (1999). FAMEswere stored in air-sealed GC-vials at 280°C until theidentification-analysis could be performed (0-5 days). Toavoid auto-oxidation of unsaturated FAs, all chemicals andheadspace volumes were de-aerated using purified argongas.
To avoid loss of particular volatile short-chained FAs (e.g.isovaleric acid) the use of FA butyl-esters (FABE) instead ofthe commonly used FAME has been recommended.However, analyses on blubber FABE in minke whales haveshown no presence of such volatile FAs (P.M., unpublisheddata) and for convenience FAME (referred to as FAs in thefollowing) were therefore chosen for this study.
FA analysisThe FAs were analysed and identified using a HewlettPackard 5890 gas-chromatograph equipped with asplit/splitless FID detector. A 30 3 0.25mm internaldiameter column coated with 50% cyanopropyl polysiloxane(0.247mm film thickness; J&W DB-23; Folsom California)was used. Helium was used as the inert carrier gas at aconstant flow of 1.2ml/min. Injection- anddetection-temperatures were set at 250°C and the initialcolumn temperature at 65°C. Two minutes after sampleinjection the temperature was increased from 65°C to 165°Cat 20°C/min and held for 0.4min. The temperature was thenincreased to 210°C at 2°C/min, held for 1min, and thenfinally increased to 240°C at 30°C/min and held for 1min.The entire program took 32.9min to complete. The HewlettPackard ChemStation software (HP 3363 Series IIChemStation) performed integration of chromatograms.Identification of most individual FAs was performed usingmethyl-ester standard mixes FIM-FAME-7 and PUFA-3(Matreya, Inc.). FAs of the n-11 and n-9 type were identifiedusing an oil-extract from harbour porpoise blubber of knowncomposition. The integrated area peaks were converted toFA percentage by weight (mass percentage of total FAs)using theoretical correction factors (Craske and Bannon,1988; Møller, 1999). Standards were run before and aftersample-sequences to calibrate the retention times and tomonitor the condition of the column. Individual FAs havebeen named according to the short-hand IUPAC
nomenclature: C(#carbon):(#double bonds)n-x, where x isthe location of the double bond nearest the terminal methylgroup.
Data analysisClassification and Regression Tree analysis (CART),ANOVA and MANOVA available in S-plus© (version 4.5,Mathsoft, Inc.) were used to investigate patterns in the FAsignatures among: (a) IWC ‘Small Areas’; and (b) majorregions i.e. Greenland (CG, WG), the NE Atlantic region(CM, ES, EB and EC pooled) and the North Sea (EN) (Fig.1). In contrast to ANOVA and MANOVA, CARTmultivariate analysis (Clark and Pregibon, 1992; Venablesand Ripley, 1994) is non-parametric and has no restriction asto the number of variables allowed in the model. Thereforethe total array of FAs was tested when using CART. TheCART technique has previously been applied to the analysisof FA signatures containing more than 60 variables (FAs)per observation (Iverson et al., 1997; Smith et al., 1997). Aninitial CART analysis revealed similar patterns for males andfemales and the two genders were therefore pooled insubsequent analyses of spatial differences. The deep blubberand the superficial blubber were analysed separately. Prior toanalysis, the data were arcsin transformed to meet theassumption of normality and homoscedasticity. Forconstruction of the classification trees, two stopping criteriawere used to determine branches: (1) a change in deviationof less than 1% of the root node deviation; or (2) when theminimum number of observations at a node was less than10.
A ‘3-Region model’ and a ‘2-Region model’ as suggestedby the CART analysis was tested further by use ofmultivariable analyses of variance (MANOVA; Wilks l)including a total of 18 FAs. Furthermore, analyses ofvariance (ANOVA) were conducted to indicate the probableimportance of individual FAs included in the MANOVA.These 18 FAs were those responsible for the major splitspicked up by the CART analyses and other FAs of dietaryorigin.
RESULTS
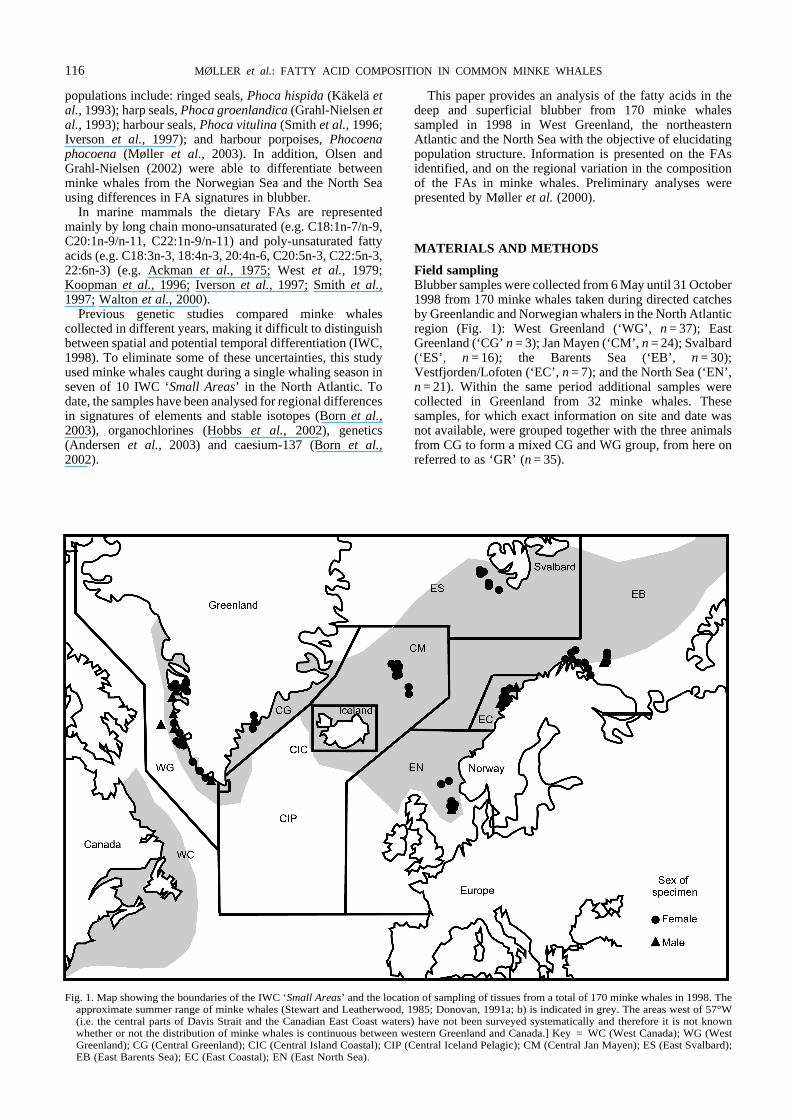
The 43 FAs identified in this study made up 93-99% of totalFAs in the blubber of the minke whales. Of these FAs, thefollowing 16 were generally represented by > 1% on weightbasis: 14:0, 16:0, 16:1n-7, 18:0, 18:1n-11, 18:1n-9, 18:1n-7,18:2n-6, 18:3n-3, 18:4n-3, 20:1n-11, 20:1n-9, 20:5n-3,22:1n-11, 22:5n-3, 22:6n-3 (Table 1).
Regional differences based on CART analysesDeep blubber signaturesBased on the FAs in the deep blubber, the overall percentageof misclassification of individuals to area was 17% (i.e. 26misclassified of 154 analysed, 26/154). The model selected19 of 43 FAs for the construction of a classification tree with19 terminal nodes (Fig. 2). At the root C20:1n-7 formed aninitial split into a NE Atlantic-North Sea group (3/69, 3misclassified of 69 classified) and a NE Atlantic-Greenlandgroup (0/85). Only 3 out of 64 Greenland animals weremisclassified to the NE Atlantic-North Sea group. Inaddition, all 20 North Sea animals were found in this groupwhere all but one could successfully be categorised in a cleanterminal node (0/19). Within the NE Atlantic-Greenlandgroup C18:4n-1 distinguished between NE Atlantic (9/32)and Greenland animals (1/53). In the Greenland group theone misclassified animal was from the neighbouring JanMayen area (CM). In both NE Atlantic sub-groups, Jan
J. CETACEAN RES. MANAGE. 5(2):115–124, 2003 117
����$%���
&�""'���(����)*��("(���+�,%-�!%�)����+./�0��"����-���%,(�"(��/��1�"2%��%%*�����"2%�� *%-1(�(�$��$ ��%-��1�)(�3%�42�$%��
-%*-%�%�"(�!�"2%�"2-%%�-%!(���5�6-%%�$���5�"2%���-"2�7��"%-���"$��"(������"2%���-"2�8%���
6-%%�$���� � ��-"2�7��"%-���"$��"(�� � ��-"2�8%��
&�""'���(�� �%%*� 8 *%-1(�(�$� �%%*� 8 *%-1(�(�$� �%%*� 8 *%-1(�(�$�
������ �����0������ �����0������ �����0������ �����0������ �����0������ �����0������
������ ���#�0����9� �����0������ �����0������ ���:�0������ �����0������ ���:�0������
������ �����0������ �����0������ �����0������ �����0������ ���#�0������ �����0������
��#��� #����0���9;� #����0���#9� 9�9#�0���:#� #��9�0����:� #����0���9#� #��:�0���9��
��#����:� �����0������ �����0������ �����0����9� ���;�0������ ���#�0����9� �����0����#�
��#����9� �����0����9� ��:��0������ ���:�0����9� �����0������ ���:�0������ �����0������
��9��� ���:�0������ �����0����9� �����0����;� �����0������ �����0����9� �����0������
��9����9� ���;�0����9� �����0����#� �����0����:� �����0������ �����0����;� �����0������
��;��� ���:��0������ ��:��0������ �#�#;�0���#9� ��#��0����#� ������0������ :����0����#�
��;����:� :�:��0���#;� ���#9�0���;�� ;����0���9�� ����;�0������ 9�;��0������ ���;;�0���:��
��;����#� ��##�0������ ��9#�0������ �����0������ ���;�0������ ���#�0������ ���9�0������
��:��� ��#��0����9� ���:�0������ ��9��0������ �����0������ �����0������ ���9�0������
��;����#� �����0����9� ���#�0������ �����0������ ��#��0������ �����0������ ��#:�0����#�
��:����:� ���#�0������ �����0������ �����0����;� �����0������ ���9�0����#� ���:�0������
��;�#���� ��#��0����9� �����0������ �����0������ �����0������ �����0����9� ���#�0����9�
������ ��#9�0���;�� ���#�0���##� ��9#�0���::� ��::�0������ ��:9�0���9�� ���#�0���#;�
���������� ��9#�0���:#� ��;��0����#� �����0���;#� ���9�0���;�� ��;��0���;�� ��:��0������
��������� ������0���##� ������0����#� ����9�0�#�##� ����;�0������ ������0���:�� ���;��0������
�������:� ��:��0����#� #�9��0����9� 9����0���:;� #��;�0������ ���#�0������ �����0���;��
�������;� �����0������ ��;#�0����9� �����0����9� �����0������ ���;�0���#�� ���#�0����9�
�������#� �����0����#� �����0����9� ���:�0����#� �����0����9� �����0����#� ���9�0����9�
�������;� �����0������ �����0����9� �����0����#� �����0������ �����0����:� ���;�0����:�
�������#� ���#�0����#� ��;9�0����;� �����0����9� ���9�0������ �����0������ ��#��0����#�
��������� ��9��0����#� ���9�0������ ��;;�0������ �����0������ �����0������ ��#:�0������
����#���� ��;��0���9�� �����0������ �����0���;:� �����0������ �����0���;�� �����0����:�
����#���� ���#�0������ �����0������ �����0����;� �����0������ �����0����:� �����0������
������ ���;�0����;� �����0������ �����0������ �����0����;� ���#�0����;� �����0����:�
���������� �����0������ ��;��0������ ���#�0������ �����0���:�� ���:�0����:� �����0������
��������� ���#��0����#� ������0������ :�#9�0�#���� ���;�0����#� ����:�0����#� ���##�0���9:�
�������:� ��:��0������ ��9��0����9� �����0������ ���9�0����;� �����0����9� ���9�0����#�
�������;� �����0������ �����0����:� ���#�0������ �����0����9� ���;�0����9� �����0����9�
�������;� �����0������ ���9�0����:� �����0����#� �����0����;� �����0����9� ���;�0����9�
����#��;� �����0������ ���;�0������ �����0������ ���:�0������ ��#��0������ ��#��0������
��������� ���:�0������ �����0������ �����0����#� ���:�0����9� �����0����9� �����0������
����#���� �����0������ �����0����;� ���#�0������ �����0������ �����0����;� ���:�0����:�
����9���� ;����0����9� #�9��0���;�� 9�9��0���#:� #����0����#� 9�;��0����;� ��#9�0������
������ ���#�0������ �����0������ �����0������ �����0������ �����0������ �����0������
���������� �����0���#:� :��:�0����#� :����0�#���� ;����0���#�� ���:��0���;#� ������0���#:�
��������� �����0����9� �����0������ ��9;�0����:� ��9��0����;� �����0������ ��;��0������
�������;� ��#��0����;� ���#�0������ ��#��0����:� ���;�0������ ��9#�0����#� ���:�0������
����9���� �����0���;9� ��;#�0���;�� �����0���;9� ��99�0���;�� ��;��0���#;� �����0���:#�
����;���� ;�:9�0���9�� 9����0������ 9��:�0������ #�:��0������ ���;�0���#9� 9�:��0����9�
��#������ ��#��0������ �����0������ �����0������ ���:�0������ ��:��0����9� �����0������
�%�"��&�� ����:�0����9� �;��:�0���;�� �9����0����9� �;��#�0����:� ����#�0����;� �9����0������
��"�(�%�"��&�� ;����0����9� �����0���;�� #����0����9� ��;;�0����:� ;��;�0����;� #����0������
8�)*$%��(<%� ;#� :�� :�� :#� ��� ���
Mayen and Greenland animals (GR and WG) intermingledwhile a lumping of Vestfjorden/Lofoten (EC) and Svalbard(ES) was apparent. The whales from the Barents Sea (EB)showed a more pronounced isolation from the rest of the NEAtlantic (i.e. 0/16 and 1/7). Approximately half of the JanMayen animals were isolated from the rest of the NEAtlantic and lumped together with the North Sea animals.
Superficial blubber signaturesThe CART analysis based on FAs in the superficial blubberresulted in a slightly higher rate of misclassifications(22.0%, 36 misclassified of 164) (Fig. 3) than found for thedeep blubber. The model selected 19 FAs to produce a totalof 20 terminal nodes. At the root node, C18:3n-4distinguished between animals from Greenland and the NE
Atlantic-North Sea with a misclassification rate of 12.2%(20/164). All of the 19 North Sea animals were along the NEAtlantic-North Sea branch where 17 were categorisedcorrectly into a terminal North Sea (EN) node. The onlymisclassification at this node represented an animal from theneighbouring Vestfjorden/Lofoten (EC) area. Similaritiesbetween Jan Mayen (CM) and Greenland animals wereobserved as indicated by a general intermingling betweenanimals from these two areas (Fig. 3).
ConclusionThe FA signatures of both the deep and the superficialblubber indicated: (1) that North Sea minke whales differedfrom those sampled in the northeastern Atlantic (i.e. JanMayen, Svalbard, Barents Sea and Vestfjorden/Lofoten) and
MØLLER et al.: FATTY ACID COMPOSITION IN COMMON MINKE WHALES118
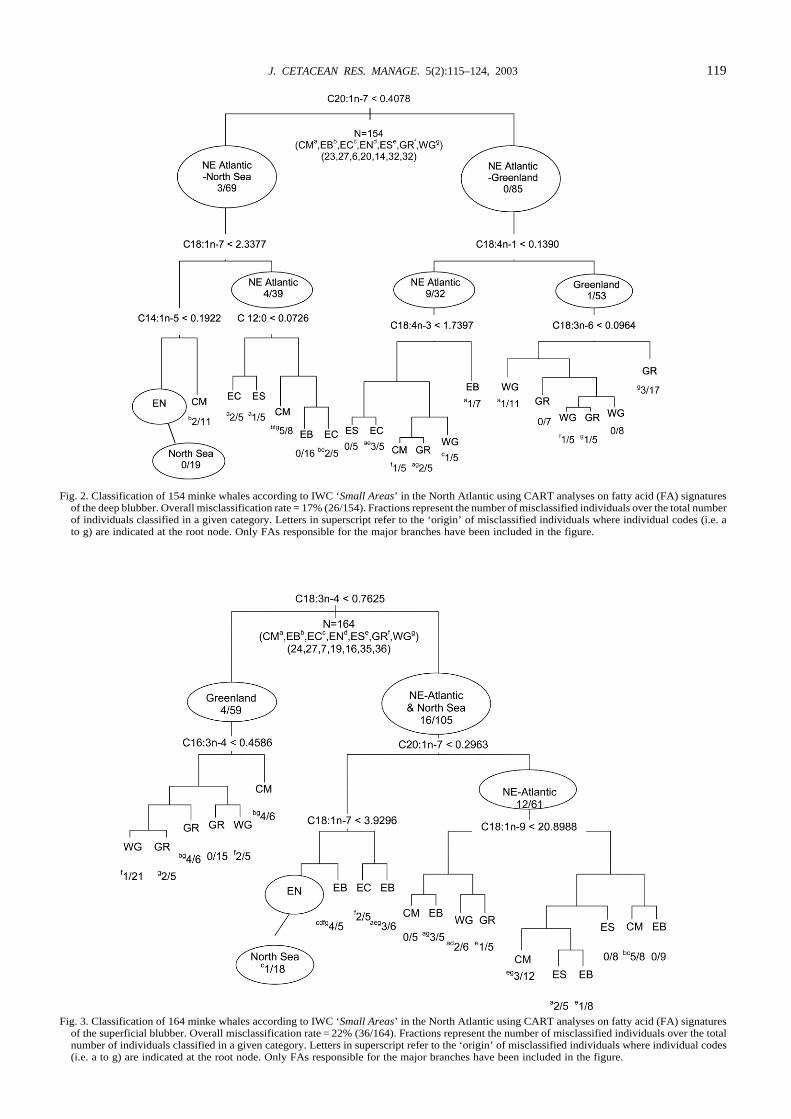
Fig. 2. Classification of 154 minke whales according to IWC ‘Small Areas’ in the North Atlantic using CART analyses on fatty acid (FA) signaturesof the deep blubber. Overall misclassification rate = 17% (26/154). Fractions represent the number of misclassified individuals over the total numberof individuals classified in a given category. Letters in superscript refer to the ‘origin’ of misclassified individuals where individual codes (i.e. ato g) are indicated at the root node. Only FAs responsible for the major branches have been included in the figure.
Fig. 3. Classification of 164 minke whales according to IWC ‘Small Areas’ in the North Atlantic using CART analyses on fatty acid (FA) signaturesof the superficial blubber. Overall misclassification rate = 22% (36/164). Fractions represent the number of misclassified individuals over the totalnumber of individuals classified in a given category. Letters in superscript refer to the ‘origin’ of misclassified individuals where individual codes(i.e. a to g) are indicated at the root node. Only FAs responsible for the major branches have been included in the figure.
J. CETACEAN RES. MANAGE. 5(2):115–124, 2003 119
����$%���
&��'�����$(�)��*�+�",%�%**%�"��*��+%������",%�����%�"+�")����*����*�""(�
��)���)��",%��$ ��%+��*�-)�.%�/,�$%��*+�-�",%���+",��"$��")��0����1������
0�1�2��%%3��$ ��%+�����0�1�2�� 3%+*)�)�$��$ ��%+��
'�+)��$%� �*� 4)$$�)� �33+�5�6� � -��*� �%��-��*� 4�7�$ %�
����
���-�$$��+%��8� �� ��9�#� ��9��� ��� ��9� :��������
���+%��88� �� ��;��� ����;�� ��� ��9� :��������
�%�)� �$�� �9�� � � � � �
<��"%+����+",�=%��
7���<��"$��")��
�� ��;��� ���;� ��� ;�� :��������
�%�)� �$�� ��� � � � � �
����
���-�$$��+%��8� �� ��#��� 9�;�>� ��� �#�� :��������
���+%��88� �� ��>��� ���#��� ��� �#�� :��������
�%�)� �$�� �>�� � � � � �
<��"%+����+",�=%��
7���<��"$��")��
�� ��>��� ��;��� ��� ;�� :��������
�%�)� �$�� ��� � � � � �
�8=)5� !+� 3�� +%3+%�%�")�!� �� �-�$$� �+%��� ���� ��%� /,)�,� +%3+%�%�"��
��)-�$�� *+�-� "/�� �� �-�$$� �+%��� 0)�%�� %�"� ���� <��"� ?+%%�$���1��
88?+%%�$����7����+",�<��"��"$��")��7��<��"%+����+",�=%���
Greenland; and (2) that animals from Greenland watersdiffered from NE Atlantic minke whales; (3) a similaritybetween CM and Greenland; and (4) minke whales from theBarents Sea appeared to be somewhat different from the restof the NE Atlantic. Although the FAs responsible for the treeconstruction differed between blubber layers, the complexityand overall topography of the trees did not.
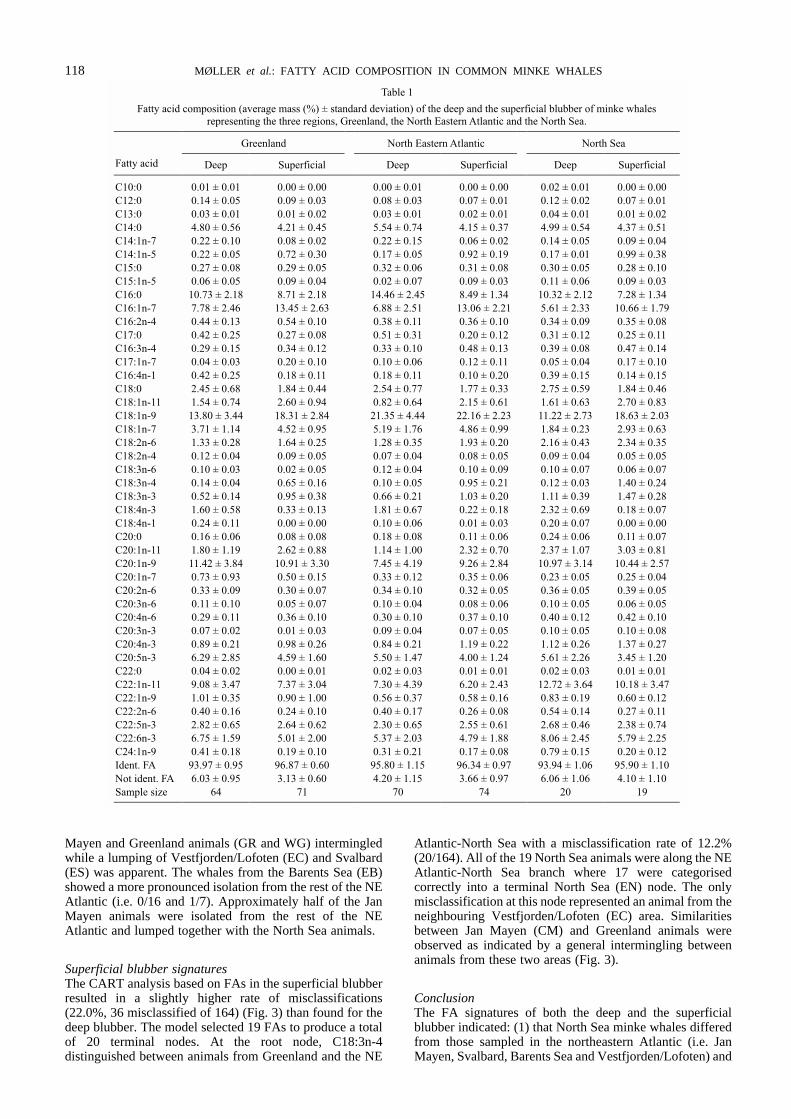
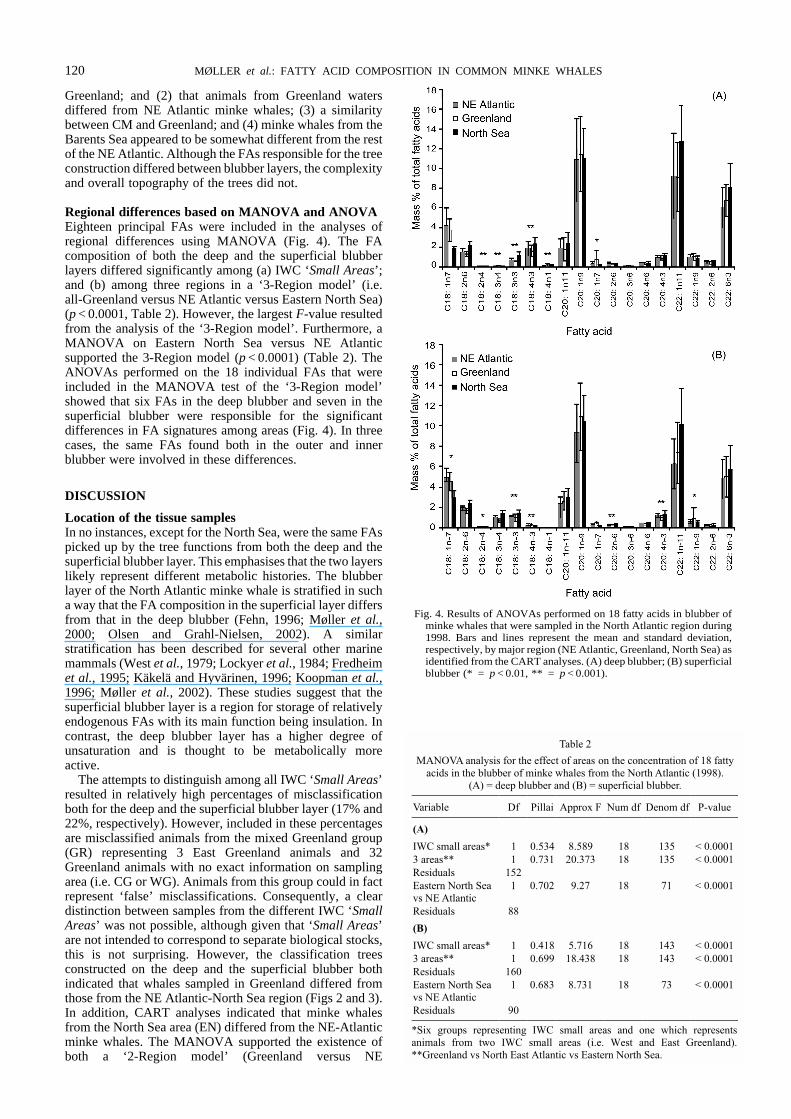
Regional differences based on MANOVA and ANOVAEighteen principal FAs were included in the analyses ofregional differences using MANOVA (Fig. 4). The FAcomposition of both the deep and the superficial blubberlayers differed significantly among (a) IWC ‘Small Areas’;and (b) among three regions in a ‘3-Region model’ (i.e.all-Greenland versus NE Atlantic versus Eastern North Sea)(p < 0.0001, Table 2). However, the largest F-value resultedfrom the analysis of the ‘3-Region model’. Furthermore, aMANOVA on Eastern North Sea versus NE Atlanticsupported the 3-Region model (p < 0.0001) (Table 2). TheANOVAs performed on the 18 individual FAs that wereincluded in the MANOVA test of the ‘3-Region model’showed that six FAs in the deep blubber and seven in thesuperficial blubber were responsible for the significantdifferences in FA signatures among areas (Fig. 4). In threecases, the same FAs found both in the outer and innerblubber were involved in these differences.
DISCUSSION
Location of the tissue samplesIn no instances, except for the North Sea, were the same FAspicked up by the tree functions from both the deep and thesuperficial blubber layer. This emphasises that the two layerslikely represent different metabolic histories. The blubberlayer of the North Atlantic minke whale is stratified in sucha way that the FA composition in the superficial layer differsfrom that in the deep blubber (Fehn, 1996; Møller et al.,2000; Olsen and Grahl-Nielsen, 2002). A similarstratification has been described for several other marinemammals (West et al., 1979; Lockyer et al., 1984; Fredheimet al., 1995; Käkelä and Hyvärinen, 1996; Koopman et al.,1996; Møller et al., 2002). These studies suggest that thesuperficial blubber layer is a region for storage of relativelyendogenous FAs with its main function being insulation. Incontrast, the deep blubber layer has a higher degree ofunsaturation and is thought to be metabolically moreactive.
The attempts to distinguish among all IWC ‘Small Areas’resulted in relatively high percentages of misclassificationboth for the deep and the superficial blubber layer (17% and22%, respectively). However, included in these percentagesare misclassified animals from the mixed Greenland group(GR) representing 3 East Greenland animals and 32Greenland animals with no exact information on samplingarea (i.e. CG or WG). Animals from this group could in factrepresent ‘false’ misclassifications. Consequently, a cleardistinction between samples from the different IWC ‘SmallAreas’ was not possible, although given that ‘Small Areas’are not intended to correspond to separate biological stocks,this is not surprising. However, the classification treesconstructed on the deep and the superficial blubber bothindicated that whales sampled in Greenland differed fromthose from the NE Atlantic-North Sea region (Figs 2 and 3).In addition, CART analyses indicated that minke whalesfrom the North Sea area (EN) differed from the NE-Atlanticminke whales. The MANOVA supported the existence ofboth a ‘2-Region model’ (Greenland versus NE
Fig. 4. Results of ANOVAs performed on 18 fatty acids in blubber ofminke whales that were sampled in the North Atlantic region during1998. Bars and lines represent the mean and standard deviation,respectively, by major region (NE Atlantic, Greenland, North Sea) asidentified from the CART analyses. (A) deep blubber; (B) superficialblubber (* = p < 0.01, ** = p < 0.001).
MØLLER et al.: FATTY ACID COMPOSITION IN COMMON MINKE WHALES120
Atlantic-North Sea) and a ‘3-Region model’ (Greenland vs.NE Atlantic vs the North Sea) model. However, largerF-values were obtained from testing the ‘3-Region model’for both blubber layers thereby favouring this model over the‘2-Region model’. This effectively is in accord with IWC‘Medium Area’ assumptions of three biological stocks (IWC,2004). The MANOVA also indicated that there weresignificant differences among some IWC ‘Small Areas’.However, because a total of 43 FAs were included in theconstruction of classification trees, the CART analyses arethought to be relatively more powerful than the MANOVAin separating among whales sampled in different areas.Differences in FA signatures in this study may have beeninfluenced by the fact that samples may have been takenfrom different parts of the body of the whale. Differences inblubber FA composition between two dorsal sites (30cm infront of and 30cm behind the dorsal fin) have been reportedfor North Atlantic minke whales (Olsen and Grahl-Nielsen,2002). However, this difference was much smaller than thedifference in FA signatures between the deep and superficiallayer (Olsen and Grahl-Nielsen, 2002). No information isavailable about the exact sites from where the samples weretaken and therefore the potential influence of the uncertaintyassociated with the sampling method is difficult to assess.There is no indication that large ( > 7m) and small ( < 7m)whales feed on different food items (Haug et al., 2002), butdifferences according to sexual maturity have beenidentified in harbour porpoise (Møller, 1999) and may alsoinfluence the results of this study to some degree. However,the fact that the findings in this study resemble thoseobtained in a genetic study using the same samples(Anderson et al., 2002) indicates that the FA technique isuseful irrespective of sexual status and the location of theblubber sample on the whale.
Animal movementsThe lack of clear differences among regions could to someextent be explained by some animals moving rapidly amongfeeding grounds. Minke whales are capable of relativelyhigh swimming speeds (i.e. 7-12km/h, Blix and Folkow,1995; Folkow, in litt., 27 April 2000). Therefore, a directedmovement between even distant areas within the range ofthis study may take a minke whale only a few weeks. Hence,a whale may have fed in one area to be sampled not muchlater in another area. Furthermore, the actual lag-timebetween the dietary intake of the FAs and their deposition asa signal in the blubber is not known.
Despite the fact that the composition of FAs in the depotfats of marine mammals is influenced by the composition ofthe diet (e.g. Ackman, 1980), finding a FA composition in apredator identical to that of its diet is unusual (Iverson et al.,1995). This can be explained by an animal’s ability to denovo synthesise and selectively metabolise, absorb anddeposit FAs (Enser, 1984; Sargeant et al., 1988). It is acombination of dietary fats and endogenous synthesis thatinfluences the blubber FA signature. Even though the diet ofNorth Atlantic minke whales has been shown to varyconsiderably between geographic regions and periods (e.g.Haug et al., 2002; Sigurjónsson and Galan, 1990; Lydersenet al., 1991), it is a combination of internal andenvironmental factors that influences the composition of theblubber.
Additional sampling areasIdeally, samples of minke whales from neighbouringCanadian (WC) and Icelandic (CIP and CIC, cf. Fig. 1)waters should have been included in this study. However,
minke whales are currently not harvested by Canada orIceland. Further work on differences in FA signatures toincorporate minke whales from the entire North Atlanticrange of this species is recommended. Samples from areaswhere minke whales are not harvested may in the future beobtained from biopsies taken from free-roaming whales.Knowledge of the metabolism of the blubber, the turnoverrate of FAs, and the effect of e.g. physiological state andreproductive status of the individual may significantlyadvance the feasible use of FA signatures as a tool inpopulation studies.
The influence of foragingBlubber FA signatures may reflect major and sometimeseven minor differences in the diet (e.g. Iverson et al., 1997;Møller et al., 2003). Within the range covered by this study,there are major differences in food available to andconsequently eaten by minke whales. Minke whalesconcentrate on traditional summer feeding grounds (Solvik,1976; Harwood, 1990) where they feed in shallow shelfareas in association with highly productive frontal regimes(Mann and Lazier, 1991). In the Northern Hemisphere nosingle organism forms a predominant food supply in theminke whale diet. The complex oceanography andbathymetry of the North Atlantic (Mackintosh, 1965) can inpart explain this heterogeneity. Minke whales differmarkedly among the regions within the range of this studywith respect to diet (Folkow et al., 2000; Neve, 2000; Olsenand Holst, 2001; Haug et al., 2002). Capelin (Mallotusvillosus) is an important food for minke whales in WestGreenland waters whereas polar cod (Boreogadus saida)seems to be of relatively greater importance in easternGreenland (Neve, 2000). Generally, the minke whale foodcomposition in Greenland waters resembles that reported forIcelandic nearshore waters where capelin and sand eel(Ammodytes sp.) made up ca 56% and krill (mainlyThysanoessa sp.) ca 35% of the food on weighted frequencybasis (Sigurjónsson et al., 2000).
Studies of minke whale diet in the Northeast Atlantic overthe period 1992-1999 showed that the food comprised ofrelatively few species and that the dietary compositionvaried considerably both in space and time, presumably dueto geographic differences in the distribution and abundanceof potential prey (Haug et al., 2002). In general, the whalesfind capelin and herring (Clupea harengus) and,occasionally, krill more preferably than other prey, whichusually comprised of gadoid fish (cod, Gadus morhua;saithe, Pollachius virens and haddock, Melanogrammusaeglefinus). In the northeastern Atlantic, regional differencesin stomach contents were found. Consumption of herringwas almost exclusively confined to the Vestfjorden/Lofoten(EC) and the Barents Sea (EB) areas whereas consumptionof krill was most pronounced in the Svalbard (ES) area(Folkow et al., 2000). In the latter area, capelin wasimportant prior to the collapse of the Barents Sea capelinstock in 1992-1993 (Haug et al., 2002). In 1999, herring wasa predominant food item in the Norwegian Sea whereas sandeel dominated (86.6% by weight) the minke whale food inthe North Sea. In this latter area, mackerel (Scomberscombrus) made up 9.3% and other fish (e.g. herring) theremainder of food items (Olsen and Holst, 2001). These diets(stomach contents) are very different from those inGreenland waters where cod (Gadus sp.) has only beenreported in a limited number of stomachs and herring in none(cf. Neve, 2000). The cod stock in Greenland during the1990s has been very small (Anon., 2001) and herring,mackerel, saithe and haddock are almost absent (H.
J. CETACEAN RES. MANAGE. 5(2):115–124, 2003 121
Hovgård, Danish Fisheries Institute, DFU, pers. comm.,2001).
Although minke whales are euryphagous, and despite thefact that there are both inter-annual and inter-seasonalvariation in their food, it is clear that their overall foodselection is determined by prominent regional differences inthe distribution and abundance of various prey types. Likely,these regional differences in prey availability are recorded asdifferences in signatures of FAs in the blubber of the minkewhales. We believe that differerences in the foragingecology of minke whales among regions is recorded in theblubber layers. The deep layer likely provides a record of amore recent history in contrast to an older history recorded inthe superficial blubber. However, there are no comparabledata on regional differences in FAs in the fish species or inother prey of minke whales to allow for a thoroughdiscussion on the trophic importance of the signatures foundin the minke whales (e.g. Dietz et al., 1998).
Comparison with other studiesOnly one other study exists on regional differences inblubber FA signatures in North Atlantic baleen whales.Olsen (2002) used FAs to differentiate between minkewhales sampled in the North Sea and the Norwegian Sea in1999. The findings by Olsen (2002) supported the results ofMøller et al. (2002) and this study, that minke whales fromthe North Sea constitute a group that is different from thosesummering further north in the NE Atlantic region.
The present study indicates the existence of populationsub-structuring in North Atlantic minke whales on a largegeographical scale. This is in accordance with other studiesusing the same material from 1998 but applying differentanalytical techniques. Genetic analyses, which included bothmitochondrial and nuclear DNA suggested the existence offour genetically distinct subpopulations: (1) WestGreenland; (2) East Greenland and Jan Mayen; (3) NorthEast Atlantic (Svalbard, Barents Sea Vestfjorden/Lofoten);and (4) the North Sea (2002). Andersen et al. (2002) hadaccess to a larger sample from East Greenland than thepresent study, which only included three samples from thisregion. This is the likely explanation for Andersen et al.’s(2002) finding that CG constitutes a separate unit.
A regional comparison of PCBs and organochlorine (OC)pesticides showed that minke whales from the Barents Sea(EB) had significantly higher concentrations of SPCBs thanthose from the Vestfjorden/Lofoten, the North Sea andSvalbard, as well as significantly higher SDDTconcentrations compared to West Greenland animals (Hobbset al., 2002). The similarities and differences inconcentrations suggested that minke whales from WestGreenland and East Greenland represent one group ofwhales, distinct from both the Jan Mayen minke whales andthose from other IWC defined stocks within the rangecovered by the present study. However, principal componentanalysis using proportions of OCs did not reveal any majordifferences among groups. With the exception of the BarentsSea and West Greenland, there was a general similarity inmean levels and proportions of OC contaminants amongminke whales in the northeastern Atlantic suggesting that theminke whales are quite mobile and may feed in multipleareas.
Multivariate and principal component analyses ofsignatures of stable isotopes of Pb, C and N and 19 otherelements in muscle, kidney, liver and baleen of the minkewhales that were sampled in 1998 suggested the existence ofsub-structuring of the minke whale population within theexplored geographical range. In particular, minke whales in
West Greenland, the North Sea and the Vestfjorden/Lofotenareas appeared to be different from those in other areas(Born, et al., 2003). Finally, Born et al. (2002) found thehighest caesium-137 concentration in minke whales from theNorth Sea, and that the mean Cs-137 levels in minke whalesfrom Svalbard and the North Sea differed significantly frommean levels in the other areas. This difference supports theindications from other studies that groups of minke whalesare resident for some time at their feeding grounds in theNorth Atlantic and may occur in separate stocks duringsummer.
ACKNOWLEDGEMENTS
The present project has received financial support from theDanish Environmental Protection Agency as part of theenvironmental support programme Dancea – DanishCooperation for Environment in the Arctic. The authors aresolely responsible for all results and conclusions presented inthe report, and do not necessary reflect the position of theDanish Environmental Protection Agency. The GreenlandInstitute of Natural Resources and the Danish NationalEnvironmental Research Institute also funded this study.
We wish to thank the Greenland and Norwegianfishermen and hunters and others who helped collecting thesamples. The cooperation during the sampling phase withthe Directorate of Fisheries (Nuuk) and KNAPK(Association of Greenland Hunters and Fishermen) is greatlyacknowledged. Thanks to Sofie Jeremiassen and KirstenRydahl (Greenland Institute of Natural Resources) and toSigga Joensen, Else Marie Nielsen and Maja Kirkegaard(Danish Environmental Research Institute, Roskilde) forvarious help during the sampling and preparation of thesamples. We gratefully acknowledge the constructivecriticism offered by Dr Sara J. Iverson (DalhousieUniversity, Nova Scotia, Canada) and an anonymousreviewer.
REFERENCES
Ackman, R.G. 1980. Lipids in fish. pp. 86-103. In: J.J. Connell (ed.)Advances in Fish Science and Technology. Fishing New Books,Farnham, Surrey.
Ackman, R.G., Hingley, J.H., Eaton, C.A., Logan, V.H. and Odense,P.H. 1975. Layering and tissue composition in the blubber of thenorthwest Atlantic sei whale (Balaenoptera borealis). Can. J. Zool.53:1340-4.
Anderson, L.W., Born, E.W., Dietz, R., Haug, T., Øien, N. andBendixen, C. 2003. Genetic population structure of minke whales(Balaenoptera acutorostrata) from Greenland, the North EastAtlantic and the North Sea probably reflects different ecologicalregions. Mar. Ecol. Prog. Ser. 247:263-80.
Anonymous. 2001. Report of the ICES Advisory Committee onFisheries Management, 2000. ICES Co-operative Research ReportNo. 242. 911pp. [Available from: http://www.ices.dk].
Bakke, I., Johansen, S., Bakke, O. and El-Gewely, M.R. 1996. Lack ofpopulation subdivision among the minke whales from Icelandic andNorwegian waters based on mitochondrial DNA sequences. Mar.Biol. 125:1-9.
Blix, A.S. and Folkow, L.P. 1995. Daily energy expenditure in freeliving whales. Acta Physiol. Scand. 153:61-6.
Born, E.W., Outridge, O., Riget, F.F., Hobson, K., Dietz, R., Øien, N.and Haug, T. 2003. Population structure of North Atlantic minkewhales (Balaenoptera acutorostrata) inferred from regionalvariation of elemental and stable isotope signatures in tissues. J. Mar.Syst. 43:1-17.
Born, W.E., Dahlgard, H., Riget, F.F., Dietz, R., Øien, N. and Haug, T.2002. Regional variation of caesium-137 in minke whalesBalaenoptera acutorostrata from West Greenland, the NortheastAtlantic and the North Sea. Polar Biol. 25:907-13.
Christensen, I., Haug, T. and Wiig, Ø. 1990. Morphometric comparisonof minke whales Balaenoptera acutorostrata from different areas ofthe North Atlantic. Mar. Mammal Sci. 6(4):327-38.
MØLLER et al.: FATTY ACID COMPOSITION IN COMMON MINKE WHALES122
Clark, L.A. and Pregibon, D. 1992. Tree-based models. pp. 377-419.In: J.M. Chambers and T.J. Hastie (eds.) Statistical Models in S.Chapman and Hall, New York. 608pp.
Craske, J.D. and Bannon, C.D. 1988. Letter to the editor. J. Am. OilChem. Soc. 65(7):1190.
Dietz, R., Pacyna, J., Thomas, D.J., Asmund, G., Gordeev, V.,Johansen, P., Kimstach, V., Lockhart, L., Pfirman, S.L., Riget, F.F.,Shaw, G., Wagemann, R. and White, M. 1998. Chapter 7: Heavymetals. pp. 373-524. In: AMAP Assessment Report: Arctic PollutionIssues. Arctic Monitoring and Assessment Programme, Oslo,Norway.
Donovan, G.P. 1991a. Report of the sub-committee on North Atlanticminke whales, Appendix 5. Distribution of sightings of minkewhales in the North Atlantic. Rep. int. Whal. Commn 41:150-1.
Donovan, G.P. 1991b. A review of IWC stock boundaries. Rep. int.Whal. Commn (special issue) 13:39-68.
Enser, M. 1984. The chemistry, biochemistry and nutritionalimportance of animal fats. pp. 23-51. In: J. Wiseman (ed.) Fats inAnimal Nutrition. Butterworths, London.
Fehn, T.H. 1996. Fettsyrer i vågehval. MSc Thesis, University ofBergen, Norway. 73pp.
Folkow, L.P., Haug, L., Nilssen, K.T. and Nordøy, E.S. 2000.Estimated food consumption of minke whales Balaenopteraacutorostrata in Northeast Atlantic waters in 1992-1995. NAMMCOScientific Publications 2:65-80.
Fredheim, B., Holen, S., Ugland, K.I. and Grahl-Nielsen, O. 1995.Fatty acid composition in blubber, heart and brain from phocid seals.pp. 153-68. In: A.S. Blix, L. Walløe and Ø. Ulltang (eds.) Whales,Seals, Fish and Man. Elsevier Science, Amsterdam. 720pp.
Grahl-Nielsen, O., Mjaavatten, O. and Tvedt, E. 1993. Distinguishingbetween populations of the harp seal Pagophilus groenlandicus(Erxleben 1777), by chemometry of the fatty acid profile in selectedtissues. Can. J. Fish. Aquat. Sci. 50:1,400-404.
Grønvik, S. 1998. Norway. Progress report on cetacean resarch, withstatistical data for the calendar year 1996. Rep. int. Whal. Commn48:340-51.
Harwood, J. 1990. Are scientific quotas needed for the assessment ofwhale stocks? Mammal Rev. 20(1):13-6.
Haug, T., Linstrom, U. and Nilssen, K.T. 2002. Variations in minkewhale Balaenoptera acutorostrata diets in response to ecosystemchanges in the Barents Sea. Sarsia 87:409-22.
Hobbs, K.E., Muir, D.C.G., Born, E.W., Dietz, R., Haug, T., Metcalfe,T., Metcalfe, C. and Øien, N. 2002. Levels and patterns of persistentorganochlorines in minke whale (Balaenoptera acutorostrata)stocks from the North Atlantic and European Arctic. Environ. Poll.121:239-52.
International Whaling Commission. 1993. Report of the ScientificCommittee, Annex F. Report of the sub-committee on North Atlanticbaleen whales. Rep. int. Whal. Commn 43:115-29.
International Whaling Commission. 1994. Report of the ScientificCommittee, Annex K. Area definitions for RMP implementations.Rep. int. Whal. Commn 44:175-6.
International Whaling Commission. 1998. Report of the ScientificCommittee. Annex T. New genetic information relevant to WestGreenland management advice. Rep. int. Whal. Commn 48:296.
International Whaling Commission. 1999. Report of the ScientificCommittee. Annex N. The Revised Management Procedure (RMP)for baleen whales. J. Cetacean Res. Manage. (Suppl.) 1:251-8.
International Whaling Commission. 2003. Chair's Report of theFifty-Fourth Annual Meeting. Annex C. Report of the aboriginalsubsistence whaling sub-committee. Ann. Rep. Int. Whaling Comm.2002:62-75.
International Whaling Commission. 2004. Report of the ScientificCommittee. J. Cetacean Res. Manage. (Suppl.) 6:In press.
Iverson, S.J., Oftedal, O.T., Bowen, W.D., Boness, D.J. and Sampugna,J. 1995. Prenatal and postnatal transfer of fatty acids from mother topup in the hooded seal. J. Comp. Physiol. B 165:1-12.
Iverson, S.J., Frost, K.J. and Lowry, L.F. 1997. Fatty acid signaturesreveal fine scale structure of foraging distribution of harbor seals andtheir prey in Prince William Sound, Alaska. Mar. Ecol. Prog. Ser.151:255-71.
Käkelä, R. and Hyvärinen, H. 1996. Site-specific fatty acidcomposition in adipose tissue of several northern aquatic andterrestrial mammals. Comp. Biochem. Physiol. B 115:501-14.
Käkelä, R., Hyvärinen, H. and Vainiotalo, P. 1993. Fatty acidcomposition in liver and blubber of the Saimma ringed seal (Phocahispida saimensis) compared with that of the ringed seal (Phocahispida botnica) and grey seal (Halichoerus grypus) from the Baltic.Comp. Biochem. Physiol. 105B(1993):553.
Koopman, H.N., Iverson, S.J. and Gaskin, D.E. 1996. Stratification andage-related differences in blubber fatty acids of the male harbour
porpoise (Phocoena phocoena). J. Comp. Physiol. B165(8):628-39.
Larsen, F. and Øien, N. 1988. On the discreteness of stocks of minkewhales at East and West Greenland. Rep. int. Whal. Commn38:251-5.
Lockyer, C., McConnell, L.C. and Waters, T.D. 1984. The biochemicalcomposition of fin whale blubber. Can. J. Zool. 62:2553-62.
Lydersen, C., Weslawski, J.M. and Øritsland, N.A. 1991. Stomachcontent analysis of minke whales (Balaenoptera acutorostrata) fromthe Lofoten and Vesterålen areas, Norway, August 1988. Holarct.Ecol. 14:219-22.
Mackintosh, N.A. 1965. The Stocks of Whales. Fishing News (Books)Ltd, London. 232pp.
Mann, K.H. and Lazier, J.R.N. 1991. Dynamics of Marine Ecosystems.Blackwell Scientific Publications, Cambridge, MA. 467pp.
Møller, P. 1999. Distinguishing between foraging patterns and sexualmaturity of harbour porpoise (Phocoena phocoena) utlilisingblubber fatty acid signature and classification regression analysis.MSc Thesis, Århus University, Denmark. 89pp.
Møller, P., Born, E.W., Dietz, R., Ruzzante, D., Haug, T. and Øien, N.2000. Differences in fatty acid composition of blubber in minkewhales (Balaenoptera acutorostrata) from Greenland, the NEAtlantic Ocean and the North Sea, 1998. Paper SC/52/AS9 presentedto the IWC Scientific Committee, June 2000, Adelaide, Australia.[Paper available from the Office of this Journal].
Møller, P., Lockyer, C. and Lund, T. 2002. Evidence of a defined shiftin the fatty acid composition along the blubber profile of harborporpoise, Phocoena phocoena: the physiological significance. Mar.Mammal Sci. :Submitted.
Møller, P., Lockyer, C., Walton, M., Lund, T., Heide-Jørgensen, M.P.,Jensen, J. and Andreasen, H. 2003. Distinguishing between foragingpatterns and sexual maturity of harbour porpoise utilising blubberfatty acid signature. J. Cetacean Res. Manage. :In prep.
Neve, P.B. 2000. The diet of the minke whale in Greenland 2 A shortreview. NAMMCO Scientific Publications 2:92-6.
Olsen, E. 1997. A study of the reproductive potential of North Atlanticminke whales (Balaenoptera acutorostrata, Lacépède 1804) in theperiod 1972-79. Master Thesis, University of Bergen, Bergen,Norway. 76pp.
Olsen, E. 2002. Age determination of minke whales. Ph.D. Thesis,University of Bergen, Norway. 176pp.
Olsen, E. and Grahl-Nielsen, O. 2002. Blubber fatty acids of minkewhales: stratification, population identification and relation to diet.Can. J. Fish. Aquat. Sci. :Submitted.
Olsen, E. and Holst, J.C. 2001. A note on common minke whale(Balaenoptera acutorostrata) diets in the Norwegian Sea and NorthSea. J. Cetacean Res. Manage. 3(2):179-83.
Palsboll, P.J., Bérubé, M., Haug, T., Heiberg, A.C., Larsen, F., Sears, R.and Sigurjonsson, J. 1997. Preliminary analysis of population geneticdata obtained from North Atlantic minke whales, Balaenopteraacutorostrata. Paper SC/49/NA4 presented to the IWC ScientificCommittee, September 1997, Bournemouth (unpublished). 17pp.[Paper available from the Office of this Journal].
Sargeant, J.R., Henderson, R.J. and Tocher, D.R. 1988. The lipids. pp.153-218. In: J.E. Halver (ed.) Fish Nutrition. 2nd. Edn. AcademicPress, San Diego, CA.
Sigurjónsson, J. and Galan, A. 1990. Some information on stomachcontents of minke whales (Balaenoptera acutorostrata) in Icelandicwaters. Paper SC/42/NHMi28 presented to the IWC ScientificCommittee, June 1990 (unpublished). 6pp. [Paper available from theOffice of this Journal].
Sigurjónsson, J., Galan, A. and Víkingsson, G.A. 2000. A note onstomach contents of minke whales (Balaenoptera acutorostrata) inIcelandic waters. NAMMCO Scientific Publications 2:82-90.
Smith, R.J., Hobson, K.E., Koopman, H.N. and Lavigne, D.M. 1996.Distinguishing between populations of fresh- and salt-water harbourseals (Phoca vitulina) using stable-isotope ratios and fatty acidprofiles. Can. J. Fish. Aquat. Sci. 53:272-9.
Smith, S.J., Iverson, S.J. and Bowen, W.D. 1997. Fatty acid signaturesand classification trees: new tools for investigating the foragingecology of seals. Can. J. Fish. Aquat. Sci. 54:1377-86.
Solvik, O.-V. 1976. The minke whale, Balaenoptera acutorostrata(Lacépède), in the North Atlantic. Paper NA 76/10 presented to theIWC Scientific Committee Working Group Meeting on NorthAtlantic Whales, April 1976 (unpublished). 112pp. [Paper availablefrom the office of this Journal].
Stewart, B.S. and Leatherwood, S. 1985. Minke whale 2 Balaenopteraacutorostrata Lacépède, 1804. pp. 91-136. In: S.H. Ridgway and R.Harrison (eds.) Handbook of Marine Mammals. Vol. 3. The
J. CETACEAN RES. MANAGE. 5(2):115–124, 2003 123

Sirenians and the Baleen Whales. Academic Press, London andOrlando. xviii+362pp.
Sukhija, P.S. and Palmquist, D.L. 1988. Rapid method fordetermination of total fatty acid content and composition offeedstuffs and feces. J. Agric. Food Chem. 36:1202-6.
Venables, W.N. and Ripley, B.D. 1994. Tree-based models. pp. 329-48.In: W.N. Venables and B.D. Ripley (eds.) Modern Applied Statisticswith S-Plus. Springer-Verlag, Heidelberg. 462pp.
Walton, M.J., Henderson, R.J. and Pomeroy, P.P. 2000. Use of blubberfatty acid profiles to distinguish dietary differences between greyseals Halichoerus grypus from two UK breeding colonies. Mar.Ecol. Prog. Ser. 193:201-8.
West, G.C., Burns, J.J. and Modafferi, M. 1979. Fatty acid compositionof Pacific walrus skin and blubber fats. Can. J. Zool. 57:1249-55.
Date received: September 2000.Date accepted: December 2002.
MØLLER et al.: FATTY ACID COMPOSITION IN COMMON MINKE WHALES124
Copyright © 2022 FDOKUMEN