Vessel traffic disrupts the foraging behavior of southern resident killer whales Orcinus orca
11
ENDANGERED SPECIES RESEARCH Endang Species Res Vol. 6: 211–221, 2009 doi: 10.3354/esr00154 Printed March 2009 Published online January 2, 2009 INTRODUCTION The eastern North Pacific southern resident stock of killer whales Orcinus orca declined to fewer than 80 individuals in 2001, resulting in their listing as ‘depleted’ under the Marine Mammal Protection Act and ‘endangered’ under the United States and Wash- ington State Endangered Species Acts, and Canada’s Species at Risk Act. The causes of this decline are uncertain, but many scientists consider a combination of reduction in prey resources, toxic chemicals, distur- bance from vessel traffic, and other factors to have con- tributed (Krahn et al. 2004, Wiles 2004, Killer Whale Recovery Team 2005). Krahn et al. (2004) noted that the southern resident killer whale population increased at an normal rate in the late 1980s (~3% yr –1 ). Growth began to slow in the early 1990s and was followed by a decline of 20% from 1996 to 2001. This stock is composed of 3 social units (pods). J and K pods exhibited little change in number during this period, in contrast to the expected growth. In contrast, the L pod not only failed to grow, but it declined, and this decline resulted in the decline in number of the entire population. Factors in the inshore waters of Washington and British Columbia, such as declines in prey abundance, toxins, and vessel traffic may be responsible for the lack of growth in all 3 pods. Differences in usage patterns of the inshore waters © Inter-Research 2009 · www.int-res.com * *Email: [email protected], **These authors contributed equally to this article and can be considered joint first authors Vessel traffic disrupts the foraging behavior of southern resident killer whales Orcinus orca David Lusseau 1, * , **, David E. Bain 2, **, Rob Williams 3, 5 , Jodi C. Smith 4 1 University of Aberdeen, Institute of Biological and Environmental Sciences, Tillydrone Ave, Aberdeen AB24 2TZ, UK 2 University of Washington, Friday Harbor Laboratories, 620 University Road, Friday Harbor, Washington 98250, USA 3 Sea Mammal Research Unit, Gatty Marine Laboratory, St Andrews University, St Andrews, Fife KY16 8LB, UK 4 Coastal-Marine Research Group, Institute of Natural Resources, Massey University at Albany, Private Bag 102 904, North Shore MSC, New Zealand 5 Present address: Marine Mammal Research Unit, University of British Columbia, 2202 Main Mall, Vancouver, British Columbia V6T 1Z4, Canada ABSTRACT: Vessel traffic may have contributed to southern resident killer whales Orcinus orca becoming endangered. To determine the importance of this threat, we measured the behavior of southern residents in the presence and absence of vessels from 2003 to 2005 at 2 different sites along San Juan Island, Washington, USA. We observed activity states of killer whale schools using scan sampling and collected information on the number of vessels present at various distances from those. We use first-order, time-discrete Markov chains to estimate state-transition probability matrices under varying boat exposure conditions. Transition probabilities between activity states were signif- icantly affected by vessel traffic. In addition, there was a reduction in time spent foraging, as esti- mated from the stationary state budget from the Markov chains, confirming an effect also previously observed in northern resident killer whales. If reduced foraging effort results in reduced prey cap- ture, this would result in decreased energy acquisition. Each school was within 400 m of a vessel most of the time during daylight hours from May through September. The high proportion of time south- ern resident killer whales spend in proximity to vessels raises the possibility that the short-term behavioral changes reported here can lead to biologically significant consequences. KEY WORDS: Whale watching · Killer whale · Disturbance · Behavioral disruption · Foraging Resale or republication not permitted without written consent of the publisher OPEN PEN ACCESS CCESS
-
Upload
independent -
Category
Documents
-
view
1 -
download
0
Transcript of Vessel traffic disrupts the foraging behavior of southern resident killer whales Orcinus orca
ENDANGERED SPECIES RESEARCHEndang Species Res
Vol. 6: 211–221, 2009doi: 10.3354/esr00154
Printed March 2009Published online January 2, 2009
INTRODUCTION
The eastern North Pacific southern resident stock ofkiller whales Orcinus orca declined to fewer than 80individuals in 2001, resulting in their listing as‘depleted’ under the Marine Mammal Protection Actand ‘endangered’ under the United States and Wash-ington State Endangered Species Acts, and Canada’sSpecies at Risk Act. The causes of this decline areuncertain, but many scientists consider a combinationof reduction in prey resources, toxic chemicals, distur-bance from vessel traffic, and other factors to have con-tributed (Krahn et al. 2004, Wiles 2004, Killer WhaleRecovery Team 2005).
Krahn et al. (2004) noted that the southern residentkiller whale population increased at an normal rate inthe late 1980s (~3% yr–1). Growth began to slow in theearly 1990s and was followed by a decline of 20% from1996 to 2001. This stock is composed of 3 social units(pods). J and K pods exhibited little change in numberduring this period, in contrast to the expected growth.In contrast, the L pod not only failed to grow, but itdeclined, and this decline resulted in the decline innumber of the entire population. Factors in the inshorewaters of Washington and British Columbia, such asdeclines in prey abundance, toxins, and vessel trafficmay be responsible for the lack of growth in all 3 pods.Differences in usage patterns of the inshore waters
© Inter-Research 2009 · www.int-res.com**Email: [email protected],**These authors contributed equally to this article and can be
considered joint first authors
Vessel traffic disrupts the foraging behavior ofsouthern resident killer whales Orcinus orca
David Lusseau1,*,**, David E. Bain2,**, Rob Williams3, 5, Jodi C. Smith4
1University of Aberdeen, Institute of Biological and Environmental Sciences, Tillydrone Ave, Aberdeen AB24 2TZ, UK2University of Washington, Friday Harbor Laboratories, 620 University Road, Friday Harbor, Washington 98250, USA
3Sea Mammal Research Unit, Gatty Marine Laboratory, St Andrews University, St Andrews, Fife KY16 8LB, UK4Coastal-Marine Research Group, Institute of Natural Resources, Massey University at Albany, Private Bag 102 904,
North Shore MSC, New Zealand
5Present address: Marine Mammal Research Unit, University of British Columbia, 2202 Main Mall, Vancouver,British Columbia V6T 1Z4, Canada
ABSTRACT: Vessel traffic may have contributed to southern resident killer whales Orcinus orcabecoming endangered. To determine the importance of this threat, we measured the behavior ofsouthern residents in the presence and absence of vessels from 2003 to 2005 at 2 different sites alongSan Juan Island, Washington, USA. We observed activity states of killer whale schools using scansampling and collected information on the number of vessels present at various distances from those.We use first-order, time-discrete Markov chains to estimate state-transition probability matricesunder varying boat exposure conditions. Transition probabilities between activity states were signif-icantly affected by vessel traffic. In addition, there was a reduction in time spent foraging, as esti-mated from the stationary state budget from the Markov chains, confirming an effect also previouslyobserved in northern resident killer whales. If reduced foraging effort results in reduced prey cap-ture, this would result in decreased energy acquisition. Each school was within 400 m of a vessel mostof the time during daylight hours from May through September. The high proportion of time south-ern resident killer whales spend in proximity to vessels raises the possibility that the short-termbehavioral changes reported here can lead to biologically significant consequences.
KEY WORDS: Whale watching · Killer whale · Disturbance · Behavioral disruption · Foraging
Resale or republication not permitted without written consent of the publisher
OPENPEN ACCESSCCESS
Endang Species Res 6: 211–221, 2009
among the different pods (Bigg et al. 1990, Olesiuk etal. 1990, Osborne 1999, Hauser et al. 2006) mayaccount for some of the additional decline experiencedby the L pod alone, but factors external to these watersare likely to be of similar importance to factors ininshore waters (regional differences in prey abun-dance [Protected Resources Division 2004], perhapsentanglement, and exposure to oil, among others).
Vessel traffic may have contributed to the declinethrough a variety of mechanisms. Collisions betweenvessels and killer whales occur occasionally in resi-dents, including southern residents, and other killerwhales and result in injury or death (Ford et al. 2000,G. M. Ellis pers. comm.). Unburned fuel and exhaustfrom vessels may contribute to toxin load. The pres-ence of noise from vessels may contribute to stress(Romano et al. 2004). Noise from vessel traffic maymask echolocation signals (Bain & Dahlheim 1994,Erbe 2002), reducing foraging efficiency. Behavioralresponses may result in increased energy expenditure,or disrupt feeding activity, which may reduce energyacquisition (Bain 2002, Williams et al. 2006). Energeticmechanisms for impact are of particular concern, sincesouthern resident killer whales may be food limited.
Repeated disturbance of wild animals is implicatedas a factor reducing the quality of life, foraging effi-ciency, fitness, or reproductive success of individualanimals. Studies link anthropogenic disturbance tochanges in foraging behavior (e.g. Galicia & Baldas-sare 1997), reproductive success (e.g. Safina & Burger1983), and mating system and social structure (e.g.Lacy & Martins 2003). These, in turn, either singly orsynergistically, can influence population dynamics andviability (Lusseau et al. 2006). Effects of vessel traffichave been studied in a range of cetacean species.Effects vary within and between species, and includedchanges in respiration patterns, surface active behav-iors, swimming velocity, vocal behavior, activity state,inter-individual spacing, wake riding, approach andavoidance, and displacement from habitat. Williams etal. (2006) found northern residents were less likely toforage in the presence vessels. Vessel traffic can alsodisplace bottlenose dolphins (Lusseau 2005, Bejder etal. 2006) and significantly alter their behavioral budget(Lusseau 2004).
In the San Juan and Gulf Islands region, the com-mercial whale-watching day runs from about 09:00 to21:00 h in summer, and until sunset in spring and earlyfall. In addition to commercial whale-watching vessels,other vessels are also in contact with whales through-out the day. These include recreational and researchvessels, cruise ships, sport and professional fishingvessels, and intermittently commercial freight ships.Due to the variety of vessels observed in the presenceof whales, the term whale watching as used in the pre-
sent paper refers to all whale-oriented vessel traffic,regardless of whether the vessels are commercialwhale-watching vessels or not. Because these whalesare in the presence of vessels during much of the day,the potential for cumulative effects makes it importantto investigate whether the behavior of killer whales isaltered in the presence of vessels.
Assessing variation in behavior under different con-ditions is difficult, due to the inherent temporaldynamics of activity states, as they tend to occur inbouts. We used Markov chains to quantify this tempo-ral dependence and assess how exposure conditionschanged it (Cane 1959, Lusseau 2003). The same tem-poral biases inherent to behavioral data mean that sim-ple tallies of state samples observed under differentboat conditions will not represent the true behavioralbudget of the population under these exposure condi-tions (Guttorp 1995, Lusseau 2003). However, we caninfer these budgets from the stationary behavior of theMarkov chains developed for each exposure condition.
Here, we assess whether boat traffic affects thebehavioral dynamics and behavioral budget of thispopulation of killer whales. Given the importance offood limitation on the dynamics of this population, weparticularly determined whether they disrupt foragingactivities and the range of influence of vessels (themaximum distance between whales and boats elicitingdisruptions).
MATERIALS AND METHODS
Study areas. From 28 July to 30 September 2003,1 May to 31 August 2004, and 15 May to 31 July 2005,a land-based team of observers monitored behavior ofwhales and activity of boats from 2 study sites on thewest coast of San Juan Island, WA, USA. One site(hereafter referred to as the north site) was located at48° 30.561’ N, 123° 8.494’ W (near Lime Kiln State Park)at an altitude of approximately 99 m above mean lowerlow water. The south site was located on Mt. Finlayson(48° 27.421’ N, 122° 59.401’ W) at a height of 72 m, andthe view of the eastern portion of Juan de Fuca Straitwas unobstructed. Whales have been reported to usethis area heavily for foraging, whereas the north siteappeared to be used primarily for travel and socializing(Heimlich-Boran 1988, Felleman et al. 1991, Hoelzel1993). Together, these sites were chosen to maximizesample size and to allow the behavioral observations toinclude the entire repertoire of the population.
Behavioral sampling. During the study periods,238 d were spent on effort, of which 128 d were spentwith whales. During that time scan sampling was con-ducted at 15 min intervals to characterize subgroupsize (ranging from 1, to the size of the school in the
212
Lusseau et al.: Effects of vessel traffic on foraging of killer whales
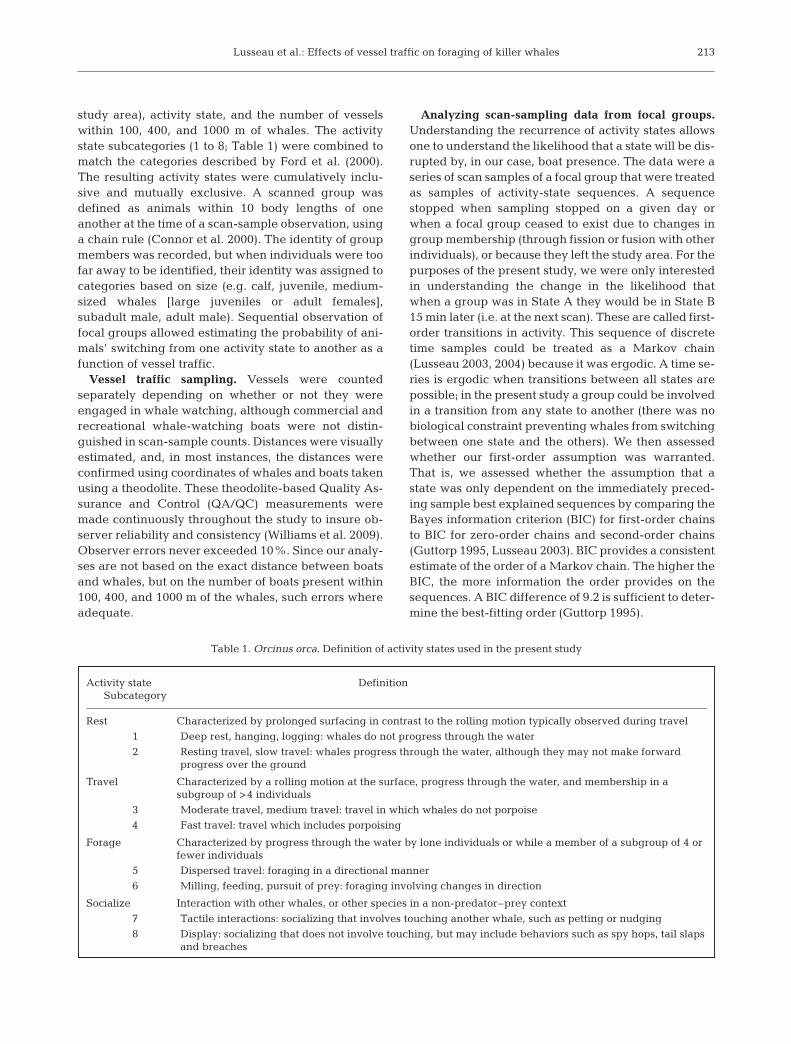
study area), activity state, and the number of vesselswithin 100, 400, and 1000 m of whales. The activitystate subcategories (1 to 8; Table 1) were combined tomatch the categories described by Ford et al. (2000).The resulting activity states were cumulatively inclu-sive and mutually exclusive. A scanned group wasdefined as animals within 10 body lengths of oneanother at the time of a scan-sample observation, usinga chain rule (Connor et al. 2000). The identity of groupmembers was recorded, but when individuals were toofar away to be identified, their identity was assigned tocategories based on size (e.g. calf, juvenile, medium-sized whales [large juveniles or adult females],subadult male, adult male). Sequential observation offocal groups allowed estimating the probability of ani-mals’ switching from one activity state to another as afunction of vessel traffic.
Vessel traffic sampling. Vessels were countedseparately depending on whether or not they wereengaged in whale watching, although commercial andrecreational whale-watching boats were not distin-guished in scan-sample counts. Distances were visuallyestimated, and, in most instances, the distances wereconfirmed using coordinates of whales and boats takenusing a theodolite. These theodolite-based Quality As-surance and Control (QA/QC) measurements weremade continuously throughout the study to insure ob-server reliability and consistency (Williams et al. 2009).Observer errors never exceeded 10%. Since our analy-ses are not based on the exact distance between boatsand whales, but on the number of boats present within100, 400, and 1000 m of the whales, such errors whereadequate.
Analyzing scan-sampling data from focal groups.Understanding the recurrence of activity states allowsone to understand the likelihood that a state will be dis-rupted by, in our case, boat presence. The data were aseries of scan samples of a focal group that were treatedas samples of activity-state sequences. A sequencestopped when sampling stopped on a given day orwhen a focal group ceased to exist due to changes ingroup membership (through fission or fusion with otherindividuals), or because they left the study area. For thepurposes of the present study, we were only interestedin understanding the change in the likelihood thatwhen a group was in State A they would be in State B15 min later (i.e. at the next scan). These are called first-order transitions in activity. This sequence of discretetime samples could be treated as a Markov chain(Lusseau 2003, 2004) because it was ergodic. A time se-ries is ergodic when transitions between all states arepossible; in the present study a group could be involvedin a transition from any state to another (there was nobiological constraint preventing whales from switchingbetween one state and the others). We then assessedwhether our first-order assumption was warranted.That is, we assessed whether the assumption that astate was only dependent on the immediately preced-ing sample best explained sequences by comparing theBayes information criterion (BIC) for first-order chainsto BIC for zero-order chains and second-order chains(Guttorp 1995, Lusseau 2003). BIC provides a consistentestimate of the order of a Markov chain. The higher theBIC, the more information the order provides on thesequences. A BIC difference of 9.2 is sufficient to deter-mine the best-fitting order (Guttorp 1995).
213
Activity state DefinitionSubcategory
Rest Characterized by prolonged surfacing in contrast to the rolling motion typically observed during travel
1 Deep rest, hanging, logging: whales do not progress through the water
2 Resting travel, slow travel: whales progress through the water, although they may not make forwardprogress over the ground
Travel Characterized by a rolling motion at the surface, progress through the water, and membership in asubgroup of >4 individuals
3 Moderate travel, medium travel: travel in which whales do not porpoise
4 Fast travel: travel which includes porpoising
Forage Characterized by progress through the water by lone individuals or while a member of a subgroup of 4 orfewer individuals
5 Dispersed travel: foraging in a directional manner
6 Milling, feeding, pursuit of prey: foraging involving changes in direction
Socialize Interaction with other whales, or other species in a non-predator–prey context
7 Tactile interactions: socializing that involves touching another whale, such as petting or nudging
8 Display: socializing that does not involve touching, but may include behaviors such as spy hops, tail slapsand breaches
Table 1. Orcinus orca. Definition of activity states used in the present study
Endang Species Res 6: 211–221, 2009
To understand the effect of boat interactions on thestate transitions, the number of vessels in the field ofview was counted, as these vessels may have con-tributed to ambient noise in the area (Bain pers. obs.).The number of vessels within 100, 400, and 1000 m ofsubgroups were also counted. The numbers withinspecific distances were used as candidate explanatorycovariates, to assess whether the probability of animalsswitching among activity states varied as a function ofboat traffic. We therefore constructed a transitionmatrix, representing the probabilities for whales to beobserved in state i at time t and subsequently in state jat the next sampling event (t + 15 min):
(1)
where eij is the total number of times the transition was
observed and is the total number of time state i
was observed as the starting state.Analyzing the influence of vessel traffic and other
factors on behavior. We were able to explore theeffects of several parameters on the likelihood to gofrom one state to another by comparing the behavioralcontingency tables (preceding to succeeding states)obtained for different levels of different factors(Lusseau 2003). Using these multidimensional contin-gency tables, we used general log-linear analyses(SPSS algorithm), to test whether site (north/south),year (2003/2004/2005), pod (J, K, and L), or vessel traf-fic (boat present/absent within 100, 400, and 1000 m)affected transitions in activity states, which was thelikelihood that focal groups went from a precedingbehavior (state at time t) to a succeeding behavior(state at time t + 15 min). Log-linear analyses can bethought of as generalized linear models for categoricaldata (with a Poisson distribution and log link). Thistechnique is described in more detail by Lusseau(2003, 2004). The response variable in these analyseswas the succeeding behavior (S), and we estimatedwhether the observed count of succeeding behaviorwas influenced by the preceding behavior (P), the year(Y), boat presence (B), and/or location (L). Given thatwe estimated the behavioral sequences using first-order Markov chains, we were assuming that the inter-action PS was significant. Given that sampling wasbased on observational data, we could not control sam-ple size for each factor, and therefore the count of pre-ceding behavior was influenced by other factors(Caswell 2001). The log-linear analysis fits a saturatedmodel to the dataset, i.e. a model that considers allinteractions, indicated by BLYPS in the first analysis.The effects of the different factors can be tested bycomparing different fitted models using likelihoodratio tests. Here, the null hypothesis is that succeeding
behaviors are independent of boat presence, year, andlocation, given preceding behaviors. This null hypoth-esis corresponds to the null model PS + LBYP. Theinfluence of factors was assessed in 2 manners. First,we estimated the Akaike information criterion (AIC)for each model, and the best fitting model minimizedAIC. Secondly, we assessed whether the presence of afactor in the log-linear model added a significant con-tribution to explaining the data’s variance using likeli-hood ratio tests. For example, the effect of boat pres-ence in the first analysis can be evaluated bycomparing the null model and BPS + LBYP becauseadding the terms BS and BPS, which correspond to aboat presence effect on the observed count of succeed-ing behaviors, to the null model results in the modelBPS + LBYP. The significance of the boat presenceeffect can then be tested by comparing the goodness-of-fit of both models. The difference in goodness-of-fit (ΔG2 = G2
BPS,LBYP – G2PS,LBYP) is the likelihood ratio
testing the significance of the addition of terms BS andBPS with degrees of freedom equal to the difference inthe degrees of freedom for the 2 models. The effect ofthe various factors can be tested at various stages byadding the effect to different models that already con-sider other factors (Fig. 1). We tested the interactionsbetween year, site, and boat presence and their influ-ences on behavioral transitions.
Influence of pod identity. We then tested whetherthe pod identity of the focal whales influenced the pre-vious analysis. For this analysis we only retained focalschools that were composed exclusively of members of1 pod. Due to sample size constraints the latter analysiswas carried out on only 2 behavioral states (foragingor not foraging), while the former was carried out onall states.
Influence of distance between boats and whales. Toassess whether distance to boats influenced the behav-ior of killer whales, we calculated the likelihood thatwhales that were foraging stayed foraging when boatsinteracted with them at distances of 100, 400, and1000 m. We also looked at the effect of boat presenceon the likelihood that whales that were foraging wouldstay foraging by comparing control situations (no boatswithin the given distance band) to impact ones. In allthese analyses, foraging was selected because recentstudies show that northern resident killer whales weremore likely to switch activity states when boatsapproached foraging whales than when whales wereengaged in other activity states. Furthermore, alter-ation to this state is likely to carry larger energetic con-sequences for killer whales, because it has the poten-tial not only to increase energetic expenditure, but alsoto reduce acquisition (Williams et al. 2006).
We analyzed the scans containing distances betweenvessels and groups to determine mean and maximum
eikk
∑
pe
eij
ij
ikk
= ∑
214
Lusseau et al.: Effects of vessel traffic on foraging of killer whales
vessel counts along with the proportion of time groupsspent within 100, 400, or 1000 m of the nearest vessel(e.g. proportion of time within 100 m equals the num-ber of scans with boats within 100 m divided by thenumber of scans in which vessel distances wererecorded).
Behavioral budget variations. Finally, we assessedvariation in behavioral budget under different condi-tions. We estimated budgets using the long-termbehavior of the transition matrices. Transition matricesare based on ergodic time series, which means thateigenanalysis of this matrix reveals several propertiesof activity states. Applying the Perron-Frobenius theo-rem we show that the transition matrix of long-termbehavior, i.e. the amount of time that the whales spentin each activity state, can be approximated by the left
eigenvector of the dominant eigenvalue of the matrix(Lusseau 2003). Ultimately, this approach can be usedto calculate stable, unbiased activity budgets in con-trast with budgets obtained from sample tallies thatcan be influenced by autocorrelation issues. Further,reliance on transitions rather than individual scanshelped control for possible effects of whale behavior onvessel behavior.
RESULTS
Over the 3 field seasons we observed 593 behavioraltransitions in Orcinus orca (135 in 2003, 217 in 2004, and251 in 2005 out of 373, 1058, and 770 scans, respectively;Table 2). The first-order Markov chain was deemed the
215
31
PS, BYLP G2 = 154.2, df = 132, AIC = –109.8
BPS, BYLP G2 = 131, df = 120, AIC = –109
LPS, BYLP G2 = 132.6, df = 120, AIC = –107.4
YPS, BYLP G2 = 122.5, df = 108, AIC = –93.5
BPS, LPS, BYLP G2 = 118.5, df = 108, AIC = –97.5
BPS, YPS, BYLP G2 = 109.8, df = 96, AIC = –93.1
LPS, YPS, BYLP G2 = 98.9, df = 96, AIC = –93.1
BPS, YPS, LPS, BYLP G2 = 86.6, df = 84, AIC = –81.4
BYPS, BYLP G2 = 78.4, df = 72, AIC = –65.6
BLPS, BYLP G2 = 105.2, df = 96, AIC = –86.8
YLPS, BYLP G2 = 74.9, df = 72, AIC = –69.1
LPS, BYPS, BYLP G2 = 53.1, df = 60, AIC = –66.9
YPS, BLPS, BYLP G2 = 67.7, df = 72, AIC = –76.3
BPS, YLPS, BYLP G2 = 64.1, df = 60, AIC = –55.9
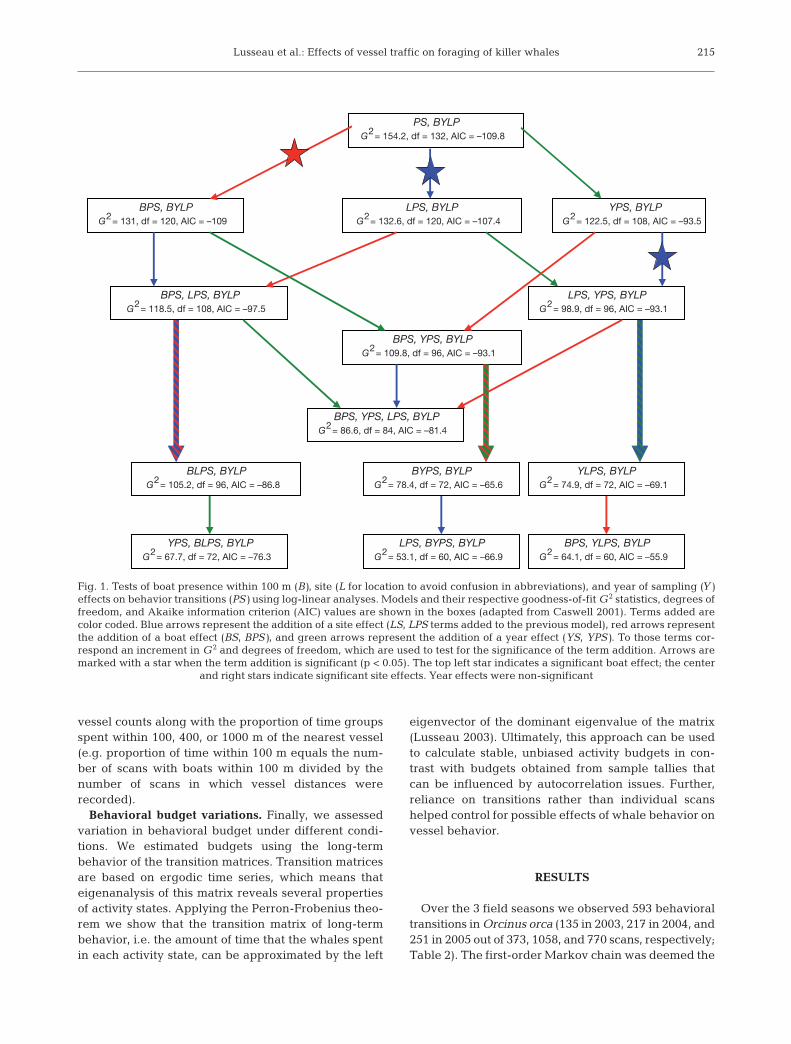
Fig. 1. Tests of boat presence within 100 m (B), site (L for location to avoid confusion in abbreviations), and year of sampling (Y)effects on behavior transitions (PS) using log-linear analyses. Models and their respective goodness-of-fit G2 statistics, degrees offreedom, and Akaike information criterion (AIC) values are shown in the boxes (adapted from Caswell 2001). Terms added arecolor coded. Blue arrows represent the addition of a site effect (LS, LPS terms added to the previous model), red arrows representthe addition of a boat effect (BS, BPS), and green arrows represent the addition of a year effect (YS, YPS). To those terms cor-respond an increment in G2 and degrees of freedom, which are used to test for the significance of the term addition. Arrows aremarked with a star when the term addition is significant (p < 0.05). The top left star indicates a significant boat effect; the center
and right stars indicate significant site effects. Year effects were non-significant
Endang Species Res 6: 211–221, 2009
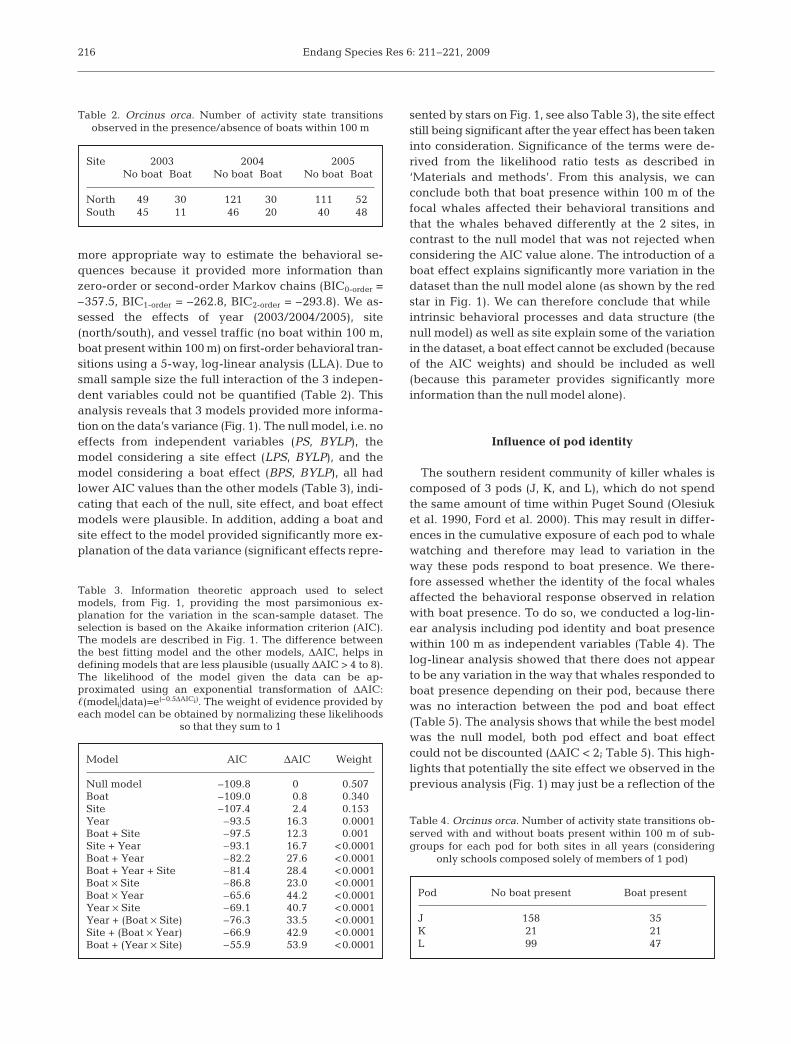
more appropriate way to estimate the behavioral se-quences because it provided more information thanzero-order or second-order Markov chains (BIC0-order =–357.5, BIC1-order = –262.8, BIC2-order = –293.8). We as-sessed the effects of year (2003/2004/2005), site(north/south), and vessel traffic (no boat within 100 m,boat present within 100 m) on first-order behavioral tran-sitions using a 5-way, log-linear analysis (LLA). Due tosmall sample size the full interaction of the 3 indepen-dent variables could not be quantified (Table 2). Thisanalysis reveals that 3 models provided more informa-tion on the data’s variance (Fig. 1). The null model, i.e. noeffects from independent variables (PS, BYLP), themodel considering a site effect (LPS, BYLP), and themodel considering a boat effect (BPS, BYLP), all hadlower AIC values than the other models (Table 3), indi-cating that each of the null, site effect, and boat effectmodels were plausible. In addition, adding a boat andsite effect to the model provided significantly more ex-planation of the data variance (significant effects repre-
sented by stars on Fig. 1, see also Table 3), the site effectstill being significant after the year effect has been takeninto consideration. Significance of the terms were de-rived from the likelihood ratio tests as described in‘Materials and methods’. From this analysis, we canconclude both that boat presence within 100 m of thefocal whales affected their behavioral transitions andthat the whales behaved differently at the 2 sites, incontrast to the null model that was not rejected whenconsidering the AIC value alone. The introduction of aboat effect explains significantly more variation in thedataset than the null model alone (as shown by the redstar in Fig. 1). We can therefore conclude that whileintrinsic behavioral processes and data structure (thenull model) as well as site explain some of the variationin the dataset, a boat effect cannot be excluded (becauseof the AIC weights) and should be included as well(because this parameter provides significantly moreinformation than the null model alone).
Influence of pod identity
The southern resident community of killer whales iscomposed of 3 pods (J, K, and L), which do not spendthe same amount of time within Puget Sound (Olesiuket al. 1990, Ford et al. 2000). This may result in differ-ences in the cumulative exposure of each pod to whalewatching and therefore may lead to variation in theway these pods respond to boat presence. We there-fore assessed whether the identity of the focal whalesaffected the behavioral response observed in relationwith boat presence. To do so, we conducted a log-lin-ear analysis including pod identity and boat presencewithin 100 m as independent variables (Table 4). Thelog-linear analysis showed that there does not appearto be any variation in the way that whales responded toboat presence depending on their pod, because therewas no interaction between the pod and boat effect(Table 5). The analysis shows that while the best modelwas the null model, both pod effect and boat effectcould not be discounted (ΔAIC < 2; Table 5). This high-lights that potentially the site effect we observed in theprevious analysis (Fig. 1) may just be a reflection of the
216
Model AIC ΔAIC Weight
Null model –109.8 0. 0.507Boat –109.0 0.8 0.340Site –107.4 2.4 0.153Year –93.5 16.3 0.0001Boat + Site –97.5 12.3 0.001Site + Year –93.1 16.7 <0.0001Boat + Year –82.2 27.6 <0.0001Boat + Year + Site –81.4 28.4 <0.0001Boat × Site –86.8 23.0. <0.0001Boat × Year –65.6 44.2 <0.0001Year × Site –69.1 40.7 <0.0001Year + (Boat × Site) –76.3 33.5 <0.0001Site + (Boat × Year) –66.9 42.9 <0.0001Boat + (Year × Site) –55.9 53.9 <0.0001
Table 3. Information theoretic approach used to selectmodels, from Fig. 1, providing the most parsimonious ex-planation for the variation in the scan-sample dataset. Theselection is based on the Akaike information criterion (AIC).The models are described in Fig. 1. The difference betweenthe best fitting model and the other models, ΔAIC, helps indefining models that are less plausible (usually ΔAIC > 4 to 8).The likelihood of the model given the data can be ap-proximated using an exponential transformation of ΔAIC:�(modeli�data)=e(–0.5ΔAICi). The weight of evidence provided byeach model can be obtained by normalizing these likelihoods
so that they sum to 1
Pod No boat present Boat present
J 158 35K 21 21L 99 47
Table 4. Orcinus orca. Number of activity state transitions ob-served with and without boats present within 100 m of sub-groups for each pod for both sites in all years (considering
only schools composed solely of members of 1 pod)
Site 2003 2004 2005No boat Boat No boat Boat No boat Boat
North 49 30 121 30 111 52South 45 11 46 20 40 48
Table 2. Orcinus orca. Number of activity state transitions observed in the presence/absence of boats within 100 m
Lusseau et al.: Effects of vessel traffic on foraging of killer whales
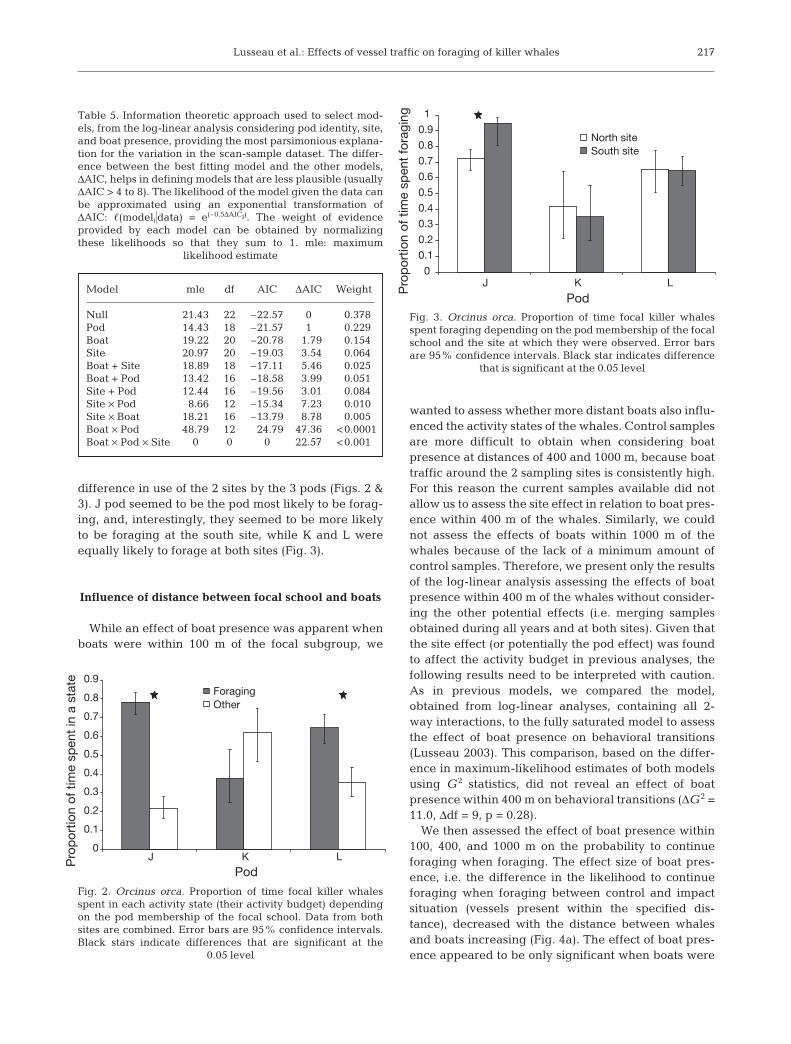
difference in use of the 2 sites by the 3 pods (Figs. 2 &3). J pod seemed to be the pod most likely to be forag-ing, and, interestingly, they seemed to be more likelyto be foraging at the south site, while K and L wereequally likely to forage at both sites (Fig. 3).
Influence of distance between focal school and boats
While an effect of boat presence was apparent whenboats were within 100 m of the focal subgroup, we
wanted to assess whether more distant boats also influ-enced the activity states of the whales. Control samplesare more difficult to obtain when considering boatpresence at distances of 400 and 1000 m, because boattraffic around the 2 sampling sites is consistently high.For this reason the current samples available did notallow us to assess the site effect in relation to boat pres-ence within 400 m of the whales. Similarly, we couldnot assess the effects of boats within 1000 m of thewhales because of the lack of a minimum amount ofcontrol samples. Therefore, we present only the resultsof the log-linear analysis assessing the effects of boatpresence within 400 m of the whales without consider-ing the other potential effects (i.e. merging samplesobtained during all years and at both sites). Given thatthe site effect (or potentially the pod effect) was foundto affect the activity budget in previous analyses, thefollowing results need to be interpreted with caution.As in previous models, we compared the model,obtained from log-linear analyses, containing all 2-way interactions, to the fully saturated model to assessthe effect of boat presence on behavioral transitions(Lusseau 2003). This comparison, based on the differ-ence in maximum-likelihood estimates of both modelsusing G2 statistics, did not reveal an effect of boatpresence within 400 m on behavioral transitions (ΔG2 =11.0, Δdf = 9, p = 0.28).
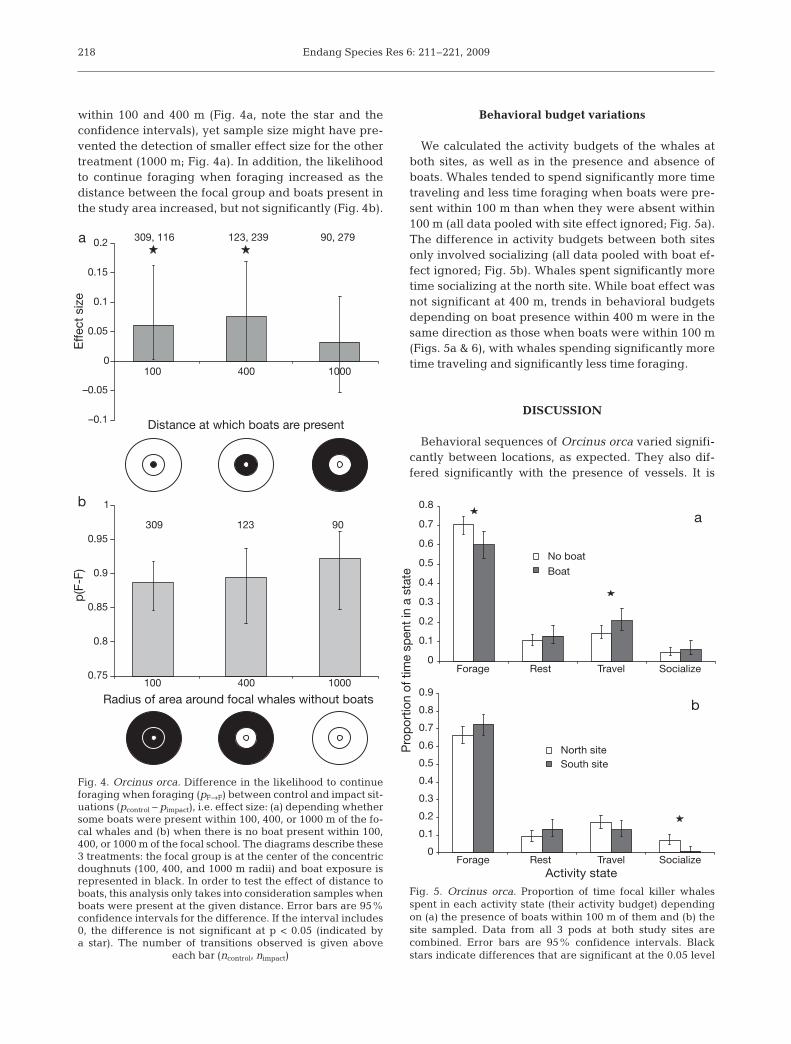
We then assessed the effect of boat presence within100, 400, and 1000 m on the probability to continueforaging when foraging. The effect size of boat pres-ence, i.e. the difference in the likelihood to continueforaging when foraging between control and impactsituation (vessels present within the specified dis-tance), decreased with the distance between whalesand boats increasing (Fig. 4a). The effect of boat pres-ence appeared to be only significant when boats were
217
Model mle df AIC ΔAIC Weight
Null 21.43 22 –22.57 0 0.378Pod 14.43 18 –21.57 1 0.229Boat 19.22 20 –20.78 1.79 0.154Site 20.97 20 –19.03 3.54 0.064Boat + Site 18.89 18 –17.11 5.46 0.025Boat + Pod 13.42 16 –18.58 3.99 0.051Site + Pod 12.44 16 –19.56 3.01 0.084Site × Pod 8.66 12 –15.34 7.23 0.010Site × Boat 18.21 16 –13.79 8.78 0.005Boat × Pod 48.79 12 24.79 47.36 <0.0001Boat × Pod × Site 0 0 0 22.57 <0.001
Table 5. Information theoretic approach used to select mod-els, from the log-linear analysis considering pod identity, site,and boat presence, providing the most parsimonious explana-tion for the variation in the scan-sample dataset. The differ-ence between the best fitting model and the other models,ΔAIC, helps in defining models that are less plausible (usuallyΔAIC > 4 to 8). The likelihood of the model given the data canbe approximated using an exponential transformation ofΔAIC: �(modeli�data) = e(–0.5ΔAICi). The weight of evidenceprovided by each model can be obtained by normalizingthese likelihoods so that they sum to 1. mle: maximum
likelihood estimate
0
0.1
0.2
0.3
0.4
0.5
0.6
0.7
0.8
0.9
LKJ
Pod
Pro
por
tion
of t
ime
spen
t in
a s
tate
ForagingOther
Fig. 2. Orcinus orca. Proportion of time focal killer whalesspent in each activity state (their activity budget) dependingon the pod membership of the focal school. Data from bothsites are combined. Error bars are 95% confidence intervals.Black stars indicate differences that are significant at the
0.05 level
0
0.1
0.2
0.3
0.4
0.5
0.6
0.7
0.8
0.9
1
LKJ
Pod
Pro
por
tion
of t
ime
spen
t fo
ragi
ng
North siteSouth site
Fig. 3. Orcinus orca. Proportion of time focal killer whalesspent foraging depending on the pod membership of the focalschool and the site at which they were observed. Error barsare 95% confidence intervals. Black star indicates difference
that is significant at the 0.05 level
Endang Species Res 6: 211–221, 2009
within 100 and 400 m (Fig. 4a, note the star and theconfidence intervals), yet sample size might have pre-vented the detection of smaller effect size for the othertreatment (1000 m; Fig. 4a). In addition, the likelihoodto continue foraging when foraging increased as thedistance between the focal group and boats present inthe study area increased, but not significantly (Fig. 4b).
Behavioral budget variations
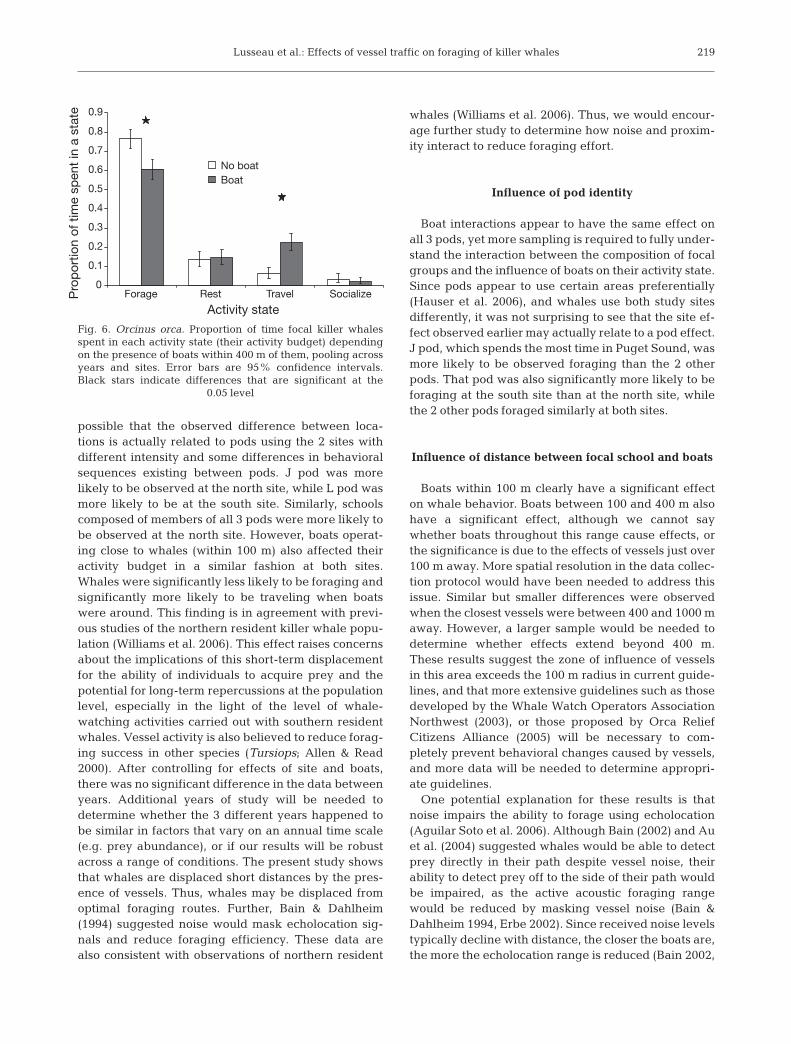
We calculated the activity budgets of the whales atboth sites, as well as in the presence and absence ofboats. Whales tended to spend significantly more timetraveling and less time foraging when boats were pre-sent within 100 m than when they were absent within100 m (all data pooled with site effect ignored; Fig. 5a).The difference in activity budgets between both sitesonly involved socializing (all data pooled with boat ef-fect ignored; Fig. 5b). Whales spent significantly moretime socializing at the north site. While boat effect wasnot significant at 400 m, trends in behavioral budgetsdepending on boat presence within 400 m were in thesame direction as those when boats were within 100 m(Figs. 5a & 6), with whales spending significantly moretime traveling and significantly less time foraging.
DISCUSSION
Behavioral sequences of Orcinus orca varied signifi-cantly between locations, as expected. They also dif-fered significantly with the presence of vessels. It is
218
–0.1
–0.05
0
0.05
0.1
0.15
0.2
100 1000400
100 1000400
Distance at which boats are present
Effe
ct s
ize
0.75
0.8
0.85
0.9
0.95
1
Radius of area around focal whales without boats
p(F
-F)
309, 116 123, 239 90, 279
309 123 90
b
a
Fig. 4. Orcinus orca. Difference in the likelihood to continueforaging when foraging (pF→F) between control and impact sit-uations (pcontrol – pimpact), i.e. effect size: (a) depending whethersome boats were present within 100, 400, or 1000 m of the fo-cal whales and (b) when there is no boat present within 100,400, or 1000 m of the focal school. The diagrams describe these3 treatments: the focal group is at the center of the concentricdoughnuts (100, 400, and 1000 m radii) and boat exposure isrepresented in black. In order to test the effect of distance toboats, this analysis only takes into consideration samples whenboats were present at the given distance. Error bars are 95%confidence intervals for the difference. If the interval includes0, the difference is not significant at p < 0.05 (indicated bya star). The number of transitions observed is given above
each bar (ncontrol, nimpact)
0
0.1
0.2
0.3
0.4
0.5
0.6
0.7
0.8
No boat
Boat
0
0.1
0.2
0.3
0.4
0.5
0.6
0.7
0.8
0.9
Forage Rest Travel Socialize
Forage Rest Travel Socialize
Activity state
Pro
port
ion
of ti
me
spen
t in
a st
ate
North siteSouth site
b
a
Fig. 5. Orcinus orca. Proportion of time focal killer whalesspent in each activity state (their activity budget) dependingon (a) the presence of boats within 100 m of them and (b) thesite sampled. Data from all 3 pods at both study sites arecombined. Error bars are 95% confidence intervals. Blackstars indicate differences that are significant at the 0.05 level
Lusseau et al.: Effects of vessel traffic on foraging of killer whales
possible that the observed difference between loca-tions is actually related to pods using the 2 sites withdifferent intensity and some differences in behavioralsequences existing between pods. J pod was morelikely to be observed at the north site, while L pod wasmore likely to be at the south site. Similarly, schoolscomposed of members of all 3 pods were more likely tobe observed at the north site. However, boats operat-ing close to whales (within 100 m) also affected theiractivity budget in a similar fashion at both sites.Whales were significantly less likely to be foraging andsignificantly more likely to be traveling when boatswere around. This finding is in agreement with previ-ous studies of the northern resident killer whale popu-lation (Williams et al. 2006). This effect raises concernsabout the implications of this short-term displacementfor the ability of individuals to acquire prey and thepotential for long-term repercussions at the populationlevel, especially in the light of the level of whale-watching activities carried out with southern residentwhales. Vessel activity is also believed to reduce forag-ing success in other species (Tursiops; Allen & Read2000). After controlling for effects of site and boats,there was no significant difference in the data betweenyears. Additional years of study will be needed todetermine whether the 3 different years happened tobe similar in factors that vary on an annual time scale(e.g. prey abundance), or if our results will be robustacross a range of conditions. The present study showsthat whales are displaced short distances by the pres-ence of vessels. Thus, whales may be displaced fromoptimal foraging routes. Further, Bain & Dahlheim(1994) suggested noise would mask echolocation sig-nals and reduce foraging efficiency. These data arealso consistent with observations of northern resident
whales (Williams et al. 2006). Thus, we would encour-age further study to determine how noise and proxim-ity interact to reduce foraging effort.
Influence of pod identity
Boat interactions appear to have the same effect onall 3 pods, yet more sampling is required to fully under-stand the interaction between the composition of focalgroups and the influence of boats on their activity state.Since pods appear to use certain areas preferentially(Hauser et al. 2006), and whales use both study sitesdifferently, it was not surprising to see that the site ef-fect observed earlier may actually relate to a pod effect.J pod, which spends the most time in Puget Sound, wasmore likely to be observed foraging than the 2 otherpods. That pod was also significantly more likely to beforaging at the south site than at the north site, whilethe 2 other pods foraged similarly at both sites.
Influence of distance between focal school and boats
Boats within 100 m clearly have a significant effecton whale behavior. Boats between 100 and 400 m alsohave a significant effect, although we cannot saywhether boats throughout this range cause effects, orthe significance is due to the effects of vessels just over100 m away. More spatial resolution in the data collec-tion protocol would have been needed to address thisissue. Similar but smaller differences were observedwhen the closest vessels were between 400 and 1000 maway. However, a larger sample would be needed todetermine whether effects extend beyond 400 m.These results suggest the zone of influence of vesselsin this area exceeds the 100 m radius in current guide-lines, and that more extensive guidelines such as thosedeveloped by the Whale Watch Operators AssociationNorthwest (2003), or those proposed by Orca ReliefCitizens Alliance (2005) will be necessary to com-pletely prevent behavioral changes caused by vessels,and more data will be needed to determine appropri-ate guidelines.
One potential explanation for these results is thatnoise impairs the ability to forage using echolocation(Aguilar Soto et al. 2006). Although Bain (2002) and Auet al. (2004) suggested whales would be able to detectprey directly in their path despite vessel noise, theirability to detect prey off to the side of their path wouldbe impaired, as the active acoustic foraging rangewould be reduced by masking vessel noise (Bain &Dahlheim 1994, Erbe 2002). Since received noise levelstypically decline with distance, the closer the boats are,the more the echolocation range is reduced (Bain 2002,
219
0
0.1
0.2
0.3
0.4
0.5
0.6
0.7
0.8
0.9
Forage Rest Travel Socialize
Activity state
Pro
por
tion
of t
ime
spen
t in
a s
tate
No boatBoat
Fig. 6. Orcinus orca. Proportion of time focal killer whalesspent in each activity state (their activity budget) dependingon the presence of boats within 400 m of them, pooling acrossyears and sites. Error bars are 95% confidence intervals.Black stars indicate differences that are significant at the
0.05 level

Endang Species Res 6: 211–221, 2009
Williams et al. 2002a), potentially leading to foragingdisruption, as suspected here. To test this hypothesis,acoustic monitoring would be required, as noise pro-duced varies with engine type and the speed at whichboats operate. These data were beyond the scope ofthe present study.
CONCLUSIONS
In this study, we found evidence consistent withchanges in behavior in the presence of vessels. Theseeffects support the development and enforcement ofregulations for whale watchers, both recreational andcommercial. Future research could address whetherdifferent approaches to whale watching have differentdegrees of impact (as paralleling and leap-froggingwere compared by Williams et al. 2002a,b), andwhether changes in behavior are more pronounced insome parts of the range than in others. However, sinceit has proven difficult to demonstrate significant differ-ences in behavioral responses to currently acceptedpractices, it could be expected to take carefully con-trolled experiments or many years of observation tocompare the implications of proposed guidelines tocurrent guidelines. Future research could also attemptfurther elucidation of age, sex, pod, and individual dif-ferences in responses to vessels. Strong behavioralresponses of animals to disturbance do not always indi-cate population-level effects. Indeed, inter-specificvariability in site fidelity and availability of alternativesuitable habitat make it difficult to infer population-level consequences from inter-specific variability insensitivity to disturbance (Gill et al. 2001). Thus, it willbe important to develop the link between short-termbehavioral effects and population dynamics (see Bain2002).
The present study echoes findings with northern res-ident killer whales: the presence of vessels inhibits theforaging behavior of fish-eating killer whales. Thismay lead to a reduction in energy acquisition, and apriority field research area would be to addresswhether prey capture actually is affected by vesselpresence. In addition, modeling exercises should becarried out to identify potential mechanisms and thebiological significance of any effects found.
Acknowledgements. We thank B. Gleason of San Juan IslandNational Historic Park for permission to use the south site(Permits SAJH-2004-SCI-0003 and SAJH-2005-SCI-0003),and the Reiss family for permission to use the north site. Wethank E. Ashe, A. Coleman, B. Cuddihy, A. Foote, M. Foss, J.Hogan, A. Miller, F. Robertson, D. Ross, and R. Taylor forassistance with data collection. The Whale Museum’s Sound-watch Program, the Marine Mammal Monitoring Program
(M3), and The Whale Watch Operators Association Northwestassisted with increasing the quantity of no-boat data at ournorth site. We give special thanks to D. Noren for her helpwith the design of this project and review of an earlier draft ofthe manuscript. We also thank Jason Matthiopoulos for usefulcomments on the manuscript. The data used in this reportwere funded under NMFS Contracts AB133F03SE0959,AB133F04CN0040 and AB133F05SE3965.
LITERATURE CITED
Aguilar Soto NA, Johnson M, Madsen PT, Tyack PL, Boc-concelli A, Borsani JF (2006) Does intense ship noise dis-rupt foraging in deep-diving Cuvier’s beaked whales(Ziphius cavirostris)? Mar Mamm Sci 22:690–699
Allen MC, Read AJ (2000) Habitat selection of foragingbottlenose dolphins in relation to boat density near Clear-water, Florida. Mar Mamm Sci 16:815–824
Au WWL, Ford JKB, Horne JK, Newman Allman KA (2004)Echolocation signals of free-ranging killer whales (Orci-nus orca) and modeling of foraging for chinook salmon(Oncorhynchus tshawytscha). J Acoust Soc Am 115:901–909
Bain DE (2002) A model linking energetic effects of whalewatching to killer whale (Orcinus orca) populationdynamics. Orca Relief Citizens Alliance, Friday Harbor,WA. Available at: http://orcarelief.org/docs/bain_paper.pdf
Bain DE, Dahlheim ME (1994) Effects of masking noise ondetection thresholds of killer whales. In: Loughlin TR (ed)Marine mammals and the ‘Exxon Valdez’. AcademicPress, San Diego, CA, p 243–256
Bejder L, Samuels A, Whitehead H, Gales N (2006) Decline inrelative abundance of bottlenose dolphins exposed tolong-term disturbance. Conserv Biol 20(6):1791–1798
Bigg MA, Olesiuk PF, Ellis GM, Ford JKB, Balcomb KC III(1990) Social organization and genealogy of resident killerwhales (Orcinus orca) in the coastal waters of BritishColumbia and Washington State. Rep Int Whaling Comm12(Spec Issue):383–405
Cane VR (1959) Behaviour sequences as semi-Markov chains.J R Stat Soc Ser B Methodological 21:36–58
Caswell H (2001) Matrix population models. Sinauer Associ-ates, Boston, MA
Connor RC, Wells RS, Mann J, Read AJ (2000) The bottlenosedolphin. In: Mann J, Connor RC, Tyack PL, Whitehead H(eds) Cetacean societies. University of Chicago Press, Lon-don, p 91–125
Erbe C (2002) Underwater noise of whale-watching boats andpotential effects on killer whales (Orcinus orca), based onan acoustic impact model. Mar Mamm Sci 18:394–418
Felleman FL, Heimlich-Boran JR, Osborne RW (1991) Feed-ing ecology of the killer whale (Orcinus orca). In: PryorKW, Norris KS (eds) Dolphin societies: discoveries andpuzzles. University of California Press, Berkeley, CA,p 113–147
Ford JKB, Ellis GM, Balcomb KC (2000) Killer whales: the nat-ural history and genealogy of Orcinus orca in BritishColumbia and Washington, 2nd edn. University of BritishColumbia Press, Vancouver, BC
Galicia E, Baldassare GA (1997) Effects of motorized tour-boats on the behavior of non-breeding American flamin-gos in Yucatan, Mexico. Conserv Biol 11:1159–1165
Gill JA, Norris K, Sutherland WJ (2001) Why behaviouralresponses may not reflect the population consequences ofhuman disturbance. Biol Conserv 97:265–268
220
Lusseau et al.: Effects of vessel traffic on foraging of killer whales
Guttorp P (1995) Stochastic modeling of scientific data. Chap-man and Hall, London
Hauser DDW, VanBlaricom GR, Holmes EE, Osborne RW(2006) Evaluating the use of whalewatch data in determin-ing killer whale (Orcinus orca) distribution patterns. J CetRes Manag 8:273–281
Heimlich-Boran JR (1988) Behavioral ecology of killer whales(Orcinus orca) in the Pacific Northwest. Can J Zool 66:565–578
Hoelzel AR (1993) Foraging behaviour and social groupdynamics in Puget-Sound killer whales. Anim Behav 45:581–591
Killer Whale Recovery Team (2005) Recovery strategy for thenorthern and southern resident killer whales (Orcinusorca) in Canada. Species at Risk Recovery Strategy Series,Fisheries and Oceans Canada, Ottawa
Krahn MM, Ford MJ, Perrin WF, Wade PR and others (2004)2004 Status review of southern resident killer whales(Orcinus orca) under the Endangered Species Act. NOAATech Memo NMFSNWFSC-62, US Department of Com-merce, Washington, DC
Lacy KE, Martins EP (2003) The effect of anthropogenic habi-tat usage on the social behavior of a vulnerable species,Cyclura nubila. Anim Conserv 6:3–9
Lusseau D (2003) The effects of tour boats on the behavior ofbottlenose dolphins: using Markov chains to modelanthropogenic impacts. Conserv Biol 17:1785–1793
Lusseau D (2004) The hidden cost of tourism: effects of inter-actions with tour boats on the behavioural budget of twopopulations of bottlenose dolphins in Fiordland, NewZealand. Ecol Soc 9: art. 2
Lusseau D (2005) The residency pattern of bottlenose dol-phins Tursiops sp. in Milford Sound, New Zealand, isrelated to boat traffic. Mar Ecol Prog Ser 295:265–272
Lusseau D, Lusseau SM, Bejder L, Williams R (2006) An indi-vidual-based model to infer the impact of whalewatchingon cetacean population dynamics. IWC SC/58/WW7Report to the 58th meeting of the International WhalingCommission Scientific Committee, St. Kitts and Nevis
Olesiuk PF, Bigg MA, Ellis GM (1990) Life history andpopulation dynamics of resident killer whales (Orcinusorca) in the coastal waters of British Columbia and
Washington State. Rep Int Whaling Comm 12(SpecIssue):209–243
Orca Relief Citizens Alliance (2005) The best view of ourwhales is from shore. Orca Relief Citizens Alliance, FridayHarbor, WA
Osborne RW (1999) A historical ecology of Salish Sea ‘resi-dent’ killer whales (Orcinus orca): with implications formanagement. PhD dissertation, University of Victoria,Victoria, BC
Protected Resources Division (2004) Initial assessment ofNOAA fisheries’ critical habitat analytical review teamsfor 13 evolutionarily significant units of Pacific salmon andO. mykiss. NOAA Fisheries Protected Resources Division,Portland, OR
Romano TA, Keogh MJ, Kelly C, Feng P and others (2004)Anthropogenic sound and marine mammal health: mea-sures of the nervous and immune systems before and afterintense sound exposure. Can J Fish Aquat Sci 61:1124–1134
Safina C, Burger J (1983) Effects of human disturbance onreproductive success in the black skimmer. Condor 85:164–171
Whale Watch Operators Association Northwest (2003)Best practices guidelines—2003. Available at: www.nwwhalewatchers.org/guidelines.html
Wiles GJ (2004) Washington State status report for the killerwhale. Washington Department Fish and Wildlife,Olympia, WA
Williams R, Bain DE, Ford JKB, Trites AW (2002a) Behaviouralresponses of male killer whales to a ‘leapfrogging’ vessel.J Cet Res Manag 4:305–310
Williams R, Trites A, Bain DE (2002b) Behavioural responsesof killer whales (Orcinus orca) to whale-watching boats:opportunistic observations and experimental approaches.J Zool 256:255–270
Williams R, Lusseau D, Hammond PS (2006) Estimating rela-tive energetic costs of human disturbance to killer whales(Orcinus orca). Biol Conserv 133:301–311
Williams R, Bain DE, Smith JC, Lusseau D (2009) Effects ofvessels on behavior patterns of individual southern resi-dent killer whales Orcinus orca. Endang Species Res. 6:199–209
221
Editorial responsibility: Jason Matthiopoulos,St. Andrews, UK
Submitted: July 19, 2007; Accepted: September, 25, 2008Proofs received from author(s): December 9, 2008