Translation Series No. 3558 - Fisheries and Oceans Canada ...
Upload
independentCategory
view
1download
0
Population Structure of Humpback Whales from TheirBreeding Grounds in the South Atlantic and IndianOceansHoward C. Rosenbaum1,2,3,4*, Cristina Pomilla1,2,3, Martin Mendez1,2,4, Matthew S. Leslie1,2, Peter B.
Best5, Ken P. Findlay8, Gianna Minton6, Peter J. Ersts1,3, Timothy Collins1,6, Marcia H. Engel7,10, Sandro L.
Bonatto10, Deon P. G. H. Kotze9, Mike Meyer9, Jaco Barendse5, Meredith Thornton5, Yvette
Razafindrakoto11, Solange Ngouessono12, Michel Vely13, Jeremy Kiszka14
1 Cetacean Conservation and Research Program, Global Conservation-Marine, Wildlife Conservation Society, Bronx, New York, United States of America, 2 Sackler Institute
for Comparative Genomics and Conservation Genetics Program, American Museum of Natural History, New York, New York, United States of America, 3 American Museum
of Natural History, Center for Biodiversity and Conservation, New York, New York, United States of America, 4 Department of E3B, Columbia University, New York, New
York, United States of America, 5 University of Pretoria, Mammal Research Institute, Pretoria, Cape Town, South Africa, 6 Environment Society of Oman, Ruwi, Muscat,
Sultanate of Oman, 7 Instituto Baleia Jubarte, Caravelas, Bahia, Brazil, 8 Oceanography Department, University of Cape Town, Rondebosch, South Africa, 9 Marine and
Coastal Management, Rogge Bay, South Africa, 10 Faculdade de Biociencias, Pontifıcia Universidade Catolica do Rio Grande do Sul, Porto Alegre, Rio Grande do Sul, Brazil,
11 Wildlife Conservation Society-Madagascar Country Program, Antananarivo, Madagascar, 12 Agence Nationale des Parcs Nationaux, Ministere du Tourisme et des Parcs
Nationaux, Libreville, Gabon, 13 Association Megaptera, Paris, France, 14 Universite de La Rochelle, LIENSS, Institut du Littoral et de l’Environnement, La Rochelle, France
Abstract
Although humpback whales are among the best-studied of the large whales, population boundaries in the SouthernHemisphere (SH) have remained largely untested. We assess population structure of SH humpback whales using 1,527samples collected from whales at fourteen sampling sites within the Southwestern and Southeastern Atlantic, theSouthwestern Indian Ocean, and Northern Indian Ocean (Breeding Stocks A, B, C and X, respectively). Evaluation of mtDNApopulation structure and migration rates was carried out under different statistical frameworks. Using all genetic evidence,the results suggest significant degrees of population structure between all ocean basins, with the Southwestern andNorthern Indian Ocean most differentiated from each other. Effective migration rates were highest between theSoutheastern Atlantic and the Southwestern Indian Ocean, followed by rates within the Southeastern Atlantic, and thelowest between the Southwestern and Northern Indian Ocean. At finer scales, very low gene flow was detected betweenthe two neighbouring sub-regions in the Southeastern Atlantic, compared to high gene flow for whales within theSouthwestern Indian Ocean. Our genetic results support the current management designations proposed by theInternational Whaling Commission of Breeding Stocks A, B, C, and X as four strongly structured populations. The populationstructure patterns found in this study are likely to have been influenced by a combination of long-term maternally directedfidelity of migratory destinations, along with other ecological and oceanographic features in the region.
Citation: Rosenbaum HC, Pomilla C, Mendez M, Leslie MS, Best PB, et al. (2009) Population Structure of Humpback Whales from Their Breeding Grounds in theSouth Atlantic and Indian Oceans. PLoS ONE 4(10): e7318. doi:10.1371/journal.pone.0007318
Editor: Robert DeSalle, American Museum of Natural History, United States of America
Received April 16, 2009; Accepted August 6, 2009; Published October 8, 2009
Copyright: � 2009 Rosenbaum et al. This is an open-access article distributed under the terms of the Creative Commons Attribution License, which permitsunrestricted use, distribution, and reproduction in any medium, provided the original author and source are credited.
Funding: This material is based upon work supported by the National Research Foundation (South Africa) under Grant number 2053539. We also acknowledgeMarine and Coastal Management, South Africa, for the cruises of the research vessel Algoa and collection of samples in South Africa and Mozambique, and specialthanks go to Herman Oosthuizen. The Instituto Baleia Jubarte was sponsored by Petrleo Brasileiro S.A (PETROBRAS) and Norsul Cia. De Navegao. Funding to HCRwas provided by numerous individuals and foundations, especially the Lenfest Oceans Program. The funders had no role in study design, data collection andanalysis, decision to publish, or preparation of the manuscript.
Competing Interests: The authors have declared that no competing interests exist.
* E-mail: [email protected]
Introduction
The issue of population structure has remained a central one in
the areas of molecular ecology and conservation biology. An
understanding of ecological forces influencing dispersal and
isolation by applying robust and high-resolution molecular tools
has aided in conservation management planning [1]. A recurrent
topic in the marine environment centers on the varying degrees and
plausible mechanisms of population structure for different species.
In marine systems, barriers to gene flow are often not as conspicuous
as they are in terrestrial environments [2], making it difficult to
interpret gene flow and population differentiation patterns [3]. For
example, inter and intra-specific differences between Atlantic and
Pacific oceans are thought to have emerged by the formation of the
Panama Land Bridge, ice barriers in the Arctic, or by differential
environmental tolerance through the Arctic or the tropics [4,5].
Conversely, periods of inter-glacial warming have allowed episodic
contact between populations in the Southern and Northern
Hemispheres over evolutionary time scales [6]. Barriers to dispersal
have not fluctuated to the same extent throughout large parts of the
Southern Hemisphere (SH) [7], and therefore populations of large
migratory marine species in the SH may potentially show a higher
degree of connectivity across ocean basins over evolutionary and
demographic timeframes [8,9].
PLoS ONE | www.plosone.org 1 October 2009 | Volume 4 | Issue 10 | e7318

Social structure, long-term maternally reinforced migratory
behaviour, and vicariant events can have profound effects on the
degree of population structure detected among marine species
[10]. Ecological and environmental discontinuities such as frontal
systems, ocean currents, and abrupt changes in bathymetry can
also function as marine boundaries for some marine species
[11,12,13]. Despite the plausibility of these mechanisms affecting
population structure, we often lack sufficient information to
empirically test the significance of such relationships. An exception
to this general lack of information is the case of sea turtles [14],
which exemplifies the influence of philopatry on phylogeographi-
cal patterns, and in maintaining significant and very high levels of
genetic differentiation (Fst,0.5), despite transoceanic movements
and oceanographic influences [9,15]. Some species of large
migratory whales in the SH offer an opportunity to examine
population differences at large oceanic scales and evaluate the
influence of population history [16,17], but the influence of
ecological phenomena and environmental features on such
population structure was not fully considered. Humpback whales
are one such species to evaluate the role of ecological and
evolutionary forces in shaping population structure. They are
widely distributed throughout the SH, undertake long-distance
migrations between feeding areas and breeding grounds, and yet
typically show preference for specific coastal regions proximate to
continental shelf areas or oceanic islands [18].
Much of what we know about population differentiation among
humpback whales has resulted from studies in the North Atlantic
and North Pacific [19,20,21,22,23,24,25,26]. In general, hump-
back whales within an ocean basin in the Northern Hemisphere
(NH) mix on common sub-areas in breeding grounds but segregate
and show maternal fidelity to particular sectors on their feeding
areas [25,27,28]. This is reflected in the very high and significant
fixation indices (FST,0.4) between feeding areas and breeding
grounds in the North Pacific, and in significant indices (KST,0.04)
between feeding areas in the North Atlantic [29,30]. High and
significant degrees of population structure (FST,0.1–0.28) among
breeding concentrations have been detected in the North Pacific,
reflecting long-term population isolation between continental and
oceanic grounds proximate to Western Mexico and the Hawaiian
Archipelago, respectively [19,21,29].
There are some suggestions that the population structure
observed in the NH should apply to humpback whales in the SH
but with migration polarities seasonally reversed [31]. However,
other factors suggest this might not be the case, including the
differences between NH and SH humpback whale migration
patterns, the nature of the circumpolar Antarctic ecosystem, as
well as potential differences in other biological factors (e.g. diet and
metabolic rates). In the Southern Oceans, humpback whale
distribution on feeding areas was historically divided into six
longitudinal sectors surrounding the South Pole, termed Areas I –
VI that have been subsequently used for sub-population identity
[18,32] by the International Whaling Commission (IWC).
Seasonal distribution data between these high-latitude feeding
areas and low-latitude breeding grounds led to the designation of
seven breeding grounds and migratory corridors termed Breeding
Stocks A to G [33]. An eighth Breeding and Feeding Stock (X) in
the northern Indian Ocean, with no access to high-latitude waters
in the NH for summer feeding, has been proposed by the IWC
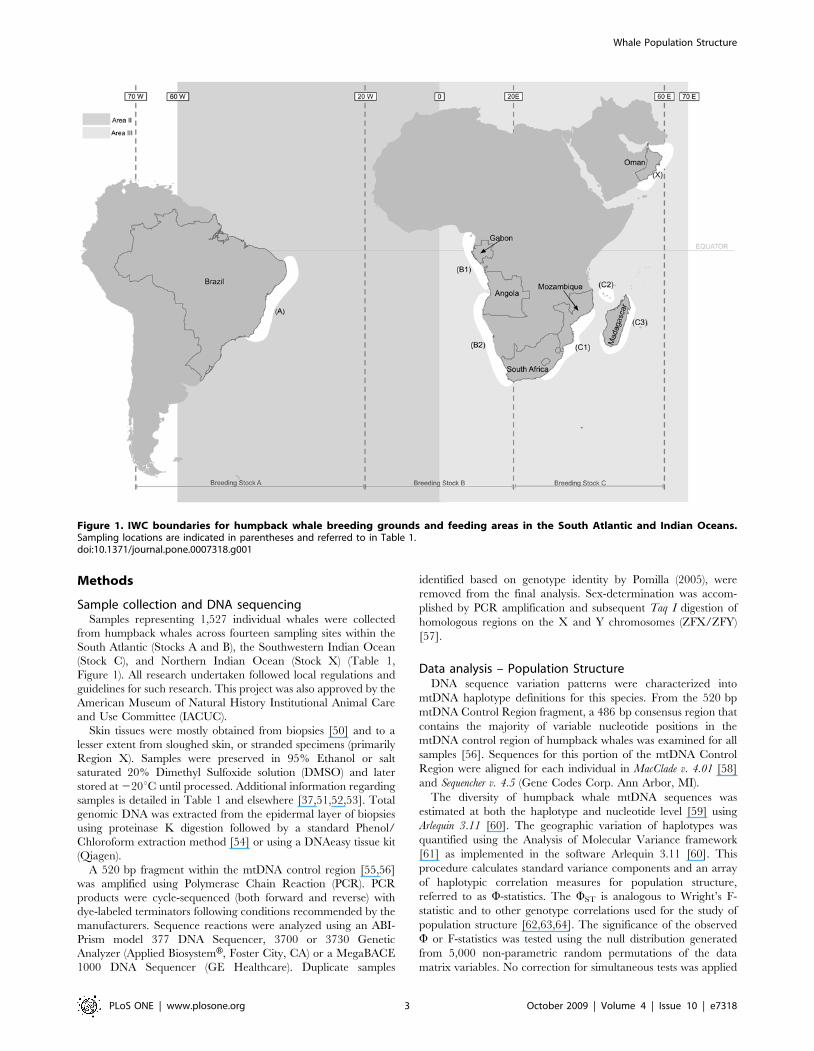
[34,35] (See Fig. 1).
Further stock subdivision at the intra-oceanic spatial scale in
the SH has been discussed by the IWC. Within the Southeast
Atlantic, humpback whales were further characterized into B1
and B2 sub populations to the north and south of 18u S,
respectively - in the vicinity of the northern end of the Walvis
Ridge and the Angola-Benguela front [33,36]. In the Southwest
Indian Ocean, three separate migratory streams of the Stock C
have been proposed [37], based largely on distributional
evidence and catch histories; one migration and breeding stock
along the continental east coast of Africa (termed C1 by the
IWC), a second utilizing the waters of the central Mozambique
Channel Islands (C2), and a third that travels along the south and
east coast of Madagascar to the relatively sheltered Antongil Bay
and potentially to other areas surrounding the coasts of
Madagascar during the winter months (C3) [38,39,40] (See
Fig. 1). The extent to which these management designations in
areas of the South Atlantic and Indian Ocean reflect whale
population history and population structure has never previously
been tested using genetic data.
Historically, research extending through first half of the 20th
century used Discovery Mark Programme data from the 1930s–
1960s to reveal the first clues to population structure and
migratory connections between feeding areas and breeding
grounds [18,41,42,43,44,45,46]. The program was established to
understand population connectivity and population dynamics to
better manage whaling. In some areas such as the eastern Indian
Ocean (Breeding Stock D) and the Southwestern Pacific (Breeding
Stock E) there were sufficient migratory connections to make
inferences regarding population structure, before genetic or
photographic data became available [42,43,47,48]. However, in
the South Atlantic and Southwestern Indian Ocean, connectivity
patterns have not been established to the same extent, primarily
due to fewer returns from the Discovery Mark Programme [46].
More recently, the development of individual identification,
satellite telemetry and particularly genetic methodologies have
provided powerful additional means of investigating cetacean
population structure and even testing the validity of some potential
biological and ecological boundaries of the management units used
by the IWC [33].
In a first step toward this objective for SH humpback whales,
Baker et al. [29] and Olavarria et al. [49] evaluated genetic data
using fixation indices to assess IWC stock designations largely from
the South Pacific breeding grounds (Breeding Stocks D, E, F and
G). The approach provided sufficient resolution and statistical
power to corroborate the large-scale oceanic stock boundaries
previously proposed by the IWC.
Our study uses a multi-year and large-scale genetic sampling
approach in the Indian and South Atlantic Oceans to study inter-
and intra-oceanic SH humpback whale population structure.
Long-term collaborative studies of humpback whales in the
Southwestern Atlantic Ocean (Breeding Stock A), the Southeast-
ern Atlantic (Breeding Stock B), the Southwestern Indian Ocean
(Breeding Stock C), and the Northern Indian Ocean (Stock X)
have facilitated these studies. Specifically, we evaluate (i) the
degree of gene flow and mtDNA structure that exists among
oceanic breeding grounds (e.g. eastern South Atlantic Ocean or
Breeding Stock B, compared to Breeding Stock C in the Western
Indian Ocean), (ii) the degree of gene flow and mtDNA structure
among sub-populations within these oceanic breeding grounds (iii)
the potential for sex-biased dispersal in relation to population
structure in the breeding grounds, and (iv) the implications of
population genetic structure for conservation management of this
species.
Overall, our results help elucidate how ecological and
evolutionary process have shaped population structure and gene
flow patterns among humpback whales distributed within the
South Atlantic and Indian Ocean (both North and South), and
allow us to test the applicability of current stock definitions used
for conservation and management of this species.
Whale Population Structure
PLoS ONE | www.plosone.org 2 October 2009 | Volume 4 | Issue 10 | e7318
Methods
Sample collection and DNA sequencingSamples representing 1,527 individual whales were collected
from humpback whales across fourteen sampling sites within the
South Atlantic (Stocks A and B), the Southwestern Indian Ocean
(Stock C), and Northern Indian Ocean (Stock X) (Table 1,
Figure 1). All research undertaken followed local regulations and
guidelines for such research. This project was also approved by the
American Museum of Natural History Institutional Animal Care
and Use Committee (IACUC).
Skin tissues were mostly obtained from biopsies [50] and to a
lesser extent from sloughed skin, or stranded specimens (primarily
Region X). Samples were preserved in 95% Ethanol or salt
saturated 20% Dimethyl Sulfoxide solution (DMSO) and later
stored at 220uC until processed. Additional information regarding
samples is detailed in Table 1 and elsewhere [37,51,52,53]. Total
genomic DNA was extracted from the epidermal layer of biopsies
using proteinase K digestion followed by a standard Phenol/
Chloroform extraction method [54] or using a DNAeasy tissue kit
(Qiagen).
A 520 bp fragment within the mtDNA control region [55,56]
was amplified using Polymerase Chain Reaction (PCR). PCR
products were cycle-sequenced (both forward and reverse) with
dye-labeled terminators following conditions recommended by the
manufacturers. Sequence reactions were analyzed using an ABI-
Prism model 377 DNA Sequencer, 3700 or 3730 Genetic
Analyzer (Applied BiosystemH, Foster City, CA) or a MegaBACE
1000 DNA Sequencer (GE Healthcare). Duplicate samples
identified based on genotype identity by Pomilla (2005), were
removed from the final analysis. Sex-determination was accom-
plished by PCR amplification and subsequent Taq I digestion of
homologous regions on the X and Y chromosomes (ZFX/ZFY)
[57].
Data analysis – Population StructureDNA sequence variation patterns were characterized into
mtDNA haplotype definitions for this species. From the 520 bp
mtDNA Control Region fragment, a 486 bp consensus region that
contains the majority of variable nucleotide positions in the
mtDNA control region of humpback whales was examined for all
samples [56]. Sequences for this portion of the mtDNA Control
Region were aligned for each individual in MacClade v. 4.01 [58]
and Sequencher v. 4.5 (Gene Codes Corp. Ann Arbor, MI).
The diversity of humpback whale mtDNA sequences was
estimated at both the haplotype and nucleotide level [59] using
Arlequin 3.11 [60]. The geographic variation of haplotypes was
quantified using the Analysis of Molecular Variance framework
[61] as implemented in the software Arlequin 3.11 [60]. This
procedure calculates standard variance components and an array
of haplotypic correlation measures for population structure,
referred to as W-statistics. The WST is analogous to Wright’s F-
statistic and to other genotype correlations used for the study of
population structure [62,63,64]. The significance of the observed
W or F-statistics was tested using the null distribution generated
from 5,000 non-parametric random permutations of the data
matrix variables. No correction for simultaneous tests was applied
Figure 1. IWC boundaries for humpback whale breeding grounds and feeding areas in the South Atlantic and Indian Oceans.Sampling locations are indicated in parentheses and referred to in Table 1.doi:10.1371/journal.pone.0007318.g001
Whale Population Structure
PLoS ONE | www.plosone.org 3 October 2009 | Volume 4 | Issue 10 | e7318
to significance levels of pairwise comparisons [65,66]. A
corresponding Chi-square analysis was conducted in DNnaSP
[67].
Given the large degree of sampling for each region, we are able
to investigate population structure at different spatial scales, as well
as controlling for sex-biased structure. The data were first
partitioned according to Breeding Stocks (A, B, C, and X) and
then into sub-populations within Breeding Stocks (B1, B2, C1, C2,
C3; see Figure 1 and Table 1) [33]. Data were further divided by
gender to evaluate the effect of sex on population structure for all
breeding stocks. For effects of sex, we evaluated differences
between males, females, and males plus females, and whether the
incorporation of non-sexed animals into the sample pool produced
changes in our evaluation of sex effects on population structure.
Data Analysis-Migration Rates between BreedingGrounds
In order to estimate effective migration rates and divergence
times between neighbouring breeding stocks in a stepping-stone
fashion (Stock A vs. Stock B, Stock B vs. Stock C, Stock C vs.
Stock X) we used a maximum-likelihood framework based on
coalescence theory, implemented in the programs MDIV and
MIGRATE 2.0.3 [68,69]. Our rationale was to use MDIV to
provide estimates of symmetric migration rates and explore the
possibility of asymmetric migration included in the MIGRATE
algorithm. For the latter, we subdivided Region C1 into
Mozambique (M) and Eastern South Africa (ESA), and C3 into
Antongil Bay (AB) and Southern Madagascar (SM) in order to
assess potential differences in gene flow directionality between
these sub-populations.
MDIV was utilized to produce effective migration rate and
divergence time estimates among neighbouring Breeding Stocks
(A, B, C and X). This package uses a Markov Chain Monte Carlo
(MCMC) procedure to jointly estimate multiple parameters for
pairs of populations in a Maximum Likelihood framework. MDIV
estimates the migration rate per gene per generation between
populations scaled by the effective population size (M = 2Nem), the
time since the two populations diverged scaled by the effective
population size (T = t/2 Ne), and the parameter theta (h), which is a
product of the effective population size and the mutation rate of
the studied gene region, (h= 4Nem).
Markov chains of 56106 cycles were run with a burn-in time of
56105 cycles to minimize dependence on initial conditions. The
maximum value for the theta parameter was theta = 0. The choice
of theta = 0 provides the model with a flat (uninformative) prior
hypothesis, which has the least influence on the parameter
estimation. Values for Mmax (maximum value for the scaled
migration rate) and Tmax (maximum value for the scaled
divergence time) were the result of a sensitivity analysis to assess
the Markov Chain convergence with different values for both
parameters. A Tmax of 5 was well above the estimated T in all of
our sensitivity computations, therefore proving an appropriate
choice for the parameter estimation. The Mmax used for
estimating M varied between Tmax = 10 to Tmax = 35 depending
on the population comparison (Mmax A-B = 30, Mmax B-C = 35,
Mmax C-X = 10). A minimum of ten converged runs for each
comparison was used to provide average M values and
corresponding standard deviations.
MIGRATE provides estimates of M (m/m) and H (2Nem) where
m is the immigration rate, m the mutation rate, and Ne the effective
population size. The product HM results in the number of
immigrants per generation 2Nem (from now on reported simply as
Nem). We adopted a migration matrix model allowing for
asymmetric migration rates between regions and variable
subpopulation sizes. The following Markov chain scheme was
implemented: 15 short chains (dememorization: 10,000 genealo-
gies, recorded genealogies: 500, sampling increment: 100), and one
long chain (dememorization: 10,000 genealogies, recorded gene-
alogies: 40,000, sampling increment: 100).
Results
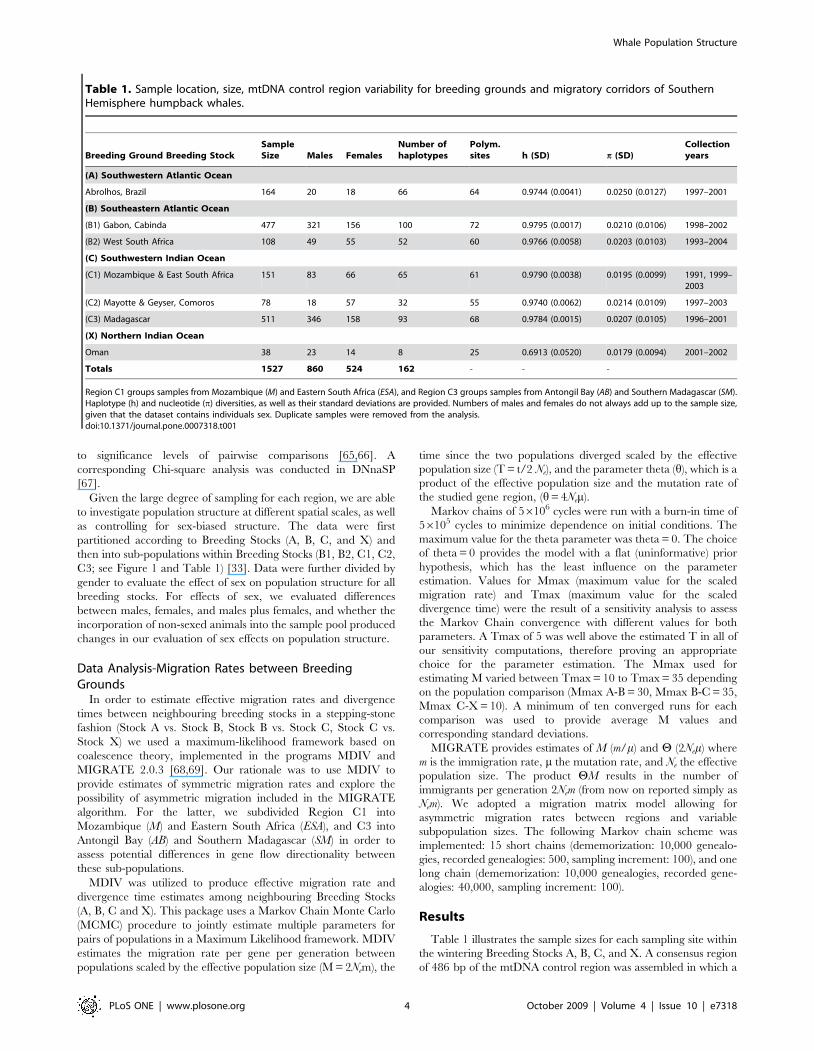
Table 1 illustrates the sample sizes for each sampling site within
the wintering Breeding Stocks A, B, C, and X. A consensus region
of 486 bp of the mtDNA control region was assembled in which a
Table 1. Sample location, size, mtDNA control region variability for breeding grounds and migratory corridors of SouthernHemisphere humpback whales.
Breeding Ground Breeding StockSampleSize Males Females
Number ofhaplotypes
Polym.sites h (SD) p (SD)
Collectionyears
(A) Southwestern Atlantic Ocean
Abrolhos, Brazil 164 20 18 66 64 0.9744 (0.0041) 0.0250 (0.0127) 1997–2001
(B) Southeastern Atlantic Ocean
(B1) Gabon, Cabinda 477 321 156 100 72 0.9795 (0.0017) 0.0210 (0.0106) 1998–2002
(B2) West South Africa 108 49 55 52 60 0.9766 (0.0058) 0.0203 (0.0103) 1993–2004
(C) Southwestern Indian Ocean
(C1) Mozambique & East South Africa 151 83 66 65 61 0.9790 (0.0038) 0.0195 (0.0099) 1991, 1999–2003
(C2) Mayotte & Geyser, Comoros 78 18 57 32 55 0.9740 (0.0062) 0.0214 (0.0109) 1997–2003
(C3) Madagascar 511 346 158 93 68 0.9784 (0.0015) 0.0207 (0.0105) 1996–2001
(X) Northern Indian Ocean
Oman 38 23 14 8 25 0.6913 (0.0520) 0.0179 (0.0094) 2001–2002
Totals 1527 860 524 162 - - -
Region C1 groups samples from Mozambique (M) and Eastern South Africa (ESA), and Region C3 groups samples from Antongil Bay (AB) and Southern Madagascar (SM).Haplotype (h) and nucleotide (p) diversities, as well as their standard deviations are provided. Numbers of males and females do not always add up to the sample size,given that the dataset contains individuals sex. Duplicate samples were removed from the analysis.doi:10.1371/journal.pone.0007318.t001
Whale Population Structure
PLoS ONE | www.plosone.org 4 October 2009 | Volume 4 | Issue 10 | e7318

total of 162 maternal haplotypes (Genbank accession numbers
GQ913691-GQ913852) was detected from 25–72 polymorphic
sites (shown in Table 1 with numbers of haplotypes for each area).
A subset of samples from Brazil (n<20) had slightly fewer than
486 bp of sequences at the 39 end of the Control Region [51].
However, incorporation of missing data did not affect the
assignment of these sequences to haplotype definitions as other
variable sites defined a particular haplotype. When polymorphic
sites defining haplotypes in these samples were not available, and
sequences matched to more than one haplotype, alternative
scenarios of matching to other haplotypes were tested to assess
their influence on the larger dataset. No significant differences
were found. Haplotype diversity ranged from 0.974–0.980 for
Breeding Stocks A, B, and C to the lowest haplotype diversity of
0.691 for Oman in Stock X. Nucleotide diversity estimates ranged
between 0.018 and 0.025 for all four regions.
For the global AMOVA analysis, significant differences were
found between the four Breeding Stocks A, B, C, and X for both
WST and FST (Table 2). Chi-square tests were also highly
significant (Table 3). However, nearly all of the molecular variance
was attributed to differences in ‘within-site’ variation detected for
both test statistics. Sex (males, females, and females+males [no
unknowns]) had no significant effect on global population structure
as the overall AMOVA results and Chi-square tests were highly
significant for each gender stratum (Tables 2 and 3). However,
males exhibit smaller degrees of genetic structure than females and
males + females. Any plausible inter-annual comparisons were not
significant (data not shown), indicating that there are no temporal
sampling influences on the results.
When either the total sample, males plus females or females
alone were tested, all pairwise comparisons among Breeding
Stocks and sub-populations within Breeding Stocks using FST were
significantly different (p,0.05) from one another, except between
C2 vs C3 (Tables 4, 5, 6). When only males were considered, all
pairwise comparisons were significantly different with the
exception of the following: B1 vs. B2 or C2; B2 vs. C1, C2 or
C3; C1 vs. C2 or C3; and C2 vs. C3 (Table 7). For pairwise
comparisons based on WST, the following comparisons were
statistically significant when using either all samples available or
males+females: A vs. B1; B1 vs. C1or C3; and X vs. all population
comparisons (Tables 4 and 5). For females: A vs. B1, B2 and C2;
B1 vs. C1and C3; and X vs. all comparisons were statistically
significant (Table 6). For males: A vs. B1, B2 and C3 were
significantly different, while B1 vs. C3 was also significantly
different, and all males from Stock X were statistically different
from all other stocks (Table 7).
The highest effective migration rates resulting from our analysis
utilizing MDIV were between Breeding Stocks B and C, followed
by the estimated effective migration rate between Breeding Stocks
A and B, with the lowest migration between Breeding Stocks C
Table 2. AMOVA results for breeding areas A, B, C and X ofSouthern Hemisphere humpback whales using moleculardistances (Wst) and haplotype frequencies (Fst).
Samples Stock Global Fst (p value) Global Wst (p value)
All samples ABCX 0.01849 (0.00000) 0.01131 (0.00000)
M+F ABCX 0.02011 (0.00000) 0.01232 (0.00000)
Females ABCX 0.02145 (0.00000) 0.01476 (0.00099)
Males ABCX 0.01873 (0.00000) 0.01203 (0.00089)
The AMOVAs (or ‘Global’ value) are shown for the entire dataset (All samples),animals of known sex from molecular sexing (M+F), females and males. The P-value is the probability of a more extreme variance component or F-value thanthat observed, in comparison to a null distribution of these values on 5,000random permutations of the data matrix. Significant values (p,0.05) arehighlighted in bold.doi:10.1371/journal.pone.0007318.t002
Table 3. Chi-Square test for differences in haplotypefrequencies for four breeding Regions (A, B, C and X) ofSouthern Hemisphere humpback whales.
Samples Stock X2 p DF
All samples ABCX 1143.127 0.000 390
M+F ABCX 967.074 0.000 375
Females ABCX 524.924 0.000 300
Males ABCX 616.676 0.000 330
All strata based on sex of animals are shown. The P-value is the probability of amore extreme variance component or F-value than that observed, incomparison to a null distribution of these values on 1,000 random permutationsof the data matrix. Significant values (p,0.05) are highlighted in bold.doi:10.1371/journal.pone.0007318.t003
Table 4. Pairwise measures of genetic divergence in variouspopulations of Southern Hemisphere humpback whales,using all samples (Table 4), males + females (Table 5), femalesonly (Table 6) and males only (Table 7).
A B1 B2 C1 C2 C3 X
A 0.0041 0.0042 0.0037 0.0066 0.0036 0.1034
B1 0.0073 0.0000 0.0049 0.0016 0.0043 0.0939
B2 0.0098 0.0030 0.0019 0.0000 0.0030 0.1057
C1 0.0148 0.0061 0.0057 0.0019 0.0000 0.0948
C2 0.0166 0.0084 0.0064 0.0052 0.0002 0.0963
C3 0.0120 0.0072 0.0053 0.0029 0.0020 0.0797
X 0.1473 0.1302 0.1280 0.1257 0.1175 0.1163
Pairwise Wst and Fst values are above and below the diagonal, respectively.Significant values are highlighted in bold.doi:10.1371/journal.pone.0007318.t004
Table 5. Pairwise measures of genetic divergence in variouspopulations of Southern Hemisphere humpback whales,using all samples (Table 4), males + females (Table 5), femalesonly (Table 6) and males only (Table 7).
A B1 B2 C1 C2 C3 X
A 0.0118 0.0106 0.0058 0.0136 0.0046 0.0887
B1 0.0143 0.0000 0.0047 0.0019 0.0041 0.0899
B2 0.0168 0.0025 0.0008 0.0000 0.0018 0.1000
C1 0.0202 0.0061 0.0055 0.0016 0.0000 0.0891
C2 0.0250 0.0089 0.0071 0.0055 0.0000 0.0902
C3 0.0166 0.0072 0.0051 0.0030 0.0021 0.0767
X 0.1678 0.1299 0.1299 0.1246 0.1163 0.1160
Pairwise Wst and Fst values are above and below the diagonal, respectively.Significant values are highlighted in bold.doi:10.1371/journal.pone.0007318.t005
Whale Population Structure
PLoS ONE | www.plosone.org 5 October 2009 | Volume 4 | Issue 10 | e7318

and X. Population divergence time estimates are inversely related
to the effective migration rates, with divergence time between
Breeding Stocks C and X being the greatest (Table 8). Using
MIGRATE to assess asymmetric effective migration patterns, the
highest degrees of migrants inferred occurs from: Breeding Stock
B1 to A; C2 to C1-ESA; C3 to B2, C2 or C1-ESA; and C1-ESA to
B2 (Table 9). Rates of migration with Nem/generation #5, but .1,
suggests limited gene flow from B1 to B2 or C3; C1-M to B1 or B2;
C1-ESA to B1 or C3. With #1 Nem/generation based on mtDNA
lineages analysis, the following comparisons are characterized by
either a very low or a lack of gene flow: Breeding Stock B2 to B1,
C3-SM, C2, C1-M or C1-ESA; C to X; and X to C. Interestingly,
limited or very low gene flow rates were detected for whales
between the two sub- populations in Breeding Stock B (B1 and
B2), compared to high gene flow rates for whales within Breeding
Stock C.
Discussion
Oceanic Population StructureOverall, the tests for population differentiation based on
haplotype frequencies and molecular distances were significant
among Breeding Stocks A, B, C and X, as well as between
particular sub- populations within these Stocks (only the values for
males alone showed less discrimination, and these will be discussed
below). Therefore, the AMOVA, Chi square and pairwise test
results presented here generally support the current IWC
designation of Breeding Stocks A, B, C, and X. The magnitude
of these fixation indices is consistent with other comparisons of SH
humpback whale breeding stocks [49]. On an evolutionary scale,
these data suggest long-term maternal transmission of migration
routes and fidelity to breeding grounds for whales in the South
Atlantic and Southwestern Indian Ocean that reinforce population
structure, with a degree of gene flow that likely erodes strong
differentiation.
Within the Southern Atlantic Ocean, humpback whales
congregate in the waters off northeastern Brazil (Abrolhos Banks,
Breeding Stock A) and throughout the Gulf of Guinea (Breeding
Stock B). Our findings indicate differentiated demographic
aggregations of breeding individuals in these two stocks with
small evolutionary divergence, as evidenced by significant
differences in haplotype frequencies, coupled with small and
non-significant molecular distances and high migration rates.
Recent genotypic capture-recapture, satellite telemetry studies,
and a limited number of photographic comparisons have
Table 6. Pairwise measures of genetic divergence in variouspopulations of Southern Hemisphere humpback whales,using all samples (Table 4), males + females (Table 5), femalesonly (Table 6) and males only (Table 7).
A B1 B2 C1 C2 C3 X
A 0.0550 0.0299 0.0210 0.0378 0.0301 0.1427
B1 0.0237 0.0035 0.0116 0.0034 0.0056 0.0733
B2 0.0278 0.0016 0.0000 0.0000 0.0000 0.0827
C1 0.0426 0.0102 0.0105 0.0000 0.0000 0.0876
C2 0.0366 0.0102 0.0078 0.0073 0.0000 0.0676
C3 0.0258 0.0088 0.0064 0.0086 0.0029 0.0648
X 0.1696 0.1144 0.1093 0.1087 0.0861 0.0997
Pairwise Wst and Fst values are above and below the diagonal, respectively.Significant values are highlighted in bold.doi:10.1371/journal.pone.0007318.t006
Table 7. Pairwise measures of genetic divergence in variouspopulations of Southern Hemisphere humpback whales,using all samples (Table 4), males + females (Table 5), femalesonly (Table 6) and males only (Table 7).
A B1 B2 C1 C2 C3 X
A 0.0359 0.0386 0.0185 0.0193 0.0298 0.0854
B1 0.0235 0.0000 0.0053 0.0000 0.0027 0.0811
B2 0.0225 0.0015 0.0057 0.0000 0.0003 0.0918
C1 0.0210 0.0056 0.0032 0.0000 0.0000 0.0740
C2 0.0281 0.0002 0.0000 0.0000 0.0000 0.0771
C3 0.0230 0.0060 0.0033 0.0016 0.0000 0.0669
X 0.1681 0.1256 0.1313 0.1215 0.1412 0.1111
Pairwise Wst and Fst values are above and below the diagonal, respectively.Significant values are highlighted in bold.doi:10.1371/journal.pone.0007318.t007
Table 8. Likelihood-based estimates of migration rate anddivergence time between population pairs of SouthernHemisphere humpback whales, performed with softwareMDIV.
M [2Nem] (SE) T [t/2Ne] (SE) h [4Nm] (SE)
A-B 25.935 (1.612) 0.063 (0.017) 15.811 (0.458)
B-C 32.547 (1.12) 0.071 (0.01) 17.593 (0.155)
C-X 5.179 (0.335) 0.145 (0.022) 17.131 (0.354)
At least ten runs were averaged to obtain the shown values. M and T representthe population migration rate and population divergence time per generationscaled by population size, respectively, and theta is directly proportional to theeffective population size and the mutation rate, according to h= 4Nm.doi:10.1371/journal.pone.0007318.t008
Table 9. Estimated number of migrants per generation (Nem)exchanged between neighbouring Southern Hemispherehumpback whale Breeding Regions, as estimated using theprogram MIGRATE.
A+ B1+ B2+ C3N+ C3S+ C2+ C1N+ C1S+ X+
A - 29.555 2.454 * * * * * *
B1 3.492 - 0.386 0.193 0.394 2.125 2.099 1.159 *
B2 1.551 2.183 - 37.132 10.854 2.326 1.551 14.240 *
C3N * 2.123 5.601 - 1.600 2.836 6.531 1.067 0.267
C3S * 4.885 0.696 6.613 - 0.348 0.348 2.436 1.139
C2 * 13.054 0.000 27.308 4.656 - 0.665 0.665 0.693
C1N * 20.749 0.000 19.680 5.238 2.829 - 0.655 0.000
C1S * 25.579 0.000 1.518 1.012 1.012 0.506 - 0.506
X * * * 0.285 0.570 0.285 0.285 0.285 -
Magnitude and directionality are shown by reading the first row (ie A+) in thefirst place, and then matching the appropriate cell with regions listed inleftmost column. (*) Comparisons between Breeding Regions A or B vs. X, and Avs. C are omitted, as they are not neighbouring Breeding Stocks. Subpopulations in Breeding Regions C1 and C3 were used for the MIGRATEanalysis.doi:10.1371/journal.pone.0007318.t009
Whale Population Structure
PLoS ONE | www.plosone.org 6 October 2009 | Volume 4 | Issue 10 | e7318

established provisional migratory connections between breeding
grounds and feeding areas for each of these two populations based
on movements of a number of individuals [51,70,71].
Using the available evidence collectively, it appears the majority
of whales in Breeding Stock A retain their fidelity to breeding
grounds off Brazil and to feeding areas in the western South
Atlantic, where historical concentrations once existed [51,71].
Similarly, some humpback whales that breed in the Gulf of Guinea
feed in areas south-west of Southern Africa in the eastern South
Atlantic near Bouvet Island (54uS) [72], classified by IUCN as a
maritime Antarctic Island, south of the Antarctic Polar Front
[72,73]. While no transoceanic migration events have been
detected, our data shows evidence of exchange or mixing between
these two populations on opposites sides of the Atlantic Ocean.
Interestingly, an acoustic analysis of humpback whale song in a
single breeding season found identical song structure amongst the
whales of Breeding Stocks A and B [74]. The nature of cultural
transmission of song [75,76] and change in theme composition
that occurs through time, coupled with significant, but low genetic
differentiation between these stocks, support contact among males
of these two populations somewhere in their annual migratory
cycle or on their feeding areas [36]. Mediation of gene flow may
occur south of the breeding grounds or on feeding areas. Singing
can occur on the feeding areas [77] where mixing between whales
from different populations may be most likely to occur.
The differentiation between whales from Breeding Stocks B and
C is largely evident through statistically significant partitioning
between FST or chi-square values. When assessing the degree of
differentiation in relation to migration patterns, the effective
numbers of migrants from these populations (Tables 8 and 9) are
generally the highest for whales in two different oceanic regions.
Direct movements of an individual whale based on genetic capture-
recapture have also been detected between these regions [78]. The
exact path for oceanic inter-change remains unknown, and the level
to which it recurs is not understood. The potential for this degree of
gene flow to be mediated through mixing of whales on common
feeding areas in the Southern Oceans (south of 50 degrees), and
resultant movements to neighbouring Breeding Stocks where gene
flow would occur, is being investigated using mtDNA and
microsatellites (Loo et al. in prep). Population genetic theory
indicates that FST values of 0.01 correspond to approximately 25
migrant individuals per generation (which are consistent with results
from MIGRATE). For humpback whales, this could amount to 1 or
2 migrants per annum, and would suggest these populations are
demographically and temporally structured on the Breeding
Grounds, yet can and do readily exchange individuals [78].
With respect to the lack of differentiation among pairwise
comparisons using molecular distances between the South Atlantic
and Southwestern Indian Ocean (Breeding Stocks B and C), it is
possible that the lack of structure is due to retained common
ancestry. Phyleogeographic analyses of these mtDNA lineages also
support a high degree of ancestry [data not shown, but also see
51]. All of the maternal lineages identified in this region represent
evolutionary closely related groups, defined by low molecular
distances between haplotypes. However, it is difficult to differen-
tiate between the retention of ancestral polymorphism and levels of
recent connectivity. Given the estimated migration rates between
B2 and C1, and the higher statistical significance of the haplotypic
distances as compared to molecular distances, we would favor the
scenario of some degree of contemporary exchange, for example,
between these two adjacent sub- populations. This scenario as
determined from the mtDNA population structure and gene flow
analyses is consistent with the inter-ocean migration event
reported in [78].
High statistical significance for both haplotype frequencies and
molecular distances indicates strong genetic structure between
stock X and all other Breeding Stocks including Stock C. To date,
no photographic matches have been found between Stocks X and
C [79]. The majority of the population structure results are highly
significant (FST ,0.1, Phi-ST ,0.9, and all significance levels
#0.05), more so than any other pairwise comparison between
Breeding Stocks in this study and elsewhere in the SH [49]. The
FST values detected between Breeding Stocks C and X (FST
,0.11–0.17) are among the highest recorded for population
differentiation among any humpback whale populations world-
wide, and begin to approach values representing long-term
phylogeographic patterns (FST ,0.5) of other marine species,
such as marine turtles [14].
Furthermore, the effective number of migrants per generation
between Breeding Stock C sub- populations and Region X is the
lowest when contrasted with any other pairwise comparisons in
this study. These results taken collectively with the evidence that
all but one of the haplotypes are shared between Northern Indian
Ocean and Southwestern Indian Ocean, suggest that a high
degree of shared ancestral polymorphism in mtDNA control
region lineages is maintained between these highly differentiated
populations in the Southwestern and Northern Indian Oceans.
These results are consistent with an isolated population of
humpback whales in the northern Indian Ocean.
Research indicates that the population size off the coast of
Oman is small (,200 individuals) [53]. However, other portions of
the expected range of the population in the Northern Indian
Ocean have not been systematically surveyed [53]. This could
potentially influence interpretations concerning population struc-
ture. The high haplotype diversities among the other populations
in this study, coupled with a smaller population size from Breeding
Stock X, could create a bias toward statistically significant
differentiation when contrasted with populations with larger
sample sizes. This could occur if whaling had a differential impact
on particular maternal lineages (for example, more common
lineages or lineages associated with particular geographic areas).
Although in the case with humpback whales from Breeding Stock
X we do find private mtDNA haplotypes, the majority of lineages
are the same as those found among the other Breeding Stocks,
differing significantly in frequency. Foetal evidence from whaling
data indicates that northern Indian Ocean humpback whales
adhere to a NH humpback breeding cycle with mating and calving
occurring between January and May [35], providing a likely
barrier to inter-breeding with whales in the SH [53]. Further
evidence of feeding and breeding behaviours (recording of song),
as well as the year-round sightings of individual whales, suggested
that whales in this area may not exhibit typical migratory
characteristics associated with NH or SH populations. Given the
high degree of population differentiation inferred from mtDNA
and the low population size, the survival of this small and isolated
population is of great concern to the international scientific and
conservation community [53].
Sub-Population StructureNearly all B and C sub- population comparisons (with the
exception of C2 vs. C3) were statistically significant when assessed
by the FST index for all samples, males plus females, and females
alone (Tables 4, 5 and 6). The lack of significant FST for C2 and
C3 is consistent with photographic recaptures between these sub-
populations [33]. Samples and sampling effort from whales in the
Mozambique Channel (C2) have been limited. A more complete
analysis of whales in the C2 sub-population is needed to better
evaluate the degree of connectivity of the C2 and C3 sub-
Whale Population Structure
PLoS ONE | www.plosone.org 7 October 2009 | Volume 4 | Issue 10 | e7318

populations. Comparisons between C1 (East South Africa) and C3
(Antongil Bay) showed significant FST values (albeit low) and high
rates of gene flow. These results, taken together with the
population structure data, could suggest current demographic
independence, with some degree of contemporary exchange, and
likely a high degree of shared ancestry among whales in sub-
populations of Breeding Stock C in the Southwestern Indian
Ocean. However, further analyses that critically examine inter-
change of individuals, directionality, and whether these represent
mature adults are needed for discriminating between ecolo-
gical, reproductive and evolutionary influences in population
structuring.
Conversely, whales sampled from Breeding Stock B1 are
significantly differentiated from whales of Breeding Stock B2,
and very low gene flow rates are detected. This is contrary to the
most fundamental expectations of isolation-by-distance, where
whales from the adjacent B1 and B2 regions were thought to be
part of the same breeding population. Satellite telemetry studies
show two individuals moving from B1 to areas well to the west of
survey/sampling range of B2, offshore from the Walvis Ridge [72].
The mtDNA differentiation of B1 and B2 sub-populations presents
a very interesting case in the field of molecular ecology where
populations appear to be differentiated in the marine environment
in the absence of a geographic barrier, possibly due to
environmental or ecological factors, or some undetected temporal
stratification of matrilineal lineages within the sampling of whales
from the B2 sub- population.
Recent surveys indicate that humpback whales are found in the
southern range of B2 (west South Africa) during summer [80], and
photographic identification shows individuals occurring in these
waters in several different months. Combined with historical
catches off Namibia during austral summer months [81], recent
records of whales defecating and feeding off the west coast of
South Africa, and the known high productivity of the southern
Benguela region [82], these data suggest that the southern section
of the B2 sub- population may serve more as a feeding location
and migratory corridor and that a second unsurveyed breeding
population may exist further north in B2 [33]. These animals
would likely breed off Angola, which had known concentrations
for 19th and 20th century whalers [83] or potentially as far south as
Southern Angola near the Agulhas-Benguela Front. Animals
sighted and caught during coastal whaling operations off Namibia
(Luderitz and Walvis Bay) are likely to be part of the population
undertaking seasonal migration from winter breeding grounds
further north. However, further surveying and sampling is
necessary to confirm relationships to B1 and B2 sub-populations.
Influence of sex-biased movements and samplingEvaluating mtDNA control region lineages stratified by sex
provides a preliminary evaluation of sex-biased effects of dispersal
in terms of population structure, although a comparative analysis
with bi-parentally inherited markers would be necessary to fully
account for male-driven population structure. Because females
pass on their mtDNA haplotype to their offspring, they can
homogenize the mtDNA structure through dispersal coupled with
reproductive events in different populations. Males, on the other
hand, do not significantly influence mtDNA structure. If despite
this fact females show higher mtDNA structure than males, it
would only be conservative to suggest that dispersal is biased
toward males and that females exhibit a significant degree of
phylopatry. The typical presumption in the social system of baleen
whales is that despite the fidelity to particular areas, males will
generally disperse more widely than females, resulting in higher
levels of female mtDNA structure as compared to male mtDNA
structure. When comparing our male and female fixation indices
we observe a markedly higher female structure (i.e. a change in
detecting a significance level for population pairwise comparisons)
for FST and WST pairwise comparisons between Stocks A, B, C and
X (Tables 2 and 4–7). Furthermore males exhibit lower degrees of
genetic structure when contrasted with all other types of data-
groupings for FST comparisons, and varying degrees of genetic
structure for WST pairwise comparisons. Whereas these data would
support the assumption of female phylopatry and male dispersal
for humpback whales in our study area, we emphasize that
mtDNA results should be cautiously evaluated in the absence of
nuclear or male-specific molecular markers.
At a smaller spatial scale, most pairwise FST and WST
comparisons among males between Breeding Stocks B and C
were not significant (Table 7). The mtDNA AMOVA and pairwise
FST are again suggestive of some degree of female fidelity to
Breeding Stocks, and would be more consistent with patterns of
increased male dispersal and migration between sub- populations
within Breeding Stocks or between Breeding Stocks.
For WST tests, females generally exhibited non-significance in
the pairwise comparisons for many of the sub- population
comparisons. Although these results are largely incongruent with
the FST pairwise comparisons, this is an expected outcome when
stocks present small evolutionary divergence. In addition, these
results may be biased by the fact that, with the exception of Brazil
(males = 20;females = 18), West South Africa (55:49) and Mayotte/
Comoros (57:18), there is a considerable sampling bias toward
males on these breeding grounds [84] (see Table 1). This is a
typical problem on humpback whale breeding grounds, and it is
unclear whether these are true ‘‘sampling’’ biases (i.e. easier
acquisition of samples from males) or whether females are truly not
available (i.e. sex bias). With relatively fewer known females
available for sampling, the most common haplotypes increase in
frequency, typically missing rare or infrequent haplotypes in
sampling events. This results in significantly lower molecular
distances among the available haplotypes, contributing to non-
significant WST values, but still allowing for significant differences
between haplotype frequencies per se, and therefore significant FST
values. This is one of the more parsimonious explanations for the
observed pattern given the genetic results and issue of female
availability on the breeding grounds.
Biogeography and Migration PatternsInteresting and consistent biogeographic patterns for marine
species are beginning to emerge for migratory marine species in
their environments. From detailed studies of mtDNA control
region sequences of green sea turtle populations (Chelonia mydas) in
the Southwestern Indian Ocean, Bourjea et al. [15] challenged
traditional hypotheses concerning the movements of green sea
turtles between the Atlantic and Indian Oceans. While colder
waters of the Benguela Current System have traditionally been
considered a thermal barrier to gene flow for some warm-water
marine species, Bourjea et al. [15] found evidence that movement
of sea turtles between these ocean basins has occurred, although
not at high rates. Such inter-ocean basin movement may be
facilitated by Agulhas Current eddies or rings which convey
significant quantities of Agulhas Current water into the South
Atlantic. This oceanographic discontinuity would affect a
stenothermic species such as a marine turtle, but would likely
not have as much relevance to humpback whales during
migration. However, Perrin [85] has suggested that the interface
between Agulhas and Benguela currents has likely had an effect for
movements of cetaceans over evolutionary time. Furthermore,
recent research is beginning to reveal that water temperature can
Whale Population Structure
PLoS ONE | www.plosone.org 8 October 2009 | Volume 4 | Issue 10 | e7318

play an important role for humpback whale breeding grounds
[86].
The only movement directly detected for humpback whales
between these ocean basins is from East to West, and represent
movements from the Indian to the Atlantic Ocean [78]. The Nem
values as calculated in MDIV and MIGRATE, being larger from
Stock C to Stock B2 than from B2 to C, support this finding.
Prevalent migration from the Indian to the South Atlantic Ocean
via southern Africa has been proposed for the big eye tuna
(Thunnus obesus), whereas higher migration in the opposite direction
has been suggested for hammered sharks and (Sphyrna lewini) and
the green turtle (Chelonia mydas) [15,87,88]. Our data on humpback
whales can be explained either by exchange events between both
Breeding Stocks around the South African coast or by movement
events in the Southern Ocean during the feeding season, followed
by switching of migratory routes. Whereas the first possibility
would favour a relationship between humpback whale movement
patterns and oceanographic features in the Southern African
region, such local oceanographic features would have no influence
over exchange events occurring in the feeding areas.
The location of the Angola Current/Benguela Current Front
coincides with a major hiatus in the availability of genetic samples, most
being either from Gabon (north of 5oS) or west south Africa (south of
32oS). Although a role for this Front as the possible divisor between the
two Breeding Stocks along the West Coast of Africa [33,36] is
supported by mtDNA differentiation and satellite tagging data [72],
this may be coincidental with the geographic nature of collected
samples and requires further analysis particularly from humpback
whales off the coast of Angola. Furthermore, from a biogeography
perspective, the migratory destinations for breeding grounds in the
eastern South Atlantic Ocean (Breeding Stock B1, near the equator)
and in the western Indian Ocean (Breeding Stock C, considerably
south of the equator, but within the tropics) raises the question about
particular characteristics that humpback whales seek for a breeding
ground. In this case, it may be that differences in water temperatures
(<24uC) help dictate movements to breeding grounds at oceanic scale
[86]. Two SH humpback whale breeding grounds, one in the eastern
equatorial Pacific (G Breeding Stock & central American Breeding
grounds) and the other in the eastern South Atlantic/Gulf of Guinea
(B1 Breeding Stock), occur north of the equator where SSTs $24uC.
Examination of the location of breeding grounds for SH humpback
whales indicates these two regions are considerably to the north of
other SH breeding grounds [89], and suggest that the Benguela along
with the Humbolt/Peru Current systems influence the location of
breeding grounds for these populations [86].
Summary and Management ImplicationsMost populations of humpback whales became severely
depleted following intensive periods of whaling that included
18th and 19th century pelagic whaling [83], coastal whaling
operations [90], and more mechanized commercial whaling and
floating factories in the 20th century [90,91]. With the cessation on
whaling of SH humpback whales in 1963 (and despite the
continuation of illegal Soviet whaling activities into the early
1970’s), certain depleted populations are now undergoing
significant recoveries [89,90,92,93,94,95]. Genetic assessments to
evaluate population structure are the backbone of Management
Unit (MU) designations, which have proven key elements of
prioritization in conservation and management strategies [1].
The combined genetic evidence suggests that there is a
significant degree of population structure for humpback whale
Breeding Stocks within the Indian and South Atlantic Oceans.
The Breeding Stocks in the Northern and Southwestern Indian
Ocean are the most differentiated from each other, providing
further evidence for the isolated nature of the population in the
Northern Indian Ocean. Similar patterns of oceanic population
structure are broadly observed in the Southeastern Indian Ocean,
for Breeding Stock D off Western Australia, and in the South
Pacific for Breeding Stocks E–G [49]. Based on an analysis of 1112
samples (not individuals) using mtDNA control region sequences,
Olavarria et al. [49] found significant differentiation at the
haplotype and nucleotide levels between 6 different breeding
grounds, which fit within 4 larger Breeding Stocks, defined by the
IWC. In that study, the authors suggest that their large-scale
mtDNA comparisons demonstrate sufficient differentiation
(FST ,0.01–0.07) to support the defined Breeding Stocks, and
sub-population structure in the South Pacific Ocean.
While significant mtDNA population structure clearly exists
between Southeastern Atlantic and Southwestern Indian Ocean,
(Stocks B and C), the magnitude of such structure is relatively weak
in relation to the other comparisons in our study. This is also
evidenced by the estimated migration rates, which suggest that
some level of mixing occurs between humpback whales from these
populations. The mtDNA results presented here show 1)
significant genetic differentiation between oceanic Breeding Stocks
2) genetic differentiation between sub-populations with some
degrees of gene flow between sub-populations within oceanic
population structure, and 3) oceanographic phenomena likely
influencing humpback whale population structure. An integrative
approach combining our genetic analyses with bi-parentally
inherited molecular markers and contemporary movement data
in various population-modeling scenarios may provide a more
precise framework for evaluating whale recovery from previous
exploitation, and hence its resilience to current and emerging
threats, including the possibility of resumed hunting.
Acknowledgments
We are grateful to the staff of the WCS/AMNH New York Staff and WCS
Country Programs of Madagascar and Gabon, in particular George
Amato, Rob DeSalle, Eleanor Sterling, Helen Crowley Matthew
Hatchwell and Lee White, and all the summer interns, students, volunteers
and research assistants who have contributed to field and laboratory work,
in particular Carla Freitas, Vanessa Rasoamampianina, and Nick
Mbadinga. In Gabon Guy-Philippe Sounguet of Aventure Sans Frontier
provided valuable support and generous logistic support was supplied by
Rombout Swanborn and the personnel of Operation Loango. Bertrand
Wendling and the staff of Service des Peches, Direction de l’Agriculture et
de la Foret, as well as the members of the Association Megaptera provided
support in Mayotte. Peter Best, Meredith Thornton and Jaco Barendse
would like to acknowledge the contributions of Shaun Dillon and Simon
Elwen to sample collection, and the Earthwatch Institute and Mazda
Wildlife Fund for field support. Logistical assistance was generously
provided by the South African Navy and the Military Academy, Saldanha,
and field transport was provided by the Mazda Wildlife Fund. This
material is based upon work supported by the National Research
Foundation (South Africa) under Grant number 2053539. We also
acknowledge Marine and Coastal Management, South Africa, for the
cruises of the research vessel Algoa and collection of samples in South Africa
and Mozambique, and special thanks go to Herman Oosthuizen. We
acknowledge the Instituto Baleia Jubarte staff, and in particular Maria
Luiza Pacheco, Marcos Rossi Santos, Milton Marcondes and Clarencio
Baracho for the contribution of samples from Brazil. The Instituto Baleia
Jubarte was sponsored by Petroleo Brasileiro S.A (PETROBRAS) and
Norsul Cia. De Navegacao. We would like to finally thank Dr. Carlos
Olavarria and an annonymous reviewer for their helpful comments and
suggestions, which significantly improved our manuscript.
Author Contributions
Conceived and designed the experiments: HR CP MM MSL PBB KPF
GM PJE TC MHE SLB DPGHK MM JB MT YR SN MV JK. Performed
the experiments: HR CP MM MSL PBB KPF GM PJE TC MHE SLB
Whale Population Structure
PLoS ONE | www.plosone.org 9 October 2009 | Volume 4 | Issue 10 | e7318

DPGHK MM JB MT YR SN MV JK. Analyzed the data: HR CP MM
MSL. Contributed reagents/materials/analysis tools: HR CP MM MSL
PBB KPF GM PJE TC MHE SLB DPGHK MM JB MT YR SN MV JK.
Wrote the paper: HR CP MM MSL. Drafting the article or revising it
critically for important intellectual content: CP MM MSL PBB KPF GM
PJE TC MHE SLB DPGHK MM JB MT YR SN MV JK. Final approval
of the version to be published: CP MM MSL PBB KPF GM PJE TC MHE
SLB DPGHK MM JB MT YR SN MV JK.
References
1. DeSalle R, Amato G (2004) The expansion of conservation genetics. Nature
Review Genetics 5: 702–713.
2. Jorgensen HBH, Hansen MM, Bekkevold D, Ruzzante DE, Loeschcke V (2005)Marine landscapes and population genetic structure of herring (Clupea harengus L.)
in the Baltic Sea. Molecular Ecology 14: 3219–3234.
3. Waples RS (1998) Separating the wheat from the chaff: Patterns of genetic
differentiation in high gene flow species. Journal of Heredity 89: 438–450.
4. Gaines CA, Hare MP, Beck SE, Rosenbaum HC (2005) Nuclear markers
confirm taxonomic status and relationships among highly endangered and
closely related right whale species. Proceedings of the Royal Society B: BiologicalSciences 272: 533–542.
5. Craig MT, Graham RT, Torres RA, Hyde JR, Freitas MO, et al. (2008) How
many species of goliath grouper are there? Cryptic genetic divergence in athreatened marine fish and the resurrection of a geopolitical species. Endangered
Species Research: doi: 10.3354/esr00117.
6. Davies JL (1963) The antitropical factor in cetacean speciation. Evolution 17:107–116.
7. Barker S, Diz P, Vautravers MJ, Pike J, Knorr G, et al. (2009) Interhemispheric
Atlantic seesaw response during the last deglaciation. Nature 457: 1097–U1050.
8. Bonfil R, Meyer M, Scholl MC, Johnson R, O’Brien S, et al. (2005)Transoceanic migration, spatial dynamics, and population linkages of white
sharks. Science 310: 100–103.
9. Boyle MC, FitzSimmons NN, Limpus CJ, Kelez S, Velez-Zuazo X, et al. (2009)Evidence for transoceanic migrations by loggerhead sea turtles in the southern
Pacific Ocean. Proceedings of the Royal Society B: Biological Sciences.
10. Hoelzel AR (1998) Genetic structure of cetacean populations in sympatry,parapatry, and mixed assemblages: Implications for conservation policy. Journal
of Heredity 89: 451–458.
11. Briggs JC (1974) Operation of zoogeographic barriers. Systematic Zoology 23:248–256.
12. Kaschner K, Watson R, Trites AW, Pauly D (2006) Mapping world-wide
distributions of marine mammal species using a relative environmental suitability
(RES) model. Marine Ecology-Progress Series 316: 285–310.
13. Redfern JV, Ferguson MC, Becker EA, Hyrenbach KD, Good C, et al. (2006)
Techniques for cetacean-habitat modeling. Marine Ecology-Progress Series 310:
271–295.
14. Bowen BW, Karl SA (2007) Population genetics and phylogeography of seaturtles. Molecular Ecology 16: 4886–4907.
15. Bourjea J, Lapegue S, Gagnevin L, Broderick D, Mortimer JA, et al. (2007)
Phylogeography of the green turtle, Chelonia mydas, in the Southwest IndianOcean. Molecular Ecology 16: 175–186.
16. LeDuc RG, Dizon AE, Goto M, Pastene LA, Kato H, et al. (2007) Patterns of
genetic variation in Southern Hemisphere blue whales and the use of assignmenttest to detect mixing on the feeding grounds. Journal of Cetacean Research and
Management 9: 73–80.
17. Patenaude NJ, Portway VA, Schaeff CM, Bannister JL, Best PB, et al. (2007)Mitochondrial DNA diversity and population structure among southern right
whales (Eubalaena australis). Journal of Heredity 98: 147–157.
18. Mackintosh NA (1942) The southern stocks of whalebone whales. DiscoveryReports 22: 197–300.
19. Baker CS, Herman LM, Perry A, Lawton WS, Straley JM, et al. (1986)
Migratory movement and population structure of humpback whales (Megaptera
novaeangliae) in the Central and Eastern North Pacific. Marine Ecology-Progress
Series 31: 105–119.
20. Calambokidis J, Steiger GH, Evenson JR, Flynn KR, Balcomb KC, et al. (1996)Interchange and isolation of humpback whales off California and other North
Pacific feeding grounds. Marine Mammal Science 12: 215–226.
21. Calambokidis J, Steiger GH, Straley JM, Herman LM, Cerchio S, et al. (2001)
Movements and population structure of humpback whales in the North Pacific.Marine Mammal Science 17: 769–794.
22. Clapham PJ (1996) The social and reproductive biology of humpback whales: an
ecological perspective. Mammal Review 26: 27–49.
23. Clapham PJ, Young SB, Brownell RL (1999) Baleen whales: conservation issuesand the status of the most endangered populations. Mammal Review 29: 35–60.
24. Palsbøll PJ, Berube M, Allendorf FW (2007) Identification of management units
using population genetic data. Trends in Ecology & Evolution 22: 11–16.
25. Palsbøll PJ, Clapham PJ, Mattila DK, Larsen F, Sears R, et al. (1995)
Distribution of MtDNA haplotypes in North Atlantic humpback Whales - the
Influence of behavior on population structure. Marine Ecology-Progress Series116: 1–10.
26. Palsbøll PJ, Allen J, Berube M, Clapham PJ, Feddersen TP, et al. (1997) Genetic
tagging of humpback whales. Nature 388: 767–769.
27. Clapham PJ, Mattila DK, Palsbøll PJ (1993) High-latitude area composition ofhumpback whale competitive groups in Samana Bay - further evidence for
panmixia in the North Atlantic population. Canadian Journal of Zoology 71:1065–1066.
28. Stevick PT, Allen J, Clapham PJ, Katona SK, Larsen F, et al. (2006) Population
spatial structuring on the feeding grounds in North Atlantic humpback whales(Megaptera novaeangliae). Journal of Zoology 270: 244–255.
29. Baker CS, Medrano-Gonzalez L, Calambokidis J, Perry A, Pichler F, et al.
(1998) Population structure of nuclear and mitochondrial DNA variation amonghumpback whales in the North Pacific. Molecular Ecology 7: 695–707.
30. Palsbøll PJ, Clapham PJ, Mattila DK, Larsen F, Sears R, et al. (1995)
Distribution of mtDNA haplotypes in North Atlantic humpback whales: the
influence of behavior on population structure. Marine Ecology Progress Series116: 1–10.
31. Clapham PJ (2000) The Humpback Whale. In: Mann J, Connor RC, Tyack PL,
Whitehead H, eds. Cetacean Societies, field studies of dolphins and whales.
Chicago: The University of Chicago. pp 173–196.
32. Gambell R (1976) World whale stocks. Mammal Review 5: 41–53.
33. IWC (2007) Annex H: Report of the sub-committee on other Southern
Hemisphere Whale Stocks. Journal of Cetacean Research and Management 9:188–209.
34. Reeves RR, Leatherwood S, Papastavrou V (1991) Possible stock affinities of
humpack whales in the Northern Indian Ocean. UNEP Marine MammalTechnical Reports 3: 259–269.
35. Mikhalev YA (1997) Humpback whales Megaptera novaeangliae in the Arabian Sea.
Marine Ecology Progress Series 149: 13–21.
36. Pomilla C (2005) Genetic structure of humpback whale (Megaptera novaean-
gliae) populations on Southern Hemisphere wintering grounds [PhD Thesis]:
New York University.
37. Best PB, Findlay KP, Sekiguchi K, Peddemors VM, Rakotonirina B, et al. (1998)Winter distribution and possible migration routes of humpback whales (Megaptera
novaeangliae) in the southwest Indian Ocean. Marine Ecology Progress Series 162:
287–299.
38. Rosenbaum H, Walsh P, Razafindrakoto Y, Vely M, DeSalle R (1997) First
description of a humpback whale wintering ground in Baie d’Antongil,
Madagascar. Conservation Biology 11: 312–314.
39. Angot M (1951) Rapport scientifique sur les expeditions baleiniers autour deMadagascar (saisons 1949–1950). pp 439–486.
40. Bermond M (1950) Campagne baleiniere dans les eaux de Madagascar (saison
1949). Cybium 5: 31–37.
41. Brown SG (1957) Whales observed in the Indian Ocean. Notes on their
distribution. Marine Observer 27: 157–165.
42. Chittleborough RG (1965) Dynamics of two populations of humpback whales,
Megaptera novaeangliae (Borowski). Australian Journal of Marine and FreshwaterResearch 16: 33–128.
43. Dawbin W (1966) The seasonal migratory cycle of the humpback whale. In:
Norris K, ed. Whales, dolphins and porpoises. Berkeley: University of CaliforniaPress. pp 145–170.
44. Matthews LH (1938) The humpback whale, Megaptera nodosa. Discovery Reports
17: 7–92.
45. Omura H (1953) Biological Study on humpback whales in the Antarctic whaling
areas IV and V. Scientific Report of the Whales Research Institute (Tokyo) 8:
81–102.
46. Rayner GW (1940) Whale marking: progress and results to December 1939.Discovery Reports 19: 245–284.
47. Chittleborough RG (1955) Aspects of reproduction in the male humpback
whale, Megaptera nodosa (Bonnaterre). Australian Journal of Marine andFreshwater Research 6: 1–29.
48. Dawbin WH (1956) The migrations of humpback whales which pass the New
Zealand coast. Transactions of the Royal Society of New Zealand 84: 147–196.
49. Olavarria C, Baker CS, Garrigue C, Poole M, Hauser N, et al. (2007) Population
structure of South Pacific humpback whales and the origin of the eastern
Polynesian breeding grounds. Marine Ecology-Progress Series 330: 257–268.
50. Lambertsen RH (1987) A biopsy system for large whales and its use forcytogenetics. Journal of Mammalogy 68: 443–445.
51. Engel MH, Fagundes NJR, Rosenbaum HC, Leslie MS, Ott PH, et al. (2008)
Mitochondrial DNA diversity of the Southwestern Atlantic humpback whale
(Megaptera novaeangliae) breeding area off Brazil, and the potential connections toAntarctic feeding areas. Conservation Genetics 9: 1253–1262.
52. Findlay KP, Best PB (1996) Estimates of the numbers of humpback whales
observed migrating past Cape Vidal, South Africa, 1988–1991. MarineMammal Science 12: 354–370.
53. Minton G, Collins TJQ, Pomilla C, Findlay KP, Rosenbaum HC, et al. (2008)
Megaptera novaeangliae (Borowski, 1781) (Arabian Sea subpopulation) Humpback
Whale. IUCN Redlist Population assessment for IUCN Redlist, 1–8.
54. Sambrook J, Fritsch EF, Maniatis T (1989) Molecular cloning: a laboratory
manual. New York: Cold Spring Harbor Laboratory Press.
55. Kocher TD, Thomas WK, Meyer A, Edwards SV, Paabo S, et al. (1989)Dynamics of Mitochondrial DNA Evolution in Animals: Amplification and
Whale Population Structure
PLoS ONE | www.plosone.org 10 October 2009 | Volume 4 | Issue 10 | e7318
Sequencing with Conserved Primers. Proceedings of the National Academy of
Sciences USA 86: 6196–6200.56. Baker CS, Perry A, Bannister JL, Weinrich MT, Abernethy RB, et al. (1993)
Abundant mitochondrial DNA variation and worldwide population structure in
humpback whales. Proceedings of the National Academy of Sciences USA 90:8239–8243.
57. Palsbøll PJ, Vader A, Bakke I, Elgewely MR (1992) Determination of gender incetaceans by the polymerase chain-reaction. Canadian Journal of Zoology 70:
2166–2170.
58. Maddison WP, Maddison DR (1992) MacClade: analysis of phylogeny andcharacter evolution. 3.0 ed. Sunderland, Massachusetts: Sinauer Associates.
59. Nei M (1987) Molecular evolutionary genetics. New York.: Columbia UniversityPress.
60. Excoffier L, Laval G, Schneider S (2005) Arlequin ver. 3.0: An integratedsoftware package for population genetics data analysis. Evolutionary Bioinfor-
matics Online 1: 47–50.
61. Excoffier L, Smouse P, Quattro J (1992) Analysis of molecular variance inferredfrom metric distances among DNA haplotypes: Application to human
mitochondrial DNA restriction data. Genetics 131: 479–491.62. Hudson RR, Slatkin M, Maddison WP (1992) Estimation of levels of gene flow
from DNA sequence data. Genetics 132: 583–589.
63. Weir BS, Cockerham CC (1984) Estimating F-Statistics for the analysis ofpopulation structure. Evolution 38: 1358–1370.
64. Takahata N, Palumbi SR (1985) Extranuclear differentiation and gene flow inthe finite island model. Genetics 441–457.
65. Narum SR (2006) Beyond Bonferroni: Less conservative analyses forconservation genetics. Conservation Genetics 7: 783–787.
66. Perneger TV (1998) What’s wrong with Bonferroni adjustments. BMJ 316:
1236–1238.67. Rozas J, Sanchez-DelBarrio JC, Messegyer X, Rozas R (2003) DnaSP, DNA
polymorphism analyses by the coalescent and other methods. Bioinformatics2496–2497.
68. Beerli P, Felsenstein J (2001) Maximum likelihood estimation of a migration
matrix and effective population sizes in n subpopulations by using a coalescentapproach. Proceedings of the National Academy of Sciences USA 98:
4563–4568.69. Nielsen R, Wakeley J (2001) Distinguishing migration from isolation: a Markov
Chain Monte Carlo approach. Genetics 158: 885–896.70. Stevick PT, Godoy LP, McOsker M, Engel MH, Allen J (2006) A note on the
movement of a humpback whale from Abrolhos Bank, Brazil to South Georgia.
Journal of Cetacean Research and Management 8: 297–300.71. Zerbini AN, Andriolo A, Heide-Jorgensen MP, Pizzorno JL, Maia YG, et al.
(2006) Satellite-monitored movements of humpback whales Megaptera novaeangliae
in the southwest Atlantic Ocean. Marine Ecology-Progress Series 313: 295–304.
72. Rosenbaum HC, Mate B (Submitted) From north of the equator to the
Antarctic: unique and unexpected movements for humpback whales off the coastof West Africa and throughout the eastern South Atlantic Ocean. Proceedings of
the Royal Society B: Biological Sciences.73. Ansorge IJ Lutjeharms Lutjeharms JRE. The influence of the Antarctic
Circumpolar Current on the oceanographic setting of a sub-Antarctic island;2007 59-66. Society Hobart Tasmania.
74. Darling JD, Sousa-Lima RS (2005) Songs indicate interaction between
humpback whale (Megaptera novaeangliae) populations in the western and easternSouth Atlantic Ocean. Marine Mammal Science 21: 557–566.
75. Noad MJ, Cato DH, Bryden MM, Jenner MN, Jenner KCS (2000) Culturalrevolution in whale songs. Nature 408: 537.
76. Whitehead H, Rendell L, Osborne RW, Wursig B (2004) Culture and
conservation of non-humans with reference to whales and dolphins: reviewand new directions. Biological Conservation 120: 427–437.
77. Mattila DK, Guinee LN, Mayo CA (1987) Humpback songs on a North Atlantic
feeding ground. Journal of Mammalogy 68: 880–883.
78. Pomilla C, Rosenbaum HC (2005) Against the current: an inter-oceanic whale
migration event. Biology Letters 1: 476–479.
79. Minton G, Collins TJQ, Findlay KP, Ersts PJ, Rosenbaum HC, et al. (in press)
Seasonal distribution, abundance, habitat use and population identity of
humpback whales in Oman. Journal of Cetacean Research and Management,
Special Issue on Southern Hemisphere Humpback Whales. .
80. Best PB, Sekiguchi K, Findlay KP (1995) A suspended migration of humpback
whales Megaptera novaeangliae on the west coast of South Africa. Marine Ecology
Progress Series 118: 1–12.
81. Townsend CH (1935) The distribution of certain whales as shown by logbook
records of American whaleships. Zoologica 19: 1–50.
82. Shannon LJ, Field JG, Moloney CL (2004) Simulating anchovy-sardine regime
shifts in the southern Benguela ecosystem. Ecological Modelling 172: 269–281.
83. Josephson EA, Smith TD, Reeves RR (2008) Depletion within a decade: the
American 19th-century North Pacific right whale fishery. In: Starkey DJ,
Holm P, Barnard M, eds. Oceans Past: Management Insights from the History
of Marine Animal Populations, Earthscan, London. pp 133–147.
84. Pomilla C, Rosenbaum HC (2006) Estimates of relatedness in groups of
humpback whales (Megaptera novaeangliae) on two wintering grounds of the
Southern Hemisphere. Molecular Ecology 15: 2541–2555.
85. Perrin WF (2007) The south african species gate. In: Best P, ed. Whales and
Dolphins of the Southern African Subregion Cambridge University Press. 352 p.
86. Rasmussen K, Palacios DM, Calambokidis J, Saborio MT, Rosa LD, et al.
(2007) Southern Hemisphere humpback whales wintering off Central America:
insights from water temperature into the longest mammalian migration. Biology
Letters 3: 302–305.
87. Durand JD, Collet A, Chow S, Guinand B, Borsa P (2005) Nuclear and
mitochondrial DNA markers indicate unidirectional gene flow of Indo-Pacific to
Atlantic bigeye tuna (Thunnus obesus) populations, and their admixture off
southern Africa. Marine Biology 147: 313–322.
88. Duncan KM, Martin AP, Bowen BW, De Couet HG (2006) Global
phylogeography of the scalloped hammerhead shark (Sphyrna lewini). Molecular
Ecology 15: 2239–2251.
89. IWC (2008) Annex H: Report of the sub-committee on other Southern
Hemisphere Whale Stocks. Journal of Cetacean Research and Management:
207–224.
90. Findlay KP (2001) A review of humpback whales catches by modern whaling
operations in the Southern Hemisphere. Memoirs of the Queensland Museum
47: 411–420.
91. Baker CS, Clapham PJ (2004) Modelling the past and future of whales and
whaling. Trends in Ecology and Evolution 19: 365–371.
92. Bannister JL (1994) Continued increase in Group IV humpbacks of Western
Australia. Report of the Scientific Committee of the International Whaling
Commission 44: 309–310.
93. Bryden MM, Kirkwood GP, Slade RW (1990) Humpback whales, Area V. An
increase in numbers off Australia’s east coast. In: Kerry KR, Hempel G, eds.
Antarctic ecosystems Ecological change and conservation Berlin, Heidelberg:
Springer-Verlag. pp 271–277.
94. Chaloupka M, Osmond M, Kaufman G (1999) Estimating seasonal abundance
trends and survival probabilities of humpback whales in Hervey Bay (east coast
Australia). Marine Ecology-Progress Series 184: 291–301.
95. Paterson RA, Paterson P, Cato DH (2001) Status of humpback whales, Megaptera
novaeangliae, in east Australia at the end of the 20th century. Memoirs of the
Queensland Museum: 579–586.
Whale Population Structure
PLoS ONE | www.plosone.org 11 October 2009 | Volume 4 | Issue 10 | e7318
Copyright © 2022 FDOKUMEN