Regional and Supra-Regional Coherence in Limnological Variables
Upload
khangminh22Category
view
0download
0
Table of Contents
Regional Development Council Resolution IV-A-155-2016
Message from the President
Message from the Secretary of Socioeconomic Planning
Message from the RDC Calabarzon Chairperson
Foreword from the NEDA Regional Director
Acknowledgement
List of Tables and Figures
Part I: Introduction
Part II: Enhancing the Social Fabric (“Malasakit”)
Part III: Inequality-Reducing Transformation (“Pagbabago”)
Part IV: Increasing Growth Potential (“Patuloy na Pag-unlad”)
Part V: Enabling and Supportive Economic Development
Part VI: Foundations for Sustainable Development
Part VII: Plan Implementation and Monitoring
List of Acronyms
References
RDP 2017-2022 Planning Committees
Regional Development Plan 2017-2022 | v

vi Regional Development Plan 2017-2022
Regional Development Plan 2017-2022 | vii
Message

viii Regional Development Plan 2017-2022

Regional Development Plan 2017-2022 | ix
Message

x Regional Development Plan 2017-2022
Regional Development Plan 2017-2022| xi
Message

xii Regional Development Plan 2017-2022

Regional Development Plan 2017-2022 | xiii
Foreword
xiv Regional Development Plan 2017-2022
Regional Development Plan 2017-2022| xv
Acknowledgement

xvi Regional Development Plan 2017-2022
Regional Development Plan 2017-2022 | xvii
List of Tables and Figures
Chapter 1 The Long View
Chapter 2 Global and Regional Trends and Prospects
Chapter 3 Overlay of Economic Growth, Demographic Trends, and Physical Characteristics
Chapter 4 Regional Development Plan 2017-2022 Overall Framework
Chapter 5 Ensuring People-Centered, Clean, and Efficient Governance
Chapter 6 Pursuing Swift and Fair Administration of Justice
xviii Regional Development Plan 2017-2022
Chapter 7 Promoting Philippine Culture and Values
Chapter 8 Expanding Economic Opportunities in Agriculture, Forestry, and Fisheries
Regional Development Plan 2017-2022 | xix
Chapter 9 Expanding Economic Opportunities in Industry and Services
Chapter 10 Accelerating Human Capital Development
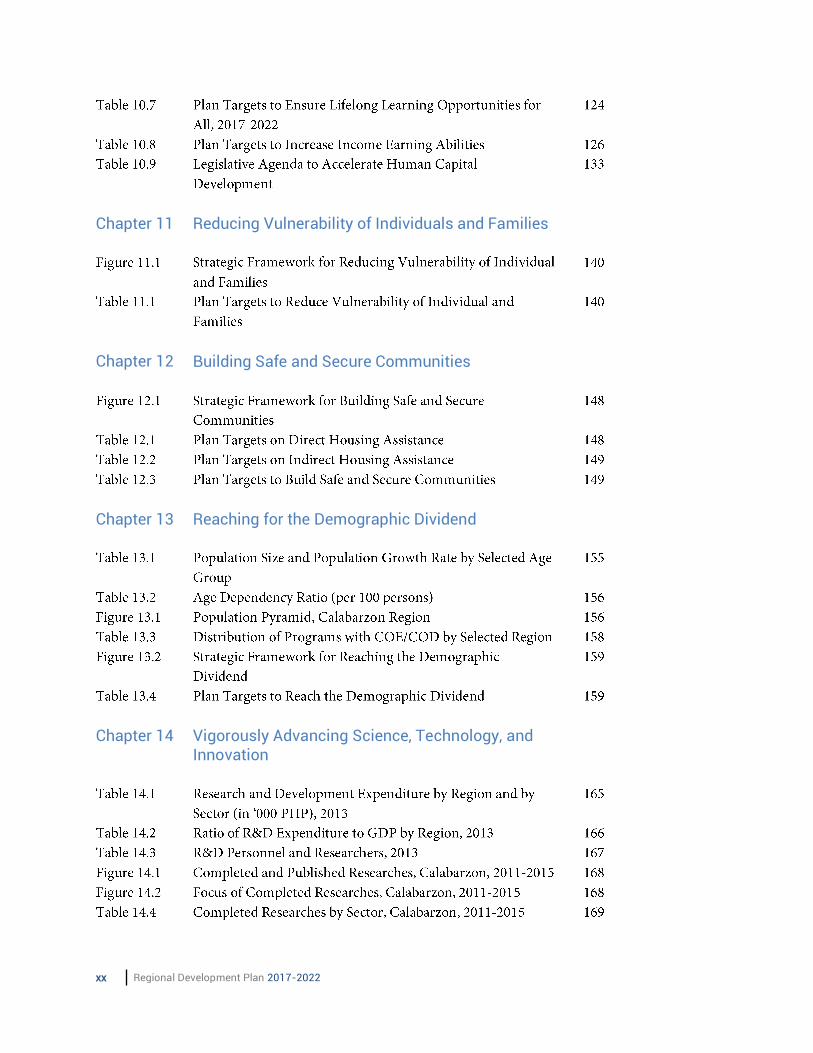
xx Regional Development Plan 2017-2022
Chapter 11 Reducing Vulnerability of Individuals and Families
Chapter 12 Building Safe and Secure Communities
Chapter 13 Reaching for the Demographic Dividend
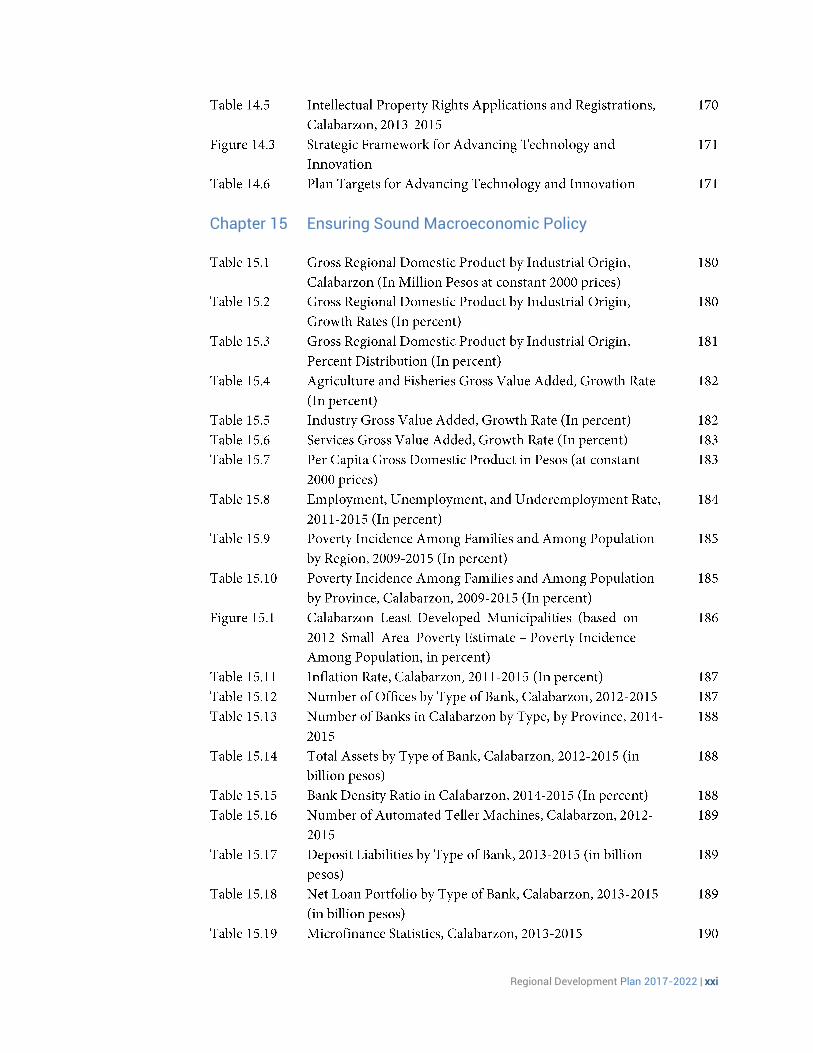
Chapter 14 Vigorously Advancing Science, Technology, and Innovation
Regional Development Plan 2017-2022 | xxi
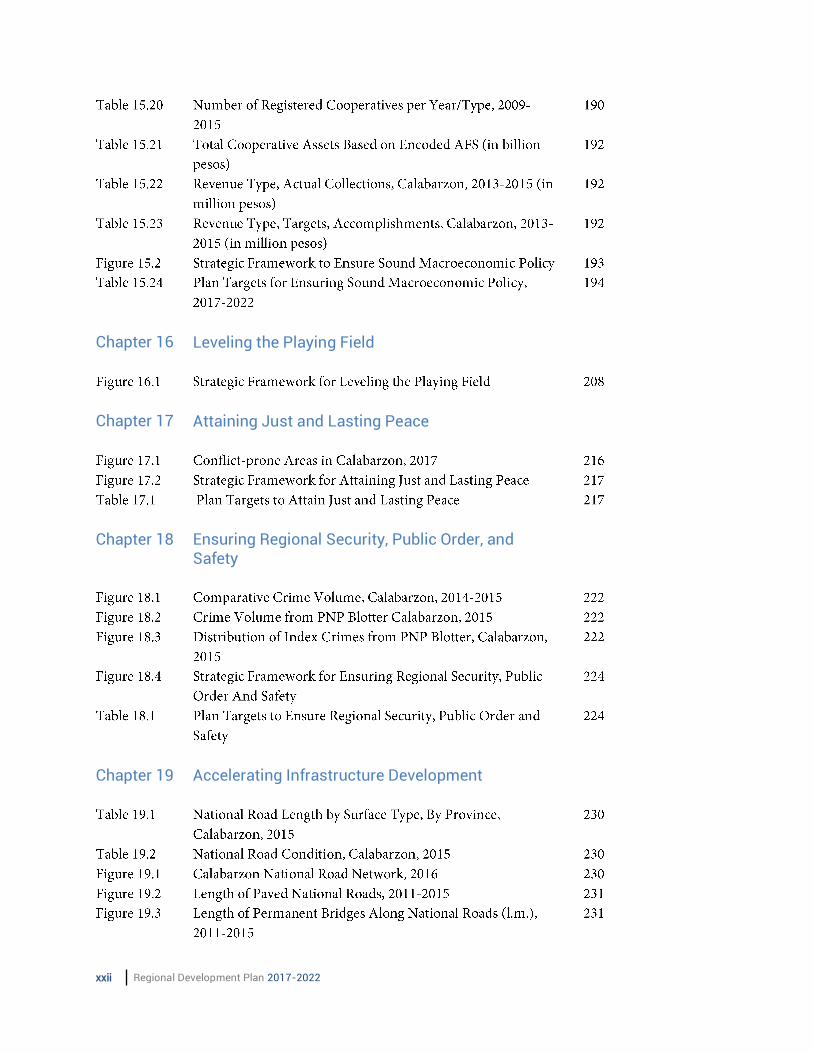
Chapter 15 Ensuring Sound Macroeconomic Policy
xxii Regional Development Plan 2017-2022
Chapter 16 Leveling the Playing Field
Chapter 17 Attaining Just and Lasting Peace
Chapter 18 Ensuring Regional Security, Public Order, and Safety
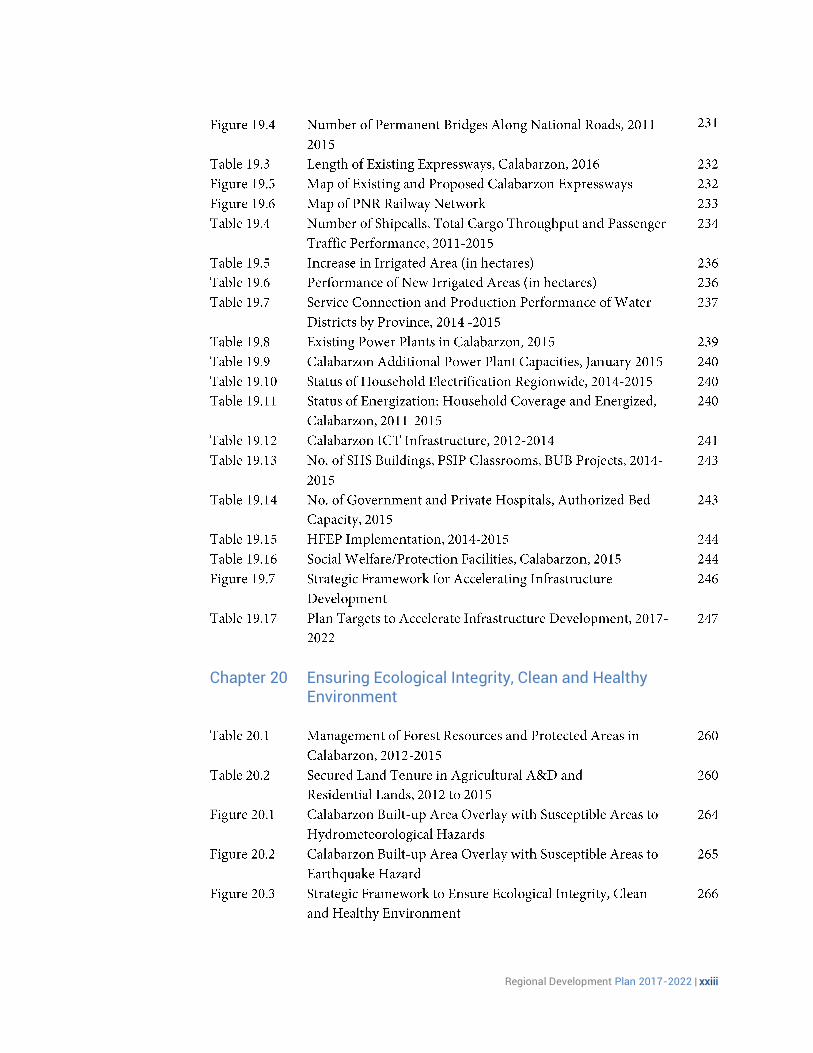
Chapter 19 Accelerating Infrastructure Development
Regional Development Plan 2017-2022 | xxiii
Chapter 20 Ensuring Ecological Integrity, Clean and Healthy Environment
xxiv Regional Development Plan 2017-2022
Chapter 21 Plan Implementation and Monitoring

Chapter 1 The Long View | 1

2 Regional Development Plan 2017-2022
Chapter 1 The Long View | 3

4 Regional Development Plan 2017-2022
Chapter 1 The Long View | 5
Chapter 1
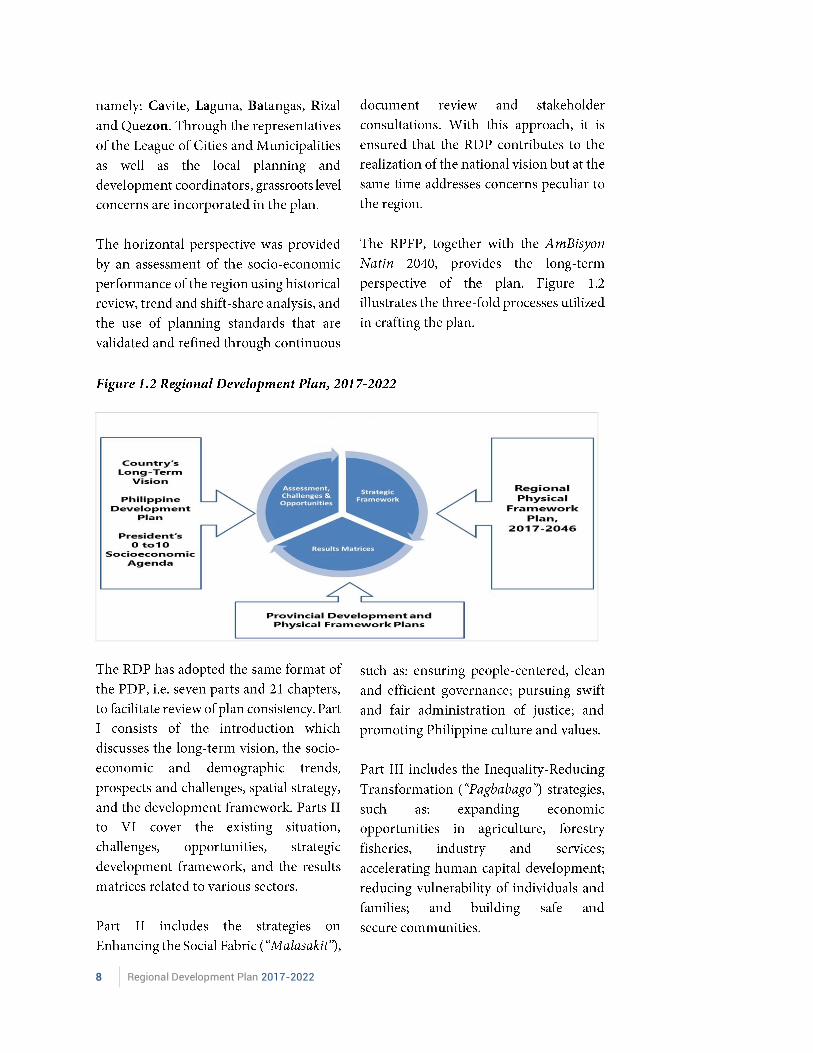
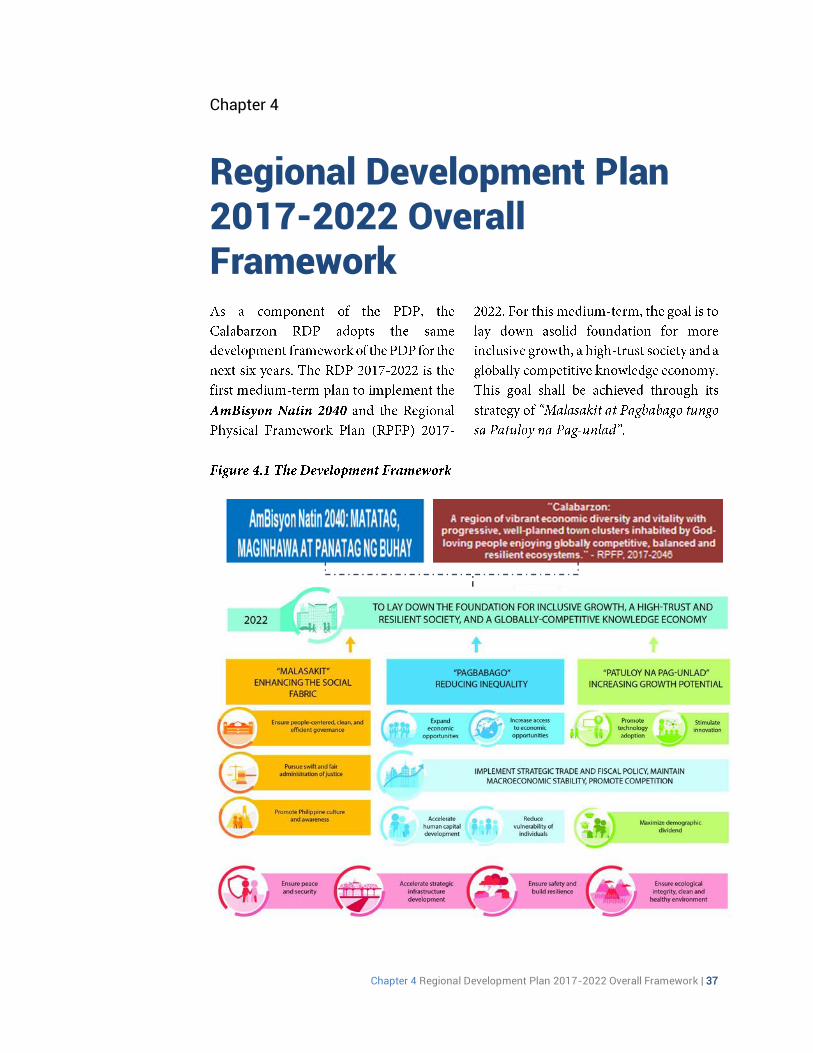
The Long View The Calabarzon Regional Development Plan (RDP), 2017-2022 is anchored on country’s long-term vision or AmBisyon Natin 2040 as well as the image that Calabarzonians desire the region to be in 2046 as enunciated in the Regional Physical Framework Plan (RPFP), as follows:
“The country is a prosperous middle class society where no one is poor. People live long and healthy lives and are smart and innovative. The Philippines is a high-trust society where families thrive in vibrant, culturally diverse, and resilient communities.” – AmBisyon Natin 2040
“Calabarzon: A region of vibrant economic diversity and vitality with progressive, well-planned town clusters inhabited by God-loving people enjoying globally competitive, balanced and resilient ecosystems.” – RPFP, 2017-2046
6 Regional Development Plan 2017-2022
Chapter 1 The Long View | 7
8 Regional Development Plan 2017-2022
Chapter 1 The Long View | 9

10 Regional Development Plan 2017-2022
Chapter 2 Regional Trends and Prospects | 11
sss

12 Regional Development Plan 2017-2022
Chapter 2 Global and Regional Trends and Prospects | 13
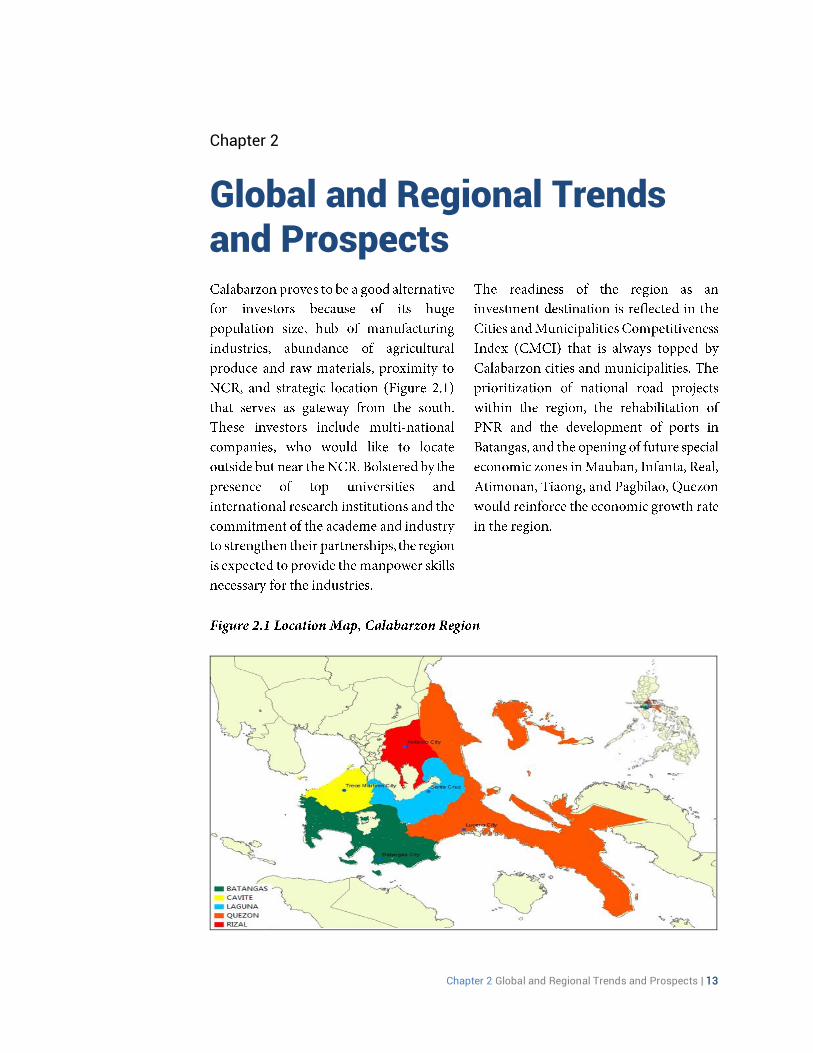
Chapter 2
Global and Regional Trends and Prospects

14 Regional Development Plan 2017-2022
Tourism and Infrastructure
Manufacturing and Logistics
Chapter 2 Global and Regional Trends and Prospects | 15
InformationTechnology, Business Process Outsourcing and Creative Industries
Agriculture/Agribusiness
16 Regional Development Plan 2017-2022
Other Development Prospects
Chapter 3 Overlay of Economic Growth, Demographic Trends, and Physical Characteristics | 17

18 Regional Development Plan 2017-2022
Chapter 3 Overlay of Economic Growth, Demographic Trends, and Physical Characteristics | 19
Chapter 3
Overlay of Economic Growth, Demographic Trends, and Physical Characteristics
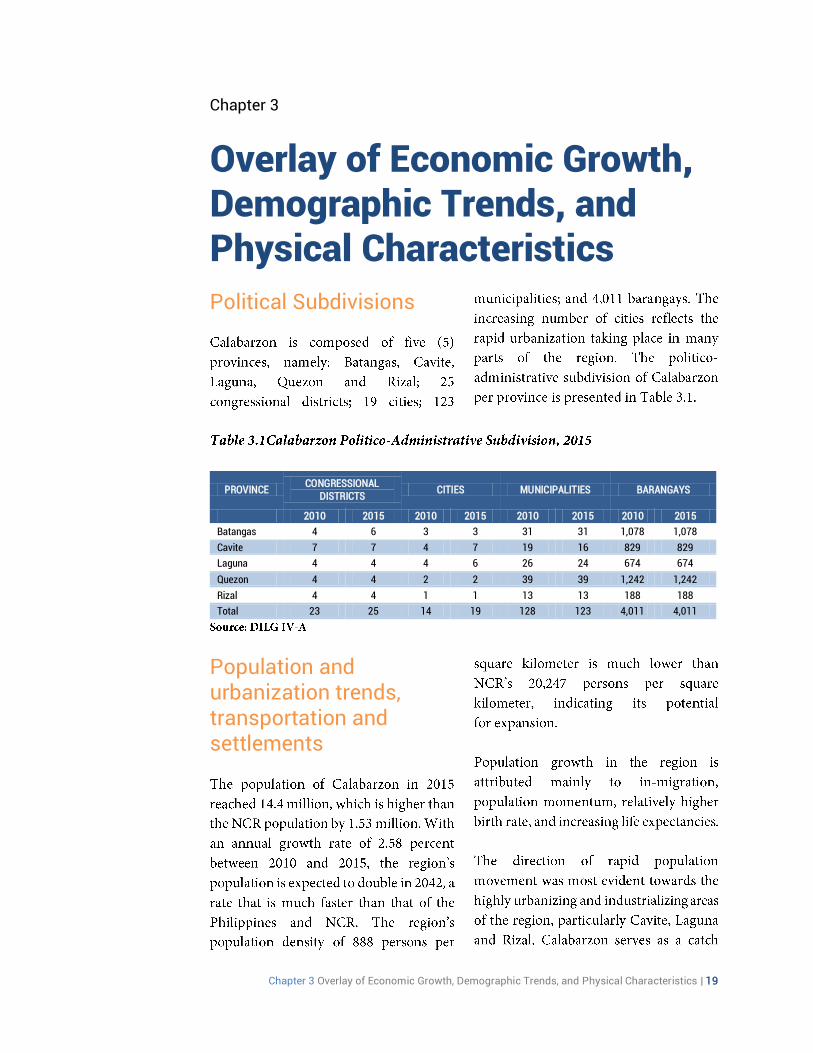
Political Subdivisions
PROVINCE CONGRESSIONAL
DISTRICTS CITIES MUNICIPALITIES BARANGAYS
2010 2015 2010 2015 2010 2015 2010 2015
Batangas 4 6 3 3 31 31 1,078 1,078
Cavite 7 7 4 7 19 16 829 829
Laguna 4 4 4 6 26 24 674 674
Quezon 4 4 2 2 39 39 1,242 1,242
Rizal 4 4 1 1 13 13 188 188
Total 23 25 14 19 128 123 4,011 4,011
Population and urbanization trends, transportation and settlements
20 Regional Development Plan 2017-2022
Transportation and Settlements

Chapter 3 Overlay of Economic Growth, Demographic Trends, and Physical Characteristics | 21
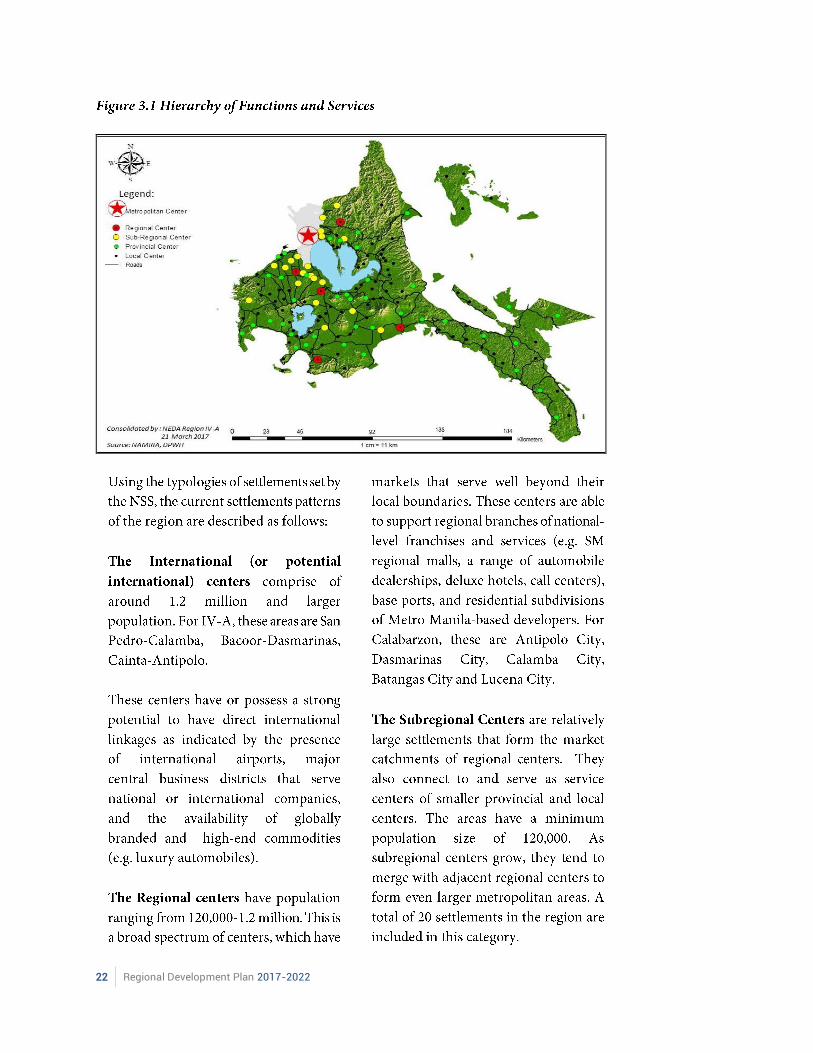
Hierarchy of Functions and Settlements
22 Regional Development Plan 2017-2022
Chapter 3 Overlay of Economic Growth, Demographic Trends, and Physical Characteristics | 23
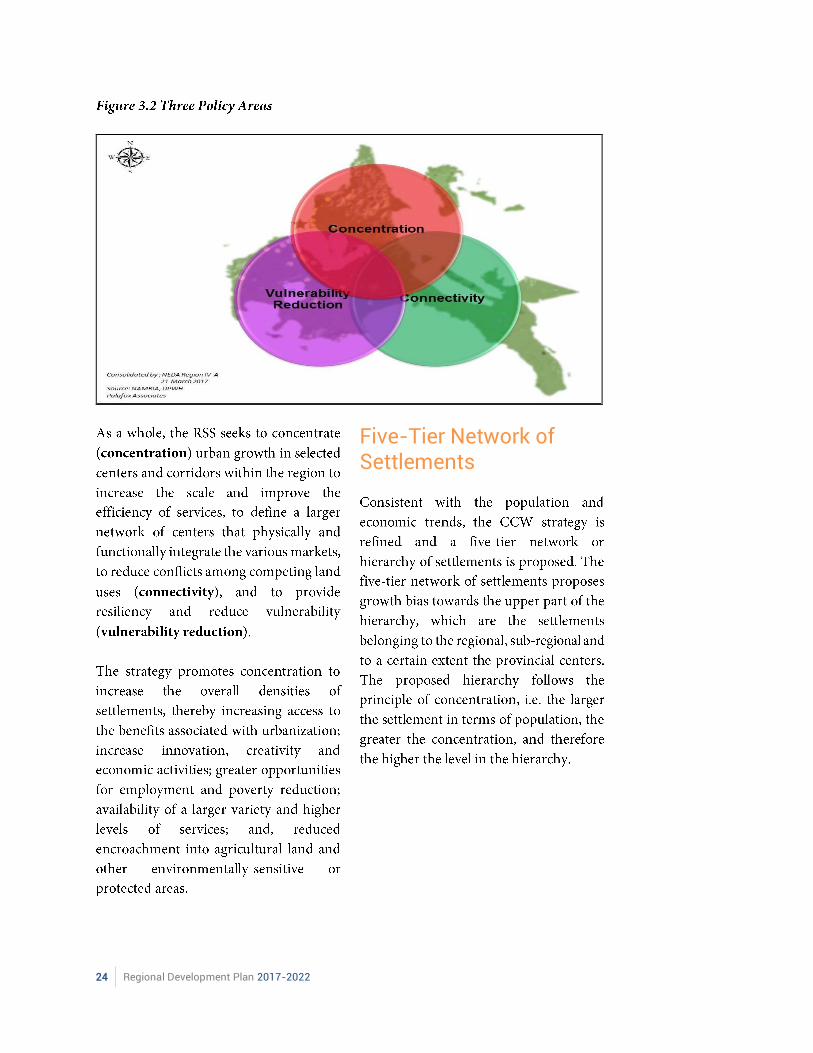
Overall Spatial Strategy
Centers, Corridors and Wedges (CCW) approach
Concentration, Connectivity and Vulnerability Reduction (CCVR)
24 Regional Development Plan 2017-2022
Five-Tier Network of Settlements
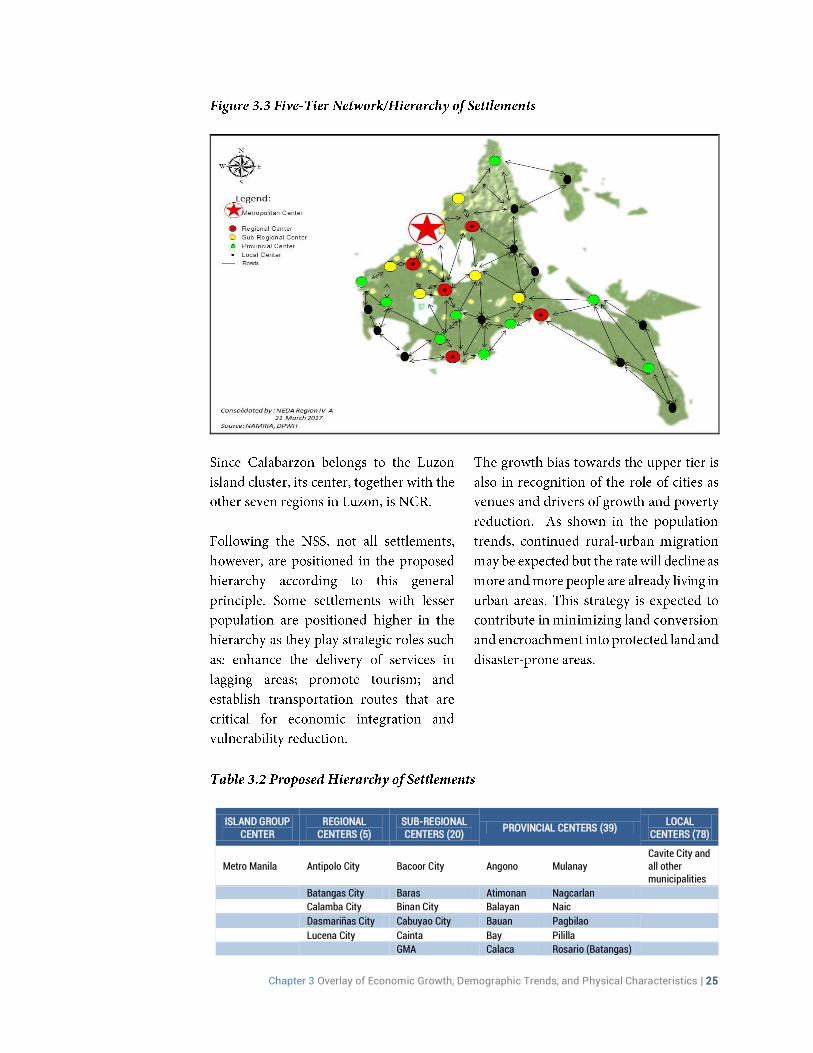
Chapter 3 Overlay of Economic Growth, Demographic Trends, and Physical Characteristics | 25
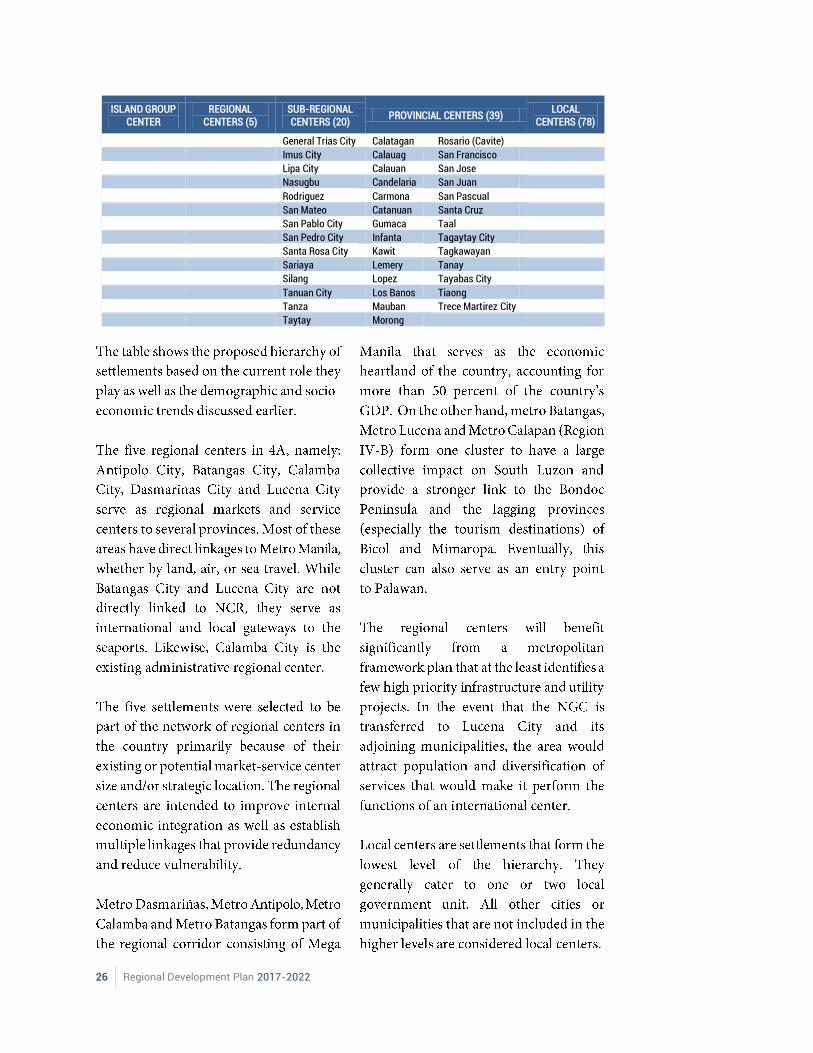
ISLAND GROUP CENTER
REGIONAL CENTERS (5)
SUB-REGIONAL CENTERS (20)
PROVINCIAL CENTERS (39) LOCAL
CENTERS (78)
Metro Manila Antipolo City Bacoor City Angono Mulanay Cavite City and all other municipalities
Batangas City Baras Atimonan Nagcarlan
Calamba City Binan City Balayan Naic
Dasmariñas City Cabuyao City Bauan Pagbilao
Lucena City Cainta Bay Pililla
GMA Calaca Rosario (Batangas)
26 Regional Development Plan 2017-2022
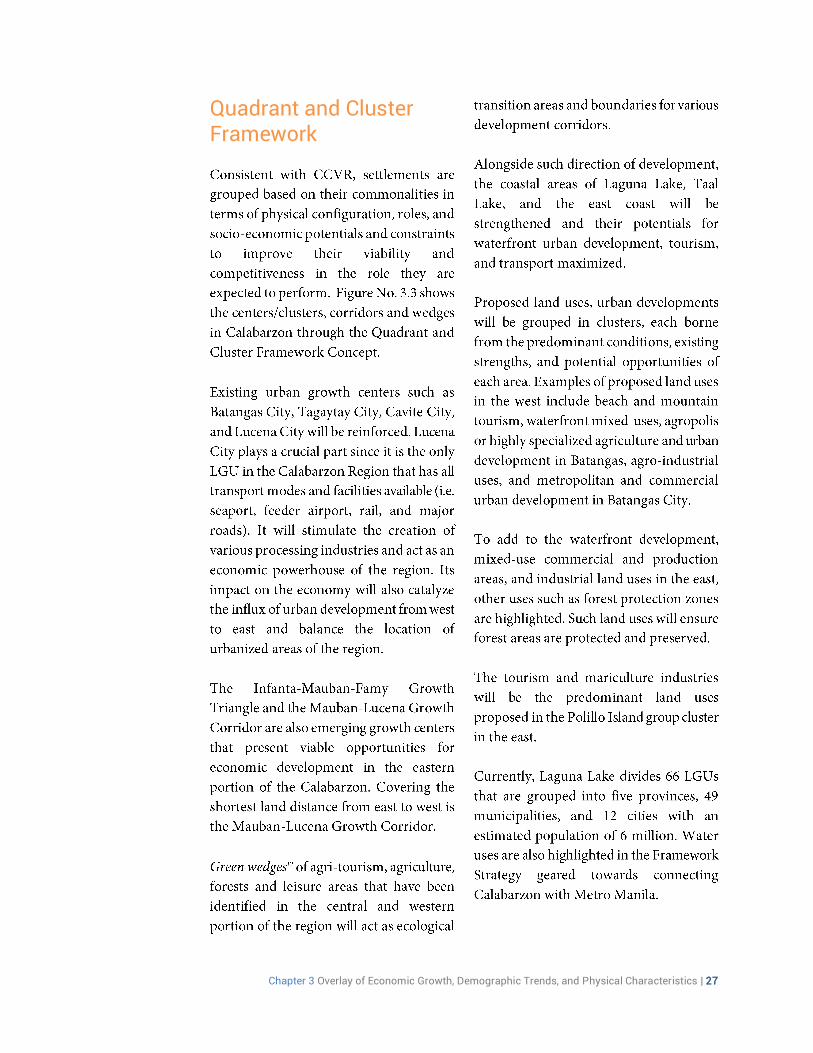
ISLAND GROUP CENTER
REGIONAL CENTERS (5)
SUB-REGIONAL CENTERS (20)
PROVINCIAL CENTERS (39) LOCAL
CENTERS (78)
General Trias City Calatagan Rosario (Cavite)
Imus City Calauag San Francisco
Lipa City Calauan San Jose
Nasugbu Candelaria San Juan
Rodriguez Carmona San Pascual
San Mateo Catanuan Santa Cruz
San Pablo City Gumaca Taal
San Pedro City Infanta Tagaytay City
Santa Rosa City Kawit Tagkawayan
Sariaya Lemery Tanay
Silang Lopez Tayabas City
Tanuan City Los Banos Tiaong
Tanza Mauban Trece Martirez City
Taytay Morong
Chapter 3 Overlay of Economic Growth, Demographic Trends, and Physical Characteristics | 27
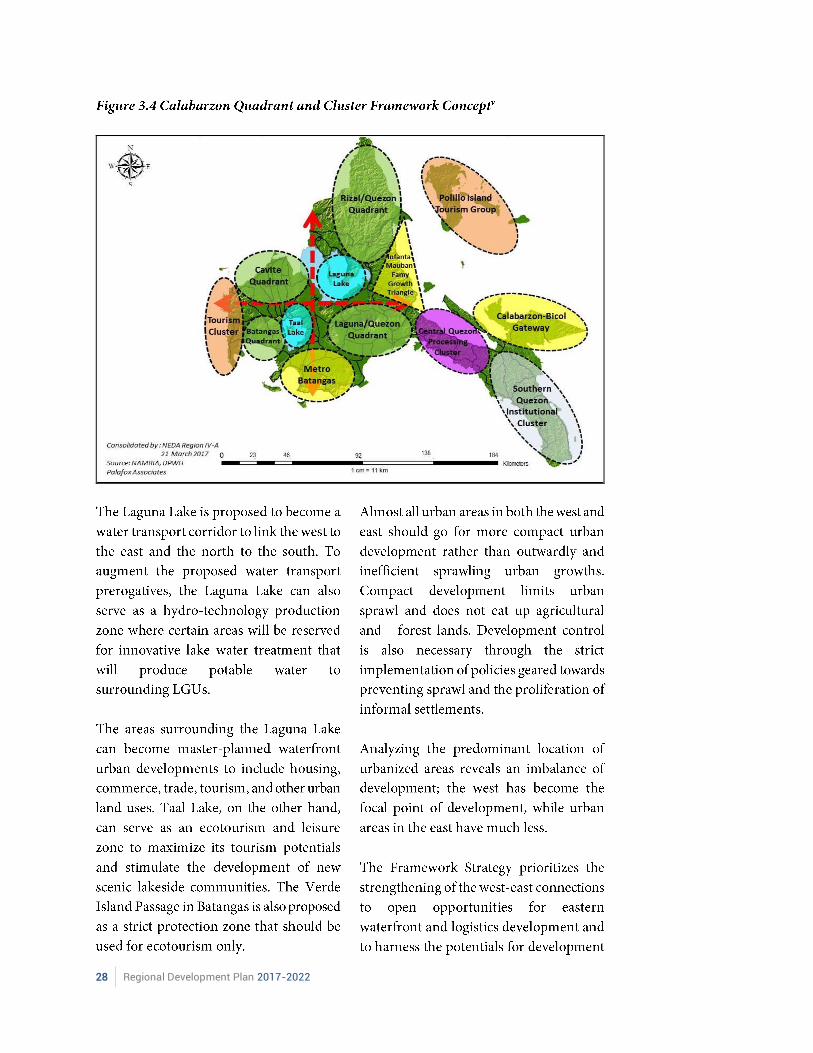
Quadrant and Cluster Framework
28 Regional Development Plan 2017-2022
Chapter 3 Overlay of Economic Growth, Demographic Trends, and Physical Characteristics | 29
Enhance Connectivity and Strengthening East-West Connections
Manila Bay-Pacific Coast Corridor
30 Regional Development Plan 2017-2022
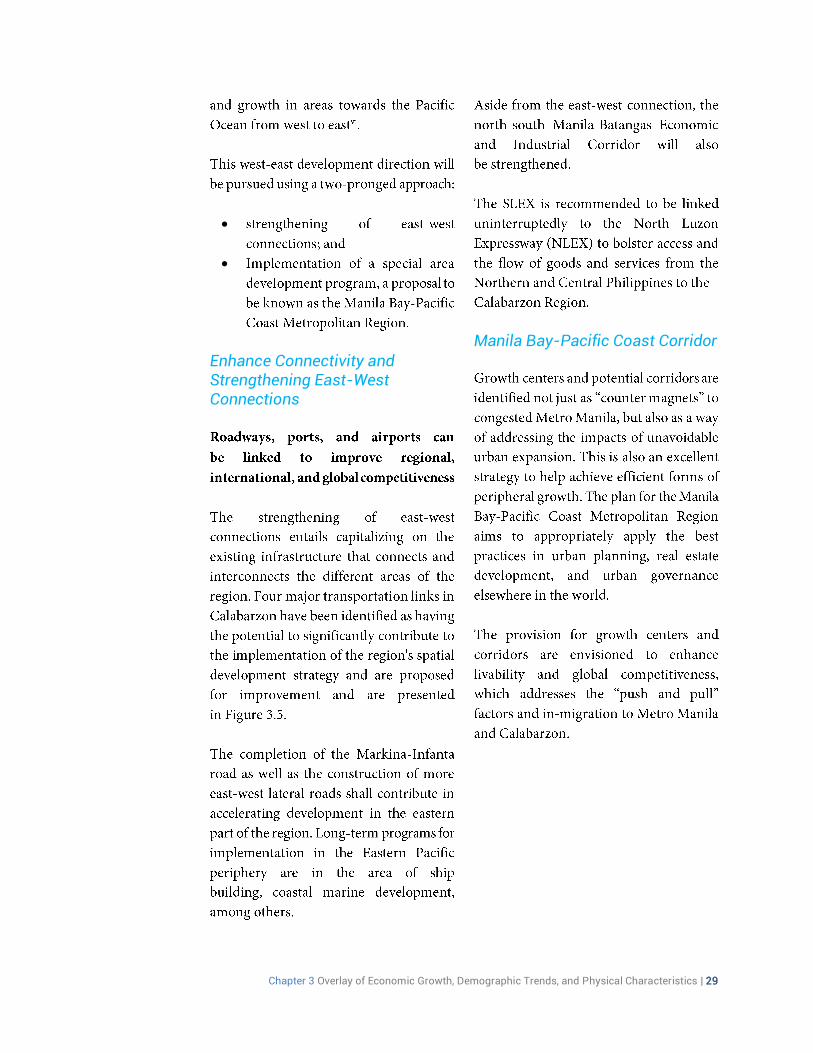
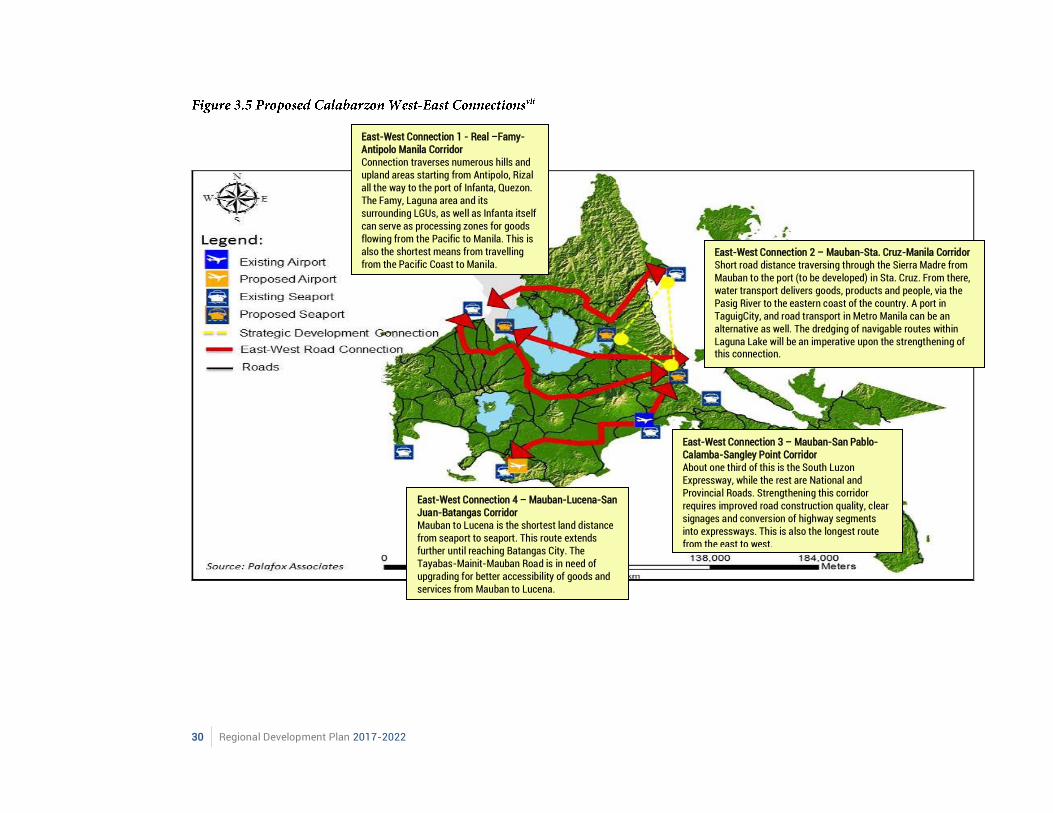
East-West Connection 1 - Real –Famy-Antipolo Manila Corridor Connection traverses numerous hills and upland areas starting from Antipolo, Rizal all the way to the port of Infanta, Quezon. The Famy, Laguna area and its surrounding LGUs, as well as Infanta itself can serve as processing zones for goods flowing from the Pacific to Manila. This is also the shortest means from travelling from the Pacific Coast to Manila.
East-West Connection 2 – Mauban-Sta. Cruz-Manila Corridor Short road distance traversing through the Sierra Madre from Mauban to the port (to be developed) in Sta. Cruz. From there, water transport delivers goods, products and people, via the Pasig River to the eastern coast of the country. A port in TaguigCity, and road transport in Metro Manila can be an alternative as well. The dredging of navigable routes within Laguna Lake will be an imperative upon the strengthening of this connection.
East-West Connection 3 – Mauban-San Pablo-Calamba-Sangley Point Corridor About one third of this is the South Luzon Expressway, while the rest are National and Provincial Roads. Strengthening this corridor requires improved road construction quality, clear signages and conversion of highway segments into expressways. This is also the longest route from the east to west.
East-West Connection 4 – Mauban-Lucena-San Juan-Batangas Corridor Mauban to Lucena is the shortest land distance from seaport to seaport. This route extends further until reaching Batangas City. The Tayabas-Mainit-Mauban Road is in need of upgrading for better accessibility of goods and services from Mauban to Lucena.
Chapter 3 Overlay of Economic Growth, Demographic Trends, and Physical Characteristics | 31
Prioritize Ports Development
32 Regional Development Plan 2017-2022
i
Chapter 3 Overlay of Economic Growth, Demographic Trends, and Physical Characteristics | 33

34 Regional Development Plan 2017-2022
Chapter 4 The RDP 2017-2022 Framework | 35

36 Regional Development Plan 2017-2022
Chapter 4 Regional Development Plan 2017-2022 Overall Framework | 37
Chapter 4
Regional Development Plan 2017-2022 Overall Framework
38 Regional Development Plan 2017-2022
Enhancing the social fabric
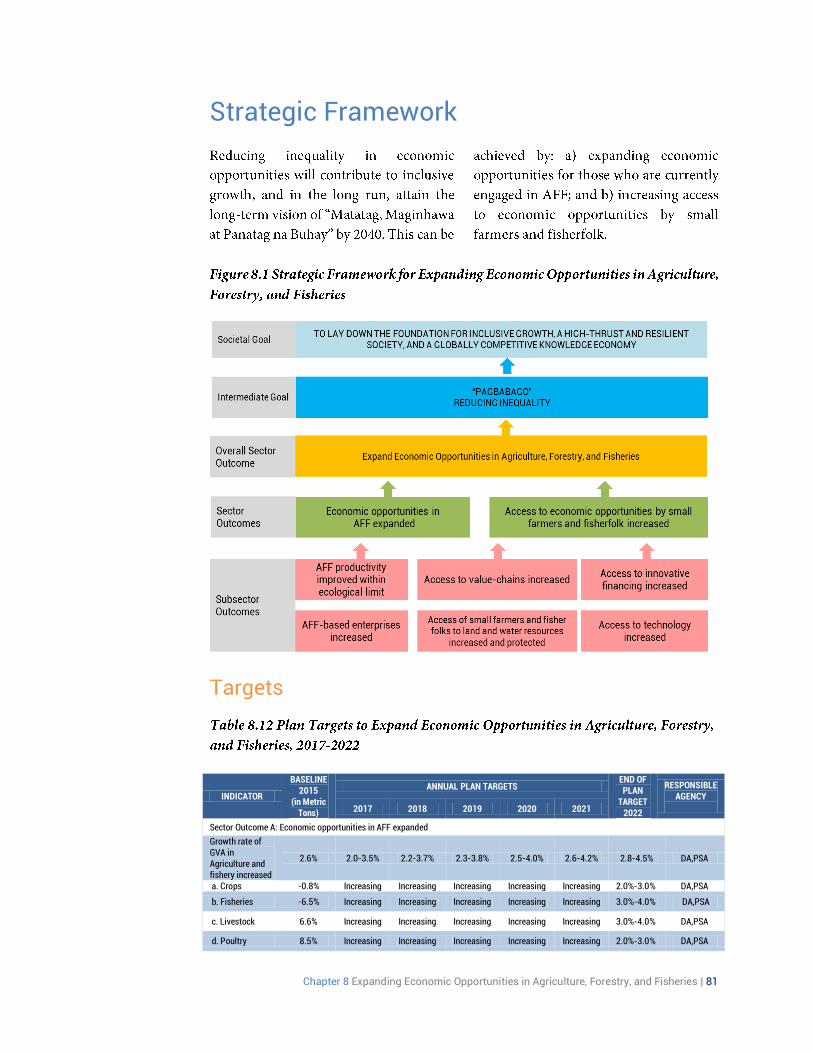
Reducing inequality
Increasing potential growth
Enabling and supportive economic environment
Foundations for sustainable development
Chapter 5 Ensuring People-Centered, Clean, and Efficient Governance | 39

40 Regional Development Plan 2017-2022
Chapter 5 Ensuring People-Centered, Clean, and Efficient Governance | 41

42 Regional Development Plan 2017-2022
Chapter 5 Ensuring People-Centered, Clean, and Efficient Governance | 43
Chapter 5
Ensuring People-centered, Clean and Efficient Governance
Trust in the government and its instrumentalities are necessary in order to sustain economic development. Lack of trust in the government by the public and investors equate to irresponsiveness to policies and programs. This chapter focuses on the role of good governance in development. The good governance characterized by a citizen-centered, clean, and efficient delivery of goods and services defines the pace of economic development.
Assessment and Challenges
Increasing transparency and citizens’ participation
44 Regional Development Plan 2017-2022
Improving performance management and accountability
Chapter 5 Ensuring People-Centered, Clean, and Efficient Governance | 45
Cities and Municipalities Competitiveness Index
46 Regional Development Plan 2017-2022
.
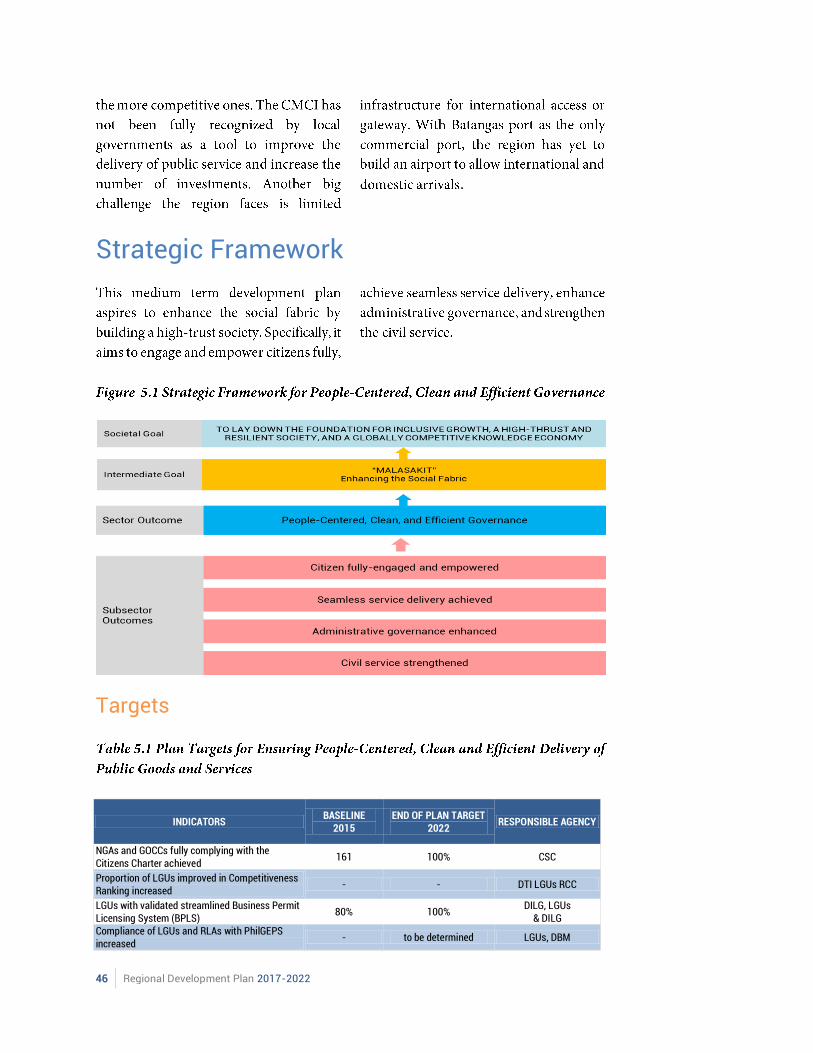
Strategic Framework
Targets
INDICATORS BASELINE
2015 END OF PLAN TARGET
2022 RESPONSIBLE AGENCY
NGAs and GOCCs fully complying with the Citizens Charter achieved
161 100% CSC
Proportion of LGUs improved in Competitiveness Ranking increased
- - DTI LGUs RCC
LGUs with validated streamlined Business Permit Licensing System (BPLS)
80% 100% DILG, LGUs
& DILG Compliance of LGUs and RLAs with PhilGEPS increased
- to be determined LGUs, DBM
Chapter 5 Ensuring People-Centered, Clean, and Efficient Governance | 47
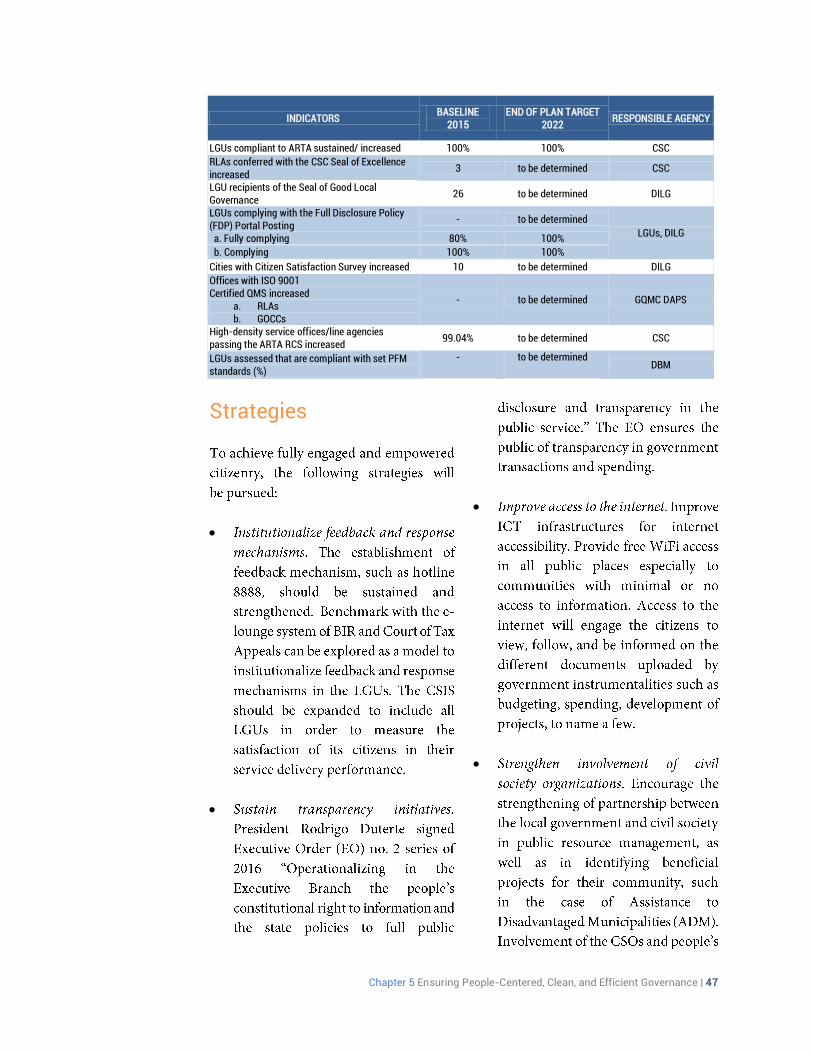
INDICATORS BASELINE
2015 END OF PLAN TARGET
2022 RESPONSIBLE AGENCY
LGUs compliant to ARTA sustained/ increased 100% 100% CSC
RLAs conferred with the CSC Seal of Excellence increased
3 to be determined CSC
LGU recipients of the Seal of Good Local Governance
26 to be determined DILG
LGUs complying with the Full Disclosure Policy (FDP) Portal Posting
- to be determined LGUs, DILG
a. Fully complying 80% 100% b. Complying 100% 100% Cities with Citizen Satisfaction Survey increased 10 to be determined DILG
Offices with ISO 9001 Certified QMS increased
a. RLAs b. GOCCs
- to be determined GQMC DAPS
High-density service offices/line agencies passing the ARTA RCS increased
99.04% to be determined CSC
LGUs assessed that are compliant with set PFM standards (%)
- to be determined DBM
Strategies
48 Regional Development Plan 2017-2022
Chapter 5 Ensuring People-Centered, Clean, and Efficient Governance | 49
50 Regional Development Plan 2017-2022
Major Programs and Projects

Chapter 6 Pursuing Swift and Fair Administration of Justice | 51

52 Regional Development Plan 2017-2022
Chapter 6 Pursuing Swift and Fair Administration of Justice | 53
Chapter 6
Pursuing Swift and Fair Administration of Justice This chapter discusses the role of economic justice in inclusive growth and the several initiatives identified to improve administration of justice. The administration of justice must be swift and fair.
Assessment and Challenges
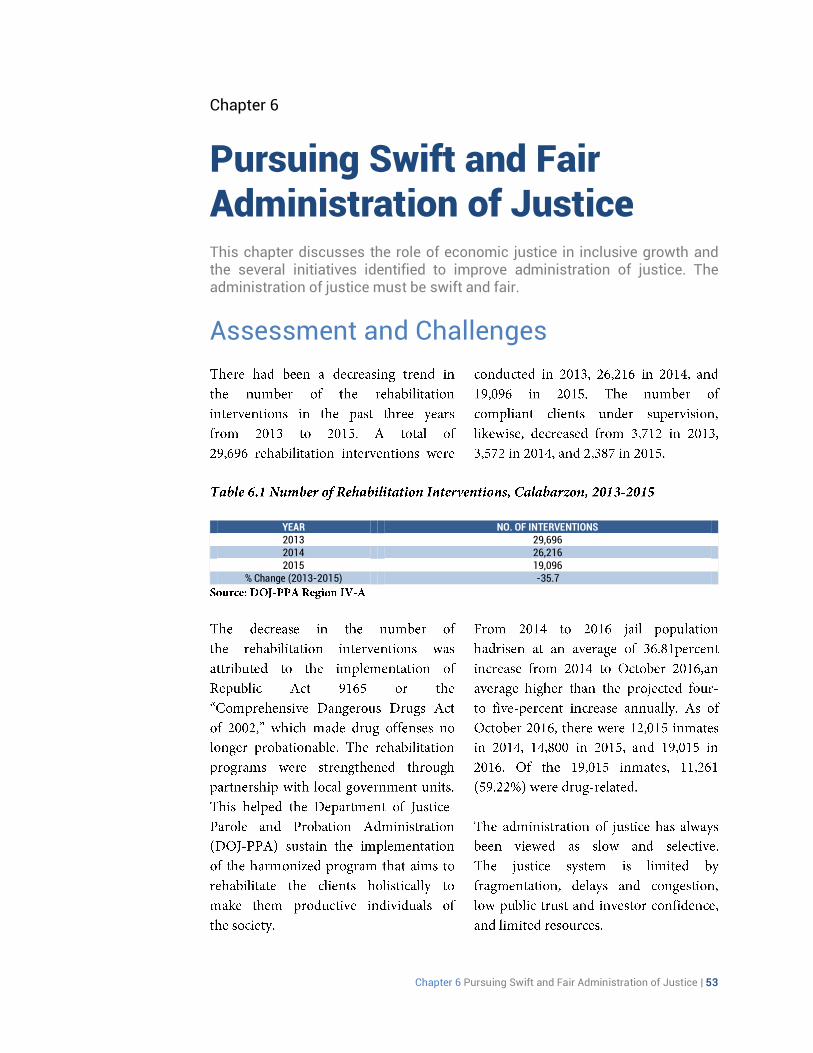
YEAR NO. OF INTERVENTIONS 2013 29,696 2014 26,216 2015 19,096
% Change (2013-2015) -35.7
54 Regional Development Plan 2017-2022
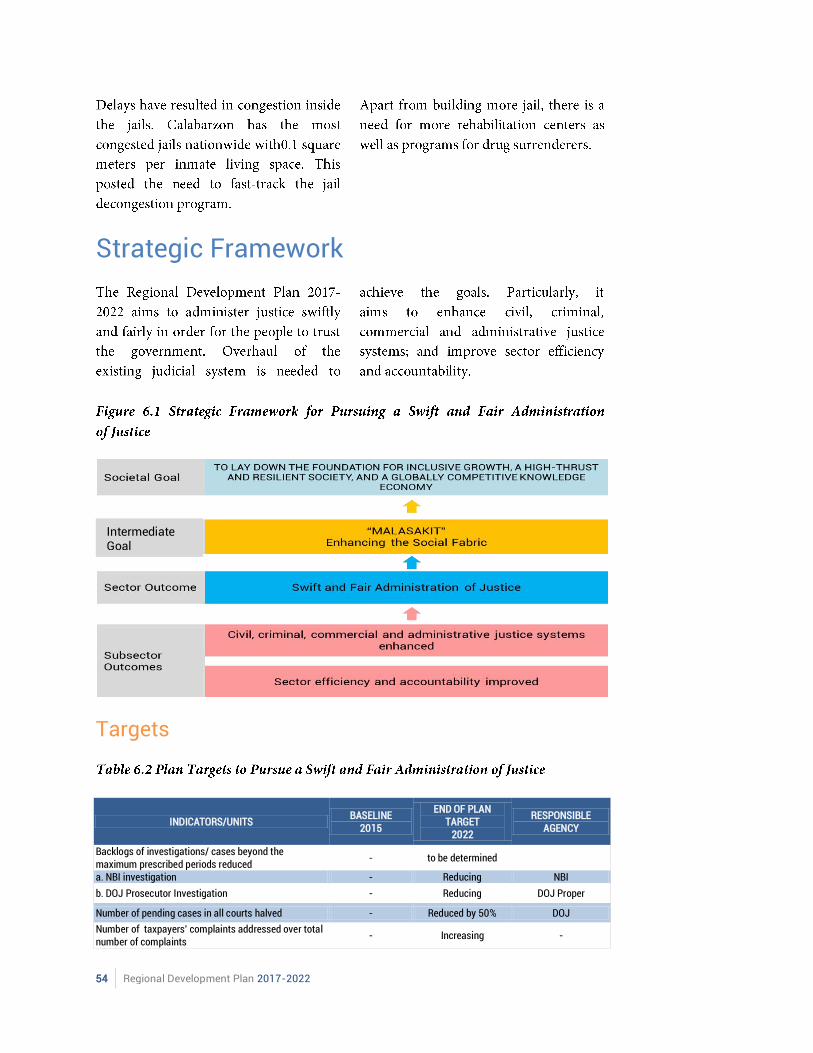
Strategic Framework
Targets
INDICATORS/UNITS BASELINE
2015
END OF PLAN TARGET
2022
RESPONSIBLE AGENCY
Backlogs of investigations/ cases beyond the maximum prescribed periods reduced
- to be determined
a. NBI investigation - Reducing NBI
b. DOJ Prosecutor Investigation - Reducing DOJ Proper
Number of pending cases in all courts halved - Reduced by 50% DOJ
Number of taxpayers’ complaints addressed over total number of complaints
- Increasing -
Intermediate Goal
Chapter 6 Pursuing Swift and Fair Administration of Justice | 55
Strategies
56 Regional Development Plan 2017-2022
Major Programs and Projects

Chapter 7 Promoting Philippine Culture and Values | 57

58 Regional Development Plan 2017-2022

Chapter 7 Promoting Philippine Culture and Values | 59
Chapter 7
Promoting Philippine Culture and Values
Culture, in its holistic context, is the thread that binds the social fabric of a particular group, community, and nation. Conflicts caused by differences among individuals can be cured by a single notion of what they value. Acceptance amidst cultural diversity provides an engaging environment wherein members of a particular community can freely participate, collaborate, and contribute. This eases the means to translate and realize the unified set of goals a particular nation is geared towards. Consonant to growth, culture is considered as one of the pillars to achieve inclusive growth since it caters wide range and cross-cutting sectors. A nation driven by culture-integrated programs and policies tend to be efficient due to the acceptable context by which these strategies were formulated. On the other hand, a nation damaged by policies that resound culture inequality paves way to disagreements in terms of economic, political, and social ideas. In general, culture fragmentation leads to the disorientation of the national development plans. This chapter aims to discuss the need for a one Filipino identity as a catalyst towards inclusive, sustainable and human-centered development. Hence, the Regional Development Plan adopts the priority areas reflected in the Philippine Development Plan: a) safeguarding and enshrining our cultural heritage, b) achieving equity and inclusion in access to cultural resources and services; and c) sustaining and enhancing cultural assets to foster creativity and innovation for soio-economic growth.
Assessment and Challenges

60 Regional Development Plan 2017-2022

Chapter 7 Promoting Philippine Culture and Values | 61
62 Regional Development Plan 2017-2022
Chapter 7 Promoting Philippine Culture and Values | 63
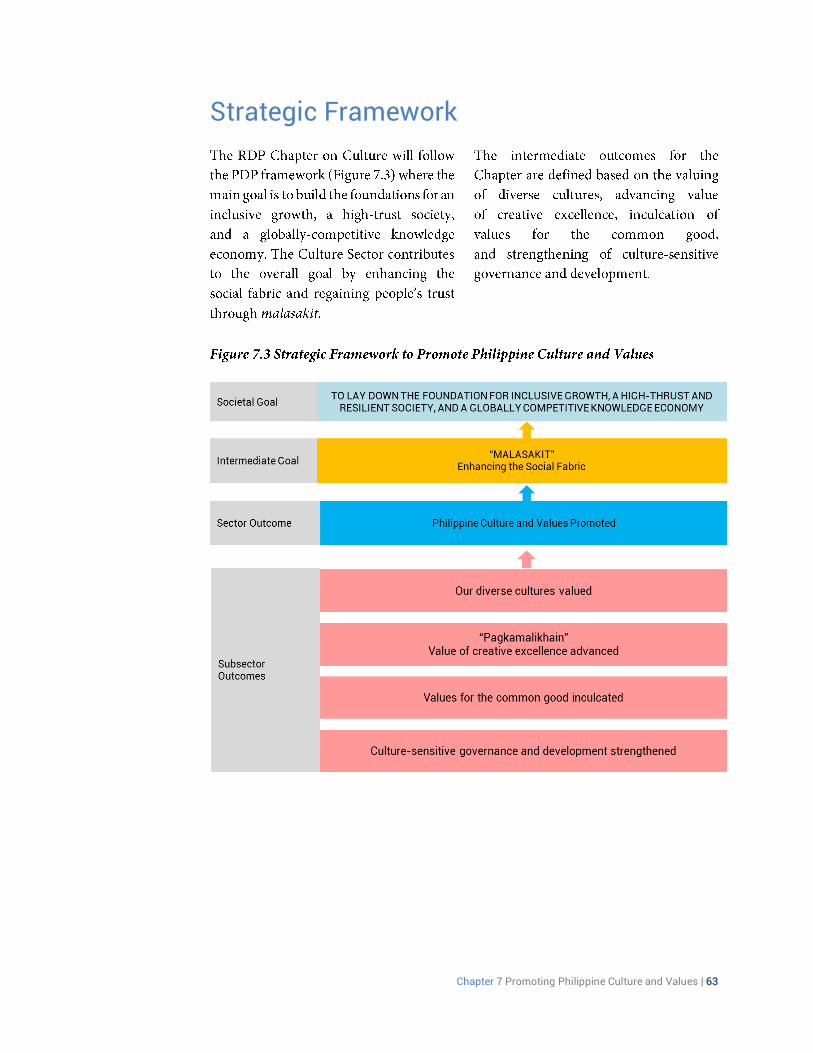
Strategic Framework
64 Regional Development Plan 2017-2022
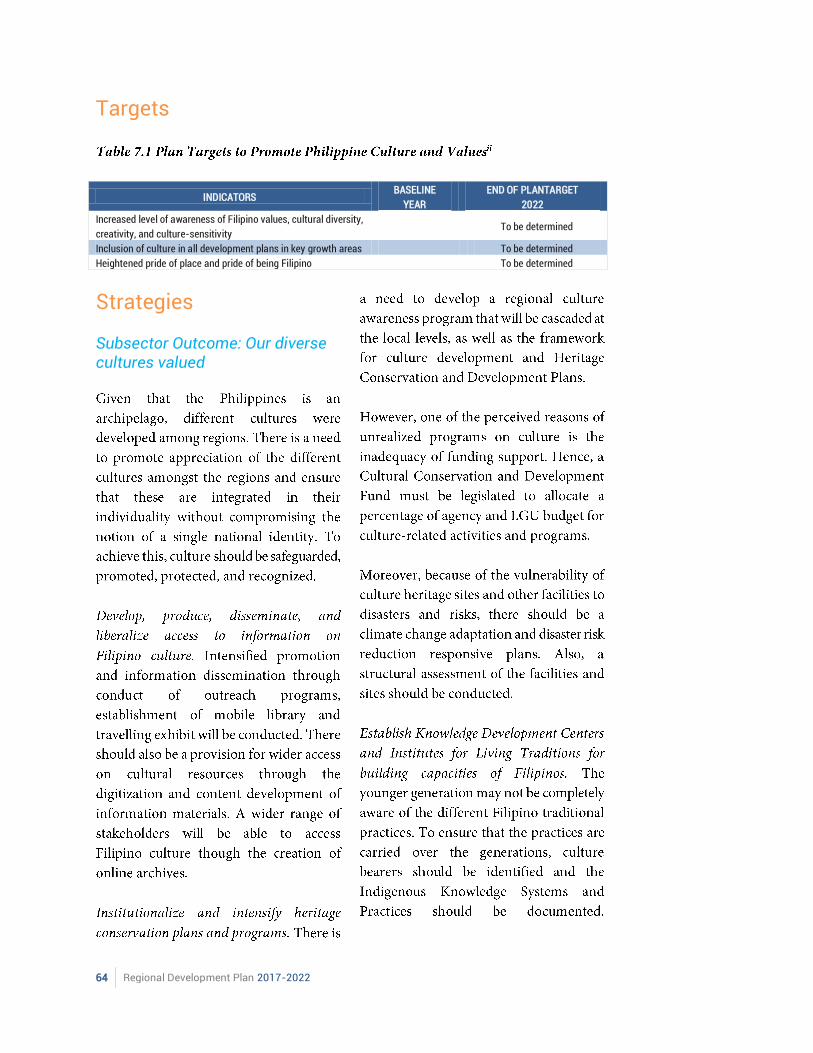
Targets
INDICATORS BASELINE
YEAR
END OF PLANTARGET
2022
Increased level of awareness of Filipino values, cultural diversity,
creativity, and culture-sensitivity
To be determined
Inclusion of culture in all development plans in key growth areas To be determined
Heightened pride of place and pride of being Filipino To be determined
Strategies Subsector Outcome: Our diverse cultures valued
Chapter 7 Promoting Philippine Culture and Values | 65
Subsector Outcome: “Pagkamalikhain” Value of creative excellence advanced
Subsector Outcome: Values for the common good inculcated
66 Regional Development Plan 2017-2022
Subsector Outcome: Culture-sensitive governance and development strengthened
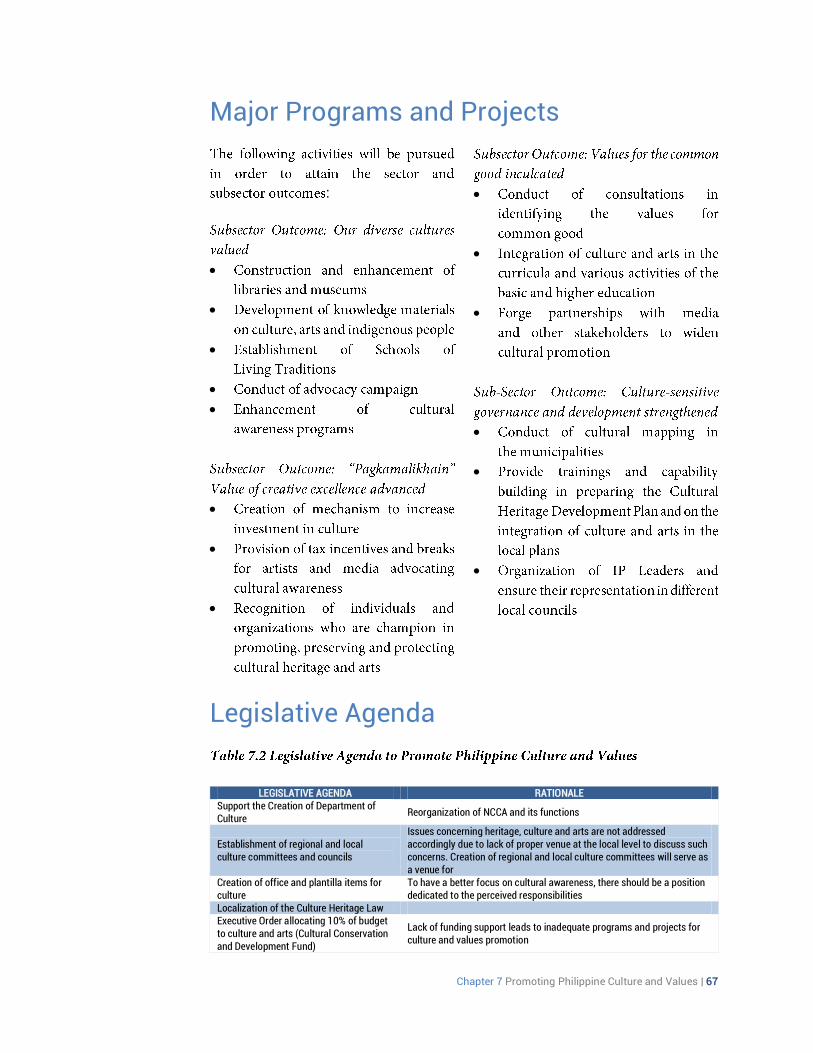
Chapter 7 Promoting Philippine Culture and Values | 67
Major Programs and Projects
:
Legislative Agenda
LEGISLATIVE AGENDA RATIONALE Support the Creation of Department of Culture
Reorganization of NCCA and its functions
Establishment of regional and local culture committees and councils
Issues concerning heritage, culture and arts are not addressed accordingly due to lack of proper venue at the local level to discuss such concerns. Creation of regional and local culture committees will serve as a venue for
Creation of office and plantilla items for culture
To have a better focus on cultural awareness, there should be a position dedicated to the perceived responsibilities
Localization of the Culture Heritage Law Executive Order allocating 10% of budget to culture and arts (Cultural Conservation and Development Fund)
Lack of funding support leads to inadequate programs and projects for culture and values promotion
68 Regional Development Plan 2017-2022
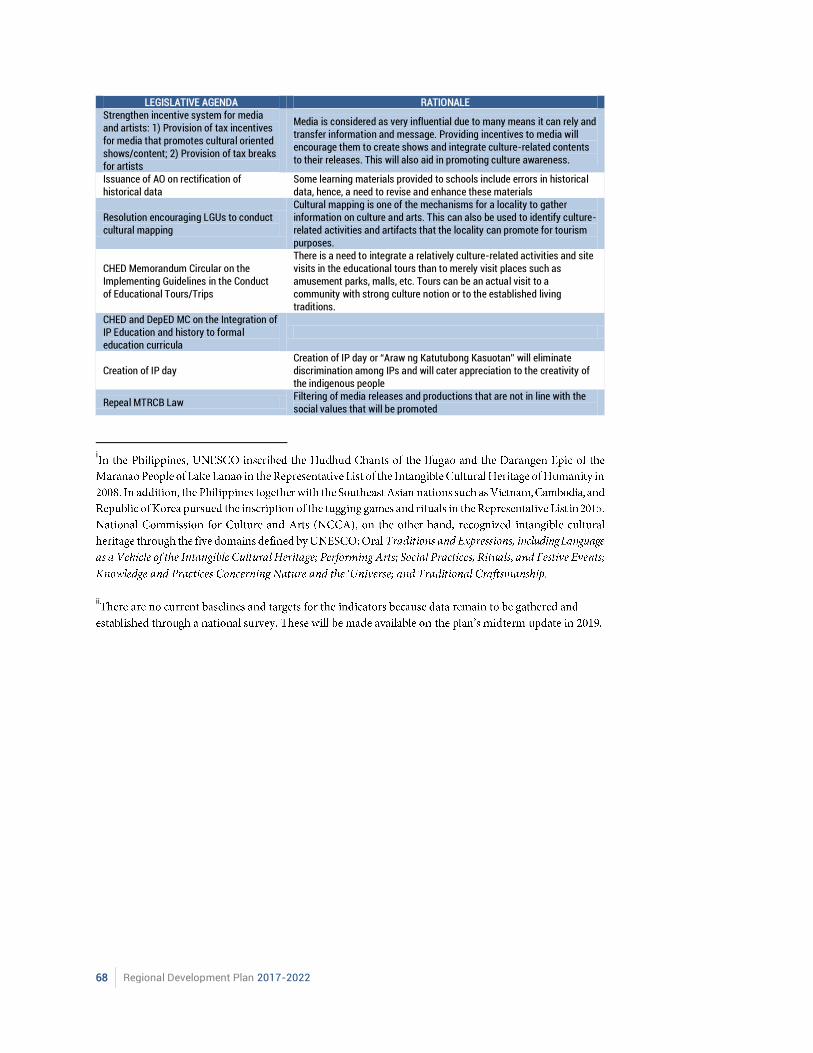
LEGISLATIVE AGENDA RATIONALE Strengthen incentive system for media and artists: 1) Provision of tax incentives for media that promotes cultural oriented shows/content; 2) Provision of tax breaks for artists
Media is considered as very influential due to many means it can rely and transfer information and message. Providing incentives to media will encourage them to create shows and integrate culture-related contents to their releases. This will also aid in promoting culture awareness.
Issuance of AO on rectification of historical data
Some learning materials provided to schools include errors in historical data, hence, a need to revise and enhance these materials
Resolution encouraging LGUs to conduct cultural mapping
Cultural mapping is one of the mechanisms for a locality to gather information on culture and arts. This can also be used to identify culture-related activities and artifacts that the locality can promote for tourism purposes.
CHED Memorandum Circular on the Implementing Guidelines in the Conduct of Educational Tours/Trips
There is a need to integrate a relatively culture-related activities and site visits in the educational tours than to merely visit places such as amusement parks, malls, etc. Tours can be an actual visit to a community with strong culture notion or to the established living traditions.
CHED and DepED MC on the Integration of IP Education and history to formal education curricula
Creation of IP day Creation of IP day or “Araw ng Katutubong Kasuotan” will eliminate discrimination among IPs and will cater appreciation to the creativity of the indigenous people
Repeal MTRCB Law Filtering of media releases and productions that are not in line with the social values that will be promoted
i
ii
Chapter 8 Expanding Economic Opportunities in Agriculture, Forestry, and Fisheries | 69

70 Regional Development Plan 2017-2022
Chapter 8 Expanding Economic Opportunities in Agriculture, Forestry, and Fisheries | 71

72 Regional Development Plan 2017-2022
Chapter 8 Expanding Economic Opportunities in Agriculture, Forestry, and Fisheries | 73
Chapter 8
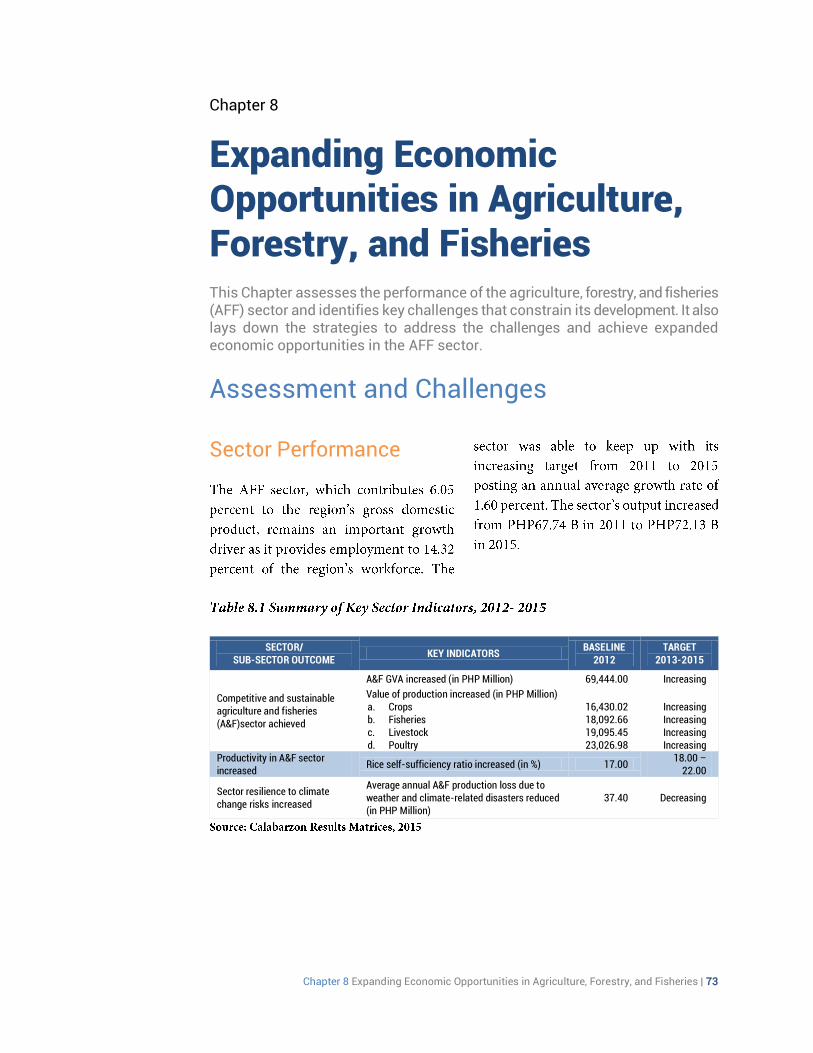
Expanding Economic Opportunities in Agriculture, Forestry, and Fisheries This Chapter assesses the performance of the agriculture, forestry, and fisheries (AFF) sector and identifies key challenges that constrain its development. It also lays down the strategies to address the challenges and achieve expanded economic opportunities in the AFF sector.
Assessment and Challenges Sector Performance
SECTOR/
SUB-SECTOR OUTCOME KEY INDICATORS
BASELINE 2012
TARGET 2013-2015
Competitive and sustainable agriculture and fisheries (A&F)sector achieved
A&F GVA increased (in PHP Million) 69,444.00 Increasing
Value of production increased (in PHP Million) a. Crops 16,430.02 Increasing b. Fisheries 18,092.66 Increasing c. Livestock 19,095.45 Increasing d. Poultry 23,026.98 Increasing
Productivity in A&F sector increased
Rice self-sufficiency ratio increased (in %) 17.00 18.00 –
22.00
Sector resilience to climate change risks increased
Average annual A&F production loss due to weather and climate-related disasters reduced (in PHP Million)
37.40 Decreasing
74 Regional Development Plan 2017-2022
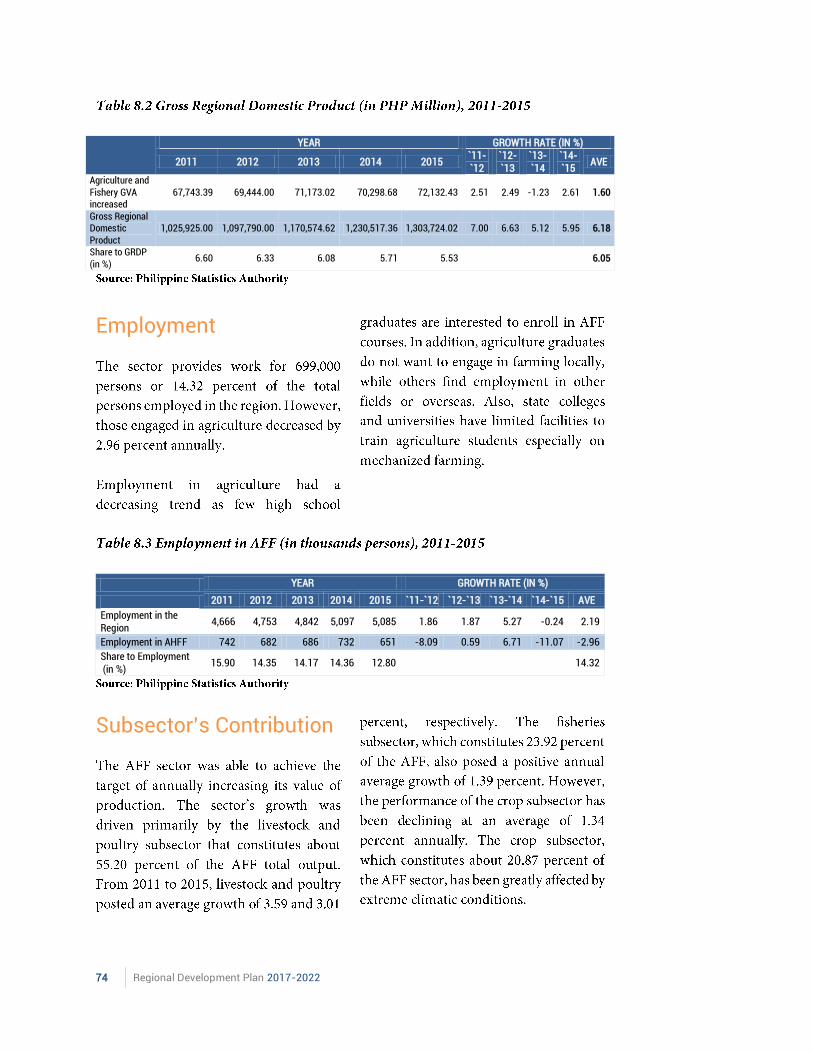
YEAR GROWTH RATE (IN %)
2011 2012 2013 2014 2015 `11-`12
`12-`13
`13-`14
`14-`15
AVE
Agriculture and Fishery GVA increased
67,743.39 69,444.00 71,173.02 70,298.68 72,132.43 2.51 2.49 -1.23 2.61 1.60
Gross Regional Domestic Product
1,025,925.00 1,097,790.00 1,170,574.62 1,230,517.36 1,303,724.02 7.00 6.63 5.12 5.95 6.18
Share to GRDP (in %)
6.60 6.33 6.08 5.71 5.53 6.05
Employment
YEAR GROWTH RATE (IN %)
2011 2012 2013 2014 2015 `11-`12 `12-`13 `13-`14 `14-`15 AVE
Employment in the Region
4,666 4,753 4,842 5,097 5,085 1.86 1.87 5.27 -0.24 2.19
Employment in AHFF 742 682 686 732 651 -8.09 0.59 6.71 -11.07 -2.96
Share to Employment (in %)
15.90 14.35 14.17 14.36 12.80 14.32
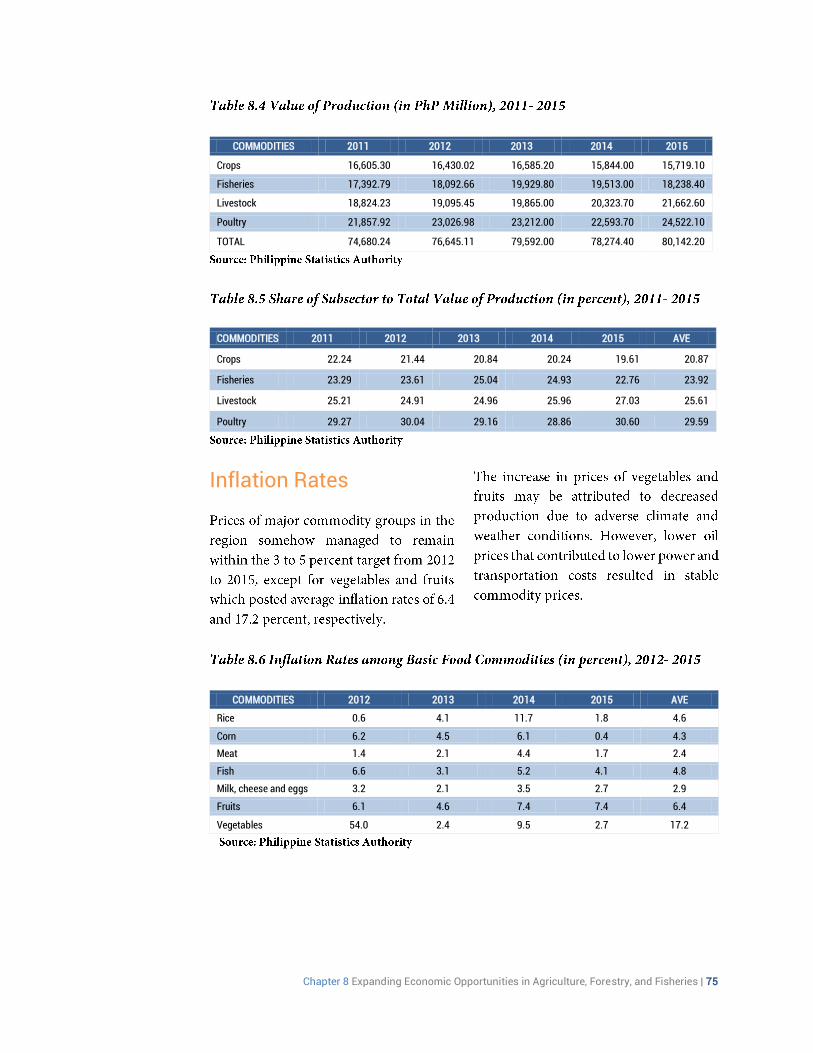
Subsector’s Contribution
Chapter 8 Expanding Economic Opportunities in Agriculture, Forestry, and Fisheries | 75
COMMODITIES 2011 2012 2013 2014 2015
Crops 16,605.30 16,430.02 16,585.20 15,844.00 15,719.10
Fisheries 17,392.79 18,092.66 19,929.80 19,513.00 18,238.40
Livestock 18,824.23 19,095.45 19,865.00 20,323.70 21,662.60
Poultry 21,857.92 23,026.98 23,212.00 22,593.70 24,522.10
TOTAL 74,680.24 76,645.11 79,592.00 78,274.40 80,142.20
COMMODITIES 2011 2012 2013 2014 2015 AVE
Crops 22.24 21.44 20.84 20.24 19.61 20.87
Fisheries 23.29 23.61 25.04 24.93 22.76 23.92
Livestock 25.21 24.91 24.96 25.96 27.03 25.61
Poultry 29.27 30.04 29.16 28.86 30.60 29.59
Inflation Rates
COMMODITIES 2012 2013 2014 2015 AVE
Rice 0.6 4.1 11.7 1.8 4.6
Corn 6.2 4.5 6.1 0.4 4.3
Meat 1.4 2.1 4.4 1.7 2.4
Fish 6.6 3.1 5.2 4.1 4.8
Milk, cheese and eggs 3.2 2.1 3.5 2.7 2.9
Fruits 6.1 4.6 7.4 7.4 6.4
Vegetables 54.0 2.4 9.5 2.7 17.2
76 Regional Development Plan 2017-2022
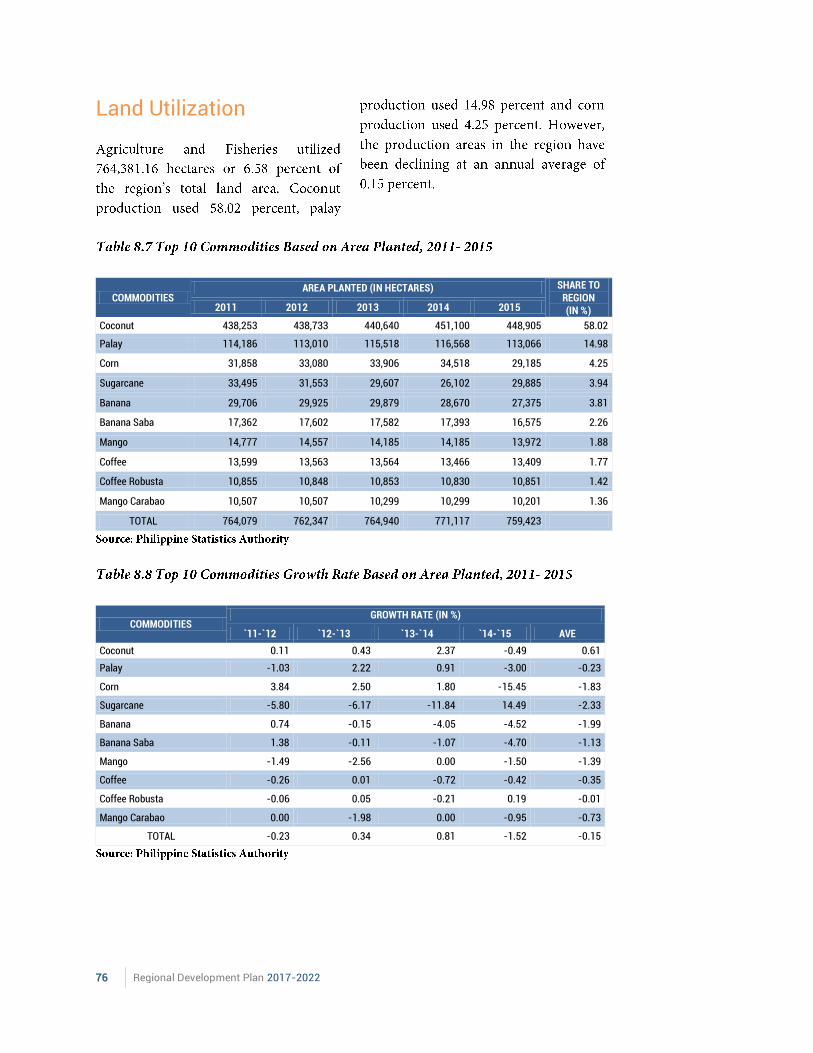
Land Utilization
COMMODITIES AREA PLANTED (IN HECTARES) SHARE TO
REGION (IN %) 2011 2012 2013 2014 2015
Coconut 438,253 438,733 440,640 451,100 448,905 58.02
Palay 114,186 113,010 115,518 116,568 113,066 14.98
Corn 31,858 33,080 33,906 34,518 29,185 4.25
Sugarcane 33,495 31,553 29,607 26,102 29,885 3.94
Banana 29,706 29,925 29,879 28,670 27,375 3.81
Banana Saba 17,362 17,602 17,582 17,393 16,575 2.26
Mango 14,777 14,557 14,185 14,185 13,972 1.88
Coffee 13,599 13,563 13,564 13,466 13,409 1.77
Coffee Robusta 10,855 10,848 10,853 10,830 10,851 1.42
Mango Carabao 10,507 10,507 10,299 10,299 10,201 1.36
TOTAL 764,079 762,347 764,940 771,117 759,423
COMMODITIES GROWTH RATE (IN %)
`11-`12 `12-`13 `13-`14 `14-`15 AVE
Coconut 0.11 0.43 2.37 -0.49 0.61
Palay -1.03 2.22 0.91 -3.00 -0.23
Corn 3.84 2.50 1.80 -15.45 -1.83
Sugarcane -5.80 -6.17 -11.84 14.49 -2.33
Banana 0.74 -0.15 -4.05 -4.52 -1.99
Banana Saba 1.38 -0.11 -1.07 -4.70 -1.13
Mango -1.49 -2.56 0.00 -1.50 -1.39
Coffee -0.26 0.01 -0.72 -0.42 -0.35
Coffee Robusta -0.06 0.05 -0.21 0.19 -0.01
Mango Carabao 0.00 -1.98 0.00 -0.95 -0.73
TOTAL -0.23 0.34 0.81 -1.52 -0.15
Chapter 8 Expanding Economic Opportunities in Agriculture, Forestry, and Fisheries | 77
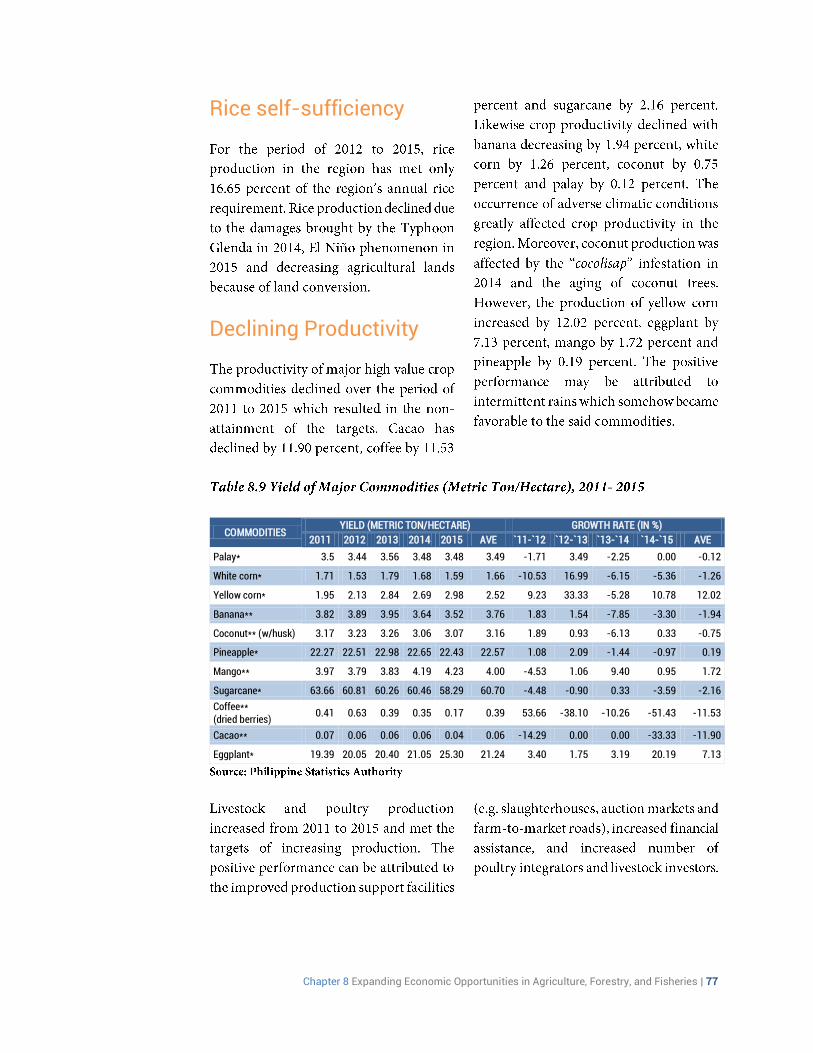
Rice self-sufficiency
Declining Productivity
COMMODITIES YIELD (METRIC TON/HECTARE) GROWTH RATE (IN %)
2011 2012 2013 2014 2015 AVE `11-`12 `12-`13 `13-`14 `14-`15 AVE
Palay* 3.5 3.44 3.56 3.48 3.48 3.49 -1.71 3.49 -2.25 0.00 -0.12
White corn* 1.71 1.53 1.79 1.68 1.59 1.66 -10.53 16.99 -6.15 -5.36 -1.26
Yellow corn* 1.95 2.13 2.84 2.69 2.98 2.52 9.23 33.33 -5.28 10.78 12.02
Banana** 3.82 3.89 3.95 3.64 3.52 3.76 1.83 1.54 -7.85 -3.30 -1.94
Coconut** (w/husk) 3.17 3.23 3.26 3.06 3.07 3.16 1.89 0.93 -6.13 0.33 -0.75
Pineapple* 22.27 22.51 22.98 22.65 22.43 22.57 1.08 2.09 -1.44 -0.97 0.19
Mango** 3.97 3.79 3.83 4.19 4.23 4.00 -4.53 1.06 9.40 0.95 1.72
Sugarcane* 63.66 60.81 60.26 60.46 58.29 60.70 -4.48 -0.90 0.33 -3.59 -2.16
Coffee** (dried berries)
0.41 0.63 0.39 0.35 0.17 0.39 53.66 -38.10 -10.26 -51.43 -11.53
Cacao** 0.07 0.06 0.06 0.06 0.04 0.06 -14.29 0.00 0.00 -33.33 -11.90
Eggplant* 19.39 20.05 20.40 21.05 25.30 21.24 3.40 1.75 3.19 20.19 7.13
78 Regional Development Plan 2017-2022
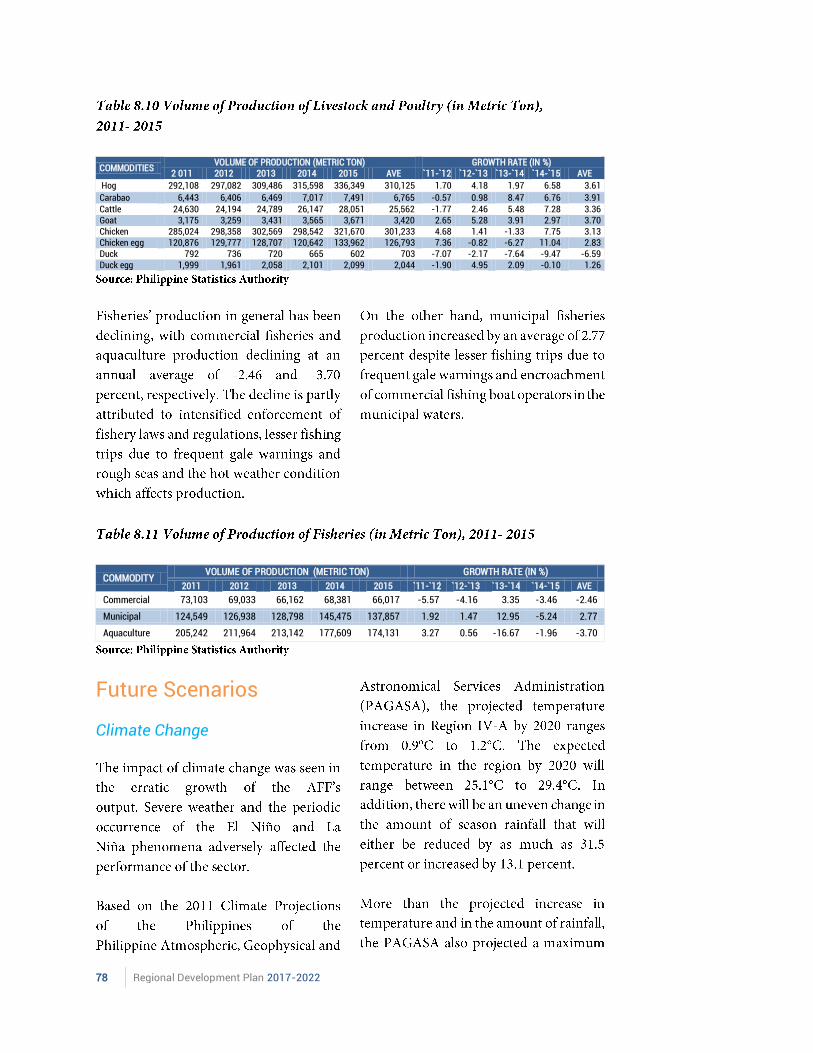
COMMODITIES VOLUME OF PRODUCTION (METRIC TON) GROWTH RATE (IN %)
2 011 2012 2013 2014 2015 AVE `11-`12 `12-`13 `13-`14 `14-`15 AVE
Hog 292,108 297,082 309,486 315,598 336,349 310,125 1.70 4.18 1.97 6.58 3.61
Carabao 6,443 6,406 6,469 7,017 7,491 6,765 -0.57 0.98 8.47 6.76 3.91 Cattle 24,630 24,194 24,789 26,147 28,051 25,562 -1.77 2.46 5.48 7.28 3.36 Goat 3,175 3,259 3,431 3,565 3,671 3,420 2.65 5.28 3.91 2.97 3.70 Chicken 285,024 298,358 302,569 298,542 321,670 301,233 4.68 1.41 -1.33 7.75 3.13 Chicken egg 120,876 129,777 128,707 120,642 133,962 126,793 7.36 -0.82 -6.27 11.04 2.83 Duck 792 736 720 665 602 703 -7.07 -2.17 -7.64 -9.47 -6.59 Duck egg 1,999 1,961 2,058 2,101 2,099 2,044 -1.90 4.95 2.09 -0.10 1.26
COMMODITY VOLUME OF PRODUCTION (METRIC TON) GROWTH RATE (IN %)
2011 2012 2013 2014 2015 `11-`12 `12-`13 `13-`14 `14-`15 AVE
Commercial 73,103 69,033 66,162 68,381 66,017 -5.57 -4.16 3.35 -3.46 -2.46
Municipal 124,549 126,938 128,798 145,475 137,857 1.92 1.47 12.95 -5.24 2.77
Aquaculture 205,242 211,964 213,142 177,609 174,131 3.27 0.56 -16.67 -1.96 -3.70
Future Scenarios Climate Change
Chapter 8 Expanding Economic Opportunities in Agriculture, Forestry, and Fisheries | 79
Comparative Advantage
Alternative Sources of Income
Market Accessibility
80 Regional Development Plan 2017-2022
Technology Adoption
Agriculture Promotion
Chapter 8 Expanding Economic Opportunities in Agriculture, Forestry, and Fisheries | 81
Strategic Framework
Targets
INDICATOR
BASELINE 2015
(in Metric Tons)
ANNUAL PLAN TARGETS END OF PLAN
TARGET 2022
RESPONSIBLE AGENCY
2017 2018 2019 2020 2021
Sector Outcome A: Economic opportunities in AFF expanded
Growth rate of GVA in Agriculture and fishery increased
2.6% 2.0-3.5% 2.2-3.7% 2.3-3.8% 2.5-4.0% 2.6-4.2% 2.8-4.5% DA,PSA
a. Crops -0.8% Increasing Increasing Increasing Increasing Increasing 2.0%-3.0% DA,PSA
b. Fisheries -6.5% Increasing Increasing Increasing Increasing Increasing 3.0%-4.0% DA,PSA
c. Livestock 6.6% Increasing Increasing Increasing Increasing Increasing 3.0%-4.0% DA,PSA
d. Poultry 8.5% Increasing Increasing Increasing Increasing Increasing 2.0%-3.0% DA,PSA
82 Regional Development Plan 2017-2022
INDICATOR
BASELINE 2015
(in Metric Tons)
ANNUAL PLAN TARGETS END OF PLAN
TARGET 2022
RESPONSIBLE AGENCY
2017 2018 2019 2020 2021
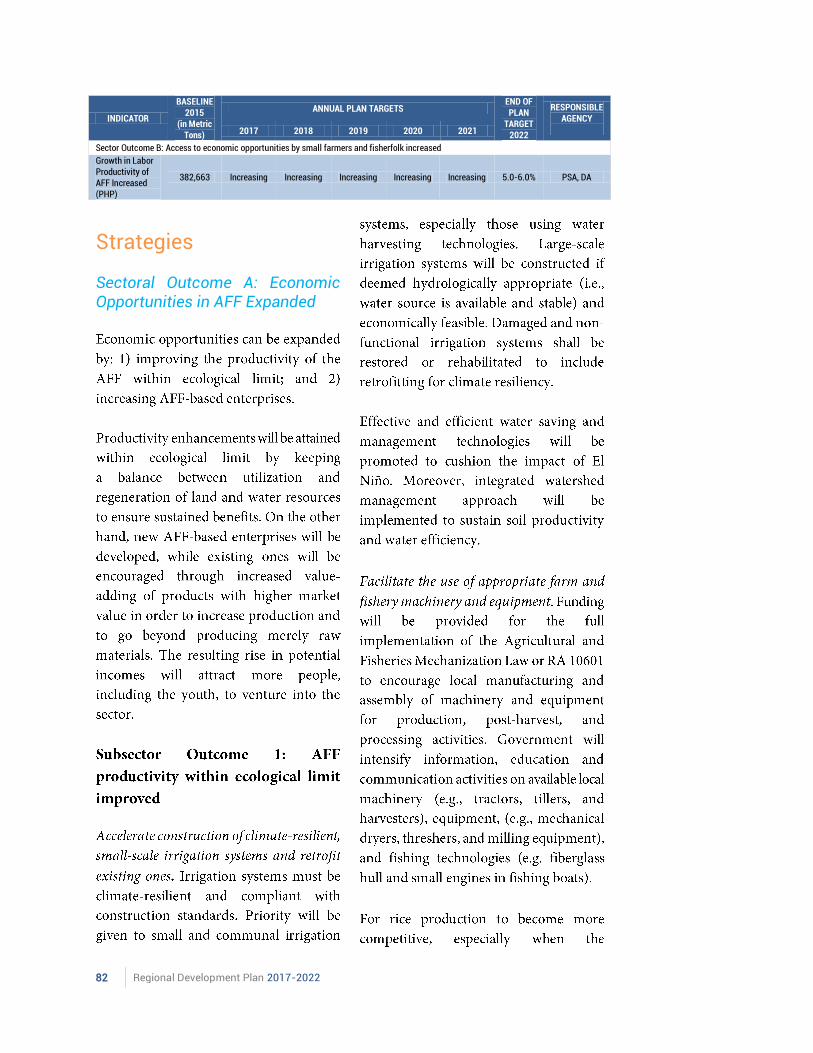
Sector Outcome B: Access to economic opportunities by small farmers and fisherfolk increased
Growth in Labor Productivity of AFF Increased (PHP)
382,663 Increasing Increasing Increasing Increasing Increasing 5.0-6.0% PSA, DA
Strategies
Sectoral Outcome A: Economic Opportunities in AFF Expanded
Chapter 8 Expanding Economic Opportunities in Agriculture, Forestry, and Fisheries | 83
84 Regional Development Plan 2017-2022
Sectoral Outcome B: Access to Economic Opportunities by Small Farmers and Fisherfolk Increased
Chapter 8 Expanding Economic Opportunities in Agriculture, Forestry, and Fisheries | 85
86 Regional Development Plan 2017-2022
Chapter 8 Expanding Economic Opportunities in Agriculture, Forestry, and Fisheries | 87
Major Programs and Projects

88 Regional Development Plan 2017-2022
89 Regional Development Plan 2017-2022

90 Regional Development Plan 2017-2022
Chapter 9 Expanding Economic Opportunities in Industry and Services | 91
Chapter 9
Expanding Economic Opportunities in Industry and Services
This Chapter assesses the performance of industry and services sector, identifies key challenges that constrain the development of the sector and lays down strategies to address the challenges and achieve expanded economic opportunities in industry and services.
Assessment and Challenges
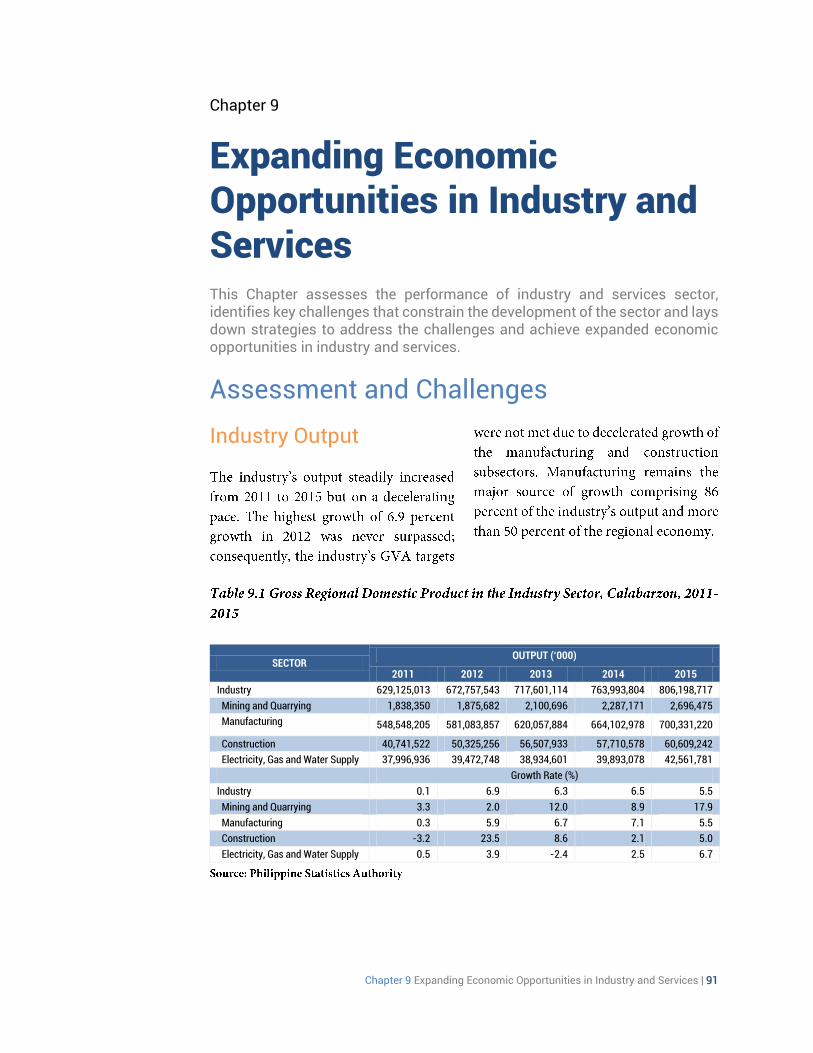
Industry Output
SECTOR OUTPUT (‘000)
2011 2012 2013 2014 2015
Industry 629,125,013 672,757,543 717,601,114 763,993,804 806,198,717
Mining and Quarrying 1,838,350 1,875,682 2,100,696 2,287,171 2,696,475
Manufacturing 548,548,205 581,083,857 620,057,884 664,102,978 700,331,220
Construction 40,741,522 50,325,256 56,507,933 57,710,578 60,609,242
Electricity, Gas and Water Supply 37,996,936 39,472,748 38,934,601 39,893,078 42,561,781
Growth Rate (%)
Industry 0.1 6.9 6.3 6.5 5.5
Mining and Quarrying 3.3 2.0 12.0 8.9 17.9
Manufacturing 0.3 5.9 6.7 7.1 5.5
Construction -3.2 23.5 8.6 2.1 5.0
Electricity, Gas and Water Supply 0.5 3.9 -2.4 2.5 6.7

92 Regional Development Plan 2017-2022
SECTOR OUTPUT (‘000)
2011 2012 2013 2014 2015
Services 329,178,347 353,911,552 381,800,493 396,224,882 425,392,864
Transport, Storage & Communication 67,036,558 71,466,700 75,989,886 81,015,668 85,785,427 Trade and Repair of Motor Vehicles, Motorcycles, Personal & Household Goods,
81,438,257 87,376,119 90,596,166 91,479,239 97,792,624
Financial Intermediation 33,513,199 37,228,829 42,441,010 45,739,973 48,481,969 Real Estate, Renting & Business Activities 85,362,809 93,447,168 103,128,122 106,583,547 113,817,636 Public Administration & Defense, Compulsory Social Security
12,928,277 13,784,329 14,613,386 15,189,527 15,301,886
Other Services 48,899,248 50,608,407 55,031,923 56,216,928 64,213,322

Chapter 9 Expanding Economic Opportunities in Industry and Services | 93
Employment Generation
SUBSECTOR
2011 2012 2013 2014 2015
NO.
(IN ‘000) %
NO.
( IN ‘000) %
NO.
( IN ‘000) %
NO.
( IN ‘000) %
NO.
( IN ‘000) %
Industry 1,158 1,200 1,259 1,330 1,332
Mining and Quarrying
3 0.26 3 0.25 3 0.24 6 0.45 6 0.45
Manufacturing 789 68.13 814 67.83 852 67.67 902 67.82 905 67.94
Construction 340 29.36 355 29.58 378 30.02 403 30.30 402 30.18
Electricity, Gas and Water Supply
25 2.16 28 2.33 24 1.91 25 1.88 25 1.88
EMPLOYMENT
2011 2012 2013 2014 2015
NO.
(IN ‘000) %
NO.
( IN ‘000) %
NO.
( IN ‘000) %
NO.
( IN ‘000) %
NO.
( IN ‘000) %
Industry 1,158 1,200 1,259 1,330 1,332
Mining and Quarrying
3 0.26 3 0.25 3 0.24 6 0.45 6 0.45
Manufacturing 789 68.13 814 67.83 852 67.67 902 67.82 905 67.94
Construction 340 29.36 355 29.58 378 30.02 403 30.30 402 30.18
Electricity, Gas and Water Supply
25 2.16 28 2.33 24 1.91 25 1.88 25 1.88
94 Regional Development Plan 2017-2022
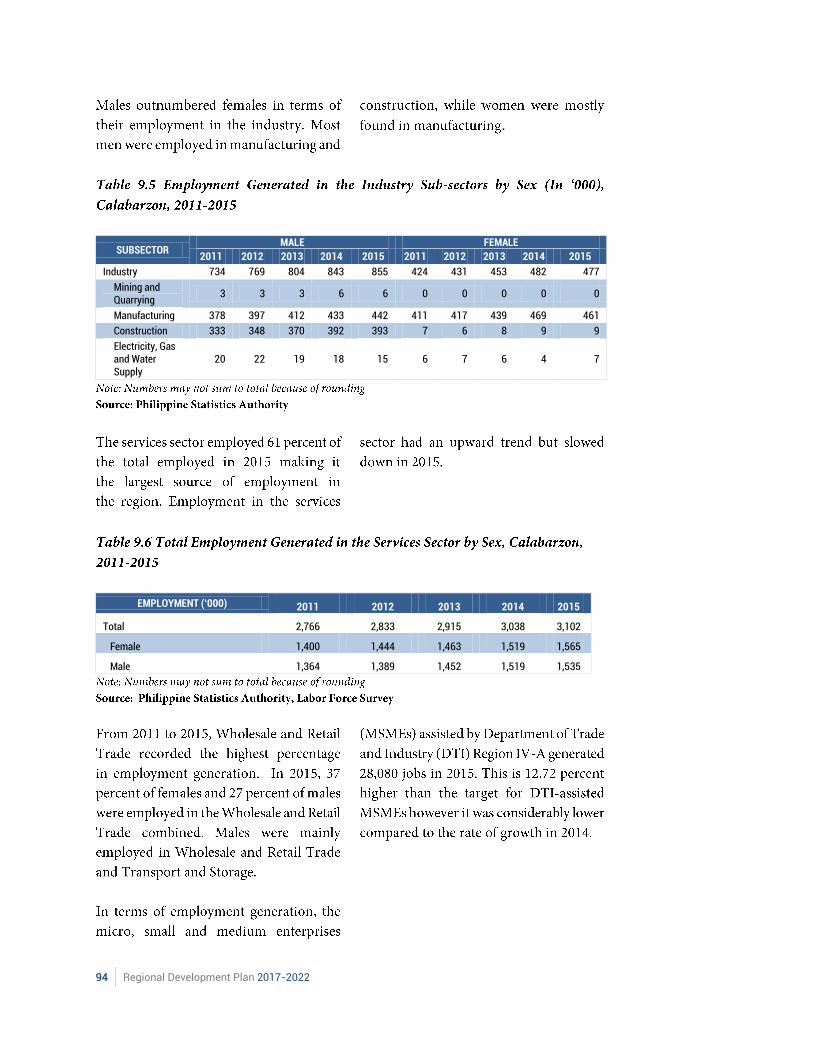
.
SUBSECTOR MALE FEMALE
2011 2012 2013 2014 2015 2011 2012 2013 2014 2015
Industry 734 769 804 843 855 424 431 453 482 477
Mining and Quarrying
3 3 3 6 6 0 0 0 0 0
Manufacturing 378 397 412 433 442 411 417 439 469 461
Construction 333 348 370 392 393 7 6 8 9 9
Electricity, Gas and Water Supply
20 22 19 18 15 6 7 6 4 7
EMPLOYMENT (‘000) 2011 2012 2013 2014 2015
Total 2,766 2,833 2,915 3,038 3,102
Female 1,400 1,444 1,463 1,519 1,565
Male 1,364 1,389 1,452 1,519 1,535
Chapter 9 Expanding Economic Opportunities in Industry and Services | 95
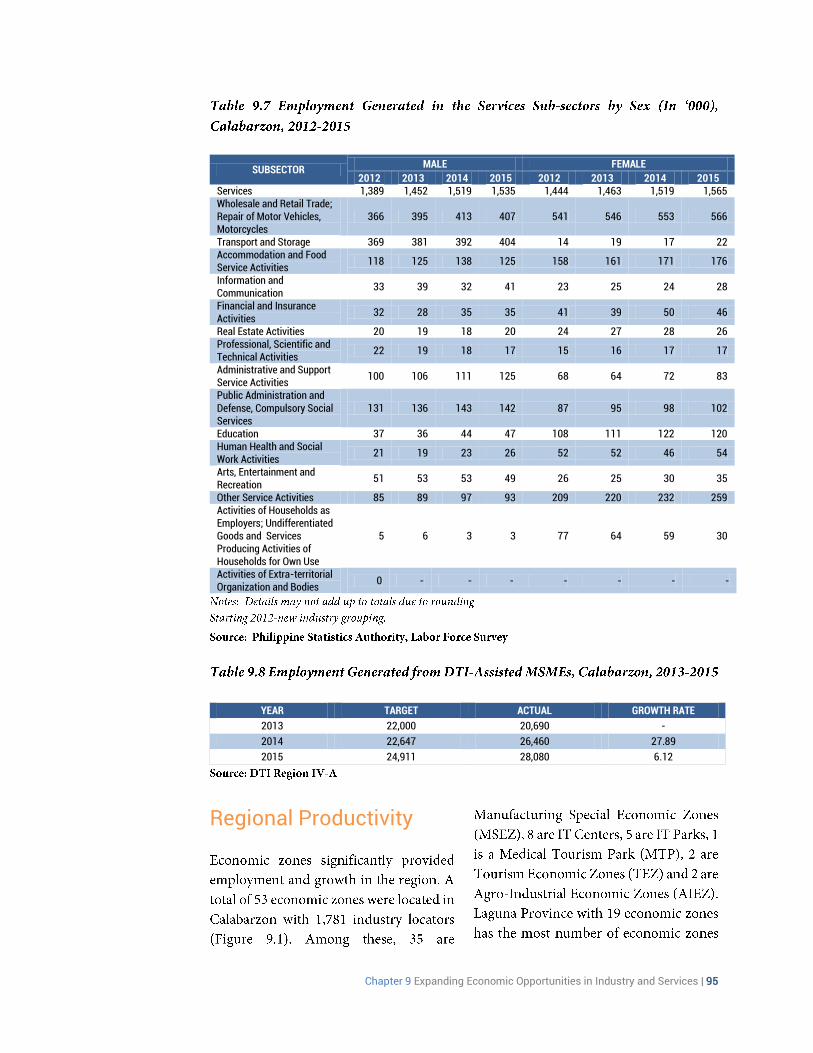
SUBSECTOR MALE FEMALE
2012 2013 2014 2015 2012 2013 2014 2015 Services 1,389 1,452 1,519 1,535 1,444 1,463 1,519 1,565 Wholesale and Retail Trade; Repair of Motor Vehicles, Motorcycles
366 395 413 407 541 546 553 566
Transport and Storage 369 381 392 404 14 19 17 22 Accommodation and Food Service Activities
118 125 138 125 158 161 171 176
Information and Communication
33 39 32 41 23 25 24 28
Financial and Insurance Activities
32 28 35 35 41 39 50 46
Real Estate Activities 20 19 18 20 24 27 28 26 Professional, Scientific and Technical Activities
22 19 18 17 15 16 17 17
Administrative and Support Service Activities
100 106 111 125 68 64 72 83
Public Administration and Defense, Compulsory Social Services
131 136 143 142 87 95 98 102
Education 37 36 44 47 108 111 122 120 Human Health and Social Work Activities
21 19 23 26 52 52 46 54
Arts, Entertainment and Recreation
51 53 53 49 26 25 30 35
Other Service Activities 85 89 97 93 209 220 232 259 Activities of Households as Employers; Undifferentiated Goods and Services Producing Activities of Households for Own Use
5 6 3 3 77 64 59 30
Activities of Extra-territorial Organization and Bodies
0 - - - - - - -
YEAR TARGET ACTUAL GROWTH RATE
2013 22,000 20,690 -
2014 22,647 26,460 27.89
2015 24,911 28,080 6.12
Regional Productivity
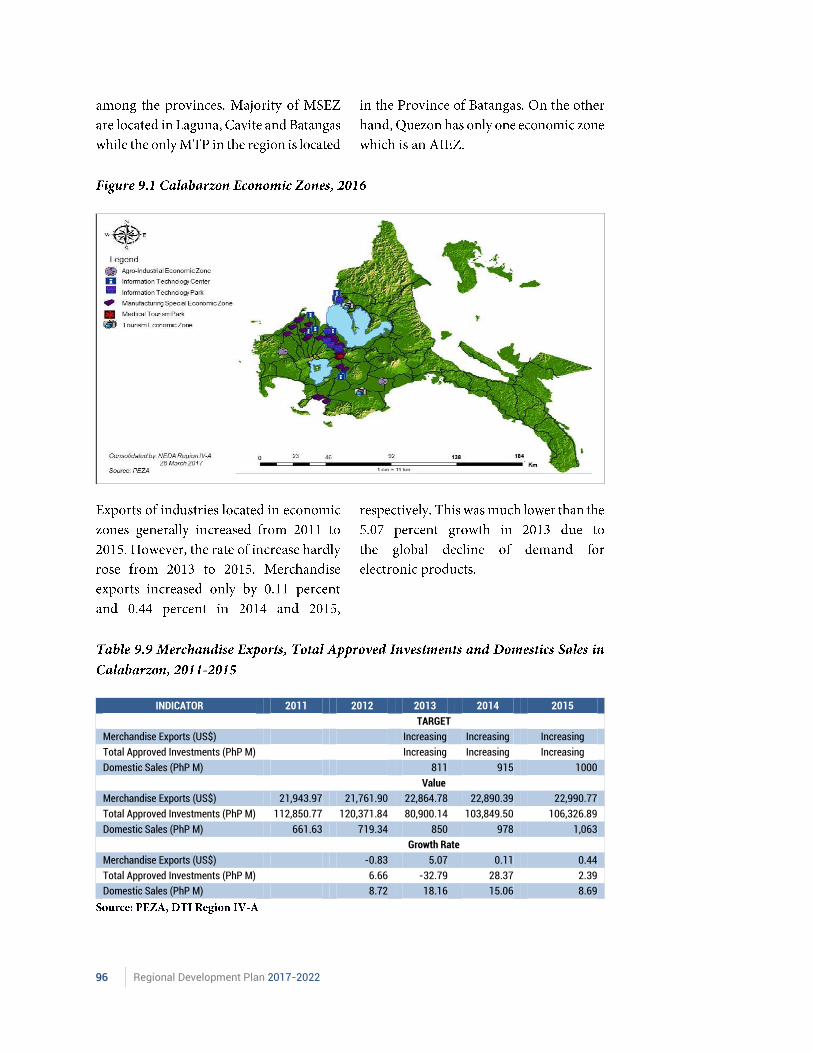
96 Regional Development Plan 2017-2022
INDICATOR 2011 2012 2013 2014 2015
TARGET
Merchandise Exports (US$) Increasing Increasing Increasing
Total Approved Investments (PhP M) Increasing Increasing Increasing
Domestic Sales (PhP M) 811 915 1000
Value
Merchandise Exports (US$) 21,943.97 21,761.90 22,864.78 22,890.39 22,990.77
Total Approved Investments (PhP M) 112,850.77 120,371.84 80,900.14 103,849.50 106,326.89
Domestic Sales (PhP M) 661.63 719.34 850 978 1,063
Growth Rate
Merchandise Exports (US$) -0.83 5.07 0.11 0.44
Total Approved Investments (PhP M) 6.66 -32.79 28.37 2.39
Domestic Sales (PhP M) 8.72 18.16 15.06 8.69
Chapter 9 Expanding Economic Opportunities in Industry and Services | 97
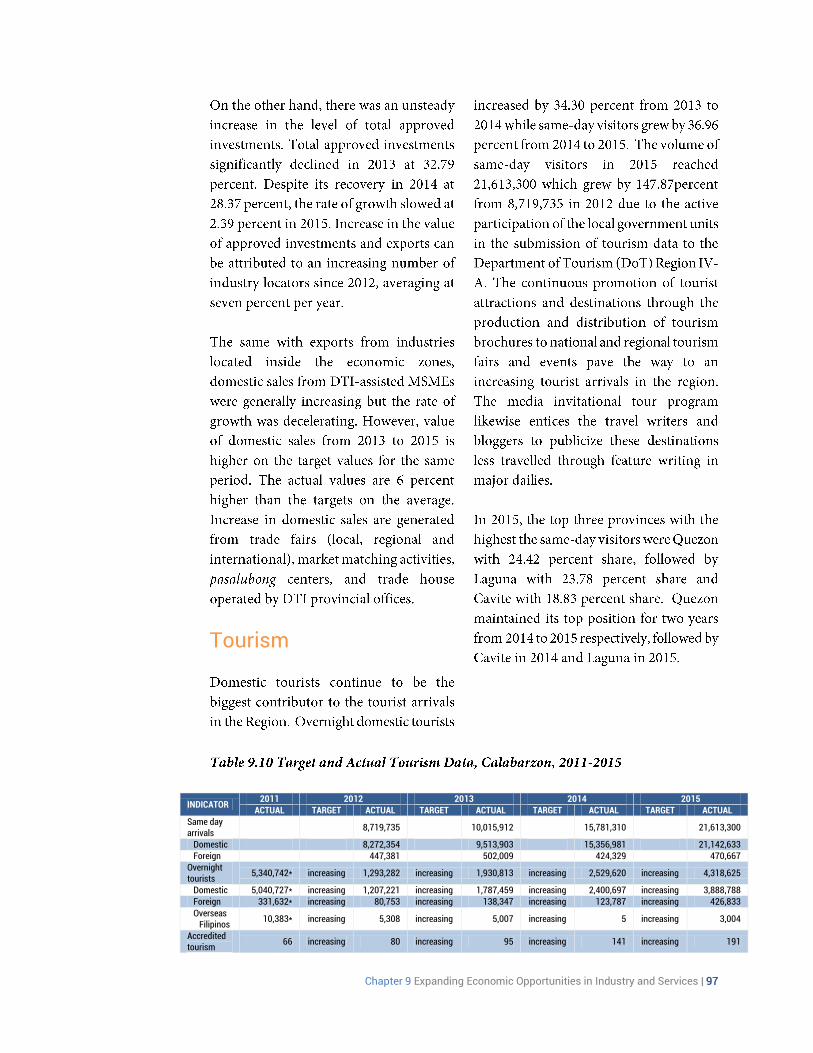
Tourism
INDICATOR 2011 2012 2013 2014 2015
ACTUAL TARGET ACTUAL TARGET ACTUAL TARGET ACTUAL TARGET ACTUAL Same day arrivals
8,719,735 10,015,912 15,781,310 21,613,300
Domestic 8,272,354 9,513,903 15,356,981 21,142,633 Foreign 447,381 502,009 424,329 470,667 Overnight tourists
5,340,742* increasing 1,293,282 increasing 1,930,813 increasing 2,529,620 increasing 4,318,625
Domestic 5,040,727* increasing 1,207,221 increasing 1,787,459 increasing 2,400,697 increasing 3,888,788 Foreign 331,632* increasing 80,753 increasing 138,347 increasing 123,787 increasing 426,833
Overseas Filipinos
10,383* increasing 5,308 increasing 5,007 increasing 5 increasing 3,004
Accredited tourism
66 increasing 80 increasing 95 increasing 141 increasing 191
98 Regional Development Plan 2017-2022
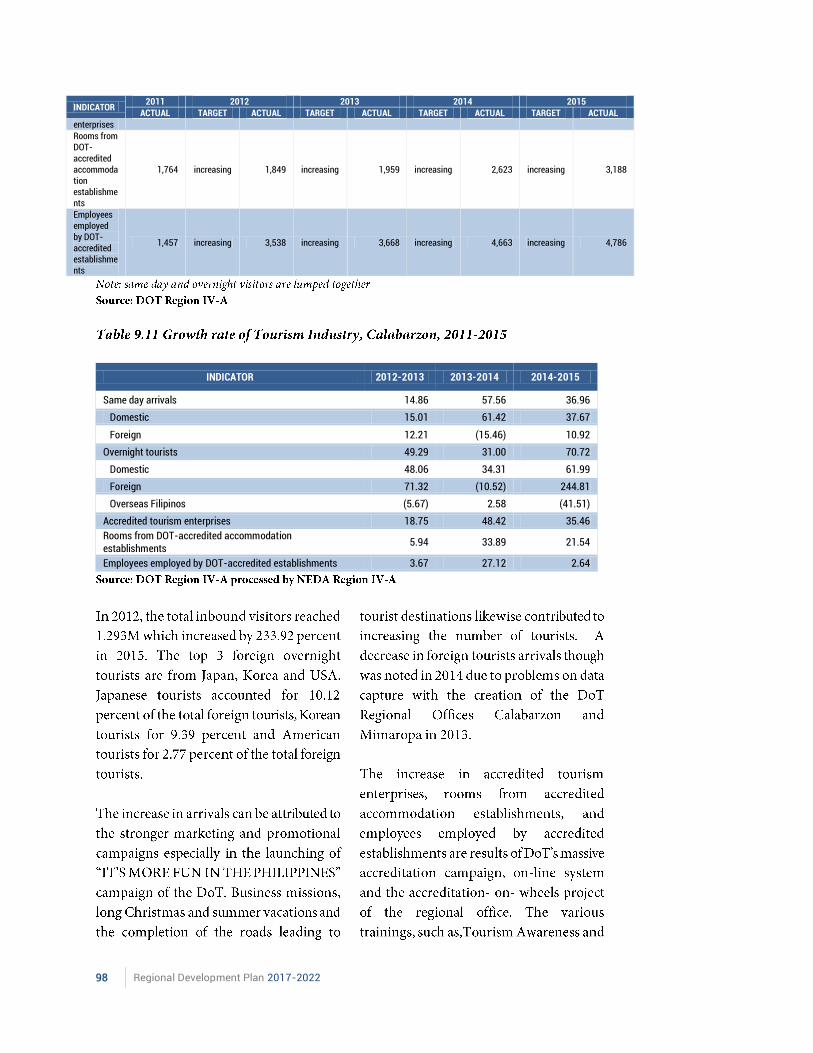
INDICATOR 2011 2012 2013 2014 2015
ACTUAL TARGET ACTUAL TARGET ACTUAL TARGET ACTUAL TARGET ACTUAL enterprises Rooms from DOT-accredited accommodation establishments
1,764 increasing 1,849 increasing 1,959 increasing 2,623 increasing 3,188
Employees employed by DOT-accredited establishments
1,457 increasing 3,538 increasing 3,668 increasing 4,663 increasing 4,786
INDICATOR 2012-2013 2013-2014 2014-2015
Same day arrivals 14.86 57.56 36.96
Domestic 15.01 61.42 37.67
Foreign 12.21 (15.46) 10.92
Overnight tourists 49.29 31.00 70.72
Domestic 48.06 34.31 61.99
Foreign 71.32 (10.52) 244.81
Overseas Filipinos (5.67) 2.58 (41.51)
Accredited tourism enterprises 18.75 48.42 35.46
Rooms from DOT-accredited accommodation establishments
5.94 33.89 21.54
Employees employed by DOT-accredited establishments 3.67 27.12 2.64
Chapter 9 Expanding Economic Opportunities in Industry and Services | 99
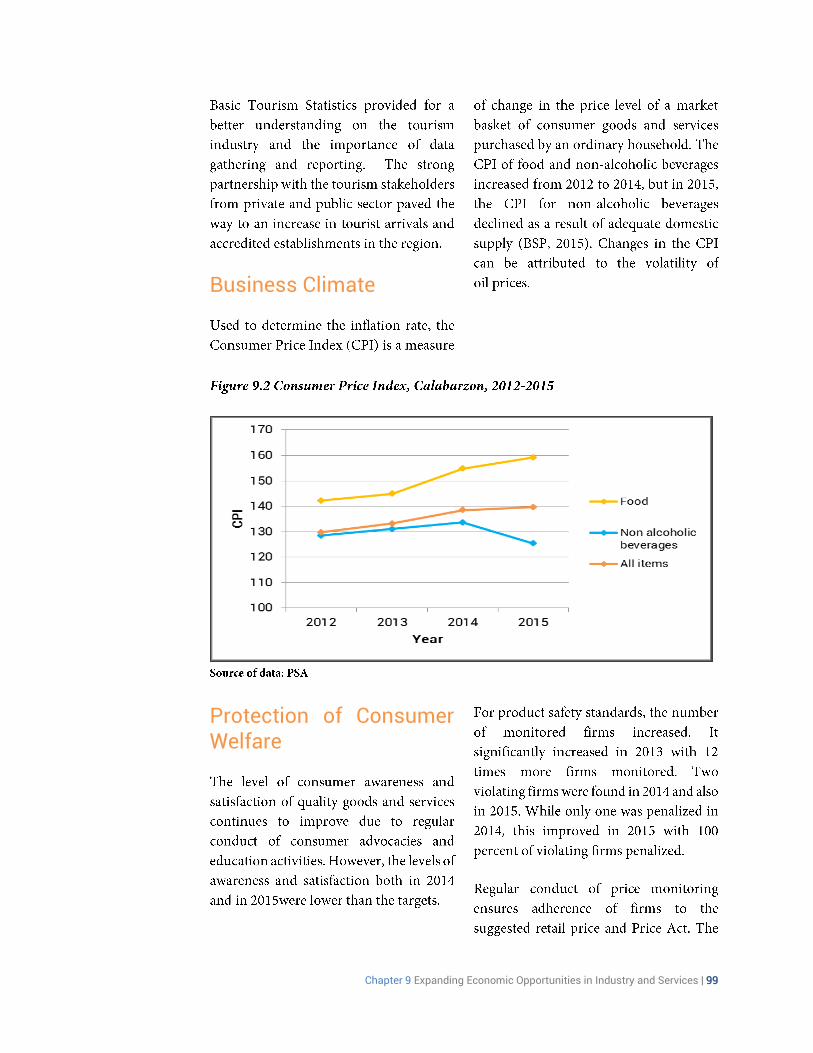
Business Climate
Protection of Consumer Welfare
100 Regional Development Plan 2017-2022
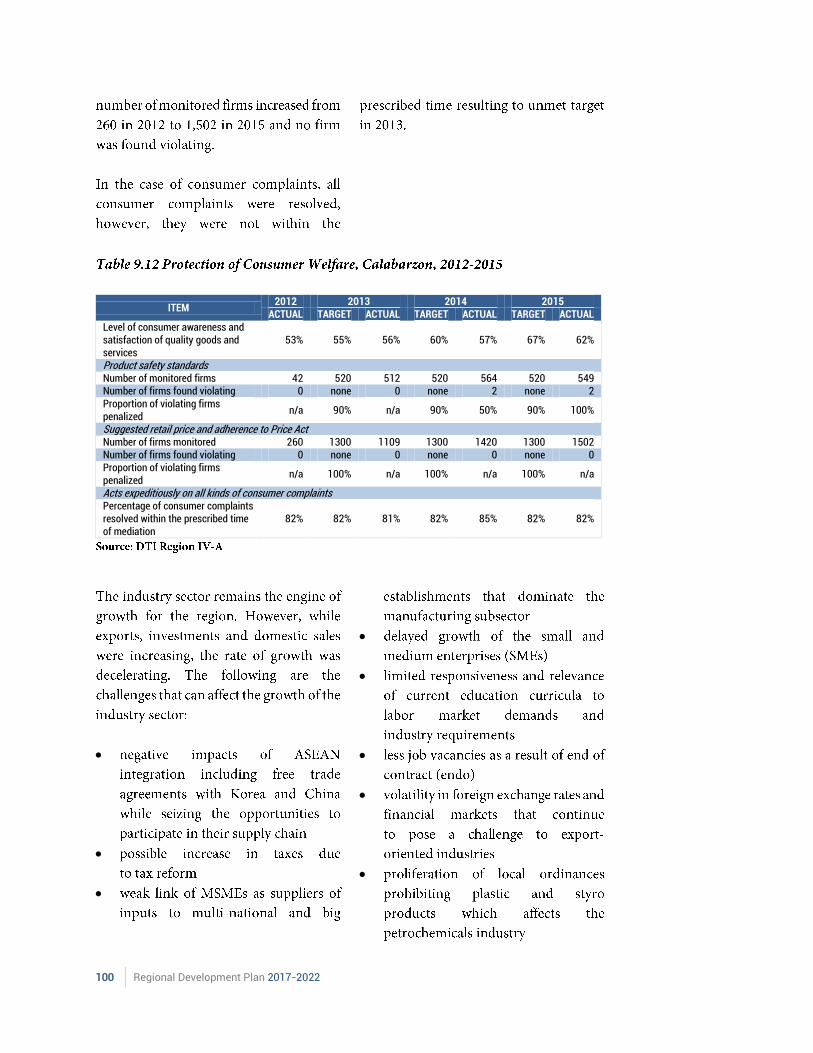
ITEM 2012 2013 2014 2015
ACTUAL TARGET ACTUAL TARGET ACTUAL TARGET ACTUAL Level of consumer awareness and satisfaction of quality goods and services
53% 55% 56% 60% 57% 67% 62%
Product safety standards Number of monitored firms 42 520 512 520 564 520 549 Number of firms found violating 0 none 0 none 2 none 2 Proportion of violating firms penalized
n/a 90% n/a 90% 50% 90% 100%
Suggested retail price and adherence to Price Act Number of firms monitored 260 1300 1109 1300 1420 1300 1502 Number of firms found violating 0 none 0 none 0 none 0 Proportion of violating firms penalized
n/a 100% n/a 100% n/a 100% n/a
Acts expeditiously on all kinds of consumer complaints Percentage of consumer complaints resolved within the prescribed time of mediation
82% 82% 81% 82% 85% 82% 82%
Chapter 9 Expanding Economic Opportunities in Industry and Services | 101
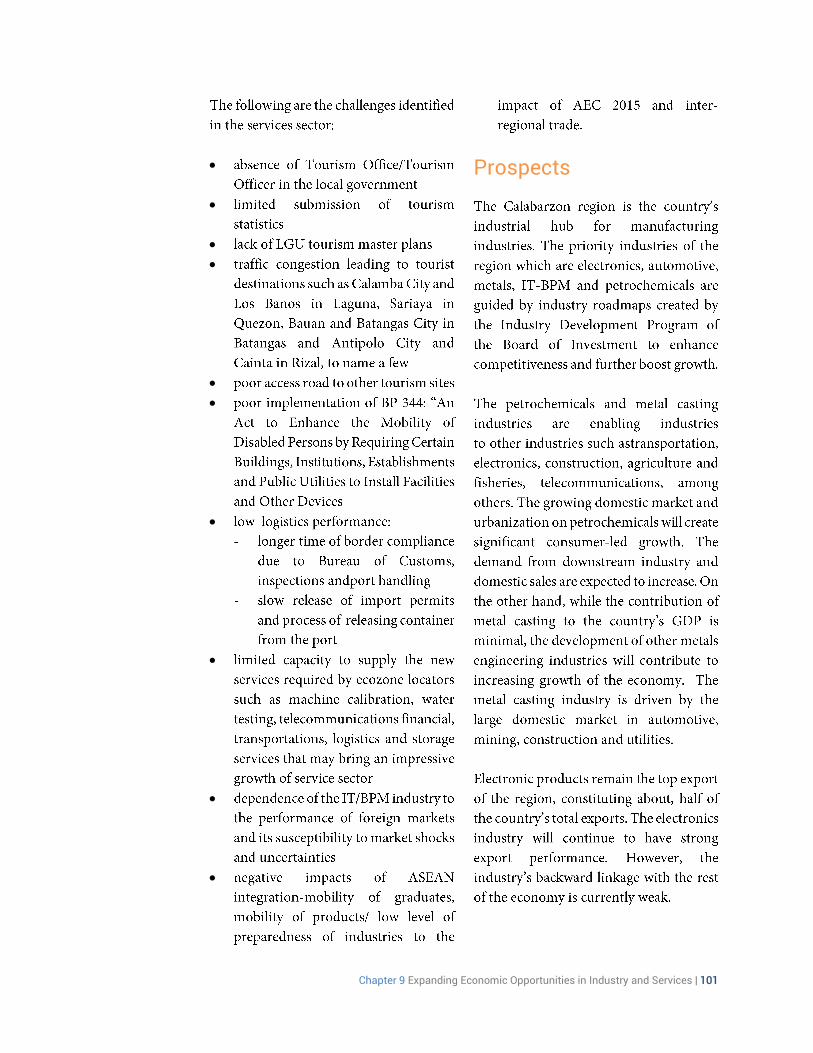
Prospects
102 Regional Development Plan 2017-2022
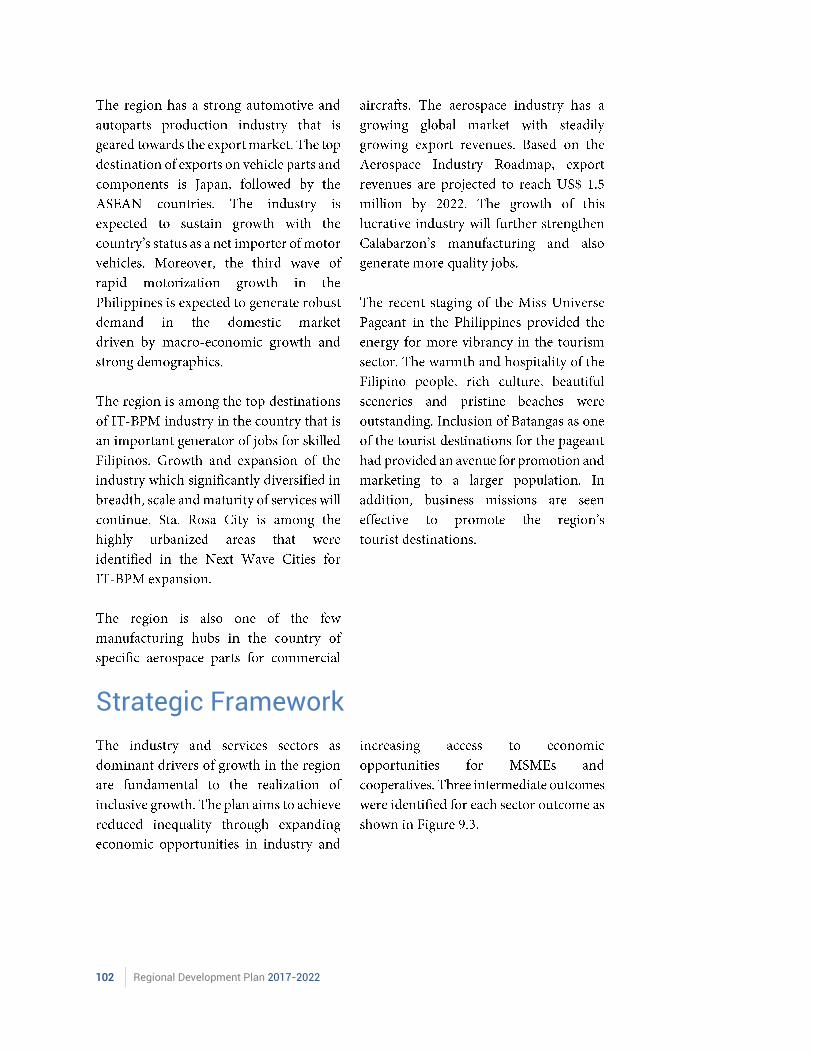
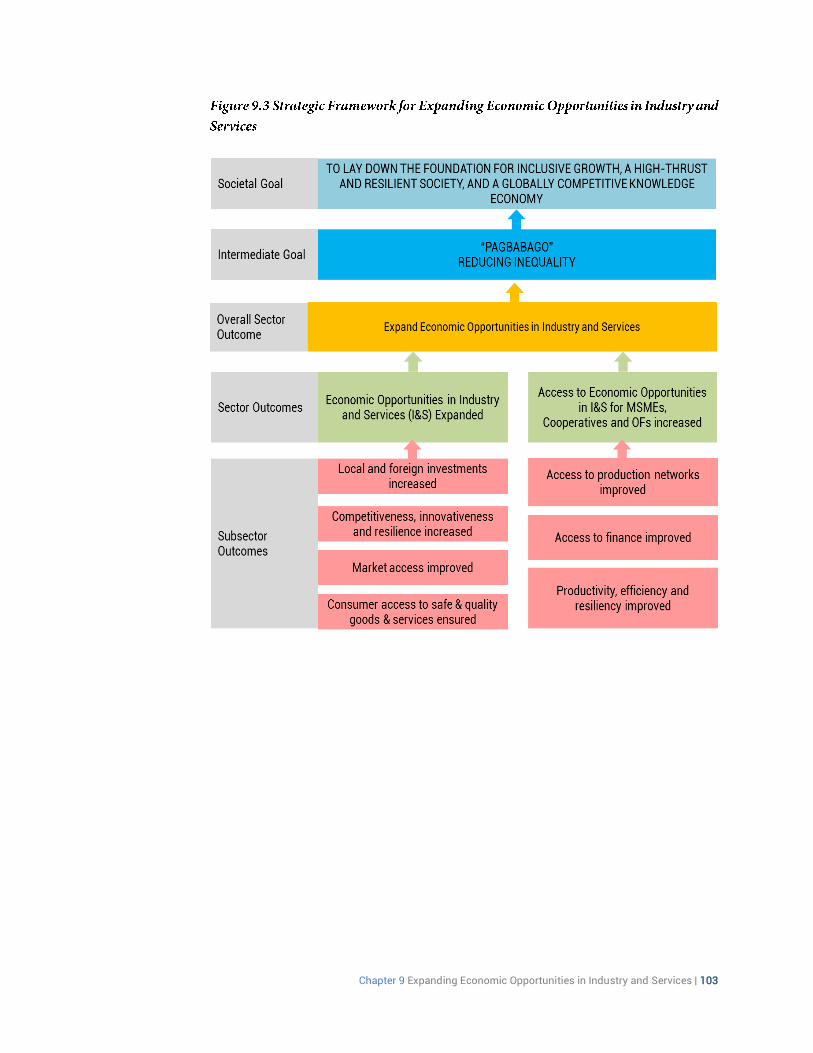
Strategic Framework
Chapter 9 Expanding Economic Opportunities in Industry and Services | 103
104 Regional Development Plan 2017-2022
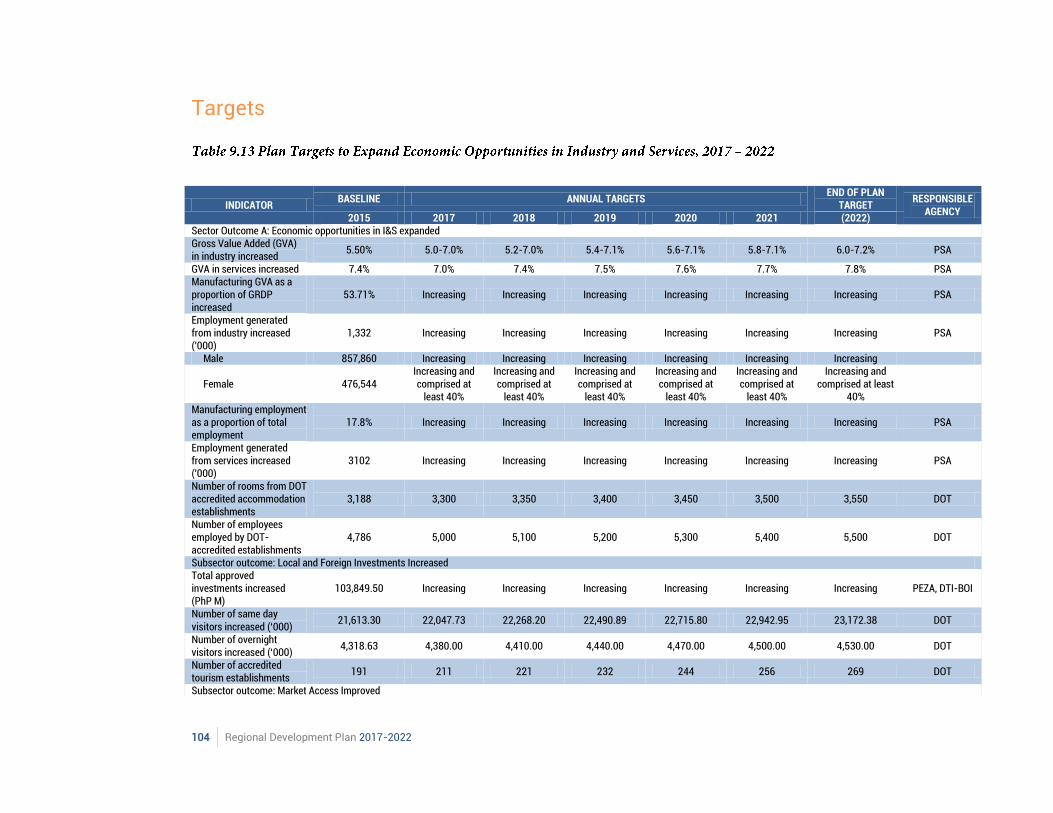
Targets
INDICATOR BASELINE ANNUAL TARGETS
END OF PLAN TARGET
RESPONSIBLE AGENCY
2015 2017 2018 2019 2020 2021 (2022) Sector Outcome A: Economic opportunities in I&S expanded Gross Value Added (GVA) in industry increased
5.50% 5.0-7.0% 5.2-7.0% 5.4-7.1% 5.6-7.1% 5.8-7.1% 6.0-7.2% PSA
GVA in services increased 7.4% 7.0% 7.4% 7.5% 7.6% 7.7% 7.8% PSA Manufacturing GVA as a proportion of GRDP increased
53.71% Increasing Increasing Increasing Increasing Increasing Increasing PSA
Employment generated from industry increased ('000)
1,332 Increasing Increasing Increasing Increasing Increasing Increasing PSA
Male 857,860 Increasing Increasing Increasing Increasing Increasing Increasing
Female 476,544 Increasing and comprised at
least 40%
Increasing and comprised at
least 40%
Increasing and comprised at
least 40%
Increasing and comprised at
least 40%
Increasing and comprised at
least 40%
Increasing and comprised at least
40%
Manufacturing employment as a proportion of total employment
17.8% Increasing Increasing Increasing Increasing Increasing Increasing PSA
Employment generated from services increased ('000)
3102 Increasing Increasing Increasing Increasing Increasing Increasing PSA
Number of rooms from DOT accredited accommodation establishments
3,188 3,300 3,350 3,400 3,450 3,500 3,550 DOT
Number of employees employed by DOT-accredited establishments
4,786 5,000 5,100 5,200 5,300 5,400 5,500 DOT
Subsector outcome: Local and Foreign Investments Increased Total approved investments increased (PhP M)
103,849.50 Increasing Increasing Increasing Increasing Increasing Increasing PEZA, DTI-BOI
Number of same day visitors increased (‘000)
21,613.30 22,047.73 22,268.20 22,490.89 22,715.80 22,942.95 23,172.38 DOT
Number of overnight visitors increased (‘000)
4,318.63 4,380.00 4,410.00 4,440.00 4,470.00 4,500.00 4,530.00 DOT
Number of accredited tourism establishments
191 211 221 232 244 256 269 DOT
Subsector outcome: Market Access Improved

Chapter 9 Expanding Economic Opportunities in Industry and Services | 105
INDICATOR BASELINE
2015 ANNUAL TARGETS END OF PLAN
(2022) RESPONSIBLE
AGENCY 2017 2018 2019 2020 2021 Merchandise exports increased (US$ M)
- Increasing
Increasing Increasing Increasing Increasing To be determined
DTI-EMB
Services exports increased 22,890.77 Increasing Increasing Increasing Increasing Increasing To be determined PEZA Subsector Outcome: Consumer access to safe and quality goods and services ensured Increased level of consumer awareness and satisfaction of quality goods and services
62% Increasing Increasing Increasing Increasing Increasing To be determined DTI
Percentage of consumer complaints resolved within the prescribed time - mediation (10 days) and arbitration (20 days)
82% Increasing Increasing Increasing Increasing Increasing To be determined
Sector Outcome: Access to Economic Opportunities in I&S for MSMEs, Cooperatives and OFs Increased Proportion of small-scale industries to total industries
- Increasing Increasing Increasing Increasing Increasing To be determined DTI
Subsector outcome: Access to Production Networks Improved Number of MSMEs participating in global value chains
- Increasing Increasing Increasing Increasing Increasing To be determined DTI
Subsector outcome: Access to Finance Improved Proportion of small-scale industries (enterprises) with a loan or line of credit increased
- Increasing Increasing Increasing Increasing Increasing To be determined -
Total number of credit cooperatives
37 28 27 26 26 25 24 CDA
Subsector outcome: Productivity, Efficiency and Resilience Improved Number of barangay micro business enterprises registered increased
- Increasing Increasing Increasing Increasing Increasing To be determined DTI, DOLE
106 Regional Development Plan 2017-2022
Strategies and Interventions
Sector Outcome: Expanded Economic Opportunities in Industry and Services
Chapter 9 Expanding Economic Opportunities in Industry and Services | 107
108 Regional Development Plan 2017-2022
Sector Outcome: Increased Access to Economic Opportunities for MSMEs and Cooperatives in I&S
Chapter 9 Expanding Economic Opportunities in Industry and Services | 109

110 Regional Development Plan 2017-2022
Chapter 10 Accelerating Human Capital Development | 111

112 Regional Development Plan 2017-2022
Chapter 10 Accelerating Human Capital Development | 113
Chapter 10
Accelerating Human Capital Development
This chapter focuses on providing more options for the development of human capital potentials and reducing the inequalities in human development through increase in human capital investment and increased returns in terms of productivity, income and employability. This chapter will specifically contribute to the desired intermediate goal of reducing inequality, or “Pagbabago”.
Assessment and Challenges
Nutrition and Health
114 Regional Development Plan 2017-2022
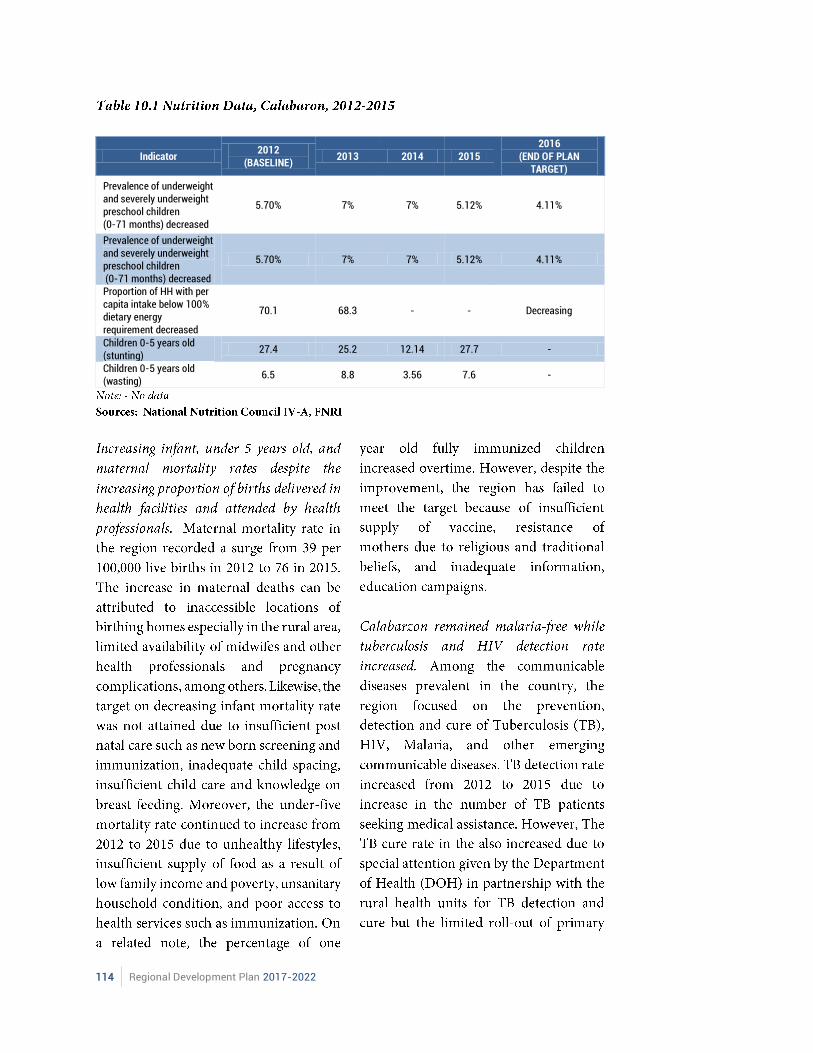
Indicator 2012
(BASELINE) 2013 2014 2015
2016 (END OF PLAN
TARGET)
Prevalence of underweight and severely underweight preschool children (0-71 months) decreased
5.70% 7% 7% 5.12% 4.11%
Prevalence of underweight and severely underweight preschool children (0-71 months) decreased
5.70% 7% 7% 5.12% 4.11%
Proportion of HH with per capita intake below 100% dietary energy requirement decreased
70.1 68.3 - - Decreasing
Children 0-5 years old (stunting)
27.4 25.2 12.14 27.7 -
Children 0-5 years old (wasting)
6.5 8.8 3.56 7.6 -
Chapter 10 Accelerating Human Capital Development | 115
116 Regional Development Plan 2017-2022
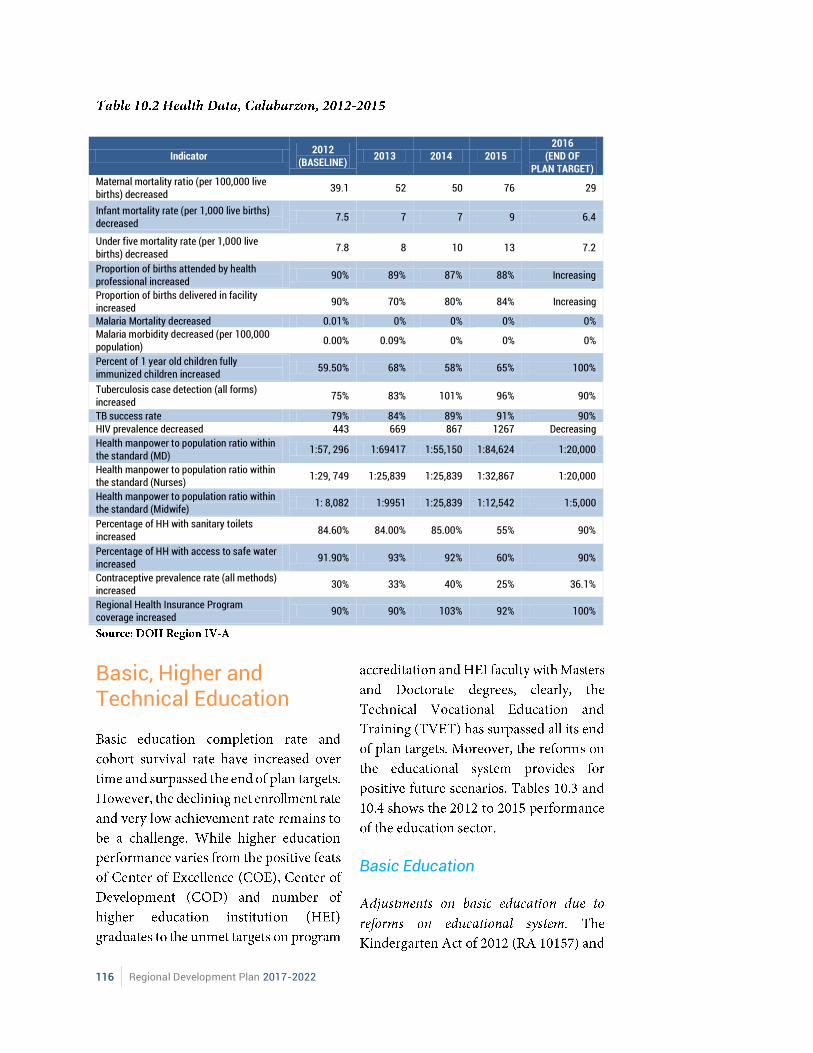
Indicator 2012
(BASELINE) 2013 2014 2015
2016 (END OF
PLAN TARGET) Maternal mortality ratio (per 100,000 live births) decreased
39.1 52 50 76 29
Infant mortality rate (per 1,000 live births) decreased
7.5 7 7 9 6.4
Under five mortality rate (per 1,000 live births) decreased
7.8 8 10 13 7.2
Proportion of births attended by health professional increased
90% 89% 87% 88% Increasing
Proportion of births delivered in facility increased
90% 70% 80% 84% Increasing
Malaria Mortality decreased 0.01% 0% 0% 0% 0% Malaria morbidity decreased (per 100,000 population)
0.00% 0.09% 0% 0% 0%
Percent of 1 year old children fully immunized children increased
59.50% 68% 58% 65% 100%
Tuberculosis case detection (all forms) increased
75% 83% 101% 96% 90%
TB success rate 79% 84% 89% 91% 90% HIV prevalence decreased 443 669 867 1267 Decreasing
Health manpower to population ratio within the standard (MD)
1:57, 296 1:69417 1:55,150 1:84,624 1:20,000
Health manpower to population ratio within the standard (Nurses)
1:29, 749 1:25,839 1:25,839 1:32,867 1:20,000
Health manpower to population ratio within the standard (Midwife)
1: 8,082 1:9951 1:25,839 1:12,542 1:5,000
Percentage of HH with sanitary toilets increased
84.60% 84.00% 85.00% 55% 90%
Percentage of HH with access to safe water increased
91.90% 93% 92% 60% 90%
Contraceptive prevalence rate (all methods) increased
30% 33% 40% 25% 36.1%
Regional Health Insurance Program coverage increased
90% 90% 103% 92% 100%
Basic, Higher and Technical Education
Basic Education
Chapter 10 Accelerating Human Capital Development | 117
118 Regional Development Plan 2017-2022
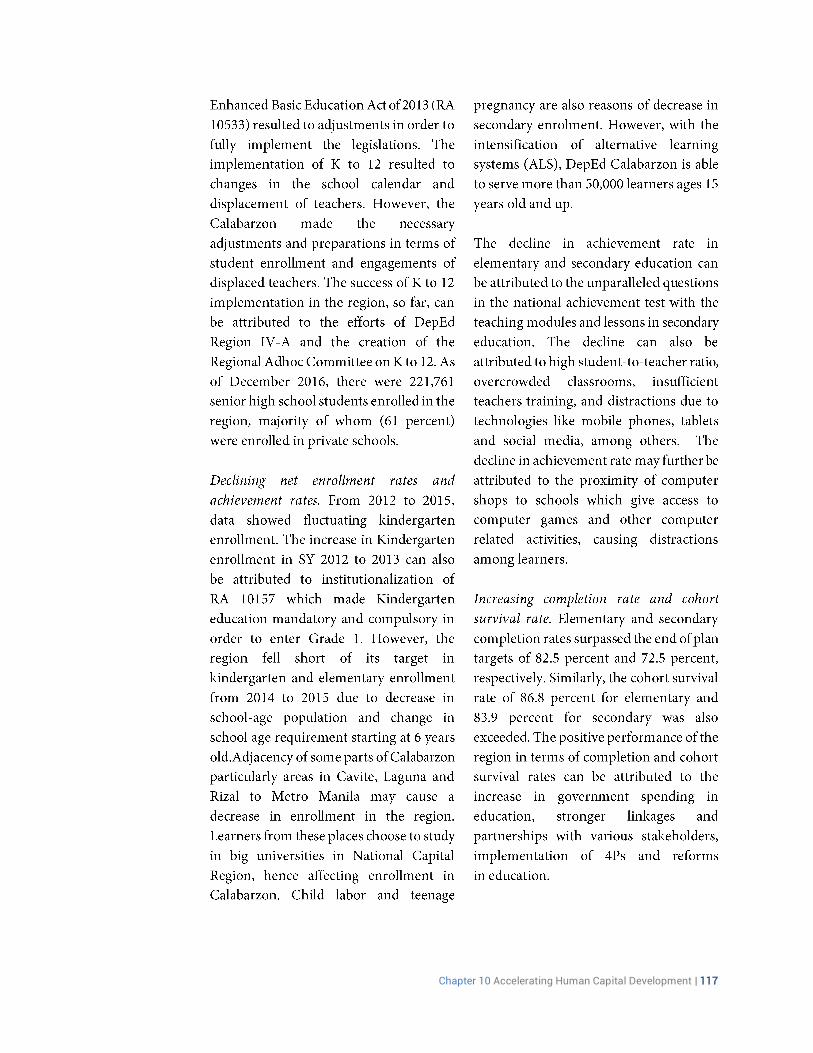
Indicator 2012
(BASELINE) 2013 2014 2015
2016 (END OF
PLAN TARGET)
Net enrolment rate in kindergarten increased 65.25 91.30 88.30 79.90 Increasing
Net enrolment rate in elementary increased 88.50 92.37 91.91 72.88 100
Net enrolment rate in secondary increased 68.21 70.13 68.33 55.20 93.3
Completion rate in elementary increased 84.81 82.25 95.71 94.78 82.5
Completion rate in secondary increased 82.57 80.20 86.00 84.79 75.5
Cohort survival rate in elementary increased 86.45 84.79 96.63 91.82 86.8
Cohort survival rate in secondary increased 85.37 82.67 89.31 86.93 83.9
Achievement rate in elementary increased 65.96 59.82 57.89 - 75.0
Achievement rate in secondary increased 49.01 49.08 44.45 - 75
Higher Education and Technical Vocational Education and Training
Chapter 10 Accelerating Human Capital Development | 119
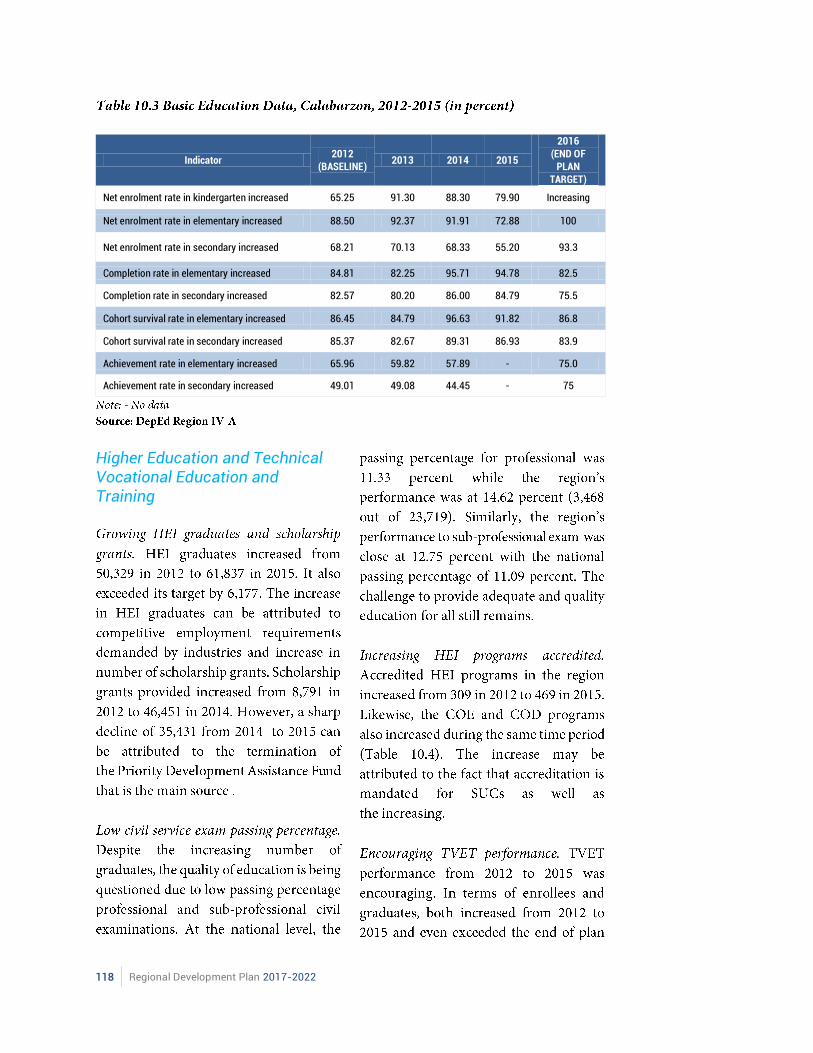
Indicator 2012
(BASELINE) 2013 2014 2015
2016 (END OF
PLAN TARGET)
Accredited HEI Programs 301 407 407 469 536
Center of Excellence (COE) Programs 11 11 11 14 11
Center of Development (COD) Programs 10 10 10 12 10
Higher education faculty with MA 5,774 6,554 6,554 2,211 7,586
Higher education faculty with PhD 1,375 1,713 1,713 1,958 1,983
Students with STUFAP 8,791 5,024 46,451 11,020 Increasing
Higher education graduates increased 50,329 52,660 60,660 61,873 55,660
Higher education institutions with accredited program increased
11 19 19 7 Increasing
TVET enrollees increased 200,398 248,086 288,629 324,132 286,035
TVET graduates increased 205,183 245,992 276,940 306,874 257,431
Persons Assessed 98,752 114,669 132,408 169,242 123,778
Persons Certified 80,682 99,903 118,075 150,247 105,211
Certification rate in TVET increased 82.00% 87.10% 93.20% 88.80% 85.0%
Labor Policies
120 Regional Development Plan 2017-2022
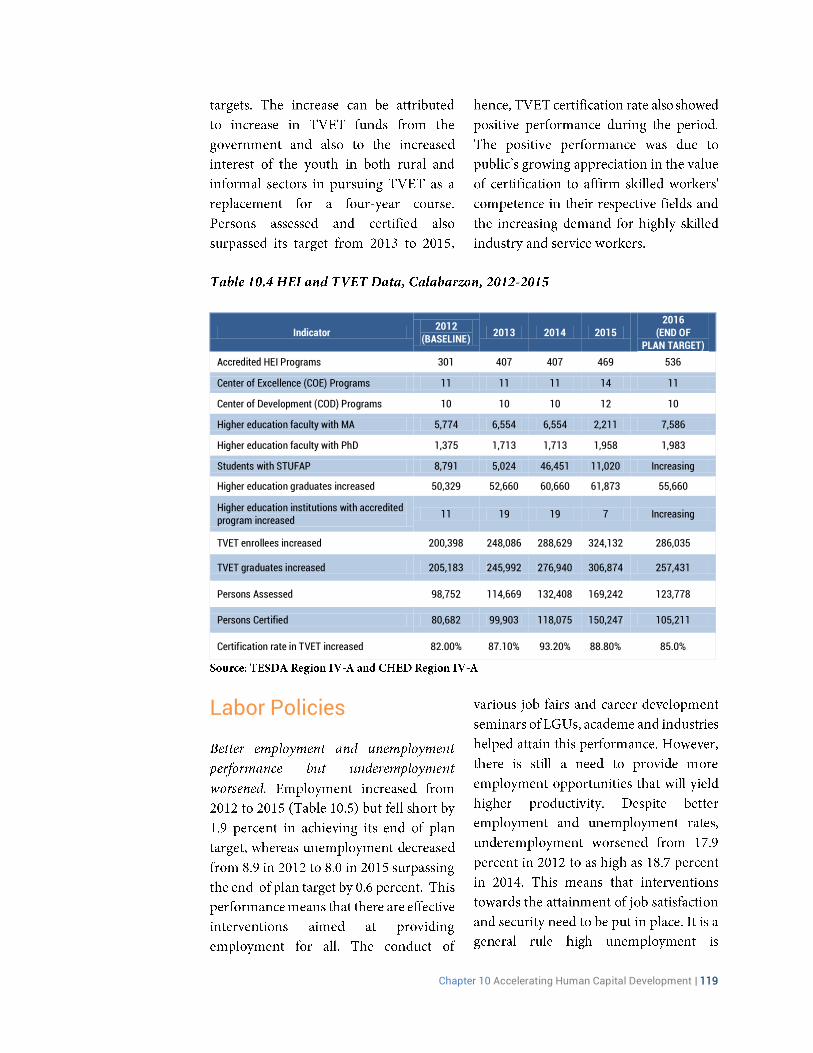
Indicator 2012
(BASELINE) 2013 2014 2015
2016 (END OF PLAN TARGET)
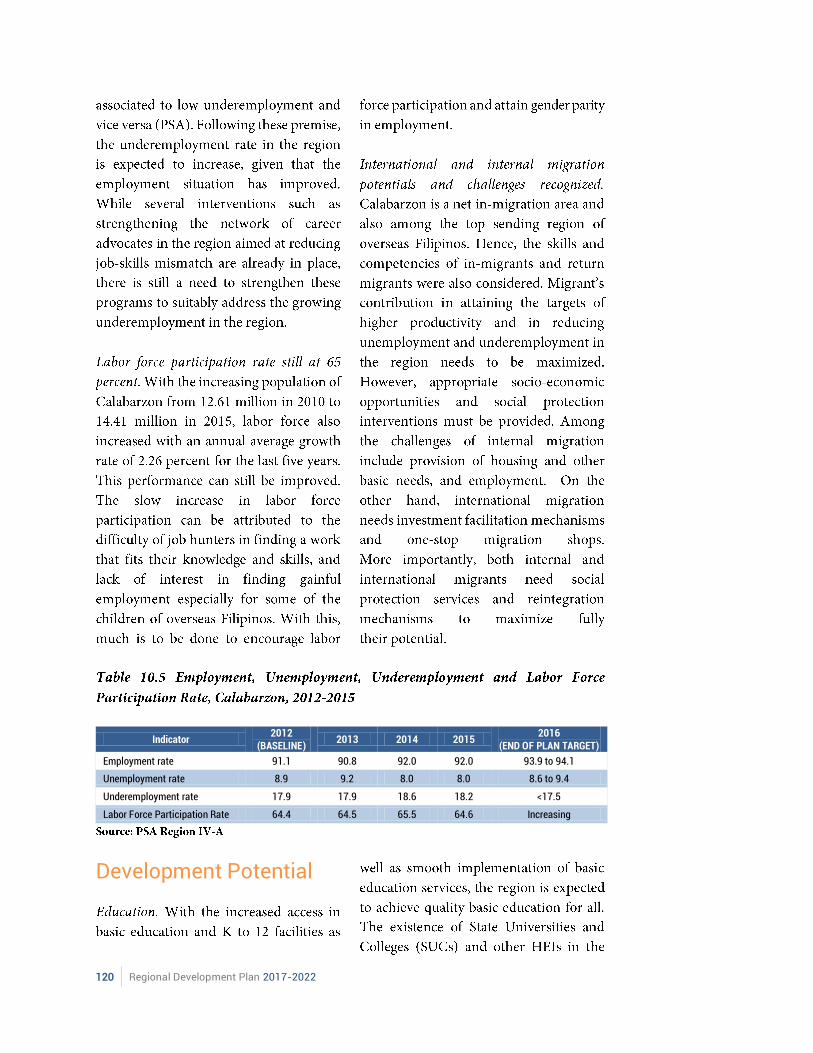
Employment rate 91.1 90.8 92.0 92.0 93.9 to 94.1
Unemployment rate 8.9 9.2 8.0 8.0 8.6 to 9.4
Underemployment rate 17.9 17.9 18.6 18.2 <17.5
Labor Force Participation Rate 64.4 64.5 65.5 64.6 Increasing
Development Potential
Chapter 10 Accelerating Human Capital Development | 121
Strategic Framework
.
122 Regional Development Plan 2017-2022
Targets
INDICATORS
BASELINE 2015
END OF PLAN TARGET 2022
RESPONSIBLE AGENCY
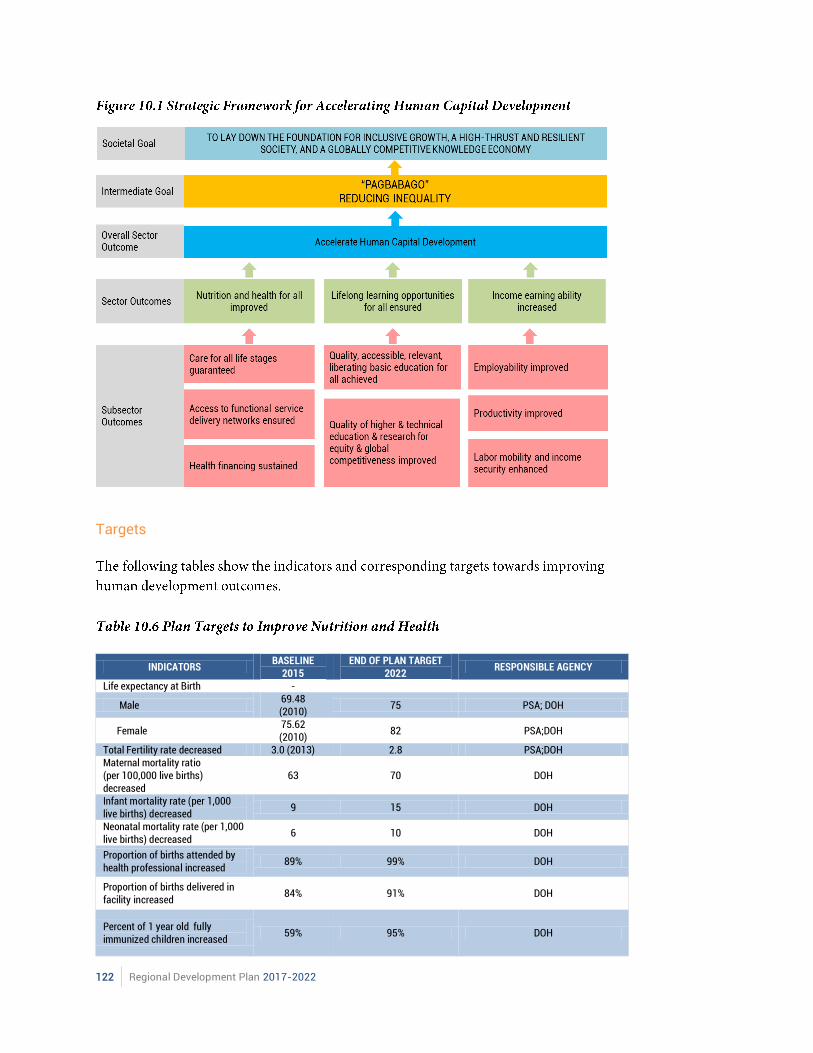
Life expectancy at Birth -
Male 69.48 (2010)
75 PSA; DOH
Female 75.62 (2010)
82 PSA;DOH
Total Fertility rate decreased 3.0 (2013) 2.8 PSA;DOH Maternal mortality ratio (per 100,000 live births) decreased
63 70 DOH
Infant mortality rate (per 1,000 live births) decreased
9 15 DOH
Neonatal mortality rate (per 1,000 live births) decreased
6 10 DOH
Proportion of births attended by health professional increased
89% 99% DOH
Proportion of births delivered in facility increased
84% 91% DOH
Percent of 1 year old fully immunized children increased
59% 95% DOH
Chapter 10 Accelerating Human Capital Development | 123
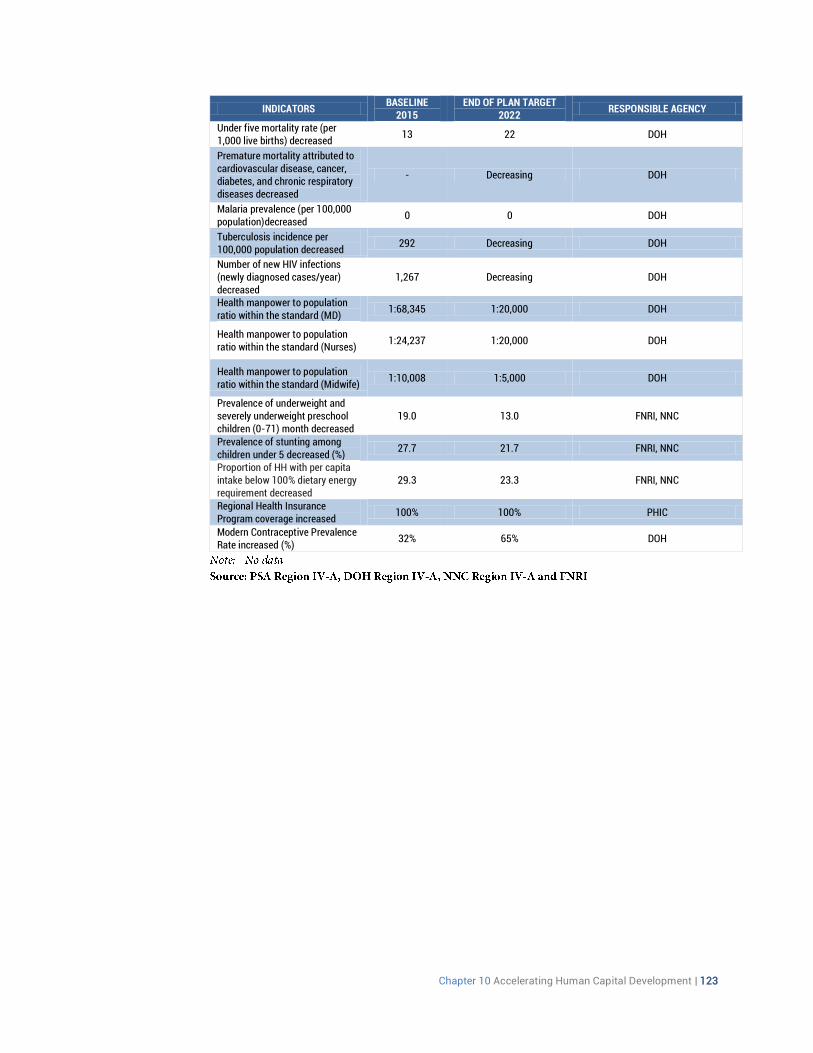
INDICATORS
BASELINE 2015
END OF PLAN TARGET 2022
RESPONSIBLE AGENCY
Under five mortality rate (per 1,000 live births) decreased
13 22 DOH
Premature mortality attributed to cardiovascular disease, cancer, diabetes, and chronic respiratory diseases decreased
- Decreasing DOH
Malaria prevalence (per 100,000 population)decreased
0 0 DOH
Tuberculosis incidence per 100,000 population decreased
292 Decreasing DOH
Number of new HIV infections (newly diagnosed cases/year) decreased
1,267 Decreasing DOH
Health manpower to population ratio within the standard (MD)
1:68,345 1:20,000 DOH
Health manpower to population ratio within the standard (Nurses)
1:24,237 1:20,000 DOH
Health manpower to population ratio within the standard (Midwife)
1:10,008 1:5,000 DOH
Prevalence of underweight and severely underweight preschool children (0-71) month decreased
19.0 13.0 FNRI, NNC
Prevalence of stunting among children under 5 decreased (%)
27.7 21.7 FNRI, NNC
Proportion of HH with per capita intake below 100% dietary energy requirement decreased
29.3 23.3 FNRI, NNC
Regional Health Insurance Program coverage increased
100% 100% PHIC
Modern Contraceptive Prevalence Rate increased (%)
32% 65% DOH
124 Regional Development Plan 2017-2022
INDICATORS
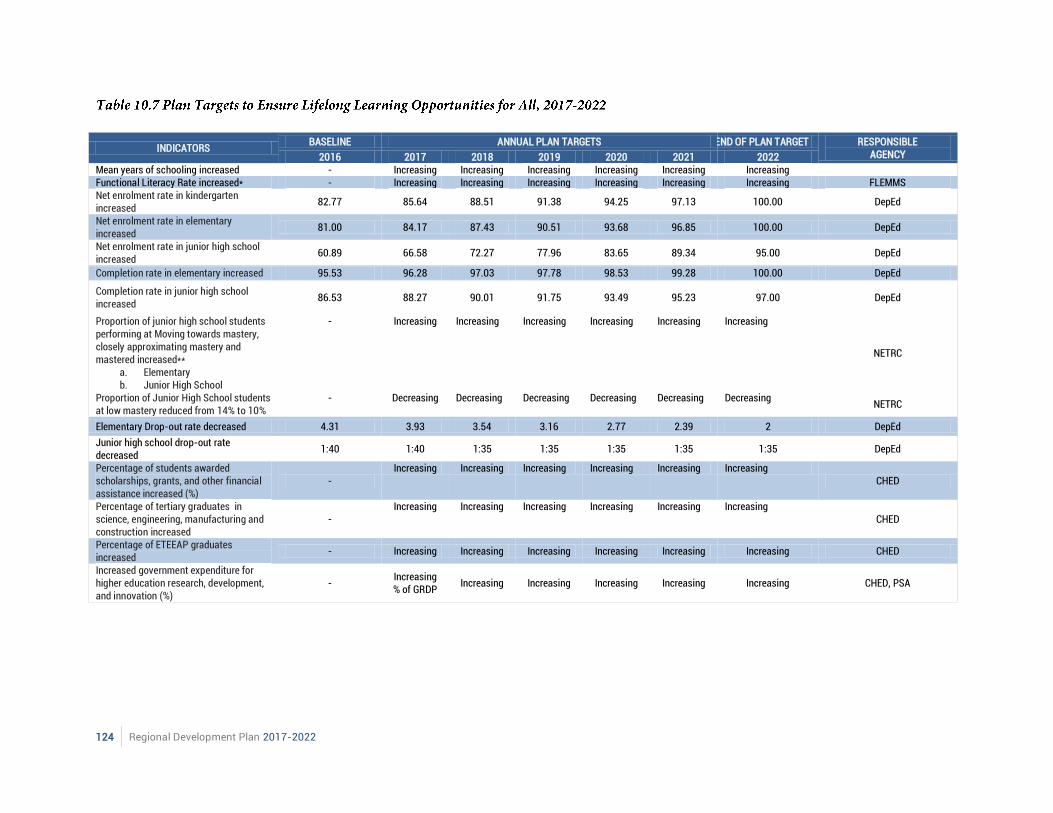
BASELINE ANNUAL PLAN TARGETS END OF PLAN TARGET RESPONSIBLE AGENCY 2016 2017 2018 2019 2020 2021 2022
Mean years of schooling increased - Increasing Increasing Increasing Increasing Increasing Increasing Functional Literacy Rate increased* - Increasing Increasing Increasing Increasing Increasing Increasing FLEMMS Net enrolment rate in kindergarten increased
82.77 85.64 88.51 91.38 94.25 97.13 100.00 DepEd
Net enrolment rate in elementary increased
81.00 84.17 87.43 90.51 93.68 96.85 100.00 DepEd
Net enrolment rate in junior high school increased
60.89 66.58 72.27 77.96 83.65 89.34 95.00 DepEd
Completion rate in elementary increased 95.53 96.28 97.03 97.78 98.53 99.28 100.00 DepEd
Completion rate in junior high school increased
86.53 88.27 90.01 91.75 93.49 95.23 97.00 DepEd
Proportion of junior high school students performing at Moving towards mastery, closely approximating mastery and mastered increased**
a. Elementary b. Junior High School
- Increasing Increasing Increasing Increasing Increasing Increasing
NETRC
Proportion of Junior High School students at low mastery reduced from 14% to 10%
- Decreasing Decreasing Decreasing Decreasing Decreasing Decreasing NETRC
Elementary Drop-out rate decreased 4.31 3.93 3.54 3.16 2.77 2.39 2 DepEd
Junior high school drop-out rate decreased
1:40 1:40 1:35 1:35 1:35 1:35 1:35 DepEd
Percentage of students awarded scholarships, grants, and other financial assistance increased (%)
- Increasing Increasing Increasing Increasing Increasing Increasing
CHED
Percentage of tertiary graduates in science, engineering, manufacturing and construction increased
- Increasing Increasing Increasing Increasing Increasing Increasing
CHED
Percentage of ETEEAP graduates increased
- Increasing Increasing Increasing Increasing Increasing Increasing CHED
Increased government expenditure for higher education research, development, and innovation (%)
- Increasing % of GRDP
Increasing Increasing Increasing Increasing Increasing CHED, PSA
Chapter 10 Accelerating Human Capital Development | 125
INDICATORS
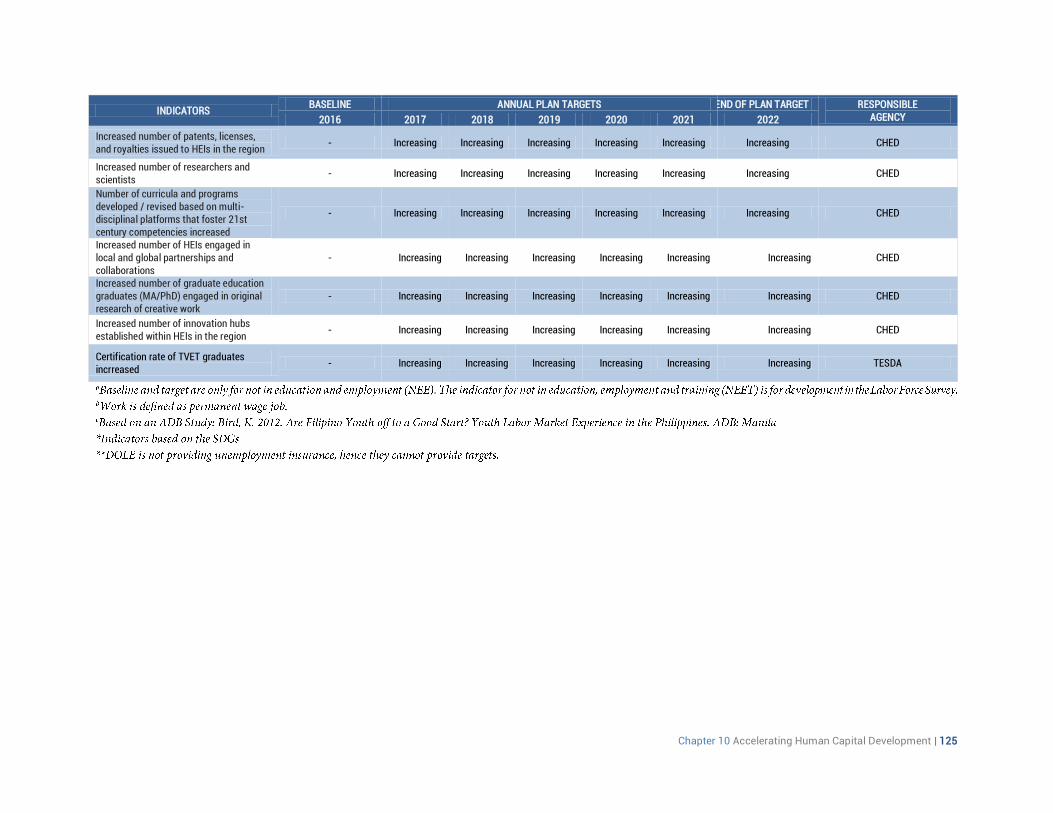
BASELINE ANNUAL PLAN TARGETS END OF PLAN TARGET RESPONSIBLE AGENCY 2016 2017 2018 2019 2020 2021 2022
Increased number of patents, licenses, and royalties issued to HEIs in the region
- Increasing Increasing Increasing Increasing Increasing Increasing CHED
Increased number of researchers and scientists
- Increasing Increasing Increasing Increasing Increasing Increasing CHED
Number of curricula and programs developed / revised based on multi-disciplinal platforms that foster 21st century competencies increased
- Increasing Increasing Increasing Increasing Increasing Increasing CHED
Increased number of HEIs engaged in local and global partnerships and collaborations
- Increasing Increasing Increasing Increasing Increasing Increasing CHED
Increased number of graduate education graduates (MA/PhD) engaged in original research of creative work
- Increasing Increasing Increasing Increasing Increasing Increasing CHED
Increased number of innovation hubs established within HEIs in the region
- Increasing Increasing Increasing Increasing Increasing Increasing CHED
Certification rate of TVET graduates incrreased
- Increasing Increasing Increasing Increasing Increasing Increasing TESDA
126 Regional Development Plan 2017-2022
INDICATORS
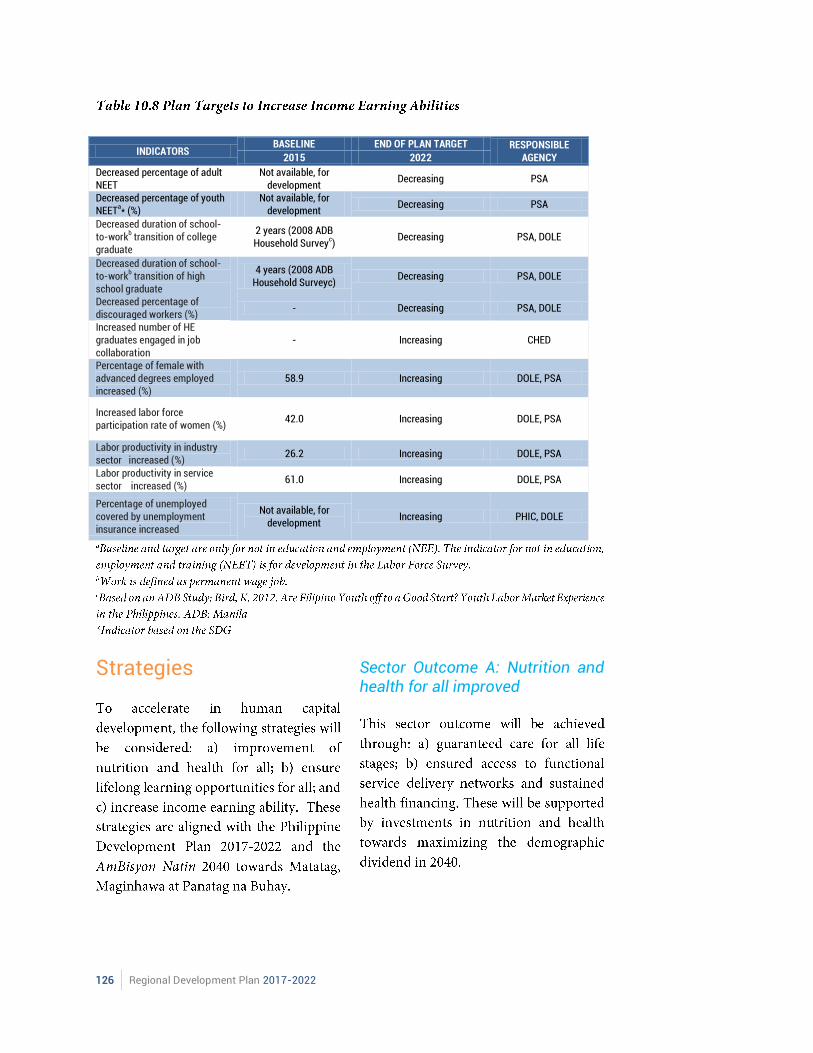
BASELINE END OF PLAN TARGET RESPONSIBLE AGENCY 2015 2022
Decreased percentage of adult NEET
Not available, for development
Decreasing PSA
Decreased percentage of youth NEET
a* (%)
Not available, for development
Decreasing PSA
Decreased duration of school-to-work
b transition of college
graduate
2 years (2008 ADB Household Survey
c)
Decreasing PSA, DOLE
Decreased duration of school-to-work
b transition of high
school graduate
4 years (2008 ADB Household Surveyc)
Decreasing PSA, DOLE
Decreased percentage of discouraged workers (%)
- Decreasing PSA, DOLE
Increased number of HE graduates engaged in job collaboration
- Increasing CHED
Percentage of female with advanced degrees employed increased (%)
58.9 Increasing DOLE, PSA
Increased labor force participation rate of women (%)
42.0 Increasing DOLE, PSA
Labor productivity in industry sector increased (%)
26.2 Increasing DOLE, PSA
Labor productivity in service sector increased (%)
61.0 Increasing DOLE, PSA
Percentage of unemployed covered by unemployment insurance increased
Not available, for development
Increasing PHIC, DOLE
Strategies
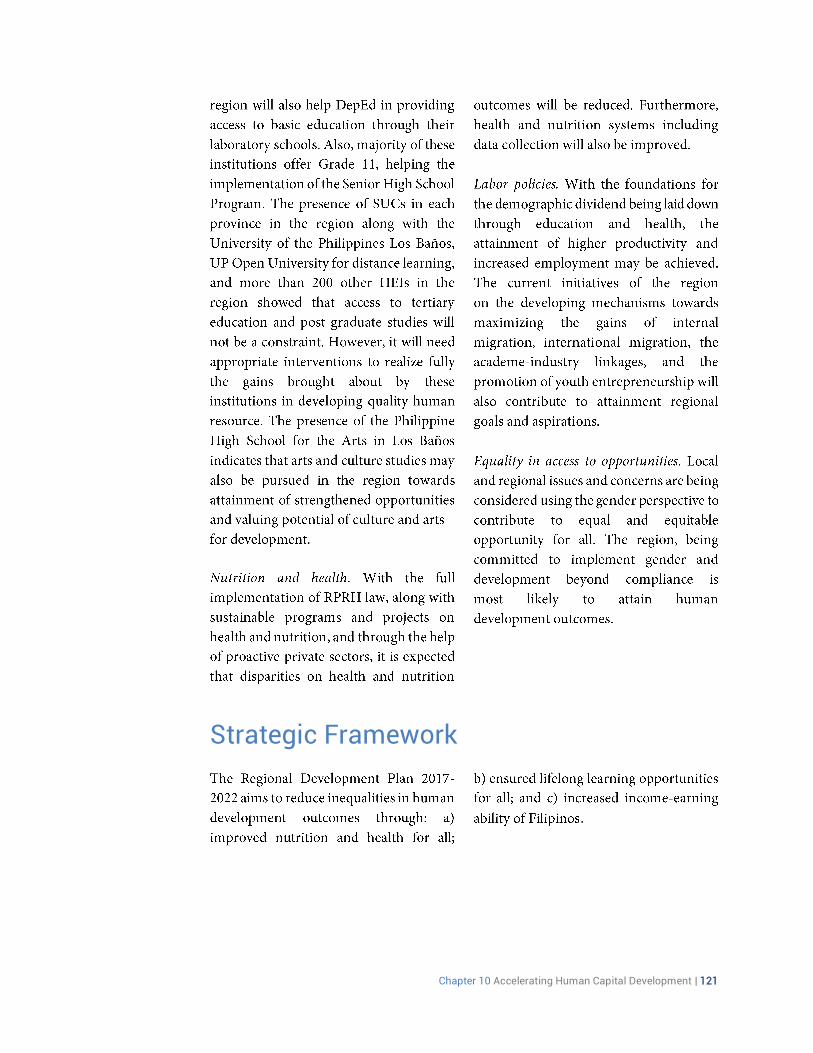
Sector Outcome A: Nutrition and health for all improved
Chapter 10 Accelerating Human Capital Development | 127
128 Regional Development Plan 2017-2022
Sector Outcome B: Lifelong learning opportunities for all ensured
Chapter 10 Accelerating Human Capital Development | 129
130 Regional Development Plan 2017-2022
Chapter 10 Accelerating Human Capital Development | 131
Sector Outcome C: Income-earning ability increased
132 Regional Development Plan 2017-2022
Major Programs and Projects
Chapter 10 Accelerating Human Capital Development | 133
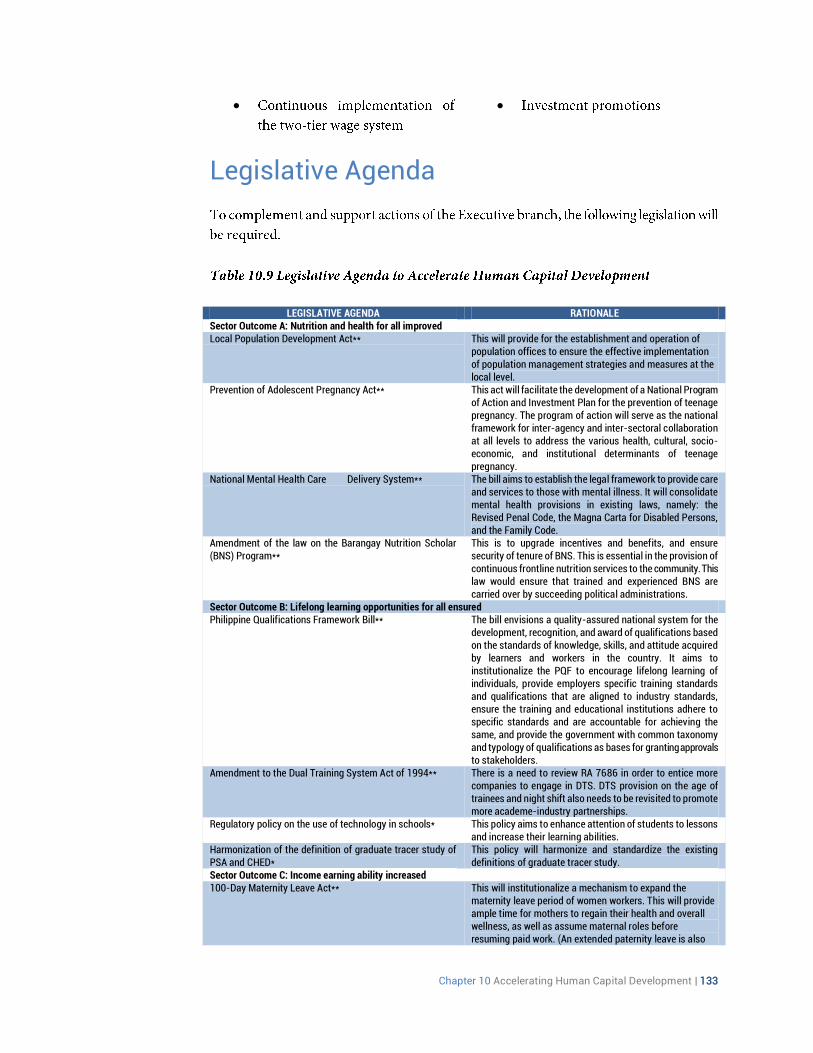
Legislative Agenda
LEGISLATIVE AGENDA RATIONALE Sector Outcome A: Nutrition and health for all improved Local Population Development Act** This will provide for the establishment and operation of
population offices to ensure the effective implementation of population management strategies and measures at the local level.
Prevention of Adolescent Pregnancy Act** This act will facilitate the development of a National Program of Action and Investment Plan for the prevention of teenage pregnancy. The program of action will serve as the national framework for inter-agency and inter-sectoral collaboration at all levels to address the various health, cultural, socio-economic, and institutional determinants of teenage pregnancy.
National Mental Health Care Delivery System** The bill aims to establish the legal framework to provide care and services to those with mental illness. It will consolidate mental health provisions in existing laws, namely: the Revised Penal Code, the Magna Carta for Disabled Persons, and the Family Code.
Amendment of the law on the Barangay Nutrition Scholar (BNS) Program**
This is to upgrade incentives and benefits, and ensure security of tenure of BNS. This is essential in the provision of continuous frontline nutrition services to the community. This law would ensure that trained and experienced BNS are carried over by succeeding political administrations.
Sector Outcome B: Lifelong learning opportunities for all ensured Philippine Qualifications Framework Bill** The bill envisions a quality-assured national system for the
development, recognition, and award of qualifications based on the standards of knowledge, skills, and attitude acquired by learners and workers in the country. It aims to institutionalize the PQF to encourage lifelong learning of individuals, provide employers specific training standards and qualifications that are aligned to industry standards, ensure the training and educational institutions adhere to specific standards and are accountable for achieving the same, and provide the government with common taxonomy and typology of qualifications as bases for granting approvals to stakeholders.
Amendment to the Dual Training System Act of 1994** There is a need to review RA 7686 in order to entice more companies to engage in DTS. DTS provision on the age of trainees and night shift also needs to be revisited to promote more academe-industry partnerships.
Regulatory policy on the use of technology in schools* This policy aims to enhance attention of students to lessons and increase their learning abilities.
Harmonization of the definition of graduate tracer study of PSA and CHED*
This policy will harmonize and standardize the existing definitions of graduate tracer study.
Sector Outcome C: Income earning ability increased 100-Day Maternity Leave Act** This will institutionalize a mechanism to expand the
maternity leave period of women workers. This will provide ample time for mothers to regain their health and overall wellness, as well as assume maternal roles before resuming paid work. (An extended paternity leave is also
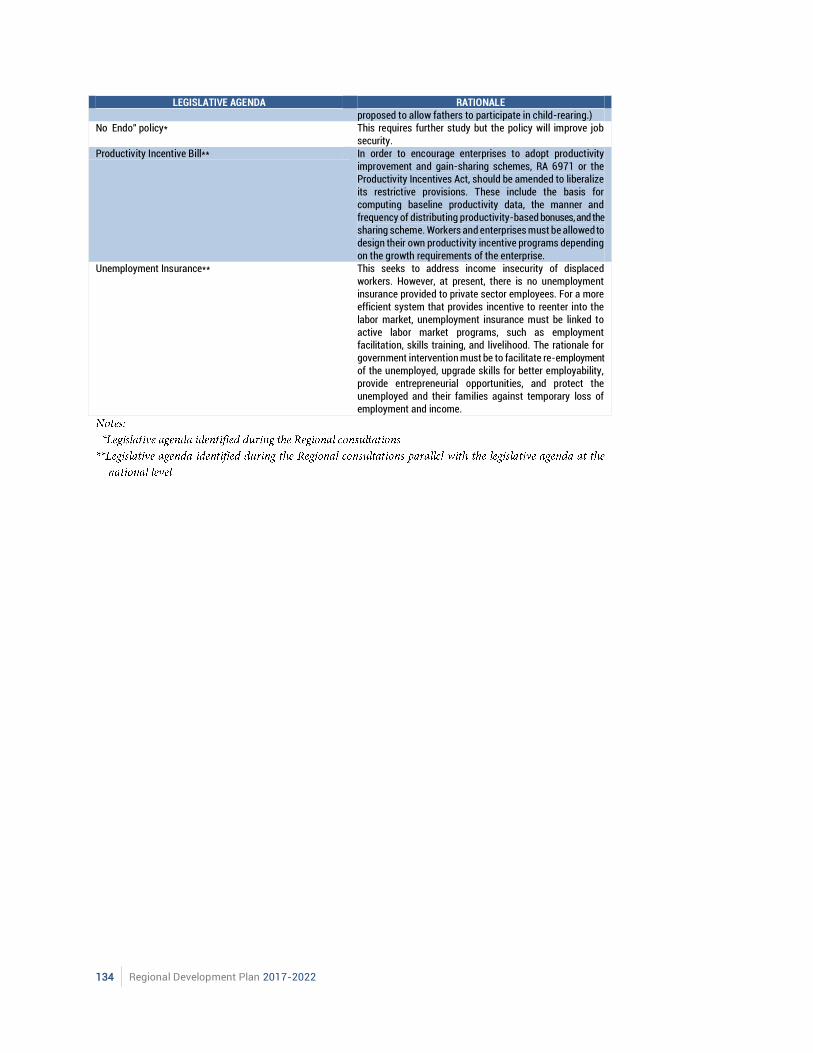
134 Regional Development Plan 2017-2022
LEGISLATIVE AGENDA RATIONALE proposed to allow fathers to participate in child-rearing.)
No Endo" policy* This requires further study but the policy will improve job security.
Productivity Incentive Bill** In order to encourage enterprises to adopt productivity improvement and gain-sharing schemes, RA 6971 or the Productivity Incentives Act, should be amended to liberalize its restrictive provisions. These include the basis for computing baseline productivity data, the manner and frequency of distributing productivity-based bonuses, and the sharing scheme. Workers and enterprises must be allowed to design their own productivity incentive programs depending on the growth requirements of the enterprise.
Unemployment Insurance** This seeks to address income insecurity of displaced workers. However, at present, there is no unemployment insurance provided to private sector employees. For a more efficient system that provides incentive to reenter into the labor market, unemployment insurance must be linked to active labor market programs, such as employment facilitation, skills training, and livelihood. The rationale for government intervention must be to facilitate re-employment of the unemployed, upgrade skills for better employability, provide entrepreneurial opportunities, and protect the unemployed and their families against temporary loss of employment and income.
Chapter 11 Reducing Vulnerability of Individuals and Families | 135

136 Regional Development Plan 2017-2022
Chapter 11 Reducing Vulnerability of Individuals and Families | 137
Chapter 11
Reducing Vulnerability of Individuals and Families
Vulnerability, as defined by International Federation of Red Cross and Red
Crescent Societies is the “diminished capacity of an individual or group to
anticipate, cope with, resist and recover from the impact of a natural or man-
made hazard”. The level of vulnerability would vary depending on an individual’s
social group, gender, age, among others. In the Philippines, the most vulnerable
groups are the children, women, persons with disability, Indigenous Peoples,
older persons, overseas Filipinos and their families, and workers in the informal
and contractual workers in the formal sector.
This chapter discusses the situation of the most vulnerable groups in the region
and the government’s performance in reducing the risk of these groups. It also
includes strategies to attain a universal and transformative social protection
program for all. This chapter also covers the updates on the asset reform in
the region.
Assessment and Challenges
138 Regional Development Plan 2017-2022
Inherent Vulnerabilities
Economic Risks
Chapter 11 Reducing Vulnerability of Individuals and Families | 139
Governance and Political Risks
Natural Hazards
140 Regional Development Plan 2017-2022
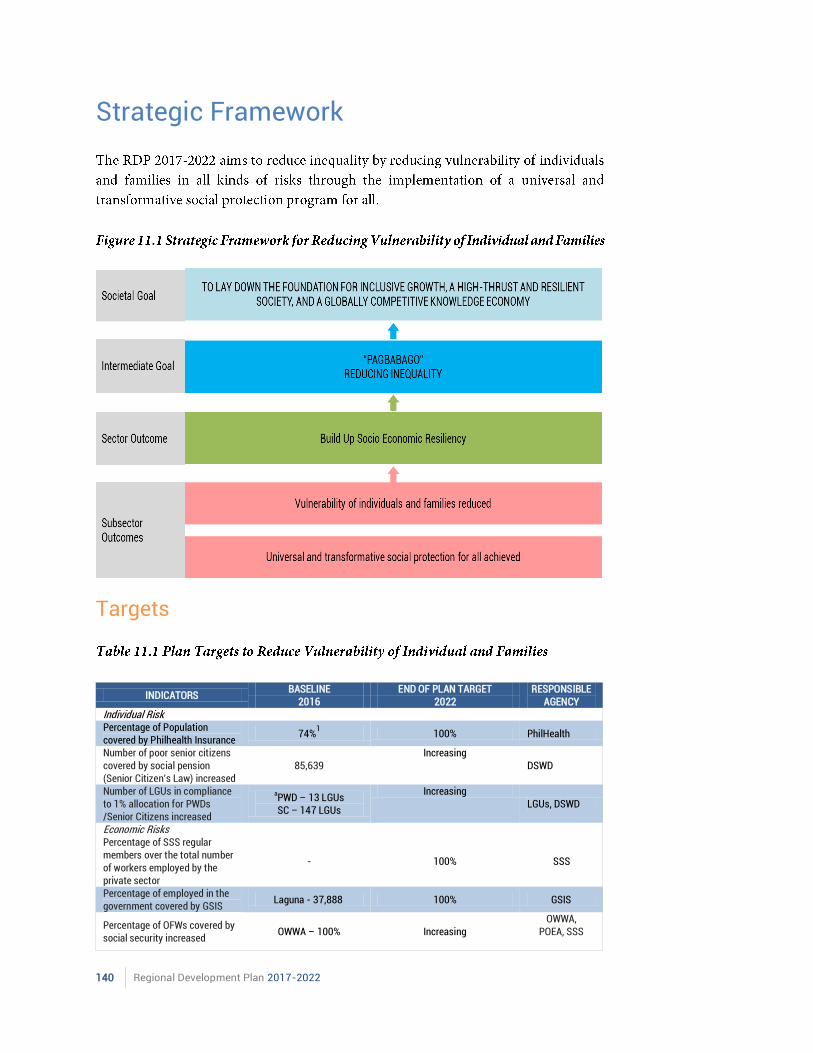
Strategic Framework
Targets
INDICATORS
BASELINE END OF PLAN TARGET RESPONSIBLE AGENCY 2016 2022
Individual Risk Percentage of Population covered by Philhealth Insurance
74%1 100% PhilHealth
Number of poor senior citizens covered by social pension (Senior Citizen's Law) increased
85,639 Increasing
DSWD
Number of LGUs in compliance to 1% allocation for PWDs /Senior Citizens increased
aPWD – 13 LGUs SC – 147 LGUs
Increasing LGUs, DSWD
Economic Risks Percentage of SSS regular members over the total number of workers employed by the private sector
- 100% SSS
Percentage of employed in the government covered by GSIS
Laguna - 37,888 100% GSIS
Percentage of OFWs covered by social security increased
OWWA – 100% Increasing OWWA,
POEA, SSS
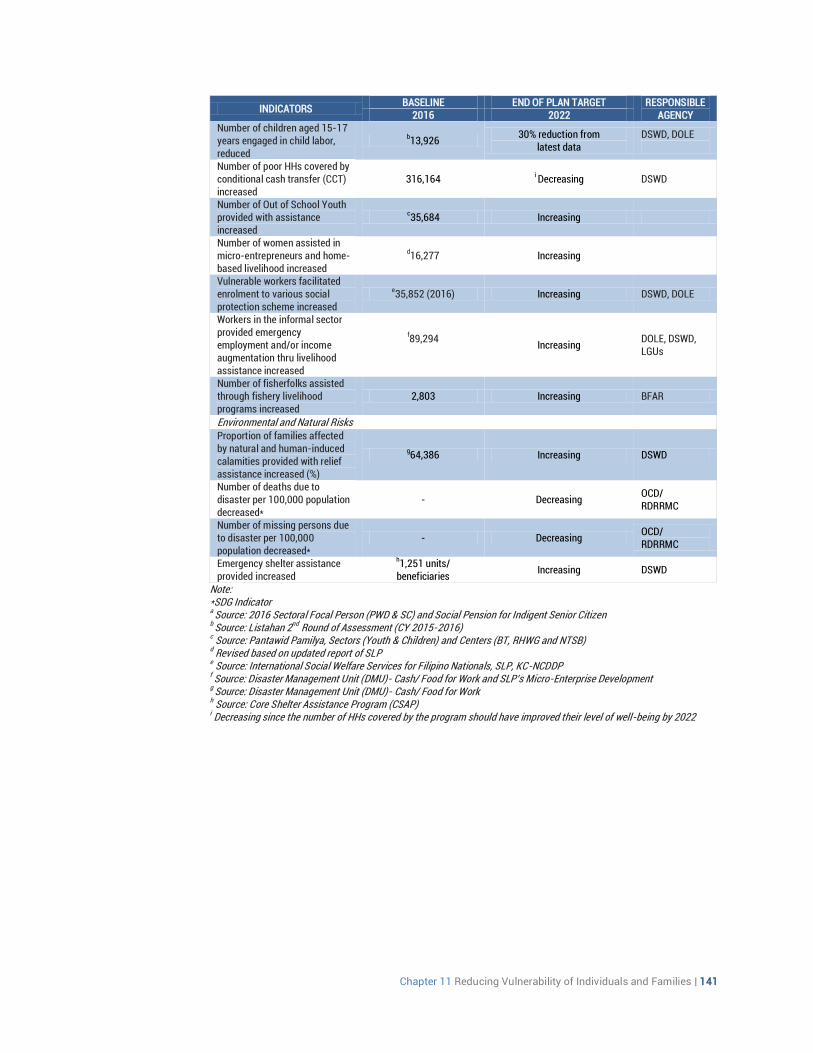
Chapter 11 Reducing Vulnerability of Individuals and Families | 141
INDICATORS
BASELINE END OF PLAN TARGET RESPONSIBLE AGENCY 2016 2022
Number of children aged 15-17 years engaged in child labor, reduced
b13,926
30% reduction from latest data
DSWD, DOLE
Number of poor HHs covered by conditional cash transfer (CCT) increased
316,164 i Decreasing DSWD
Number of Out of School Youth provided with assistance increased
c35,684 Increasing
Number of women assisted in micro-entrepreneurs and home-based livelihood increased
d16,277 Increasing
Vulnerable workers facilitated enrolment to various social protection scheme increased
e35,852 (2016) Increasing DSWD, DOLE
Workers in the informal sector provided emergency employment and/or income augmentation thru livelihood assistance increased
f89,294
Increasing
DOLE, DSWD, LGUs
Number of fisherfolks assisted through fishery livelihood programs increased
2,803 Increasing BFAR
Environmental and Natural Risks
Proportion of families affected by natural and human-induced calamities provided with relief assistance increased (%)
g64,386 Increasing DSWD
Number of deaths due to disaster per 100,000 population decreased*
- Decreasing OCD/ RDRRMC
Number of missing persons due to disaster per 100,000 population decreased*
- Decreasing OCD/ RDRRMC
Emergency shelter assistance provided increased
h1,251 units/
beneficiaries Increasing DSWD
Note: *SDG Indicator a Source: 2016 Sectoral Focal Person (PWD & SC) and Social Pension for Indigent Senior Citizen b Source: Listahan 2nd Round of Assessment (CY 2015-2016) c Source: Pantawid Pamilya, Sectors (Youth & Children) and Centers (BT, RHWG and NTSB) d Revised based on updated report of SLP e Source: International Social Welfare Services for Filipino Nationals, SLP, KC-NCDDP f Source: Disaster Management Unit (DMU)- Cash/ Food for Work and SLP’s Micro-Enterprise Development g Source: Disaster Management Unit (DMU)- Cash/ Food for Work h Source: Core Shelter Assistance Program (CSAP) i Decreasing since the number of HHs covered by the program should have improved their level of well-being by 2022
142 Regional Development Plan 2017-2022
Strategies
Chapter 11 Reducing Vulnerability of Individuals and Families | 143
Major Programs and Projects
Legislative Agenda

144 Regional Development Plan 2017-2022

Chapter 12 Building Safe and Secure Communities | 145

146 Regional Development Plan 2017-2022
Chapter 12 Building Safe and Secure Communities | 147
Chapter 12
Building Safe and Secure Communities According to Maslow’s Hierarchy of Needs, shelter is one of the physiological needs that humans should satisfy in order to survive and to attain self-actualization - a time when a person can do what they are born to do. In fact, in the national survey for Ambisyon Natin 2040, shelter is one of the identified aspirations of the Filipino. Thus, the region, through the Regional Development Plan aims to have safer and more secure housing projects in the region to cater the existing needs of the population as well as the additional population brought about by in-migration. This chapter discusses the existing situation of programs and projects related to housing in the region as well as identified strategies to address the challenges experienced during the previous years.
Assessment and Challenges
148 Regional Development Plan 2017-2022
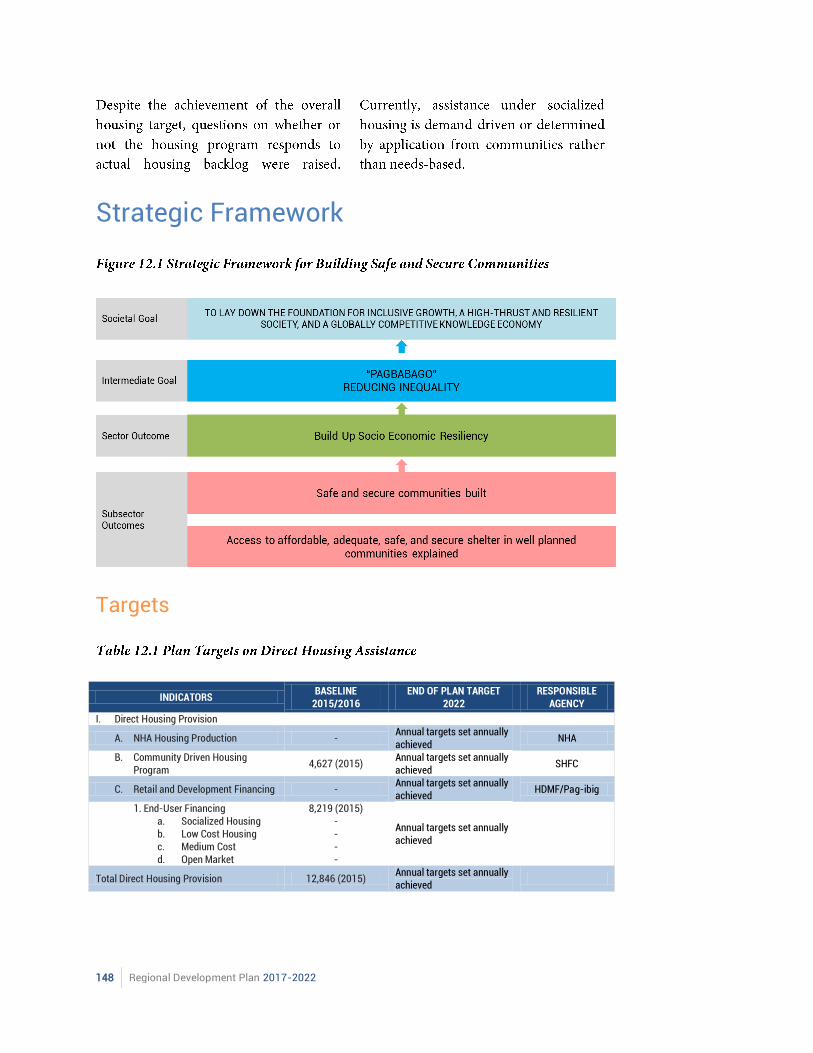
Strategic Framework
Targets
INDICATORS
BASELINE 2015/2016
END OF PLAN TARGET 2022
RESPONSIBLE AGENCY
I. Direct Housing Provision
A. NHA Housing Production - Annual targets set annually achieved
NHA
B. Community Driven Housing Program
4,627 (2015) Annual targets set annually achieved
SHFC
C. Retail and Development Financing - Annual targets set annually achieved
HDMF/Pag-ibig
1. End-User Financing a. Socialized Housing b. Low Cost Housing c. Medium Cost d. Open Market
8,219 (2015) - - - -
Annual targets set annually achieved
Total Direct Housing Provision 12,846 (2015) Annual targets set annually achieved
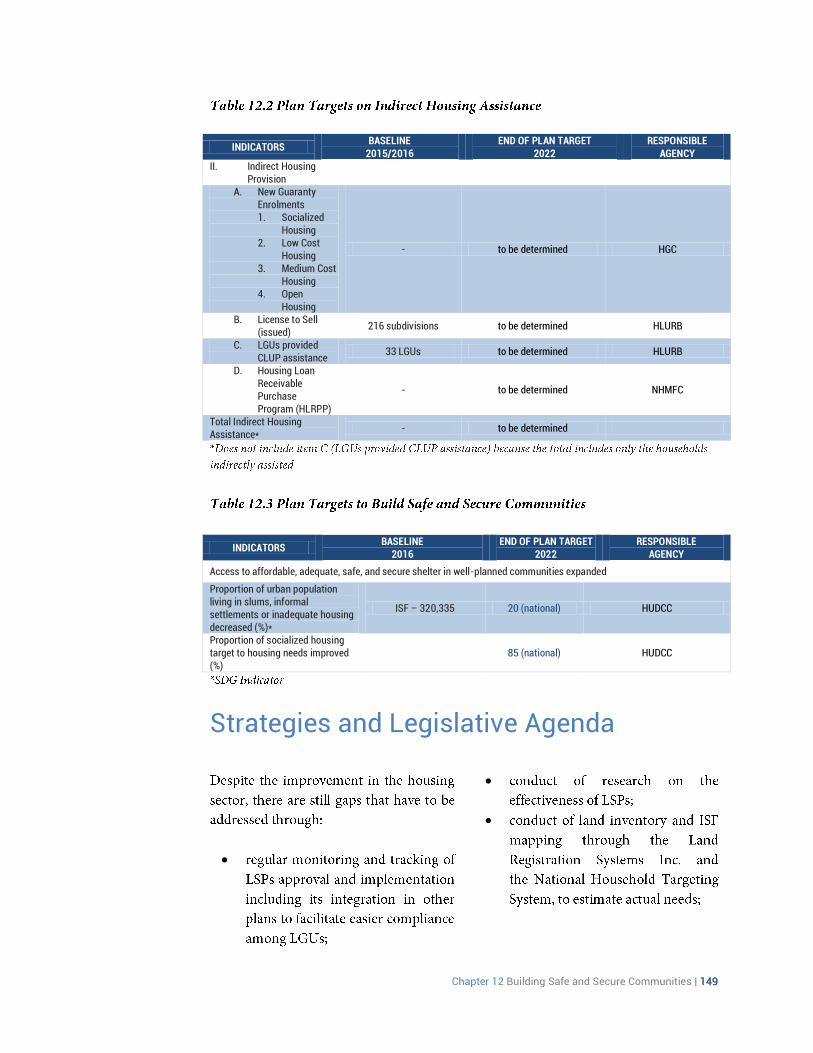
Chapter 12 Building Safe and Secure Communities | 149
INDICATORS BASELINE
2015/2016 END OF PLAN TARGET
2022 RESPONSIBLE
AGENCY II. Indirect Housing
Provision
A. New Guaranty Enrolments 1. Socialized
Housing 2. Low Cost
Housing 3. Medium Cost
Housing 4. Open
Housing
- to be determined HGC
B. License to Sell (issued)
216 subdivisions to be determined HLURB
C. LGUs provided CLUP assistance
33 LGUs to be determined HLURB
D. Housing Loan Receivable Purchase Program (HLRPP)
- to be determined NHMFC
Total Indirect Housing Assistance*
- to be determined
INDICATORS BASELINE
2016 END OF PLAN TARGET
2022 RESPONSIBLE
AGENCY
Access to affordable, adequate, safe, and secure shelter in well-planned communities expanded
Proportion of urban population living in slums, informal settlements or inadequate housing decreased (%)*
ISF – 320,335 20 (national) HUDCC
Proportion of socialized housing target to housing needs improved (%)
85 (national) HUDCC
Strategies and Legislative Agenda
150 Regional Development Plan 2017-2022
Major Programs and Projects
Chapter 13 Reaching for the Demographic Dividend | 151

152 Regional Development Plan 2017-2022
Chapter 13 Reaching for the Demographic Dividend | 153

154 Regional Development Plan 2017-2022
Chapter 13 Reaching for the Demographic Dividend | 155
Chapter 13
Reaching for the Demographic Dividend Demographic dividend is the “economic growth potential that can result from shifts in a population’s age structure, mainly when the share of the working-age population (15 to 64) is larger than the non-working-age share of the population (14 and younger, and 65 and older)i”.
Assessment and Challenges
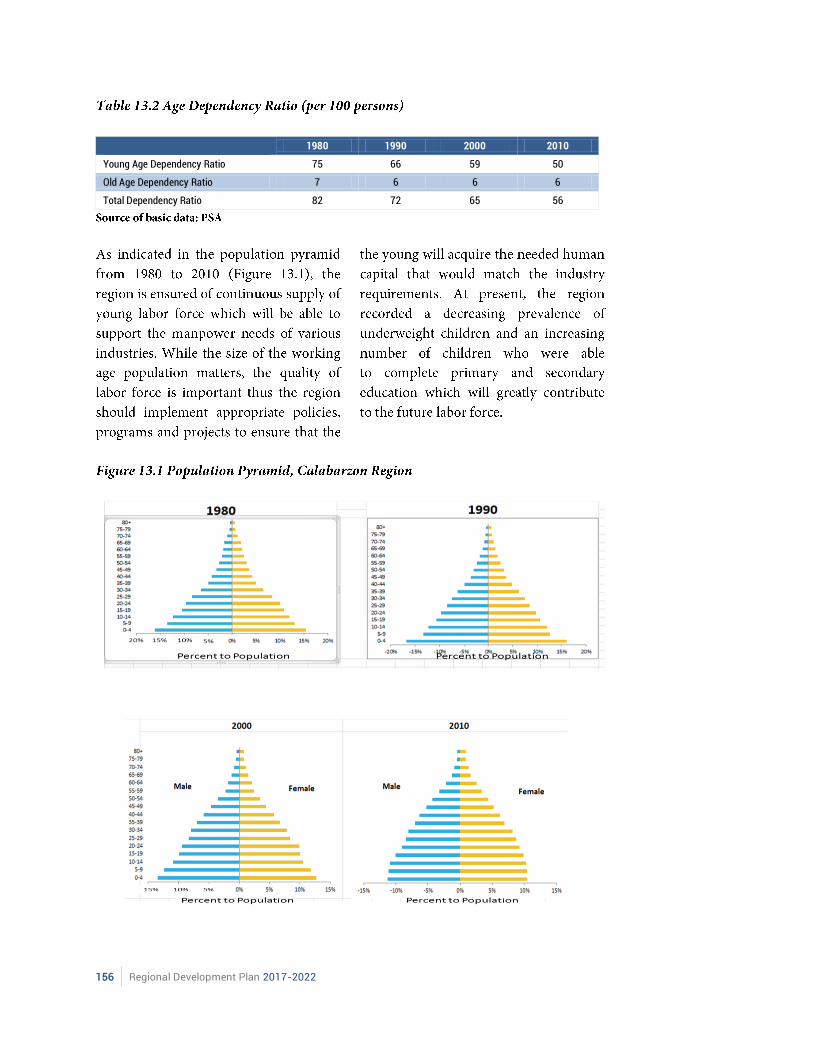
POPULATION1/
GROWTH RATE2/
1980 1990 2000 2010 1970-80 1980-90 1990-2000
2000-2010
AVE.
0-14 years old 1,894,544 2,440,012 3,376,000 4,049,014 2.57 2.56 3.30 1.83 2.57 65 & over 176,302 217,592 328,800 480,366 2.13 2.13 4.21 3.86 3.08 15-64 years old 2,532,589 3,681,999 5,718,100 8,053,629 3.82 3.81 4.50 3.48 3.90 CALABARZON 4,603,435 6,349,452 9,320,629 12,609,803 3.21 3.27 3.91 3.07 3.37
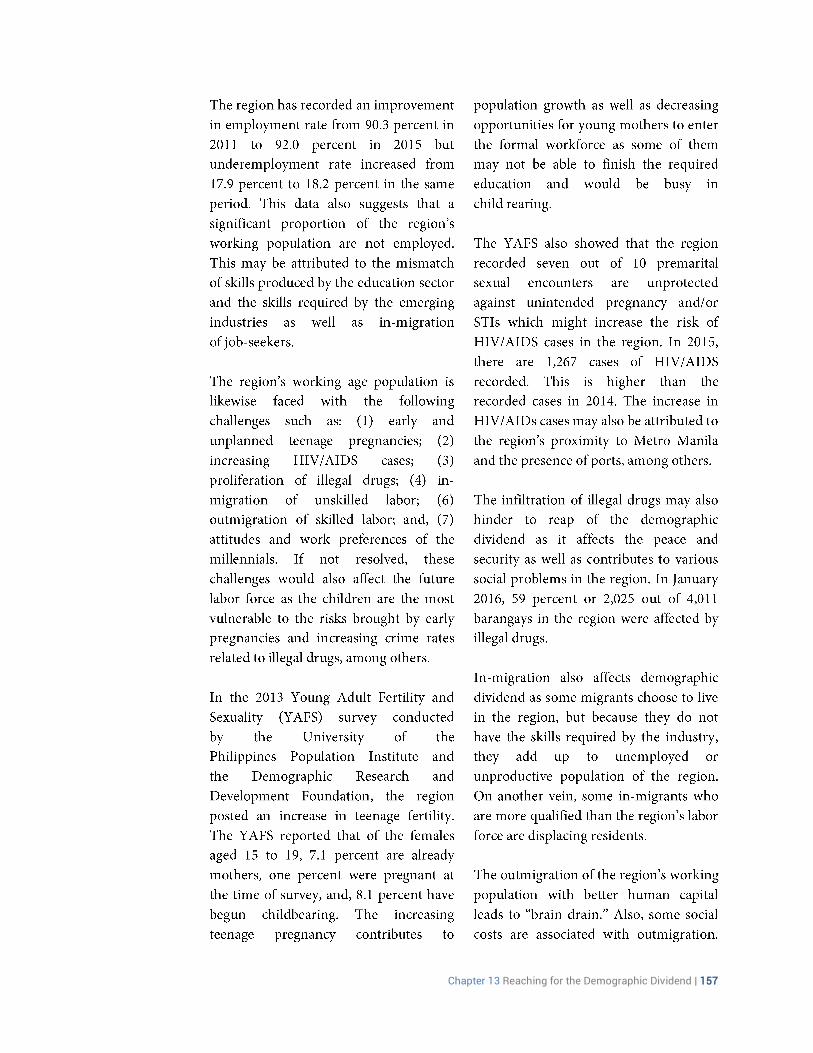
156 Regional Development Plan 2017-2022
1980 1990 2000 2010
Young Age Dependency Ratio 75 66 59 50
Old Age Dependency Ratio 7 6 6 6
Total Dependency Ratio 82 72 65 56
Chapter 13 Reaching for the Demographic Dividend | 157
158 Regional Development Plan 2017-2022
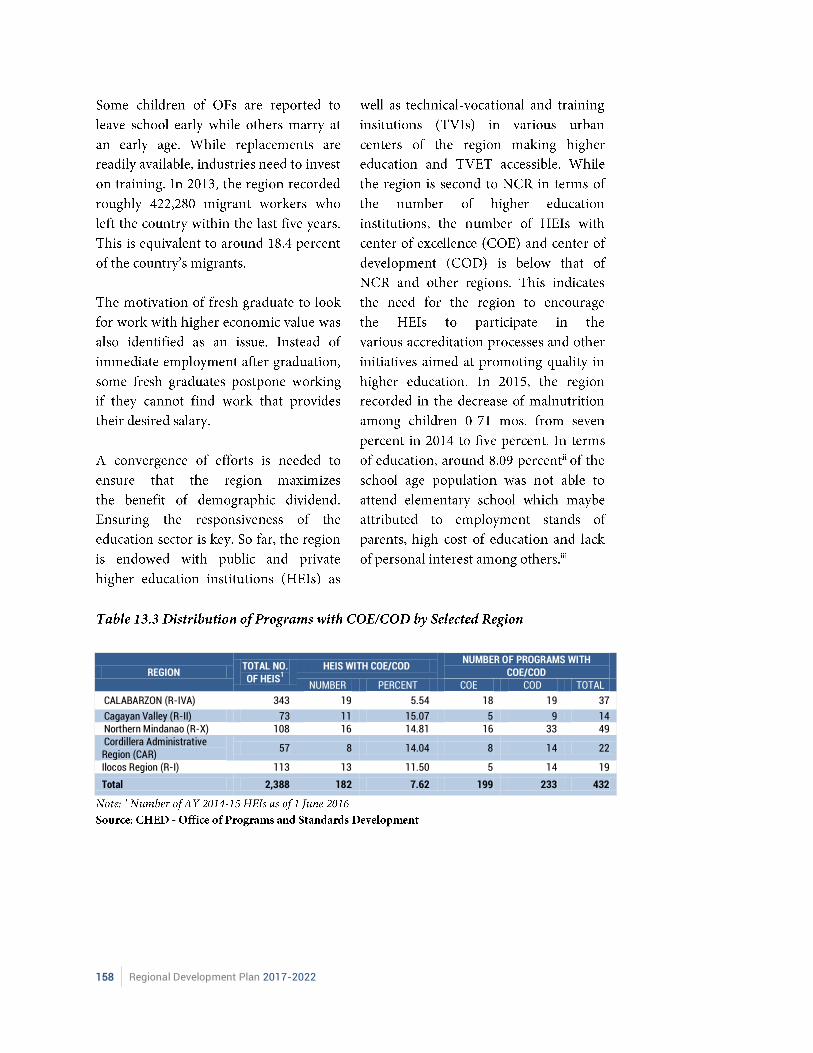
REGION TOTAL NO. OF HEIS
1
HEIS WITH COE/COD NUMBER OF PROGRAMS WITH
COE/COD NUMBER PERCENT COE COD TOTAL
CALABARZON (R-IVA) 343 19 5.54 18 19 37
Cagayan Valley (R-II) 73 11 15.07 5 9 14 Northern Mindanao (R-X) 108 16 14.81 16 33 49 Cordillera Administrative Region (CAR)
57 8 14.04 8 14 22
Ilocos Region (R-I) 113 13 11.50 5 14 19
Total 2,388 182 7.62 199 233 432
Chapter 13 Reaching for the Demographic Dividend | 159
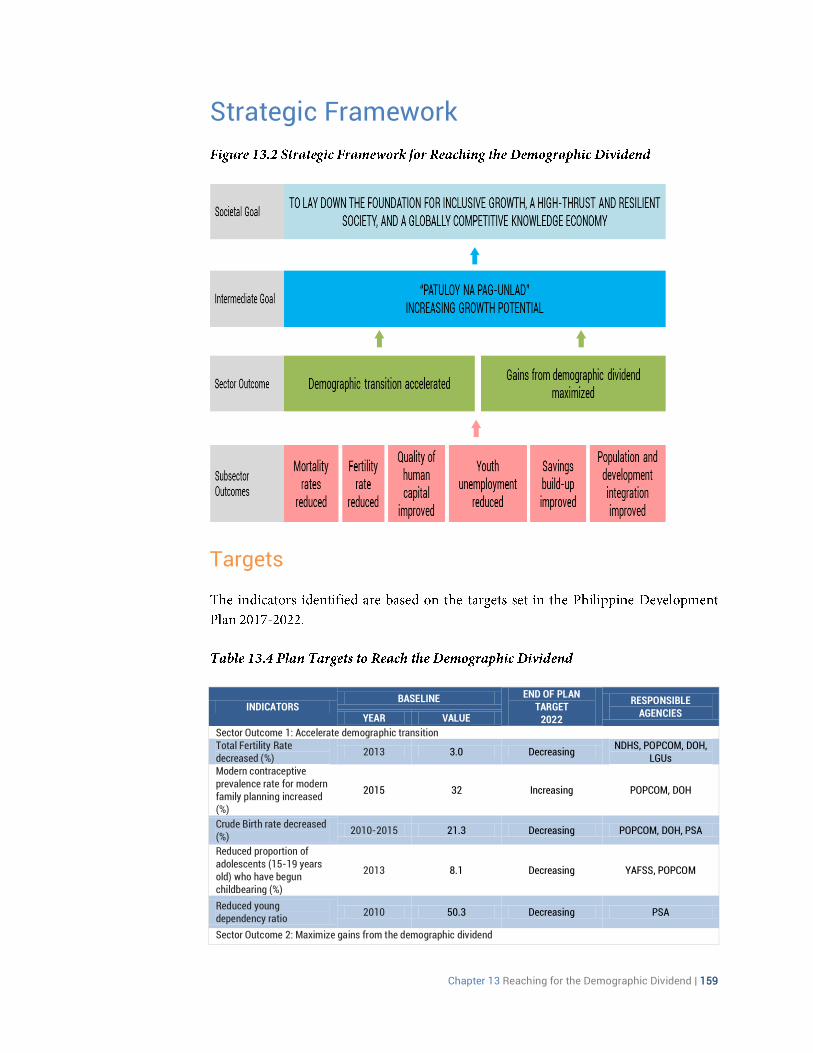
Strategic Framework
Targets
INDICATORS BASELINE END OF PLAN
TARGET 2022
RESPONSIBLE AGENCIES YEAR VALUE
Sector Outcome 1: Accelerate demographic transition Total Fertility Rate decreased (%)
2013 3.0 Decreasing NDHS, POPCOM, DOH,
LGUs Modern contraceptive prevalence rate for modern family planning increased (%)
2015 32 Increasing POPCOM, DOH
Crude Birth rate decreased (%)
2010-2015 21.3 Decreasing POPCOM, DOH, PSA
Reduced proportion of adolescents (15-19 years old) who have begun childbearing (%)
2013 8.1 Decreasing YAFSS, POPCOM
Reduced young dependency ratio
2010 50.3 Decreasing PSA
Sector Outcome 2: Maximize gains from the demographic dividend
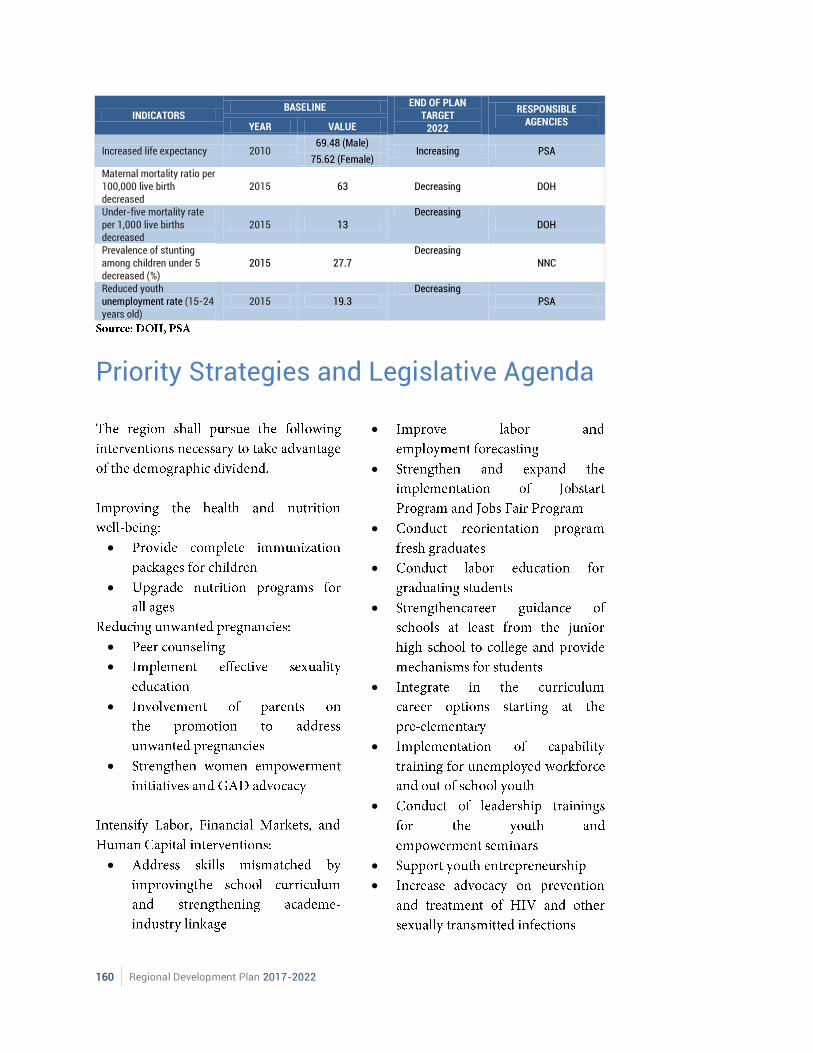
160 Regional Development Plan 2017-2022
INDICATORS BASELINE END OF PLAN
TARGET 2022
RESPONSIBLE AGENCIES YEAR VALUE
Increased life expectancy 2010 69.48 (Male)
Increasing PSA 75.62 (Female)
Maternal mortality ratio per 100,000 live birth decreased
2015 63 Decreasing DOH
Under-five mortality rate per 1,000 live births decreased
2015 13 Decreasing
DOH
Prevalence of stunting among children under 5 decreased (%)
2015 27.7 Decreasing
NNC
Reduced youth unemployment rate (15-24 years old)
2015 19.3 Decreasing
PSA
Priority Strategies and Legislative Agenda
Chapter 13 Reaching for the Demographic Dividend | 161
Major Programs and Projects
i ii

162 Regional Development Plan 2017-2022
Chapter 14 Vigorously Advancing Science, Technology, and Innovation | 163

164 Regional Development Plan 2017-2022
Chapter 14 Vigorously Advancing Science, Technology, and Innovation | 165
Chapter 14
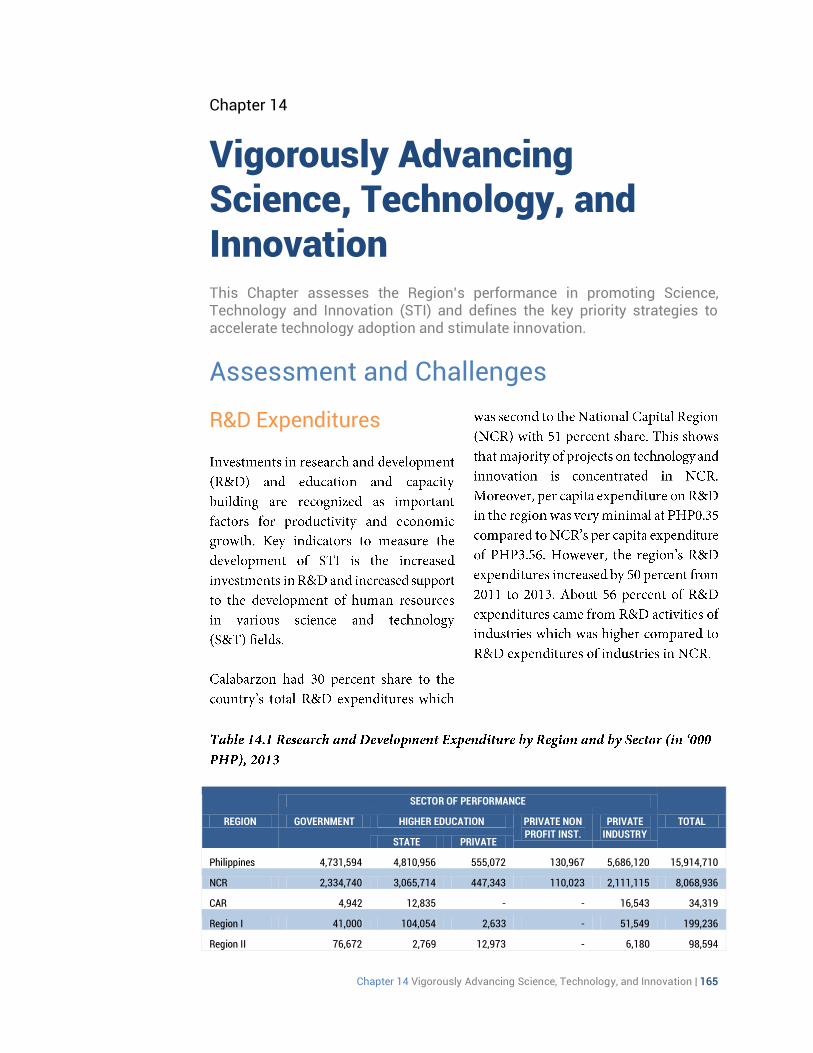
Vigorously Advancing Science, Technology, and Innovation This Chapter assesses the Region’s performance in promoting Science, Technology and Innovation (STI) and defines the key priority strategies to accelerate technology adoption and stimulate innovation.
Assessment and Challenges
R&D Expenditures
REGION
SECTOR OF PERFORMANCE
TOTAL GOVERNMENT HIGHER EDUCATION PRIVATE NON PROFIT INST.
PRIVATE INDUSTRY
STATE PRIVATE
Philippines 4,731,594 4,810,956 555,072 130,967 5,686,120 15,914,710
NCR 2,334,740 3,065,714 447,343 110,023 2,111,115 8,068,936
CAR 4,942 12,835 - - 16,543 34,319
Region I 41,000 104,054 2,633 - 51,549 199,236
Region II 76,672 2,769 12,973 - 6,180 98,594
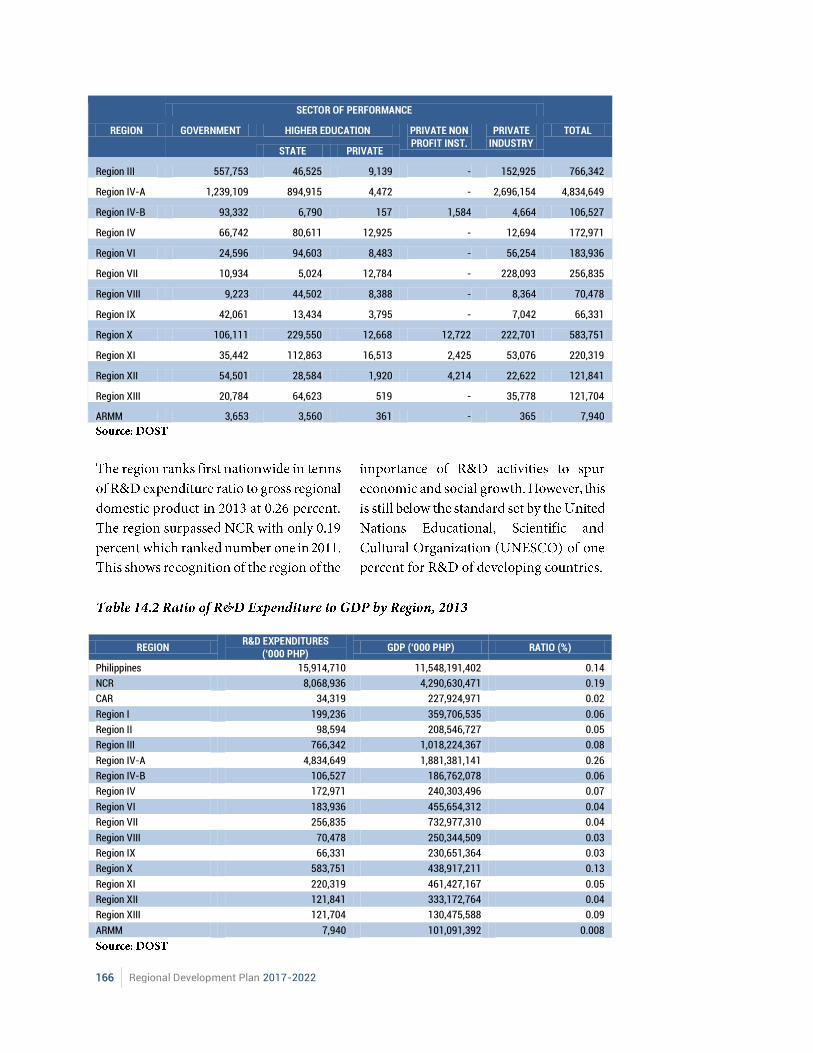
166 Regional Development Plan 2017-2022
REGION
SECTOR OF PERFORMANCE
TOTAL GOVERNMENT HIGHER EDUCATION PRIVATE NON PROFIT INST.
PRIVATE INDUSTRY
STATE PRIVATE
Region III 557,753 46,525 9,139 - 152,925 766,342
Region IV-A 1,239,109 894,915 4,472 - 2,696,154 4,834,649
Region IV-B 93,332 6,790 157 1,584 4,664 106,527
Region IV 66,742 80,611 12,925 - 12,694 172,971
Region VI 24,596 94,603 8,483 - 56,254 183,936
Region VII 10,934 5,024 12,784 - 228,093 256,835
Region VIII 9,223 44,502 8,388 - 8,364 70,478
Region IX 42,061 13,434 3,795 - 7,042 66,331
Region X 106,111 229,550 12,668 12,722 222,701 583,751
Region XI 35,442 112,863 16,513 2,425 53,076 220,319
Region XII 54,501 28,584 1,920 4,214 22,622 121,841
Region XIII 20,784 64,623 519 - 35,778 121,704
ARMM 3,653 3,560 361 - 365 7,940
REGION R&D EXPENDITURES
(‘000 PHP) GDP (‘000 PHP) RATIO (%)
Philippines 15,914,710 11,548,191,402 0.14
NCR 8,068,936 4,290,630,471 0.19
CAR 34,319 227,924,971 0.02
Region I 199,236 359,706,535 0.06
Region II 98,594 208,546,727 0.05
Region III 766,342 1,018,224,367 0.08
Region IV-A 4,834,649 1,881,381,141 0.26
Region IV-B 106,527 186,762,078 0.06
Region IV 172,971 240,303,496 0.07
Region VI 183,936 455,654,312 0.04
Region VII 256,835 732,977,310 0.04
Region VIII 70,478 250,344,509 0.03
Region IX 66,331 230,651,364 0.03
Region X 583,751 438,917,211 0.13
Region XI 220,319 461,427,167 0.05
Region XII 121,841 333,172,764 0.04
Region XIII 121,704 130,475,588 0.09
ARMM 7,940 101,091,392 0.008
Chapter 14 Vigorously Advancing Science, Technology, and Innovation | 167
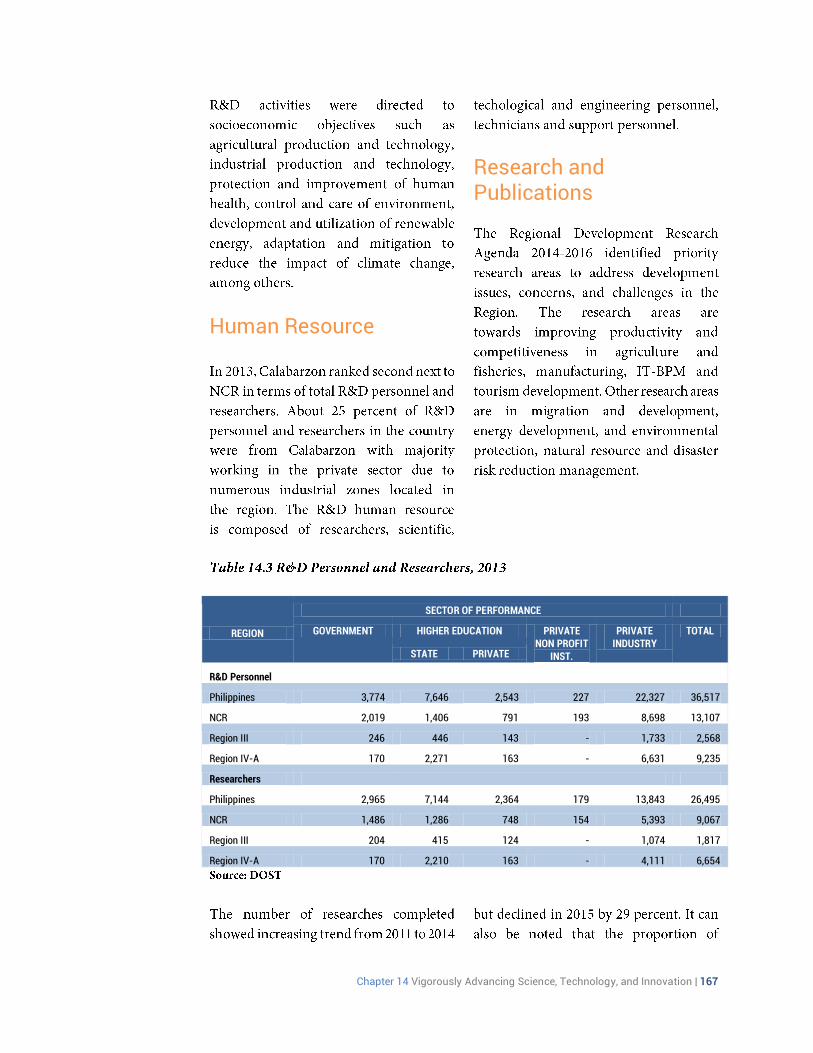
Human Resource
Research and Publications
REGION
SECTOR OF PERFORMANCE
GOVERNMENT HIGHER EDUCATION PRIVATE NON PROFIT
INST.
PRIVATE INDUSTRY
TOTAL
STATE PRIVATE
R&D Personnel
Philippines 3,774 7,646 2,543 227 22,327 36,517
NCR 2,019 1,406 791 193 8,698 13,107
Region III 246 446 143 - 1,733 2,568
Region IV-A 170 2,271 163 - 6,631 9,235
Researchers
Philippines 2,965 7,144 2,364 179 13,843 26,495
NCR 1,486 1,286 748 154 5,393 9,067
Region III 204 415 124 - 1,074 1,817
Region IV-A 170 2,210 163 - 4,111 6,654
168 Regional Development Plan 2017-2022
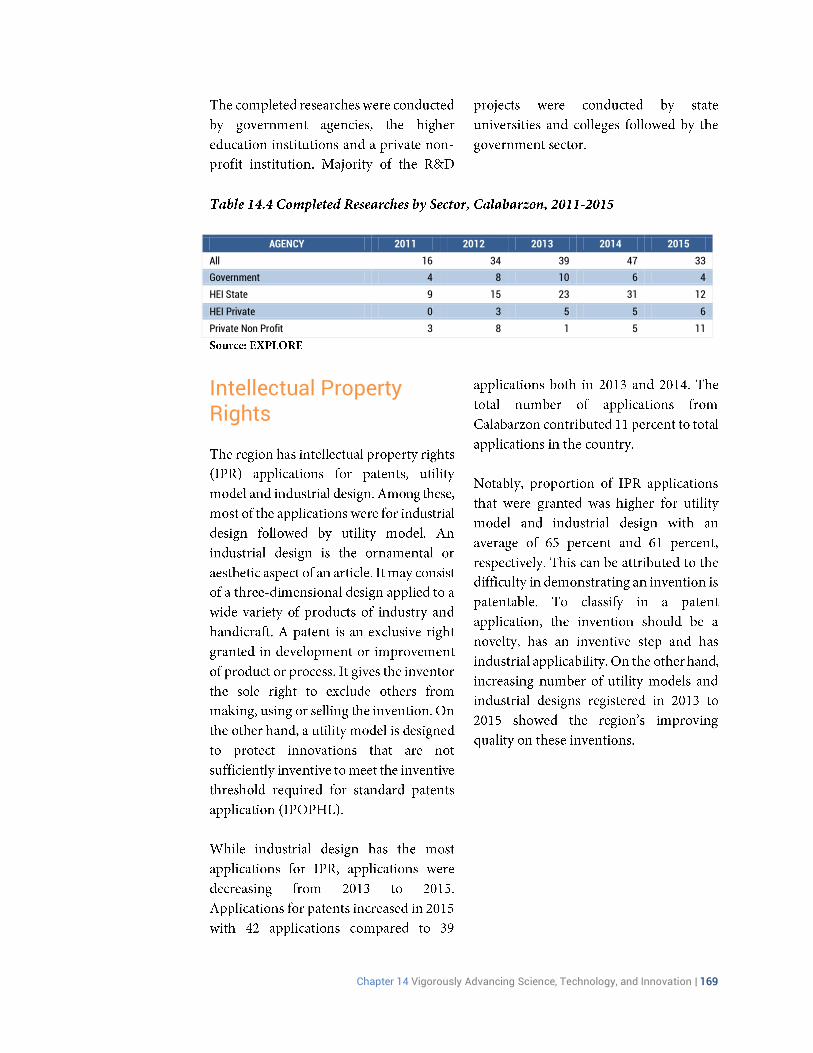
20.7% Education
18.9% Agriculture & Fisheries
12.4% Envi protection, NRM & DRR
11.2% Manufacturing & Services
7.1% Health & Nutrition
5.9% IT-PBM
23.7% Others
Chapter 14 Vigorously Advancing Science, Technology, and Innovation | 169
AGENCY 2011 2012 2013 2014 2015
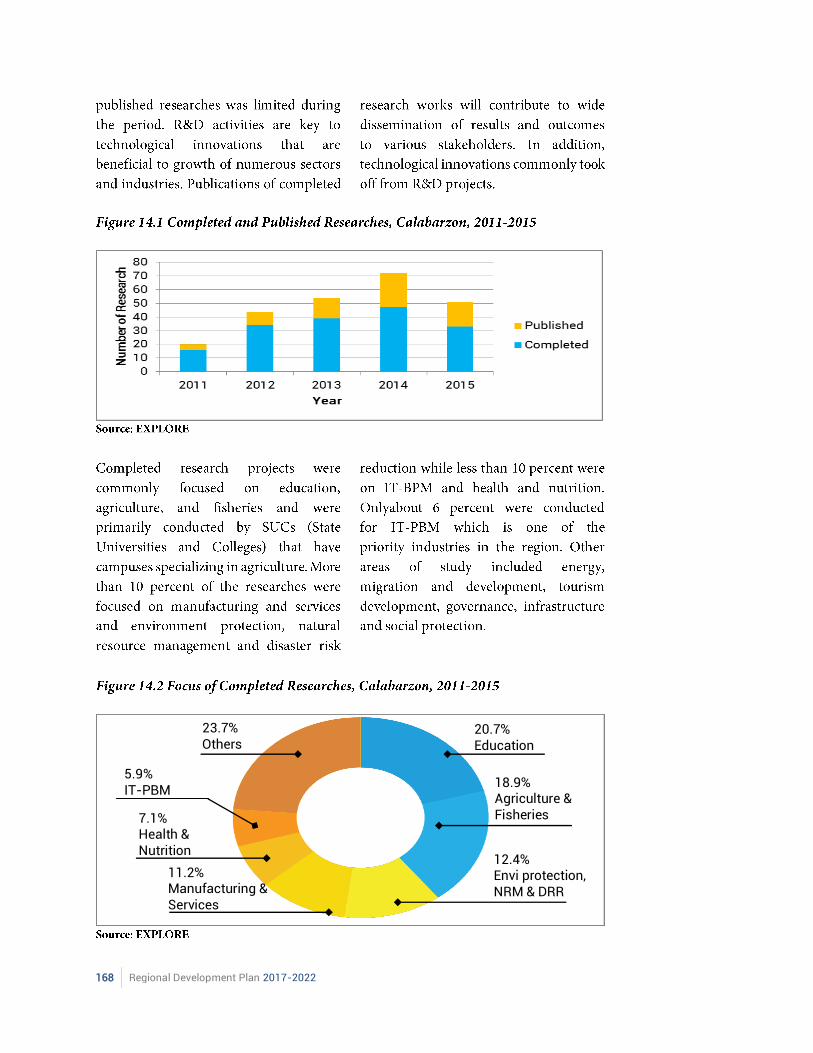
All 16 34 39 47 33
Government 4 8 10 6 4
HEI State 9 15 23 31 12
HEI Private 0 3 5 5 6
Private Non Profit 3 8 1 5 11
Intellectual Property Rights
170 Regional Development Plan 2017-2022
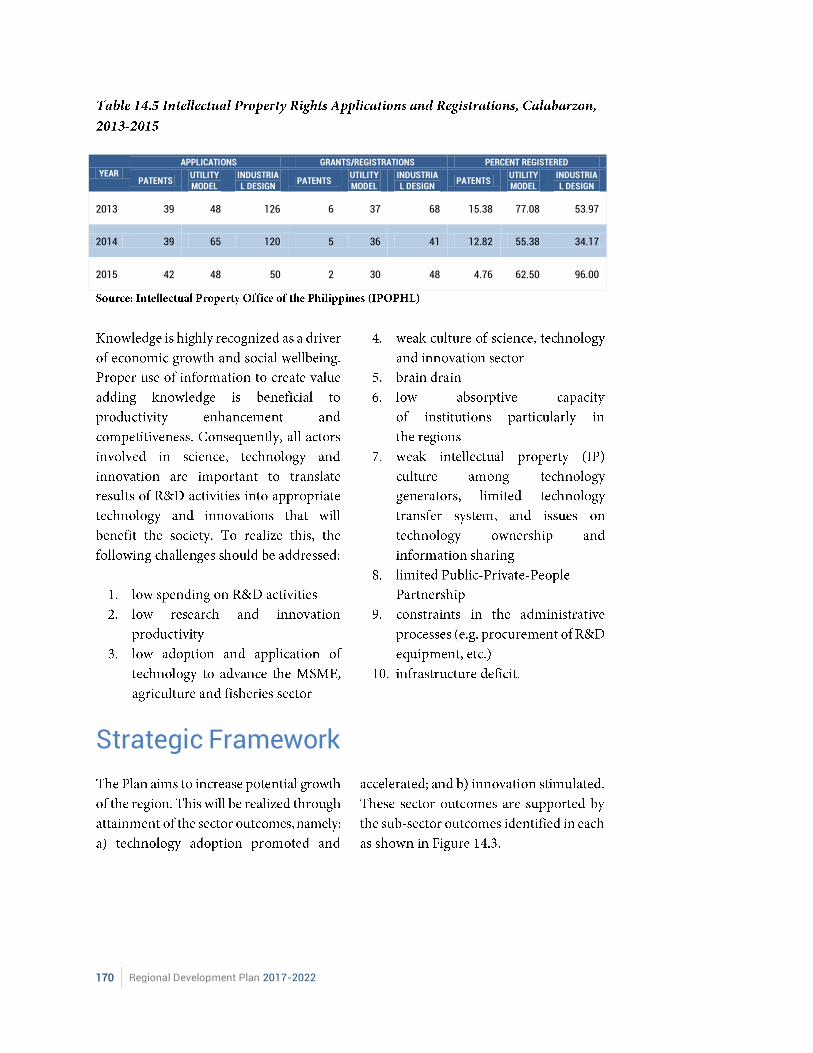
YEAR APPLICATIONS GRANTS/REGISTRATIONS PERCENT REGISTERED
PATENTS UTILITY MODEL
INDUSTRIAL DESIGN
PATENTS UTILITY MODEL
INDUSTRIAL DESIGN
PATENTS UTILITY MODEL
INDUSTRIAL DESIGN
2013 39 48 126 6 37 68 15.38 77.08 53.97
2014 39 65 120 5 36 41 12.82 55.38 34.17
2015 42 48 50 2 30 48 4.76 62.50 96.00
Strategic Framework
Chapter 14 Vigorously Advancing Science, Technology, and Innovation | 171
Targets
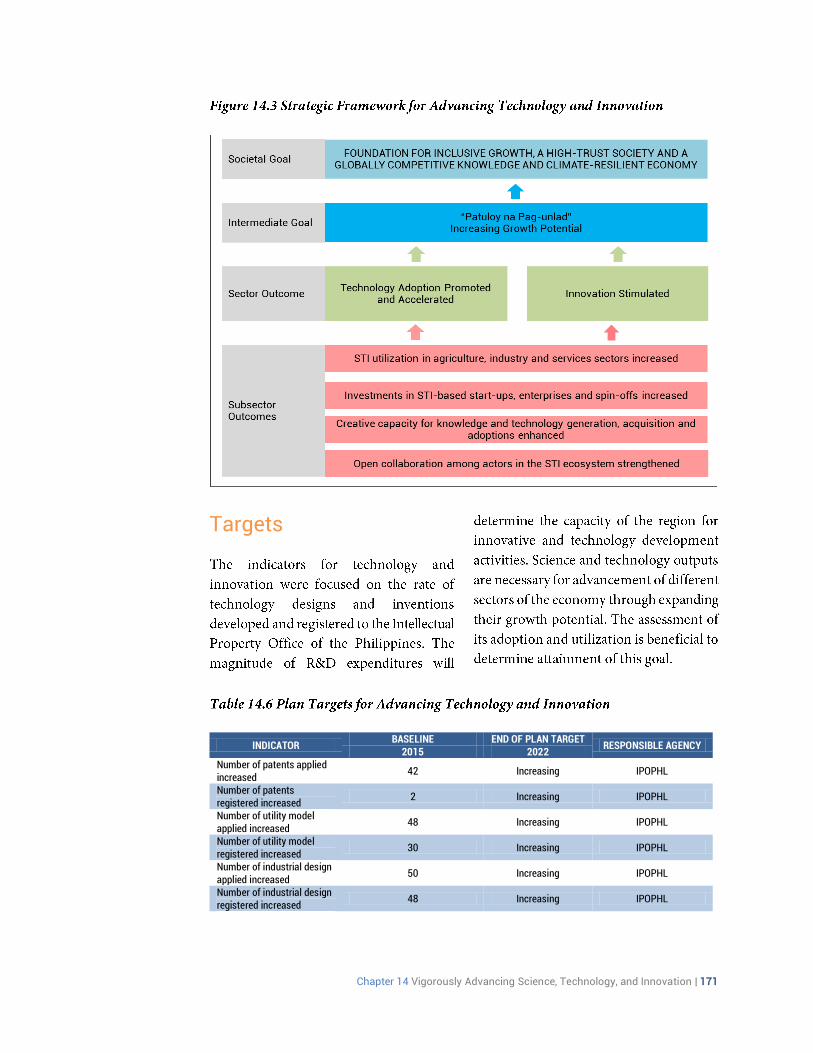
INDICATOR BASELINE END OF PLAN TARGET
RESPONSIBLE AGENCY 2015 2022
Number of patents applied increased
42 Increasing IPOPHL
Number of patents registered increased
2 Increasing IPOPHL
Number of utility model applied increased
48 Increasing IPOPHL
Number of utility model registered increased
30 Increasing IPOPHL
Number of industrial design applied increased
50 Increasing IPOPHL
Number of industrial design registered increased
48 Increasing IPOPHL
172 Regional Development Plan 2017-2022
Strategies
Chapter 14 Vigorously Advancing Science, Technology, and Innovation | 173
Major Programs and Projects

174 Regional Development Plan 2017-2022
Chapter 15 Ensuring Sound Macroeconomic Policy | 175

176 Regional Development Plan 2017-2022
Chapter 15 Ensuring Sound Macroeconomic Policy | 177

178 Regional Development Plan 2017-2022
Chapter 15 Ensuring Sound Macroeconomic Policy | 179
Chapter 15
Ensuring Sound Macroeconomic Policy This chapter assesses the economic performance of the region and identifies key challenges, strategies and strategic interventions to increase economic opportunities towards growth and development. Increasing productive output and employment generation are the prerequisites in fighting poverty. To attain macroeconomic stability, the region will have to: a) address the challenges of competition globally, with ASEAN countries and with other local regions; b) improve its infrastructure connectivity; c) disperse development opportunities in several areas; d) diversify and explore new investment areas; e) integrate and promote its cultural identity; f) keep up with technology advancement; g) adapt to climate change and promote disaster preparedness; h) sustain a peaceful environment; and i) advocate for the continuity of the programs and projects being implemented by local governments units across four administrations towards sustainability.
Assessment and Challenges
A. Sustained Economic Growth
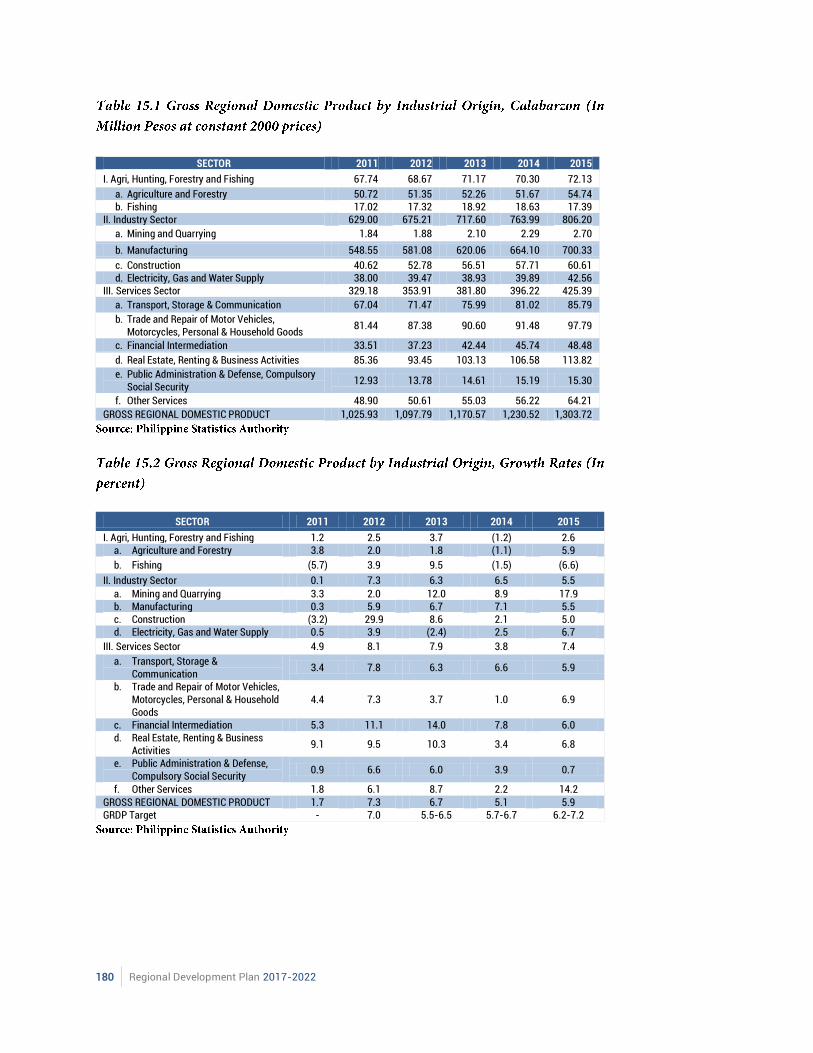
180 Regional Development Plan 2017-2022
SECTOR 2011 2012 2013 2014 2015
I. Agri, Hunting, Forestry and Fishing 67.74 68.67 71.17 70.30 72.13
a. Agriculture and Forestry 50.72 51.35 52.26 51.67 54.74 b. Fishing 17.02 17.32 18.92 18.63 17.39
II. Industry Sector 629.00 675.21 717.60 763.99 806.20
a. Mining and Quarrying 1.84 1.88 2.10 2.29 2.70
b. Manufacturing 548.55 581.08 620.06 664.10 700.33
c. Construction 40.62 52.78 56.51 57.71 60.61 d. Electricity, Gas and Water Supply 38.00 39.47 38.93 39.89 42.56
III. Services Sector 329.18 353.91 381.80 396.22 425.39
a. Transport, Storage & Communication 67.04 71.47 75.99 81.02 85.79
b. Trade and Repair of Motor Vehicles, Motorcycles, Personal & Household Goods
81.44 87.38 90.60 91.48 97.79
c. Financial Intermediation 33.51 37.23 42.44 45.74 48.48
d. Real Estate, Renting & Business Activities 85.36 93.45 103.13 106.58 113.82
e. Public Administration & Defense, Compulsory Social Security
12.93 13.78 14.61 15.19 15.30
f. Other Services 48.90 50.61 55.03 56.22 64.21
GROSS REGIONAL DOMESTIC PRODUCT 1,025.93 1,097.79 1,170.57 1,230.52 1,303.72
SECTOR 2011 2012 2013 2014 2015
I. Agri, Hunting, Forestry and Fishing 1.2 2.5 3.7 (1.2) 2.6 a. Agriculture and Forestry 3.8 2.0 1.8 (1.1) 5.9
b. Fishing (5.7) 3.9 9.5 (1.5) (6.6)
II. Industry Sector 0.1 7.3 6.3 6.5 5.5
a. Mining and Quarrying 3.3 2.0 12.0 8.9 17.9 b. Manufacturing 0.3 5.9 6.7 7.1 5.5 c. Construction (3.2) 29.9 8.6 2.1 5.0 d. Electricity, Gas and Water Supply 0.5 3.9 (2.4) 2.5 6.7
III. Services Sector 4.9 8.1 7.9 3.8 7.4
a. Transport, Storage & Communication
3.4 7.8 6.3 6.6 5.9
b. Trade and Repair of Motor Vehicles, Motorcycles, Personal & Household Goods
4.4 7.3 3.7 1.0 6.9
c. Financial Intermediation 5.3 11.1 14.0 7.8 6.0 d. Real Estate, Renting & Business
Activities 9.1 9.5 10.3 3.4 6.8
e. Public Administration & Defense, Compulsory Social Security
0.9 6.6 6.0 3.9 0.7
f. Other Services 1.8 6.1 8.7 2.2 14.2 GROSS REGIONAL DOMESTIC PRODUCT 1.7 7.3 6.7 5.1 5.9 GRDP Target - 7.0 5.5-6.5 5.7-6.7 6.2-7.2
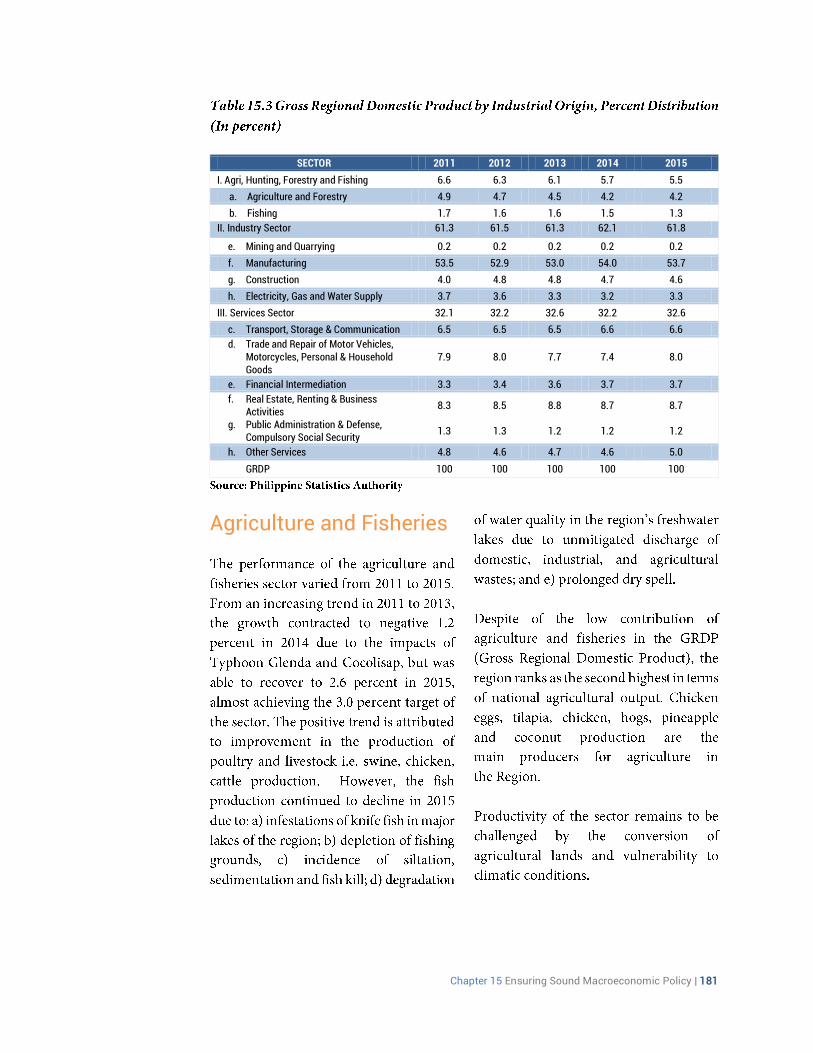
Chapter 15 Ensuring Sound Macroeconomic Policy | 181
SECTOR 2011 2012 2013 2014 2015
I. Agri, Hunting, Forestry and Fishing 6.6 6.3 6.1 5.7 5.5
a. Agriculture and Forestry 4.9 4.7 4.5 4.2 4.2
b. Fishing 1.7 1.6 1.6 1.5 1.3
II. Industry Sector 61.3 61.5 61.3 62.1 61.8
e. Mining and Quarrying 0.2 0.2 0.2 0.2 0.2
f. Manufacturing 53.5 52.9 53.0 54.0 53.7
g. Construction 4.0 4.8 4.8 4.7 4.6
h. Electricity, Gas and Water Supply 3.7 3.6 3.3 3.2 3.3
III. Services Sector 32.1 32.2 32.6 32.2 32.6
c. Transport, Storage & Communication 6.5 6.5 6.5 6.6 6.6
d. Trade and Repair of Motor Vehicles, Motorcycles, Personal & Household Goods
7.9 8.0 7.7 7.4 8.0
e. Financial Intermediation 3.3 3.4 3.6 3.7 3.7
f. Real Estate, Renting & Business Activities
8.3 8.5 8.8 8.7 8.7
g. Public Administration & Defense, Compulsory Social Security
1.3 1.3 1.2 1.2 1.2
h. Other Services 4.8 4.6 4.7 4.6 5.0
GRDP 100 100 100 100 100
Agriculture and Fisheries
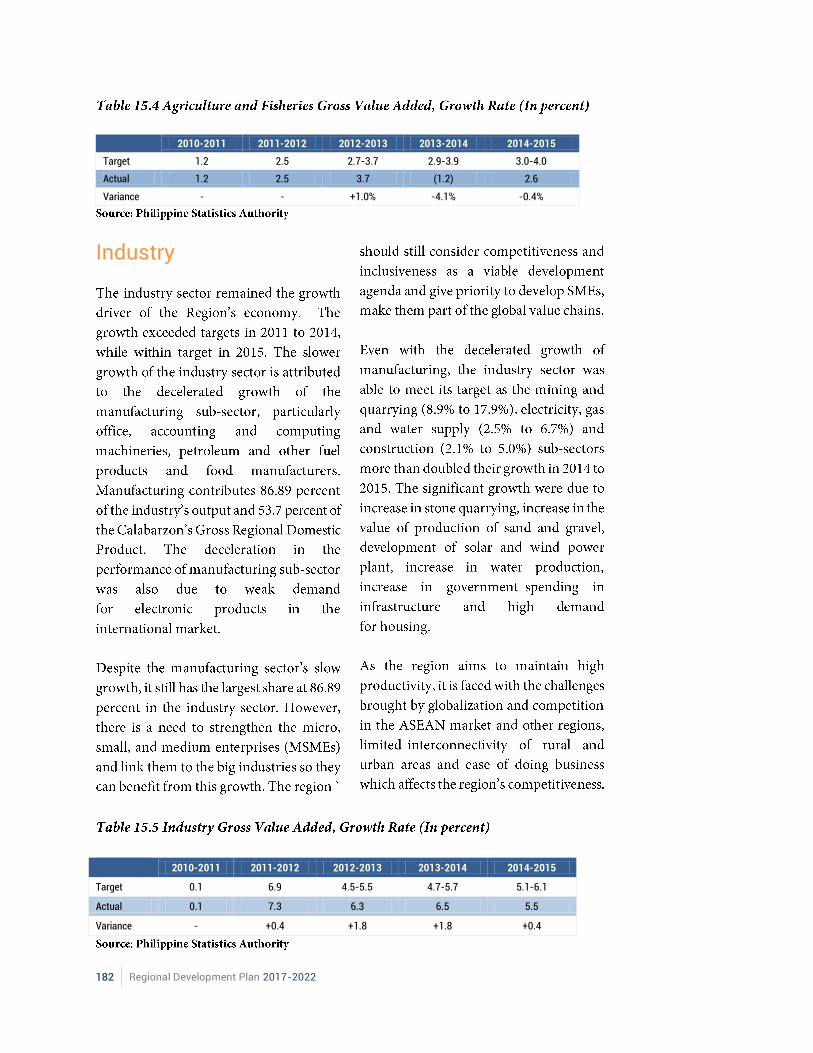
182 Regional Development Plan 2017-2022
2010-2011 2011-2012 2012-2013 2013-2014 2014-2015
Target 1.2 2.5 2.7-3.7 2.9-3.9 3.0-4.0
Actual 1.2 2.5 3.7 (1.2) 2.6
Variance - - +1.0% -4.1% -0.4%
Industry
2010-2011 2011-2012 2012-2013 2013-2014 2014-2015
Target 0.1 6.9 4.5-5.5 4.7-5.7 5.1-6.1
Actual 0.1 7.3 6.3 6.5 5.5
Variance - +0.4 +1.8 +1.8 +0.4
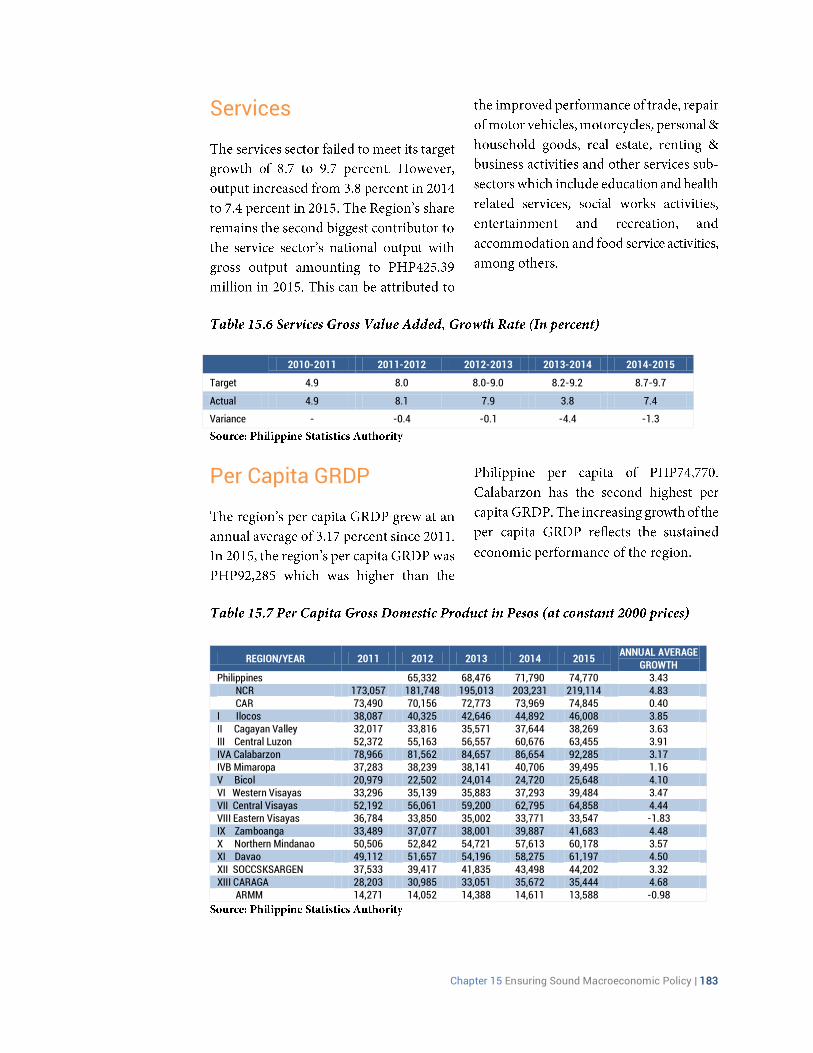
Chapter 15 Ensuring Sound Macroeconomic Policy | 183
Services
2010-2011 2011-2012 2012-2013 2013-2014 2014-2015
Target 4.9 8.0 8.0-9.0 8.2-9.2 8.7-9.7
Actual 4.9 8.1 7.9 3.8 7.4
Variance - -0.4 -0.1 -4.4 -1.3
Per Capita GRDP
.
REGION/YEAR 2011 2012 2013 2014 2015 ANNUAL AVERAGE
GROWTH Philippines
65,332 68,476 71,790 74,770 3.43
NCR 173,057 181,748 195,013 203,231 219,114 4.83 CAR 73,490 70,156 72,773 73,969 74,845 0.40 I Ilocos 38,087 40,325 42,646 44,892 46,008 3.85 II Cagayan Valley 32,017 33,816 35,571 37,644 38,269 3.63 III Central Luzon 52,372 55,163 56,557 60,676 63,455 3.91 IVA Calabarzon 78,966 81,562 84,657 86,654 92,285 3.17 IVB Mimaropa 37,283 38,239 38,141 40,706 39,495 1.16 V Bicol 20,979 22,502 24,014 24,720 25,648 4.10 VI Western Visayas 33,296 35,139 35,883 37,293 39,484 3.47 VII Central Visayas 52,192 56,061 59,200 62,795 64,858 4.44 VIII Eastern Visayas 36,784 33,850 35,002 33,771 33,547 -1.83 IX Zamboanga 33,489 37,077 38,001 39,887 41,683 4.48 X Northern Mindanao 50,506 52,842 54,721 57,613 60,178 3.57 XI Davao 49,112 51,657 54,196 58,275 61,197 4.50 XII SOCCSKSARGEN 37,533 39,417 41,835 43,498 44,202 3.32 XIII CARAGA 28,203 30,985 33,051 35,672 35,444 4.68 ARMM 14,271 14,052 14,388 14,611 13,588 -0.98
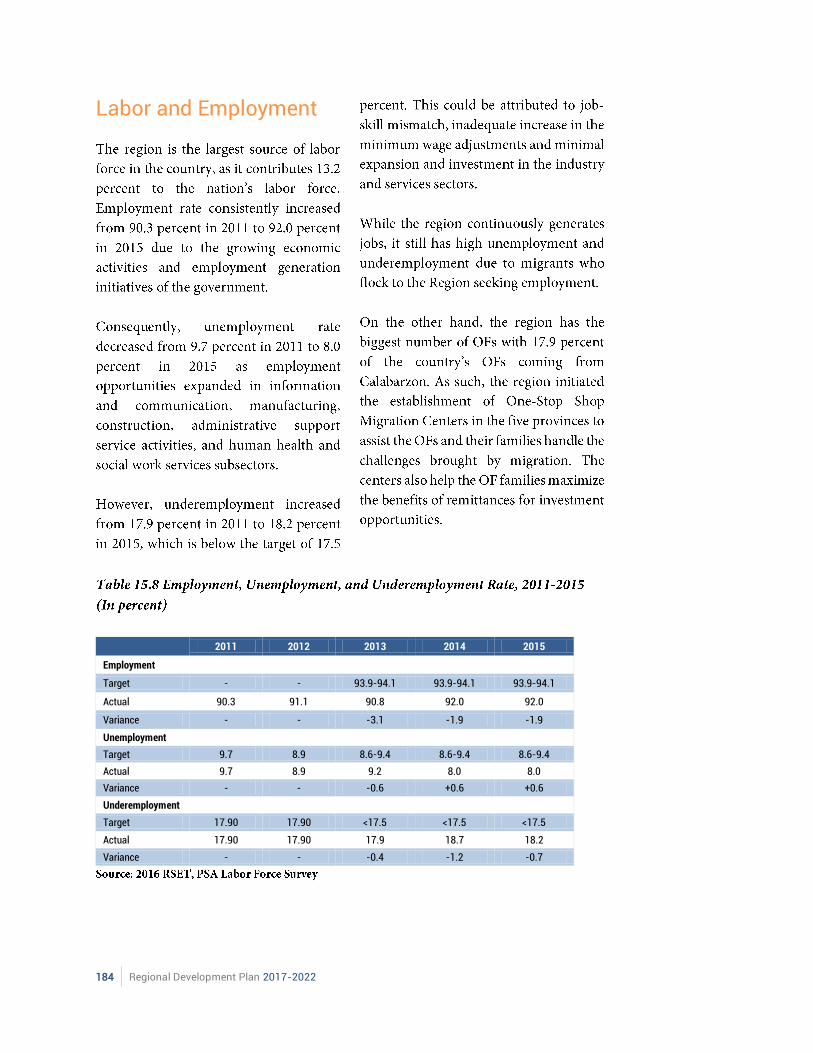
184 Regional Development Plan 2017-2022
Labor and Employment
2011 2012 2013 2014 2015
Employment
Target - - 93.9-94.1 93.9-94.1 93.9-94.1
Actual 90.3 91.1 90.8 92.0 92.0
Variance - - -3.1 -1.9 -1.9
Unemployment
Target 9.7 8.9 8.6-9.4 8.6-9.4 8.6-9.4
Actual 9.7 8.9 9.2 8.0 8.0
Variance - - -0.6 +0.6 +0.6
Underemployment
Target 17.90 17.90 <17.5 <17.5 <17.5
Actual 17.90 17.90 17.9 18.7 18.2
Variance - - -0.4 -1.2 -0.7
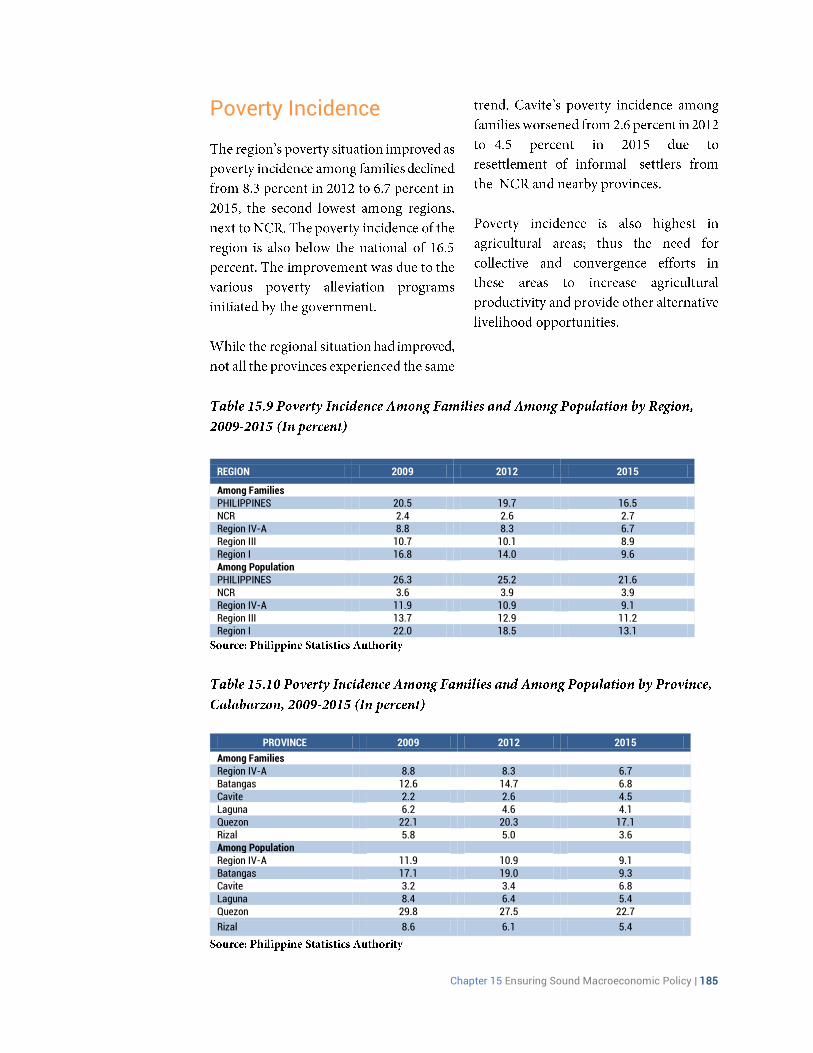
Chapter 15 Ensuring Sound Macroeconomic Policy | 185
Poverty Incidence
REGION 2009 2012 2015
Among Families PHILIPPINES 20.5 19.7 16.5 NCR 2.4 2.6 2.7 Region IV-A 8.8 8.3 6.7 Region III 10.7 10.1 8.9 Region I 16.8 14.0 9.6 Among Population PHILIPPINES 26.3 25.2 21.6 NCR 3.6 3.9 3.9 Region IV-A 11.9 10.9 9.1 Region III 13.7 12.9 11.2 Region I 22.0 18.5 13.1
PROVINCE 2009 2012 2015
Among Families Region IV-A 8.8 8.3 6.7 Batangas 12.6 14.7 6.8 Cavite 2.2 2.6 4.5 Laguna 6.2 4.6 4.1 Quezon 22.1 20.3 17.1 Rizal 5.8 5.0 3.6 Among Population Region IV-A 11.9 10.9 9.1 Batangas 17.1 19.0 9.3 Cavite 3.2 3.4 6.8 Laguna 8.4 6.4 5.4 Quezon 29.8 27.5 22.7
Rizal 8.6 6.1 5.4
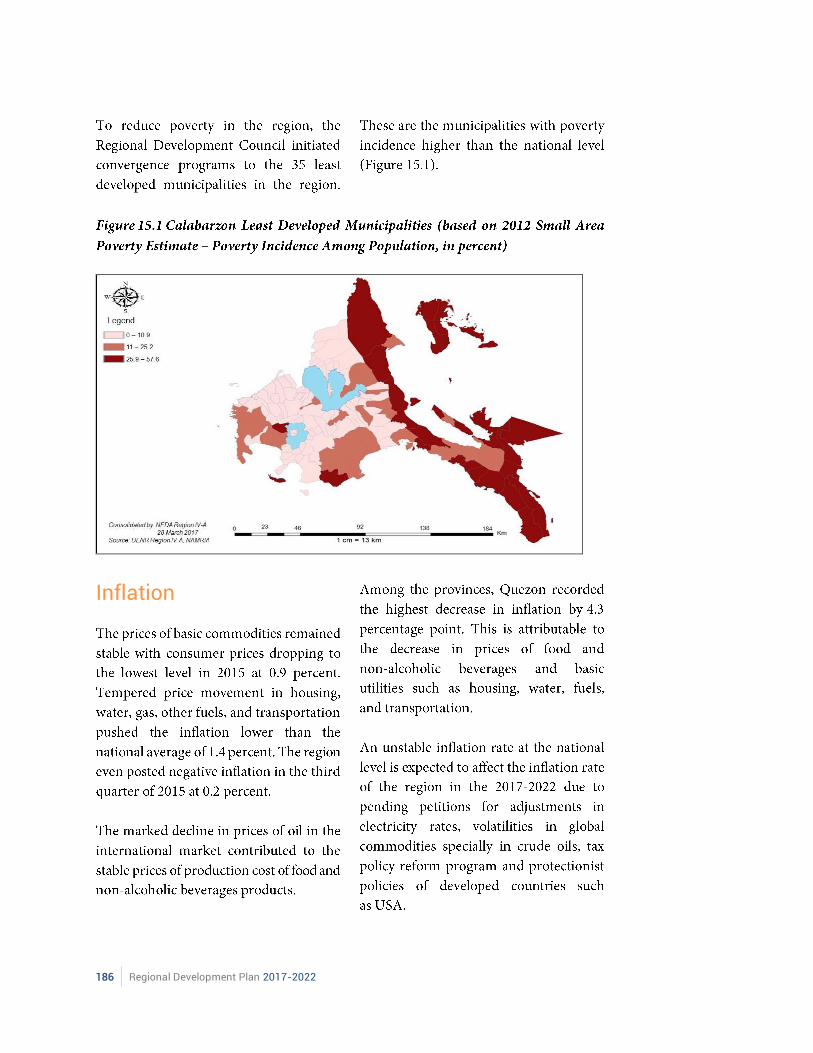
186 Regional Development Plan 2017-2022
Inflation
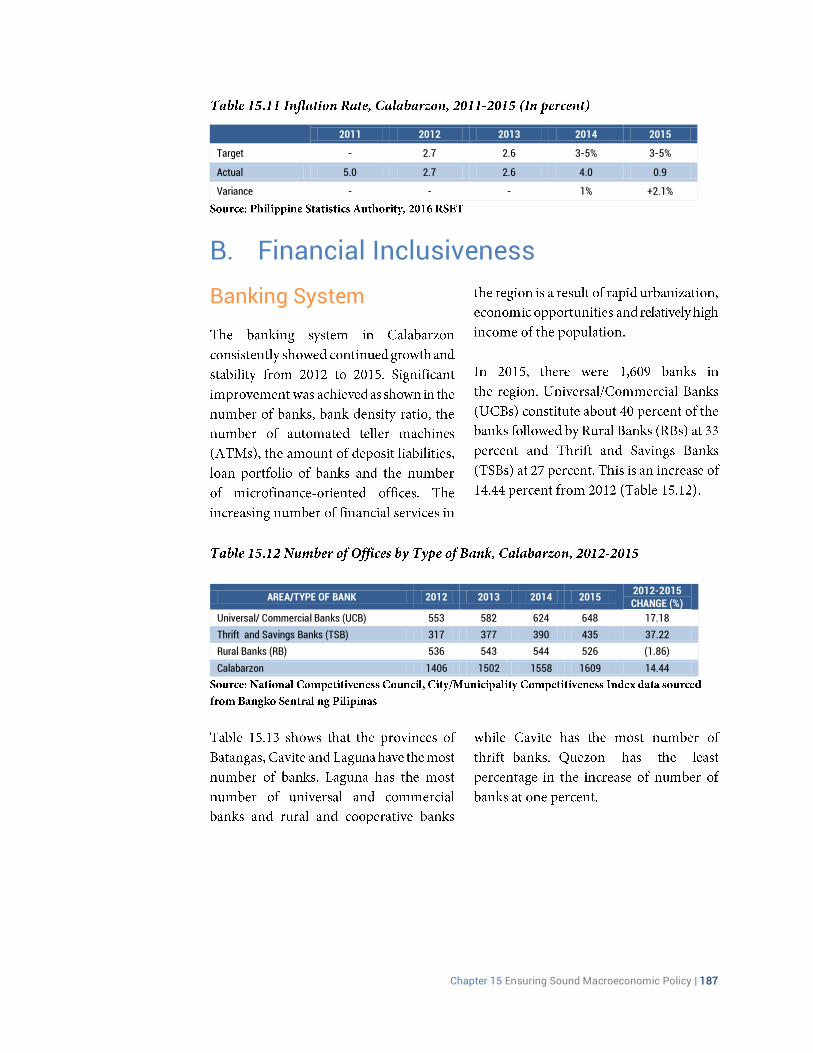
Chapter 15 Ensuring Sound Macroeconomic Policy | 187
B. Financial Inclusiveness
Banking System
AREA/TYPE OF BANK 2012 2013 2014 2015 2012-2015 CHANGE (%)
Universal/ Commercial Banks (UCB) 553 582 624 648 17.18
Thrift and Savings Banks (TSB) 317 377 390 435 37.22
Rural Banks (RB) 536 543 544 526 (1.86)
Calabarzon 1406 1502 1558 1609 14.44
2011 2012 2013 2014 2015
Target - 2.7 2.6 3-5% 3-5%
Actual 5.0 2.7 2.6 4.0 0.9
Variance - - - 1% +2.1%
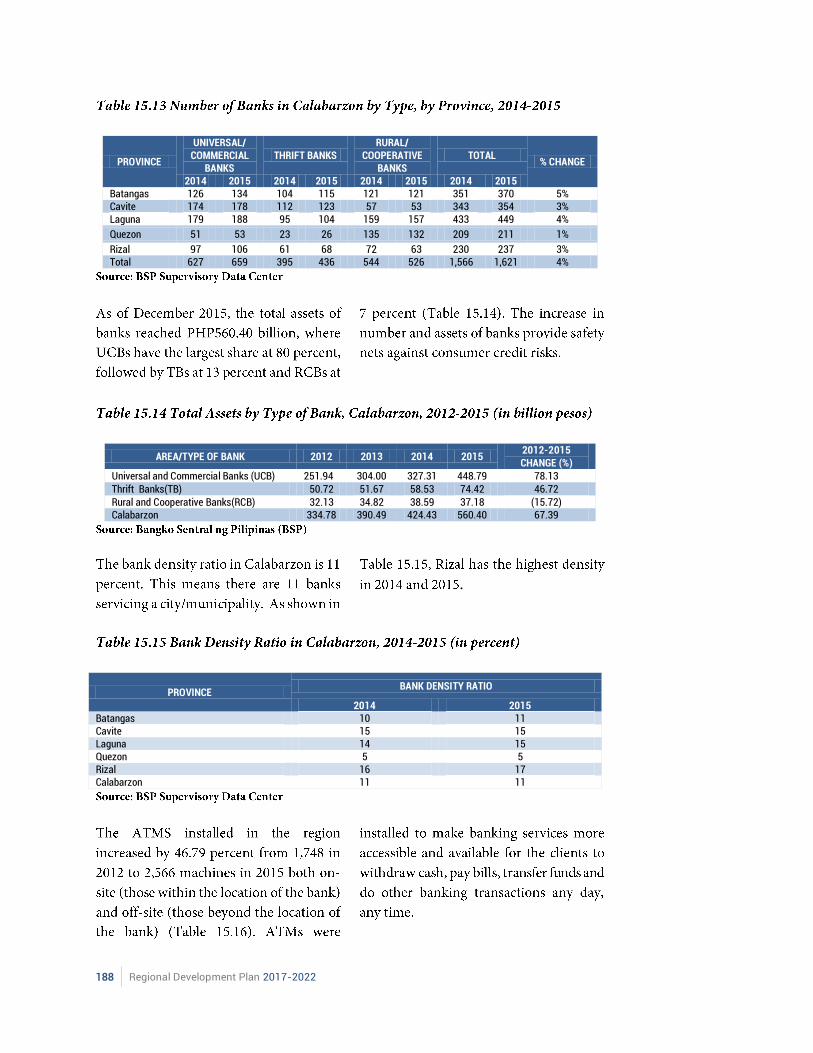
188 Regional Development Plan 2017-2022
PROVINCE
UNIVERSAL/ COMMERCIAL
BANKS THRIFT BANKS
RURAL/ COOPERATIVE
BANKS TOTAL
% CHANGE
2014 2015 2014 2015 2014 2015 2014 2015 Batangas 126 134 104 115 121 121 351 370 5% Cavite 174 178 112 123 57 53 343 354 3% Laguna 179 188 95 104 159 157 433 449 4%
Quezon 51 53 23 26 135 132 209 211 1%
Rizal 97 106 61 68 72 63 230 237 3% Total 627 659 395 436 544 526 1,566 1,621 4%
AREA/TYPE OF BANK 2012 2013 2014 2015 2012-2015 CHANGE (%)
Universal and Commercial Banks (UCB) 251.94 304.00 327.31 448.79 78.13 Thrift Banks(TB) 50.72 51.67 58.53 74.42 46.72 Rural and Cooperative Banks(RCB) 32.13 34.82 38.59 37.18 (15.72) Calabarzon 334.78 390.49 424.43 560.40 67.39
.
PROVINCE BANK DENSITY RATIO
2014 2015 Batangas 10 11 Cavite 15 15 Laguna 14 15 Quezon 5 5 Rizal 16 17 Calabarzon 11 11
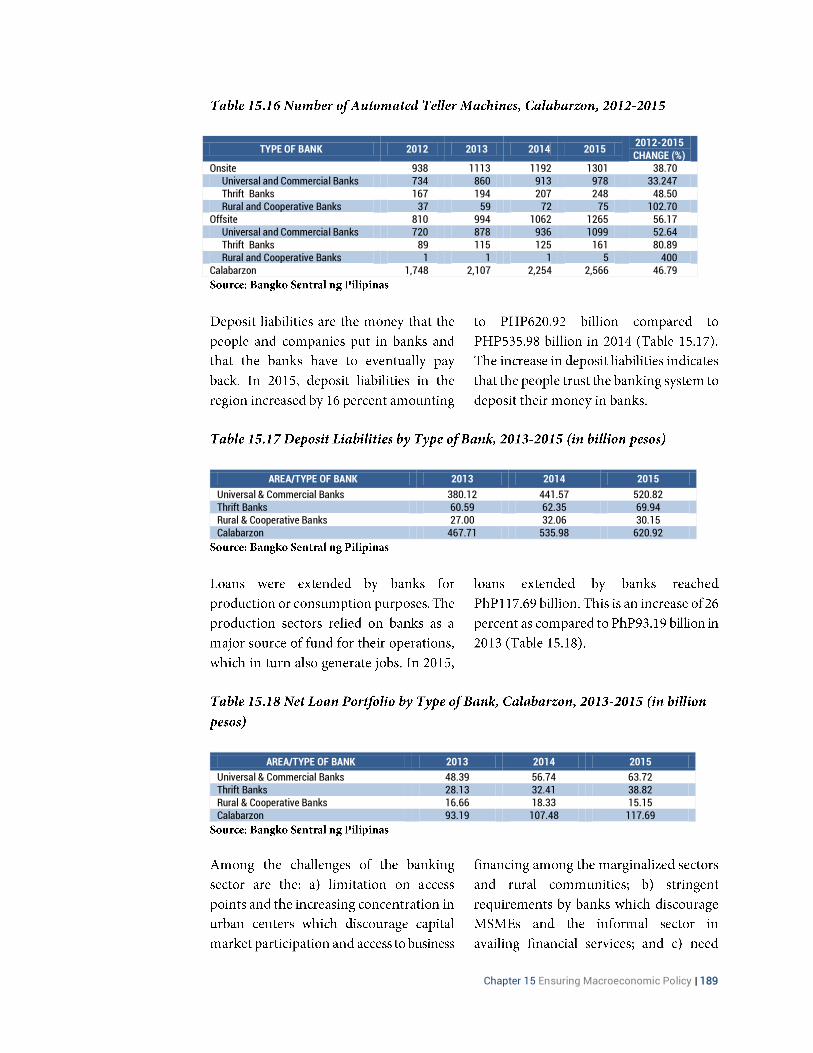
Chapter 15 Ensuring Macroeconomic Policy | 189
TYPE OF BANK 2012 2013 2014 2015 2012-2015 CHANGE (%)
Onsite 938 1113 1192 1301 38.70 Universal and Commercial Banks 734 860 913 978 33.247 Thrift Banks 167 194 207 248 48.50 Rural and Cooperative Banks 37 59 72 75 102.70
Offsite 810 994 1062 1265 56.17 Universal and Commercial Banks 720 878 936 1099 52.64 Thrift Banks 89 115 125 161 80.89 Rural and Cooperative Banks 1 1 1 5 400
Calabarzon 1,748 2,107 2,254 2,566 46.79
AREA/TYPE OF BANK 2013 2014 2015
Universal & Commercial Banks 380.12 441.57 520.82 Thrift Banks 60.59 62.35 69.94 Rural & Cooperative Banks 27.00 32.06 30.15 Calabarzon 467.71 535.98 620.92
AREA/TYPE OF BANK 2013 2014 2015
Universal & Commercial Banks 48.39 56.74 63.72 Thrift Banks 28.13 32.41 38.82 Rural & Cooperative Banks 16.66 18.33 15.15 Calabarzon 93.19 107.48 117.69
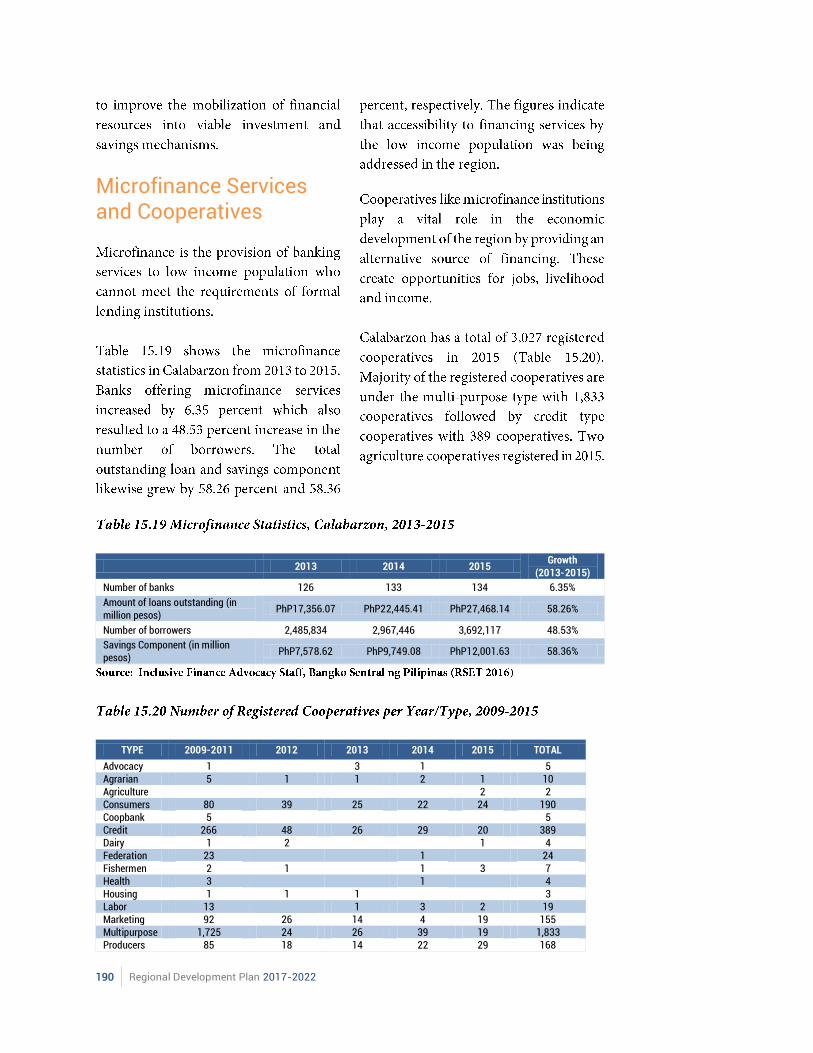
190 Regional Development Plan 2017-2022
Microfinance Services and Cooperatives
2013 2014 2015 Growth
(2013-2015)
Number of banks 126 133 134 6.35%
Amount of loans outstanding (in million pesos)
PhP17,356.07 PhP22,445.41 PhP27,468.14 58.26%
Number of borrowers 2,485,834 2,967,446 3,692,117 48.53%
Savings Component (in million pesos)
PhP7,578.62 PhP9,749.08 PhP12,001.63 58.36%
TYPE 2009-2011 2012 2013 2014 2015 TOTAL
Advocacy 1
3 1
5 Agrarian 5 1 1 2 1 10 Agriculture
2 2
Consumers 80 39 25 22 24 190 Coopbank 5
5
Credit 266 48 26 29 20 389 Dairy 1 2
1 4
Federation 23
1
24 Fishermen 2 1
1 3 7
Health 3
1
4 Housing 1 1 1
3
Labor 13
1 3 2 19 Marketing 92 26 14 4 19 155 Multipurpose 1,725 24 26 39 19 1,833 Producers 85 18 14 22 29 168
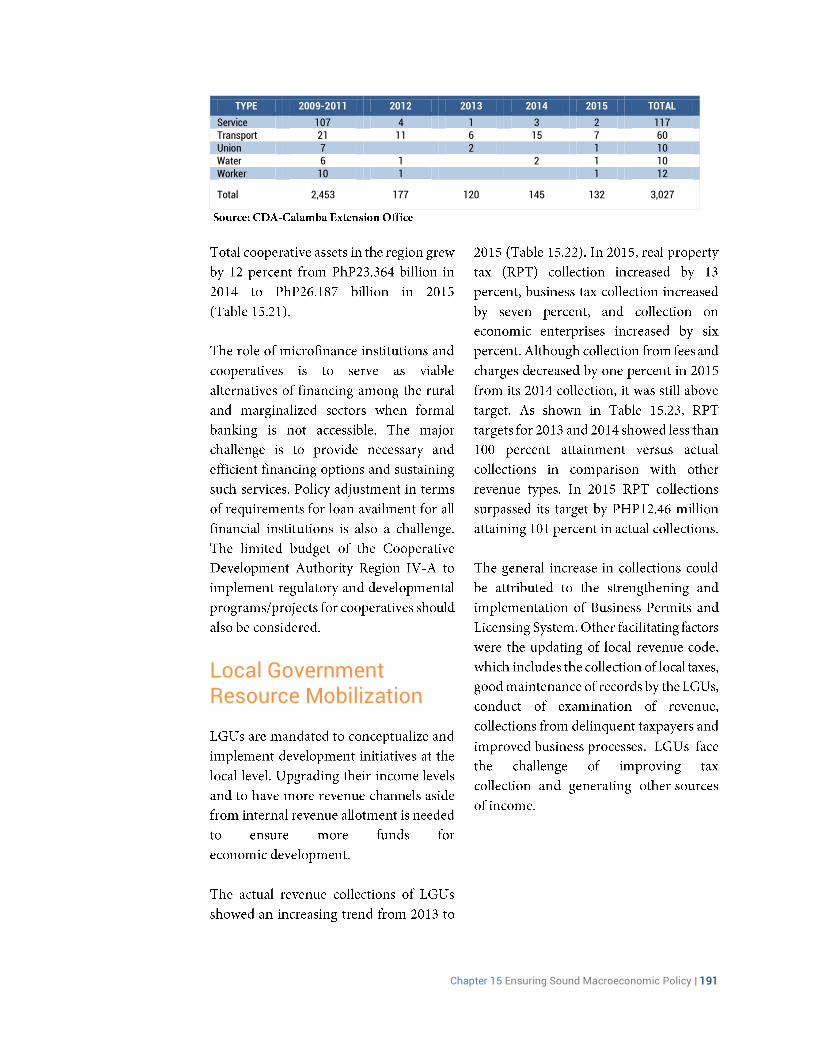
Chapter 15 Ensuring Sound Macroeconomic Policy | 191
TYPE 2009-2011 2012 2013 2014 2015 TOTAL
Service 107 4 1 3 2 117 Transport 21 11 6 15 7 60 Union 7
2
1 10
Water 6 1
2 1 10 Worker 10 1
1 12
Total 2,453 177 120 145 132 3,027
Local Government Resource Mobilization
.
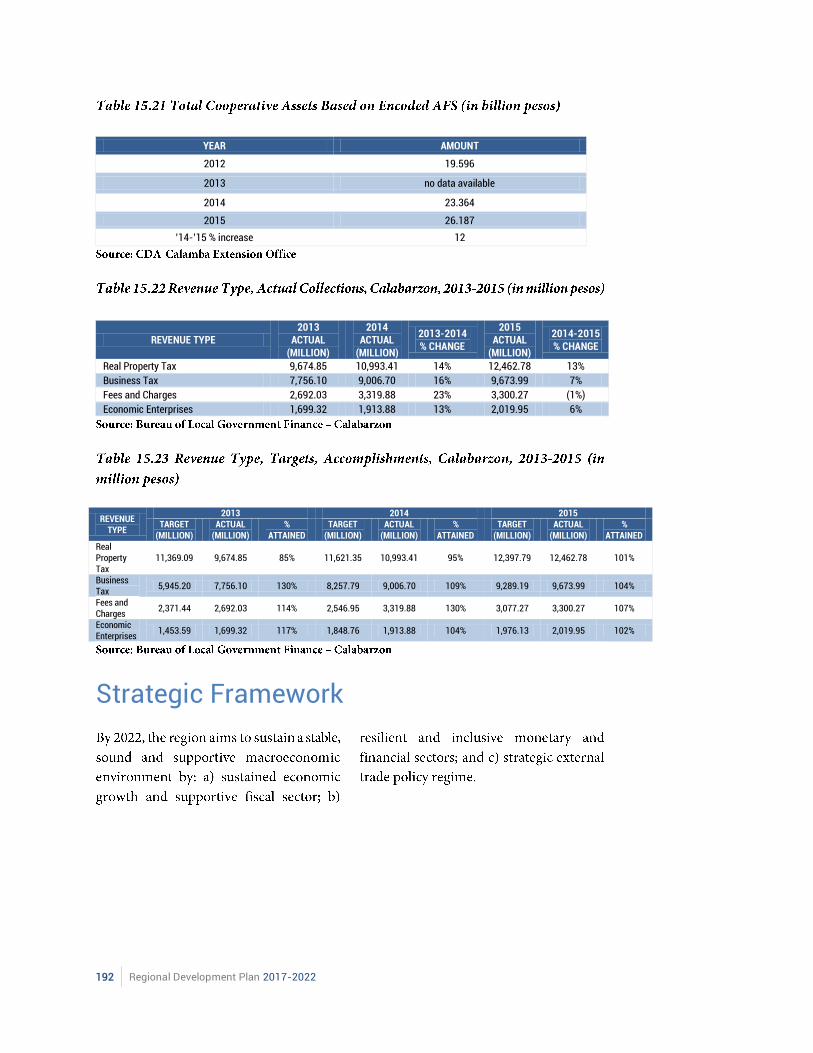
192 Regional Development Plan 2017-2022
YEAR AMOUNT
2012 19.596
2013 no data available
2014 23.364
2015 26.187
’14-’15 % increase 12
REVENUE TYPE 2013
ACTUAL (MILLION)
2014 ACTUAL
(MILLION)
2013-2014 % CHANGE
2015 ACTUAL
(MILLION)
2014-2015 % CHANGE
Real Property Tax 9,674.85 10,993.41 14% 12,462.78 13%
Business Tax 7,756.10 9,006.70 16% 9,673.99 7%
Fees and Charges 2,692.03 3,319.88 23% 3,300.27 (1%)
Economic Enterprises 1,699.32 1,913.88 13% 2,019.95 6%
REVENUE TYPE
2013 2014 2015 TARGET
(MILLION) ACTUAL
(MILLION) %
ATTAINED TARGET
(MILLION) ACTUAL
(MILLION) %
ATTAINED TARGET
(MILLION) ACTUAL
(MILLION) %
ATTAINED Real Property Tax
11,369.09 9,674.85 85% 11,621.35 10,993.41 95% 12,397.79 12,462.78 101%
Business Tax
5,945.20 7,756.10 130% 8,257.79 9,006.70 109% 9,289.19 9,673.99 104%
Fees and Charges
2,371.44 2,692.03 114% 2,546.95 3,319.88 130% 3,077.27 3,300.27 107%
Economic Enterprises
1,453.59 1,699.32 117% 1,848.76 1,913.88 104% 1,976.13 2,019.95 102%
Strategic Framework
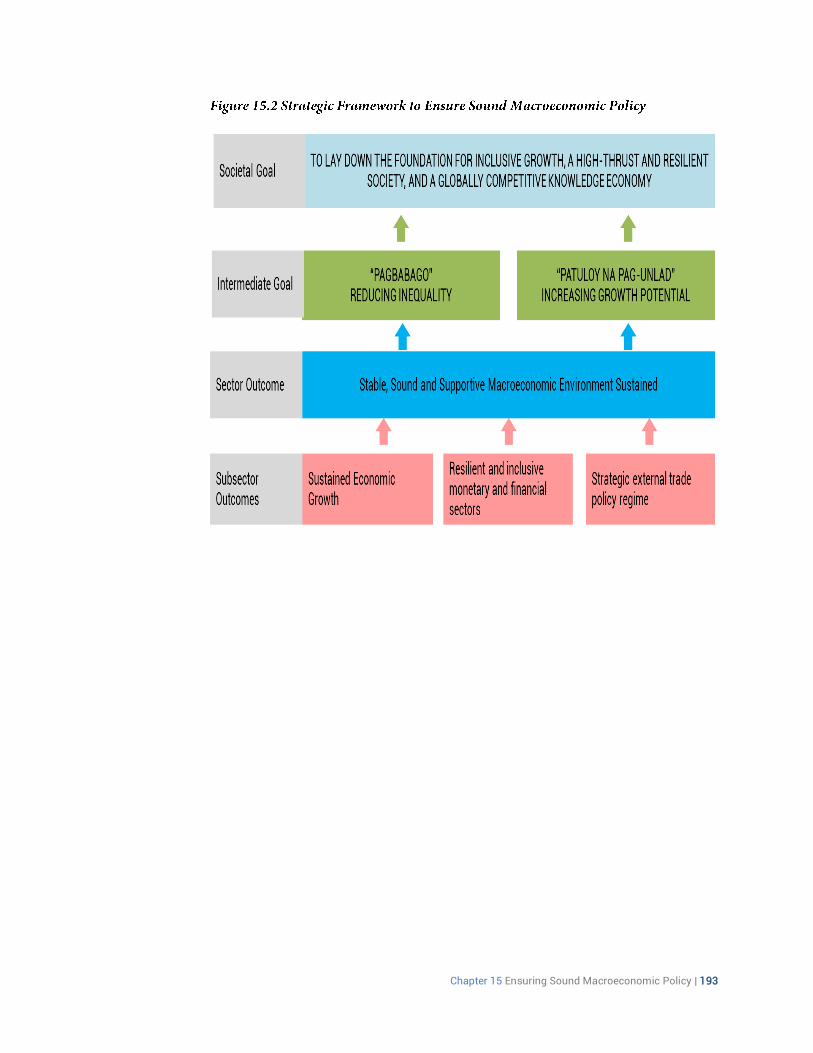
Chapter 15 Ensuring Sound Macroeconomic Policy | 193
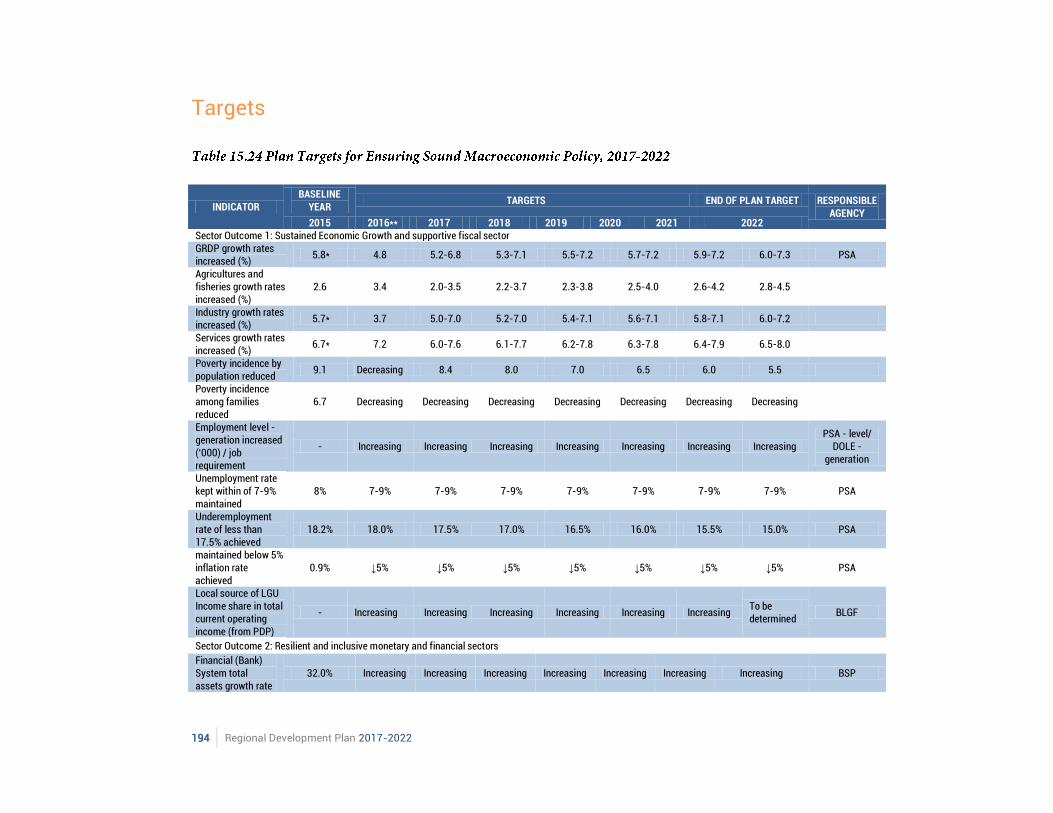
194 Regional Development Plan 2017-2022
Targets
INDICATOR BASELINE
YEAR TARGETS END OF PLAN TARGET RESPONSIBLE
AGENCY 2015 2016** 2017 2018 2019 2020 2021 2022
Sector Outcome 1: Sustained Economic Growth and supportive fiscal sector GRDP growth rates increased (%)
5.8* 4.8 5.2-6.8 5.3-7.1 5.5-7.2 5.7-7.2 5.9-7.2 6.0-7.3 PSA
Agricultures and fisheries growth rates increased (%)
2.6 3.4 2.0-3.5 2.2-3.7 2.3-3.8 2.5-4.0 2.6-4.2 2.8-4.5
Industry growth rates increased (%)
5.7* 3.7 5.0-7.0 5.2-7.0 5.4-7.1 5.6-7.1 5.8-7.1 6.0-7.2
Services growth rates increased (%)
6.7* 7.2 6.0-7.6 6.1-7.7 6.2-7.8 6.3-7.8 6.4-7.9 6.5-8.0
Poverty incidence by population reduced
9.1 Decreasing 8.4 8.0 7.0 6.5 6.0 5.5
Poverty incidence among families reduced
6.7 Decreasing Decreasing Decreasing Decreasing Decreasing Decreasing Decreasing
Employment level - generation increased (‘000) / job requirement
- Increasing Increasing Increasing Increasing Increasing Increasing Increasing
PSA - level/ DOLE -
generation
Unemployment rate kept within of 7-9% maintained
8% 7-9% 7-9% 7-9% 7-9% 7-9% 7-9% 7-9% PSA
Underemployment rate of less than 17.5% achieved
18.2% 18.0% 17.5% 17.0% 16.5% 16.0% 15.5% 15.0% PSA
maintained below 5% inflation rate achieved
0.9% ↓5% ↓5% ↓5% ↓5% ↓5% ↓5% ↓5% PSA
Local source of LGU Income share in total current operating income (from PDP)
- Increasing Increasing Increasing Increasing Increasing Increasing To be determined
BLGF
Sector Outcome 2: Resilient and inclusive monetary and financial sectors
Financial (Bank) System total assets growth rate
32.0% Increasing Increasing Increasing Increasing Increasing Increasing Increasing BSP
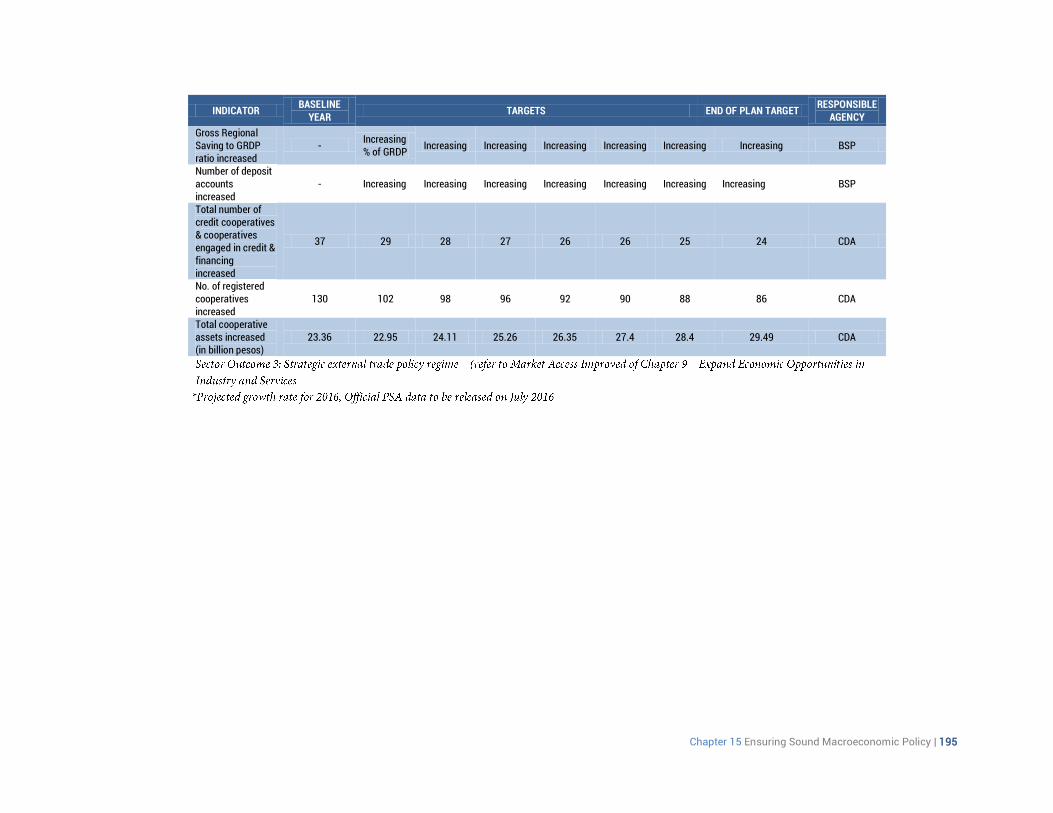
Chapter 15 Ensuring Sound Macroeconomic Policy | 195
INDICATOR BASELINE
YEAR TARGETS END OF PLAN TARGET
RESPONSIBLE AGENCY
Gross Regional Saving to GRDP ratio increased
- Increasing % of GRDP
Increasing Increasing Increasing Increasing Increasing Increasing BSP
Number of deposit accounts increased
- Increasing Increasing Increasing Increasing Increasing Increasing Increasing BSP
Total number of credit cooperatives & cooperatives engaged in credit & financing increased
37 29 28 27 26 26 25 24 CDA
No. of registered cooperatives increased
130 102 98 96 92 90 88 86 CDA
Total cooperative assets increased (in billion pesos)
23.36 22.95 24.11 25.26 26.35 27.4 28.4 29.49 CDA
196 Regional Development Plan 2017-2022
Strategies
Chapter 15 Ensuring Sound Macroeconomic Policy | 197
198 Regional Development Plan 2017-2022
Chapter 15 Ensuring Sound Macroeconomic Policy | 199
200 Regional Development Plan 2017-2022
Chapter 15 Ensuring Sound Macroeconomic Policy | 201

202 Regional Development Plan 2017-2022

Chapter 16 Leveling the Playing Field | 203

204 Regional Development Plan 2017-2022
Chapter 16 Leveling the Playing Field | 205
Chapter 16
Leveling the Playing Field The region, tagged as the industrial powerhouse of the country for having the highest industry output and the second biggest contributor to the national economy offers tremendous opportunities for development. However, its potential to be the leading economic growth area is hampered by the competitiveness of the firms and the various localities in the region as investment destinations. Thus, improving the investment climate in the region is a major strategy to attract new investors as well as to encourage business establishments to expand their businesses and for market to function and thereby contributing to the economic development of the region. An important step towards improving the investment climate of the region is by creating a level playing field. The region shall benefit from the enactment of Republic Act (RA) No. 10667 or the Philippine Competition Act (PCA) that provides for the formulation of a National Competition Policy (NCP) that aims to steer regulations and administrative procedures of government agencies toward promoting competition, as well as to strengthen the enforcement of anti-trust laws and effectively ensure competitive neutrality. Market competition drives firms to perform at their best by producing high quality goods and services at the lowest costs and cheapest price. It encourages entrepreneurial activity, entry of new firms and supports the growth of smaller companies besides larger market players. In the process, competition raises productivity, expands economic opportunities, increases real income, and improves overall welfare. Competition is socially beneficial and promotes inclusive economic growth and benefits the poor through job creation and lower prices of a wide range of high quality commodities. However, market failures such as imperfect information, poor regulation and anti-competitive practices of existing firms to control a dominant market share prevent markets from being competitive. Thus, a competition law and policy is a vital tool to ensure the existence of an enabling environment for a working market competition and to achieve competitiveness in a global and knowledge-intensive world economy. The essential components of the NCP include competitive neutrality, consumer protection, government regulations that do not impede competition, removal of structural barriers, and establishment of an institutional national and subnational mechanism to coordinate and oversee the implementation of the policy.
206 Regional Development Plan 2017-2022
Assessment and Challenges Competition Environment
Chapter 16 Leveling the Playing Field | 207
Market players in the Regional Economy
Strategic Framework
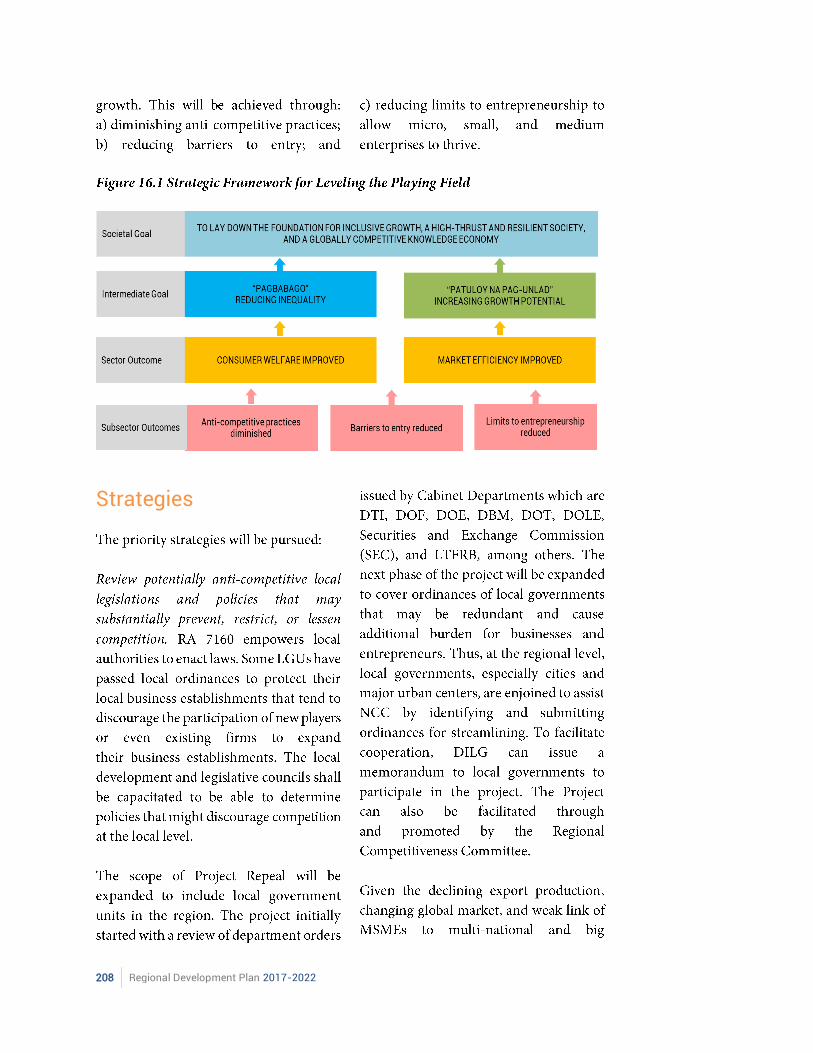
208 Regional Development Plan 2017-2022
Strategies
Chapter 16 Leveling the Playing Field | 209
210 Regional Development Plan 2017-2022
Chapter 17 Attaining Just and Lasting Peace | 211

212 Regional Development Plan 2017-2022

Chapter 17 Attaining Just and Lasting Peace | 213

214 Regional Development Plan 2017-2022
Chapter 17 Attaining Just and Lasting Peace | 215
Chapter 17
Attaining Just and Lasting Peace This chapter discusses the extent of the effect of internal conflict in the region. With the goal of attaining just and lasting peace, it outlines the factors that cause the existence of insurgency, as well as the strategies and interventions that promote peace and address root causes of these conflicts.
Assessment and Challenges
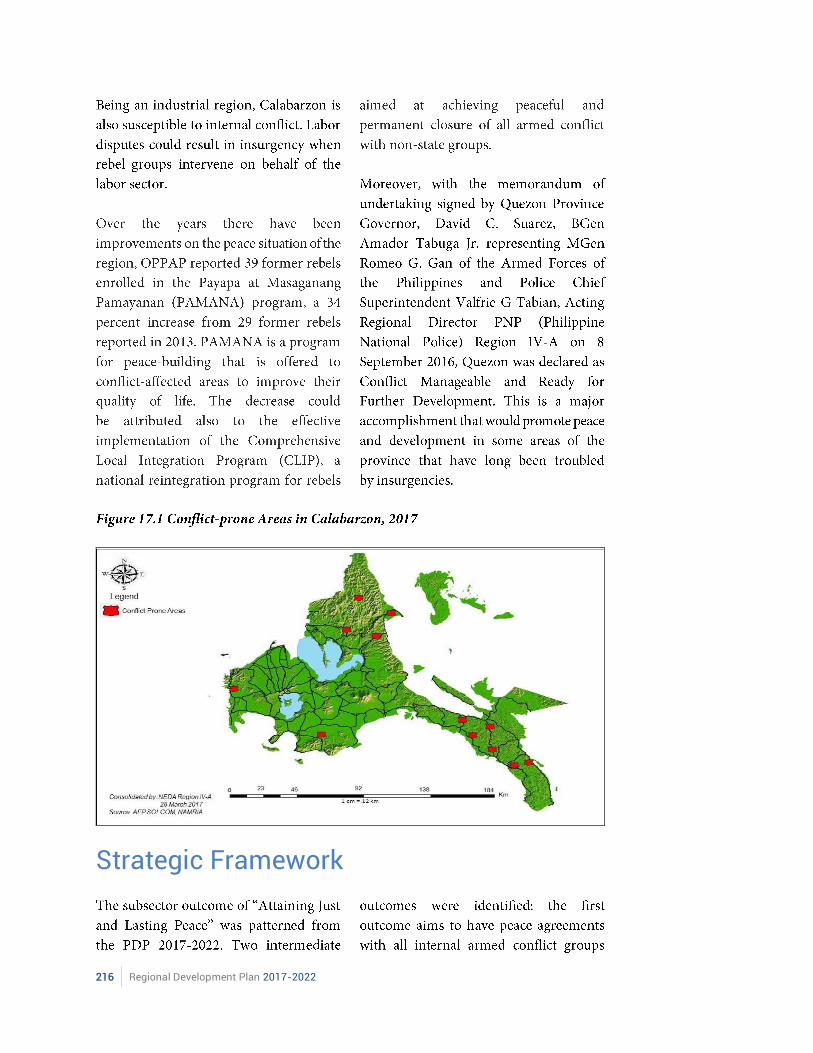
216 Regional Development Plan 2017-2022
Strategic Framework
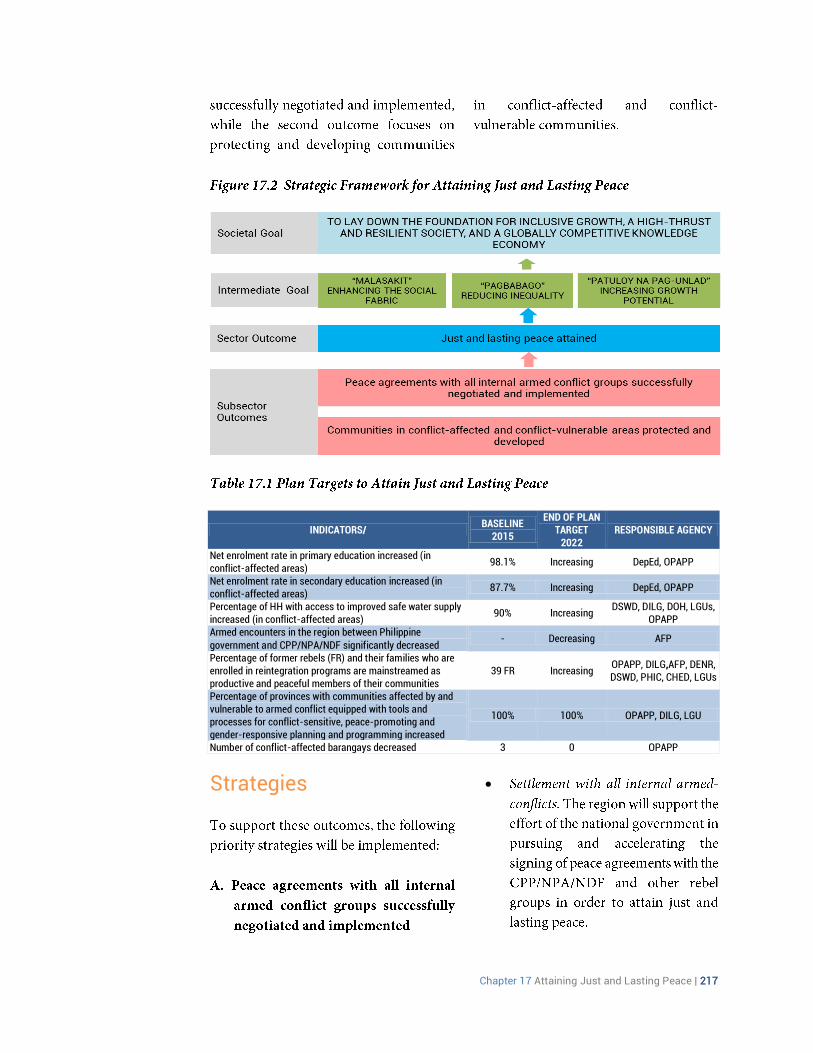
Chapter 17 Attaining Just and Lasting Peace | 217
INDICATORS/ BASELINE
2015
END OF PLAN TARGET
2022 RESPONSIBLE AGENCY
Net enrolment rate in primary education increased (in conflict-affected areas)
98.1% Increasing DepEd, OPAPP
Net enrolment rate in secondary education increased (in conflict-affected areas)
87.7% Increasing DepEd, OPAPP
Percentage of HH with access to improved safe water supply increased (in conflict-affected areas)
90% Increasing DSWD, DILG, DOH, LGUs,
OPAPP Armed encounters in the region between Philippine government and CPP/NPA/NDF significantly decreased
- Decreasing AFP
Percentage of former rebels (FR) and their families who are enrolled in reintegration programs are mainstreamed as productive and peaceful members of their communities
39 FR Increasing OPAPP, DILG,AFP, DENR, DSWD, PHIC, CHED, LGUs
Percentage of provinces with communities affected by and vulnerable to armed conflict equipped with tools and processes for conflict-sensitive, peace-promoting and gender-responsive planning and programming increased
100% 100% OPAPP, DILG, LGU
Number of conflict-affected barangays decreased 3 0 OPAPP
Strategies
218 Regional Development Plan 2017-2022
Major Programs and Projects
Chapter 18 Ensuring Regional Security, Public Order, and Safety | 219

220 Regional Development Plan 2017-2022
Chapter 18 Ensuring Regional Security, Public Order, and Safety | 221
Chapter 18
Ensuring Regional Security, Public Order, and Safety This chapter assesses the security, public order and safety situation of the region. It provides strategies and interventions to ensure a desirable environment conducive to regional and national development.
Assessment and Challenges
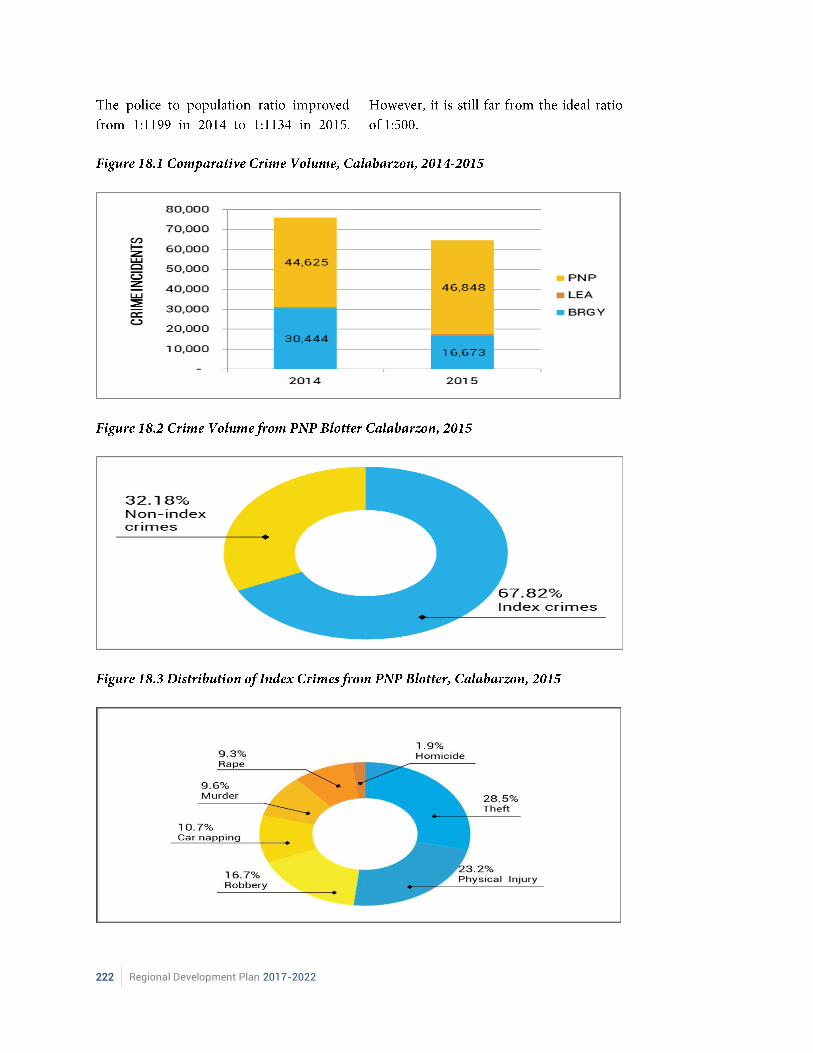
222 Regional Development Plan 2017-2022
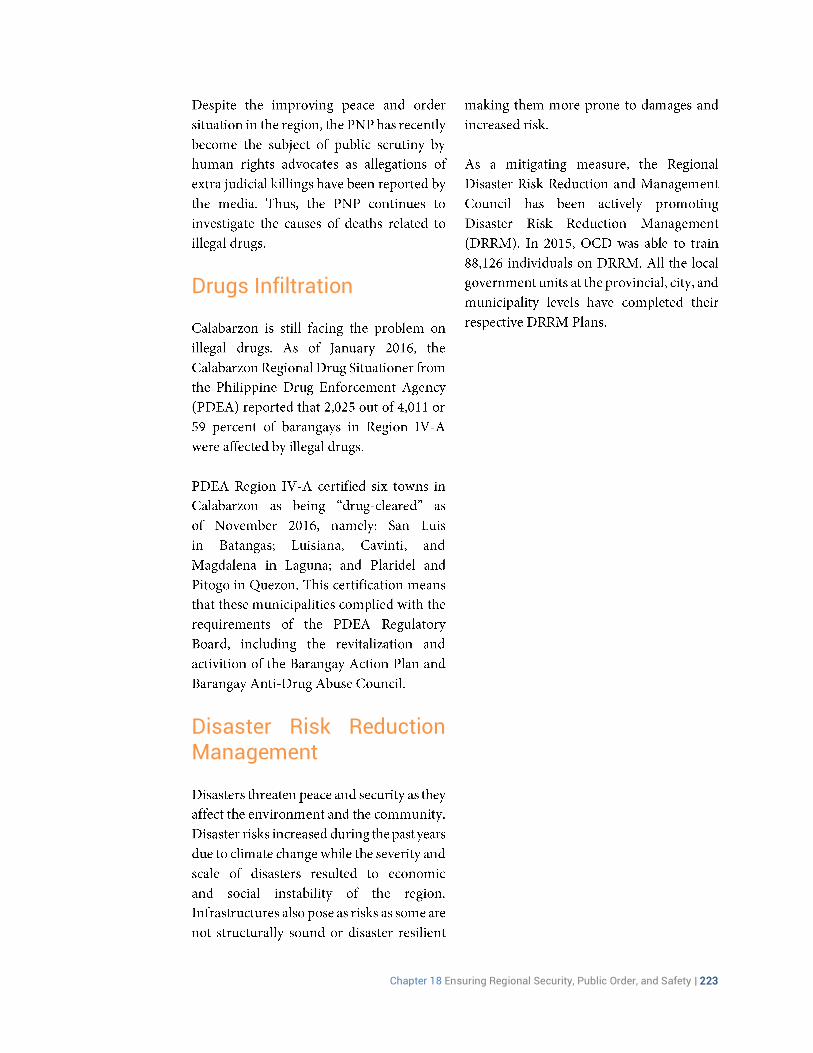
Chapter 18 Ensuring Regional Security, Public Order, and Safety | 223
Drugs Infiltration
Disaster Risk Reduction Management
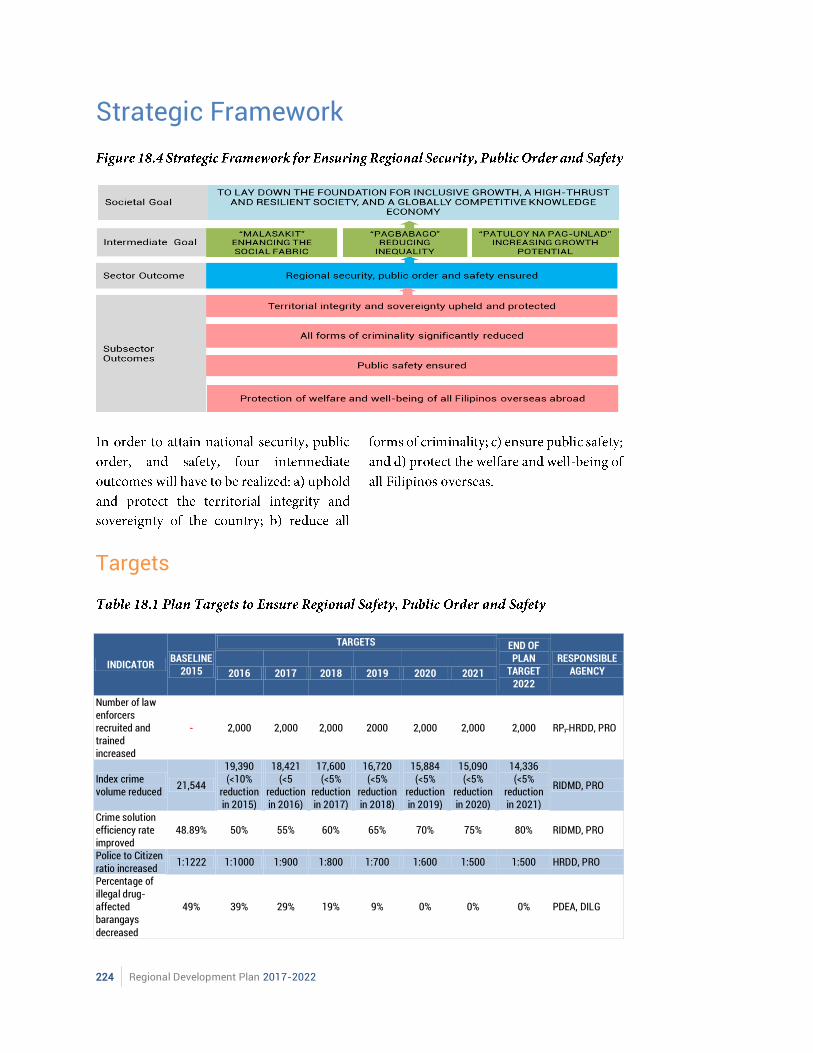
224 Regional Development Plan 2017-2022
Strategic Framework
Targets
INDICATOR BASELINE
2015
TARGETS END OF PLAN
TARGET 2022
RESPONSIBLE AGENCY 2016 2017 2018 2019 2020 2021
Number of law enforcers recruited and trained increased
- 2,000 2,000 2,000 2000 2,000 2,000 2,000 RP, HRDD, PRO
Index crime volume reduced
21,544
19,390 (<10%
reduction in 2015)
18,421 (<5
reduction in 2016)
17,600 (<5%
reduction in 2017)
16,720 (<5%
reduction in 2018)
15,884 (<5%
reduction in 2019)
15,090 (<5%
reduction in 2020)
14,336 (<5%
reduction in 2021)
RIDMD, PRO
Crime solution efficiency rate improved
48.89% 50% 55% 60% 65% 70% 75% 80% RIDMD, PRO
Police to Citizen ratio increased
1:1222 1:1000 1:900 1:800 1:700 1:600 1:500 1:500 HRDD, PRO
Percentage of illegal drug-affected barangays decreased
49% 39% 29% 19% 9% 0% 0% 0% PDEA, DILG
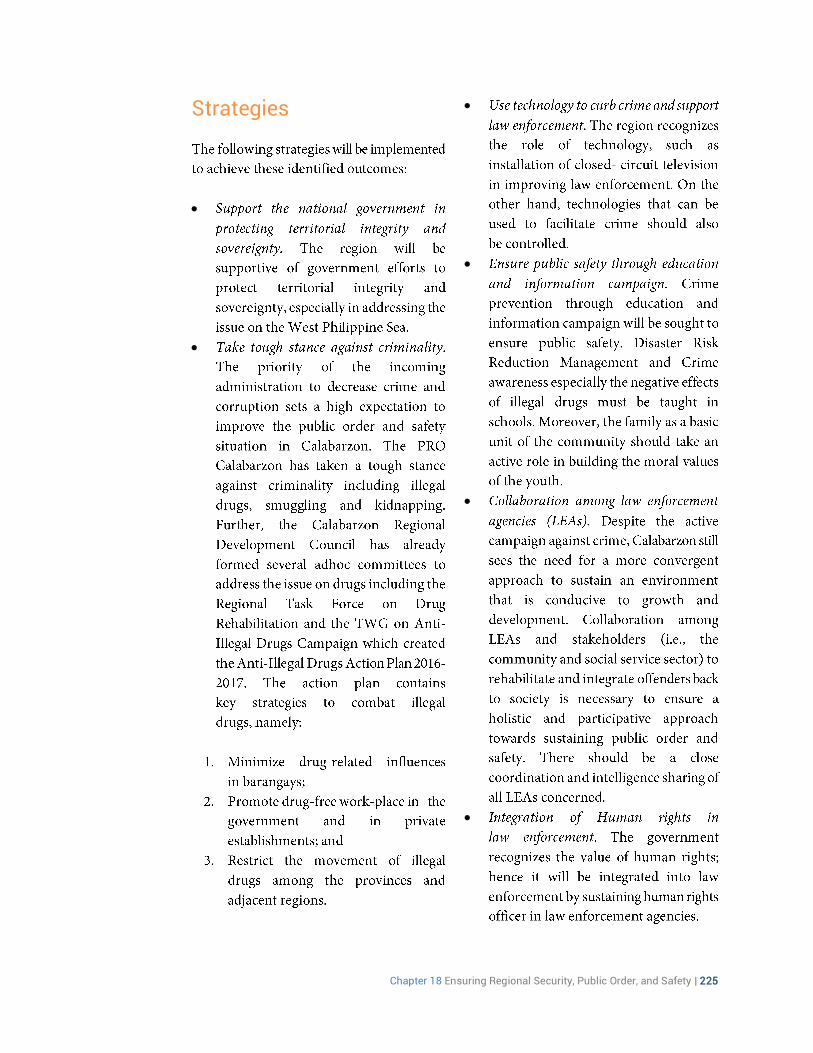
Chapter 18 Ensuring Regional Security, Public Order, and Safety | 225
Strategies
226 Regional Development Plan 2017-2022
Major Programs and Projects
Chapter 19 Accelerating Infrastructure Development | 227

228 Regional Development Plan 2017-2022
Chapter 19 Accelerating Infrastructure Development | 229
Chapter 19
Accelerating Infrastructure Development In order to achieve the national goal of inclusive growth, accelerated and strategic infrastructure development will be pursued. The region will implement infrastructure projects in transportation, flood control, water resources, power and energy, social welfare, and information and communication technology. These infrastructures aim to support tourism, agricultural productivity, safe environment, electrification, and mobility of people, goods and services.
Assessment and Challenges
Land Transport
Roads and Bridges

230 Regional Development Plan 2017-2022
PROVINCE PAVED (KM) UNPAVED (KM) TOTAL LENGTH (KM)
Batangas 556.39 556.39 Cavite 438.84 438.84 Laguna 349.49 349.49 Quezon 825.555 105.23 930.785 Rizal 232.257 232.257 Calabarzon 2,402.53 2,507.76
CONDITION LENGTH (IN KM)
Good 1,072.05 km (42.75%)
Fair 772.897 km (13.17%)
Poor 330.160 km (13.17%)
Bad 131.179 km (5.23%)
No assessment 201.473 km (8.03%)
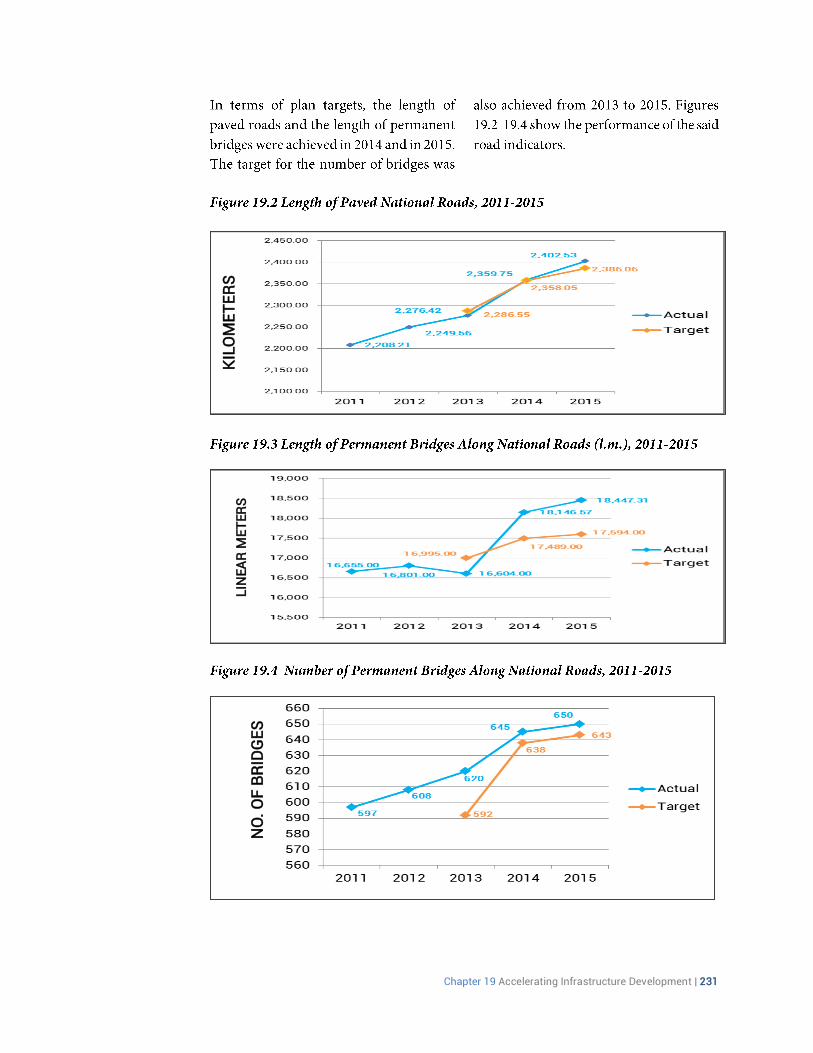
Chapter 19 Accelerating Infrastructure Development | 231
NO
. O
F B
RID
GE
S
LIN
EA
R M
ET
ER
S
KIL
OM
ET
ER
S
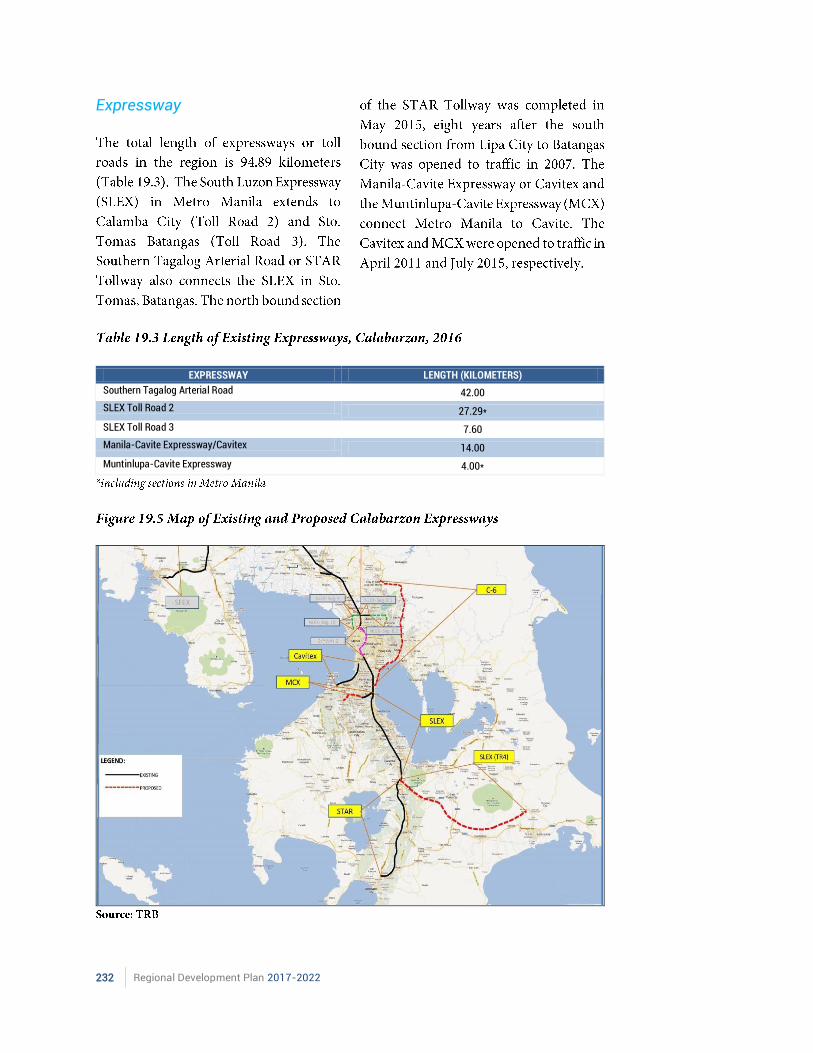
232 Regional Development Plan 2017-2022
Expressway
EXPRESSWAY LENGTH (KILOMETERS)
Southern Tagalog Arterial Road 42.00
SLEX Toll Road 2 27.29*
SLEX Toll Road 3 7.60
Manila-Cavite Expressway/Cavitex 14.00
Muntinlupa-Cavite Expressway 4.00*
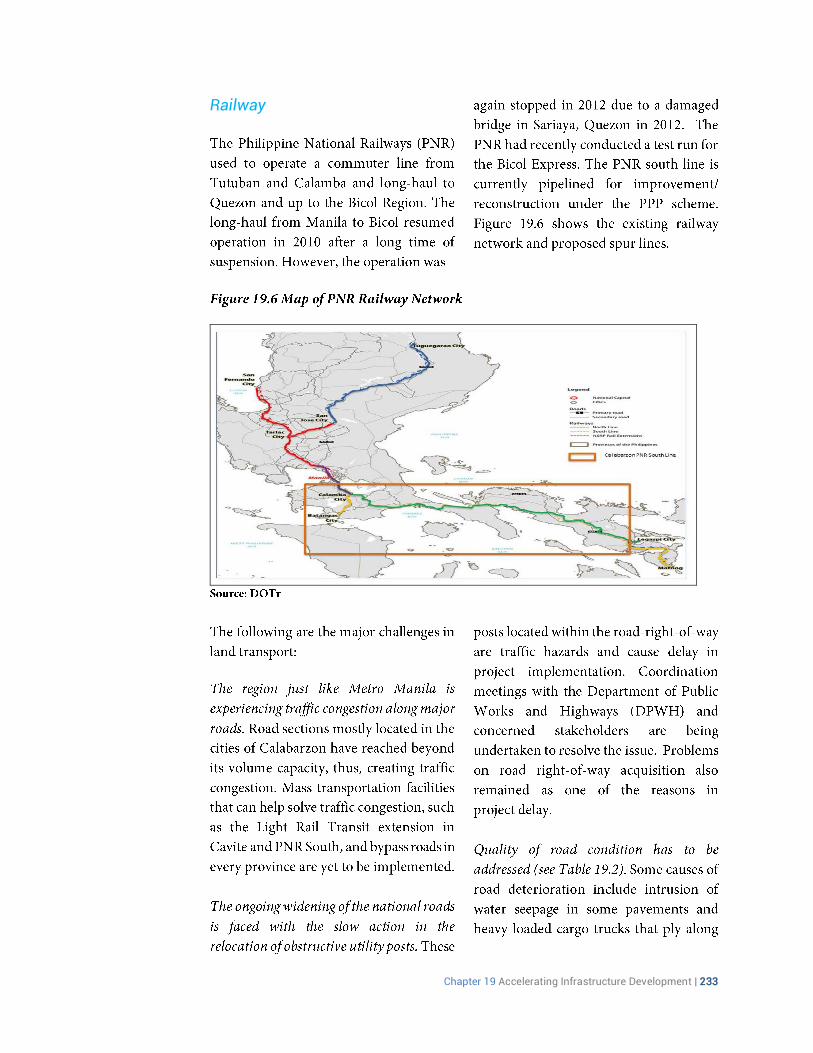
Chapter 19 Accelerating Infrastructure Development | 233
Railway
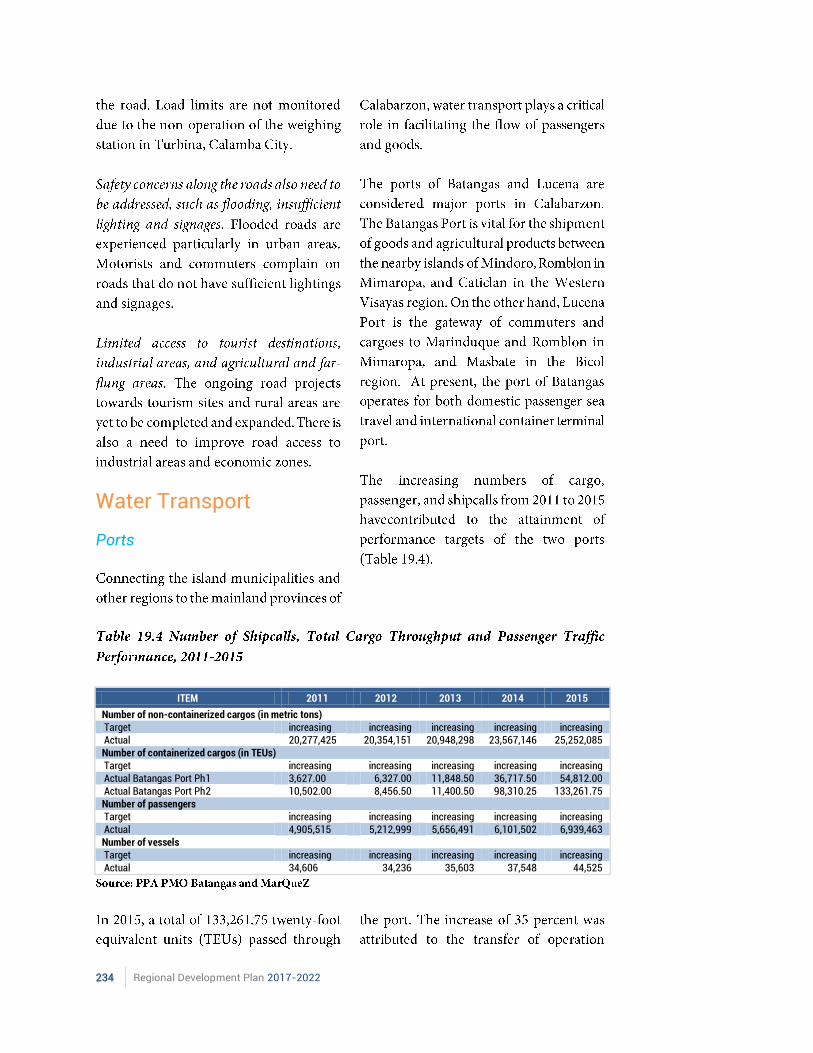
234 Regional Development Plan 2017-2022
Water Transport
Ports
ITEM 2011 2012 2013 2014 2015
Number of non-containerized cargos (in metric tons) Target increasing increasing increasing increasing increasing Actual 20,277,425 20,354,151 20,948,298 23,567,146 25,252,085 Number of containerized cargos (in TEUs) Target increasing increasing increasing increasing increasing Actual Batangas Port Ph1 3,627.00 6,327.00 11,848.50 36,717.50 54,812.00 Actual Batangas Port Ph2 10,502.00 8,456.50 11,400.50 98,310.25 133,261.75 Number of passengers Target increasing increasing increasing increasing increasing Actual 4,905,515 5,212,999 5,656,491 6,101,502 6,939,463 Number of vessels Target increasing increasing increasing increasing increasing Actual 34,606 34,236 35,603 37,548 44,525
Chapter 19 Accelerating Infrastructure Development | 235
Water Resources
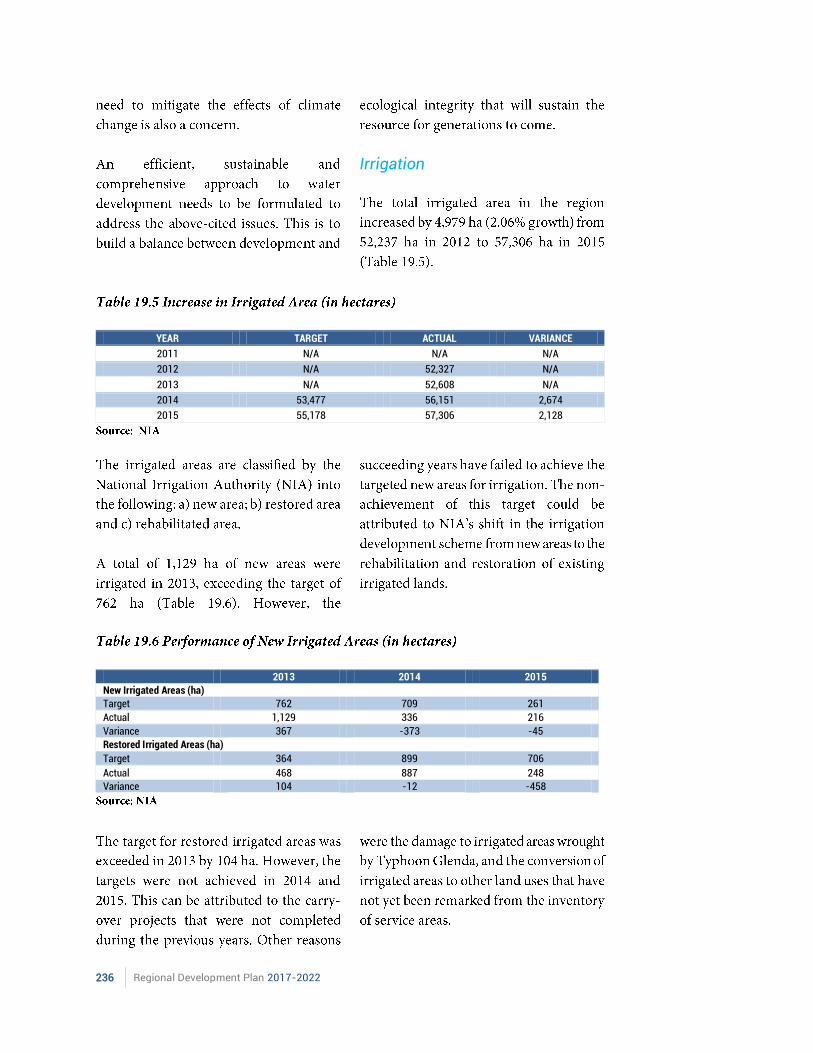
236 Regional Development Plan 2017-2022
Irrigation
YEAR TARGET ACTUAL VARIANCE
2011 N/A N/A N/A
2012 N/A 52,327 N/A
2013 N/A 52,608 N/A
2014 53,477 56,151 2,674
2015 55,178 57,306 2,128
2013 2014 2015
New Irrigated Areas (ha)
Target 762 709 261
Actual 1,129 336 216
Variance 367 -373 -45
Restored Irrigated Areas (ha)
Target 364 899 706
Actual 468 887 248
Variance 104 -12 -458
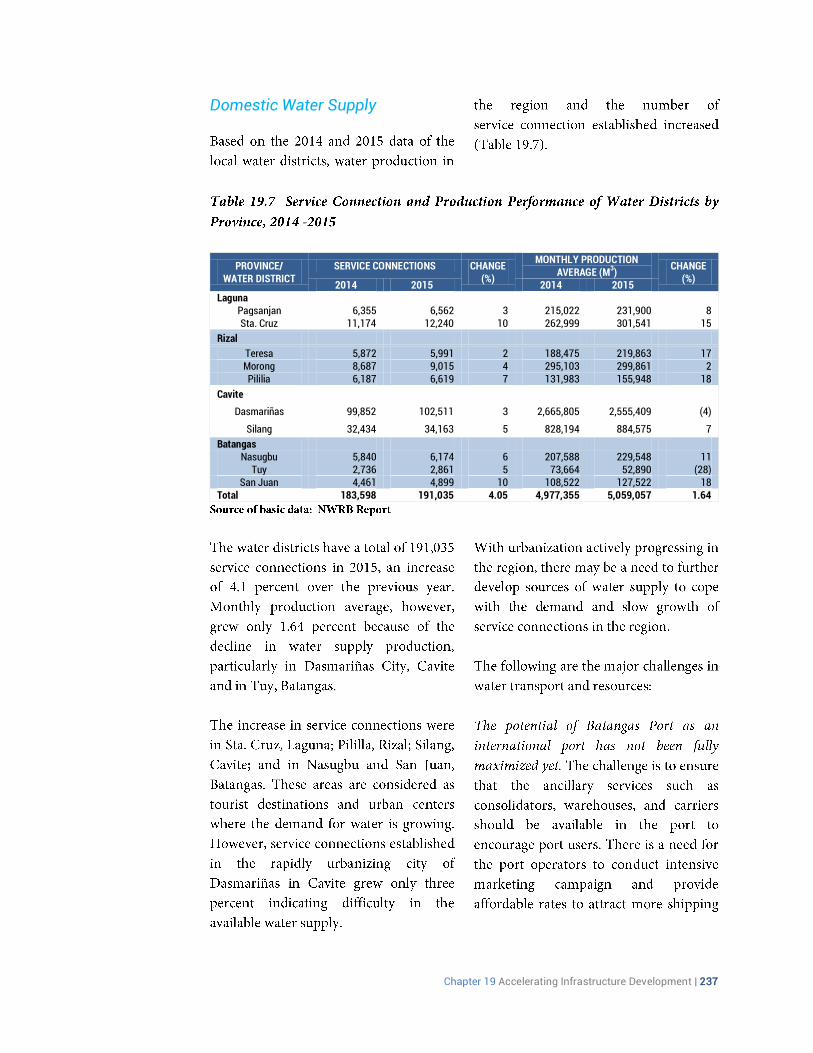
Chapter 19 Accelerating Infrastructure Development | 237
Domestic Water Supply
PROVINCE/ WATER DISTRICT
SERVICE CONNECTIONS CHANGE (%)
MONTHLY PRODUCTION AVERAGE (M
3)
CHANGE (%)
2014 2015 2014 2015 Laguna
Pagsanjan 6,355 6,562 3 215,022 231,900 8 Sta. Cruz 11,174 12,240 10 262,999 301,541 15
Rizal
Teresa 5,872 5,991 2 188,475 219,863 17 Morong 8,687 9,015 4 295,103 299,861 2 Pililia 6,187 6,619 7 131,983 155,948 18
Cavite
Dasmariñas 99,852 102,511 3 2,665,805 2,555,409 (4)
Silang 32,434 34,163 5 828,194 884,575 7
Batangas Nasugbu 5,840 6,174 6 207,588 229,548 11
Tuy 2,736 2,861 5 73,664 52,890 (28) San Juan 4,461 4,899 10 108,522 127,522 18
Total 183,598 191,035 4.05 4,977,355 5,059,057 1.64
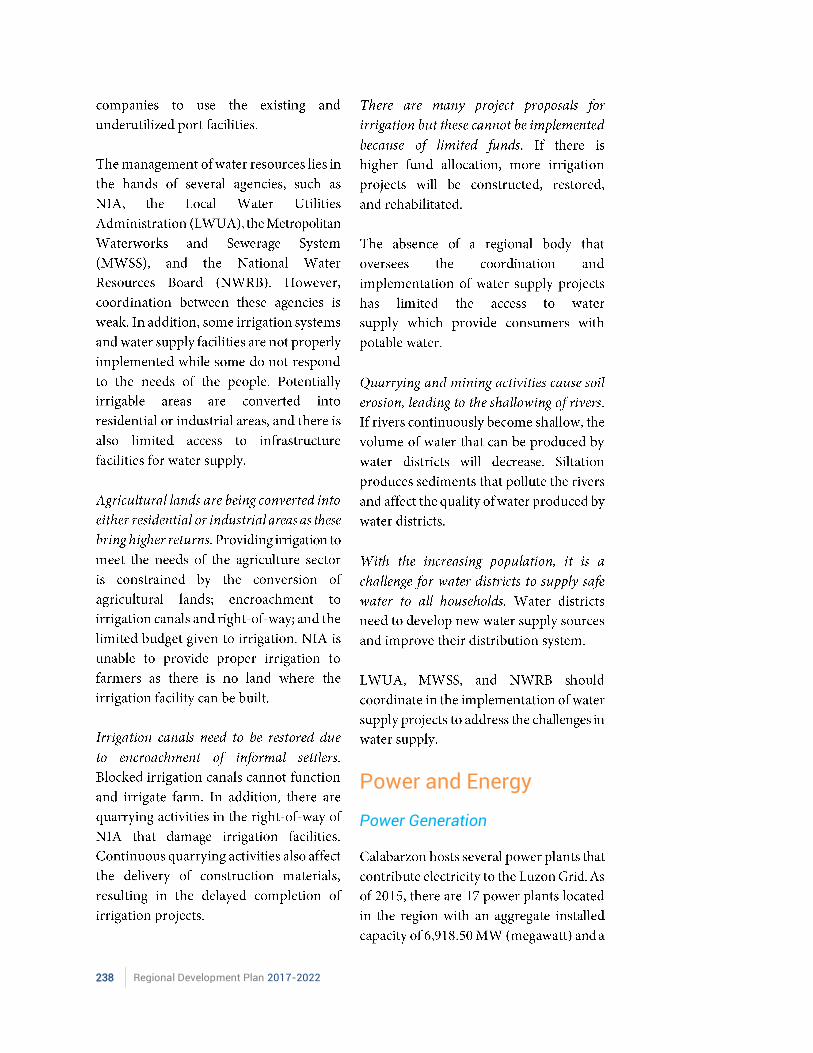
238 Regional Development Plan 2017-2022
Power and Energy
Power Generation
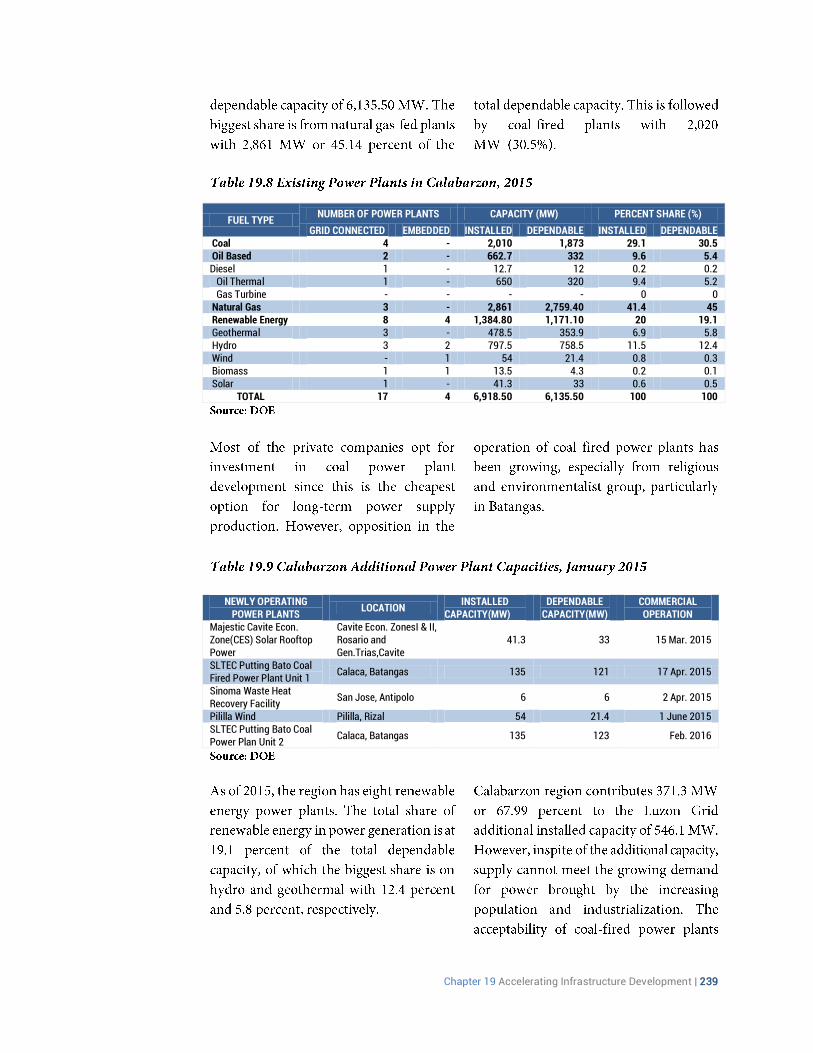
Chapter 19 Accelerating Infrastructure Development | 239
FUEL TYPE
NUMBER OF POWER PLANTS CAPACITY (MW) PERCENT SHARE (%)
GRID CONNECTED EMBEDDED INSTALLED DEPENDABLE INSTALLED DEPENDABLE Coal 4 - 2,010 1,873 29.1 30.5 Oil Based 2 - 662.7 332 9.6 5.4 Diesel 1 - 12.7 12 0.2 0.2 Oil Thermal 1 - 650 320 9.4 5.2 Gas Turbine - - - - 0 0 Natural Gas 3 - 2,861 2,759.40 41.4 45 Renewable Energy 8 4 1,384.80 1,171.10 20 19.1 Geothermal 3 - 478.5 353.9 6.9 5.8 Hydro 3 2 797.5 758.5 11.5 12.4 Wind - 1 54 21.4 0.8 0.3 Biomass 1 1 13.5 4.3 0.2 0.1 Solar 1 - 41.3 33 0.6 0.5
TOTAL 17 4 6,918.50 6,135.50 100 100
NEWLY OPERATING
POWER PLANTS LOCATION
INSTALLED CAPACITY(MW)
DEPENDABLE CAPACITY(MW)
COMMERCIAL OPERATION
Majestic Cavite Econ. Zone(CES) Solar Rooftop Power
Cavite Econ. ZonesI & II, Rosario and Gen.Trias,Cavite
41.3 33 15 Mar. 2015
SLTEC Putting Bato Coal Fired Power Plant Unit 1
Calaca, Batangas 135 121 17 Apr. 2015
Sinoma Waste Heat Recovery Facility
San Jose, Antipolo 6 6 2 Apr. 2015
Pililla Wind Pililla, Rizal 54 21.4 1 June 2015 SLTEC Putting Bato Coal Power Plan Unit 2
Calaca, Batangas 135 123 Feb. 2016
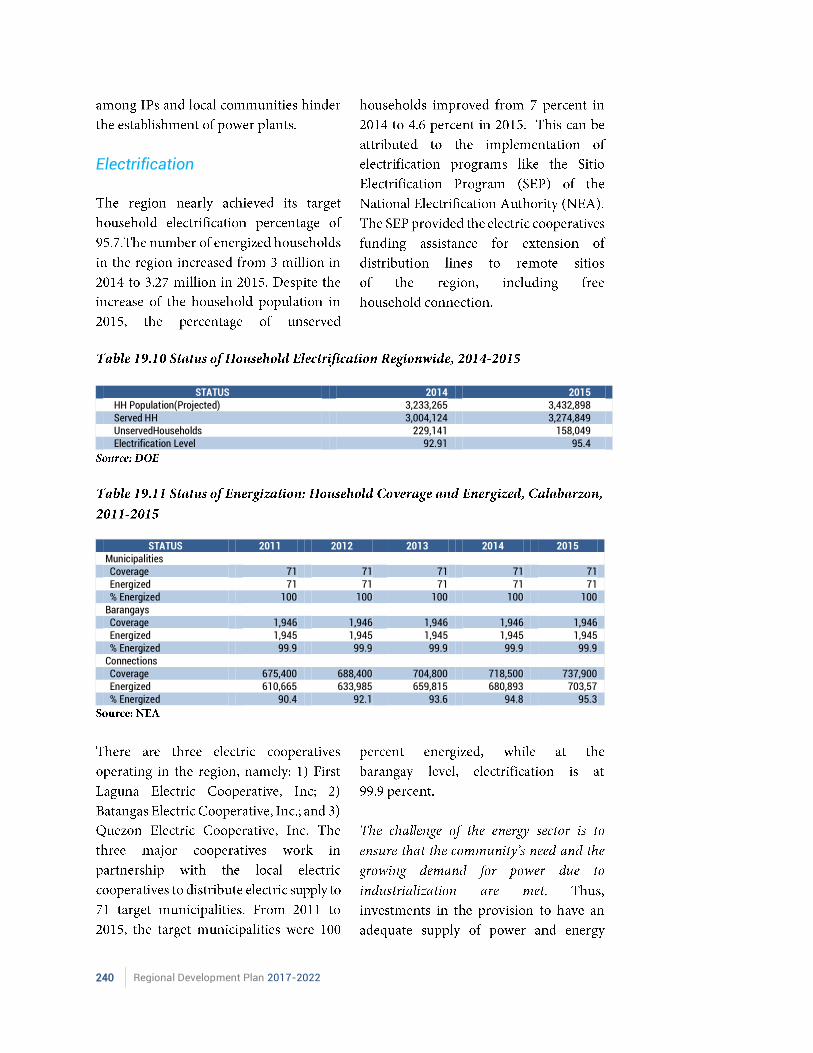
240 Regional Development Plan 2017-2022
Electrification
STATUS 2014 2015 HH Population(Projected) 3,233,265 3,432,898 Served HH 3,004,124 3,274,849 UnservedHouseholds 229,141 158,049 Electrification Level 92.91 95.4
STATUS 2011 2012 2013 2014 2015
Municipalities Coverage 71 71 71 71 71 Energized 71 71 71 71 71 % Energized 100 100 100 100 100 Barangays Coverage 1,946 1,946 1,946 1,946 1,946 Energized 1,945 1,945 1,945 1,945 1,945 % Energized 99.9 99.9 99.9 99.9 99.9 Connections Coverage 675,400 688,400 704,800 718,500 737,900 Energized 610,665 633,985 659,815 680,893 703,57 % Energized 90.4 92.1 93.6 94.8 95.3
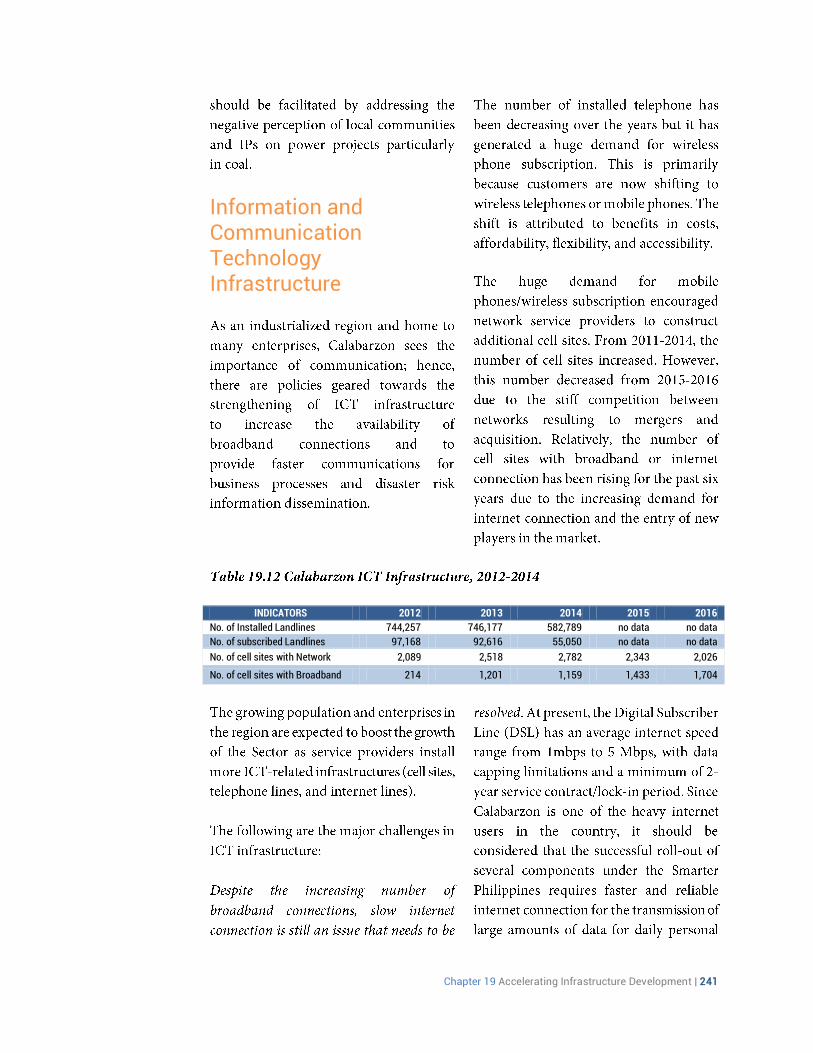
Chapter 19 Accelerating Infrastructure Development | 241
Information and Communication Technology Infrastructure
INDICATORS 2012 2013 2014 2015 2016
No. of Installed Landlines 744,257 746,177 582,789 no data no data
No. of subscribed Landlines 97,168 92,616 55,050 no data no data
No. of cell sites with Network 2,089 2,518 2,782 2,343 2,026
No. of cell sites with Broadband 214 1,201 1,159 1,433 1,704
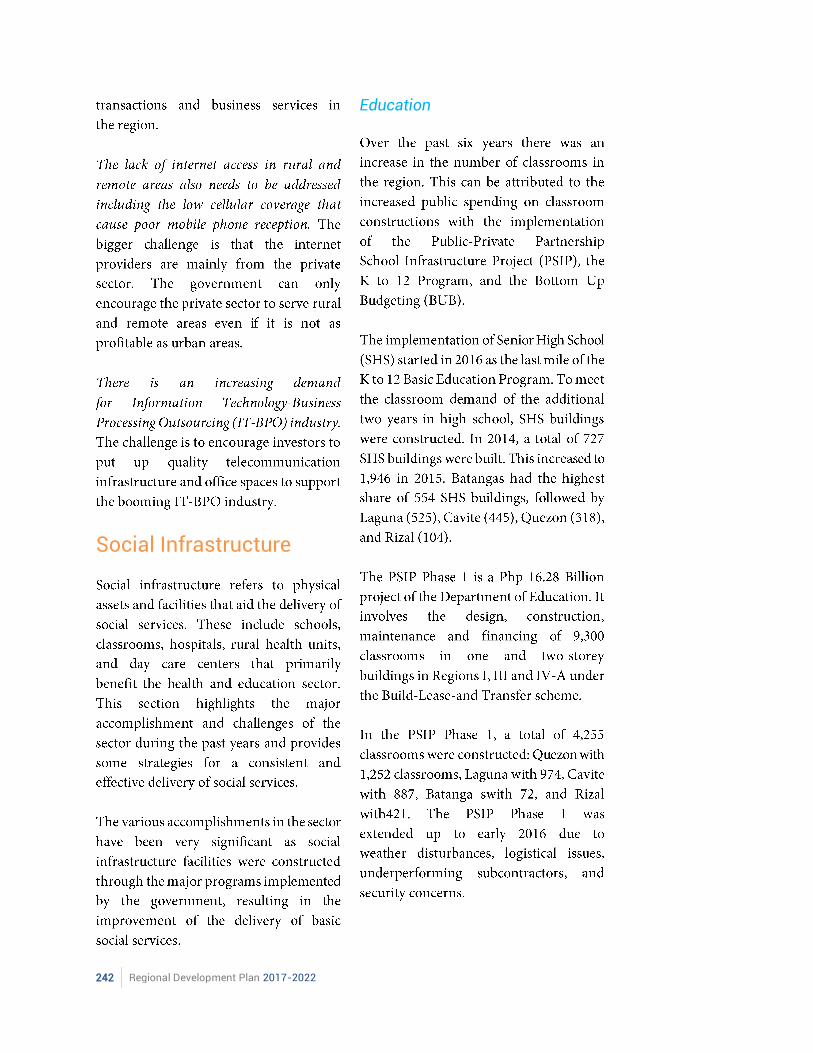
242 Regional Development Plan 2017-2022
Social Infrastructure
Education
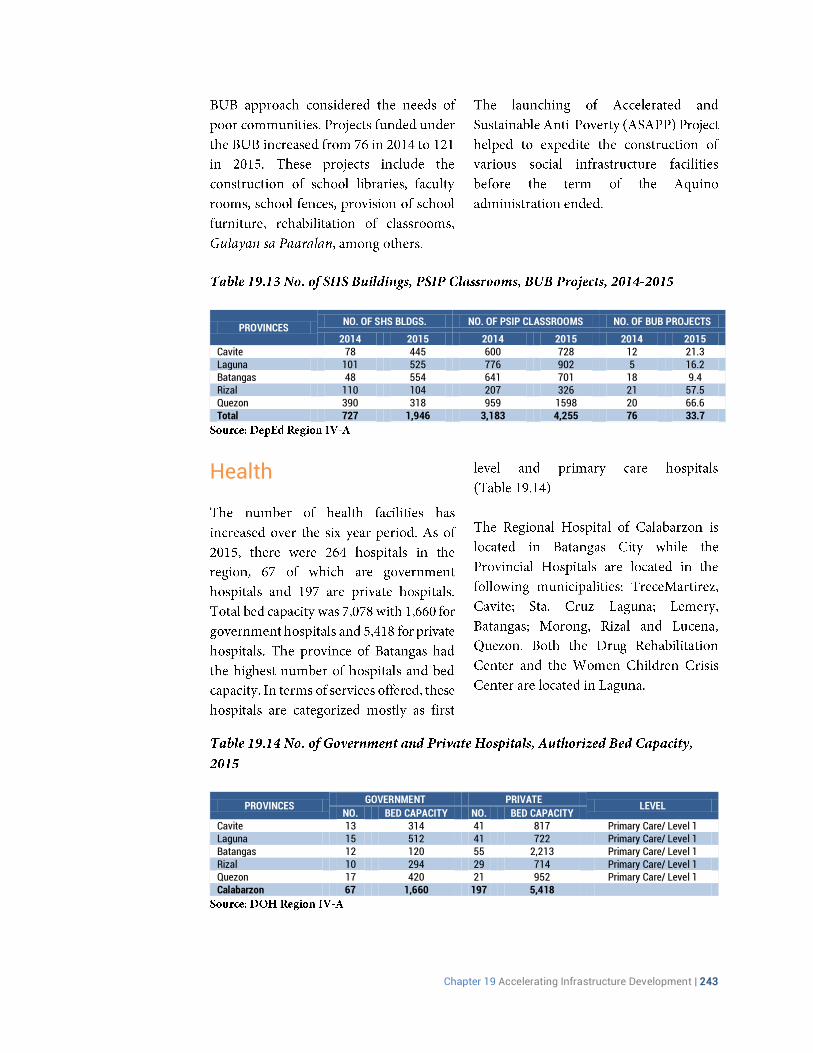
Chapter 19 Accelerating Infrastructure Development | 243
PROVINCES NO. OF SHS BLDGS. NO. OF PSIP CLASSROOMS NO. OF BUB PROJECTS
2014 2015 2014 2015 2014 2015 Cavite 78 445 600 728 12 21.3 Laguna 101 525 776 902 5 16.2 Batangas 48 554 641 701 18 9.4 Rizal 110 104 207 326 21 57.5 Quezon 390 318 959 1598 20 66.6 Total 727 1,946 3,183 4,255 76 33.7
Health
PROVINCES GOVERNMENT PRIVATE
LEVEL NO. BED CAPACITY NO. BED CAPACITY
Cavite 13 314 41 817 Primary Care/ Level 1 Laguna 15 512 41 722 Primary Care/ Level 1 Batangas 12 120 55 2,213 Primary Care/ Level 1 Rizal 10 294 29 714 Primary Care/ Level 1 Quezon 17 420 21 952 Primary Care/ Level 1 Calabarzon 67 1,660 197 5,418
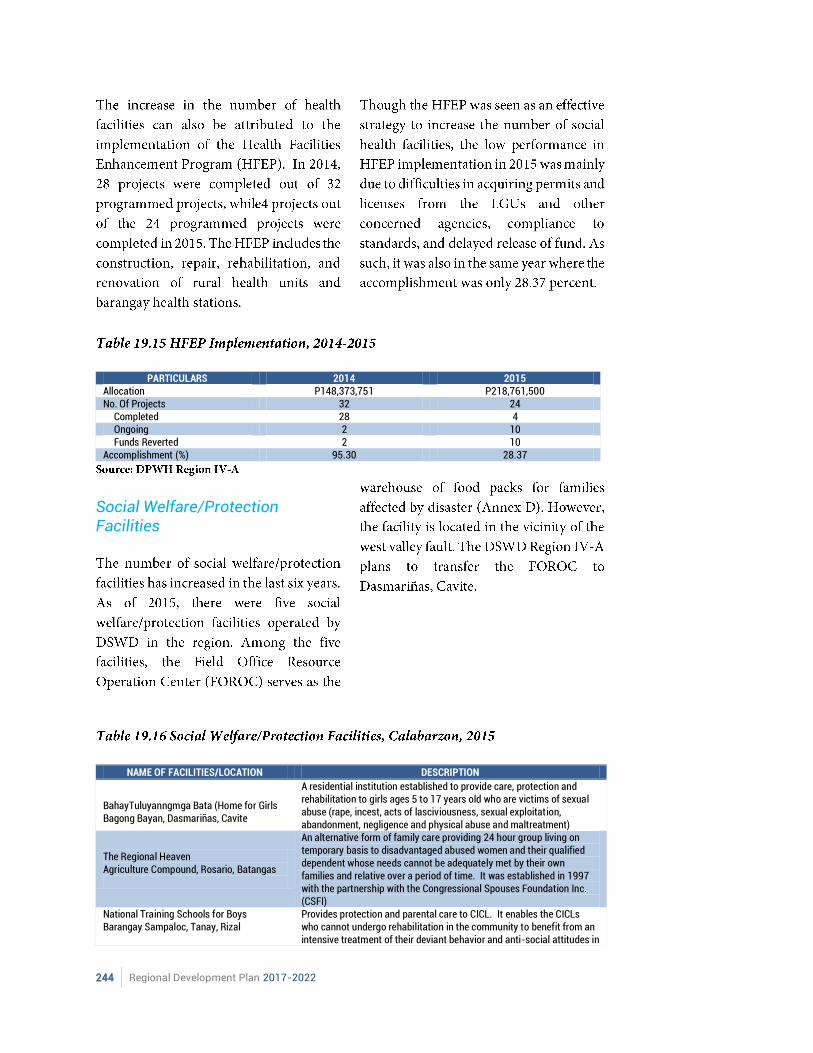
244 Regional Development Plan 2017-2022
PARTICULARS 2014 2015
Allocation P148,373,751 P218,761,500 No. Of Projects 32 24
Completed 28 4 Ongoing 2 10 Funds Reverted 2 10
Accomplishment (%) 95.30 28.37
Social Welfare/Protection Facilities
NAME OF FACILITIES/LOCATION DESCRIPTION
BahayTuluyanngmga Bata (Home for Girls Bagong Bayan, Dasmariñas, Cavite
A residential institution established to provide care, protection and rehabilitation to girls ages 5 to 17 years old who are victims of sexual abuse (rape, incest, acts of lasciviousness, sexual exploitation, abandonment, negligence and physical abuse and maltreatment)
The Regional Heaven Agriculture Compound, Rosario, Batangas
An alternative form of family care providing 24 hour group living on temporary basis to disadvantaged abused women and their qualified dependent whose needs cannot be adequately met by their own families and relative over a period of time. It was established in 1997 with the partnership with the Congressional Spouses Foundation Inc. (CSFI)
National Training Schools for Boys Barangay Sampaloc, Tanay, Rizal
Provides protection and parental care to CICL. It enables the CICLs who cannot undergo rehabilitation in the community to benefit from an intensive treatment of their deviant behavior and anti-social attitudes in
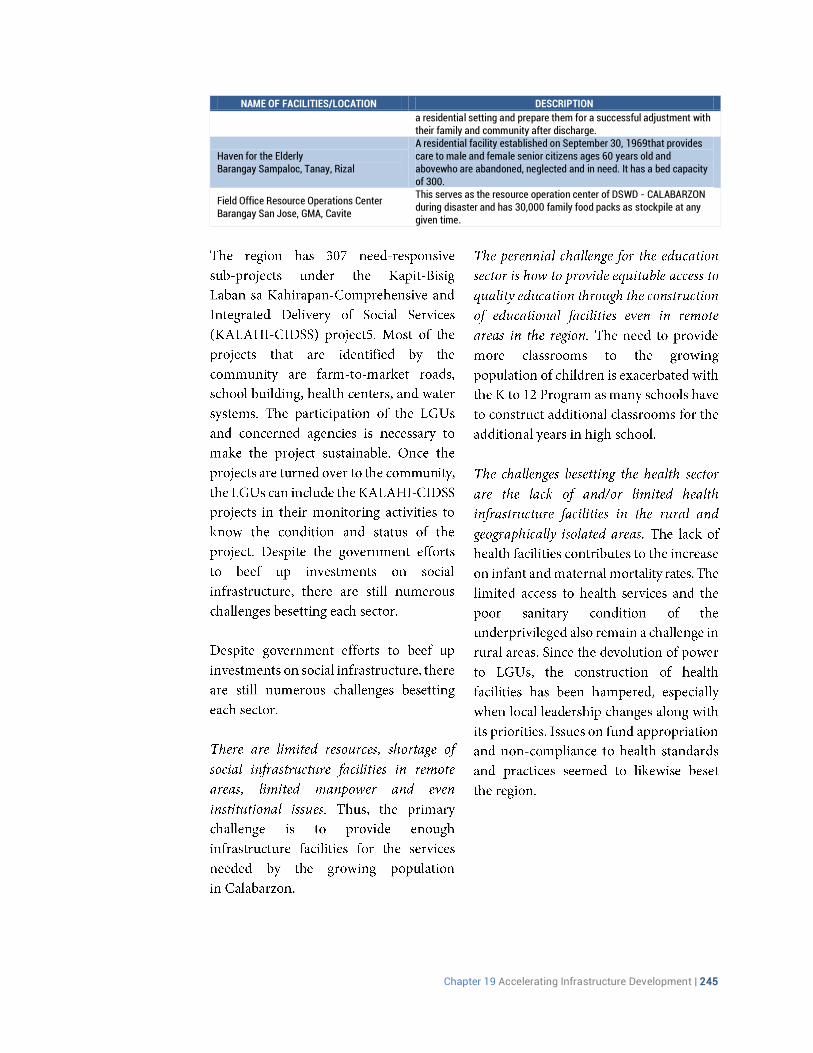
Chapter 19 Accelerating Infrastructure Development | 245
NAME OF FACILITIES/LOCATION DESCRIPTION
a residential setting and prepare them for a successful adjustment with their family and community after discharge.
Haven for the Elderly Barangay Sampaloc, Tanay, Rizal
A residential facility established on September 30, 1969that provides care to male and female senior citizens ages 60 years old and abovewho are abandoned, neglected and in need. It has a bed capacity of 300.
Field Office Resource Operations Center Barangay San Jose, GMA, Cavite
This serves as the resource operation center of DSWD - CALABARZON during disaster and has 30,000 family food packs as stockpile at any given time.
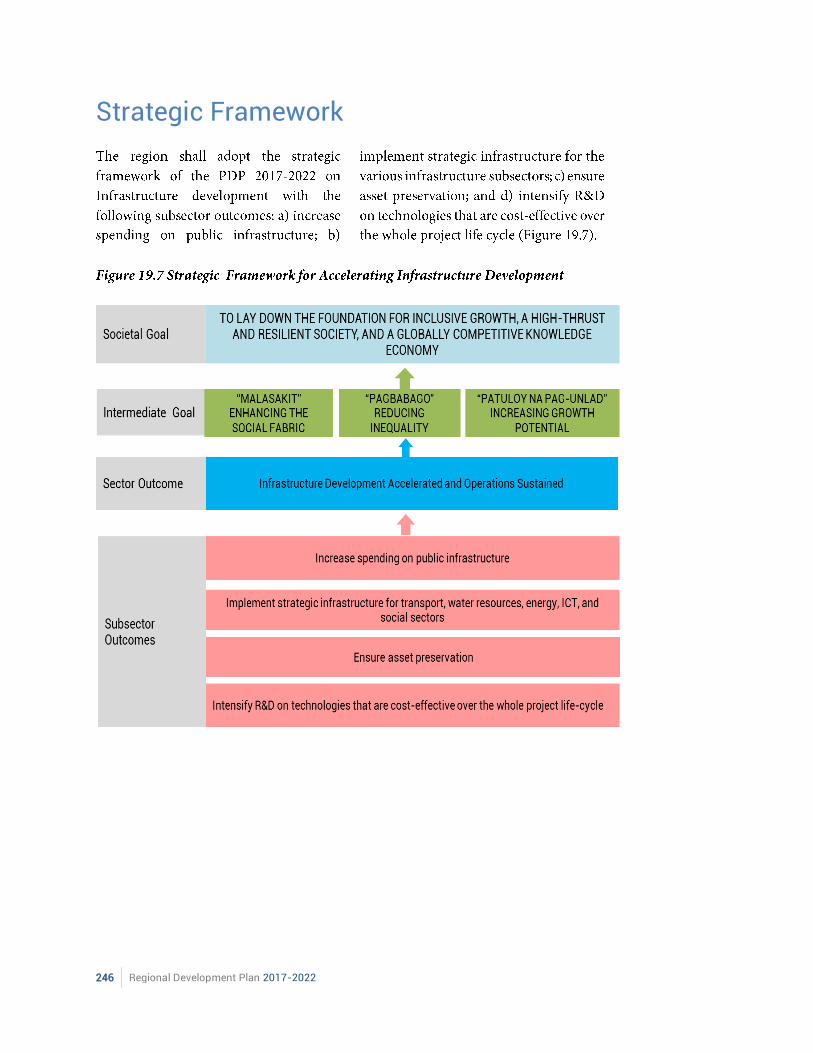
246 Regional Development Plan 2017-2022
Strategic Framework
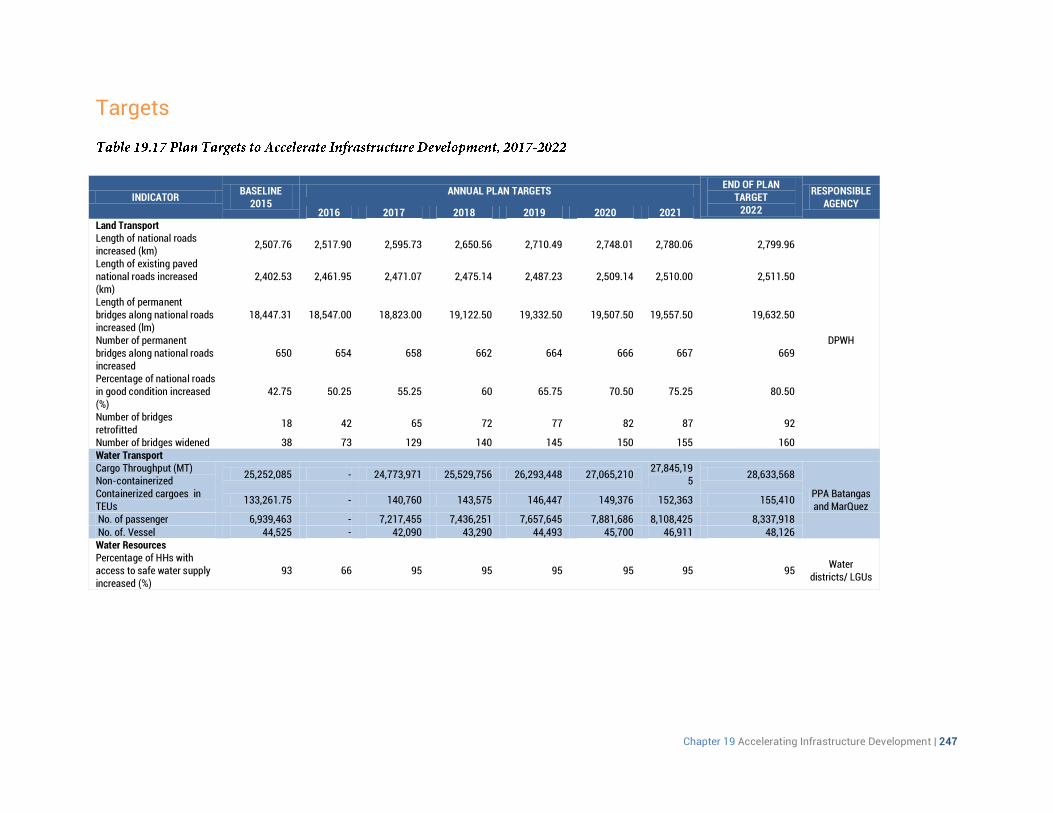
Chapter 19 Accelerating Infrastructure Development | 247
Targets
INDICATOR BASELINE
2015 ANNUAL PLAN TARGETS
END OF PLAN TARGET
2022
RESPONSIBLE AGENCY
2016 2017 2018 2019 2020 2021 Land Transport Length of national roads increased (km)
2,507.76 2,517.90 2,595.73 2,650.56 2,710.49 2,748.01 2,780.06 2,799.96
DPWH
Length of existing paved national roads increased (km)
2,402.53 2,461.95 2,471.07 2,475.14 2,487.23 2,509.14 2,510.00 2,511.50
Length of permanent bridges along national roads increased (lm)
18,447.31 18,547.00 18,823.00 19,122.50 19,332.50 19,507.50 19,557.50 19,632.50
Number of permanent bridges along national roads increased
650 654 658 662 664 666 667 669
Percentage of national roads in good condition increased (%)
42.75 50.25 55.25 60 65.75 70.50 75.25 80.50
Number of bridges retrofitted
18 42 65 72 77 82 87 92
Number of bridges widened 38 73 129 140 145 150 155 160 Water Transport Cargo Throughput (MT) Non-containerized
25,252,085 - 24,773,971 25,529,756 26,293,448 27,065,210 27,845,19
5 28,633,568
PPA Batangas and MarQuez
Containerized cargoes in TEUs
133,261.75 - 140,760 143,575 146,447 149,376 152,363 155,410
No. of passenger 6,939,463 - 7,217,455 7,436,251 7,657,645 7,881,686 8,108,425 8,337,918 No. of. Vessel 44,525 - 42,090 43,290 44,493 45,700 46,911 48,126 Water Resources Percentage of HHs with access to safe water supply increased (%)
93 66 95 95 95 95 95 95 Water
districts/ LGUs
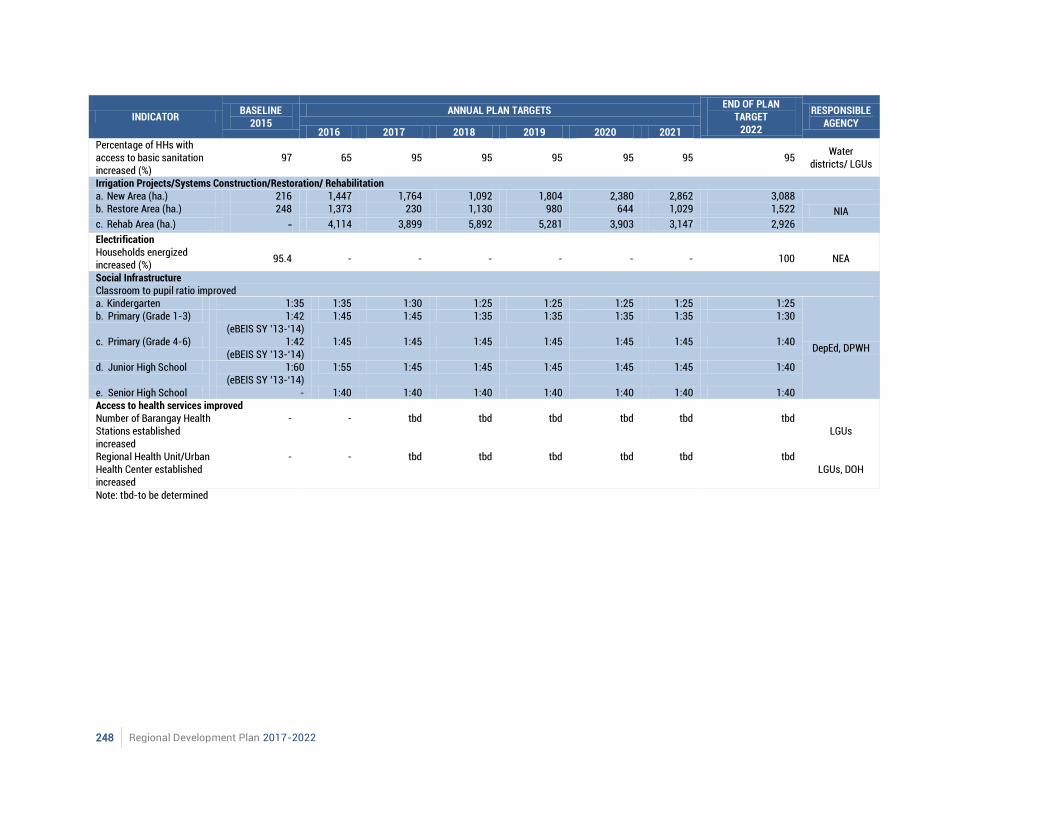
248 Regional Development Plan 2017-2022
INDICATOR BASELINE
2015 ANNUAL PLAN TARGETS
END OF PLAN TARGET
2022
RESPONSIBLE AGENCY
2016 2017 2018 2019 2020 2021 Percentage of HHs with access to basic sanitation increased (%)
97 65 95 95 95 95 95 95 Water
districts/ LGUs
Irrigation Projects/Systems Construction/Restoration/ Rehabilitation a. New Area (ha.) 216 1,447 1,764 1,092 1,804 2,380 2,862 3,088
NIA b. Restore Area (ha.) 248 1,373 230 1,130 980 644 1,029 1,522
c. Rehab Area (ha.) - 4,114 3,899 5,892 5,281 3,903 3,147 2,926
Electrification Households energized increased (%)
95.4 - - - - - - 100 NEA
Social Infrastructure Classroom to pupil ratio improved a. Kindergarten 1:35 1:35 1:30 1:25 1:25 1:25 1:25 1:25
DepEd, DPWH
b. Primary (Grade 1-3) 1:42 (eBEIS SY ’13-‘14)
1:45 1:45 1:35 1:35 1:35 1:35 1:30
c. Primary (Grade 4-6) 1:42 (eBEIS SY ’13-‘14)
1:45 1:45 1:45 1:45 1:45 1:45 1:40
d. Junior High School 1:60 (eBEIS SY ’13-‘14)
1:55 1:45 1:45 1:45 1:45 1:45 1:40
e. Senior High School - 1:40 1:40 1:40 1:40 1:40 1:40 1:40 Access to health services improved Number of Barangay Health Stations established increased
- - tbd tbd tbd tbd tbd tbd LGUs
Regional Health Unit/Urban Health Center established increased
- - tbd tbd tbd tbd tbd tbd LGUs, DOH
Note: tbd-to be determined

Chapter 19 Accelerating Infrastructure Development | 249
Strategies
Subsector Outcome 1: Spending on public infrastructure increased
Subsector Outcome 2: Strategic infrastructure implemented
250 Regional Development Plan 2017-2022
Chapter 19 Accelerating Infrastructure Development | 251
252 Regional Development Plan 2017-2022
Chapter 19 Accelerating Infrastructure Development | 253
254 Regional Development Plan 2017-2022
Subsector Outcome 3: Asset preservation ensured
Sector Outcome 4: Intensify infrastructure-related research and development (R&D)
Major Programs and Projects
Transport
Chapter 19 Accelerating Infrastructure Development | 255
o
o
o
o
Irrigation
Water Supply
Power and Energy

256 Regional Development Plan 2017-2022
Chapter 20 Ensuring Ecological Integrity, Clean and Healthy Environment | 257

258 Regional Development Plan 2017-2022
Chapter 20 Ensuring Ecological Integrity, Clean and Healthy Environment | 259
Chapter 20
Ensuring Ecological Integrity, Clean and Healthy Environment The environment is one of the foundations of sustainable development as it provides the needed raw materials to support the productive sector, livelihood and cultural activities, and the appropriate setting for human settlements to thrive. Thus, its conservation and protection are critical to achieve a balanced and strategic growth for future generations. In order to support higher regional economic growth and population increase in the next six years and abate possible negative ecological impacts, the maintenance of a healthy and good quality environment is needed.
The performance of environment and natural resources sector, including disaster adaptation, in the past planning period from 2011-2016 show that while environmental management has improved, environmental quality has declined and that disaster vulnerability and damages remain to be a challenge for the region. Based on the assessment of past performance and outstanding challenges in the sector, region specific as well as nationally applicable strategies, programs and projects have been identified to rehabilitate degraded areas and to protect and conserve pristine ecosystems.
Assessment and Challenges Sustainable management of natural resources

260 Regional Development Plan 2017-2022
INDICATORS 2012 2013 2014 2015
Open and denuded forest land area rehabilitated (ha)
13,688 29,087 23,180 22,009
Timber poaching hotspots 6 0 0 0
Mangrove area rehabilitated (ha) 588 1,000 823 2,741 Number of costal area with biodiversity conserved
- 11 14 62
Terrestrial protected areas (PAs) managed 100% 100% 100% 100%
Marine PAs (LGU designated) managed 4% 2% 2% 2%
Area of degraded coral reefs in NIPAs marine PA rehabilitated (ha)
- 2,724 2,724 8,000
Percent of classified caves effectively managed by LGUs
- - 43% 36%
INDICATORS 2012 2013 2014 2015
Number of beneficiaries with secured land tenure in public agricultural A&D lands completed by 2015
6,820 6,389 5,797 5,803
Number of beneficiaries with secured land tenure in residential lands zoned as residential areas
6,257 2,698 3,911 4,085
Chapter 20 Ensuring Ecological Integrity, Clean and Healthy Environment | 261
Environmental quality
262 Regional Development Plan 2017-2022
Disaster adaptation capacities of communities
Chapter 20 Ensuring Ecological Integrity, Clean and Healthy Environment | 263
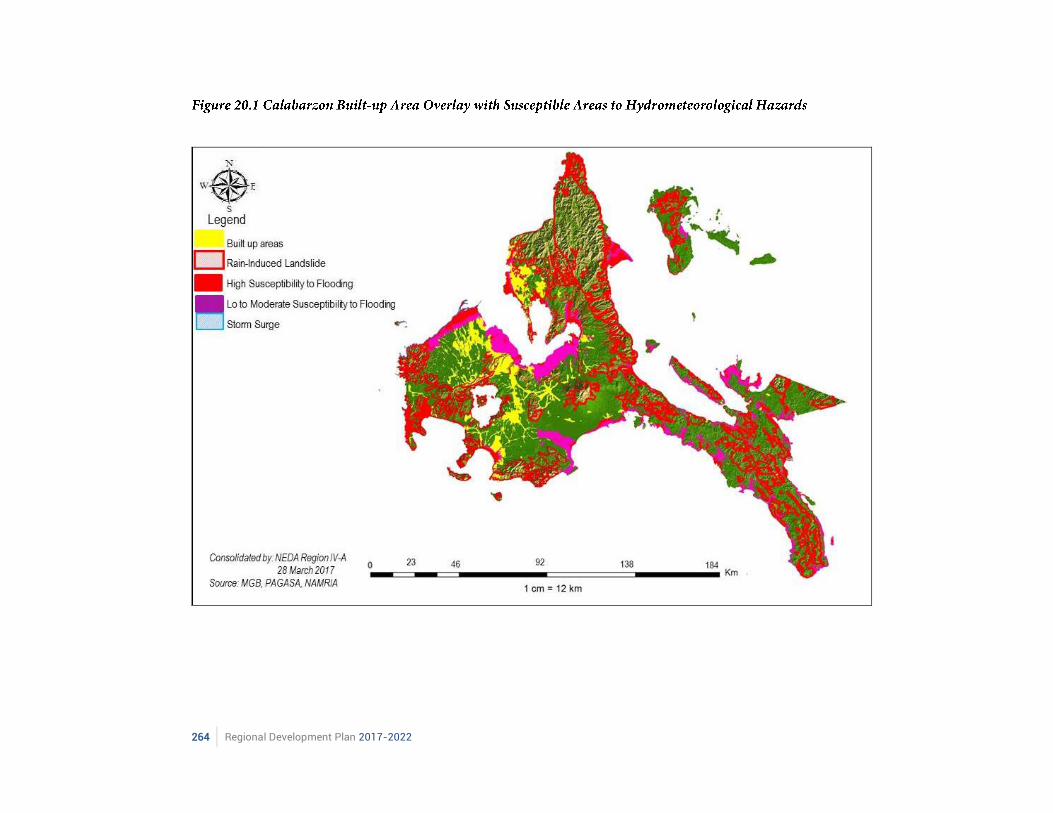
264 Regional Development Plan 2017-2022
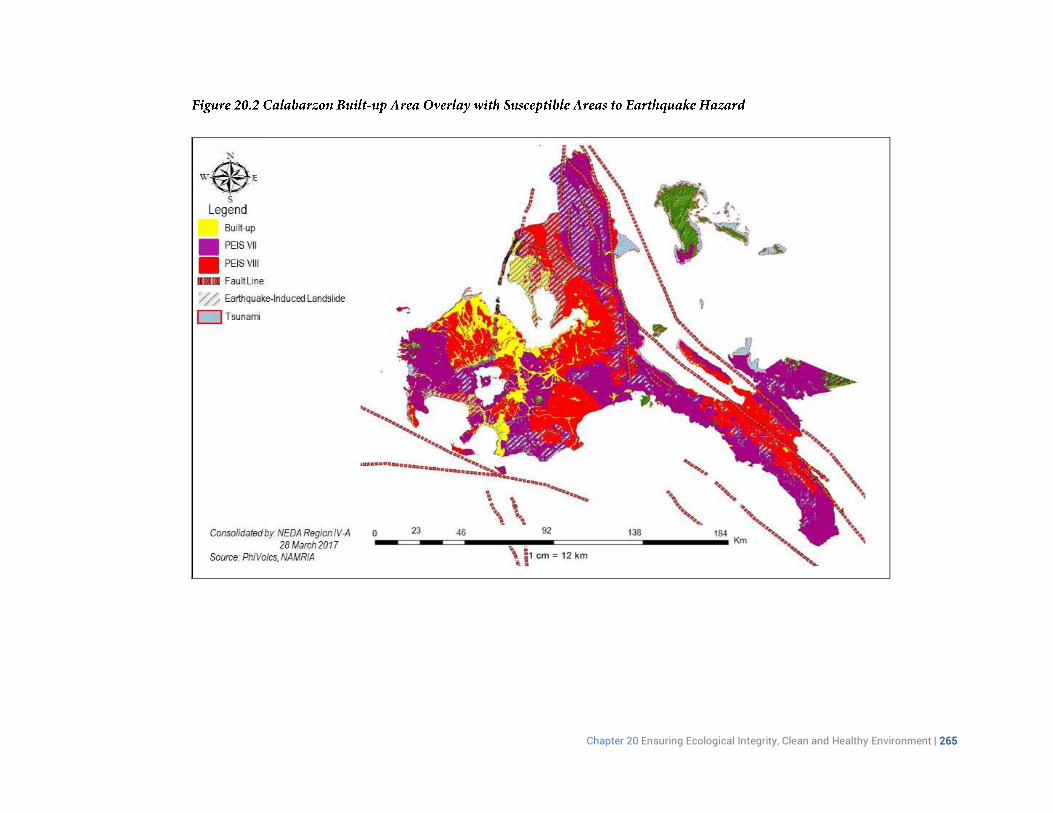
Chapter 20 Ensuring Ecological Integrity, Clean and Healthy Environment | 265
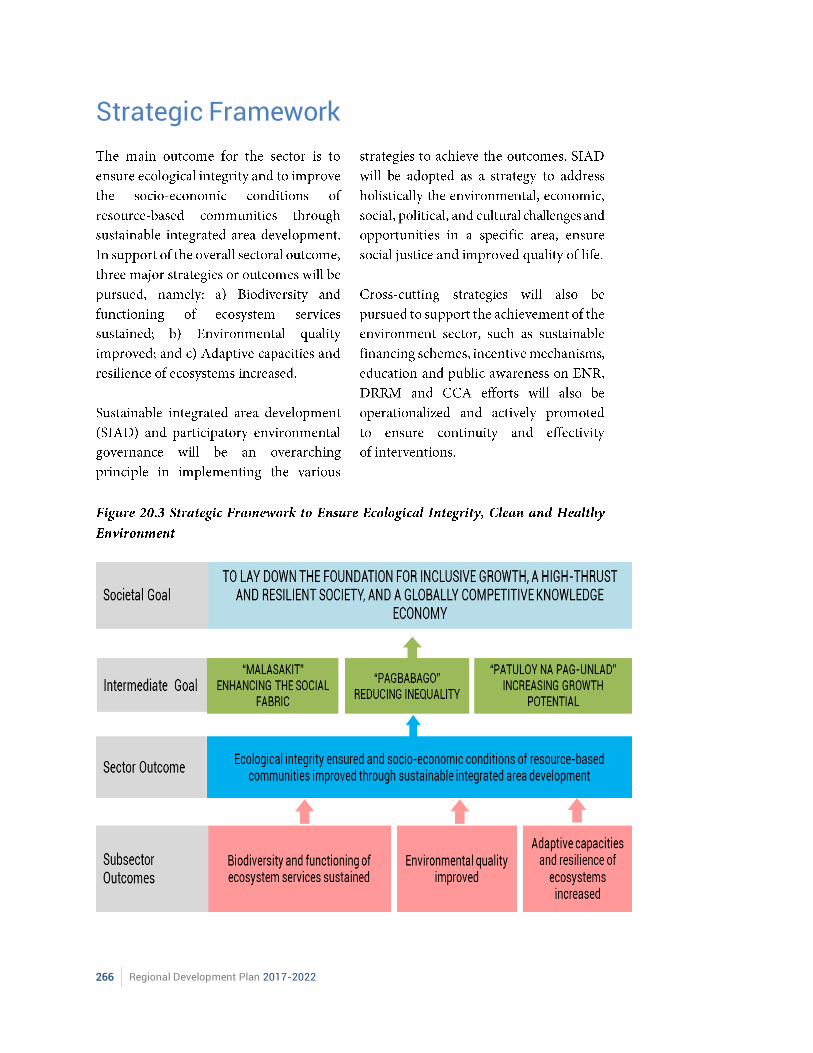
266 Regional Development Plan 2017-2022
Strategic Framework
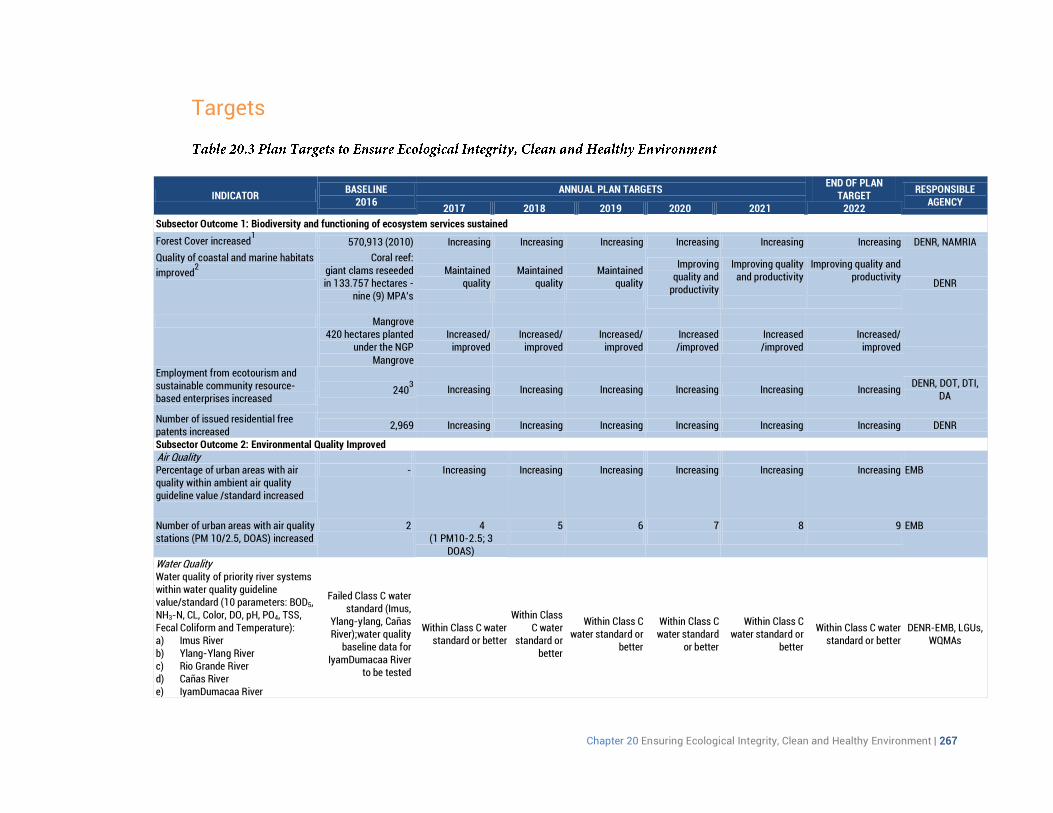
Chapter 20 Ensuring Ecological Integrity, Clean and Healthy Environment | 267
Targets
INDICATOR BASELINE
2016 ANNUAL PLAN TARGETS
END OF PLAN TARGET
RESPONSIBLE AGENCY
2017 2018 2019 2020 2021 2022
Subsector Outcome 1: Biodiversity and functioning of ecosystem services sustained
Forest Cover increased1
570,913 (2010) Increasing Increasing Increasing Increasing Increasing Increasing DENR, NAMRIA
Quality of coastal and marine habitats
improved2
Coral reef: giant clams reseeded in 133.757 hectares -
nine (9) MPA’s
Maintained quality
Maintained quality
Maintained quality
Improving quality and
productivity
Improving quality and productivity
Improving quality and productivity
DENR
Mangrove 420 hectares planted
under the NGP Mangrove
Increased/ improved
Increased/ improved
Increased/ improved
Increased /improved
Increased /improved
Increased/ improved
Employment from ecotourism and sustainable community resource-based enterprises increased
2403
Increasing Increasing Increasing Increasing Increasing Increasing DENR, DOT, DTI,
DA
Number of issued residential free patents increased
2,969 Increasing Increasing Increasing Increasing Increasing Increasing DENR
Subsector Outcome 2: Environmental Quality Improved Air Quality Percentage of urban areas with air quality within ambient air quality guideline value /standard increased
- Increasing Increasing Increasing Increasing Increasing Increasing EMB
Number of urban areas with air quality stations (PM 10/2.5, DOAS) increased
2 4 (1 PM10-2.5; 3
DOAS)
5
6
7
8
9 EMB
Water Quality Water quality of priority river systems within water quality guideline value/standard (10 parameters: BOD5, NH3-N, CL, Color, DO, pH, PO4, TSS, Fecal Coliform and Temperature): a) Imus River b) Ylang-Ylang River c) Rio Grande River d) Cañas River e) IyamDumacaa River
Failed Class C water standard (Imus,
Ylang-ylang, Cañas River);water quality
baseline data for IyamDumacaa River
to be tested
Within Class C water standard or better
Within Class C water
standard or better
Within Class C water standard or
better
Within Class C water standard
or better
Within Class C water standard or
better
Within Class C water standard or better
DENR-EMB, LGUs, WQMAs
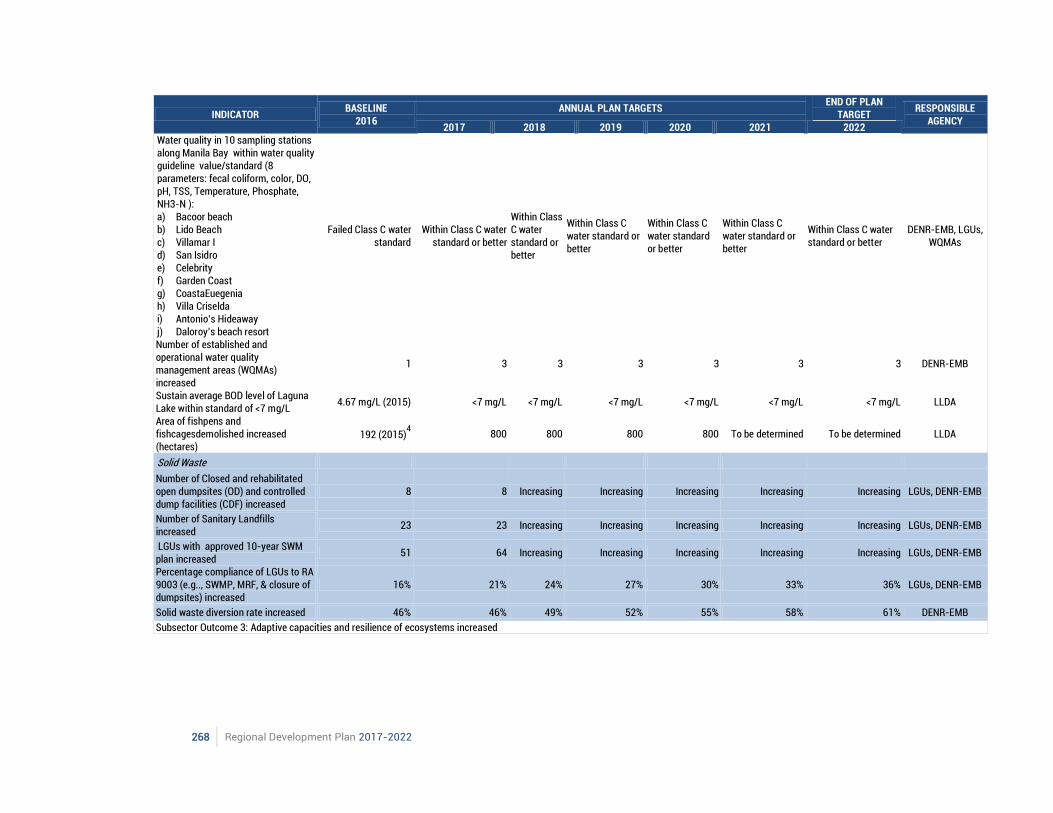
268 Regional Development Plan 2017-2022
INDICATOR BASELINE
2016 ANNUAL PLAN TARGETS
END OF PLAN TARGET
RESPONSIBLE AGENCY
2017 2018 2019 2020 2021 2022 Water quality in 10 sampling stations along Manila Bay within water quality guideline value/standard (8 parameters: fecal coliform, color, DO, pH, TSS, Temperature, Phosphate, NH3-N ): a) Bacoor beach b) Lido Beach c) Villamar I d) San Isidro e) Celebrity f) Garden Coast g) CoastaEuegenia h) Villa Criselda i) Antonio’s Hideaway j) Daloroy’s beach resort
Failed Class C water standard
Within Class C water standard or better
Within Class C water standard or better
Within Class C water standard or better
Within Class C water standard or better
Within Class C water standard or better
Within Class C water standard or better
DENR-EMB, LGUs, WQMAs
Number of established and operational water quality management areas (WQMAs) increased
1 3 3 3 3 3 3 DENR-EMB
Sustain average BOD level of Laguna Lake within standard of <7 mg/L
4.67 mg/L (2015) <7 mg/L <7 mg/L <7 mg/L <7 mg/L <7 mg/L <7 mg/L LLDA
Area of fishpens and fishcagesdemolished increased (hectares)
192 (2015)4
800 800 800 800 To be determined To be determined LLDA
Solid Waste
Number of Closed and rehabilitated open dumpsites (OD) and controlled dump facilities (CDF) increased
8 8 Increasing Increasing Increasing Increasing Increasing LGUs, DENR-EMB
Number of Sanitary Landfills increased
23 23 Increasing Increasing Increasing Increasing Increasing LGUs, DENR-EMB
LGUs with approved 10-year SWM plan increased
51 64 Increasing Increasing Increasing Increasing Increasing LGUs, DENR-EMB
Percentage compliance of LGUs to RA 9003 (e.g.., SWMP, MRF, & closure of dumpsites) increased
16% 21% 24% 27% 30% 33% 36% LGUs, DENR-EMB
Solid waste diversion rate increased 46% 46% 49% 52% 55% 58% 61% DENR-EMB
Subsector Outcome 3: Adaptive capacities and resilience of ecosystems increased
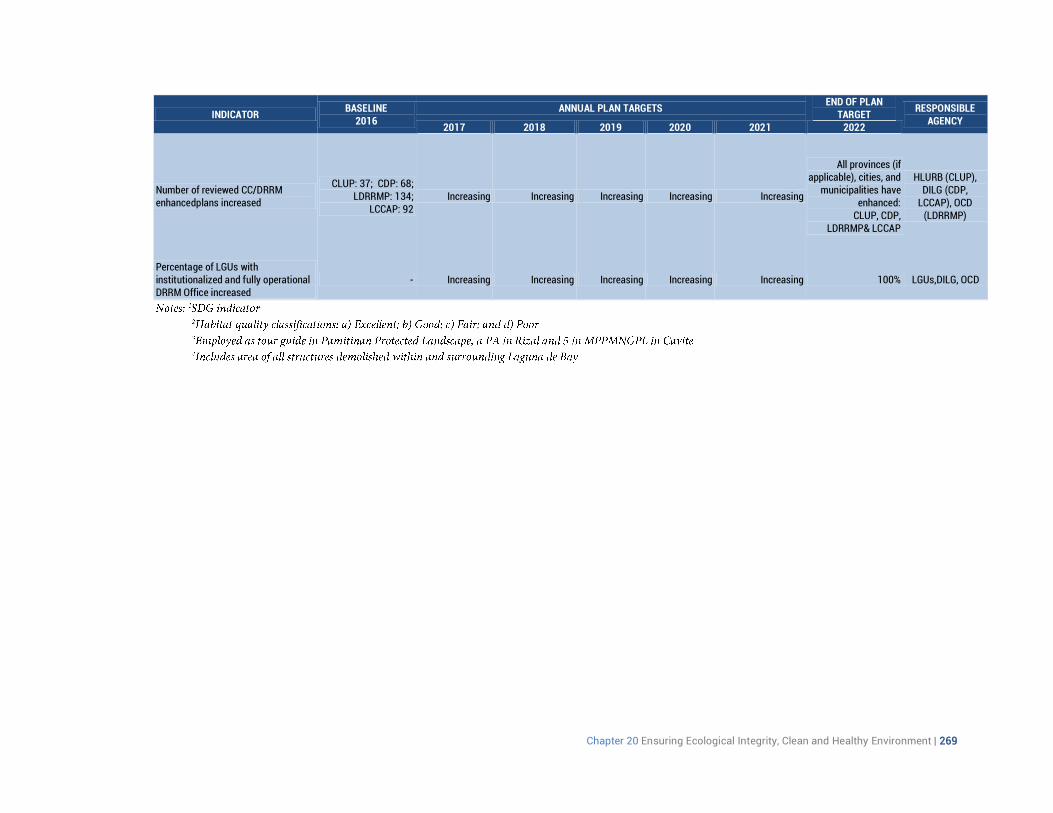
Chapter 20 Ensuring Ecological Integrity, Clean and Healthy Environment | 269
INDICATOR BASELINE
2016 ANNUAL PLAN TARGETS
END OF PLAN TARGET
RESPONSIBLE AGENCY
2017 2018 2019 2020 2021 2022
Number of reviewed CC/DRRM enhancedplans increased
CLUP: 37; CDP: 68; LDRRMP: 134;
LCCAP: 92 Increasing Increasing Increasing Increasing Increasing
All provinces (if applicable), cities, and
municipalities have enhanced:
CLUP, CDP, LDRRMP& LCCAP
HLURB (CLUP), DILG (CDP,
LCCAP), OCD (LDRRMP)
Percentage of LGUs with institutionalized and fully operational DRRM Office increased
- Increasing Increasing Increasing Increasing Increasing 100% LGUs,DILG, OCD
270 Regional Development Plan 2017-2022
Strategies
Chapter 20 Ensuring Ecological Integrity, Clean and Healthy Environment | 271
272 Regional Development Plan 2017-2022
Chapter 20 Ensuring Ecological Integrity, Clean and Healthy Environment | 273
274 Regional Development Plan 2017-2022
Chapter 20 Ensuring Ecological Integrity, Clean and Healthy Environment | 275
276 Regional Development Plan 2017-2022
Major Programs and Projects
Chapter 20 Ensuring Ecological Integrity, Clean and Healthy Environment | 277
Legislative Agenda
i
iii

278 Regional Development Plan 2017-2022
Chapter 21 Plan Implementation and Monitoring | 279

280 Regional Development Plan 2017-2022
Chapter 21 Plan Implementation and Monitoring | 281

282 Regional Development Plan 2017-2022
Chapter 21 Plan Implementation and Monitoring | 283
Chapter 21
Plan Implementation and Monitoring and Evaluation
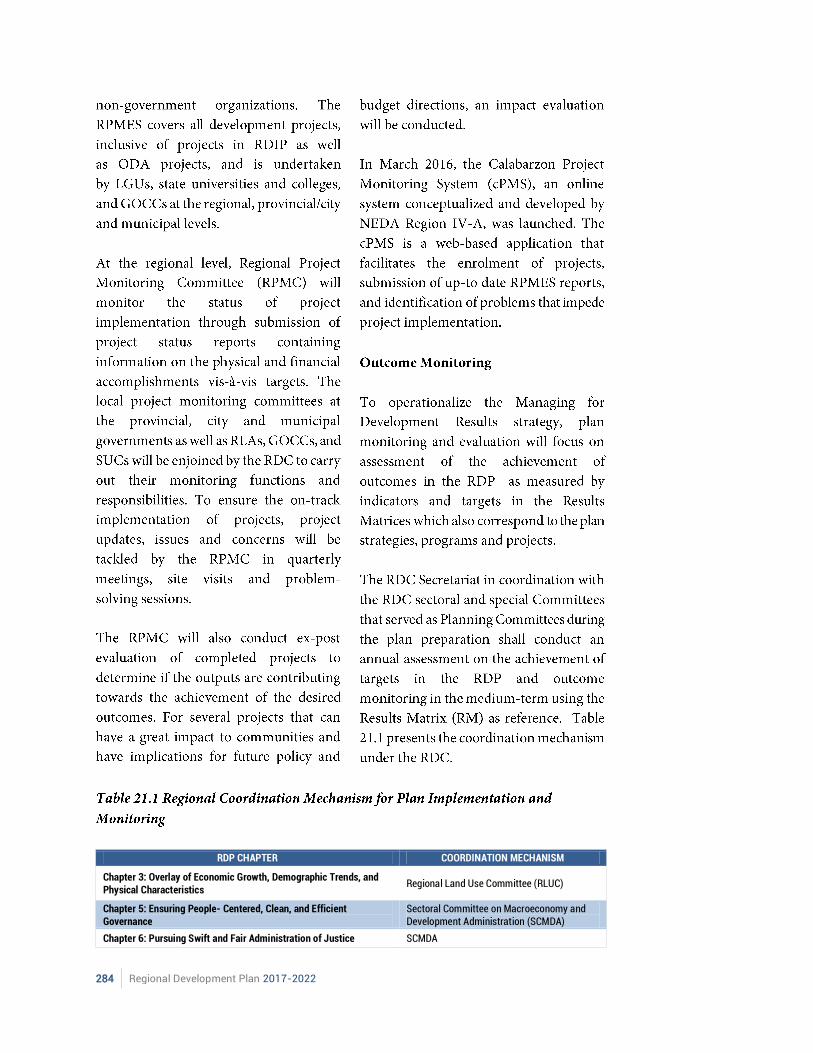
284 Regional Development Plan 2017-2022
RDP CHAPTER COORDINATION MECHANISM
Chapter 3: Overlay of Economic Growth, Demographic Trends, and Physical Characteristics
Regional Land Use Committee (RLUC)
Chapter 5: Ensuring People- Centered, Clean, and Efficient Governance
Sectoral Committee on Macroeconomy and Development Administration (SCMDA)
Chapter 6: Pursuing Swift and Fair Administration of Justice SCMDA

Chapter 21 Plan Implementation and Monitoring | 285
RDP CHAPTER COORDINATION MECHANISM
Chapter 7: Promoting Philippine Culture and Values Sectoral Committee on Social Development (SCSD)
Chapter 8: Expanding Economic Opportunities in Agriculture, Forestry, and Fisheries
Sectoral Committee on Economic Development (SCED)
Chapter 9: Expanding Economic Opportunities in Industry and Services
SCED, Investment Promotion Group (IPG)
Chapter 10: Accelerating Human Capital Development SCSD, Regional Taskforce on Drug Rehabilitation (RTFDR)
Chapter 11: Reducing Vulnerability of Individuals and Families SCSD, Special Committees & Sub-committees
Chapter 12: Building Safe and Secure Communities SCSD, Special Committees & Sub-committees
Chapter 13: Reaching for the Demographic Dividend SCSD, Special Committees & Sub-committees
Chapter 14: Vigorously Advancing Science, Technology, and Innovation
SCED
Chapter 15: Ensuring Sound Macroeconomic Policy SCMDA
Chapter 16: Regional Competitiveness Regional Competitiveness Council (RCC)
Chapter 17: Attaining Just and Lasting Peace SCMDA
Chapter 18: Ensuring Security, Public Order, and Safety SCMDA, Anti-Illegal Drugs Campaign Technical Working Group (TWG)
Chapter 19: Accelerating Infrastructure Development Sectoral Committee on Infrastructure Development (SCID), Traffic Management TWG
Chapter 20: Ensuring Ecological Integrity, Clean and Healthy Environment
SCED
286 Regional Development Plan 2017-2022
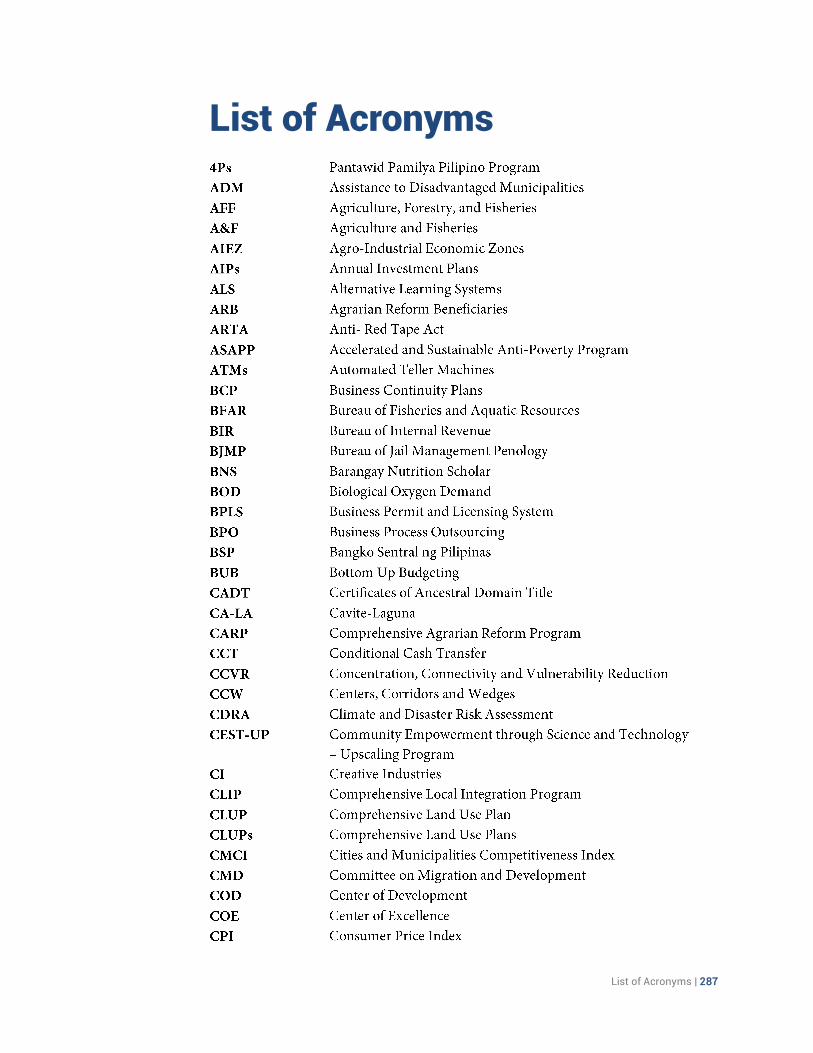
List of Acronyms | 287
List of Acronyms
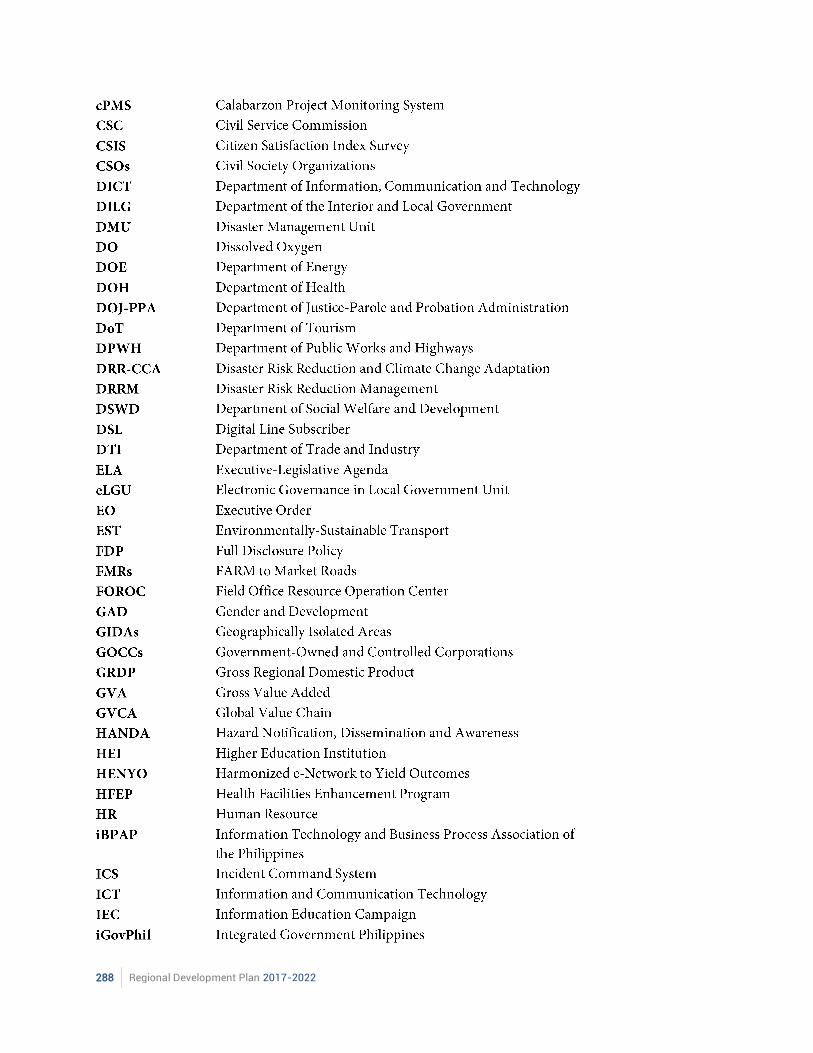
288 Regional Development Plan 2017-2022
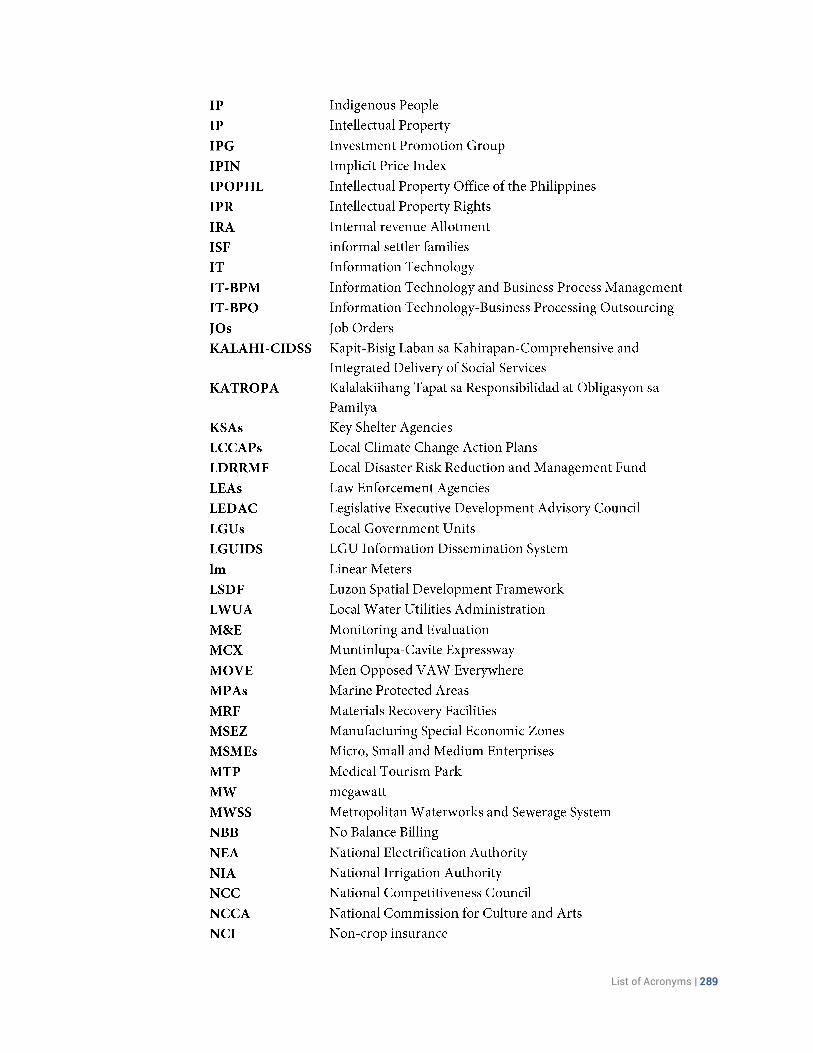
List of Acronyms | 289
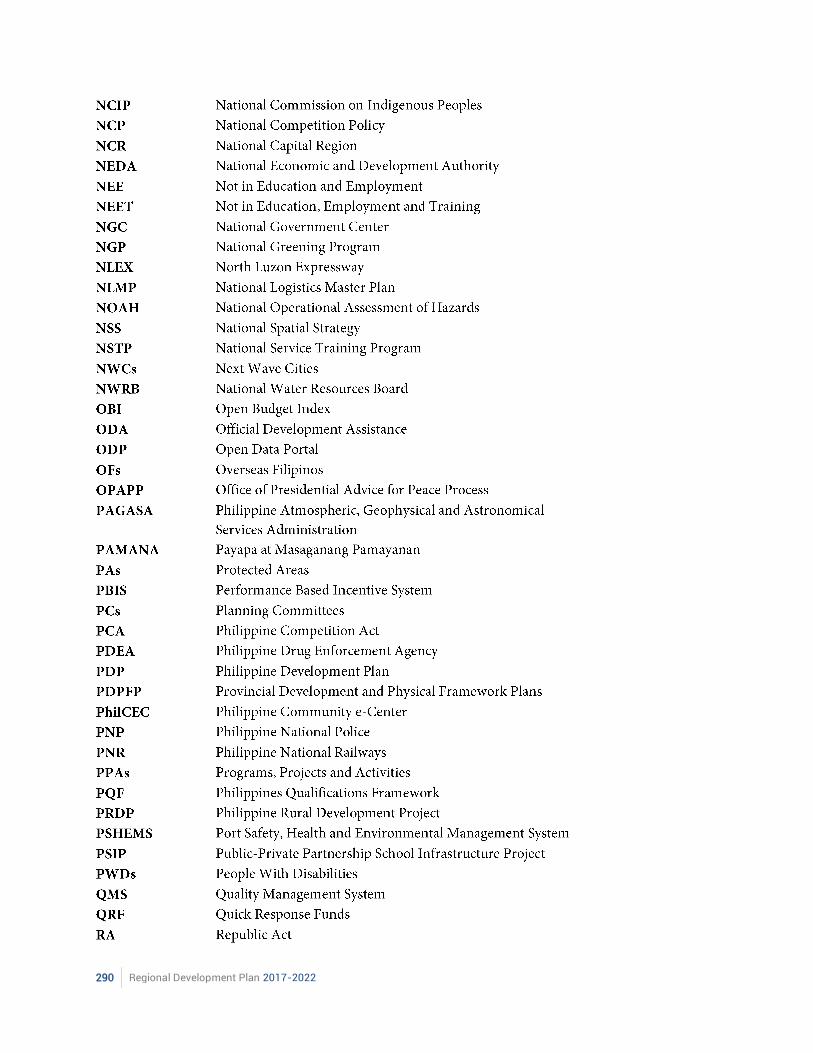
290 Regional Development Plan 2017-2022
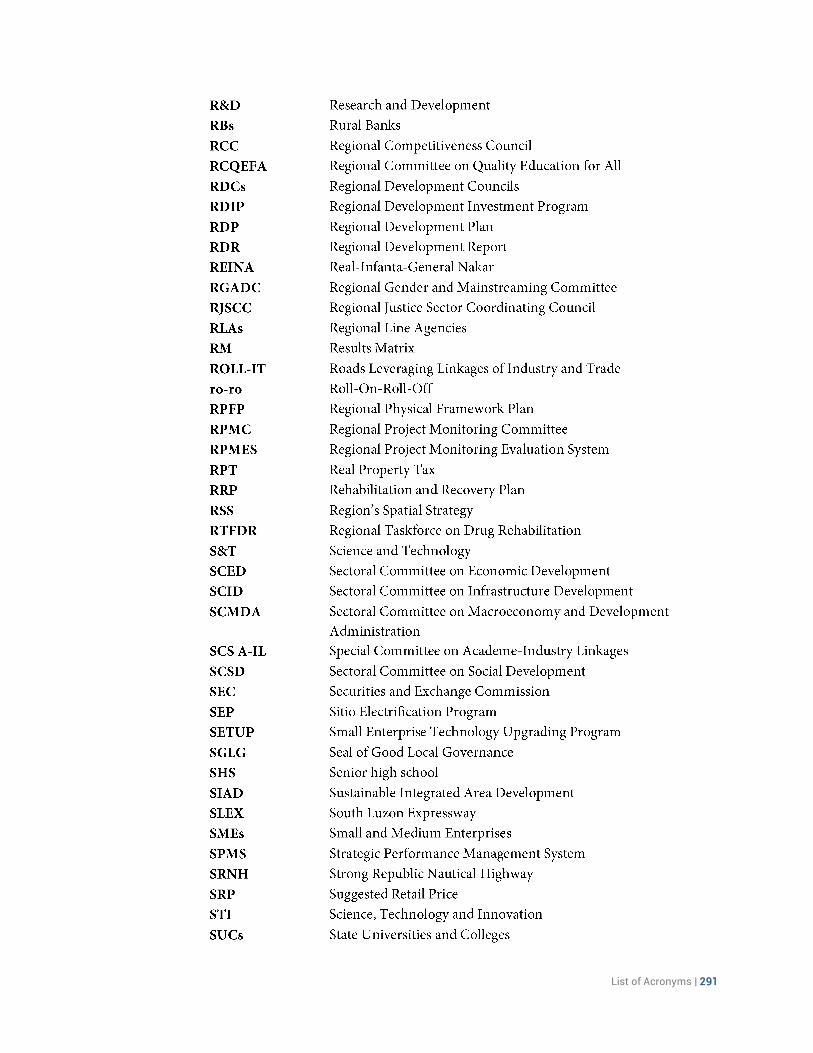
List of Acronyms | 291
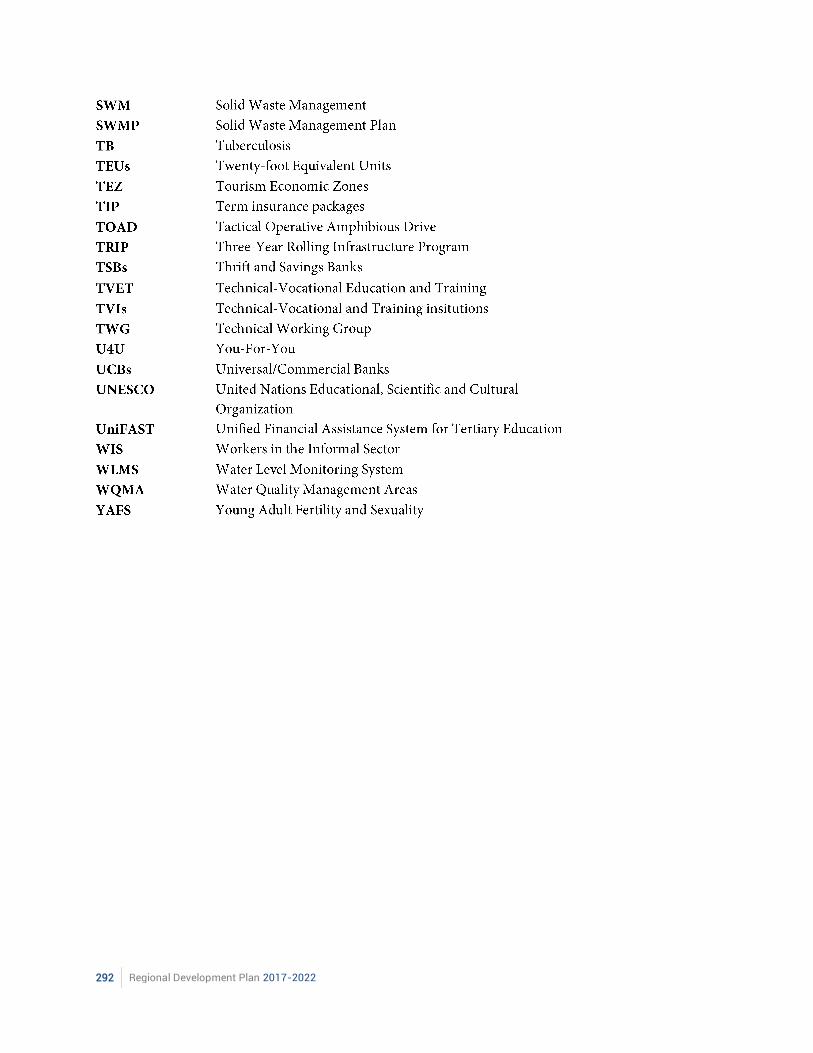
292 Regional Development Plan 2017-2022
References | 293
References
Chapter 5: Ensuring People-Centered, Clean, and Efficient Governance
Chapter 8: Expanding Economic Opportunities in Agriculture, Fisheries and Forestry
Chapter 11: Reducing Vulnerability of Individuals and Families
294 Regional Development Plan 2017-2022
Chapter 12: Building Safe and Secure Communities
Chapter 13: Reaching for the Demographic Dividend
RDP 2017-2022 Planning Committees | 295
RDP 2017-2022 Planning Committeesi PLANNING COMMITTEE ON MACROECONOMY AND DEVELOPMENT ADMINISTRATION
296 Regional Development Plan 2017-2022
PLANNING COMMITTEE ON ECONOMIC DEVELOPMENT
RDP 2017-2022 Planning Committees | 297
PLANNING COMMITTEE ON SOCIAL DEVELOPMENT
298 Regional Development Plan 2017-2022
PLANNING COMMITTEE ON INFRASTRUCTURE DEVELOPMENT
RDP 2017-2022 Planning Committees | 299
PLANNING COMMITTEE ON REGIONAL LAND USE
300 Regional Development Plan 2017-2022
PLANNING COMMITTEE ON REGIONAL COMPETITIVENESS
Copyright © 2022 FDOKUMEN