
Rice-Based Biosystems Journal 2022 (February 2022)
140
-
Upload
khangminh22 -
Category
Documents
-
view
0 -
download
0
Transcript of Rice-Based Biosystems Journal 2022 (February 2022)


ABOUT THE COVERAmidst the challenges brought about by the pandemic, Filipino farmers triumph in achieving the record high palay output of 19.96 million metric ton in 2021. This exceptional feat must be reciprocated with new sets of knowledge gathered through research to sustain their achievement. This issue contains researches not only in rice production but also in rice-based cultivation such as onion and sweet potato. We feature fresh studies on managing weeds and pests and reducing farm expenses through mechanization. We also highlight developments in increasing the value of rice through production of rice-based products such as rice malt with soy milk.
Instructions on manuscript submission are found on pages 129-132. For more information, please visit www.philrice.gov.ph/grants/call-publication/.
Rice-based Biosystems JournalA semi-annual publication of Philippine Rice Research Institute

Published by:
VOLUME 10 • FEBRUARY 2022

EDITORIAL TEAM
JOHN C. DE LEON Chair, Plant Breeder and Executive Director, PhilRice
VETHAIYA T. BALASUBRAMANIAN Agronomist and Soil Scientist, Tamil Nadu, India
CALIXTO M. PROTACIO Professor, Institute of Crop Science,
College of Agriculture and Food Science, UPLB
EUFEMIO T. RASCO JR. Academician, National Academy of Science and Technology (NAST)
RODOLFO C. UNDAN Professor of Agricultural Engineering and former President,
Central Luzon State University (CLSU)
LUIS REY I. VELASCO Professor of Entomology, UPLB
RUBEN L. VILLAREAL Academician, NAST
MARILOU J. ANG-LOPEZ Assistant Professor VII, School of Technology, University of the Philippines
Visayas (UPV)
ROLANDO T. CRUZ Agronomist, Los Baños, Laguna. Philippines
EVELYN F. DELFIN Agronomist, Los Baños, Laguna. Philippines
JOSE E. HERNANDEZ Professor, Institute of Crop Science, College of Agriculture
and Food Science, UPLB
YOICHIRO KATO Assistant Professor, Faculty of Agriculture, The University of Tokyo, Tokyo, Japan
TANGUY LAFARGE Crop Physiologist, Centre de Cooperation Internationale En Recherche Agronomique Pour Le Developpement (CIRAD), Montpellier, France
FELINO P. LANSIGAN Professor of Statistics and Dean, Collete of Arts and Sciences, UPLB
CEZAR P. MAMARIL Soil Scientist and Rice Farmer
MILAGROS R. MARTINEZ-GOSS Professor Emeritus, Institute of Biological Sciences, UPLB
TEODORO C. MENDOZA Professor, Institute of Crop Science, College of Agriculture and Food Science, UPLB
AGNES C. ROLA Academician, NAST and Professor, College of Public Affairs, UPLB
GENARO O. SAN VALENTIN Soil Scientist and Senior Consultant, PhilRice
POMPE C. STA CRUZ Director and Professor, Institute of Crop Science, College of Agriculture and Food Science, UPLB
BERNARDO D. TADEO President and CEO, Full Advantage Phils. International, Inc.
EMMANUEL R. TIONGCO Plant Pathologist and Senior Consultant, PhilRice
EDITOR-IN-CHIEFNORVIE L. MANIGBAS
Scientist II and Chief Science Research Specialist, [email protected] • [email protected] • [email protected]
EDITORIAL BOARD CHARISMA LOVE B. GADO-GONZALES
Editor, PhilRice
CONSORCIA E. REAÑO Statistical Editor, University of the Philippines Los Baños (UPLB)
PRODUCTION TEAM JERRALYN R. GREGORIO
Editorial Assistant, PhilRice
CARLO G. DACUMOSLayout and Design, PhilRice
ADVISORY BOARD
AILON OLIVER V. CAPISTRANOSenior Science Research Specialist, PhilRice
ARLEN A. DELA CRUZSenior Science Research Specialist, PhilRice
ANALIZA HENEDINA M. RAMIREZAssociate Professor, Institute of Weed Science, Entomology and Plant
Pathology, College of Agriculture and Food Science, UPLB
DINDO KING M. DONAYRESenior Science Research Specialist, PhilRice
ELMER G. BAUTISTASupervising Science Research Specialist and Scientist I, PhilRice
GERARDO F. ESTOY JR.Branch Director, PhilRice Negros
JAYVEE A. CRUZSenior Science Research Specialist and Scientist I, PhilRice
JESUSA BELTRANChief Science Research Specialist and Scientist I, PhilRice
JONATHAN M. NIONESSupervising Science Research Specialist and Scientist I, PhilRice
INVITED REVIEWERS JANICE C. LAFORTEZAInstructor, Food Science and Technology, College of Home Science and Industry, CLSU
JAIME MANALOSupervising Science Research Specialist, PhilRice
MANUEL JOSE C. REGALADOChief Science Research Specialist and Scientist I, PhilRice
ROEL R. SURALTAChief Science Research Specialist and Scientist I, PhilRice
MARISSA V. ROMEROChief Science Research Specialist, PhilRice
REYNANTE L. ORDONIOSenior Science Research Specialist and Scientist I, PhilRice
RIZA G. ABILGOS-RAMOSSupervising Science Research Specialist, PhilRice
RICARDO F. ORGEand Chief Science Research Specialist and Scientist II, PhilRice
RIZAL G. CORALESSupervising Science Research Specialist, PhilRice
ROSALY V. MANAOISSenior Science Research Specialist and Scientist I, PhilRice

CONTENTS
VOLUME 10, FEBRUARY 2022
FULL PAPERREGROWTH OF Cyperus rotundus L. VARIANTS IN RESPONSE TO HERBICIDE ................................... 1 FLOODING DURATION, AND CLIPPING INTERVENTIONSJayvee S. Bruno, Kennedy B. Dela Cruz, Raymart John C. Queliza, Celynne O. Padilla, Jessica Joyce L. Jimenez, and Dindo King M. Donayre
INFLUENCE OF Fimbristylis miliacea (L.) Vahl ON GROWTH .................................................................... 9 AND YIELD OF BULB ONION (Allium cepa L.)Kaiser Angelo A. Morla, Celynne O. Padilla, and Dindo King M. Donayre
CHARACTERISTICS, IDENTITY, AND SURVIVAL OF RED EARTHWORM ................................................. 15 INFESTING IRRIGATED RICE PADDIES IN FOUR PHILIPPINE PROVINCESFemia R. Sandoval, Edwin C. Martin, and Clarence B. Codod
GENETIC AND TRAIT DIVERSITY OF SELECTED RICE VARIETIES .......................................................... 23 FOR VARIETAL MIXTURE (VarMix)Imeldalyn G. Pacada, Ma. Theresa F. Celestino, and Merryll Anne M. Miranda
RICE MECHANIZATION MODELS FOR SMALLHOLDER FARMERS: ......................................................... 33 A CASE IN THE PHILIPPINESRicardo F. Orge, Kristine S. Pascual, Jesusa C. Beltran, Tyrone C. Juganas, Rachelle Marie S. Martin, and Aurora M. Corales
ESTABLISHMENT OF THE CAPILLARY IRRIGATION (CAPILLARIGATION) .............................................. 41 SYSTEM FOR SWEETPOTATOJoshua D. Mari, Mary Grace N. Semilla, and Ricardo F. Orge
RAPID ANALYSIS OF RICE PROTEIN AND AMYLOSE CONTENT ................................................49 USING NEAR-INFRARED REFLECTANCE SPECTROSCOPY Gerome A. Corpuz, Evelyn H. Bandonill, Rodel M. Bulatao, Bernando S. Peralta, Jenina Patria S. Villar, Lynnden C. Lucas, Jasper G. Tallada, and Henry M. Corpuz
QUALITY CHARACTERISTICS OF RICE-MALT WITH SOY MILK BEVERAGE ........................................... 61Riza G. Abilgos-Ramos, El Shaira L. Rizzo, Xenia Portia S. Fuentes, and Amelia V. Morales
SUITABILITY OF TARO (Colocasia esculenta) AND RICE (Oryza sativa L.) .............................................. 75 FLOUR BLENDS FOR CRINKLE PREMIX FORMULATIONAmelia V. Morales, Elyss J. Santiago, Christine C. Taganap, Jhomar L. Valerio, John Edward I. Zapater, Geraldine G. Gantioque,and Rosaly V. Manaois
ASSESSING CONSUMERS’ WILLINGNESS TO BUY (WTB) NATIVE DELICACIES ................................... 87 INCORPORATED WITH FERMENTED RICE BRAN (FRB) IN LEYTE, PHILIPPINESVince G. Lao, Angelita L. Paradero, and Riza Abilgos-Ramos

CONTENTS
RESEARCH NOTEENHANCEMENT OF RICE SEEDLING GROWTH BY PLANT .................................................................. 95 GROWTH-PROMOTING Streptomyces mutabilisJayvee A. Cruz, Josef Mikhail R. Bautista, and Erlinda S Paterno
EVALUATION OF RICE ACCESSIONS FOR BROWN ............................................................................... 101 PLANTHOPPER (Nilaparvata lugens STÅL) AND GREEN LEAFHOPPER (Nephotettix virescens DISTANT) RESISTANCEXavier Greg I. Caguiat, Mary Ann M. Rañeses, Danny O. Alfonso, and Gilely DC. Santiago
RESPONSE TO HERBICIDE OF RICE BREEDING LINES DERIVED ...................................................... 107 FROM DIFFERENT INDUCED MUTATIONSChristopher C. Cabusora, and Nenita V. Desamero
IMPROVING FILIPINO RICE FARMERS’ COMPETITIVENESS ................................................................ 113 THROUGH MECHANIZATIONElmer G. Bautista, Manuel Jose C. Regalado, Arnold S. Juliano, Joel A. Ramos, Alice B. Mataia, and Jesusa C. Beltran
ISOLATION AND CHARACTERIZATION OF PLANT-GROWTH-PROMOTING ....................................... 123 BACTERIA UNDER LONG-TERM IRRIGATED LOWLAND RICE ECOSYSTEM Paul John M. Pangilinan, Editha V. Evangelista, Wilfredo B. Collado, and Jayvee A. Cruz

RICE-BASED BIOSYSTEMS JOURNAL (2022) 10: 1-8 1
FULL PAPER
REGROWTH OF CYPERUS ROTUNDUS L. VARIANTS IN RESPONSE TO HERBICIDE, FLOODING DURATION,
AND CLIPPING INTERVENTIONS Jayvee S. Bruno1, Kennedy B. Dela Cruz1, Raymart John C. Queliza2, Celynne O. Padilla3,
Jessica Joyce L. Jimenez1, and Dindo King M. Donayre1*
1Philippine Rice Research Institute, Science City of Muñoz, Nueva Ecija; 2Bureau of Plant Industry, NSQCS Building, Vasra, Quezon City, Metro Manila;
3Central Luzon State University, Science City of Muñoz, Nueva Ecija Corresponding Author: [email protected]
AbstractHerbicides, tillage, and flooding are known to highly influence infestation of C. rotundus on rice-onion
cropping but their effects on pure rice culture are yet to be explored. To pioneer studies on this area, four experiments were conducted to determine the responses of C. rotundus variants to herbicide, flooding, and clipping interventions. Experiments I and II subjected three variants (irrigated lowland rice, rainfed lowland rice, and rice-vegetable) to five herbicides (pendimethalin, pyribenzoxim + cyhalofop-butyl, bispyribac-sodium, 2,4-D, and 2-methyl-4-chlorodiphenoxyacetic acid [MCPA]) and eight flooding durations (0 - 7, 0 - 14, 0 - 21, 7 - 49, 14 - 49, and 21 - 49 days after planting [DAP] including saturated conditions [0 - 49] and continuous flooding [0 - 49]). Experiments III and IV exposed the whole and clipped tubers of C. rotundus variant A (irrigated lowland rice) to eight flooding durations, prolonged soil burial, and submergence in water for 90, 180, 270, and 360 DAP. Growths of the three variants were completely suppressed by bispyribac-sodium, 2,4-D, and MCPA by continuous flooding. The least growth was observed in flooding the field 0 - 21 DAP. Clipping the tubers of C. rotundus variant A one to three times yielded growth similar to the whole tuber. Tubers had 85 - 90% germination rate after 90, 180, 270, and 360 days of soil burial and submergence in water. These findings could be used as basis in the development of integrated weed management against C. rotundus on Philippine rice and rice-based cropping systems.
Keywords: Cultural Control, Chemical Control, Ecotype, Purple Nutsedge, Survival
IntroductionCyperus rotundus L. is one of the world’s worst
weeds due to its reproductive behavior in the soil, flexibility on many environmental conditions, and infestations in numerous crop production areas around the world (Holm et al., 1977). Previous study showed that full competition of the weed under upland conditions reduced the grain yield by 43% on drilled rice and 51% on broadcasted rice (Okafor and De Datta, 1974). Another study also showed that it reduced the grain yield of upland rice by as much as 53% at 0 kg N ha-1, 44% at 600 kg N ha-1, and 47% at 120 kg N ha-1 when its population density was at 100 - 1,000 individual plants m-2 (Okafor and De Datta, 1976).
C. rotundus has many variants distributed around the world (Wills, 1998; Kabawata and Nishimoto, 2003). In the Philippines, it also has variants that grow in irrigated rice and rice-based fields (Baltazar et al., 1997; Pablico, 1986). In fact, Casimero (2000) confirmed that it has a lowland ecotype that can grow
taller, produce more off-shoots, possesses heavier biomass and larger tubers than its upland ecotype. It was further confirmed that it can grow taller than the transplanted and direct-seeded rice plants under field conditions (Donayre et al., 2015). Fuentes et al. (2010) and Peña-Fronteras et al. (2009) explained that its survival under flooded conditions was due to its morphological and physiological adaptive mechanisms.
Herbicide application is one of the available weed management options against C. rotundus. Herbicides are synthetic chemicals used to kill weeds. Farmers prefer this technique due to ease of application, immediate visibility of the results, and less labor requirement (Beltran et al., 2016; Donayre et al., 2014). The technique was proven effective against C. rotundus infesting rice-onion areas in the Philippines (Islam et al., 2009; Casimero, 2000).
Mechanical control through tillage and water management by means of flooding are also options against rice weeds. Tillage controls the weeds by

Regrowth of Cyperus rotundus L. Variants in ricefields
2 RICE-BASED BIOSYSTEMS JOURNAL (2022) 10: 1-8
burying and separating their shoots and roots. It also enhances germination of dormant seeds and desiccates shoots and roots by exposing them under the heat of the sun (Zimdahl, 2007). Weeds are also stressed through flooding, which results in oxygen deprivation and rapid biomass loss.
Knowledge on the influence of interventions to weed population dynamics helps predict the ecological changes in the field (Moody, 1996). It also helps refine the interventions to prevent weed shifts and weed management complexity. The effects of herbicide applications, tillage, and flooding against C. rotundus infesting rice-onion areas are already identified. However, this area is still new in rice production. Although previous reports showed that some herbicides were effective against the lowland ecotype C. rotundus, further validation is required to confirm their efficacies against weeds in rice fields. This study hypothesized that (a) C. rotundus variants had different growth responses to herbicide and flooding interventions and (b) C. rotundus of irrigated lowland rice can be controlled by prolonged flooding.
Materials and MethodsTime and place of the study
Four studies were conducted at the experimental area of the Crop Protection Division of the Philippine Rice Research Institute Central Experiment Station (PhilRice CES) in Maligaya, Science City of Muñoz, Nueva Ecija (N 15° 40' 11.415", E 120° 53' 24.3802"). Experiments I, II, and III were conducted from December 2018 to May 2019 while Experiment IV was performed from September 2019 to August 2020.
Collection of tubers
Tubers of C. rotundus variants were collected in irrigated lowland ricefield in La Purisima, Aliaga (150
30’ 59” N, 1200 49’ 44” E); rainfed lowland ricefield, Alalay Chika, Lupao (150 50’ 55” N, 1200 54’ 15” E); and rice-vegetable field, Abar 2nd, San Jose City (150
47’ 04” N, 1200 57’ 48” E), in Nueva Ecija. Mature plants at reproductive phase were carefully pulled out from the soil using a shovel. Matured tubers were separated from the mother plants, placed inside a plastic container, and were cleaned in the weed science laboratory of PhilRice CES.
Pre-germination of tubers
Cleaned tubers of each variant were separately placed and sealed inside moistened, autoclavable plastics (30 cm [length] x 20 cm [width]); placed inside a temperature-controlled oven (Yamato DN83 constant temperature) at 40°C for 4 h; planted at 3 tubers per pot inside 24 cm diameter and 20 cm-
depth clay pots previously filled with 5 kg sterilized moist soil (Maligaya soil series [PhilRice, 2008]); and allowed to grow and multiply into new plants under screenhouse conditions. After one month, all tubers attached to each mother plant were harvested, cleaned, and planted in plastic containers (33 cm [length] x 23 cm [width] x 10 cm [height]) filled with 2 kg of sterilized soil; and allowed to sprout for 4 days. Tubers showing 3 - 5 cm initial growths on roots and shoots were selected and grouped into different sizes (large, medium, and small). All sizes were included in each treatment. Four-day-old pre-germinated tubers were kept in a cool place and then planted immediately in each experiment.
Experimental treatments, designs, and measurements
Experiment I. Regrowth in response to herbicides
A cylindrical plastic pot (20 cm-diameter, 15 cm-depth) filled with 3.5 kg of sterilized moist soil was used in this experiment. Every pot was planted equidistantly with five pre-germinated tubers each of C. rotundus variant (variant A from irrigated-lowland rice field; variant B, rainfed-lowland rice field; and variant C, rice-vegetable field) at 3 cm depth. Growing plants in each pot were then subjected to five different herbicides: (a) pendimethalin, applied 3 DAP at 4 L ha-1, (b) pyribenzoxim + cyhalofop butyl, 16 DAP at 1 L ha-1, (c) bispyribac-sodium, 21 DAP at 250 ml ha-1, (d) MCPA 30 DAP at 2 L ha-1, and (e) 2,4-D amine salt, 30 DAP at 1 Lha-1. A pot with growing tubers and water was included as control. Plants were grown under saturated conditions. The pots were arranged in 3:6 factorial design in randomized complete block design (RCBD) with three replications. Height, number of off-shoots and tubers, and dry weight of shoots and roots, as well as the tubers were gathered 20 days after herbicide application.
Experiment II. Regrowth in response to flooding durations
Using the same experimental unit as in Experiment I, each pot was planted with one pre-germinated tuber of each variant at 3 cm-depth. Pots were divided and subjected to seven flooding durations (0 - 7, 0 - 14, 0 - 21, 7 - 49, 14 - 49, 21 - 49, and 0 - 49 [continuous flooding and saturated conditions] DAP). To ensure uniform conditions, pots with tubers were placed inside a rectangular steel pan (200 cm x 75 cm x 20 cm) and flooded with clean tap water at 5 cm depth (5 cm deep from the soil surface in each pot and 15 cm deep from bottom of steel pan). Pots with tubers under early flooding treatment (0 - 7, 0 - 14, and 0 - 21 DAP) were immediately transferred in an area suited for the regrowth of tubers. Pots with tubers under late flooding treatment (7 - 49, 14 - 49, and 21 -

Regrowth of Cyperus rotundus L. Variants in ricefields
RICE-BASED BIOSYSTEMS JOURNAL (2022) 10: 1-8 3
49 DAP) were also placed in the same area. All pots were arranged in 3:8 factorial design in RCBD with three replications. Height, number of off-shoots and tubers, and dry weight of shoots and roots as well as the tubers were gathered at 49 DAP.
Experiment III. Regrowth of clipped tubers in response to flooding durations
This experiment was conducted simulating the effects of tillage. Pre-germinated tubers of C. rotundus variant A were cut and divided into four clipping treatments: unclipped (whole tuber), clipped once (cutting results in two fragments), clipped twice (cutting results in three fragments), and clipped thrice (cutting results in four fragments). All tubers were separately planted 3 cm deep in each pot with the same sizes and soil volume as in Experiment I (Figure 1). The pots with tubers were subjected to the same flooding treatments using the same materials, processes, and conditions used in Experiment II. Pots were arranged in 4:8 factorial design in RCBD with three replications. Height, number of off-shoots and tubers, and dry weight of shoots and roots as well as the tubers were also gathered at 49 DAP.
Figure 1. Unclipped and clipped tubers of Cyperus rotundus variant A: (a) whole tuber, (b) clipped once, (c) clipped twice, and (d) clipped thrice.
Experiment IV. Regrowth in response to prolonged submergence
A cylindrical clay pot (17 cm-diameter, 15-cm depth) filled with 1.5 kg of sterilized soil was used. Each pot was equidistantly planted with 10 pre-germinated tubers of C. rotundus variant A at 3 cm depth. All pots were divided and submerged for 90, 180, 270, and 360 DAP. All pots were placed in a rectangular steel pan (200 cm x 75 cm x 20 cm) and submerged in water at 5 cm depth (5 cm deep from the soil surface in each pot and 15 cm deep from bottom of steel pan). After each duration, all pots were placed
in an area suited for the regrowth of tubers (e.g., full exposure to sunlight and enough moisture in pots). The pots were arranged in completely randomized design (CRD) with four replications. Number of tubers that regrew were recorded for 30 days. Percentage of germinated tubers was calculated by dividing the number of tubers that regrew to the total number of pre-germinated tubers planted in each pot.
Statistical analysis
Data were analyzed through ANOVA using STAR 201. Once heterogeneity of data was detected, means were subsequently converted using square-root method [(x + 0.5)1/2] and ran again using ANOVA (Gomez and Gomez, 1984). All means were compared using either Fishers’ LSD or Tukey’s HSD at 5% level of significance.
Results Regrowth in response to herbicides
Height (P=0.000), number of off-shoots (P=0.000), number of tubers (P=0.002), and dry-weight of off-shoots (P=0.001) of C. rotundus were significantly influenced by the interaction of variants and herbicides, as well as the main effect of variants. The weed’s growth parameters were also significantly influenced by the main effect of herbicides.
In the controlled treatment, C. rotundus variant A (from irrigated-lowland rice field) grew tallest; variant C (from rice-vegetable field) produced the highest mean number of off-shoots, number of tubers, and dry-weight of off-shoots (Table 1). Growth variables of variant C had no significant differences from those of variants A and B (from rainfed-lowland rice field). In the study of Fuentes et al. (2010) on morphological characteristics of two C. rotundus ecotypes, the lowland ecotype (collected from ricefield with continuously flooded soil) was taller by 30% and heavier by 50% than the upland ecotype (from a vegetable field with continuously aerated soil). Pena-Fronteras et al. (2009), Dimaano (2009), and Casimero (2000) also had the similar findings.
Heights, numbers of off-shoots and tubers, as well as the dry-weights of off-shoots of the three variants were less affected by pyribenzoxim + cyhalofop-butyl but not affected by pendimethalin. However, all the growth variables including dry-weights of roots and tubers were completely inhibited by bispyribac-sodium, 2,4-D, and MCPA (Table 2).

Regrowth of Cyperus rotundus L. Variants in ricefields
4 RICE-BASED BIOSYSTEMS JOURNAL (2022) 10: 1-8
Table 1. Growth and development of Cyperus rotundus variants as influenced by different herbicides.
Variant Herbicides
Untreated Pend Pycy Bisp 2,4-D MCPA
Height (cm plant-1)
A 23.5a 26.0a 17.8a 0a 0a 0a
B 11.5c 13.7c 13.0a 0a 0a 0a
C 15.8b 18.0b 14.8ab 0a 0a 0a
Number of off-shoots pot-1
A 35.0a 30.7a 9.7b 0a 0a 0a
B 35.0a 34.7a 30.7a 0a 0a 0a
C 40.3a 24.0a 32.0a 0a 0a 0a
Number of tubers pot-1
A 40.3a 40.3a 31.0a 0a 0a 0a
B 40.3a 40.3a 31.0a 0a 0a 0a
C 47.0a 26.3b 16.7b 0a 0a 0a
Dry-weight of off-shoots (g pot-1)
A 6.3a 7.8a 6.7a 0a 0a 0a
B 6.3a 7.8a 6.7a 0a 0a 0a
C 8.6a 9.3a 6.8a 0a 0a 0a
Variant A = from irrigated lowland ricefield, Variant B = from rainfed-lowland ricefield, and Variant C = from rice-vegetable fieldPend = pendimethalin, Pycy = pyribenzoxim + cyhalofop-butyl, Bisp = bispyribac-sodiumMeans in columns with the same letter are not significantly different at 5% level of significance using Tukey’s HSD
Table 2. Dry-weights of roots and tubers of Cyperus rotundus variants influenced by different herbicides.
Herbicides Dry-weight of Roots (g pot-1)
Dry-weight of Tubers (g pot-1)
Untreated 7.5a 5.1a
1 7.6a 4.6a
2 2.3b 4.2a
3 1.8b 0b
4 2.2b 0b
5 2.7b 0b
Means in columns with the same letter are not significantly different at 5% level of significance using Tukey’s HSD
Regrowth in response to flooding durations
Heights (P=0.000), number of off-shoots (P=0.000), number of tubers (P=0.000), dry-weight of off-shoots (P=0.024), and dry-weight of roots (P=0.001) of CYPRO were significantly influenced by the main effect of flooding durations. Each growth variable, however, was not influenced by the interaction of variants and flooding durations nor by the main effect of variants.
The three C. rotundus variants grew tallest under full saturated conditions. But their heights were not significantly different when flooded within 0 to 7, 0 - 14, 7 - 49, 14 - 49, and 21 - 49 DAP (Figure 2A). On the other hand, their heights were shortest when
flooded within 0 to 21 DAP completely suppressed under continuous flooding (0 - 49 DAP).
All variants had higher mean numbers of off-shoots when flooded within 21 to 49 DAP (Figure 2B). The numbers, however, were not significantly different when flooded from 0 to 7, 0 - 14, 7 - 49, 14 - 49, 21 - 49 DAP under full saturated conditions. Same as height, their number of off-shoots were very least when flooded within 0 to 21 DAP and were completely inhibited under continuous flooding.
Every variant produced the highest mean number of tubers under saturated conditions but none at all in continuous flooding (Table 3). Flooding for 7 and 14 DAP resulted in production of comparable numbers of tubers under saturated conditions. In addition, mean number of tubers did not significantly differ in 0 - 7, 0 - 14, 0 - 21, and 21 - 49 DAP; 0 - 14, 0 - 21, 7 - 49, 14 - 49, and 21 - 49 DAP. The variants, however, produced the least numbers of tubers when flooded within 0 - 21 DAP.
Dry-weights of shoots and roots were not significantly different in all flooding durations. Despite that, dry-weights of off-shoots and roots were highest when flooded within 14 - 49 and 21 - 49 DAP; the least in 0 - 21 DAP. No shoots and roots were observed under continuous flooding.

Regrowth of Cyperus rotundus L. Variants in ricefields
RICE-BASED BIOSYSTEMS JOURNAL (2022) 10: 1-8 5
Table 3. Number of tubers and dry-weights of Cyperus rotundus variants at different flooding durations.
Flooding Duration (DAP)
Number of Tubers
pot-1
Dry-weight of Off-shoots
(g pot-1)
Dry-weight of Roots(g pot-1)
0 - 49 (Flooded) 0d 0b 0b
0 - 7 15.6ab 1.0ab 2.3ab
0 - 14 11.1abc 1.4ab 3.1ab
0 - 21 6.6bcd 0.6ab 1.2b
7 - 49 3.6cd 2.0ab 4.9ab
14 - 49 2.7cd 4.1a 7.8ab
21 - 49 4.7bcd 4.0ab 10.7a
0 - 49 (Saturated) 20.9a 2.2ab 4.1ab
Means in columns with the same letter(s) are not significantly different at 5% level of significance
Regrowth of clipped tubers in response to flooding durations
All growth variables of C. rotundus variant A (from irrigated-lowland ricefield) were influenced by the main effect of flooding duration (P=0.000) but not by the interaction of clipping and flooding duration nor by the main effect of clipping.
Unclipped tuber (whole) of variant A had the highest mean height, numbers of off-shoots and tubers, and dry-weight of roots compared with tubers that were clipped once, twice, or thrice (Table 4). However, no significant differences were observed on growth variables of weeds grown from either unclipped or clipped tubers.
Heights of variant A grown from unclipped and clipped tubers were tallest when planted under saturated conditions; no growth in continuous flooded conditions (Figure 3). All tubers had rapid regrowth when flooded within 7 - 49, 14 - 49, and 21 - 49 DAP. Regrowth was delayed by 14 days when flooded from 0 to 7 DAP and by 21 and 28 days when flooded within 0 - 14 and 0 - 21 DAP, respectively. Mean heights and number of tubers off-shoots in flooding durations of 0 - 7, 0 - 14, and 0 - 21 DAP were comparable in continuous flooding. Mean height and number of off-shoots were very least when flooded for 21 DAP.
Variant A mean numbers of tubers flooded within 0 - 7 DAP was comparable in saturated conditions. Meanwhile, mean numbers of tubers flooded within 0 - 14, 0 - 21, 7 - 49, 14 - 49, and 21 - 49 DAP were comparable in continuous flooding (Table 5).
Figure 2. Height and number of shoots of Cyperus rotundus at different flooding durations. Means with the same letter(s) are not significantly different at 5% level of significance.
Table 4. Growth variables of Cyperus rotundus variant A as influenced by different clipping treatments.
ClippingHeight
(cm)Number of Off-shoots
plant-1
Number of Tubers
pot-1
Dry-weight of Off-shoots
(g pot-1)
Dry-weight of Roots (g pot-1)
Whole 18.5a 7.8a 6.3a 3.8a 2.9a
1x 15.8a 7.2a 5.7a 4.2a 2.7a
2x 14.3a 5.6a 3.7a 2.6a 1.3a
3x 10.4a 3.8a 3.4a 1.9a 1.9a
Means in columns with the same letter are not significantly different at 5% level of significance.

Regrowth of Cyperus rotundus L. Variants in ricefields
6 RICE-BASED BIOSYSTEMS JOURNAL (2022) 10: 1-8
Dry-weights of off-shoots of C. rotundus variant A in saturated conditions did not significantly differ in flooding durations of 7 - 49, 14 - 49, and 21 - 49 DAP. On the other hand, dry-weights of shoots in continuous flooded conditions did not differ in flooding durations of 0 - 7, 0 - 14, 0 - 21, 7 - 49, and 14 - 49 DAP. Dry-weights of roots in saturated conditions did not significantly differ when flooded within 0 to 7, 7 - 49, 14 - 49, and 21 - 49 DAP. All tubers had the least mean number of tubers, dry-weight of off-shoots, and dry-weight of roots when flooded in 0 - 21 DAP.
Table 5. Number of tubers and dry weights of irrigated lowland rice weed variant as influenced by different flooding durations.
Flooding Durations(DAP)
Number of Tubers pot-1
Dry-weight of Off-shoots
(g pot-1)
Dry-weight of Roots (g pot-1)
0 - 49 FFC 0c 0c 0b
0 - 7 7.5ab 4.0abc 2.3ab
0 - 14 3.1bc 1.3bc 0.8b
0 - 21 0.8c 0.3bc 0.3b
7 - 49 3.9bc 3.5abc 2.9ab
14 - 49 4.6bc 4.2abc 2.6ab
21 - 49 5.5bc 5.7ab 3.6ab
0 - 49 FSC 12.8a 6.2a 5.0a
FFC – full flooded conditions, FSC – full saturated conditions; means in columns with the same letter(s) are not significantly different at 5% level of significance
Regrowth in response to prolonged burial and submergence
Whole tubers of C. rotundus variant A had 85 to 90% germinations after prolonged burial in the soil and submergence in water (Figure 4). No significant differences arose on germination of all tubers at 90, 180, 270, and 360 DAP (P=0.8709). Tubers germinated as early as 5 days, the latest at 27 DAP. Higher germination of all tubers was obtained between 9 and 11 days after draining the plots and planting under saturated conditions.
DiscussionPlants used escape and quiescence strategies to
deal with stress due to flooding (van Veen et al., 2014; Striker, 2012; Bailey-Serres and Voesenek, 2008; Mommer and Visser, 2005). In the escape strategy, roots elongate rapidly to reach the water surface to restore contact of leaves for photosynthesis and re-aeration of underwater organs via aerenchyma tissues. Meanwhile, plants that use the quiescence strategy reduce their energy by stopping some growth processes to conserve carbohydrates that can be used for regrowth when flooding recedes.
This study found that C. rotundus variant A (from irrigated-lowland rice field) used the quiescence strategy to survive under flooded conditions. This theory is supported by the work of Fuentes et al. (2010) who studied the physiological responses of lowland ecotype C. rotundus (also from irrigated-lowland rice field) to flooding. In their experiments, they found that this weed is able to adapt under these conditions due to its bigger tubers that have high carbohydrate and soluble sugar content; larger stems, and more air spaces (aerenchyma) that enable oxygen diffusion to its submerged parts. They also found that the weed can
Figure 3. Height and number of off-shoots of Cyperus rotundus variant A as influenced by different flooding durations (means with the same letters are not significantly different at 5% level of significance).
Figure 4. Percentage germination of Cyperus rotundus variant A after prolonged submergence (error bars are + SE of the means)
Regrowth of Cyperus rotundus L. Variants in ricefields
RICE-BASED BIOSYSTEMS JOURNAL (2022) 10: 1-8 7
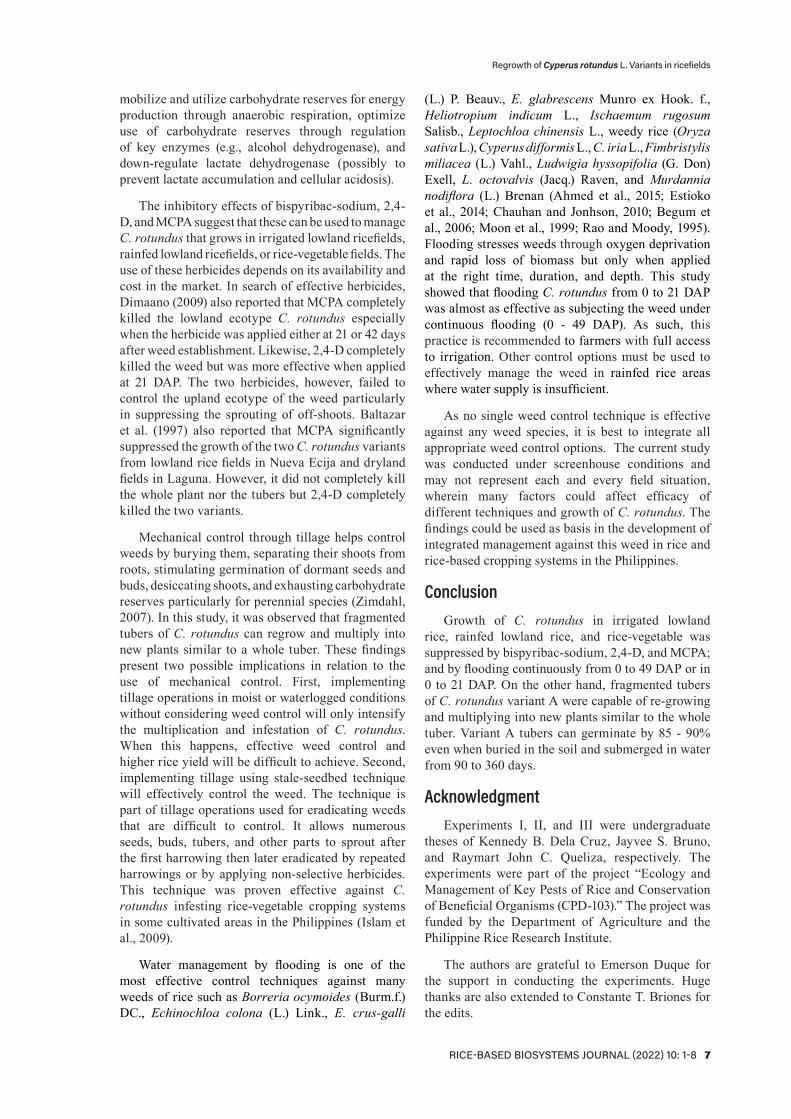
mobilize and utilize carbohydrate reserves for energy production through anaerobic respiration, optimize use of carbohydrate reserves through regulation of key enzymes (e.g., alcohol dehydrogenase), and down-regulate lactate dehydrogenase (possibly to prevent lactate accumulation and cellular acidosis).
The inhibitory effects of bispyribac-sodium, 2,4-D, and MCPA suggest that these can be used to manage C. rotundus that grows in irrigated lowland ricefields, rainfed lowland ricefields, or rice-vegetable fields. The use of these herbicides depends on its availability and cost in the market. In search of effective herbicides, Dimaano (2009) also reported that MCPA completely killed the lowland ecotype C. rotundus especially when the herbicide was applied either at 21 or 42 days after weed establishment. Likewise, 2,4-D completely killed the weed but was more effective when applied at 21 DAP. The two herbicides, however, failed to control the upland ecotype of the weed particularly in suppressing the sprouting of off-shoots. Baltazar et al. (1997) also reported that MCPA significantly suppressed the growth of the two C. rotundus variants from lowland rice fields in Nueva Ecija and dryland fields in Laguna. However, it did not completely kill the whole plant nor the tubers but 2,4-D completely killed the two variants.
Mechanical control through tillage helps control weeds by burying them, separating their shoots from roots, stimulating germination of dormant seeds and buds, desiccating shoots, and exhausting carbohydrate reserves particularly for perennial species (Zimdahl, 2007). In this study, it was observed that fragmented tubers of C. rotundus can regrow and multiply into new plants similar to a whole tuber. These findings present two possible implications in relation to the use of mechanical control. First, implementing tillage operations in moist or waterlogged conditions without considering weed control will only intensify the multiplication and infestation of C. rotundus. When this happens, effective weed control and higher rice yield will be difficult to achieve. Second, implementing tillage using stale-seedbed technique will effectively control the weed. The technique is part of tillage operations used for eradicating weeds that are difficult to control. It allows numerous seeds, buds, tubers, and other parts to sprout after the first harrowing then later eradicated by repeated harrowings or by applying non-selective herbicides. This technique was proven effective against C. rotundus infesting rice-vegetable cropping systems in some cultivated areas in the Philippines (Islam et al., 2009).
Water management by flooding is one of the most effective control techniques against many weeds of rice such as Borreria ocymoides (Burm.f.) DC., Echinochloa colona (L.) Link., E. crus-galli
(L.) P. Beauv., E. glabrescens Munro ex Hook. f., Heliotropium indicum L., Ischaemum rugosum Salisb., Leptochloa chinensis L., weedy rice (Oryza sativa L.), Cyperus difformis L., C. iria L., Fimbristylis miliacea (L.) Vahl., Ludwigia hyssopifolia (G. Don) Exell, L. octovalvis (Jacq.) Raven, and Murdannia nodiflora (L.) Brenan (Ahmed et al., 2015; Estioko et al., 2014; Chauhan and Jonhson, 2010; Begum et al., 2006; Moon et al., 1999; Rao and Moody, 1995). Flooding stresses weeds through oxygen deprivation and rapid loss of biomass but only when applied at the right time, duration, and depth. This study showed that flooding C. rotundus from 0 to 21 DAP was almost as effective as subjecting the weed under continuous flooding (0 - 49 DAP). As such, this practice is recommended to farmers with full access to irrigation. Other control options must be used to effectively manage the weed in rainfed rice areas where water supply is insufficient.
As no single weed control technique is effective against any weed species, it is best to integrate all appropriate weed control options. The current study was conducted under screenhouse conditions and may not represent each and every field situation, wherein many factors could affect efficacy of different techniques and growth of C. rotundus. The findings could be used as basis in the development of integrated management against this weed in rice and rice-based cropping systems in the Philippines.
ConclusionGrowth of C. rotundus in irrigated lowland
rice, rainfed lowland rice, and rice-vegetable was suppressed by bispyribac-sodium, 2,4-D, and MCPA; and by flooding continuously from 0 to 49 DAP or in 0 to 21 DAP. On the other hand, fragmented tubers of C. rotundus variant A were capable of re-growing and multiplying into new plants similar to the whole tuber. Variant A tubers can germinate by 85 - 90% even when buried in the soil and submerged in water from 90 to 360 days.
AcknowledgmentExperiments I, II, and III were undergraduate
theses of Kennedy B. Dela Cruz, Jayvee S. Bruno, and Raymart John C. Queliza, respectively. The experiments were part of the project “Ecology and Management of Key Pests of Rice and Conservation of Beneficial Organisms (CPD-103).” The project was funded by the Department of Agriculture and the Philippine Rice Research Institute.
The authors are grateful to Emerson Duque for the support in conducting the experiments. Huge thanks are also extended to Constante T. Briones for the edits.

Regrowth of Cyperus rotundus L. Variants in ricefields
8 RICE-BASED BIOSYSTEMS JOURNAL (2022) 10: 1-8
Literature CitedAhmed S, Opeña JL, Chauhan BS (2015) Seed germination
ecology of doveweed (Murdannia nudiflora) and its implication for management in dry-seeded rice. Weed Science 63(2): 491-501
Bailey-Serres J, Voesenek LACJ (2008) Flooding stress: acclimations and genetic diversity. Annual Review of Plant Biology 59: 313-339
Baltazar AM, Martin EC, Casimero MC, Bariuan FV, Obien SR, De Datta SK (1997) Characterization of purple nutsedge in rainfed rice–onion systems. Proceedings of the 16th Asian-Pacific Weed Science Society Conference (pp 326-329). Malaysia: Kuala Lumpur
Begum MA, Juraimi AS, Amartalingam R, Man AB, Rastans SOBS (2006) The effects of sowing depth and flooding on the emergence, survival, and growth of Fimbristylis miliacea (L.) Vahl. Weed Biology and Management 6(3): 157-164
Beltran JC, Bordey FH, Launio CC, Litonjua AC, Manalili RG, Mataia AB, Relado RZ, Moya PF (2016) Pesticide use and practices. In Bordey FH, Moya PF, Beltran JC, Dawe DC (Eds.). Competitiveness of Philippine Rice in Asia (pp 75-86). Maligaya, Science City of Muñoz, Nueva Ecija: Philippine Rice Research Institute
Casimero MC (2000) Population dynamics, growth, and control of weeds in rainfed rice-onion cropping systems (PhD Dissertation) [pp 139]. Philippines: University of the Philippines Los Baños, College, Laguna
Chauhan BS, Jonhson DE (2010) The role of seed ecology in improving weed management strategies in the tropics. Advances in Agronomy 105: 221-262
Dimaano NGB (2009) Control of lowland ecotype purple nutsedge (Cyperus rotundus): Efficacy of selected herbicides. Proceedings of 40th PMCP Anniversary and Annual Scientific Conference (pp 90-91). Philippines: Baguio City
Donayre DKM, Martin EC, Casimero MC, Juliano LM, Beltran JC (2015) Prevalence of lowland ecotype Cyperus rotundus L. and weed management of rice farmers in Aliaga, Nueva Ecija, Philippines. IAMURE International Journal of Ecology and Conservation 13(1): 14-28
Donayre DKM, Endino CA, Seville CU, Ciocon IMG (2014) Major weeds and farmers’ weed management practices in rainfed ricefields of Negros Island, Philippines. Asia Life Sciences 23(1): 137-148
Estioko LP, Miro B, Baltazar AM, Merca FE, Ismail AM, Johnson DE (2014) Differences in responses to flooding by germinating seeds of two contrasting rice cultivars and two species of economically important grass weeds. AoB Plants 6: plu064
Fuentes RG, Baltazar AM, Merca FE, Ismail AM, Johnson DE (2010) Morphological and physiological responses of lowland purple nutsedge (Cyperus rotundus L.) to flooding. AoB Plants 2010: plq010
Gomez KA, Gomez AA (1984) Statistical Procedures for Agricultural Research Second Edition (pp 680). USA: John Wiley & Sons
Holm LG, Plucknett DL, Pancho JV, Herberger JP (1977) The world’s worst weeds: Distribution and biology (pp 609). East-West Center, University Press of Hawaii
Islam MN, Baltazar AM, De Datta SK, Karim ANM (2009) Management of purple nutsedge (Cyperus rotundus L.) tuber populations in rice-onion cropping systems. Philippine Agricultural Scientist 92(4): 407-418
Kabawata O, Nishimoto RK (2003) Temperature and rhizome chain effect on sprouting of purple nutsedge (Cyperus rotundus) ecotypes. Weed Science 51: 348-355
Moody K (1996) Weed community dynamics in ricefields. In Naylor R (Ed.). Herbicides in Asian Rice: Transitions in Weed Management (pp 27-36). Palo Alto, California Institute for International Studies, Stanford University and Manila Philippines: International Rice Research Institute
Mommer L, Visser EJW (2005) Underwater photosynthesis in flooded terrestrial plants: A matter of leaf plasticity. Annals of Botany 96(4): 581-589
Moon BC, Park ST, Kim SC, Kwon SJ, Mortimer AM, Piggin C (1999) Weed emergence as affected by burying depth and water management. Korean Journal of Crop Science 44(1): 32-27
Okafor LI, De Datta SK (1974) Competition between weeds and upland rice in monsoon Asia. Philippine Weed Science Bulletin 1(1): 39-45
Okafor LI, De Datta SK (1976) Competition between upland rice and purple nutsedge for Nitrogen, moisture, and light. Weed Science 24(1): 43-46
Pablico PP (1986) Lowland rice field weeds in Nueva Ecija, Philippines. International Rice Research Notes 11: 29
Peña-Fronteras JT, Villalobos MC, Baltazar AM, Merca FE, Ismail AM, Johnson DE (2009) Adaptation to flooding in upland and lowland ecotypes of Cyperus rotundus, a troublesome sedge weed of rice: tuber morphology and carbohydrate metabolism. Annals of Botany 103: 295-302
PhilRice [Philippine Rice Research Institute] (2008) Simplified Keys to Soil Series: Nueva Ecija (pp 57). Maligaya, Science City of Muñoz, Nueva Ecija: Philippine Rice Research Institute
Rao AN, Moody K (1995) Effect of seedling depth and soil moisture regime on emergence of Ischaemum rugosum and Echinochloa glabrescens. In Proceedings of the 15th Asian-Pacific Weed Science Society Conference (pp. 520-524). Japan: Tsukuba
Striker GG (2012) Flooding stress on plants: anatomical, morphological and physiological responses. In Mworia J (Ed.). Botany (pp 1-28). IntechOpen: http://www.intechopen.com (accessed September 14, 2018)
van Veen H, Vashisht D, Voesenek LACJ, Sasidharan R (2014) Different Survival Strategies Amongst Plants to Cope with Underwater Conditions. In van Dongen J and Licausi F (Eds.). Low-Oxygen Stress in Plants. Plant Cell Monographs 21: 329-349
Wills GD (1998) Comparison of purple nutsedge (Cyperus rotundus) from around the world. Weed Technology 12: 491-503
Zimdahl RL (2007) Fundamentals of Weed Science Third Edition. USA: Academic Press

RICE-BASED BIOSYSTEMS JOURNAL (2022) 10: 9-14 9
INFLUENCE OF FIMBRISTYLIS MILIACEA (L.) VAHL ON GROWTH AND YIELD OF BULB ONION (ALLIUM CEPA L.)
Kaiser Angelo A. Morla1, Celynne O. Padilla1, and Dindo King M. Donayre2
1Central Luzon State University, 2Philippine Rice Research Institute, Science City of Muñoz, Nueva Ecija
*Corresponding author: [email protected]
AbstractAn experiment was conducted to determine the influence of F. miliacea (FIMMI) on the growth and yield of
transplanted onions (TPO) and direct-seeded onions (DSO) grown in plastic box with FMMI at 0, 10, 15, 20, and 25 plants/box until maturity. From 5 densities, shoot biomass of FIMMI increased by 1.3 - 2.7 folds in TPO; 1.6 - 13 folds in DSO as density increased by 15 - 25. Bulb weights of TPO were reduced by 11, 17.4, 22.1, and 38.7%; DSO by 86.4, 89.6, 88.8, and 88.1% at 10, 15, 20, and 25 FIMMI densities, respectively. Bulb weights of DSO suffered the greatest reductions due to weed competition. Density and shoot biomass of FIMMI were strongly negatively correlated to bulb weights of TPO (r = -0.987, -0.995) and DSO (r = -0.986, -0.999). Regression analysis showed that 97.49 and 99.95% of TPO bulb weights and 97.25 and 99.95% of DSO were attributed to the density and shoot biomass of FIMMI. This study showed that FIMMI is an important weed of bulb onion and could reduce yield if left uncontrolled throughout the crop’s growing season.
Keywords: Cyperaceae, Globe-fringe Rush, Quadratic Equation, Additive Design
IntroductionOnion (Allium cepa L.) is one of the major
vegetable crops in the Philippines planted after rice (PhilRice, 2007). In 2019, bulb onion was planted in 19,900 hectares with production volume of 222,100 metric tons valued at PhP 5.6 billion (PSA, 2020). These figures are expected to further rise to meet the demands for culinary purposes.
Growth and development of onions can be negatively affected by weeds. In a field study in Nueva Ecija, weeds left uncontrolled reduced the yield of red and white onions by as much as 78 and 97%, respectively (Baltazar et al., 1998a). In another study, yield of red onion was also reduced by 79% when major weeds such as Cyperus rotundus L., Echinochloa colona (L.) Link., and Trianthema portulacastrum L. were left uncontrolled (Baltazar et al., 1998b). It is important, therefore, that these weeds must be controlled to safeguard the quantity and quality of yield as well as ensure decent income from onions.
Fimbristylis miliacea (L.) Vahl, commonly known as globe fringe-rush, is a C4 and perennial plant that has an erect and flattened stem; linear, flat, and soft leaves that are overlapping in two rows; numerous, globose to ovoid in shape; and brown to brown-orange spikelets (Moody et al., 2014). It has similar distinguishing characteristics as F. littoralis Gaudich. var. littoralis except that it has 4 - 5 involucral bracts
that are much shorter than its inflorescence (Pancho and Obien, 1995).
FIMMI is a weed of irrigated and rainfed rice in the Philippines (Donayre et al., 2014; Pancho and Obien, 1995). It mainly propagates by seeds at a reproduction rate of 42,275 seeds/plant (Begum et al., 2008a). Many of its seeds germinate by as much as 50% when dropped at soil surface under saturated conditions or flooding is delayed up to 28 days after seeding (DAS), according to Chauhan and Johnson (2009) and Begum et al. (2006). When not controlled, FIMMI could reduce the yield of rice by as much as 49% (Begum et al., 2008b).
FIMMI had been reported infesting onion fields along with other weed species (Baltazar et al., 1999). Its negative impact on growth and yield of bulb onion has not been quantified. This paper hypothesized that (a) FIMMI, when allowed to grow at certain density level until maturity, will reduce growth and yield of transplanted and direct-seeded onions under greenhouse conditions, and (b) there will be difference on yield reductions between transplanted and direct-seeded rice.
Materials and MethodsLocation and materials
The study was conducted under greenhouse conditions at Barangay Matingkis, Science City of Muñoz, Nueva Ecija from November 2018 to April
FULL PAPER

Influence of Fimbristylis miliacea (L.) Vahl on Bulb Onion (Allium cepa L.)
10 RICE-BASED BIOSYSTEMS JOURNAL (2022) 10: 9-14
2019. Red Pinoy onion variety was planted as it has wide usage by growers in Nueva Ecija. Planting materials were prepared following the standard procedure of PhilRice (2003). The soil (Maligaya soil series) used as medium for planting was collected from the same field area and location. To avoid growth of other plants, collected soil samples were pulverized, placed inside a polypropylene plastic bag, and sterilized by mixing with water and heating for 8 hours in a huge cylindrical metal drum. After sterilization, soil sample in each bag was allowed to cool and then transferred into black plastic boxes. FIMMI plants, on the other hand, were prepared by collecting mature seeds in the same location. Seeds were pre-germinated on top of moist soil inside a plastic box and allowed to germinate and grow for 25 days under moist condition and full sunlight.
Experimental design
Black, plastic box (area = 173 cm2, depth = 23 cm) filled with 10 kg of sterilized, moist soil was the experimental unit of this study. Each box was planted with either 30-40-day-old seedlings of TPO or 30 seeds of DSO. Twenty-five-day old FIMMI plants were simultaneously planted in each experimental unit at 0, 10, 15, 20, and 25 plants/box. Each experimental unit with transplanted bulb onion and FIMMI or direct-seeded bulb onion and FIMMI at different densities were arranged separately in randomized complete block design with four replications. All plants inside each experimental unit were grown until the crop’s maturity. All plants were nourished with synthetic fertilizers based on the recommended rates for onion. Water was also supplied in each box, and maintained at saturation level whenever necessary. An additive design of crop-weed competition, where density of onion was held constant and that of FIMMI was kept increased, was utilized to determine the outcome of FIMMI - onion competition (Swanton et al., 2015).
Data collected
Height of transplanted and direct-seeded onion at 77 days after planting (DAT) or DAS were determined
by measuring it from the base to tallest leaf of each plant. Using a ruler, the average length of the leaves was also determined by measuring the length of the three leaves close to the base of each plant. Number of leaves per plant was manually counted. Root and bulb lengths and bulb width were also measured using a ruler. Leaf and bulb weight and shoot-weights of FIMMI were also recorded after harvest. Percentage reductions on growth variables and bulb weight (Y) of onion were calculated using the equation Y (%) = [(Y0 – Y1)/Y0] *100, where, Y0 as the mean value at 0 weed density and Y1 as the mean values at 10, 15, 20, and 25 weed densities, respectively.
Statistical analysis
All the data were subjected to ANOVA using STAR 201 while treatment means were compared using Fischer’s least significant difference (LSD) at 5% level of significance. A Pearson-product moment correlation coefficient (r) was also computed to determine the strength and direction of relationship between FIMMI variables (density and shoot weight) and bulb weight of onion. Data on density and shoot weight of FIMMI and bulb weight of onion were fitted to the polynomial quadratic equation (Y = α + ax + bx2) to determine if the density and shoot weight of the weed are significant contributors and predictors to bulb weight.
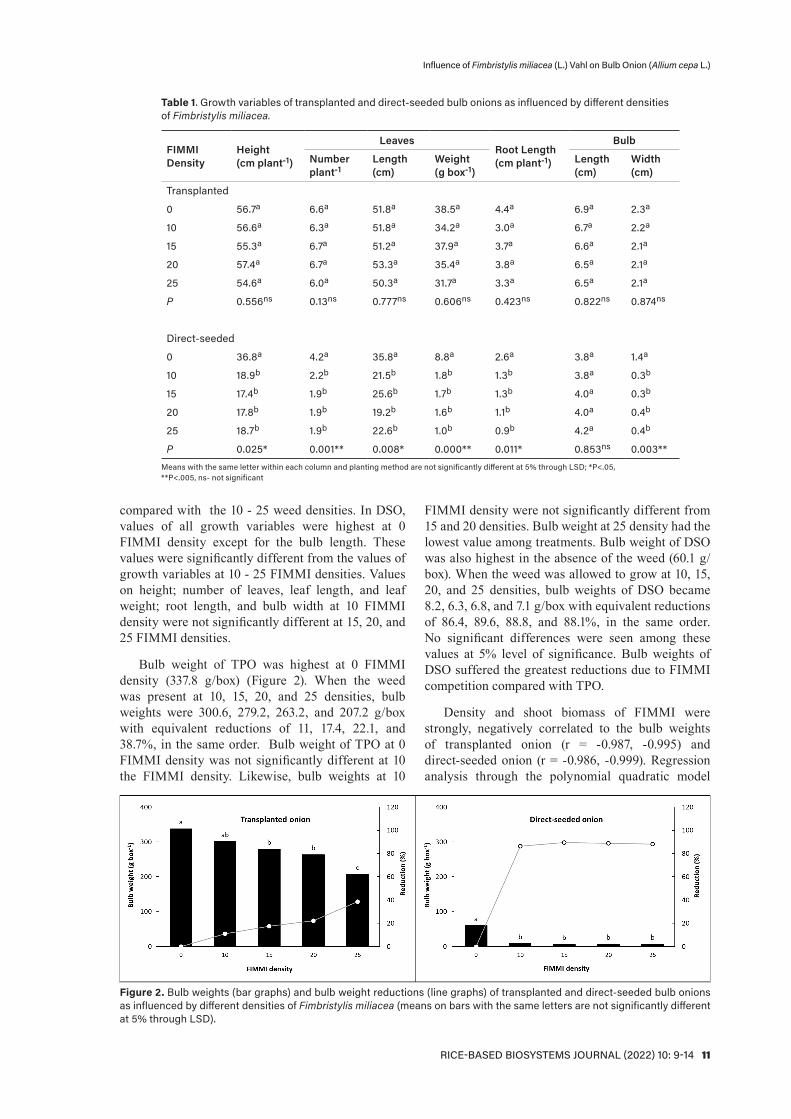
Results and DiscussionShoot biomass of FIMMI in TPO was 9.9, 12.6,
15.6, and 26.2 g/box while that in DSO was 86.9, 95.0, 114.4, and 128.6 g/box at 10, 15, 20, and 25 densities, respectively (Figure 1). From 10 density each box, its shoot biomass increased by 1.3, 1.6, and 2.7 folds in TPO while 1.6, 11.6, and 13 folds in DSO as density increased by 15, 20, and 25.
Values of all growth variables of TPO at 0 FIMMI density were not significantly different at 10, 15, 20, and 25 FIMMI densities (Table 1). Nevertheless, the values on leaf weight, root length, bulb length, and bulb width were still highest at 0 FIMMI density
Figure 1. Shoot biomass of FIMMI at each density.
Influence of Fimbristylis miliacea (L.) Vahl on Bulb Onion (Allium cepa L.)
RICE-BASED BIOSYSTEMS JOURNAL (2022) 10: 9-14 11
compared with the 10 - 25 weed densities. In DSO, values of all growth variables were highest at 0 FIMMI density except for the bulb length. These values were significantly different from the values of growth variables at 10 - 25 FIMMI densities. Values on height; number of leaves, leaf length, and leaf weight; root length, and bulb width at 10 FIMMI density were not significantly different at 15, 20, and 25 FIMMI densities.
Bulb weight of TPO was highest at 0 FIMMI density (337.8 g/box) (Figure 2). When the weed was present at 10, 15, 20, and 25 densities, bulb weights were 300.6, 279.2, 263.2, and 207.2 g/box with equivalent reductions of 11, 17.4, 22.1, and 38.7%, in the same order. Bulb weight of TPO at 0 FIMMI density was not significantly different at 10 the FIMMI density. Likewise, bulb weights at 10
FIMMI density were not significantly different from 15 and 20 densities. Bulb weight at 25 density had the lowest value among treatments. Bulb weight of DSO was also highest in the absence of the weed (60.1 g/box). When the weed was allowed to grow at 10, 15, 20, and 25 densities, bulb weights of DSO became 8.2, 6.3, 6.8, and 7.1 g/box with equivalent reductions of 86.4, 89.6, 88.8, and 88.1%, in the same order. No significant differences were seen among these values at 5% level of significance. Bulb weights of DSO suffered the greatest reductions due to FIMMI competition compared with TPO.
Density and shoot biomass of FIMMI were strongly, negatively correlated to the bulb weights of transplanted onion (r = -0.987, -0.995) and direct-seeded onion (r = -0.986, -0.999). Regression analysis through the polynomial quadratic model
Table 1. Growth variables of transplanted and direct-seeded bulb onions as influenced by different densities of Fimbristylis miliacea.
FIMMI Density
Height(cm plant-1)
LeavesRoot Length (cm plant-1)
Bulb
Number plant-1
Length (cm)
Weight (g box-1)
Length (cm)
Width(cm)
Transplanted
0 56.7a 6.6a 51.8a 38.5a 4.4a 6.9a 2.3a
10 56.6a 6.3a 51.8a 34.2a 3.0a 6.7a 2.2a
15 55.3a 6.7a 51.2a 37.9a 3.7a 6.6a 2.1a
20 57.4a 6.7a 53.3a 35.4a 3.8a 6.5a 2.1a
25 54.6a 6.0a 50.3a 31.7a 3.3a 6.5a 2.1a
P 0.556ns 0.13ns 0.777ns 0.606ns 0.423ns 0.822ns 0.874ns
Direct-seeded
0 36.8a 4.2a 35.8a 8.8a 2.6a 3.8a 1.4a
10 18.9b 2.2b 21.5b 1.8b 1.3b 3.8a 0.3b
15 17.4b 1.9b 25.6b 1.7b 1.3b 4.0a 0.3b
20 17.8b 1.9b 19.2b 1.6b 1.1b 4.0a 0.4b
25 18.7b 1.9b 22.6b 1.0b 0.9b 4.2a 0.4b
P 0.025* 0.001** 0.008* 0.000** 0.011* 0.853ns 0.003**Means with the same letter within each column and planting method are not significantly different at 5% through LSD; *P<.05, **P<.005, ns- not significant
Figure 2. Bulb weights (bar graphs) and bulb weight reductions (line graphs) of transplanted and direct-seeded bulb onions as influenced by different densities of Fimbristylis miliacea (means on bars with the same letters are not significantly different at 5% through LSD).

Influence of Fimbristylis miliacea (L.) Vahl on Bulb Onion (Allium cepa L.)
12 RICE-BASED BIOSYSTEMS JOURNAL (2022) 10: 9-14
(second order) also showed that 97.49 and 99.95% of bulb weight of TPO; 97.25 and 99.95% bulb weight of DSO were explained by the density and shoot biomass of FIMMI (Figure 3). The analysis also showed that density and shoot biomass of the weed were significant predictors and contributors to the bulb weights of TPO (P = 0.025, 0.005) and DSO (P = 0.027, 0.000).
FIMMI reduced the bulb weights of transplanted and direct-seeded onions suggesting that failure to control the weed in the field will definitely result in reduction of crop yield. Begum et al. (2008b) also reported that FIMMI at 1000 plants/m2 reduced the number of panicles per plant by 39%, number of tillers per plant (38%), shoot biomass (42%), and grain yield of direct-seeded rice (49%) when the weed is allowed to grow and compete until maturity. When herbicide (Fentrazamide + propanil) was applied, no reductions occurred on the same growth variables; only 2% on grain yield.
The lighter weight of FIMMI in transplanted onion could be attributed to its size and height disadvantage over the crop during the competition periods. In rice cropping system, weeds in transplanted rice have lesser growths and negative effects on yield due to the crop’s head start from the day of planting until maturity (Ampong-Nyarko and De Datta, 1991). In reverse, weeds in direct-seeded rice have better
growths and greater negative impacts on yield due to earlier competition at younger growth stages of the crop (Casimero, 2004).
FIMMI had more serious effects on yield of direct-seeded onion than that of transplanted onion. In rice, most weeds also had more serious effects on direct-seeded seedlings than on transplanted seedlings. For example, Commelina diffusa Burm f. at 1 - 7 plant/pot, reduced the grain yield of direct-seeded rice 9.8 - 34% while only 5.4 - 22.4% on transplanted rice (Cabiao et al., 2020). Ampong-Nyarko and De Datta (1991) explained that transplanted seedlings hardly lose yield due to their head start over the weeds. Meanwhile, direct-seeded rice is highly prone to yield losses because its germinating seeds grow together with weeds (Casimero, 2004). The absence of early flooding to suppress weeds during the initial growth phase, absence of seedling size to compete with weeds, and the uneven stand that provides space for weeds to grow further aggravate the vulnerability of direct-seeded seedlings to weed competition and yield losses (Kumar et al., 2017; Chauhan, 2012).
Knowledge on weed biology and ecology helps decide what, how, and when to implement control measures effectively. In this study, FIMMI significantly reduced the growth and yield of onion implying that control must be executed whenever the weed grows and competes in the field. In managing
Figure 3. Predicted bulb weights of transplanted and direct-seeded bulb onions as a function of density and shoot biomass of Fimbristylis miliacea.

Influence of Fimbristylis miliacea (L.) Vahl on Bulb Onion (Allium cepa L.)
RICE-BASED BIOSYSTEMS JOURNAL (2022) 10: 9-14 13
FIMMI and other weeds of onion, PhilRice (2007) recommends to implement the following control measures: thorough land preparation, rice straw mulching, rice hull burning, hand weeding, and herbicide application. Use of stale-seedbed technique was further recommended particularly for perennial weeds like the Cyperus rotundus L.
Conclusion This study showed that F. miliacea had influence
on the growth and yield of transplanted and direct-seeded bulb onions if left uncontrolled from the time of planting until maturity. The weed reduced the bulb weights of transplanted bulb onion by 11 - 38.7%; direct-seeded bulb onion by 86.4 - 88.1% at 10, 15, 20, and 25 density box-1. Bulb weights of DSO suffered the greatest reductions due to weed competition. There are several options on how to manage the weed. However, careful selection, planning, and implementation must be done to achieve effective, economical, and environmentally sound weed management. To know more about its ecology, the predictive models under field conditions and the different weed management techniques through a holistic approach must be evaluated.
AcknowledgmentThe authors would like to thank Constante T.
Briones for the English critic.
Literature CitedAmpong-Nyarko K, De Datta SK (1991) A handbook for
weed control in rice. Los Baños, Laguna, Philippines: International Rice Research Institute
Baltazar AM, Martin EC, Casimero MC, Bariuan FV, Obien SR, De Datta SK (1999) Major weeds in rainfed rice-onion cropping systems in the Asian site in the Philippines. Philippine Agricultural Scientist 82: 166-177
Baltazar AM, Bariuan FV, Martin EC, Casimero MC, Bajo FJr, Obien SR, De Datta SK, Mortimer AM (1998a) Complementary weed control strategies in rice-vegetable systems (Evaluation of integrated weed management strategies against weeds in onion). In Integrated Pest Management Collaborative Research Support Program: Fifth Annual Report 1997-1998 (pp. 239-243). USA: Virginia Polytechnic Institute and State University
Baltazar AM, Bariuan FV, Martin EC, Casimero MC, Bajo FJr, Obien SR, De Datta SK, Mortimer AM (1998b) Integrated weed management strategies in rice-onion systems. In Integrated Pest Management Collaborative Research Support Program: Sixth Annual Report 1998-1999 (pp. 341-349). USA: Virginia Polytechnic Institute and State University
Begum MA, Juraimi AS, Amartalingam R, Man AB, Rastans SOBS (2006) The effects of sowing depth and flooding on the emergence, survival, and growth of Fimbristylis miliacea (L.) Vahl. Weed Biology and Management 6: 157-164
Begum MA, Juraimi JS, Amartalingam R, Rastan SOBS, Man AB (2008a) Growth and development of Fimbristylis miliacea (L.) Vahl. Biotropia 15(1): 1-11
Begum MA, Juraimi JS, Omar SRS, Rajan A, Man AB (2008b) Effect of herbicides for the control of Fimbristylis miliacea (L.) Vahl in rice. Journal of Agronomy 7(3): 251-257
Cabiao MNS, Quilantang JR, Alberto RT, Donayre DKM (2020) Interference of Commelina diffusa Burm. f. on rice growth and yield. Rice-based Biosystems Journal 6: 49-55
Casimero MC (2004) Managing weeds in rice. In Redoña ED, Castro AP, Llanto GP (Eds.). Rice Integrated Crop Management: Towards a Rice Check System in the Philippines (pp 107-119). Science City of Muñoz, Nueva Ecija: Philippine Rice Research Institute
Chauhan BS (2012) Weed management in direct-seeded rice systems (p 20). Los Baños, Laguna, Philippines: International Rice Research Institute
Chauhan BS, Johnson DE (2010) The role of seed ecology in improving weed management strategies in the tropics. Advances in Agronomy 105: 221-262.
Donayre DKM, Endino CA, Seville CU, Ciocon IMG (2014) Major weeds and farmers’ weed management practices in rainfed ricefields of Negros, Philippines. Asia Life Sciences 23(1): 137-148
Kumar V, Opeña J, Valencia K, Thi HL, Son NH, Donayre DKM, Janiya J, Johnson DE (2017) Rice weed management in Southeast Asia. In Rao AN, Matsumoto H (Eds.). Weed Management in Rice in the Asian-Pacific Region (pp 282-307). Asian Pacific Weed Science Society; Japan: The Weed Science Society of Japan; and India: Indian Society of Weed Science
Pancho JV, Obien SR (1995) Manual of ricefield weeds in the Philippines. Science City of Muñoz, Nueva Ecija: Philippine Rice Research Institute
PhilRice [Philippine Rice Research Institute] (2003) Philippine Rice Production Training Manual. Science City of Muñoz, Nueva Ecija: Philippine Rice Research Institute
PhilRice [Philippine Rice Research Institute] (2007) Integrated Pest Management in Rice-Vegetable Cropping Systems. Science City of Muñoz, Nueva Ecija: Philippine Rice Research Institute
PSA [Philippine Statistics Authority] (2020) 2019 Selected Statistics on Agriculture. Diliman, Quezon City, Philippines: Philippine Statistics Authority
Swanton CJ, Nkoa R, Blackshaw RE (2015) Experimental methods for crop-weed competition studies. Weed Science Special Issue 63: 2-11
Moody K, Munroe CE, Lubigan RT, Paller JrEC, Barcial PM, Fabro LE, Janiya JD, Magsino GL (2014) Major Weeds of the Philippines 2nd Edition. Los Baños, Laguna, Philippines: University of the Philippines Los Baños


RICE-BASED BIOSYSTEMS JOURNAL (2022) 10: 15-22 15
IntroductionEarthworms generally have positive effects on
many ecosystems. It plays important roles in soil physical, chemical, and biological properties. They eat soil organic matter and increase availability of plant nutrients in their casts (Somniyam and Suwanwaree, 2009). Worm casts are generally richer in exchangeable calcium, potassium, and phosphorus than the surrounding soil, while earthworms and their excretions are valuable nitrogen sources (Ramsay and Hill, 1978). In 2010, Choosai et al., reported that significant increase in rice yield resulted from earthworm (Drawida beddardi) activity.
Earthworms have three broad ecological groups (Epigeic, Endogeic, Anecic) based on what they eat and where they tend to live in the soil. The groups can be distinguished by their sizes and colors. Epigeic species are reddish-brown and small, usually less than 7.5-cm-long when mature or adult. Adult
CHARACTERISTICS, IDENTITY, AND SURVIVAL OF RED EARTHWORM INFESTING IRRIGATED RICE
PADDIES IN FOUR PHILIPPINE PROVINCES Femia R. Sandoval1, Edwin C. Martin1*, and Clarence B. Codod2
1Crop Protection Division, Philippine Rice Research Institute, Science City of Muñoz, Nueva Ecija2Former PhilRice staff
Corresponding author: [email protected]
AbstractEarthworm infestations were reported in the rice farms in Mountain Province, Kalinga, Nueva Ecija, and
Pangasinan in 2015. Characteristics, identity, and behavior of these invading earthworms were unknown; thus, survey and collection were conducted at affected areas during 2015 wet season. Adult living and preserved specimens were brought to the University of the Philippines Los Baños for identification. Laboratory experiment was conducted to assess if flooding causes earthworm mortality. Test tubes (80 ml) were filled with 40 g soil and watered at different levels: saturated 0 - 0.5, 2.5, 5, and 10 cm (T1, T2, T3, and T4), consisting three earthworms per tube with eight replications. Screenhouse experiment was also conducted to observe the effects of earthworms on the destruction of levees. Eight-inch pails with 100 earthworms per container were used. Pails were 10-cm high with three replications and watered at 0 - 0.5, 3, and 10 (T1, T2, and T3).
The earthworm collected from sampling sites was identified as Pontoscolex corethrurus (Müller, 1857). It has pink to almost transparent skin, zygolobic prostomium, saddle-type clitellum with 9 - 11 segments, and 4 closely paired setae (hooked) per segment. It prefers to be at the upper 15 cm of the saturated paddy soil. P. corethrurus were most problematic on the seedbed as they cover the emerging seeds with thick mud castings causing seedlings to develop longer roots and stems, which are succulent and hard to pull; thus, resulting in increased seedling mortality. The highest number of earthworms sampled was recorded in Bontoc, Mountain Province (10,647 m2) at seedling stage. During fallow period when the paddy was dry, earthworm populations sampled in moist irrigation canals in Sagada, Mountain Province and Pangasinan were 4,870 and 3,398 m2, respectively. Flooding caused earthworm mortality. Moreover, levees with 10 cm water level were eroded from 10 cm to 1.33 cm high after 14 days of flooding. Earthworms flock in paddy levees to have access to oxygen and survive the flooded condition.
Keywords: Endogeic, Glossoscolecidae, Irrigated Rice
earthworms have collars or clitellum that juveniles lack. They live in the surface litter above the mineral soil or the top inch (2.5 cm) and make no permanent burrows. They feed on surface litter, fungi, and microorganisms that they digest. Endogeic species are easily separated from the epigeic and anecic by their color. Their skin pigmentation is not the usual red brown, but light grey and sometimes with an albino-pink head. Adult size range from 7.5 to 12.5 cm long. They make extensive branching burrow systems in the top 50 cm (20 in) of the soil and feed by ingesting large amounts of soil and digesting its organic matter, fungi, and microorganisms. Anecic species make vertical burrows up to 2 m (6 ft) deep in the soil, but they feed on fresh surface litter. The common night crawler is an example of an anecic species, which has reddish brown color and larger than either of the other two groups. Adults are usually 12.5 - 20-cm long (Smithsonian Environmental Research Center, 2014) with 80 - 198 body segments. The prostomium
FULL PAPER

Characteristics, Identity, and Survival of Red Earthworm Infesting Philippine Irrigated Rice Paddies
16 RICE-BASED BIOSYSTEMS JOURNAL (2022) 10: 15-22
is either epilobic, zygolobic, or tanylobic, which is the first segment in the anterior end of a worm’s body and functions like an overlip of a feeding animal (Chaudhuri and Bhattacharjee, 2011).
Earthworms may damage rice crops. A study by Barrion and Litsinger (1997) in the Cordillera Region showed that the earthworms’ burrowing activity caused leaks in rice levees, and body setae mechanically injured roots resulting in plant stunting and seedling death. Barrion and Litsinger (1997) also reported a small red earthworm measuring 40 - 75 mm long and 1.5 - 2 mm wide. They identified it as Dichogaster curgensis Michaelsen, a pest of irrigated lowland rice that belongs to the family Ochtochaetidae.
Rice yield from irrigated farms shared more than three-fourths to the total palay production in the Philippines. The share in 2015 and 2016, which was recorded at 76.8%, gradually declined by more than 75% in 2017 and 2018. The top producing region was Central Luzon with 3.30 million metric tons or 18.2% of the country’s total palay production in 2015(PSA, 2019).
Rice farmers in Mountain Province, Kalinga, Pangasinan, and Nueva Ecija reported earthworm infestations and sought for immediate action and recommended management options. They said that earthworms bury emerging rice seedlings by covering them with thick mud castings, which eventually killed some seedlings; while surviving seedlings grew longer succulent stems. This observation was also observed in the experimental fields at PhilRice Central Experiment Station (PhilRice CES) in Nueva Ecija.
Characterization, proper identification, and understanding the behavior of these earthworms are necessary to provide proper recommendations. This study characterized and identified the earthworm-causing problem in select rice field areas in Luzon and evaluated the pests’ survival under flooded conditions and its effects to rice levees.
Materials and MethodsSurvey and focus group discussion
Focus group discussions (FGD) were conducted with 16 farmers and local government officials of Sagada, Mountain Province to gather baseline information in 2015 wet season when the infestations were reported. Farmers were asked when they first observed these earthworms in their fields and how they were affecting their rice crop. Fields were surveyed and samples were collected from sites identified by the local government units.
Characterization and identification
Paddy soil samples with earthworms were collected from four 10-cm-deep, 0.3 x 0.3 m quadrats. Soil samples were contained in circular plastic basins measuring 20 x 15 cm (diameter x height) with an area of 314.16 cm2 with 2 kg capacity. Earthworms were counted on soil samples from each quadrat. Four quadrats per site were sampled. The earthworms were sensitive and tended to retract in their burrows inside the soil upon sensing movements in the ground. Thus, samples were collected 1 - 2 min after entry in the field when the earthworms were actively moving their tails in the shallow water above the soil surface (Figure 1). Earthworms were placed in vials containing 70% ethanol and transferred to laboratory for identification. All worms were washed clean of adhering soil, patted dry with a paper towel, and preserved in 4% formaldehyde (Fender, 1985). Representative samples were preserved for further identification and references.
Using adult specimens, the external characteristics of the earthworms were described as follows: segmental position of the clitellum on the body, body length, number of segments, tail or body shapes (flattened or circular), pigmentation, and clitellum shape (saddle or annular).
Dr. Nestor T. Baguinon, retired Professor at the College of Forestry and Natural Resources,
Figure 1. Earthworm tails on the surface of irrigation water on the side of a seedbed (A) and tails of earthworms actively moving underwater (B).

Characteristics, Identity, and Survival of Red Earthworm Infesting Philippine Irrigated Rice Paddies
RICE-BASED BIOSYSTEMS JOURNAL (2022) 10: 15-22 17
Department of Forest Biological Sciences, University of the Philippines Los Baños, identified the live and preserved samples.
Earthworm survival on flooding and its effect on levees
Laboratory experiment was conducted to assess if flooding causes P. corethrurus’ mortality. Test tubes (80 ml) were filled with 40 g dried powdered paddy soil and watered at different levels. Treatment 1 served as the control with 0 - 0.5 cm water level; the other treatments have 2.5, 5, and 10 cm water levels. Three earthworms were placed in each test tube with eight replications per treatment. The setup was maintained inside the laboratory with average daily temperature of 27°C.
Soil samples were collected at PhilRice CES in 2015 wet season. A one-kilogram sample was collected in 30 cm x 30 cm sites in the upper 1 - 15 cm and 16 - 30 cm soil layers in flooded and saturated conditions. Six samples were collected per soil condition; flooded when water level was 10-cm-deep, and saturated when water level was 0 - 0.5-cm-deep.
A screenhouse experiment was also conducted to observe the effects of earthworms on the destruction of levees. Levee was created in 8-inch pails at 10-cm-height with 0 - 0.5, 3, and 10 cm water levels and three replications. One hundred earthworms at juvenile stage were introduced per pail.
Laboratory and screenhouse experiments were arranged in completely randomized design. All the data gathered were subjected to ANOVA while treatment means were separated by either standard error or Fisher’s least significant difference test at 5% level of significance through SAS 9.1.3.
Results and DiscussionSurvey and focus group discussion
The populations of earthworms varied in sampling sites (Table 1). The highest number was recorded in Bontoc, Mountain Province with an average of 10,647 individuals per m-2. Higher number of earthworms and greater damage were observed during field establishment and planting season in December and January, according to the farmers in Sagada, Mountain Province.
The least earthworm population of 1,369 m-2 was recorded in site 2 in Science City of Muñoz, Nueva Ecija. Based on field observations and assessment, worms were present and active 15 cm in the top of moist soil but not in dry paddy, especially after harvest when the field is left to dry. In moist irrigation canals of Sagada, Mountain Province and Pangasinan sampling sites, earthworm populations of 4,870 and 3,398 m-2 were observed during fallow period when the paddies were dry. Barrion and Litsinger (1997) described that the crop could tolerate earthworm (Dichogaster curgensis Michaelsen) densities of 140 m-2 but suffered significant yield loss when populations were 10 times higher and complete loss at 700 m-2. Dr. Baguinon, an expert in the field of Ecology, stated in a personal communication that earthworms tend to dig deeper below ground and encyst to survive dry conditions and aestivate until conditions become favorable. Among the known tolerance mechanisms of earthworms is their ability to enter dormancy in response to higher temperatures, low soil moisture, or both (Lee, 1985). The ubiquitous tropical peregrine species P. corethrurus can become dormant in drought conditions (James and Hendrix, 2004).
Table 1. Average earthworm population in sampling sites.
Province Municipality Population in 1m2 Remarks
MountainProvince
Sagada (Ambasing) 4,870 Fallow period, irrigation canal
Sagada (Balugan) 8, 594 Rice plants are at flowering stage, juveniles with some adults
Bontoc 10, 647 Rice plants at seedling stage, mostly adult
Kalinga Pasil 6,732 Seedbed ready for planting, juveniles
Tabuk City 1,695 Seedbed approximately 20 DAS, mixed
Nueva Ecija Maligaya, Science City of Muñoz (site 1)
6,963 Seedbed ready for planting, juveniles
Maligaya, Science City of Muñoz (site 2)
1,369 Field ready for planting, juveniles, noticeably thin (1 mm) average of 40-mm-long
Pangasinan Asingan 2,021 After seedling pulling
Umingan 3,398 Fallow period, irrigation canal
Bolinao 2,610 Tillering stage
Bani 2,316 Vegetative stage
Labrador 5,753 Vegetative stage

Characteristics, Identity, and Survival of Red Earthworm Infesting Philippine Irrigated Rice Paddies
18 RICE-BASED BIOSYSTEMS JOURNAL (2022) 10: 15-22
FGD and personal interviews with farmers and field workers disclosed that the red earthworms were first observed in Ambasing, Sagada, Mountain Province in 1980s; Balugan, Sagada, Mountain Province, 2009; Pasil, Kalinga, 2000; and Science City of Muñoz, Nueva Ecija, 2008. Rice farmers agreed on the troubles caused by earthworms. They reported that the small red earthworms were most problematic on the seedbed. They cover the emerging seeds with thick mud castings resulting in seedlings with succulent stems that are hard to pull or even mortality. According to Joshi et al. (1999), earthworms interfere with germination by covering the seeds in the seedbed, as well as scraping the root tissues of the rice seedlings (Barrion and Litsinger, 1997). In contrast, farmer-respondents in Pangasinan did not perceive earthworms as a problem in their rice fields because of the difference in soil types and moisture.
In the terraced rice fields of Kalinga and Mt. Province, farmers stressed that the earthworms’ burrowing activity resulted in faster seepage of flood water and further loosened the compaction, which destroyed levees and terrace walls. This complements the findings of Castonguay (2014), Gomez and Pacardo (2005), and Joshi et al. (1999), specifying that the earthworms caused the degradation of the Ifugao rice terraces. The length of damaged walls in each terrace ranged 2.8 - 8 m while damaged dikes measured 0.5 - 25 m (Gomez and Pacardo, 2005). Endogeic species like P. corethrurus make extensive branching burrow systems in the top 50 cm (20 in) of the soil (Smithsonian Environmental Research Center, 2014) that increase water infiltration rate (Lavelle et al., 1987). In this case, greater number of earthworms with extensive burrows would result in wastage of irrigation water in the rice fields and later water stress on plants and growth of weeds (Joshi et al., 1999) and prolonged drought during dry season (Castonguay, 2014) especially in fields without sufficient water supply.
At least three farmers in Sagada, Mountain Province observed that the co-occurrence of giant earthworms further aggravates the destruction of stone terrace walls. As a result, the rice field easily loses water and causes water stress to the rice plants especially in areas where irrigation water is not readily available. According to a farmer in Sagada, keeping the seedbed moist and sprinkling the crop can lessen earthworm activities while saturated seedbed increases their activity. Meanwhile, field workers at PhilRice CES said that earthworm damage could be avoided by elevating the seedbed. Seedling mortality and challenges on water management were the major problems encountered due to this infestation. No reduction in yield was observed.
Characterization and identification
The earthworm collected from sampling sites in Mt. Province, Kalinga, Pangasinan, and Nueva Ecija was identified as Pontoscolex corethrurus (Müller, 1857), which belongs to the South American family Glossoscolecidae. This species is believed to have originated in northeast South America where the rest of its cogenitors are found (Righi, 1984). These earthworms are distinguished through their pink to almost transparent skin (Figure 2A), zygolobic prostomium (Figure 2B), saddle-type clitellum with 9 - 11 segments (Figure 2C), and four closely paired setae (hooked) per segment (Figure 2D). On the average, adult earthworms have 207 segments. When anesthetized with 70% ethyl alcohol, the average size is 74.7 mm (length) x 1.8 mm (width) with 5 - 6 mm clitellum located at the 14 - 24th segment from the prostomium.
The cocoon of P. corethrurus (Figure 3) had either brown, dark green, or black color. It measures 4.6 mm (length) x 1.9 mm (width). Dark green cocoons weighed 0.005758 g while black cocoons weighed 0.006415 g, each cocoon contained two juveniles. Newly emerged juveniles measured 8 - 10 mm long by 0.5 - 1 mm
Figure 2. A 7.5 cm P. corethrurus earthworm with pink skin (A), zygolobic prostomium (B), saddle-type clitellum (C), and setae in each segment (D).

Characteristics, Identity, and Survival of Red Earthworm Infesting Philippine Irrigated Rice Paddies
RICE-BASED BIOSYSTEMS JOURNAL (2022) 10: 15-22 19
diameter (Figure 3). Earthworms are hermaphrodites having both male and female reproductive organs. P. corethrurus, Dichogaster affinis, M. houlleti, and O. beatrix have the ability to produce cocoons by self-fertilization or parthenogenesis (Chaudhuri and Bhattacharjee, 2011). Cocoon production ranges from 1 to 20 per mating depending on species (Edwards, 2004). Chaudhuri and Bhattacharjee in 2011 reported that cocoon development varied from 21 to 51 days.
The endogeic species P. corethrurus was collected and described in crop fields in Blamenau, Brazil 160 years ago (Mϋller, 1857). It is an invasive earthworm that has colonized most land transformed by human activities in the humid tropics (Lavelle et al., 1987). In Ifugao, the group of Joshi et al. (1999) identified terrace-dwelling earthworm pest species: Polypheretima elongate, Pheretima spp. Pontoscolex corethrurus, Pithemera bicincta, and Amynthas diffringens. Only P. corethrurus exists in the forests.
The P. corethrurus earthworm and the “giant earthworms” (Pheretima spp.) that affected rice production in the Banaue rice terraces are two of the invasive alien species (IAS) present in the Philippines as reported by Dr. Ravindra Joshi in 2006. IAS include exotic or non-native micro and macro-species introduced, accidentally or deliberately, to a place that is not part of their natural habitat or distributional range and have adverse ecological and economic impacts (Bruton and Merron, 1985; De Silva, 1989).
A monoculture of P. corethrurus earthworm was observed and collected in all sampling sites, although some farmers noticed the presence of other earthworms such as the giant earthworms (Sagada, Mt. Province) but with much fewer population. This conforms to the findings of Marichal et al. (2010), which stated that native species tend to disappear as a result of disturbances such as land cultivation, which destroy their habitats and reduce their food sources. This habitat destruction resulted in the emergence of P. corethrurus especially in soils with increased pH, C, and nutrient contents. In the sampling sites at PhilRice CES, the soil pH ranges from 5.63 to 5.91. Edwards (2004) stated that most earthworms prefer normal soil pH while few of them can live in acidic soil (Ismail and Murthy, 1985) as validated by the
study conducted by Nath and Chaudhuri in 2010, which concluded that P. corethrurus can tolerate and even prefer acidic soil.
Survival in flooded condition
Barrion and Litsinger (1997) reported that in the Cordillera rice terraces, flooding at 14 cm depth caused 20.2% mortality of Dichogaster curgensis after seven days. A laboratory experiment was conducted to further validate whether flooding will cause mortality to P. corethrurus,.
Seven days after the experiment was set up, earthworm casualty was significantly different in 5 and 10 cm water levels with 37.5 and 41.67% mortality, respectively (Figure 4A). Dead earthworms surfaced on the soil (Figure 4C) with pale color and disintegrated skin starting from the posterior part (Figure 4B). Mortality was evident with the presence of pungent odor from the tubes with dead earthworms. No earthworms died in the test tubes with 0 - 0.5 cm water level. Access to oxygen was the only difference between flooded and unflooded treatments, the most probable cause of earthworm’s mortality in this experiment. P. corethrurus earthworms can prosper on paddies, along the margins and paddy levees but not in flooded soils (James and Hendrix, 2004).
Figure 3. P. corethrurus cocoon (left) and newly emerged juvenile (right).
P. corethrurus is generally found in the top 30 cm of the soil (Lavelle et al., 1995). It prefers to be at the upper 15 cm saturated paddy soil than at the lower 16 - 30 cm layer. This is indicated by 108.57% difference in the number of earthworms extracted from the soil
Figure 4. Earthworm mortality at 7 days in different water levels under laboratory condition (A), pale color and disintegrated skin starting from the posterior part (B), and dead earthworms surfaced on the soil (C).

Characteristics, Identity, and Survival of Red Earthworm Infesting Philippine Irrigated Rice Paddies
20 RICE-BASED BIOSYSTEMS JOURNAL (2022) 10: 15-22
sample taken at the upper (15 cm) and the lower (30 cm) soil layer (Figure 5A). It was further observed that the number of earthworms is 157.95% higher in saturated soil than in paddy soil with 5 - 10 cm flood water (Figure 5B). Being a geophagous polyhumic endogeic species (Lavelle, 1981), P. corethrurus is generally found in the top 30 cm of the soil and has a relatively high organic matter assimilation efficiency (Lavelle et al., 1995); allowing it to survive even in very poor soils and giving it high ability to colonize new habitats (Lavelle et al., 1987).
Earthworms need oxygen to live; breathing through their moist slimy skin in a process called diffusion whereby molecules move from an area with higher to lower concentration. To survive, the amount of oxygen inside the earthworm should always be less (lower concentration) than its environment. In flooded condition, water takes the place of air in the paddy soil, which may suffocate the earthworms and eventually die when their skin dries up as exchange of gas cannot take place (Lauren, 2006).
Effects on levees
Earthworm burrowing activities loosened and destroyed levees in the pail with 10 cm water level. Thick casting was noticeable on the side of levees flooded at 3 - 5 cm and was otherwise present at the base of the levee with 0 - 1 cm water level. The height of levees on the pails with 10 cm water level was lower than those on pails with saturated soil and with 3 cm water level. The earthworms flock in paddy levees and other elevated areas with better airflow and soil condition (Figure 6).
Fourteen days after flooding, the levees flooded with 10 cm water level were degraded from 10 - 1.33 cm height while the levees flooded with 3 cm water had 7 cm height. Levees in saturated soil were the tallest at 8.33 cm high (Figure 7). Dikes bordering the paddy fields act as refuge for earthworms and allow them to survive during the dry season (Choosai et al., 2009), which may also be true when the paddy is flooded. This study found that flooding causes
Figure 5. Average number of earthworms in 30 cm x 30 cm quadrat sampling area relative to sampling depth (A) and water level (B).
Figure 6. Loosening of levees by earthworms in flooded soil.

Characteristics, Identity, and Survival of Red Earthworm Infesting Philippine Irrigated Rice Paddies
RICE-BASED BIOSYSTEMS JOURNAL (2022) 10: 15-22 21
earthworm mortality. Earthworms also aggregate on paddy levees (dikes) and terrace walls to have access to oxygen when the field is flooded. As such, earthworm burrowing loosens the compaction of levees and terrace walls leading to the collapse of the structure; thus, paddy water is released and wasted.
Conclusion The earthworms collected in farmers’ fields in
Mt. Province, Kalinga, Nueva Ecija, and Pangasinan were identified as Pontoscolex corethrurus. These earthworms were numerous on the upper saturated layer (15 cm) of the soil than in the flooded paddy. Recognizable through their pink to almost transparent skin, zygolobic prostomium, saddle-type clitellum with 9 - 11 segments and four closely paired setae per segment. Adult earthworms have 207 segments, average size is 74.7 mm (length) x 1.8 mm (width). Clitellum (5 - 6 mm) is located at the 14 - 24th segment starting from the prostomium. The cocoon had either brown, dark green, or black color measuring 4.6 mm (length) x 1.9 mm (width). They are most problematic on the seedbed where they cover the emerging seeds with thick mud castings resulting in seedlings with longer roots and stems that are succulent and hard to pull. In some cases, mortality was observed on seedlings that were heavily covered with mud castings.
Flooding resulted in P. corethrurus morality. In flooded soil, the earthworms flock on levees and other elevated areas for survival, which then resulted in loosening and destruction of levees and afterwards released water from the irrigation. Thus, maintenance of 3 - 5 cm water level to reduce earthworm population and prevent levees destruction is recommended.
Earthworm contributes to soil fertility but in some cases particularly in this study, P. corethrurus high population causes problems on seedlings and eventually destroys levees. However, further study on the effect of earthworm on rice plants and farm inputs are recommended to assess their impact on yield.
Literature CitedBarrion AT, Litsinger JA (1997) Dichogaster nr. curgensis
Michaelsen (Annelida: Octochaetidae): An earthworm pest of terraced rice in the Philippine Cordilleras. Crop Protection 16(1): 89-93
Bruton MN, Merron SV (1985) Alien and translocated aquatic animals in Southern Africa: A general introduction checklist and bibliography South African National Scientific Programs Report 113:1-71
Castonguay AC (2014) Assessment of resilience and adaptability of social-ecological systems: A case study of the Banaue rice terraces. Institute for Natural Resource Conservation, Christian-Albrechts Universität zu Kiel. 21(2): 15
Chaudhuri PS, Bhattacharjee S (2011) Reproductive biology of eight tropical earthworm species of rubber plantations in Tripura, India. Tropical Ecology 52(1): 49-60
Choosai C, Mathieu J, Hanboonsong Y, Jouquet P (2009) Termite mounds and dykes are biodiversity refuges in paddy fields in North-eastern Thailand. Environmental Conservation 36(1): 71-79
Choosai C, Jouquet P, Hanboonsong Y, Hartmann C (2010) Effects of earthworms on soil properties and rice production in the rainfed paddy fields of Northeast Thailand. Applied Soil Ecology 45(3): 298-303
De Silva SS (1989) Exotic aquatic organisms in Asia. Asian Fisheries Society, Special Publication 3 (pp 154). Manila, Philippines: Asian Fisheries Society
Edwards CA (2004) Earthworm ecology, 2nd edition. New York, Washington: CRC Press
Fender, WM (1985) Earthworms of the Western United States. Part I. Lumbricidae. Megadrilogica 4(5): 93-129
Gomez RA, Pacardo EP (2005) Survey of the damage in the Ifugao Rice Terraces and its environmental dynamics. Philippine Agricultural Scientist 88(1): 133-137
Smithsonian Environmental Research Center (2014) Great Lakes Worm Watch. Earthworms by Ecological Group: A Guide to Earthworms You’ll Find in The Great Lakes Region. Retrieved from https://serc.si.edu/sites/default/files/types_of_earthworms_diagram.pdf (accessed December 2014)
Ismail SA, Murthy VA (1985) Distribution of earthworms in Madras. Proceedings: Animal Sciences 94: 557-566
James SW, Hendrix PF (2004) Invasion of exotic earthworms into North America and other regions. In Edwards CA (Ed.). Earthworm Ecology, Second Edition (75-88). Bocan Raton, FL: CRC Press
Joshi RC, Matchoc ORO, Cabigat JC, James SW (1999) Survey of earthworms in the Ifugao Rice Terraces, Philippines. Journal of Environmental Science and Management 2(2): 1-12
Joshi RC (2006) Invasive alien species (IAS): Concerns and status in the Philippines. In Proceedings of the International Workshop on the Development of Database (APASD) for Biological Invasion (pp 8). Taichung, Taiwan, China: FFTC. Retrieved from https://www.fftc.org.tw/htmlarea_file/activities/20110826121346/paper-729213301.pdf (accessed December 2014)
Figure 7. Loosening and destruction of levees by earthworms after 14 days in flooded and saturated soil.

Characteristics, Identity, and Survival of Red Earthworm Infesting Philippine Irrigated Rice Paddies
22 RICE-BASED BIOSYSTEMS JOURNAL (2022) 10: 15-22
Lauren G (2006) Wow! The wonders of an earthworm; How diffusion allows an earthworm to breathe. Retrieved from https://www.sas.upenn.edu/~glauren/earthworm.html. (accessed January 2022)
Lavelle P (1981) Stratégies de reproduction chez les vers de terre. Acta Oecol Gen 2: 117-133
Lavelle P, Barois I, Cruz I, Fragoso C, Hernandez A, Pineda A, Rangel P (1987) Adaptative strategies of Pontoscolex corethrurus (Glossoscolecidae, Oligochaete), a peregrine geophageous earthworm of the humid tropics. Biology and Fertility of Soils 5(3): 188-194
Lavelle P, Lattaud C, Trigo D, Barois I (1995) Mutualism and biodiversity in soils. Plant Soil 170: 23-33
Lee K (1985) Earthworms, their ecology and relationship with soils and land use. Journal of Applied Ecology 24(1): 334
Marichal R, Martinez AF, Praxedes C, Ruiz D, Carvajal AF, Oszwald J, Hurtado MD, Brown GG, Grimaldi M, Desjardins T, Sarrazin M, Decaens T, Velasquez E, Lavelle P (2010) Invasion of Pontoscolex corethrurus (Glossoscolecidae, Oligochaeta) in landscapes of the Amazonian deforestation arc. Applied Soil Ecology 46(3): 443-449
Müller FII (1857) Description of a new species of Earthworm (Lumbricus corethrurus). Annals and Magazine of Natural History 20(115):13-15
Nath S, Chaudhuri PS (2010) Human-induced biological invasions in rubber (Hevea brasiliensis) plantations of Tripura (India) - Pontoscolex corethrurus as a case study. Asian Journal of Experimental Biological Science 1(2): 360-369
Philippine Statistical Authority [PSA] (2019) Palay Production in the Philippines (pp 1). Retrieved from f ile:///D:/STUDY%20Protocol%20and%20Reports/For%20Publication/Earthworm/Literatures/Palay%20Production%20in%20the%20Philippines%20,%202015-2018_0.pdf (accessed January 2022)
Ramsay J, Hill S (1978) Earthworms, the agriculturist’s friends. Retrieved from eap.mcgill.ca/publications/eap6.htm (accessed January 6, 2015)
Righi G (1984) Pontoscolex (Oligochaeta, Glossoscolecidae) a new evaluation. Studies on Neotropical Fauna and Environment 19(3): 159-177
Somniyam P, Suwanwaree P (2009) The diversity and distribution of terrestrial earthworms in Sakaerat Environmental Research Station and adjacent areas, Nakhon Ratchasima, Thailand. World Applied Sciences Journal 6(2): 221-226

RICE-BASED BIOSYSTEMS JOURNAL (2022) 10: 23-31 23
IntroductionVarietal mixture by inter row or intercrop is
a known strategy for biotic stress management. Approaches were applied in designing mixtures depending on the specific crop problem, competitive ability against weed disease infections (Ločmele et al., 2017), and malting quality (Swanston et al., 2006). For instance, barley for yield; bean to decrease fly damages (Ssekandi et al., 2016); banana to control nematodes (Quénéhervé et al., 2011); finger millet to manage blast disease (Kumar et al., 2011); and wheat to control diseases (Cowger and Mundt, 2002; Mundt et al., 1999; Callonec et al., 1996).
In rice, VarMix approaches and strategies were also reported for yield and weed management (Amin et al., 2019); blast control (Han et al., 2016; Raboin et al., 2012; Zhu et al., 2005; Falvo, 2000); and lodging resistance (Revilla-Molina et al., 2009). The effectiveness of VarMix relies on the quality of varieties; thus, the economic importance of traits. These traits were mostly based on plant height, maturity, tillering capability, blast resistance, grain quality, and yield (Amin et al., 2019; Han et al., 2016; Li et al., 2013; Raboin et al., 2012).
The use of VarMix in rice to combat biotic and abiotic stress for yield stability was not fully utilized
GENETIC AND TRAIT DIVERSITY OF SELECTED RICEVARIETIES FOR VARIETAL MIXTURE (VarMix)
Imeldalyn G. Pacada*, Ma. Theresa F. Celestino, and Merryll Anne M. Miranda, Philippine Rice Research Institute, Science City of Muñoz, Nueva Ecija, Philippines
*Corresponding Author: [email protected]
AbstractThe effectiveness of varietal mixture (VarMix) depends on the traits and qualities of rice. In this study,
single varieties for VarMix combination were selected based on their genetic and trait variation such as resistance against pests and diseases and stress-tolerance. To identify genetic and phenotypic variation, molecular markers, simple sequence repeats (SSR) and published phenotypic traits of 36 Philippine released varieties were used. Genetic composition of these varieties was revealed using two genetic similarity coefficients Simple Matching (SM) and Roger and Tanimoto (R and T). Among the two-coefficients, R and T provide group clustering with higher genetic dissimilarities of 0.33 coefficient than SM with only 0.50. The six established VarMix source varieties (PSB Rc82, NSIC Rc 214, Rc 216, Rc 238, Rc 298, and Rc 300) demonstrate distinct clusters belonging to two major groups, which were based on genetic similarity coefficients. The NSIC Rc 214 belongs to Group I while PSB Rc82 is part of Group II, Cluster 2.1a. The remaining varieties belong to Group II, but also part of different cluster group i.e., NSIC Rc 238 (Group II, Cluster 2.1.b.1.2), NSIC Rc 298 (Group II, Cluster 2.1b.2.1), NSIC Rc 300 (Group II, Custer 2.1b.1.2), and NSIC Rc 216 (Group II, Cluster 2.1b.2.2). The varieties have similar traits for plant height, maturity, grain size and shape, and amylose content but have different reactions to diseases (blast, bacterial leaf blight) and pests (tungro, brown plant hopper, and stem borer). The genetic and trait variation of each single variety which contributed to express the functional diversity for selected VarMix combination, resulted in mitigating the effect of biotic and abiotic stress. Identification of genetic diversity of selected rice varieties is vital in establishing relevant information for VarMix selection.
Keywords: Genetic Similarity, SSR, VarMix, Diversity, Rice
in the Philippine rice production areas until studies from recent years showed its potential in areas with limited source of water and in pests and diseases hotspots (Pacada et al., 2021; Pacada et al., 2014). The unique selection process in this study compared with other rice VarMix research (Han et al., 2016; Li et al., 2013; Raboin et al., 2012; Revilla-Molia et al., 2009) included the use of mixing seeds with 1:1 to 1:1:1:1:1:1 ratio of the selected diverse genotypes, which showed their genetic dissimilarities through DNA polymorphism.
Molecular markers have been widely used for a number of applications in assessing genetic diversity of rice varieties (Singh et al., 2016; Musyoki et al., 2015; Ravi et al., 2003). Microsatellite markers also known as SSR have been proven effective for genetic diversity analysis. SSR markers are codominant and multi-allelic (polymorphic) in nature, and are highly reproducible, simple, easily scored, and reliable (Salgotra et al., 2015). Moreover, genetic diversity assessment based on determination of DNA polymorphism excludes the environmental effects.
VarMix is a mixture of selected varieties seeds with closely similar agronomic traits but are genetically dissimilar. Agronomic traits pertain to maturity, height, and grain size and shape while genetic dissimilarities are distinct genetic makeup of
FULL PAPER

Rice Genetic and Trait Diversity for Varietal Mixture
24 RICE-BASED BIOSYSTEMS JOURNAL (2022) 10: 23-31
a rice variety. In the initial VarMix investigation of Pacada et al. (2014), selection for establishing VarMix combinations was based on the top 20 varieties used by farmers in Region III identified by Philippine Rice Research Institute Central Station Office (PhilRice CES) rice-based farm household survey in 2012. It includes the six popular varieties specifically, PSB Rc 82, NSIC Rc 214, Rc 216, Rc 238, Rc 298, and Rc 300. In this study, 36 PSB/NSIC varieties that are commonly used by farmers in various regions and provinces in the Philippines were utilized. These varieties were considered to validate the diverse genetic constitution of the six popular varieties in generating VarMix combinations.
This study aimed to demonstrate the genetic and trait-based selection of the six single varieties used for creating VarMix combinations.
Materials and MethodsPlant materials
Thirty-six commonly planted PSB/NSIC varieties in select regions and provinces in the Philippines were selected (Rice Varietal Improvement Group, 2016). The experiment was established in the 2015 wet season under field conditions at PhilRice CES, Maligaya, Science City of Muñoz, Nueva Ecija.
Traits profiling and selection
Agronomic, grain quality traits, and reaction to pests and diseases of 36 PSB/NSIC varieties published in Pinoy Rice Knowledge Bank of PhilRice was identified and profiled. Varieties selection for VarMix combination was based on plant’s similarity in terms of height, maturity, grain size and shape, amylose content, and different genetic makeup.
Genetic diversity classification
Leaf collection. Twenty-one-day-old seedlings were transplanted individually, 20 hills per variety at 20 cm x 20 cm spacing. Five leaf samples were then collected 20 days after transplanting for genotyping. Each collected leaf was placed in a glassine bag and immediately stored in an ice box to prevent DNA degradation. All entries were quickly frozen in liquid nitrogen and ground into fine powder using mortar and pestle. DNA was isolated and extracted following the modified method (Perez et al., 2012).
SSR markers and assay. Forty-seven SSR markers used by Dalusong et al. (2019) were used. DNA amplification was carried out in 8 µL Polymerase Chain Reaction (PCR) reaction volume containing 2.76 µL of sterile distilled water, 1.5 µL of 5X Green GoTaq PCR buffer, 0.3 µL of 25 mM MgCl2, 0.4 µL of 5 mM DNTP, 0.5 µL of 10 mM primer (forward), 0.5
µL of 10 mM primer (reverse), 0.04 µL Commercial Taq Polymerase (Invitrogen), and 2 µL DNA template (35 - 45 ng). The PCR process was conducted with an initial denaturation of 95°C for 5 min, 29 cycles of denaturation at 94°C for 1 min, primer annealing at 55°C for 1 min, and extension at 72°C for 2 min, and final extension at 72°C for 5 min. Short Tandem Repeat (STR) loading dye of 4 µL was added to PCR products and afterwards, analyzed in non-denaturing Polyacrylamide Gel Electrophoresis at 100V for 1.5 h. The gels were stained in Gelred (Biotum) for 15 - 30 min and observed under a UV transilluminator.
Scoring and data analysis
The amplified products from the visualized PCR results were scored based on the allele size. The profiles produced by SSR markers were scored manually for each SSR locus (Table 1). Only polymorphic bands or markers that produced two or more different amplicon sizes were included in the analysis. The alleles observed per SSR marker locus were the inputs for genetic analysis. Two genetic similarity coefficients (SM; R and T) were used to determine the comprehensive genetic difference of 36 varieties. This analysis was under the procedures of Numerical Taxonomy and Multivariate Analysis System (NTSYS-pc version 2.1) and data from this was used to establish construction of dendrograms.
Similarity coefficients using SM and R and T are computed through the formula:
SM = a + d or a + d a + b + c + d n
which is the number of agreements (matches) divided by the total number of variables. For complete agreement, SM = 1, whereas for maximum dissimilarity, SM = 0.
R and T = a + d (a + d) + 2(b + c);
and gives double weight to mismatching variables, so it is always smaller than SM, except for the trivial case of b+c = 0.
Genetic diversity was calculated at each locus for allelic PIC with program Power Marker version 3.25 (Liu and Muse, 2005) based on allelic frequencies of the 36 varieties being analyzed. The PIC values for each SSR were estimated by determining the frequency of alleles per locus using the formula:
PIC = 1− ∑ x2i ;
where xi is the relative frequency of the ith allele of the SSR loci. Markers were classified as informative when PIC was ≥ 0.5.

Rice Genetic and Trait Diversity for Varietal Mixture
RICE-BASED BIOSYSTEMS JOURNAL (2022) 10: 23-31 25
Cluster dendogram was performed to group the rice varieties reflecting the overall measure of its genetic similarities. This process was conducted using the Unweighted Pair Group Method with Arithmetic mean (UPGMA) under the NTSYS programs, showing the distance-based interrelationship among the genotypes.
Results and DiscussionPolymorphism of SSR markers
There were 128 alleles detected from 42 SSR markers used with an average of 3.05 alleles per locus. The numbers of alleles per locus ranged from 2 to 6. Map of loci for each chromosome with the sequence of the markers is shown in Table 1. Based on allelic diversity and frequency, PIC value for each SSR marker used ranged from 0.05 to 0.76. PIC value, which is greater than 0.7, is considered to be highly informative, while PIC of ≥0.5, and <0.5 is informative and moderately informative, respectively. RM 592 had the highest PIC value of 0.76, which also had the highest number of polymorphic alleles, followed by RM 586 and RM 589 with the same value of 0.68. Moreover, the identification of RM makers with PIC values higher than 0.70 was sufficient to segregate genotypes with diverse genetic background (Kimaro et al., 2020; Dalusong et al., 2019).
Genetic similarity and trait dissimilarities
The profiles of the 36 varieties for selected agronomic, grain quality traits, and their pests and disease reaction are shown in Table 2. Their genetic differences using two genetic similarity coefficients, SM, and R and T are shown in Figure 1. Among the two coefficients, R and T provided group clustering with higher genetic dissimilarities of 0.33 coefficient compared with SM with only 0.50. However, similar groupings of six varieties were observed for both coefficients in terms of grouping and sub-clustering.
Basically, two major groups were resolved by two genetic coefficients, in which NSIC Rc 214 was classified in the distinct cluster of Group I while PSB Rc82 was sorted in Group II, Cluster 2.1a. The remaining four single varieties were categorized in Group II but were classed in different cluster group i.e., NSIC Rc 238 (Group II, Cluster 2.1.b.1.2), NSIC Rc 298 (Group II, Cluster 2.1b.2.1), NSIC Rc 300 (Group II, Cluster 2.1b.1.2), and NSIC Rc216 (Group II, Cluster 2.1b.2.2). Table 3 summarizes the six varieties based on genetic similarity groupings, agronomic, grain quality, and pest and disease reaction. The distinct grouping of NSIC Rc 214 (Figure 1) could be attributed to its disparity in maturity,plant height (Table 3), and the undetermined alleles, which may be derived from the unprofiled traits. Moreover, the sub clustering of other single varieties may be associated with the unique genetic gene pool used by the breeding institutions such as PhilRice and International Rice Research Institute (IRRI) (Table 4).
Table 1. Polymorphic information (PIC) content of 42 SSR markers.
No. ChromosomeLocation
Marker Name
Number of Alleles
Diversity in Value of PIC
1 1 RM243 2 0.142 1 RM10764 2 0.053 1 RM7466 2 0.354 1 RM10711 3 0.455 1 RM562 4 0.576 1 RM3412 3 0.317 1 RM10825 3 0.588 1 RM5 3 0.159 1 RM490 3 0.4810 1 RM136 3 0.5711 2 RM110 2 0.2112 2 RM263 4 0.3213 2 RM290 3 0.3314 2 RM324 3 0.4115 2 RM262 2 0.3616 2 RM154 4 0.6517 2 RM521 2 0.3518 2 RM211 3 0.4519 4 RM335 5 0.5020 5 RM164 4 0.4121 5 RM169 4 0.4822 5 RM592 6 0.7623 5 RM413 3 0.4024 6 RM510 2 0.3725 6 RM586 4 0.4726 6 RM589 4 0.6927 6 RM584 5 0.6928 6 RM30 2 0.0529 7 RM445 3 0.4030 7 RM234 3 0.3531 8 RM331 2 0.2932 8 RM515 4 0.6833 8 RM44 3 0.4434 9 RM152 2 0.5635 10 RM566 2 0.1436 10 RM228 2 0.3637 11 RM171 2 0.1838 11 RM202 3 0.3539 11 RM224 2 0.1440 11 RM21 4 0.6241 11 RM254 2 0.3742 12 RM27421 3 0.26
Total number of alleles 128Average number of alleles per locus 3.05

Rice Genetic and Trait Diversity for Varietal Mixture
26 RICE-BASED BIOSYSTEMS JOURNAL (2022) 10: 23-31
Tabl
e 2.
Pro
file
trai
ts o
f 36
varie
ties
com
mon
ly p
lant
ed i
n se
lect
regi
ons
and
prov
ince
s in
the
Phili
ppin
e (P
inoy
Ric
e K
now
ledg
e B
ank,
Phi
lRic
e).
Var
iety
Agro
nom
ic
Char
acte
ristic
s G
rain
Qua
lity
Traits
Reac
tions
to P
est a
nd D
iseas
es
BLAS
T (In
duce
d)BL
B
(Indu
ced)
Tung
ro
(Indu
ced)
Tung
ro
(Mod
ified
)BP
HGL
HDH
(WH)
Stem
bor
er
Ave Y
ld.
(t/h
a)Ma
t. (D
AS)
Plt.
Ht.
(cm
)Gr
ain
Sha
pe
(mm
)AC
AB
CD
GA
BC
GA
DG
AC
GW
SBYS
BW
SBYS
B
C
BH
AD
IRa
infe
d
PSB
Rc 14
3.6110
923.3
0 S24
.33 I
--
-I
--
--
--
S-
--
-I
IS
--
--
--
NSIC
2011
Rc 27
23.0
11088
2.4 I
25.0
II
IS
I-
SI
I-
SS
--
SS
IMR
MS-
-MR
MR-
-NS
IC 20
11 Rc
288
3.6118
127
2.4 I
19.7
LI
II
I-
II
I-
SS
--
SS
MSMS
MS
MR
I
NS
IC 20
13 R
c 346
3.310
597
3.2 S
21.5
IS
II
I-
SS
I-
SS
--
IS
II
--
-R
MR-
-NS
IC 20
13 R
c 348
3.010
3119
3.0 I
22.1 I
SR
II
-S
SI
-S
S-
-I
RI
I-
--
RMR
--
Irrig
ated
PS
B Rc
104.8
106
773.0
0 I26
.86 H
--
--
R-
--
I-
-I
--
-R
MRI
--
--
--
PSB
Rc 18
5.112
310
23.1
0 S21
.53 I
--
--
I-
--
I-
-I
--
-I
IMS
--
--
--
PSB
Rc 28
5111
933.2
S20
.1 I-
--
-R
--
-I
--
I-
--
II
I-
--
--
-PS
B Rc
525.3
11586
3.1 S
19.6
L-
--
-I
--
-I
--
I-
--
II
I-
--
--
-PS
B Rc
825.4
11010
03.2
S21
.5 I
--
--
R-
--
I-
-S
--
-I
MSI
--
--
--
NSIC
Rc 1
224.7
121
106
3.3 S
22.5
I-
--
-R
--
-I
--
I-
--
II
R-
--
--
-NS
IC R
c 128
5.5118
993.3
S17.
5 LS
--
--
I-
--
S-
--
--
MSMS
R(I)
--
--
--
NSIC
Rc 1
304.9
108
893.1
S18
.3 L
I-
--
-I
--
-S
--
--
-MS
IMR
(I)-
--
--
-NS
IC R
c 134
5.410
790
3.0 I
22.1 I
I-
--
-I
--
-S
--
--
-MS
MSMR
(I)-
--
--
-NS
IC R
c 146
4.6110
101
3.2 S
22.3
IS
--
--
I-
--
S-
--
--
SMS
MR(M
S)-
--
--
-NS
IC R
c 150
5.9
109
962.9
I23
.2 I
I-
--
-I
--
-S
--
S-
-MS
MS-
--
--
--
NSIC
Rc 1
52
6.010
997
3.4 S
28.9
HI
--
--
I-
--
S-
-S
--
MSI
--
--
--
-NS
IC R
c 158
6.0
11394
3.6 S
21.6
I-
--
-I
--
-I
--
S-
-I
MSI
--
--
--
-NS
IC R
c 160
5.6
107
963.3
S15
.7 L
I-
--
-I
--
-S
--
S-
-MS
I-
--
--
--
NSIC
Rc 2
146.0
11610
63.5
S21
.9 I
--
--
I-
--
I-
-S
--
SMR
MR-
--
--
--
NSIC
Rc 2
16
6.0112
963.2
S20
.5 I
S-
--
-I
--
-S
--
S-
-MR
MR-
--
--
--
NSIC
Rc 2
226.1
11410
13.4
S24
.0 I
--
--
I-
--
I-
-S
--
IMR
MR-
--
--
--
NSIC
2011
Rc 23
86.4
11010
43.2
S21
.0 I
SR
-I
II
II
-S
S-
-S
SI
MR-
MRR
MRMS
RMR
NSIC
2012
Rc 2
985.3
104
933.2
S19
.5 I
SS
SS
II
II
-S
S-
-S
SMR
I-
--
SMR
--
NSIC
2012
Rc 3
005.7
11598
2.9 I
20.4
IS
RR
II
SI
I-
SS
--
SS
MRMR
--
-S
I-
-NS
IC 20
13 R
c 308
5.8111
993.2
S22
.2 I
SI
-S
II
II
-S
S-
-S
SMR
I-
--
MRI
R-
NSIC
2014
Rc 3
525.1
11110
43.3
S18
.9 I
II
-I
II
IS
-S
S-
-S
SS
S-
--
MR-
MR-
NSIC
2014
Rc 3
545.4
11295
3.0 S
21.0
II
I-
II
IR
S-
SS
--
SS
MSMR
--
-MR
-MR
-NS
IC 20
14 R
c 356
5116
105
3.3 S
20.1 I
SI
-I
II
RI
-S
S-
-S
SI
MS-
--
MSR
--

Rice Genetic and Trait Diversity for Varietal Mixture
RICE-BASED BIOSYSTEMS JOURNAL (2022) 10: 23-31 27
Var
iety
Agro
nom
ic
Char
acte
ristic
s G
rain
Qua
lity
Traits
Reac
tions
to P
est a
nd D
iseas
es
BLAS
T (In
duce
d)BL
B
(Indu
ced)
Tung
ro
(Indu
ced)
Tung
ro
(Mod
ified
)BP
HGL
HDH
(WH)
Stem
bor
er
Ave Y
ld.
(t/h
a)Ma
t. (D
AS)
Plt.
Ht.
(cm
)Gr
ain
Sha
pe
(mm
)AC
AB
CD
GA
BC
GA
DG
AC
GW
SBYS
BW
SBYS
B
C
BH
AD
INS
IC 20
14 R
c 358
5.4114
983.2
S19
.7 I
SI
-S
IS
IS
-S
S-
-S
SI
MS-
--
IMS
R-
NSIC
2014
Rc 3
605.2
11810
33.2
S18
.4 I
SR
-R
SI
II
-S
S-
-S
SMS
I-
--
IR
R-
NSIC
2015
Rc 3
945.2
106
943.2
S19
.9 I
SI
-I
-I
II
-S
S-
--
-I
I-
--
RS
--
NSIC
2015
Rc 3
965.1
106
932.7
I12
.6LS
S-
I-
II
I-
SS
--
-S
II
--
-R
S-
-
NSIC
2015
Rc 3
985.3
106
982.6
I20
.5 I
SI
-I
-I
SS
-S
S-
--
SI
I-
--
RS
R-
NSIC
2015
Rc 4
005.8
120
105
2.8 I
16.7L
SI
-I
-I
II
-S
S-
--
SI
I-
--
II
--
NSIC
2015
Rc 4
025.5
107
953.0
S19
.2 I
SI
-I
-S
SR
-S
S-
-S
-I
I-
--
RS
--
AC -
Amyl
ose
cont
ent;
GS
- Gra
in s
hape
, S -
Slen
der;
I – In
term
edia
te, S
- Su
scep
tible
; MS
- Mod
erat
ely
susc
eptib
le; I
Inte
rmed
iate
; MR
- Mod
erat
ely
resi
stan
t;
R - R
esis
tant
; SB
- Ste
mbo
rer,
DH
- D
ead
hear
t; W
H -
Whi
te h
ead;
YSB
- Ye
llow
ste
m b
orer
; WSB
- W
hite
ste
m b
orer
, A
- Phi
lRic
e C
ES; B
- Ph
ilRic
e Is
abel
a; C
- Ph
ilRic
e M
idsa
yap;
D -
Uni
vers
ity o
f the
Phi
lippi
nes
Los
Bañ
os; E
- D
A-C
agay
an V
alle
y In
tegr
ated
Agr
icul
tura
l Res
earc
h C
ente
r (C
VIAR
C);
F –
Visa
yas
Stat
e U
nive
rsity
(VSU
); G
- IR
RI; H
- Ph
ilRic
e-Ag
usan
; I –
Bic
ol In
tegr
ated
Agr
icul
tura
l Res
earc
h C
ente
r (B
IARC
); J –
Wes
tern
Vis
ayas
Agr
icul
tura
l Res
earc
h C
ente
r (W
ESVI
ARC)
Yld.
- Yi
eld;
Mat
. - M
atur
ity; P
lt. H
t. - P
lant
hei
ght
Tabl
e 2.
(Con
tinue
d)
Var
iety
Agro
nom
ic
Char
acte
ristic
s G
rain
Qua
lity
Traits
Reac
tions
to P
est a
nd D
iseas
es
BLAS
T (In
duce
d)BL
B
(Indu
ced)
Tung
ro
(Indu
ced)
Tung
ro
(Mod
ified
)BP
HGL
HDH
(WH)
Stem
bor
er
Ave Y
ld.
(t/h
a)Ma
t. (D
AS)
Plt.
Ht.
(cm
)Gr
ain
Sha
pe
(mm
)AC
AB
CD
GA
BC
GA
DG
AC
GW
SBYS
BW
SBYS
B
C
BH
AD
INS
IC 20
14 R
c 358
5.4114
983.2
S19
.7 I
SI
-S
IS
IS
-S
S-
-S
SI
MS-
--
IMS
R-
NSIC
2014
Rc 3
605.2
11810
33.2
S18
.4 I
SR
-R
SI
II
-S
S-
-S
SMS
I-
--
IR
R-
NSIC
2015
Rc 3
945.2
106
943.2
S19
.9 I
SI
-I
-I
II
-S
S-
--
-I
I-
--
RS
--
NSIC
2015
Rc 3
965.1
106
932.7
I12
.6LS
S-
I-
II
I-
SS
--
-S
II
--
-R
S-
-
NSIC
2015
Rc 3
985.3
106
982.6
I20
.5 I
SI
-I
-I
SS
-S
S-
--
SI
I-
--
RS
R-
NSIC
2015
Rc 4
005.8
120
105
2.8 I
16.7L
SI
-I
-I
II
-S
S-
--
SI
I-
--
II
--
NSIC
2015
Rc 4
025.5
107
953.0
S19
.2 I
SI
-I
-S
SR
-S
S-
-S
-I
I-
--
RS
--
Sub-
clus
terin
g is
bas
ed o
n th
e 0.
39 R
and
T g
enet
ic s
imila
rity
coeff
icie
nt, s
ame
num
ber a
nd le
tter
bel
ong
to th
e sa
me
clus
ter g
roup
; AC
- Am
ylos
e co
nten
t;
GS
- Gra
in s
hape
, S -
Slen
der;
I - In
term
edia
te ;
S - S
usce
ptib
le; M
S - M
oder
atel
y su
scep
tible
; I -
Inte
rmed
iate
; MR
- Mod
erat
ely
resi
stan
t; R
- Res
ista
nt;
A - P
hilR
ice
CES
; B -
PhilR
ice
Isab
ela;
C -
PhilR
ice
Mid
saya
p; D
- Uni
vers
ity o
f the
Phi
lippi
nes
Los
Bañ
os; E
- D
A- C
agay
an V
alle
y In
tegr
ated
Agr
icul
tura
l Res
earc
h C
ente
r (C
VIAR
C);
F –
Visa
yas
Stat
e U
nive
rsity
(VSU
); G
- IR
RI; H
- Ph
ilRic
e-Ag
usan
; I -
Bic
ol In
tegr
ated
Agr
icul
tura
l Res
earc
h C
ente
r BIA
RC; J
- W
este
rn V
isay
as A
gric
ultu
ral R
esea
rch
Cen
ter (
WES
VIAR
C)Yl
d. -
Yiel
d; M
at. -
Mat
urity
; Plt.
Ht.
- Pla
nt h
eigh
t
Tabl
e 3.
Sum
mar
y of
gen
etic
and
trai
ts v
aria
tion
of s
ix s
elec
ted
varie
ties.

Rice Genetic and Trait Diversity for Varietal Mixture
28 RICE-BASED BIOSYSTEMS JOURNAL (2022) 10: 23-31
Figure 1. Comparison of dendrograms constructed using SM (top) and R and T (bottom) similarity coefficients.

Rice Genetic and Trait Diversity for Varietal Mixture
RICE-BASED BIOSYSTEMS JOURNAL (2022) 10: 23-31 29
Identification and classification of variety are useful information particularly in designing varietal mixture for the mitigation of pest (Ssedkandi et al., 2016; Quénéhervé et al., 2011) and disease infestation (Ločmele et al., 2017; Kumar et al., 2011; Cowger et al., 2002; Mundt et al., 1999; Callonec et al., 1996) and for yield productivity (Li et al., 2013; Kiaer et al., 2012; Gallandt et al., 2001). This research showed that diversification approach based on genetic composition, variability in agronomic traits, and different level of resistance in pest and diseases can contribute to the overall performance of selected VarMix combinations, in which the mixing effect increases its productivity given the different environmental conditions; thus, out yielding corresponding single variety (Pacada et al., 2021). Moreover, genetic variation based on molecular data and phenotypic traits of each variety, contributed in identifying functional diversity of some VarMix combinations, which were more stable and highly responsive to given environment (Pacada et al., 2021). Functional diversity in this study entailed the mixing effect of diversified function for a particular trait to lessen the effect of biotic and abiotic stresses. In the formulation of VarMix, one of the primary bases for the selection is the genetic composition of a variety, which is highlighted in this study, while other rice researches involving VarMix solely considered the economic importance of traits. (Han et al., 2016; Li et al., 2013; Raboin et al., 2012; Revilla-Molia et al., 2009).
For above ground environment, disease and pest reduction was attributed to dilution and barrier effect mechanism (Castro, 2001), which are associated with the genetic makeup variability of single varieties. VarMix acts as differential variety, possessing different degree of resistance that causes movement restriction and obstruction barrier for pest and disease infestation. In the initial investigation, other mechanisms were also validated for below ground environment where VarMix combinations triggered its root plasticity by means of compensation and facilitation mechanism (Yadav et al., 2009; Garcia-Barrios, 2002; Callaway, 1995). This mechanism
was identified by Pascua et al. (2020), in which integrating NSIC Rc 298 with five single varieties complemented other VarMix combinations by producing high grain yield, total root length, and water use under cycles of alternate wetting and drying (CAWD). This complementation by inter-varietal diversity facilitated water increase of its roots from deeper soil layer through hydraulic lif, and redistributed the water uptake to its neighboring roots (Sekiya et al., 2011; Neumann and Cardon, 2012), which resulted in enhanced VarMix root index. Moreover, complementation and facilitation mechanism of VarMix was attributed to different genetic background of six single varieties. NSIC Rc 298 was developed for direct seeding ecosystem and the other single variety was bred for irrigated lowland ecosystems.
ConclusionVarMix is a promising stop gap approach
to address water scarcity and pest and diseases especially that a single multi-trait local variety tolerable of various biotic and abiotic stresses is yet to be developed. Classification of diverse single variety based on molecular and phenotypic level plays an important role in the good performance of VarMix in different environments. The mixing effect of VarMix is associated with inter-varietal diversity; thus, lessening sensitivity to water scarcity and enhancing reactions against pests and diseases. Moreover, the identified genetic variation of single variety used in creating VarMix combinations intensified the expression of functional diversity and resulted in positive trade-offs particularly in obtaining yield stability under stress and non-stress conditions.
AcknowledgmentThis research is part of the project, “Varietal
Mixture of Rice to Enhance Yield and Mitigate Effects of Climate Change in Stress-Prone Areas” funded by Department of Agriculture - Bureau of Agricultural Research (DA-BAR). The authors also recognized the technical assistance of Dr. Arlen A. Dela Cruz.
Table 4. Parentage of six single varieties and breeding institution.
Variety Ecosystem Parentage Breeding Institution
NSIC Rc 214 Irrigated IR72890-70-2-3-3/IR57301-195-3-3 IRRI
PSB Rc82 Irrigated IR47761-27-1-3-6/PSB Rc28 IRRI
NSIC 2011 Rc 238 Irrigated IR72870-120-1-2-2/IR72870-19-2-2-3 IRRI
NSIC 2012 Rc 298 Rainfed PR29253-96-1/AR32-4-58-2 PhilRice
NSIC 2012 Rc 300 Irrigated PSB Rc62/PSB Rc66 PhilRice
NSIC Rc 216 Irrigated PJ7/MATATAG 1 PhilRice

Rice Genetic and Trait Diversity for Varietal Mixture
30 RICE-BASED BIOSYSTEMS JOURNAL (2022) 10: 23-31
Liu K, Muse SV (2005) Powermaker: An integrated analysis environment for genetic marker analysis. Bioinformatics 21(9): 2128-2129
Ločmele I, Legzdiņa L, Gaile Z, Kronberga A (2017) Estimation of yield and yield stability of spring barley genotype mixtures agricultural science. Research for Rural Development 2
Mundt CC, Cowger C, Hoffer ME (1999) Disease management using varietal mixtures. In van Ginkel M, McNab A, Krupinsky J (Eds.). Septoria and Stagonospora Disease of Cererals: A Compilation of Global Research (pp 111-116). Mexico: CIMMYT
Musyoki MA, Kioko WF, Ngugi MP, Agyirifo D, Muriira KG, Wavinya ND, Matheri F, Lagat CR, Mwenda NS, Kiambi MJ, Ngithi NL (2015) Genetic diversity studies on selected rice (Oryza Sativa) genotypes based on amylose content and gelatinization temperature. Advances in Crop Science and Technology 3:5
Neumann RB, Cardon ZG (2012) The magnitude of hydraulic redistribution by plant roots: A review and synthesis of empirical and modeling studies. New Phytologist 194: 337-352
Pacada IG, Cabanting RMF, Pocsedio AE, Dalusong VG, Perez LM (2014) Varietal mixtures as potential approach for increasing rice yield in rainfed lowland condition. In Abstract of Papers Presented during 44th Crop Science Scientific Conference of the Federation of Crop Science Societies of the Philippines 39(1): 108
Pacada IG, Suralta RR, Beltran JC, Niones JM, Desamero NV, Bandonill EH, Rillon JP (2021) Are there good reasons to push for VarMix in unfavorable rice-growing areas in the Philippines? Rice Science for Decision Makers. Retrieved from https://www.philrice.gov.ph/databases/rice-science-for-decision-makers/ (accessed November 22, 2021)
Pascua AG, Pacada IG, Suralta RR (2020) Growth performance and yield of rice variety mixture (VarMix) under soil moisture fluctuation stress during reproductive stage. Rice-Based Biosystem Journal 7: 37-47
Perez LM, Pastor HM, Domingo JM, Tabanao DA, Manigbas NL (2012) Detecting hybrid admixtures through DNA analysis. Philippine Journal of Crop Science 37(1): 42-46
Quénéhervé PV, Salmon, FH, Achard R, Gertrude JC, Chabrier MC, Duyck PF, Tixier P (2011) Effect of banana crop mixtures on the plant-feeding nematode community. Applied Soil Ecology 49(1): 40-45
Raboin LM, Ramanantsoanirina A, Dusserre J, Razasolofonanahary F, Tharreau D, Lannou C, Sester M (2012) Two-component cultivar mixtures reduce rice blast epidemics in an upland agrosystem. Plant Pathology 61(6): 1103-1111
Ravi M, Geethanjali S, Sameeyafarheen F, Maheswaran M (2003) Molecular marker based genetic diversity analysis in rice (Oryza sativa L.) using RAPD and SSR markers. Euphytica 133: 243-252
Literature CitedAmin MA, Anwar MP, Rahman MR, Islam MR, Islam AKMM
(2019) Growing tall and dwarf rice cultivars in mixture for better weed management and higher yield. Journal of Bangladesh Agricultural University 17(2): 133-141
Callaway RM (1995) Positive interactions among plants. Botanical Review 61: 306-349
Calonnec A, Goyeau H, de Vallavieille-Pope C (1996) Effects of induced resistance on infection efficiency and sporulation of Puccinia striiformis on seedlings in varietal mixtures and on field epidemics in pure stands. European Journal of Plant Pathology 102: 733-74
Castro A (2001) Cultivar mixture. Retrieved from https://www.apsnet.org/edcenter/disimpactmngmnt/topc/cultivarmixes/Pages/default.aspx (accessed December 15, 2020)
Cowger C, Mundt CC (2002) Effects of wheat cultivar mixtures on epidemic progression of septoria tritici blotch and pathogenicity of Mycosphaerella graminicola. Phytopathology 92(6): 617-623
Dalusong VG, Santos LH, Perez LM (2019) Establishment of core short tandem repeat (STR) markers for rice (Oryza sativa L.) varietal identification. Philippine Journal of Crop Science 44 (3): 31-44
Falvo DJ (2000) Rice blast control and polyvarietal planting in the Philippines: A study in genotype by environment biogeography. Social Science Diliman 2(1): 43-58
Gallandt ER, Dofing SM, Reisenauer PE, Donaldson E (2001) Diallel analysis of cultivar mixtures in winter wheat. Crop Science 41(3): 792-796
Garcia-Barrios L (2002) Plant-plant interactions in tropical agriculture. In Vandermeer JH (Ed.). Tropical Agroecosystems (pp 11- 58). Florida: CRC Press
Han GY, Jie, Lang J, Sun Y, Wang YY, Zhu YY, Lu BR (2016) Intercropping of rice varieties increases the efficiency of blast control through reduced disease occurrence and variability. Journal of Integrative Agriculture 15(4): 795-802
Kiær LP, Skovgaard IM, Ostergard H (2009) Grain yield increase in cereal variety mixtures: Meta-analysis of field trials. Field Crops Research 114(3): 361-373
Kiær LP, Skovgaard IM, Ostergard H (2012) Effects of intervarietal diversity, biotic stresses and environmental productivity on grain yield of spring variety mixture. Euphytica 185: 123-138
Kimaro D, Melis R, Sibiya J, Shimelis H, Shayanowako A (2020) Analysis of genetic diversity and population structure of pigeonpea [Cajanus cajan (L.) Millsp] accessions using SSR markers. Plants 9(12):1643
Kumar B, Kumar J (2011) Management of blast disease of finger millet (Eleusine coracana) through fungicides, bioagents and varietal mixture. Indian Phytopathology 64(3): 272-274
Li XF, Liu ZX, Lu DB, Liu YZ, Mao XX, Li ZX, Li, HJ (2013) Development and evaluation of multi-genotype varieties of rice derived from MAGIC lines. Euphytica 192: 77-86

Rice Genetic and Trait Diversity for Varietal Mixture
RICE-BASED BIOSYSTEMS JOURNAL (2022) 10: 23-31 31
Revilla-Molina IM, Bastiaans L, Van Keulen H, Kropff MJ, Hui F, Castilla NP, Mewf TW, Zhu YY, Leung H (2009) Does resource complementarity or prevention of lodging contribute to the increased productivity of rice varietal mixtures in Yunnan, China? Field Crops Research 111(3): 303-307
Salgotra RK, Gupta BB, Bhat JA, Sharma S (2015) Genetic diversity and population structure of basmati rice (Oryza sativa L.) germplasm collected from North Western Himalayas using trait linked SSR Markers. Plos one 10(7)
Sekiya N, Araki H, Yano K (2011) Applying hydraulic lift in an agroecosystem: Forage plants with shoots removed supply water to neighboring vegetable crops. Plant and Soil 341(1): 39-50
Singh N, Choudhury DR, Tiwari G, Singh AK, Kumar S, Srinivasan K, Tyagi RK, Sharma AD, Singh NK, Singh R (2016) Genetic diversity trend in Indian rice varieties: An analysis using SSR markers. BMC Genetics 17(1): 1-13
Ssekandi WJ, Mulumba W, Colangelo P, NankyaR, Fadda C, Karungi K, Otim M, De Santis P, Jarvis DI (2016) The use of common bean (Phaseolus vulgaris) traditional varieties and their mixtures with commercial varieties to manage bean fly (Ophiomyia spp.) infestations in Uganda. Journal of Pest Science 89(1): 45-57
Swanston JS, Newton AC, Hoad SP, Spoor W (2006) Variation across environments in patterns of water uptake and endosperm modification in barley varieties and variety mixtures. Journal of the Science of Food and Agriculture 86(5): 826-833
Yadav BK, Mathur S, Siebel MA (2009) Soil moisture dynamics modeling considering the root compensation mechanism for water uptake by plants. Journal of Hydrologic Engineering 14(9): 913-922
Zhu YY, Fang H, Wang YY, Fan JX, Yang SS, Mew TW, Mundt CC (2005) Panicle blast and canopy moisture in rice cultivar mixtures. Phytopathology 95(4): 433-438


RICE-BASED BIOSYSTEMS JOURNAL (2022) 10: 33-40 33
RICE MECHANIZATION MODELS FOR SMALLHOLDER FARMERS: A CASE IN THE PHILIPPINES
Ricardo F. Orge, Kristine S. Pascual, Jesusa C. Beltran, Tyrone C. Juganas, Rachelle Marie S. Martin, and Aurora M. Corales*
Philippine Rice Research Institute, Science City of Muñoz, Nueva Ecija, Philippines*Corresponding Author: [email protected]
Abstract Rice mechanization in the Philippines generally falls under the small-scale category with the majority of
the farmers owning only a hectare or less of farm land. Farm mechanization helps rice farmers cope with the challenges brought about by climate change and trade liberalization. While there were already attempts to introduce mechanization technologies in rice farming for the past three decades, the level of mechanization has not progressed much. This paper discusses the challenges encountered in mechanizing farm operations since the 1990s and presents success stories that can serve as models for smallholder farmers. The paper also highlights advancements in implementing a nationwide rice mechanization program to reduce production cost and help Filipino compete with the international market.
Keywords: Custom-service Provision, Mechanization Models, Modernization, Trade Liberalization
IntroductionThe Philippine rice sector is facing various
challenges. In February 2019, the country shifted to open rice trade policy when its import quota system was replaced with tariff through the enactment of Republic Act No. 11203 or the Rice Tariffication Law (RTL). This act permits the entry of cheaper imported rice in the country. Despite the imposed taxes, it is expected to result in price decline of milled rice and consequently, farm gate price reduction of paddy rice. While this shift benefits the consumers in general, it economically harms the Filipino rice farmers, especially the smallholders who are incapable of competing due to the high production cost.
Despite the numerous technological advances for the past years, rice production cost in the country is relatively higher than in Vietnam and Thailand, which are the major sources of rice imports. On average, farmers spend PhP 45,300 ha-1 or PhP 11.20 kg-1 of produced paddy, the biggest chunk incurred by labor cost at 51% (Figure 1). In some parts of the country, farm labor is becoming scarce and expensive due to the need for workers in other sectors (e.g., construction, factories), which provides a higher and more stable income. Moreover, with farmers within a community practicing synchronous planting, the demand for farm workers during labor-intensive operations such as manual transplanting and harvesting has been confined to a short period of time, resulting in workforce insufficiency. In most cases, this results in the delay of operations.
Climate change is one of the current big challenges that the rice sector is facing. Rice is a climate-sensitive
crop, which can be badly affected with losses due to weather and climate-related factors. The El Niño in 1998, for example, caused a significant decline in production while another substantial loss occurred in 2010 when ready-to-harvest rice fields were exposed to continuous rains and floods. Aside from reducing production cost, mechanization also plays a vital role in helping farmers cope with climate change. During the occurrence of drought, farmers rely on alternative irrigation pumps to provide water and sustain the growth and development of the crops. In addition, harvesting machines such as rice combine can help farmers reap their rice crop in a shorter period than through manual harvesting. It also minimizes the risk of encountering strong typhoons and floods. With the erratic rainfall patterns, the use of mechanical paddy dryers is a must particularly if rice harvest would be dried and stored awaiting for a price increase or for milling.
In support of agricultural mechanization, increased farm income, and modernized agriculture, the
Figure 1. Cost shares (%) in rice production (PSA, 2019).
FULL PAPER
Pesticides 3%
Seeds 4%
Fuel, oil, and electricity 2%
Fertilizers 10%
Other costs 11%
Interest 4%
Land, rent, and machine
15%
Labor cost 51%
Seeds
Fertilizers
Pesticides
Labor cost
Land, rent, and machine
Fuel, oil, and electricity
Interest
Other costs
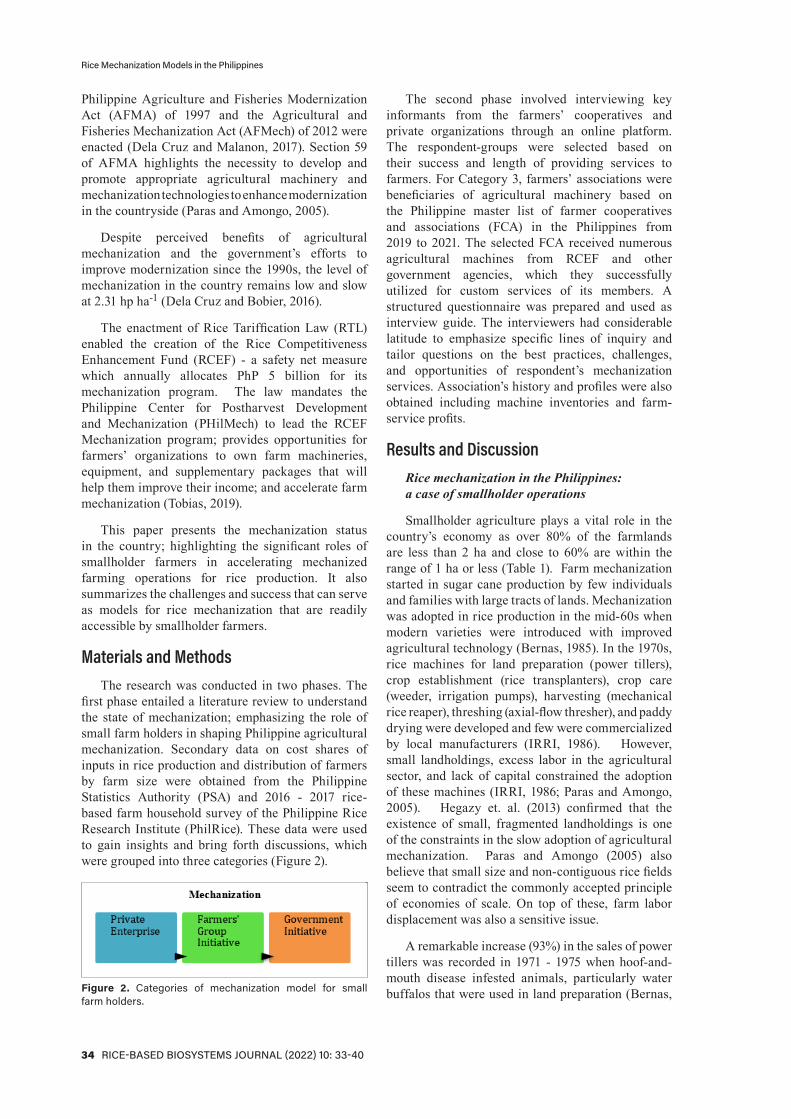
Rice Mechanization Models in the Philippines
34 RICE-BASED BIOSYSTEMS JOURNAL (2022) 10: 33-40
Philippine Agriculture and Fisheries Modernization Act (AFMA) of 1997 and the Agricultural and Fisheries Mechanization Act (AFMech) of 2012 were enacted (Dela Cruz and Malanon, 2017). Section 59 of AFMA highlights the necessity to develop and promote appropriate agricultural machinery and mechanization technologies to enhance modernization in the countryside (Paras and Amongo, 2005).
Despite perceived benefits of agricultural mechanization and the government’s efforts to improve modernization since the 1990s, the level of mechanization in the country remains low and slow at 2.31 hp ha-1 (Dela Cruz and Bobier, 2016).
The enactment of Rice Tariffication Law (RTL) enabled the creation of the Rice Competitiveness Enhancement Fund (RCEF) - a safety net measure which annually allocates PhP 5 billion for its mechanization program. The law mandates the Philippine Center for Postharvest Development and Mechanization (PHilMech) to lead the RCEF Mechanization program; provides opportunities for farmers’ organizations to own farm machineries, equipment, and supplementary packages that will help them improve their income; and accelerate farm mechanization (Tobias, 2019).
This paper presents the mechanization status in the country; highlighting the significant roles of smallholder farmers in accelerating mechanized farming operations for rice production. It also summarizes the challenges and success that can serve as models for rice mechanization that are readily accessible by smallholder farmers.
Materials and MethodsThe research was conducted in two phases. The
first phase entailed a literature review to understand the state of mechanization; emphasizing the role of small farm holders in shaping Philippine agricultural mechanization. Secondary data on cost shares of inputs in rice production and distribution of farmers by farm size were obtained from the Philippine Statistics Authority (PSA) and 2016 - 2017 rice-based farm household survey of the Philippine Rice Research Institute (PhilRice). These data were used to gain insights and bring forth discussions, which were grouped into three categories (Figure 2).
The second phase involved interviewing key informants from the farmers’ cooperatives and private organizations through an online platform. The respondent-groups were selected based on their success and length of providing services to farmers. For Category 3, farmers’ associations were beneficiaries of agricultural machinery based on the Philippine master list of farmer cooperatives and associations (FCA) in the Philippines from 2019 to 2021. The selected FCA received numerous agricultural machines from RCEF and other government agencies, which they successfully utilized for custom services of its members. A structured questionnaire was prepared and used as interview guide. The interviewers had considerable latitude to emphasize specific lines of inquiry and tailor questions on the best practices, challenges, and opportunities of respondent’s mechanization services. Association’s history and profiles were also obtained including machine inventories and farm-service profits.
Results and DiscussionRice mechanization in the Philippines: a case of smallholder operations
Smallholder agriculture plays a vital role in the country’s economy as over 80% of the farmlands are less than 2 ha and close to 60% are within the range of 1 ha or less (Table 1). Farm mechanization started in sugar cane production by few individuals and families with large tracts of lands. Mechanization was adopted in rice production in the mid-60s when modern varieties were introduced with improved agricultural technology (Bernas, 1985). In the 1970s, rice machines for land preparation (power tillers), crop establishment (rice transplanters), crop care (weeder, irrigation pumps), harvesting (mechanical rice reaper), threshing (axial-flow thresher), and paddy drying were developed and few were commercialized by local manufacturers (IRRI, 1986). However, small landholdings, excess labor in the agricultural sector, and lack of capital constrained the adoption of these machines (IRRI, 1986; Paras and Amongo, 2005). Hegazy et. al. (2013) confirmed that the existence of small, fragmented landholdings is one of the constraints in the slow adoption of agricultural mechanization. Paras and Amongo (2005) also believe that small size and non-contiguous rice fields seem to contradict the commonly accepted principle of economies of scale. On top of these, farm labor displacement was also a sensitive issue.
A remarkable increase (93%) in the sales of power tillers was recorded in 1971 - 1975 when hoof-and-mouth disease infested animals, particularly water buffalos that were used in land preparation (Bernas, Figure 2. Categories of mechanization model for small
farm holders.

Rice Mechanization Models in the Philippines
RICE-BASED BIOSYSTEMS JOURNAL (2022) 10: 33-40 35
his one-unit mechanical transplanter to few farmers. Typical in any start-up business, there were several setbacks and failures encountered. However, the business operation has improved through the owner’s active and continuing skills training in agriculture-related ventures and through his linkage with the Department of Agriculture. The business expanded gradually after the Land Bank of the Philippines provided credit to procure additional farm machine equipment for custom services covering neighboring municipalities. From one mechanical transplanter, the owner now has PhP 10 M worth of farm machinery and equipment including four 4-wheel tractors, five mechanical transplanters, three rice combine harvesters, two paddy seed cleaners, and other small farm machines to service 100 ha per rice growing season. The payment scheme is either on a cash basis or a certain percentage of the harvest. Incentive is also given to farmers who sell their paddy rice to him after harvest through a contract agreement. In addition to custom-service provision, the business also began the production of rice seedlings, which are grown in plastic trays ready for mechanical transplanting. This innovation provided added value to the existing mechanical transplanter for hire with additional packages of services such as seeds, seedling care, and seedling transport from seedbed to the field (Figure 3). This model has proven profitable and in-demand with a net income of 50% of the total cost of operations (Table 2).
At present, the business has grown to offer services for the entire value chain of rice production from seed to rice through seed production, palay trading, rice milling, and marketing. It also provides free consultancy on best crop management practices of rice production through helping farmers access information from the internet and weather forecasts for effective cropping calendar. In addition, farm learning centers that teach proper land preparation, farm site development, and other management methods were established as corporate social responsibility and advocacy for farm mechanization.
1985). Farm operations, specifically land preparation and threshing, have achieved significant levels of mechanization (Bingabing et al., 2015). This finding was further supported by the study of Rodriguez and Piadozo (2016) in Laguna, which showed that 100% of the farmer respondents with landholdings of 1 - 1.7 ha, owned two-wheel tractors and irrigation pumps.
Table 1. Distribution of farmers by farm size (%) (Rice-based Farm Household Survey, 2016 - 2017).
Category (ha) Irrigated Rainfed All Ecosystems
2016 Wet Season
≤ 1.00 55 63 58
1.01 - 2.00 26 23 25
2.01 - 3.00 9 7 9
≥ 3.01 10 7 8
2017 Dry Season
≤ 1.00 55 70 59
1.01 - 2.00 27 20 25
2.01 - 3.00 10 5 9
≥ 3.01 8 5 8
Sims and Kienzle (2016) discussed how the private sector can be involved in providing mechanization services to smallholder farmers. First is through group ownership, in which neighboring farmers join together to invest in agricultural machinery for its member’s utilization. Second is through service provision by an owner of an agricultural machinery, in which the owner-farmer attends first to his own needs and then supplies services to fellow farmers. This involves enterprising farmers or individuals with a background in agriculture and serves as business opportunities to invest in agricultural machines and provide services within the locality. These two types of models exist in the Philippines with the first model through farmers’ organizations or cooperatives being the more dominant way of the government to provide agricultural machinery through dole out or subsidy such as in the case of the RCEF Mechanization Program.
Some examples of these farm mechanization models in the Philippines include:
Model 1: Mechanization through custom service provision by private enterprise
The Right Agri Development Incorporated. This is a family-owned business that caters the mechanization needs of more than 90 smallholder farmers in Isabela, a major rice-producing province. It is a custom service provider in rice production operations such as land preparation, planting, irrigation, harvesting, as well as marketing rice. The growing manual labor shortages in 2012 motivated the owner to ventured rentals of
Figure 3. Custom-service provision of rice seedlings in trays ready for mechanical transplanting.

Rice Mechanization Models in the Philippines
36 RICE-BASED BIOSYSTEMS JOURNAL (2022) 10: 33-40
Table 2. Cost and returns of custom-service provision from raising seedlings to mechanical transplanting.
Activity Cost (PhP ha-1)
Soils and seedbed preparation 1,000
Seeds 2,600
Seedling 1,000
Seedling care 1,100
Other labor 1,000
Mechanical transplanting 8,000
Total 14,700
Net profit 7,350
DR1 Farmtech Services. This is a business enterprise in Sta. Rita, Quezon, Nueva Ecija owned by Mr. Jonas Del Rosario, a 42-year-old AB Economics graduate with more than 16 years of experience in mechanized farming.
The first mechanized rice seedling center certified by Kubota Philippines, it offers mechanized farm custom services mainly in land preparation, mechanical transplanting, and combine harvesting.
In 2003, Del Rosario took over the management of their family-owned 50-ha rice production area. He then ventured into mechanized rice production due to operational problems in the field. In manual transplanting, for example, his broker often provided insufficient numbers of farm workers resulting in the delayed establishment of his crop. He was also frustrated with manual transplanting due to uneven spacing between rows and the over or under populated seedlings per hill. He purchased his first farm machine - a 36hp Kubota 4-wheel-drive tractor in 2005, followed by rice combine, mechanical transplanters, and paddy hauler. Today, his farm has expanded from 50 to 95 ha. After fulfilling his farm needs, Del Rosario provided custom services (Table 3) with different payment schemes (Table 4) to his co-farmers in 13 municipalities in Nueva Ecija and expanded in three municipalities in Tarlac, which totals 300 - 400 ha annual coverage.
Table 3. Operations covered by DR1 Farmtech Services.
Farm Services Year Started
Land preparation services 2005
Combine harvesting 2012
Mechanized transplanting 2016
Selling seedlings grown on mats 2016
Paddy hauler 2020
Table 4. Payment schemes offered by DR1 Farmtech Services.
Machine/Service Payment
Combine harvester
Starting: 14% of harvestPresent: 8% of harvest
Mechanical transplanter
PhP 11,000 ha-1 (USD 229.16 ha-1 (within the municipality Succeeding: +10 km= + PhP 500.00 or USD 10.45
Seedlings on mats PhP 25/tray (pick up price); minimum of 300 trays for free delivery
Paddy hauler 70 - 80 bags per trip; PhP 15/bag
Operators and other workers are paid PhP 700 - 500 ha-1 of operation with free meals and other needs, which shows how the business values its farmworkers. Eight laborers including the operators of two transplanters are usually deployed for every 1-hectare field operation and an additional 2 - 3 laborers per hectare increase.
Del Rosario and DR1 Farmtech Services have always been a step ahead in acquiring farm machines. He was not also spared from negative comments, which discouraged him and his business at one point in his journey. However, he did not pay much attention to his detractors; instead, he focused on his goals and devoted his time to learning innovations. With a successful partnership with Kubota, he was able to make a name in modern farming.
Model 2: Mechanization through farmers’ group initiative
Tabacao Primary Multi-purpose Cooperative (PMPC). The cooperative started with only 20 ha and 16 members, which grew to 1,492 active members, covering an aggregate of 1,008-ha farmlands. It offers a wide range of services from palay buying and lending to custom-service provision of farm operations such as land preparation, combine harvesting, drying, and milling. In 2006, the cooperative ventured into mechanical drying of palay with rice hull as fuel source. In 2011, drying and milling facilities were also expanded with the installation of a solar drying pavement and acquisition of a one-unit rice mill. The cooperative has 54 machine assets, of which 40 were acquired through bank loans and the rest are through donations from the government and private organizations. Some of the rice production machines include seven four-wheel-drive tractors (four units 35 hp, and three units 90 hp), a walk-behind transplanter, multi-pass rice mill, three units of multi-tiller with complete implements and recirculating dryers, and four units of combine harvester. Combine harvesting has been one of the most sought-after services. Other farmers also bought their own combine harvesters due to great demand.

Rice Mechanization Models in the Philippines
RICE-BASED BIOSYSTEMS JOURNAL (2022) 10: 33-40 37
The cooperative also partnered with a private company to supply a recirculating dryer in exchange for a milling service of brown rice and white rice. They produced around 150,000 and 90,000 cavans of rice during dry and wet seasons, respectively. In the dry season, rice produced is 80% hybrid and 20% inbred. While the cooperative is currently extending 70% of the custom services exclusively to its members, it also provides services to 30% non-members in the community. Covering four municipalities in Nueva Ecija, the cooperative is also into marketing brown rice in malls, nearby provinces, and other cooperatives in small and large-scale trade. The cooperative sells rice hull from their rice mills at PhP 2.50 per kilo while the rest is used as fuel for recirculating dryers to reduce operation costs.
Model 3: Mechanization by government initiative through RCEF
Under the RCEF Mechanization Program, PhP 5 billion is allotted annually for agricultural mechanization to increase farmers’ productivity, profitability, and global competitiveness. The expected benefits of using agricultural machinery are (a) to reduce the cost of rice production by PhP 2 - 3 per kg through the use of accurate, effective, and complete set of machines and (b) to reduce postharvest losses by 3 - 5% through the use of appropriate and efficient postharvest machinery. One highlight of the program is empowering the FCAs through training, extension services, and enhancing their entrepreneurial capacity to operate, manage their farm machinery, postharvest and processing facilities in a viable, and sustainable manner (PHilMech, 2021a). As of 2020, in spite of the pandemic, 1,018 units of farm machines and equipment had been distributed to 13 regions of the Philippines including Cordillera. (Table 5). Some of the FCA recipients were interviewed and their stories are presented in this paper.
Table 5. Farm machines distributed nationwide under the RCEF Mechanization Program as of 4th Quarter of 2020 (PHilMech, 2021b).
Farm Machine Units
Four-wheel tractor 2,709
Hand tractor 3,744
Floating tiller 1,545
Precision seeder 146
Walk-behind transplanter 1,304
Riding-type transplanter 413
Reaper 1,524
Combine harvester 1,717
Mobile rice mill 157
Mobile recirculating grain dryers 4
Total 13,263
Davao Integrated Resource Cooperative (DIRCO). Located in New Corella, Davao del Norte with head office in Tagum City, the cooperative was started by the employees of the National Food Authority in 1992. It transformed into a farmers’ cooperative with 314 members and 171.5 ha of land area in 2012. In 2016, DIRCO received a hand tractor and floating tiller from the DA - Regional Field Office 11. The cooperative then created payment scheme to help its members (Table 6). In 2018, the board members submitted a proposal to the Office of the Provincial Agriculturist (OPA) to acquire additional machinery for custom-servicing. The cooperative was loaned one unit of 4-wheel-tractor, walk-behind transplanter, and combine harvester. Only 20% of their net income was given back to the OPA while the remaining 80% was retained as cooperative income.
In 2020, the cooperative applied for the RCEF Program on machinery and acquired a hand tractor, four-wheel tractor, floating tiller, riding-type transplanter, and combine harvester. They retained the same payment scheme for their machinery from OPA (Table 6).
Table 6. Machines acquired by the cooperative from the government and custom service payment scheme.
Machine Custom Service Payment Scheme
Floating tiller Free rent Operator fee: PhP 500 ha-1 + Fuel costs
Hand tractor Free rent Operator fee: PhP 500 ha-1 + Fuel costs
Four-wheel tractor Rental cost: PhP 2,000 - 3,000 ha-1, additional PhP 500 (non-members) + Operator fee: PhP500 ha-1 + fuel costs
Transplanter Rental cost: PhP 4,500 - 5,000 ha-1 (members), additional PhP 500 (non-members) + Operator fee: PhP 500 ha-1 + fuel costs *from seed preparation to transplanting; 11-14 DAS age of seedlings;
Combine harvester 8% of yield harvested (members), 11% (non-members)
The cooperative cited the top three challenges they encountered in handling their enterprises:
• Maintenance of machines. Repairing and maintaining machines are expensive. One broken machine heavily affects custom-service enterprise. Thus, two permanent employees were hired and trained to focus on maintaining and repairing all machines.
• High demand for custom-service. Following DA‒PHilMech’s policy on servicing all rice farmers within 100-ha radius from their office, the cooperative struggles to serve members and non-members. In comparison

Rice Mechanization Models in the Philippines
38 RICE-BASED BIOSYSTEMS JOURNAL (2022) 10: 33-40
to the demand, the cooperative is still short in machinery.
• No permanent operator. As most of the jobs are seasonal (i.e., land preparation, planting, harvesting), operators do not stay as they prefer regular source of income.
The cooperative also cited the top three reasons of their success:
• Providing jobs for the community. The growing custom-service enterprise enabled them to hire employees within their community.
• Capital build-up. Capital grew through their enterprise, which they are using for salaries and other cooperative expenses.
• Offer cheaper custom-service rates. They offer cheaper rates for farmer-members and lower rates for non-members (less than 2%).
Calitan Multi-Purpose Cooperative. It is located in Calitan, Panay, Capiz, covering three barangays (Agbanban, Calitan, and Candual) of the Agcalcan Agrarian Reform Community. Panay Founder and current chairman, Mabini Besino, has been leading the cooperative for 28 years since it was established in 1992. Besino retired from his work in the Capiz provincial military to focus on reviving the cooperative from its inactivity way back 1996. Since 2001, the cooperative grew to 210 farmer-members with 129.5 ha of land area, linking 13 small farmer associations. With its growing membership, it had to acquire machinery from government agencies. Besino’s positions as official chairperson of the Provincial Agricultural and Fisheries Council, member of the Provincial Agrarian Reform Coordinating Committee, and regional president of the Small Water Irrigation Systems Association, empowered him to write and submit proposals and requests. Since 2016, the cooperative acquired the following grants from various government agencies:
• PHilMech: one unit of four-wheel tractor, combine harvester, precision seeder, hand tractor, and floating tiller.
• DA-Regional Field Office 6: one unit of four-wheel tractor, combine harvester, hand tractor, multi-pass rice mill; and two units of reapers.
• Department of Agrarian Reform - Regional Office 6: four-wheel tractor.
• Natural calamities such as typhoons also damaged the cooperative’s properties. But with their continuous efforts, it re-invested in
the construction of a palay shed (500-cavan-capacity), cooperative office, and garage for machinery.
The cooperative has an estimated total asset of PhP 3 - 5 million with zero liabilities. To further generate capital build-up, it developed a custom-service enterprise with different payment schemes for each service (Table 7).
Table 7. Custom service payment scheme of the Calitan MPC.
Machine/Service Payment Scheme
Combine harvester 8:1 bag ratio (operator c/o MPC; fuel c/o client)
Flatbed dryer PhP 27/bag (member), PhP 30/bag (non-member)
Rice mill PhP 1.75 kg-1 (member) PhP 1.90 kg-1 (non-member)
Around 20 - 30% of their net income is set aside for repair and maintenance costs. Employees’ salaries are on an honorarium basis, office hours are during weekends. Board members have an honorarium of PhP 200 a day during meetings and other cooperative activities.
The cooperative cited the main challenges in handling their enterprise:
• Moderate to extreme weather conditions affect the reservation schedules of combine harvesters for custom servicing, resulting in delayed harvests and lower quality of palay.
• Loan payment. Some farmer-members fail to pay their loans on time resulting in opportunity cost of capital.
• Low meeting attendance. Some members are irresponsible and do not participate in cooperative’s events.
Top strategies in their successful enterprise:
• Transparency of records. All transactions have official receipts or newly signed vouchers (cash in and cash out). Members are regularly updated on the income statements and record of expenses.
• Lead by example. Leaders set good examples to their members by living up to their positions and follow policies released by the board.
• Regular consultation with members. Before implementing policy, it is approved by the body with 25% of members in quorum.

Rice Mechanization Models in the Philippines
RICE-BASED BIOSYSTEMS JOURNAL (2022) 10: 33-40 39
Summary and ConclusionThe paper shows that custom service provision by
individuals and farmers’ groups are effective models in accelerating large-scale mechanization. This is a viable model for promoting mechanization because of the direct client-provider relationship through contract agreements. The payment scheme can also be flexible for small-farm holders, whether indirect cash or a percentage of the harvest. The models have expanded farmers’ ventures to cover the entire value chain of rice production in the community. This shows the significant role of farmers’ cooperatives and their practical approach to develop and introduce mechanized farming to the locality. Furthermore, the current flagship program of the Department of Agriculture through RCEF would strengthen these cooperatives and the newly organized organizations to be more profitable and productive. While the landscape of agricultural land in the country is fragmented, which hinders economies’ scale in rice farming, the government should pursue land consolidation and farm clustering to facilitate large-scale mechanization and maximize rice productivity.
Regardless of farm size, the provision of custom services from land preparation to harvesting and other operations is a feasible business enterprise. Farm mechanization, however, is highly capital-intensive compared with other production inputs. Its application is quite complex especially for small-holder farmers as machines do not only require proper operation but also infrastructure to ensure proper maintenance and repair. Through custom hiring services, smallholder farmers are able to gain the benefits of mechanization.
The necessity to recognize the importance of drivers results in successful mechanization programs. To create an environment conducive for mechanization, all stakeholders particularly manufacturers and sellers of farm machines, farm service providers, farmers, and farm machine operators must be able to take profit from mechanized farming.
While the role of the private sector is recognized as a catalyst in creating an environment that promotes mechanization, the role of the government is still considered vital. Thus, farmers need to organize to be able to avail of government support.
To maximize the benefits derived from mechanization, there is a need to integrate mechanization technologies involved from production until postproduction operations. Aside from ensuring timely operations and reducing possible postharvest losses, mechanization also eliminates the middle men; thus, maximizing income from rice farming.
AcknowledgmentThe authors would like to thank the following
PhilRice staff for their valuable contributions in writing this paper: John C. De Leon, Eduardo Jimmy P. Quilang, Arnold S. Juliano, Silvestre C. Andales, Joel A. Ramos, Jade D. Dorado, and Michael M. Ubongen. Likewise, special thanks to Constante T. Briones for the language editing.
Appreciation was also given to Engr. Romeo Vasquez of Right Agri Development Inc., Jonas Del Rosario of DR1 Farmtech Services, Desiree Corpuz of Tabacao Primary Multi-Purpose Cooperative, Mabini B. Besiño of Calitan Multipurpose Cooperative, and Alan A. Asejo of Davao Integrated Resource Cooperative for sharing their experiences in sustaining rice livelihoods in their respective communities.
Sincere credits to the RCEF Mechanization Program of PHilMech for providing relevant information on rice mechanization in the country.
Literature CitedBernas LG (1985) The power tiller manufacturing industry in the
Philippines. Proceedings of the International Conference on Small Farm Equipment for Developing countries: Past Experiences and Future Priorities (pp 141-149). United States: International Rice Research Institute
Bingabing RL, Paz RR, Badua AE, Gragasin M (2015) Department of agriculture Rice mechanization roadmap: On-farm and postharvest mechanization programs (2011-2016). In Banta SJ (Ed.). Mechanization in Rice Farming: Papers Presented at the Annual Rice Forum “Mechanization in Rice Farming: Status, Challenges, and Opportunities” (p 353). Los Baños Laguna: Asia Rice Foundation
Dela Cruz, SM, and HG, Malanon (2017) State of on-farm maize mechanization in the Philippines. Agricultural Engineering International: CIGR Journal 19(4): 20-28
Dela Cruz, RS, Bobier SB (2016) Farm power available for utilization in Philippine agriculture. Postharvest and Mechanization Journal 2(1): 1-16
Hegazy R, Schmidley A, Bautista E, Sumunistrado D, Gummert M, Elepaño A, Sumunistrado D (2013) Mechanization in rice farming: Lessons learned from other countries. Quezon City: Asia Rice Forum
IRRI [International Rice Research Institute] (1986) Small farm equipment for developing countries. Proceedings of the International Conference on Small Farm Equipment for Developing Countries: Past Experiences and Future Priorities (p 640). Manila: International Rice Research Institute
Paras FO, Amongo RM C (2005) Technology transfer strategies for small farm mechanization technologies in the Philippines. Philippine Agricultural Mechanization Bulletin 11(2): 14-23

Rice Mechanization Models in the Philippines
40 RICE-BASED BIOSYSTEMS JOURNAL (2022) 10: 33-40
PHilMech [Philippine Center for Postharvest Development and Mechanization] (2021a) Establishment of FCA-enterprise models for mechanization. Science City of Muñoz, Nueva Ecija
PHilMech [Philippine Center for Postharvest Development and Mechanization] (2021b) RCEF Mechanization Program. Presented during the Ugnay Palay: 33rd National Rice R4D e-Conference. Science City of Muñoz, Nueva Ecija
PSA [Philippine Statistics Authority] (2019) Average palay production costs and returns. Retrieved from https://openstat.psa.gov.ph/PXWeb/pxweb/en/DB/DB__2B__AA__CR/0012B5FCOP0.px/?rxid=c3ed94b5-7d95-41e8-b25b-01494c2d1e1e (accessed October 25, 2021)
Rodriguez DJF, Piadozo MES (2016) Characterization of farm mechanization among lowland rice farmers in Laguna, Philippines. Journal of Economics, Management & Agricultural Development 2(2): 97-108
Sims B, Kienzle J (2016) Making mechanization accessible to smallholder farmers in Sub-Saharan Africa. Environments 3(4). Retrieved from https://doi.org/10.3390/environments 3020011 (accessed October 11, 2021)
Tobias AM (2019) The Philippine Rice Tariffication Law: Implications and issues. Retrieved from http://ap.fftc.agnet.org/ap_db.php?id=960&print=1 (accessed October 11, 2021)

RICE-BASED BIOSYSTEMS JOURNAL (2022) 10: 41-48 41
ESTABLISHMENT OF THE CAPILLARY IRRIGATION (CAPILLARIGATION) SYSTEM FOR SWEETPOTATO
Joshua D. Mari1, Mary Grace N. Semilla1*, and Ricardo F. Orge2
1 Tarlac Agricultural University, Malacampa, Camiling, Tarlac2 Philippine Rice Research Institute, Science City of Muñoz, Nueva Ecija
*Corresponding Author: [email protected]
Abstract During extreme drought periods when it is already too risky to plant rice, farmers are usually advised
to plant other crops to maximize the use of limited water supply so they can have an alternate income source. Sweetpotato (Ipomoea batatas) is commonly planted in rainfed areas or during drought. In this study, the capillarigation system of Philippine Rice Research Institute was tried and evaluated as an alternative irrigation method for sweetpotato production and compared its performance with manual irrigation. The experiment was carried out with four treatments, three of which were represented by the different settings of the capillarigation system to effect varying rates of water applications (T1: 100% depth of riser, T2: 50% depth of riser, T3: 25% depth of riser) and the farmers’ common practice of manual irrigation serving as the control (T0). Results showed that the vine length and storage root length and width were not significantly affected by the treatments employed. However, the number of stem vines, storage root weight, and water productivity were significantly influenced. T1 significantly had the highest average storage root weight of 196.9 kg. On the other hand, water productivity was significantly highest in T3 with 394.5g harvested root per liter of water used.
Keywords: Capillarigation System, Climate Change, Drip Irrigation, Drought, El Niño, Irrigation, Sweetpotato
Introduction The entire world is experiencing climate change.
The World Meteorological Organization (WMO) reported an increasing trend in the global annual mean temperature in the past 45 years. Their recent reports showed that 2020 was one of the three warmest years (2016 as warmest) on record, which is 1.2 ± 0.1 °C above baseline years of 1850 -1900 (WMO, 2021). Climate change has been affecting the lives and livelihood (WMO, 2021) especially in the developing countries (Porio et al., 2018). In the Philippines, the agricultural sector is highly affected. In 2016, for example, there was a decrease in rice production due to typhoon occurrences, dry spell, and drought (PSA, 2018).
Rice production requires a lot of water, estimated to be on the average of 1,432 L per kg of paddy grains produced under an irrigated lowland production system. Thus, planting rice during periods of forecasted El Niño or when there is uncertainty of water supply is risky (Stuecker et al., 2018; Lansigan et al., 2000). Initial investments such as land preparation, seeds, and fertilizer may be wasted if the available water supply is no longer enough to sustain the growth of the rice crop. With this, farmers ought to adapt crop diversification so that their income will not be solely dependent on rice production. Thus, an alternative crop like sweetpotato, which is drought tolerant and requires less water (Siqinbatu et al., 2014) than rice can be planted. Sweetpotato can also
substitute rice as staple food (Portilla and Pagaduan, 2014).
Sweetpotato production has high potential of increasing farmers’ income. It ranked 5th in terms of value of production with PhP 1.054 million value, next to onion, mango, string beans, and coconut (PSA, 2021b). Central Luzon is the third largest sweetpotato producer in the Philippines with 10.1% share in 546.89 thousand MT produce (PSA, 2021a). In this region, 73.8% of the 2020 sweetpotato production is accounted from Tarlac (PSA, 2021b); thereby, making the province the largest commercial producer of sweetpotato (Pagcaliwangan, 2016).
Although sweetpotato is drought tolerant and can withstand limited water (Siqinbatu, 2014), irrigation is still critical as it affects root yield. Decreased water supply resulted in decreased storage root weight (Ekanayakem and Collins, 2004; Felix et al., 2015) while excessive water also affects root development (Pardales and Yamauchi, 2003). Thus, the need to check water management.
Technologies like drip irrigation is an efficient way of utilizing water (Maisiri et al., 2005; Megersa and Abdulahi, 2015). However, the system needs relatively high initial investment (Ali, 2022; Rowe et al., 2014). Thus, a more economical water efficient system like the capillary irrigation technology or capillarigation developed by the Philippine Rice Research Institute (PhilRice), which makes use of capillary wicks (Orge and Sawey, 2019) can be employed.
FULL PAPER

Capillarigation for Sweetpotato
42 RICE-BASED BIOSYSTEMS JOURNAL (2022) 10: 41-48
The system of irrigating plants by capillary action has been adopted in several studies (Semanda, 2018). However, research on this area has not progressed for large scale plant production (Million et al., 2007). The capillarigation system showed good performance in green pepper fields (Orge and Sawey, 2019), paving opportunities in exploring its application to other crops.
This study evaluated the applicability of the capillarigation system for sweetpotato production. Specifically, it aimed to: (a) set-up the system in plots prepared for planting sweetpotato, (b) determine the volume of water applied in relation to system’s setting, and (c) evaluate system performance in terms of the crop’s agronomic characteristics and yield parameters.
Materials and MethodsThe capillarigation system components
This experiment used the capillarigation system developed by the Philippine Rice Research Institute (PhilRice) as a low-cost alternative to drip irrigation of rice-based crops especially when water supply is limited and that planting of rice is no longer possible. Its layout is almost similar to the drip irrigation except that capillary wicks are used as means of dispensing water (Figure 1) instead of the emitter or dripper, which is typically used in the drip irrigation system. It was designed to be a do-it-yourself type of irrigation system maximizing the use of local and recycled materials. More details in the design and setting up of the system are provided in the two publications of Orge and Sawey (2017, 2019).
Figure 1. Schematic layout of the capillarigation system (Orge and Sawey, 2017)
In this study, a 200 L plastic cylindrical container was used as water tank and a 16 L plastic pail as water level limiter. For the water supply and distribution lines, a 12.5 mm (1/2”) diameter PVC pipes cut into desired lengths were used and complemented with PVC tee fittings and elbows. The same size of PVC was also used for the risers, which were individually cut into 18 cm length. Commercially available cotton rope was used as capillary wicks. To minimize water loss due to evaporation, each wick was covered with recycled plastic drinking straw.
Field layout and establishment
This study was conducted in Brgy. Paul, Mangatarem, Pangasinan from August 2020 to June 2021. The field used was idle (fallowed) prior to the setting up of this study. Land preparation was done using 4W tractor-mounted rotavator to remove the weeds and loosen the soil to attain a good tilth suitable for planting.
To create variations in the rate of application of water using the capillarigation system, the depth of water relative to the height of the riser varied in this study by changing the location of the float valve relative to the height of the 16 L pail used as water level limiter. This variation resulted incorresponding changes in the freeboard i.e., the difference in height between the riser and the water level inside the riser.
Table 1 presents the treatments of the study. T1, T2, and T3 represent the settings of the capillarigation system, which were described in terms of the volume of water inside the water level limiter with its height corresponding to the height of water in the riser. In T1, for example, the amount of water in the secondary tank is 7 L, which corresponds to a fully filled riser. On the other hand, in T3, the 2 L volume of water in the secondary tank corresponds to a riser that has only a water height of ¼ (25%) of its height. Manual irrigation was also added in the treatment to serve as the control (T0) and as basis in comparing the performance of the capillarigation system with the existing irrigation practice.
Table 1. Treatment used.
Treatment Code Description
T0 Control; manual irrigation
T1 Capillarigation setup; 7 L maximum level; 100% depth of riser (every other day monitoring)
T2 Capillarigation setup; 3 L maximum level; 50% depth of riser (once a week monitoring)
T3 Capillarigation setup; 2 L maximum level; 25% depth of riser (once a month monitoring)

Capillarigation for Sweetpotato
RICE-BASED BIOSYSTEMS JOURNAL (2022) 10: 41-48 43
Figure 2 shows a setup of the capillarigation system, typical for T1, T2, and T3. As shown, the distance between rows (ridge) was 100 cm and each row had an effective length of 3 m just enough to accommodate 10 hills of sweetpotato spaced at 30 cm between hills. Each hill was planted with 1 cut vine.
2. Plant parameters. Data were collected immediately after harvesting. Plant parameters were determined in terms of the following:
a. length and width of storage roots
b. length of sweet potato vines
c. number of the vine stems
3. Yield. This was determined by taking the root yield of five randomly selected plants representing each treatment.
4. Water productivity. This was computed using the formula:
Ewu = Y/Vt
Where:
Vt = total accumulated volume of water applied throughout the crop growth.
Y= total crop yield in the area
Data analysis
Data were analyzed in a randomized complete block design using Statistical Tool for Agricultural Research (STAR). Further analysis was run by STAR for comparison of treatment means using Least Significant Difference (LSD)
Results and Discussion General information
Figure 3 shows the capillarigation system established in plots planted with Super Bureau variety (VSP 6). Aside from being easy to assemble, the system components can easily be purchased in local stores (Appendix Table 1). The sweetpotato planting materials were sourced out from the Rootcrops Research and Training Center based at the Tarlac Agricultural University, Malacampa, Camiling, Tarlac. Two rainfall occurred during the study; however, these were not documented. Sweetpotatoes were harvested after 4 months from the planting date.
Data gathered
The following data were used in evaluating the performance of the capillarigation system (represented at different settings) relative to that of the control (manual irrigation):
1. Volume of water applied. For the plots using the capillarigation system, the volume of water supplied to the plants was determined based on the total amount of water added to the initially-filled tank devoted for each treatment. For the control, volume of water was supplied through a plastic pail. The volume of water applied per plant was computed using the formula:
V= Vt/ n
Where:
Vt = total accumulated volume of water applied throughout the crop growth
n = number of plants
Figure 2. Layout of the capillarigation system established for sweetpotato production in the study.

Capillarigation for Sweetpotato
44 RICE-BASED BIOSYSTEMS JOURNAL (2022) 10: 41-48
Figure 3. The capillarigation system installed in sweetpotato plots.
Volume of water supplied
As shown in Figure 4, the highest volume consumed in the whole duration of cropping was T1 (235 L). This is followed by the control setup with 160 liters. T2 and T1 were supplied with 47 L and 8 L for the whole growing season, respectively. It was observed that storage roots were still produced in T2 and T3, which indicates that sweetpotato can be grown during scarce water conditions.
Figure 4. Total volume of water applied in each of the treatments.
Growth parameters
The capillarigation system was evaluated based on sweetpotato agronomic characteristics including storage roots yield. Table 2 shows the growth parameters of sweetpotato in terms of vine length and number of vines. T1 has the longest vine produced, followed by control, T2 and T3. However, analysis of variance showed that vine length is not significantly different among treatments. Li et.al (2021) found that more water promotes growth of sweetpotato shoot. Similarly, vine lengthened with increased irrigation
(Gajanayake and Reddy, 2016). It can be noted that these studies involved deficit irrigation treatments, which is not the case in this research.
Result of this study agrees with Sokoto and Gaya (2016), which concluded that irrigation interval had no significant effect on the vine length because the supplied water was sufficient enough for vine growth. On the other hand, the average number of vines had significant differences among treatments with T1 having the most number of vines. This was followed by those plants under control, and then T2 and T3 which were not significantly different from each other. Gomes and Carr (2001) showed that vine production is higher in wet season than in dry season. Vine number also increased with more irrigation (Saqib, et.al, 2017). Both the length and number of vines contributed to the vine yield. Furthermore, increasing irrigation frequency caused higher vine yield (Saqib, et al., 2017, Biswal et al., 2017). Above-ground growth can be increased to promote source capacity, which leads to higher vine yield and eventually, high harvest (Li et al, 2021).
Table 2. Growth parameters of sweetpotato under different treatments
Treatment Vine length, cm
No. of vines
T0 - Control; Manual Irrigation 196.0 3.8 ab
T1 - 7 L maximum level; 100% depth of riser 213.8 4.4 a
T2 - 3 L maximum level; 50% depth of riser 189.0 3.4 b
T3 - 2 L maximum level; 25% depth of riser 146.6 3.6 b
ns *

Capillarigation for Sweetpotato
RICE-BASED BIOSYSTEMS JOURNAL (2022) 10: 41-48 45
Yield parameters
Storage root length, storage root diameter, and storage root weight increase with irrigation frequency or shorter irrigation interval (Saqib et al., 2017; Nedunchezhiyan et al., 2012). However, this is not the case for this study’s storage root diameter and length (Table 3). All treatments produced roots, which length and width do not significantly differ from each other. This can be due to the insignificant difference in vine length, which directly affects yield parameters (Saqib, et al., 2017). Root length and diameter were higher in longer irrigation intervals; however, root diameter does not significantly vary (Abu El-Fotoh, et al., 2019). Storage root length and width are parameters related to assessing quality of harvest (Bryan et al., 2003; Abd El-Baky et al., 2010; Villordon et al., 2018). All treatments in this study produced relatively similar quality of storage roots while The weight of harvested roots significantly varied (Table 3). Storage roots weight was highest in T1, followed by control, T3,, and T2 (Figure 5). This can be attributed to the vine yield in each of the treatment. Increasing irrigation frequency also increased root yield (Nedunchezhiyan et al., 2012), which is supported by the yield result from T3, T1, and control irrigation. However, T3 produced higher storage roots yield than T2, which was watered more frequently. This could mean that certain irrigation level could affect storage root yield. Almost similar observations were also noted by Thompson, Smittle, and Hall (1992); Gajanayake and Reddy (2016); and Li et al., (2021). This is where water use efficiency
or water productivity comes in to assess the resource utilization of a technology (Maisiri et al., 2005; Mergesa and Abdulahi, 2015).
Water productivity
In this study, water productivity was significantly affected by the different treatments (Figure 6). It can be observed that T3 with a maximum water level of 2 L or 25% depth of riser had significantly highest storage root produced per liter of water supplied with 394.50 g per liter. It is followed by T2 with 57.28 g of storage roots produced. Control and T1 produced 20.58 and 17.69 g of storage roots per liter, respectively. While other studies showed that increasing irrigation levels increased water use efficiency (Laurie, Plooy and Laurie, 2009; Mantovani et al., 2013; Zhang et al., 2018), this study matches results gathered by Nedunchezhiyan, Gangandhara, Ray (2012) and Li et al., (2021), who found that water is more efficiently utilized at lower irrigation levels. This may indicate that with less amount of water applied through capillarigation, especially in T3 and T2, sweetpotato can maximize or save water resource. This also shows that sweetpotato, despite limited water supply, can still be productive (Siqinbatu et al., 2014). It should also be noted that the crop was established during the last two months of rainy season and first 2 months of dry season. Solis et al. (2014) reported that soil moisture status for the first 30 days after transplanting (DAT) affected root development. Despite T2 having very low amount of irrigation, the rainfall occurrences might have supplied just
Table 3. Sweetpotato yield parameters of the different treatments.
Treatment Storage root length (cm)
Storage root width (cm)
Storage root weight (g)
T0- Control; Manual irrigation 3.49 1.98 164.60 b
T1 - 7 L Maximum level; 100% depth of riser 4.48 2.40 207.80 a
T2 - 3 L Maximum level; 50% depth of riser 3.93 1.83 134.60 c
T3 - 2 L Maximum level; 25% depth of riser 3.31 1.88 157.80 bc
ns ns *
Figure 5. Total actual weight of harvested sweetpotato storage roots from each treatment.
Figure 6. Water productivity of each treatment.

Capillarigation for Sweetpotato
46 RICE-BASED BIOSYSTEMS JOURNAL (2022) 10: 41-48
enough moisture within 30 DAT; thereby, producing storage roots. Certain genotypes have the ability to be productive amid less water (Solis et al., 2014; Andrade et al., 2016), which could mean that the variety used in this study might also be drought-tolerant. Irrigation method did not affect water use efficiency (Onder, et al., 2015). Results from T1 and control, which employed different irrigation systems, were not significantly different. However, if storage root yield is considered, T1 showed more advantages.
ConclusionIn this study, the PhilRice-developed
capillarigation system was used to irrigate plots planted with sweetpotato and compared its performance, measured in terms of the crop’s growth (number of vines and vine length) and yield parameters (storage root dimensions and weight), with the traditional, manual method of irrigation. The capillarigation system was operated in three settings, each setting representing a treatment, with the manual irrigation as the control. The following conclusion are drawn from the study results:
1. The capillarigation system can be an alternative irrigation method for sweetpotato. Under optimum setting, water application is more efficient than the conventional practice of manual irrigation;
2. The adjustments on the water level at the secondary tank, which were represented by the three treatments (T1, T2, and T3), can be a practical way of varying the water application rate. Results show that a 100% level setting (T1) led to the highest crop yield while the highest water productivity was recorded at 25% (T3). Setting to be used is based on field condition. T3 setting could be the best option in areas with limited water. However, if water supply is good, the best option is to target for the highest yield;
3. The installation of the capillarigation system may require an added cost. However, this can be compensated by savings in labor cost as once installed, the plots are already self-watering. System components can also be made from recycled materials, which can significantly lower down its investment cost.
AcknowledgmentThe researchers are grateful for the assistance
of the Director of Rootcrops Research and Training Center in Tarlac Agricultural University, Dr. Lilibeth B. Laranang; members of the advisory committee, Dr. Leonell P. Lijauco and Engr. Jesus A. Tolentino; and the Bachelor of Science in Agricultural Engineering Class of 2021.
Literature CitedAbu El-Fotoh HM, Abd-El-Kader AS, Manssur FYO (2019)
Effect of irrigation intervals, antitranspirants, compost and humic acid on growth and yield of sweetpotato. Plant Production Science. Zagazig Journal of Agricultural Research 6(3): 649-664
Ali MH (2022) Practices of irrigation and on-farm water management. Volume 2. New York City: Springer
Andrade MI, Naico A, Ricardo J, Eyzaguirre R, Makunde G, Ortiz R, Gruneberg W (2016) Genotype x environment interaction and selection for drought adaptation in sweetpotato (Ipomoea batats L. Lam.) in Mozambique. Euphytica 209: 261-280
Biswal S, Nedunchezhiyan M, Mohapatra PK (2017) Effect of irrigation schedule and fertilizer levels on growth and yield of sweetpotato (Ipomoea batatas L.) Journal of Rootcrops. Indian Society for Rootcrops 43(1): 44-51
Bryan AD, Schultheis JR, Pesic-VanEsbroeck Z, Yencho GC (2003) Cultivar decline in sweetpotato. II. Impact of virus infection on yield and storage root quality in ‘Beauregard’ and ‘Hernandez’. Journal of the American Society for Horticultural Science 128(6): 856-863
Ekanayakem I, Collins W (2004) Effect of irrigation on sweet potato root carbohydrates and nitrogenous compounds. Food, Agriculture and Environment 2(1): 243-248
El-Baky A, Ahmed AA, El-Nemr MA, Zaki MF (2010) Effect of potassium fertilizer and foliar zinc application on yield and quality of sweetpotato. Research Journal of Agricultural & Biological Sciences 6(4): 386-394
Felix J, Shock C, Ishida J, Feibert E, Saunders L (2015) Irrigation criteria and sweetpotato cultivar performance in the Treasure Valley of Eastern Oregon. HortScience 50 (7): 1011-1017
Gajanayake B, Reddy KR (2016) Sweetpotato responses to mid- and late-season soil moisture deficits. Crop Science 56(4): 1865
Gomes F, Carr MKV (2001) Effects of water availability and vine harvesting frequency on the productivity of sweetpotato in Southern Mozambique. I. Storage root and vine yields. Experimental Agriculture 37(4): 523-537

Capillarigation for Sweetpotato
RICE-BASED BIOSYSTEMS JOURNAL (2022) 10: 41-48 47
Lansigan FP, delos Santos WL, Coladilla JO (2000) Agronomic impacts of climate variability on rice production in the Philippines. Agriculture, Ecosystems & Environment 82(1-3), 129-137
Laurie RN, Plooy DU, Laurie SM (2009) Effect of moisture stress on growth and performance of orange fleshed sweetpotato. In African Crop Science Conference Proceedings 9: 235-239
Li S, Zhao L, Sun N, Liu Q, Li H (2021) Photosynthesis product allocation and yield in sweepotato with different irrigation levels at mid-season. Agricultural Water Management 246: 10678
Mantovani EC, Delazari FT, Dias LE, Assis IR, Vieira GH, Landim FM (2013) Yield and water use efficiency for two sweetpotato cultivars depending in irrigation depths. HorticulturaBrasileira 31(4)
Maisiri N, Senzanje A, Rockstrom J, Twomlow SJ (2005) On farm evaluation of the effect of lowcost drip irrigation on water and crop productivity compared to conventional surface irrigation system. Physics and Chemistry of the Earth, Parts A/B/C 20 (11-16): 783-791
Megersa G, Abdulahi J (2015) Irrigation system in Israel: A review. International Journal of Water Resources and Environmental Engineering 7(3): 29-37
Million J, Yeager T, Larsen C (2007) Water use and fertilizer response of Asalea using several no-leach irrigation methods. Hortechnology 17(1): 21-25
Nedunchezhiyan M, Gangadharan B, Ray RC (2012) Effect of tillage, irrigation, and nutrient levels on growth and yield of sweet potato in rice fallow. International Scholarly Research Network. ISRN Agronomy 2021
Onder D, Onder S, Caliskan ME, Calikskan S (2015) Influence of different irrigation methods and irrigation levels on water use efficiency, yield, and yield attributes of sweet potatoes. Fresenius Environmental Bulletin 24(10a): 3398-3403
Orge RF, Sawey DA (2017) Coping with water scarcity in rice-based farms: development of a capillary irrigation system for smallholder farmers in the Philippines. In Gorawala, P. and Mandhatri, S. Agricultural Research Updates 16: 191-207
Orge RF, Sawey DA (2019) Field performance of the capillary wick irrigation (capillarigation) system for rice-based crops. International Journal of GEOMATE 17(61): 41-49
Pagcaliwangan B (2016) Sweetpotato fiesta held in Camiling Tarlac. Retrieved from http://www.pcaarrd.dost.gov.ph/home/por tal /index.php/quick-information-dispatch/2697-sweetpotato-fiesta-held-in-camiling-tarlac (accessed February 18, 2022)
Pardales JR, Yamauchi A (2003) Regulation of root development in sweetpotato and cassava by soil moisture during their establishment period. Plant and Soil 255: 201-208
PSA [Philippine Statistics Authority] (2018) Crops statistics of the Philippines 2016-2020. Retrieved from https://psa.gov.ph/content/crops-statistics-philippines-national-and-regional (accessed February 18, 2022)
PSA [Philippine Statistics Authority] (2021a) Crops statistics of the Philippines 2016-2020. Retrieved from https://psa.gov.ph/content/crops-statistics-philippines-national-and-regional (accessed February 18, 2022)
PSA [Philippine Statistics Authority] (2021b) Central Luzon’s total value of other crops value and volume of production in 2020. Retrieved from http://rsso03.psa.gov.ph/article/central-luzons-total-value-other-crops-value-and-volume-production (accessed February 18, 2022)
Porio E, Dator-Bercilla J, Narisma G, Cruz F, Yulo-Loyzaga A (2018) Drought and urbanization: The case of the Philippines. In Urban Drought (pp 183-208). Singapore: Springer
Portilla JM, Pagaduan JMR (2014) Status of other staple crops as substitute to rice: an assessment in Isabela and Quirino [Philippines]. Philippine Journal of Crop Science. 39: 132-133
Rowe BD, Kolp MR, Greer SE, Getter KL (2014) Comparison of irrigation efficiency and plant health of overhead, drip, and sub-irrigation for extensive green roofs. Ecological Engineering 64: 306-313
Saqib M, Khalid M, Hussain S, Anjum M (2017) Effect of water stress and planting system on growth yield and quality of sweet potato. Acta Scientiarum Polonorum Hortorum. Cultus 16 (6): 201-210
Semanda NPK, Ward JD, Myers BR (2018) A semi-systematic review on capillary irrigation: the benefits, limitations, and opportunities. Horticulturae 4(3):23
Siqinbatu YK, Hirai H, Shibuya T, Endo R (2014) Effects of soil water content on the growth and yield of sweetpotato grown on sandy soil. Eco-Engineering 26(3): 75-80
Sokoto MB, Gaya MI (2016) Growth and yield of sweetpotato (Ipomoea batatas L.) as influenced by irrigation interval and variety in Sokoto Sudan Savananah, Nigeria. International Journal of Plant and Soil Science 11(3):1-12
Solis J, Villordon A, Baisakh N, LaBonte D, Firon N (2014) Effect of drought on storage root development and gene expression profile of sweetpotato under greenhouse and field conditions. Journal of the American Society for Horticultural Science 139(3): 317-324
Stuecker M, Tigchelaar M, Kantar M (2018) Climate variability on rice production in the Philippines. PLoS ONE 13(8): 0201426
Thompson PG, Smittle DA, Hall MR (1992) Relationship of sweetpotato yield and quality to amount of irrigation. HortScience 27(1): 23-26
Villordon A, Gregorie JC, LaBonte D, Khan A, Selvaraj M (2018) Variation in ‘Bayou Belle’ and ‘Beauregard’ sweetpotato root length in response to experimental phosphorous deficiency and compacted layer treatments. HortScience 53(10): 1534-1540
WMO [World Meteorological Organization] (2021) State of global climate 2020. Retrieved from https://public.wmo.int/en/our-mandate/climate/wmo-statement-state-of-global-climate (accessed February 23, 2022)
Zhang H, Xie B, Dong S, Wang B, Zhang L, Shi C (2018) Effects of different periods of drought stress on photosynthetic efficiency and water consumption characteristics of sweet potato. Journal of Applied Ecology 29(6): 1943-1850

Capillarigation for Sweetpotato
48 RICE-BASED BIOSYSTEMS JOURNAL (2022) 10: 41-48
Annex Table 1. Cost of materials for the capillarigation setup (3 treatments).
Materials Quantity/Unit Unit Price Actual Cost (PhP)
Plastic drum (200 L) 3 pcs 700 2100.00
Plastic pail (16 L) 3 pcs 100 300.00
Plastic floater 3 pcs 50 150.00
PVC pipes, 12.5 mm (1/2 in) x 3m 20 pcs 20 400.00
Cotton rope 1 roll 50 50.00
Plastic faucet 3 pcs 20 60.00
Plastic drinking straw 1 pack 20 20.00
PVC tee fittings 35 pcs 10 350.00
Sealants 2 tubes 35 70.00
Elbows, 12.5 mm (1/2 in) 9 pcs 10 90.00
Material Cost 3,590.00
Labor Cost 1,200.00
Total Cost 4,790.00

RICE-BASED BIOSYSTEMS JOURNAL (2022) 10: 49-59 49
RAPID ANALYSIS OF RICE PROTEIN AND AMYLOSE CONTENT USING NEAR-INFRARED REFLECTANCE
SPECTROSCOPY Gerome A. Corpuz, Evelyn H. Bandonill, Rodel M. Bulatao, Bernando S. Peralta,
Jenina Patria S. Villar, Lynnden C. Lucas, Jasper G. Tallada, and Henry M. Corpuz* Philippine Rice Research Institute, Science City of Muñoz, Nueva Ecija, Philippines*Corresponding Author: [email protected], [email protected]
Abstract A fast and simple alternative method based on near-infrared reflectance spectroscopy (NIRS) was developed
to analyze rice endosperm protein content (PC) and amylose content (AC). The spectral data and the measured values for PC and AC of different rice varieties and elite lines were collected to create a diverse calibration dataset. Modified partial least square (mPLS) method was employed to create an optimal calibration model for the two parameters using milled rice and flour samples. Results showed that the calibration models made with flour samples were more reliable than milled rice as indicated by the higher coefficient of determination (R2), lower standard error of calibration (SEC), and standard error of prediction (SEP). Moreover, the developed calibration models for rice flour provided good prediction results for PC and AC with a relatively acceptable ratio of prediction to deviation (RPD) values of 4.0 and 2.5, respectively. Results of external validation test showed that the prediction accuracy of PC calibration model was 96.46 and 95.84% for AC suggesting that these models could accurately measure the PC and AC values of unknown samples. These findings demonstrate the feasibility of NIRS-based screening method for high-throughput and reliable measurement of PC and AC in rice grains.
Keywords: Amylose Content, Calibration Model, Modified Partial Least-Squares, Near-Infrared Spectroscopy, Protein Content
Introduction Aside from yield increase and resistance to abiotic
and biotic stresses, grain quality improvement has been the target of the rice breeding program to develop new varieties that are highly acceptable to consumers (Lou et al., 2009). Through the National Cooperative Testing (NCT) program and pre-NCT grain quality (GQ) screening studies, Rice Chemistry and Food Science Division of the Philippine Rice Research Institute (PhilRice) receives more than 1,000 rice breeding materials annually from various breeding groups and institutions for GQ evaluation. Rice grain quality is assessed based on milling yield, physical attributes, physicochemical properties (PCPs), and nutritional quality (Asante, 2017). From the consumers’ perspective, rice starch PCPs are primary considerations because these determine the cooking and eating quality of rice and its marketability (Hori et al., 2016). Among these PCPs, amylose and PC greatly influence rice eating quality. Amylose is the key indicator of the texture of cooked rice. High amylose rices are hard and fluffy while low amylose rices tend to have soft and sticky grains when cooked. PC is more likely associated with the nutritional quality of rice. Although PC is not a major part of rice breeding selection, it significantly affects the cooking and eating qualities of cooked rice grain due to its
interaction with water during cooking. Consumers less prefer rice varieties with high PC because of their harder and less sticky cooked grains (Jimenez et al., 2019). These rice constituents are routinely measured in the laboratory using conventional methods, which are laborious, time-consuming, costly, and generate huge amounts of harmful chemical wastes. Therefore, there is a need for a rapid, cost-reducing, safe, and accurate alternative method to fast-track the screening of rice breeding materials with excellent eating quality.
NIRS is a robust analytical technique due to its capability for fast and reliable measurement of quality attributes of foods and feeds (Cen and He, 2007). The NIRS machine can analyze various constituents in food and agricultural products such as cereals and cereal-based products, milk and dairy products, meat, fish, fruits and vegetables, confectionery, and beverages (Osborne, 2006a; Champagne et al., 2001). It is also adopted for the quality screening of germplasms in cereal breeding programs (Osborne, 2006b). Compared with conventional laboratory methods, NIRS technology offers many advantages such as simple operation, quick, reliable, cost-effective analysis, safe, and environment-friendly as no hazardous chemicals are used. The machine can also concurrently measure several constituents
FULL PAPER

Rapid Analysis Using Near-Infrared Reflectance Spectroscopy
50 RICE-BASED BIOSYSTEMS JOURNAL (2022) 10: 49-59
in a single run (Osborne, 2006a). Hence, the NIRS technology would be a suitable alternative method for grain quality screening in the rice breeding program, in which hundreds of rice lines are submitted for analysis.
The NIRS technology is recognized as a fast and straightforward method. The instrument’s versatility can be achieved through accurate and robust calibration models that are developed for target quality traits. Calibration development involves the following: (1) collection and processing of NIR spectra of rice samples; (2) determination of reference data using conventional laboratory methods and combining them with spectral data to build a calibration dataset carrying all chemical and physical variations to be expected in the samples from an unknown population; (3) establishment of optimum calibration models and elimination of outliers; and (4) internal and external validation of the developed calibration models to assess their prediction accuracy (Li et al., 2020).
NIRS has shown the potential of predicting various rice grain quality parameters. Prediction models for rice moisture, protein, amylose content, and gelatinization temperature of whole brown rice (Bagchi et al., 2016), milled rice, and flour samples were previously developed (Bao et al., 2001; Bao et al., 2007a; Natsuga and Kawamura, 2006; Wu and Shi, 2007; Xie et al., 2014). Furthermore, NIRS calibration models for rice grain milling quality (e.g., degree of milling, surface lipid content, grain color, and whiteness index), rice flour pasting viscosity, and cooked rice textural properties analyses were also reported (Srikham and Noomhorm, 2015; Siriphollakul et al., 2015; Fazeli et al., 2021a; Bao et al., 2007a; Champagne et al., 2001). However, the calibration models previously reported may not be reliable to satisfactorily measure the target traits of other rice samples especially when they are locally cultivated. Thus, all possible variations may not be covered in their calibration set. The sampling technique and wavelength range used during spectra collection and the conventional methods employed in determining the reference values are also different from those used in the present study. Thus, the need to develop and validate new prediction models compatible with the Philippine rice samples.
NIRS technology has been adopted by breeders in some rice-producing countries to facilitate efficient evaluation of breeding populations for grain quality traits. However, it has not been fully explored in the Philippines, particularly in screening the elite lines during early selection stages of the rice breeding program. Furthermore, no similar studies were conducted using a diverse set of Philippine rice
samples and elite lines. The present study developed prediction models for rapid and reliable analysis of rice PC and AC to facilitate efficient delivery of grain quality data that will significantly help in breeding high-yielding Philippine rice varieties with excellent eating quality.
Materials and MethodsRice samples
There were 600 rice samples, including National Seed Industry Council (NSIC)-approved varieties and NCT promising lines, used in this study. These samples were grown in the Philippine Rice Research Institute Central Experiment Station (CES) from 2018 Dry Season (DS) to 2020 Wet Season (WS). Rice grains were dried up to 12 - 14% moisture content and aged for at least two months at room temperature prior to analysis. Rice samples were dehulled in Satake testing husker (Satake Co. Japan), polished using a rice miller tester (Grainman 60-115-60-2AT, Grain Machinery Manufacturing Corporation, USA), and ground in a Cyclone Sample Mill (UDY Corporation, USA) equipped with a 0.5 mm screen.
Spectra collection
Reflectance spectra of milled rice and flour samples were collected using a visible or near-infrared scanning spectrophotometer (NIR System DS 2500 Analyzer, FOSS) through ISIscan Nova version 8.0.6.2. The spectra were collected continuously using 400 - 2500 nm wavelength and recorded as log (1/R) at 2 nm increments. The spectral data were processed with Foss Mosaic Solo version 8.0.4.12. The scanned data was exported and utilized with WinISI Project Manager version 4.12.0.15440. The average spectrum of each sample was used for further analysis.
Determination of reference values
Rice AC was measured based on the pH 9.2 iodine colorimetric method of Juliano et al. (2012). Exactly 100 mg flour was weighed and transferred into a 100-mL volumetric flask then added with 1 mL of 95% ethanol to wet the samples and disperse the clumps. The sample was soaked in 9 mL of 1N NaOH and incubated for 18 - 24 h to gelatinize the starch fraction. After which, the solution was diluted to 100 mL with distilled water. About 5 mL of the sample was transferred to a 100-mL volumetric flask and diluted with approximately 50 mL distilled water. The solution was added with 1 mL of 0.9 M NH4Cl, swirled gently, then added with 2 mL of iodine reagent (0.15% iodine in 1.5% KI) and diluted to 100-mL mark with distilled water. Absorbance was measured at 620 nm within 20 - 60 min incubation using UV-Vis spectrophotometer (Shimadzu UV-

Rapid Analysis Using Near-Infrared Reflectance Spectroscopy
RICE-BASED BIOSYSTEMS JOURNAL (2022) 10: 49-59 51
1280, Japan). AC was calculated based on the standard curve generated from potato amylose and milled rice undefatted checks.
The PC of rice was analyzed using the Kjeldahl method. Rice flour (0.3 g) was weighed and transferred into a digestion tube and added with 1 Kjeltabs catalyst and 5 mL of concentrated sulfuric acid (H2SO4). The tubes containing the samples were placed in the digestion block and heated gently at 420oC until the solids became a clear solution. After cooling, the digested samples were added with approximately 25 mL of distilled water to dissolve the crystalline residue. The samples were distilled and titrated with 0.05N H2SO4 using a Kjeltec protein autoanalyzer (Velp DK-159, Italy) following the manufacturer’s instructions. The crude PC was computed using the formula:
models. RPD indicates the suitability of the created calibration equations to predict the target constituent. With a higher RPD value, the calibration model will more likely predict the right sample values (Porep et al., 2015). External validation was performed using another set of unknown samples that were not part of the calibration dataset to check the actual prediction performance of the calibration models.
ResultsSpectral profile and reference data
NIR spectra provide vital information on the different functional groups (e.g., C-H, O-H, and N-H bonds) of measured constituents in the tested samples. Figures 1A and 1B show the NIR spectra of the milled and rice flour samples used in the
PC (%) = [ Vol H2SO4(sample) - Vol H2SO4 (blank)] x N H2SO4]
X 0.014 X 5.95 X 100 weight of sample (g)
Calibration and validation procedures
Calibration datasets for milled rice and flour samples were created separately. Calibration was performed using WinISI II Project Manager version 4.10.0.15326. Principal component analysis was run and the generalized Mahalanobis distances, also known as Global H distance (GH), were computed for each spectrum to remove the outliers. The remaining samples in the calibration dataset were divided into two subsets: (1) calibration subset to develop the calibration models and (2) internal validation subset using 75 samples to evaluate the prediction performance of the developed calibration models. Using modified PLS, calibration equations were developed on the first derivative of reflectance and transmittance spectra (math treatment, D = 1, G = 4, S1 = 4, S2 = 1) and standard normal variance and de-trend (SNVD) scatter correction. D represents the derivative order number (1 means first derivative); G is gap (the number of data points over which derivation is computed); S1 is the number of data points in the 1st smoothing, and S2 is the number of data points in the 2nd smoothing, which is normally set at 1 for no 2nd smoothing (Bao et al., 2001). NIRS calibration models were assessed based on the computed SEC, coefficient of determination for calibration (R2), coefficient of determination (1-VR), and standard error of cross-validation (SECV). However, the prediction performance of the developed calibration models was evaluated based on the coefficient of determination for internal validation (r2) and SEP. Moreover, the RPD or SD/SEP ratio was also used to determine the precision of the developed calibration
calibration model development. Although the patterns were similar, the NIR spectra of milled rice samples had a stronger energy absorption and were more segregated and scattered than flour samples. The different particle sizes of grains (whole and broken grains) probably caused the scattering of spectral fingerprints among milled rice samples. The uniform and smooth spectra of flour samples could be due to their finer and homogenous particle size. The first derivative of the raw spectra was presented to clearly visualize prominent peaks associated with the absorption bands of the functional groups of target constituents. Sharp absorption bands around 996 - 968, 1205 - 1206, 1344 - 1345, 1404 - 1405, 1560 - 1562, 1775 - 1779, 1932 - 1934, 2113 - 2115, and 2306 - 2310 nm were observed for both milled rice and flour spectra (Figures 1C and 1D). These wavelengths can be associated with differences in starch composition (amylose and amylopectin), protein, and other biochemical constituents of the rice grain.
The means, ranges, and standard deviations of each parameter of the milled rice and flour sample sets are summarized in Table 1. Amylose ranged 11.15 - 26.28%, covering the low to high AC classifications. The AC histogram showed that majority of the samples were representative of intermediate rice types with 17.1 - 21.0% AC followed by high (>21.0%) and low AC rices (10.1 - 17.0%) (Figure 2A). Some waxy and very low AC rices were also included, but they were tagged as outliers and eventually omitted from the calibration dataset. Large variation was observed in the PC of the selected samples, ranging from 4.93 to 11.65% (Table 1). Based on the frequency distribution

Rapid Analysis Using Near-Infrared Reflectance Spectroscopy
52 RICE-BASED BIOSYSTEMS JOURNAL (2022) 10: 49-59
Figure 1. NIRS whole spectra of rice samples based on (A) milled rice and (B) rice flour group covering the visible and NIR region (400 - 2400 nm wavelength) and their corresponding first derivative spectra (C, D).

Rapid Analysis Using Near-Infrared Reflectance Spectroscopy
RICE-BASED BIOSYSTEMS JOURNAL (2022) 10: 49-59 53
Table 1. Means, ranges, and standard deviations (SD) of the reference values for PC and AC of rice samples in milled rice and flour sets.
Calibration Internal Cross-validation
N Range (%) Mean SD N Range (%) Mean SD
Milled riceConstituentPC 469 4.93 - 11.65 7.23 0.97 75 5.40-8.61 7.23 0.97AC 516 11.15 - 26.28 19.56 2.51 75 11.59-27.76 19.56 2.51
FlourConstituentPC 410 5.03-11.65 7.13 0.90 75 5.40-8.61 7.14 0.89AC 474 11.15-26.28 19.58 2.53 75 11.59-27.76 19.58 2.34
N = number of samples; SD = standard deviation
Figure 2. Histogram of (A) PC and (B) AC reference values used in calibration model development.

Rapid Analysis Using Near-Infrared Reflectance Spectroscopy
54 RICE-BASED BIOSYSTEMS JOURNAL (2022) 10: 49-59
of PC values, most samples in the calibration dataset had 5.0 - 8.0% PC, the typical PC of milled rice samples (Figure 2B).
Calibration and validation for the milled rice set
Of the 600 rice samples, 469 and 516 entries were retained for PC and AC calibration set, respectively, and 75 entries were used in the internal cross-validation to check the performance of calibration models. Using mPLS regression analysis, a good calibration model was developed for PC and AC based on milled rice spectra as indicated by relatively high R2 and 1-VR and low SEC and SECV. However, PC calibration model had a higher R2 (0.93), 1-VR (0.91) and lower SEC (0.26) and SECV (0.28) than the AC calibration model. Internal cross-validation produced low SEP (0.29) and high r2 (0.92) values for the PC calibration model. For the AC calibration model, the computed SEP and r2 values were 1.34 and 0.73, respectively (Table 2). Moreover, the scatter plot of predicted and reference laboratory values for PC showed stronger linear relationships than the AC calibration model (Figures 3A and 3B). The good predictive capacity of the milled rice PC calibration model was further confirmed by the higher RPD value (3.40).
Calibration and validation for the flour set
After omitting the outliers, 410 and 474 entries were retained to develop PC and AC calibration models using flour samples. The calibration and internal cross-validation statistics were improved compared with their milled rice counterparts, particularly for the AC calibration model. The computed R2, SEC, SECV, and 1-VR values were 0.95, 0.20, 0.21, and 0.95 for PC and 0.84, 1.00, 1.25, and 0.75 for AC, respectively. The SEC and SECV for both models were lower than those obtained in the milled rice set, suggesting that the developed flour-based calibration models were better than the milled rice set (Table 2). Moreover, internal cross-validation resulted in higher r2 and
Table 2. Calibration and internal cross-validation statistics for PC and AC in milled rice and flour samples.
Calibration Internal Cross-validation
SEC R2 SECV 1-VR r2 SEP RPD Slope
Milled riceConstituentPC 0.26 0.93 0.28 0.91 0.92 0.29 3.40 1.00AC 1.28 0.74 1.63 0.58 0.73 1.34 1.90 1.01
FlourConstituentPC 0.20 0.95 0.21 0.95 0.94 0.23 4.00 1.00AC 1.00 0.84 1.25 0.75 0.84 1.03 2.50 1.00
SEC = standard error of calibration; RSQ = coefficient of determination for calibration; SECV = standard error of cross-validation; 1-VR = variance ratio r2 = coefficient of determination for internal cross-validation; SEP = standard error of prediction; RPD = the ratio of SD/SEP.
lower SEP for both constituents. This indicates that the flour-based calibration models can predict PC and AC with high accuracy. Accordingly, the regression plot demonstrated better quantitative correlations and a stronger relationship between the predicted and laboratory PC and AC values (Figures 3C and 3D). Dots were closely scattered within the target line and the gap was narrower than in the regression plot of milled rice set. Based on RPD values, the PC (4.00) and AC (2.50) calibration models were considered good and can be used for screening rice breeding lines.
External validation of the flour-based calibration models
The developed calibration models based on rice flour spectra were installed in the NIRS machine and their prediction performance was assessed using 20 unknown rice samples that were not part of the calibration dataset. Table 3 shows the comparison of the measured and predicted values and the computed accuracy. Results showed that the flour set’s calibration models were valid for the quantitative determination of PC and AC of unknown rice samples. PC and AC calibration models achieved high prediction performance with 96.46% and 95.84% accuracy, respectively. The accuracy of the developed calibration model was further assessed statistically. The computed Pearson’s correlation coefficient (r) for comparing the laboratory PC and AC values and NIRS-predicted values were 0.97 and 0.79, respectively (Table 4). An r value larger than 0.70 indicates a statistically significant relationship and higher than 0.80 is significantly correlated.
As shown in Figure 4, the NIRS-predicted values showed positive and strong correlations with the PC and AC laboratory values, suggesting that the developed calibration models could predict the PC and AC quantitatively with high accuracy. Paired t-test was used to determine whether the differences of means measured by the conventional and NIRS-based methods are significant. Paired t-tests showed

Rapid Analysis Using Near-Infrared Reflectance Spectroscopy
RICE-BASED BIOSYSTEMS JOURNAL (2022) 10: 49-59 55
Figure 3. Scatter plots between laboratory and NIR-predicted values for PC and AC for milled rice (A, C) and flour set (B, D), respectively.
Table 3. Prediction accuracy of the developed calibration models for PC and AC in flour set.
UnknownSamples
Constituent
PC AC
Laboratory Value
NIRS-Predicted Value Accuracy Laboratory
ValueNIRS-Predicted
Value Accuracy
(%) (%) (%) (%) (%) (%)
1 7.97 7.67 96.24 23.15 22.10 95.462 7.24 7.30 99.17 19.35 19.38 99.843 6.27 6.25 99.68 19.86 19.76 99.504 7.21 7.02 97.36 22.69 21.75 95.865 7.54 7.15 94.83 21.43 21.38 99.776 6.88 6.71 97.53 19.98 19.89 99.557 6.77 6.60 97.49 20.58 21.01 97.918 6.05 5.76 95.21 18.37 20.05 90.859 7.41 6.83 92.17 23.25 23.63 98.3710 7.03 6.77 96.30 19.55 18.72 95.7511 6.63 6.56 98.94 19.30 19.03 98.6012 7.00 6.57 93.86 23.62 23.44 99.2413 7.59 7.25 95.52 21.55 23.11 92.7614 6.63 6.19 93.36 20.05 21.43 93.1215 6.70 6.64 99.10 20.60 20.21 98.1116 6.25 6.00 96.00 17.84 20.99 82.3417 7.77 7.26 93.44 23.46 21.97 93.6518 7.24 7.17 99.03 18.53 20.19 91.0419 6.51 6.37 97.85 19.25 19.57 98.3420 7.02 6.75 96.15 22.11 22.84 96.70 AVE 96.46 AVE 95.84

Rapid Analysis Using Near-Infrared Reflectance Spectroscopy
56 RICE-BASED BIOSYSTEMS JOURNAL (2022) 10: 49-59
Figure 4. Regression plot between laboratory and NIRS-predicted (A) PC and (B) AC values of 20 unknown samples.
Table 4. Correlation analysis and t-test between NIRS-predicted and laboratory values for PC and AC content of unknown rice samples.
Constituent Correlation Coefficient (r)
t-value
PC 0.97**** 6.40****
AC 0.79**** 1.17
**** significant at p<0.0001
that the mean AC of 20 unknown rice samples obtained from the two methods were not significantly different. Although the NIRS-predicted values differed significantly from the laboratory values at 95% confidence level (Table 4), the PC calibration model had higher prediction accuracy and RPD values than the AC calibration model.
DiscussionGrain quality evaluation is an integral part of the
rice breeding program to produce new rice cultivars with premium eating characteristics preferred by the consumers. The cooking and eating quality of rice is determined by its starch physicochemical properties, particularly amylose and PC. However, conventional methods used to analyze these parameters are laborious, require enormous resources, and generate a large volume of toxic chemical wastes. Hence, there is a pressing need for a fast, high-throughput, cost-reducing, and reliable alternative method to fast-track the delivery of grain quality data useful for the breeding program and other stakeholders. Due to its versatility, NIRS technology has the potential
to automate the grain quality evaluation processes of the rice breeding program. In this study, suitable calibration models were developed for easier and faster analysis of rice amylose and PC. Calibration equations were calculated based on NIRS spectra and the rice samples’ known laboratory or reference values. NIRS spectra provide vital information about the target constituents present in the samples. As shown in Figure 1, prominent and sharp peaks around 996 - 968, 1205 - 1206, 1344 - 1345,1404 - 1405, 1560 - 1562, 1775 - 1779, 1932 - 1934, 2113 - 2115, and 2306 - 2310 nm were observed for milled rice and flour spectra. These absorption bands can be associated with the concentration of functional groups of target constituents in the rice grain. Fazeli et al. (2021a) reported that sharp bands at wavelengths 997 - 998 and 1199 nm are associated with O-H or NH2 second overtone, 1457 - 1573 nm for the O-H and N-H first overtone, 1752 nm for the C-H first overtone, 1938 - 2180 nm for the O-H and N-H combinations, and 2295 nm for the C-H combinations. These O-H, N-H, and C-H bond vibrations are caused by major rice components such as starch, protein, and water compounds (Bagchi et al., 2016; Barton et al., 2002). The spectral region at 1700 - 1800 nm associated with starch molecules vibration showed a good correlation with the AC (Fertig et al., 2004). The combination of the O-H stretching and O-H bending of the amylose molecule at 1929 nm was reported to be a strong band in the FT-NIR-based measurement of AC in rice paddy (Pandiselvam et al., 2016). A good calibration model for AC of Khao Dawk Mali 105 rice was also established at 1900 nm wavelength (Siriphollakul et al., 2017).
Hydrogen bonding in the starch molecule is usually observed at 1400 - 1600 nm, while the absorption band located at 1450 nm is related to the first overtone of the O-H band stretching vibration of starch and water (Siriphollakul et al., 2017; Noah 1997). Moreover, the absorption peaks registered between 1585 - 1595 nm are related to intermolecular hydrogen-bonded O-H groups in amylose molecules (Salgó and Gergely, 2012). Meanwhile, the starch and protein components gave absorption bands located at a higher wavelength (Cocchi et al., 2006). For instance, the peaks at 2173 and 2239 nm due to protein vibrations are responsible for chemical changes of the dough components of bread (Kaddour et al., 2008). The absorption bands of the N-H bonds at about 1500 - 1570 and 2050 - 2070 nm were also reported (Cocchi et al., 2006). The peaks at 2100 nm and between 2322 - 2330 nm are linked to the O-H bend/C-O stretching and C-H stretching in starch molecules, respectively. In addition, the absorption band at 2280 nm corresponds to the C-H stretch and C-H2 deformation of starch (Aenugu et al., 2011). Overall, the absorption peaks observed for the samples at various wavelengths can be attributed to

Rapid Analysis Using Near-Infrared Reflectance Spectroscopy
RICE-BASED BIOSYSTEMS JOURNAL (2022) 10: 49-59 57
their higher RPD values. RPD is used to evaluate the predictive ability and potential applications of the calibration models developed. RPD values lower than 1.9 are considered poor and not recommended for screening; RPD between 2.5 and 2.9 are treated as fair for screening purposes; values >3 are considered good for screening purposes; >5 are good for quality control, and >8 are considered excellent for all analytical tasks (Yi et al., 2017). Hence, the developed prediction models for PC and AC with RPD values of 4.00 and 2.50, respectively, are considered good for screening and can be used in the selection of rice breeding materials with desirable eating quality.
The flour-based calibration models were tested using 20 unknown rice samples to validate their actual prediction performance. High prediction accuracy from external validation tests clearly showed that the developed calibration models are suitable for measuring the AC and PC of unknown rice samples. Paired t-tests showed that the AC values of the unknown rice samples predicted by the NIRS machine were not significantly different from those obtained through the conventional laboratory method. However, PC values obtained from the two methods differed significantly. This could be attributed to the relatively small standard deviation of the laboratory values due to the sensitivity of the conventional reference method. Nonetheless, the PC calibration model had the highest prediction accuracy and RPD values. Generally, both calibration models based on flour spectra offer reasonably good quantitative information for evaluating the PC and AC in rice grains.
NIRS technology provides many advantages compared with the conventional laboratory methods (Table 5). NIRS machine can provide accurate results in less than 1 minute and analyze multiple constituents in a single run. Adoption of NIRS-based screening method will expedite the accurate and efficient delivery of rice grain quality data for the breeders because the machine can simultaneously analyze
the functional group of rice amylose and PC; thereby, providing excellent and reliable prediction models for the target constituents.
Meanwhile, the accuracy of the prediction model is strongly dependent on the samples chosen for calibration development and the accuracy of the reference methods. Therefore, proper selection of samples and reliable reference methods are crucial to the robustness and accuracy of the calibration models for the target constituents. In this study, wide ranges of reference values were collected for each parameter and minute differences in means and standard deviations between the calibration set and internal validation set were obtained from the selected rice samples. These results indicated that representative samples were selected correctly to create a diverse dataset suitable for developing a good calibration model.
Based on the computed calibration and validation statistics, the PC and AC calibration models developed from flour spectra were more robust and reliable than those developed from milled rice, as similarly reported by several authors. Bao et al. (2007b) produced superior calibration equations for thermal and retrogradation properties of rice starch using flour spectra. Measurement of AC, PC, and pasting properties was more precise with flour-based calibration models than using milled rice sets (Fazeli et al., 2021b; Xie et al., 2014; Bao et al., 2007a; Wu and Shi, 2007; Bao et al., 2001). Better calibration performance was observed for the flour samples because of their uniform and homogenous particle size because they passed through a 0.5 mm size screen sieve during the grinding of rice grains. On the other hand, milled rice samples were composed of broken and whole kernels. As grain sizes varied according to variety, prediction models could be less accurate.
The excellent predictive capacities of the flour-based calibration models were further confirmed by
Table 5. Comparison of the conventional and NIR-based methods in terms of analysis speed, chemical inputs, and hazardous waste generation.
ParameterPC AC
Conventional NIRS Conventional NIRS
Analysis time 4 h/batch of 10 samples 1 min/sample
32 h (including incubation time for starch gelatinization)/batch of 50 samples
1 min/sample
Chemical inputs Mixture of H2SO4 (200 ml), NaOH (2 L), boric acid (1.2 L) None
Mixture of NaOH (450 ml), ethanol (50 ml), ammonium chloride (50 ml), and iodine (100 ml)
None
No. of samples analyzed/day
20 100 - 150 50 100 - 150
Chemical waste generation
4L/10 samples None 10 L/50 samples None

Rapid Analysis Using Near-Infrared Reflectance Spectroscopy
58 RICE-BASED BIOSYSTEMS JOURNAL (2022) 10: 49-59
the PC and AC of around 100 - 150 samples per day. NIRS-based method is also safe and environment-friendly as it does not require the use of toxic reagents. Thus, the generation of hazardous chemical waste from conventional methods can be eliminated. The measurement of these parameters by NIRS will ensure greater efficiency of evaluating rice grain quality with a significant reduction in the manpower input as well as the time and cost of analysis.
Conclusion and RecommendationThe capability of NIRS technology to predict rice
PC and AC was evaluated in this study. Considering the calibration and validation statistics, the best calibration models to predict the rice eating quality were developed based on flour spectra. These calibration models could be used for easier and faster analysis of the amylose and PC of rice breeding materials. Shifting to NIRS-based screening method will fast-track the delivery of rice grain quality data necessary for the early release of high-yielding varieties with excellent eating qualities. The developed calibration models should be pilot-tested to further assess their reliability and accuracy in screening a large number of rice breeding lines. The calibration set must also be updated to widen the range and variability of reference values and enhance the sensitivity of the calibration models for new rice samples.
Acknowledgment The authors are thankful to Dr. Marissa V. Romero
for providing valuable suggestions and thorough proofreading of the manuscript.
Literature CitedAenugu HPR, Sathis Kumar D, Srisudharson, Parthiban N,
Ghosh SS, Banji D (2011) Near infra-red spectroscopy- An overview. International Journal of ChemTech Research 3(2): 825-836
Asante MD (2017) Breeding rice for improved grain quality (pp 69-89). Retrieved from Advances in International Rice Research: https://www.intechopen.com/chapters/53681 (accessed March 10, 2020)
Bagchi TB, Sharma S, Chattopadhyay K (2016) Development of NIRS models to predict protein and amylose content of brown rice and proximate compositions of rice bran. Food Chemistry 191: 21-27
Bao JS, Cai YZ, Corke H (2001) Prediction of rice starch quality parameters by near-infrared reflectance spectroscopy. Journal of Food Science 66(7): 936-939
Bao J, Wang Y, Shen Y (2007a) Determination of apparent amylose content, pasting properties and gel texture of rice starch by near-infrared spectroscopy. Journal of the Science of Food and Agriculture 87(11): 2040-2048
Bao J, Shen Y, Jin L (2007b) Determination of thermal and retrogradation properties of rice starch using near-infrared spectroscopy. Journal of Cereal Science 46(1): 75-81
Barton FE, Himmelsbach DS, McClung AM, Champagne EL (2002) Two-dimensional vibration spectroscopy of rice quality and cooking. Cereal Chemistry 79(1): 143-147
Cen H, He Y (2007) Theory and application of near-infrared reflectance spectroscopy in determination of food quality. Trends in Food Science and Technology 18(2): 72-83
Champagne ET, Bett-Garber KL, Grimm CC, McClung AM, Moldenhauer KA, Linscombe S, McKenzie KS, Barton FE II (2001) Near-infrared reflectance analysis for prediction of cooked rice texture. Cereal Chemistry 78(3): 358-362
Cocchi M, Durante C, Foca G, Marchetti A, Tassi L, Ulrici A (2006) Durum wheat adulteration detection by NIR spectroscopy multivariate calibration. Talanta 68(5): 1505-1511
Burestan NF, Afkari Sayyah AH, Safi M (2021a) Prediction of amylose content, protein content, breakdown, and setback viscosity of Kadus rice and its flour by near-infrared spectroscopy (NIRS) analysis. Journal of Food Processing and Preservation, 45(1): e15069
Burestan NF, Afkari Sayyah AH, Tanghinezhad E (2021b) Prediction of some quality properties of rice and its flour by near-infrared spectroscopy (NIRS) analysis. Food Science Nutrition 9(2): 1099-1105
Fertig CC, Podczeck F, Jee RD, Smith MR (2004) Feasibility study for the rapid determination of the amylose content in starch by near-infrared spectroscopy. European Journal of Pharmaceutical Sciences 21(2-3): 155-159
Hori K, Suzuki K, Iijima K, Ebana K (2016) Variation in cooking and eating quality traits in Japanese rice germplasm accessions. Breeding Science 66(2): 309-318
Jimenez R, Molina L, Zarei I, Lapis JR, Chavez R, Cuevas RPO, Sreenivasulu, N (2019). Method development of near-infrared spectroscopy approaches for nondestructive and rapid estimation of total protein in brown rice flour. In Rice Grain Quality 2019 (pp 109-135). New York: Humana Press
Juliano BO, Tuaño APP, Monteroso DN, Aoki N, Mestres C, Duldulao JBA, Bergonio KB (2012) Replacement of acetate with ammonium buffer to determine apparent amylose content of milled rice. Cereal Foods World 57(1): 14-19
Kaddour AA, Mondet M, Cuq B (2008) Application of two-dimensional cross-correlation spectroscopy to analyse infrared (MIR and NIR) spectra recorded during bread dough mixing. Journal of Cereal Science 48(3): 678-685
Li X, Zhang L, Zhang Y, Wang D, Wang X, Yu L, Zhang W, Li P (2020) Review of NIR spectroscopy methods for nondestructive quality analysis of oilseeds and edible oils. Trends in Food Science and Technology 101: 172-181
Lou J, Chen L, Yue G, Lou Q, Mei H, Xiong L, Luo L (2009) QTL mapping of grain quality traits in rice. Journal of Cereal Science 50(2): 145-151

Rapid Analysis Using Near-Infrared Reflectance Spectroscopy
RICE-BASED BIOSYSTEMS JOURNAL (2022) 10: 49-59 59
Natsuga M, Kawamura S (2006) Visible and near-infrared reflectance spectroscopy for determining physicochemical properties of rice. Transactions of the ASABE 49(4): 1069-1076
Noah L, Robert P, Millar S, Champ M (1997) Near-infrared spectroscopy as applied to starch analysis of digestive contents. Journal of Agricultural and Food Chemistry 45(7): 2593-2597
Osborne BG (2006a) Near-infrared spectroscopy in food analysis. In Encyclopedia of Analytical Chemistry: Applications, Theory, and Instrumentation (pp 1-14). Australia: John Wiley & Sons, Ltd
Osborne BG (2006b) Applications of near infrared spectroscopy in quality screening of early-generation material in cereal breeding programmes. Journal of Near Infrared Spectrosscopy 14(2): 93-101
Pandiselvam R, Thirupathi V, Vennila P (2016) Fourier transform-near infrared spectroscopy for rapid and nondestructive measurement of amylose content of paddy. Scientific Journal Agricultural Engineering 41(2): 93-100
Porep JU, Kammerer DR, Carle R (2015) On-line application of near infrared (NIR) spectroscopy in food production. Trends in Food Science and Technology 46(2): 211-230
Salgó A, Gergely S (2012) Analysis of wheat grain development using NIR spectroscopy. Journal of Cereal Science 56(1): 31-38
Siriphollakul P, Kanlayanarat S, Rittiron R, Wanitchang J, Suwonsichon T, Boonyaritthongchai P, Nakano K (2015) Pasting properties by near-infrared reflectance analysis of whole grain paddy rice samples. Journal of Innovative Optical Health Sciences 8(6): 1550035
Siriphollakul P, Nakano K, Kanlayanarat S, Ohashi S, Sakai R, Rittiron R, Maniwara P (2017) Eating quality evaluation of Khao Dawk Mali 105 rice using near-infrared spectroscopy. LWT - Food Science and Technology 79: 70-77
Srikham W, Noomhorm A (2015) Milling quality assessment of Khao Dawk Mali 105 milled rice by near-infrared reflectance spectroscopy technique. Journal of Food Science and Technology 52(11): 7500-7506
Wu JG, Shi CH (2007) Calibration model optimization for rice cooking characteristics by near infrared reflectance spectroscopy (NIRS). Food Chemistry 103(3): 1054-1061
Xie LH, Tang SQ, Chen N, Luo J, Jiao GA, Shao GN, Wei XJ, Hu PS (2014) Optimisation of near-infrared reflectance model in measuring protein and amylose content of rice flour. Food Chemistry 142: 92-100
Yi J, Sun Y, Zhu Z, Liu N, Lu J (2017) Near-infrared reflectance spectroscopy for the prediction of chemical composition in walnut kernel. International Journal of Food Properties 20(7): 1633-1642

RICE-BASED BIOSYSTEMS JOURNAL (2022) 10: 61-74 61
QUALITY CHARACTERISTICS OF RICE-MALT WITH SOY MILK BEVERAGE
Riza G. Abilgos-Ramos*, El Shaira L. Rizzo, Xenia Portia S. Fuentes, and Amelia V. MoralesPhilippine Rice Research Institute, Science City of Muñoz, Nueva Ecija, Philippines
*Corresponding Author: [email protected]
AbstractPlant-based milk alternatives can provide optimum nutrients for children. This study utilized a suitable
Philippine rice variety as an alternative to barley in producing malt and developed a non-dairy ready-to-drink beverage from rice malt and soy. Rice malt extract is processed from malting rice grains, which included 24 h steeping, 48 h germinating at ambient condition, and 24 h kilning at 95°C temperature. Suitable rice varieties for malting were National Seed Industry Council (NSIC) Rc 160, Rc 300, and Rc 15. No significant difference (p<0.05) was observed in the sensory characteristics of the treatments (9:1, 8:2, 7:3, and 6:4 rice malt: soy milk ratio) as evaluated by the respondents (n=30) aged 22 - 68, except for caramel flavor and creaminess. High caramel flavor acceptance (83.3%) was evident in treatment 7:3 rice malt: soy milk ratio as it has a balanced intensity of malt extract and optimum level of creaminess (80.0%) compared with other treatments based on the just-about-right (JAR) rating. The optimum formulation also showed no significant difference relative to the commercially-available malt beverage (p<0.05) with a rating of 7.32, which is highly appealing to children ages 3 - 12 years old (n=50). A 100-ml serving of the rice malt-soy milk beverage can provide 64.5 kcal, 1.0 g fat, 11.2 g carbohydrates, 2.5 g protein, and 0.4 g ash with a shelf-life of 20 days in a high-density polyethylene bottle stored at 4 - 7°C.
Keywords: Ready-To-Drink, Rice Malt, Plant-Based, Sensory Properties, Soy Milk, Malting
IntroductionNon-dairy or plant-based beverages are considered
healthier and more sustainable dairy alternatives that can enhance one’s health. Several food-based innovations have allowed food manufacturers to produce plant-based drink (e.g., soymilk) that mimic the taste and texture of animal-derived products and are now increasingly becoming competitive in terms of quality and price (Vuong, 2019). Despite being one of the major imports, soymilk is the most popular and available non-dairy milk alternative locally. Thus, increase in domestic soybean production is now being considered (Agcopra and Piadozo, 2016).
Almost 65% of the world’s population has lactose intolerance (Bayless et al., 2017); hence, they consume alternative plant-based milk to meet nutritional requirements. Plant-based milk is produced from plant material extracted in water, and further homogenized resulting in particle size distribution, which imitates cow’s milk in appearance and consistency (Sethi et al., 2016). Five categories of plant-based vegetable milk alternatives are listed as cereal, legume, nut, seed, and pseudo-cereal (Sethi et al., 2016), in which soy milk is considered as legume-based milk. Soy milk is an aqueous, white, creamy extract produced from soybeans, which is similar to cow’s milk in appearance and consistency (Adebayo-Tayo old et al., 2009). Soy milk contains the same amount of protein
as cow’s milk, little saturated fat, no cholesterol, high in essential fatty acids, fiber, vitamins, and minerals (Banerjee et al., 2019). Known benefits of soy include reduction of cholesterol, prevention of osteoporosis, and inhibition of certain cancers because of its rich isoflavones content (Mazumder and Begum, 2016; Kant and Broadway, 2015). Therefore, soy can be served to starving and malnourished people in less developed countries. Soy milk contains isoflavones and caseins similar to the amount in buffalo milk but less of particular casein known as alpha-s1-casein28 (Kant and Broadway, 2015). Soy milk also contains complete protein that the body requires to meet the needs for human growth, maintenance, and repair of tissues. This protein is equal to the protein quality from milk, meat, and eggs. The fats in the buffalo milk (6.0 - 15.0%) are bigger in size than in soya milk (2.60%); thus, making soya easier to digest (Pietrzak-Fiecko and Kamelska-Sadowska, 2020; Khedkar et al., 2016; Sowonola et al., 2005). Soy milk can be a cheap and nutritious beverage as it is a good source of essential monounsaturated and polyunsaturated fatty acids that are considered essential for cardiovascular health (Sethi et al., 2016). Its preparation produces a product with limited shelf-life and a characteristic beany flavor. Modern soy milk processing utilizes advanced technologies and equipment to maximize nutritional value, shelf-life, and convenience with reduced beany flavor (Sethi et al., 2016).
FULL PAPER

Quality of Rice-Malt
62 RICE-BASED BIOSYSTEMS JOURNAL (2022) 10: 61-74
Rice can be processed into a wide variety of food and beverage products. The development of rice malt extract, a product from rice, undergoes a process of malting consisting of three steps: steeping, germination, and kilning. Malting improves the nutritional value of cereal (Oluwole et al., 2012). The steeping softens the grains, increases water availability (Oluwole et al., 2012), and starts the growth of embryo (Ceppi and Brenna, 2010); germination produces enzymes that leads to hydrolysis of starch and proteins that release sugar and amino acids (Oluwole et al., 2012); while kilning stops enzymatic activities and dries the resultant malt (Ceppi and Brenna, 2010). Malt is a healthy ingredient that has a vast potential in many food applications. It can be used in breads and pastries, sweets, alcohol-free malt beer, and breakfast drinks. Malted drinks are positioned as nutritious beverages in the market that contain loads of mineral, fiber, B-vitamins, and protein. The nutrients in malt beverages are quickly absorbed by the body.
About 95 child deaths every day in the Philippines is attributable to undernutrition (UNICEF, 2015). Children in the Philippines have poor diet diversity and poor intake of micronutrients (Denny et al., 2018). A study of Mak et al. (2020) stated that there is a high prevalence of inadequate milk intake in the Philippines, particularly for energy and micronutrients, regardless of milk consumption type. Children’s diet in the Philippines is typically composed of refined rice, energy-dense foods, and sweetened beverages. It is also low in fruits, vegetables, protein-rich foods, and milk and dairy products (Denny et al., 2018). The consequences of undernutrition can be devastating as it leads to poor cognition and socio-behavioral development and increases risk of mortality and morbidity.
Malt drinks in powder and ready-to-drink form are widely consumed choices of beverage among Asian children (Mohamed et al., 2015). However, malt extracts are often sourced from barley. Rice, as a top cereal produced in Asia, has received limited attention as a major raw material for malting. Thus, there is a need to maximize and explore the malting potential of other cereal grains such as rice. Given this, the study utilized Philippine rice variety as an alternative to barley in producing malt. The research also aimed to develop an optimized formulation of a nutritious beverage from rice malt-soy milk treatment combination of 9:1, 8:2, 7:3, and 6:4. This will be done by determining the most suitable rice variety and optimum procedure requirement in malting, characterization, and sensory evaluation; and through a shelf-life study.
Materials and MethodsRice varieties with waxy amylose content (AC)
IMS2; very low AC NSIC Rc 15 and NSIC Rc 17; low AC NSIC Rc 160 and NSIC Rc 400; intermediate AC NSIC Rc 216 and NSIC Rc 300; and high AC PSB Rc 10 were sourced from Philippine Rice Research Institute, while sugar and cocoa powder were bought from a local market in Science City of Muñoz, Nueva Ecija, Philippines.
Screening of suitable rice varieties and optimum condition for malting
Sample preparation. The rice samples with different amylose classifications were evaluated for the preparation of rice-malt. Amylose content is an important and recognized parameter as it is an indicator of the rice texture upon cooking (Juliano, 2003). Rough rice forms of the sample were cleaned to remove dirt and rice hulls by manual winnowing, sorting, and subsequently immersing them in distilled water at ambient temperature for 5 min to sort out floating grains and wash off adhering dirt.
Steeping of rice grain. Steeping was based on the method described by Owusu-Mensah et al. (2011) with a few modifications. Rice sample (50 g) was soaked in plastic containers with 30 ml of 5% sodium metabisulphite for 20 sec. This was followed by a thorough washing of the grains with distilled water to remove residual chemicals. Finally, the washed grains were steeped in 500 ml of distilled water for 12, 24, 36, and 48 h at ambient temperature. With an interval of 12 h, the grains were drained and re-steeped in fresh distilled water. Air-resting was done by draining off the steep water completely. The steeping process was conducted in triplicate.
Germination of rice grains. Germination was done following Ayernor and Hammond’s methods (2001). The steeped samples (50 rice grains) were spread in petri dishes, lined with Whatman’s ordinary filter paper and allowed to germinate at ambient temperature (27 to 30°C) for 24, 36, 48, and 60 h. The filter paper was moistened at regular intervals of 12 h with 5 ml of distilled water to avoid drying and to maintain adequate moisture content. This helped ensure a humidified environment for the grains.
Kilning of rice grain and color analysis. Kilning was done following Nienupetra’s procedure (2011), which entails drying the sprouted rice grains in a hot air oven with temperature variations. Different temperatures (75°C, 85°C, and 95°C) were used to determine the optimum kilning temperature of the rice malt. The dried rice grains were dehulled using a

Quality of Rice-Malt
RICE-BASED BIOSYSTEMS JOURNAL (2022) 10: 61-74 63
Satake testing husker to remove the hull and analyzed for L*a*b* (l- lightness, a- redness/greenness, b- yellowness/blueness) values using Chroma Meter (Konica Minolta Spectrophotometer CM-5, Japan).
Malting characterization of rice varieties
Determination of out-of-steep moisture content (SMC). The soaked grains were analyzed for SMC following the AOAC process (1990) with some modification. In this method, 2 g each of the pre-soaked rice grain samples were weighed into a previously dried and weighed crucible. The crucibles with the samples were placed in a forced air oven for 5 h at 105°C. The crucibles, together with its content, were weighed again after cooling in a desiccator. The differences in weights were used for the calculation of the SMCs mean values.
Germination energy. This was determined following Ayernor and Hammond’s (2001) work. Germination energy was calculated as the ratio of germinated (viable) grains relative to the total grains malted multiplied by 100:
(1)
Determination of malt yield. Malt yield for each day of the malting period (germination period) was determined by taking the dry weights of an equal number of grains (50), before and after malting in the absence of any developed roots or shoots. Malt yield was calculated using the formula described by Asante et al. (2013):
(2)
Shoot length determination. The shoot length of 10 seedlings (per replicate) for each treatment (steeping periods) was measured using a ruler. The means were calculated and recorded as average lengths.
Proximate composition analysis. The moisture content, crude ash, and crude protein of the selected rice varieties with good germinative energy (>90%) and malting performance were evaluated using the AOAC (1990) standard methods. The total carbohydrate of the most suitable selected malted rice was calculated based on the following formula (Greenfield and Southgate, 2003):
% total carbohydrates = 100 - %moisture - %protein - %ash - %fat
(3)
The total energy content was obtained by computation and expressed in calories (Whitney and Rolfes, 2007). It was calculated using the Atwater’s conversion factors:
1kcal = [ (4×carbohydrate)+(4×protein)+(9×fat) ] 100g
(4)
pH and total titratable acidity (TTA) analysis. The pH of the three suitable rice malt extracts produced from rice varieties with good germinative energy (>90%) and malting performance were measured using a benchtop pH meter (Eutech pH 700, Singapore). This was calibrated using three standard buffer solutions (pH 4.01, 7.00, and 10.01) prior to sample analysis. AOAC (1990) was used in determining total TTA of the rice malt extracts. The sample was titrated against sodium hydroxide (0.1N) using phenolphthalein as indicator to a faint pink endpoint. The TTA was expressed as g malic acid/100 g malted extract and calculated using the following equation (Sadler and Murphy, 2010):
(5)
where: N = normality of titrant, usually NaOH (mEq/ml); V = volume of titrant (ml); Eq. wt. = equivalent weight of predominant acid (mg/mEq); W = weight of sample (g); 1000 = factor relating milligrams to grams (mg/g); [(1/10 = 100/1000)]
Product formulation The rice malt-based beverage was optimized
with the combination of rice malt extract from the most suitable rice variety with satisfactory malting capacity, widespread availability, and acceptable proximate composition. High germinative energy in malting rice is a central factor in the formation of desirable Maillard browning in the grain during kilning.
Malting process using a suitable rice variety. The most suitable selected rice variety was cleaned by sorting floating grains and washing off adhering dirt and contaminating debris. In steeping, the rice grain was steeped for 24 h and refreshed every 12 h with new water. Then, it was allowed to germinate for 48 h at ambient temperature (27 - 30°C). Clean water was sprinkled on the germinating grain with time intervals of 12 h to avoid desiccation. The germinated rice grains were arrested by drying the grain at 95°C for 24 h and dehulled using a Satake

Quality of Rice-Malt
64 RICE-BASED BIOSYSTEMS JOURNAL (2022) 10: 61-74
testing husker. The dehulled germinated rice is called the rice malt.
Rice malt extract and soy milk production. Using an Osterizer-4172 blender, 150 g of rice malt was weighed and crushed slightly. A 1000 ml water was added then the mixture was subjected to low fire heating, stirred continuously until it reached 55°C, and eventually simmered at 63°C for 15 min. Using a clean cheesecloth, the mixture was pressed to obtain the rice malt extract.
The process in soy milk production was based on the method of Afroz et al. (2016) with modifications. Soybean (125 g) was manually cleaned and soaked in 500 ml distilled water overnight (10 - 12 h). The soaked seeds were rinsed with water and manually dehulled. A ratio of 1:7 of dehulled soybean and water were blended using Osterizer-4172 blender. The slurry was filtered using a muslin cloth. The soy milk was pasteurized for 10 - 15 min at 75°C.
Rice malt extract and soy milk beverage. The rice malt extract was combined with soy milk, added with 2.6 g cocoa powder and 7.0 g brown sugar. Mixtures with different ratios (Table 1) of rice malt extract and soy milk were pasteurized at 75°C for 15 sec to determine the optimum formulation. Immediately after pasteurization, the beverages were hot-filled in a high-density polyethylene (HDPE) bottle.
Table 1. Percentage of rice malt extract and soy milk in beverage preparation.
Treatment (% wt/wt)
Rice Malt Extract Soy Milk 1 90 102 80 203 70 304 60 40
Characterization of rice malt-soy milk beverage
Sensory evaluation. Sensory tests of the rice malt-soy milk beverage were conducted using a 9-point hedonic scale rating method (1-dislike extremely; 2-dislike very much; 3-dislike moderately; 4-dislike slightly; 5-neither like nor dislike; 6-like slightly; 7-like moderately; 8-like very much; 9-like extremely). Thirty parents, either mother or father of children aged 3 - 12, from Brgy. Bagong Sikat, Science City of Muñoz, Nueva Ecija, Philippines were randomly selected and served as panelists. Balanced rotation order was employed to avert bias. Coded samples (approximately 15 ml) were served in a covered clean white plastic cup, maintained at refrigerated temperature. The panelists were instructed to taste the samples from left to right and were given a glass of water as palate cleanser. The attributes evaluated were color, aroma, overall flavor, thickness,
creaminess, smoothness, sweetness, chocolate flavor, and aftertaste. The participants were also asked to give their overall opinion about the product.
pH, TTA, color and total soluble solids. The pH, TTA, and color of rice malt beverage were evaluated using the same method mentioned above. The total soluble solids (TSS) was measured using Leica Mark II ABBE refractometer.
Final product evaluation
Consumer sensory evaluation. Children (n = 50) aged 3 - 12 from the Brgy. Bagong Sikat in Science City of Muñoz, Nueva Ecija, Philippines were randomly selected from a list provided by the barangay health worker. They assessed the acceptability of the developed beverage against a chocolate flavored malted barley drink readily available in the market. The children were instructed to pick the facial expression that they deemed appropriate using a 9-point face hedonic scale scorecard (1-dislike extremely; 9-like extremely) after tasting the product. Water was given to the panelists in between samples as a palate cleanser. In measuring the intent to purchase, the parents or caretakers (n = 50) aged 25 - 80 were also asked to rate using a 5-point Likert scale: (1) Definitely, I will not buy; (2) Probably, I will buy; (3) I am not sure whether I will buy; (4) Probably, I will buy; and (5) Definitely, I will buy after tasting the samples.
Microbial analysis. Freshly prepared rice malt-soy milk beverage (25 ml) was vigorously mixed with 225 ml of 0.1% peptone water. Successive dilutions (101 - 106) were prepared by transferring 1 ml of the suspension medium to 9 ml of 0.1% peptone water. Sample was plated in 3M Petrifilm for aerobic count plate, yeast and mold count, and Escherichia coli and coliform count. Plated Petrifilms were incubated and colony forming units (cfu) were counted based on the procedures provided by the manufacturer.
Nutritional composition. The treatment with the highest acceptability rating was subjected to nutritional composition assessment. The parameters evaluated were protein by Kjeldahl, total fat by acid hydrolysis, ash and moisture by gravimetry (AOAC, 1990); iron and zinc by atomic absorption spectrometry (Jorhem et al, 2000); sodium, potassium, magnesium, and calcium by atomic absorption spectrometry (Chekri et al, 2010); and phosphorous by colorimetry (Pulliainen and Wallin, 1996); and total calories and carbohydrates.
Shelf-life analysis. Shelf-life of the prototype or the final product was evaluated following the established method of rice malt extract-soy milk beverage that was hot-filled in a HDPE bottle and stored in a refrigerator at 4 - 7°C temperature.

Quality of Rice-Malt
RICE-BASED BIOSYSTEMS JOURNAL (2022) 10: 61-74 65
Sensory properties and color (L*, a* and b* values) were evaluated while microbial count and physical and physicochemical properties were analyzed using standard protocols.
Statistical analysis
The data were encoded and processed in MS Excel, then subjected to analysis of variance (ANOVA) at p<0.05 to determine significant differences among the samples within the evaluated parameters. Meanwhile, laboratory data was analyzed in IBM SPSS ver. 20. Significant differences between treatments were evaluated and interpreted using Tukey’s HSD Test. Sensory evaluation tests were conducted thrice.
Results and DiscussionSuitable rice varieties for malting and malting characterization
Malting technology has three stages: steeping, germinating, and kilning. A sufficient malting procedure and suitable rice variety must be identified in producing a quality rice malt. The optimum rice malt was used as the primary ingredient in the development of ready-to-drink rice malt extract-soy milk beverage. The steeping procedure activates dormant grains. As the steeping time increases, the moisture content of the rice also increases. Results were comparable to the earlier study of Owusu-Mensah et al. (2011), in which rice attained 35% moisture content. According to Smart et al. (1985), a moisture content of above 30% is good enough for modification. Results indicated that the steeped grain for 48 h facilitated a higher water uptake (Figure 1). However, a comparable moisture uptake was evident among grains steeped for 60 h. The water uptake of grains during steeping brings a rapid increase in the grain’s respiratory rate. During this process, enzymes become active; breaking down the starch into fermentable sugars (Bewley and Black, 1985). A rapid moisture uptake was evident in the first 12 h of steeping. The saturation point, however, was reached
during the 24 h-soaking time for all rice samples except for NSIC Rc 17 and PSB Rc 10. Generally, during the initial stage of soaking the rice grains in water, the moisture content rapidly increases but tends to slow down progressively (Wijngaard et al., 2005).
After the aerobic respiration of sample, germination energy of the rice varieties was calculated. Germination energy is the capacity of the grains to germinate faster, which gives an indicative measure of good grain germination during malting. In malting, more than 90% of the grain must germinate if good quality is to be obtained (Dufour, 1994). The germination energy of the rice varieties increased as the germination period was prolonged. Highest germination energy was attained during 48 and 60 h of germination. During this period, the highest germination rate of about 89.67 - 97.33% was attained by the NSIC Rc 160 rice grains (Figure 2); indicating that these are qualified for malting (Agbale et al., 2007). It was also evident that the germination energy of the rice varieties, sprouted for 60 h, were comparable with the 48-h germination time. Increasing the germination time significantly increased the germination energy of the rice samples. Likewise, Odo et al. (2016) documented a similar germination trend on three local and assessed hybrid Nigerian rice varieties for malting. Optimum germination was achieved at 48 h for the malting of rice varieties. It is noteworthy to report that NSIC Rc 160 (low AC), NSIC Rc 300 (intermediate AC), and NSIC Rc 15 (very low AC) were found to have good germinative energy (>90%). This means the grains of these varieties have low tendency to be dormant and are deemed most suitable varieties for malting.
During the malting process, materials that remained intact in the grain in the occurrence of physicochemical changes constituted the malt yield. It was recorded that as the germination time progressed, the malt yield decreased (Figure 3). This could be associated with the increased physiological and
Figure 1. Out-of-steep moisture content of the selected rice varieties (n = 3).

Quality of Rice-Malt
66 RICE-BASED BIOSYSTEMS JOURNAL (2022) 10: 61-74
enzymatic activities of the grain during germination, which utilized food reserves in the endosperm for growth and energy and with the leaching of soluble grain extracts and minerals (Ogbonna, 2002). A significant decrease in the malt yield was observed in all rice varieties during the 48-h and 60-h germination. Similar findings were observed by Ayenor and Ocloo (2007) and Osuji et al. (2019) who reported a significant decrease in the starch content and weight of their local paddy rice samples. Despite the malting loss, a considerable malt yield percentage was apparent for all rice varieties with values range of 77.27 - 82.29% and 67.70 - 76.44% after 48 and 60 h of germination, respectively. The values obtained were considerably higher than the acceptable minimum level of malt yield (35 - 50 dextrinising unit).
The growth of shoot implies the degree of enzymatic modifications during malting (Hammond and Ayernor, 2001). Figure 4 shows the shoot length development of the selected rice seeds. Results showed that all rice seedlings exhibited an increase in shoot growth with increasing malting time. A similar trend was also noted in past studies (Owusu-Mensah et al., 2011; Bam et al., 2006; Wahyuni et al., 2003). The shoot length of the rice seeds had the following ranges:
0.45 - 0.75 mm and 0.98 - 1.1 mm after germination for 48 and 60 h. During the 60-h germination, significant growth was visible in all varieties except for NSIC Rc 400. This means that steeping and germination time have a significant influence on the shoot emergence of the rice seedlings. Germination aims to maximize grain modification and minimize shoot growth. Excessive growth results in less malt extract; thus, germination was established at 48 h.
The intensity of kilning is crucial in malt flavor, and color formation (Pires and Branyik, 2015). Different temperatures were used to determine the optimum kilning temperature, specifically 75, 85, and 95°C. Color (L*, a*, and b*) values were used as indicators to determine the extent of Maillard reaction or browning of the rice grains that had taken place during kilning, which favored color and flavor development (Correia et al., 2005). It was noted that the lightness of the rice malt samples significantly decreased with increasing kilning temperature. The rice malt samples exhibited an increased drift towards the yellow and red hues as the temperature was increased. The formation of the brown color in the samples was considered as a desirable quality; hence, rice varieties and kilning temperatures that
Figure 2. Germination energy of selected rice varieties (n = 3).
Figure 3. Percent malt yield of selected rice varieties (n = 3).

Quality of Rice-Malt
RICE-BASED BIOSYSTEMS JOURNAL (2022) 10: 61-74 67
yield higher degrees of browning formation were preferred. Considering the L*, a*, b* values, the kilning temperature that yielded desirable brown color formation was at 95°C.
Proximate composition, pH, and TTA of suitable rice varieties for malting. NSIC Rc 160, Rc 300, and Rc 15 were selected as the most suitable rice varieties based on their good germinative capacity and malting performance, which resulted in a quality malt. Thus, it proved useful to look into the proximate physicochemical properties of these rice cultivars as bases for future product formulations. Moisture, ash, crude protein, pH, and TTA content are presented in Table 2. A significant difference in the moisture content, pH, and TTA were found among the three rice samples after malting. The low moisture levels (4.19 - 4.44%) of the rice malt samples indicated that it can be stored for a longer period. The findings also implied that malted NSIC Rc 160 rice cultivar obtained the highest protein content and TTA. All the
rice malts had pH values regarded as low acid foods (pH≥4.6). A similar acidity range was also recorded in the beverages produced from malted roasted maize varieties by Akonor et al. (2014). Moreover, the pH of the rice malt extracts was within the general pH range of 3.5 - 5.0 suggested for malt-based beverages (Jaganatham and Dugar, 1997). The total TTA of the rice malts calculated as the percentage of malic acid varied from 0.040 to 0.060%.
Proximate composition of malted NSIC Rc160 rice variety. In view of the satisfactory malting capacity and widespread availability, NSIC Rc 160 was selected as the major rice material for malt beverage production. Hence, its proximate composition was compared with its un-malted counterpart. The malted and un-malted NSIC Rc 160 rice were statistically different in moisture content (Table 3). Specifically, the malted NSIC Rc 160 had lower moisture content because during kilning the grains were exposed to heat resulting in moisture loss; thereby, increasing
Figure 5. Mean color parameters of selected rice varieties at different temperatures (n=3).
Table 2. Physicochemical and proximate characteristics of selected rice varieties for malting.1
Malted RiceVarieties Moisture Content (%) Ash (%) Protein (%) pH Total TTA (%) 2
NSIC Rc 160 4.23±0.03a 1.29±0.07a 9.73±0.10a 5.57±0.02c 0.060±0.00a
NSIC Rc 300 4.44±0.07b 1.29±0.11a 8.80±0.12b 5.52±0.01b 0.048±0.00b
NSIC Rc 15 4.19±0.09a 1.31±0.03a 7.38±0.10c 5.91±0.01a 0.040±0.00c
1Mean values with the same letter within a column are not significantly different from each other at p<0.05 (n = 3)2expressed as malic acid
Figure 4. Shoot length of selected rice varieties (n = 30).

Quality of Rice-Malt
68 RICE-BASED BIOSYSTEMS JOURNAL (2022) 10: 61-74
its shelf-life. No statistical differences were found for protein, ash, and fat content at (p>0.05). However, the slight decrease in the fat and ash content could be from the increased lipolytic enzyme activity that hydrolyzes fats to fatty acids and glycerol during malting (Auta et al., 2014) and mineral loss due to leaching. These findings agreed with the study of Osuji et al. (2019), which showed an insignificant decrease in the fat and ash content and increase in the carbohydrates of the malted in Nigerian rice varieties. According to Harland (2010), malting of grains is associated with nutrient improvement. Results signified that the total carbohydrates and calories of malted NSIC Rc 160 were significantly higher than the un-malted (control), which was equivalent to 6.22 and 5.31% improvements, respectively.
Table 3. Proximate composition of un-malted and malted NSIC Rc 160 rice grains.
Parameters Un-malted Malted
Moisture content 11.60±0.14a 6.60±0.30b
Protein 9.28±0.06a 9.73±00.07a
Ash 1.36±0.07a 1.29±0.05a
Fat 2.07±0.17a 1.91±0.01a
Carbohydrates 75.90±0.18b 80.64±0.09a
Calories 359.28±2.50b 378.10±0.74a
Mean values with the same letter within a row are not significantly different from each other at p<0.05 (n = 3)
Product formulation and characterization of optimized rice malt-soy milk beverage
Sensory Evaluation. Sensory panelists, aged 22 - 68, (parents, n = 30) were composed of 87% females and 13% males. All rice malt-soy milk beverages were comparable with each other (p<0.05) in terms of sensory attributes and had ‘like moderately’ scale rating, except for caramel flavor, which had ‘like slightly scale rating’ (Table 4). Treatment 3 (7:3) obtained the highest caramel flavor and was used as the determinant attribute in selecting the optimum rice malt-soy milk ratio. The chocolate and the sweeteners, rice malt and sugar enhanced the palatability of the beverage as they masked the beany flavor of the soy milk. This was comparable with the result of the choco-flavored soy milk developed by Wang et al. (2001), which obtained the highest sensory score and lowest off-flavor recorded. Malt extract was recognized for its caramel flavor produced from maltol and isomaltol. Maltol is best known for imparting sweet fruity flavor, but it has a relatively high aroma threshold and strong caramel taste (Parker, 2015).
The caramel flavor was significantly perceived (p<0.05) among treatments (Figure 6). Highest caramel flavor acceptance was apparent in Treatment 3 (7:3) because of balanced intensity of malt extract, “not too much” and “not too little,” as reported in the just-about-right rating. However, soy milk did not significantly alter the creaminess of the beverage,
Table 4. Mean ratings of the sensory evaluation for optimization of rice malt and soy milk beverage and its overall opinion compared with a commercial product.
Treatment
Sensory Attributes4 1 (9:1) 3 2 (8:2) 3 3 (7:3) 3 4 (6:4) 3
Overall opinion1 7.43±1.76a 7.27±1.55a 7.10±1.64a 7.33±1.58a
Color1 7.23±1.88a 7.20±1.65a 7.15±1.69a 7.38±1.68a
Aroma1 7.28±1.75a 7.23±1.60a 6.90±1.78a 7.33±1.73a
Overall flavor1 7.35±1.69a 7.32±1.63a 6.97±1.73a 7.23±1.59a
Thickness1 7.17±1.60a 7.12±1.60a 6.83±1.73a 7.27±1.56a
Creaminess1 7.10±1.72a 7.08±1.69a 6.80±1.79a 7.08±1.68a
Smoothness1 7.22±1.50a 7.22±1.46a 6.93±1.62a 7.13±1.74a
Sweetness1 7.28±1.75a 7.20±1.50a 7.03±1.56a 7.17±1.70a
Chocolate flavor1 7.28±1.75a 7.35±1.60a 7.10±1.56a 7.18±1.70a
Caramel flavor1 6.28±1.50b 7.02±1.36a 7.30±1.25a 6.27±1.62b
Aftertaste1 6.97±1.84a 7.05±1.75a 6.98±1.65a 7.00±1.82a
Rice malt-soy milk beverage Commercial
Overall opinion2 7.32±2.12 a 7.92±1.55 a
1N = 30; Mean scores with the same letter within a row are not significantly different from each other at p<0.052N = 50; Children (3 - 12 years old); Mean scores with the same letter within a row are not significantly different from each other at p<0.053rice malt extract: soy milk ratio 4Scale: 1 - dislike extremely; 2 - dislike very much; 3 - dislike moderately; 4 - dislike slightly; 5 - neither like nor dislike; 6 - like slightly; 7 - like moderately; 8 - like very much; 9 - like extremely

Quality of Rice-Malt
RICE-BASED BIOSYSTEMS JOURNAL (2022) 10: 61-74 69
but JAR test showed that Treatment 3 (7:3) had the optimum level of creaminess. Bolarinwa et al. (2018) also found similar sensory results for the soy milk concentration, which indicated that the soy-walnut beverage made from 10% un-malted and 30% malted soy milk substitution were mostly preferred by the consumers. Hence, a 7:3 rice malt-soy milk ratio was used in developing the beverage and was further evaluated for other parameters (consumer sensory evaluation employing children respondents, microbial, nutritional, and shelf-life). Moreover, the ingredients used in the beverage positively complemented one another as the beany flavor of soy milk was masked by rice malt extract, sugar, and cocoa powder.
pH, total soluble solids, total TTA and color. Physicochemical parameters such as pH, total TTA, and total soluble solids were used to distinguish the nature of the different rice malt formulations. pH is a measure of the hydrogen ion (H+) activity in solution while the TTA measures the predominant acid present in the beverages (Mensah-Brown et al., 2014). Consequently, both pH and TTA measure the sourness of the beverage. Different ratios of rice malt extract and soy milk significantly affected the pH, TTA, and TSS of the beverages (Table 5). All treatments have an acidic pH value ranging from 5.99 to 6.18. Cocoa powder and soy milk were some factors that might affect the pH of the beverage. Miller et al. (2008) reported that cocoa powders have a pH of around 5.3 - 5.8, which is low-acidic. Highest TTA was evident in Treatment 1.
The TSS measures the refractive index fraction of the product and is expressed as °Brix. It commonly measures the sugar content and other soluble solids such as organic, amino acids, and soluble pectin. The highest Brix was obtained in Treatment 1 (9:1), which could be due to the high content of maltose produced from starch present in the rice grain during the malting process (Gasior et al., 2020; Chaves et al., 2019; Harland, 2010).
Color result shows an increasing trend in L* values due to the increasing concentration of soy milk in each mixture (Table 6). Variations in the lightness and/or darkness of the beverages reflected the extent of caramelization reaction occurred in the rice grain during kilning and the addition of cocoa powder that darkened the beverage. The Maillard reaction imparts a caramel flavor and aroma, while soy milk as a nutritious non-dairy ingredient brings a distinct flavor enhancing the organoleptic qualities of the developed beverage. The beverage with 6:4 rice malt extract and soy milk ratio had a lighter shade because of the intrinsic milky white color of soy milk. All of the beverage samples regardless of the ratio had hues of yellow and red. Furthermore, it was noticeable that (+a*) values of the beverages were less than (+b*), which signified a drift towards the yellow color. Therefore, the ratio of malt extract and soy milk had a great influence on the L*, a*, and b* values.
Table 5. Physicochemical properties of the rice malt-soy milk beverage.
Treatment1 pH Total TTA (%) 2
Total Soluble Solids (°Brix)
T1 (9:1) 5.99±0.09c 0.018±0.003a 16.97±0.04a
T2 (8:2) 6.12±0.02b 0.017±0.002ab 15.87±0.06b
T3 (7:3) 6.16±0.07a 0.016±0.001ab 15.37±0.05b
T4 (6:4) 6.18±0.06a 0.014±0.001b 15.10±0.03 b
Mean values with the same letter within a column are not significantly different from each other at p<0.05 (n = 3)1rice malt : soy milk ratio2expressed as malic acid
Table 6. Color parameters of rice malt-soy milk beverage.
Treatment1 Color
L* a* b*
T1 (9:1) 37.67±0.03d 8.83±0.01b 10.73±0.06b
T2 (8:2) 39.10±0.04c 9.13±0.04a 11.53±0.13a
T3 (7:3) 40.12±0.08b 9.06±0.03a 11.74±0.09a
T4 (6:4) 40.58±0.07a 8.66±0.12c 11.57±0.06a
1 kilning temperature at 95°C for 24 hMean values with the same letter within a column are not significantly different from each other at p<0.05 (n = 3)
Figure 6. JAR of the creaminess and caramel flavor of rice malt soy milk beverage (n = 50).

Quality of Rice-Malt
70 RICE-BASED BIOSYSTEMS JOURNAL (2022) 10: 61-74
Final product evaluation
Consumer sensory evaluation. The respondents were 48% female and 52% male whose ages ranged from 3 - 12 (n = 50). Children responded using the 9-point hedonic facial scale (Moskowitz et al., 2012) to measure product acceptability. Result shows that the difference between commercial malted beverage and rice malt-soy milk beverage was not statistically significant p<0.05 (Table 4). This means that the newly developed rice malt-soy milk beverage is comparable with the commercially available malted drink. Furthermore, the ready-to-drink chocolate-flavored rice malt beverage was appealing to children ages 3 - 12 years old, and an ideal non-dairy alternative for people with lactose intolerance.
In terms of willingness to buy and intent to purchase, respondents were 72% female and 28% male with ages ranging from 25 to 80 (n = 50). Majority of the respondents reported that they would probably buy (56%) and definitely purchase (62%) the rice malt-soy milk beverage (Figure 7).
Microbial load. Microbial analysis is necessary to determine the quality and safety of ready-to-drink beverages. The formulated rice malt-soy milk had <3.5 x 10² CFU/ml aerobic plate count, which is within the acceptable limits based on Food and Drug Administration (2013) [104 CFU/g for chocolate products and 10-102 CFU/ml for non-alcoholic beverages] and Centre for Food Safety (2014) [<104 CFU/g for pasteurized foods]. No coliform, E. coli, yeasts, and molds were detected in the final product. This was due to the sodium metabisulphite soaked in the rice grain before the malting and pasteurization of the beverage. Pasteurization increases the product
shelf-life by reducing microbial populations and enzymatic activities that may cause a decrease in the food quality. Pathogens such as E. coli should not be detected per 25 g sample together with yeast and molds (Centre for Food Safety, 2014). Hence, the microbial load analysis indicated that the rice malt-soy milk beverage is safe for human consumption.
Nutritional composition of the final product. A 200-ml serving of the beverage can be an optimal source of carbohydrates and magnesium requirements of 3 - 12 years old children (Table 7). It also contains healthy protein and minerals, which can supply about 12 - 23% protein, 6 - 7% iron, 6 - 8% zinc, 8 - 11% potassium, 2 - 3% calcium, 2 - 6% phosphorus, and 2 - 4% sodium daily (DOST-FNRI, 2015). Hence, the product can be an effective means to deliver essential nutrients for growing children who require solid source of minerals and energy for active and optimal growth development. Fermentation also improves amino acid composition and vitamin content and increases protein and starch levels Harland (2010).
Shelf-life determination of rice malt-soy milk beverage
It was observed that the aerobic plate count was comparable up to 20 days and significantly increased on the 27th day of storage (Figure 8). No significant difference was observed on its color analysis until the 13th; however, the trend shows that over time, the beverage color darkens. No off-odor or rancid characteristic of the soy milk and cocoa, nor significant change in color, off-taste, and general acceptability were observed for up to 20 days (Table 8). The hot-fill packaging and storage conditions applied for the sample extended its shelf-life up to 20
Table 7. Nutritional composition of the final product.
ParametersNutritional
Composition (100 ml-1)
% RENI per serving for 3 - 5 years*
% RENI per serving for 6 - 9 years*
%RENI per serving for
10 - 12 years *
Calories, kcal/100g 64.50 10% 8% 6%
Carbohydrates, % 11.20 41% 41% 41%
Protein, % 2.50 23% 17% 12%
Fat, % 1.00 3% 5 5%
Ash, % 0.40 - - -
Moisture, % 84.80 - - -
Sodium, mg/100g 5.59 4% 3% 2%
Iron, mg/100g 0.33 7% 7% 6%
Zinc, mg/100g 0.20 8% 8% 6%
Potassium, mg/100g 79.39 11% 10% 8%
Magnesium, mg/100g 42.50 121% 94% 57%
Calcium, mg/100g 7.87 3% 2% 2%
Phosphorous, mg/100g 15.03 6% 6% 2%Percent RENI values are based on 2015 DOST-FNRI reference requirements of 3 - 5, 6 - 9, and 10 - 12 years old children. *serving size: 200 ml; one serving per bottle

Quality of Rice-Malt
RICE-BASED BIOSYSTEMS JOURNAL (2022) 10: 61-74 71
Figure 7. Intent to purchase of consumers for rice malt-soy milk beverage and commercial malted beverage (n = 50).
Figure 9. Physicochemical analysis of rice malt-based soy milk beverage stored at 4 - 70C.
Table 8. Sensory analysis of rice malt-soy milk beverage stored at 4 - 7oC.
AttributesDay of Storage
0 2 6 9 13 20 28
Aroma (soy) 5.41±0.62ab 5.07±1.47ab 5.74±0.71ab 5.51±0.70ab 6.01±0.89b 4.98±1.10ab 4.53±1.12a
Off-odor 0.00±0.00a 0.03±0.10a 0.04±0.09a 0.02±0.05a 0.29±0.83a 0.02±0.05a 0.23±0.63a
Color 11.26±0.02a 10.84±0.81a 10.83±1.38a 10.93±0.71a 10.70±1.23a 11.07±0.79a 11.18±1.07a
Flavor (soy) 3.97±0.61ab 4.15±0.67b 3.64±0.44ab 3.67±0.79ab 3.25±0.53a 3.23±0.72a --Off-taste 0.00±0.00a 0.03±0.07a 0.02±0.05a 0.02±0.07a 0.03±0.05a 0.02±0.04a --General acceptability 10.84±1.83a 11.83±0.87a 11.58±0.57a 11.94±0.88a 12.47±1.51a 11.97±0.92a --
-- not safe for human consumptionN = 9; Mean scores with the same letter in a same row are not significantly different at p<0.05.Legend: Aroma: 0 - none; 15 - very intense, Off odor: 0 - none; 15 - very perceptible, Color: 0 - light brown; 15 - dark brown, Flavor: 0 - none; 15 - very intense, Off-taste: 0 - none; 15 - very perceptible, General acceptability: 0 - dislike; 15 - like very much
Figure 8. Aerobic plate count of rice malt-soy milk beverage stored at 4 - 70C.
Intent purchase
Physicochemical analysis
Rice malt-soy milk beverage Commercial beverage
Days in refrigerated temperature
Quality of Rice-Malt
72 RICE-BASED BIOSYSTEMS JOURNAL (2022) 10: 61-74
days when stored at temperature ranging from 4 to 7°C with a “like” acceptability rating. As for physical observation of the beverage, sediments formed or solid particles settled at the bottom part of the bottle, hours after processing. This was due to the formation of large size dispersed particles such as fat globules, solid particles, proteins, and starch granules, which resulted in a sandy, gritty or chalky mouthfeel, and lack of creaminess due to their low-fat content (Sethi et al., 2016; Civille and Szczesniak, 1973). Various techniques like colloid mill (Sethi et al. 2016) may be used to reduce the size of the dispersed particles in soy milk preparation. Ultra-high-pressure homogenization (UHPH) results in smaller and more uniform particle sizes.
ConclusionAn acceptable choco-flavored rice malt-soy
drink was formulated from suitable Philippine rice varieties. Optimum steeping time was established for NSIC Rc 160, Rc 400, Rc 300, Rc 15, and Rc 216. Optimum germination time was 48 h and suitable kilning temperature for malting was 95°C for 24 h. This temperature developed a pleasant malt flavor and color suited for a huge variety of food applications.
Based on the sensory acceptability, the rice malt-soy milk chocolate beverage with 7:3 rice malt extract and soy milk ratio were the optimum product formulation, which is , comparable with no significant difference to the commercially-available malt beverage. The ready-to-drink chocolate-flavored rice malt-soy milk beverage is a nutritious non-dairy alternative and is highly appealing to children ages from 3 to 12 years old. An unopened rice malt-soy milk beverage in an HDPE bottle can be kept for 20 days in a refrigerated storage (4 - 7°C). The product must be pilot tested and assessed for market acceptability.
Acknowledgment
We would like to thank Jolina F. Dasalla, Gwendilyn Ramirez, and Carla G. Valderama from Central Luzon State University for their assistance in optimizing the product and participation in the sensory evaluation; Raffy B. Rodriguez for the assistance in the analysis of the physicochemical characteristics of the samples; Rommel D. Camus and Victor M. Mata for milling the rice malt samples; Jaime A. Manalo IV and Joanna Christine A. Salinasal for editing the drafts.
Literature CitedAdebayo-Tayo BC, Adegoke AA, Akinjogunia OJ (2009)
Microbial and physicochemical quality of powdered soymilk samples in Akwa Ibom, South Southern Nigeria. African Journal of Biotechnology 8(13): 3066-3071
Afroz MF, Anjum W, Islam M, Kobir A, Hossain K, Sayed A (2016) Preparation of soymilk using different methods. Journal of Food and Nutrition Sciences 4(1): 11-17 Retrieved from: https://doi.org/10.11648/j.jfns.20160401.13 (accessed March 20, 2021)
Agbale MC, Adamafio NA, Agyemang KOG, Sackey SJ (2007) Malting and brewing properties of selected cereals cultivated in Ghana. Journal of the Ghana Science Association 9(2): 146-155
Agcopra JDVL, Piadozo MAS (2016). Cost and price competitiveness of soybean production in Isabela, Philippines. Journal of Economics, Management and Agricultural Development 4(1): 77-91
Akonor PT, Tortoe C, Oduro-Yeboah C (2014) physicochemical characterization of non-alcoholic beverages from malted roasted varieties of maize (Zea mays).
International Journal of Food Science and Nutrition Engineering 4(1): 20-26
AOAC [Association of Official Analytical Chemists] (1990) Official methods of analysis of the Association of Official Analytical Chemists. Arlington, VA, USA. Method 942.05, 984.13, 942.15, 925.09, and 925.10. 15(1): 70, 74, 168, 777, 777
AOAC [Association of Official Analytical Chemists] (2006) Official methods of analysis of the Association of Official Analytical Chemists. Arlington, VA, USA. Method 2003. 05. 18(4): 40-42
Asante E, Adjaottor AA, Woode MY (2013) Malting characteristics of Wita 7 variety of rice. Peak Journal of Food Science and Technology 1(5): 61-67
Auta AI, Suberux HA, Bello IM (2014) Effect of malting duration on yield and proximate composition of ‘Fura’ produced with the grains of Pennisetum typhoides. Food Science and Quality Management 27: 33-39
Ayernor GS, Hammond TK (2001) Characteristics of rice malt for the production of sugar syrup. Journal of Ghana Science Association 3(2): 91-99
Ayenor GS, Ocloo FCK (2007) Physico-chemical changes and diastase activity associated with germinating paddy rice (PSB Rc 34). African Journal of Food Science 1: 037-041
Banerjee S, Pandey R, Gorai T, Shrivastava SL, Halda S (2019) Review on soy milk and other soy milk based products. International Research Journal of Food and Nutrition 1(1): 1-5
Bam RK, Kumaga FK, Ofori K, Aisedu EA (2006) Germination, vigor, and dehydrogenase activity of naturally aged rice (Oryza sativa L.) seeds soaked in potassium and phosphorus salts. Asian Journal of Plant Sciences 5(6): 948-955

Quality of Rice-Malt
RICE-BASED BIOSYSTEMS JOURNAL (2022) 10: 61-74 73
Bayless TM, Brown, E, Paige DM (2017) Lactase non-persistence and lactose intolerance. Current Gastroenterology Reports 19(5): 23
Bewley JD, Black M (1985) Seeds: Physiology of Development and Germination (pp 330). New Y o r k : Plenum Press
Bolarinwa IF, Aruna TE, Adejuyitan JA, Akintayo OA, Lawal OK (2018) Development and quality evaluation of soy-walnut milk drinks. International Food Research Journal, 25(5): 2033-2041
Centre for Food Safety (2014) Microbiological Guidelines for Food (For Ready-to-eat Food in General and Specific Food Items). Queensway, Hong Kong: Food and Environmental Hygiene Department. Retrieved from https://www.cfs.gov.hk/english/food_leg/files/foodleg_Microbiological_Guideline s_for_Food_e.pdf (accessed February 24, 2021)
Ceppi ELM, Brenna OV (2010) Experimental studies to obtain rice malt. Journal of Agricultural and Food Chemistry 58(13): 7701-7707. Retrieved from https://doi.org/10.1021/jf904534q (accessed February 24, 2021)
Chekri R, Noël L, Vastel C, Millour S, Kadar A, GuÉrin T (2010) Determination of calcium, magnesium, sodium, and potassium in foodstuffs by using a microsampling flame atomic absorption spectrometric method after closed-vessel microwave digestion: Method validation. Journal of AOAC International 93(6): 1888-1896 Retrieved from https://doi.org/10.1093/jaoac/93.6.1888 (accessed February 25, 2019)
Chaves DFS, Hatano DV, Milan DR (2019) Malt extract as a healthy substitute for refined sugar. American Journal of Biomedical Science & Research 4(1): AJBSR. MS.ID.000758
Civille GV, Szczesniak AS (1973) Guidelines to training a texture profile panel. Journal of Texture Studies 4: 204
Correia I, Nunes A, Duarte IF, Barros A, Delgadillo I. (2005) Sorghum fermentation followed by spectroscopic techniques. Food Chemistry 90(4): 853-859
Denny L, Angeles-Agdeppa I, Capanzana MV, Toledo MB, Donohue J, Carriquiry A (2018) Nutrient intakes and food sources of Filipino infants, toddlers and young children are inadequate: Findings from the National Nutrition Survey 2013. Nutrients 10(11): 1730 Retrieved from https://doi.org/10.3390/nu10111730 (accessed February 19, 2021)
DOST-FNRI [Department of Science and Technology - Food and Nutrition Research Institute] (2015) Philippine Dietary Reference Intakes (pp 1-7). Taguig City, Philippines: DOST-FNRI
Dufour JP (1994) Standard Methods for Sorghum Malt Analysis - Hot Water Extract. In Sorghum Analytical Handbook (pp 27). New Zealand: University of Otago, Dunedin
FAO/WHO [Food and Agriculture Organization/World Health Organization] (2004) Code of hygienic practice for milk and milk products. Joint FAO/WHO Food Standards Programme. Codex Committee on Food Hygiene (pp 116-123)
FDA [Food and Drug Administration] (2013) Revised Guidelines for the Assessment of Microbiological Quality of Processed Foods. FDA Circular 2013-010. Philippines: Department of Health
Gasior J, Kawa-Rygielska J, Kucharska AZ (2020) carbohydrates profile, polyphenols content and antioxidative properties of beer worts produced with different dark malts va r i e t i e s or roasted barley grains. Molecules 25(17): 3882
Greenfield H, Southgate DAT (2003) Food composition data: Production, management, and use. Rome, Italy: Food and Agriculture Organization of the United Nations
Hammond TK, Ayernor GS (2001) Characteristic of malted rice for the production of sugar syrup. Journal of the Ghana Science Association 3(2): 91-99
Harland BF (2010) Nutritional improvement of cereals by fermentation. Food Science and Nutrition 28(8): 349-400
Jaganatham J, Dugar SM (1997) Atomic absorption spectrophotometric determination of copper in malt beverages. Atomic Spectroscopy-Norwalk Connecticut 18: 156-159
Jorhem L, Engman J, Collaborators (2000) Determination of lead, cadmium, zinc, copper, and iron in foods by atomic absorption spectrometry after microwave digestion: NMKL Collaborative Study. Journal of AOAC International 83(5): 1189-1203 Retrieved from https://doi.org/10.1093/jaoac/83.5.1189 (accessed February 25, 2019)
Juliano BO (2003) Rice Chemistry and Quality (pp 25-39). Manila, Philippines: Philippine Rice Research Institute
Kant R, Broadway AA (2015) The benefits of consuming soya milk – A review. Trends in Biosciences 8(5): 1159-1162
Khedkar CD, Kalyankar SD, Deosarkar SS (2016) Buffalo milk. The Encyclopedia of Food and Health 1: 522-528
Mak TN, Angeles-Agdeppa I, Tassy M, Capanzana MV, Offord EA (2020) Contribution of milk beverages to nutrient adequacy of young children and preschool children in the Philippines. Nutrients 12(2): 392. Retrieved from https://doi.org/10.3390/nu12020392 (accessed February 19, 2021)
Mazumder MdAR, Begum AA (2016) Soymilk as source of nutrient for malnourished population of developing country: A review. International Journal of Advanced Scientific and Technical Research 5(6): 192-203
Mensah-Brown H, Afoakwa EO, Wadie WB (2014) Optimization of the production of a chocolate-flavoured, soy-peanut beverage with acceptable chemical and physicochemical properties using a three-component constrained extreme lattice mixture design. Optimization 23: 46-54
Miller KB, Hurst WJ, Payne MJ, Stuart DA, Apgar J, Sweigart DS, Ou B (2008) Impact of alkalization on the antioxidant and flavanol content of commercial cocoa powders. Journal of Agricultural and Food Chemistry 56(18): 8527-8533
Mohamed HJJ, Loy SL, Taib MN, Karim NA, Tan SY, Appukutty M, Razak NA, Thielecke F, Hopkins S, Ong MK, Ning C (2015) Characteristics associated with the consumption of malted drinks among Malaysian primary school children: Findings from My Breakfast study. BMC Public Health 15(1): 1-15. Retrieved from https://doi.org/10.1186/s12889-015-2666-5 (accessed February 24,2021)

Quality of Rice-Malt
74 RICE-BASED BIOSYSTEMS JOURNAL (2022) 10: 61-74
Moskowitz HR, Beckley J H, Resurreccion, AV (2012) Sensory and consumer research in food product design and development (pp 265). Ames, Iowa: Wiley-Blackwell
Nienupetra N (2011) Comparative Evaluation of Malting Properties and Processing Conditions in Enzymatic Activities of Ten Rice Varieties (M. Sc. Thesis). Kumasi, Ghana: Kwame Nkrumah University of Science and Technology
Odo M, Okorie PA, Ikegwu OJ, Kalu MA (2016) Malting potentials of hybrid and local varieties of rice. Asian Journal of Agriculture and Food Sciences 4(3). Retrieved from https://www.ajouronline.com/index.php/AJAFS/article/view/3840 (accessed February 19, 2021)
Ogbonna AC (2002) Studies on Malting Parameters, Purification and Characterization of Proteolytic Enzymes from Sorghum Malt Varieties. (PhD Thesis). Nsukka, Nigeria: University of Nigeria
Oluwole OB, Kosoko SB, Owolabi SO (2012) Development and production of high protein and energy density beverages from blends of maize (Zea mays), sorghum (Sorghum bicolor) and soybean (Glycine max) for school aged children: Effect of malting period on selected proximate parameters and sensory qualities of developed beverages. International Journal of Applied Science and Technology 2(7): 285-292
Osuji CM, Ofoedu CE, Ojukwu M (2019) Proximate composition, malting characteristics and grain quality properties of Nigerian rice of different varieties. Research Journal of Chemical Sciences 9(2): 8-15
Owusu-Mensah E, Odure I, Safor KJ (2011) Steeping: A way of improving the malting of rice grain. Journal of Food Biochemistry 35(1): 80-91
Parker JK (2015). Thermal generation of aroma. In Parker JK, Elmore JS, Methven L (Eds.). Flavour Development, Analysis and Perception in Food and Beverages (p 151-185). Cambridge, England: Woodhead Publishing. Retrieved from https://doi.org/10.1016/b978-1-78242-103-0.00008-4 (accessed February 20, 2021)
Pietrzak-Fiecko R, Kamelska-Sadowska AM (2020) The comparison of nutritional value of human milk with other mammals’ milk. Nutrients 12(5): 1404. Retrieved from https://doi.org/10.3390/nu12051404 (accessed February 19, 2021)
Pires EJ, Branyik T (2015) Biochemistry of Beer Fermentation (pp 4). London, UK: Springer International Publishing
Pulliainen KT, Wallin HC (1996) Determination of total phosphorus in foods by colorimetry. Journal of AOAC International. 79(6): 1408-1410 Retrieved from https://doi.org/10.1093/jaoac/79.6.1408 (accessed February 25, 2019)
Sadler GD, Murphy PA (2010) pH and titratable acidity. In S. Nielsen (Ed.). Food Analysis 4th Edition (pp 219-238). New York, NY: Springer Science and Business Media, LLC
Sethi S, Tyagi SK, Anurag RK (2016) Plant-based milk alternatives an emerging segment of functional beverages: A review. Journal of Food Science and Technology 53(9): 3408-3423
Smart R, Robinson J, Due G, Brien C (1985) Canopy microclimate modification for the cultivar Shiraz. I. Definition of canopy microclimate. Vitis 24: 17-31
Sowonola OA, Tunde-Akintunde TY, Adedeji F (2005) Nutritional and sensory qualities of soymilk kunnu blends. African Journal of Food Agriculture Nutrition and Development 5(2)
UNICEF [United Nations Children’s Fund] (2019). Child Survival Helping Children Survive and Thrive. Retrieved from https://www.unicef.org/philippines/child-survival (accessed January 25, 2021)
Vuong B (2019) Seeing green: Plant-based alternatives are shaking up the food sector.
IBISWorld: Where Knowledge Is Power. Retrieved from https://www.ibisworld.com/industry-insider/media/3779/industrynewsletter_veganproducts_may2019.pdf (accessed February 19, 2021)
Wahyuni S, Sinniah UR, Yusop KM, Amarthalingam R (2003) Improvement of seedling establishment of wet seeded rice using GA3 and IBA as seed treatment. Indonesian Journal of Agricultural Science 4(2): 56-62
Wang B. Xiong YL, Wang C (2001) Physicochemical and sensory characteristics of flavored soymilk during refrigeration storage. Journal of Food Quality 24(6) 513-526
Whitney E, Rolfes SR (2015) Understanding Nutrition (pp 8-10). Stamford, CT: Cengage Learning
Wijngaard HH, Ulmer HM, Neumann M, Arendt EK (2005) The effect of steeping time on the final malt quality of buckwheat. Journal of the Institute of Brewing 111(3): 275-281
3M Food Safety. 3MTM PetrifilmTM reminders for use and interpretation guide for aerobic count plates, E. coli, and coliform count plates, yeast and mould count plates.Retrieved from https://multimedia.3m.com/mws/media/236194O/petrifilm-aerobic-interpretation-guide.pdf; http://cels.uri.edu/docslink/ww/BacteriaWorkshop/EColi3MPetrifilm.pdf; https://multimedia.3m.com/mws/media/902046O/3m-petrifilm-rapid-ym-count-plate-interpretation-guide.pdf (accessed April 24, 2019)

RICE-BASED BIOSYSTEMS JOURNAL (2022) 10: 75-85 75
IntroductionTaro or gabi (Colocasia esculenta) is an important
food staple of developing countries in Africa and Asia (Alcantara et al., 2013). In Asia, the Philippines has the largest area devoted to taro grown next to China. It is primarily grown for its edible corms. In 2012 - 2016, about 15,143 - 16,362 ha of Philippine land area was planted with taro, producing about 110,365 - 112,262 mt of crop (PSA, 2018). In general, the protein and fat content of taro are low, but its carbohydrate, fiber, and mineral are high (Arnavid-vinas and Lorenz, 1999). The gross energy of raw taro is 372.56 kcal/100 g dry matter, while the boiled form contains 373.69 kcal/100 g (Adane et al., 2013).
Taro corm is usually consumed boiled, steamed or oven-baked. Aside from these usual preparations, taro corms can also be prepared into various products such as taro-milk tea, taro chips, and ice cream. The corms of taro, however, are highly perishable due to their high moisture content, resulting in high postharvest losses. In addition, taro is an underutilized crop and is often considered as a “poor man’s crop or food.” Taro can be converted into flour to limit post-harvest losses and to fully utilize this crop and improve consumption. Taro flour used as a substitute for wheat was found to be suitable in the manufacture of a wide varieties of baked goods at 15 - 20% level (Njintang and Mbofung, 2006) with an increase in yield due
to higher absorption and improved qualities of the baked products (FAO, 1997).
Rice is the staple food of Filipinos consumed as table rice or processed into various products and other forms such as rice flour. Rice flour is made from finely milled rice, gluten-free, and has lower protein content than wheat flour. Gluten provides viscoelasticity to bakery products but can cause allergy in some humans, particularly those with celiac disease. Thus, other cereals such as rice flour, is a good substitute to wheat flour (Wanyo et al., 2009). Many bread-making companies are now producing rice flour-based bread for consumers with allergic reactions (Akari et al., 2016). Production of taro and rice flours as wheat substitutes likewise offers an opportunity to ensure food security in countries such as the Philippines, which import wheat.
Bakery premixes are mixtures of ingredients required in the preparation of various baked goods. These are essential products that offer convenience for bakers by reducing production time while providing consistent premium quality of finished products that meet consumer demands; ensuring optimal use of ingredients, particularly flour; and helping reduce production cost. There are three types of bakery premixes: complete mixes, dough bases or partial mixes, and dough concentrates (Hegenbart, 1998). Except for the dough concentrates, the main
SUITABILITY OF TARO (COLOCASIA ESCULENTA) AND RICE (ORYZA SATIVA L.) FLOUR BLENDS FOR CRINKLE
PREMIX FORMULATIONAmelia V. Morales1, Elyss J. Santiago2, Christine C. Taganap2, Jhomar L. Valerio2,
John Edward I. Zapater2, Geraldine G. Gantioque2, and Rosaly V. Manaois*1
1Philippine Rice Research Institute 2Central Luzon State University, Science City of Muñoz, Nueva Ecija, Philippines*Corresponding Author: [email protected]
AbstractFormulation of chocolate crinkle premix using taro flour (TF), rice flour (RF), and all-purpose flours
(APF) was investigated to develop an innovative product from taro and improve its consumption. The optimum formulations of TF-RF-APF blends were determined by applying D-optimal mixture design with the following parameters as responses: bulk density (BD), water activity (aw), moisture content (MC), and amylose content (AC) of the premix; water holding capacity (WHC); and oil holding capacity (OHC) of the crinkles. The BD and AC of the premixes were comparable with using APF only. All had aw (< 0.70) and MC (≤ 14%) ideal for extended storage. The WHC and OHC of the crinkles produced were higher than those of the control, signifying their ability to better retain water and oil. Further optimization yielded three premix formulations containing 47.0 - 49.5% TF, 17.0 - 18.2% RF, and 33.5 - 35.2% APF. These produced chocolate crinkles that had sensory acceptability scores (n = 60, age = 19 - 22 years old) and spread ratios comparable with the control. The most preferred formulation had 47.0% TF, 18.2% RF, and 34.8% APF that could produce crinkles with higher levels of protein, carbohydrates, dietary fiber, and energy value, than commercial products at a cost of PhP 3.70/pc.
Keywords: Bakery Premix, Crinkles, D-optimal Mixture Design, Response Surface Methodology, Rice, Taro
FULL PAPER

Suitability of Taro (Colocasia esculenta) and Rice (Oryza sativa L.) for Crinkle Premix Formulation
76 RICE-BASED BIOSYSTEMS JOURNAL (2022) 10: 75-85
component of bakery premixes is flour. Development of a bakery premix utilizing rice and taro would benefit bakers, homemakers, and food enthusiasts who are interested in preparing products with improved nutritional value.
Using Response Surface Methodology (RSM) with D-optimal mixture design, this study produced an innovative product using taro and rice flours, specifically chocolate crinkle premix with optimization of the formulation of the taro-rice flour formulation. The effect of the blending of flours on the nutritional quality of the product was also determined.
Materials and MethodsPreparation of taro and rice flours
NSIC Rc 222 was obtained from the Philippine Rice Research Institute (PhilRice), Science City of Muñoz, Nueva Ecija, Philippines. NSIC Rc 222 has high amylose content (23.9%). It was selected due to its popularity as a high-yielding variety. It is one of the top varieties consistently planted nationwide in dry and wet seasons in irrigated fields. The taro (var. Lilia) corms and other ingredients were procured from the Science City of Muñoz public market. The taro corms were hand-peeled, washed, chopped, and oven-dried at 60°C for 24 h. The dried taro was powdered using a FossTM Cyclotec 1093 Sample Mill and passed through a 100-mesh sieve (USA Standard Testing Sieve ASTME-11). Rice was polished, powdered, and likewise sieved as mentioned above. The flour samples were separately packed in polypropylene plastic and stored at 4°C until use.
Formulation of flour blends using D-optimal mixture design
The produced TF and RF were blended with APF to produce chocolate crinkle premix. Flour blend formulations were generated through RSM employing D-optimal mixture design. Percentage rates of lower and upper limits of each flour were set at (A) TF 30 and 50%; (B) RF at 10 and 20%; and (C) APF at 30 and 50%, respectively. The type and amount of flour were the independent factors while BD, aw, MC, and AC were the response factors. The flour blends’ aw values were determined using the Rotronic HygroPalm HP-23 (Bassersdorf, Switzerland) in accordance to the manufacturer’s instructions. The MC was determined by oven drying method (AOAC, 2005), while the AC through iodine colorimetric binding assay of Juliano et al. (2012).
Preparation, and analyses of chocolate crinkle premix
Crinkle premix formulations containing the flour blends were prepared based on the data obtained
using D-optimal mixture design. Other ingredients were held constant, such as cocoa powder (13.3%), white sugar (38.0%), baking powder (0.9%), iodized salt (0.2%), and confectioners’ sugar (9.5%). These ingredients were added into TF-RF-APF blends based on flour weight. All ingredients were mixed, except for confectioners’ sugar, which was packed and sealed separately in polypropylene plastic bag. The aw values of the premixes were determined as indicated above. The premixes were also subjected to OHC and WHC analyses using the methods of Beuchat (1977).
Verification of the RSM model
The RSM model was verified by comparing the experimental values with the predicted values obtained from the final response regression equations described by Musa et al. (2013).
Preparation and evaluation of chocolate crinkles
Three of the optimized formulations with the least APF and higher TF concentrations were selected in the preparation of taro-rice crinkle to validate if the values obtained are at their optimum. The crinkles were prepared by adding the premixes with vegetable oil (31.5 g), water (74.0 g), egg (72.2 g), and vanilla (2.1 g). The 15-g dough was rolled into 1-inch ball, coated with confectioners' sugar, placed on cookie sheets, and baked in a preheated oven for 10 - 12 min at 176.6°C. A control sample was prepared using APF alone and evaluated together with the formulations with flour blends.
Spread ratio was evaluated by weighing the crinkles before and after baking (Zoulias et al., 2000). The height and diameter were measured using a Vernier caliper. In measuring the diameter of the crinkles, four samples were placed next to one another to obtain the total diameter. After rotating the crinkles at 90°, the new diameter was measured. The final diameter of the crinkles was taken by getting the average of the two measurements then divided it by four. While the spread ratio was calculated by dividing the diameter to its height.
For the sensory evaluation, one piece of chocolate crinkle was packed, sealed, labeled, and presented to 60 randomly-selected college students (19 - 22 years old) of the College of Home Science and Industry, Central Luzon State University (CHSI, CLSU) as panelists. The overall acceptability was determined using a 9-point hedonic scale (1 - dislike extremely; 2 - dislike very much; 3 - dislike moderately; 4 - dislike slightly; 5 - neither like nor dislike; 6 - like slightly; 7 - like moderately; 8 - like very much; 9 - like extremely). The panelists were also asked to rank the samples (1 as the most preferred with no tied answer),

Suitability of Taro (Colocasia esculenta) and Rice (Oryza sativa L.) for Crinkle Premix Formulation
RICE-BASED BIOSYSTEMS JOURNAL (2022) 10: 75-85 77
indicate their primary reason for their selection, and signify their intent to purchase a piece of the taro-rice crinkle at either of the following: 4.00, 3.00, or PhP 2.00 (1 USD = PhP 52).
Nutritional Analysis
The crinkle with the highest sensory acceptability scores were evaluated for their crude protein, crude fat, crude ash, and dietary fiber levels based on AOAC-approved methods. Total carbohydrate content was determined by difference while the energy value in kcal/g was calculated using Atwater values. The nutritional values were compared with the two commercially available crinkle products (1 local and 1 international)
Analysis of Formulation Cost
The costs of the three selected optimized formulations of chocolate crinkle premixes were evaluated based on the overall cost of the ingredients. The methods used in producing the crinkle premix and crinkles, as well as the analyses conducted, are summarized in Figure 1.
Statistical Analysis
Analyses were done threefolds, unless otherwise stated. Data were analyzed using ANOVA of the SPSS Version 20. Tukey’s Honest Significant Difference (HSD) post-hoc test at p<0.05 significance level was used to determine differences between means. RSM was performed using Design-Expert Software Version 7.0. The statistical parameters used in evaluating and selecting the best-fitted model were the coefficient of determination (R2), adjusted coefficient of determination (R2 adjusted), coefficient of variation (CV), standard deviation (Stdev), predicted residual sum of squares (PRESS), lack-of-fit, and regression data (p and F values).
Results and DiscussionRice-taro flour blend formulations
D-optimal mixture design was used to determine the desired characteristics (Nikzade et al., 2012; Shaviklo and Rafipour, 2014), reduce the number of experimental runs needed to evaluate multiple variables (Muteki et al., 2007), and identify the
Figure 1. Flowchart on Preparation and analyses of chocolate crinkle premix (BD, bulk density; aw, water activity; MC, moisture content; AC, amylose content; OHC, oil holding capacity; and WHC, water holding capacity)

Suitability of Taro (Colocasia esculenta) and Rice (Oryza sativa L.) for Crinkle Premix Formulation
78 RICE-BASED BIOSYSTEMS JOURNAL (2022) 10: 75-85
interactions statistically. The optimization yielded nine formulations (Table 1).
Table 1. Formulations of flour blends generated using D-optimal mixture design.
Formulation Taro Flour (%)
Rice Flour (%)
All-purpose Flour (%)
F1 30.0 20.0 50.0F2 50.0 12.4 37.6F3 35.0 19.3 45.7F4 50.0 20.0 30.0F5 44.1 15.2 40.7F6 43.3 10.0 46.7F7 34.4 15.6 50.0F8 46.7 18.0 35.3F9 38.7 20.0 41.3
The analysis result of response variables in pure flours and nine flour blends are shown in Table 2. The flours and flour blends had comparable BD values, which were 0.31 - 0.32 g/cm3. Their aw had mean values of ≤ 0.6 and the MC ranges from 5.6 to 10.9%. APF had the highest aw, and among those with the highest MC values while TF had the lowest values. Hence, formulations with higher APF generally produced blends with higher aw that significantly differed from those of the other formulations. No microbial growth will occur in flours with aw of 0.68 - 0.70 and ≤ 14% MC (Atwell 2001, as cited by Gurtler et al., 2014). Hence, all flours, and flour blends in this study will not support microbial growth, and can be stored for an extended period. According to Jane et al. (1992), flour AC for baking is usually 18 - 25% and the flour formulations in this study are within this range. The AC ranged from 21.52 to 23.90% and were not significantly different from each other. Amylose affects gelatinization and retrogradation of starch;
the higher the AC, the greater the tendency for the starchy product to retrograde. However, high amylose affects product texture especially when it is cooled after baking (Perdon et al., 1999). Retrogradation causes staling of bread and other starch-rich foods, reducing shelf-life, and decreasing consumer acceptance (Wang et al., 2015). Although values were statistically similar, the flour blends may exhibit different retrogradation properties. For instance, rice varieties with higher than 22.0% AC are classified as high-amylose based on the National Cooperative Testing for Rice standards. These varieties have a higher tendency to retrograde. Among the taro-rice flour blends, the lowest AC was observed from formulation F2, which has 50% TF (Table 2). The actual AC value of F2 was 21.52%.
Combinations of the flour blends with other ingredients in producing the crinkle premix has positive interaction with aw values ranging from 0.42 to 0.55, implying a shelf-stable product (Table 2).
The WHC of the formulations was 60.20 - 66.98% and OHC ranged 102.91 - 138.33%, which were higher than the control (33.84% and 97.32%, respectively). These signify their better ability to retain water and oil, which impacts the product’s texture. Altschul and Wilcke (1985) stated that 63.8% WHC and 107.0% OHC are good for baked products. WHC relates to the hydrophilic character and capability for hydrogen bonding of the protein molecules in the flour; thus, the ability of a food sample to retain water. WHC affects digestion and satiety as well as the nutritional value of foods during thermal processing, particularly in protein-rich samples. It also impacts the rehydration rate of dried vegetables (van der Sman, 2015) and the freshness and softness of baked products (Capitani et al., 2013). OHC indicates the hydrophobic nature of
Table 2. Mean physicochemical, and functional properties of flour blend, and chocolate crinkle premix.1
Sample/ Formulation
Flour and Flour Blend Analyses Crinkle Premix Analyses
BD2 (g/cm3)
aw3 MC4
(%)AC5 (%)
aw3 WHC6
(%)OHC7
(%)
Taro flour 0.31a 0.19i 5.65d 22.07a --- --- ---
Rice flour 0.32a 0.45b 9.44bc 22.69a --- --- ---
All-purpose flour 0.31a 0.60a 10.88a 23.90a 0.55a 33.84e 97.32c
F1 0.32a 0.43bc 9.58abc 22.95a 0.47b 64.52abc 138.33a
F2 0.32a 0.39fg 8.95bc 21.52a 0.44cd 60.20d 135.16a
F3 0.32a 0.42cde 9.55abc 22.51a 0.45c 61.01bcd 112.40ab
F4 0.32a 0.36h 8.24c 23.35a 0.42de 66.98a 125.45ab
F5 0.32a 0.40efg 9.33bc 22.87a 0.44c 61.81bcd 121.84ab
F6 0.32a 0.40ef 9.11bc 23.21a 0.44cd 65.18abc 103.93b
F7 0.32a 0.42cd 9.46bc 22.91a 0.44c 64.25abcd 102.91b
F8 0.31a 0.38g 9.25bc 22.36a 0.42de 61.23cd 117.99ab
F9 0.32a 0.41ef 10.25ab 23.13a 0.44c 65.64ab 112.49ab
1Means with the same superscripts within a column are not significantly different at p<0.05.2bulk density; 3water activity; 4moisture content; 5amylose content; 6water holding capacity; 7oil holding capacity

Suitability of Taro (Colocasia esculenta) and Rice (Oryza sativa L.) for Crinkle Premix Formulation
RICE-BASED BIOSYSTEMS JOURNAL (2022) 10: 75-85 79
Figure 2. Three-dimensional contour plot illustrating the interaction of: (A) %taro flour, (B) %rice flour, and (C) %all-purpose flour on the (a) BD, (b) aw, (c) MC, (d) AC of the flour blend, and (e) WHC, and (f) OHC of the crinkle premix.
foods (Awolu et al., 2016, Akinyedi and Amoo, 2009) and relates to the amount of oil that can be absorbed by a sample per unit weight (van der Sman, 2015). It is linked to the greasiness (Capitani et al., 2013), flavor, and texture of food products (Huang et al., 2019). Figure 2 shows the three-dimensional plots indicating the influence of the different proportions of flours on the BD, aw, MC, and AC of the flour blend formulations.
Effect of flour blend proportions on physicochemical properties
The response surface model was calculated to evaluate the contribution of each flour variable and the quantitative effects on the response. The software suggested cubic as the best model that had variation of 71.4% for BD, 90.2% for aw, 97.8% for MC, and

Suitability of Taro (Colocasia esculenta) and Rice (Oryza sativa L.) for Crinkle Premix Formulation
80 RICE-BASED BIOSYSTEMS JOURNAL (2022) 10: 75-85
Table 3. Summary of the p-value of the analysis of variance.
Flour Blend Crinkle Premix. BD1 (g/cm3) aw
2 MC3 (%) AC4 (%) WHC5 (%) OHC6 (%)R-Squared 0.7140 0.9016 0.9776 0.8093 0.70 0.91Adj R-Squared 0.1421 0.7049 0.9329 0.5708 0.10 0.74
p value 0.4629 0.1196 0.0143 0.1299 1.16 0.10F value 1.25 4.58 21.85 3.39 0.49 5.34C.V. % 0.95 2.99 1.27 1.65 7.95 5.63Lack-of-Fit 0.69 2.14 0.07 5.40 5.96 0.12Stdev 3.029E-003 0.28 5.096E-003 0.38 4.98 6.72
1bulk density; 2water activity; 3moisture content; 4amylose content; 5water holding capacity; 6oil holding capacity
Figure 3. Taro-rice crinkle premix from the generated optimum flour blends.
80.9% for AC (Table 3). Other percentages of the variation to complete 100% was attributed to the factors not included in the model. The lack-of-fit test showed that the model error and replicate error were small, which further validates the suitability of the prediction model.
Optimization of crinkle premix using D-optimal mixture design and validation
Data generated in the analyses were further subjected to optimization, which produced three formulations of flour blends (Figure 3, Runs 11, 21, and 25) with high desirability. The aim of this optimization was to obtain an in-range target for all six responses simultaneously with respect to the pre-defined constraints. At this stage, the defined desirable areas of six responses were superimposed and the region of interest was generated. The compositions of the optimum flour blends are presented in Table 4 while the crinkles prepared using these formulations are shown in Figure 4.
The overall acceptability and spread ratio values of the control sample and crinkles prepared using
the three optimized formulations were comparable at p<0.05 (Table 4). The overall acceptability ranged from 6.77 to 7.17 (like moderately) and spread ratio at 4.07 - 4.71. Spread ratio is a measure of cookie quality and higher value yields better cookies (Mudgil et al., 2017). These results showed that the optimized formulations generated by the software had good reproductibility, signifying interchangeablity of the formulations.
R25 crinkle was the most preferred by the panelists followed by the R21, control, and R11 (Figure 5B). The primary reasons for choosing the most preferred sample were taste and texture (Figure 4B). The frequency of willingness to purchase the sample if it is commercially available was 92%. Majority of the panelists (55 - 57%) were willing to purchase the crinkles at PhP 3.00/pc (Figure 5C). Thus, R25 was used for subsequent nutritional analysis and cost evaluation.
Verification of the model
Results of the analyses were found to be in good agreement with the predicted values (Table 5). According to Ross (2020), a Relative Standard Error
Table 4. Overall acceptability and spread ratio of crinkle optimized formulations.
Crinkle Sample Taro Flour % Rice Flour % All-purpose Flour % Overall Acceptability Spread RatioControl 100 6.77 4.71Run 11 49.5 17.0 33.5 7.17 4.07Run 21 47.6 17.1 35.2 7.12 4.07Run 25 47.0 17.2 34.8 7.12 4.35

Suitability of Taro (Colocasia esculenta) and Rice (Oryza sativa L.) for Crinkle Premix Formulation
RICE-BASED BIOSYSTEMS JOURNAL (2022) 10: 75-85 81
Figure 4. Taro-rice crinkles produced from the premixes with the generated optimum flour blends.
Figure 5. Sensory ranking (A), panelists’ primary reason for choosing the most preferred samples (B), and the purchase intent of taro-rice crinkle (C).

Suitability of Taro (Colocasia esculenta) and Rice (Oryza sativa L.) for Crinkle Premix Formulation
82 RICE-BASED BIOSYSTEMS JOURNAL (2022) 10: 75-85
Table 5. Optimum and predicted values of three selected optimized formulations of chocolate crinkle premix.
Analyses Optimized Formulations
Predicted Value
Optimum Value RSE (%)
Bulk density (g/cm3) R11 0.31 0.32 3.23R21 0.32 0.32 0.00R25 0.31 0.32 3.23
Water activity R11 0.38 0.40 5.26R21 0.38 0.40 5.26R25 0.38 0.41 7.89
Moisture content (%) R11 9.00 9.58 6.44R21 9.08 9.56 5.29R25 8.74 9.59 9.73
Amylose content (%) R11 22.15 22.58 1.94R21 22.67 22.57 0.44R25 22.20 22.60 1.80
Water holding capacity (%) R11 65.38 62.26 4.77R21 66.69 62.03 6.99R25 65.41 62.04 5.15
Oil holding capacity (%) R11 111.46 107.32 3.71R21 111.12 106.93 3.77R25 112.48 107.18 4.71
(RSE) of less than 25% is acceptable. Therefore, the finalized equation for BD, aw, MC, AC, WHC, and OHC generated by the software was acceptable for the chocolate crinkle premix formulation.
Nutritional analysis
The nutritional quality of the crinkles using R25 premix formulation, along with commercial samples available locally and abroad, is shown in Table 6. The product made with TF-RF-APF blend had high protein, fat, and carbohydrate content of 8.4%, 11.8%, and 74.6%, respectively, with a total energy of 438.2 kcal. Taro contains higher amount of carbohydrates, protein, starch, and other nutrients than other root crops and cereals (Temesgen and Retta, 2015). This could be attributed to the higher crude protein and carbohydrate content of the crinkles using the taro-rice premix compared with the commercial products with similar fat content. In milled white rice, the important nutrients found per 100 g at 14% MC were crude protein (6.3 - 7.1 g), crude ash (0.3 - 0.8 g), crude fiber (0.2 - 0.5 g), total dietary fiber (0.7 - 2.3 g), carbohydrates (77 - 89 g), and sugars (0.2 - 0.5 g) that give energy content of 349 - 373 kcal (Juliano, 2007).
The ash or the mineral content of the crinkle is 2.7% (Table 6). Minerals found in different varieties of taro include potassium, phosphorus, magnesium, calcium, sodium, and at lower quantities: iron, zinc, copper, and boron (Huang et al., 2000).
The carbohydrate content of the TF-RF-APF crinkles was higher per serving than the two commercial products (Table 8). According to Kumar
et al. (2015), taro is a good source of starch, and increasing the amount of taro flour in a taro-wheat composite flour resulted in improvements of starch content with no detectable levels of total sugars. The DF of taro-rice crinkle was likewise high at 17.5%. The high DF may be attributed mainly to the taro as wheat and polished rice are not good sources of this nutrient due to the removal of fiber-rich bran layers when these grains are polished. This finding agreed with the report of Kumar et al. (2015), which observed that fiber content was higher in taro-wheat flour composites with higher levels of taro flour. In gluten-free cookies, improved fiber levels were also observed with the utilization of taro flour (Giri and Sajeev, 2020; Tekle, 2009), as well as carbohydrate and ash content (Tekle, 2009). Huang et al. (2000) reported that DF of taro grown in Hawaii was 3.6 - 3.8%. The DF value of the rice-taro crinkles indicates that DF of the taro used in this study is higher, which could be due to varietal differences.
A serving size of a one-piece taro-rice crinkle, weighing either 17 or 20 g, was superior to the commercial products, notably in terms of the total carbohydrates and DF (Table 6). It also provides higher energy, which was mainly attributed to its high carbohydrate content. The DF was significantly higher than those of the commercial products with similar fat content. According to Hazen (2012), 4 - 5% fiber can be incorporated in similar products such as muffins and pound cakes, which is lower than the DF of the TF-RF-APF crinkles. DF is a type of carbohydrate that resists digestion and absorption (Ötles and Ozgoz, 2014). One of the important roles of different types of fiber is their

Suitability of Taro (Colocasia esculenta) and Rice (Oryza sativa L.) for Crinkle Premix Formulation
RICE-BASED BIOSYSTEMS JOURNAL (2022) 10: 75-85 83
ability to act as prebiotics or substances, which alter the types and activities of the bacteria, or microflora living inside the human gut (UMHS, 2016). High fiber intake lowers the risk of developing hypertension, cardiovascular disease, obesity, diabetes, and certain gastrointestinal diseases (Ötles and Ozgoz, 2014).
Analysis of formulation cost
The use of TF and RF lowered the cost of crinkle premix (Table 7). The control had a formulation cost of PhP 51.92. R11, R21, and R25 had costs ranging from PhP 44.78 to PhP 44.92 based on 300 g mixture. This produces 15 pc of crinkles, which costs PhP 3.70/pc. Adding the 20% markup if commercialized, the product is competitive with those already available in the market, which usually costs about PhP 4 - 5/pc.
Conclusion and RecommendationsThis study converted taro into flour and blended
with rice flour to produce taro-rice crinkle premix. The three optimum premix formulations consisted of 49.5% TF, 17.0% RF, and 33.5% APF (R11); 47.6% TF, 17.1% RF, and 35.3% APF (R21); and 47.0% TF, 18.2% RF, and 34.8% APF (R25). Formulation R25 yielded crinkles, which were the most preferred by the panelists, and produced with the lowest cost at PhP 44.78/300 g net weight or PhP 3.66/pc. The crinkles produced could provide higher contents of carbohydrate, DF, and energy than some commercially available products with the same serving sizes. These results showed that taro and rice flours can be used as partial replacements for wheat flour in developing innovative and nutritious food products such as crinkle
Table 6. Nutritional composition of chocolate crinkles with taro-rice flour blend based on serving size.
per 100g1 per 20g1 per 17g1
Property TF-RF-APF Local TF-RF-APF International
Crude protein (g) 8.4 2.0 1.0 1.0 0.9Crude fat (g) 11.8 2.5 2.5 2.0 1.9Crude ash (g) 2.7Total carbohydrates (g) 74.6 15.0 13.0 12.0 11.0Dietary fiber (g) 17.5 4.0 1.0 3.0 0.3Total energy (kcal) 438.2 90 80 74 63
1based on nutrition label
Table 7. Formulation cost of the selected optimum chocolate crinkle premix.
Ingredients Price Quantity Cost (PhP)
PhP/g Control R11 R21 R25 Control R11 R21 R25Premix
Taro flour 62.5/500 - 54.37 56.52 53.65 - 6.80 7.06 6.71
Rice flour 17.5/500 - 19.56 19.40 20.74 - 0.68 0.68 0.73
APF 97.92/500 114.17 40.24 38.25 39.77 22.36 7.88 7.49 7.79
Cocoa powder 299/1000 39.96 11.95
White sugar 60/500 114.17 13.70
Baking powder 13/50 2.69 0.70
Salt 10/250 0.48 0.02
Confectioners’ sugar 28/250 28.54 3.20
Total cost (premix formulation), PhP 51.92 44.92 44.80 44.78
Other ingredients
Vegetable oil 50/921.4 31.50 1.71
Egg 6/72.2 72.20 6.00
Vanilla 250/219.8 2.10 2.39
Total cost (crinkle mixture + premix), PhP 62.02 55.02 54.90 54.88
Price per crinkle (300 g mixture yields 15 pc) 4.13 3.67 3.66 3.66

Suitability of Taro (Colocasia esculenta) and Rice (Oryza sativa L.) for Crinkle Premix Formulation
84 RICE-BASED BIOSYSTEMS JOURNAL (2022) 10: 75-85
premix. Consumer sensory evaluation using home-use test, evaluation of the shelf life of the crinkle premix, and determination of appropriate packaging are recommended for the upscale production and commercialization of the product.
AcknowledgmentThe authors are grateful to John Paulo Samin and
Claudine Bagajo for their assistance in data analysis generated by Design Expert Software. Appreciation is also extended to Dr. Riza Abilgos-Ramos, Dr. Alma De Leon, Prof. Jessica Rustia, Prof. Venus Quines, and Dr. Judith Antonino for their technical inputs. We also acknowledge Jerry Adriano for his assistance in preparing the rice and taro flours.
Literature CitedAdane T, Shimelis A, Tilahun B, Haki GD (2013) Effect of
processing method on the proximate composition, mineral content, and anti-nutritional factors of Taro (Colocasia esculenta L.) grown in Ethiopia. African Journal of Food, Agriculture, Nutrition and Development 13(2): 7383-7398
Akari E, Ashida K, Aoki N, Takahashi M, Hamada S (2016) Characteristics of rice flour suitable for the production of rice flour blend containing gluten and methods of reducing the cost of producing rice flour. Japan Agriculture Research Quarterly 50(1): 23-31
Akinyedi AI, Amoo IA (2009) Chemical and functional properties of full fat and defatted Cassia fistula seed flours. Pak J Nutr 8(6): 765-769
Alcantara RM, Hurtada WA, Dizon EI (2013) The nutritional value and phytochemical components of taro (Colocasia esculanta L.) powder and its selected processed foods. J Nutr Food Sci 3(3): 207
Altschul AM, Wilcke HL (1985) New Protein Foods: Food Science and Technology. Orlando, FL: Academic Press
AOAC [Association of Official Analytical Chemists] (2005) Official methods of analysis of the AOAC international 18th Edition. Washington DC: AOAC International, Inc
Arnavid-Vinas MDR, Lorenz K (1999) Pasta products containing taro (Colocasia esculenta). J Food Sci Agric 76: 608-616
Atwell WA (2001) Wheat Flour: Practical Guides for the Food Industry. St. Paul, Minn.: Eagan Press
Awolu OO, Osemeke RO, Ifesan BOT (2016) Antioxidant, functional, and rheological properties of optimized composite flour, consisting wheat and amaranth seed, brewers’ spent grain and apple pomace. Journal of Food Science and Technology 53(2): 1151-63
Beuchat LR (1977) Functional and electrophoretic characteristics of succinylated peanut flour protein. J Agric Food Chem 25(2): 258-261
Capitani MI, Nolasco SM, Tomas (2013) Effect of mucilage extraction on the functional properties of chia meals. In Muzzalupo I (Ed.). Food Industry. 19: 421-437. Rijeka, Croatia: InTech
FAO [Food and Agriculture Organization] (1997) FAO Production Yearbook 1996. Rome, Italy
Giri NA, Sajeev MS. (2020) Physico-mechanical and nutritional evaluation of taro (Colocasia esculenta) flour-based gluten-free cookies. Agricultural Research 9(1): 125-131
Gurtler JB, Doyle MP, Kornacki JL (2014) The Microbiological Safety of Low Water Activity Foods and Spices. New York: Springer
Hazen C (2012) Fiber files. In Food Product Design 22(9): 1-6
Hegenbart S (1998) Maximizing Convenience with Bakery Mixes - Part One. Food Ingredients Online. Retrieved from https://www.foodingre-dientsonline.com/doc/maximizing-convenience-with-bakery-mixes-part-0001 (accessed August 26, 2019)
Huang AS, Titchenal CA, Meilleur BA (2000) Nutrient composition of taro corms and breadfruit. Journal of Food Composition and Analysis 13: 859-864
Huang S, Martinez MM, Bohrer BM (2019) The compositional and functional attributes of commercial flours from tropical fruits (breadfruit and banana). Foods 8(11): 586 https://doi.org/10.3390/foods8110586
Jane J, Shen L, Chen J, Lim S, Kasemsuwan T, Nip W (1992) Physical and chemical studies of taro starches and flours. Cereal Chem 69(5): 528-535
Juliano BO (2007) Rice chemistry and quality. Philippines: Philippine Rice Research Institute
Juliano BO, Tuaño APP, Monteroso DN, Aoki N, Mestres C, Duldulao JBA, Bergonio KB (2012) Replacement of acetate with ammonium buffer to determine apparent amylose content of milled rice. Cereal Foods World 57(1): 14-19
Kumar V, Sharma HK, Kaushal P, Singh K (2015) Optimization of taro–wheat composite flour cake using Taguchi technique. Journal of Food Measurement and Characterization 9(1): 35-51
Mudgil D, Barak S, Khatkar BS (2017) Cookie texture, spread ratio and sensory acceptability of cookies as a function of soluble dietary fiber, baking time and different water. LWT-Food Science and Technology 80: 537-542
Musa SH, Basri M, Masoumi HR, Karjiban RA, Malek EA, Basri H, Sahmsuddin AF (2013) Formulation optimization of palm kernel oil esters nanoemulsion-loaded with chloramphenicol suitable for meningitis treatment. Colloids and Surfaces B: Biointerfaces 112: 13-9
Muteki K, MacGregor J, Ueda T (2007) Mixture designs and models for the simultaneous selection of ingredients and their ratios. Chemometrics and Intelligent Laboratory System 86(1): 17-25
Nikzade V, Tehrani MM, Saadatmand-Tarzja M (2012) Optimization of low-cholesterol-low-fat mayonnaise formulation: Effect of using soymilk and some stabilizer by a mixture design approach. Food Hydrocolloids 28(2): 344-352

Suitability of Taro (Colocasia esculenta) and Rice (Oryza sativa L.) for Crinkle Premix Formulation
RICE-BASED BIOSYSTEMS JOURNAL (2022) 10: 75-85 85
Njintang YN, Mbofung CMF (2006) Effect of precooking time and drying temperature on the physico-chemical characteristics and in-vitro carbohydrate digestibility of taro flour. LWT-Food Science and Technology 39(6): 684-691
Ötles S, Ozgoz S (2014) Health effects of dietary fiber. Acta Scientiarum Polonorum Technologia Alimentaria 13(2):191-202
Perdon AA, Siebenmorgen TJ, Buescher RW, Gbur EE (1999) Starch retrogradation and texture of cooked milled rice during storage. Journal of Food Science 64(5): 828-832
PSA [Philippine Statistics Authority] (2018) Crop Statistics of the Philippines, 2012-2016. Retrieved from https://psa.gov.ph/sites/default/files/Crops (accessed August 14, 2019)
Ross S (2020) What is a relative standard error? Retrieved from https://www.investopedia.com (accessed May 11, 2021)
Serna-Saldivar S (2012) Dry-milling processes and quality of dry-milled products. In Cereal Grains: Laboratory Reference and Procedures Manual (pp. 151-153). Boca Raton, FL: CRC Press, Taylor & Francis Group
Shaviklo AR, Rafipour F (2014) Consumer-based development and optimization of fish strudel using D-optimal mixture design. Journal of Food Processing and Preserving 38(3): 845-855
Tekle A (2009) The effect of blend proportion and baking condition on the quality of cookies made from taro and wheat flour blend. Euthopia: Thesisi Addis Ababa University
Temesgen M, Retta N (2015) Nutritional potential, health and food security benefits of taro Colocasia esculenta (L.): A review. Food Science and Quality Management 36: 23-30
UMHS [University of Michigan Health System] (2016) The role of fiber. Retrieved from https://www.med.umich.edu/pfans/_pdf/hetm-2016/0816-roleoffiber.pdf (accessed August 23, 2019)
van der Sman R.G.M (2015) Getting a grip on water holding capacity. Food & biobased research. United Kingdom: Russell Publishing Ltd. Retrieved from https://www.newfoodmagazine.com/article/16126/getting-a-grip-on-water-holding-capacity/ (accessed August 12, 2019)
Wang S, Li C, Copeland L, Niu Q, Wang S (2015) Starch retrogradation: A comprehensive review. Comprehensive Reviews in Food Science and Food Safety, 14(5): 568-585
Wanyo P, Chomnawang C, Siriamornpun S (2009) Substitution of wheat flour with rice flour and rice bran in flake products: Effects on chemical, physical, and antioxidant properties. World Applied Sciences Journal 7(1): 49-56
Zoulias EI, Piknis S, Oreopoulou V (2000) Effect of sugar replacement by polyols and acesulfame-K on properties of low-fat cookies. Journal of Food and 80(14): 2049-2056


RICE-BASED BIOSYSTEMS JOURNAL (2022) 10: 87-94 87
ASSESSING CONSUMERS’ WILLINGNESS TO BUY NATIVE DELICACIES INCORPORATED WITH
FERMENTED RICE BRAN IN LEYTE, PHILIPPINESVince G. Lao1*, Angelita L. Paradero1 and Riza Abilgos-Ramos2
1Visayas State University, ViSCA, Baybay City, Leyte; 2Philippine Rice Research Institute, Science City of Muñoz (3119), Nueva Ecija
*Corresponding Author: [email protected]
AbstractRice is the main staple food in the Philippines. One of its by-products is rice bran, which is typically used
as primary ingredient for animal feed. However, in recent years, it has been treated as a potential ingredient for the preparation of nutraceuticals considering its various health benefits particularly preventing different kinds of diseases.
Fermented rice bran (FRB) is a good source of dietary fiber, vitamins, minerals, amino acids, essential fatty acids, and antioxidants. Several countries have been adding FRB to their food products for additional health benefits. In the Philippines, incorporating FRB to food is still a new concept. In fact, there are no FRB incorporated food products available in the market and no studies determining its potential. This study determined the consumer’s willingness to buy (WTB) major native delicacies in Leyte, Philippines, that are enhanced with FRB. Before incorporating FRB in the native delicacies, it is crucial to understand the consumers’ WTB towards these products as it can guide food experts and product developers on its development and help identify their market value and consumer’s acceptability.
Purposive sampling was done through a face-to-face survey from the 200 consumer-respondents of these native delicacies aged 15 - 64 years old. Results showed that 68.5% of the respondents are willing to buy native delicacies incorporated with FRB. This study also showed that perceived taste and consumers’ income positively influenced the consumers’ WTB the products, while perceived expensive price is found to be a negative and significant predictor. Thus, food experts and developers must also ensure that the combination of FRB and native delicacies will not negatively alter the taste of the new product formulation. Moreover, affordability is essential in setting the prices of these products.
Keywords: Fermented Rice Bran, Willingness to Buy, New Product Development
IntroductionRice is considered as the most important crop in
the Philippines (Bordey, 2010). It is the main staple food for majority of the Filipinos. Milling of paddy rice produced 69% starchy endosperm (milled rice), 20% rice husks, and 11% rice bran (Dhankhar, 2014). One of the government's priorities in the Philippine Rice Industry Roadmap 2030 is to ensure access to safe and nutritious rice through the Department of Agriculture (DA), which aims to increase the availability of value-added rice and related products (DA, 2018).
Rice is abundantly grown throughout the country. Its production in the Philippines reached 19.32 M metric tons (Mmt) in 2021, higher than 2.6% from the previous year. In 2021, the Philippine Statistics Authority (PSA) reported that Central Luzon, Cagayan Valley, and Western Visayas are the country’s main rice-producing regions. In Eastern Visayas, rice
produce was 272,182 Mmt with Leyte accounting for 148,509 Mmt or 54.6% of the total production during the fourth quarter of 2020 (PSA, 2021).
Rice bran, a rice by-product, is the brownish portion of rice that is taken out in fine grain form during de-husking and milling of paddy (Nagendra et al., 2011). One hundred kilograms of paddy rice can generate approximately 5 - 10 kg of bran (IRRI, n.d.). It is typically used as an ingredient in animal feed especially for ruminants and poultry, but is currently treated as a potential source in the preparation of nutraceuticals because of its various health benefits specifically in disease prevention (Alauddina et al., 2017). Rice bran is rich in dietary fiber, vitamins, minerals, amino acids, essential fatty acids, and antioxidants like γ -oryzanol, tocopherol, and tocotrienol. There is also strong evidence that rice bran may be beneficial in reducing the risk of cardiovascular diseases and colon cancer (Sharif et al., 2014).
FULL PAPER

Consumers’ Willingness to Buy Delicacies with Fermented Rice Bran
88 RICE-BASED BIOSYSTEMS JOURNAL (2022) 10: 87-94
Rice bran has drawn important attention in the food industry for its potential to be incorporated in various food products. Several studies show that rice bran can be used as an ingredient in producing healthy food products, and that there is a need to consider it as a food rather than a feed ingredient (Issara and Rawdkuen, 2016; Sharif et al., 2014). Likewise, the growing popularity of healthy meals and beverages has demanded the exploration of the possible underutilized rice by-products with beneficial properties such as rice bran (Issara and Rawdkuen, 2016).
Fermented rice bran (FRB) is considered as a new type of nutritional food adjunct and is commonly fermented with Saccharomyces cerevisiae, Lentinus edodes, or Issatchenkia orientalis (Kim and Han, 2014). Fermentation enhances the phytochemical contents of rice bran in accordance with its variety (Kim and Han, 2014). In some countries, FRB has been used in the food industry by incorporating it into food products for additional health benefits (Ono, 2014; Cao et al., 2021; Christ-Ribeiro et al., 2021). Christ-Ribeiro et al. (2021) discovered that FRB can be used as a wheat flour substitute in baking cookies. The reconstitution of brown rice flour and ball-milled rice bran improves the quality in terms of volume, springiness, and resilience of brown rice food such as steamed brown rice cakes (Cao et al., 2021). The fermented rice bran bed called Nukadoko was traditionally used for Nukazuke, a type of pickled vegetables in Japan (Ono, 2014).
Despite the world-wide potential of FRB in enhancing the functionality of food products, it is still uncommon and a new concept in the Philippines. There are no FRB-food products available in the market and no studies conducted to determine the potential of incorporating FRB into Philippine food products. This study identified the consumer’s willingness to buy (WTB) or purchase intention towards native delicacies of Leyte that are incorporated with FRB.
Leyte’s major native delicacies include binagol, moron, suman latik, and bibingka. These rice-based native delicacies are commonly consumed as snacks. Binagol is made of flour, sugar, milk, and crushed “talyan”, which is a local name for a root crop similar to cassava. Moron, which is also called chocolate moron is a type of rice cake prepared using glutinous rice, coconut milk, sugar, and tablea prepared from native grown cacao seeds, which are roasted, ground finely and molded into small patties. Suman-latik is another type of rice cake made of glutinous rice or sticky rice, brown sugar, and coconut milk. It is flavored with lye solution and served with latik sauce (a syrup made from the mixture of coconut milk and sugar) topped with grated coconut meat along with
hot chocolate or coffee (SunStar, 2015). Bibingka, a rice cake which is traditionally placed in moulders lined with banana leaves and baked using native oven with flaming coals below and above the cover.
These native delicacies have high GI as rice is the main ingredient. Incorporating FRB in these foods can increase dietary fiber (from the rice bran) and consequently can lower the GI content of food. Likewise, the prebiotics and probiotics in the FRB will also counter the effect of sugars and carbohydrates in the gut. The added fiber will also delay absorption/conversion of glucose in the food. Studies have shown that adding rice bran lowers the GI of food products (Trinidad et al., 2010; Nakamura, et al., 2017; Ijarotimi et al., 2021; Sapwarobol et al., 2021) and enhances gut health (Nealon et al., 2019; Ai et al., 2021; Seyoum et al.,2022). Producing healthier version of these native delicacies through FRB may help address health concerns of consumers.
Before incorporating the FRB to native delicacies, it is imperative to understand the consumers’ WTB of these new food items to guide product developers and processors. It will also help them formulate marketing strategies when these products will be made available in the market.
Materials and MethodsParticipants, Study Location, and Data Collection Procedure
The study was conducted in the major cities of Leyte: Baybay, Ormoc, and Tacloban. These cities have the highest population in the province, and are known as the economic hubs where businesses and demand for consumer goods and services are concentrated. Four major rice-based native delicacies that have the potential to be incorporated with FRB namely, binagol, moron, suman-latik, and bibingka, were identified through a focused group discussion participated by selected food technologists.
After identifying these major native delicacies, a personal survey was conducted to product consumers aged 15 - 64 years old. This age group has the independent capacity to decide on the products they want to buy for themselves or for their households (Ballesteros and Abilgos-Ramos, 2018). There were 200 respondents interviewed who are proportionately distributed in the three cities. The survey was conducted at the cities’ public markets and transportation terminals where most of the native delicacies are sold. Due to the COVID-19 pandemic, health protocols such as physical distancing and wearing of face masks were strictly followed throughout the survey.

Consumers’ Willingness to Buy Delicacies with Fermented Rice Bran
RICE-BASED BIOSYSTEMS JOURNAL (2022) 10: 87-94 89
Research questionnaire
A structured questionnaire was used to collect market information such as awareness and knowledge towards FRB, its health benefits, consumer’s perceptions on the major native delicacies, and WTB or willingness to pay for major native delicacies added with FRB, as well as reasons for unwillingness to buy the product.
Data analysis
Descriptive analysis specifically means, frequency counts, and percentages were employed to describe the data on respondents’ demographic characteristics, awareness, perceptions, health consciousness, and WTB. On the other hand, binary logistic regression was used to identify the determinants of consumers’ willingness to buy FRB- incorporated native delicacies.
Results and DiscussionSocio-demographic characteristics of native delicacies consumers
The 200 respondents were from Baybay (19%), Ormoc (38%), and Tacloban (43%). There were 136 female and 64 male consumers of which the average age was 34 years old. More than half (53.5%) are married, 41.5% are single, while 3% are widows/widowers, and the remaining were separated (2%). The predominance of female respondents could be linked to the observation that Filipino mothers and wives are the primary decision makers on household expenditures such as food, clothing, and other daily expenses (David, 1994).
Most consumers in the study have college education (63%) while 22% attained high school. Majority of them were self-employed (38%), 19% were students, 17% were not yet employed and served as housewives or househusbands in the family, 12% were employed either in the government or private firms, while the remaining 16% preferred not to specify their occupations.
In terms of income, 61% of the consumers earned less than PhP 10,000 a month; 21% earned PhP 10,001 to PhP 20,000 per month; 15% with PhP 20,001 - PhP 30,000, while only few (3%) earned PhP 30,001 - PhP 50,000. The respondent identified themselves as health conscious (96%) and not health conscious (4%). The socio-demographic profile of respondents is reflected in Table 1.
Understanding the socio-demographic characteristics of the buyers is important as these variables may impact the buyer’s purchase behavior towards a particular product (Kotler and Keller, 2012). Similarly,
knowing the socio-demographic characteristics of the native delicacies consumers is essential to determine which of the socio-demographic variables would affect consumers’ WTB these native delicacies if added with FRB.
Table 1. Respondents’ socio-demographic profile (n = 200)
Characteristic
Average Age: 34 years old
Frequency Percent (%)
Gender Male 64 32Female 136 68
Civil Status Single 83 41.5Married 107 53.5Separated 4 2Widow/Widower 6 3
Educational level Highschool graduate 43 22College level 61 31College graduate 64 32Not specified 32 16
Occupation Housewife/househusband 34 17Government/private employee 23 12Self-employed 75 38Student 37 19Not specified 31 16
Monthly Income (PhP)below 10,000 121 6110,001-20,000 43 2220,001-30,000 30 1530,001-50,000 6 3
Decision maker Father/husband 28 14Mother/wife 143 72Both parents 17 9Not specified 12 6
Health conscious Yes 192 96.0No 8 4
Consumers’ awareness on FRB and its health benefits
Results of the survey showed that majority (176 or 88%) of the native delicacies consumers were not aware of FRB (Figure 1) mainly because of the limited information on fermented rice bran in the Philippines. In fact, FRB has not been used as food ingredient in the county. Consumers who were aware (24 or 12%) about fermented rice bran identified their families, friends, communication media, market outlets, and training and seminars as their sources of information (Table 2).

Consumers’ Willingness to Buy Delicacies with Fermented Rice Bran
90 RICE-BASED BIOSYSTEMS JOURNAL (2022) 10: 87-94
Table 2. Sources of awareness on FRB (n = 24)
Variable Frequency Percent (%)Family 15 62.5Friends 6 25.0Communication media 3 12.5Market outlets 2 8.3Trainings/Seminars 1 4.2
*multiple response
Table 3 shows that respondents who were aware of FRB also knew about a few of its health benefits such as it is a dietary fiber source (66.7%), aids in cholesterol reduction (66.7%), it is an antioxidant (50%), and increases muscle mass (33.3%).
Table 3. Awareness on the health benefits of FRB (n = 6)
Variable Percent (%)Source of dietary fiber 66.7Cholesterol reduction 66.7Antioxidant property 50.0
Increases muscle mass 33.3
*multiple response
Consumers’ perceptions on major native delicacies if added with FRB
Consumers have different perceptions when it comes to incorporating FRB to binagol, moron, suman-latik, and bibingka. Results showed that majority of the respondents perceived it as nutritious or healthy (86.5%) and tasty (63%). On the other hand, 39% of the consumers perceived it as expensive while 22.5% said the product tasted bad. The products’ price was perceived by 40.5% of the consumers to be reasonable considering the health benefits. Moreover, they perceived that the product has a long shelf life (37%) while few (14.5%) viewed it to have a short shelf life. Overall, the respondents manifested
positive perceptions about incorporating FRB to these native delicacies (Table 6), which provides a favorable insight of their WTB should the products be released in the market. As concluded by Lim and An (2020), consumers who have positive attitudes toward well-being products are more likely to purchase them in the future.
Table 4. Respondents’ perceptions of FRB incorporated major native delicacies (n = 200)
Variable Frequency Percent (%)
Nutritious/healthy 173 86.5
Tastes good 126 63.0
Price is comparable with benefits 81 40.5
Expensive 78 39.0
Long shelf life 74 37.0
Tastes bad 45 22.5
Short shelf life 29 14.5
*multiple response
Consumers’ willingness to buy major native delicacies added with FRB
Majority of the consumers (137 or 68.5%) expressed willingness to buy Binagol, Moron, Suman-latik, and Bibingka if added with fermented rice bran while 63 consumers or 31.5% are not willing and hesitant to buy the products (Figure 2). Consumers who were not willing to buy these native delicacies if added with FRB said that they are unsure about the taste (60%), they distrust new foods (26%), and they perceived that the product is expensive (14%) (Table 5). Meanwhile, consumers who were hesitant to purchase native delicacies if added with FRB expressed that they are unsure about the taste (64%) and product appearance (24%) and that they are afraid to eat new food (11%) (Table 6).
Figure 1. Respondent’s awareness on FRB (n = 200).

Consumers’ Willingness to Buy Delicacies with Fermented Rice Bran
RICE-BASED BIOSYSTEMS JOURNAL (2022) 10: 87-94 91
Table 5. Reasons for respondents’ unwillingness to buy native delicacies when incorporated with fermented rice bran (n = 19)
Reason Frequency Percent (%)
Not sure about the taste 56 60.0
I don’t trust new foods 24 26.0Maybe expensive due to added nutrient contents 13 14.0
*multiple response
Table 6. Reasons for respondents’ hesitations to buy native delicacies when incorporated with fermented rice bran (n = 46).
Reason Frequency Percent (%)
I’m not sure how the product taste 158 64.0I can’t imagine how it looks (appearance) 59 24.0I’m afraid to eat food I never had before 28 11.0
Willingness to Pay for Native Delicacies when Incorporated with FRB
In Leyte, the current market price of Binagol is PhP 35 per piece, PhP 14 for Moron, and PhP 10 for suman latik and bibingka. Consumers were also asked about the extent of their willingness to pay for these native delicacies if incorporated with FRB. For Binagol, they were willing to pay PhP 37 per piece, PhP 12 for Moron, PhP 15 for suman latik, and PhP 15 for bibingka (Table 7). Results showed that consumers were willing to pay, in a price difference of PhP 1 - Php 5, for the additional health benefits they can gain from the FRB-enriched binagol, suman-latik, and bibingka. For Moron, consumers are willing to buy its enhanced version if its cost is lower than the current price. Most of the consumers
earn PhP 10,000 and below a month; thus, possibly affecting their hesitations on paying more for these value-added or functional products. This result implied that affordability should be considered in setting product price.
Table 7. Consumers’ willingness to pay for FRB-enriched native delicacies.
Major Native Delicacies(per piece)
(PhP)
Current Price(without FRB)
Consumers Willing toPay Price
(with FRB)
Difference(PhP)
Binagol 35 37 2Moron 14 12 2Suman-latik 10 15 5Bibingka 10 11 1
Table 8 shows the quantity of FRB-enriched native delicacies that they are willing to buy. Consumers were willing to buy four pieces of Binagol, eight of Moron, and six of Suman-latik and Bibingka.
Table 8. Purchase volume for native delicacies if incorporated with FRB.
Major Native Delicacies Quantity/Purchase (Pcs)
Binagol 4
Moron 8
Suman-latik 6
Bibingka 6
Determinants of Consumers’ WTB Native Delicacies when Incorporated with FRB
Table 9 presents the results of the binary logistic regression analysis. It was found that perceived good taste (b=2.444, p=.000) is a positive and highly significant predictor of consumers’ WTB native delicacies if incorporated with FRB. This means that
Figure 2. Consumers’ willingness to buy major native delicacies when incorporated with FRB (n = 200).

Consumers’ Willingness to Buy Delicacies with Fermented Rice Bran
92 RICE-BASED BIOSYSTEMS JOURNAL (2022) 10: 87-94
for every one unit increase on the perceived good taste, the likelihood of the consumers’ WTB increased by a factor of 2.444. This further implies that consumers expect that adding FRB inBinagol, Moron, Suman-latik, and Bibingka should not negatively alter the tastes of these products. Thus, food developers must prioritize the taste buds of the consumers in developing or producing these delicacies. Income (b = 1.041, p = .084) was also found to positively and significantly influence consumers’ WTB at 10% level of significance. The result implies that consumers with higher income are more likely to buy these upgraded native delicacies.
On the other hand, being expensive was a negative and significant (b = -1.010, p = .026) predictor of consumers’ WTB. This indicates that for every one-unit increment in the perceived expensive price, the odds of the consumers’ willingness to buy the product decreased by a factor of 1.01. Consumers expect that adding FRB in Binagol, Moron, Suman-latik, and Bibingka will not considerably increase the price.
Table 9. Regression analysis for factors affecting consumers’ WTB delicacies when incorporated with FRB.
Variable Coefficient Significance
Perceived good taste 2.444 .000***
Perceived expensiveness -1.010 0.026**
Income 1.041 .084*
Constant 17.958 .999
Observations 200
R-squared 0.366***significant at 1% level; **significant at 5% level; *significant at 10% level
ConclusionThe FRB is undeniably a good source of nutrients.
In some countries, it has been used as an adjunct to food products such as bread, cookies, rice cakes, and vegetable pickles for additional health benefits. However, in the Philippines, FRB has not been incorporated in food products for increased product functionality. This study assessed consumers’ willingness to buy FRB-enhanced native delicacies in Leyte.
Despite consumers’ high percentage of unawareness on FRB, they manifested positive perceptions about its incorporation in the major native delicacies in their hometown. They perceived it as being nutritious, healthy, and tasty with reasonable price and a long shelf life. Majority (68.5%) of the consumers were willing to buy FRB-enriched Moron, Binagol, Suman-latik, and Bibingka. Income and perceived good taste are positive and significant predictors of consumers’ willingness to buy these upgraded native delicacies. These results suggest that adding FRB in Moron, Binagol, Suman-latik,
and Bibingka must not negatively alter the taste of these products. The products should also be sold at an affordable price.
RecommendationsProduct developers or processors must pursue
the development of FRB-incorporated major native delicacies as a high percentage of the consumers show their willingness to buy the enhanced products. Marketers should conduct intensive promotional activities such as radio and TV advertisement and distribution of flyers and other IEC materials through social media platforms to increase consumers’ awareness. In developing the product, FRB should not negatively alter the taste of the delicacies because consumers value taste, which would also lead to possible repeat purchases. Affordability should also be considered in setting the prices for these FRB products. Market specialists must position FRB-enriched native delicacies as healthy and functional food products as most consumers identified themselves as health-conscious. For future research, a marketability study on the products should be conducted and a prototype must be introduced to the respondents for actual product attributes evaluation.
Literature CitedAi X, Wu C, Yin T, Zhur O, Liu C, Yan X, Yi C, Liu D, Xiao L,
Li W, Xie B (2021) Antidiabetic function of lactobacillus fermentum MF423-fermented rice bran and its effect on gut microbiota structure in type 2 diabetic mice. Frontiers in Microbiology 12:1427
Alauddina M, Islama J, Shirakawaa H, Kosekib T, Ardiansyahc A, Komaia M (2017) Rice bran as a functional food: An overview of the conversion of rice bran into a superfood/functional food. In Waisundara V, Shiomi N (Eds.). Superfood and Functional Food - An Overview of Their Processing and Utilization. Retrieved from https://www.intechopen.com/chapters/53056 (accessed April 25, 2022)
Ballesteros JF, Abilgos-Ramos RG (2018) Consumer-centric rice-based product development: From idea to shelf. Philippines: Philippine Rice Research Institute
Ballesteros JF, Abilgos-Ramos RG, Amestoso NT (2019) Experts' perspective, consumer perception on rice-based products and market trend on consumer goods for rice-based product idea generation. Rice-based Biosystems Journal 6: 27-39
Bordey FH (2010) The impacts of research on Philippine rice production. University of Illinois at Urbana-Champaign. Retrieved from https://www.ideals.illinois.edu/handle/ 2142/16072 (accessed April 29, 2022)
Cao Y, Zhao J, Jin Z, Tian Y, Zhou X, Long J (2021) Improvement of rice bran modified by extrusion combined with ball milling on the quality of steamed brown rice cake. Journal of Cereal Science 99: 103229
Castillo FG (2018) Consumer buying behavior: the multicultural influence in the philippines. International Journal of Business Management and Technology 2(2): 71-75

Consumers’ Willingness to Buy Delicacies with Fermented Rice Bran
RICE-BASED BIOSYSTEMS JOURNAL (2022) 10: 87-94 93
Christ-Ribeiro A, Chiattoni LM, Mafaldo CR, Badiale-Furlong E, de Souza-Soares LA (2021) Fermented rice-bran by Saccharomyces cerevisiae: nutritious ingredient in the formulation of gluten-free cookies. Food Bioscience 40: 100859
Cranfield J, Henson S, Masakure O (2011) Factors affecting the extent to which consumers incorporate functional ingredients into their diets. Journal of Agricultural Economics 62(2): 375-392
David F (1994) The Roles of husbands and wives in household decision-making. Philippine Sociological Review 42(1/4): 78-93
Department of Agriculture [DA] (2018) The Philippine Rice Industry Roadmap 2030. Philippines: DA
Dhankhar P, Hissar T (2014). Rice milling. IOSR Journal of Engineering 4(5): 3-42
Huang L, Bai L, Gong S (2019) The effects of carrier, benefit, and perceived trust in information channel on functional food purchase intention among Chinese consumers. Food Quality and Preference 81: 103854
Ijarotimi OS, Fakayejo DA, Oluwajuyitan TD (2021) Nutritional characteristics, glycaemic index and blood glucose lowering property of gluten-free composite flour from wheat (triticum aestivum), soybean (glycine max), oat-bran (Avena sativa) and rice-bran (Oryza sativa). Applied Food Research 1(2): 100022.
International Rice Research Institute [IRRI] (n.d). By-products. Retrieved from http://www.knowledgebank.irri.org/step-by-step-production/postharvest/rice-by-products#rice-bran (accessed April 12, 2021)
Issara U, Rawdkuen S (2016) Rice bran: A potential of main ingredient in healthy beverage. International Food Research Journal 23: 6
Kassim NM, Ong FS, Peng OS, Singh T (2014) Purchase behaviour of consumers of functional foods in Malaysia: an analysis of selected demographic variables, attitude and health status. Asia Pacific Management Review 19(1): 81-98
Kim D, Han GD (2014) Fermented rice bran attenuates oxidative stress. In Wheat and Rice in Disease Prevention and Health. Academic Press 467-480
Kotler P, Keller KL (2012) Marketing Management. New Jersey 143
Liba RT, Reyes AR, Alea AJ, Barros HJ, De Rosas PA (2017) Native rice delicacies of Naic, Cavite: An exploratory study of gastronomical past, present and future. Journal of Tourism and Hospitality 6(3): 10-13
Lim HR, An S (2021) Intention to purchase wellbeing food among Korean consumers: an application of the Theory of Planned Behavior. Food Quality and Preference 88: 104101
Link R. (2020) Functional foods: definition, benefits, and uses. Healthline. Retrieved from https://www.healthline.com/nutrition/functional-foods#:~:text=Also%20known%20as%20nutraceuticals%2C%20functional,promote%20proper%20growth%20and%20development (accessed April 25, 2021)
Majava J, Nuottila J, Haapasalo H, Law KM (2014) Customer needs in market-driven product development: product management and R&D standpoints. Technology and Investment 16-25
Mbuya NV, Demombynes G, Piza SF, Adona AJ (2021) Undernutrition in the Philippines: scale, scope, and opportunities for nutrition policy programming. World Bank Publications
Markovina J, Čačić J, Gajdoš Kljusurić J, Kovačić D (2011) Young consumers' perception of functional foods in Croatia. British Food Journal 113(1): 7-16
Mamun AA, Hayat N, Zainol NR (2020) Healthy eating determinants: A study among Malaysian young adults. Foods 9(8): 974
Meniano S (2020) 53K Eastern Visayas kids are stunted: Philippine News Agency. Retrieved from https://www.pna.gov.ph/articles/1107836 (accessed April 25, 2021)
Nagendra Prasad MN, Sanjay KR, Shravya Khatokar M, Vismaya MN, Nanjunda Swamy S (2011) Health benefits of rice bran - A review. J Nutr Food Sci 1:108
Nakamura S, Hara T, Joh T. Kobayashi A, Yamazak A, Kasuga K, Ikeuchi T, Ohtsubo K (2017). Effects of super-hard rice bread blended with black rice bran on amyloid β peptide production and abrupt increase in postprandial blood glucose levels in mice. Bioscience, Biotechnology, and Biochemistry 81(2): 323-334
Nealon NJ, Parker KD, Lahaie P, Ibrahim H, Maurya AK, Raina K, Ryan EP (2019) Bifidobacterium longum-fermented rice bran and rice bran supplementation affects the gut microbiome and metabolome. Beneficial Microbes 10(8): 823-39
Nguyen N, Nguyen HV, Nguyen PT, Tran VT, Nguyen HN, Nguyen T, Cao TK, Nguyen TH (2019) Some key factors affecting consumers' intentions to purchase functional foods: A case study of functional yogurts in Vietnam. Foods 9(1): 24
Ono H, Nishio S, Tsurii J, Kawamoto T, Sonomoto K, Nakayama J (2014) Monitoring of the microbiota profile in nukadoko, a naturally fermented rice bran bed for pickling vegetables. Journal of Bioscience and Bioengineering 118(5): 520-525
Philippine Statistics Authority [PSA] (2019) Highlights of the 2018 list of establishments (preliminary). Retrieved from http://rsso08.psa.gov.ph/sites/default/files/SR-201905-0800-15_2018%20LE.pdf (accessed April 25, 2021)
Philippine Statistics Authority [PSA] (n.d.) Census of population and housing. Retrieved from Philippine Statistics Authority Region 8 - Eastern Visayas http://rsso08.psa.gov.ph/sites/default/files/5_Leyte_Statistical%20Tables.xls (accessed April 25, 2021)
Philippine Statistics Authority [PSA] (2021a) Palay production inches up by 1.4 percent in the fourth quarter of 2020 | Philippine Statistics Authority - Eastern Visayas. Palay Production Inches up by 1.4 Percent in the Fourth Quarter of 2020. Retrieved from rsso08.psa.gov.ph. http://rsso08.psa.gov.ph/article/palay-production-inches-14-percent-

Consumers’ Willingness to Buy Delicacies with Fermented Rice Bran
94 RICE-BASED BIOSYSTEMS JOURNAL (2022) 10: 87-94
fourth-quarter-2020-0#sthash.LtH4Uibx.dpbs (accessed April 25, 2021)
Philippine Statistics Authority [PSA] (2021b) Palay Production in the Philippines. Retrieved from https://psa.gov.ph/sites/default/f iles/Palay%20Production%20in%20the%20Philippines%2C%202018-2020.pdf (accessed April 25, 2021)
Philippine Rice Research Institute [PhilRice] (2018) Healthier forms of rice, rice-based products to help address malnutrition. Retrieved from PhilRice: https://www.philrice.gov.ph/healthier-forms-rice-rice-based-products-help-address-malnutrition (accessed April 13, 2021)
Phuah KT, Rezai G, Mohamed Z, Shamsudin MN (2015) Socio-demographic profile in purchasing natural and synthetic functional foods in Malaysia. International Journal of Social Science and Humanity. 5(7): 604-607
Sapwarobol S, Saphyakhajorn W, Astina J (2021) Biological functions and activities of rice bran as a functional
ingredient: A review. Nutrition and Metabolic Insights 14: 117863882110585
Seyoum Y, Humblot C, Baxter BA, Nealon NJ, Weber AM, Ryan EP (2022) Metabolomics of rice bran differentially impacted by fermentation with six probiotics demonstrates key nutrient changes for enhancing gut health. Frontiers in Nutrition 8:795334.doi:10.3389/fnnt.2021.795334
Sharif MK, Butt MS, Anjum FM, Khan SH (2014) Rice bran: A novel functional ingredient. Critical Reviews in Food Science and Nutrition 54(6): 807-816
SunStar (2015) Bahandi trade fair featuring Leyte's delectable delights. Retrieved from https://www.sunstar.com.ph/article/28836/Sports/-Bahandi-trade-fairfeaturing-Leytes-delectable-delights (accessed May 26, 2021)
Trinidad PT, Malilin AC, Sagum RS, Encabo RR (2010) Glycemic index of commonly consumed carbohydrate foods in the Philippines. Journal of Functional Foods 2(4): 271-274
Vella MN, Stratton LM Sheeshka J, Duncan AM (2014) Functional food awareness and perceptions in relation to information sources in older adults. Nutrition Journal 13(1) 1-2

RICE-BASED BIOSYSTEMS JOURNAL (2022) 10: 95-100 95
ENHANCEMENT OF RICE SEEDLING GROWTH BY PLANT GROWTH-PROMOTING
STREPTOMYCES MUTABILISJayvee A. Cruz1*, Josef Mikhail R. Bautista1, and Erlinda S Paterno2
1Philippine Rice Research Institute, Science of Muñoz, Nueva Ecija2University of the Philippines Los Baños, College, Laguna
*Corresponding Author: [email protected]
Abstract Poor seedling growth limits the establishment and production of rice in the upland and rainfed areas in the
Philippines due to moisture loss. This study evaluated the effectiveness of Streptomyces mutabilis (S. mutabilis) on improving rice seedling growth of NSIC Rc 160, which include shoot and root length and seedling vigor. S. mutabilis is a gram-positive filamentous actinomycete, which was previously proven to improve growth and yield of rice through production of plant growth-promoting compounds such indole-3-acetic acid (IAA) and 1-aminocyclopropoane carboxylic acid (ACC)- deaminase. Results showed that S. mutabilis inoculant significantly increased root and shoot growth by 43.4 and 62.5%, respectively, relative to uninoculated control. Long root hairs were also evident in the inoculated treatment. S. mutabilis inoculation significantly increased seedling vigor index by 38.4% compared with uninoculated control. The effect of inoculation on the growth of rice seedling roots was evident starting at 4 - 7 days after sowing (DAS). The results showed the effectiveness of S. mutabilis in enhancing rice seedling growth. However, further evaluation of its effectiveness under field conditions is needed.
Keywords: Bioinoculant, Plant PGPB, Seedling Growth, Seedling Vigor, Streptomyces mutabilis
IntroductionRice production in Philippine upland areas suffers
from limited water supply. According to Mohanty et al. (2013), these areas are prone to drought because of the present climatic conditions. Consequently, upland rice yield in the country is low, which is approximately 2 t ha-1 (Cruz et al., 2015).
Poor crop establishment in drought-stress affected areas is mainly due to moisture loss. Soil evaporation leads to a large amount of moisture loss where 90 - 95% occurs in .5 - 1.0 mm soil layer, which is the optimum depth for crop sowing (Ritchie and Johnson, 1990; Tian et al., 2014). Rapid seed germination and good seedling vigor is vital to the crop’s survival and productivity by efficiently utilizing the water content of the soil before moisture loss occurs. Fast and uniform emergence of seed plays an important role as basis of crop establishment and potential yield (Orchard, 1977). Seed vigor and viability are important components influencing the seedling establishment, crop growth, and productivity (Sawan et al., 2011).
Plant Growth-promoting Bacteria (PGPB) as biofertilizers is a significant part of the integrated plant nutrient management systems, particularly in rainfed areas, where farmers rely either on “no-cost”
or “low-cost” inputs (Desai et al., 2016). PGPB are usually defined as microorganisms that can grow in, on, or around plant tissues stimulating plant growth by variety of mechanisms including nitrogen-fixation, phosphate solubilization, sequestering iron, modulation of phytohormone levels, IAA, ACC-deaminase, and siderophore production (Vessey, 2003; Glick, 2012). Worldwide, the agro-industry’s efforts in searching for an effective microorganism for plant growth-promotion has surged in the recent years, and has shown great interest in actinomycete as a source of agro-active compounds and of biocontrol tools (Behal, 2000; Tanaka and Omura, 1993).
Actinomycetes are gram-positive aerobic bacteria showing fungi-like filamentous growth (Jeffrey, 2008). They are one of the major components of the microbial population present in soil, interacting diversely with higher plants (Franco-Correa et al., 2010; Muthu et al., 2013). Recently, these filamentous bacteria were placed in a new niche as potential PGPB. They produced IAA, ACC-deaminase, siderophore, and can solubilized phosphate in vitro (Cruz et al., 2014). PGPB produce IAA in the presence of seed exudates, which could trigger faster seed germination (Mia et al., 2012). In addition, these bacterial species have been found to produce gibberellic acid (GA3), a valuable member of the gibberellins family that acts as a natural plant growth hormone, which is responsible
RESEARCH NOTE

Enhancement of Rice Seedling Growth by Streptomyces Mutabilis
96 RICE-BASED BIOSYSTEMS JOURNAL (2022) 10: 95-100
each treatment (with three replications) and grown and incubated at room temperature. Moisture was maintained by regularly watering the seeds with sterilized AGS broth (about 5 ml per Petri dish) using a pipettor. The number of germinated seeds were recorded everyday, starting at 3 days after sowing (DAS). The seed has already germinated when the emerged radicle is ≥ 2 mm. Percent seed germination was calculated using the formula:
The root and shoot length of individual seedlings were measured after 7 days to determine the vigor index using this formula (Abdul Baki and Anderson, 1973):
Experimental design and statistical analysis
The experiment was arranged in a complete randomized design while data were analyzed using statistical package for the social sciences (SPSS) software version 21.
Results and DiscussionEffectiveness of actinomycete inoculant on seedling growth and seedling vigor
The effect of S. mutabilis inoculation on seedling growth and vigor was evaluated. The S. mutabilis inoculation on root and shoot length and seedling vigor index were significant at P < 0.05. It also significantly increased the root and shoot growth at 7 DAS. Inoculated seedlings exhibited significantly better root (57.8 mm) and shoot (61.6 mm) growth than the control. Root and shoot length were increased by 43% and 62.5%, respectively (Figure 1). A higher vigor index of 901.06 was obtained in inoculated seedlings than the uninoculated control with 555.06. The inoculation increased seedling vigor index by 38.4% (Figure 2). Rapid germination serves a vital role on seed’s survival in the field and its potential yield. High vigor seeds is one of the prerequisites for better establishment of seedling in the field (Mia et al., 2012). Vigorous rice seedlings will have a higher chance of surviving under drought-prone rainfed ecosystem. Rapid early growth reduces water loss by lessening evaporation and transpiration loss through early canopy closure; therefore, conserving soil moisture for plant utilization (Kumar et al., 2009). Cruz et al. (2020) reported that the potential of S. mutabilis in improving crop growth during early vegetative stage in a rainfed upland condition was determined through quantifying its effect on seed germination, seedling
in controlling several development processes (Patil and Patil, 2012). There is a great potential that certain strains of actinomycete such as S. mutabilis may improve seedling growth and vigor. Suralta et. al (2017) reported that shoot length of inoculated seeds was increased by 28% over uninoculated control at 5 days after inoculation. Similarly, inoculation with S. mutabilis increased seminal root length of NSIC Rc 192 by 35% relative to uninoculated control. Root hair length was also promoted due to S. mutabilis at 3 days after germination relative to uninoculated control. S. mutabilis is capable of producing growth-promoting enzymes, which are helpful in improving seedling and root growth. In this study, the effect of S. mutabilis on seedling growth and seedling vigor of NSIC Rc 160 was evaluated.
Materials and MethodsThe study was conducted in 2017 at the Philippine
Rice Research Institute Central Experiment Station (PhilRice CES) under laboratory conditions. It was composed of two treatments: (1) uninoculated with argine-glycersol-salt or AGS broth alone and (2) inoculated with AGS broth and S. mutabilis. The AGS broth consists of the following: arginine monohydrochloride, 1.0 g/L; Glycerol, 10 ml/L; K2HPO4, 1.0 g/L; NaCl, 1.0 g/L; AGS stock solution, 1.0 ml/L, and CaCO3, 1.0 g/L (El-Nakeeb and Lechevalier, 1962).
Actinomycete used
The S. mutabilis used as actinomycete was obtained in PhilRice CES. It has been previously proven to produce plant growth-promoting compounds and promote growth of rice under growth room condition. Streptomyces mutabilis are capable of producing ACC-deaminase, IAA, and phosphatase based on biochemical characterization (Cruz et al., 2014; Cruz et al., 2015).
Inoculant preparation and inoculation
The carrier used for inoculant preparation is a mixture of soil and charcoal. The carrier was sterilized for 1 h in an autoclave at 121°C for 3 consecutive days. S. mutabilis culture was grown in AGS broth for 7 days under room temperature. S. mutabilis culture broth (22 ml)was aseptically transferred to 100 g of sterilized soil-based carrier, then afterwards incubated for 7 days.
Five grams of inoculant was suspended in 100 ml sterilized distilled water. Surface sterilized seeds were pre-soaked in inoculant suspension for 30 min.
Vigor index test
Twenty-five surface sterilized seeds were sown in sterile Petri plate with moist filter paper for

Enhancement of Rice Seedling Growth by Streptomyces Mutabilis
RICE-BASED BIOSYSTEMS JOURNAL (2022) 10: 95-100 97
vigor, and root growth. In the laboratory, NSIC Rc 122, 222, 240, and 300 were presoaked in S. mutabilis inoculant solution and sown in a Petri dish with moist paper. All varieties except NSIC Rc 300 showed greater shoot length, shoot dry weight, and seedling vigor with S. mutabilis inoculation relative to the uninoculated counterparts. One of the hypotheses is the varietal response of different rice varieties to PGPB inoculation. The study of Glick (2005) showed that enhanced rooting can also be attributed to the ability of the isolates to produce IAA and ACC-deaminase. ACC is an immediate precursor of ethylene in higher plants while the ACC-deaminase containing rhizobacteria can increase root growth by reducing endogenous ACC levels.
The significant improvement of shoot and root growth of rice seedlings was probably caused by the production of bacterial IAA. The actinomycete used in this experiment was previously found to produce 680 ppm bacterial IAA (Cruz et al., 2014). In the experiment of Susilowati et al. (2018), there was a 6.7% increase in plant height by isolate Azm 5.7.5.1 with an IAA production capability of 12.18 ppm compared with no bacterial inoculation. Dry weight analysis of rice grain also showed that there was a
significant effect of IAA-producing bacteria. IAA is a known phytohormone of the auxin class that plays a fundamental role in formation and elongation of roots and root hairs and initiation and emergence of lateral roots (Aziz et al., 2015). The production of IAA by actinomycete had significantly increased seedling vigor. These findings accorded with the results obtained by Venkatachalam et al. (2010), in which Streptomyces gibosonni culture filtrate increased the corn seedling shoot and root length. Likewise, Streptomyces coelicolor improved seedling vigor of Triticum eastivum under drought stress, as reported by Yandigeri et al. (2012). Furthermore, Streptomyces fumanus increased the seed vigor of wheat and soybeans by 1.5 - 2 times (Doolotkeldieva et al., 2015). The increased rate of root growth provides seedling a greater opportunity for water absorption before moisture loss occurs. The bacterial isolates has an effect on the growth of rice seedlings. The percentage increase and significant difference compared with the control demonstrates the effects of PGPB as they produce IAA (Francis et al., 2010), an auxin that modifies plant morphology, and ACC-deaminase that cleaves ACC, which is a direct precursor of the hormone ethylene that decreases shoot and root length under drought stress (Glick, 2005).
Figure 1. Shoot and root growth affected by S. mutabilis inoculation at 7 DAS.
Figure 2. Improved seedling vigor index of inoculated seedlings at 7 DAS.
Shoot length n=25 Root length
70
60
50
40
30
20
10
0
Leng
th (m
m)
Uninoculated Inoculated
Uninoculated Inoculated
1000
900
800
700
600
500
400
300
200
100
0
Vig
or in
dex

Enhancement of Rice Seedling Growth by Streptomyces Mutabilis
98 RICE-BASED BIOSYSTEMS JOURNAL (2022) 10: 95-100
Bacteria can survive under stress conditions due to the production of exopolysaccharide (EPS), which protects microorganisms from water stress by enhancing water retention and regulating the diffusion of organic carbon sources. It also helps the microorganisms to irreversibly attach and colonize the roots through the involvement of a network of fibrillar material that permanently connects the bacteria to the roots surface (Bashan et al., 2004). Inoculation of plants with drought-tolerant ACC-deaminase can increase drought tolerance of plants growing in arid, or semiarid areas due to the native beneficial microorganisms (Cruz, 2015).
The growth and development of seedling roots were also observed between 3 and 7 DAS. Actinomycete inoculation caused significant improvement in the root development of rice seedlings as compared with the uninoculated control (Figures 3-4). At 4 and 7 DAS, actinomycete inoculation significantly increased the root growth of rice seedlings by 32.3% and 43.8%, respectively.
Improved root hair development was also observed in inoculated roots, which can be attributed to bacterial IAA production (Figure 5). Root hair is an important structure of root for crops because it constitutes 77% of the root surface area (Jills et al., 2000). A diverse group of gram-positive bacteria including Arthrobacter, Micrococcus, Bacillus, Rhodococcus, Mycobacterium, Microbacterium, Streptomyces, and Corynebacterium species are
capable of producing IAA that perhaps stimulate nutrient uptake and root proliferation (Francis et al., 2010). The production of growth-promoting substances such as plant hormones is part of the metabolism of various bacteria associated with plants that causes modifications in the morphology of roots. It also influences nutrient and water absorption, and consequently promotes plant growth (Bashan and Holgiun, 1997).
In the study of Suralta et. al (2017), pre-germination inoculation of NSIC Rc 192 seeds by S. mutabilis significantly increased the shoot and seminal root length and root hair lengths relative to the uninoculated control. Similarly, inoculation of S. mutabilis generally had longer total root length under drought – regardless of the timing of inoculations – relative to the uninoculated control. Plants were sampled at 40 DAS; 14 days of well-watered and then 26 days of progressive drought stress conditions.
Further studies are required to evaluate the ability of S. mutabilis regarding its survival ability under different conditions from seed treatment up to maturity under greenhouse and field conditions. Its survival could be evaluated using molecular technique such as gfp-tagging. Fluorescent microscopy analysis could also be conducted to evaluate the survival of GFP-tagged S. mutabilis treating rice as the test crop. The results will provide data on the S. mutabilis ability to colonize the root tissues of rice indicating its capability to survive when used as a seed treatment.
Figure 3. Rice seedling growth and development from 3 to 7 DAS: (a) uninoculated control and (b) inoculated.

Enhancement of Rice Seedling Growth by Streptomyces Mutabilis
RICE-BASED BIOSYSTEMS JOURNAL (2022) 10: 95-100 99
Understanding the colonization of potential PGPB and its survival must be given importance in formulating an inoculant. Green fluorescence protein also provides a convenient tool to assess the survival rates of potential PGPB or bio-inoculant when applied to the crops. Survival rate of bacteria is very important as it will affect and influence the crop growth especially in its critical stages.
ConclusionStreptomyces mutabilis inoculation had potentially
increased seedling growth and development, as well as significantly improved seedling vigor of NSIC Rc 160 at 3 - 7 DAS through increased root and shoot
growth, probably caused by production of growth-promoting compounds such as bacterial IAA. In the future, effectiveness of S. mutabilis under field conditions could also be explored, and evaluate its survival using molecular technique such as gfp-tagging. This contributes to the establishment of S. mutabilis as a potential PGPB for bio-inoculant application.
AcknowledgmentThe authors would like to thank the Philippine
Rice Research Institute for funding this research.
Figure 5. Effect of actinomycete inoculation to the initiation of root hairs at 3 DAS, 5 mm from origin of root under 400X magnification: (a) uninoculated (b) inoculated.
Figure 4. Growth and development of rice seedling roots from 3 to 7 DAS.
3 DAS 4 DAS 5 DAS 6 DAS 7 DAS
Days after sowing (DAS)
70.0
60.0
50.0
40.0
30.0
20.0
10.0
0.0
Roo
t len
gth
(mm
)
13.2 a
10.5 a
22.2 b
29.3 a
43.2 a
32.3 b
47.7 a
37.0 b
57.8 a
40.3 b
Uninoculated Inoculated

Enhancement of Rice Seedling Growth by Streptomyces Mutabilis
100 RICE-BASED BIOSYSTEMS JOURNAL (2022) 10: 95-100
Literature CitedAbdul Baki AA, Anderson JD (1973) Vigor determination in
soybean seed by multiple criteria. Crop Science 13(6): 630-633
Aziz K, Nawaz M, Nazir J, Anjum Aaa, Yaqub T, Ahmad Mud, Rehman M U, Aziz G, Khan M (2015) Isolation, characterization, and effect of auxin producing bacteria on growth of Triticum aestivum. Journal of Animal and Plant Sciences 25(4): 1003-1007
Bashan Y, Holguin G (1998) Proposal for the division of plant growth-promoting rhizobacteria into two classifications: Biocontrol-plant growth promoting bacteria (Biocontrol-PGPB) and Plant Growth Promoting Bacteria. Soil Biol. Biochem. 30: 1225-1228
Behal V (2000) Bioactive products of Streptomyces. Advances in Applied Microbiology 47: 113-157
Cruz JA, Evangelista EV, Agpaoa AR, Suralta RR (2020) Variations in growth responses of rice varieties to inoculation with plant growth-promoting actinomycete. Phil. Sci. Letters (PSL) 13 (2):124-129
Cruz JA, Paterno ES (2014) Isolation and screening of Actinomycetes for its growth promoting activities. Asia Life Sciences 23(2): 413-427
Cruz JA, Delfin EF, Paterno ES (2015) Promotion of upland rice growth by actinomycetes under growth room condition. Asia Life Sciences 24(1): 87-94
Desai S, Kumar GP, Amalraj LD, Bagyaraj DJ, Ashwin R (2016) Exploiting PGPR and AMF biodiversity for plant health management. Microbial Inoculants in Sustainable Agricultural Productivity 1(1)
Doolotkeldieva T, Bobusheva S, Konurbaeva, M (2015) Effects of Streptomyces biofertilizer to soil fertility and rhizosphere’s functional biodiversity of agricultural plants. Advances in Microbiology 5(7): 555-571
Susilowati DN, Riyanti EI, Setyowati M, Mulya K (2018) Indole-3-acetic acid producing bacteria and its application on the growth of rice. In AIP Conference Proceedings 2002(1): 020016
El-Nakeeb MA, Lechevalier HA (1962) Selective isolation of aerobic actinomycetes. Appl. Environ. Microbiol. 11: 75-77
Franco-Correa M, Quintana A, Duque C, Suarez C, Rodríguez MX, Barea J (2010) Evaluation of actinomycete strains for key traits related with plant growth promotion and mycorrhiza helping activities. Applied Soil Ecology 45(3): 209-217
Glick BR (2012) Plant growth-promoting bacteria: Mechanisms and applications. Scientifica 2012: 1-15
Jeffrey LS (2008) Isolation, characterization, and identification of actinomycetes from agriculture soils at Semongok, Sarawak. African Journal of Biotechnology 7(20): 3697-3702
Jills SP, Alison CC, Liam D, Keith R, Claire SG (2000) Genetic interactions during root hair morphogenesis in Arabidopsis. Plant Cell 12: 1961-1974
Kumar A, Verulkar S, Dixit S, Chauhan B, Bernier J, Venuprasad R, Shrivastava M (2009) Yield and yield-attributing traits of rice (Oryza sativa L.) under lowland drought and suitability of early vigor as a selection criterion. Field Crops Research 114(1): 99-107
Mia MAB, Shamsuddin ZH, Mahmood M (2012) Effects of rhizobia and plant growth promoting bacteria inoculation on germination and seedling vigor of lowland rice. African Journal of Biotechnology 11(16): 3758-3765
Mohanty S, Wassmann R, Nelson A, Moya P, Jagadish SVK (2013) Rice and climate change: Significance for food security and vulnerability. IRRI Discussion Paper Series No. 49. Los Baños, Philippines: International Rice Research Institute
Orchard TJ (1977) Estimating the parameters of seedling emergence. Seed Science and Technology 5(1): 61-69
Patil GN, Patil RV (2012) Isolation and characterization of actinomycetes producing gibberellic acid. International Journal of Science and Research 3(9): 2319-7064
Muthu RM, Subbaiya R, Balasubramanian M, Ponmurugan P, Selvam M (2013) Isolation and identification of actinomycetes Isoptericola variabilis from Cauvery river soil sample. International Journal of Current Microbiology and Applied Sciences 2(6): 236-245
Sawan ZM, Fahmy AH, Yousef SE (2011) Effect of potassium, zinc, and phosphorus on seed yield, seed viability, and seedling vigor of cotton (Gossypium barbadense L.). Archives of Agronomy and Soil Science 57(1): 75-90
Suralta RR, Batungbakal MYT, Bello JCT, Caparas LM, Lagunilla VH, Lucas KMD, Patungan JU, Siping AJO, Cruz JA, Cabral MCJ, and Niones JM (2017) An enhanced root system developmental responses to drought by inoculation of rhizobacteria (Streptomyces mutabilis) contributed to the improvement of growth in rice. Philippine Journal of Science 147(1): 115-124.
Tanaka Y, Omura S (1993) Agroactive compounds of microbial origin. Annual Reviews of Microbiology 47: 57-87
Tian Y, Guan B, Zhou D, Yu J, Li G, Lou Y (2014) Responses of seed germination, seedling growth, and seed yield traits to seed pretreatment in maize (Zea mays L.). The Scientific World Journal 1: 1-8. doi:10.1155/2014/834630
Venkatachalam P, Ronald J, Sambath K ( 2010) Effect of soil Streptomyces on seed germination. International Journal of Pharma and Bio Science 1(4): 145-155
Vessey JK (2003) Plant growth promoting rhizobacteria as biofertilizers. Plant and Soil 255: 571-586
Yandigeri MS, Meena KK, Singh D, Malviya N, Singh DP, Solanki MK, Yadav AK, Arora DK (2012) Drought-tolerant endophytic actinobacteria promote growth of wheat (Triticum aestivum) under water stress conditions. Plant Growth Regulation 68(3): 411-420

RICE-BASED BIOSYSTEMS JOURNAL (2022) 10: 101-105 101
EVALUATION OF RICE ACCESSIONS FOR BROWN PLANTHOPPER (NILAPARVATA LUGENS STÅL) AND
GREEN LEAFHOPPER (NEPHOTETTIX VIRESCENS DISTANT) RESISTANCE
Xavier Greg I. Caguiat1, Mary Ann M. Rañeses1, Danny O. Alfonso2, Gilely DC. Santiago1
1Philippine Rice Research Institute, Science City of Muñoz, Nueva Ecija, 2Nueva Ecija University of Science and Technology, Cabanatuan City, Nueva Ecija,
Corresponding Author: [email protected]; [email protected]
Abstract The vast reservoir of rice accessions in the genebank is a source of genetic resistance that could help
accelerate breeding for insect pests-resistant varieties. This study evaluated rice accessions for brown planthopper (BPH) and green leafhopper (GLH). There were 2,055 traditional rice accessions evaluated from the Philippine Rice Research Institute (PhilRice) Genebank for BPH and 2,049 accessions for GLH. Accessions were evaluated 7 days after infestation. Thirty-two rice accessions showed moderately resistant to GLH while 843 had intermediate reaction. On the other hand, 66 showed resistance while 892 had intermediate reaction to BPH. Three rice accessions: Bandera, Saigon, and Luding-luding showed moderate resistance against GLH and BPH. Accessions that exhibited resistance to one or more insect pests were recommended for further validation. These can be utilized as source of resistance for the development of new rice varieties.
Keywords: Accessions, Brown Planthopper, Evaluation, Genebank, Green Leafhopper, Resistance
IntroductionRice (Oryza sativa L.) is one of the world’s most
important crops providing a stable food for nearly half of the global population. Despite being the most cultivated crops and used in experiments, profound studies on the effect of environmental stresses on rice are still necessary. These biotic and abiotic stresses influence the plant growth, seed quality, crop yield, and agriculture production (Agrawal et al., 2006, 2009; Agrawal and Rakwal, 2011; Jorrín et al., 2007). Plants are constantly exposed to biotic stress, which causes changes in plant’s metabolism involving physiological damages that lead to reduction of its productivity.
Biotic stresses in plants are caused by pests, parasites, and pathogens, which are known since ancient times. Biotic stresses include insect pests, fungus, bacteria, viruses, and herbicide toxicity. Dupo and Barrion (2009) stated that a small number of planthoppers and leafhoppers are economically important pests in rice. Under severe infestations, planthoppers and leafhoppers often cause hopperburn – a complex wound response that results in gross discoloration and dehydration of the rice plant (Backus et al., 2005). In addition, a number of cicindelid leafhoppers, which rarely reach high densities in the field, are also economically important virus vectors. For example, the GLP (Nephotettix virescens, Distant) and BPH (Nilaparvata lugens Stål)
are insect pests of important concern because they spread viral diseases in the rice fields. Nymphs and adults infest the rice crop at all stages of plant growth (Abo and Sy, 1997). Green leafhoppers are common in rainfed and irrigated wetland environments. They are not prevalent in upland rice. Nymphs and adults feed on the dorsal surface of the leaf blades rather than on the ventral surface. They prefer to feed on the lateral leaves rather than on the leaf sheaths and middle leaves. They mostly target rice plants that have been fertilized with large amount of nitrogen. The rice tungro disease usually results in stunted plants, reduced vigor, reduced number of productive tillers, and withering or complete plant drying. Tungro is a vital disease of rice because of its damages, which causes an explosion if it occurs in the early vegetative stage (Hasanuddin, 2002).
BPH is a destructive and widespread insect pest in the rice fields in Asia. It mainly feeds on the stems by sucking assimilates from the phloem of rice plants. Feeding by a large number of BPH may result in drying of the leaves and wilting of the tillers (Yang et al., 2002).
Various approaches had been developed to combat hopper pests. Use of resistant rice cultivars has been recognized as the most practical and economic method in pest control as part of Integrated Pest Management (Correa-Victoria et al., 1994; Yang et al., 2002; Sarwar 2012).
RESEARCH NOTE

Evaluation of Rice Accessions for Pest Resistance
102 RICE-BASED BIOSYSTEMS JOURNAL (2022) 10: 101-105
Genebank contains rice accession with untapped genetic diversity and wealth of valuable genes that could be resistant to various diseases, which can be used as donor in breeding programs. The role of accessions in the improvement of cultivated plants has been well recognized (Sarma et al., 2003; Sarwar 2012; Preetha 2017). Collections are optimized when they are properly evaluated and their attributes identified. In the broad sense and in the context of genetic resources, evaluation is the description of the material in a collection. It covers receipt of the new samples by the curator and growing these for seed increase, characterization and preliminary evaluation; further or detailed evaluation; and documentation (Sarwar 2012; Preetha 2017). Hence, there is a need to evaluate the vast accessions and determine resistant ones that could be used in the breeding program.
Materials and MethodsPlant materials
There were 2,055 traditional rice accessions evaluated from the Philippine Rice Research Institute (PhilRice) Genebank for BPH resistance while 2,049 accessions for green leafhopper (GLH). The evaluation was done in the screenhouse located at PhilRice, Maligaya, Science City of Muñoz, Nueva Ecija at N 15.067 ,̊ 120.8903. The evaluation of rice accessions was done following the protocol and evaluation scale of International Rice Research Institute (2002) under the Standard Evaluation System (SES).
Hopper culture
Test insects were collected from the field and purified from the progeny of a single female. Twenty percent of the colony was used for sustaining the mass production while the remaining underwent various tests. Culture was intensified every after 10 - 12 generations (every 1 and a half to 2 years of continuous rearing by introducing wild population into the pure culture, following the standard procedure for purifying field collected insects). Host plants can either be TN1/IR 8 or any local variety susceptible to the hoppers in the locality. The SES for rice was used to rate insect damage with rating scales of 1 - 9 (1 - very slight damage, 9 - severe damage).
Screening of test entries to BPH
There were 2,055 traditional rice accessions evaluated for BPH resistance in the screenhouse. A resistant (TKM6) and susceptible (TN1) check in a 61.5 x 61.5 x 31.5 cm (L x W x H) compartment seed box were setup. A rate of 3 - 5 nymphs was introduced to a 7-day old seedling in a seed box and kept half-submerged in water to keep the seedlings growing in a humid environment for the insects. Resistance was
rated when the susceptible check is completely wilted or killed. The SES for rice was used to rate the insect damage with rating scales of 1 - 9 (1 - very slight damage, 9 - severe damage).
Screening of test entries to GLH
The 2,049 test materials were evaluated for GLH resistance in the screenhouse. These were directly sown in a 61.5 x 61.5 x 31.5 cm (L x W x H) compartment seed box filled with garden soil. The two middle rows were assigned to susceptible (TN1) and resistant (TKM6) checks. Plant at one leaf stage (7 days after sowing) was uniformly infested with second or third instar non-viruliferous nymphs per seedling. To maintain high humidity, the seed boxes were kept half-submerged in water. Resistance was rated 10 days after infestationor when the susceptible check is completely killed. The SES for rice was used to rate the insect damage with rating scales of 1 - 9 (1- very slight damage, 9 - severe damage).
ResultsThere were 2,055 accessions evaluated for BPH
resistance, which were gathered from different provinces in the Philippines. Sixty-six accessions (3%) showed moderately resistant reaction with mild symptoms while 892 accessions (43%) were intermediate. Accession totaling 758 (37%) were found moderately susceptible while 339 (16%) were susceptible (Table 1).
On the other hand, 2,049 rice accessions were evaluated for GLH. Results showed that 41% (843) and 2% (32) of the rice accessions were found to be moderately resistant and intermediate, respectively (Table 2). Three rice accessions showed moderate resistance for both hoppers: Saigon (PRRI000039), Bandera (PRRI000040), and Luding-luding (PRRI000113). Saigon and Bandera were collected from Nueva Ecija while Luding-luding was collected from Ilocos Sur (Table 3).
DiscussionGenetics is one of the main reasons for the
different reaction of these rice accessions towards BPH and GLH. Some contain resistant genes to BPH, GLH, or both. This resistance could be explained with the presence of one or more alleles conferring resistance (Brar et al., 2009). The identified number of donors for resistance was used in breeding varieties resistant to hoppers. Resistance genetics against planthoppers has been studied with several resistance genes identified from traditional landraces. Twenty-one resistant genes have been identified for BPH while 14 for GLH.

Evaluation of Rice Accessions for Pest Resistance
RICE-BASED BIOSYSTEMS JOURNAL (2022) 10: 101-105 103
Table 1. Summary of rice accessions evaluation data on BPH and GLH resistance.
Insect Accessions Screened
Reaction
MR I MS S
No. % No. % No. % No. %
BPH 2,055 66 3 892 43 758 37 339 16
GLH 2,049 32 2 843 41 830 41 344 17*MR - moderately resistant, *I - intermediate, *MS - moderately resistant, *S - susceptible
In an earlier study of Chelliah (2008), four major genes were identified: Bph 1, bph 2, Bph 3, and bph 4, which have controlling resistance to BPH. There are indications that Bph 3 and bph 4 are either allelic or closely linked while seven resistance genes, Glh 1, Glh 2, Glh 3, glh 4, Glh 5, Glh 6, and Glh 7, were identified for GLH resistance. Moderately resistant varieties allow the sub-economic pest population to remain on the plants to serve as hosts for natural enemies. The reduction in the BPH population on resistant and moderately resistant varieties improves the natural enemy-to-pest ratio in favor of biological control (Chaudhary, 1984). According to Kogan (1982), insect resistance – an ability that could be passed on to the next generation, inhibits the growth of insect populations or enables recovery from injury caused by populations that were not inhibited to grow. Inhibition of population growth generally derives from the biochemical and morphological characteristics of a plant. It affects the behavior or the metabolism of insects to reduce the damage. Resistant varieties are compatible with biological control agents (predators,
parasites, and pathogens) on which they have no direct adverse effect. Furthermore, spiders as predators are more efficient when preying on BPH in a moderately resistant than on a susceptible variety. The increased efficiency of predator can be associated with the pests’ restless behavior. Restlessness increases the pest’s exposure to natural enemies and reduces its vigor.
Rice is often attacked by large numbers of insects. Insect pests, plant hoppers, stem borers, and gall midges are known to be the most disastrous rice pests (Heong and Hardy et. al., 2009). BPH and GLH are considered as serious threats to rice production. The use of resistant varieties is the most effective method in combating insect pests as pest resistance is inherited in plants. This strategy does not also add to production cost and does not impair the quality of the environment.
In this study, 2,055 traditional rice accessions were evaluated for BPH resistance. Sixty-six varieties showed moderate resistance, 892 intermediate, 758 moderately susceptible, and 339 susceptible (varieties were identified accounting for 3, 43, 37 and 16% of the total varieties, respectively). These results were comparable to the output of Bangladesh Rice Research Institute (BRRI), which screened 1,767 rice cultivars for BPH resistance. Researchers found that one of the cultivars was highly resistant; 86, moderately resistant; and 1,680, susceptible and highly susceptible (Ali et al., 2012). Similar to the study of Dhawande et al. (2018), which screened 1,003
Table 2. Representative rice accessions with moderate resistance against BPH and GLH.
BPH GLH
Accession No. Accession Name Accession No. Accession Name
PRRI000039 Saigon PRRI000001 Hinamog
PRRI000040 Bandera PRRI000002 Mangasa
PRRI000041 Bakikihon PRRI000014 Garaygay
PRRI000087 Amparing PRRI000020 Sanjuan
PRRI000101 Gin-awa PRRI000039 Saigon
PRRI000107 Irequin PRRI000040 Bandera
PRRI000112 Lampung PRRI000068 Alaminos
PRRI000113 Luding-luding PRRI000069 Alonor
PRRI000129 Saba PRRI000113 Luding-luding
PRRI000165 Binalasbas
Table 3. List of rice accessions with moderate resistance against BPH and GLH.
Accession No. Accession Name Province
PRRI000039
PRRI000040
PRRI000113
Saigon
Bandera
Luding-luding
Nueva Ecija
Nueva Ecija
Ilocos Sur

Evaluation of Rice Accessions for Pest Resistance
104 RICE-BASED BIOSYSTEMS JOURNAL (2022) 10: 101-105
germplasm accessions, 37 exhibited a damage score ranging from 0 to 5. They found highly resistant (2), resistant (21), and moderately resistant cultivars (14) to BPH, while the remaining 966 accessions were found susceptible with a damage score of 5 - 9. Meanwhile, Akanksha et al. (2017) evaluated 920 rice germplasm accessions, in which 12 accessions were resistant while 23 accessions were moderately resistant and others were susceptible to BPH. To identify new sources of resistance, BPH screening for resistance is certainly a continuous process. Study results show that of the 2,049 rice germplasm evaluated for GLH resistance, 32 rice varieties were moderately resistant; 843, intermediate; 830, moderately susceptible; and 344 were susceptible. Varieties were identified accounting for 2%, 41%, 41%, and 17% of the total varieties, respectively. Venkatesh et al. (2019) also found that among the 74 rice landraces screened for GLH and BPH, 27 were GLH resistant while 15 were moderately resistant to BPH with a score of 3 - 5. The resistant checks Ptb-33 and TN1 were used as susceptible checks for GLH and BPH. Karthi Samba, Panamara Samba, and Palkachaka landraces from Coimbatore, Tamil Nadu, India showed resistant to moderately resistant towards the two-hopper species. This result was also evaluated in this study, in which three rice accessions showed moderately resistant to BPH and GLH: Saigon (PRRI000039), Bandera (PRRI000040), and Luding-luding (PRRI000113). This indicates the variation in terms of resistance level of the entries of species belonging to the same family and with similar feeding habit. Vanaja et al. (2010) mentioned that Uma was a resistant landrace to BPH; however, it also showed moderate susceptibility. It was also moderately resistant to white backed planthopper and GLP. The variation in the levels of resistance in cultivars may be due to the biotype concept. Biotypes are defined as populations within an arthropod species such as GLH and BPH that show variations in their ability to effectively use a trait deployed by a plant cultivar (Gallun and Khush 1980; Wilhoit, 1992; Pedigo, 1999).
Rosida et al. (2020) identified three GLH biotypes: 1650, 1654, and 1604 which affect different resistant rice varieties. Biotypes of BPH are defined as a population or an individual distinguished from other populations with non-morphological traits such as adaptation and development to a particular host, host preference for feeding or oviposition, or both. Four BPH biotype are known for rice: Biotypes 1 and 2 are widely distributed in Southeast and East Asia, while Biotype 3 was developed in the laboratory by rearing the insects on the resistant variety ASD7 that has the bph2 gene for resistance (Panda and Heinrichs, 1983; Jena and Kim, 2010). In this study, resistance variation explains the resistance genes present against GLH, BPH, or both, as well as the presence of one
or more biotypes of either GLH, BPH, or both in the screenhouse.
Conclusion Results showed the availability of BPH and
GLH resistance genes among the PhilRice Genebank accessions. It is recommended to continuously explore the potential of available rice germplasm with good resistance against major insect pests for breeding programs. Continuous evaluation of these accessions is needed to determine the stability of BPH and GLH resistance. It is highly recommended to further test the varieties with known biotypes of both GLH and BPH such as Saigon, Bandera, and Luding-Luding.
AcknowledgmentThe authors are thankful to PhilRice for funding
this study. The authors are grateful to Mr. Danilo Narca for rearing and setting up the experiment.
Literature CitedAbo ME, Sy AA (1997) Rice virus diseases: epidemiology and
management strategies. Journal of Sustainable Agriculture 11(2-3): 113-134
Agrawal GK, Rakwal R (2006) Rice proteomics: a cornerstone for cereal food crop proteomes. Mass Spectrometry Reviews 25(1): 1-53
Agrawal GK, Jwa NS, Iwahashi Y, Yonekura M, Iwahashi H, Rakwal R (2006) Rejuvenating rice proteomics: facts, challenges, and visions. Proteomics 6(20): 5549-5576
Agrawal GK, Jwa NS, Rakwal R (2009) Rice proteomics: ending phase I and the beginning of phase II. Proteomics 9(4): 935-963
Agrawal GK, Rakwal R (2011) Rice proteomics: a move toward expanded proteome coverage to comparative and functional proteomics uncovers the mysteries of rice and plant biology. Proteomics 11(9): 1630-1649
Akanksha I, Lakshmi VJ, Chirutkar PM, Rao LV, Sarla N, Ram, T (2017) Identification of new sources for brown planthopper resistance from rice germplasm and introgression lines derived from O.nivara. ORYZA 54(3): 272-275
Ali MP, Alghamdi SS, Begum M, Anwar Uddin A, Alam M, Huang D (2012) Screening of rice genotypes for resistance to the brown planthopper, Nilaparvata lugens Stål. Cereal Research Communications 40(4): 502-508
Backus EA, Serrano MS, Ranger CM (2005) Mechanisms of hopperburn: an overview of insect taxonomy, behavior and physiology. Annu. Rev. Entomol. 50: 125-151
Brar DS, Virk PS, Jena KK, Khush GS (2009) Breeding for resistance planthoppers in rice. In Heong KL, Hardy B (Eds.). Planthoppers: New Threats to the Sustainability of Intensive Rice Production Systems in Asia (pp 401-409). Los Baños, Philippines: International Rice Research Institute

Evaluation of Rice Accessions for Pest Resistance
RICE-BASED BIOSYSTEMS JOURNAL (2022) 10: 101-105 105
Chaudhary RC, Khush GS, Heinrichs EA (1984) Varietal resistance to rice stem borers in Asia. International Journal of Tropical Insect Science 5(6): 447-463 Chelliah S (2008) Genetics of resistance in rice to planthoppers and leafhoppers. Rice Genetics I (In 2 parts): 513-522
Correa-Victoria FJ, Zeigler RS, Levy M (1994) Virulence characteristics of genetic families of Pyricularia grisea in Colombia. In Zeigler RS, Leong SA, Teng PS (Eds.). Rice Blast Disease (pp 211-229). Wallingford, UK: CAB Inter
Dhawande A, Lakshmi VJ, Chirukar PM, Katti GR, Rao LS (2018) Evaluation of germplasm accessions for resistance to rice Brown planthopper, Nilaparvata lugens (Stål). Journal of Rice Research 11(2): 36
Dupo ALB, Barrion AT (2009) Taxonomy and general biology of delphacid planthoppers in rice agroecosystems. In Heong KL, Hardy B (Eds.). Planthoppers: New Threats to the Sustainability of Intensive Rice Production Systems in Asia (pp 3-156). Los Baños, Philippines: International Rice Research Institute
Gallun RL, Khush GS (1980) Genetic factors affecting expression and stability of resistance. In Maxwell FG, Jennings PR (Eds.). Breeding plants resistant to insects (pp 64-85). US: John Wiley
Hasanuddin A (2002) Integrated tungro disease control: strategy and implementation (pp 32-44). Jakarta: Bogor Research and Development Center
Heong KL, Hardy B (2009) Planthoppers: new Threats to the Sustainability of Intensive Rice Production Systems in Asia. Philippines: International Rice Research Institute IRRI [International Rice Research Institute] (2002) Standard Evaluation System for Rice. 3rd edition. Manila Philippines: International Rice Research Institute
Jena KK, Kim SK (2010) Current status of brown planthopper (BPH) resistance and genetics. Rice 3(2): 161-171
Jorrín JV, Maldonado AM, Castillejo MA (2007) Plant proteome analysis: a 2006 update. Proteomics 7(16): 2947-2962
Kogan M (1982) Plant resistance in pest management. In Metcalf RL, Luckmann WH (Eds.). Introduction to insect pest management. 2nd edition (pp 93-134). UK: John Wiley & Sons
Panda N, Heinrichs EA (1983) Levels of tolerance and antibiosis in rice varieties having moderate resistance to the brown planthopper, Nilaparvata lugens (Stål) (Hemiptera: Delphacidae). Environmental Entomology 12(4): 1204-1214 Pedigo LP. (1999). Entomology and pest management. 3rd edition. Prentice Hall.Upper Saddle River, NJ
Preetha G (2017) Screening of rice cultures/accessions for resistance to stem borer. Journal of Entomology and Zoology Studies 5(6): 2007-2010
Rosida N, Kuswinanti T, Nasruddin A, Amin N (2020) Green leafhopper (Nephotettix virescens Distan) biotype and their ability to transfer tungro disease in South Sulawesi, Indonesia. IOP Conference Series: Earth and Environmental Science 486(1): 012147
Sarma MK, Richharia AK, Agrawal PK (2003) Pattern of pigmentation in abu rice of Assam. Indian Journal of Plant Genetic Resources 16(1): 35-39
Sarwar M (2012) Management of aromatic rice (Oryza sativa L.) genotypes using varietal resistance against the prevalence of rice stems borers. International Journal of Agronomy and Plant Production 3(8): 295-299
Sharma HC, Ortiz R (2002) Host plant resistance to insects: an eco-friendly approach for pest management and environment conservation. J Environmental Biology 23(2): 111-135
Vanaja T, Singh R, Randhawa GJ (2010) Genetic relationships among a collection of Indica rice (Oryza sativa L.) genotypes of Kerala revealed by SSR markers. Indian Journal of Agricultural Sciences 80(3): 191
Venkatesh K, Soundararajan RP, Muthukrishnan N, Jeyaprakash P (2019) Evaluation of rice landraces for resistance to planthoppers and leafhoppers. Electronic Journal of Plant Breeding 10(2): 413-418
Wilhoit LR (1992) Evolution of virulence to plant resistance: influence of variety mixtures. University of Chicago Press, Chicago Yang H, Ren X, Weng Q, Zhu L, He G (2002) Molecular mapping and genetic analysis of a rice brown planthopper (Nilaparvata lugens Stål) resistance gene. Hereditas 136(1): 39-43


RICE-BASED BIOSYSTEMS JOURNAL (2022) 10: 101-105 107
RESPONSE TO HERBICIDE OF RICE BREEDING LINES DERIVED FROM DIFFERENT INDUCED MUTATIONS
Christopher C. Cabusora* and Nenita V. DesameroPhilippine Rice Research Institute, Science City of Muñoz, Nueva Ecija
*Corresponding Author: [email protected]
AbstractWeed colonization remains one of the prominent problems in rice production. Weeds compete with rice in
acquisition of nutrients from the soil and atmosphere; thereby, affecting growth and development. One of the long-term solutions identified to reduce, if not totally eliminate, the effects of weeds in rice production is the development of herbicide-tolerant rice. In 2013, 103 rice breeding lines derived from various induced mutation strategies: seed mutation, in vitro mutagenesis, and anther culture, were screened for herbicide tolerance. The breeding lines were subjected to the recommended rate of glyphosate-containing herbicide, 14 days after seeding. Survival rate (%) was determined two weeks after herbicide application. The screening resulted in the identification of 3 (5.4%) lines, 3 (9.1%) lines, and 5 (35.7%) lines from seed mutation, in vitro mutagenesis, and anther culture, respectively, that are putatively tolerant to herbicide. Study results proved the efficiency of induced mutations in generating breeding lines with tolerance to abiotic stresses such as herbicide. These lines are currently seed produced, and will undergo validation screening to determine the stability of the herbicide tolerance trait.
Keywords: Herbicide, Glyphosate, Seed Mutation, in vitro Mutation, Anther Culture, Weeds
IntroductionWeed is one of the major causes of rice yield
reduction (Fischer et al., 1999). It poses the highest threat to potential yield loss, equivalent to the reduction brought by pathogens and animal pests (Oerke, 2006). Weeds compete with rice for soil nutrients, sunlight, water, and area (Blackman and Templeman, 1938). The intensity of competition between rice and weeds were too significant, incurring a 2 - 9% yield loss in rainfed rice areas (Tomita et al., 2003). Thus, various methods were already employed to lessen, if not eliminate, weeds in the rice paddies particularly herbicide application, which is the most common intervention against weeds as practiced by farmers (Haefele et al., 2002). Other approaches tend to be effective; hence, it should be integrated with good land preparation and good water management (Johnson and Rodenburg, 2009). However, overdependence on herbicides with similar mechanisms of action resulted in the evolution of herbicide tolerant weeds (Baucom, 2019). Currently, there have been several reports on the presence of more than 500 unique cases of herbicide-resistant weeds (Busi et al., 2013; Heap and Duke, 2018; Heap, 2018; Ghanizadeh and Harrington, 2019). The emergence of herbicide tolerant weeds shows the adaptive response of these species to continuous herbicide use (Délye et al., 2013). Herbicide resistance becomes a result of a selection process (Baltazar, 2017), created by repeated applications of herbicides with the same
mode of action (Délye et al., 2013). These routines of herbicide application lead to the selection of individuals that produce mutations, enabling them to survive (Ghanizadeh and Harrington, 2017a; 2017b).
In recent years, several crops including rice with herbicide tolerance have been reported in several countries (Kumara et al., 2008; Grover et al., 2020; Jin et al., 2022). In the Philippines, the continuous use of 2, 4-D to control weeds for 7 - 9 years resulted in the evolution of tolerant biotypes of E. crus-galli (Baltazar, 2017). This occurrence of resistant weeds was primarily confirmed in the province of Iloilo and Nueva Ecija where tolerance to butachlor and propanil was observed (Juliano and Casimero, 2007; Juliano et al., 2010). The weed’s herbicide tolerance may be attributed to the non-target site resistance mechanisms. These mechanisms allow weeds to survive the herbicide application by preventing sufficient herbicide to reach the target site (Gaines et al., 2017). At first, the weed may be affected by the application but eventually survive and consequently set seeds.
To date, herbicide tolerance has been included as one of the objectives in rice breeding programs, implementing different breeding approaches to generate rice lines with herbicide tolerance (Reddy and Nandula, 2012). Glyphosate, and glufosinate are two of the most important herbicides that control most of the weeds in rice fields (Ellis, 2001). These herbicides
RESEARCH NOTE

Response to Herbicide of Rice Breeding Lines
108 RICE-BASED BIOSYSTEMS JOURNAL (2022) 10: 101-105
are non-persistent and highly effective in weed control; thereby, causing minimum impact on animal lives (Kanissery et al., 2019). Glyphosate herbicide blocks the enzyme involved in the biosynthesis of biomolecules and secondary plant metabolites, rendering the death of the plants (Gravena et al., 2012). Meanwhile, glufosinate herbicides contain phosphinothricin as an active ingredient, which kills plants by blocking enzymes for nitrogen metabolism and detoxification of ammonia (Chang and Liao, 2002).
In this study, induced mutation strategies were used to generate herbicide-tolerant mutant lines from three cultivars. The generated lines were screened for tolerance by applying herbicide containing glyphosate as the active ingredient. This study identified putative mutant lines with tolerance to herbicide.
Materials and MethodRice breeding lines generated and developed
from different mutation strategies were evaluated for herbicide resistance (Table 1) in 2013 dry season (DS). There were 103 lines evaluated under screen house condition at the Philippine Rice Research Institute Central Experiment Station (PhilRice CES). These were distributed as 56 seed mutant lines from Swarna-Sub1, 33 in vitro mutant (IVM) lines from Salumpikit, and 16 doubled haploid lines (DHL) derived from anther culture of IR64-Sub1/Nerica 4 cross.
Table 1. List of mutants from three genotypes screened for herbicide resistance, PhilRice CES.
No. Genotype Mutation Strategy No. of Lines
1 Swarna-Sub1 Seed mutation (SM) 56
2 Salumpikit In vitro mutagenesis (IVM) 33
3 IR64-Sub1/Nerica 4
Anther culture (AC) 14
Total 103
Seed preparation and sowing
Rice seeds from each line were incubated at 50⁰C overnight to break seed dormancy, then afterwards incubated at room temperature for 24 h. Seeds were soaked in water for 24 h for pre-germination. There were 100 pre-germinated seeds directly sown in a linear furrow (Figure 1a) at 2 cm distance in a 2.7 m x 1.89 m wooden seed boxes. Seeds were grown for 2 weeks before herbicide application.
Herbicide application and scoring
Initial count of plants was determined two weeks from seeding (Figure 1b) and before applying the 2% (v/v) PowerTM herbicide (Figure 1c), which contains glyphosate as active ingredient. This herbicide is a non-selective, contact herbicide that interferes with amino acid synthesis in plants applied at 1.6 L ha-1. The 2% concentration of herbicide is the recommended rate to ensure elimination of common weeds (Monsanto, 2007). The recommended rate
Figure 1. Seeds sown in furrows (a); seedlings, 14 days after seeding (b); powerTM herbicide and 2% herbicide solution (c); herbicide application, evenly spraying at four-leaf stage after seedings (d).

Response to Herbicide of Rice Breeding Lines
RICE-BASED BIOSYSTEMS JOURNAL (2022) 10: 101-105 109
requires 73.9 ml of herbicide to be dissolved in a 3.8 L of water for a 300 m2 area. This ratio was used as a baseline to determine the recommended rate for application in a seed box with an area of 5.424 m2. For the seed boxes used, 14.4 ml of herbicide was dissolved in a 740 ml of distilled water. Foliar application was used to evenly spray the herbicide.(Figure 1d). The number of seedlings that survived was determined a week after the application, while tolerance score was classified based on the injury description published by Oldach et al. in 2008.
The experiment was laid out in a Randomized Complete Block Design (RCBD) with three replications. Comparison of means by Dunnett’s Test was used to compare the mutants to their respective wildtype.
Results and DiscussionPlant survival was determined 2 weeks after the
herbicide application, following the mortality of the susceptible check variety, IR64; indicating the efficacy of the herbicide treatment. A week after application, the lines exhibited leaf rolling (Figure 2a), which showed progression of the herbicide effects. Survival of the 56 Swarna-Sub1-derived mutants ranged from 0 to 71% (Figure 2b). The screening identified 18 (37%) lines with survival of 37 - 509%, significantly higher than the wildtype, Swarna-Sub1 with 11% survival. However, based on tolerance score, 12 (21%) lines had moderate tolerance
to herbicide. This result showed thatSwarna-Sub1’s herbicide tolerance was enhanced through induced mutation (Figure 2c).
Survival of the 33 IVM lines was 1 - 81% (Figure 3a). The widltype, Salumpikit, was susceptible (Figure 3b), incurring a 0% survival. This implies that the survival of the mutant lines was enhanced through induced mutagenesis. From the IVM lines screened, 3 (9%) lines were identified as tolerant. Induced mutation has been proven effective and efficient in producing mutant rice lines with improved agronomic traits, grain quality, and physiological stress tolerance (Brunner, 1995; Cassells and Doyle, 2003; Cabusora et al., 2019).
Among the test entries screened, only the DHLs derived from the anther culture of the cross IR64-Sub1/Nerica 4 exhibited non-leaf rolling (Figure 4a) a week after herbicide application. Screening of the 14 DHLs resulted in survival ranging from 10 to 61% (Figure 4b). Fourteen (93%) lines were significantly higher than the 16% survival rate of IR64-Sub1. Six (43%) lines were also comparable and were as tolerant as Nerica 4 with a survival of 58%. However, these tolerant lines had a survival that is 3 - 4% higher than Nerica 4 (Figure 4c). This implies that the herbicide tolerance trait of Nerica 4 was inherited by these DHLs, and further enhanced by the mutation that took place during anther culture. Doubled haploid has been proven efficient in producing stable rice lines with durable tolerance to abiotic stresses such as
Figure 2. Survival (%) of the Swarna-Sub1-derived mutants 2 weeks after herbicide application (a); leaf-rolling observed a week after the application (b); response of IR64, the wildtype and the mutants to herbicide, 2 weeks after application (c).

Response to Herbicide of Rice Breeding Lines
110 RICE-BASED BIOSYSTEMS JOURNAL (2022) 10: 101-105
salt, drought, and phosphorus deficiency (Senadhira et al., 2002; Lapitan et al., 2013; Viana et al., 2020).
Across mutation strategy, 11 (10.6%) lines were identified putatively tolerant lines (Table 2), which is an improvement or enhancement from their respective wildtype.
One of the reported mutant rice with tolerance to herbicide is the HTM-N22, which was developed from induced mutation using ethyl methyl sulfonate (EMS) of the rice cultivar Nagina 22 (Shoba et al., 2017). In Sri Lanka, induced mutation generated 12 rice varieties with tolerance to glyphosate-containing herbicide (Ekanayaka et al., 2017). The International Atomic Energy Agency (IAEA) Mutant Variety
Database had registered 2 rice varieties with herbicide tolerance, the IRAT 239, registered in 1980 and the SCS121 CL in 2014.
ConclusionThe use of the mutation techniques: seed
mutation, in vitro mutagenesis, and anther culture, resulted in the generation of 103 elite mutant lines. These lines were screened for herbicide resistance containing glyphosate as active ingredient. These lines will undergo validation screening, phenotyping, and molecular evaluation for other important traits such as abiotic stress tolerance, grain quality, disease resistance, and yield performance. These lines derived from various mutation strategies, proved
Figure 3. Survival (%) of the Salumpikit-derived IVM lines 2 weeks after herbicide application (a); response of the wildtype, Salumpikit and the mutants to herbicide 2 weeks after application (c).
Figure 4. Non-leaf rolling DHLs 1 week after herbicide application (a); survival (%) of DHLs (b) compared with both parents; surviving DHLs 2 weeks after application (c).

Response to Herbicide of Rice Breeding Lines
RICE-BASED BIOSYSTEMS JOURNAL (2022) 10: 101-105 111
the efficiency of induced mutation in generating rice lines with improved tolerance to herbicide.
As the mutant lines were tested for herbicide containing glyphosate, it can be concluded that these mutants are tolerant to this compound. This compound binds with 5-enolpyruvoylshikimate-3-phosphate synthase (EPSPS) in plants (Duke and Powles, 2008). EPSPS catalyzes the production of necessary secondary metabolites that are vital in the synthesis of tryptophan, tyrosine, and phenylalanine, as well as hormones, flavonoids, lignin, ubiquinone, and other phenolic compounds (Dill, 2005). The sensitivity of ESPS to glyphosate is the main cause of the plant’s mortality when applied with herbicide containing the compound. In the case of rice lines screened, mutation may have altered the genes responsible for the production of EPSPS; therefore, reducing its binding affinity to glyphosate rendering the plants to be tolerant (Zhao et al., 2011).
The mutant lines when fully characterized can be used as donor lines for developing herbicide-tolerant rice varieties in the Philippines.
Literature Cited Baltazar A (2017) Herbicide-resistant weeds in the Philippines:
status and resistance mechanisms. Weed Biology and Management 17(2): 57-67
Baucom RS (2019) Evolutionary and ecological insights from herbicide-resistant weeds: what have we learned about plant adaptation, and what is left to uncover? New Phytologist 223(1): 68-82
Blackman GE, Templeman W (1938) The nature of the competition between cereal crops and annual weeds. The Journal of Agricultural Science 28(2): 247-271
Brunner H (1995) Radiation induced mutations for plant selection. Applied Radiation and Isotopes 46(6-7): 589-594
Busi R, Neve P, Powles S (2013) Evolved polygenic herbicide resistance in Lolium rigidum by low-dose herbicide selection within standing genetic variation. Evolutionary Applications 6(2): 231-242
Cabusora CC, Desamero NV, Buluran RD (2019) Enhanced yield and yield component traits of the mutants derived from rice cv. Samba Mahsuri-sub1 and Pokkali through induced mutation. Global Scientific Journals 7(6): 649-653
Table 2. Putative herbicide tolerant lines derived from various induced mutation strategy, PhilRice CES, 2013 dry season.
No. Designation ParentageSurvival Tolerance
ScoreNo. % Adv (%)1 IR64 0 0.0 2 Swarna-Sub1 15 11.0 3 SM3-SWSUB1 5-1-7 Swarna-Sub1 14 71.4* 509.4 MT4 SM3-SWSUB1 5-1-14 Swarna-Sub1 22 59.3* 398.7 MT5 SM3-SWSUB1 7-1-3 Swarna-Sub1 11 52.4* 336.2 MT6 Salumpikit 0 0.0 7 Salumpikit-IVM2011WS 2-1-4 Salumpikit 21 56.8* MT8 Salumpikit-IVM2011WS 1-3-9 Salumpikit 13 81.3* T9 Salumpikit-IVM2011WS 1-3-26 Salumpikit 29 70.7* MT10 IR64-Sub1 24 15.7 11 Nerica 4 60 58.2 MT12 ACRL-2011DS-2 IR64-Sub1/Nerica 4 85 50.8** 223.5 MT13 ACRL-2011DS-9 IR64-Sub1/Nerica 4 87 60.7** 286.8 MT14 ACRL-2011DS-11 IR64-Sub1/Nerica 4 89 60.5** 285.3 MT15 ACRL-2011DS-16 IR64-Sub1/Nerica 4 85 60.0** 282.2 MT16 ACRL-2011DS-18 IR64-Sub1/Nerica 4 87 53.7** 242.2 MTMinimum 0 0 223.5 Maximum 89 81.3 509.4Range 89 81.3 285.9Mean 40.1 47.6 320.5Standard deviation 35.0 25.8 93.7Coefficient of variance 87.3 54.2 29.2
*Significantly different to wildtype and to IR64 by Dunnett’s Comparison of Means, at Alpha = 0.05** Significantly different to IR64-Sub1 by Dunnett’s Comparison of Means, at Alpha = 0.05Adv - Advantage over the wildtype/parentsMT - Moderately tolerantT - Tolerant

Response to Herbicide of Rice Breeding Lines
112 RICE-BASED BIOSYSTEMS JOURNAL (2022) 10: 101-105
Heap I, Duke SO (2018) Overview of glyphosate-resistant weeds worldwide. Pest Management Science 74(5): 1040-1049
Jin M, Chen L, Wang X, Deng W, Tang X (2021) Development of herbicide resistance genes and their application in rice. The Crop Journal 10(1): 26-35
Johnson DE, Rodenburg J (2009) Weed management in rice-based cropping systems in Africa. Chapter Four. In Donald S (Ed.). Advances in Agronomy 103: 149-218
Juliano LM, Casimero MC (2007) Herbicide resistance in Echinochloa spp. in the Philippines. In Proceedings of the 21st Asian-Pacific Weed Science Society Conference (pp 205-212). Colombo, Sri Lanka: Asian-Pacific Weed Science Society
Juliano LM, Casimero MC, Llewellyn R (2010) Multiple herbicide resistance in barnyardgrass (Echinochloa crus-galli) in direct-seeded rice in the Philippines. International Journal of Pest Management 56(4): 299-307
Kanissery R, Gairhe B, Kadyampakeni D, Batuman O, Alferez A (2019) Glyphosate: Its environmental persistence and impact on crop health and nutrition. Plants 8(499): 1-11
Kumara V, Bellidera RR, Brainard RK, Malick RK, Guptad RK (2008) Risk of herbicide-resistant rice in India: A review. Crop Protection 27(3-5): 320-329
Lapitan VC, Cayaban EB, Roferos LT, San Valentin GO and Sebastian LS (2013) Utilization of anther culture technique for rice improvement in the Philippines. Philippine Journal of Crop Science SN 0116-463X.
Oerke EC (2006) Crop losses to pests. The Journal of Agricultural Science 144(1): 31-43
Oldach KK, Peck DM, Cheong J, Williams KJ, Nair RM (2008) Identification of a chemically induced point mutation mediating herbicide tolerance in annual medics (Medicago spp.). Annals of Botany 101(7): 997-1005
Reddy KN, Nandula VK (2012) Herbicide resistant crops: History, development and current technologies. Indian Journal of Agronomy 57 (1): 1-7
Senadhira D, Zapata Arias FJ, Gregorio GB, Alejar MS, Cruz HC, Padolina TF, Galvez AM (2002) Development of the first salt-tolerant rice cultivar through indica/indica anther culture. Field Crops Research 76: 103-1110
Shoba D, Raveendran M, Mannonmani S, Utharasu S, Dhivyapriya D, Subhasini G, Ramchandar S, Valarmathi R, Grover N, Krishan SG, Singh AK, Jayaswal P, Kale P, Ramkuma MK, Mithra SVA, Mohapatra T, Singh K, Singh NK, Sarla N, Sheshshayee MS, Kar MK, Robin S, Sharma RP (2017) Development and genetic characterization of a novel herbicide (Imazethapyr) tolerant mutant in rice (Oryaz sativa L.). Rice 10:10
Tomita S, Miyagawa S, Kon Y, Noichana C, Inamura T, Nagata Y, Sributta A, Nawata E (2003) Rice yield losses by competition with weeds in rainfed paddy field in north-east Thailand. Weed Biology and Management 3: 162-171
Viana EV, Pegoraro C, Bsanello C and de Oliveira AC (2020) Mutagenesis in Rice: The Basis for Breeding a New Super Plant. Frontiers in Plant Science 10: 1326
Zhao T, Lin C, Shen Z (2011) Development of transgenic glyphosate-resistant rice with G6 gene encoding 5-Enolpyruvylshikimate-3-Phosphate Synthase. Agricultural Sciences in China 10(9): 1307-1312
Cassells AC, Doyle BM (2003) Genetic engineering and mutation breeding for tolerance to abiotic and biotic stresses: Science, technology and safety. Bulgarian Journal of Plant Physiology Special Issue: 52-82
Chang SY, Liao C (2002) Analysis of glyphosate, glufosinate and aminomethylphosphonic acid by capillary electrophoresis with indirect fluorescence detection. Journal of Chroma-tography 959(1-2): 309-315
Délye C, Jasieniuk M, Le Corre V (2013) Deciphering the evolution of herbicide resistance in weeds. Trends in Genetics 29(11): 649-658
Dill GM (2005) Glyphosate-resistant crops: history, status and future. Pest Management Science 61(3): 219-224
Duke SO, Powles SB (2008) Glyphosate: A once-in-a-century herbicide. Pest Management Science 64(4): 319-325
Ekanayaka EMSI, Weerakoon SR, Somaratne S, Weerasena OVDSJ (2017) Developing herbicide resistant Sri-lankan rice (Oryza sativa L.) varieties: An application of self organizing map. Information Processing in Agriculture 4(2): 140-149
Ellis JM (2001) Glyphosate- and Glufosinate -Resistant Technologies: Weed Management and Off-Target Crop Response. Retrieved from LSU Dissertations and Theses: https://digitalcommons.lsu.edu/gradschool_disstheses/280 (accessed January 28, 2022)
Fischer AJ, Florez JA, Ramirez H and Duque MC (1999) Predicting rice yield losses caused by multispecies weed competition. Agronomy Journal 91(1) 87-91
Gaines TA, Duke SO, Morran S, Rigon CAG, Tranel PJ, Kupper A, Dayan FE (2017) Mechanism of evolved herbicide resistance. Journal of Biological Chemistry 295(30): 10307-10330
Ghanizadeh H, Harrington KC (2019) Herbicide resistant weeds in New Zealand: State of knowledge. New Zealand Journal of Agricultural Research 64(4): 471-482
Ghanizadeh H, Harrington KC (2017a) Perspectives on non-target site mechanisms of herbicide resistance in weedy plant species using evolutionary physiology. AoB Plants 9(5): plx035
Ghanizadeh H, Harrington KC (2017b) Non-target site mechanisms of resistance to herbicides. Critical Reviews in Plant Sciences 36(1):24-34
Gravena R, Filho RV, Alves PLCA, Mazzafera P, Gravena AR (2012) Glyphosate has low toxicity to citrus plants growing in the field. Canadian Journal of Plant Science 92(1): 119-127
Grover N, Kumar A, Yadav AK, Krishnan SG, Ellur RK, Bhowmick PK, Vinod KK, Bollinedi H, Nagarajan M, Viswanathan C, Sevanthi AMV, Singh NK, Mohapatra T, Singh AK (2020) Marker assisted development and characterization of herbicide tolerant near isogenic lines of a mega Basmati Rice Variety, “Pusa Basmati 1121”. Rice 13(68):1-13
Haefele S, Wopereis MCS, Donovan C (2002) Farmers' perceptions, practices and performance in a Sahelian irrigated rice scheme. Experimental Agriculture 38(2): 197-210
Heap I (2018) International survey of herbicide resistant weeds. Proceedings of the 16th Australian Weeds Conference. Brisbane: Queensland Weeds Society

RICE-BASED BIOSYSTEMS JOURNAL (2022) 10: 113-123 113
IMPROVING FILIPINO RICE FARMERS’ COMPETITIVENESS THROUGH MECHANIZATION
Elmer G. Bautista*, Manuel Jose C. Regalado, Arnold S. Juliano, Joel A. Ramos,Alice B. Mataia, and Jesusa C. Beltran
Philippine Rice Research Institute, Science City of Muñoz, Nueva Ecija, Philippines*Corresponding Author: [email protected]
AbstractAgricultural modernization through the use of appropriate mechanization is a key factor towards
competitiveness of the rice industry. While the level of rice farming mechanization in the Philippines is still predominantly lower than neighboring countries, the government is propelling towards modernization. One of the apparent advantages of mechanization is its potential to reduce the farmers’ production costs; however, the depression of rice farm gate prices subsequently negates savings. Moreover, lower farm gate prices do not automatically result in lower milled rice prices, which is necessary for the locally produced rice to effectively compete with the imported rice. Hence, some of these identified challenges should be faced before attaining complete Philippine rice mechanization. This paper presents the challenges in implementing rice mechanization, as well as possible interventions to address these challenges. Strategies in promoting mechanization are also recommended as basis for the formulation of policy measures with regards to farm modernization.
Keywords: Agricultural Mechanization, Rice Production, Farmer’s Competitiveness, Policy Measures
IntroductionThe Philippines is an agricultural-based country.
Rice is the most important staple food accounting for the 25% food expenditures of the poorest (30% of the total population) in the country (Balisacan and Sebastian, 2006). From its 9.2 million hectares (Mha) agricultural land, 33% or 4.7 Mha is devoted to rice production. The globalization, liberalization of agricultural trade, economic integration of the Association of Southeast Asian Nations (ASEAN), and the effects of climate change, are challenging the Philippine agriculture sector.
As population growth escalates the per capita rice consumption of 110 kg in 2015 - 2016 (PSA, 2017), the government is struggling to increase rice production. The level of self-sufficiency in rice has been an up-and-down battle in the past decades. In 1990, it decreased from 91 to 80% (2010), but went up to 90% in recent years.
Figure 1 shows the trends in palay production from 2000 to 2020. In 2020, palay output reached a high record of 19.29 million tons (Mt) of which 76% and 24% came from the irrigated and rainfed ecosystems, respectively. This is 2.55% higher than
Figure 1. Paddy production from 2000 to 2020.
RESEARCH NOTE

Improving Competitiveness Through Farm Mechanization
114 RICE-BASED BIOSYSTEMS JOURNAL (2022) 10:113-123
the 2019 production of 18.81 Mt primarily due to improvements in harvest (1.45% growth) and yield (1.09%). This improvement was fueled by the series of interventions massively implemented by the government and private sectors, early harvest in anticipation of higher trading prices, and continuous use of high-yielding varieties. The impacts of climate change such as unpredictable rainfall patterns led to the need for mechanization, particularly the utilization of combine harvesters and dryers.
Mechanization is necessary in land preparation, crop establishment and management, and harvesting, as well as processing the agricultural products toward competitive and improved productivity. Perceived problems in rice farming are high production cost, aging farmers, scarce labor, and climate change. The basic requirement to address these challenges is to reduce the unit cost of rice production through machines, which are proven to be cost-efficient compared with manual labor.
Farm mechanization enhances labor productivity, shortens time of operations, and helps the optimization of cropping duration within a season. As the Department of Agriculture (DA) stated, “Boost farm mechanization to reduce production costs, enable our rice farmers to produce more harvests, earn bigger incomes, and subsequently compete with their counterparts in the ASEAN.”
This paper discusses the status, challenges, and opportunities of mechanization in the Philippines. It also highlights the interventions, and research initiatives of Philippine Rice Research Institute (PhilRice) in rice mechanization. Recommended opportunities in promoting mechanization are also discussed, which can guide the crafting of policy measures in boosting the productivity and competitiveness of Filipino local farmers.
Rationale for Mechanization
Contribution to productivity. Mechanization is a key strategy to improve the level of farm productivity and competitiveness of the agriculture sector (Rodulfo et al., 2008; Cao et al., 2014). Through mechanization, timeliness of operations is optimized, which leads to increase in cropping intensity (Amare and Endalew, 2016). In a microeconomic farm-level assessment of mechanization, conducted by Gonzales et al. (2013), fully and partly mechanized rice farms surpassed the non-mechanized farms in terms of crop yield, cost of production, and profitability. Appropriate farm machinery, equipment, and facilities can lead to improved land and labor productivity and reduced postharvest losses (Bautista, 2001; Apiors et al., 2016). A study on using appropriate machinery in Nigeria also showed that using power tillers in small
farms can increase yield by 70% (Faleye et al., 2012). Mechanization can also increase labor productivity for higher rural incomes (Bordey et al., 2016).
Contribution to loss reduction. Based on a study of the Philippine Center for Postharvest Development and Mechanization (PHilMech) and Philippine Rice Research Institute (PhilRice), a staggering 16.5% of rice grains are lost from harvesting to storage operations (Salvador et al., 2012). The use of combine harvesters saves time, reduces labor, minimizes cost, and reduces losses in harvesting and threshing (Bordey et al., 2016). Mechanization allows easier and timely postharvest operations; thus, reducing harvest and postproduction losses (Mohammad and Alireza, 2013; Regalado and Ramos, 2018). According to Regalado et al. (2020), using combine harvester, flatbed dryer, and hermetic storage resulted in 42.4% lower postharvest losses compared with manual reaping, mechanical threshing, sun drying, and ambient storage during on-time harvest period of rice. Additionally, combine harvester can save an average of 16.3 labor-days/ha (Arida et al., 2017).
Current Situation of Local Rice Mechanization
Mechanization of rice farm operations. Human labor is one of the crucial inputs in rice cultivation in the Philippines. The total labor use (labor-days/ha) of rice farming in six Asian countries for the crop year 2013 - 2014 is presented in Table 1. Total labor in the Philippines is significantly lower than in Indonesia and India. However, for land preparation (5.5 md) and threshing (2 md), labor use in India is significantly less than in the Philippines where the use of four-wheel tractors and combine harvesters are popular. Furthermore, comparative cost of production shows that labor cost in the Philippines was accounted for the 30% of the total cost per kilogram (Table 2). Adding the cost for operator, family, and exchange (OFE) labor (PhP 0.66/kg) and for animal, machine, fuel, and oil (PhP 1.73/kg), total production cost is increased to 50%. This is consistent with the recent data from Philippine Statistics Authority (PSA), which showed that labor cost earns the biggest portion in the total production cost (Figure 2). This represents the cost opportunity for mechanizing the rice sector.
Mechanization is highly adopted in land preparation and threshing of intensively cultivated rice fields (Bautista, 2003). Bordey et al. (2016) mentioned two types of labor source; the hired and OFE laborers. Hired laborers are mainly in charge of transplanting, harvesting, and manual weeding while OFE laborers perform the application of fertilizer and pesticide, irrigation, and drainage. This comparison reflects the acquisition of mechanization in an area, exhibiting that OFE labor is mostly dominant in highly mechanized countries.

Improving Competitiveness Through Farm Mechanization
RICE-BASED BIOSYSTEMS JOURNAL (2022) 10: 113-123 115
Table 1. Total labor for major activities in six Asian countries, 2013 - 2014.
ActivityLabor-intensive Countries Highly-mechanized Countries
Nueva Ecija, Philippines
West Java, Indonesia
Tamil Nadu, India
Zhejiang,China
Suphan Buri, Thailand
Can Tho, Vietnam
High-yielding seasonTotal labor (labor-days/ha) 68.7 96.2 78.3 34.9 9.7 21.9Land preparation 8.8 14.7 5.5 5.2 1.8 2.4Crop establishment 20.7 21.7 32.7 16.5 0.9 6.3Crop care and maintenance 18.8 27.3 37.5 11.0 6.3 11.0Harvesting and threshing 18.3 25.6 2.0 1.0 0.7 1.2Postharvest 2.0 6.9 0.6 1.1 0.0 1.1
Source: Bordey et al. (2016)
Table 2. Comparative cost of rice production (P/kg), 2013 - 2014.
Costs (P/kg) Nueva Ecija, Philippines
Zhejiang,China
West Java, Indonesia
Tamil Nadul, India
Suphan Buri, Thailand
Can Tho, Vietnam
Seeds 0.58 0.77 0.15 0.45 1.12 0.44Fertilizers 1.94 1.90 1.05 0.91 1.56 1.36Pesticides 0.36 1.33 1.03 0.22 0.90 0.87Hired labor 3.76 0.49 4.29 2.52 0.66 0.46Operator, family, and exchange (OFE) 0.66 2.52 1.02 0.47 0.65 0.81
Animal, machine, fuel, and oil 1.73 3.16 0.50 1.78 1.66 0.81Irrigation 0.45 0.00 0.10 0.12 0.14 0.08Land rent 2.11 3.80 6.61 1.96 1.89 1.49Interest on capital 0.43 0.01 0.32 0.08 0.07 0.08Others 0.40 0.10 0.63 0.35 0.20 0.13Cost/kg 12.41 14.07 15.71 8.87 8.85 6.53
Source: Bordey et al., 2016
Figure 2. Cost shares in Philippine rice production, 2019. (Source: PSA, 2020)
Other cost 10%
Interest 5%
Machine and land rent (cash, non-cash, imputed 15%
Irrigation (cash, in-kind) 1%
Permanent labor/caretakers etc. (cash, in-kind) 2%
Hired labor (cash, in-kind) 22%
Pesticides (cash, non-cash, imputed 2%
Fertilizer (cash, non-cash, imputed 10%
Seeds (cash, non-cash, imputed 4%
Fuel, oil, and electricity (cash, in-kind) 2%
Harvester, and thresher’s share 12%
OFE labor 14%
Percentage breakdown of cost of rice production (2019

Improving Competitiveness Through Farm Mechanization
116 RICE-BASED BIOSYSTEMS JOURNAL (2022) 10:113-123
Data from the rice-based farming household survey (RBFHS) of the PhilRice Socioeconomics Division (2006 - 2016 wet seasons) showed that hand tractors had the highest percentage on the actual use of machines during land preparation at 67%. During harvesting, labor (67%) was predominantly utilized while only 32% used combine harvester. Most farmers (83%) were aware of the combine harvester; however, hardly 30% have adopted it during the survey. Perception or farmer’s awareness on the drum seeder was at 30% but the adoption was only 3%. Table 3 shows the estimated number of agricultural machines and equipment in the Philippines as of 2014, which is insufficient to meet the requirements of the cropped area and harvested volume (DA, 2016). Subsequent to the implementation of the Rice Tariffication Law (RTL) in 2019 as a result of globalization, the Rice Competitiveness Enhancement Fund (RCEF) was established to help and assist farmers in coping with the competitive prices of rice in the world market. The RCEF program distributes machines to farmers’ cooperatives and associations as one of the strategies in raising the level of farm mechanization in the country. An estimated 15,900 units of machines are expected to be distributed within the six-year subsistence of this program (Table 4).
For drying of paddy, sun-drying on pavements or canvas and nets is still popular in the Philippines; although several mechanical dryer models have
been introduced and readily available in the market (Gagelonia et al., 2013). Cachuela et al. (2009) stated that about 50% of the palay harvest was dried on roads or highways, 45% on multi-purpose drying pavements, and 5% on mechanical dryers.
Mechanization level
The Philippines is one of the countries in Asia with lowest levels of mechanization. However, it gained considerable improvement from 0.52 hp ha-1 in 1990 to 1.23 hp ha-1 for all crops, and 2.31 hp ha-1 for rice and corn in 2011 (PHilMech, 2011). This level is similar with India and Pakistan, and is way behind the level of Japan (7 hp ha-1), South Korea (4.11 hp ha-1), and China (4.10 hp ha-1) as reported by DA in 2013. In 2018, Bangladesh had an average available power use in agriculture of 2.44 hp ha-1, Thailand with 3.08 hp ha-1, and Vietnam with 2.41 hp ha-1 (Hossen et al. 2020). As reported by Bordey et al. (2016), in spite of the mechanization program imposed by the Philippine government, the widespread level is still relatively low, which can be related to the abundance of farm labor or the rural landless workforce. Survey results from KAPEX 2015 in Nueva Ecija showed that land preparation is fully mechanized while some provinces have low rates of machine use in other farm operations except for threshing and spraying.
Materials and MethodsProper understanding of the current status of
Philippine rice mechanization and planned strategies to increase farm machine use were discussed through series of meetings. Major challenges in rice mechanization were identified through cross referencing or reviewing published data and literature and authors’ experiences. PhilRice’s R&D initiatives and those of other agencies were also identified and scrutinized to produce solutions in the emerging challenges of the enactment of rice mechanization. The opportunities, strategies, and ways forward in promoting mechanization were then recommended as
Table 3. Agricultural machinery in the Philippines as of 2014.
Agricultural MachinesUnits
(estimated), 2014Agricultural tractors1. Four-wheel tractors 12,5682. Power tillers 5,7023. Hand tractors 142,187Paddy threshers1. Rice threshers 66,7682. Pedal threshers 4,5793. Multipurpose threshers/shellers 3,740Mechanical harvesters1. Combine harvesters 7032. Reapers 5693. Multi-crop combine harvesters 5Post-harvest machinery1. Corn shellers 3,8002. Flat-bed dryers 1,5533. Recirculating/columnar mechanical dryers
1,016
4. Mobile flash dryers 745. Corn mills 1,0066. Rice mills (single pass) 13,0407. Rice mills (multi-pass) 9758. Micro mills 29
Source: DA, 2016
Table 4. Farm machines distributed through RCEF, 2019 - 2020 (as of June 2021).
Types of Machines UnitsFour-wheel tractors 2,700Hand tractors 3,140Floating tillers 969Precision seeders 124Walk-behind transplanters 838Riding-type transplanters 373Reapers 1376Combine harvesters 1,706Threshers 539Mobile rice mills 124
Source: PHilMech, 2021

Improving Competitiveness Through Farm Mechanization
RICE-BASED BIOSYSTEMS JOURNAL (2022) 10: 113-123 117
a guide for agencies in implementing mechanization programs and formulating policy measures to enhance the productivity and competitiveness of local rice farmers.
Results and Discussions Challenges in rice mechanization
A. Lack of capital for mechanization
Efficient agricultural machines and equipment are mostly imported from Japan, China, Korea, India, and Vietnam at high acquisition costs. Although imported rice combine-harvesters have been introduced and became popular in certain regions including Cagayan Valley and Central Luzon, the level of combine-harvested area is still low at 2.2% (Bingabing et al. 2016). Among the common adoption constraints were high costs of the machines, parts availability, and servicing. Some of the imported machines are four-row walk-behind transplanter (PhP 350,000 - 380,000), 6-row riding-type transplanters (PhP 1.1 M), and combine harvesters (PhP 1.4 - 1.6 M). These prices are evident reasons for the low percentage of mechanization in the country as it can hardly be afforded by majority of the farmers.
Financial credit facilities are available to farmers through banks or nonbank financial institutions. However, most farmers are small farm holders who seldomly avail loans from these institutions due to high interest rates, long processing time, and laborious and numerous documentary requirements.
B. Limited available quality metal parts and after-sales service
Providing after-sales services of agricultural machines is very limited throughout the country restricting the sustainability of its utilization.
The poor services provided after purchase can be attributed to the limited availability of spare parts and accessories, inaccessible service centers, and insufficient technicians within and after the warranty period (DA, 2016). There is also a problem in the weak capability of local manufacturers to fabricate quality farm machines because of the limited quality metal parts and inadequate training of technicians and personnel.
C. Lack of qualified skilled workers
Most agricultural machine operators and technicians do not have formal training and acquired their knowledge solely through the informal life-long learning process (DA, 2016). They are not certified by the Technical Education and Skills Development Authority (TESDA) or any other training agencies. They are also hesitant to use machines because they do not have sufficient knowledge on proper machine operations. Therefore, appropriate training programs and training centers for agricultural machine operations, maintenance, storage, and safety must be easily made available for the farmers.
D. Limited custom service providers
Customized services for land preparation and threshing are usually done in a very limited scale and non-professional way. Currently, provision for customized mechanization services has yet to be developed and organized as established service providers are very few. According to Andales et al. (2013), some farm machine owners, who are also crop growers, provide customized operation services to their co-farmers. Most capable farmers invest on machines for their own use, and eventually make farm operation services available to other neighboring farms.
Table 5. Rate of farm mechanization (%) per farm operation.
Farm Operation National Survey Nueva EcijaLand preparation 88.0 100.0 (n=615)Crop establishment
Hauling of seedlings * 18.0 (n=113) Transplanting 0 0 Direct seeding 0.1 0.8
Crop care and maintenance Irrigation * 14.0 Hauling of inputs * 48.0 Pesticide application * 0 Fertilizer application 0 0
Harvesting 1.3 15.0Threshing 89.6 85.0(Bautista et al 2017) *no available data

Improving Competitiveness Through Farm Mechanization
118 RICE-BASED BIOSYSTEMS JOURNAL (2022) 10:113-123
E. Small-sized/irregularly shaped paddy fields
Available imported farm machines in the market are big, which do not fit in small and irregularly shaped field plots. Lantin (2001) emphasized that this limits machine efficiency in the country. The mechanization of small, non-contiguous parcels of land may prove to be inefficient especially during land preparation and harvesting (Paras and Amongo, 2005).
F. Deep-muddy and soft soils with deep hardpans
Due to underdeveloped rice fields, irrigation water and drainage cannot be efficiently applied resulting in deep hardpans and waterlogging that add to farmers’ labor difficulties. Hardpan is a compacted soil layer produced by repeated tillage that limits percolation of water and nutrients. Furthermore, the continuous use of heavy machines such as combine harvesters causes breaking of soil hardpans, which leaves a pit-like muddy soil layer on the surface This also restricts use of power tillers for land preparation. Thus, the necessity to design machines that will fit the country’s field condition arose, simultaneous to the plan of developing rice fields for easy drainage during harvesting.
G. Lack of sustained support (Sanchez, 2015)
There are no programs providing linkages to agriculture and the industry, and support to the transfer of advanced production and post-harvest is limited. Processing of technologies to the stakeholders is also insufficient. Mohammad (2018) denoted that government support policies are necessary to achieve food security.
H. High cost and increased use of fossil fuels
The implementation of Tax Reform for Acceleration and Inclusion (TRAIN) Law significantly increased the prices of petroleum-based fuels and lubricants affecting farmers who primarily depend on these for farm operations. In rainfed areas, farmers use 100 L/ha for irrigation. This activity does not only burden the farmers but also causes negative impact on the environment, considering that each liter of diesel used has a corresponding amount of 2.7 kg of carbon dioxide released to the atmosphere as greenhouse gas (Fenangad et al., 2015).
I. High postharvest losses
The national average of postharvest losses is 16.5% (PHilMech, 2010): harvesting (2.0%), piling (0.1%), threshing (2.2%), drying (5.9%), milling (5.5%), and storage (0.8%). The combine harvester that reaps and threshes rice in one passing can reduce
cost and postharvest losses from 5 to 3% per hectare (PhilRice, 2018).
J. Impacts of climate change
Obstructive effects of climate change such as drought, typhoons, and floods have been affecting the agricultural sector (Mohammad et al., 2018). Super typhoons have excessively flooded agricultural areas resulting in crop destruction. Changing and intensifying rainfall exacerbate the situation. To minimize losses, harvesting machines that could retrieve totally lodged crops should be developed.
Opportunities
PhilRice, through its Rice Engineering and Mechanization Division (REMD), develops agricultural machines for local rice farming conditions, some of which are already available in the market. The following discussions are mainly focused on REMD-initiated interventions with other agencies complementary activities.
1. Contiguous Farming
Land consolidation facilitates the field operations in rice production such as water and nutrient management. The REMD Experimental and Demonstration farm showcases and tests the PhilRice-developed technologies, which can improve the rice production system through proper land consolidation. In general, the REMD demo farm is moving toward improved land consolidation, irrigation, and drainage infrastructure; improving access roads with entrance and exit; and developing a fully mechanized model farm.
2. Tiller for Deep Muddy Field Conditions
The laboy tiller was developed by PhilRice in 2006 to deal with deep muddy fields. It was commercialized particularly in Aurora where laboy fields are common. The tiller has been developed to lower the operating cost incurred by hand tractor by 50%. Moreover, a lightweight riding boat tiller using molded tough virgin polyethelyne (MDPE) plastic pontoon will soon be pilot-tested.
3. Climate-Resilient Technologies
A riding-type small farm tractor called MaKiSiG (Makina para sa pabago-bagong Klima at Sari-saring Gawain sa bukid) is now being developed, which can be operated in extreme field conditions like deep-mud and water-submerged fields. Aside from doing the functions of a typical hand tractor, this mini-tractor is also designed to dig canals for conveying water, construct small ponds for harvesting rainwater, and drill shallow tube wells.

Improving Competitiveness Through Farm Mechanization
RICE-BASED BIOSYSTEMS JOURNAL (2022) 10: 113-123 119
4. Trainings for Machine Operators and Technicians
PhilRice, through the initiative of the Agricultural Training Institute (ATI), had conducted training courses on the proper operation and maintenance of farm machines to the operators and technicians in Cordillera and Region III. This training enables participants to take the TESDA examination and eventually acquire their certificates. PhilRice intends to apply for accreditation regarding the conduct of the required examination so that the institute can also grant formal certifications to machine operators and technicians. REMD is also working on a proposal to establish an Agricultural and Biosystems Engineering (ABE) Unit in each PhilRice Branch Stations so personnel could efficiently learn the operation and proper maintenance of agricultural machines.
5. Locally Manufactured Machines
PhilRice has spearheaded the development of locally adapted models of specific machines. As of 2018, the following machines produced by accredited manufacturers are already commercially available: (1) microtiller, (2) laboy tiller, (3) hand tractor (HT) attachment, (4) drum seeder, (5) flatbed dryer, (6) reversible dryer, (7) seed cleaner, (8) SACLOB, (9) micromill; 10) brown rice mill; 11) flourmill; 12) open carbonizer; 13) continuous rice-husk carbonizer, (14) rice-husk stove, (15) gasifier stove, and (16) wind pump.
6. Alternative Energy Sources
Apart from fossil fuels, alternative and renewable energy sources should be promoted and adapted by farmers. The Rice Hull-Gasifier Engine Pump System developed by PhilRice provides alternative fuel (the gas produced from the partial burning of the rice hull) for a gasoline engine to pump for water supply. This system is 36% and 44% cheaper to operate than gasoline engine-pump and diesel engine-pump, respectively (Juliano et al., 2010). It is also an environment-friendly technology, which can provide irrigation water to communities with limited access to irrigation facilities.
7. Reduction of Postharvest Losses
Rice postharvest management protocol was generated to help reduce losses from 16 to 10%, covering the harvesting, threshing, drying, storing, and milling operations. A policy paper should be developed to facilitate deployment of this protocol.
PhilRice constantly improves the field performance and operation of mini-rice combine and stripper combine harvesters to minimize harvesting losses. The institute also developed some
improved drying technologies such as the flatbed-type mechanical dryer and the reversible flatbed dryer. Furthermore, the combined conduction and far-infrared radiation dryer is currently being pilot-tested. For better storage, the institute developed a hermetic storage called “SACLOB,” which is a climate-proof storage for rice seeds, milled rice, and brown rice. This airtight storage is made of tarpaulin and can store up to 50 kg of milled rice for 6 - 12 months. Another variant can store up to one ton of rice seeds.
8. Farm Service Providers
Mr. Romeo Vasquez, an agricultural engineer in Isabela, is one of the few providers of land preparation, transplanting, and harvesting services. Mr. Dante Delima of Occidental Mindoro also provides mechanization services from land preparation to postharvest operations and technical assistance on proper irrigation and crop management.
PhilRice, through its consultant Dr. Silvestre C. Andales, is proposing the establishment of Farm Service Centers (FSC) in collaboration with University of Philippines Los Baños (UPLB), which will be supported by government funding agencies. PhilRice and UPLB will initially establish three FSCs to provide technical assistance in the operation and maintenance of rice machinery with the financial assistance of the Land Bank of the Philippines (LBP).
9. Focused Intervention on the Reduction of Production Cost
Low productivity is evident in rice farms as a result of poor crop management and low agricultural mechanization level. According to Regalado et al., (2013), mechanization is most important in crop establishment, harvesting and threshing, and drying to boost productivity and reduce cost. High labor cost that constitutes 30% of the total production cost can be minimized with the use of farm machines.
A gear-transmission power tiller with a pivot mechanism for multiple farm operations is being developed to reduce labor cost. It can also be a universal prime mover for multiple farm machines such as rotovator, rice transplanter, paddy seeder, and multi-crop seeder.
PhilRice developed row-seeding and was introduced using a manual plastic drum seeder. However, its utilization is low due to concerns on its ergonomics. The REMD technologies currently available for direct seeding are: (1) multi-crop reduced-till planter, which has a fertilizer applicator, and can also plant maize, soybean, and mungbean; (2) local riding-type precision seeder, which is being field tested and evaluated; and (3) multi-purpose

Improving Competitiveness Through Farm Mechanization
120 RICE-BASED BIOSYSTEMS JOURNAL (2022) 10:113-123
seeder, which can also be used for corn and mungbean production, is being pilot tested in five main rice-producing regions.
Development of the local riding-type transplanter and rice combine harvester created an opportunity to collaborate with the Metal-Working Industries Association of the Philippines (MIAP) — a group of local manufacturers, and the Metal Industry Research and Development Center (MIRDC). The machineries are being pilot tested including a three-row mechanical weeder.
Strategies and ways forward
1. Corporate Farming
This is a new strategy being promoted by the Land Bank of the Philippines (LBP) to address the problems of farmer cooperatives and associations on lack of capital; shortage of competent business managers; and unstable financial controls (Javier, 2016). Corporate farming provides opportunities to improve the productivity of cooperative members through the available farm inputs and modern technologies. This will result in higher yield and income from mechanization (Lim, 1985). Fair share of income is also assured as farm management is being handled by an established financial.
2. Integrated Seed Production and Processing Centers
Centers using bulk handling, processing, and storage should be established in strategic locations in the Philippines to provide enough high-quality rice seeds to farmers. Utilization of certified seeds increases yield by 5 - 10%. In 2016, a modern rice seed processing facility with 2 tons seeds per hour capacity funded by the Korea International Cooperation Agency (KOICA) was inaugurated at PhilRice. The facility has two 6 t per batch recirculating dryer, two units of 4 t capacity per batch reversible airflow flatbed dryers, two units of 2 t h-1 air-screen machine, one unit of 2 t h-1 gravity separator, an automatic bagger and closer, and a 50-cubic-meter cold storage room.
3. Improved Rice Value Chain
This chain involves the chronological processes of production up to the distribution of final product to consumers with respective actors playing vital roles in series of activities. In each activity, different inadequacies arise, resulting in the inefficiency of the rice value chain. The study conducted by Miah (2013), identified opportunities for improvement on the chain: (a) providing proper storage for paddy and milled rice; (b) using high-quality seeds; (c) storing paddy for better price in off-season; (d) using of modern technologies to reduce production cost; (e)
improving transportation system; and (f) equipping involved actors with a clear concept of the rice value chain. Improving the chain will make marketing of rice profitable to farmers and ensure consumers satisfaction.
4. Farmer-friendly Credit and Loan Facility
A credit facility that can be easily availed by farmers for farm input and mechanization must be in place. Innovative financing schemes have to address farmers’ limited collateral; hence, must accept movable assets, minimize long processing of documents, and simplify requirements (DA, 2016).
Currently, DA’s Agricultural Competitiveness Enhancement Fund (ACEF) Lending Program, managed by the LBP, provides loans to the agriculture and fishery sectors. The Farm Equipment and Machineries Loan Program was launched by DA to help improve local farm mechanization. This program initially offers a PhP 400 million fund to farmers with a 6% interest per annum, payable in 8 years (Arcalas, 2018).
5. Strengthening Local Agri-machinery Manufacturers
As mandated by R. A. 10601 or the Agriculture and Fisheries Mechanization (AFMech) Law, the DA will promote and encourage the production of locally made agricultural machines. These will be cheaper than the imported machines; thus, affordable for the Filipino farmers. Therefore, intensified, sustained support to strengthen the capability of local manufacturers must be provided.
6. Use of Renewable/Alternative Energy Sources
Mechanization cannot be fully discussed without referring to the utilization of fossil fuel. The use of alternative energy sources should be continuously encouraged and promoted as a way to ease the burden on the spiraling cost of fuel. Renewable energy sources include solar, wind, ocean, hydropower, biomass, geothermal, and biofuels. The AFMech Law promotes these renewable, non-conventional alternative energy sources for agricultural machinery. Moreover, further research should be done to enhance the use of these renewable energy sources.
7. Smart Farming
Smart farming and precision agriculture involve the integration of advanced technologies into existing farming practices to increase production efficiency and quality of the agricultural products (Brown, 2018). The September 2018 National Conference on Smart Farming 4.0 spearheaded by Philippine Council for Agriculture, Aquatic and Natural

Improving Competitiveness Through Farm Mechanization
RICE-BASED BIOSYSTEMS JOURNAL (2022) 10: 113-123 121
Resources Research and Development (PCAARRD) and PhilRice was held in Batangas State University and attended by government and private institutions. Collaboration among agencies can effectively promote smart farming by conducting significant research and development efforts.
ConclusionFarm mechanization is one of the important
factors in the development of Philippine rice industry. Mechanizing the sector will improve the production efficiency and quality of rice. Highly-mechanized rice farming can be achieved if mechanization challenges will be addressed specifically: (1) small-sized or irregularly shaped paddy fields, (2) deep- mud and soft soils with deep hardpans, (3) impacts of climate change, (4) lack of qualified skilled workers, (5) increased usage and high cost of fossil fuels, (6) postharvest losses, (7) insufficient number of established farm custom service providers, (8) lack of capital for mechanization, and (9) limited availability of quality metal parts, and after-sales service. Through the initiatives of REMD, several machines have been developed to address these challenges and some are now available in the market, while others are undergoing pilot-testing. In spite of numerous and unending present challenges and constraints in improving the competitiveness of Filipino rice farmers, opportunities are available to raise the awareness level of rice farm mechanization in the Philippines. DA-PhilRice’s initiated R&D interventions could also address these challenges. Strategies and ways forward are recommended to comprehensively promote mechanization in rice farming and modernization of the rice industry. Through the implementation of these strategies, government support, and cooperation of the stakeholders, the competitiveness of the Filipino rice farmers and the rice industry is possible.
AcknowledgmentThe authors are grateful to the program and
project leaders and researchers of the REMD and Socioeconomics Division of PhilRice for their invaluable contributions to this paper.
Literature CitedAlizadeh MR, Allameh A (2013) Evaluating rice losses in various
harvesting practices. International Research Journal of Applied and Basic Sciences 4(4): 894-901
Amare D, Endalew W (2016) Agricultural mechanization: assessment of mechanization impact experiences on the rural population and the implications for Ethiopian smallholders. Engineering and Applied Sciences 1(2): 39-48
Andales SC, Gagelonia E, Ilao R, Umali B (2013) Custom service provision centers for rice farm mechanization in the Philippines. Paper presented during the Annual Rice Forum held on November 22, 2013 at the BSWM Auditorium, Quezon City
Apiors EK, Kuwornu J, Kwadzo G (2016) Effect of mechanisation use intensity on the productivity of rice farms in southern Ghana. Acta Agriculturae Slovenica 107(2): 439-451
Arcalas JY (2018) Piñol announces P400-million farm mechanization loan program. Retrieved from https://businessmirror.com.ph/pinol-announces-p400-million-farm-mechanization-loan-program/ (accessed October 4, 2018)
Arida IA, Beltran JC, Bordey FH, Tanzo IR, Relado RZ, Malasa RB, Antivo MJT (2017) Socioeconomic impact of adopting rice combine harvester in the Philippines (pp 4). In Rice R&D Highlights 2017. Nueva Ecija, Philippines: Philippine Rice Research Institute
Balisacan AM, Sebastian LS (2006) Securing rice, reducing poverty: challenges and policy direction. Retrieved from https://www.researchgate.net/publication/267629865_Securing_Rice_Reducing_Poverty_Challenges_and_Policy_Directions (accessed January 5, 2022)
Bautista EG, Kim J, Kim Y, Panganiban ME (2017) Farmer’s perception on farm mechanization and land reformation in the Philippines. Korean Soc. Int. Agric 29(3): 242-250
Bautista AMF (2017) Facing giants in the rice security arena. PhilRice Magazine 30(4): 14-15
Bautista EU (2003) Mechanizing rice production and postharvest operation in the Philippines: present status, prospects and challenges. AGRIS 10(2): 27-39 Retrieved from http://agris.fao.org/agris-search/search.do?recordID=PH2004000787 (accessed October 9, 2018)
Bautista EU (2001) Mechanizing rice agriculture in the Philippines. In Philippine Rice RD&E Scholars Forum (pp 63-75). Nueva Ecija, Philippines: Philippine RiceResearch Institute and DA-BAR
Bingabing RL, Paz RR, Badua AE, Gragasin M (2016) Department of Agriculture Rice Mechanization Roadmap: on-farm and Postharvest Mechanization Programs (2011-2016). In Banta SJ (Ed.). Mechanization in rice farming (pp 353). Los Baños, Laguna: Asia Rice Foundation
Bordey FH, Beltran JC, Arida IA, Litonjua AC, Lapurga MC, Collado WB (2017) Comparative efficiency of rice farming in Asia and the Philippines (pp 1-140). Nueva Ecija, Philippines: Philippine Rice Research Institute
Bordey FH, Moya PF, Beltran JC, Dawe DC (2016) Competitiveness of Philippine rice in Asia (pp 76-101). Nueva Ecija, Philippines: Philippine Rice Research Institute
Brown M (2018) Smart-farming- automated and connected agriculture. Retrieved from https://www.engineering.com/DesignerEdge/DesignerEdgeAr (accessed October 25, 2018)

Improving Competitiveness Through Farm Mechanization
122 RICE-BASED BIOSYSTEMS JOURNAL (2022) 10:113-123
Cachuela RL, Apaga ARM, Pangilinan JE (2009) Status of grains postharvest program in the Philippines. In the 6th National Grains Postproduction Conference, November 25-27, 2009. Bohol, Philippines: Philippine Rice Postproduction Consortium
Cao W, Huang H, Yang M (2014) The effect of agricultural mechanization on food yield in China. Retrieved from https://elibrary.asabe.org/abstract.asp?aid=44572 (accessed August 18, 2021)
Caraga DA (2021) Modernizing aAAgriculture tThrough fFarm mMechanization. Retrieved from https://pia.gov.ph/press-releases/2021/07/17/modernizing-agriculture-through-farm-mechanization (accessed August 5, 2021)
DA [Department of Agriculture] (2013) PHL farm mechanization is 1.23 hp/ha. Retrieved from https://www.official gazette.gov.ph/2013/05/21/phl-farm-mechanization-is-1-23-hpha/ (accessed October 25, 2018)
DA [Department of Agriculture] (2016) The national agricultural and fishery mechanization program (2017-2022). Quezon City, Philippines: DA
Emami M, Almassi M, Bakhoda H, Kalantari I (2018) Agricultural mechanization, a key to food security in developing countries: strategy formulating for Iran. Agriculture and Food Security 7(1): 1-12
Faleye T, Abedija JA, Farounbi AJ (2012) Improving small-farm productivity through appropriate machinery in Nigeria. International Research Journal of Agricultural Science and Soil Science 2(9): 386-389
Fenangad DB, Abon JE, Mabalot P, Orge RF (2015) Production of biodiesel from waste cooking oil using the cruzesterification process for rice farming operations. OIDA International Journal of Sustainable Development 8(12): 25-32
Gagelonia EC, Martinez RC, Alojado DD (2013) Mechanizing drying of paddy: an industry concern. In the Annual Rice Forum, November 22, 2013 at the BSWM Auditorium, Quezon City, Philippines
Gonzales LA, Elca CD, Paningbatan BC, Umali RM, Gonzales A A, Ignacio JC (2013) Socioeconomics analysis of rice mechanization in the Philippines. Paper presented during the Annual Rice Forum held on November 22, 2013 at the BSWM Auditorium, Quezon City, Philippines
Hossen M, Talukder M, Amin R, Al Mamun MR, Rahaman H, Paul S, Rahman M, Miaruddin M, Ali M, Islam M (2020) Mechanization status, promotional activities and government strategies of Thailand and Vietnam in comparison to Bangladesh. Agri Engineering 2(4): 489-510
Javier EQ (2016) Rice cooperatives: corporate farming with a twist. Retrieved from https://business.mb.com.ph/2016/ 11/26/rice-corporatives-corporate-farming-with-a-twist/ (accessed October 8, 2018)
Juliano AS, Bautista EU, Moliñawe LB (2010) Rice hull gasifier engine-pump system. Rice Technology Bulletin 71. Retrieved from https://www.pinoyrice.com/resources/reading-materials/rice-technology-bulletin/?cp=3 (accessed December, 2010)
Lantin RM (2001) Efficient mechanization of lowland rice production through land consolidation. Philippine Agricultural Mechanization Bulletin 3(1): 17-24
Lim PC (1985) Effect of agricultural mechanization on farm income patterns. Philippine Journal of Development 12(1): 198-210
Miah MS (2013) Value chain analysis of rice marketing in selected areas of Jalampur District. (Thesis.) Bangladesh: Bangladesh Agricultural University
Miraflor MB (2020) PHilMech starts task of agriculture modernization with funds from RT. Retrieved from https://mb.com.ph/2020/12/27/philmech-starts-task-of-agriculture-modernization-with-funds-from-rtl/ (accessed August 5, 2021)
Padin MG (2015) Philippines needs block farms, less farmers-experts. Retrieved from https://businessmirror.com.ph/philippines-needs-block-farms-less-farmers-experts/ (accessed October 8, 2018)
Paras FO, Amongo RMC (2005) Technology transfer strategies for small farm mechanization technologies. Retrieved from http://www.fftc.agnet.org/library.php?func=view&id= 20110726161100 (accessed October 5, 2018)
PHilMech [Philippine Center for Postharvest Development and Mechanization] (2010) Postharvest losses. Retrieved from http://old.philmech.gov.ph/?page=phlossinfo (accessed October 9, 2018)
PhilRice [Philippine Rice Research Institute] (2016) State-of-the-art rice seed processing facility inaugurated. Retrieved from http://www.philrice.gov.ph/state-of-the-art-rice-seed-processing-facility-inaugurated (accessed October 15, 2018)
PSA [Philippine Statistics Authority] (2017) Consumption of selected agricultural commodities in the Philippines, Vol. 1, February 2017. Retrieved from https://psa.gov.ph/content/consumption-selected-agricultural-commodities-philippines-0 (accessed April _ 2018)
Regalado MJC, JA Ramos, TC Juganas, MM Raneses, JR Waliwar (2020) Field validation of rice postharvest management protocol for reduced losses and improved rice quality. Annual study report
Regalado MJC, Ramos PS (2018) Field testing of a rice crop postharvest management protocol for reduced postproduction losses and improved product quality.Rice-Based Biosystems Journal 4: 31-40
Regalado MJC, Bautista EU, Tado CJM, Gagelonia EC, Sicat EV, Canapi G,
Panagsagan J (2013) Mechanization of land preparation and crop establishment operations in rice farming in the Philippines. Paper presented during the Annual Rice Forum held on November 22, 2013 at the BSWM Auditorium, Quezon City, Philippines
Rodulfo VA, Del Rosario AC, CJM Tado (2008) Country Report: Philippines. Country report presented during the Study Meeting on Appropriate Mechanization Strategies for Improving Agricultural Productivity, September 24-30, 2008. New Delhi, India
Salvador AR, Domingo MR, Camaso VEB, Gutierrez RQ, Paz RR (2012) Assessment of the state and magnitude of the paddy grains postproduction losses in major production areas. PHilMech Journal 2(1): 19-37
Sanchez F (2015) Challenges faced by Philippine agriculture and UPLB's strategic response towards sustainable development and internalization. Journal of the International Society for Southeast Asian Agricultural Sciences 21(2): 191-199

RICE-BASED BIOSYSTEMS JOURNAL (2022) 10: 123-128 123
ISOLATION AND CHARACTERIZATION OF PLANT-GROWTH-PROMOTING BACTERIA UNDER LONG-TERM
IRRIGATED LOWLAND RICE ECOSYSTEMPaul John M. Pangilinan1, Editha V. Evangelista2, Wilfredo B. Collado, and Jayvee A. Cruz2
1Central Luzon State University, Science City of Muñoz, Nueva Ecija92Philippine Rice Research Institute, Maligaya, Science City of Muñoz, Nueva Ecija
*Corresponding author: Jayvee A. Cruz: [email protected]
AbstractSixty-one nitrogen-fixing bacteria found at the Long-term Fertility Experiment (LTFE) plots of Philippine
Rice Research Institute in Nueva Ecija were isolated and characterized for their plant-growth promoting activities. These include indole-3-acetic acid (IAA) production, phosphate solubilization, and starch hydrolysis. Thirty-three of the isolates were obtained from the fertilized plots and 28 from the unfertilized plots. Sixteen isolates solubilized tricalcium phosphate and only 4 hydrolyzed starch. For IAA production, 57% of bacterial isolates were positive while the remaining 43% were negative based on qualitative observation of color development. It was manifested by the change in color of the broth culture from pink to red. Most of the positive isolates for IAA production were obtained from the fertilized plot. On the average, Phosphorus Solubilization Index (PSI) of bacterial isolates from the LTFE area ranges from 1.39 to 2.12. The highest solubilizing index was exhibited by F3-008 (2.12). These potential plant growth-promoting bacteria (PGPB) needs to be evaluated in a plant-soil system to uncover their effectiveness as plant growth-promoter under field conditions.
Keywords: Indole-3-acetic Acid, Phosphate Solubilization, Starch Hydrolysis, Plant Growth-promoting Bacteria, Long-term Fertility Trials
IntroductionRice (Oryza sativa L.) is the staple food of more
than half of the world’s population (Gross and Zhao, 2013). It is a very rich source of carbohydrates as well as main livelihood of people particularly in Asian countries. This 21st century, cultivation, marketing, and consumption of rice are changing rapidly. The world population is expected to increase beyond 8 million implying major challenges in the food sector and threatens food sustainability (Toriyama et al., 2005; Smol, 2012).
Intensification of rice production is a way to mitigate these demands; thus, an increase in chemical fertilizer usage is expected. The long-term fertility experiment (LFTE) of the Philippine Rice Research Institute (PhilRice) is one of the oldest long-term fertility trials in the world, which started to operate since 1970. Its major function is to assess the effects of fertilizer treatments on soil productivity and soil health under long-term conditions. Due to the possible consequences of increased usage of chemical fertilizers in rice crop production, there is a growing interest on alternative strategies to ensure the sustainable production and maintenance of soil health. Soil microorganisms are vital component of the soil system because of their crucial role in all biogeochemical processes, which occur in the soil
allowing the mobilization of plant nutrients (Basau et al., 2021).
Plant growth-promoting bacteria is a non-pathogenic and strongly root colonizing bacteria that resides on the rhizoplane and increase plant’s yield by one or more mechanisms (Babalola, 2010). Presence of PGPBs entails either plants are provided with growth-promoting substances that is synthesized by the bacterium or uptake of specific plant nutrients is facilitated. The indirect promotion of plant growth occurs when potential plant growth-promoting bacteria (PGPB) prevent the deleterious effects of phyto-pathogenic microorganisms (Glick, 1995; Ahemed and Kibret, 2013). PGPB-mediated growth occurs through altering the whole microbial community in the rhizoplane niche. This is done through the production of various plant growth promoting substance such as IAA, gibberellins, and siderophore and through biochemical mechanisms of various growth-promoting characteristics such as phosphate solubilization and antifungal activity (Kloepper and Schroth, 1981).
Interest in the potentials of indigenous plant-growth promoting microorganisms as microbial inoculant in agriculture due to their ability to induce plant growth and improve the microbial health of the soil is continuously rising. This study isolated
RESEARCH NOTE

Isolation and Characterization of Plant-Growth-Promoting Bacteria
124 RICE-BASED BIOSYSTEMS JOURNAL (2022) 10:123-128
and characterized indigenous rhizoplane bacteria with multiple plant-growth promoting activities. It also initiated a unique opportunity to look for the promising growth-promoting-bacteria that has the potential to improve soil health and contribute to higher crop yield.
Materials and MethodsSoil Sample Collection
Soil samples were collected from the LTFE of the the PhilRice Central Experiment Station (CES) in Nueva Ecija, Philippines. From each sampling plots (planted with NSIC Rc 160 and fertilizer treatments of no N-P-K fertilization and +N-P-K Site-Specific Nutrient Management [SSNM] for Nitrogen), soil samples were collected at the post-harvest stage of rice. Single point samples were collected using the standard procedure of soil sampling. Soil samples were placed in clear sterile plastic containers and transported to the laboratory.
Isolation and Purification of Bacterial Isolates
One gram of fresh soil sample was added into a centrifuge tube containing 9 mL water blank. Soil suspensions were mechanically shaken using a vortex mixer, afterwards diluted to make a series of four ten-fold dilutions. Meanwhile, 0.1 mL of the 10-2 and 10-3 dilutions was spread plated on duplicate Jensen’s Nitrogen-free (N-Free) agar plates. The plates were incubated under room temperature for 7 days and morphologically different colonies appearing on the medium were purified.
Media used
Jensen’s N-free medium was used for the isolation and purification of free living N2-fixing bacteria. This medium was only prepared when needed. The media was sterilized for 20 min under 121o C and 15 lbf/in² before use.
In vitro Screening of Bacterial Isolates for Plant Growth-Promoting Activities
Microbiological assays for the assessment of plant growth-promoting activities (PGPA) were conducted to determine the potential of bacterial isolates as plant growth promoters. Isolates were tested for IAA production, phosphate solubilization, and starch hydrolysis.
IAA production assay
A loopful of bacteria was inoculated into Jensen’s N-free broth supplemented with 0.05 g L-Tryptophan
(Shahab et al., 2009). After 7 days of incubation, cultures were centrifuged for 10 min at 13,000 rpm under 4˚C. The IAA in the supernatant was detected colorimetrically by incorporating Salkowki’s reagent (1.0 mL 0.5 M FeCl3, 30.0 mL H2SO4, and 50.0 mL distilled water), 1 ml of the supernatant was reacted with 2.0 ml of the reagent. Pink to red color development indicates positive result. Absorbance values were determined using a spectrophotometer (590 nm) and the concentration of IAA was determined using the IAA standard curve.
Phosphate solubilization assay
Bacterial isolates were point-inoculated on the surface of the Pikovskaya’s media and were incubated for 5 days. Clearance or halo zone formation around the bacterial colony indicates phosphate solubilization (Shahab et al., 2009). Phosphate solubilizing efficiency of bacterial isolates was semi-quantitatively determined in terms of its PSI using the formula (Sarker et al., 2012):
Eq. 1
Starch hydrolysis assay
Bacterial isolates were streak-inoculated on starch agar plates. After 24 h of incubation under room temperature, the surface of the plate was submerged with Lugol’s iodine solution to determine the presence or absence of starch in the vicinity of bacterial growth. Microbial starch hydrolysis was revealed as a clearing zone surrounding bacterial colonies (Collins et al., 1995).
Results and DiscussionIsolation of PGPB from the Soil
Sixty-one nitrogen-fixing bacteria were obtained from soil samples from LTFE plots (Table 1). Thirty-three of the isolated bacteria came from the fertilized treatment and 28 were isolated from the unfertilized treatment. Jensen’s medium was used in the isolation and purification of nitrogen-fixing bacteria. The high number of nitrogen-fixing bacteria from the rhizoplane indicates that soils have numerous nitrogen-fixing bacteria that can induce plant-growth. Bacterial isolates from LTFE plots were considered as nitrogen-fixers due to their ability to grow in Jensen’s N-free medium, which is selective for diazotrophs. Nitrogen-fixing bacteria were able to fix atmospheric nitrogen and grow on N-free medium.

Isolation and Characterization of Plant-Growth-Promoting Bacteria
RICE-BASED BIOSYSTEMS JOURNAL (2022) 10: 123-128 125
Isolates IAAmg/L PSI Starch
HydrolysisF1-001 332.35 0.00 -F1-002 54.50 0.00 -F1-003 73.00 0.00 -F1-004 8.00 0.00 -F1-005 0.00 0.00 -F1-006 47.50 0.00 -F1-007 0.00 1.39 -F1-008 124.25 0.00 -F1-009 336.50 0.00 -F1-010 408.50 0.00 -F1-011 0.00 0.00 +F1-012 0.00 0.00 -F1-013 129.75 0.00 -F1-014 343.50 0.00 -F1-015 0.00 0.00 -F2-001 29.75 1.50 -F2-002 0.00 0.00 -F2-003 408.00 0.00 -F2-004 0.00 1.55 -F2-005 0.00 0.00 -F2-006 441.50 0.00 -F2-007 539.50 0.00 -F2-008 0.00 0.00 -F2-009 61.50 1.71 -F2-010 494.75 0.00 -F3-001 0.00 1.63 -F3-002 0.00 0.00 -F3-003 0.00 1.41 -F3-004 38.75 0.00 -F3-005 105.50 1.66 -F3-006 236.75 0.00 -F3-007 34.25 0.00 -F3-008 0.00 2.12 -UF1-001 0.00 0.00 -UF1-002 295.50 0.00 -UF1-003 215.25 1.81 -UF1-004 17.50 1.41 -UF1-005 9.25 1.43 -UF1-006 52.50 0.00 -UF1-007 0.00 0.00 +UF1-008 39.00 0.00 -UF1-009 153.00 0.00 -UF1-010 192.25 1.45 -UF2-001 334.00 0.00 -UF2-002 164.50 0.00 +UF2-003 418.25 0.00 -UF2-004 193.25 0.00 -UF2-005 13.50 0.00 -UF2-006 331.00 0.00 -UF2-007 12.50 1.63 -UF2-008 16.00 0.00 -UF2-009 56.75 0.00 -UF2-010 372.75 0.00 -UF2-011 247.75 0.00 -UF3-001 37.00 0.00 -UF3-002 287.25 1.43 -UF3-003 29.50 1.41 -UF3-004 72.00 1.47 -UF3-005 503.00 0.00 -UF3-006 29.50 0.00 +UF3-007 131.5 0.00 -
In vitro screening of nitrogen-fixing bacteria for their PGPA
IAA production
Based on qualitative observation of color development, 57% of the total bacteria isolated from LTFE were positive for IAA while the remaining 43% were negative. IAA production was manifested by the change in color of the broth culture from pink to red after the incorporation of Salkowski’s reagent (Figure 1). Most of the positive isolates that are positive for IAA production were obtained from the fertilized plot. Quantitative determination of IAA was done using regression analysis based on the intensity of color development against a standard series. Results showed that bacterial isolates from the fertilized and unfertilized plots produced an average amount of IAA of 237.04 and 165.69 mg L-1, respectively.
Most of the nitrogen-fixing isolates were IAA producers, which have the potential to stimulate plant growth provided that tryptophan, its precursor, is available (Marumo, 1968). Tryptophan is an essential amino acid that undergoes oxidation via bacterial enzymatic activities. The development of pink to red color in the broth suspension was due to the complex formed by the reaction between Fe-H2SO4 solution and IAA present in the solution (Aly et al., 2012; Gronomeyer et al., 2012). Inoculation of IAA producing isolates induces lateral root and root hair development, which has profound implications on plant growth and development (Wahyudi et al., 2011). Numerous microorganisms produce IAA, which might have been responsible for the positive findings in colorimetric tests (Ahemad and Kibret, 2013).
Phosphate solubilization
Sixteen of the 61 isolates were positive for phosphorus solubilization. Phosphorus solubilization was manifested by the formation of halo or clearing zone around bacterial colonies in the Pikovskaya’s media, which contains Ca3PO4 as source of phosphorus (Figure 2). The formation of clearing zone may be attributed to the production of low molecular weight organic acids by the bacteria through the presence of hydroxyl and carbonyl groups, which chelate the cations bound to phosphate; thus, increasing phosphorus availability in the soil that can enhance plant growth.
Table 2 shows the PSI of the isolates positive for phosphate solubilization. Bacterial phosphorus solubilization was quantified by computing the PSI (eq. 1). On the average, PSI of bacterial isolates from the fertilized plot ranged from 1.39 to 2.12. The highest solubilizing index was exhibited by F3-008 (2.12).
Table 1. Growth-promoting activities of 61 nitrogen-fixing isolates.

Isolation and Characterization of Plant-Growth-Promoting Bacteria
126 RICE-BASED BIOSYSTEMS JOURNAL (2022) 10:123-128
In terms of phosphate solubilization, 16 isolates were found to be positive. The strains of the genera Pseudomonas, Bacillus, and Rhizobium are among the most efficient phosphate solubilizers. It has been established that the principal mechanisms of phosphate solubilization is the production of low molecular weight acids that chelates the ions bound to phosphate through their hydroxyl and carbonyl groups; thus, increasing phosphate availability for plant utilization. Moreover, phosphate solubilizing bacteria can produce organic acids such as citric, glyoxalic, malic, Ketobutyric, fumaric, and tartaric acid. (Kannapiran and Sri Ramkumar, 2011). Proliferation of phosphate solubilizing bacteria in the soil often yields to soil acidification, which leads to phosphorus solubilization (Zhu et al., 2011).
Starch hydrolysis
Four (UF1-007, UF2-002, UF3-006, F1-011) of the 55 isolates were positive for starch hydrolysis (Table 1). Three of the four positive isolates were obtained from the unfertilized plot. Starch hydrolysis is manifested by the formation of clearing zone around bacteria streak after the surface of the medium was washed
Figure 2. Phosphate solubilization on Pikovskaya’s agar medium. Positive result is indicated by the presence of clearing zone around bacterial colony.
Figure 1. IAA production in N-free broth with Salkowski’s reagent, development of red-pink color after the incorporation of Salkowski’s reagent indicates the presence of IAA in the broth solution.
Table 2. PSI of bacterial isolates positive for phosphorus solubilization assay.
Isolate CodeColony
Diameter (mm)
Halo Zone Diameter
(mm)PSI
F1-007 07.75 10.75 1.39
F2-001 05.50 08.25 1.50
F2-004 05.25 08.12 1.55
F2-009 06.12 10.50 1.71
F3-001 03.75 06.12 1.63
F3-005 08.12 13.50 1.66
F3-003 11.82 16.75 1.41
F3-008 04.25 09.00 2.12
UF1-003 05.87 10.62 1.41
UF1-004 06.75 09.50 1.41
UF1-005 06.62 09.50 1.43
UF1-010 08.12 11.75 1.45
UF2-007 04.50 06.12 1.63
UF3-002 06.37 09.12 1.43
UF3-003 05.50 07.75 1.41
UF3-004 04.25 06.25 1.47

Isolation and Characterization of Plant-Growth-Promoting Bacteria
RICE-BASED BIOSYSTEMS JOURNAL (2022) 10: 123-128 127
with iodine solution (Figure 3). This test is used to identify bacteria that can hydrolyze starch using α-amylase and oligo-1,6-glucosidase enzyme. Iodine solution must be added to the starch agar to be able to interpret the results of the starch hydrolysis test. Iodine reacts with the starch by forming a dark brown color. Subsequently, hydrolysis of starch yields to a clearing zone around bacterial growth (MacFaddin, 2000). The principal mechanism of starch hydrolysis is through the secretion of exoenzyme, including α-amylase and oligo-1,6-glucosidase, which hydrolyze starch by breaking the glucosidic linkages between the sugar subunits (Collins et al., 2004). The bacterial isolates are non-starch hydrolyzing, which could be attributed to the low exoenzyme-producing ability of the isolates; making the bacteria unable to split starch into individual α-glucose sub-units. This finding is not new with respect to nitrogen-fixing bacteria as similar results were obtained by Dhevendaran et. al (2013).
ConclusionThe results indicate that rice paddy soil collected
from the fertilized LTFE plots are good source of potential plant growth-promoting bacteria. Several bacteria were isolated and proved to be promising plant growth-promoters based on a series of biochemical screening. Growth-promoting activities of the bacteria include IAA production, phosphate solubilization, and starch hydrolysis. These traits are known and proven to positively affect plant growth and development via direct and indirect mechanisms. Hence, these potential PGPB need further evaluation in a plant-soil system to uncover their effectiveness as plant growth-promoters under field conditions.
Literature CitedAhemad M, Kibret M (2013) Mechanisms and applications
of plant-growth promoting rhizobacteria: Current perspective. Journal of King Saud University-Science 26:1-20
Aly MM, Ahmed HE, Jastaniah SD (2012) Synergistic effect between Azotobacter vinelandii and Streptomyces sp. isolated from saline soil on seed germination and growth of wheat plant. Journal of American Science 8: 667-676
Babalola B (2010) Beneficial bacteria of agricultural importance. Biotechnology Letter 32:1559-1570
Basau, S, Kumar, G, Chhabra, S, Prasad, R (2021) Role of soil microbes in biogeochemical cycle for enhancing soil fertility. In Verma JP, Macdonald CA, Gupta VK, Podile AR (Eds.). New and Future Developments in Microbial Biotechnology and Bioengineering (pp 149-457). Elsevier
Collins CH, Lyne PM, Grange JM, Falkinham JO (2004) Identification methods. In Collins CH (Ed.). Collins and Lyne's Microbiological Methods (8th ed.) (pp. 89-109). Euston Road, London: Arnold Publishers
Collins RA, Mcnally T, Fothergill-Gilmore LA, Muirhead H (1995) A subunit interface mutant of yeast pyruvate kinase requires the allosteric activator fructose 1,6-bisphosphate for activity. The Biochemical Journal 310: 117-23
Dhevendaran K, Preetha G, Hari BNV (2013) Studies on nitrogen-fixing bacteria and their application on the growth of seedling of Ocimum sanctum. Pharmacognosy Journal 5(2): 60-65
Glick, BR (1995) The enhancement of plant growth by free living bacteria. Canadian Journal of Microbiology 41(2): 109-117
Gronomeyer AL, Burbano CS, Hurek T, Reinhold-Hurek B (2012) Isolation and characterization of root-associated bacteria from agricultural crops in the Kavango region of Nambia. Plant and Soil 365: 67-82
Figure 3. Starch hydrolysis assay on starch agar medium. Positive result is indicated by the presence of clearing zone around the streak.

Isolation and Characterization of Plant-Growth-Promoting Bacteria
128 RICE-BASED BIOSYSTEMS JOURNAL (2022) 10:123-128
Gross, BL, Zhao, Z (2013) Archeological and genetic insights into the origins of domesticated rice. Proceedings of the National Academy of Sciences of the United States of America Apr 2014, 111(17): 6190-6197
Kannapiran E, Sri Ramkumar V (2011) Isolation of phosphate solubilizing bacteria from the sediments of Thondi coast, Palk Strait, Southeast coast of India. Annals of Biological Research 2:157-163
Kloepper JW, Schroth MN (1981) Relationship of in vitro antibiosis of plant growth-promoting rhizobacteria to plant growth and the displacement of root microflora. Phytopathology 71:1020-1024
MacFaddin JF (2000) Biochemical tests for identification of medical bacteria (3rd ed.). Philadelphia, PA: Lippincott Williams and Wilkins
Marumo S, Hattori H, Abe H, Munakata K (1968) Isolation of 4-chloroindolyl-3-acetic acid from immature seeds of Pisum sativum. Nature 219: 959-960
Shahab S, Ahmed N, Khan NS (2009) Indole acetic acid production and enhanced plant growth by indigenous PSBs. African Journal of Agricultural Research 4(11): 1312-1316
Smol JP (2012) Climate change: A planet in flux. Nature 483: 12-15
Toriyama K, Heong KL, Hardy B (2005) Rice is life: Scientific perspective for the 21st century. Proceedings of the world rice research conference (p 7). Tsukuba, Japan: International Rice Research Institute
Wahyudi AT, Astuti RP, Widyawati A, Mery A, Nawangsih AA (2011) Characterization of Bacillus sp. strains isolated from rhizosphere of soybean plants for their use as potential plant growth-promoting Rhizobacteria. Journal of Microbiology and Antimicrobials 3(2): 34-40
Zhu F, Qu L, Hong X, Sun X (2011) Isolation and characterization of a phosphate solubilizing halophilic bacterium Kushneria sp. YCWA18 from Daqiao Saltern on the coast of Yellow Sea of China. Evidence-Based Complementary and Alternative Medicine 2011: 615032

RICE-BASED BIOSYSTEMS JOURNAL (2022) 10 129
CALL FOR PUBLICATIONRice-Based Biosystems Journal
SCOPE
The Rice-Based Biosystems Journal encourages publication of original research and review articles that have impact on applied and integrated rice and rice-based cropping systems in a particular ecosystem. The Journal provides information on rice-based researches on soil and crop management, crop protection, crop improvement, grain quality, farm machinery, resource use efficiency, plant biology, nutraceuticals, food value-adding systems, biofertilizers, biopesticides, biomaterials, and system analysis and simulation. It also covers the economics, social, and communication systems that influence the landscape of rice and rice-based cropping systems.
AUTHOR’S GUIDELINES
1. Submission and Acceptance of Manuscripts
Manuscripts are submitted to Rice-Based Biosystems Journal: [email protected]. Manuscripts should be formatted as described in the Rice-Based Biosystems Journal Author Guidelines and follow the PhilRice style guide. When preparing your file, please use Times New Roman as font type, and 12 as font size for the text. Please do not use Japanese or other Asian fonts. Do not use automated or manual hyphenation. With your submission, you will have to complete, sign, and send the Copyright Transfer Agreement. Authors may provide names of potential reviewers for their manuscript. Authors must inform the editorial assistant of any possible conflict of interest capable of influencing their judgement, and if necessary, a disclaimer will be included. Revised manuscripts must be submitted two weeks after the authors are notified of conditional acceptance pending satisfactory revision. Authors resubmitting manuscripts should follow the same procedures as for submission of new manuscripts. If accepted, papers become the copyright of the journal. Photos and tables must be high resolution scans (JPEG at 300 dpi).
2. Requirements for Manuscripts
2.1. Language
The language of publication is English.
2.2. Format
The first page should contain the name and address of the institute where the work has been done, the title of the paper, name(s) and initial(s) of the author(s), the e-mail address of the corresponding author, and the number of figures and tables.
The main text shall be preceded by an abstract, which is always in English and contains the background for the research undertaken, reference to the material and methods used, as well as main results and conclusions. It should not exceed 220 words. Up to seven ‘keywords’ should be added. A short version of the title (running title) should also be given.
The main text should be divided into the following sections: Introduction, Materials and Methods, Results and Discussion, Conclusion, Recommendation, Acknowledgment, and Literature Cited. Facts explained by tables or figures need no lengthy explanation in the text. Numerical material should be submitted only after statistical processing.

130 RICE-BASED BIOSYSTEMS JOURNAL (2022) 10
The manuscript comprises a printout of the text and a list of all figures and tables with their captions and titles on a separate piece of paper. In anticipation of the online edition, we ask that you convey the essential information within the first 60 characters of the captions. Each figure, table, and bibliographic entry must have a reference in the text. The preferred position for the insertion of figures and tables should be marked on the margin of the text of the manuscript. Any corrections requested by the reviewer should already be integrated into the file. The text should be prepared using standard software (Microsoft Word). Please do not include footnotes.
2.3. Length
The manuscript should be typed double spaced with a 4 cm left margin. Manuscripts, including figures and tables, should not exceed 25 printed pages. The publication of shorter papers may be given priority.
2.4. Units, Abbreviations, and Nomenclature
All units and measures must conform to the international standard-system (SI). Botanical genus and species names should be set in italics.
2.5. Illustrations and Tables
The number of tables and figures should be kept to the minimum necessary, and have a maximum of 13 cm in height and 17 cm in width. All figures should include reproducible copies marked with the author’s name, short title, and figure number. Figures submitted as electronic file should be saved in PNG instead of JPEG for better quality. Powerpoint and Word graphics are unsuitable for reproduction.
Submit high-contrast photographic materials suitable for reproduction. Images should be of high quality with respect to detail, contrast, and fineness of grain to withstand the inevitable loss of contrast and detail during the printing process.
Scanned figures (usually in JPEG format) should have a resolution of 300 dpi (halftone) or 600 to 1200 dpi (line drawings) in relation to the reproduction size. You may submit figures in color or black and white. Graphs with an x and y axis should not be enclosed in frames; only 2-dimensional representations. Place labels and units.
Captions for the figures should give a precise description of the content and should not be repeated within the figure. Tables should be created with the table function of a word processing program. Spreadsheets are not acceptable.
2.6. References
The literature cited should be arranged alphabetically and contain: the author’s surname, first name and middle initial, year of publication, title of paper, name of journal, volume number, and first and last page number of the publication.
Bibliographic references to books or other established publications should contain: author’s surname, first name and middle initial, year of publication, and edition, publishing house and place of publication. The name of the author and the date of publication should be included within the text. If more than one publication of the same author appeared in one year, these should be marked by small letters after the year, e.g., 2015a; 2015b. References to publications by more than two authors should be cited as follows: Luna et al. (2015) or (Luna et al., 2015).
Call for Publication

RICE-BASED BIOSYSTEMS JOURNAL (2022) 10 131
3. Copyright
If your paper is accepted, the author identified as the formal corresponding author for the paper will receive an email.
4. Proof Corrections and Offprints
The corresponding author will receive an e-mail with the laid out publication. A working e-mail address must therefore be provided for the corresponding author. Further instructions will be sent with the proof. We will charge for excessive changes made by the author in the proofs, excluding typesetting errors.
5. Submission and Acceptance of Research Notes
A research note is a short discussion on key research findings and advances on a particular theory, study, or methodology that does not sum up to a full research article. The format and guidelines of a research note resembles that of a full-length manuscript except for the number of words, figures and/or tables. A 3000 to 4000-word paper with an abstract and a maximum of 2 figures and/or 2 tables may be submitted as a research note.
6. Submission of Invited Papers
The Editorial Team can invite a member of the Advisory Board and Editorial Board of the Rice-Based Biosystems Journal or an expert to submit a paper in line with the theme of the volume to be published. Invited papers may be in the form of a full paper, research note or a review article. A review article gives information on a particular field of study, recent major advances and discoveries, significant gap in the research, current debates, and ideas or recommendations for future advances.
At least one expert on the subject matter will review the invited paper. Instructions for submitting a full paper and research note are in numbers 1-5 of the author guidelines.
6.1 Format
The Abstract consists of 220 words or less that summarizes the topic of the review. The current challenges and perspective on the topic are addressed, with significant conclusion and recommendations.
The Introduction states the purpose of the review. It presents a short background of the nature of the problem and its aspects of being resolved. The limitations of current solution or studies are included.
The Body presents the current studies and major advances or discoveries and impact on the present situation of the problem. Evaluation of studies such as applicability and availability of the methods used to certain areas and situation or statistical significance are elaborated.
The Conclusion summarizes the overall or major impacts and main points of the current studies. Recommendations for future advances of the research on the subject matter are presented.
The Literature Cited follows the instructions in number 2.6 of the author guidelines.
Call for Publication

132 RICE-BASED BIOSYSTEMS JOURNAL (2022) 10
EDITORIAL POLICYAuthors should:
• designate a corresponding author who will be responsible in coordinating issues related to submission and review, including ensuring that all authorship disagreements are resolved appropriately;
• submit original work that has been honestly carried out according to rigorous experimental standards;
• give credit to the work and ideas of others that led to their work or influenced it in some way;
• declare all sources of research funding and support;
• submit manuscripts that are within the scope of the journal by ensuring that they abide by the journal’s policies and follow its presentation and submission requirements;
• explain in a cover letter if there are special circumstances when the manuscript deviates in any way from a journal’s requirements or if anything is missing and ensure that the manuscripts do not contain plagiarized material or anything that is libelous, defamatory, indecent, obscene or otherwise unlawful, and that nothing infringes the rights of others;
• ensure they have permission from others to cite personal communications and that the extent, content, and context have been approved;
• provide details of related manuscripts they have submitted or have in press elsewhere; and
• check the references cited to ensure that the details are correct.
Authors should not:
• submit the same or a very similar manuscript to more than one journal at the same time, present their work, or use language, in a way that detracts from the work or ideas of others;
• be influenced by the sponsors of their research regarding the analysis and interpretation of their data or in their decision on what to, or not to publish and when to publish;
• divide up the papers inappropriately into smaller ones in an attempt to increase their list of publications;
• be involved in ‘ghost’ or ‘gift’ authorship;
• use information privately obtained without direct permission from the individuals from whom it was obtained;
• make exaggerated claims about the novelty or significance of their findings;
• misrepresent or inappropriately enhance their results by any means;
• make significant changes to their manuscript after acceptance without the approval of the editor or journal editorial office; and
• submit a manuscript that has been rejected by one journal to another journal without considering the reviewers’ comments, revising the manuscript, and correcting presentational errors.

CALL FOR PAPERSThe Rice-Based Biosystems Journal is a peer-reviewed online and an open-accessed journal in The University
Library of University of the Philippines Diliman, Cagayan State University Library, and recently in Caloocan City Science High School. It is managed by the Philippine Rice Research Institute (PhilRice) through a competent editorial team, reputable advisory and editorial boards, and invited referees. The journal encourages publication of original research and review articles that have impact on and are interconnected with rice and rice-based crops. It publishes rice and rice-based research studies on soil and crop management, crop protection, crop improvement, grain quality, farm machinery, resource use efficiency, plant biology, nutraceuticals, food value-adding systems, biofertilizers, biopesticides, biomaterials, and systems analysis and stimulation. It also covers the economics, social, and communication systems that may influence the landscape of rice and rice-based production. For your submission, you can email your manuscript to [email protected] with subject and file format as: RBBJ_Title_Surname.doc. For more information about the journal, please visit www.philrice.gov.ph/grants/call-publication/.
PHILRICE CENTRAL EXPERIMENT STATION Maligaya, Science City of Muñoz, 3119 Nueva Ecija Tel: (44) 456 -0277 • Direct line/Telefax: (44) 456-0354
BRANCH STATIONS:PhilRice Batac, MMSU Campus, Batac City, 2906 Ilocos Norte; Telefax: (77)670-1867; (77)677-1508; Mobile: 0919-944-3016 Email: [email protected] phPhilRice Isabela, Malasin, San Mateo, 3318 Isabela; Mobile:0947-996-2554; 0999-889-3027; Email: [email protected] Los Baños, UPLB Campus, College, 4030 Laguna; Tel: (49) 536-8620; 501-1917; Mobile: 0920-911-1420; Email: [email protected] Bicol, Batang Ligao City, 4504 Albay;Tel: (052) 284-4860; Mobile: 0998-963-4340; Email: [email protected] Negros, Cansilayan, Murcia, 6129 Negros Occidental; Mobile: 0932-850-1531; 0915-349-0142; Email: negros.station@philrice. gov.phPhilRice Agusan, Basilisa, RTRomualdez, 8611 Agusan del Norte; Telefax: (85) 343-0768; Tel: 343-0534; 343-0778; Email: [email protected] Midsayap, Bual Norte, Midsayap, 9410 North Cotabato; Telefax: (64) 229-8178; 229-7241 to 43 Email: [email protected] Field Office, CMU Campus, Maramag, 8714 Bukidnon; Mobile: 0916-367-6086; 0909-822-9813
SATELLITE STATIONS:Mindoro Satellite Station, Alacaak, Sta. Cruz, 5105 Occidental Mindoro • Mobile: 0917-714-9366; 0948-655-7778Samar Satellite Station, UEP Campus, Catarman, 6400 Northern Samar • Mobile: 0948-754-5994; 0929-188-5438Zamboanga Satellite Station, WMSU Campus, San Ramon, 7000 Zamboanga City • Mobile: 0910-645-9323; 0975-526-0306
Liaison Office, 3rd Floor. ATI Bldg, Elliptical Road, Diliman, Quezon City; Tel/Fax: (02) 8 920-5129
www.philrice.gov.phwww.pinoyrice.com 0917-111-7423 DA-PhilRice [email protected] PhilRice TV
We are a government corporate entity (Classification E) under the Department of Agriculture. We were created through Executive Order 1061 on 5 November 1985 (as amended) to help develop high-yielding and cost-reducing technologies so farmers can produce enough rice for all Filipinos.
With our “Rice-Secure Philippines” vision, we want the Filipino rice farmers and the Philippine rice industry to be competitive through research for development work in our central and seven branch stations, coordinating with a network that comprises 59 agencies strategically located nationwide.
We have the following certifications: ISO 9001:2015 (Quality Management), ISO 14001:2015 (Environmental Management), and OHSAS 18001:2007 (Occupational Health and Safety Assessment Series).