International Conference on Education 2017 (ICEDU-2017)
390
Proceedings of 3 rd International Conference on Education 2017 (ICEDU-2017) 20 th – 22 nd April, 2017 Kuala Lumpur, Malaysia Committee of the ICEDU- 2017 The International Institute of Knowledge Management (TIIKM) Tel: +94(0) 11 3132827 [email protected]
-
Upload
khangminh22 -
Category
Documents
-
view
2 -
download
0
Transcript of International Conference on Education 2017 (ICEDU-2017)
Proceedings of
3rd
International Conference on Education
2017
(ICEDU-2017)
20th – 22
nd April, 2017
Kuala Lumpur, Malaysia
Committee of the ICEDU- 2017
The International Institute of Knowledge Management (TIIKM)
Tel: +94(0) 11 3132827

ii
Disclaimer
The responsibility for opinions expressed, in articles, studies and other contributions in this
publication rests solely with their authors, and this publication does not constitute an
endorsement by the ICEDU or TIIKM of the opinions so expressed in them.
Official website of the conference
www.educationconference.co
Proceedings of 3rd
International Conference on Education 2017
Edited by Miss. Shanika De Silva, International Institute of Knowledge Management
ISSN 2424-6700 online
Copyright @ 2017 TIIKM
All rights are reserved according to the code of intellectual property act of Sri Lanka,
2003
Published by The International Institute of Knowledge Management (TIIKM), No.
531/18, Kotte Road, Pitakotte, 10100, Sri Lanka
Tel: +94(0) 11 3098521
Fax: +94(0) 11 2873371
iii
Hosting Partner:
University of Northern Colorado, USA
Academic Partners:
International Islamic University, Malaysia
Vytautas Magnus University, Lithuania
Organized By:
The International Institute of Knowledge Management (TIIKM)
PROF. EUGENE P. SHEEHAN (Conference Chair, ICEDU 2017)
Dean, Professor of Psychological Sciences College of Education and Behavioural Sciences
University of Northern Colorado
Greeley, CO USA.
DR. CHRISTY MCCONNELL MOROYE (Keynote Speaker, ICEDU 2017)
Associate Professor of Educational Foundations
and Curriculum Studies, University of Northern
Colorado, USA
PROF. DR. HAIRUDDIN MOHD ALI (Keynote Speaker, ICEDU 2017)
Dean, Kulliyyah of Education, International
Islamic University,Malaysia
DR. FLORANTE C. GARCIA ADAMSON (Session Chair, ICEDU 2017)
Adamson University, Philippines
DR. AMEEN ALI TALIB (Session Chair, ICEDU 2017)
SIM University, Singapore
DR. ABDOLREZA LESSANI (Session Chair, ICEDU 2017)
Universiti Putra Malaysia, Malaysia
PROF. DR. NIK AHMAD HISHAM ISMAIL (Session Chair, ICEDU 2017)
Kulliyah of Education, International Islamic
ICEDU 2017 Committee

iv
University Malaysia, Malaysia
DR. FAIZAH IDRUS (Session Chair, ICEDU 2017)
Kulliyah of Education, International Islamic
University Malaysia, Malaysia
DR. SIMON SO (Session Chair, ICEDU 2017)
The Education University of Hong Kong, Hong
Kong
DR. ANTHONY RHODES (Session Chair, ICEDU 2017)
Zayed University, United Arab Emirates
MR. ISANKA. P. GAMAGE (Conference Convener, ICEDU 2017)
The International Institute of Knowledge
Management
MR. OSHADEE WITHANAWASAM (Conference Publication Chair, ICEDU 2017)
The International Institute of Knowledge
Management
MR. SARANGA MEEPITIYA (Conference Coordinator, ICEDU 2017)
The International Institute of Knowledge
Management
Editorial Board-ICOM 2013
Editor in Chief
Dr. Eugene P. Sheehan, Dean, College of Education and Behavioral Sciences, University of Northern Colorado,
Greeley, CO, USA
The Editorial Board is not responsible for the content of any abstract
Asst. Prof. T. Andrawis, S P Jain School of Global Management, Australia
Dr. R. Cajetas-Saranza, Phillipine Normal Universiy, Philippine
Dr. F. A. Rauf, Our Own Public Health Institute (OOPHI), Pakistan
Prof. Dr. G. Gedvilienė, Department of Education Sciences, Vytautas Magnus University, Lithuania
Ms. V. Bortkevičienė , Department of Education Sciences, Vytautas Magnus University, Lithuania
Editorial Board - ICEDU - 2017
Scientific Committee - ICEDU - 2017

v
Dr. C. Williams, Counseling Health & Special Education Division, Emirates College for Advanced Education,
UAE
Dr. C. Hess, Colorado Mesa University, USA
Dr. M. Yamkasikorn, Nakhon Phanom University, Thailand
Dr. W. Diteeyont, Kasetsart University, Thailand
Prof. K. H. Y. Cheung, University of Macau, China
Assoc. Prof. S. L. Ieong, University of Macau, China
Dr. E. P. Sheehan, University of Northern Colorado, USA
Dr. N. Sileo, University of Northern Colorado, USA
Dr. C. Moroye, University of Northern Colorado, USA
Ms. V. Sherman, University of Northern Colorado, USA
Mr. M. Floren, University of Northern Colorado, USA
Dr. B. Saminathan, Bharathidasan University, India
Dr. J. Madhu, American University in the Emirates, United Arab Emirates
Dr. J. Essary, Zayed University, United Arab Emirates
Dr. A. Tholappan, Bharathidasan University, India
Dr. C. J. Hill, The British University In Dubai, UAE
Asst. Prof. D. Joann , De La Salle University, Philippines
Assoc. Prof. Bustos-Orosa, Maria Alicia, De La Salle University, Philippines
Dr. T. E. Maaddawy, United Arab Emirates University, UAE
Dr. A. Abukari, The British Universtiy in Dubai, UAE
Dr. A. Brandišauskienė, Lithuanian University of Educational Sciences, Lithuania
Assoc. Prof. Dr. A. Galkienė, Lithuanian University of Educational Sciences, Lithuania
Dr. Y. Don, University Utara Malaysia, Malaysia
Asst. Prof. A. Y. Mooi Ng, University of Nottingham, Malaysia
Assoc. Prof. Dr. S. B. Sharif, Universiti Malaysia Sabah, Malaysia
Dr. C. Andin, Universiti Malaysia Sabah, Malaysia
Prof. Dr. N. A. H Ismail, Kulliyyah of Education, Malaysia
Assoc. Prof. Dr. S. S. Abdallah, Kulliyyah of Education, Malaysia
Assoc. Prof. Dr. S. Hussien, Kulliyyah of Education, Malaysia

vi
Dr. F. Idrus, Kulliyyah of Education, Malaysia
Dr. R. M. Kamalludeen, Kulliyyah of Education, Malaysia
Dr. S. J. Syed, University of Nottinham, Malaysia
Dr. A. Z. B. A. Razak, university of Malaya, Malaysia
Dr. T. Moodley, University of the Western Cape, South Africa
Dr. B. V. Durga Kumar, Nilai University, Malaysia
vii
Table of Contents Page No
01. Using Bloom’s Taxonomy and Gender Differences to Enhance
Theory and Practice in Global Education
Hadjer Belhamidi1, Amina Mazouzi2 and Boulenouar Mohammed
Yamin3
1-9
02. Development Of Stefan-Boltzmann Board Game Based On Game
Characteristics
Ary Norsaputra, Thasaneeya Ratanaroutai Nopparatjamjomras,
Suchai Nopparatjamjomras and Ratchapak Chitaree
10-16
03. Cross-country analysis on neighboring migration policy by the
example of Finland and Russia
Maria Pitukhina, Svetlana Shabayeva and Andrej Privara/
17-28
04. Student’s Perception of Group Work and Knowledge Building in
an Economics Unit
Heng Kiat Sing, Philip Nuli Anding and Tan Kock Wah
29-37
05. The 21st Century Milieu: Learning Preferences Of Msu-Tcto
Sophomore Students
Fernigil L. Colicol
38 - 48
06. A Case Study of Autocad 2D Engineering Drawing Performance
Among Furniture and Product Design (BFPD) Students
Indera Irawan M. R and Affandi H.M
49-57
07. The implementation of project based learning to improve the
competences of teacher candidates
Krisna Merdekawati
58-63
08. Exploring Students’ Academic Achievements in Electricity and
Magnetism Through Learning Styles and Learning Style-Based
Instructional Strategies in Mthatha High Schools
Sakyiwaa Danso and Emmanuel Mushayikwa
64-76
09. Teaching Strategies to Raise Awareness of Non-Communicable
Diseases in Secondary Schools in Brunei Darussalam
77-90
viii
Noormah Azrayati Haji Mohammad Noor and Jainatul Halida
Jaidin
10. The Role of Personalized Education Tools in Computer
Programming Learning
Fadhla Junus
92-98
11. The Application of Authentic Assessment in Chemistry Curriculum
Studies
Beta Febriana and Widinda Arlianty
99-105
12. Understanding Peer and Teacher Assessment about Laboratory
Skill on Formative Assessement Through Scientific Approach
Widinda Arlianty and Beta Febriana
106-113
13. Evidence-Based Practice: Inclusive Education for the Effective
Implementation for Children with Autism
Emine Ozel Eren and Nik Asilah Nik Ali
114-128
14. Assessing Training Needs of Transition Services for Teachers of
Learning Disabled Students in the Secondary Stage in Saudi Arabia
Munirah AL-Hudaib, Nadia Tazi and Saeed Al-Yamani
129-136
15. Enquiry Pedagogy in Teaching Titrations with using Natural
Indicator
Udan Kusmawan, Afnidar, Srihamda, and Deetje Sunarsih
137-144
16. Green Skills: Innovation in the subject of Design and Technology
(D&T)
Amarumi Alwi, Arasinah Kamis, Haryanti Mohd Affandi ,Faizal
Amin Nur Yunu and Ridzwan Che Rus
145-154
17. Enhancing mathematics students’ mental computation in
calculating percentage by using the bubble method
Nor Halimah Aminah Muhammad Nur Lubis, Khairul Amilin
Tengah, Masitah Shahrill and Elvynna Leong
155-165

ix
18. Using concrete model to enhance conceptual knowledge of low
ability students in factorising quadratic expression
Eis Farhana Abdul Latiff, Khairul Amilin Tengah, Masitah Shahrill
and Elvynna Leong
166-173
19. Teaching and learning of Integers using hands-on versus virtual
manipulatives
Goh Lin Sen, Khairul Amilin Tengah, Masitah Shahrill and
Elvynna Leong
174-185
20. The Flipped Classroom Strategy: The Effects of Implementation at
the Elementary School Level Mathematics Lessons
Tieng Seng Toh, Khairul Amilin Tengah, Masitah Shahrill, Abby
Tan and Elvynna Leong
186-197
21. Using Visual Representations as an Alternative in Teaching
Simultaneous Equations
Nur Nadhirah Haji Nordin, Khairul Amilin Tengah, Masitah
Shahrill, Abby Tan and Elvynna Leong
198-204
22. Analysing Students’ Perspectives on Geometry Learning from the
Combination of Van Hiele Phase-Based Instructions and GeoGebra
Georgina Ling Ling Chua, Khairul Amilin Tengah, Masitah
Shahrill, Abby Tan and Elvynna Leong
205-213
23. Factors Affecting Teaching Abilities, Practices and Motivation –
Evidences from Senior Secondary Schools in Delhi
Charu Jain and Narayan Prasad
214-226
24. The Differences between Traditional and Dynamic Assessment in
Diagnosing Students with Reading Disabilities at Primary School in
the Kingdom of Bahrain
Danha Al Hajeri, Nadia Tazi and Mansoor A. Sayyah
228-233
25. Selected Ongkah-Ongkah of Sama Dilaut in the Province of Tawi-
Tawi: Their Forms and Styles of Expression
Elvinia Reyes- Alivio, Junefe D. Naquira and Josephine M. Lendio
234-246

x
26. The Effectiveness of a Counseling Training Program for Teachers
in Modifying the Behavior of Pupils Learning Disabilities in the
Third Grade
Asmaa Al Aazmy, Nadia Tazi and Mansoor Sayyah
247-255
27. The Effect of Designing a Blended Learning Environment on
Achievement and Deep Learning of Graduate Students at the
Arabian Gulf University
Ahmed Nouby and Tayseer Alkhazali
256-265
28. Extent of Viability of Utilizing Internet Shops as an Alternative
Laboratory in Internet and Computing Fundamentals: Basis for a
Proposed Academe-Industry Linkage Program
Kurt B. Catolico
266-279
29. Ambition Level and its Relation to Excessive Competition among
Musically Gifted Students at the Higher Institute of Musical arts in
Kuwait
Mashail KH. Boshehri1, Fatima Ahmed Al-Jasim and Mohammed
J. Jamalallail
280-298
30. New Paradigm for Cloud Computing Curriculum by Meeting
Industry Needs: Ccse and EMC2 as Case Study
Kawther Aldhlan and Mahreen Nasir
299-304
31. Integrating Element of Green Skills in the 21st Century Learning
Bushra Limuna Ismail, Arasinah Kamis, Che Ghani Che Kob, Tee
Zee Kiong and Mohd Bekri Rahim
305-314
32. Speech Acts on the Posters in Handling Refugees in Freiburg
Rezki Auliya Handarta
315-327
33. Mother Tongue-Based Mathematics Iloko Language Competence
of Grade I Pupils in Bauang District, Division of La Union
Eloisa A. Rivera
328-341

xi
34. Theory of Change: A Success or a Failure for School Improvement,
A Discussion Base on Malaysian Context
R. Sudha Nair
342-352
35. Social Capital, Migration And Social Integration
Le Thi Mai
353-363
36. Grid Method Approach in Teaching Basic Vector Concepts for
Fundamental Physics
Nur Asyikin A.N, M.I.M Yusof, Abu Hassan H., N.A.Johari,
Masnitamj and Raudzatul F
364-372
37. Nurturing Proactive, Creative and Communicative Learners
Through Social Media
Christopher Pang, Xiu Er, Chuang and Christian Chia
373-380

Proceeding of the 3rd International Conference on Education, Vol. 3, 2017, pp. 1-9 Copyright © 2017 TIIKM ISSN 2424 - 6700 online DOI: https://doi.org/10.17501/icedu.2017.3101
3rd International Conference on Education, 20-22 2017, Kuala Lumpur, Malaysia
USING BLOOM’S TAXONOMY AND GENDER
DIFFERENCES TO ENHANCE THEORY AND PRACTICE
IN GLOBAL EDUCATION
Hadjer Belhamidi1, Amina Mazouzi
2 and Boulenouar Mohammed Yamin
3
1African University of Adrar, Algeria 2Saad Dahlab University of Blida, Algeria
3Djilali Liabes University of Sidi Bel Abbes, Algeria
Abstract: Gender differences are important in theory vs. practice in education, and ignoring them
causes the problem of incongruity instead of harmony with the material learnt. Psychiatrists have
discovered a difference in the way the two genders handle theoretical and applied knowledge. This
difference lies in genders’ performance, whether they learn the theory alone, or practice what they
learn. We will investigate how Bloom’s Taxonomy (used by curriculum designers), particularly the
psychomotor approach, would be misused by curriculum designers if they ignore the different
patterns of reasoning and application of the two genders. Psychiatrists have discovered that females
understand the theoretical knowledge better than the males, while the males on the other hand
perform the application of the applied knowledge better than the females. As a result, countries/
schools/ syllabus designers that focus on theory more than they do on practice end up with a higher
number of female students in schools, while the males tend to lose interest and drop out somehow.
The same result occurs with majors that focus on theory alone, as literature, history, languages…etc.
This research urges curriculum designers to consider gender differences in applying the psychomotor
approach. The research analyzes how far curriculums consider application in order to help
curriculum designers face problems at the level of gender differences. Researchers will find this
study useful to understand how to use theory and practice to raise the level of students’ performance
in various majors
Keywords: Theory vs. Practice, Gender Psychological Differences, Bloom’s Psychomotor
Approach, Curriculum Designing, Education
1. Introduction
The educational approach, which is based on Bloom’s Taxonomy (Classification, Categorization), is applied in
any kind of learning and any field of study. Bloom, just like Ibn Khaldoun, explains how the acquisition process
is systematic and can be categorized in an exact system or process to be followed and developed by teachers/
students or curriculum syllabus designers. The taxonomy is a set of techniques very useful for thinking and
metacognition as well as paraknowledge, since it is composed of stages that instruct learners on how to know
something, how to remember it, apply it and finally how to use it in other situations to create something new. In
this sense, Bloom’s Taxonomy is very purposeful in that it enables knowledge to be useful in real life situations,
and prevents the pointless notion of the learning process (learning for the sake of a diploma versus learning for
the sake of practicing the knowledge in real life).
2. Practice as a Learning/ Teaching Process
Based on the relationship between the material being learnt and the psyche of the learner, the psychomotor
learning process is very useful in learning manual and verbal activities that involve repetition or practice such as
pronouncing, articulating, writing, driving, sports…etc. The short story “18 Holes in His Mind” (Canfield and
Hansen, 2008) illustrates the valuable use of theory-into-practice-notion, and the value of practice and repetition
Corresponding Author: Hadjer Belhamidi/ [email protected]
Hadjer Belhamidi, Amina Mazouzi & Boulenouar Mohammed Yamin/Using Bloom’s Taxonomy and..
2
in learning anything. Unfortunately, not all schools consider practice as a tool for knowledge; allowing students
to only acquire and understand the theory, without practicing it. This happens in majors that focus on the
theoretical knowledge alone (literature, history…etc.), in schools that lack practicing laboratories…etc. Ignoring
practicing the knowledge prevents the students from grasping the knowledge, at the level of both the theory and
the practical art, especially boys, since the experiments done in this research proved that girls grasp the theory
better than boys, but when it comes to excellence in practice, boys perform better. One of the approaches of
Bloom’s Taxonomy is highly applicable in theory vs. practice, i.e.: practicing the theory or knowledge, and that
is the psychomotor approach.
3. The Psychomotor Learning/ Teaching Process
The psychomotor learning process is one of the categories of Bloom’s Taxonomy (Anderson and Sosniak,
1994), and it is divided into three stages, observing, imitating and practice.
Observing: It means to watch someone carry out the process you are trying to learn, or to hear someone say the
things you are trying to learn. The more you watch or listen the more affective/ influential the information
becomes, and the better you learn or the more influenced you become. The next stage is imitating.
Imitating: In this stage, you keep practicing with so much focus/ attention, i.e.: conscious imitation, until you
have the ability to carry out the process on your own. Imitation involves repetition. For example, learning about
the IPA or RP in a phonetics class merely involves the theoretic information, but students need to apply the
theory frequently and repeatedly in order to pronounce better. This learning/ teaching process involves constant
repetition, i.e.: only moving from the theoretic rules of pronunciation learnt in class into “manipulated theoretic
repetition” into “unthinking/ automatic/robotic/ unaware/ unconscious/ repetition”, would guarantee fluency in
the best articulation possible. Repetition and practice are highly important and very effective and indeed
necessary (obligatory) psychomotor activities to learn anything manual or verbal, especially pronunciation, so,
in order for students to have a proper pronunciation, they must be provided with the native-speaker-in-class-
audio materials to practice both listening and speaking. After that, you need practice, which is also another
psychomotor activity.
Practice: Practice allows you to carry out the process with perfection, but more than that, practice stores the
process you learn in your psychomotor skills, i.e.: a long-term memory so that (a) you would never forget the
process, and (b) your process becomes automatic. This means that a student never needs to monitor the activity
again, since the activity has become subconscious. On the other hand, this process makes males excel better than
females, because their subconscious is more automatic. This automated process can be affected by gender
differences (Wright and Payne, 1985). An automatic subconscious means that you no longer need to pay
attention because the flow or current of the process does not fade or deviate or be distracted, which can be the
case for females. In order to excel in a process, repeat it until it can be performed smoothly, with little or no
attention at all. The process is at first conscious but the more you practice, the more it becomes unconscious or
automatic, and demands no attention to be performed in a correct way, especially for men. It has been noticed
however, in an arts class, that females may excel better than males in detailed crafts (The researchers conducted
an experiment on males’ and females’ thinking and the results are approved when it comes to feminism and
gender criticism: Females have a more meticulous or detailed thinking and performance while males are more
general).
4. The Defects of a Mere Theoretical Education Based on Gender Individual Differences
The third world universities’ teaching material can be inadequate concerning using/practicing the learnt
material. If these countries provide a syllabus that establishes the first part of Bloom’s Taxonomy of the
cognitive approach, and fails to proceed to the next part of the practical knowledge, i.e.: if they provide the

Proceeding of the 3rd International Conference on Education, Vol. 3, 2017, pp. 1-9
3
theoretical knowledge and neglect the practice, most students would fail, especially male students. This research
explains the psychological sex differences (Elneel et al. 2008), which boys and girls differ in and which inflict
their learning process. According to most theories, feminist, gender criticism as well as other psychological
studies, males and females are different (Annett, 1983), but that does not mean they are unequal. We can say
that males and females are equally different. This research has come up with the result that males’ subconscious
is stronger than the females’, and as a result, they excel better in practical activities, such as driving…etc.
Females’ conscious abilities, on the other hand, are stronger and when it comes to the theoretical knowledge,
they have no problem, but of course, when it comes to the practice, they show a lesser degree of performance
than the males, except for exceptional cases. Bloom’s Taxonomy asserts the necessity of the use of practice in
order for students to master the learnt material. Education has to be based on both theory and practice. The
research has discovered that there are more males than females in scientific majors where there are laboratories
to practice the theoretical learnt material. On the other hand, in such majors where there is the theoretical
knowledge alone, such as literature, civilization, linguistics majors where the researchers’ universities provided
the theoretical education alone, the research has discovered that there are more females than males enrolled.
First analysis may reveal that it was a matter of preferences, i.e.: there are many male students in scientific
majors because the males chose them because it is not boring for them if they practice the knowledge learnt. But
the researchers of this study conducted a study on their own students, and they discovered that females are able
to grasp the theory without practice, but they only show average results if they do not practice the learnt
material. On the other hand, the researchers’ study discovered that the male students find the theoretical
knowledge boring and inadequate, and they must practice to achieve average or above average results. The
research also discovered that, after a long-termed practice, male students can excel better than the females. The
research steps were to conduct two exams; the exam of the first semester was theoretical alone. In the module of
literary theory, students were given theoretical questions and definitions. The results were that females’
performance was a little above average, with some exceptions below, while males’ performance was average
with a few exceptions below, knowing that the classes that the experiment was conducted on included students
that share a very close level. In the second semester, after a long time of practice, the same students were given
a practical exam in the same domain, and the result was that, female students’ performance was 10% excellent,
50% above average and 20% below average. On the other hand, the male students’ performance showed 30%
excellent and 60% above average. Thus, students of exact sciences cannot only study the theoretical knowledge
of Mathematics, physics, chemistry…etc. without at least a certain amount of application or exercises. Students
of chemistry, physics and biology will definitely fail to understand the rules if they are not provided with proper
laboratories for experiments, and students of EFL will fail to achieve language proficiency without practicing
the four skills in proper in-class-supervised practical work.
The researchers assumed that there might be another reason why there might be more male than female students
in exact sciences majors (chemistry, math, physics, data processing…etc.), and more females than males in
inexact knowledge majors. They assumed that males tend to choose those majors because (a) they like
practicing and find theoretical education boring, (b) they find lab experiments more exciting and thrilling, (c)
their subconscious is stronger and works better on experiments since many of them involve repetitive
psychomotor processes, (c) they are more rational and logical than females and it would not enhance their level
in fields which are romantic inexact irrational or illogical, such as literatures, arts…etc. However, these
assumptions all fell down after the experiments conducted, apart from one, (c). Benjamin Bloom (Bloom and
Krathwohl, 1956) asserted the necessity of practical education in his psychomotor approach, and the
psychomotor scientists and psychiatrists have discovered that males’ subconscious is stronger than females, and
it enables them to (a) acquire knowledge better with practice, and (b) excel better than females after a long-
termed practice (Fairweather, 2002). The males show a better performance of psychomotor activities, whereas
the females’ pattern of practice tends to break down with time because they tend to be less focused, more
distracted, or more conscious, and thus, they break down the pattern of practice or unconsciously alter it since
their subconscious is weaker, and the psychomotor activities depend on it.

Hadjer Belhamidi, Amina Mazouzi & Boulenouar Mohammed Yamin/Using Bloom’s Taxonomy and..
4
Students must have verbal/manual activities in classes/ laboratories, outside…etc. otherwise; the study of the
theory alone would engage less learners belonging to one gender alone (females) and neglect the rest (males).
Leading psychiatrists and gender critics have theorized the strength of male students’ subconscious
verbal/manual activities (as driving…etc.), and, on the other hand, the strength of female learners’ mental
activities (theory or thinking) (Donaldson and Kleinknecht, 1975). That does not mean that females are better
writers, artists, sculptors or thinkers, but it means they can be average or above average writers, artists, sculptors
and thinkers with the theoretical knowledge alone, because they perform better than boys when they both study
the theoretical knowledge alone. On the other hand, males can be below average writers, artists, sculptors and
thinkers after the theoretical knowledge alone. Thus, they must have the practical knowledge, but once they
have it, they can master these skills better than girls.
Accordingly, males are rational, logical and think mostly using their conscious mind, while they use the
subconscious mind in practice, while females are irrational, emotional, and illogical and they think using their
subconscious mind. During a theoretical class relating to an inexact field (literature, poetry…etc.), the needed
mental processes are illogical. Female students’ thinking is already illogical; they do not need an excessive
practice to understand the knowledge, and that gives them the edge. Therein, only the conscious activities of the
students are needed (not psychomotor, verbal, practical, manual), in a field that demands exceptions instead of
rules (illogical), and it helps the female learners’ conscious because it is already illogical. That is the same as
saying that females are more romantic or poetic than men with theory alone, but after practice, males become
the excellent poets.
The male students would excel more if these illogical classes are provided with other classes of practical work,
because in whichever field of science (logical, exact or illogical, inexact), practice is more exact and makes
more sense than theory, especially to them. Provided that they have a practical work class in inexact fields
(instead of spoon-feeding alone), male students will gain the edge over the females, because in practice, they use
their subconscious.
Focusing on theory and neglecting practice that may occur in third world countries or developed countries when
universities fail to provide laboratories and proper practicing outlets, or in inexact majors (literature, EFL,
linguistics, history and civilization), involves female students in the syllabus and the neglects the male students.
For majors that have laboratories to practice knowledge, such as chemistry...etc. more male students are
involved in the course material, and it does not neglect the females either. However, majors or universities that
do not focus on practice end up automatically (not deliberately) involving only females and neglecting male
students, although female students need practice too. Thus, one of the aims of this study was to urge curriculum
designers reconsider the practical part in education, because without it, the graduates will find their knowledge
useless in real life.
5. The Scope of the Research
This research is done broadly to relate to the defects of education that may occur in places where the authorities
may ignore the importance of practice or the psychomotor knowledge, and its impact on the two genders. The
most important terms of this research are Bloom’s Taxonomy (Krathwohl, 2002), the Freudian concepts
(conscious vs. subconscious) and the logic vs. illogic. In Edgar Allan Poe’s “The Purloined Letter” (Lacan and
Mehlman, 1972), there are two different types of thinking: logical and illogical thinking. Accordingly, a logical
person can never outsmart another illogical person, because a logical person is always be predictable, but an
illogical person is always unpredictable, and that may make him a genius in some cases. In the short story, the
logical Prefect tries to outsmart the illogical Mr. D, but fails to solve the case because he uses exact scientific
logical thinking. He seeks the help of a man who is acquainted with both poetry (illogical) and mathematics
(logical), and it is this illogical poet (Dupin) who outsmarts the villain and solves the case. Poe uses Dupin to

Proceeding of the 3rd International Conference on Education, Vol. 3, 2017, pp. 1-9
5
explain how scientists, according to him, rely too much on exact rules and this prevents them from thinking
outside the box, which the formal system of their education that is exact and can never change. It makes them
too logical, always predictable, and in spite of making new inventions, their inventions are systematic and they
follow rules, instead of uncertainties or exceptions as poets do, and that, according to him, makes poets smarter
than mathematicians.
Poe then, toys with the notions of logic and illogic, stating that mathematicians only memorize and apply rules,
while poets do not have rules, or the rules they have (values, virtues) are filled with illogical uncertainties,
which makes them think more and memorize less. According to him, poets think more than mathematicians.
Even though the story stereotypes the two notions of exact sciences (logic) against other fields of study
(illogical), the researchers stands to believe that both fields of research, logical (math, physics, chemistry…exact
sciences.) and illogical (literature, arts, history, politics…etc. inexact sciences) demand proper outlets for
practice. This means that education, wherever it stands, in schools and universities, and in whichever fields or
majors, needs to be both theoretical and practical.
Based on gender criticism, however, the story would take a wrong turn, since gender criticism defines men as
being the rational beings and women the irrational more emotional beings. This is the notion that matters in this
research: men are logical and women are more illogical, and driving on the Freudian notions of conscious and
subconscious with Bloom’s Taxonomy, we can recap that; the reason why females are numerous in theoretical
majors and men are outnumbered is that with the theoretical education women can achieve above average levels,
while men need practice to be excellent. Exceptional male students who practice at home can excel better than
female students, though they are still outnumbered. The research came up with the following results:
Table 1 Gender Differences throughout Theoretical and Practical Education
Hadjer Belhamidi, Amina Mazouzi & Boulenouar Mohammed Yamin/Using Bloom’s Taxonomy and..
6
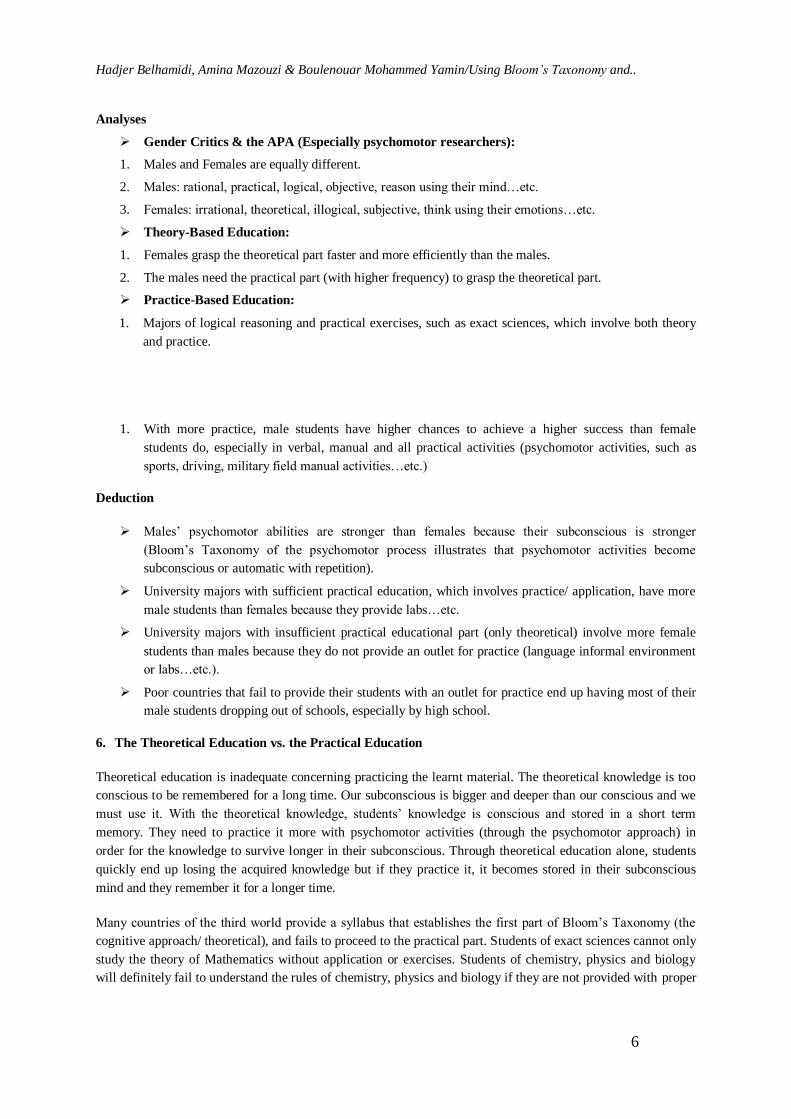
Analyses
Gender Critics & the APA (Especially psychomotor researchers):
1. Males and Females are equally different.
2. Males: rational, practical, logical, objective, reason using their mind…etc.
3. Females: irrational, theoretical, illogical, subjective, think using their emotions…etc.
Theory-Based Education:
1. Females grasp the theoretical part faster and more efficiently than the males.
2. The males need the practical part (with higher frequency) to grasp the theoretical part.
Practice-Based Education:
1. Majors of logical reasoning and practical exercises, such as exact sciences, which involve both theory
and practice.
1. With more practice, male students have higher chances to achieve a higher success than female
students do, especially in verbal, manual and all practical activities (psychomotor activities, such as
sports, driving, military field manual activities…etc.)
Deduction
Males’ psychomotor abilities are stronger than females because their subconscious is stronger
(Bloom’s Taxonomy of the psychomotor process illustrates that psychomotor activities become
subconscious or automatic with repetition).
University majors with sufficient practical education, which involves practice/ application, have more
male students than females because they provide labs…etc.
University majors with insufficient practical educational part (only theoretical) involve more female
students than males because they do not provide an outlet for practice (language informal environment
or labs…etc.).
Poor countries that fail to provide their students with an outlet for practice end up having most of their
male students dropping out of schools, especially by high school.
6. The Theoretical Education vs. the Practical Education
Theoretical education is inadequate concerning practicing the learnt material. The theoretical knowledge is too
conscious to be remembered for a long time. Our subconscious is bigger and deeper than our conscious and we
must use it. With the theoretical knowledge, students’ knowledge is conscious and stored in a short term
memory. They need to practice it more with psychomotor activities (through the psychomotor approach) in
order for the knowledge to survive longer in their subconscious. Through theoretical education alone, students
quickly end up losing the acquired knowledge but if they practice it, it becomes stored in their subconscious
mind and they remember it for a longer time.
Many countries of the third world provide a syllabus that establishes the first part of Bloom’s Taxonomy (the
cognitive approach/ theoretical), and fails to proceed to the practical part. Students of exact sciences cannot only
study the theory of Mathematics without application or exercises. Students of chemistry, physics and biology
will definitely fail to understand the rules of chemistry, physics and biology if they are not provided with proper

Proceeding of the 3rd International Conference on Education, Vol. 3, 2017, pp. 1-9
7
laboratories for experiments, and students of EFL will fail to achieve language proficiency without practicing
the four skills in proper in-class-supervised practical work sessions.
Example: In teaching a foreign language, in order to master listening and speaking, students must have practical
sessions of listening (laboratories for listening supervised practical work).
In order to master reading and writing, students must be supplemented with the reading material in libraries
(meaning inside libraries) in addition to practical reading sessions there, because the sessions of reading
comprehension are merely theoretical, technical and formal, and they would not suffice.
The reason countries of the third world that focus mainly on learning the theory and neglect its practice,
especially when it comes to majors of literature, history, art, linguistics, philosophy…etc., is because of their
inability to provide labs or practicing outlets…etc. Bloom testifies that all sciences share the same exact
systematic learning process that depends on both theory and practice (whether being exact or inexact science:
literature, history, art, linguistics, philosophy, chemistry, math., sports, martial arts…etc.), without proper
practice, the theory fails and is ultimately forgotten.
Information taught theoretically alone without practice is mostly stored in the conscious part of the memory and
is easily forgotten, whereas information stored in the subconscious part after practice is memorized forever
because it becomes unconscious information. Studies have shown that if the learnt data becomes unconscious it
can even be part of our dreams. Students must have verbal/manual activities in classes/ laboratories,
outside…etc. otherwise; the study of the theory alone would engage less learners (females alone). For both male
and female learners, only with practice would the theory make sense because only after practice would the
learner access to metacognition and paraknowledge.
7. The Importance of Autonomous Education
Students must be provided with supervised as well as unsupervised practical work sessions so that they learn the
value of autonomous learning. It is far better to learn than to be taught, where the lure of the exotic and the
bravery of discovery would disappear. Ibn Khaldoun said, "Learners who are educated by tyrant and controlling
teachers become lazy, liars and malevolent. They are prone to becoming inhuman and dependent on others.
Even worse, they are unwilling to acquire virtues and good morals. This, in fact, what happened to every nation
who was in the grip of oppression” (Ibn Khaldoun, 1988).
When the educational system/ syllabus offers a poor practice outlet or none at all, students are supposed to find
ways to practice on their own, since practicing demands a longer time than theory, and even in scientific majors
when the education offers a practice outlet, students are still obliged to practice outside class. Not all nations
who are lazy and dependent are oppressed, but they need to modify their syllabi (curricula) to fit the needs of all
learners and both genders.
Males’ psychomotor abilities are stronger than females because their subconscious is stronger (Bloom’s
Taxonomy of the psychomotor process illustrates that psychomotor activities become subconscious or automatic
with repetition) with a few exceptions when females top the males in practice. University majors with sufficient
practical educational part involve more male students than females because they provide labs…etc.
8. Conclusion
Bloom’s Taxonomy is a very effective approach in all the learning process. The cognitive approach serves to
process information from the stage of hearing it for the first time until the stage of being able to produce it and
even modify it, and is thus obligatory to achieve learning proficiency. The affective approach on the other hand,

Hadjer Belhamidi, Amina Mazouzi & Boulenouar Mohammed Yamin/Using Bloom’s Taxonomy and..
8
appeals to students’ emotions, motivates them to join the making of the lesson, and influences their lives outside
classes. Finally, the psychomotor approach highlights their need for practice to master the learnt material.
In addition to that, Benjamin Bloom, the pioneering educational psychiatrist, has established these three
categories to involve all the process of learning, based on (a) information alone, (b) information and learner’s
affection and (c) information and learner’s psychology, to be able to help learners acquire information using
three personal methods of approaching and processing information: cognition, affection and psychology.
Bloom’s Taxonomy has defined itself a strong pillar in education in different levels of schools until university,
in all fields of study and research. It has, thus, proved itself necessary on a multidisciplinary level (second
language acquisition, philosophy, art, literature, history, science, physics…etc.), although taking it from the
perspective of Edgar Allan Poe, it would seem to have less to do with students’ intelligence when it comes to
exact sciences.
Moreover, the taxonomy provides guidelines for future use of the learnt knowledge in post-graduation/
paraknowledge/ metacognition levels, and assures that information learnt is not only necessary for exams, rather
it can be useful to create a self-employed student writer (of tourism guides…etc.), translator (of books…etc.),
novelist…etc. Thus, its effectiveness lies in enabling students be creative and enabling them to use their
knowledge in real life.
9. References
Bonnie M. Wright R. B. Payne, 1985, Effects of Aging on Sex Differences in Psychomotor Reminiscence and
Tracking Proficiency. Journal of Gerontology, (2): 179-184.
Hugh Fairweather, 2002, Sex differences in cognition. Elsevier, Vol. 4, (3): 231–280.
Avolio, Bruce J. Waldman, David A, 1994, Variations in cognitive, perceptual, and psychomotor abilities across
the working life span: Examining the effects of race, sex, experience, education, and occupational type.
Psychology and Aging, Vol. 9 (3): 430-442.
Donaldson, David, Ronald, A. Kleinknecht, 1975, A Review of the Effects of Diazepam on Cognitive and
Psychomotor Performance. The Journal of Nervous & Mental Disease, (4): 123-140.
Elneel, F.H.F., Carter, F., Tang, B. et al., 2008, Extent of innate dexterity and ambidexterity across handedness
and gender: Implications for training in laparoscopic surgery. Surgical Endoscopy, Vol. 22, (1): 31-37.
Annett M, Kilshaw D., 1983, Right- and Left-handed skills II: estimating the parameter of distribution of L-R
differences in males and females. British Journal of Psychology, 74:269–283.
Lacan, Jacques and Jeffrey Mehlman, 1972, Seminar of “The Purloined Letter” in Yale French Studies. No. 48,
French Freud: Structural Studies in Psychoanalysis, Yale University Press: 39-72.
Krathwohl, D. R., 2002, A Revision of Bloom's Taxonomy: An Overview. Theory into Practice, 41 (4), 212-
218.
Canfield, Jack and Mark Victor Hansen, 2008, Chicken Soup for the Soul: Tales of Golf and Sport (Maryland:
Pneuma Books LLC).
Lorin W. Anderson, Lauren A. Sosniak, 1994, Bloom's Taxonomy: A Forty-year Retrospective (Indiana: NSSE).

Proceeding of the 3rd International Conference on Education, Vol. 3, 2017, pp. 1-9
9
Bloom, Benjamin S. & David R. Krathwohl, 1956, Taxonomy of Educational Objectives: The Classification of
Educational Goals, by a Committee of College and University Examiners: Handbook 1: Cognitive domain.
(New York: Longmans).
Hyman, S. Edgar, 1962, The Tangled Bank: Darwin, Marx, Frazer and Freud as Imaginative Writers (New
York: Atheneum).
Proceeding of the 3rd International Conference on Education, Vol. 3, 2017, pp. 10-16 Copyright © 2017 TIIKM ISSN 2424 - 6700 online DOI: https://doi.org/10.17501/icedu.2017.3102
3rd International Conference on Education, 20-22 2017, Kualalumpur, Malaysia
DEVELOPMENT OF STEFAN-BOLTZMANN BOARD GAME
BASED ON GAME CHARACTERISTICS
Ary Norsaputra1, Thasaneeya Ratanaroutai Nopparatjamjomras
1, Suchai
Nopparatjamjomras1 and Ratchapak Chitaree
2
1Institute for Innovative Learning, Mahidol University, Thailand 2Departement of Physics, Faculty of Science, Mahidol University, Thailand
Abstract: The purposes of this study are to develop Stefan-Boltzmann board game and evaluate the
components (main board, metal hexagon, self-card, information card, and action card) based on five
game characteristics which are competition and goals, strategy and tactical, challenges, rules, and
fantasy elements. The topics covered by this board game are Stefan-Boltzmann‟s law, radiation
power emitted by object, absolute temperature, area, and emissivity. The game characteristics of the
board game were assessed by a Physics lecturer and a game expert via a set of 5-point Likert scale
assessment tool during the implementation of the board game. The participants were four Indonesian
students who had a bachelor degree from faculty of Education and were taking a one year course for
the professional physics teacher certification. The score of „main board‟ for each game
characteristics are 3.5, 3.5, 4, 5, and 4.5 respectively to competition and goals, game choices,
challenges, rules, and game fantasy. In addition, a semi-structured interview was used to collect
students‟ opinion on game characteristics that will be used to improve the board game in the future.
Keywords: Stefan-Boltzmann‟s law, board game, game characteristics
Introduction
In 1895, modern physics was started with the unsolved questions related to the phenomena of the blackbody
radiation (Thorton and Rex, 2006). This issue is important and has been taught in modern physics class at
undergraduate level (Siegel and Howell, 1972). Theoretically, “Blackbody” is an object which can absorb all of
the incident electromagnetic radiation and releases those radiation, this phenomenon is called “Blackbody
radiation”, when the object is in thermal equilibrium. The power of radiation (P) emitted by an object of area
(A) is directly proportional to the fourth power of the absolute temperature (T) of the body as described by
Stefan-Boltzmann law.
𝑃 = 𝜎𝐴𝑇4 (1)
Where 𝜎 = 5.67 × 10⁻⁸W/m2K4, is the Stefan-Boltzmann constant..
Many techniques to teach this topic have been developed by many researchers (Edmonds, 1968; Carvalho and
Sousa, 2006; Lopresto and Hagoort, 2011; Marr and Wilkin, 2012; Sadoglu, 2015) and they revealed that
students who had been taught via tradition teaching have many misconceptions such as students describe color
as representative of the object temperature (Carvalho and Sousa, 2006), students always describe the blackbody
as an object that has a dark color (Sadoglu, 2015).
Board game was recommended as a good educational tool (Smyrnaiouet al. 2012), which had a variety of
descriptions such as 1) board game was a voluntary activity by players, using the rules, the specific time and
place (Huizinga, 1938); 2) board game was the simple model that could make the complex system and difficult
issues being the simple plain game processes (Bochenneket al. 2007); and 3) board game could present the
newness in order for enhancing the curricula, more fun, and may touch each other (Allery, 2014).
The aims of our paper are 1) to develop the Stefan-Boltzmann board game; 2) to evaluate the board game
components (Main board, Metal hexagon, Self-card, Information card, and Action card) in terms of game
Corresponding Author: SuchaiNopparatjamjomras/[email protected]

Proceeding of the 3rd International Conference on Education, Vol. 3, 2017, pp. 10-16
11
characteristics (Competition and goals, Strategy and tactical, Challenge, Rules, and Fantasy) and students‟
attitude towards the game components.
Literature Review
Several studies have been approved that using board game as a learning tool has many positive effects to
students such as 1) having potential to cover an element of competition and to motivate the students (Livingston
and Stoll, C.S., 1973; Gershenand Handelman, 1974); 2) promoting an active learning (Richardson and Birge,
1995); 3) increasing students‟ communication skills by the game layout (Richardson and Birge, 1995); 4)
making learning with joy (Allesi andTrolip, 2001); 5) repeating the steps of learning in each game turn
(Bochenneket al. 2007); 6) replacing the simple memorization with an active learning and application concepts
(Shiroma et al. 2011); and 7) promoting participation among peers (Popil and Dillard-Thompson, 2015).
A number of the board game have also been developed for teaching Physics e.g. “Voyager” (Smith, 2003) was
used to improve students‟ knowledge about satellites, “Space Hunter” (Kirikayaet al.2010) was used to evaluate
students‟ recognizing level of celestial object in the space and universe, and “Quantum race” was specially
designed to bring the analogy fundamental quantum mechanical concept (Chiarello, 2015). However, there has
been no board game related to Stefan-Boltzmann, so researchers would like to create the Stefan-Boltzmann
board game.
Stefan-Boltzmann Board Game
The Stefan-Boltzmann board game was designed to cover the topics of Stefan-Boltzmann‟s law, radiation power
emitted by object, absolute temperature, area, and emissivity. As Bochennek, K., Wittekindt, B., Zimmermann,
S. Y., and Klingebiel, T. (2007) suggested that the combination of the board contents and rules would provide
narrative, physical, and simulation aspect, the topics of Stefan-Boltzmann‟s law and radiation power emitted by
object were embedded into the rules and mission of the Stefan-Boltzmann board game, respectively. The rules
of the game have been set to show the concept of Stefan-Boltzmann‟s law, and the mission of the game is
collecting the radiation power placed on the “Metal hexagon”. In gathering the radiation power, player had to
mark the temperature, area, and emissivity so they would notice that these parameters were affected to the
radiation power emitted by an object.
On the other hand, this board game was also developed according to five game characteristics suggested by
Charsky(2010). The game components consist of Main board, Metal hexagon, Self-card, Information card, and
Action card (see Figure 1). The design of the “Main board” was in accordance with the scientific concept. The
main information of the learning concept such as value of temperature, area, emissivity, and radiation power
were contained in “Information card” and “Self-card”. “Action card” was composed of a command to support
the player to understand the Stefan-Boltzmann‟s laws e.g. The players were commanded to add more
temperature on the “Main board” to increase the radiation power level. Lastly, “Metal Hexagon” was the color
states located on the “Main board” to present the radiation power level by its color. On the other hand, “Metal
hexagon” was used to place the radiation power which should be collected by players.

AryNorsaputra, ThasaneeyaRatanaroutaiNopparatjamjomras, SuchaiNopparatjamjomras and
RatchapakChitaree/Development Of Stefan-Boltzmann Board Game Based On Game Characteristics
12
Figure 1 The Stefan-Boltzmann board game consists of (a) Main board, (b) Metal hexagon, (c) Self-card, (d)
Information card, and (e) Action card.
Methods
To assess the Stefan-Boltzmann board game components, the research instruments, which were consisting of an
assessment sheets and a semi-structured interview, were developed by researchers. This was a part of the main
research which was approved by institutional review board at Institute of Population and Social Research (IPSR-
IRB), Mahidol University.
The Likert-scale assessment sheet, which was developed regarding to five game characteristics (Charsky, 2010),
was used by the experts to assess the game components. The semi-structured interview and the voice recorder
were used to collect students‟ attitude towards the game. The voice recording was analyzed through a thematic
approach which was transcribed verbatim, grouped based on similarities as open coding (Corbin and Strauss,
1990), and interpreting.
The Stefan-Boltzmann board game was implemented with 4 participants who were taking professional physics
teacher program. The implementation was started with the introduction of the game components and the game
rules. The participants had 40 minutes to play the game. During this time the experts assessed the quality of the
board game components via the assessment sheet. After the game was finished, all participants were interviewed
in Bahasa by one of researchers.
Findings
The Stefan-Boltzmann board game component
The game components (Main board, Metal hexagon, Self-card, Information card, and Action card) were
assessed by the experts toward five game characteristics; Competition and goals, Strategy and tactical,
Challenge, Rules, and Fantasy. The results are shown in the Table 1.
Each component had dominant score at several game characteristics. The “Main board” and “Metal hexagon”
had the high score at the characteristics of “Rules” and “Fantasy” and the low score for “Competition and
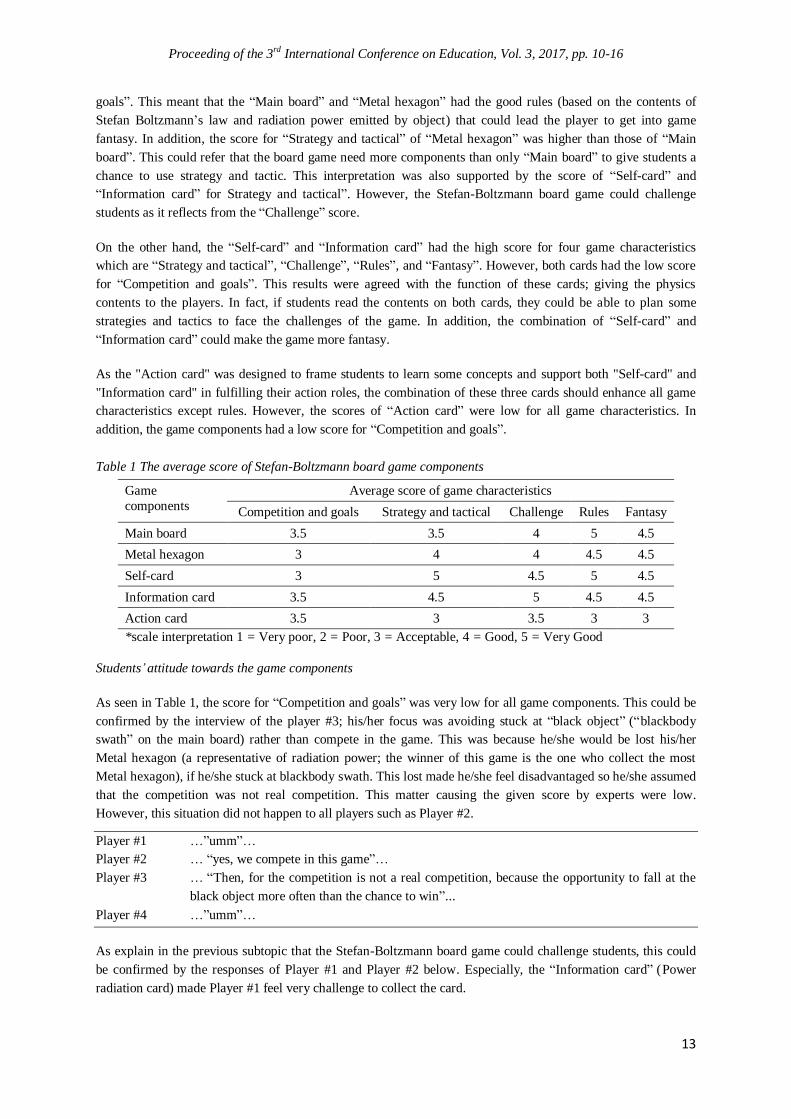
Proceeding of the 3rd International Conference on Education, Vol. 3, 2017, pp. 10-16
13
goals”. This meant that the “Main board” and “Metal hexagon” had the good rules (based on the contents of
Stefan Boltzmann‟s law and radiation power emitted by object) that could lead the player to get into game
fantasy. In addition, the score for “Strategy and tactical” of “Metal hexagon” was higher than those of “Main
board”. This could refer that the board game need more components than only “Main board” to give students a
chance to use strategy and tactic. This interpretation was also supported by the score of “Self-card” and
“Information card” for Strategy and tactical”. However, the Stefan-Boltzmann board game could challenge
students as it reflects from the “Challenge” score.
On the other hand, the “Self-card” and “Information card” had the high score for four game characteristics
which are “Strategy and tactical”, “Challenge”, “Rules”, and “Fantasy”. However, both cards had the low score
for “Competition and goals”. This results were agreed with the function of these cards; giving the physics
contents to the players. In fact, if students read the contents on both cards, they could be able to plan some
strategies and tactics to face the challenges of the game. In addition, the combination of “Self-card” and
“Information card” could make the game more fantasy.
As the "Action card" was designed to frame students to learn some concepts and support both "Self-card" and
"Information card" in fulfilling their action roles, the combination of these three cards should enhance all game
characteristics except rules. However, the scores of “Action card” were low for all game characteristics. In
addition, the game components had a low score for “Competition and goals”.
Table 1 The average score of Stefan-Boltzmann board game components
Game
components
Average score of game characteristics
Competition and goals Strategy and tactical Challenge Rules Fantasy
Main board 3.5 3.5 4 5 4.5
Metal hexagon 3 4 4 4.5 4.5
Self-card 3 5 4.5 5 4.5
Information card 3.5 4.5 5 4.5 4.5
Action card 3.5 3 3.5 3 3
*scale interpretation 1 = Very poor, 2 = Poor, 3 = Acceptable, 4 = Good, 5 = Very Good
Students’ attitude towards the game components
As seen in Table 1, the score for “Competition and goals” was very low for all game components. This could be
confirmed by the interview of the player #3; his/her focus was avoiding stuck at “black object” (“blackbody
swath” on the main board) rather than compete in the game. This was because he/she would be lost his/her
Metal hexagon (a representative of radiation power; the winner of this game is the one who collect the most
Metal hexagon), if he/she stuck at blackbody swath. This lost made he/she feel disadvantaged so he/she assumed
that the competition was not real competition. This matter causing the given score by experts were low.
However, this situation did not happen to all players such as Player #2.
Player #1 …”umm”…
Player #2 … “yes, we compete in this game”…
Player #3 … “Then, for the competition is not a real competition, because the opportunity to fall at the
black object more often than the chance to win”...
Player #4 …”umm”…
As explain in the previous subtopic that the Stefan-Boltzmann board game could challenge students, this could
be confirmed by the responses of Player #1 and Player #2 below. Especially, the “Information card” (Power
radiation card) made Player #1 feel very challenge to collect the card.

AryNorsaputra, ThasaneeyaRatanaroutaiNopparatjamjomras, SuchaiNopparatjamjomras and
RatchapakChitaree/Development Of Stefan-Boltzmann Board Game Based On Game Characteristics
14
Player #1 … “ It was so challenges me to get more power radiation cards”...
Player #2 … “yes, I feel challenged to win the game”…
Player #3 …”umm”…
Player #4 …”umm”…
For the characteristic of “Rules”, many game components had the high score. This meant that many game
components were guided by the clearly rules. For example, the rules for “Main board” were to control the
players to 1) move their game avatar 2) use the “Information card” and “Action card”, and 3) collect the
radiation power from “Metal hexagon”. This could help the players to run the game easily but some of them
(Player #4) thought the rules were not show the game purpose which is learning the concept of Stefan-
Boltzmann‟s law.
Player #1 … “ the rules are good standard, there are the new things such as cards, and the dice that we
throw or we played, that is really possible”...
Player #2 …”umm”…
Player #3 …”umm”…
Player #4 … “ in case for understanding ….umm…….. the way to play the game and how to run the
game are clearly enough, but it is not to understand the aim of the game. I know your game
relate to the Stefan-Boltzmann's law, Then we could not, especially for me couldn't get the
point of the aim of the game”…
As interpreted in the previous subtopic, the “Self-card” and “Information card” were designed to present the
concept of Stefan-Boltzmann‟s Law. This information should be faced by players while they got it and may let
the players having good understanding towards the concepts. This might be the explanation why the score of
“Challenge” for both were higher than those of others (see Table 1). It was approved by Player #1‟s response
that he/she could differentiate the radiation power level by temperature; the yellow color had the highest
temperatures (in the range of dark red to yellow). In addition, students could use the information from these
cards to create their strategic plan that was approved by Player #2 and Player #4. They mentioned that if they
understood the contents on the information cards, they should collect the metal hexagon in order of its energy
level (highest to lowest). This feature was in accordance with Malone and Lepper(1987). On the other side, the
“Main board” and “Metal hexagon” also offered the good strategy by their challenge e.g. if the players noticed
that it was not necessary to complete all parameters to obtain the radiation power, they could cheat with
acquiring opponents‟ parameters with completing the last parameters in the same value to radiation power.
Player #1 … “Yellow has the highest temperature, because it is the brightest”...
Player #2 … “As I remember, it showed. Because, yellow color emitted by the glowing object have the
highest temperature than another color. I think the radiation power also higher than others”…
Player #3 … “umm……..At first, I was not, because I did not pay attention to self-card but after half the
game, I noticed it in directions in color and there is already listed”...
Player #4 … “For the theory, any way we can occasion. We're Getting the card, then we have time to
read, so and we had the most good right strategy at yellow, orange and it is its higher-energy
radiation”…
In addition, the Player #1 and Player #2 were able to determine the temperature of incandescent object by its
color.
Discussion and Conclusion

Proceeding of the 3rd International Conference on Education, Vol. 3, 2017, pp. 10-16
15
The concepts of radiation power emitted by object, absolute temperature, area, and emissivity were integrated
into a game cycle as the Stefan-Boltzmann board game. This game could present the interaction among the
concepts in an enthusiastic way.
The components of this board game, which were Main board, Metal hexagon, Self-card, Information card, and
Action card, were evaluated by the experts based on game characteristics: Competition and goals, Strategy and
tactical, Challenge, Rules, and Fantasy.
All game components except “Action card” were good at all game characteristics except “Competition and
goals”. This could be explained as 1) the students were not familiar with the game; 2) the researcher did not
have enough time to explain each game components and game rules, clearly; 3) the level of challenge for each
game components were not the same that made the goals of the game unclear; and 4) the Stefan-Boltzmann
board game was designed for a single purpose (to cover the topics of Stefan-Boltzmann‟s law, radiation power
emitted by object, absolute temperature, area, and emissivity) whereas Eisenack(2013) suggested that the good
game design should serve multiple purposes. On the other hand, the explanation for low score of “Action card”
was the insufficient implementation time for players to have a chance to use the card. This was because the
“Action card” was not distributed to students at the starting of the game, students had to collect the card during
the game. These results will be used to develop the other version of the Stefan-Boltzmann board game.
However, this learning approach could encourage students to read the information of the Self-cards and
Information cards that could help students to understand the Stefan-Boltzmann‟s law. Especially the effect of
the absolute temperature to the radiation power emitted or absorbed by the object. This was in accordance with
the statement proposed by Chiarello(2015) as “board games can be useful supports for the exposition and
explanation of complex scientific concepts”.
Acknowledgement
This study was conducted under the Grant of Mahidol-Norway Capacity Building Initiative for ASEAN. We
also wish to thank the Faculty of Graduate Studies of Mahidol University which support the financial cost in
attending the 3rd International Conference on Education (ICEDU) 2017 in Kuala Lumpur, Malaysia. Also the
experts; Ms. Shelly Effwinda and Mr. AgusRiyadi, and all other people involved in the research.
References
Alessi, S.M. and Trollip, S.R., 2000. Multimedia for learning: Methods and development (Allyn & Bacon, Inc).
Allery, L., 2014, Make use of educational games. Education for Primary Care, 25(1), 65-66.
Bochennek, K., Wittekindt, B., Zimmermann, S. Y., &Klingebiel, T., 2007, More than mere games: a review of
card and board games for medical education. Medical teacher, 29(9-10), 941-948.
Carvalho, P. S., & e Sousa, A. S., 2006, Should we use colours as symbolic representations of hot and
cold?.Physics education, 41(3), 263-266.
Charsky, D., 2010, From edutainment to serious games: A change in the use of game characteristics. Games and
Culture, 5(2), 177-198.
Chiarello, F., 2015, Board Games to Learn Complex Scientific Concepts and the" Photonics Games"
Competition. In European Conference on Games Based Learning. Academic Conferences International Limited.
Italy, October, (p. 774).

AryNorsaputra, ThasaneeyaRatanaroutaiNopparatjamjomras, SuchaiNopparatjamjomras and
RatchapakChitaree/Development Of Stefan-Boltzmann Board Game Based On Game Characteristics
16
Corbin, J. M., & Strauss, A., 1990, Grounded theory research: Procedures, canons, and evaluative criteria.
Qualitative sociology, 13(1), 3-21.
Edmonds, I. R. (1968). Stephan-Boltzmann law in the laboratory. American Journal of Physics, 36(9), 845-846.
Eisenack, K., 2013, A climate change board game for interdisciplinary communication and education.
Simulation & Gaming, 44(2-3), 328-348.
Gershen, J. A., &Handelman, S. L., 1974, Role-playing as an educational technique in dentistry. Journal of
dental education, 38(8), 451-455.
Huizinga, J., 2003, Homo Ludens: A Study of the Play Element in Culture (London, U.K.: Routledge)
Kirikaya, E. B., Iseri, S., &Vurkaya, G., 2010, A Board Game about Space and Solar System for Primary
School Students. The Turkish online Journal of Education technology, 9(2), 1-13.
Livingston, S. A., & Stoll, C. S., 1973, Simulation games, an introduction for the Social Studies teacher. Free
Press.
LoPresto, M. C., &Hagoort, N., 2011, Determining Planetary Temperatures with the Stefan‐Boltzmann Law. The
Physics Teacher, 49(2), 113-116.
Malone, T. W., &Lepper, M. R., 1987, Making learning fun: A taxonomy of intrinsic motivations for learning.
Aptitude, learning, and instruction, 3(1987), 223-253.
Marr, J. M., & Wilkin, F. P., 2012, A better presentation of Planck‟s radiation law. American Journal of Physics,
80(5), 399-405.
Popil, I., & Dillard-Thompson, D., 2015), A game-based strategy for the staff development of home health care
nurses. The Journal of Continuing Education in Nursing, 46(5), 205-207.
Richardson, D., &Birge, B., 1995, Teaching physiology by combined passive (pedagogical) and active
(andragogical) methods. The American journal of physiology, 268(6 Pt 3), 66-74.
Sadoglu, G. P., 2015, Turkish Student‟s Perception about the Black Body Radiation, Photoelectric Effect and
Compton Scattering Phenomena. Journal of Studies in Education, 5(3), 309–326.
Shiroma, P. R., Massa, A. A., & Alarcon, R. D., 2011, Using game format to teach psychopharmacology to
medical students. Medical teacher, 33(2), 156-160.
Siegel, R., & Howell, J. R., 1972, Thermal Radiation Heat Transfer (New York U.S.A: McGraw Hill).
Smith, D. R., 2003, "Voyager" an Educational Card game. Physics Education, 38(1), 47-51.
Smyrnaiou, Z., Foteini, M., &Kynigos, C., 2012, Students‟ constructionist game modelling activities as part of
inquiry learning processes. Electronic Journal of E-Learning, 10(2), 235–248.
Thornton, S., & Rex, A., 2006, Modern Physics for Scientists and Engineers fourth Edition (Cengage Learning).

Proceeding of the 3rd International Conference on Education, Vol. 3, 2017, pp. 17-28 Copyright © 2017 TIIKM ISSN 2424 - 6700 online DOI: https://doi.org/10.17501/icedu.2017.3103
3rd International Conference on Education, 20-22 April 2017, Kuala Lumpur, Malaysia
CROSS-COUNTRY ANALYSIS ON NEIGHBORING
MIGRATION POLICY BY THE EXAMPLE OF FINLAND
AND RUSSIA
Maria Pitukhina1, Svetlana Shabayeva
2 and Andrej Privara
3
1Petrozavodsk State University, Russia
2Petrozavodsk State University, Russia 3 University of Economics in Bratislava, Slovakia
Abstract: Article deals with, in particular, migration influence on both qualitative and quantitative
human capital parameters in a recipient country. Currently Russian migration policy is under
transition - the necessity of taking serious measures is acute, especially taking into account migrants’
human capital parameters such as education. Tajikistan, Kirgizia, Armenia are main countries of
migrants’ origins in Russia. Migrants from these countries are mainly unskilled, poorly educated,
low wage labor. Migration policy in Finland is considered to be highly adaptive and balanced.
Reasons for Finland’s success are the best European projection system of labour market parameters;
VET and higher education development; skills anticipation; information dissemination in society;
lifelong learning implementation. There is a variety of methods widely applied in the article –
qualitative evaluation of labour market parameters, desk studies, documents analysis, and
comparative research. The research reflects on the OECD indicators “Education at Glance” 2011;
Statistics Russia; Russian Strategy 2020 – a new model of growth; National Finnish Acts 1994,
1999, 2003, 2004; Concept on state migration policy in Russia till 2025; EUROSTAT etc. Authors
conclude that Russian migration policy shall implement Finnish approach since only full and up-to-
date data will contribute to the result-oriented decision-making process.
Keywords: Education in a Multicultural Society, Foreign Labour Migration, Human Capital
Introduction
One of the recent trends – foreign labour migrants increase both in the European Union (EU) and Russia – is
conditioned on by population ageing and huge decrease of active working age what logically result in acute
recruitment needs for economy. Taking into consideration both innovative economy implementation and
globalization processes it is highly necessary to supply labour force.
Foreign labour migration is a controversial phenomenon; much depends upon institutional differences and gaps,
migration policies’ history, cultural links, economy structure. Nowadays foreign labour migration demand both
in the EU as well as in Russia is high. The census held in 2010 in Russia revealed that migration surplus in
1992–2010 amounted to 7 million people only and thus compensated 60 per cent or 13,1 million of natives’
natural loss. Without this large–scale nomadism from the ex–USSR, Russian population would amount to 135,4
million instead of 142,9 million nowadays (Strategy 2020 2011). The challenge of the population ageing is
widely perceived in Europe. Italy highlights that if Italians want to pursue the same life standards by the year
2050, they will have to create 2,400 job places for migrants annually [18]. German chamber of trade claims that
Germany lacks 400 000 highly–qualified workers – this shortage costs 25 billion euro annually, what is
equivalent to 1% of country’s economic growth [1, с.151.].
Another important issue dealing with foreign labour migration is migrants’ unwillingness to be integrated into
society. Some scholars claim that “recipient society’s values are not taken over” [1, с.152] and quite often
migrants’ costs exceed migrants’ contribution to the recipient economies. This problem is also reflected in the
Corresponding Author: Maria Pitukhina/[email protected]

Maria Pitukhina, Svetlana Shabayeva and Andrej Privara/ Cross-country analysis on neighboring migration policy by the example of Finland and Russia
18
EU literature. Most of the studies on foreign labour migration in Finland are handled by the Institute of
Migration in Turku (E.Heikkilä, M.Pikkarainen, О.Koivukangas, А.-L.Toivanen, Р.Kero, М.Niemi, I.Soderling,
О.-К.Kaskinen). Few studies on foreign labourt migration inclusion into Russian labour market are mostly
pursued by individual researchers (S.Shabayeva N.Parikova, M.Pitukhina, V.Mukomel, V.Iontsev, T.Zhigalina).
For the last years migration attractiveness has dropped in Russia. Society is constantly challenged with anti–
migration moods, while migrants themselves lack serious motivation to changes. Currently Russian migration
policy is aimed at temporary labour migration and doesn’t contribute to migrants’ integration in the society [2].
Finland, Germany, and Australia pay much attention to this issue on a state level. This result in a migration
policy, well-balanced and rationalized, aimed at both risks mitigation and recipients’ economies benefitting.
Obviously, foreign labour migration is a complex socio-political phenomenon playing the key role in economy.
To a greater extent it conditions on country’s socio-economic development.
Current article is dealing with neighboring migration policies analysis of Finland and Russia. Russia and
Finland have a common geopolitical and historical context. Their border amounting to 1325,8 kilometers is the
longest between Russia and the European Union.
The aim of the paper is to perform analysis of foreign labour migration influence on human capital
development; to pursue a cross-country analysis; to outline the main challenges for the human capital
development in Russia; to suggest measures aimed at overcoming challenges for the human capital development
in Russia taking into account the best foreign practice (case of Finland).
Basic elements of Finnish migration policy were defined almost 20 years ago. Nowadays they are still topical:
Act on the Integration of Immigrants and Asylum Seekers 493/1999 [10], Nationality Act 359/2003 [13], Aliens
Act 301/2004 [12], Act on the Municipality of Domicile 201/1994 [11]. Fundamental principles of Russian
migration policy are represented in the Constitution 12.12.1993. However, current economic situation demanded
new legislation and thus a number of new conceptual documents have recently appeared: the President’s
“Decree on international consensus achievement” 7.05.2012 [8]; “Concept on state migration policy till 2025”
13.06.2012 [3]; “Strategy–2020: new growth model – new social policy” 14.03. 2012 [6].
Nowadays Finland is pursuing active migration policy aimed at migrants’ integration on labour market by
means of upgrading their language skills and qualification. Migrants’ kids have an overall access to education,
they also enjoy the right to study their mother–tongue. Finland is paying much attention towards multicultural
education. Migrants’ access to political participation is especially welcomed on regional and municipal levels –
they are entitled to vote and to be elected. Finland is taking the second place after Norway in terms of migrants’
political participation flexibility. A wide spectrum of different laws prohibiting any kind of racial, religious,
national discrimination is widely implemented in Finland. Migrants in Finland have a free access to legal
assistance through a recently created office of Ombudsman for minorities.
All these principles were actually declared in Russia years ago, however, all the necessary documents were
adopted in 2012.
Migration policy in Finland is considered to be highly adaptive, balanced, first of all preserving national
interests. Success of such migration policy is conditioned on by implementing the best system of labour market
parameters projection in Europe. The projection results are widely implemented by policymakers and citizens.
Complementary and highly detailed statistic data is also a crucial issue.
While analyzing reasons for Finland’s success we are highlighting the main aspects - quality and quantity of
systemic approach on foreign labour migration in its diverse aspects – the best projection system of labour

Proceeding of the 3rd International Conference on Education, Vol. 3, 2017, pp. 17-28
19
market parameters in Europe; foreign labour migration influence evaluation on human capital quality; VET
development; skills anticipation; both information and research results dissemination in society; lifelong
learning implementation.
2.Defining human capital parameters
Foreign labour migration influences both current and potential human capital development in a recipient
country.
In one of the fundamental research on human capital dated 1982 “On the mechanics of economic development”
[19] Lucas is giving the first definition to human capital – “the way it affects current production and the way the
current time allocation affects the accumulation of it”. Thus, Lucas believes that the principle feature of human
capital is productivity in time. In Mankiw, Romer, and Weil paper dated 1992 and titled “A contribution to the
empirics of economic growth” [20] authors perceive human capital through such parameters as: high income,
technological changes, labour force growth. Gatman and Schonberg in their paper in 2008 on “How general is
human capital? A task–based approach” claimed that the main human capital determinants are skills (Gatman
and Schonberg 2008) [15].
Despite the fact that human capital is a complex phenomenon, it is possible to evaluate it by means of the
Human Development Index. This is especially vital while performing cross-country analysis. The UN is
calculating the Human Development Index for each country annually. The Human Development Index includes
such parameters as lifetime, living standard, literacy, education. It would be pretty interesting to compare the
countries parameters and observe how these criteria are implemented both in Russia and Finland:
– foreign labour migrants’ vocational education;
– foreign labour migrants’ Human Development Index.
3.Foreign labour migrants’ vocational education.
Both in Russia and Finland it is widely perceived that low–qualified migrants will experience the layoff in the
nearest future. In this terms human capital development is becoming crucial. As it is visible from the Table 1
foreign labour migration in Russia is characterized with a low–qualified workforce: migrants speak poor
Russian, and main migration flows to Russia are mostly those with elementary vocational education. Huge
numbers of labour migrants come from the Commonwealth of Independent States – Uzbekistan (41%),
Tajikistan (21.5%), Ukraine (13.4%), and Kirgizstan (9.4%) [7, сс. 233-234]. The majority (86%) of these
foreign immigrants to Russia are male. Thus, the majority of foreign labour migrants in Russia are low-skilled
[7]. Such a situation seriously contradicts many global trends mentioned in the WDR “skilled workers represent
a growing share of international migration” [25, с.234]. However, there is explanation. For the last two decades
Russia has been involved in an “overall” tertiary vocational education. In Russia in 1980ies there used to be
only 40% of graduates from tertiary vocational education institutions, at the end of 1990ies this number rocketed
and accounted for 75% [7]. This seriously challenged the occupational-qualification structure of the Russian
labour market. In 1980s USSR, there used to be one manager for every three workers; nowadays there is one
worker for every three managers [5]. Thus, our country has done a lot to contribute to the labour force shortage
which is trying to be resolved via foreign labour migration nowadays. Such situation might cause serious
negative outcomes, such as social tensions increasing and human capital degradation. Thus, quality of foreign
labour migration tends to be a very acute problem in Russia especially in terms of labour force shortage and
population ageing.

Maria Pitukhina, Svetlana Shabayeva and Andrej Privara/ Cross-country analysis on neighboring migration policy by the example of Finland and Russia
20
Table 1 Redistribution of native workers and labour migrants in Russia in vocational education (per cent), 2011
Level of vocational education Native workers in
Russia
Labour migrants in Russia
Tertiary 55% 16%
Secondary 24% 27%
Elementary 21% 57%
Total 100% 100%
However, in terms of innovative economy implementation it is highly important to reflect not only on
qualitative aspect of foreign labour migrants. It is mentioned in the Concept on state migration policy till 2025:
“For the recent 2 decades migration surplus has increasingly substituted more than half of natural loss” [3], what
is no doubt highly important. Nowadays human capital upgrading becomes highly crucial. In 2012 the
President’s “Decree on international consensus achievement” introduced “mandatory exams for foreign labour
migrants in Russian language, Russian history, Russian legislation excluding those who are highly–qualified”
[8]. Right after the Decree publication in May 250 assessment centers were open in Russian regions. Starting
with the 1 January 2013 all migrants shall take exam in Russian language. Language tests were elaborated by 3
leading Russian Universities: Moscow State University, St.Petersburg State University and Russian University
of People’s Friendship. These tests include exercises in listening comprehension, grammar, and communication.
850 Russian words are set to be migrants’ mandatory minimum. Starting with 2015 migrants shall take exams in
Russian history and Russian legislation.
Table 2 below demonstrates native workers and foreign labour migrants redistribution in Finland by the
vocational education level. It is visible that situation in Finland is very much different from Russian. Balance,
the main feature of Finnish vocational system, is proved vividly with equal level of education both for migrants
and native workers. Such situation is conditioned on by present–day realia, particularly, innovative economy
implementation. Its successful implementation is possible due to its constant labour force development and of
course shall be supported by political measures. In particular, the Finnish National Board of Education has
developed a strategy titled “Learning and competence 2020” that stresses the development of civil skills such as
creativity, interaction, active participation, self–expression, influence, self–education, responsibility what are
resulting in “national intellectual capital” [23].
Table 2. Redistribution of native workers and labour migrants in Finland in vocational education (per cent), 2011
Level of vocational education Native workers in
Finland
Labour migrants in Finland
Tertiary 37% 33%
Secondary 45% 42%
Elementary 18% 25%
Total 100% 100%
A broad picture on qualitative aspects of migration policy is represented with such index as Human
development index (HDI) [24].

Proceeding of the 3rd International Conference on Education, Vol. 3, 2017, pp. 17-28
21
Foreign labour migrants’ Human Development Index
The major countries of origin for migrants in Finland are mainly the former Soviet Union (20 per cent), Sweden
(12.8 per cent), Finland (10.3 per cent). (Fig.1).
Figure 1. Foreign labour migrants in Finland, 2011
The major countries of migrants origin in Russia are Uzbekistan (511,500), Tajikistan (268,600), Ukraine
(167,300), and Kirgizia (117,700) [9].
It is obvious that countries of origin for foreign labour migrants are different in cases of Russia and Finland.
This is increasingly influencing human capital quality. It is obvious from the Table 3 that the Finnish Human
Development Index is amounting to 0,882 and foreign labour migrants mostly possess very high, high or middle
indexes. Russian human development index is amounting to 0,755 and foreign labour migrants mostly acquire
middle and low indexes.
Table 3. HDI qualitative evaluation for foreign labour migrants in Russia and Finland
Country of origin of foreign
labour migration
HDI of foreign labour
migrants in Finland
HDI of foreign labour
migrants in Russia
Germany 0,905
Sweden 0,904
UK 0,863
Estonia 0,835
Serbia 0,766
Russia 0,755
China 0,687
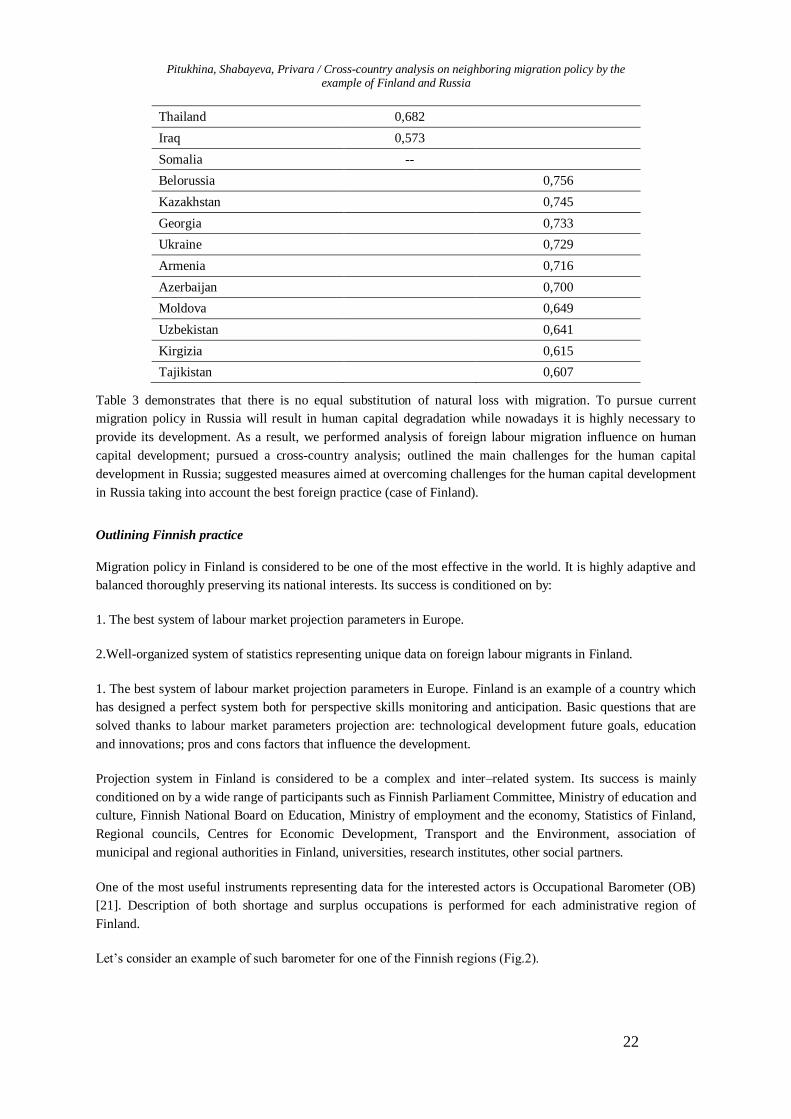
Pitukhina, Shabayeva, Privara / Cross-country analysis on neighboring migration policy by the example of Finland and Russia
22
Thailand 0,682
Iraq 0,573
Somalia --
Belorussia 0,756
Kazakhstan 0,745
Georgia 0,733
Ukraine 0,729
Armenia 0,716
Azerbaijan 0,700
Moldova 0,649
Uzbekistan 0,641
Kirgizia 0,615
Tajikistan 0,607
Table 3 demonstrates that there is no equal substitution of natural loss with migration. To pursue current
migration policy in Russia will result in human capital degradation while nowadays it is highly necessary to
provide its development. As a result, we performed analysis of foreign labour migration influence on human
capital development; pursued a cross-country analysis; outlined the main challenges for the human capital
development in Russia; suggested measures aimed at overcoming challenges for the human capital development
in Russia taking into account the best foreign practice (case of Finland).
Outlining Finnish practice
Migration policy in Finland is considered to be one of the most effective in the world. It is highly adaptive and
balanced thoroughly preserving its national interests. Its success is conditioned on by:
1. The best system of labour market projection parameters in Europe.
2.Well-organized system of statistics representing unique data on foreign labour migrants in Finland.
1. The best system of labour market projection parameters in Europe. Finland is an example of a country which
has designed a perfect system both for perspective skills monitoring and anticipation. Basic questions that are
solved thanks to labour market parameters projection are: technological development future goals, education
and innovations; pros and cons factors that influence the development.
Projection system in Finland is considered to be a complex and inter–related system. Its success is mainly
conditioned on by a wide range of participants such as Finnish Parliament Committee, Ministry of education and
culture, Finnish National Board on Education, Ministry of employment and the economy, Statistics of Finland,
Regional councils, Centres for Economic Development, Transport and the Environment, association of
municipal and regional authorities in Finland, universities, research institutes, other social partners.
One of the most useful instruments representing data for the interested actors is Occupational Barometer (OB)
[21]. Description of both shortage and surplus occupations is performed for each administrative region of
Finland.
Let’s consider an example of such barometer for one of the Finnish regions (Fig.2).
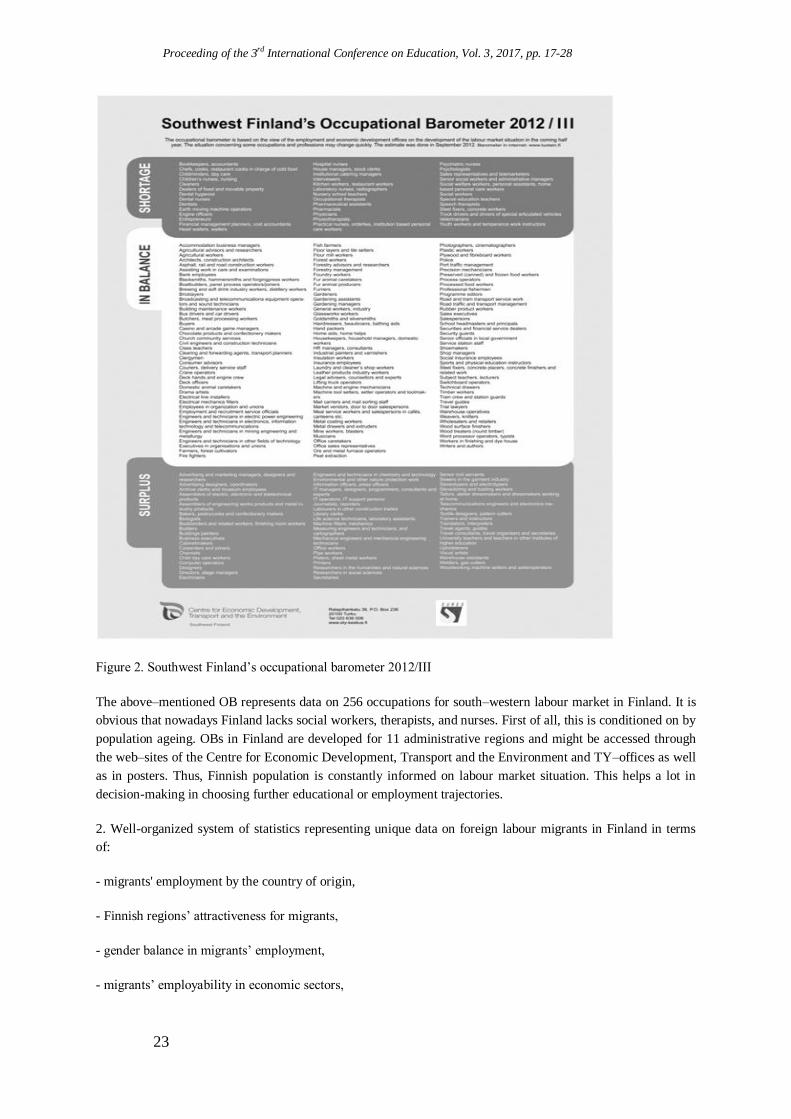
Proceeding of the 3rd International Conference on Education, Vol. 3, 2017, pp. 17-28
23
Figure 2. Southwest Finland’s occupational barometer 2012/III
The above–mentioned OB represents data on 256 occupations for south–western labour market in Finland. It is
obvious that nowadays Finland lacks social workers, therapists, and nurses. First of all, this is conditioned on by
population ageing. OBs in Finland are developed for 11 administrative regions and might be accessed through
the web–sites of the Centre for Economic Development, Transport and the Environment and TY–offices as well
as in posters. Thus, Finnish population is constantly informed on labour market situation. This helps a lot in
decision-making in choosing further educational or employment trajectories.
2. Well-organized system of statistics representing unique data on foreign labour migrants in Finland in terms
of:
- migrants' employment by the country of origin,
- Finnish regions’ attractiveness for migrants,
- gender balance in migrants’ employment,
- migrants’ employability in economic sectors,

Pitukhina, Shabayeva, Privara / Cross-country analysis on neighboring migration policy by the example of Finland and Russia
24
- migration unemployment rate,
-share of highly-skilled and low-skilled migrants.
Thus, statistics on «migrants’ employment by the country of origin» reveals the highest level of employment for
migrants from Estonia, the UK, Sweden, China, Turkey, the USA. Migrants from Iran, Somalia, Iraq, the former
Yugoslavia Republic possess the lowest employment rates [16].
Gender balance in foreign labour migration is also picturesque. Females reveal the same employment results as
males do - in trade (16%), education and research (13%), healthcare (12%). These numbers don’t seriously
differentiate from those for males in trade (17%), finances, insurance, business (15%).
In Finland regions’ attractiveness in the framework of foreign labour migration is studied thoroughly. Thus,
Finnish Ahvenmaa possesses the most favorable conditions for migrants’ employment. Second place goes to
Uusimaa. It is obvious that southern Finland turns out to be the most attractive for migrants comparing to its
northern part. Thus, in Lapland, Kainuu only 15% of migrants are able to find job [16].
Nowadays a well-organized system of statistics is absent in Russia. There is no detailed research on Russian
regions’ attractiveness for migrants, poor knowledge on feminization of migration on the labour market. It is
highly necessary both to study and implement the Finnish model of foreign labour migrants in Russia.
4.Conclusion
Current situation in Russia and Finland is a result of measures taken by each country. Migration policy in
Finland is first of all aimed at the Finnish society needs and results in negative factors annihilation. A complex
system of preventive measures aimed at migrants’ integration into Finnish society results in human capital
development. A thoroughly planned system of different measures, consecutive implementation of these
measures, migrants’ adaptation in culture and language, results dissemination on labour market help Finland to
overcome present–day challenges: population ageing, depopulation, productivity gap.
Russia is currently transforming its migration policy. High necessity of Russian transformations is highly
obvious taking into consideration, in particular, Finnish experience. Russian migration policy should put the
goals where the key–element will be Russian society’s interests. It is obvious that full, valid, and up–to–date
information will contribute to result–oriented decision–making. Information collecting on foreign labour
migrants is far not enough, it is also important to apply it for further analysis of current situation on labour
market and in decision–making. Data layout on foreign labour migrants by the Finnish example will contribute
to further information dissemination on current and perceptive labour market situation. Finland’s experience
might become highly useful in finding solutions on foreign labour migration.
Acknowledgements
The article was prepared under the Strategic Development Program of Petrozavodsk State University.
References
Жигалина, М, 2011. Миграция как фактор развития человеческого потенциала мегаполиса, крупного
города // Международная научно-практическая конференция “Германия и Россия: опыт и перспективы
членства в ВТО” : материалы конференции/ ВШЭ СПб.- 16 апреля Санкт-Петербург. - 2011. – сс.151-
153.

Proceeding of the 3rd International Conference on Education, Vol. 3, 2017, pp. 17-28
25
Итоговый доклад о результатах экспертной работы по актуальным проблемам социально-экономической
стратегии России на период до 2020. Date of access: 01/05/2017 http://youngscience.ru/files/news-150312-
strateg2020.pdf .
Концепция государственной миграционной политики РФ на период до 2025 года. Date of access: 01/05/2017 http://www.kremlin.ru/acts/15635 .
Парикова, Н., Сигова, С., 2011. Влияние зарубежной трудовой миграци. Date of access: 01/05/2017
http://openbudgetrf.ru/doc/141/
Послание Президента ФС РФ 5/11/2008. Date of access: 01/05/2017
http://base.consultant.ru/cons/cgi/online.cgi?req=doc;base=LAW;n=81294.
Стратегия-2020: Новая модель роста - новая социальная политика. Date of access: 01/05/2017 http://www.intelros.ru/reports/13467-itogovyy-doklad-o-rezultatah-ekspertnoy-raboty-po-aktualnym-
problemam-socialno-ekonomicheskoy-strategii-rossii-na-period-do-2020-goda-strategiya-2020-novaya-model-
rosta-novaya-socialnaya-politika.html
Труд и занятость в России. 2010. Статистика: 233-234.
Указ Президента РФ от 7 мая 2012 года “Об обеспечении межнационального согласия”: Date of access:
01/05/2017 www.kremlin.ru
Федеральная служба статистики. 2010. Социально-экономические индикаторы. Регионы РФ, Москва:
252-288.
Act 1999. On the Integration of Immigrants and Reception of Asylum Seekers 493. Date of access: 01/05/2017
http://www.finlex.fi/en/laki/kaannokset/1999/en19990493.pdf
Act 1994. On the Municipality of Domicile 201 Date of access: 01/05/2017 www.stat.fi
Act 2004. Aliens Act 301. Date of access: 01/05/2017
http://www.finlex.fi/en/laki/kaannokset/2004/en20040301.pdf
Act 2003. Nationality Act 359. Date of access: 01/05/2017
http://www.finlex.fi/en/laki/kaannokset/2003/en20030359.pdf
EUROSTAT. Migrants in Europe. A statistical portrait of the first and second generation. Date of access:
01/05/2017 http://epp.eurostat.ec.europa.eu/cache/ITY_OFFPUB/KS-31-10-539/EN/KS-31-10-539-EN.PDF
Gatman, Ch., Schonberg, U. How general is human capital? A task-based approach, 2007. Date of access:
01/05/2017 http://www.cepr.org/meets/wkcn/4/4560/papers/GathmannFinal.pdf
Heikkilä, E., Pikkarainen, M., 2011. Internationalization of Population and Labour Forcefrom the Present to the
Future in Finland. Date of access: 01/05/2017 http://www.aemi.dk/publications/AEMI%20Journal%2008-
09.pdf?page=169
Inkeri repatriation has stopped. Finnish immigration service. Date of access: 01/05/2017
http://www.migri.fi/download/16763_paluumuuttojono_ru.pdf
Interview of professor Stefano Bianchini. Date of access: 01/05/2017 http://capriciosa.ru/ru/beseda-s-
professorom-universiteta-boloni-stefano-byankini.html
Lucas, R. On the mechanics of economic development, 1987. Date of access: 01/05/2017
http://www.parisschoolofeconomics.eu/docs/darcillon-thibault/lucasmechanicseconomicgrowth.pdf
Mankiw, N., Romer, D., Weil, D. A contribution to the empirics of economic growth, 1992. Date of access:
01/05/2017 http://www.amenezes.uac.pt/macroeconomiaII/macroeconomiaII_20062007/papers/mrw1992.pdf
Occupational barometer. Date of access: 01/05/2017 www.turku.fi/download.aspx?ID=91536&GUID...D080-
4A13
OECD indicators. Education at glance. Date of access: 01/05/2017
http://www.oecd.org/education/highereducationandadultlearning/48631582.pdf
Strategy. Learning and competence 2020. Finnish National Board of Education. Date of access: 01/05/2017
http://www.oph.fi/download/135542_learning_and_competence_2020.pdf
UN report. Human Development Index Report. Date of access: 01/05/2017
http://hdr.undp.org/en/reports/global/hdr2011/download/

Pitukhina, Shabayeva, Privara / Cross-country analysis on neighboring migration policy by the example of Finland and Russia
26
World Development Report. Date of access: 01/05/2017
http://wdronline.worldbank.org/worldbank/a/c.html/world_development_report_2013/abstract/WB.978-0-8213-
9575-2.abstract.
Appendix
Figure 1. Foreign labour migrants in Finland, 2011

Proceeding of the 3rd International Conference on Education, Vol. 3, 2017, pp. 17-28
27
Figure 2. Southwest Finland’s occupational barometer 2012/III
Table 1 Redistribution of native workers and labour migrants in Russia in vocational education (per cent), 2011
Level of vocational education Native workers in
Russia
Labour migrants in Russia
Tertiary 55% 16%
Secondary 24% 27%
Elementary 21% 57%
Total 100% 100%

Pitukhina, Shabayeva, Privara / Cross-country analysis on neighboring migration policy by the example of Finland and Russia
28
Table 2. Redistribution of native workers and labour migrants in Finland in vocational education (per cent), 2011
Level of vocational education Native workers in
Finland
Labour migrants in Finland
Tertiary 37% 33%
Secondary 45% 42%
Elementary 18% 25%
Total 100% 100%
Table 3. HDI qualitative evaluation for foreign labour migrants in Russia and Finland
Country of origin of foreign
labour migration
HDI of foreign labour
migrants in Finland
HDI of foreign labour
migrants in Russia
Germany 0,905
Sweden 0,904
UK 0,863
Estonia 0,835
Serbia 0,766
Russia 0,755
China 0,687
Thailand 0,682
Iraq 0,573
Somalia --
Belorussia 0,756
Kazakhstan 0,745
Georgia 0,733
Ukraine 0,729
Armenia 0,716
Azerbaijan 0,700
Moldova 0,649
Uzbekistan 0,641
Kirgizia 0,615
Tajikistan 0,607
Proceeding of the 3rd International Conference on Education, Vol. 3, 2017, pp. 29-37
Copyright © 2017 TIIKM ISSN 2424 - 6700 online DOI: https://doi.org/10.17501/icedu.2017.3104
3rd International Conference on Education, 20-22 April 2017, Kuala Lumpur, Malaysia
STUDENTS’ PERCEPTION OF GROUP WORK AND
KNOWLEDGE BUILDING IN AN ECONOMICS UNIT
Heng Kiat Sing1, Philip Nuli Anding
2, Tan Kock Wah
3
1Swinburne University of Technology Sarawak Campus, Malaysia 2,3Universiti Malaysia Sarawak, Malaysia
Abstract: The purpose of this study is to examine students‟ perception of group work and
knowledge building in an economics unit. Even though economics is a required subject for most
business courses in higher education, past studies have shown that students perceived economic
concepts as too abstract to understand and irrelevant to the real world. A qualitative research
approach was chosen, using semi-structured face-to-face focus groups and/or individual interviews
with forty-six business students who voluntarily participated in this study. The research results
revealed that students have either a positive or negative perception of group work and knowledge
building experience. Furthermore, this study found out that students who work in groups are able to
demonstrate their ability in making economic concepts relevant by connecting the concepts to the
real world if there is an on-going collaborative effort among team members. Guidance from the
lecturer and team members could support some students particularly those who came from high
school to tertiary learning, and where this is their first exposure to group work that deals with the
complexities of real world events. The results presented may facilitate improvements in group work
and increase the likelihood of knowledge building in economics subjects.
Keywords: Group Work, Knowledge Building, Collaborative Learning, Economics
Introduction
A primary concern in higher education is that graduates are expected to acquire knowledge and skills so
that they are able to develop competence in continuous learning and problem solving in real life
situations. Economics is a required subject for most business courses in tertiary learning. A diverse
group of students poses a challenge for economics lecturers not only in terms of determining the
relevant subject-specific skills to be embedded in the subject, but also in deciding the range of generic
skills that the students will learn and later enable them to enhance their employment opportunities
(Forsythe, 2010). Zlatkin-Troitschanskaia et al. (2016) reviewed past studies and state that the
importance of economic knowledge in higher education has increased significantly not only in business
but also in law and engineering courses at the international level.
Background of the study
This study researched and reported on students‟ perception of group work and knowledge building on
group assignment that is related to economics in the business environment. The aim of this group
assignment is to expose students to different market structures so that students will understand the
behaviour of firms by examining and comparing businesses from a similar industry. In this study, group
work refers to students work together to complete a written report whereas knowledge-building is
defined as the “production and continual improvement of ideas of value to a community” (Scardamalia
and Bereiter, 2003, p.1371) that is students learn how to continually improve ideas among group
members.
Corresponding Author: Maria Pitukhina/[email protected]
Heng Kiat Sing, Philip Nuli Anding and Tan Kock Wah / Student’s Perception of Group Work and Knowledge Building
in an Economics Unit
30
Review of related literature
Group work provides chances for students to negotiate meaning, manipulate ideas with others and
reflect upon their learning (Fraser and Deane, 1997). Small group structures help distribute the
cognitive load among the members of the group. This happens by taking advantage of group members‟
distributed expertise. Discussion among team members activates relevant prior knowledge and
facilitates the processing of new information (Hmelo-Silver, 2004). This means that each member‟s
efforts are required and indispensable for group success. Thus each member has a unique contribution
to make to the joint effort because of the availability of resources, roles, and task responsibilities
(Johnson and Johnson, 1999).
Participants through their collaborative interactions within a social and environment context (King et al.
2010; Yew et al. 2011) build knowledge. Bruffee (1995) states that the collaborative learning not only
helps students become autonomous, articulate, and socially and intellectually mature, it also helps
students learn the issues significantly due to a discipline-based inquiry process. Learners are able to
construct meaning and knowledge, and identify the course of learning through active participation in
individual and social activities (Biggs, 1996). Theoretically, the hierarchies of the building of
knowledge in an economics subject starts from mastering the basic economic concepts to attaining
higher-ordered thinking, creativity and synthesis of knowledge (Steinemann, 2003; Walstad, 2001). It is
assumed that if students understand the subject content, they will be able to retrieve meaning from it
and build interconnectivity between related concepts since “individuals are active in the reconstruction
of the messages and meanings of assessments” (Sambell and McDowell, 1998, p.391).
With research and learning carried out in groups, students can learn how peer learning enforces
knowledge and how group interaction allows deliberation and the exchange of information. Team
members share responsibility for the overall advancement of knowledge in the team. This is consistent
with the socio-cultural approach, the view of learning focuses on collaborative knowledge building and
is an ongoing activity at the group level (Arvaja, 2005; Arvaja et al. 2007).
Purpose of the study
In previous studies, students have stated that economic concepts are too abstract to understand and they
perceive these concepts as irrelevant to the real world (Islam, 2011; Reimann, 2004). Furthermore,
studies in economics research (Tang, 2003; Tang and Robinson, 2004) have consistently shown that
students lack the skill or ability to apply economic concepts to real world problems. Despite a great
amount of writing devoted to introducing and integrating group work that deals with real problems to
engage student learning (Forsythe, 2010; Goodman, 2010; Guest, 2012), there remains a paucity of
evidence on the content and nature of knowledge building that takes place in collaboration between
students.
Hence this study aims to examine students‟ perception of group work and knowledge building in an
economics unit. Also, this study is relevant to higher education government policy in Malaysia because
economics is an elective subject in secondary school, but is classified as a compulsory subject for all
pre-university and undergraduate business studies (Khoo and Abdul, 2013). This study was conducted
in the context of a naturalistic educational context, that is in a higher learning institution, so the process
of knowing should be highly valued (Brownlee et al. 2009).

Proceeding of the 3rd International Conference on Education, Vol. 3, 2017, pp. 29 - 37
31
Research methodology
A qualitative research approach was chosen, using semi-structured face-to-face focus groups and/or
individual interviews lasting up to one hour. The purpose of the focus group interviews is to get
collective views on a group of people, normally three to five members in a group. The individual
student interviews and focus group interviews were organized separately. Direct quotations from
interviews are a basic source of raw data in qualitative inquiry that could reveal respondents‟ depth of
emotion, the ways they have organized their world, their thoughts about what happened, their
experiences, and their basic perceptions (Patton, 2002) will be presented in the findings and discussion
section. For ethical reasons, all the names used in this study are pseudonyms.
Purposive sampling was used in this study in selecting information-rich cases for in-depth study. Patton
(2002, p. 230) states that, “Studying information-rich cases yields insights and in-depth understanding
rather than empirical generalization.” The participants were recruited from the course of Foundation of
Arts in a private university in Sarawak. The criterion for participant selection was that participants were
business students who enrolled for an introductory economics unit whereby this unit involved group
work and group assessment. Fifty business students attended a briefing that was conducted by the
researcher. After the briefing, a total of forty-six students expressed their willingness to participate in
this study.
Findings and discussion
The research results reveal that students have either a positive or negative perception of group work and
knowledge building experience.
Students’ perceptions about their experiences with group work
The majority of the participants (n = 33) perceived their experience with their group work positively.
Results reveal that students who found the experience of working in groups positive were more likely to
reveal that they were satisfied with their team members and team leaders. Besides that, they revealed
that they were content with the way that meetings were conducted in their groups. They also perceived
that their interpersonal relationship with their team members as good and pleasant. In addition to that,
they enjoyed the field work that they participated in. They identified that with the exposure to this
group assignment, they have gained knowledge on the current economy, background of the
organization, how to do business, preparing a report, planning the allocated tasks, and they had
opportunities to share ideas among team members. This means that in certain circumstances ideas
proposed by some students were taken over and expanded on by others. In this way, the cycles of
discussion contributed both to the diffusion of ideas in the group as well as to the expansion of
knowledge (Elbers and Streefland, 2000).
Students who had an unpleasant experience with their group work expressed that they were dissatisfied
with the task allocated in the group assignment, field work experience, and interpersonal relationship
among team members. Students expressed concerns that they did not receive proper guidance from
seniors. Seniors are perceived by juniors as experts to guide them in their discipline; juniors are
ordinary group members who perceived themselves as novices in their discipline. Hence, the guidance
provided by seniors is greatly needed by juniors. Apparently this did not happen in some groups.
Besides that, communication barriers also caused an unpleasant experience for some students. Students
were not able to familiarize themselves with each other in a short period of time when members come
from diverse language and cultural backgrounds so it was difficult “to expect newly formed groups with
a substantial degree of cultural diversity to be able to solve problems very effectively” (Watson et al.
1993, p.598).

Heng Kiat Sing, Philip Nuli Anding and Tan Kock Wah / Student’s Perception of Group Work and Knowledge Building
in an Economics Unit
32
Student perceptions about their experiences with knowledge building
Based on student narrative descriptions, it is most likely that a positive group work experience may lead
to a positive knowledge building experience. This is evidenced in some participants, like G, H, J and R,
where they explained their positive experience in knowledge building. However, we cannot deny the
presence of negative group work experience that may prohibit students to engage in knowledge
building.
A participant, J, highlighted the importance of „understanding‟ in her knowledge building experience.
This signifies that in group work, students take responsibility for advancing the group‟s understanding
as they ask questions and built on each other‟s thinking to construct collaborative explanations (Hmelo-
Silver and Barrows, 2008). This also confirms that if group assessments are employed correctly, it is
undoubtedly they have the potential to promote better student interaction and understanding and allow a
sharing of different views and knowledge (Strauss and Alice U, 2007).
“Without understanding, we cannot complete this task, we don't understand what
economics is; we cannot come up with our own sentences or otherwise you know
people would say we plagiarize other people's work. I think it is all based on
understanding, you have to understand the economic terms." (Participant J, individual
interview on 20th July 2016 at 1pm)
Another participant, R, used the term „communication‟ to illustrate his knowledge building experience.
This finding is consistent with that of Jang (2007, p. 68) who found that “talk becomes a key
component of knowledge construction and validation.”
“For me (it) is communication. It is because we have to talk to each other to know what
others are thinking and some just keep quiet, so we try to talk to them to get to know
each other so we can know and do it together.” (Participant R, focus group interview on
20th July 2016 at 2pm)
Participants such as G and H relate their knowledge building experience with continuous improvement.
Participant G shared that her experience is like “Climb the staircase. Improve myself one by one and
increase my knowledge” (Focus group interview on 21st July 2016 at 1pm). Another participant, H also
had the same experience and used „Kaizen‟ to describe it. “When I work with the team members, (we)
make mistakes and improve on it … know and learn something new from the interview, marketing
strategy, how to attract customers, the knowledge could be used in the future if I want to operate a
business” (Individual interview on 19th July 2016 at 12 noon). This finding is consistent with the
analysis of collaborative learning that revealed patterns of repetition and reconstruction of ideas in
groups that foster the circulation, improvement and acceptance of knowledge (Elbers and Streefland,
2000).
It is important to note that two participants expressed their knowledge building experience as „scared‟
and one participant expressed „worried‟ for her experience. Four participants even mentioned that their
knowledge building experience is „stress.‟ Their experiences were caused by unclear expectations of the
group assignment, overwhelmed with the workload allocated, limited assistance and guidance by
senior, and team members who were not proactive in completing allocated tasks.

Proceeding of the 3rd International Conference on Education, Vol. 3, 2017, pp. 29 - 37
33
“As a leader, you have to do the research and tell them [team members] what to do. Everyone
will come after me. My senior is not helping at all. Keep asking questions." (Participant N, focus
group interview on 21st July 2016 at 1pm)
Due to their unpleasant experience in knowledge building, they wish that their team members could
have been more responsible in their work and there should have been better coordination in work
allocated.
“Because the team members seem like (they are) doing their own work … I don‟t know how to
describe the situation.” (Participant W, focus group interview on 18th July 2016 at 11am)
Throughout this group work and knowledge building experience, students revealed that they were able
to identify economic concepts and relate these concepts to economic events. Table 1 (below) presents
the excerpts from interview responses that are related to economic events. Participants derived
economic concepts such as demand and supply for goods and service, the impact of implementation of
Goods and Services Tax (GST) in Malaysia, market opportunities and real world events. This shows
that students were able to demonstrate their ability in making these economic concepts relevant and
meaningful by connecting them to real world events when completing this group assignment,
particularly for those participants who have positive group work and knowledge building experience.
Table 1 Excerpts from interview responses that are related to economic events
Economic concepts and excerpts
from interview responses
Participant‟s group work
experience
Participant‟s knowledge building
experience
Demand and supply for goods
and service
When the university is “having
[sic]” semester break, the café
“nearby [sic]” the off-campus
hostel didn't prepare so much
dishes due to a low demand.
(Participant S, focus group interview on 18th July 2016 at
3pm)
Positive
“We divide the tasks.”
Positive
“Amazing”
The demand and supply
for “Thai sauce” [a
savory sauce] chicken
rice. The cafeteria runs
out of this ingredient in
preparing this cuisine.
(Participant J, individual
interview on 20th July 2016 at
1pm)
Positive
“I like the members to work
together.”
Positive
“Understanding”

Heng Kiat Sing, Philip Nuli Anding and Tan Kock Wah / Student’s Perception of Group Work and Knowledge Building
in an Economics Unit
34
The demand for bubble milk tea
“at [sic]”this town was affected
by food poisoning incidents that
happened in Taiwan because one
of the main ingredients in
preparing the drink is tapioca
pearls.
(Participant K, focus group
interview on 20th July 2016 at
4pm)
Positive
“The interview was
interesting.”
Positive
“Challenging”
Implementation of Goods and
Services Tax (GST)
Since the implementation of GST
in Malaysia, “the price of dishes
also increases [sic]”. To remain
competitive in the market, the
owner of the restaurant compares
the price of his dishes with other restaurants.
(Participant C, focus group
interview on 21st July 2016 at
1pm)
Positive
“Can increase knowledge.”
Positive
“Relax”
Just like the “presence [sic]” of
GST … the smoothie and juice
bar’s owner said that normally their sales are good but after the
“presence [sic]” of GST, there is
“slightly [sic]” change in demand
… so less kids purchase the
drink…
(Participant K, focus group
interview on 20th July 2016 at
4pm)
Positive
“The interview was
interesting.”
Positive
“Challenging”
Market opportunities
The hardware business “is
operating [sic]” in an open
market. The owner of the hardware shop also involves in
construction industry to diversify
his business.
(Participant P, focus group
interview on 21st July 2016 at
1pm)
Positive
“Can go for the
interview.”
Negative
“Scared”
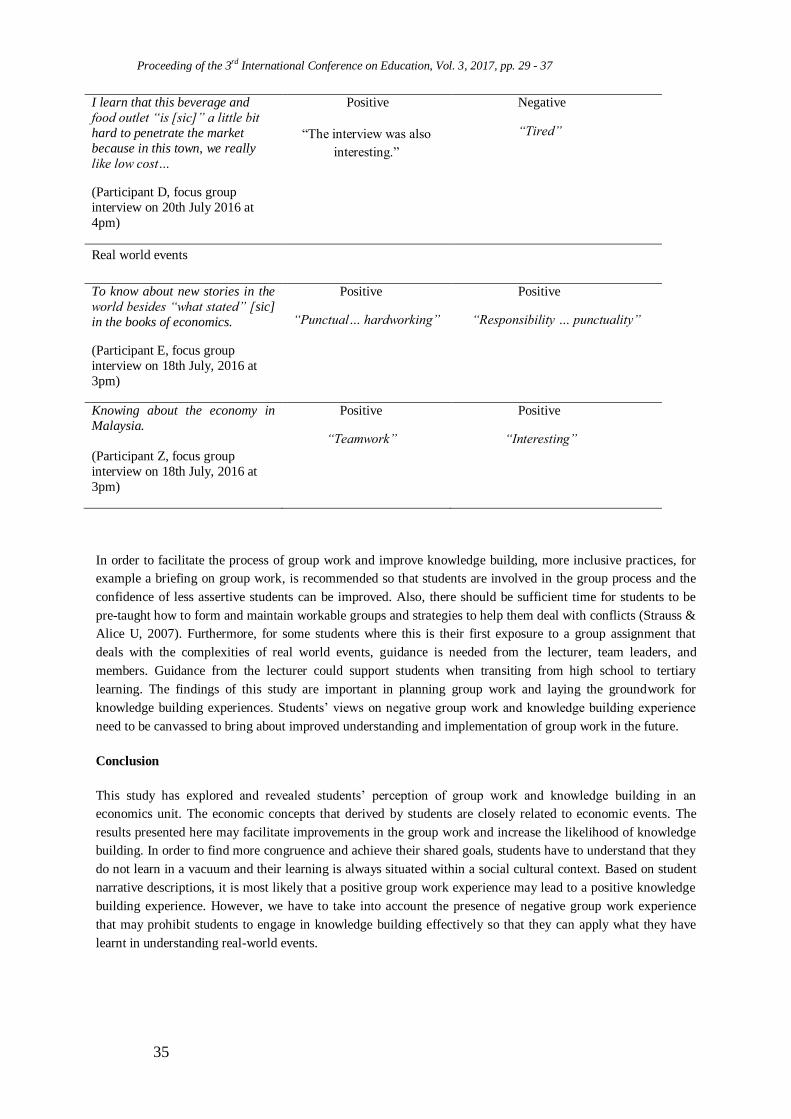
Proceeding of the 3rd International Conference on Education, Vol. 3, 2017, pp. 29 - 37
35
I learn that this beverage and
food outlet “is [sic]” a little bit
hard to penetrate the market
because in this town, we really
like low cost…
(Participant D, focus group
interview on 20th July 2016 at
4pm)
Positive
“The interview was also
interesting.”
Negative
“Tired”
Real world events
To know about new stories in the
world besides “what stated” [sic]
in the books of economics.
(Participant E, focus group
interview on 18th July, 2016 at
3pm)
Positive
“Punctual… hardworking”
Positive
“Responsibility … punctuality”
Knowing about the economy in
Malaysia.
(Participant Z, focus group
interview on 18th July, 2016 at
3pm)
Positive
“Teamwork”
Positive
“Interesting”
In order to facilitate the process of group work and improve knowledge building, more inclusive practices, for
example a briefing on group work, is recommended so that students are involved in the group process and the
confidence of less assertive students can be improved. Also, there should be sufficient time for students to be
pre-taught how to form and maintain workable groups and strategies to help them deal with conflicts (Strauss &
Alice U, 2007). Furthermore, for some students where this is their first exposure to a group assignment that
deals with the complexities of real world events, guidance is needed from the lecturer, team leaders, and
members. Guidance from the lecturer could support students when transiting from high school to tertiary
learning. The findings of this study are important in planning group work and laying the groundwork for
knowledge building experiences. Students‟ views on negative group work and knowledge building experience
need to be canvassed to bring about improved understanding and implementation of group work in the future.
Conclusion
This study has explored and revealed students‟ perception of group work and knowledge building in an
economics unit. The economic concepts that derived by students are closely related to economic events. The
results presented here may facilitate improvements in the group work and increase the likelihood of knowledge
building. In order to find more congruence and achieve their shared goals, students have to understand that they
do not learn in a vacuum and their learning is always situated within a social cultural context. Based on student
narrative descriptions, it is most likely that a positive group work experience may lead to a positive knowledge
building experience. However, we have to take into account the presence of negative group work experience
that may prohibit students to engage in knowledge building effectively so that they can apply what they have
learnt in understanding real-world events.
Heng Kiat Sing, Philip Nuli Anding and Tan Kock Wah / Student’s Perception of Group Work and Knowledge Building in an
Economics Unit
36
Acknowledgements
We would like to thank the students who volunteered to participate in this study. We also wish to thank the
Dean, course coordinator and lecturer for the course of Foundation of Arts in the private university in Sarawak
for their collaboration in conducting this study.
References
Arvaja, M., 2005, Collaborative knowledge construction in authentic school contexts. Jyväskylä: Institute for
Educational Research, University of Jyväskylä.
Arvaja, M., Salovaara, H., Ha¨kkinen, P., and Sanna, J., 2007, Combining individual and group-level
perspectives for studying collaborative knowledge construction in context. Learning and Instruction, 17, 448-
459.
Biggs, J., 1996, Enhancing teaching through constructive alignment. Higher Education, 32, 347-364.
Brownlee, J. M., Walker, S., Lennox, S. P., Exley, B. E., and Pearce, S. M., 2009, The first year university
experience: Using personal epistemology to understand effective learning and teaching in higher education.
Higher Education, 58(5), 599-618.
Bruffee, K. A., 1995, Sharing our toys: Cooperative learning versus collaborative learning.
Change(January/February), 12-18.
Elbers, E., and Streefland, L., 2000, Collaborative learning and the construction of common knowledge.
European Journal of Psychology of Education, XV(4), 479-490.
Forsythe, F., 2010, Problem-based learning. Retrieved June 8, 2014, from
http://www.economicsnetwork.ac.uk/handbook/printable/pbl2.pdf
Fraser, S., and Deane, E., 1997, Why open learning? Australian Universities' Review, 1, 25-31.
Goodman, R. J., 2010, Problem-based learning: merging of economics and mathematics. Journal of Economics
and Finance, 34, 477-483.
Guest, R., 2012, The case for integrating accounting, finance, and economics in teaching the GFC through a
problem-based learning approach. Journal of Business Ethics Education, 9, 11-24.
Hmelo-Silver, C. E., 2004, Problem-based learning: What and how do students learn? Educational Psychology
Review, 16(3), 235-266.
Hmelo-Silver, C. E., and Barrows, H. S., 2008, Facilitating collaborative knowledge building. Cognition and
Instruction, 26, 48-94.
Islam, S., 2011., Teaching introductory economics to students of different majors. Proceedings of American
Society of Business and Behavioural Science, 18(1), pp. 877-885. Retrieved June 17, 2014, from
http://asbbs.org/files/2011/ASBBS2011v1/PDF/I/IslamS.pdf.
Proceeding of the 3rd International Conference on Education, Vol. 3, 2017, pp. 29 - 37
37
Jang, S‐J., 2007, A study of students' construction of science knowledge: Talk and writing in a collaborative
group. Educational Research, 49 (1), 65‐81.
Johnson, D. W., and Johnson, R. T., 1999, Learning together and alone: Cooperative, competitive and
individualistic learning (5th ed.). Massachusetts: Allyn and Bacon.
Khoo, Y. Y., and Abdul, G. K. A., 2013, Learning in group: The effectiveness of collaborative problem solving
on pre-university students. Human and Social Science Research, 1(2), 105-111.
King, S., Greidanus, E., Carbonaro, M., Drummond, J., Boechler, P., and Kahlke, R., 2010, Synchronous
problem-based e-learning (ePBL) in interprofessional health science education. Journal of Interactive Online
Learning, 9(2), 133-150.
Patton, M. Q., 2002, Qualitative research and evaluation methods (3rd ed.). Thousand Oaks, CA: Sage
Publications.
Reimann, N., 2004, First‐year teaching‐learning environments in economics. International Review of
Economics Education, 3(1), 9‐38.
Sambell, K., and McDowell, L., 1998, The construction of the hidden curriculum: Messages and meanings in
the assessment of student learning. Assessment and Evaluation in Higher Education, 23 (4), 391‐402.
Scardamalia, M., and Bereiter, C., 2003, Knowledge building. In J. W. Guthrie, Encyclopedia of education (2nd
ed., pp. 1370–1373). New York, NY: Macmillan.
Steinemann, A., 2003, Implementing sustainable development through problem-based learning: Pedagogy and
practice. Journal of Professional Issues in Engineering Education and Practice, October, 216-224.
Strauss, P., and Alice U., 2007, Group assessments: Dilemmas facing lecturers in multicultural tertiary
classrooms. Higher Education Research & Development, 26(2), 147-161.
Tang, T., 2003, Understanding students' misunderstanding in economics. Economic Analysis & Policy, 33(1),
157-171.
Tang, T., and Robinson, T., 2004, The effects of introductory economics course on students' beliefs and
aptitudes in economics. Australasian Journal of Economics Education, 1(2), 199-222.
Walstad, W. B., 2001, Improving assessment in university economics. Journal of Economic Education,
Summer, 281-294.
Watson, W. E., Kumar, K., and Michaelsen, L. K., 1993, Cultural diversity's impact on interaction process and
performance: Comparing homogenous and diverse task groups. Academy of Management Journal, 36(3), 590-
602.
Yew, E. H., Chng, E., and Schmidt, H. G., 2011, Is learning in problem-based learning cumulative? Advances in
Health Sciences Education, 16, 449-464.
Zlatkin-Troitschanskaia, O., Schmidt, S., Brückner, S., Förster, M., Yamaoka, M., and Asano, T., 2016,
Macroeconomic knowledge of higher education students in Germany and Japan – a multilevel analysis of
contextual and personal effects. Assessment & Evaluation in Higher Education, 41(5), 787-801.
Proceeding of the 3rd International Conference on Education, Vol. 3, 2017, pp. 38-48 Copyright © 2017 TIIKM ISSN 2424 - 6700 online DOI: https://doi.org/10.17501/icedu.2017.3105
3rd International Conference on Education, 20-22 April 2017, Kuala Lumpur, Malaysia
THE 21ST
CENTURY MILIEU: LEARNING PREFERENCES
OFMSU-TCTO SOPHOMORE STUDENTS
Fernigil L. Colicol
College of Education, Mindanao State University-Tawi-Tawi College of Technology and Oceanography, Philippines
Abstract: The shift from teacher-centered to student-centered approach in the new milieu calls for teachers to adapt to the learners’ learning preferences. This study determined the levels of learning preferences of MSU-TCTO College of Education sophomore students along the different approaches
and strategies in teaching, namely: Direct Instruction, Discussion, Indirect Instruction and Emerging Models of Teaching (EMT). It further determined if there were significant differencesin the students’ learning preferences between and amongthe variables tested. A descriptive research design was used. After a semester of exposure to the different teaching strategies and class activities, the 114 Educ. 121N (Social Dimensions of Education) sophomore students, 1st semester, AY 2016-2017, were given a teacher’s survey questionnaire. Findings revealedthat majority of the students “most preferred” the four teaching approaches, however, the EMThad thehighest mean and the direct instruction had the least. Students preferred most the feeding program,clothes-giving and parlor games activities – a community immersion, the cultural dance presentation and the role play activity
of the EMT approach.Listening to a classmate’s report and to a teacher’s lecture under the direct instruction had the least overall mean. Among the four approaches, ANOVA showed a no significant difference in the students’ learning preferences. However, there was a significant difference in their levels of learning preferencesbetween direct and discussion, direct and indirect, and direct and EMT. In conclusion, the college students preferred collaborative, performance-based and hands-on learning.
Keywords:Sophomore, Milieu, Learning, Preference, Approach, Strategy
Introduction
Teachers’ teaching strategies are vital in imparting knowledge, skills and values among learners. A strategy and
class activity provides a learning experience from which the learners canacquire insights and understanding of facts,
concepts and principles that they can use and apply in a variety of situations in life.
The new milieu is characterized by a shift from teacher-centredto learner-centred approach (Vega V. et al. 2009).In
the traditional classroom, the teacher dominates all class activities, while students sit and listen; now the real world
demands that students must go beyond rote and factual level of understanding. They must think critically and
creatively to solve complex problems in a variety of situations in life (Bruer 1993). When a teacher employs
methods as simulations, discovery, problem solving and cooperative learning, different from lower-level rote
learning like simple recall of information, this emphasizes a shift in the learning experience from teacher centered to
student-centred approach.
According to Vega et al. (2009), the shift from the traditional to the present-day classroom is as follows:
For the student: from passively waiting for the teacher to give directions and information to actively searching for needed information and learning experiences, determining what is needed, and seeking ways to attain it; from
always being in the role of the learner to participating at times as the expert/knowledge provider; from always
following given procedures to desiring to explore , discover, and create unique solutions to learning problems; from
viewing the teacher as the one who has all of the answers to viewing the teacher as a resource, model, and helper
who will encourage exploration and attempts to find unique solutions to problems. On the other hand, for the
teacher, the shift is: from always being viewed as the content expert and source for all the answers to participating at
times as one who may not know it all but desires to learn; from being viewed as the primary source of information
who continually directs it to students to being viewed as a support, collaborator, and coach for students as they learn
to gather and evaluate information for themselves; from always asking the questions and controlling the focus of
student learning to actively coaching students to develop and pose their own questions and explore their own
Corresponding Author: Fernigil L. Colicol/[email protected]

Fernigil L. Colicol/The 21st Century Milieu: Learning Preferences Of Msu-Tcto Sophomore Students
39
alternative ways of finding answers; and from directing students through preset step-by-step exercises so that all
achieve similar conclusions to actively encouraging individuals to use their personal knowledge and skills to create
unique solutions to problems.
(Social Dimensions of Education Revised Edition Copyright, 2009 p. 154)
Broño and Palmiery (2006) in their professional education refresher course book with area of focus on the General
Principles and Methods of Teachingcategorized teaching approaches as direct, discussion, indirect and emerging
models of teaching (EMT), arranged in the order from teacher-centred to student-centred approaches. Direct is a
student-centred approach, also known as expository approach. The indirect approach on the other hand is a student-
centred approach, also called an exploratory approach. Discussion is considered a bridge between the direct and
indirect approach characterized by teacher-student and student-student exchanges. The emerging models of teaching
(EMT) is a student-centered approach and constructivist characterized by a highly collaborative, performance-based
and experience-centered teaching.
Learners as the heart of the school system are given utmost priority. Their preferences, needs and interests are
accounted for in any learning endeavour. In fact, according to Lardizabal (1996), learners are the first to consider
when choosing a method. Their characteristics and nature – age, maturity, grade level, abilities, interests, growth, health, problems, etc. should be considered for learning to take effect.
The Outcomes-Based Education which has been prescribed to all academic institutionsand the implementation of
the K-12 Curriculum for basic education, these are salient features of the 21st milieu that requires for teachers to
keep abreast with the latest developments in education. A GRASPS Model by Wiggins and McTighe (2008), an
acronym that begins with Real-World with the letter G for Goal, R for Role, A for Audience, S for Situation, P for
Product and S for Standard, is one effective model for setting a real-world task for students.
The researcher intended to find out the effectiveness of teaching approaches applied and the learning preferences of
students on this particular context at this particular period of time.
The study aimed to determine the levels of learning preferences of MSU-TCTO College of Education sophomore
students along the different approaches and strategies in teaching.
Specifically, it tried to answer the following queries:
1. What are the levels of learning preferences of MSU-TCTO College of Education students along the
different teaching strategies and class activities:
1.1 written homework;
1.2 issue poll;
1.3 reflection activity;
1.4 lecture;
1.5 class discussion;
1.6 drama;
1.7 message relay activity;
1.8 individual reporting;
1.9 listening to a classmate’s report;
1.10 film viewing;
1.11 role play;
1.12 group review;
1.13 self-review;
1.14 news reporting;
1.15 group practice
1.16 feeding program, giving of clothing and parlor games;
1.17 props and corner preparation;
Proceeding of the 3rd International Conference on Education, Vol. 3, 2017, pp. 38 - 48
40
1.18 cultural dance presentation;
1.19 journal writing; and
1.20 major examinations?
2. What are the levels of learning preferences of MSU-TCTO College of Education sophomore students
along the different approaches in teaching in terms of the following variables:
2.1 direct instruction;
2.2 discussion;
2.3 indirect instruction; and
2.4 emerging models of teaching?
3. Is there a significant difference in the learning preferences of the MSU-TCTO College of Education
sophomore students along theteaching approaches direct, discussion, indirect and emerging models of
teaching?
4. Is there a significant difference in the learning preferences of the MSU-TCTO College of Education
sophomore students along the following variables:
4.1 direct instruction vs. discussion;
4.2 direct instruction vs. Indirect instruction;
4.3 direct instruction vs. emerging models of teaching;
4.4 discussion vs. indirect instruction;
4.5 discussion vs. emerging models of teaching; and
4.6 indirect instruction vs. emerging models of teaching?
Null Hypothesis
There is no significant difference in the learning preferences of the MSU-TCTO College of Education sophomore
students along the four approaches, direct, discussion, indirect and emerging models of teaching (EMT).
There is no significant difference in the learning preferences of the MSU-TCTO College of Education sophomore
students along direct instruction vs. discussion, direct instruction vs. indirect instruction, direct instruction vs.
emerging models of teaching, discussion vs. indirect instruction, discussion vs. emerging models of teaching and
indirect instruction vs. emerging models of teaching.
Significance of the Study
The findings of this study would contribute to education development;improve its deliveryfrom the national to the
local levels. This would provide a feedback as regards the effectiveness of teachers’ teaching approaches and
strategies as perceived by the learners – the primary recipients of instruction. It would also determine the trend of
students learning preferences at this particular period of time.
To the school administrators, this study would serve as a guide in decision-making and policy formulationin order to
cope with the learners’ needs and interests. It would serve as an assessment guide in identifying appropriate and
relevant programs to support in order to improve the teaching-learning processes.
To the professors and teachers, this assessment gave a relevant feedback on the effectiveness of teaching approaches
and strategies employed in the classroom. It provided for the direction of the class program according to the learning
preferences of learners considering their learning styles, motivation, needs and interests.
To the students,this providedinclusive and holistic development as they were given subsequent attention in class
activities.
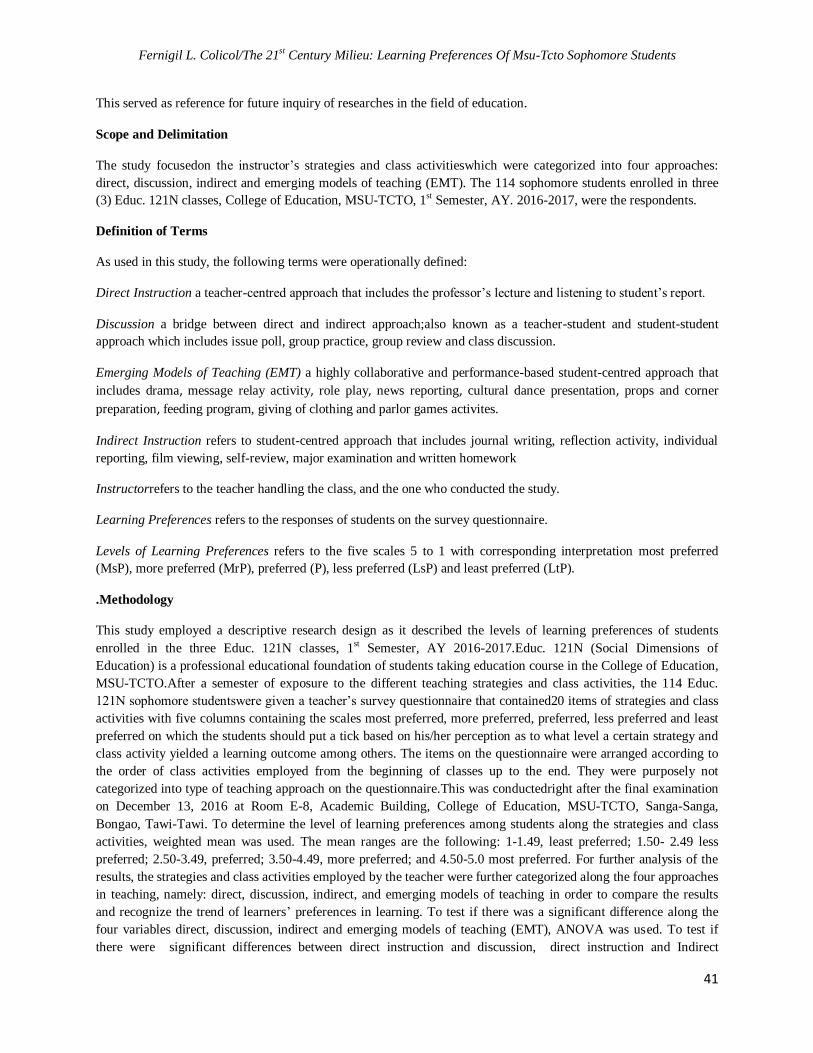
Fernigil L. Colicol/The 21st Century Milieu: Learning Preferences Of Msu-Tcto Sophomore Students
41
This served as reference for future inquiry of researches in the field of education.
Scope and Delimitation
The study focusedon the instructor’s strategies and class activitieswhich were categorized into four approaches:
direct, discussion, indirect and emerging models of teaching (EMT). The 114 sophomore students enrolled in three
(3) Educ. 121N classes, College of Education, MSU-TCTO, 1st Semester, AY. 2016-2017, were the respondents.
Definition of Terms
As used in this study, the following terms were operationally defined:
Direct Instruction a teacher-centred approach that includes the professor’s lecture and listening to student’s report.
Discussion a bridge between direct and indirect approach;also known as a teacher-student and student-student
approach which includes issue poll, group practice, group review and class discussion.
Emerging Models of Teaching (EMT) a highly collaborative and performance-based student-centred approach that
includes drama, message relay activity, role play, news reporting, cultural dance presentation, props and corner
preparation, feeding program, giving of clothing and parlor games activites.
Indirect Instruction refers to student-centred approach that includes journal writing, reflection activity, individual
reporting, film viewing, self-review, major examination and written homework
Instructorrefers to the teacher handling the class, and the one who conducted the study.
Learning Preferences refers to the responses of students on the survey questionnaire.
Levels of Learning Preferences refers to the five scales 5 to 1 with corresponding interpretation most preferred
(MsP), more preferred (MrP), preferred (P), less preferred (LsP) and least preferred (LtP).
.Methodology
This study employed a descriptive research design as it described the levels of learning preferences of students
enrolled in the three Educ. 121N classes, 1st Semester, AY 2016-2017.Educ. 121N (Social Dimensions of
Education) is a professional educational foundation of students taking education course in the College of Education,
MSU-TCTO.After a semester of exposure to the different teaching strategies and class activities, the 114 Educ.
121N sophomore studentswere given a teacher’s survey questionnaire that contained20 items of strategies and class
activities with five columns containing the scales most preferred, more preferred, preferred, less preferred and least
preferred on which the students should put a tick based on his/her perception as to what level a certain strategy and
class activity yielded a learning outcome among others. The items on the questionnaire were arranged according to
the order of class activities employed from the beginning of classes up to the end. They were purposely not
categorized into type of teaching approach on the questionnaire.This was conductedright after the final examination
on December 13, 2016 at Room E-8, Academic Building, College of Education, MSU-TCTO, Sanga-Sanga,
Bongao, Tawi-Tawi. To determine the level of learning preferences among students along the strategies and class
activities, weighted mean was used. The mean ranges are the following: 1-1.49, least preferred; 1.50- 2.49 less
preferred; 2.50-3.49, preferred; 3.50-4.49, more preferred; and 4.50-5.0 most preferred. For further analysis of the
results, the strategies and class activities employed by the teacher were further categorized along the four approaches
in teaching, namely: direct, discussion, indirect, and emerging models of teaching in order to compare the results
and recognize the trend of learners’ preferences in learning. To test if there was a significant difference along the
four variables direct, discussion, indirect and emerging models of teaching (EMT), ANOVA was used. To test if
there were significant differences between direct instruction and discussion, direct instruction and Indirect

Proceeding of the 3rd International Conference on Education, Vol. 3, 2017, pp. 38 - 48
42
instruction, direct instruction and emerging models of teaching, discussion and indirect instruction, discussion and
emerging models of teaching and indirect instruction and emerging models of teaching, T-test was used. SPSS was
used in the analysis and treatment of the data.
Findings and Discussion
Table 1.Weighted Mean of Levels of Learning Preferencesof MSU-TCTO Sophomore Students along the Strategies
and Class Activities
Strategies and Class Activities Weighted Mean Interpretation
Written Homework 4.19 MrP
Issue poll 4.15 MrP
Reflection 4.71 MsP
Lecture 4.34 MrP
Class Discussion 4.68 MsP
Drama 4.51 MsP
Message Relay 4.49 MrP
Individual Reporting 4.40 MrP
Listening to a classmate’s report 4.31 MrP
Film Viewing 4.72 MsP
Role Play 4.55 MsP
Group review 4.60 MsP
Self Review 4.35 MrP
News Reporting 4.50 MsP
Group Practice 4.60 MsP
Feeding, Giving of Clothing & Parlor Games 4.72 MsP
Props and Corner Preparation 4.54 MsP
Cultural Dance Presentation 4.59 MsP
Journal Writing 4.48 MrP
Major Examinations 4.61 MsP
Overall 4.51 MsP
Legend: MsP- Most Preferred (5), MrP- More Preferred (4), P-Preferred (3), LsP-Less Preferred (2), LtP-Least
Preferred (1)
Table 1 shows the weighted means of learning preferences of students along the strategies and class activities in Ed
121N classes. The strategies and class activities are discussed according to the order of weighted means with their
corresponding levels of interpretations in descending order. Findings revealed that the feeding, giving of clothing, and parlor games and film viewing activities had the highest mean both 4.72, followed by the reflection activity,
class discussion, major examinations, group review, group practice cultural dance presentation, Role play, props
and corner preparation, drama and news reporting with corresponding weighted means of 4.71 4.68 4.61 4.60, 4.60,
4.59 4.55, 4.54, 4.51 and 4.50, respectively all with “most preferred” corresponding levels of interpretation.Message
relay, journal writing, individual reporting, self-review, lecture, listening to a classmates report, written homework
and issue poll with weighted mean values of 4.49, 4.48, 4.40, 4.35, 4.34, 4.31, 4.19 and 4.15, respectively with
“more preferred” corresponding levels of interpretation. The overall weighted mean is 4.51 with “most preferred”
corresponding level of interpretation.
Table 2. Weighted Means of Learning Preferences of MSU-TCTO Sophomore Students along theStrategies and
Class Activities categorized according to Teaching Approaches

Fernigil L. Colicol/The 21st Century Milieu: Learning Preferences Of Msu-Tcto Sophomore Students
43
Teaching Approach Teaching Strategy/Class Activity Weighted Mean Interpretation
Direct Listening to a classmate’s report 4.31 MrP
Lecture 4.34 MrP
Overall 4.33 MrP
Discussion
Issue Poll 4.15 MrP
Group Review 4.60 MsP
Group Practice 4.65 MsP
Class Discussion 4.68 MsP
Overall 4.52 MsP
Indirect Written Homework 4.19 MrP
Self Review 4.35 MrP
Individual Reporting 4.41 MrP
Journal Writing 4.49 MrP
Major Examinations 4.62 MsP
Reflection 4.71 MsP
Film Viewing 4.72 MsP
Overall 4.50 MsP
Emerging Models of
Teaching
Message Relay 4.49 MrP
News Reporting 4.50 MsP
Drama 4.51 MsP
Role Play 4.55 MsP
Props & Corner Preparation 4.55 MsP
Cultural Dance Presentation 4.59 MsP
Feeding, Giving of Clothing & Parlor
Games
4.72 MsP
Overall 4.56 MsP
Legend: MsP- Most Preferred (5), MrP- More Preferred (4), P-Preferred (3), LsP-Less Preferred (2), LtP-Least
Preferred (1)
Table 2 shows the weighted means of learning preferences of MSU-TCTO Sophomore students along strategies and
class activities categorized according to each type of teaching approaches in ascending order. Listening to a
classmate’s report and giving of a lecture by a teacher under direct instruction have mean values of 4.31 and 4.34,
respectively. The overall weighted mean is 4.33 with “more preferred” corresponding level of interpretation.
Categorized under the discussion approach are issue poll, group review, group practice and class discussion with
corresponding mean values of 4.15, 4.60, 4.65 and 4.68, respectively. The overall weighted mean is 4.52 with “most
preferred” corresponding level of interpretation. Indirect approach that includes written homework, self-review,
individual reporting, journal writing, major examinations, reflection and film viewing with corresponding mean
values of 4.19, 4.35, 4.41, 4.49, 4.62, 4.71, and 4.72, respectively has 4.50 overall weighted mean with “most
preferred” corresponding level of interpretation. Activities belong to the Emerging Models of Teaching (EMT) are
message relay, news reporting, drama, role play, props and corner preparation, cultural dance presentation and
feeding, giving of clothing and parlor games activities with corresponding mean values of 4.49, 4.50, 4.51, 4.55,
4.55, 4.59 and 4.72, respectively. The overall weighted mean is 4.56 with “most preferred” corresponding level of
interpretation.
Among the four approaches, the emerging models of teaching (EMT) has the highest mean of 4.56 followed by the
discussion approach with 4.52, indirect approach with 4.50, and the direct instruction with a mean of 4.33 has the
least overall mean. This implies that the sophomore students likely preferred student-centred approaches to
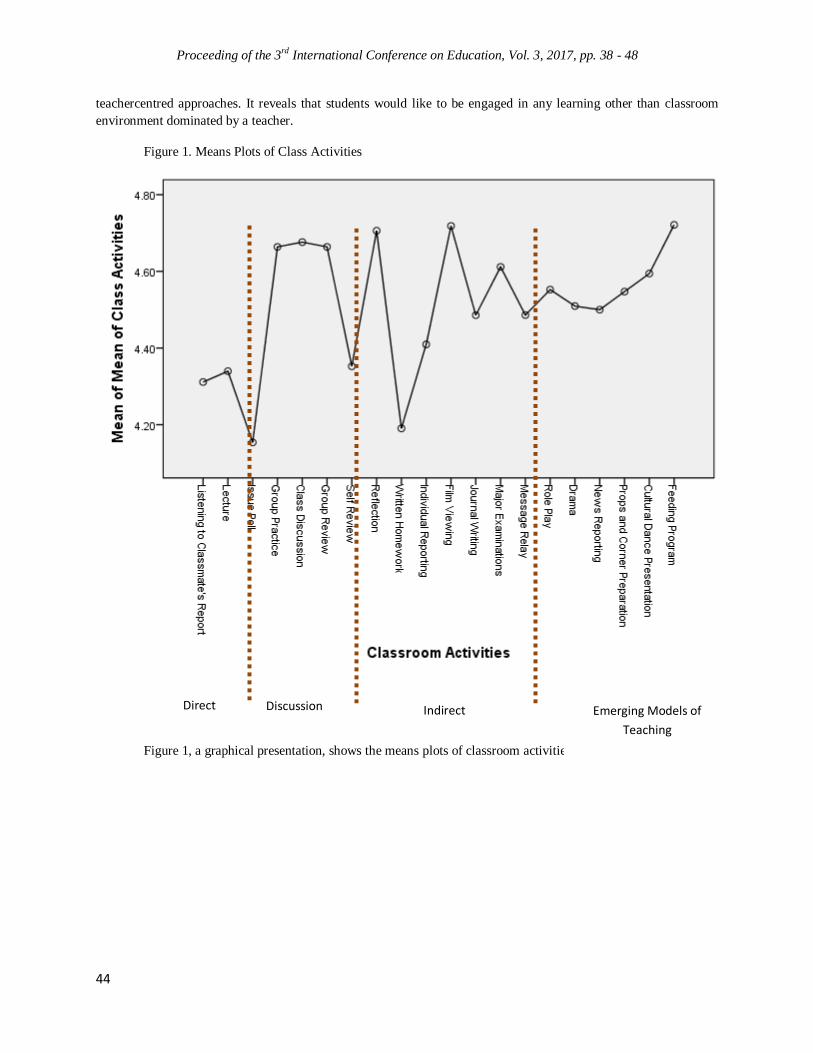
Proceeding of the 3rd International Conference on Education, Vol. 3, 2017, pp. 38 - 48
44
teachercentred approaches. It reveals that students would like to be engaged in any learning other than classroom
environment dominated by a teacher.
Figure 1. Means Plots of Class Activities
Figure 1, a graphical presentation, shows the means plots of classroom activities.
Direct Discussion Indirect Emerging Models of
Teaching
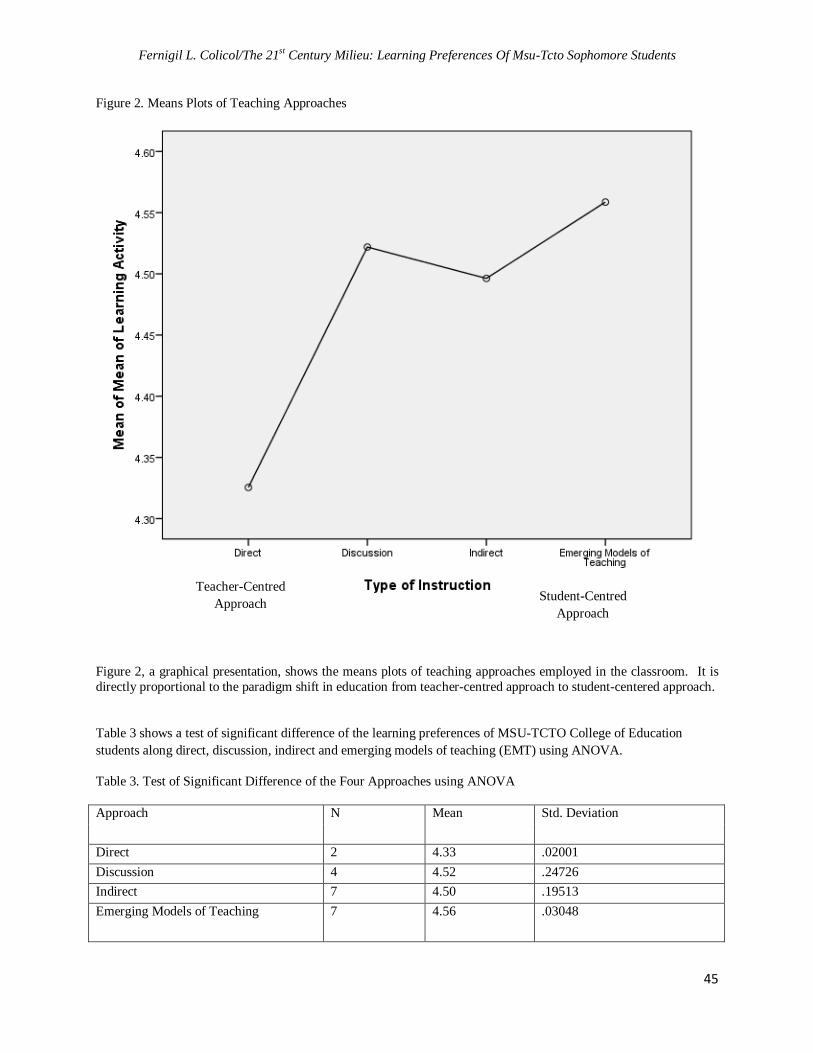
Fernigil L. Colicol/The 21st Century Milieu: Learning Preferences Of Msu-Tcto Sophomore Students
45
Figure 2. Means Plots of Teaching Approaches
Figure 2, a graphical presentation, shows the means plots of teaching approaches employed in the classroom. It is
directly proportional to the paradigm shift in education from teacher-centred approach to student-centered approach.
Table 3 shows a test of significant difference of the learning preferences of MSU-TCTO College of Education
students along direct, discussion, indirect and emerging models of teaching (EMT) using ANOVA.
Table 3. Test of Significant Difference of the Four Approaches using ANOVA
Approach N Mean Std. Deviation
Direct 2 4.33 .02001
Discussion 4 4.52 .24726
Indirect 7 4.50 .19513
Emerging Models of Teaching 7 4.56 .03048
Teacher-Centred
Approach
Student-Centred
Approach

Proceeding of the 3rd International Conference on Education, Vol. 3, 2017, pp. 38 - 48
46
Total 20 4.51 .16820
df F Sig Remarks
Between Groups 3 .029 .410 Not Significant
Within Groups 16 .028
Total 19
As shown in Table 3 ANOVA reveals thatthere is no significant difference in the learning preferences of the
sophomore students along the four approaches direct, discussion, indirect and emerging models of teaching (EMT)
with mean values of 4.33, 4.52, 4.50 and 4.56 and corresponding standard deviations of 0.02, 0.25, 0.20 and 0.03,
respectively. An F-value of 0.029 between groups and 0.028 within groups and a p-value of 0.410 shows a no
significant difference at a 0.05 level of significance.
This shows that the learning preferences of students along the four approaches with the activities listening to
teacher’s lecture and to a classmate’s report,issue poll, group practice, class discussion, group review, self review,
reflection, written homework, individual reporting, film viewing, journal writing, major examinations, message
relay, role play, drama, news reporting, props and corner preparation, cultural dance presentation, and feeding
program, did not significantly differ. So the four approaches are allrelevant in teaching considering that teacher may
use one, two or more approaches in teaching a certain lesson. Teachers may use student-centered or teacher-centered
or a combination of both approaches to teach a particular lesson to ensure learning. Therefore the null hypothesis
that states “there is no significant difference in the learning preferences of MSU-TCTO sophomore students along
the variables tested” is accepted.
Table 4 shows a test of significant difference in learning preferences of MSU-TCTO sophomore students between
two approaches using T-test.
Table 4.Test of Significant Difference between Two Approaches using T-test
Group Category Mean Mean
Difference
t-value Sig. (2-tailed) Remarks
Direct vs.
Discussion
4.3318 -0.1908 -2.435 .016 Significant
4.5226
Direct vs.
Indirect
4.3318 -0.1585 -2.006 .046 Significant
4.4903
Direct vs.
EMT
4.3318 -0.2295 -2.836 .005 Highly Significant
4.5613
Discussion vs.
Indirect
4.5226 0.0323 .493 .623 Not Significant
4.4903
Discussion vs. EMT
4.5226 -0.0387 -.572 .568 Not Significant
4.5613
Indirect vs.
EMT
4.4903 -0.071 -1.036 .301 Not Significant
4.5613
Table 4on the test of significance of mean differences shows that on the learning preferences between direct and
discussion, the mean difference is significant with a t-value of -2.435 and p-value of 0.16. Between direct and

Fernigil L. Colicol/The 21st Century Milieu: Learning Preferences Of Msu-Tcto Sophomore Students
47
discussion, hearing a lecture of a teacher and listening to a classmate’s report of the direct instruction are less
preferred to issue poll, group review, group practice and class discussion of the discussion approach in learning.
This means that direct instruction being a teacher controlled approach yielded a lesser learning outcome to
discussion that is highly democratic; characterized by teacher-student and student-student exchanges.Between direct
and indirect, Table 4 shows a significant mean difference with a t-value of -2.006 and p-value of .046. Students
preferred indirect instruction, a student-centered approach to direct instruction, a teacher-centered approach.
Activities under indirect instruction like self review, reflection, written homework, individual reporting, film
viewing, journal writing, and major examinations generally preferred by the students to a teacher’s lecture and
student’s report of the direct instruction. This means that students would like to be engaged in a learning activity
where they have the opportunity to explore, discover and experience by themselves to promote independent learning
than to become passive by just listening. Between direct and EMT, the mean difference is highly significant with a t-
value of -2.836 and p-value of 0.005. Generally, students most preferred performance-based activities like message
relay, role play, drama, news reporting, props and corner preparation, cultural dance presentation, and feeding
program categorized under the EMT approach. This means that students’ preference indeed shiftedtowards a highly
collaborative, performance-based and hands-on learning from a highly teacher-controlled approach.Students
inclined to a real-world task.They carried out a taskwhen engaged in a meaningful learning activity. Thus, the null
hypothesis that states “there is no significant difference in the learning preferences of MSU-TCTO sophomore
students between direct and discussion, direct and indirect, and direct and EMT” is rejected.
On the other hand, Table 4 shows that on the learning preferences between discussionand indirect, the mean
difference is not significant with a t-value of 0.493 and p-value of 0.623. Since a discussion always involved
students in learning activities, they did not perceive it differently from indirect approach, a student centered
approach, in learning. Thus, students’ learning preferences on discussiondo not differ from indirect approach.
Between discussion and EMT, the mean difference shows not significant with a t-value of -0.572 and p-value of
0.568. Although students preferred most the EMT approach among the four approaches, students would still rely
with the guidance of the teacher in learning. Thus, teacher’s presence inside the classroom as a facilitator is still very
important. This means that students’ preferences along the two approaches do not significantly differ. Between
indirect and EMT, Table 4 shows a high mean difference with t-value of -1.036 and p-value of 0.301. Although the
EMT was much more preferred to indirect approach in learning, there was no significant difference in their
preferences along these two student-centred approaches. Thus, the null hypothesis that states “there is no significant
difference in the learning preferences of MSU-TCTO sophomore students between discussion and indirect,
discussion and EMT, and indirect and EMT” was accepted.
Conclusion
It is concluded that the MSU-TCTO College of Education sophomore students preferred student-centred approaches
to teacher-centered ones. They most preferred the activities classified under the emerging models of teaching which
are highly collaborative, performance-based and experience-centered that promote self-discovery and independent
learning.
References
Aquino, Gaudencia. Effective Teaching 3rd edition. Mandaluyong City: National Bookstore,2003.
Arends, Richard. Learning to Teach 5th edition. Singapore: McGraw Hill Co., 2001
Eggen, P. And Kauchak, Donald. Strategies for Teachers: Teaching Content and Thinking Skills 3rd edition. USA:
Ailyn and Bacon, 1996.
Freiberg, H.J. and Driscoll A. Universal Teaching Strategies, 2nd edition. USA: Allyn and Bacon, 1996.

Proceeding of the 3rd International Conference on Education, Vol. 3, 2017, pp. 38 - 48
48
Killen, Roy. Effective Teaching Strategies : Lesson from Research and Practice. Australia: Social Science Press,
1996.
Leus , M.J. Fundamental Principles of Teaching. Unpublished material
Salandanan, Gloria. Teaching Approaches and Strategies. Q.C. Katha Publishing Co., Inc., 2000.
Shalaway, Linda. Learning to Teach: The Essential Guide for All Teachers. USA: Scholastic Professional Books,
1998.
Vega V. et al. Social Dimensions of Education. Quezon City, Metro Manila:Lorimar Publishing,Inc (2009).

Proceeding of the 3rd International Conference on Education, Vol. 3, 2017, pp. 49-57 Copyright © 2017 TIIKM ISSN 2424 - 6700 online DOI: https://doi.org/10.17501/icedu.2017.3106
3rd International Conference on Education, 20-22 April 2017, Kuala Lumpur, Malaysia
A CASE STUDY OF AUTOCAD 2D ENGINEERING
DRAWING PERFORMANCE AMONG FURNITURE AND
PRODUCT DESIGN (BFPD) STUDENTS
Indera Irawan M. R and Affandi H.M
Faculty Of Education, The National University of Malaysia
Abstract: Automatic Computer Aided Design (AutoCAD 2D) engineering drawing is an
important component in BFPD courses. This software is commonly practiced by students
for product design process as part of the project development. However, there is a lack of
quality in 2D engineering drawing that affects the students’ prototype making process and
project progression. This paper intends to identify the problems that weakened the
students' performances of the AutoCAD 2D engineering drawings. Data were collected
from the students’ examinations, assignments and independent projects. Semi structured
interviews were also conducted with the students. The sample consisted of BFPD’s Year 2
and Year 3 students at the First City University College. The findings indicated that the
lacking of technical skills is the main contribution of this study. Therefore, future research
is needed to investigate the identified problems further and recommendations are also
made to improve the syllabus.
Keywords: AutoCAD, 2D Engineering Drawing, Learning, Product Design
1. Introduction
Automatic Computer Aided Design (AutoCAD) is a software application for 2D CAD and 3D CAD drawing
model, drafting and engineering drawing. It was founded by Autodesk in 1982 (Kennedy, 2014). AutoCAD can
be used to draw, record data such as tolerances, construction materials of prototypes, and analyze drawing
without producing the prototypes (Reddy, 2008). AutoCAD software is specifically designed for drafters in
specific job-roles and industries (Daniel Greenspan, 2010). According to Guntur Dzulfikar (2014), he claimed
that AutoCAD is the world’s most commonly used CAD software with the highest overall job-market demand.
Therefore, it is widely introduced to students in institutions of higher learning, so they can get the exposure to
the software and fulfill the market demand concurrently (Awang, 2000) . According to Monk in 1996 noted in
his research that all students should have explored and utilized computing as it was used by professionals within
their respective field of study, and the upper level courses with significant computing content should be
available in each major. In this paper, it focuses on 2D drafting which is useful for various engineering sectors
such as electrical design, mechanical design, product design, building design, and architectural rendering and
design (Eteli & Eniekenemi, 2016). Although 3D solid modeling mechanical CAD (3D drafting) on the personal
computer (PC) has been available for more than 20 years, the demand for 2D CAD or 2D engineering drawing
solutions is still strong, especially for product design and factory management (Seats, 2015). Therefore, the
introduction of AutoCAD 2D engineering drawing in the universities and technical schools can meet the need of
the industry such as furniture and product design (Serdar, 2015).
2. Research Background
Bachelor of Art (Hons) Furniture and Product Design (BFPD) is one of the programmes offered at First City
University College (FCUC). The students who are taking this courses are required to learn AutoCAD for their
2D engineering drawing (Nichols, 2013). It is common to adopt a 2D engineering drawing for a product design
as part of the project developments . However, the applicability of this software to develop design project
Corresponding Author: Indera Irawan M. R/ [email protected]

Indera Irawan M. R and Affandi H.M/A Case Study of Autocad 2D Engineering Drawing Performance Among Furniture and Product Design (BFPD) Students
50
modules is limited that there is a lacking of quality and knowledge on AutoCAD 2D engineering drawing (2D
drafting) in their student’s Design Project modules. This insufficiencies influences the prototype making
process and overall project progression (Beckmann & Krause, 2010).
AutoCAD module is one of the courses to help students in preparing their documentation for design project
modules. The Design Project Module is a major course studied by the BFPD’s students that requires them to
understand the whole design process. After the students have completed their 2D engineering drawing or design
documentation, they will enter workshop to build up their own prototype or model making (refer to figure 1).
Figure 1 The Product Design Process (sources:Costello Design, 1996)
The below two figures show the AutoCAD 2D engineering drawing of coffee table design with a different
missing element in standard 2D drafting for Industrial Design. In figure 2, there is no detailed explanation
provided for the extra view welding parts and the hidden line. In figure 3, on the other hand, there is no
difference found between the hidden line and the object line. Above all, these missing information adversely
influence the result of the students’ project.
View and the parts name
missing.
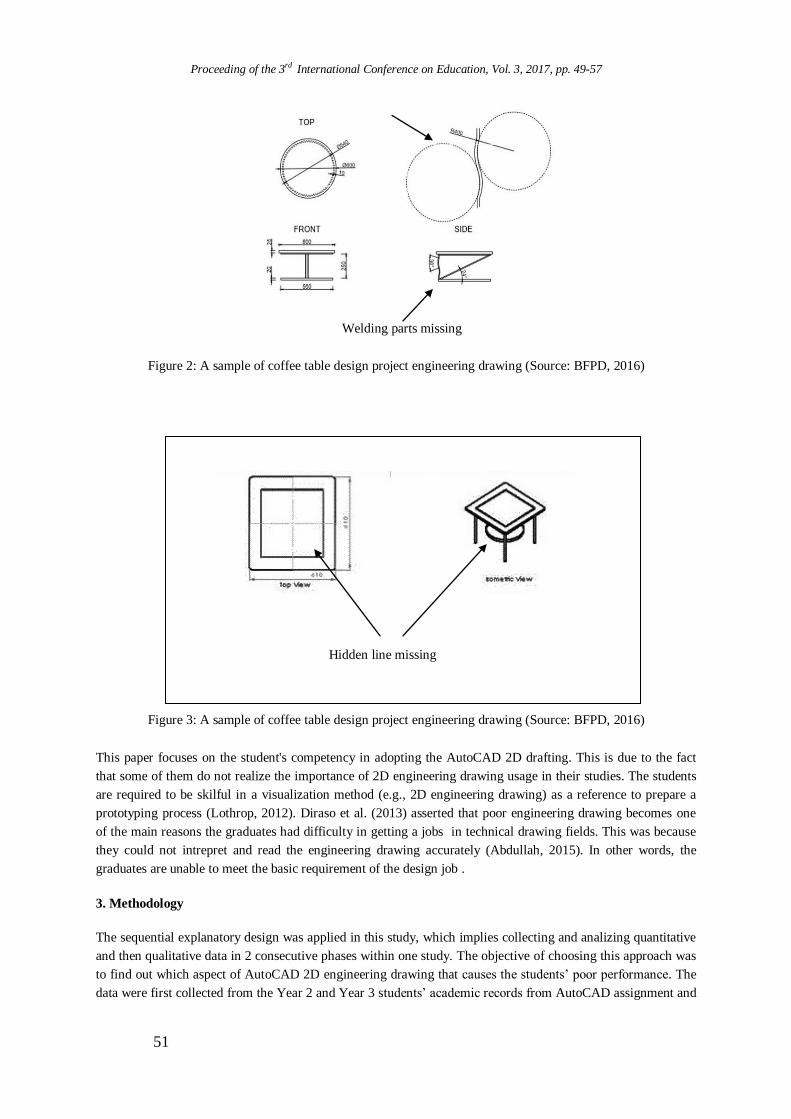
Proceeding of the 3rd International Conference on Education, Vol. 3, 2017, pp. 49-57
51
Figure 2: A sample of coffee table design project engineering drawing (Source: BFPD, 2016)
Figure 3: A sample of coffee table design project engineering drawing (Source: BFPD, 2016)
This paper focuses on the student's competency in adopting the AutoCAD 2D drafting. This is due to the fact
that some of them do not realize the importance of 2D engineering drawing usage in their studies. The students
are required to be skilful in a visualization method (e.g., 2D engineering drawing) as a reference to prepare a
prototyping process (Lothrop, 2012). Diraso et al. (2013) asserted that poor engineering drawing becomes one
of the main reasons the graduates had difficulty in getting a jobs in technical drawing fields. This was because
they could not intrepret and read the engineering drawing accurately (Abdullah, 2015). In other words, the
graduates are unable to meet the basic requirement of the design job .
3. Methodology
The sequential explanatory design was applied in this study, which implies collecting and analizing quantitative
and then qualitative data in 2 consecutive phases within one study. The objective of choosing this approach was
to find out which aspect of AutoCAD 2D engineering drawing that causes the students’ poor performance. The
data were first collected from the Year 2 and Year 3 students’ academic records from AutoCAD assignment and
Welding parts missing
Hidden line missing

Indera Irawan M. R and Affandi H.M/A Case Study of Autocad 2D Engineering Drawing Performance Among Furniture and Product Design (BFPD) Students
52
engineering drawing part in Design Project. These students have learned AutoCAD since Year 1. The total
sample was 18 students. There were 7 students from Year 3 and 9 students from Year 2. To identify the
students’ performance of AutoCAD 2D drafting, they were assigned to work on several assessments whereby
their results were recorded. These assessments included 4 minor assignments, 1 examination and 1 major final
drawing. The final drawing was based on either their own project or a selected product given to them. After that,
the students’ result for 2D engineering drawing were checked and recorded. Since there were 6 projects in one
term, the students were compulsory to produce 6 pieces of 2D engineering drawings by the end of the term.
The SPSS software was used to get the means score both subjects. SPSS was chosen because of its popularity in
academic and sciences social, making it the most widely used packages of its type (Arkkelin, 2014). After the
data being analysed, the semi structured interviews were conducted with the students to determine the factors
that contributed to poor performance in AutoCAD 2D engineering drawing. The student’s weak factors can be
detected through the probing question that will be asked in this semi structured interviews (Freeman, 2006) .
The Atlas Ti software was used for the interview data analysis. The software will help to analyze the qualitative
data, especially the discussion and documentation (Rambaree, 2012).
5. Result
Statistics
Design Project AutoCAD
N Valid 18 18
Missing 0 0
Mean 2.6667 3.6667
Std. Deviation .97014 1.23669
Variance .941 1.529
Table 1 Descriptive Statistic Design Project and AutoCAD marks result
Table 1 shows the descriptive statistic for both Design Project and AutoCAD. It was observed that the students
in AutoCAD class scored a higher mean of 3.6667 as compared to Design Project 1, with the mean score of
2.6667. This concluded that students performed better in AutoCAD class. In other words, the outcomes of the
engineering drawing in AutoCAD class were better than Design Project modules.
Design Project
Frequency Percent
Valid F 2 11.1
D 5 27.8
C 9 50.0
B 1 5.6
A 1 5.6
Total 18 100.0

Proceeding of the 3rd International Conference on Education, Vol. 3, 2017, pp. 49-57
53
Table 2 Percentage scores AutoCAD 2D Engineering Drawing result grade (Design Project module)
Table 2 shows the students' scores ranging from A to F for 2D engineering drawing in Design Project modules.
Only 5.6% of the students scored an A and a B in this course. In details, 50% of the students got a C and 27.8%
of them got a D. Unfortunately, 11.1% of the students failed their project. The analysis concluded that most
students did not perform well in AutoCAD 2D engineering drawing in Design Project.
AutoCAD
Frequency Percent
Valid F 1 5.6
D 2 11.1
C 5 27.8
B 4 22.2
A 6 33.3
Total 18 100.0
Table 3 Percentage Scores AutoCAD Module
Table 3 presents the details of the students’ results in AutoCAD module. The analysis showed that 33.3% of the
students scored an A and 22.2% of them got a B. In addition, 27.8% of them got a C and 11.1% got a D.
However, only 5.6% failed the module. This concluded that most students did better in AutoCAD modules.
5.1 Interview approach
There were 11 students selected to participate the interview because get the low grade AutoCAD 2D
engineering drawing in Design Project. All the interviews were conducted face to face. There were 3 main
questions and each main question have 2 or 3 sub question which it will give contains information. P means the
participant. P1 to P8 is from Year 2 and P9 to 11 is Year 3 batch. Interview questions and responses are as
follows with responses in italics. Question 1 is to explore and identify levels of knowledge of students about
the AutoCAD 2D engineering drawing.
Question 1
How would you describe AutoCAD 2D engineering drawing and do you know about the AutoCAD 2D
engineering drawing?
P1: I know the dimension. We use it to draw a flat object. It is easy to use, but sometimes it also looks
complicated. There are too many functions in the software. The interface is not nice and not user friendly.
P2: The measurement and the dimension of the product. I do not really understand the AutoCAD software.
When I used it to draw design project, I faced a problem when drawing a more complicated shape.
P3: The top view, side view, and orthographic drawing, yes, I know about it.I understand the
technical drawing. But sometimes I curious on measurement and AutoCAD menu.

Indera Irawan M. R and Affandi H.M/A Case Study of Autocad 2D Engineering Drawing Performance Among Furniture and Product Design (BFPD) Students
54
P4: All measurements must be correct and it is related to skill drawing. AutoCAD is a platform to make a
technical drawing. It can be used to draw 2D as well.
P5:Oh.. I learn before, but now I forget.I’m still not remember the menu of the software.Form my opinion, those
who has strength in mathematics or measurement, it's very easy to apply AutoCAD 2D.
P6: It has 2D measurement. I think AutoCAD can be used to prepare a technical drawing, but I am not
professional. It is too difficult for me. I’m very weak on calculation or mathematics
P7: It is a software to draw a more detailed in 2D engineering drawing.
P8: Yes, I know it is a 2D drawing software that shows the dimensions.
P9: Yes, sometimes the subject is boring and the software is also boring. The interface is difficult.
P10: Yes, I know. It can provide detailed dimensions, but it is very complicated and need to play keyboard,and
remember the command.
P11: Yes, I know. It is a software. I guess. It is not really a good software. It is hard to use.
Most participants complained about the AutoCAD 2D was difficult to use. Some students mentioned that the
interface design was boring and too many menus in AutoCAD. However, many of them agreed that the
AutoCAD was adopted to do a detailed 2D engineering drawing. They also knew about orthographic drawing.
Moreover, some participants mentioned about basic knowledge of mathematics and measurement need to be
applied in AutoCAD. They also feel difficult to draw complicated design such like organic shapes. To sum up,
the majority of the students pointed out that the software is difficult to apply in their own design. This problem
might imply that they lacked a technical thinking skill in the software application. Therefore, Question 2 is to
determine the factors influencing students’ difficulty in AutoCAD 2 engineering drawings.
Question 2
Why and what do you feel difficult about the AutoCAD 2D engineering drawing? Is it because of the interface
design, lecturer, timetable, lecture notes, assignments or lab facility or anything that I’m not mentioning here?
P1: Actually the software is fine. The problem is I always come late for the class, so it is my own disciplinary
problem. I missed the early lecture. My lecturer, computer lab and the timetable of the class are fine for me.
P2: It is quite okay. It is not totally 100% difficult to use. The timetable is fine. Even if I could not remember to
apply AutoCAD in the class, the lecturer helped and guided me. The computer lab was complete.
P3: I think everything is okay. When doing project 1, I have forgotten about it already so I used
traditional technical drawing. I am not practicing AutoCAD after the class.
P4: For lecture, we come late for the class so it is our problem. Others are okay. The lecturer helps us a lot, but
it is difficult because we miss an earlier lecture. This is our problem. I also do not practice after the class.
P5: It is a complicated software as compared with other softwares to transform from 3D to 2D. The AutoCAD
starts with 2D. Time is not enough. AutoCAD is difficult. I need more time to learn. I only remember in the
class because it is easy to understand, but when I go home, I forget how to use it. The lecture is fine and easier
to understand. Lab facility and class timetable are fine for me. Too many interfaces to remember.
Proceeding of the 3rd International Conference on Education, Vol. 3, 2017, pp. 49-57
55
P6: It is okay so far, but I need guidance to apply AutoCAD. I am very weak in computer technology. I can
follow the instruction in the class. If I do not know, I will ask. The lecturer helps me and lecture notes are also
fine for me.
P7: So far there is no problem from my side. The PCs (computers) are enough, and the timetable is also
appropriate. The lecture is also okay, no problem. It is easy to understand. The lecturer gives us suitable notes,
exercises and assignments.
P8: For facility, it is okay. But learning once a week is not enough for me. Therefore, I forgot. That is why I am
weak in this software. AutoCAD is more suitable to engineers, it is more technical.
P9: There is no problem in class. All is fine for me. The lecturer teaches us all fundamental of AutoCAD but I do
not have enough time to learn and practice it. Sometime, we are busy with other activities.
P10: There was no problem in class facility and lecturer. All is fine for me. Lecturer teaches us all basic about
AutoCAD and also the engineering drawing, but I always forget how to apply. It is very complicated and need to
know how to play keyboard and remember the command.
P11: The class runs well actually and the lecturer does not give any problem to me. Sometimes, the lecturer
helps and guides me how to draw. The computer lab is also good enough.
One of the main problems faced by most students was they forgot how to apply AutoCAD 2D. They could not
remember the command and the menu in AutoCAD because they did not practice quite often after the class.
They could only understand what the lecturer had delivered in the AutoCAD class. Some of them attended the
AutoCAD class late, and therefore they had missed a lot of important information. There was no complaint
about the university’s lecturer and computer lab facilities. They could understand the lectures as well. The
assignments given to the students were also suitable for their level. Most importantly, students had to practice
the software at home or with their friends to remember the software application, so they could apply it for their
own design. Unfortunately, the students always expected from their lecturer to assist them without having a
willingness to learn. One conclusion can be drawn was the learning attitudes of the students become an obstacle
for them in their studies. The next question is related to the practice of AutoCAD 2D in the design project
module. It is relevant to their spatial skill and technical thinking.
Question 3
How frequent you apply AutoCAD 2D engineering drawing in the Design Project module? Why you do better
in AutoCAD class, but not in Design Project? Is it because of your design is complicated to draw? How about
the Design Project lecturer?
P1: Sometimes it depends on my design, but my design project is not really difficult to draw. In AutoCAD class,
it is a more practical tool. The project design will involve everything. It is more independent. The lecturer helps
and guides us, but the problem is we need think how to solve our problems.
P2: I rarely practiced. I need time to think how to draw using AutoCAD. That is why I prefer the traditional
way. Sometime I just guess the dimension in my drawing. The assignment given in AutoCAD itself is easy. The
lecturer helps and guides us, but I forget when going back home.
P3: Sometimes. But I forget how to draw some drawings that involved tangent. Anyway, we have
hand sketches into 3D already. In terms of 2D, I do not know what measurement value is needed to
start my design. The drawing in AutoCAD class is easy because the lecturer guides us. It is different

Indera Irawan M. R and Affandi H.M/A Case Study of Autocad 2D Engineering Drawing Performance Among Furniture and Product Design (BFPD) Students
56
from Design Project. We need to solve the drawing problem by ourselves. So far the lecturer helps
but we need to solve it by ourselves.
P4: I rarely use it. It is complicated, but I try my best to apply it. I apply manual technical drawing and the
traditional way. Anyway Design Project is about the design process and it is given individually to us to solve the
problem. There is no problem with the lecturer because I understand that this module requires a certain level of
independence.
P5: Sometimes I apply also. I submit my AutoCAD final assignment with the same drawing in my Design
Project. Therefore, no problem at all. The lecturer guides us. I think the problems are time management and
procrastination.
P6: For the first and second project, I apply traditional style. When doing the next project, I apply it. The
problem is it is difficult to transfer our 3D hand sketches to 2D. I do not know how to measure the curve,
tangent and radius part measurement. I also forgot the calculation part. I am weak in technical parts as well.
The lecturer guides us, but I forget because I do not practice it in depth.
P7: I rarely apply. It is a good software that can be used to convert our drawing directly from 3D to 2D. It is
not time-consuming. Since we were Year 1 students that time, we did not learn any advanced software. We
learnt the basic only. The lecturer helps and gives a lot of opinions about my design. The technical part must be
solved by myself.
P8: I rarely apply it because it is complicated. I do not have enough time to think, learn and explore. I prefer
hand sketches. It is my weakness. I do not like calculation and technical parts. I am weak in 2D engineering
drawing for Design Project because I cannot solve the technical drawing itself.
P10: I only applied it when I was Year 1. In Year 2 and 3, I had other software modules. Therefore, there was
no problem at all. But for me, AutoCAD is multitasking. 2D CAD can be used to draw anything such as
furniture, product and interior in 2D version. When I was Year 1, it was still new for me, I could not think any
technical parts and understand well about 2D engineering drawing.
P11: Sometimes I apply. I apply traditional technical drawing because I forget how to use AutoCAD.
Engineering drawing is quite difficult for me. I prefer hand sketches or hand drawing because I do not need to
think the technical parts.
The above responses captured that most students rarely applied AutoCAD 2D engineering drawing in their
design project modules. This was because they were unable to think about the technical parts in their design.
They also experienced some problems with their own design. They were weak in technical thinking as well.
They were also not interested in reading the manual of 2D engineering drawing. Overall, the conclusion was the
students would prefer to adopt the easiest way to complete their design instead of investing time to learn the
AutoCAD software because due to a lack of technical skills AutoCAD 2D engineering drawing.
6. Conclusion and recommendation
Based on the above discussion, the students’ academic performance of AutoCAD 2D engineering drawing was
not necessarily affected by the software. In fact, it's highly depended upon the students' technical thinking skill.
The main reason was the students did not practice the software routinely due to their inadequate level of
understanding of 2D engineering drawing and technical parts. Particularly, the software is also difficult to apply.
Thus, it affected their attitude indirectly and they chose to go for the easiest way. According to the findings of

Proceeding of the 3rd International Conference on Education, Vol. 3, 2017, pp. 49-57
57
the present study, the following recommendations were made to help students enhance their performance in
AutoCAD 2D engineering.
1. The faculty and departmental libraries should be equipped with textbooks with the latest edition
about 2D engineering drawing and AutoCAD to encourage students to cultivate a good reading
culture .
2. Design interesting and easy modules for BFPD students to understand the courses better.
3. Enhance AutoCAD 2D engineering drawing to develop the students skill.
4. Lecturers should give extra tutorials to improve the student's understanding of the AutoCAD 2D
engineering drawing.
5. Students should achieve full attendance at AutoCAD class with good performance.
6. BFPD’s students should spend more time on their engineering drawing to meet their own
expectation of the course.
7. The faculty should send the lecturers for AutoCAD and Engineering Drawing training to improve
their teaching method.
8. Design a multimedia or application specialist for BFPD 2D AutoCAD engineering drawing
references.
7. Acknowledgement
The Authors appreciate the participation from students of the BFPD, First City University College and the
University to make this project a complete one.
References
Abdullah, Z. (2015). Improving Malaysian engineering graduate ability to read and interpret engineering drawings. UTEM.
Arkkelin, D. (2014). Using SPSS to Understand Research and Data Analysis. Psychology Curricular
Materialssychology Curricular Materials, 194.
Awang, D. bin. (2000). Rekabentuk Industri Dalam Kejuruteraan Mekanikal,Fakulti Kejutereaan, Universiti
Teknologi Malaysia,1-5.
Beckmann, G., & Krause, D. (2010). Improving the mechanical design education by hands-on experience with machine parts. In DS 62: Proceedings of E and PDE 2010, the 12th International Conference on Engineering and
Product Design Education - When Design Education and Design Research Meet.
Eteli, I., & Eniekenemi, E. (2016). Effect of Autocad Software In Teaching Isometric And Oblique Drawing
Among Female Students In Federal Science Technical College Tungbo, Bayelsa State. International Journal of
Education and Evaluation ISSN, 2(2), 2489–73.
Freeman, T. (2006). “Best practice” in focus group research: Making sense of different views. Journal of
Advanced Nursing, 56(5), 491–497. https://doi.org/10.1111/j.1365-2648.2006.04043.x
Kennedy, L. (2014). A Brief History of AutoCAD. Retrieved from
http://www.scan2cad.com/autocad-brief-history/
Lothrop, T. (2012). Design Drawing – An Integrated Visualization System.Thesis The Ohio State University,
15-25
Nichols, B. (2013). Valuing the Art of Industrial Design National Endowment for the Arts. Washington D.C, 7-
15.
Rambaree, K. (2012). Three Methods Of Qualitative Data Analysis Using ATLAS . Ti: “ A Posse Ad Esse.”
ATLAS.ti User Conference 2013, 1–15. https://doi.org/http://dx.doi.org/10.14279/depositonce-4840

Indera Irawan M. R and Affandi H.M/A Case Study of Autocad 2D Engineering Drawing Performance Among Furniture and Product Design (BFPD) Students
58
Reddy, K. V. (2008). Textbook of Engineering Drawing 2nd Edition. BS Publication. Hyderabad. Retrieved
from http://books.google.com.my/books
Seats, C. A. D. (2015). AutoCAD Alternatives Are Alive and Well in Product Design Graebert: Millions of 2D
CAD Seats. Retrieved from http://www.digitaleng.news/de/autocad-alternatives-are-alive-and-well-in-product-
design/
Serdar, T. (2015). Enhancing Spatial Visualization Skills in Engineering Drawing Course. In 122nd ASEE
Annual Conference & Exposition (p. 26.663.1-26.663.12).

Proceeding of the 3rd International Conference on Education, Vol. 3, 2017, pp. 58-63 Copyright © 2017 TIIKM ISSN 2424 - 6700 online DOI: https://doi.org/10.17501/icedu.2017.3107
3rd International Conference on Education, 20-22 April 2017, Kuala Lumpur, Malaysia
THE IMPLEMENTATION OF PROJECT BASED
LEARNING TO IMPROVE THE
COMPETENCES OF TEACHER CANDIDATES
Krisna Merdekawati
Islamic University of Indonesia, Indonesia
Abstract: Based on the legislation in Indonesia, the required competences of teachers in Indonesia
include pedagogical, professional, social, and personality. As one of teacher candidate education
institution, Chemistry Education Department, Islamic University of Indonesia contribute to produce
competent teacher candidates. The department has developed course materials, learning strategies;
system-oriented evaluation to develop student competence as chemistry teacher candidates. Project
Based Learning (PBL) is an option that is applied to achieve these objectives. This study aims to
describe the implementation of PBL towards the attainment of teacher candidates. Subjects were
students of chemistry education level three in academic years of 2016/2017. The research
instruments include project assessment, competency tests, observation sheets, and student
satisfaction questionnaire. Learning is conducted in accordance with the stages in the PBL such as:
start with the essential question, design a plan, create a schedule, monitor, and assess the outcome.
The research data shows that PBL gives positive impact on the attainment of teacher candidates.
Students also gave a positive response to the application of PBL. The data of assessment
pedagogical, professional, social, and personality in consecutive is 1.6 (good categories), 1.3
(enough categories), 1.7 (good categories), 1.6 (good categories). The score of student assessment
related to the implementation of PBL is 1.8 (good categories).
Keywords: Project Based Learning, Teacher Competence, Teacher Candidates
Introduction
The teacher is a key component in the educational system. All other components, such as curriculum, facilities,
fundings, school environment, and so on will not be effective if the core of learning which the teacher
interaction with students is not qualified. The quality improvement of education must begin with the quality
improvement of teachers. During the last 3 decades, the quality in the teaching profession has been a central
concern in a number country (Seferoglu, 2005). There are several studies that examine the important of teacher
competence development efforts. Competency based teacher education become a focus in many universities
(Smit, 2016). The preparation of teacher candidates academically and professionally is a vital responsibility of
the state through the teachers training institutions (Nzilano, 2013). Since 2001, Norwegian educational policy
has had a stonge focus on strengthening teacher education (Ostern, 2016) .The faculty of education should seek
to prepare lifelong learning competences, to produce professional teachers (Akyol, 2016).
According to Government Legislation Number 14 Year 2005 and Government Regulation Number 74 Year
2008, competencies required for teachers in Indonesia include pedagogical, professional, social, and personality.
Pedagogical competence is the ability of teachers in managing students learning that at least the following
understanding to: a) foundation of education, b) learners, c) curriculum development, d) design instructional, e)
implementation of learning that educates and dialogical, f) use of learning technology, g) evaluation of learning
outcomes, h) development of learners. Pedagogical competence related to the ability to manage learning that
must be held by teachers so that it can serve as a good educator.
Professional competence is the ability of teachers to master the knowledge of science being taught. The mastery
Corresponding Author:KrisnaMerdekawati/[email protected]

KrisnaMerdekawati/ The implementation of project based learning to improve the competences of teacher candidates
59
of at least involve the mastery of subject matter broad and deep based on the standard of teaching, mastering
concepts and scientific disciplines are conceptually coherent with the subjects of teaching. A teacher must
master the subject matter of teaching. The process of transferring knowledge would not be happened if the
teachers do not have the knowledge.
Social competence is the ability of teachers as part of the community. Social competence at least the following:
1) communicate verbally and politely, 2) use information and communication technology functional, 3) interact
effectively with students, educators, staff, leader of education unit, parents or guardians of students, 4) mingle
politely with the surrounding communities to heed the norms and value systems that apply, 5) apply the
principle of true brotherhood and the spirit of togetherness. Personal competence is competence related to the
character that should be owned by teachers, such as faithful, thoughtful, honest, democratic, authoritative, and
capable of being exemplary.
As one teacher candidates education institutions, Chemical Education Department,Islamic University of
Indonesia contributed to produce competent teacher candidates. The department has developed course materials,
learning strategies, system-oriented evaluation to develop student competence as chemistry teacher candidates.
Learning strategy that is often used in the study program is Project Based Learning (PBL). PBL is an option that
is applied to develop the competencies of students as teacher candidates. Therefore, PBL provides students a
real experience to apply the lecture material in a project. PBL has great potential to make the learning
experience interesting and meaningful for the students to enter the workforce. PBL facilitate students to develop
the competencies needed when working,
PBL is an active student-centered form of instruction which is characterized by students’ autonomy,
constructive investigations, goal-setting, collaboration, communication and reflection within real-world
practices (Kokotsaki et al, 2016).PBL is an instructional model that was developed from the thinking of John
Dewey on learning by doing. The project became the core activity in the PBL. This model requires the activity
of students to construct knowledge and produce concrete results. The issues that used in PBL is a problem that
weighted, relevant, real, and complex. PBL facilitate students to apply the concepts in real situation. Thus,
students not only get knowledge in cognitive structure, but also to develop competence. Global School Net
reported the results of the research on the characteristics of PBL from Auto Desk Foundation. The results of
these studies indicates that PBL has the following characteristics: learners make decisions about a framework,
any problems or challenges posed to the students, the students design a process to determine a solution to the
problems posed, students collaboratively responsible for access and managing information to solve the problem,
the process of continuous evaluation, students periodically reflect on the activities already carried out, the final
product learning activities will be evaluated qualitatively, tolerant learning situations through fault and changes.
PBL focuses on the concepts and the main principles of a discipline, engage students in problem solving
activities and tasks of other significant, provide opportunities for students to work autonomously construct their
own learning, and ultimately produce the works of students that valuable, and realistic ( Okudan& Sarah, 2006).
Learning steps (syntax) PBL developed by The George Lucas Educational Foundation include: start with the
essential question, design a plan for the project, create a schedule, monitor the students and the progress of the
project, assess the outcome, and evaluate the experience. The implementation of PBL gave a positive influence
on the development of attitudes, self-concept, habituation-based learning environment (Alacapinar, 2008;
Kalayci, 2008). In addition, PBL also gave positive effect on academic achievement, understanding contextual
knowledge, interest and curiosity (Erdem, 2012).
Methodology
This study aims to describe the implementation of PBL towards the attainment of teacher candidates. The study
used a descriptive approach. The subjects were students of chemistry education level three academic years
2016/2017. The research instruments include project assessment, competency tests, observation sheets, and
Proceeding of the 3rd International Conference on Education, Vol. 3, 2017, pp. 58-63
60
student satisfaction questionnaire. The stages in the research activities include the development of research
instruments, teaching practices, collection and analysis of data.
Project assessment instrument consists of three aspects: planning, implementation, and products. Each aspect
further elaborated in the assessment indicators. In order the project assessment can be objective; an assessment
rubric is made to be used as a reference in the assessment. Assessment rubrics describe the achievements of each
indicator and scores. Competency tests consisted of reviewing the performance of pedagogical, professional,
social and personal competence observation sheet. The competency tests were developed from competency
assessment indicators which refer to the applicable laws and regulations in Indonesia. Competency test scores in
the range of 0-2, 0 if the expected indicator is not appear, 1 if the indicator appears but less suitable, 2 if the
indicator appears and appropriate. The results of competency assessment have 3 categories ( poorcategory for
score < 1, enough category for 1< score≤1.5, good category for score > 1.5. The questionnaire was developed to
evaluate the response and students assessment of the learning process quality using PBL.
PBL applied in subjects related to the achievement of the teacher competence, such as teaching and learning
strategies, evaluation of processes and learning outcomes, instructional media, curriculum review, learning
program development during 1 year. The projects undertaken by students such as create chemistry learning
media, lesson plan book, and assessment instruments. The data collection is done throughout the implementation
of PBL. Data observation, competency test, and project assessment is used to describe the implementation and
effect of PBL.
Results
Before the lecture, the students are divided into groups that are heterogeneous. Lecture was in accordance with
the stages in the PBL, first start with the essential question. Learning begins by providing essential questions,
questions that can lead to the assignment of students in performing an activity. For example, students are
directed to the urgency of the selection of learning strategies in designing chemistry quality of learning, teaching
media urgency, and assessment urgency. Students showed great interest when the lecturer highlights the
questions on the subject matter to be resolved. It is therefore, the questions were relevant to the needs of current
students in the world of work in the future. This stage is not only meant to guide students in projects to be
undertaken, but also to generate interest towards learning. The second phase, design a plan for the project,
students gathers information that related to the focus of the project. The planning is about the rules, the selection
of activities that can support in answering the essential question, by integrating a variety of subjects as possible,
and to know the tools and materials that can be accessed to assist the completion of the project.
The third stage is create a schedule, the lecturer and students collaborate to draw up a schedule of activities in
completing the project. Activities in this stage include making a timeline for completing the project, making the
project completion deadline, guiding students as they make way not associated with the project, and asking the
student to make an explanation of the election in certain way. The fourth stage is the students and monitors the
progress of the project. Lecturer monitors and facilitates the activities of students in completing the project. The
fifth stage, assess the outcome. Assessment is done to measure the achievement of learning, play a role in
evaluating the progress and provide feedback about the level of student understanding has been reached. The
assessment of the outcome is the process of analyzing product of project have been carried out, whether the
products are to be used to answer questions that were formulated in the early part of learning. The last phase is
evaluate the experiences. At the end of the learning process, reflection is done on the activities and results of
projects already executed. Students express the experience in the completion of the project. Lecturers and
students collaboratively evaluate the learning experience.The competency assessment tests data show that the
student has had the required competence of teachers. Brief description of competency assessment data are
shown in Table 1 to Table 5.

KrisnaMerdekawati/ The implementation of project based learning to improve the competences of teacher candidates
61
Table 1 The data summary of pedagogic competence assessment..
Assessment aspect The average score
(maximum score is 2)
Instructional design 1.8
Implementation of learning that educates and dialogical 1.5
Utilization of learning technologies 1.4
Table 2 The data summary of professional competence assessment.
Assessment aspect The average score
(maximum score is 2) Understanding the concepts, laws, theories of chemical 1.2
Understanding the scope of chemistry materials at school 1.3
Mastering the skills of the laboratory 1.2
Managing chemical materials creatively 1.6
Table 3. The data summary of social competence assessment
Assessment aspect The average score
(maximum score is 2)
Communicate verbally, write politely 1.8
Use communication technology and information
functionally
1.2
Interact effectively and polite 1.9
Apply the principles of brotherhood and togetherness 1.9
Table 4. The data summary of personality competence assessment
Assessment aspect The average score
(maximum score is 2)
Behave based on norms 1.6
Can be a role model 1.4
Present their selves as a person who is stable, mature and wise 1.4
Proud of teacher profession 2.0
Responsible to task 1.4
Table 5. The average score of competence assessment
Pedagogic
competence
Professional
competence
Social
competence
Personality
competence
Average
1.6 1.3 1.7 1.6
Category
Good Enough Good Good
The above data show that student as a teacher candidates has had the required competence of teachers in
Indonesia. However, it still needs to be an effort to improve the professional competence, which is the
competence related in mastering chemitry content. PBL provides real learning experiences for students. Projects
undertaken are complex and real problems faced by students when they being a teacher. So that the pedagogic
and professional competences can be developed. Through collaboration in project work, social skills and norms
of pro-academic can be developed. Pro-academic norms, such as appreciate the difference, wise in deciding
problems, responsibility. Social competence and personality of the students can be developed in PBL.
The implementation of PBL during teaching and learning process enhanced the students’ motivation and
experience. PBL offered challenging series of activities to students. This technique facilitated the students to
understand the subjects effectively and easily as they solved the real world problem while developing the
project.In addition, the group activities which the students had during the project development enhanced their
involvement in the learning activities. The groupactivities enabled the students to work by sharing their
knowledgeand information to each other. They were able to work and contribute to theproject based on their

Proceeding of the 3rd International Conference on Education, Vol. 3, 2017, pp. 58-63
62
expertise. The group was heterogeneous. It encouraged them to help and learn from each other. Italso built
positive bound of relationship among students.A classroom may consist of students with different kinds of
ability, interests, and needs. Project work is suited to the classroom with variedabilitystudents as it can bridge
students to work together. By doing so, each student will be ableto participate well in the project.
In PBL, lecturer as a facilitator for students. While in the class of conventional lecturer regarded as someone
who had the most material and all information provided directly by the lecturer. In PBL class, students
accustomed to working collaboratively. This differs from the class of conventional who are familiar with
individual classroom situations. PBL class is more active when compared to a conventional classroom. Many
students acquired skills, which are hard to come from conventional lectures. In terms of acceptability and
assessment of students, the students considered that PBL is easy to implement, not burdening students, and
feasible to implement. Students assess that PBL can help them understand and apply the lecture material.
Student assessment score related to the implementation of PBL is 1.8 (good categories).
Conclusions
The research data shows that PBL gave a positive impact on the attainment of teacher candidates. The data
assessment of pedagogical, professional, social, personality consecutive are 1.6 (good categories), 1.3 (enough
categories), 1.7 (good categories), 1.5 (good categories). Students also gave a positive response on the
implementation of PBL. Student assessment score related to the implementation of PBL is 1.8 (good
categories). PBL provides students a real experience to apply the lecture material in a project. PBL has great
potential to create the learning experience interesting and meaningful for the students to enter the workforce.
PBL facilitate students develop the competencies needed when working, students become more involved in
learning. there are several skills that built from the project in the classroom, such as team building skills, make
decisions cooperatively, cooperation, problem solving. These skills are indispensable when working and is a
skill that is difficult to teach through conventional learning.
Acknowledgements
This acknowledgement is being dedicated by the author to Academic Development Agency, Islamic University
of Indonesia for funding research through teaching grants program
References
Akyol, B., 2016, Teacher self-efficacy perceptions, learning oriented motivation, lifelong learning tendencies of
candidate teachers: A modeling study. Eurasian Journal of Educational Research, 65, 19-34.
Alacapinar, F., 2008, Effectiveness of Project Based Learning, Eurasian J. Educational Res, 32, 17-34.
Erdem, Emine., 2012, Examination of the Effects of Project Based Learning Approach on Students’ Attitudes Towards Chemistry and Test Anxiety. World Applied Sciences Journal, 17(6), 764-769.
George Lucas Educational Foundation. Instructional Module Project Based Learning, Date of access 3/1/2017.
http://www.edutopia.org/modules/PBL/whatpbl.php.
Global School Net. Introduction to Networked Project-Based Learning. Date of access 3/1/2017.
www.globalschoolnet.org/web/pbl/.
Indonesia Government Legislation Number 14 Year 2005.
Indonesia Government Regulation Number 74 Year 2008.
Kalayci, N., 2008, An Application Related to Project Based Learning in Higher Education Analysis in Terms of
Students Directing the Project. Education and Sci., 147(33), 85-105.
Kokotsaki, D., Menzies, V., Wiggins, A., 2016, Project-based learning : a review of the literature. Improving
schools., 19 (3), 267-277.

KrisnaMerdekawati/ The implementation of project based learning to improve the competences of teacher candidates
63
Nzilano, J.L., 2013, Pre-service teachers’ teaching competencies: the experience of practicing teaching in
secondary schools and teacher colleges. African Journal of Teacher, 3(1).
Okudan. G. E., and Sarah, E. R., 2004, A project-based approach to entreprenurial leadership education.
Journal Technovation. 20, 1-16.
Ostern, A. L., 2016, Responding to the challenge of providing stronger research base for teacher education:
research discourses in the Norwegian national research school for teacher education. Journal Education
Research, 58(1).
Seferoglu, S.S., 2005. A study on teaching competencies of teacher candidates. Proceedings of International
Conference on Education, National University of Singapore, Singapore, pp. 709-716.
Smit, R., 2014, Individual differences in beginning teachers’ competencies-A latent growth curve model based on video data. Journal for Education Research Online, 6(2), 21-43.

Proceeding of the 3rd International Conference on Education, Vol. 3, 2017, pp. 64-76 Copyright © 2017 TIIKM ISSN 2424 - 6700 online DOI: https://doi.org/10.17501/icedu.2017.3108
3rd International Conference on Education, 20-22 April 2017, Kuala Lumpur, Malaysia
EXPLORING STUDENTS’ ACADEMIC ACHIEVEMENTS
IN ELECTRICITY AND MAGNETISM THROUGH
LEARNING STYLES AND LEARNING STYLE-BASED
INSTRUCTIONAL STRATEGIES IN MTHATHA HIGH
SCHOOLS
Sakyiwaa Danso and Emmanuel Mushayikwa
University of the Witwatersrand, South Africa
Abstract: Recent studies of the teaching and learning process have shown that learners tend to
receive and process information in different ways. This study was conducted to explore the impact of
matching instructional strategies to the learners learning styles, considering their cultural background
in the teaching of Electricity and Magnetism among Grade 11 physical science learners in schools
around Mthatha. To achieve the intended objective and to answer the research question “what impact
does the learners‟ learning style preferences have on learners‟ academic achievements”, a total of
205 physical science learners were sampled for the study. A purposive convenience sampling
technique was used to select four schools from the target population. A non-experimental
quantitative exploratory design was adopted for the study. Physical Science Achievement Test and
Index of Learning Style Questionnaire were the main instruments used for gathering the data. Data
were analysed using descriptive statistics and inferential statistics including an independent sample t-
test together with multiple regression analysis. The result indicates that, the four learning style
categories combined did not contribute significantly to the academic achievement of the grade 11
learners in electricity and magnetism at the four high schools in Mthatha.
Keywords: Learning Styles, Instructional Strategies, Achievements, Physical Sciences
Introduction
The study of physical science as a subject at secondary school level has become a national priority in
South Africa due to the growing awareness about its contributions to the socio-economic and
technological development of the nation. Hence, the development of programmes to improve
scientific literacy is currently an important endeavour in the South African educational context.
According to Larkin-Hein (2000) the brisk changes that continue to occur in academia suggest that learning
should be a continuous process. Taber (2009) also posits that learning is a personal activity and each learner has
to construct his or her own knowledge. However for learning to be personalised, McFarlane (2013) suggested
that learners should develop an interest in the subject matter and construct new knowledge based on their
understanding of the concepts, and more importantly, as Udo and Udofia (2014) affirmed, participate actively in
the teaching and learning process. Therefore, according to Holbrook (2011) learners learn physical sciences to
gain knowledge and skills as well as to pass in the subject knowledge examination.
In the learning environment, however, every learner has his/her own natural ways of acquiring and processing
information. These unique ways are described by Singh, Govil and Rani (2015) as their learning styles. In
literature numerous learning styles and learning style models exist due to the fact that learning is achieved at
different levels. According to Zywno and Waalen (2002), learning style model classifies learners according to
where they fit on a number of scales regarding the ways they receive and process information Hence, some
Corresponding Author: Sakyiwaa Danso/ [email protected]
Sakyiwaa Danso and Emmanuel Mushayikwa/Exploring Students’ Academic Achievements in Electricity and Magnetism
Through Learning Styles and Learning Style-Based Instructional Strategies in …
65
theorists (for example Kolb, 1984) define learning styles by focusing on different aspects as observed by
Akkoyunlu and Yilmaz-Soylu (2009).
In the same way, instructional strategies also vary. According to Felder (1988), some teachers teach by
demonstrating, others by lecturing; while others emphasise on principles and applications. Therefore, how much
a learner learns in a classroom is often due to the learners‟ inherent ability and prior preparation as well as the
match between the learners‟ learning styles and the teacher‟s instructional strategies. However, there is also a
general agreement that the most effective learning occurs when the learning activities are closely matched to the
learners‟ preferred learning styles (Gordon and Bull, 2004). Gordon and Bull (2004) further stated that, by
matching instructional strategies to the learners‟ learning style preferences; the learning process becomes easy
and comfortable for both teacher and the learners. However, sometimes, mismatches occur; and as a result,
some learners may get bored or discouraged and may perform poorly in examinations.
Vita (2001) claims there is another factor: the importance of cultural background in the development of
individual learning style. This is supported by the fact that culturally-based educational experiences predispose
individuals to certain ways of learning. This is reiterated by New York State Board of Regent‟s Report (1987, as
cited in Claxton, 1990, p.3), “learning styles and behavioural tendency do exist and that learners from particular
socialisation and cultural experiences possess preferences to knowledge that are highly functional in the
indigenous home environment and can be capitalised upon to facilitate performance in academic settings”.
Knowing each individual learner‟s cultural background is essential preparation for facilitating and structuring
successful instruction for all learners, as Hewson (1988) suggested, science teaching and learning should be
culturally sensitive, giving attention to what is really happening in the learners‟ minds and hearts. As such,
Guild (1994) recommends the selection of appropriate instructional strategies that match learners‟ learning style
preferences and cultural attributes to facilitate smooth delivery and effective achievement of instructional
objectives.
Some studies (for example, Mashile, 2001; Mji &Makgato, 2006) in South Africa have investigated and
reported on different factors that particularly affect the teaching and learning of physical sciences. These
include; out-dated teacher-centred instructions and mismatches of teachers‟ teaching styles and learners‟
learning styles, among others. In their conclusion, they indicated that the recurring poor performance in the
subject calls for a concerted effort for measures that will help improve the status quo.
Mji & Makgato (2006) carried out their study in the Eastern Cape and reported that science teachers still used
out-dated teacher-centred teaching strategies. The researchers‟ own experiences as science teachers in Mthatha
also support this observation where traditional teacher-centred instruction emphasises the passive acquisition of
knowledge. The bulk of the work involves teacher-talk, using either a lecture method or a simple question-and-
answer technique that basically demands recall of knowledge from the learners, as observed by Zakaria and
Iksan (2007). As noted by Kulkarni and Klemmer (2012), a severe deficiency in traditional teaching methods in
the physical sciences resides in the fact that learners do not visualise the details of different science processes
and they frequently fail to understand the most basic science concepts and phenomena.
Furthermore, one of the fundamental principles upon which the National Curriculum Statement (NCS) is based
is the relevance of what is being learned. The NCS physical sciences curriculum structured content knowledge
into six core areas (DoE, 2011). According to Chabay and Sherwood (2006), Electricity/Magnetism is one core
area which learners perceived to be complex as it involves abstract and multidimensional phenomena that
learners have difficulty comprehending. For example, in the sub-topic of electrostatics, electric fields and their
associated representational formalisms are three-dimensional, abstract, and have few analogies to learners‟
everyday experience, as observed by Furio and Guisasola (1998). As a result, Chambers and Andre (1995) noted
that, learners have trouble understanding the relationship of abstractions about electric fields to

Proceeding of the 3rd International Conference on Education, Vol. 3, 2017, pp. 64-76
66
phenomenological dynamics. Therefore, to meet this need, Chinn and Samarapungavan (2009) recommended
the use of different teaching strategies to cater for the different learning styles learners bring to the science
classroom. Although, much research have been conducted on learning styles and their determinants, much less
research seems to have been done on the learning style preferences among learners and their relationship to the
embedded cultural context and further, how teachers can use this information to diversify the way they teach to
engage all learners in a multicultural settings.
Against this background, the study investigated the impact of matching instructional strategies with the learners
learning styles, considering learners cultural backgrounds in the teaching of the topic of Electricity and
Magnetism to Grade 11 learners in schools around Mthatha. This paper is therefore reporting on a small part of a
bigger study comprising both quantitative and qualitative research components.
Purpose and Research Questions
Specifically, the study was designed to identify learning style preferences among learners in Grade 11 and to
explore the effectiveness of different learning style-based instructional strategies on learners‟ academic
achievements in the concepts „Electricity and Magnetism‟, considering learners‟ cultural background.
Therefore, the following research questions were developed and served as the guiding force of the study.
1. What are the prevailing learning style preferences among grade 11 physical science learners based on the
index of learning style questionnaire?
2. What impact does the learning style preference of learners have on their academic achievements?
Review of the Literature
The literature offers a myriad of definitions of learning styles and learning style models. As noted by
Vita(2001), the one which, by virtue of its encompassing properties, still commands benchmarking significance,
is that provided by Keefe (1979, p.4), that “learning styles are characteristic cognitive, effective, and
psychological behaviours that serve as relatively stable indicators of how learners perceive, interact with, and
respond to the learning environment”. Accordingly, Schmeck (2013) defined learning style, as being the
cognitive style that a person demonstrates or manifests when confronted with a learning task. Schmeck (2013)
later expanded his definition of learning style to include concepts that incorporate individual motives and
personal experiences that influence perception. However, Cassidy (2004) stated explicitly that the ideal way in
which an individual approaches a learning situation has been characterized by a variety of theoretical learning
style models. One such an ideal model is the Curry „Onion‟ model (Curry, 1983).
The Curry‟s “Onion” Model is a standard method of classifying learning style models, which categorises
learners learning differences as layers of an onion, with four layers: instructional preferences, social interaction
preferences, information processing and personality levels (Coffield, Moseley, Hall, & Ecclestone, 2004). The
outermost layer comprises Instructional preferences which focus on the most observable traits of a learner,
examples of which are emotional, and environment (Gordon & Bull, 2004). Rezler (2013) and, Dunn and Dunn
model (Dunn & Dunn, 1993) of learning styles come under this category. Social interaction provides the next
layer and relates to the ability of learners to interact with their peers in the learning process, as well as the
differences related to gender, age or maturation levels. An example of this type of model is the Grasha and
Riechmann (1975) type model. The innermost layer encompasses Cognitive Personality Style, which can shape
and influence a learner‟s ability to acquire and integrate information. The Myers-Briggs Type Indicator (MBTI)
is based on personality levels (Cuthbert, 2005).The more stable layer encompasses information processing
model which is conceived as the individual's intellectual approach to obtaining information, sorting, storing and
utilizing information (Gordon & Bull, 2004). Learning style models such as; Kolb (1984); Schmeck, Ribich and
Ramanaiah (1977) and Felder-Silverman (1988) learning style model fall under this category.

Sakyiwaa Danso and Emmanuel Mushayikwa/Exploring Students’ Academic Achievements in Electricity and Magnetism
Through Learning Styles and Learning Style-Based Instructional Strategies in …
67
The Felder-Silverman‟s model is one of the theoretical frameworks used to determine the different learning style
preferences among people. Felder-Silverman (1988) defined learning style as the characteristics, strengths and
preferences in the way people receive and process information. The model specifically focuses on the aspects of
learning styles in engineering students (Kanninen, 2008) and describes the learning style of a student in four
dimensions (Felder & Henriques, 1995). We have specifically selected the Felder-Silverman‟s model as the
pedagogical model for instructions in the physical sciences against competing alternatives for this study for the
reason that it has been explicitly developed for classroom application and, provided a richer and more flexible
sliding scales support for classifying the learners learning styles. Besides, it has a wide-ranging system of
learning styles which help teachers to be more aware of the needs of the learners and adjust their instructions
accordingly. The model has also been successfully implemented in previous studies on learning style and
academic achievement of high school learners in science subjects (the most recent of which were: Adkins &
Guerreiro, 2017; Akinbobola, 2015).
The Felder-Silverman Learning Style (1988) model rates the learners‟ learning style in a scale of four
dimensions; processing, perception, input and understanding. The first dimension (processing) distinguishes
between an active and a reflective way of processing information. Active learners learn best by working actively
with the learning material, by applying the material, and by trying things out. Reflective learners prefer to think
about and reflect on the content. The second dimension (perception) distinguishes between sensing and intuitive
learning. Sensing learners like to learn from facts and solve problems with standard approaches. In contrast,
Intuitive learners prefer to learn from abstract materials and are more able to discover possibilities and
relationships. The third dimension (input) focuses on the visual-verbal aspect. Visual learners remember best
from every details of what they see and therefore prefer to learn from pictures and diagrams while verbal
learners learn best from spoken materials and textual representations. The fourth dimension distinguishes
between sequential and global dimension (understanding). Sequential learners learn in small incremental steps
as they have a linear learning progress and tend to follow logical stepwise paths in finding solutions. In contrast,
Global learners use a holistic thinking process and absorb learning material almost randomly without seeing
connections but after they have learned enough materials they suddenly get the whole picture.
With the above in mind, the review of related studies have also shown that, all learners have different learning style preferences and that excellent teaching requires diagnosing the learning style of each learner and aligning
teaching strategies accordingly (Kolb, 1984; Felder-Silverman, 1988; Dunn & Dunn, 1993). A significant
number of studies have been carried out to establish whether learning style preferences have any influence on
learners‟ academic achievement. Jahanbakhsh (2012) investigated the relationship between learning styles of
girls and their academic achievements based on their majors in Iranian high schools. The results indicated that
Sensing/Intuitive learner‟s showed a significant correlation with the academic achievement of students whose
major was mathematical science. In contrast, Gakhar (2006) studied the academic achievement of students as
determined by their preferred learning styles, thinking styles and study skills. The results of the study showed no
significant difference in the academic achievement of students with different learning styles. Therefore, the
studies by Gakhar (2006), showed conflicting result from the study conducted by Jahanbakhsh (2012).
However, Pashler, McDaniel, Rohrer, and Bjork (2009) in their study concluded that in order for the learning styles “meshing hypothesis” (the matching, or meshing, hypothesis implies that students‟ learning is enhanced
when a mode of instruction is used that matches their learning preference) to be confirmed, numerous well-
designed studies would have to test the matching hypothesis and show significant interaction effects. Therefore,
Cuevas (2015) contends that it is not enough for research to simply show that students may have preferences for
certain modes of learning because studies on metacognition have consistently shown that students‟ preferences
and evaluation of their own learning tend to be highly inaccurate when compared to actual learning. Cuevas
(2015) further stated explicitly that, consistent, replicable evidence of achievement is necessary to justify the
effort required to implement learning style-based instructions. Accordingly, Mayer (2011) argues that learning
styles research have persistently lacked rigor and that there is no evidence that clearly supports the application or
practice of learning style-based instructions. In addition, Cuevas (2015) argued vehemently that much literature
have been written on learning styles, but very little of it contributes to evidence-based support for the concept.
However, we contend that, the development of learning style-based instructional tools could allow for easy

Proceeding of the 3rd International Conference on Education, Vol. 3, 2017, pp. 64-76
68
creation of educational materials that take into cognisance learners learning style preferences and cultural
background in the teaching/learning process to counter these critiques, and to give learners the opportunity to
identify their learning styles in a new way to improve their achievement in science.
Materials and Methods
The study espoused the positivism worldview, to gather essential information numerically utilising quantitative
exploratory approach, because the researcher aims at exploring the impact of learning style-based instructions on learner achievement by considering learners‟ cultural backgrounds. This phenomenon is therefore, multifaceted
and required multiplicity of knowledge sources which were blended with the research questions to construct a
meaningful proposition about the complex environment of learning styles and learning style-based instructions
on achievement of learners in schools in Mthatha. The population of the study consisted of all grade 11 physical
science learners in high schools in Mthatha. Purposive convenient sampling technique was employed to select
four schools from the target population. A total of 205 learners and 4 physical science teachers participated in the
study in their intact classes. The participating teachers were trained on the development and implementation of
learning style-based instructions in the physical science classroom.
Instrumentation
Felder-Silverman Index of Learning Style Questionnaire (FSILSQ) and Physical Science Achievement Test
(PSAT) were the main instruments used to gather data for this study.
The FSILSQ was adopted from Felder and Silverman (1998) learning style model. Permission to use the questionnaire was granted by the authors. The questionnaire was designed to assess and determine learners‟
learning style preferences on a scale of four dimensions and consisted of 44 forced-items with options „a‟ and „b‟
corresponding to one or the other category of the dimension. The learners were required to choose options that
apply more to their learning styles, as each option refers to any of the four dimensions of the learning style
including; active/reflective, sensing/intuitive, visual/verbal, and sequential/global. Scoring is done by summing
up the number of „a‟ and „b‟ responses respectively for each dimension, with scores ranging from 1 to 11. To
obtain the total scores for each dimension, lower scores in each column are subtracted from the higher scores of
either „a‟ or „b‟ and the difference determines the learning style of that learner. For example, a score of 9a under
Active column and 2b under the Reflective column will give a difference of 7a which indicates that the learner
has a moderate preference for active learning. A learner‟s profile is therefore said to be low or mild (a score of 1-
3), moderate (a score of 5-7) or strong (a score of 9-11) for one dimension on the scale.
Reliability tests were performed for each of the learning-style dimensions to ensure that the instrument was
applicable to the South African population. Cronbach‟s alpha ranged from 0.73 to 0.78. Reliability scores were
therefore deemed fairly high and satisfactory, as confirmed by Felder and Spurlin (2005).
The PSAT consisted of 50 multiple choice items in the concept of electricity and magnetism, which were
constructed by the researchers. Each item on the PSAT had four options; „A‟, „B‟, „C‟, „D‟ with only one correct
answer, which was awarded 2 marks. The PSAT was validated by three physical science teachers, including the
subject advisor of the district.
Data Analysis
The quantitative data were entered into SPSS and Microsoft Excel spreadsheet for data analysis. For research
question 1, to determine the prevailing learning styles, descriptive statistics were employed. In addition,
inferential statistics were employed to determine if there were any significant differences between learners‟
learning style-based instructions and learners‟ academic achievement to answer research question 2. Multiple regressions were employed to help determine how Felder-Silverman‟s learning and teaching styles
(independently and in combination) measured learners‟ academic achievement in the physical sciences. A
confidence interval of 0.05 was employed throughout the study therefore a p-value above 0.05 suggested that
there was no significant difference between the learning style dimensions and the level of academic achievement
in physical science.

Sakyiwaa Danso and Emmanuel Mushayikwa/Exploring Students’ Academic Achievements in Electricity and Magnetism
Through Learning Styles and Learning Style-Based Instructional Strategies in …
69
Results and Discussions
Learners’ learning style preferences
The Table 1 highlights the distribution of learners across the four main dimensions of the Felder-Silverman‟s
learning style: processing (active/reflective), perception (sensing/intuitive), input (visual/verbal), and
understanding (sequential/global) used in this study.
Table 1: distribution of learning style preferences among the grade 11 physical science learners in Mthatha
From a total number of 205 respondents in the processing learning style category, 127 of them representing 62%
were classified as active learners, forming the majority of this category, while 78 representing 38% were
considered as reflective learners. Considering the perception learning style category, 33 ((16%) of the learners
were classified as being intuitive, while 172 (84%) were sensory, with the sensory forming the majority. A total of 65 (31.7%) of the learners were considered as verbal while the majority of 140 (68.3%) were identified as
having a preference for visual under the input category of learning style. For the understanding learning style
category, majority of the learners were sequential with 144 (70.2%) of the learners, while 61 (29.8%) of the
learners were global. The table further illustrates that the predominant learning styles among the 205
respondents were Active (62%); Sensing (68%); Visual (68%) and Sequential (70%). This finding corroborates
with those of Gonzales, Glaser, Howland, Clark, Hutchins, Macauley, and Ward, (2017) who determined the
learning style preferences among nursing students to be more active, sensing, visual and sequential. This result
shows that people have preferences in terms of how information is received and processed by each individual in
the learning environment.
Learning style preferences and academic achievement
Learners‟ academic achievement for this study was assessed by the administration of a multiple choice test on electricity and magnetism. This topic was taught by four teachers from the four high schools who implemented
learning style-based instructional strategies in their classrooms to teach electricity and magnetism. The
academic achievement scores within each learning style dimension is described statistically using means,
standard deviations and variances and estimated region for the location of the true mean at 95% confidence
interval mean and presented in the sections that follow.

Proceeding of the 3rd International Conference on Education, Vol. 3, 2017, pp. 64-76
70
Table 2: comparison of academic achievement in electricity and magnetism based on the learning style
preferences of the grade 11 physical sciences learners
The Table 2 shows that, the mean for academic achievement scores of grade 11 active/reflective learners were 63.5 and 65.4 respectively. The Table 2 also shows that at 95%confidence interval, the lower and upper bound
for the true mean of academic achievement was 61.66 and 65.27 for active learners and 62.78 and 68.04 for
reflective learners. This suggests that the probability of finding the location of the true score at 95 percent
confidence interval for both active and reflective learners was within a similar region of distribution of their
academic achievement scores. Furthermore, the Table 2 shows that the measure of standard deviation for the
spread of academic achievement scores for active learners was 10.27 and reflective learners were 11.66. This
measure of standard deviation indicates that the distribution of scores was nearly the same for both active and
reflective learners.
Similarly, the mean for academic achievement scores of sensing learners were 64.2 and intuitive learners were
64.2. At 95% confidence interval, the lower and upper bound of the true mean of measures of academic
achievement score was 62.52 and 65.90 for sensing learners, and 61.56 and 65.06 for intuitive learners and the
measure of standard deviation for the distribution of academic achievement scores was 11.22 for sensing
learners and 8.71 for intuitive learners. This further suggests that the distribution of academic achievement
scores of sensing learners were relatively more dispersed than academic achievement scores of intuitive learners.
Moreover, the mean of academic achievement scores was 63.3 for visual learners and 66.1 for verbal learners. In
addition, the Table 2 shows that, at 95 percent confidence interval, the lower and upper bound for the true mean
of academic achievement scores of visual learners was 61.56 and 65.06 respectively and verbal learners was 63.29 and 68.95. This means that the probability of finding the location of the true score at 95% confidence
interval for both visual and verbal learners was almost within same region of distribution of scores. Moreover,
the Table 2 shows that the measures of standard deviation of the distribution of academic achievement scores
were 10.46 for visual learners and 11.42 for verbal learners. This demonstrates that the distribution of academic
achievement for both visual and verbal learners were comparable.

Sakyiwaa Danso and Emmanuel Mushayikwa/Exploring Students’ Academic Achievements in Electricity and Magnetism
Through Learning Styles and Learning Style-Based Instructional Strategies in …
71
Furthermore, the mean of academic achievement scores was 64.1 for sequential learners and 64.5 for global learners. In addition, at 95 percent confidence interval, the lower and upper bound for the true mean of academic
achievement scores of sequential learners were 62.36 and 65.83 and global learners were 61.48 and 67.43. This
means that the probability of finding the location of the true score at 95 percent confidence interval for both
sequential and global learners was almost within same region of distribution of scores. Moreover, the result
shows that the measures of standard deviation about the distribution of academic achievement scores were 10.53
for sequential learners and 11.61 for global learners. This demonstrates that the distribution of academic
achievement for both sequential and global learners were approximately comparable.
Table 2 illustrates that there was no statistically significant difference between learners‟ academic achievement
scores and any of the dimensions of learning style preferences among grade 11 physical science learners.
Combined Effect and Relative Contribution of the Learning styles on Academic Achievement
Table 3: Combined effect of learning style categories on academic achievement
The combination of the four learning style dimensions accounted for 2.1% of the variance (R2: 0.021; p: 0.365).
Table 3 therefore suggests that statistically the four learning style dimensions combined do not contribute
significantly to the academic achievement of the grade 11 learners in electricity and magnetism at the four high
schools.
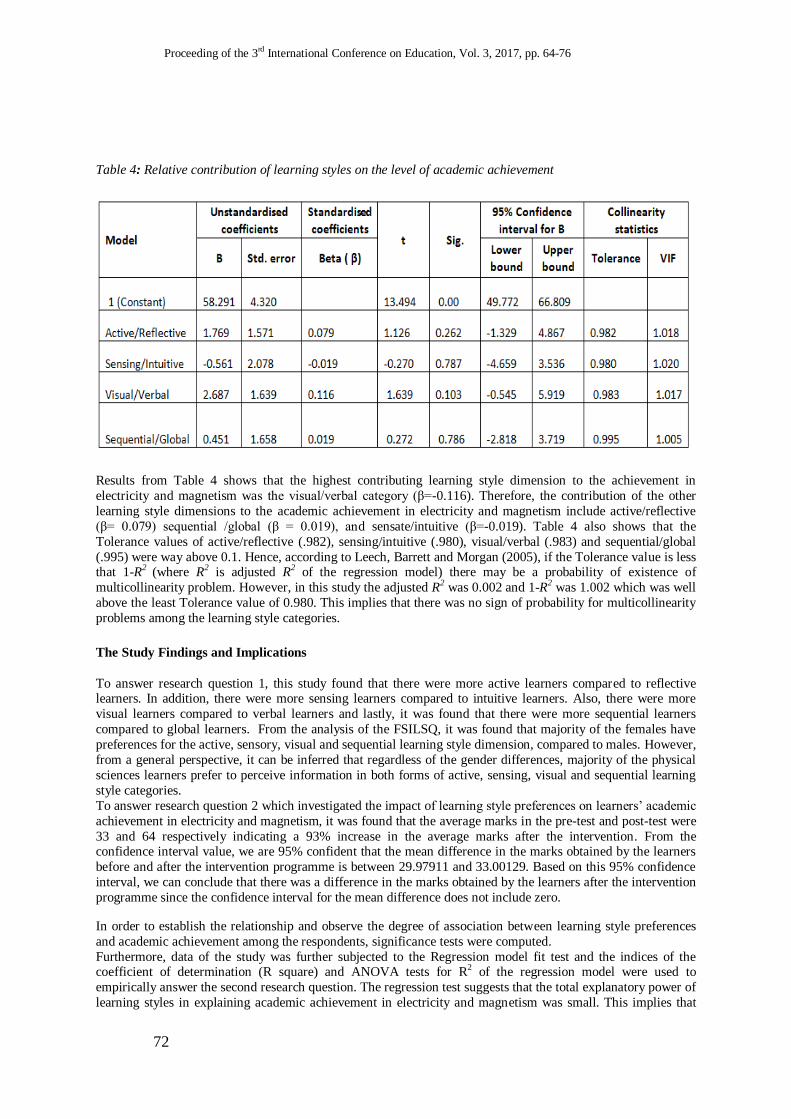
Proceeding of the 3rd International Conference on Education, Vol. 3, 2017, pp. 64-76
72
Table 4: Relative contribution of learning styles on the level of academic achievement
Results from Table 4 shows that the highest contributing learning style dimension to the achievement in
electricity and magnetism was the visual/verbal category (β=-0.116). Therefore, the contribution of the other
learning style dimensions to the academic achievement in electricity and magnetism include active/reflective
(β= 0.079) sequential /global (β = 0.019), and sensate/intuitive (β=-0.019). Table 4 also shows that the
Tolerance values of active/reflective (.982), sensing/intuitive (.980), visual/verbal (.983) and sequential/global
(.995) were way above 0.1. Hence, according to Leech, Barrett and Morgan (2005), if the Tolerance value is less that 1-R2 (where R2 is adjusted R2 of the regression model) there may be a probability of existence of
multicollinearity problem. However, in this study the adjusted R2 was 0.002 and 1-R2 was 1.002 which was well
above the least Tolerance value of 0.980. This implies that there was no sign of probability for multicollinearity
problems among the learning style categories.
The Study Findings and Implications
To answer research question 1, this study found that there were more active learners compared to reflective learners. In addition, there were more sensing learners compared to intuitive learners. Also, there were more
visual learners compared to verbal learners and lastly, it was found that there were more sequential learners
compared to global learners. From the analysis of the FSILSQ, it was found that majority of the females have
preferences for the active, sensory, visual and sequential learning style dimension, compared to males. However,
from a general perspective, it can be inferred that regardless of the gender differences, majority of the physical
sciences learners prefer to perceive information in both forms of active, sensing, visual and sequential learning
style categories.
To answer research question 2 which investigated the impact of learning style preferences on learners‟ academic
achievement in electricity and magnetism, it was found that the average marks in the pre-test and post-test were
33 and 64 respectively indicating a 93% increase in the average marks after the intervention. From the confidence interval value, we are 95% confident that the mean difference in the marks obtained by the learners
before and after the intervention programme is between 29.97911 and 33.00129. Based on this 95% confidence
interval, we can conclude that there was a difference in the marks obtained by the learners after the intervention
programme since the confidence interval for the mean difference does not include zero.
In order to establish the relationship and observe the degree of association between learning style preferences
and academic achievement among the respondents, significance tests were computed.
Furthermore, data of the study was further subjected to the Regression model fit test and the indices of the coefficient of determination (R square) and ANOVA tests for R2 of the regression model were used to
empirically answer the second research question. The regression test suggests that the total explanatory power of
learning styles in explaining academic achievement in electricity and magnetism was small. This implies that

Sakyiwaa Danso and Emmanuel Mushayikwa/Exploring Students’ Academic Achievements in Electricity and Magnetism
Through Learning Styles and Learning Style-Based Instructional Strategies in …
73
there were other important instructional variables which could explain academic achievement than learning
styles can do. In addition, the ANOVA model of Sensing/Intuitive, Visual/Verbal, Active/Reflective and
Sequential/Global failed to significantly predict academic achievement of the PSAT, F (4, 200) = 1.085,
p=0.365. The outputs of the regression test showed that the prediction of grade 11 science learners (F (4, 200) =
1.085, p=0.365) academic achievement in electricity and magnetism from the linear combination of learning
styles was not statistically significant. Therefore, the regression model has failed to demonstrate statistically
significant prediction of variations in academic achievement from the different learning style preferences. Thus,
statistically, the four learning style categories combined do not contribute significantly to the academic achievement of the grade 11 learners in electricity and magnetism at the four high schools in Mthatha.
In concluding the quantitative phase of the study, the researchers posit that there was not a particular learning
style preference that helped learners to be successful in learning the concept “electricity and magnetism”
considered in this study. Moreover, the empirical data of the quantitative part of the study failed to suggest a
learning style model specific for physical science education, but learning styles can be used to identify trends of
learning style preferences among learners to improve instructional strategies adopted by physical science
teachers to improve learner achievement in the subject.
The findings of this study therefore, have implications for teacher development and learner achievements. It is
of vital importance that science teachers are exposed to varied instructional approaches of which they could
implement in their science classrooms to accommodate learners with different learning style preferences to
enhance learner achievement in the subject.
Limitation and Future Research
This study utilised a small sample size of 205 learners from a large population of physical science high school
learners across South Africa and that can hinder the generalisation of the results. Limited studies in this field
have been done in South Africa. Therefore, there is a great scope of research in the field of science education
and in the broader field of education in general. The quantitative design utilised in this study could identify
prevailing learning style preferences and their correlations with academic achievements, ignoring other aspects
of learning that might hinder learner achievement. A mixed methods design could be utilised to create a healthy
debate to get learners perceptions and conceptions about learning styles and learning style-based instructions in
order to investigate the interactions and interrelationships between the main variables of the study.
Recommendations
It is recommended that more research should be done with the focus on learning style preferences and learner achievement among high school learners, taking other variables like cultural influence on learning style into
consideration. This would provide substantial evidence about the role learning style-based instructions play in
learner achievement in physical sciences. Furthermore, a necessity for studies interrogating learners‟ learning
styles and teachers‟ instructional strategies and how these can be adjusted in order to increase learner
achievement in physical science. Further studies could consider the issue of gender, race, and ethnicity in
relation to learning style preferences and academic achievements among high school science learners.
References
Adkins, D. and Guerreiro, M., 2017. Learning styles: Considerations for technology enhanced item design.
British Journal of Educational Technology.
Akinbobola, A. O., 2015. Effects of learning styles and instructional strategies on students‟ achievement in
Nigerian senior secondary school physics. Advances in Physics Theories and Applications, 41(1).
Akkoyunnlu, B., and Yilmaz, S., 2009. “The effect of learning styles on achievement in different learning
environment”. TOJET: The Turkish Online Journal of Educational Technology, 8(4). Retrieved from:
http://www.search.proquest.com.
Cassidy, S., 2004. Learning styles: An overview of theories, models, and measures. Educational Psychology. An
International Journal of Experimental Educational Psychology.24 (1), 419-444.
Chabay, R., and Sherwood, B., 2006. Restructuring the introductory electricity and magnetism course. American
Journal of Physics, 74(4), 329-336.

Proceeding of the 3rd International Conference on Education, Vol. 3, 2017, pp. 64-76
74
Chambers, S.K., and Andre, T., 1995. Are conceptual change approaches to learning science effective for
everyone? Gender, prior subject matter interest and learning about electricity. Contemporary educational
psychology, 20 (4), pp. 377 – 391.
Chinn, C. A., and Samarapungavan, A. L. A., 2009. Conceptual change - multiple routes, multiple mechanisms:
A commentary on Ohlsson (2009). Educational Psychologist, 44(1), 48-57.
Claxton, C.S., 1990. Learning styles, minority stu dents and effective Education. Journal of Developmental Education, 14 (1), 6.
Coffield, F., Moseley, D., Hall, E., and Ecclestone, K., 2004. Learning styles and Pedagogy in post 16 learning:
A systematic and critical review. The Learning and Skills Research Centre: London.
Cuevas, J., 2015. Is learning styles-based instruction effective? A comprehensive analysis of recent research on
learning styles. Theory and research in Education, 13(3), pp.308-333
Curry, L., 1983. An Organization of Learning Styles Theory and Constructs.
Cuthbert, P.F., 2005. The student learning process: learning styles or learning approaches. Teaching in Higher
Education, 10(2), pp.235-249.
Department of Education. (2011). National Curriculum Statement Grades R - 12: Curriculum and Assessment
Policy (CAPS) Physical Sciences. Pretoria: Department of Education. South Africa.
Dunn, R. S., and Dunn, K. J., 1993. Teaching secondary students through their individual learning styles:
Practical approaches for grades 7-12. Prentice Hall.
Felder, R.M., 1988, October. How students learn: Adapting teaching styles to learning styles. In Frontiers in
Education Conference, 1988., Proceedings (pp. 489-493). IEEE.
Felder, R.M. and Henriques, E.R., 1995. Learning and teaching styles in foreign and second language
education. Foreign language annals, 28(1), pp.21-31.
Felder, R. M., and Silverman, L. K., 1988. Learning and teaching styles in engineering education. Engineering
Education, 78(7), 674-681.
Felder, R. M., and Spurlin, J., 2005. Applications, reliability and validity of the index of learning styles.
International journal of engineering education, 21(1), 103-112.
Furio, C. and Guisasola, J., 1998. Difficulties in learning the concept of electric field. Science Education, 82(4),
pp.511-526.
Gakhar, M.,2006. A study of academic achievement as determined by their preferred learning, thinking styles and study skills. Psycho Lingua, 36(2).
Gonzales, L.K., Glaser, D., Howland, L., Clark, M.J., Hutchins, S., Macauley, K., Close, J.F., Leveque, N.L.,
Failla, K.R., Brooks, R. and Ward, J., 2017. Assessing Learning Styles of Graduate Entry Nursing Students as a
Classroom Research Activity: A quantitative research study. Nurse Education Today, 48, pp.55-61.
Gordon, D., and Bull, G., 2004. The Nexus explored: A generalised model of learning styles. SITE 2004,
Atlanta, Georgia, USA, March.
Grasha, A. F., and Riechmann. S. W. 1975. Student learning styles questionnaire. University of Cincinatti,
Faculty Resource Center, Cincinatti, OH.
Guild, P., 1994. The Culture/Learning Style Connection. Educational Leadership, 51(2), 16-21.
Hewson, M. G., 1988. The ecological context of knowledge: implications for learning science in developing
countries. Journal of Curriculum Studies, 20, 317–326.
Sakyiwaa Danso and Emmanuel Mushayikwa/Exploring Students’ Academic Achievements in Electricity and Magnetism
Through Learning Styles and Learning Style-Based Instructional Strategies in …
75
Holbrook, J., 2011. Enhancing scientific and technological literacy (STL): A major focus for science teaching at
school. Journal of Science. Teach. Assoc. Niger, 46(1):9-34.
Jahanbakhsh, R., 2012. Learning styles and academic achievement: A case study of Iranian high school girls‟
students. Procedia-Social and Behavioural Sciences, 51, 1030-1034.
Kanninen, E., 2008. Learning styles and e-learning. Master of Science Thesis, Tampere University of
Technology.
Keefe, J. W., 1979. Learning style: An Overview. In Keefe, J W (Eds.) Student Learning Styles: Diagnosing and
prescribing programs, NASSP, Reston.
Kolb, D.A., 1984. Experiential learning: Experience as the source of learning and development. Englewood
Cliffs, NJ: Prentice Hall.
Kulkarni, C., and Klemmer, S.R., 2012. Learning design wisdom by augmenting physical studio critique with
online self-assessment. Technical report, Stanford University.
Larkin-Hein, T., 2000. Learning styles in introductory physics: Enhancing student motivation, interest and
learning. Paper presented at the international Conference on Engineering and Computer Education. August
2000. Sao Paolo, Brazil (pp. 1-6).
Leech, N. L., Barrett, K. C., and Morgan, G. A., 2005. SPSS for intermediate statistics: Use and interpretation
(2 ed.). Mahwah, New Jersey: Lawrence Erlbaum Associates, Inc.
Mashile, E.O., 2001. Science achievement determinants: factorial structure of family variables. South African
Journal of Education, 21(4), pp.336-338.
Mayer, R.E., 2011. Does styles research have useful implication for educational practice? Learning and individual Differences, 21 (3), 319 -320.
McFarlane, D. A., 2013. Understanding the challenges of science education in the 21st century: New
opportunities for scientific literacy. International Letters of Social and Humanistic Sciences, 4(1), 35-44.
Mji, A., and Makgato, M., 2006. Factors associated with high school learners' poor performance: a spotlight on
mathematics and physical science. South African Journal of Education, 26(2), 253-266.
Pashler, H., McDaniel, M., Rohrer, D., and Bjork, R., 2009. Learning styles: Concepts and evidence.
Psychological Science in the Public Interest 9(3): 105–119.
Rezler, A. G., 2013. Learning Preference Inventory. Journal of Clinical Reasoning & Procedural Competency,
1(1), 31-47.
Schmeck, R. R., Ribich, F., and Ramanaiah, N., 1977. Development of a self-report inventory for assessing
individual differences in learning processes. Applied Psychological Measurement, 1(3), 413-431.
Schmeck, R. R. (Ed.), 2013. Learning strategies and learning styles. Springer Science & Business Media.
Singh, L., Govil, P., and Rani, R., 2015. Learning Style Preferences among Secondary School Students.
International Journal of Recent Scientific Research, 6(5), 3924-3928.
Taber, K.S., 2009. Learning from experience and teaching by example: reflecting upon personal learning
experience to inform teaching practice. Journal of Cambridge Studies, 4 (1), 82-9.
Udo, M. E., and Udofia T, M., 2014. Effects of mastering learning strategy on students‟ achievement in
symbols, formulae and equations in chemistry. Journal of Educational Research and Reviews, 2(3), 28-35
Vita, G. D., 2001. Learning styles, culture and inclusive instruction in the multicultural classroom: A business
and management perspective. Innovations in Education and Teaching International, 38(2), 165-174.

Proceeding of the 3rd International Conference on Education, Vol. 3, 2017, pp. 64-76
76
Zakaria, E., and Iksan, Z., 2007. Promoting cooperative learning in science and mathematics education: A
Malaysian perspective. Online Submission, 3(1), 35-39.
Zywno, M.S., and Waalen, J.K., 2002. The effect of individual learning styles on students‟ outcomes in
technology-enabled education. Global Journal of Engineering Education, 6(1), 1-10.
Proceeding of the 3rd International Conference on Education, Vol. 3, 2017, pp. 77-90 Copyright © 2017 TIIKM ISSN 2424 - 6700 online DOI: https://doi.org/10.17501/icedu.2017.3109
3rd International Conference on Education, 20-22 April 2017, Kuala Lumpur, Malaysia
TEACHING STRATEGIES TO RAISE AWARENESS OF
NON-COMMUNICABLE DISEASES IN SECONDARY
SCHOOLS IN BRUNEI DARUSSALAM
Noormah Azrayati Haji Mohammad Noor and Jainatul Halida Jaidin
Sekolah Menengah Berakas, Ministry of Education, Brunei Darussalam, Brunei
Sultan Hassanal Bolkiah Institute of Education, Universiti Brunei Darussalam, Brunei
Abstract: To date, non-communicable diseases (NCDs) remain the leading cause of disability and
death in most countries, including Brunei Darussalam. As such, various strategies to improve health
literacy have been introduced and carried out by both government and non-government agencies
throughout the country. One of the on-going strategies is to raise awareness of NCDs among
secondary school students through a subject called Food and Nutrition. This paper documents the
teaching strategies used by five exemplary Food and Nutrition (FN) teachers in Brunei Darussalam.
The aims of this study were to analyse and identify strategies as well as techniques that teachers
could use to help students practice healthy lifestyle behaviours. A discussion on the extent to which
these teaching strategies were effective in delivering important messages about NCDs is also
presented. This study adopted a qualitative approach to research, wherein data were collected mainly
through a series of lesson observations. In addition, analysis of teachers’ lesson plans and students’
work were used to obtain richer data. A total of five FN teachers and twenty-five students
participated in the study. Overall, all teachers in the study preferred to use teacher-centred teaching
strategies and very few teachers made the effort to incorporate student-centred teaching strategies in
their lessons. However, it was found that the students were more engaged in lessons that provided
opportunities for experiential and collaborative learning. The study makes a strong recommendation
for student-centred teaching strategies in promoting healthy lifestyle behaviours among secondary
school students. The findings of this study are useful to FN teachers, researchers and policy-makers.
The findings serve as precursors to further research and decision-making.
Keywords: Food and Nutrition, Non-Communicable Diseases, Secondary Schools, Teaching
Strategies
Introduction
In Brunei Darussalam’s education system, Food and Nutrition (FN) is offered as an option subject under a
broader subject area called the Technology Learning Area. FN is offered to Year 9, Year 10, and Year 11
students undergoing the General Science Programme, General Programme, and Applied Programme (Ministry
of Education, 2013). Lack of knowledge on nutrition and good dietary habits, as well as lack of physical
activity could prompt non-communicable diseases (NCDs).
NCDs are the main cause of death and disabilties in most countries around the world (Hawkes, 2013). Factors
such as high blood pressure, high concentrations of serum cholesterol, tobacco smoking, unhealthy eating
habits, overweight or obesity, and physical inactivity were found to be the main risk factors of NCDs (Musaiger
& Al-Hazzaa, 2012). Al-Nohair (2014) stated that factors such as international fast food chains, easy access to
cars, increased popularity of processed food, and lack of exercise had contributed to dramatic increase in obesity
in Gulf countries. Similarly, Brunei is not an exception. The rapid development of fast-food outlets and
increased sedentary lifestyles had also shown adverse impact on most Bruneians especially among children and
adolescents. According to Brunei Darussalam’s Ministry of Health (2013), it was estimated that in 2012, 50.8%
males and 54.4% females died prematurely due to NCDs. In 2008, 48.8% males and 38.3% females died
Corresponding Author: Noormah Azrayati Haji Mohammad Noor/ [email protected]

Noormah Azrayati Haji Mohammad Noor and Jainatul Halida Jaidin / Teaching Strategies To Raise Awareness of Non-Communicable Diseases in Secondary Schools in Brunei Darussalam
78
prematurely from NCDs (Ministry of Health, 2013). These data suggest a significant increase in the number of
deaths caused by NCDs. The top five leading causes of deaths according to a document on The Leading Causes
of Deaths in Brunei (2008-2012) were cancers, heart diseases including acute rheumatic fever, diabetes mellitus,
cerebrovascular diseases, chronic bronchitis and unspecified emphysema and asthma.
The Knowledge Convention Report (2012) highlighted that, 12.3% of Bruneian students were obese in 2008.
The statistic increased in 2010 by 1.2%. In another study in 2011 involving 30,000 students, the issue of obesity
among Bruneian school children was also highlighted. It was found that 30% of the participants were
overweight, which was an increase of 1.7% from the previous year. The increase in the number of overweight
and obese children is indeed a major concern, because in small countries like Brunei Darussalam, 10%
represents a significant proportion of the total population. Moreover, research has found that obesity at a young
age is likely to persist into adulthood, which could lead to other chronic diseases (Güngör, 2014).
It is therefore important to raise awareness of factors leading to NCDs through education. Researchers such as
Carraway-Stage, Henson, Dipper, Spangler, Ash, and Goodell (2014) argue that education through nutrition
teaches students to make healthier choices of food, food preparation and safety. These researchers also found
that in order to properly scaffold the teaching and learning of FN in schools, a number of aspects need to be
taken into consideration, such as the teachers’ competencies, time and resources available. Teaching nutrition
using suitable and effective strategies can produce long term benefits to an individual and the population in
general. According to Tull (1996), FN is the study of nutrients and their relationships with food and living
things. The term nutrition refers to the study of food and its relation to health. Researchers such as Ball, Hughes
and Leverin (2010) define nutrition as a foundation for basic treatment, health care, and health information in
the 21st Century. The definition is similar to those outlined by the National Public Health Partnership (2001),
Strategic Inter-Governmental Nutrition Alliance (2001) and World Health Organisation (2003). Knowing about
nutrition or nutrition education plays a critical part in promoting health throughout life, particularly in
preventing and managing chronic diseases.
The FN curriculum in Brunei Darussalam’s education system seeks to address challenging issues such as
unhealthy diets, processed food, physical inactivity, and promote healthy lifestyle behaviours that include
making the right food choices and planning meals. It is hoped that the topics taught in FN would educate and
encourage students to lead a healthier lifestyle, and ultimately, reduce the major risk factors for NCDs. It is also
important to note that healthy living requires a permanent lifestyle change and successful lifestyle change needs
to start as early in life as possible. Researchers such as Denman (1999), Drummond (2010), and Singura (2013)
suggest that, schools and classrooms are the best learning environments to begin long-term behavior change as
students spend most of their time in schools. For example, students in Brunei Darussalam spend between six to
nine hours (this includes attending religious classes in the afternoon) a day in schools. Equally significant in
long-term behavior change is the strategies used by teachers to raise awareness of NCDs and introduce the
benefits of practicing healthy lifestyle behaviours (Sovyanhadi & Cort, 2004). Accordingly, it is important to
observe, record and analyse the kinds of teaching strategies FN teachers use to discuss nutrition and practice
healthy lifestyle behaviours. Such analysis will serve as a baseline data for further investigations on effective
teaching strategies for FN, and in so doing, creates a resource bank of FN teaching strategies.
This paper outlines various strategies and techniques used by a group of five exemplary FN teachers in Brunei
Darussalam. The aim is to provide an insight into ways in which curricular modifications can be made to
address issues pertaining to NCDs. For example, findings of this study could suggest the implementation of
practical strategies to counter NCDs in a systemic manner. However, the findings of this study are not intended
for generalization. Rather, the findings are aimed at providing insights into various strategies used by FN
teachers in raising awareness of NCDs among secondary school students.

Proceeding of the 3rd International Conference on Education, Vol. 3, 2017, pp. 77-90
79
Defining Non-Communicable Diseases (NCDs)
NCDs refer to chronic diseases that could not be transferred from one individual to another, and these diseases
typically progress slowly over a long period of time. The main types of NCDs include cardiovascular diseases
(such as heart attack and stroke, cancers, chronic respiratory diseases and diabetes. These diseases are caused by
a number of factors that includes ageing, fast and unplanned urbanisation, and the globalisation of unhealthy
lifestyles (World Health Organisation, 2015). All age groups including children, adults, and the elderly around
the world are vulnerable to the risk factors that contribute to NCDs.
Effective preventive and control strategies are vital to combat the incidence of NCDs. Managing these diseases
requires a lot of funding due to expensive costs of diagnosis and treatment. Brunei Darussalam’s Ministry of
Health (2014) stated that the nation is genuinely concerned with issues pertaining to NCDs, because these issues
had placed a significant burden on the nation’s socio economic development. As a result, the Brunei Darussalam
National Multi-Sectoral Action Plan for the Prevention and Control of NCDs (BruMAP-NCD 2013-2018) was
launched in September 2013. This is an important step in enforcing relevant measures throughout the country.
All of these measures are aimed at reducing the rate of premature death caused by NCDs with a target rate of
18% by 2018. In order to achieve the target rate, six (6) key areas were identified and implemented such as: (i)
to reduce tobacco use; (ii) promoting healthy and balanced diets; (iii) increase physical activities; (iv)
identifying and managing people at risk with NCDs; (v) and finally, enhancing quality of care and managing
outcome of NCDs (Piri, 2014). This paper focuses on the second area, namely, promoting healthy and balanced
diets through education. Early introduction to healthy eating habits and food preferences, particularly in school,
would improve long-term eating pattern and promote healthy lifestyle behaviours. Raising awareness among
specific target groups in society, specifically the youth, students, senior citizens and people with NCDs,
therefore, is very important. Nevertheless, effective preventive and control strategies require a holistic,
incorporated, and multilevel method, warranting strong and sustained commitment and actions from all division
to address NCDs (Ismail & Koh, 2014).
Methodology
This study adopted a qualitative approach to research. Data were collected and triangulated consistently through
observations, informal interviews and analysis of teachers’ lesson plans as well as students’ work. The first
author of this paper conducted the research in all five participating schools. In this paper, findings obtained
from lesson observations are reported to illustrate the kind of teaching strategies used by the participants to raise
awareness of NCDs in all research sites.
Lesson observation was the main instrument for collecting data in the study. Nevertheless, the authors of this
paper took note that further methodological improvements could have been made to the research design of the
study. For example, to include a stratified testing sample (such as distributing survey questionnaires to teachers
and / or students to assess the necessity of amending curricular setup to yield desired output) as a source of
concrete assessment.
Lesson observations were carried out from May 2015 to August 2015, aimed at investigating teaching strategies
used by FN teachers to raise awareness of NCDs among secondary school students. At least three lesson
observations per class for each participating teacher in the study. During each lesson observation, field notes on
the teachers’ and students’ activities were taken. Several aspects of teaching and learning were noted during
lesson observations, and these include aspects such as: (i) the frequency of questionings (taking into
consideration the type of questions asked, for example, lower-order or higher-order questions based on Bloom’s
Taxonomy) on NCDs; (ii) the students’ correct answers; (iii) on task discussions on NCDs; (iv) inclusion of
activities such as project work, pictorial, videos, and others by incorporating 21st century skills (as outlined in
the 21CLD rubrics); and finally, (v) checking for signs of students’ motivation, understanding and engagement
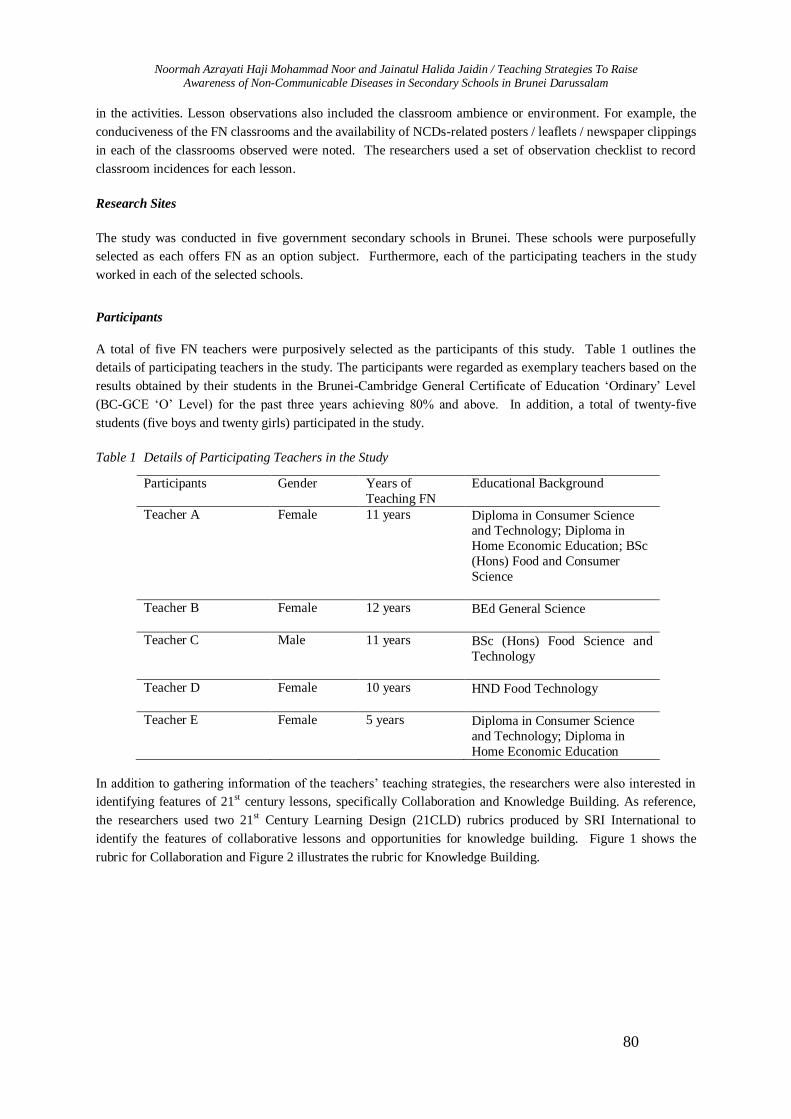
Noormah Azrayati Haji Mohammad Noor and Jainatul Halida Jaidin / Teaching Strategies To Raise Awareness of Non-Communicable Diseases in Secondary Schools in Brunei Darussalam
80
in the activities. Lesson observations also included the classroom ambience or environment. For example, the
conduciveness of the FN classrooms and the availability of NCDs-related posters / leaflets / newspaper clippings
in each of the classrooms observed were noted. The researchers used a set of observation checklist to record
classroom incidences for each lesson.
Research Sites
The study was conducted in five government secondary schools in Brunei. These schools were purposefully
selected as each offers FN as an option subject. Furthermore, each of the participating teachers in the study
worked in each of the selected schools.
Participants
A total of five FN teachers were purposively selected as the participants of this study. Table 1 outlines the
details of participating teachers in the study. The participants were regarded as exemplary teachers based on the
results obtained by their students in the Brunei-Cambridge General Certificate of Education ‘Ordinary’ Level
(BC-GCE ‘O’ Level) for the past three years achieving 80% and above. In addition, a total of twenty-five
students (five boys and twenty girls) participated in the study.
Table 1 Details of Participating Teachers in the Study
Participants Gender Years of
Teaching FN
Educational Background
Teacher A
Female 11 years Diploma in Consumer Science and Technology; Diploma in
Home Economic Education; BSc
(Hons) Food and Consumer
Science
Teacher B Female 12 years BEd General Science
Teacher C Male 11 years BSc (Hons) Food Science and
Technology
Teacher D Female 10 years HND Food Technology
Teacher E
Female 5 years Diploma in Consumer Science
and Technology; Diploma in
Home Economic Education
In addition to gathering information of the teachers’ teaching strategies, the researchers were also interested in
identifying features of 21st century lessons, specifically Collaboration and Knowledge Building. As reference,
the researchers used two 21st Century Learning Design (21CLD) rubrics produced by SRI International to
identify the features of collaborative lessons and opportunities for knowledge building. Figure 1 shows the
rubric for Collaboration and Figure 2 illustrates the rubric for Knowledge Building.

Proceeding of the 3rd International Conference on Education, Vol. 3, 2017, pp. 77-90
81
Figure 1. 21CLD Rubric for Collaboration
Figure 2. 21CLD Rubric for Knowledge Construction

Noormah Azrayati Haji Mohammad Noor and Jainatul Halida Jaidin / Teaching Strategies To Raise Awareness of Non-Communicable Diseases in Secondary Schools in Brunei Darussalam
82
Results and Discussion
There were generally two categories of teaching strategies used by FN teachers in the study. These teaching
strategies were categorized into: (i) traditional teacher-centred; and (ii) student-centred teaching strategies. All
FN teachers in the study used traditional teacher-centred teaching strategies to teach proper dietary intake to
prevent NCDs. All participating teachers were aware of student-centred teaching strategies and most of them
made efforts to incorporate these strategies in their lessons, except one teacher. Table 2 outlines the teaching
strategies used by the teachers in further detail.
Table 2 The Different Teaching Strategies Used By FN Teachers
Teacher No. of students Total
no. of
students
Teaching Strategies
Boys Girls Traditional
Teacher-Centred
Student-Centred
A 2 4 6 Lecture and Note
Reading
Observation
Experiential Learning
Collaborative Learning
Discussion using audio-
visual
B 0 4 4 Lecture and Note Reading
None
C 2 4 6 Lecture by Note Reading
Observation
Experiential and Inquiry-
Based Learning
Collaborative Learning
D 0 6 6 Lecture by Note Reading
Observation
Experiential Learning
Collaborative Learning
E 1 2 3 Lecture by Note Reading
Observation
Inquiry-Based Learning
Each of the teaching strategies is discussed next. The discussion will start with traditional teacher-centred
strategies followed by those categorized as student-centred strategies. Based on the first author’s observation,
all participating teachers delivered lectures and provided students with a lot of information through typed notes
using Microsoft Word or Microsoft Power-point presentations. The first author also noted frequent ‘simple
question and answer’ sessions during lectures. The term ‘simple question and answer’ here means, that the
teacher merely asked students to highlight keywords in their handouts and write extra notes on a piece of paper.
In addition to using handouts or notes during lectures, the first author noted other techniques such as mind-maps
or concept mapping. For example, Teacher C used mind-maps to illustrate key concepts during a lecture. As
shown in Figure 3, Teacher C used mind-mapping technique to create a visual diagram that represented all of
the interrelated factors leading to NCDs.

Proceeding of the 3rd International Conference on Education, Vol. 3, 2017, pp. 77-90
83
Figure 3. Mind-mapping done by Teacher C during Lecture
It was observed that most of the students paid attention to their teachers’ lectures. The students actively posed
questions comprising mainly lower-order questions during lectures. Some examples of these questions include:
“What happens when people drink Coke?” “What are the symptoms of a person having hypertension?”. It was
also noted that most teachers in the study started their questions with how (describe), what and why, and these
questions could be categorized as remembering, understanding and applying respectively (in the three lowest
levels of Bloom’s taxonomy). Some examples of these questions include: “What can we do to prevent CHD?”
“In what ways do we reduce fats / lipids intake in our diet?” “Why do we need to cut down salt in cooking or
foods?” “Give examples of what Bruneians like to eat nowadays.”
Only two teachers made efforts to use experiential learning in their lessons. Teacher A introduced the use of an
electronic sphygmomanometer to measure blood pressure and heart beat in one of her activities. She prepared a
set of questions for the ‘measuring blood pressure and heart beat’ activity and the students were divided into two
groups to answer the questions. This activity encouraged the students to work collaboratively with each other.
Figure 4 shows the worksheet that the students completed during this lesson.

Noormah Azrayati Haji Mohammad Noor and Jainatul Halida Jaidin / Teaching Strategies To Raise Awareness of Non-Communicable Diseases in Secondary Schools in Brunei Darussalam
84
Figure 4. Measuring Blood Pressure and Heart Beat Activity Sheet
Through this activity, students had the opportunity to use actual sphygmomanometer and learned about high
blood pressure (also known as hypertension) in depth. In doing so, students were able to relate systolic and
diastolic measurements to the definition of hypertension.
In another FN lesson, Teacher D provided an opportunity for the students to apply what they have learned about
reducing the amount of fat and salt in our food by making a healthy egg sandwich. Teacher D commenced the
lesson by reminding students about rules and regulations (pertaining to hygiene and safety) that we need to keep
in mind before preparing our food in the kitchen such as wearing clean apron, keeping short fingernails and
washing hands regularly. Then, Teacher D introduced the healthier choice of ingredients to students, which
included wholemeal bread, low fat mayonnaise, less salt, boiled eggs, avocado, spring onions, and two other
types of vegetables. Next, Teacher D proceeded with the preparation of sandwich by mashing the boiled eggs,
slicing the vegetables, mixing the mayonnaise aith a little bit of salt. While preparing the ingredients, Teacher D
carried out a simple question and answer session on reasons for and the benefits of reducing the intake of fat and
salt in our food. After demonstrating the process of making a healthy sandwich, Teacher D instructed the
students to make their own version of a healthy egg sandwich. Teacher D encouraged the students to be creative
with their recipes.
Another example of teaching strategy that could be categorized as student-centred was the use of inquiry-based
learning where the teacher asked students to conduct online research on Dietary Recommendations and present
their findings to the class. A teacher in School C used this strategy to encourage the students become
independent learners and work collaboratively to attain the learning goal. The students were divided into two
groups and each group came up with their own research and presentation strategies. As a result of this activity,
each group produced Power-point slides for their respective presentations to the class. Figure 5 illustrates the
Power-point slides produced by one of the groups.

Proceeding of the 3rd International Conference on Education, Vol. 3, 2017, pp. 77-90
85
Figure 5. Presentation Slides by Students from School C
Both groups presented their findings and every member participated during each presentation. The teacher was
very pleased with the students’ efforts and findings, and both groups received positive feedback from the
teacher. Another teacher in another school also made an effort to incorporate inquiry-based learning in her
teaching. Similar to the teacher in School C, Teacher E asked her students to find out about selected NCDs,
specifically: obesity, diabetes and cancer. The students were given a week to complete the task and present their
findings in the next class. Figure 6 shows some of the students’ notes during their research.
Figure 6. Students’ Notes on Selected NCDs
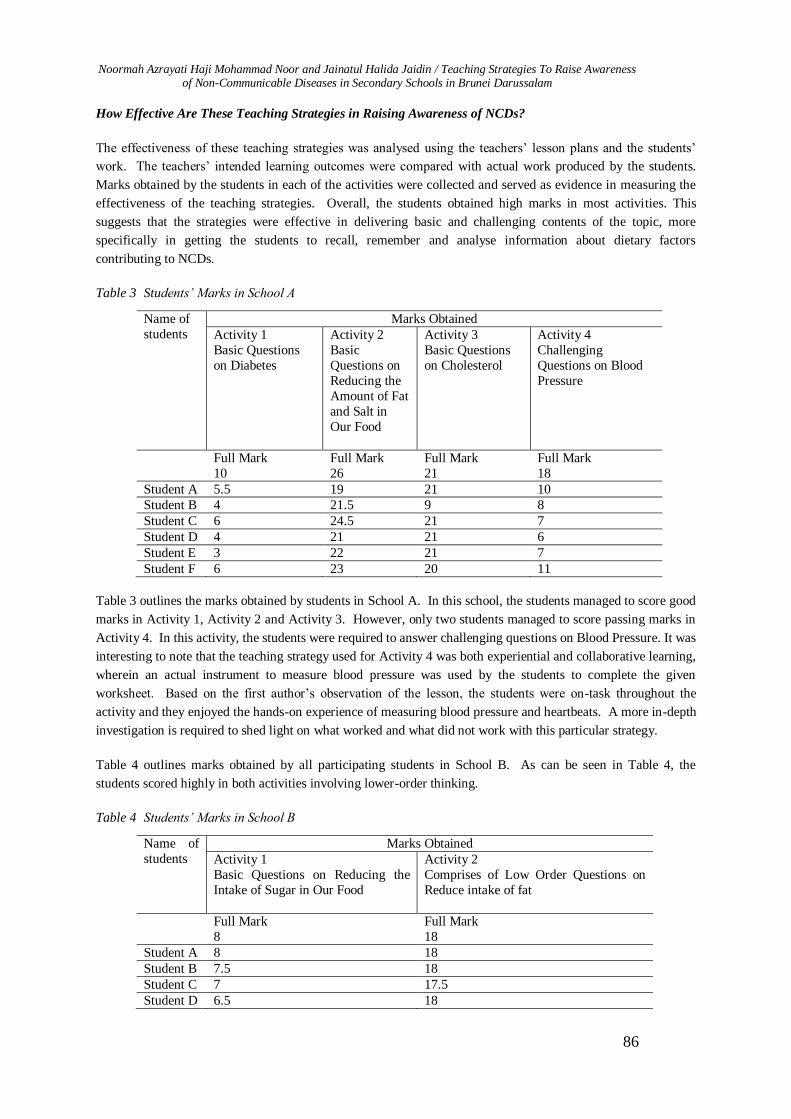
Noormah Azrayati Haji Mohammad Noor and Jainatul Halida Jaidin / Teaching Strategies To Raise Awareness of Non-Communicable Diseases in Secondary Schools in Brunei Darussalam
86
How Effective Are These Teaching Strategies in Raising Awareness of NCDs?
The effectiveness of these teaching strategies was analysed using the teachers’ lesson plans and the students’
work. The teachers’ intended learning outcomes were compared with actual work produced by the students.
Marks obtained by the students in each of the activities were collected and served as evidence in measuring the
effectiveness of the teaching strategies. Overall, the students obtained high marks in most activities. This
suggests that the strategies were effective in delivering basic and challenging contents of the topic, more
specifically in getting the students to recall, remember and analyse information about dietary factors
contributing to NCDs.
Table 3 Students’ Marks in School A
Name of
students
Marks Obtained
Activity 1
Basic Questions
on Diabetes
Activity 2
Basic
Questions on
Reducing the
Amount of Fat
and Salt in
Our Food
Activity 3
Basic Questions
on Cholesterol
Activity 4
Challenging
Questions on Blood
Pressure
Full Mark
10
Full Mark
26
Full Mark
21
Full Mark
18
Student A 5.5 19 21 10
Student B 4 21.5 9 8
Student C 6 24.5 21 7
Student D 4 21 21 6
Student E 3 22 21 7
Student F 6 23 20 11
Table 3 outlines the marks obtained by students in School A. In this school, the students managed to score good
marks in Activity 1, Activity 2 and Activity 3. However, only two students managed to score passing marks in
Activity 4. In this activity, the students were required to answer challenging questions on Blood Pressure. It was
interesting to note that the teaching strategy used for Activity 4 was both experiential and collaborative learning,
wherein an actual instrument to measure blood pressure was used by the students to complete the given
worksheet. Based on the first author’s observation of the lesson, the students were on-task throughout the
activity and they enjoyed the hands-on experience of measuring blood pressure and heartbeats. A more in-depth
investigation is required to shed light on what worked and what did not work with this particular strategy.
Table 4 outlines marks obtained by all participating students in School B. As can be seen in Table 4, the
students scored highly in both activities involving lower-order thinking.
Table 4 Students’ Marks in School B
Name of
students
Marks Obtained
Activity 1
Basic Questions on Reducing the
Intake of Sugar in Our Food
Activity 2
Comprises of Low Order Questions on
Reduce intake of fat
Full Mark
8
Full Mark
18
Student A 8 18
Student B 7.5 18
Student C 7 17.5
Student D 6.5 18

Proceeding of the 3rd International Conference on Education, Vol. 3, 2017, pp. 77-90
87
In School C, all participating students in School C managed to score passing marks in an activity that posed
challenging questions about dietary factors leading to NCDs. Table 5 outlines the students’ marks. In this
activity, the inquiry-based learning strategy helped the students develop a better understanding about Dietary
Recommendations to prevent NCDs.
Table 5 Students’ Marks in School C
Name of students Marks Obtained
Activity 1
Challenging Questions on Reducing the Intake of Fat, Salt and
Sugar (Dietary Recommendations)
Full Marks
20
Student A 15
Student B 18
Student C 15
Student D 15
Student E 18
Student F 18
Based on the first author’s observations, the students worked collaboratively when analysing and evaluating
relevant information for their presentations. They brainstormed, discussed, argued and eventually agreed on a
final set of information and presentation layout.
In School D, all students managed to obtain very good marks for both activities. Table 6 outlines the marks
obtained by the students in this school. Teaching strategies used by the FN teacher in this school were effective
in helping the students understand the benefits of reducing fat, salt and sugar in our diet.
Table 6 Students’ Marks in School D
Name of
students
Marks Obtained
Activity 1
Basic Questions on Reducing the
Intake of Fat, Salt and Sugar
(Dietary Recommendations)
Activity 2
Making a Healthy Egg Sandwich
Full Marks
12
Full Marks
25
Student A 10 20
Student B 11 22
Student C 12 21
Student D 12 22
Student E 11 23
Student F 11.5 23
Figure 7 shows a student’s answer sheet for Activity 1 in School D and this suggests that the teaching strategy
used by the teacher as effective in delivering the lesson.

Noormah Azrayati Haji Mohammad Noor and Jainatul Halida Jaidin / Teaching Strategies To Raise Awareness of Non-Communicable Diseases in Secondary Schools in Brunei Darussalam
88
Figure 7. A Student’s Answer Sheet fro Activity 1 in School D
Table 7 outlines the three activities in School E. All students in this school managed to score good marks in all
activities, except Student A in Activity 3, as the student was absent on that day.
Table 7 Students’ Marks in School E
Name of
students
Marks Obtained
Activity 1 Research – Cancer,
Obesity and Diabetes
Activity 2 Pop Quiz (on selected
NCDs and diet)
Activity 3 Basic Questions on
Tooth Decay and
Reducing Intake of
Sugar
Full Marks
20
Full Marks
15
Full Marks
12
Student A 13 12 ABSENT
Student B 15 12.5 11
Student C 13 11.5 4
Conclusion
The current study presents a variety of teaching strategies used by FN teachers to raise awareness of NCDs
among secondary schools in Brunei Darussalam. The teaching strategies were generally effective in helping
students understand the long-term benefits of lowering the intake of fat, salt and sugar in our diet. However, the
findings of this study also suggest that there is a need for FN teachers to provide more opportunities for the
Noormah Azrayati Haji Mohammad Noor and Jainatul Halida Jaidin / Teaching Strategies To Raise Awareness of Non-Communicable Diseases in Secondary Schools in Brunei Darussalam
89
students to analyse current dietary issues in the country and suggest solutions to address these issues. For
example, FN teachers can start with getting the students to reflect on their own daily dietary intakes and create a
meal plan that is healthier for themselves and the family.
References
Al-Nohair, S. (2014). Obesity in Gulf Countries. International Journal of Health Sciences, 8(1), pp. 79–83.
Ball, L. E., Hughes, R. M., & Leveritt, M. D. (2010). Nutrition in general practice: role and workforce preparation expectations of medical educators, Australian Journal of Primary Health, 16(4), pp. 304-310.
Baumbusch, J. (2010). Semi-structured interviewing in Practice-Close Research. Journal for Specialists in
Pediatric Nursing, 15(3), pp. 255-258.
Borbasi, S., Chapman, Y., Gassner, L., Dunn, S., & Read, K. (2002). Perceptions of the researcher: In-depth
interviewing in the home. Contemporary Nurse, 14, pp. 24-37.
Carraway-Stage, V., Henson, S. R., Dipper, A., Spangler, H., Ash, S. L., and Goodell, L. S. (2014). Understanding the state of nutrition education in the head start classroom: A qualitative approach. American
Journal of Health Education, 45, pp. 52-62, DOI:10.1080/19325037.2013.853000
Cheng, N. Y. I., & Wong, M. Y. E. (2015). Knowledge and attitude of school-teachers towards promoting
healthy lifestyle to students. Health, 7(01), p. 119. Retrieved from
http://www.scirp.org/journal/PaperInformation.aspx?paperID=53318#.VTGaWiGeDGc
Contento, I. R. (2007). Nutrition education: linking research, theory, and practice. UK: Jones & Bartlett
Learning.
Creswell, J. W. (2014). Qualitative, quantitative, and mixed methods approaches research designs (4th Ed.).
USA: SAGE Publications.
Denman, S. (1999). Health promoting schools in England – A way forward in development. Journal of Public
Health, 21(2), pp. 215-220, DOI: 10.1093/pubmed/21.2.215
Dimitrios, B., Labros, S., Nikolas, K., Maria, K., & Athanasios, K. (2013). Traditional teaching methods vs.
teaching through the application of information and communication technologies in the accounting field: Quo Vadis?. European Scientific Journal, 9(28).
Driscoll, D. L. (2011). Introduction to primary research: Observations, surveys, and interviews. Writing Spaces:
Readings on Writing, 2, pp. 153-174.
Drummond, C. E. (2010). Using nutrition education and cooking classes in primary schools to encourage
healthy eating. Journal of Student Wellbeing, 4(2), pp. 43-54.
Güngör, N. K. (2014). Overweight and obesity in children and adolescents. Journal Clinical Research in Pediatric Endocrinology, 6, pp. 129-143, DOI: 10.4274/jcrpe.1471
Hackathorn, J., Solomon, E. D., Blankmeyer, K. L., Tennial, R. E., & Garczynski, A. M. (2011). Learning by
doing: An empirical study of active teaching techniques. The Journal of Effective Teaching, 11(2), pp. 40-54.
Harrell, M. C., & Bradley, M. A. (2009). Data collection methods semi-structured interviews and focus groups.
Santa Monica, CA: Rand National Defense Research Institute.
Hawkes, C. (2013). Promoting healthy diets through nutrition education and changes in the food environment: An international review of actions and their effectiveness. Retrieved on September 1, 2015 from
http://www.fao.org/docrep/017/i3235e/i3235e.pdf
Ismail, P. K. P., & Koh, D. (2014). Role of occupational health in managing non-communicable diseases in
Brunei Darussalam. Global Health Action. Retrieved on September 1, 2015 from
http://www.ncbi.nlm.nih.gov/pmc/articles/PMC4224701/
Kauchak, D., & Eggen, P. (2012). Learning & teaching research-based methods (6th Ed.). UK: Pearson.
Knowledge Convention Report (2012). Majlis Ilmu 2012: Nikmat kesihatan asas kesejahteraan Negara. Brunei
International Medical Journal, 8(5), pp. 283-288.
Martin, A., Saundrs, D. H., Shenkin, S. D., & Sproule, J. (2014). Lifestyle intervention for improving school
achievement in overweight or obese children and adolescents. Cochrane Database of Systematic Reviews, (3),
DOI: 10.1002/14651858.CD009728.pub2.

Proceeding of the 3rd International Conference on Education, Vol. 3, 2017, pp. 77-90
90
Ministry of Education (2011). School Based Assessment for Learning Brunei Darussalam: SBAfL, Guidebooks
for Year 7 and 8 Core Subjects. Ministry of Education, Brunei Darussalam: Curriculum Development
Department.
Ministry of Education (2013). The National Education System for the 21st Century: SPN21 (Revised Ed.). Ministry of Education, Brunei Darussalam.
Ministry of Health (2013). Brunei Darussalam National Multisectoral Action Plan for the Prevention and
Control of Noncommunicable Diseases (BruMAP-NCD) 2013-2018. Retrieved on September 1, 2015 from
http://www.moh.gov.bn/download/download/BRUMAPBOOK.pdf
Musaiger, A. O., & Al-Hazzaa, H. M. (2012). Prevalence and risk factors associated with nutrition-related
noncommunicable diseases in the Eastern Mediterranean region. International Journal of General Medicine, 5,
pp. 199-217, DOI: 10.2147/IJGM.S29663
Parasuram, R., Huiting, X., Wang, J., Thirumarban, A., Joon, K. E., & Poh, C. L. (2014). Effectiveness of using
non-traditional teaching methods to prepare student health care professionals for the delivery of the mental state
examination: A systematic review protocol. The JBI Database of Systematic Reviews and Implementation
Reports, 12(8), pp. 3-19, DOI:10.11124/jbisrir-2014-1354.
Plaxcedia, M. (2015). Strategies for enhancing teaching of food and nutrition in future urban secondary schools,
Manicaland Province. IOSR Journal of Research & Method in Education, 5(1), pp. 75-83, DOI:10.9790/7388-
05117583
Peck, A. C., Ali, R. S., Matchock, R. L., & Levine, M. E. (2006). Introductory psychology topics and student
performance: Where’s the challenge? Teaching of Psychology, 33(3), pp. 167-170.
Prince, M. (2004). Does active learning work? A review of the research. Journal of Engineering Education,
93(3), pp. 223-231.
Russell, A. T., Comello, R. J., and Wright, D. L. (2007). Teaching strategies promoting active learning in
healthcare education. Journal of Education and Human Development, 1(1), pp. 1-8.
Shah, P., Misra, A., Gupta, N., Hazra, D. K., Gupta, R., Seth, P., & Goel, K. (2010). Improvement in nutrition-
related knowledge and behaviour of urban Asian Indian school children: Findings from the ‘Medical Education
for Children / Adolescents for Realistic Prevention of Obesity and Diabetes and for Healthy Ageing’(MARG)
Intervention Study’. British Journal of Nutrition, 104(03), pp. 427-436.
Singura, L. (2013). Impact of Nutrition Education on Student Learning. Unpublished Doctoral Dissertation.
Minnesota, USA: Walden University.
Sovyanhadi, M., & Cort, M. A. (2004). Effectiveness of various nutrition education teaching methods for high school students: A case study in Alabama, United States. Malaysian Journal of Nutrition, 10(1), pp. 31-37.
Umer, S. & Siddiqui, J. A. (2013). Improving trends of teaching methods used in the Concept Schools of
Karachi: An evaluative study. Journal of Educational Research International, 2(2).
Vygotsky, L. (1978). Mind in society: The development of higher development of higher psychological process.
Cambridge, MA: Harvard University Press.
Wandberg, R. & Rohwer, J. (2010). Teaching health education in language diverse classrooms. USA: Jones and Bartlett Publisher.
World Health Organisation (2015). Noncommunicable Diseases. Retrieved on September 1, 2015 from
http://www.who.int/mediacentre/factsheets/fs355/en/

Proceeding of the 3rd International Conference on Education, Vol. 3, 2017, pp. 92-98 Copyright © 2017 TIIKM ISSN 2424 - 6700 online DOI: https://doi.org/10.17501/icedu.2017.3110
3rd International Conference on Education, 20-22 April 2017, Kuala Lumpur, Malaysia
THE ROLE OF PERSONALIZED EDUCATION
TOOLS IN COMPUTER PROGRAMMING LEARNING
Fadhla Junus
State Islamic University (UIN) Ar-Raniry, Indonesia
Abstract: The proliferation of information and communication technology (ICT) which is followed
by the high demand of ICT tools, especially smartphones, has transformed the face of global
learning, as everybody would be able to educate themselves without having to commute from home
to school. This phenomenon has emerged a tutorial generation who has been educated by
personalized education tools in the form of mobile-based and/or web-based applications that support
any kind of knowledge they are interested in. This paper depicted a conducted research question
whether those applications will vanish the traditional teaching model which was believed as high
consuming in cost, time, and effort. The respondents were the students and lecturers of the
vocational information technology program at UIN Ar-Raniry. During the research, they were given
the top five independent learning applications related to programming courses, then they were
requested to review at the same courses that was served by the most highly impact of MOOC
services such as Coursera, Edx, and Udacity. The experiences of the participants were recorded and
noted, then analyzed by QDA Miner software which summarized that ICT education tools assisted
them to sharpen their understanding of the course content because they could learn at their own
pace. Such education model is expected to empower a community within university preparing the
formal institutions to adopt the new form of education. In the future, a further research will be
needed on discussing a basic standard in the development of educational applications that is
relevance to the curriculum.
Keywords: Education, Technology, Personalised Education Tool, Programming Teaching
Introduction
The presence of many computer applications in the internet era has transformed the shape of global education.
Computer programming field is one of knowledge area, which has been affected by the emergence of
information and communication technology (ICT). Most people whose expertise in this field gained knowledge
not only from their formal education, but also from independent learning sources that widely spread on the net.
ICT utilization is supposed to elevate learning and proficiency in any educational sector. Its existence has
established a virtual society who delivers the most recent knowledge applied in any related subject. This
community of practice involves practitioners around the world who provide solutions in a tutorial format
(Luksha and Peskov, 2014; Song, et al, 2013). Students as well as teachers commonly use the knowledge-base
society services to improve their programming skills personally. Both of them have became a part of tutorial
generation who trained themselves by using ICT services.
Personalized education tool (PET) is a part of ICT services for educational purpose. It runs both on the web or
mobile platform. Since the booming of massive open online course (MOOC), PET has been widely used as a
method in teaching computer programming. It is expected to be a supporting media for students who learn
computer programming to upgrade their comprehension of a particular programming languages. Besides that,
PET helps the learners in solving their homework or any project related to software development. As for
teacher, it is intended as a model to structure teaching materials. The main advantage of PET is its ability to be
Corresponding Author: Fadhla Junus/ [email protected]

Fadhla Binti Junus /The Role of Personalized Education Tools in Computer Programming Learning
93
accessed in offline mode, consequently, users in a remote area would still be able to learn on the available
subjects while they are disconnecting to the internet.
ICT services is predicted to replace the traditional teaching model. Lecture, textbook, personal tutorial, and
apprenticeship will be replaced by MOOC, online multimedia libraries, virtual tutor, and virtual simulator,
respectively (Luksha and Peskov, 2014). Moreover, digital technology serves extensive information as learning
resource for researchers, teachers and students in collecting, analyzing, and disseminating data (Benson, 2015).
If these speculations would be occured, do people still need going to school? As they would be able to study
from their comforted places and in effortless circumstances.
The conducted research was supposed to answer the above assumption. As far as the author knows, many
researchs clarified the ICT in education life but there are no any studies discussing on PET utilization for
teaching and learning in computer programming field. Thus, the objective of this work is to construct a model to
perform a comprehensive investigation of the effect of PET in higher education.
This work resulted in a recommendation of applying PET in learning as well as teaching computer
programming. In the point of view of the respondents, they believed that PET should be adopted by educational
institution because of its flexibility. Furthermore, the variety of learning style that was arranged in PET enticed
them into a fun learning atmosphere.
The remainder of this article is constructed as follows: Section 2 provides related works to digital education.
Section 3 reviews method that was used during the investigated research. Section 4 discusses the finding of this
observation. Ultimately, the paper is concluded, and the future implications of this study are elaborated.
Related Works
Amalgamation of ICT with pedagogy system has altered the conventional learning process. In higher education,
the lecture room has turned into student-centered learning that involved digital learning resources (Alonso et al,
2005; Kostolányová and Šarmanová, 2014). McLoughlin (2010) reports that the integration of social software
into learning system has succesfully increased the quality of students‟ skill and their career preparation in UK,
USA, and Australia.
Another supporting study (Gell-Mann (1996) cited in Alonso et al. (2005)) also states that optimization of
instructional method can be achieved when learning is assisted and personalized. ICT devices are the promising
defender of education system as they can be employed to personalize learning. The emergence of Open
Educational Resources (OER) as a service of Web 2.0 conduced openness and collaboration on the net, because
it can be accessed over any electronic tools and supplies abundant teaching material for free (Mikroyannidis et
al, 2011). The OER movement has built a personal learning environment (PLE) which enabled people to learn
on any subject that they are interested in without regarding to place and time.
As PLE keeps growing, it raised many virtual societies that replaced the role of teachers. In a PLE system, every
body could be both teacher and student depends on the skill level of a particular subject. Collaboration of
knowledge and experience between senior and junior members play the most important aspect (Luksha and
Peskov, 2014). An ideal PLE, according to an investigation (Glahn et al (2007) cited in Verpoorten et
al.(2009)), should involve these two design principles : 1. Perspective of learners in their current learning
context; 2. Contrasting information that allows the learner to evaluate the own actions.
MOOC, which has been existed more than a decade, is an example of PLE that is virtually supported by 142
universities. In accordance with report of International Strategy Office of Oxford University, the number of
enrollment to MOOC provider is high, but the student who completed the course is low (Benson, 2015).

Proceeding of the 3rd International Conference on Education, Vol. 3, 2017, pp. 92-98
94
Similarly, Luksha and Peskov (2014) mentioned that the most obvious drawback of MOOC is student
motivation. According to them also, such condition is in contrast to the benefit of MOOC as an efficient online
teaching methodology and provision of content from best global providers. To resolve this, Verpoorten et al
explained in their research that “one key concept of PLE is motivation. It relies on three factors: perceived
controllability, perceived value of the learning task and perceived self-efficacy for it.”(Verpoorten et al, 2009).
Therefore, each individual should consider those three aspects before deciding to be a part of PLE system.
In this smart phone era, the inquiry to educational softwares in supporting PLE system has been increased. As
narrated in the Executive Summary of Future Agendas for Global Education, in section New Education: Stories
from the Future, “The rising demand for personalized education from employers and investors will spur the
development of personal education management systems (and respective market infrastructure). Development of
personalized education tools will open a wealth of opportunities for „concise‟ students that are ready to manage
their own educational goals. The growing demand for authenticity, the search for a unique life path guided by
deeper personal interests and the need for self-actualization, becomes a significant social phenomenon.” (Luksha
and Peskov, 2014, p.25). This statement binds the preceding finding by Dagger et al (2004) that “personalized
education must provide tools and mechanisms in order to improve learner satisfaction with the received learning
experience.” (Dagger et al, 2004, p.2)
A study by Virvou and Alepis (2004) found that one disadvantage of web-based educational application is its
loading time to launch a new page. This was caused by the limited bandwidth of ICT devices. Such trouble may
be a burden for learners to reach their learning achievement because it wasted their valuable time. To eliminate
this problem, the web-based educational software must also provide a mobile-based courseware which is still
working in offline mode through learners‟ smartphone. At the current state, the appearance of PETs empower
people to be directed remotely and asynchronously by human tutor out of the classroom.
Methods
PET softwares that were involved in this work are running on smart phone with Android operating system,
because the majority of participants in this study use this platform in their daily activities. The crucial point in
selecting these applications was the learning material must accommodate computer programming theme.
Further requirements embroiled in choosing PET applications were:
1. User Rating score is four stars;
2. They have been downloaded by more than 5,000 users;
3. They contain variety of the most widely used programming language, i.e. C++, Java,
Phyton, and Web development series.
Based on the above preconditions, eight coursewares were chosen as illustrated in Table 1. Five applications
were served by independent developer, while the other three of top MOOC providers.
Table 1 Summary of personalized education tools.
Application Name User rating
(in stars)
Number of
download
Number of
programming
language
MOOC provider
Coursera
4
79,775
Many
Udacity 4 19,029 Many
EdX 4 13,199 Many
Independent developer

Fadhla Binti Junus /The Role of Personalized Education Tools in Computer Programming Learning
95
Udemy 4.1 58,109 7
Programming Hub 4 46,770 17
Solo Learn 5 33,155 11
Learn Programming 4 12,130 30
Enki 4.5 5,656 5
This study was designed at the Vocational Information Technology Program of Education and Teaching
Department of UIN Ar-Raniry, where the author works as a full time lecturer. Participants consist of 45 students
who are interested in software engineering and also five lecturers who teach them.
Respondents were interviewed about their experiences on using the above PETs. They were suggested to enroll
to similar programming course that were also taught in the classroom. The given period to accomplish their
interactions with PET system were as long as they attend the face-to-face learning. During the four months of
observation, the participants were required to express their point of view in such learning method. Therefore,
they were given following three questions:
1. Will PET replace computer programming school? ;
2. Is there any possibility to implement PET to other knowledge field? ;
3. What to expect to achieve an ideal PET?.
Each recorded answer described respondent‟s opinions were scripted in text format. Accordingly, 50 scripting
texts, which were saved as document files, imported to QDA Miner. Those 50 files were executed as variables.
Each of them then associated as a case by adapting its file name. The transformation of recorded voice into text
manuscript is compulsory, because the version of QDA Miner is free.
Next important step was coding each script by defining code name that was followed by picking code color. The
code name functions as keywords that represented the given questions. Afterward, each case was manually
scanned using the defined codes by pointing on appropriate sentences. The sentences were marked by the colors
that were selected while defining the code.
Another way in analyzing the variables is by using Retrieve feature. It contains two retrieval modes which can
be extracted by text and coding. Both features have searchable expression in which a specific string could be
labeled. Moreover, the coding retrieval provides conditional item through which any boolean expression could
be assigned. In final step, coding frequency feature was used to examine how often each code appears in the
whole cases. The most frequent code shows the significance that leads to sum up this work.
In qualitative analysis, QDA Miner serves easier and faster method to gain significant data value because it can
read alphanumerical data. Main obstacle in this analysis phase was time consuming during relating data to the
defined code. The longer script of interview in each case, the more required time to inspect data manually.
Results and Discussion
Figure 1 shows the number of cases obtained from an analysis of the participants‟s answer to the first and the
second of interview questions. It depicts the majority of respondents who agree to apply PET in computer
programming learning and teaching as well as in other knowledge area (represented by the green graph).
However, the number of participants who disagree nearly equal to those who has hesitation which is denoted by
Probably label.
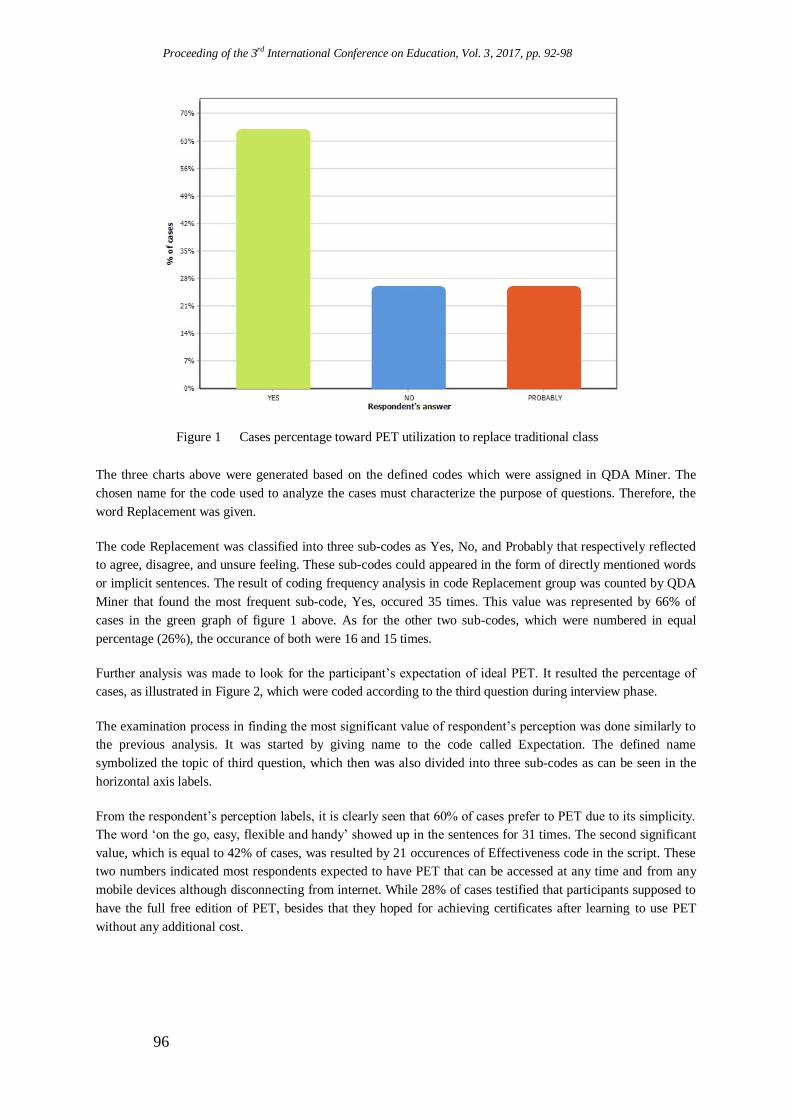
Proceeding of the 3rd International Conference on Education, Vol. 3, 2017, pp. 92-98
96
Figure 1 Cases percentage toward PET utilization to replace traditional class
The three charts above were generated based on the defined codes which were assigned in QDA Miner. The
chosen name for the code used to analyze the cases must characterize the purpose of questions. Therefore, the
word Replacement was given.
The code Replacement was classified into three sub-codes as Yes, No, and Probably that respectively reflected
to agree, disagree, and unsure feeling. These sub-codes could appeared in the form of directly mentioned words
or implicit sentences. The result of coding frequency analysis in code Replacement group was counted by QDA
Miner that found the most frequent sub-code, Yes, occured 35 times. This value was represented by 66% of
cases in the green graph of figure 1 above. As for the other two sub-codes, which were numbered in equal
percentage (26%), the occurance of both were 16 and 15 times.
Further analysis was made to look for the participant‟s expectation of ideal PET. It resulted the percentage of
cases, as illustrated in Figure 2, which were coded according to the third question during interview phase.
The examination process in finding the most significant value of respondent‟s perception was done similarly to
the previous analysis. It was started by giving name to the code called Expectation. The defined name
symbolized the topic of third question, which then was also divided into three sub-codes as can be seen in the
horizontal axis labels.
From the respondent‟s perception labels, it is clearly seen that 60% of cases prefer to PET due to its simplicity.
The word „on the go, easy, flexible and handy‟ showed up in the sentences for 31 times. The second significant
value, which is equal to 42% of cases, was resulted by 21 occurences of Effectiveness code in the script. These
two numbers indicated most respondents expected to have PET that can be accessed at any time and from any
mobile devices although disconnecting from internet. While 28% of cases testified that participants supposed to
have the full free edition of PET, besides that they hoped for achieving certificates after learning to use PET
without any additional cost.

Fadhla Binti Junus /The Role of Personalized Education Tools in Computer Programming Learning
97
Figure 2 Cases percentage of expected benefit of ideal PET
From the two figures above can be concluded that the possibility of PET to change the way of people in learning
is a very exciting proposition. The flexibility of PET enabled anyone to improve their skill and knowledge at
anytime as the knowledge is on the hand. As mentioned in the introduction, so far no particular investigations
study about PET utilization in learning and teaching computer programming. Although this is a small study, the
results can be relatively implemented in traditional computer programming class.
Limitations found during this study were in the analysis of participant‟s answers, the hardest part was in
interpreting the implicit sentences. Every sentence in the 50 interviewed scripts must read thoroughly before it
was tagged to the suitable sub-codes. Moreover, the use of formulas to calculate the coding frequency by QDA
Miner could not be initialized. Consequently, the interpretations of resulted figures may reveal a possible flaw.
Conclusion
PET utilization is inevitable to adapt in daily learning activities. According to the analysis of the interview
script, the participants are able to learn at their own pace and time because PET offers flexibility in accessing
study materials from any handheld devices with or without internet connection. Besides that, easy access to the
latest knowledge can be achieved from the leading PET developers in modest way. Morever, the learning
variety such quiz in a game format has attracted learners to spend more time to study. Although greater number
of respondents believed that PET will replace the face-to-face classroom, the existence of it still can not be
generally applied to traditional education model. The presence of real teacher is irreplaceable with virtual
instructor, mainly for those whose less self-motivation. Additionally the issued certificate has not been legally
recognized.
Even though this work focused on computer programming subjects, it is also applicable to other knowledge
fields. Digital education is not something new, any educational institutions should prepare themselves to
implement PET by taking part as a content provider or at least become a player who utilizes it in their academic
systems. Therefore the institutions should give priority to legalize compatibility of PET content to regular
course and also authorize certificate which were issued by PET providers. A future work is also needed by
involving a larger number of participants who are interested in another field that still related to computer

Proceeding of the 3rd International Conference on Education, Vol. 3, 2017, pp. 92-98
98
science. Besides that the mix method, both qualitative and quantitative, can be applied in data analysis to
achieve more valid result.
Acknowledgements
Author would like to thank all the respondents who contributed information and experience to this study, which
formed the basis for the conclusions made in this report.
References
Alonso, F., López, G., Manrique, D., & Viñes, J. M. (2005). An instructional model for web‐ based e‐ learning
education with a blended learning process approach. British Journal of educational technology, 36(2), 217-235.
Benson, K., 2015, International trends in higher education 2015. International Strategy Office, University of
Oxford. Date of access: 18/10/2016.
https://www.ox.ac.uk/sites/files/oxford/International%20Trends%20in%20Higher%20Education%202015.pdf
Dagger, D., Wade, V., and Conlan, O. 2004. Developing Active Learning Experiences for Adaptive
Personalised eLearning. Paper presented at the 2nd International Workshop on Authoring Adaptive and Adaptable Educational Hypermedia.
Gell-Mann, M. (1996). A commentary to R Schank. In J. Brockman (Ed.), The third culture: beyond the
scientific revolution. Touchtone Books. 167-180. Cited in Alonso, F., López, G., Manrique, D., & Viñes, J. M.
(2005). An instructional model for web‐ based e‐ learning education with a blended learning process approach.
British Journal of educational technology, 36(2), 217-235.
Glahn, C., Specht, M., Koper, R., 2007, Smart indicators on learning interactions. In: E. Duval, R. Klamma, M.
Wolpers (eds.) Creating new learning experiences on a global scale. LNCS, vol. 4753, (Berlin, Heidelberg: Springer), pp. 56-70. Cited in Verpoorten, D., Glahn, C., Kravcik, M.,Ternier, S., & Specht, M., 2009,
Personalisation of Learning in Virtual Learning Environments. In U. Cress, V. Dimitrova & M. Specht (Eds.),
Lecture Notes in Computer Sciences, Vol. 5794. (Berlin, Germany, Springer-Verlag), pp. 52-66.
Kostolányová, K., Šarmanová, J. (2014). Use of adaptive study material in education in elearning environment.
The Electronic Journal of e-Learning, 12(2), 126-226.
Luksha, P., and Peskov, D., 2014, Future Agendas for Global Education. Executive Summary. Date of access:
16/10/2016. http://edu2035.org/pdf/GEF.Agenda_eng.pdf.
McLoughlin, C., Lee, M.J. (2010). Personalised and self regulated learning in the Web 2.0 era: International
exemplars of innovative pedagogy using social software. Australasian Journal of Educational Technology,
26(1), 28-43.
Mikroyannidis, A., Okada, A., Little, S. and Connolly, T., 2011, Supporting the collaborative adaptation of
Open Educational Resources: The OpenScout Tool Library. In: ED-MEDIA 2011: World Conference on
Educational Multimedia, Hypermedia & Telecommunications, Lisbon, Portugal, 27 June - 1 July, pp.3734-3739
Song, K., Kim, H., Seo, J., Kim, C. (2013). Development and Pilot Test of ICT in Education readiness indicators in the global context. KEDI Journal of Educational Policy, 10(2), 243-265
Verpoorten, D., Glahn, C., Kravcik, M., Ternier, S., & Specht, M., 2009, Personalisation of Learning in Virtual
Learning Environments. In U. Cress, V. Dimitrova & M. Specht (Eds.), Lecture Notes in Computer Sciences,
Vol. 5794. (Berlin: Springer-Verlag), pp. 52-66.
Virvou, M., Alepis, E. (2005). Mobile Educational Features in Authoring Tools for Personalised Tutoring.
Journal Computers and Education, 44(1), 53-68.
Proceeding of the 3rd International Conference on Education, Vol. 3, 2017, pp. 99-105 Copyright © 2017 TIIKM ISSN 2424 - 6700 online DOI: https://doi.org/10.17501/icedu.2017.3111
3rd International Conference on Education, 20-22 April 2017, Kuala Lumpur, Malaysia
THE APPLICATION OF AUTHENTIC ASSESSMENT
IN CHEMISTRY CURRICULUM STUDIES
Beta Febriana and Widinda Arlianty
Department of Chemistry Education, Islamic University of Indonesia, Indonesia
Abstract: One of the growing issues in Indonesia is changing curriculum. Nowadays, most of high
school using two different curriculum. Teacher candidates must be understand and differentiate
between that two curriculum was applied. The purpose of the study was to investigate the effect of
authentic assessment on the teacher candidates in Chemistry Education. This study was used
Classroom Action Research using two cycles of learning. The sample were teacher candidates of
Chemistry Education 4th semester in academic year 2016/2017. The learning approach used is
Contextual Teaching and Learning. Data collection techniques used is testing method and non-
testing methods. The test method consists of tests for cognitive, on the other hand, the non-test
methods using a Likert scale questionnaire and an observation sheet. The tool of authentic
assessment consisted of reviewing aspects of knowledge, attitudes, and self-efficacy and peer
assessment. The results showed that student achievement increased from the first to second cycles. In
the cognitive aspect, the students' scores increased from 62.00% to 81.67%; in aspects of the attitude
that consists of attitude assessment, self-efficacy, and peer assessment in the first cycle of 77.04%;
75.71%; 72.57%, while in the second cycle of 79.07%; 77.62%; 73.61% respectively.
Keywords: Authentic Assessment, Contextual Teaching and Learning, Chemistry Curriculum
Studies
Introduction
The subject Chemistry Curriculum Studies is one of the compulsory subjects are held on the fifth semester with
two credits of semester. This course discusses the components of the curriculum in a national education system.
Indonesian curriculum education includes curriculum structure which is then presented in the form of
subsequent syllabus and then the syllabus used as a reference in designing of Lesson Plan. Learning gains
subjects on this subject are that students have an understanding and ability to develop chemistry curriculum in
school and understand the urgency of character education in school chemistry curriculum studies.
The study subjects of this curriculum will be taught to students of Chemistry Education Department on fifth
semester of 2014. The character of this students is passive to the learning process. Learning system that tends to
be a teacher-centered result in students only receive knowledge, notes and even tend to memorize lessons.
Learning materials are only learned by wrote will be easier to be forgotten by the students because the materials
are considered to be memorable. Score obtained was also unsatisfactory so we need methods that can make students actively in learning activities. One is to apply methods that are student-centered learning.
Student of Chemistry Education Program graduates are expected to become competent in the field of education
one of them to be competent in analyzing the content/structure of the curriculum where the curriculum is the
spirit of the national education system. In analyzing the structure of the curriculum, students can directly
observe the implementation of the curriculum in a school. The process of student assessment based solely on the
score of mid-semester test (MST) and the final-semester test (FST) has not been able to assess the overall
activity of students in the learning process. In fact, the learning process that is student-centered involve thinking
students skills are hands on and minds on. Assessment to assess overall student activity is authentic assessment.
This assessment consists of authentic assessment itself and portfolio assessment. All results of the students tasks
are well documented, neat, easy to read and traceable through the assessment process.
The process of learning is conducted should be accompanied by the process of assessment/appraisal capable of assessing student activity with truth. A proper assessment appropriates to assess the process of student activities
Corresponding Author: Beta Febriana/ [email protected]
Beta Febriana and Widinda Arlianty/The Application of Authentic Assessment in Chemistry Curriculum Studies
100
in the course curriculum is the Authentic Assessment. Authentic is a process of collecting, reporting and using
information about student learning outcomes by applying valuation principles, the implementation of
sustainable, evidence is authentic, accurate, and consistent as public accountability (Depdiknas, 2009). Based on
the above mentioned backgrounds, it can be the formulation of the problem, namely how the implementation of
assessing by authentic assessment in Chemistry Curriculum Studies.
Literature Review
Authentic assessment is the process of gathering information by teachers/lecturers about the progress and
achievement of learning undertaken by learners through a variety of techniques are able to express, to prove, or
demonstrate precisely that the learning objectives have been completely overcome and accomplished (Nurhadi,
2004). Data were collected through assessments not to seek information about student learning. True learning
should be emphasized in order to help students to be able to learn and not emphasized in obtaining as much
information at the end of the study period (Nurhadi, 2004).
Authentic assessment concerned with the assessment process and results at once. Thus, the entire look of the
students in a series of learning activities can be assessed objectively, it is, and not solely based on the final result
(product). Authentic assessment emphasizes the ability of learners to demonstrate their knowledge in a real and
meaningful. The assessment activities are not just ask or tapped the knowledge that has been known to learners,
but also the real performance of the knowledge that has been mastered. As Mueller (2006) stated authentic assessment is a form of assessment in which students are asked to perform real-world tasks that demonstrate
meaningful application of essential knowledge and skills. Authentic assessment can form a task for the students
to showcase their knowledge, skills and attitude, and an assessment criteria or rubric which will be used to
assess performance based on the task.
Self-efficacy is defined as a person's judgment about his/her ability to achieve the desired level of performance
or determined, which will affect the next action (Bandura, 1997). According to Zimmerman (2000), self-
efficacy is a personal judgment about a person's ability to organize and implement the work program in
achieving its intended purpose, and he tried to assess the level, generality and strength of all the activities and
contexts. Zimmerman added that self-efficacy beliefs will keep students motivated to learn through the use of
self-regulation as a process of goal setting, self-monitoring, self-evaluation, and strategies used. Additionally, it
will determine how much effort it does, how long he stayed when in trouble, and how flexible the unfortunate
situation. Noer (2012) stated that the greater a person's self-efficacy, the greater the effort, perseverance, and flexibility. Self-efficacy also affects the mindset and emotional reactions. A person with low self-efficacy will
give up easily, tend to become stressed, depressed, and have a narrow vision of what is best to resolve the
problem. While high self-efficacy, will help a person in creating a sense of calm in the face of a difficult
problem or activity.
Peer-rating is an assessment that involves the students to assess the quality of their work. Rating peer requires
other students to provide feedback on the score or the performance of their friends or their products based on a
criteria who have made the criteria that have been made with them (Kartono, 2011). Some advantages of rating
peers, among others: 1) to improve learning outcomes, 2) to improve collaborative learning through feedback
from peers, 3) Students can help the theme in understanding and studying them and feel more comfortable in the
learning process, and 4) students can comment on their performance. A peer assessment results similar to the
results of teacher assessment (Falchinov & Goldfrich, 2000) and a common understanding between the assessor in understanding the assessment criteria at peers.
Research Methods
Research design
The design of this research is Classroom Action Research by Kemmis and Mc Taggart by using two cycles. The
first cycle is conducted before the mid-semester test (MST) while the second cycle is implemented after mid-
semester test (MST). Furthermore, improving the learning process by using the mid-semester test (MST) and the
final-semester test (FST) results. The design of this research presented in Fig 1 below.

Proceeding of the 3rd International Conference on Education, Vol. 3, 2017, pp. 99-105
101
Figure 1. Design of the research
Research Subjects
Subjects in this study were students of Chemistry Education Program in fifth semester 2014 class of nine.
Assessments have been conducted which consisted of the test assessment analyzed using quantitative analysis,
whereas the non-test assessment using qualitative analysis.
Research Instruments
Data collection research using assessment of aspects of knowledge, attitudes, self-efficacy and peers.
Instruments which are used in the form of test and non-test sheets.
1. Test sheet
Cognitive aspect (knowledge)
2. Non-test sheet
Affective aspect (attitude) : questionnaire
Self-efficacy : questionnaire
Peer assessment : observation sheet
Assessment for cognitive aspect taken from assessment through MST and FST while assessment for affective
aspect and self-efficacy obtained by questionnaire. Peer assessment obtained from observationa sheet who filled
by students. The items used to assess of self-efficacy and peer assessment are shown in Table 1 and Table 2.
Table 2 Aspect of Self-efficacy Assessment
Aspect of Self-
efficacy Indicator of Self-efficacy
Level The student's belief in his ability to do planning and self-regulation
The student's belief in his ability to complete learning tasks that have varying
degrees of difficulty in learning
Strength The students' belief in their effort ability in realizing the expected learning
objectives

Beta Febriana and Widinda Arlianty/The Application of Authentic Assessment in Chemistry Curriculum Studies
102
Aspect of Self-
efficacy Indicator of Self-efficacy
The student's belief in his ability to persevere in the efforts undertaken to achieve
the learning objectives
Generality The student's belief in his ability to make prior experiences as a force in achieving
learning achievement
The students' belief in their ability in the lesson is a reliable skill for success in
various situations/tasks.
Table 2 Aspect of Peer Assessment
Aspect of Peer Assessment Indicator of Peer Assessment
Make a plan with full of responsibility Diligently plotting the observed object
Determine details of aspects to be observed closely
Carry out the task with full of
responsibility
Observe the object seriously
Gather assignments just in time
Carry out the task with full of honesty Carry out the observation task seriously
Keeping track of factual observations
Data Analysis and Results
Instrument Validation Results Validation of research instrument by two judgement experts. The results of the validation instrument of
cognitive assessment, affective assessment, self-efficacy assessment and peer assessment using the formula
Gregory presented in Table 3 below.
Table 3. Summary of Content Validity Result of Authentic Assessment
Variable The number of
Indicator CV Conclusion
Cognitive Instrument 12 0,95
Analysis can be
continued
Affective Instrument 20 0,82
Self-efficacy Instrument 10 0,88
Peer Assessment Instrument 6 0,93
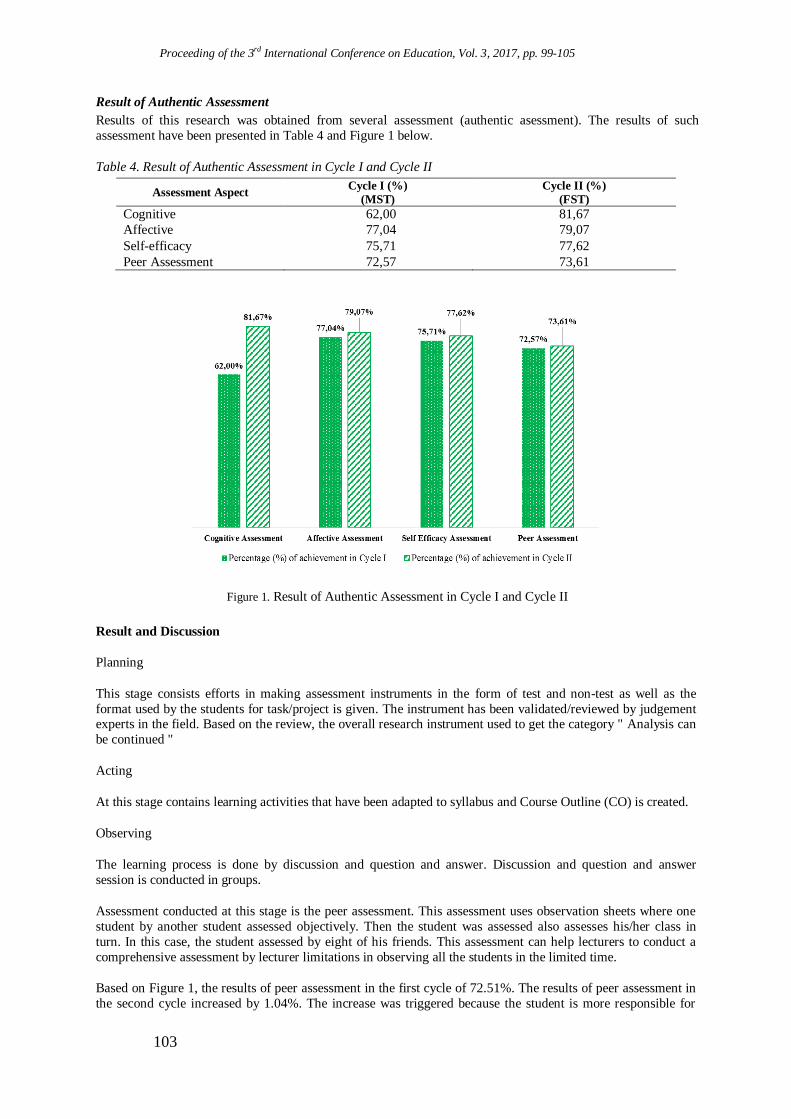
Proceeding of the 3rd International Conference on Education, Vol. 3, 2017, pp. 99-105
103
Result of Authentic Assessment
Results of this research was obtained from several assessment (authentic asessment). The results of such
assessment have been presented in Table 4 and Figure 1 below.
Table 4. Result of Authentic Assessment in Cycle I and Cycle II
Assessment Aspect Cycle I (%)
(MST)
Cycle II (%)
(FST)
Cognitive 62,00 81,67
Affective 77,04 79,07
Self-efficacy 75,71 77,62
Peer Assessment 72,57 73,61
Figure 1. Result of Authentic Assessment in Cycle I and Cycle II
Result and Discussion
Planning
This stage consists efforts in making assessment instruments in the form of test and non-test as well as the
format used by the students for task/project is given. The instrument has been validated/reviewed by judgement experts in the field. Based on the review, the overall research instrument used to get the category " Analysis can
be continued "
Acting
At this stage contains learning activities that have been adapted to syllabus and Course Outline (CO) is created.
Observing
The learning process is done by discussion and question and answer. Discussion and question and answer
session is conducted in groups.
Assessment conducted at this stage is the peer assessment. This assessment uses observation sheets where one
student by another student assessed objectively. Then the student was assessed also assesses his/her class in
turn. In this case, the student assessed by eight of his friends. This assessment can help lecturers to conduct a
comprehensive assessment by lecturer limitations in observing all the students in the limited time.
Based on Figure 1, the results of peer assessment in the first cycle of 72.51%. The results of peer assessment in
the second cycle increased by 1.04%. The increase was triggered because the student is more responsible for
Beta Febriana and Widinda Arlianty/The Application of Authentic Assessment in Chemistry Curriculum Studies
104
what they do. Based on the findings showed that students who scored low in the first cycle, the second cycle
they has increased the score by their friends. On assignment held on this second cycle is continuous so that if a
student left behind one of the tasks, the tasks that otherwise would not be done. This has encouraged students to
be more aware of the importance of a given task.
Furthermore, self-efficacy ratings given in the first cycle yield of 75.71%. J. Strecher, V. et al. cit Noer (2012)
said that self-efficacy influences one's choice in setting behavior, the number of their efforts to complete the task, and the length of time they persist in the face of obstacles that self-efficacy affect a person's emotional
reaction. Thus, individuals with low self-efficacy against certain tasks more thinking about their personal
shortcomings rather than thinking about completing a task, in turn, will hamper the successful completion of the
task. Assessment previously granted in this first cycle gives an average score of 77.62. The results obtained in
this second cycle rose by 1.91%. Assessment using a questionnaire to assess this themselves brings out the
confidence of the individual student if basically they able to perform any task/project is given to the maximum.
Rating attitudes conducted in the first cycle scored of 77.04%. Rating attitudes uses a questionnaire with Likert
scale with four possible answers, namely Strongly Agree, Agree, Disagree and Strongly Disagree. This
assessment consists of two statements that are positive statements and negative statements. Competencies
expected of votes this attitude is that students are able to behave honestly, discipline, responsibility and
teamwork. The assessment carried out on this second cycle. In the first cycle, the results of the assessment of
student attitudes achieved by 77.04%, while in the second cycle of this amounted to 79.07%. An increase of 2.03% happened due to the students here work individually so that raises their individual responsibility which
allows an increase in positive attitudes of students in learning.
Knowledge assessment uses assessment tests in the form of mid-semester test (MST). Based on the results of
MST, the students average score is 62.00%. Another aspect considered in the learning process is the aspect of
knowledge. Aspects of knowledge is assessed using assessment tests in the form of final-semester test (FST).
Based on the results, the average score of students reached 81.67%. Results of the assessment of the score of
knowledge increased 62.00% to 81.67%. This significant increase is due to the reflection that has been done at
the beginning of the meeting in the second cycle. Reflections on learning in the form of repetition of learning
materials bring out new enthusiasm and motivation within the students. Students are more familiar with the
repetition of material presented.
Willey & Gardner (2007) from their research concluded that the self- and peer-assessment positively effect on student learning outcomes, which can improve learning outcomes and increase their desire to learn. In another
study Willey & Gardner (2008) also concluded that the self- and peer-assessment into their facilities in a
mutually beneficial receives feedback from their group of friends, as the critical success factors in their study
group.
Reflecting
Reflection phase is about providing feedback during the learning process. Feedback is provided about the
learning material that has not been understood by the students. Reflection made after MST takes place so that
the faculty and students know the learning achievement indicators which are not yet mastered by students are
marked by obtaining a score that is not optimal for each indicator. Furthermore, based on the acquisition of the
score, a lecturer repeats material on the indicator that students truly master the concepts given.
At MST results showed that the average score of 62. Based on the responses of students, they still have not been able to acquire the structural difference between the standards-based curriculum and the curriculum designed in
2013.
Conclusion
The results pointed out that student achievement increased from the first to second cycles. In the cognitive
aspect, the students' scores increased from 62.00% to 81.67%; in aspects of the attitude that consists of attitude
assessment, self-efficacy, and peer assessment in the first cycle of 77.04%; 75.71%; and 72.57% respectively,
while in the second cycle of 79.07%; 77.62%; 73.61% respectively.

Proceeding of the 3rd International Conference on Education, Vol. 3, 2017, pp. 99-105
105
Acknowledgements
Authors would like to thank the Academic Development Agency (ADA) Islamic University of Indonesia who
has given the opportunity to be one of the recipients of Regular Teaching Grant Program in the first semester of
the academic year 2016/2017.
References
Bandura. 1997. Self-Efficacy: The Exercise of Control. New York: W.H. Freeman and Company
Depdiknas. 2009. Kurikulum TingkatSatuan Pendidikan. Jakarta: Depdiknas.
Falchikov, N dan Goldfinch, J. 2000. Student Peer Assessment in Higher Education: A Meta-Analysis
Comparing Peer and Teacher Marks. Review of educational research, 70 (3), 287-322
Kartono. 2011. Efektivitas Penilaian Diri dan Teman Sejawat untuk Penilaian Formatif dan Sumatif pada
Pembelajaran Mata Kuliah Analisis Kompleks. Prosiding Seminar Nasional Matematika Prodi Pendidikan
Matematika, Universitas Muhammadiyah Surakarta
Masnur, Muslich. 2007. KTSP Pembelajaran Berbasis Kompetensi dan Kontekstual. Jakarta : PT Bumi Aksara
Mueller, John. 2008. Authentic Assessment Toolbox. North Central College
http://jfmueller.faculty.noctrl.edu/toolbox/index.htm
Mueller, RJ. 2006. Authentic Assessment. North Central College.
http://jonatan.mueller.faculty.noctrl.edu/toolbox/whatisit.htm
Nurhadi. 2004. Kurikulum 2004. Jakarta: Gramedia Widiasarana.
Noer, Sri Hastuti. Self-Efficacy Mahasiswa terhadap Matematika. Seminar Nasional Matematika dan
Pendidikan Matematika Jurusan Pendidikan Matematika FMIPA UNY
Willey, K. & Gardner, AP. 2007. Investigating The Capacity of Self and Peer Assessment to Engage Student
and Increase Their Desire to Learn.
Willey, K. & Gardner, AP. 2008. The Effectiveness of Using Self and Peer Assessment in Short Courses: Does
It Improve Learning?. Proceeding of AaeE conference. Tersedia pada http://www.aaee.com.au/
conferences/papers/2008/aaee08_submission_WLCS.pdf.
Zimmerman, B. J. 2000. Self-Efficacy: An Essential Motive to Learn. Contemporary Educational Psychology,
25, 82-91

Proceeding of the 3rd International Conference on Education, Vol. 3, 2017, pp. 106-113 Copyright © 2017 TIIKM ISSN 2424 - 6700 online DOI: https://doi.org/10.17501/icedu.2017.3112
3rd International Conference on Education, 20-22 April 2017, Kuala Lumpur, Malaysia
UNDERSTANDING PEER AND TEACHER ASSESSMENT
ABOUT LABORATORY SKILL ON FORMATIVE
ASSESSEMENT THROUGH SCIENTIFIC APPROACH
Widinda Arlianty and Beta Febriana
Islamic University of Indonesia, Indonesia
Abstract: In order to obtain a holistic view of students’s contribution peer assessment used in
addition to teacher assessment to arrive at overall course grade of a students in scientific approach.
However, students based assessment to determines final value still lots raises questions. Although,
literature shown student based assessment useful to review and evaluate the right skills in scientific
approach, but assessment between students and teacher have different perceptions toward viewpoints
in assessments. Therefore, the aim of this study was to identify differences and similiarities between
peer assessment and teacher assessment. The samples of this research were 2nd-semester were
following physical chemistry experiment in the laboratory. The research was quasi experimental.
The scope of this study is limited to laboratory skill in the laboratory and that were assessed using
peer and teacher assessment. The data peer and teacher assessment were collected by observation
sheet in experiment. Students in each group were asked to give confidential assessment to review
laboraty skill of their group. The data analysis result indicate that students tend to give similiar
scores to peers, which are much higher than what were given by their teacher. In conclusion, that
student based assessment does provide information on laboratory skill of peers which may not
accordance with assessment is given by teacher. Understanding that contributes that was privided by
students againts assessment learning process is important as basic a review of teachers help students
be learners have good laboratory skill through scientific approach.
Keywords: Peer Assessment, Teacher Assessment, Laboratory Skills
Introduction
In a learning process of many factors that influence the achievement of a goal. These factors consist of internal
factors and external factors. Internal factors are usually derived from self-learners. While external factor is an
external treatment that is expected to have a better effect on the achievement of learning objectives. The
learning method is one of the factors that influence the learning process. Teachers typically use a variety of
teaching methods to convey the subject matter in order to facilitate students in a lesson. Teachers always think
of the learning method that will be used in the learning process. However, there are other important factors that
actually contribute to the success of learning that assessment. Assessment serves as a feedback process that has
been done and to encourage the learners to achieve better learning.
Assessment in learning activities important to know the achievements of students. Assessment does not only
apply to the teaching and learning activities in the classroom or teaching theoretical level, but the assessment is
also necessary for practical activities or that are of direct experience. The process of documenting, through the
measurement process, knowledge, skills, attitudes, and beliefs of students called assessment. It can be stated
also that the assessment is a systematic activity to obtain information about what is known, done, and done by
students[6].
Assessment used in Department of Chemistry Education, Islamic University Indoneisa is assessment that has
been determined by the lecturer of the course or assessment only focused on the lecturer and aided by
Corresponding Author: Widinda Arlianty/ [email protected]
Widinda Arlianty and Beta Febriana/Understanding Peer and Teacher Assessment about Laboratory Skill on
Formative Assessement Through Scientific Approach
107
assistants. This assessment is used to determine the students' ability to work in laboratoium. However, the
assessment is only done by lecturers and assistants have not been able to assess the overall activities in the
laboratory. Therefore, the assessment is necessary to assist the faculty in assessing the ability of the individual
laboratory. This is done so that the student's ability to work in a laboratory could actually measured. Proper
assessment and can help in assessing the skills of students in the laboratory is through peer assessment.
Peer Assessment is commonly known as peer assessment where the assessment carried out by their own
friends. Assessment of the requested information on the performance of students from other students[4]. In
addition they also suggested that peer assessment is the process by which one team or group assess each group
member friend and judge based on information that has been collected. But others argue that the peer
assessment involves students provide feedback on the quality of work of their friend. Assessment peers
requires students to pass judgment on the performance, and excellence of other friends in deciding their
involvement in these activities. The assessment uses peer assessment helps reduce the subjectivity of education
in this case the teacher or lecturer in assessing the learning process[7]. Implementation of peer assessment
helps build student confidence. Assessment conducted by colleagues to help students better prepare themselves
to be more competent.
Characteristics include peer assessment, peer assessment is a process whereby each member of a team doing
assess, then goal setting should be understood students well. Peer assessment as an alternative assessment gives
students the freedom to express opinions. Identified several advantages of peer assessment include: (1) peer
assessment can improve the learning process, (2) to identify the weaknesses and strengths of students in
learning, (3) encourage to learn more in-depth and meaningful (4) encourage the learning does not depend on
others, (5) can recognize that transparent assessment criteria for assessment, (6) push for mutually analyzing
the performance or results of each working group's friends[5].
Peer assessment and self-assessment has great potential to the understanding of mathematics student
teachers[3]. In another opinion, shows that the self-assessment and peer can be applied to courses that discuss
the concepts and relationships between concepts [1]. The practice of self-assessment and peer assessment in
colleges and schools are lacking, while the teacher is actually a positive perception of the benefit of self-
assessment and peer and there is potential for wide application[2].
Implementation of the assessment in the laboratory can be done easily if the learning process in the laboratory
is well designed using a variety of methods, models, or the right learning approach. Suitable learning approach
applied in the laboratory activities is through a scientific approach. The scientific approach is an approach to
learning that is now often used in the learning process in the laboratory. In a scientific approach consists of
several process of observing (Observing), ask (Questioning), reasoning (associating), try (experimenting),
concluded and forming networks (Networking). Through this activity, the students will be assessed
contribution through the assessment given by the teacher (teacher assessment) as well as peer assessment (peer
assessment) [8,9].
Practicum courses organized to provide laboratory skills and mastery of the material to the maximum.
Implementation of the practicum course very important to support the learning outcomes. Course practicum is
a means to strengthen, proved, finding a theory derived from the lectures in class. Hopefully, by the learning by
using a scientific approach as well as peer assessment and teacher assessment on practicum courses can not
only produce students have competence in the areas of knowledge, but also skills and attitudes.
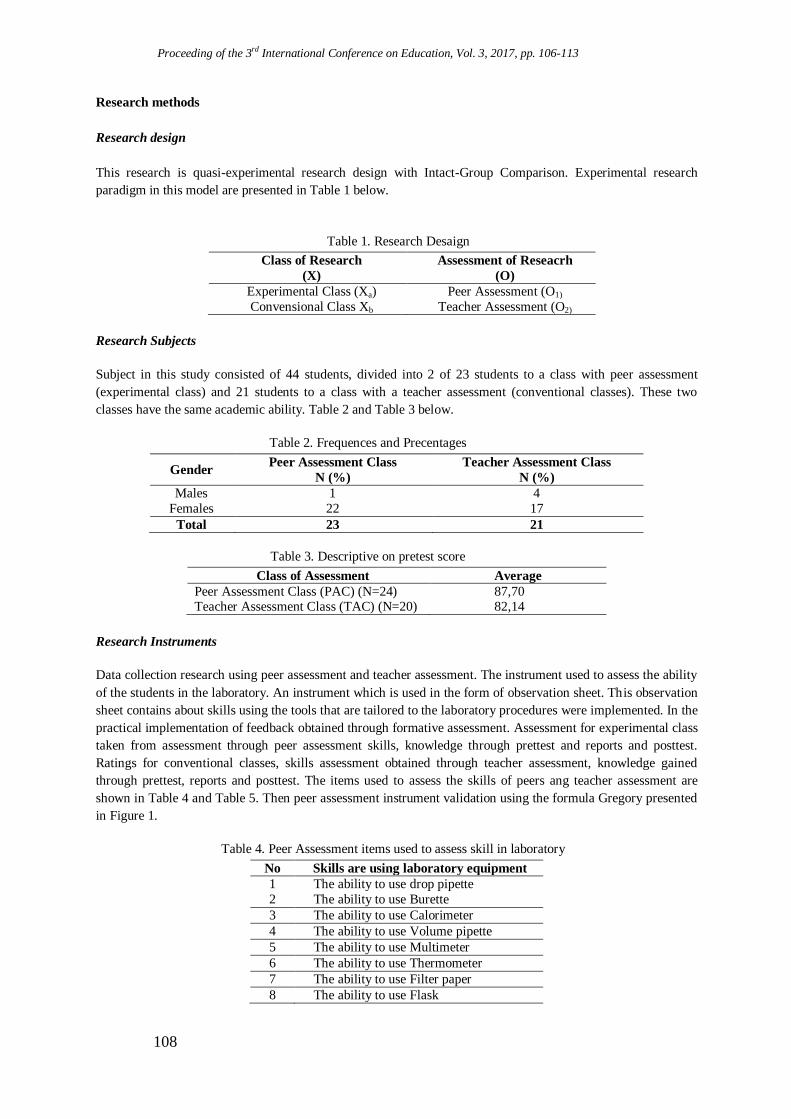
Proceeding of the 3rd International Conference on Education, Vol. 3, 2017, pp. 106-113
108
Research methods
Research design
This research is quasi-experimental research design with Intact-Group Comparison. Experimental research
paradigm in this model are presented in Table 1 below.
Table 1. Research Desaign
Class of Research
(X)
Assessment of Reseacrh
(O)
Experimental Class (Xa) Peer Assessment (O1)
Convensional Class Xb Teacher Assessment (O2)
Research Subjects
Subject in this study consisted of 44 students, divided into 2 of 23 students to a class with peer assessment
(experimental class) and 21 students to a class with a teacher assessment (conventional classes). These two
classes have the same academic ability. Table 2 and Table 3 below.
Table 2. Frequences and Precentages
Gender Peer Assessment Class
N (%)
Teacher Assessment Class
N (%)
Males 1 4
Females 22 17
Total 23 21
Table 3. Descriptive on pretest score
Class of Assessment Average
Peer Assessment Class (PAC) (N=24) 87,70 Teacher Assessment Class (TAC) (N=20) 82,14
Research Instruments
Data collection research using peer assessment and teacher assessment. The instrument used to assess the ability
of the students in the laboratory. An instrument which is used in the form of observation sheet. This observation
sheet contains about skills using the tools that are tailored to the laboratory procedures were implemented. In the
practical implementation of feedback obtained through formative assessment. Assessment for experimental class
taken from assessment through peer assessment skills, knowledge through prettest and reports and posttest.
Ratings for conventional classes, skills assessment obtained through teacher assessment, knowledge gained
through prettest, reports and posttest. The items used to assess the skills of peers ang teacher assessment are
shown in Table 4 and Table 5. Then peer assessment instrument validation using the formula Gregory presented
in Figure 1.
Table 4. Peer Assessment items used to assess skill in laboratory
No Skills are using laboratory equipment
1 The ability to use drop pipette
2 The ability to use Burette
3 The ability to use Calorimeter
4 The ability to use Volume pipette
5 The ability to use Multimeter
6 The ability to use Thermometer
7 The ability to use Filter paper
8 The ability to use Flask

Widinda Arlianty and Beta Febriana/Understanding Peer and Teacher Assessment about Laboratory Skill on
Formative Assessement Through Scientific Approach
109
9 The ability to use Analytical Balance
10 The ability to use Measuring cup
11 The ability to use Viscometer
12 The ability to use Tube Hoppler
Table 5. Teacher Assessment items used to assess skill in laboratory
No Skills in the laboratory
1 Wear clothing and protective clothing
2 Engineering and laboratory safety
3 Activeness in the laboratory
4 Accuracy and precision of results
5 Interim report
Figure 1. Formula Formula Gregory
A : The number of items that are less relevant by both panelists
B : The number of items that are less relevant according to the first panel and relevant
according to panelists II
C : The number of items that are relevant according to the first panel and less relevant
according to panelists II
D : The number of the relevant item by both panelists
Research Procedure
The experimental gruoup was taught scientific approach. The use of the approach performed on laboratory
experiments. The scientific approach consists of 5 points, namely Observing, Questioning, associating,
experimenting, Networking. Conventional classroom learning that is practical in accordance with existing rules
in the university environment. They undergo a learning process using scientific approaches and conventional for
eight weeks. Every practical implementation will be assessed using peer assessment for the experimental class
and teacher assessment for conventional classroom. This assessment is held up to the seventh practical
implementation is resolved. At the end of the practicum was held posttest in experimental classes and
conventional classes. Chronology of the application of peer assessment and teacher assessment are presented in
Figure 2 and Figure 3 below.
Figure 2. Peer Assessment Implementation Flow

Proceeding of the 3rd International Conference on Education, Vol. 3, 2017, pp. 106-113
110
Figure 3. Teacher Assessment Implementation Flow
Data Analysis and Results
Instrument Validation Results
The results of the validation instrument gregory peer assessment using the formula presented in Table 6 below.
Table 6. Summary of Results of Content Validity Test Instruments Peer Assessment
Variable The number of
Indicator CV Conclusion
Peer Assessment Instrument 19 0,95 Analysis can be
continued
Result of Peer and Teacher Assessment
Results of this study was obtained from several assessments on the assessment and peer classroom teacher
classroom assessment. The results of such assessment have been presented in Table 7 and Figure 4. below.
Table 7. Descriptive Between Peers and Teacher Assessment Score
Assessment Aspect Experimental Class
(Peer Assessment Class)
Convensional Class
(Teacher Assessment)
Pretest 87,70 82,14
Laboratory Skills 91,90 86,77
Report 86,32 77,13
Postest 41,56 35,39
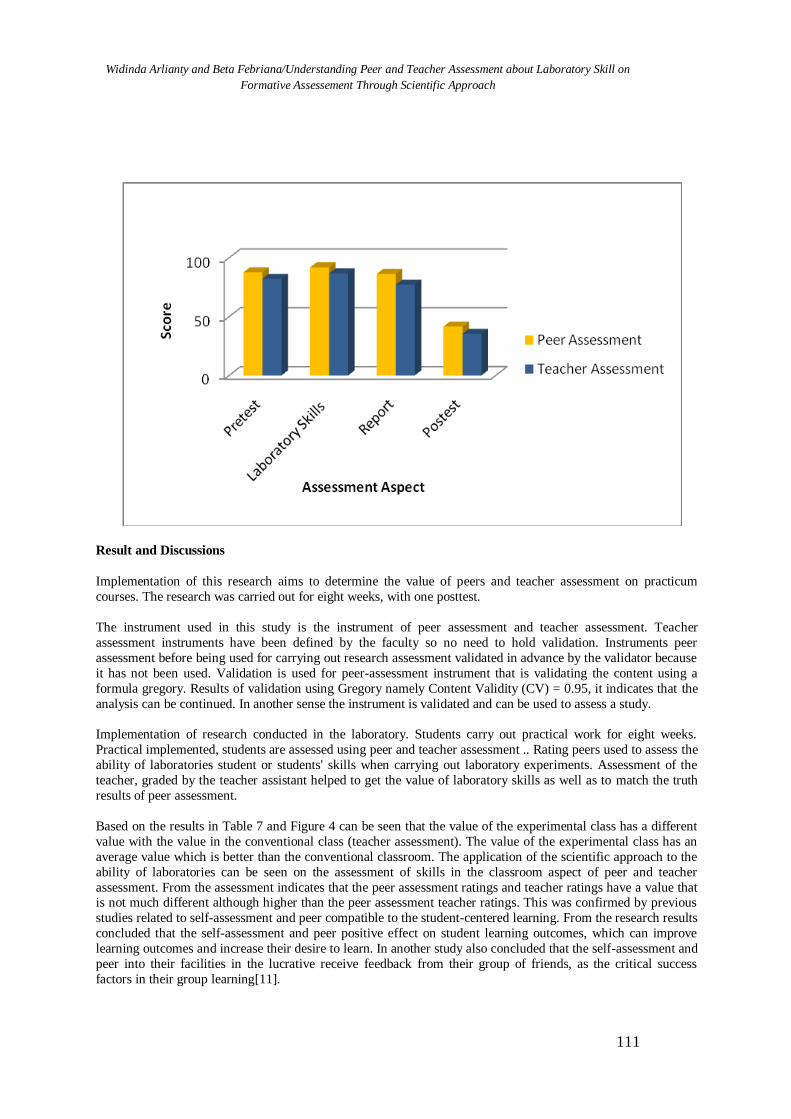
Widinda Arlianty and Beta Febriana/Understanding Peer and Teacher Assessment about Laboratory Skill on
Formative Assessement Through Scientific Approach
111
Result and Discussions
Implementation of this research aims to determine the value of peers and teacher assessment on practicum
courses. The research was carried out for eight weeks, with one posttest.
The instrument used in this study is the instrument of peer assessment and teacher assessment. Teacher
assessment instruments have been defined by the faculty so no need to hold validation. Instruments peer
assessment before being used for carrying out research assessment validated in advance by the validator because
it has not been used. Validation is used for peer-assessment instrument that is validating the content using a
formula gregory. Results of validation using Gregory namely Content Validity (CV) = 0.95, it indicates that the
analysis can be continued. In another sense the instrument is validated and can be used to assess a study.
Implementation of research conducted in the laboratory. Students carry out practical work for eight weeks.
Practical implemented, students are assessed using peer and teacher assessment .. Rating peers used to assess the
ability of laboratories student or students' skills when carrying out laboratory experiments. Assessment of the
teacher, graded by the teacher assistant helped to get the value of laboratory skills as well as to match the truth
results of peer assessment.
Based on the results in Table 7 and Figure 4 can be seen that the value of the experimental class has a different
value with the value in the conventional class (teacher assessment). The value of the experimental class has an
average value which is better than the conventional classroom. The application of the scientific approach to the
ability of laboratories can be seen on the assessment of skills in the classroom aspect of peer and teacher
assessment. From the assessment indicates that the peer assessment ratings and teacher ratings have a value that is not much different although higher than the peer assessment teacher ratings. This was confirmed by previous
studies related to self-assessment and peer compatible to the student-centered learning. From the research results
concluded that the self-assessment and peer positive effect on student learning outcomes, which can improve
learning outcomes and increase their desire to learn. In another study also concluded that the self-assessment and
peer into their facilities in the lucrative receive feedback from their group of friends, as the critical success
factors in their group learning[11].

Proceeding of the 3rd International Conference on Education, Vol. 3, 2017, pp. 106-113
112
Assessment of peer assessment contains the assessment of mastery of laboratory equipment that will be used by
students in the laboratory. Students use a variety of tools such as the chemical laboratory, burette; pippete drop,
volume pipette, stirrer, thermometer, flasks and others. This assessment is carried out in order to give the ability
laboratory students department of chemical education. Peer assessment is carried out in a way students were
divided into several groups. Furthermore, each group will assess the friends in one group. Suppose that in a
group consisting of four members, each member will assess the other three members. Assessment using observation sheet where students are given guidelines and scoring rubric that will be used to assess which have
been validated by a validator. The results of this assessment turned out to be quite a strong effect in addition to
the academic field. Students when assessed by their friends feel that they have to do the best practice, so the
students' performance in the laboratory is maximal. But also did not deny that there are weaknesses of peer
assessment. When students are in a group that feels the same ability, or below, it will plan to judge the same
thing from the whole member. Assessments can be used to cross-check the results of peer assessment is an
assessment of the teacher. Assessment from the teacher is an assessment that has the same goal is to determine
the ability of student laboratories. The results of these assessments are used to minimize the level of subjectivity
peer assessment has been used on previous students.
Implementation of the assessment peer and teacher equally influential on student achievement. From Table 7
shows that the difference between these two values are not much different on each aspect. This difference indicates that the assessment is done through peer assessment provide more opportunities to students in
assessing his friend. Truth values given student can crosscheck through teacher assessment. Formative
assessment can be obtained from a variety of additional value in addition to the laboratory skills such as pretest
assessment and reports. These assessments help provide feedback that can help improve the learning process in
the laboratory. The formative assessment can encourage active learning process student-centered[10]. Feedback
provided by students is an important component that can be used to improve the learning process.
Conclusion
The purpose of this research is to know the difference and similarity between assessment using peer and teacher
assessment with scientific approach to know the ability of laboratory. Based on research that has been done that
peers and teacher assessment affect the ability of the student laboratory. Know the influence of peers and teacher
assessment assessment is important to help students to develop students' freedom in knowing the assessments
performed so that students can learn from the transparency of the existing value to optimize its ability.
Acknowledge
Authors would like to thank the Academic Development Agency (BPA) Islamic University of Indonesia who
have given the opportunity to be one of the recipients Regular Teaching Grant Program in the second semester
of the 2015/2016 academic year.
References
Matsuno, S., 2009, Self, peer, and teacher-assessments in Jananese university EFL writing classrooms,
Language testing, 28 (1),75-100.
Noonan, B., & Duncan, R., 2005, Peer and self-assessment in high school, Practical Assessment Research &
Evaluation, 10 (17), 1-8.
Xin Ma, Millman, R., & Wells, M., 2008, A self and peer assessment intervention in mathematics content
courses for pre-service elementary school teacher.
Kiliq, E, D., 2007, Measure for university student’ attitude towards peer assessment, Sanliurfa: Harran
University
Majduddin, Khadijah., 2010, Peer assessment alternative to traditional testing. Teheran: University of Tehran.
Rifa`i, A., & Catharina, T.A., 2009, Psikologi pendidikan, Semarang: UNNES Press.

Widinda Arlianty and Beta Febriana/Understanding Peer and Teacher Assessment about Laboratory Skill on
Formative Assessement Through Scientific Approach
113
Falchikov, N. & Goldfinch, J, 2000, Student peer assessment in higher education: A meta-analysis comparing
peer and teacher marks. Practical Assessment Research & Evaluation, 70 (3): 287-322
Mac Donald, R.F. & Savin-Baden, M., (2004) “A Briefing on Assessment in Problem-based Learning,” LTSN
Generic Centre Assessment Series. Available on the Higher Education Academy’s Resource.
Kolmos, A. & J.E. Holgaard., 2007, Alignment of PBL and assessment.1stInternational Conference on Research in Higher Education. Honolulu: American Educational Research Association, pp. 1-9.
Wahab, H. F. A., dkk. 2008. Penggunaan penilaian formatif sebagai proses melengkapkan gelung:
satu usaha penembahbaikan. Makalah seminar
Willey, K. & Gardner, A. P., 2007, Investigating the capacity of self and peer assessment to engage student and
incease their desire to learn.

Proceeding of the 3rd International Conference on Education, Vol. 3, 2017, pp. 114-128 Copyright © 2017 TIIKM
ISSN 2424 - 6700 online DOI: https://doi.org/10.17501/icedu.2017.3113
3rd International Conference on Education, 20-22 April 2017, Kuala Lumpur, Malaysia
EVIDENCE-BASED PRACTICE: INCLUSIVE EDUCATION
FOR THE EFFECTIVE IMPLEMENTATION FOR
CHILDREN WITH AUTISM
Emine Ozel Erenand Nik Asilah Nik Ali
Department of Educational Psychology and Counselling, Faculty of Education, Kuala Lumpur,Malaysia
Abstract: Interventions for autism are increasing being held to standards such as ‗evidence-based
practice‘ in psychology and ‗scientifically-based re-search‘ in education. At the factor when these
ideas rose with regards to psychotherapy and regular education, they brought on substantial debate.
Evidence-based practices (EBPs) are the premise on which educators and other specialist coops are
required to outline educational programs for students with autism spectrum disorders (ASD).
Inclusive education as a late modernity reform project is exemplified in the call for ‗Education for
All‘. Despite the simplicity of its message, inclusion is highly debatable. General education teachers
have differing views about the inclusion of students with ASD in mainstream class-rooms. However,
the type and severity of the Autistic children‘s affect teachers‘ willingness to accommodate certain
students and their confidence that they will effectively manage their classrooms. The Implementation
science guides the movement of innovations, such as transforming evidence-based practices for
students with ASD into regular practices at school. This article is presented as an inclusive
educational model to build systems of professional development that increase the quality of services
and promote teachers' use of evidence-based practices. Further, it is proposed that the ASD
community align with the greater inclusive education reform movement.
Keywords: Inclusive education, Autism Spectrum Disorder, Effective Implementation, Evidence-
based practice (EBP)
Introduction
In last decades that an increase in the number of children diagnosed with autism spectrum disorder (ASD)1 to 1
in 68, family interest for protection scope of evidence-based treatments for ASD has increased.(Roanaet.,al.,
2016).The time period evidence-based practice (EBP) has emerge as a commonplace capture phrase over the
last ten years, and connection with it may be observed across a number of disciplines. but, at the same time as
the notion of evidence-based totally practice is becoming an increasing number of usual as an important
attention of teacher work, there is confusion and contradiction concerning its which means. one of the reasons
for this is the variety of complicated terminology related to EBP, which include phrases which includes ‗best
exercise‘, ‗nice evidence‘, and ‗research-based‘, all of which have been used synonymously with EBP, in spite
of differences in their that means (Hornby, Gable & Evans, 2013).
Evidence-based practices (EBPs) are the basis on which teachers and other service providers are required to
design educational programs for learners with autism spectrum dis-orders (ASD).Thus, an increasing number of
students with disabilities, including those with ASD, are being educated in inclusive settings around the world
(Koegel et al. 2012). In the course of recent decades, there has been a common and widespread drive by
international governments towards inclusion as a model for education. In that capacity, inclusion has now
become one of the most crucial educational issues internationally. In the twenty-first century inclusive education
is considered as the right of every child to be a part of mainstream society. Inclusive education mainly has
focused on the position of students with special needs. In many countries these students do not even attend
school, let alone a special one. Implementation science provides guidance for moving in-novation, such as
utilizing evidence- based practices for students with ASD, into regular practice in schools. The principles of
implementation science, the scientific knowledge about evidence-based practices, and the measurement of
program quality into an intervention approach for students with ASD. The purpose of this article is to provide
educators with a defineion and overview of evidence-based practice, outline rules for recognizing compelling
Corresponding Author:EmineOzelEren/[email protected]

EmineOzelEren and Nik Asilah Nik Ali/Evidence-Based Practice: Inclusive Education for the Effective
Implementation for Children with Autism
115
teaching practices and highlight particular resources that educators can utilize students with autism.
Inclusion: Indefinable Constructs
The basic premise underpinning inclusion is that all children, regardless of ability or disability have a basic right
to be educated alongside their peers in their local school. Inclusion is thus generally defined as ―providing
effective learning opportunities for all pupils‖. Article 24 of the UN Convention on the Rights of Persons with
Disabilities recognizes that education should be accessible ―… without discrimination and on the basis of equal
opportunity… within an inclusive education system at all levels…‖. A persist theme in it is generally
recognized, regardless, that kids with handicap keep on experiencing distinctive types of avoidance which differ
contingent on their inability, residence, and the way of life or class to which they have a place(UNICEF, 2013).
In accordance with worldwide guidelines the expression ―students with disabilities‖ refers to those with sensory,
communication, motor, learning disabilities and behavior disorders(WHO,2011). Partly resulting from this
rights-based approach, there is an intense global debate on implementing inclusive education (Cooper and Jacob
2011;Yeung 2012).This has generated an interest among policy-makers, researchers and practitioners on the
question of ―how‖to make education inclusive.
Inclusive education was defined as characterized by:
a logic of acknowledgment and having a place inside a group;
a philosophy of pupil, own family, educator and community collaboration;
a celebration of the variety and value of all pupils;
valuing educating pupils in high-quality schools;
valuing educating pupils alongside their age peers;
valuing educating pupils in mainstream classrooms;
valuing educating pupils in schools in their local community (Salend,2011).
So it is clear from the above that inclusive education and special education are based on different philosophies
and provide alternative approaches to the education of children with special education needs (SEN). In fact, they
are now increasingly regarded as diametrically opposed in their approaches to providing education for children
with SEN. This is a confusing situation for professionals in the field of education as well as for parents of
children with SEN. Inclusion in education is recognized as a basic human right and the foundation for a more
just and equal society (European Agency for Development in Special Needs Education, 2012). Interpretation of
inclusive education is, however, an increasingly contentious term that challenges educators and educational
systems think about the work of teaching and learning in different ways and from varied perspectives (Grima-
Farrell, Bain and McDonagh,2011,p.118). Therefore, inclusive education to represent an entire school concern
and attempts to adjust specialized curriculum to general education in a way that most adequately and
proficiently bestows quality training to all pupils". The issue of value has been a note-worthy drive globally,
supporting the development towards a more inclusive education framework and the path in which consideration
is characterized (Forlin, 2012).It is also possible that the lack of a tight conceptual focus that inclusive education
suffer from may have contributed to the misconception and confused practices (Berlach& Chambers,
2011).Scholars, practitioners, governments, and organizations such as UNESCO and UNICEF have also
provided conceptualizations and definitions of inclusive education.
On the other hand they provide a philosophical framework for inclusive education along with school-based and
classroom-based examples(Berlach& Chambers, 2011). Their philosophical underpinnings consist of the
availability of opportunity; acceptance of disability and/or disadvantage; superior ability and diversity; and an
absence of bias, prejudice, and inequality. Some inclusive education scholars, conceptualize the task of
inclusion as being that which identifies and removes barriers to participation in education (Ainscow, Dyson,
Goldrick, & West, 2011).The special school-regular school dichotomy is no longer a useful way of framing
education, and barriers that exist in both sectors need to be removed to create what is, at last, dis-similar to
irregular school (Slee,2011),Graham and Slee ,2008). That reference to ―Reforming education is a manifold and
complex task that reaches into the deep structures of education and schooling to generate distinctive strategies,
practices and societies(Slee,2011). An extended perspective of inclusive education permits it to be viewed as a
Proceeding of the 3rd International Conference on Education, Vol. 3, 2017, pp. 114-128
116
human rights issue, with marginalized and excluded groups being discriminated against and denied what is
readily available to others in the mainstream.
Following the above definition of inclusion from UNESCO (2012) utilized as a part of this report, schools must
be pre-pared to both acknowledge students with different needs and in addition to carry on in proactive
approaches to eliminate boundaries to empower full attendance. Schools must receive the elements of inclusion,
while in the meantime be set up to dismantle systems and works on prompting to exclusion (Forlin,2013).
Measuring, in this way, includes inspecting consideration from the point of view of an entire school approach,
for example, proffered by the UNICEF (2010),meaning of "Inclusion is really about how well child-friendly
schools are doing at making practical changes so that all children, regardless of their background or ability, can
succeed. Inclusive education became list 10 topics:
1. Provision of information
2. Physical features
3. Inclusive school policies
4. The IEP
5. Student interactions
6. Staffing and personnel
7. External links
8. Assessment of achievement
9. Curriculum
10. Teaching strategies (Winter, E., &O‘Raw, P.,2010).
A variety of measures of these features of inclusion has been developed. To accomplish this, most frameworks
receive an entire school way to deal with measuring parts of getting to, support, approach, educational modules,
instructional method, quality teaching, and appraisal of accomplishment. In light of being signatories to
worldwide traditions, governments are required to give affirmations that inability and differing qualities are
being tended to, particularly inside an inclusive education field. (Donnelly & Watkins, 2011).
The objective of inclusion is that children with disabilities have the capacity to take an interest fully in general
education. Teachers must bolster the youngster's full cooperation in environment and his or her social
integration with ordinarily developing peers. General education teachers ought not simply be required to "follow
the educational programs" but rather to "learn the educational modules". These are the students whose needs
are special that some modifications within the teaching - learning process are a precondition in order to enable
them to fully participate and benefit from the process of inclusive education.
This study will emphasize on the evidence-based teaching strategies that have been found to be very effective
and significant particularly for inclusive classrooms. Evidence-based teaching practices, the movement began in
pedagogy in the mid-nineties. Evidence-based teaching methodologies are obviously determined teaching
techniques that have been shown in research to be effective in bringing about desired outcomes in a delineated
population of learners (Das, 2013).This is the integration of professional expertise, learners' ability and the best
research evidence into the decision-making the process for teaching-learning in the classroom. For teaching-
learning process in inclusive classrooms, evidence-based teaching strategies can play a vital role for quality
learning especially for the students with disabilities.
Characteristics of Students with ASD
Autism is a neurodevelopmental condition that affects social communication in particular. People with autism
also have difficulties with restricted or repetitive behaviors and for many, this includes sensory problems
(American Psychiatric Association 2013).The forthcoming revised edition of the Diagnostic and Statistical
Manual of Mental Disorders (DSM-5) acknowledges this extraordinary inconstancy in the introduction of ASD,
and the related trouble of portraying individual disorders inside the mental imbalance range. DSM-5
consolidates the beforehand separated autistic disorder, Asperger's disorder, youth disintegrative con-fusion, and
inescapable formative issue not generally indicated, into a solitary disorder (autism spectrum disorder)
(American Psychiatric Association 2013).Autism makes it difficult to make sense of the world, disables
conventional insight and results in difficulty under-standing and communicating about internal and external
EmineOzelEren and Nik Asilah Nik Ali/Evidence-Based Practice: Inclusive Education for the Effective
Implementation for Children with Autism
117
states and behaviors (self and others). The way these characteristics manifest and impact on the person with
autism and those around them in both the short and long term depends on the social and environmental context
(Prizant 2015). One of the issues in the inclusion process of students with ASD is the severity of the disability
from student to student .The factors that can make or break the inclusion process are related to the student‘s
functioning in terms of his\her personal\ internal factors such as; social skills, communication and language
skills, stereotypical behavior and other individual abilities (Eldar, Talmor& Wolf-Zukerman (2010).Advocates
of inclusion suggest that placement of children with ASD in general education settings can lead to academic and
social benefits due to reduced isolation and stigma, improved instructor expectations, get admission to an extra
stimulating surroundings, and behavioral models from normal students (Rotheram-Fuller et al. 2010). As
diagnosis rates and public awareness of autism have improved, so too has the variety of therapeutic processes,
strategies and tools on provide, a lot of which might be advertised and advocated through on-line social
networking. These interventions might also include extensive claims of fulfillment connected, in spite of not
having been carefully evaluated (Stansberry-Brusnahan& Collet-Klingenberg, 2010) human beings with ASD
and their families can be stressed and overwhelmed by means of the plethora of ‗medications‘ accessible to
them, and possibly open themselves to intercessions that are incapable or even destructive (Marder& Fraser,
2012). A number of authors have undertaken research and literature reviews to identify interventions for people
with ASD that meet the criteria for EBP (National Autism Center, 2009). At a wide level, there is agreement
that the accompanying elements, as components of administration conveyance models, are supported by
thorough research evidence:
• Individualized supports and programs
• Relatively established and supportive environments
• Supported transitions among settings
• Practical method to behavior management
• Family involvement.
In spite of the fact that research findings are a crucial issue of EBP, other essential elements must be taken into
consideration when designing and delivering programs and interventions for people with ASD. These include
professional judgement; data-based decision making; values and preferences of the client and their family; and
the capacity of the agent to implement an intervention appropriately (National Autism Center, 2009).Teachers
are required to use educational practices based on evidence obtained via quality research.
A New Prospect: Evidence –Based Practice for ASD Students in the Inclusive Education
The evidence-based teaching techniques which have been observed to be very effective and substantial
specifically for inclusive classroom. Evidence-based teaching strategies are clearly specified teaching strategies
that have been shown in controlled research to be effective in bringing about desired outcomes in a delineated
population of students. For teaching learning method inclusive classrooms, evidence-based teaching techniques
can play a crucial function for excellent mastering especially for the students with disabilities (Browder, D. M.,
Wood, L., Thompson, J., &Ribuffo, C.,2014).Professionals serving students with autism spectrum disorders
(ASD) in inclusive classroom settings face the challenge of selecting and successfully implementing evidence-
based intervention strategies. The reason for identifying evidence-based practices is to help consumers and
providers choose among intervention approaches. The principally, was explained, what is a practice. For
instance, after a meticulous literature search and coding procedure, the National Standards Project (NAC, 2009),
on intercessions for people with ASD classified 11 practices as evidence-based:
1. Antecedent package
2. Behavioral package
3. Comprehensive behavioral treatment for young children
4. Joint attention intervention
5. Modeling
6. Naturalistic teaching strategies
7. Peer training package
8. Pivotal response treatment

Proceeding of the 3rd International Conference on Education, Vol. 3, 2017, pp. 114-128
118
9. Schedules
10. Self-management
11. Story-based intervention package (NAC, p.43, 2009; Smith, T., 2013).
Two items in this list, modeling and schedules, are specific cuing procedures that have a wide range of
applications for individuals with and without ASD. Most different objects are combinations of strategies that
change from study to study but, three objects confer with greater standardized packages. Comprehensive
behavioral treatment originated inside the work of on early intensive behavioral intervention (EIBI) for infants
and preschoolers with ASD. It has advanced into many distinctive models, all of which integrate a multiplicity
of intervention approaches that are added 20 to 40 hour per week for 2 to 3 years (Smith, 2011). Crucial reaction
treatment is one way to deal with utilizing naturalistic showing techniques, with need given to practices
recognized by the designers as particularly imperative for advancing youngsters' improvement (Koegel and
Koegel, 2006). Story-based intercession is gotten from a trade-marked program, Carol Gray's Social Stories
(Gray, 2004).As recognized in a sharp analysis, the main normal component of every one of the 11 of these
things is that each is involved mediation strategies or blends that appear to share center characteristic features
(NAC, 2009).An evidence-based practice can be defined as an instructional strategy, intervention, or teaching
program that has resulted in consistent positive results when experimentally tested (Mesibov&Shea, 2011;
Simpson, 2005).The usage of astounding exploration is required all together for mediation methodologies to be
considered an evidence-based practice(Odom, Collet-Klingenberg, Rogers, & Hatton, 2010). In addition to,
further define ―quality‖ as research that incorporates experimental, quasi-experimental, or single-subject
research designs; is replicated multiple times, and is published in peer reviewed professional journals (Boutot
and Myles,2011).
Therefore, research excludes evidence this is supported by means of anecdotal reviews, case research, and
booklet in non- refereed journals, magazines, the net, and different media information retailers (Boutot and
Myles, 2011).The idea of proof based practice started in the medicinal field in the 1970s (Odom et al., 2005) and
was embraced into the field of training with the No Child Left Behind (NCLB) Act (NCLB, 2002), in which the
expression " scientifically based research" is said more than a hundred times (Simpson, 2005).Special teachers
are required by expert norms ‗Council for Exceptional Children, 2009‘ and United States government direction
to actualize successful instructive methodologies bolstered by confirmation and research NCLB 2002. As
indicated by Mayton, Wheeler, Menendez, and Zhang (2010), the field of a custom curriculum has been defied
with a critical crevice amongst research and practice. Systems that are bolstered by research are regularly not
put into practice in the classroom.
Furthermore, to assist in enhancing the quality of special education services for children and teenagers with
ASD, much work has gone into identifying EBPs (National Autism Center, 2009; Odom, Collet- Klingenberg,
Rogers, & Hatton, 2010). The resources for determining best practices in autism are more complete and
accessible than in previous years, however, educators face the challenge of being able to accurately identify
those evidence-based practices and then replicate the strategies in the classroom and other educational settings
(Stansberry-Brusnahan& Collet-Klingenberg, 2010). EBP is obligation not only for the field of a specialized
curriculum, as well as particularly those teachers liable for teaching children with autism to have firsthand
knowledge of evidence-based practices to assist limit the gap among research and exercise. As indicated by the
‗‘National Research Council 2001‘‘, the training of educators and school faculty is the essential method for
guaranteeing that evidence- based coaching procedures are connected when working with pupils with autism.
Educators have the benefit of directly being capable of becoming aware of every pupil's special needs and
objectives; when they have the information of evidence- based practice in the classroom they are better prepared
to coordinate the techniques to the individual needs of every pupil served (Simpson, 2005).For educators
attempting to meet the diverse range of learning needs for children with ASD, decisions regarding the types of
interventions to implement in the classroom and the limited research on numerous strategies can be both
misleading and confusing. Because of that experts' and parental figures' dependence on untested techniques and
reliance on procedures that have constrained confirmation have brought about doubtful and absurd desires for
understudies and have frustrated the potential advance of understudies with ASD (Simpson, 2005).It is vital for
educators, directors, and other school personnel to be informed about evidence- based methods to deal with
satisfactorily address the necessities of pupils with autism.

EmineOzelEren and Nik Asilah Nik Ali/Evidence-Based Practice: Inclusive Education for the Effective
Implementation for Children with Autism
119
Perspectives on Evidence-Based Concepts and Autism
There are several clear benefits of an evidence-based approach to autism treatment. The many years in the past
empiricism placed an give up to psychodynamic speculations approximately parental the many years in the past
empiricism placed an give up psycho-dynamic speculations approximately parental pathology because the cause
of autism (Mesibov, G. B., &Shea, V. (2011).Also, empiricism maintains to allow the field to transport past
testimonials and anecdotes from family participants, which in autism have resulted in a few specifically
facilitated communication; the management of secretin; chemical chelation of the blood. Add on, empiricism in
academic settings can probably counterbalance factors which includes historical traditions, philosophical
developments, and political pressures that influence how services for students with autism are prepared and
introduced. The Evidence-Based, Individualized Program for Students with Autism (EBIPSA), developed by the
NPDC, is an example of such a model. EBIPSA depends on the careful specifications of goals (i.e., behavioral
targets or skills), an underlying foundation of program quality, identification of specifically focused intervention
practices, implementation with a high degree of fidelity, and training for service providers to ensure ongoing
fidelity of implementation. A conceptual framework for this model appears in Figure 1.
Influences
Process
Model Features
Figure 1. The conceptual framework of the Evidence-Based, Individualized Program for Students with Autism
(EBIPSA)(Odom et al.2012)
Evidence-Based, Individualized Program for Students with Autism
Goals. As with any program of systematic instruction or intervention, carefully specifying the learner‘s goals,
which are also the desired outcomes, is essential. In educational systems, Individualized Family Service Plans
(IFSP), Individualized Education Plans (IEP), and Individualized Transition Plans (ITPs) specify goals and
benchmarks. Considerations of the requirements of the current and future environments also are critical for
designing programs that will operate in inclusive settings for school-age children and youth with ASD.
Characteristics of well-developed goals are that they are measurable, functional, and generalizable
(Kurth&Mastergeorge, 2010).
Selection of focused intervention practices. In an individualized intervention approach, the selection of a
specifically focused intervention is based on the goals identified, the characteristics of the individuals, and
characteristics of the current environment. The teacher/therapist/service provider‘s capacity to deliver the
intervention for instance, the professional development, training, the support they have received in the student‘s
current setting is also a critical part of the decision-making process. For example, some interventions may
Future
Environment
Family and
Student
Priorities
Current
Environment Student
Characteristic
GOALS
Social
Communication Behavior
Selection Of EBP Implementation Outcomes
Professional Development
Technical Assistance &Support
Program Quality
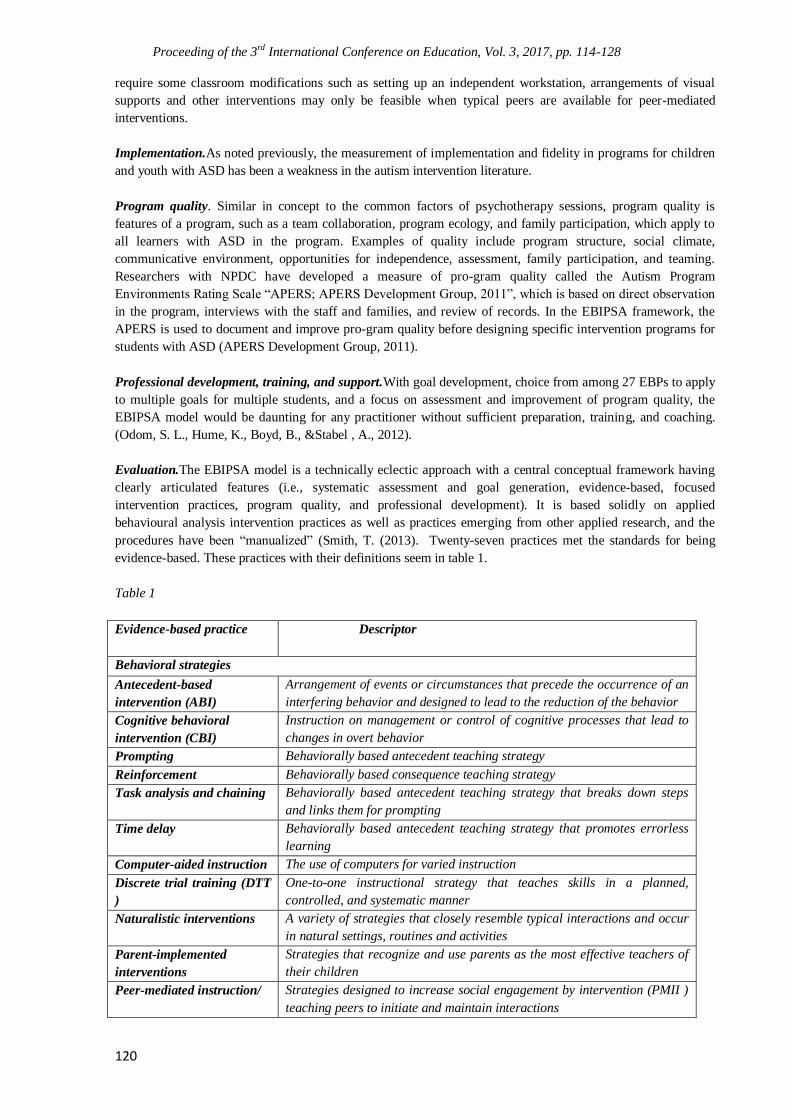
Proceeding of the 3rd International Conference on Education, Vol. 3, 2017, pp. 114-128
120
require some classroom modifications such as setting up an independent workstation, arrangements of visual
supports and other interventions may only be feasible when typical peers are available for peer-mediated
interventions.
Implementation.As noted previously, the measurement of implementation and fidelity in programs for children
and youth with ASD has been a weakness in the autism intervention literature.
Program quality. Similar in concept to the common factors of psychotherapy sessions, program quality is
features of a program, such as a team collaboration, program ecology, and family participation, which apply to
all learners with ASD in the program. Examples of quality include program structure, social climate,
communicative environment, opportunities for independence, assessment, family participation, and teaming.
Researchers with NPDC have developed a measure of pro-gram quality called the Autism Program
Environments Rating Scale ―APERS; APERS Development Group, 2011‖, which is based on direct observation
in the program, interviews with the staff and families, and review of records. In the EBIPSA framework, the
APERS is used to document and improve pro-gram quality before designing specific intervention programs for
students with ASD (APERS Development Group, 2011).
Professional development, training, and support.With goal development, choice from among 27 EBPs to apply
to multiple goals for multiple students, and a focus on assessment and improvement of program quality, the
EBIPSA model would be daunting for any practitioner without sufficient preparation, training, and coaching.
(Odom, S. L., Hume, K., Boyd, B., &Stabel , A., 2012).
Evaluation.The EBIPSA model is a technically eclectic approach with a central conceptual framework having
clearly articulated features (i.e., systematic assessment and goal generation, evidence-based, focused
intervention practices, program quality, and professional development). It is based solidly on applied
behavioural analysis intervention practices as well as practices emerging from other applied research, and the
procedures have been ―manualized‖ (Smith, T. (2013). Twenty-seven practices met the standards for being
evidence-based. These practices with their definitions seem in table 1.
Table 1
Evidence-based practice Descriptor
Behavioral strategies
Antecedent-based
intervention (ABI)
Arrangement of events or circumstances that precede the occurrence of an
interfering behavior and designed to lead to the reduction of the behavior
Cognitive behavioral
intervention (CBI)
Instruction on management or control of cognitive processes that lead to
changes in overt behavior
Prompting Behaviorally based antecedent teaching strategy
Reinforcement Behaviorally based consequence teaching strategy
Task analysis and chaining Behaviorally based antecedent teaching strategy that breaks down steps
and links them for prompting
Time delay Behaviorally based antecedent teaching strategy that promotes errorless
learning
Computer-aided instruction The use of computers for varied instruction
Discrete trial training (DTT
)
One-to-one instructional strategy that teaches skills in a planned,
controlled, and systematic manner
Naturalistic interventions A variety of strategies that closely resemble typical interactions and occur
in natural settings, routines and activities
Parent-implemented
interventions
Strategies that recognize and use parents as the most effective teachers of
their children
Peer-mediated instruction/ Strategies designed to increase social engagement by intervention (PMII )
teaching peers to initiate and maintain interactions
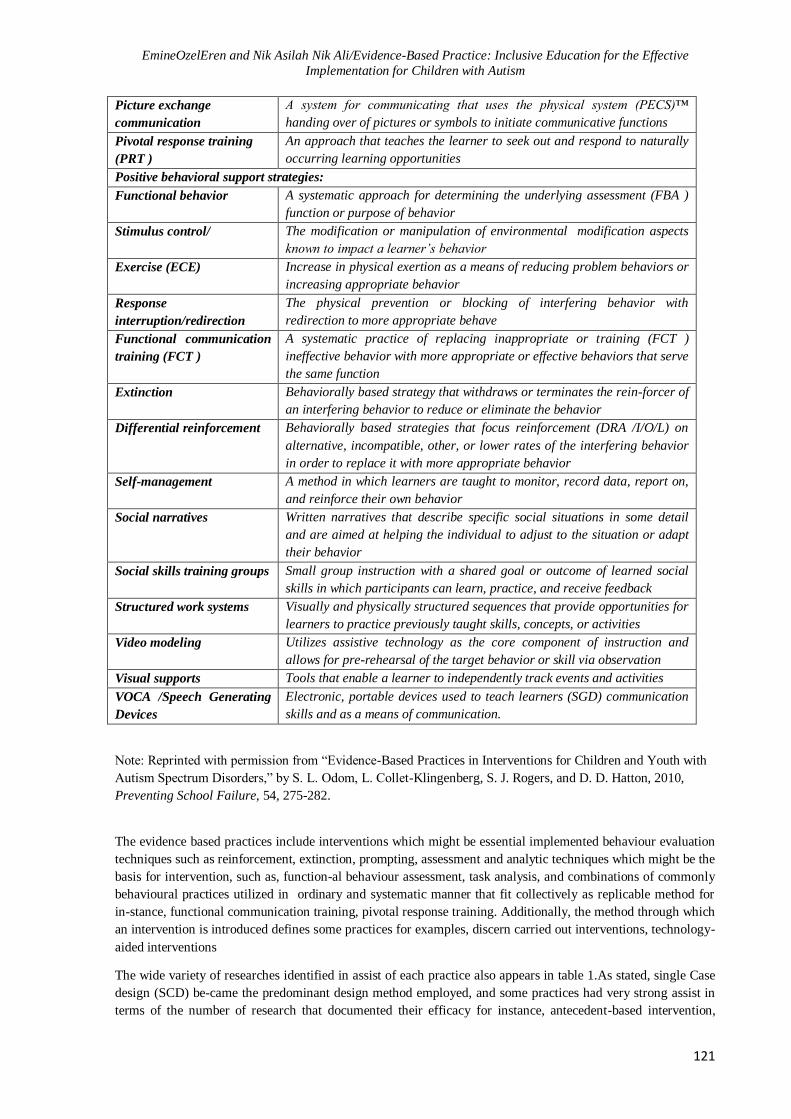
EmineOzelEren and Nik Asilah Nik Ali/Evidence-Based Practice: Inclusive Education for the Effective
Implementation for Children with Autism
121
Picture exchange
communication
A system for communicating that uses the physical system (PECS)™
handing over of pictures or symbols to initiate communicative functions
Pivotal response training
(PRT )
An approach that teaches the learner to seek out and respond to naturally
occurring learning opportunities
Positive behavioral support strategies:
Functional behavior A systematic approach for determining the underlying assessment (FBA )
function or purpose of behavior
Stimulus control/
The modification or manipulation of environmental modification aspects
known to impact a learner’s behavior
Exercise (ECE) Increase in physical exertion as a means of reducing problem behaviors or
increasing appropriate behavior
Response
interruption/redirection
The physical prevention or blocking of interfering behavior with
redirection to more appropriate behave
Functional communication
training (FCT )
A systematic practice of replacing inappropriate or training (FCT )
ineffective behavior with more appropriate or effective behaviors that serve
the same function
Extinction
Behaviorally based strategy that withdraws or terminates the rein-forcer of
an interfering behavior to reduce or eliminate the behavior
Differential reinforcement
Behaviorally based strategies that focus reinforcement (DRA /I/O/L) on
alternative, incompatible, other, or lower rates of the interfering behavior
in order to replace it with more appropriate behavior
Self-management A method in which learners are taught to monitor, record data, report on,
and reinforce their own behavior
Social narratives
Written narratives that describe specific social situations in some detail
and are aimed at helping the individual to adjust to the situation or adapt
their behavior
Social skills training groups
Small group instruction with a shared goal or outcome of learned social
skills in which participants can learn, practice, and receive feedback
Structured work systems
Visually and physically structured sequences that provide opportunities for
learners to practice previously taught skills, concepts, or activities
Video modeling Utilizes assistive technology as the core component of instruction and
allows for pre-rehearsal of the target behavior or skill via observation
Visual supports Tools that enable a learner to independently track events and activities
VOCA /Speech Generating
Devices
Electronic, portable devices used to teach learners (SGD) communication
skills and as a means of communication.
Note: Reprinted with permission from ―Evidence-Based Practices in Interventions for Children and Youth with
Autism Spectrum Disorders,‖ by S. L. Odom, L. Collet-Klingenberg, S. J. Rogers, and D. D. Hatton, 2010,
Preventing School Failure, 54, 275-282.
The evidence based practices include interventions which might be essential implemented behaviour evaluation
techniques such as reinforcement, extinction, prompting, assessment and analytic techniques which might be the
basis for intervention, such as, function-al behaviour assessment, task analysis, and combinations of commonly
behavioural practices utilized in ordinary and systematic manner that fit collectively as replicable method for
in-stance, functional communication training, pivotal response training. Additionally, the method through which
an intervention is introduced defines some practices for examples, discern carried out interventions, technology-
aided interventions
The wide variety of researches identified in assist of each practice also appears in table 1.As stated, single Case
design (SCD) be-came the predominant design method employed, and some practices had very strong assist in
terms of the number of research that documented their efficacy for instance, antecedent-based intervention,

Proceeding of the 3rd International Conference on Education, Vol. 3, 2017, pp. 114-128
122
differential reinforcement, prompting, reinforcement, video-modelling that different practices had strong assist
from research the use of either SCD or group design methodology such as, parent implemented interventions,
social narratives, social skills training, technology-aided training, and intervention, visual helps. However any
practices have been completely supported through group design methodologies.
Teacher and Peers Experiences In Inclusive Settings
It is essential to understand the current practices used to foster inclusive education for students with autism
spectrum disorders (ASDs) as well as factors related to the implementation of classroom interventions. An
important factor in deter-mining the success of inclusion is the attitude of the teacher. Teachers‘ attitudes toward
inclusion vary across the educational field, and numerous studies have involved teachers‘ attitudes toward
inclusion. As appeared in the accompanying audit, some of these reviews utilized the term joining or main-
streaming, though others utilized inclusion. Regardless of the distinctive phrasing, all appeared to allude to a
circumstance in which a class, a school, or an instructive framework tries to address the issues of students with
special needs.
The attitude of students with autism towards socializing with peers was mixed; some preferred to spend time by
them-selves, others enjoyed socializing as long as it was in the con-text of a conversation of interest to them,
while others found coping with ‗normal‘ social and academic daily situations stressful (Saggers, Hwang, and
Mercer 2011; Sciutto et al. 2012).Typical peers were willing to assist students with autism and support
communication with them in class but this was less evident during recess. Teachers felt that they were required
to facilitate interaction between students with autism and their peers (Soto-Chodiman, Pooley, and Taylor 2012).
The tendency for students with autism to behave differently from their peers and their difficulties or lack of
skills in responding to social situations resulted in students with autism experiencing isolation, teasing and
bullying, which were perceived by students, parents and education professionals to be frequently encountered by
students with autism (Gray and Donnelly 2013; Hedges et al. 2014; Humphrey and Lewis 2008; Humphrey and
Symes 2011; Johansson 2014; Saggers, Hwang, and Mercer 2011; Sciutto et al. 2012)
UNESCO (1994), various international declarations enacted on inclusive education have given the rights to all
children to access education in mainstream settings. Research had demonstrated that youngsters with disabilities
displayed better social skills and educational success when they found out in the same environment with their
normally developing students (Koegel et al.2011).Inclusive education is very crucial because it affords to get
admission to high-quality education for children with disabilities. Isolation in education reasons worry,
discrimination, and prejudice in the direction of human beings with the disability. All children need an
education so as to assist them in constructing friendship and prepare them for future lifestyles. On top of this,
inclusive schooling assists youngsters with disabilities in decreasing the anxiety in building friendship and
achieving respect from without disability students.The importance of reforming teacher education to success-
fully implement inclusive education has been recognized for many years (Armstrong, &Spandagou, 2010;
Forlin, Loreman, & Sharma, 2014; Savolainen, Engelbrecht, Nel, &Malinen, 2012).According to Forlin,
(2013),teacher education globally, however, has not yet responded to this call. In a comprehensive review of
research on teacher and inclusive education commissioned by UNESCO, Rieser (2013),reported that:
The providers of education for pre-service teachers around the world are still largely operating from a teacher-
centered pedagogy and have little recent and relevant experience. They do not teach inclusive education
principles. When children with disabilities are covered it is in discrete courses based upon the old deficit
medical model approach. Student teachers and their educators have little practical experience in inclusive
settings. Teacher educators have low status and little scrutiny of what they are doing and how effective it is.
There is a reticence amongst the more progressive academics to use categorical approaches to impairment for
fear of regressing into segregate medical model approaches (Reiser, 2013, p. 136).Furthermore inclusive
schooling quality teacher training will become important to make certain that principals and teachers are
cognizant of the knowledge of inclusive education and the way to guide newcomers with ASD students in their
classes. In general education settings, focusing at the attitudes of teachers in the direction of youngsters with
autism is crucial because it can provide an invaluable source of in-formation used .Within the improvement of
teacher education and professional development applications(Park &Chitiyo, 2011).The significance of teachers
within the successful implementation of inclusion is obvious considering that teachers are the people charged
with enforcing and facilitating inclusive practice with all youngsters in a mainstream setting (Boyle et al., 2012).

EmineOzelEren and Nik Asilah Nik Ali/Evidence-Based Practice: Inclusive Education for the Effective
Implementation for Children with Autism
123
VII. FAMILIES WITH CHILDREN WITH ASD and THEIR EXPERIENCES in the INCLUSIVE
EDUCATION
This system know-how that parents need to additionally keep in mind that they also play a crucial function in
supporting their toddler in addition to the classroom teacher for the a success implementation of inclusive
practices. Inclusion for policy makers could suggest that families and youngsters who have been excluded for
decades (e.g., youngsters with disabilities) technique a school to sign up their child. Most significantly, it also
approach that the school gets the essential assist to teach the child (Sharma, U.2011).
Close collaboration between families and schools is an effective way to create a successful home-school
partnership. Family involvement and communication between the home and school are vital in special
education. Using a communication log or notebook that the inclusion teacher, the special education teacher, and
parents can send back and forth daily or weekly to help maintain communication is indeed crucial. The student
will feel more a part of the mainstream education classroom if his or her teacher and parents are on the same
page and in regular communication (Boutot, 2007). Also, it is recognized that parents play a key role for the
ASD treatment. More specifically, physicians and other healthcare professionals can provide support to parents
by educating them about ASD; providing anticipatory guidance; training and involving them as co- therapists;
assisting them in obtaining access to re-sources; providing emotional support through traditional strategies such
as empathetic listening and talking through problems(Marcus, Kunce&Schopler, 2005).
Parental involvement not only benefits students and creates active participation by the parents in the school
community, but also increases parental satisfaction in the processes related to inclusive education(Timmons and
Breitenbach, 2004).Parents‘ choice of not to have their child formally diagnosed created issues for educators,
such as ineligibility for resources, and made managing concerns from other parents more challenging.
Educators‘ perceived lack of disclosure made creating an atmosphere of peer acceptance and promoting peer
understanding more difficult and increased the risk of students with autism being excluded (Lindsay et al. 2013)
Parents viewed inclusion as providing their child with a better chance of a ‗normal‘ daily life .
Discussion
A current audit of studies utilizing single-case research plans demonstrated an adequate number of studies with
methodological quality giving empirical evidence to bolster the utilization of behaviorally based interventions as
the method for enhancing social attitudes of pupils with ASD in general education (Camargo et al. 2014).As a
consequence of that significant factors concerning their effectiveness in inclusive classrooms nevertheless is
require to be addressed. Despite the fact that present research provide treasured information which could assist
teachers and practitioners to choose evidence based practices to facilitate social interaction of youngsters with
ASD in general education, additional information remains needed.
The large increase in the number of students with an autism educational classification (Pinborough-Zimmerman
et al.,2012),combined with budgetary worries in urban school areas, represents a pickle to teachers, managers,
and parents. Members illustrated the numerous and shifted difficulties to giving best practices to ASD treatment
in government funded schools, some of which are reliable with past research (Kasari and Smith, 2013;
Lindstrom,2013).
It is crucial that, adjusting the configuration of training and the medicines themselves may bring about
mediations that are all the more viably dispersed (Iadarolaet. Al.2015).Despite the fact that, for teachers who are
as of now loaded with expert advancement exercises, online or video guideline may help them get to ASD-
particular preparing all the more effectively. Concerning, modular approaches (Kasari and Smith, 2013), and
school-wide programs are called ―Positive Behavioral Interventions and Supports‖ (Horner et al., 2009) are
individualized and evidence-based. These mediations adopt a more extensive strategy than a portion of the
specific procedures, for example, discrete trial preparing to utilized for pupils with ASD, and they, in this way,
might be less demanding to coordinate into existing proficient advancement learning activities.
According to education professionals, inclusion provided students with autism the opportunity to engage in
more academic tasks, and the use of class-wide strategies to address behavior and social issues which benefitted
all students (Sansosti and Sansosti 2012).Social communication characteristics of autism and relation-ships

Proceeding of the 3rd International Conference on Education, Vol. 3, 2017, pp. 114-128
124
emerge as a key mediator of success school. All aspects of school life from learning in class to relating to peers
in the playground were perceived by stakeholders to be negatively impacted by student communication
limitations.
Meanwhile, a crucial enabler for the implementation of EBPs is having effective professional improvement for
teachers. That enlightened professional improvement consists of several key factors (Odom,2009). First, team
building and collaboration need to be constructed into the method. Second, specialists or coaches ought to
provide demonstrations of the EBPs in class-room settings and observe up with remarks to teachers on their use
of EBPs. Third, teachers ought to form groups of practice with the intention to share information and reflections
on the advent of EBPs into their classrooms. Fourth, on-line resources, together with video clips of EBPs being
utilized in lecture room settings, can be accessed to provide useful facts and tips on their use. Fifth, internet-
primarily based video and interactive structures, consisting of wikis and video remarks, may be used to assist the
implementation of EBPs. Besides the want for powerful expert improvement and step-by way of-step tactics for
implementing EBPs, it is also essential for the successful use and maintenance of EBPs that instructors have
assist in using them (Torres, Farley, & cook, 2012).
This support desires to come back from each faculty administrators and instructors‘ colleagues, including
mainstream lecture room teachers and experts in inclusive and special training. It is good to set up a network of
exercise so teachers can help each other inside the use of EBPs. They are able to then proportion their stories
and produce practice-based evidence to monitor and evaluate the effectiveness of EBPs of their unique settings.
The parents and educators said positive and negative outcomes in phrases of the attitude of others closer to
students recognized with autism suggesting know-how of the diagnosis led to ‗autistic expectancies‘ of
youngsters even as the lack of expertise ended in misunderstanding of ‗autistic‘ behaviors and elevated the risk
of exclusion. However, educators felt strongly that labeling resulted in get admission to resources. even as most
parents believed that inclusion gave their kids a better risk to have a ‗normal existence‘, simplest a mild majority
expressed satisfaction with the inclusion of their child suggesting that many believed main-stream placement
was not working for their child. There has been an extensive gap inside the studies when it comes to the
perspectives of people with autism, and as an end result, lack of expertise about their perspective of the problem.
Conclusion
This article that there is now an extensive and rapidly growing international literature on evidence-based
practice in education. Increasing numbers of students with autism enrolled in mainstream schools mean it is
highly likely that teachers will have one or more students with autism in their classes each year. Autism is no
longer a rare condition or only the preserve of special education, students with autism are increasingly the
business of regular schools, yet what little we know of educational outcomes for these students to date suggests
that students with autism are not doing as well as we would expect given their evident cognitive abilities, or
compared to other students with and without disabilities. For students with disabilities, education will support
their inclusion into regular education through the use of strategies, systems and particular materials. Meanwhile,
for those special needs students such as ASD pupils not ready to be incorporated into regular education
classrooms, an inclusive education program will be created to react to their individual adapting needs. This
inclusive education program incorporates introduction to parents and additionally guardians and to educators in
fundamental training that get students\ with special educational needs‘‘ school in life.
Fortunately, the emerging field of implementation science may provide the needed guidance for such a
translational process (Fixsen, Blase, Metz, & Van Dyke, 2013), and professional development models for
teachers and service providers working with children and youth with ASD have begun to adopt an
implementation science approach (Odom, Cox, & Brock, 2013).All of this points to the fact that from science to
practice is a clear challenge and furthermore an imperative next stride for the field (Wong et al.,2014). One
approach to improving services to students with ASD enrolled public school programs is through professional
development. Consequently, that successful implementation of EBP, is dependent on a multilayered, problem
solving process, that must explore the delicate balance between research, the practitioner as a teacher and the
pupils and parents.

EmineOzelEren and Nik Asilah Nik Ali/Evidence-Based Practice: Inclusive Education for the Effective
Implementation for Children with Autism
125
References
Ainscow, M., Dyson, A., Goldrick, S., & West, M. (2011). Developing equitable education systems.
Abbingdon, UK: Routledge.
American Psychiatric Association. 2013. Diagnostic and Statistical Manual (DSM-5). 5th ed. Arlington, VA:
American Psychiatric Publishing.
APERS Development Group. (2011). Autism Program Environment Rating Scale (preschool/ elementary and
middle/high school). Chapel Hill: National Professional Development Center on ASD, FPG Child Development
Institute, University of North Carolina at Chapel Hill.
Armstrong, A.C., Armstrong, D.A., and Spandagou, I. (2010) Inclusive Education: International Policy and
Practice, London: Sage Publications. Journal of Research in Special Educational Needs, 10(3). DOI:
10.1111/j.1471-3802.2010.01177_2.x
Berlach, R. G., & Chambers, D. (2011). Inclusivity imperatives and the Australian National Curriculum. The
Educational Forum, 75 (1), 52-65.
Boutot, E. (2007). Fitting in: Tips for promoting acceptance and friendships for students with autism spec-trum
disorders in inclusive classrooms. Intervention in School and Clinic, 42, no. 3: 156–61. doi: 10.1177/1053451
Boutot, E. A., & Myles, B. S., (2011). Autism spectrum disorders: Foundations, characteristics, and effective
strategies. Pearson Education, Inc.: Upper Saddle River, NJ.
Boyle, C., Topping, K., Jindal-Snape, D., & Norwich, B. (2012). The importance of peer support for teaching
staff when including children with special educational needs. School Psychology International, 33(2), 167–184.
doi:10.1177/0143034311415783
Browder, D. M., Wood, L., Thompson, J., &Ribuffo, C. (2014). Evidence-based practices for students with
severe disabilities (Document No. IC-3). Retrieved from University of Florida, Collaboration for Effective
Educator, Development, Accountability, and Reform Centerwebsite:
http://ceedar.education.ufl.edu/tools/innovation-configurations
Camargo, S. P. H., Rispoli, M., Ganz, J., Hong, E., Davis, H., & Mason, R. (2014). A review of the quality of
behaviorally-based intervention research to improve social interaction skills of children with ASD in inclusive
settings. Journal of Autism and Developmental Disorders, 44, 2096–2116.
Cooper and Jacob (2011) From Inclusion to Engagement: Helping Students Engage with Schooling through
Policy and Practice ISBN: 978-0-470-66484-1258 pages
Das, Asim 2013, Identifying Evidence-Based Teaching Strategies that Teachers Use in Inclusive Primary Class-
rooms in Southern Bangladesh.Journal of Educational and Social Research MCSER Publishing, Rome-Italy
Vol. 3 No. 7 October 2013 Doi:10.5901/jesr.2013.v3n7p639639
Donnelly, V., & Watkins, A. (2011).Teacher education for inclusion in Europe. Prospects, 41, 341–353. doi:
10.1007/s11125-011-9199-1
Eldar, E., Talmor, R., & Wolf-Zukerman, T. (2010).Successes and difficulties in the individual inclusion of
children with Autism Spectrum Disorder (ASD) in the eyes of their coordinators, International Journal of
Inclusive Education, 14(1), 97-114
Fixsen, D., Blase, K., Metz, A., & Van Dyke, M. (2013). Statewide implementation of evidence-based
programs. Exceptional Children, 79, 213-232.
Forlin, C. (2013). Issues of Inclusive Education in the 21st Century. Journal of Learning science No.6, 67-81.
Forlin, C. (Ed.). (2012). Future directions for inclusive teacher education: An international perspective. New
York: Routledge.
Forlin, C., Loreman, T., & Sharma, U. (2014). A system-wide professional learning approach about inclusion
for teachers in Hong Kong. Asia-Pacific Journal of teacher Education, 42(3),247-260.

Proceeding of the 3rd International Conference on Education, Vol. 3, 2017, pp. 114-128
126
Graham, L.J., &Slee, R. (2008). An illusory interiority: Interrogating the discourse/s of inclusion. Educational
Philosophy and Theory, 40(2), 247–60.
Gray, C.A. (2004). Social Stories™ 10.1: The new defining criteria and guidelines. Jenison Autism Journal:
Creative Ideas in Practice, 15(4), 2—21.
Grima-Farrell, C. R., Bain, A., &McDonagh, S. H. (2011). Bridging the research-to-practice gap: A review of
the literature focusing on inclusive education. Australasian Journal of Special Education, 35(2), 117–136.
DOI:10.1375/ajse.35.2.117.
Hornby, G., Gable, R. A., & Evans, W. (2013). Implementing evidence-based practice in education: What
international literature reviews tell us and what they don‘t.Preventing School Failure: Alternative Education for
Children and Youth, 57(3), 119-123.
Horner, R., Sugai, G., Smolkowski, K., Eber, L., Nakasato, J., Todd, A., & Esperanza, J., (2009). A randomized,
wait-list controlled effectiveness trial assessing schoolwide positive behavior support in elementary schools.
Journal of Positive Behavior Interventions, 11, 133-145.
http://dx.doi.org/10.1080/1359866X.2014.906564
Humphrey, N., and S. Lewis. 2008. ―‗Make Me Normal‘: The Views and Experiences of Pupils on the Autistic
Spectrum in Mainstream Secondary Schools.‖ Autism 12: 23–46.
Humphrey, N., and W. Symes. 2011. ―Peer Interaction Patterns among Adolescents with Autistic Spectrum
Dis-orders (ASDs) in Mainstream School Settings.‖ Autism 15: 397–419.
Iadarola, S., S. Hetherington, C. Clinton, M. Dean, E. Raeisinger, L. Huynh, J. Locke, et al. 2015. ―Services for
Children with Autism Spectrum Disorder in Three, Large Urban School Districts: Perspectives of Parents and
Educators.‖ Autism19: 694–703.
Johansson, S. 2014. ―‗He Is Intelligent but Different‘: Stakeholders‘ Perspectives on Children on the Autism
Spectrum in Urban Indian School Context.‖ International Journal of Disability, Development and Education 61:
416–433.
Kasari C and Smith T (2013) Interventions in schools for children with autism spectrum disorder: methods and
recommendations. Autism 17: 254–267.
Koegel, L., Kuriakose, S., Singh, A., &Koegel, R. (2012).Improving generalization of peer socialization gains in
inclusive school settings using initiations training. Behavior Modification, 36(3), 361–377.
Koegel, L., Matos-Fredeen, R., Lang, R., &Koegel, R. (2011). Interventions for children with autism spectrum
disorders in inclusive school settings. Cognitive and Behavioral Practice, 18(3), 421–588.
Koegel, R. L., &Koegel, L. K. (2006). Pivotal response treatments for autism: Communication, social, and
academic development. Baltimore, MD: Paul H Brookes Publishing.
Kurth J, Mastergeorge A (2010) Academic and cognitive profiles of students with autism: implications for class-
room practice and placement. International Journal of Special Education 25(2): 8–14.
Lindsay S, Proulx M, Thomson N, Scott H. (2013)Exploring educator's challenges of including children with
autism spectrum disorder in mainstream classes. International Journal of Disability, Development and
Education;60:347–362
Lindstrom JH (2013) Introduction to the special issue: response to intervention within the context of specific
learning disabilities, emotional disturbance, autism spectrum disorders, and early childhood special education.
Exceptionality 21: 1–4.
Marcus, L., Kunce, L., &Schopler, E. (2005). Working with families. In F. Volkmar, R. Paul, A.Klin, & D.
Cohen (Eds.), Handbook of autism and pervasive developmental disorders (pp.1055–1086). Hoboken, NJ:
Wiley.
Marder, T., & Fraser, D. (2012). Evidence-based practice for special educators teaching students with autism.
Special Education Journal, (7). Retrieved from
EmineOzelEren and Nik Asilah Nik Ali/Evidence-Based Practice: Inclusive Education for the Effective
Implementation for Children with Autism
127
Mayton, M. R., Wheeler, J. J., Menendez, A. L., and Zhang, J. (2010). An analysis of evidence-based practices
in the education and treatment of learners with autism spectrum disorders. Education and Training in Autism
and Developmental Disabilities, 45, 539-551.
Mesibov, G. B., &Shea, V. (2011). Evidence-based practices and autism. [Review]. Autism, 15(1), 114-133.
National Autism Center (2009). Evidence-based practice and autism in the schools: a guide to providing
appropriate interventions to students with autism spectrum disorders. Randolph, MA: National Autism Center.
Odom, S. L. (2009). The tie that binds: Evidence-based practice, implementation science, and early intervention.
Topics in Early Childhood Special Education, 29, 53-61. http://dx.doi.org/10.U77/0271121408 329171
Odom, S. L., Collet-Klingenberg, L., Rogers, S., & Hatton, D. (2010). Evidence-based practices for children and
youth with autism spectrum disorders. Preventing School Failure, 54, 275-282
Odom, S. L., Cox, A., & Brock, M. (2013). Implementation science, professional development, and autism
spectrum disorders: National Professional Development Center on ASD. Exceptional Children, 79, 233–251
Odom, S. L., Hume, K., Boyd, B., &Stabel, A. (2012). Moving beyond the intensive behavior treatment vs.
eclectic dichotomy: Evidence-based and individualized programs for learners with ASD. Behavior Modification,
36, 270-297. http://dx.doi.org/10.1177 /0145445512444595
Odom, S., Brantlinger, E., Gersten, R., Horner, R., Thompson, B., & Harris, K. (2005). Research in special
education: Scientific methods and evidence-based practices. Exceptional Children,71(2), 137–148.
Park, M. &Chitiyo, M. (2011).An examination of teacher attitudes towards children with autism, Journal of
Research in Special Educational Needs, 11(1), 70 78.
Pinborough-Zimmerman J, Bakian AV, Fombonne E, et al. (2012) Changes in the administrative prevalence of
autism spectrum disorders: contribution of special education and health from 2002–2008. Journal of Autism and
Developmental Disorders 42: 521–530.
Prizant, B. M. 2015. Uniquely Human: A Different Way of Seeing Autism. New York: Simon & Schuster.
Reiser, R. (2013). Teacher education for children with disabilities: a Literature review.p,136
Roane, H. S., Fisher, W. W., &Carr, J. E. (2016). Applied Behavior Analysis as Treatment for Autism Spectrum
Disorder. Journal Of Pediatrics, 17527-32. doi:10.1016/j.jpeds.2016.04.023
Rotheram-Fuller, E., Kasari, C., Chamberlain, B., & Locke, J. (2010). Social involvement of children with au-
tism spectrum disorders in elementary school classrooms. Journal of Child Psychology and Psychiatry, 51(11),
1227–1234.
Saggers B. , Hwang Y.& K.L. Mercer (2011). Your voice counts: Listening to the voice of high school stu-
dents with autism spectrum disorder. Australasian Journal of Special Education, 35, 173–190.
doi:10.1375/ajse.35.2.173
Salend, S. J. (2011). Creating inclusive classrooms: Effective and reflective practices (7thed.). Columbus, OH:
Pearson Education.p-39.
Sansosti, J. M., &Sansosti, F. J. (2012). Inclusion for students with high-functioning autism spectrum disorders:
Definitions and decision making. Psychology in the Schools, 49, 917–931.
Savolainen, H., Engelbrecht, P., Nel, M., &Malinen, O. (2012). Understanding teachers‘ attitudes and self-
efficacy in inclusive education: Implications for pre-service and in service teacher. European Journal of Special
Needs Education, 27(1), 51–68. http://dx.doi.org/10.1080/08856257.2011.613603
Sciutto, M., S. Richwine, J. Mentrikoski, and K. Niedzwiecki. 2012. ―A Qualitative Analysis of the School
Experiences of Students with Asperger Syndrome.‖ Focus on Autism and Other Developmental Disabilities 27
(3): 177–188.
Sharma, U. (2011). Teaching in inclusive classrooms: Changing heart, head, and hand. Bangladesh Education
Journal, 10 (2), 7-18.

Proceeding of the 3rd International Conference on Education, Vol. 3, 2017, pp. 114-128
128
Simpson, R. (2005). Evidence-based practices and students with autism spectrum disorders. Focus on Autism
and Other Developmental Disabilities, 20(3), 140-149.
Slee, R. (2011). The irregular school: Exclusion, schooling, and inclusive education. Abbingdon, UK:
Routledge.
Smith, T. (2013). What is evidence-based behavior analysis ?The Behavior Analyst,36, 7–33.[PubMed],[Web of
Science ®]
Soto, R. E., Pooley, J. , Cohen, L. , & Taylor, M. F. (2012). Students with ASD in mainstream primary
education set-tings: Teachers' experiences in Western Australian class-rooms. Australasian Journal of Special
Education, 36(2), 97-111.
Stansberry- Brusnahan, L. L., & Collet- Klingenberg, L. L. (2010). Evidence-based practices for young children
with autism spectrum disorders: Guidelines and recommendations from the National Resource Council and
National Professional Development Center on Autism Spectrum Disorders. International Journal of Early
Childhood Special Education, 2, 45-56.
Timmons, V., &Breitenbach, M. (2004). A model of teacher support for children with autism: a Prince Edward
Island story. Education Canada, 44(1), 52-53.
Torres, C., Farley, C. A., & Cook, B. G. (2012). A special educator‘s guide to successfully implementing
evidence-based practices. Teaching Exceptional Children, 45, 64–73.
UNESCO (1994) The Salamanca Statement and Frame-work for Action on Special Needs Education.
Salamanca, Spain: UN.
UNESCO (2009)United Nations Educational, Scientifics &Cultural Organization Policy Guidelines on Inclusion
in Education. France: Author.
UNESCO (2012). Education: Addressing exclusion. Retrieved
from:http://www.unesco.org/new/en/education/themes/strengthening-education-systems/inclusiveeducation/.
UNICEF (2010). Assessing child-friendly schools: A guide for program managers in East Asia and the Pacific,
p. 31. Retrieved from: http://www.unicef.org/eapro/Assessing_CFS.pdf.
UNICEF (2013, May). The state of the world‘s children: Children with a disability. Retrieved from:
http://www.unicef.org/publications/files/SWCR2013_ENG_Lo_res_24_Apr_2013.pdf.
WHO (2011).World Health Organization World Report on Disability. Switzerland WHO Press.
Winter, E., &O‘Raw, P. (2010). A literature review of the principles and practices relating to inclusive
education for children with special educational needs. Trim, Ireland: National Council for Special Education.
Wong, C., Odom, S. L., Hume, K. Cox, A. W., Fettig, A., Kucharczyk, S., … Schultz, T. R. (2014). Evidence-
based practices for children, youth, and young adults with Autism Spectrum Disorder. Chapel Hill: The
University of North Carolina, Frank Porter Graham Child Development Institute, Autism Evidence-Based
Practice Review Group.
Yeung, A. S. (2012). Exploring organizational perspectives on implementing educational inclusion in
mainstream schools. International Journal of Inclusive Education, 16(7), 675-690.

Proceeding of the 3rd International Conference on Education, Vol. 3, 2017, pp. 129-136 Copyright © 2017 TIIKM ISSN 2424 - 6700 online DOI: https://doi.org/10.17501/icedu.2017.3114
3rd International Conference on Education, 20-22 April 2017, Kuala Lumpur, Malaysia
ASSESSING TRAINING NEEDS OF TRANSITION
SERVICES FOR TEACHERS OF LEARNING DISABLED
STUDENTS IN THE SECONDARY STAGE IN SAUDI
ARABIA
MunirahAL-Hudaib, Nadia Tazi and Saeed Al-Yamani
Arabian Gulf University, Bahrain
Abstract: This study aimed to identify training needs of transitional services for teachers
of secondary learning-disabled girls in Saudi Arabia, and determine the differences in
training needs of transition services for teachers pursuant to the variables: educational
level, years of experience, and training courses. A descriptive method was used here,
specifically developed to measure these needs. The sample represented all secondary
schools providing learning disabilities programs in Saudi Arabia. Participants included 39
female teachers of learning disabilities during the school year 2015-2016. Results
indicated that teachers of learning-disabled girls lack knowledge and skills to effectively
provide transition services, and need training and qualification in some areas. The most
important areas needing training and their percentagesare Interagency Collaboration
(90.91%), Career Development(77.78%), Transition Planning(50%), Leadership
&Policy(40%), Secondary Academic Programs (33.33%), Family Collaboration (20.00%),
and Assessment (11.11%). Findings showed that teachers no need training courses in
Community-Referenced Curriculum &Programs . Concerning variables, statistically
significant differences existed at the level of training needs for teachers regarding
transition services (0.05%). Teachers’ educational level and years of experience had no
significant effect on teachers’ knowledge and skills for transition services. Results are
discussed and some recommendations are suggested.
Keywords: Training, Needs, Transition, Services
Introduction
Teaching students with learning disabilities (LD)is designed to meet the unique needs of each learner,
aimed to help raise the level of academic achievement, including performance in all academic subjects
and materials, and other aspects such as social and behavioral areas, development of motivation, and
assistance in overcoming difficulties.
Since learning disabilities is a continued process, there are some groups of learning-disabled students
(adolescents with LD) who need additional special services –in essence transitional services (Al-Hadidy&
al-Khatib, 2005).
Transition for students with special needs, from school borders to post-secondary stages, represents a big
problem for them in that they often face great difficultiesthat they cannot overcomein the absence of
transitional services and support for such a group of students (Al-Battal, 2011). It is observed that many
students with special needs, including those with LD, drop out from school or exceed school age and still
lack in academic and social skills to qualify them to obtain and retainemployment(Al-Qaruty, 2005).
Consequently, there is a vital need to find effective, organized transitional programs in proper order to
guide these students and others, and to provide them with direction to proceed from secondary school into
postsecondary education or practical life. For this reason, this type of service has become the cornerstone
of successful special needs programs.
Munirah AL-Hudaib, Nadia Tazi and Saeed Al-Yamani/Assessing Training Needs of Transition Services
for Teachers of Learning Disabled Students in the Secondary Stage in Saudi Arabia
130
Research Problem
The Individuals with Learning Disabilities Education Act (IDEA) in the United States of America (1997,
2004) states that teachers of girls with learning disabilities should possess necessary skills and knowledge
to provide girls with LD with teaching that can help them transit into external life, adapt successfully, and
pursue specific careers or lines of work (Dinglem,Falvey, Givner&Haager, 2004).
The American National Joint Committee on Learning Disabilities argues that many learning-disabled
female students are unaware or ignorant of the fact that there are options and alternatives after secondary
education, due to a failureon the part of their teachers to inform, encourage, support, assist, or prepare
them for the future. This has prompted the committee to consider the necessity of training able teachers to
teach students with LD how to choose an alternative postsecondary education, as well as of how to design
and implement an effective transitional plan suitable to each girl and her own special needs (Levinson &
Palmer, 2005).
Developing a transitional plan and providing its services is critical to help and assist girls with LD,
provided that this plan is extensive and includes several aspects and areas such as teaching, employment,
personal responsibility, relationships, family, and others (National Joint Committee on Learning
Disabilities, 1994). Beard (1991) noted that there are some female teachers of learning-disabled student
who offer these services to girls although they are not well-trained in providing transitional services,
which is a continued challenge facing all teachers today (Blalock, et al., 2003).It has become an urgent
necessity to offer students transitional services by highly qualified and trained teachers to enable LD
students toconfront and overcome their challenges. It is thus critical for teacher education programs to
assure the competences of teachers to enable them to provide effective transitional services (Morgan,
Callow-Heusser, Horrocks, Hoffmann, Kupferman, 2014).
There is an important role to be played byteachers to improve the effectiveness of transitional teaching.
IDEA argues that there are important instructions concerning teachers' qualification and competencies.
For teachers to be qualified in teaching in the transitional process, they should possess sufficient skills
and knowledge to provide transitional services in an effective manner (Morningstar, & Clark, 2003).
Through the researcher's field experience working with schools, it is clear that there is a defect in the
transitional processes from secondary schools to postsecondary stages, and that these services have not
been given due care or attention. In accord, it should be crucial to find organized, effective transitional
programs to guide these girls. Yali, Bassett, and Hutchinon (2009) noted the vital role played by in-
service training to raise the level of learning-disabled girls' teachers in transitional processes, as compared
to pre-service training, underlining that female teachers' training in the transitional field has become an
urgent and desired issue. Thus informed, the research problem of this study is to assess the training needs
associated with transitional services for female teachers of girls with LD at the secondary stage in Saudi
Arabia.
Research Questions
This study attempts to answer the following questions:
1. What are the training needs in transitional services for female teachers of the learning-disabled
girls in Saudi Arabia?
2. Are there differences in training needs to transitional services for female teachers of the
learning-disabled girls in Saudi Arabia according to these variables: years of experience,
qualification, and number of training courses in the field of transitional services?
Purposes
The purpose of this study is:
1. To identify the training needs in transitional services for female teachers of learning-disabled
Corresponding Author:Munirah AL-Hudaib

Proceeding of the 3rd International Conference on Education, Vol. 3, 2017, pp. 129-136
131
girls in Saudi Arabia, and
2. To investigate differences in training needs of transitional services for female teachers of
learning-disabled girls in Saudi Arabia pursuant to these variables: years of experience, degree
ofqualification, and number of training courses in the field of transitional services.
Significance of Research
The significance of this study lies in two aspects: scientific importance and applicability.
First, Scientific Importance
This scientific importance lies in the scarcity of research and studies on training needs in transitional
services in general in the Arab world. To the researcher's knowledge, this is the first study in the Arab
world to examine the training needs in the field of transitional services for female teachers providing
education to girls with LD in Saudi secondary schools.
Second, Importance of Applicability
To identify the training needs in the field of transitional services for female teachers providing education
to girls with LD in Saudi secondary schools may help professionals and personnel in decision-making to
improve the quality of these transitional services in a realistic and feasible manner so that girls with LD
can transit to postsecondary easily. Moreover, this can be an addition to the Arab library by providing a
framework about transitional services for Saudi students with LD.
Limits
Spatial: This study was limited to all secondary schools providing LD programs in four Saudi areas:
Riyadh, Majmaa, Jeddah, and Mecca.
Chronological: Training needs-related data were collected in the school year 2015-2016.
Method
A descriptive method (survey) was used here as it was suitable to the research aim.
Population: The study population consisted of all female teachers of learning-disabled girls in Saudi
secondary schools during the school year 2015-2016.
Participants
The sample consisted of female teachers working with girls with LD in Saudi girls' secondary schools in
the school year 2015-2016. For the shortage of LD teachers in Saudi Arabia a comprehensive sample was
used here (39 teachers).
Instrumentation
A tool was developed specifically for this study based on the Likert-4 point scale to identify the training
needs in the field of transitional services for female teachers providing education to girls with LD in
Saudi secondary schools through a review of literature on the topic of skills and knowledge required by
female teachers in secondary schools to provide effective transitional services to students with LD.
Additionally, some Arab and foreign testing, measures, and surveys concerning teachers' competences in
the field of transitional services to girls with LD were reviewed. The final tool had 69 items regarding
skills that should be available to provide transitional services. The scale items were divided into eight
dimensions with each including transitional planning, assessment, and family collaboration.
Results
The findings related to Question One: "What are the training needs in transitional services for female
teachers of learning-disabled girls in Saudi Arabia?"

Munirah AL-Hudaib, Nadia Tazi and Saeed Al-Yamani/Assessing Training Needs of Transition Services
for Teachers of Learning Disabled Students in the Secondary Stage in Saudi Arabia
132
Table 1 Sample's Needs Concerning Service Areas
Field Mean SD Trend
Community-Referenced
Curriculum & Programs2.880.84 Qualified
Assessment 2.700.77Qualified
Family Collaboration 2.59 0.75 Qualified
Secondary Academic Programs 2.59 0.78 Qualified
Leadership &Policy2.58 0.81 Qualified
Transition Planning 2.57 0.72 Qualified
Career Development 2.41 0.78 Not qualified
Interagency Collaboration 2.33 0.78 Not Qualified
Total Score 2.64 0.88 Qualified
Figure 1 Areas that should be effectively available for transitional services for LD
A set of results were drawn:
At the level of the eight dimensions of the transitional services areas, training needs can be
divided into two main sections: (a) no need to training programs, and (b) a need to training
programs. Generally, the female teachers of the girls with LD need training in the field of
professional development and in civil society organization cooperation.
These teachers do need training in the field of community-referenced programs and curricula.
As seen in table 1 and Figure 1, each mean over 2.50 is considered qualified, whereas a mean less
than 2.50 is considered not qualified.

Proceeding of the 3rd International Conference on Education, Vol. 3, 2017, pp. 129-136
133
The following is a detailed analysis of teacher responses to skills items in each field:
Teachers need to training in assessment:
- Determining relevant jobs based on the assessment findings in terms of girls with LD's interests,
abilities and tendencies.
Teachers need training in family collaboration:
- Training parents in transitional services-related issues
- Communication with various cultural organizations to assure the participation of a large number
of learning-disabled girls' families.
Teachers need training in secondary academic programs:
- Providing classroom teachers with information about transitional services with an aim to include
them in public academic curricula.
- Adapting transitional services to models used in the Ministry of Education.
Concerning other areas, we focus on the most important items:
Teachers need training in politics and leadership:
- Adapting transitional services programs for the with LD as required.
- Using research results in developing transitional service programs for girls with LD.
Teachers need training in transitional planning:
- An individual plan should meet and achieve the transitional services goals related to education,
employment and independent skills for postsecondary girls.
- To involve the families of girls with LD in planning transitional services, coordinating a meeting
plan for transitional services with stakeholders (college special needs center-institutes-
craftsmen).
- To determine labor market needs for postsecondary stage and coordination with relevant
communities and organizations.
Teachers need training in professional development of a high caliber:
- To supply typically developmental girls' female teachers with information to help girls with LD
choose their career and realize its requirements.
- To provide normal classrooms teachers with information concerning career-related behaviours
and skills (job application, work behaviours) and a high-quality level of training.
- To assist girls with LD through modifying learning settings to suit to their abilities.
- To provide a database of available job opportunities for girls with LD in the field of work, study,
internal training, co-operation with authorities related to the labor market and their needs for
employment.
Teachers need training in the field of civil inter-institutional cooperation:
- To providecomprehensive informationfor all such assupporting and assistive services from civil
societal organizations to girls with LD, and helpingthe girls with LD to receive services offered
by the civil society organizations.
- To know the role played by civil society organizations and their subsystems in the field of
transitional services.
- To make school-civil society organization treaties.
- To find solutions with civil society organizations and relevant authorities to overcome obstacles
that hinder provisionof transitional services to girls with LD.
Results concerning research question two: "Are there differences in training needs to transitional services
for female teachers of the learning-disabled girls in Saudi Arabia according to these variables: years of
experience, qualification, and number of training courses in the field of transitional services?"
- There are no statistically significant differences in the female teachers' needs for training that can be
attributed to difference in number of years of experience.
- There are no statistically significant differences in the female teachers' needs for training attributable to
difference in qualifications.

Munirah AL-Hudaib, Nadia Tazi and Saeed Al-Yamani/Assessing Training Needs of Transition Services
for Teachers of Learning Disabled Students in the Secondary Stage in Saudi Arabia
134
- There are statistically significant differences in the female teachers' needs for training in transitional
services and participation in training courses.
Recommendations
The following recommendations are based on the study findings:
It is crucial to devise new and specialized regulations and legislation in regard to transitional
services, with oversight toensure effective implementation by all parties interested in transitional
services.
It is critical to find an academic curriculum for transitional services at Saudi universities for
special needs personnel in their final year that focuses on professional development and
cooperation among civil society institutions.
Girls with LD should be supervised and observed to monitor and ensure their qualitative level of
transitional services provision at the secondary level.
It is vital for the public and private sectors to cooperate with the Ministry of Education to
facilitate transitional services provision by qualifying the secondary girls’ professional status.
Offering workshops and training courses for female teachers of girls with LD and teachers in
general education to develop their aptitude in postsecondary transitional services provision, and
to improve their qualitative level of training.
It is important for Saudi universities to cooperate with Ministry of Education to offer suitable
opportunities for girls with LD through a college special needs center.
It is necessary for families of girls with LD to collaborate with transitional team members, to
participate in transitional planning, to understand all of their rights as children, and to provide all
necessary support and assistance.
To conduct more research in this field so that all interested parties can offer services in an
improved manner and to overcome any and all obstacles that result.
Suggested Future Research
It is recommended to conduct future research to deal with the following topics:
The effectiveness of a training course for female teachers of girls with LD to provide
postsecondary transitional services.
The effect of transitional services on the future of the girls with LD.
Providing transitional services programs for the secondary girls with LD from the perspective of
female teachers and the girls' families.
The differences in transitional services programs among groups of individuals with special needs
in Saudi Arabia.
References
Al-Battal, Z.B.M. (2008). Transitional Needs for the Disabled Individuals. Al-Manal Journal,Sharjah City
for Human Services, 222, pp. 24-25.
Al-Battal, Z.B.M. (2011). Academic Considerations for College Disabled Students. Master Thesis at King
Saud University, Riyadh, Saudi Arabia.
Al-Hadidi, M; & Al-Khateeb, J. (2005). Teaching Strategies for Special Needs students. Amman, Dar Al-
Fikr.
Al-Qaruti, Y. (2005). Transitional Services: The Arab Special Needs Conference: Reality and Desires.
Jordan, Amman, Reviewed10/1/2016 on http://cutt.us/wPqzg

Proceeding of the 3rd International Conference on Education, Vol. 3, 2017, pp. 129-136
135
Beard, J. (1991). State directors of special education transition programs: StateDefinitions and real
and ideal teacher competencies. Available from ERIC Document Reproduction Service ( No. ED
342543).
Blalock, G., Kochhar-Bryant, C. A., Test, D. W., Kohler, P., White, W Lehmann,J.,& Patton, J.
(2003). The need for comprehensive personnel preparation in transition and career development: A
position statement of the division on career development and transition,
fromhttp://cde.sagepub.com/content/26/2/207.
Dinglem, M., Falvey, M. A., Givner, C. &Haager, D. (2004). Essential special and general education
teacher competencies for preparing teachers for inclusive settings. Issues in Teacher Education, 13(1),
35-50.
Levinson, E. M., & Palmer, E. J. (2005). Preparing students with disabilities for school-to-work transition
and post school life.Counseling 101, 11-15, provided by the National Association of School Psychologists
(www.nasponline.org)
Morgan, R. L., Callow-Heusser, C. A., Horrocks, E. L., Hoffmann, A. N.,&Kupferman, S. (2014).
Identifying transition teacher competencies through literature review and surveys of experts and
practitioners. Career Development and Transition for Exceptional Individuals, 37(3), 149-160.
Morningstar, M. E., & Clark, G. M. (2003). The status of personnel preparation for transition
education and services: What is the critical content? How can it be offered?.Career Development for
Exceptional Individuals, 26(2), 227-237.
National Joint Committee on Learning Disabilities. (1994). Secondary topostsecondary education
transition planning for students with learning disabilities. Retrieved
fromhttp://www.asha.org/policy/RP1994-00133
Yali, J., Bassett, D. S., &Hutchinon, S.R. (2009) . Secondary special educators’transition
involvement. Journal of IntellectualDevelopmental Disabilities, 34(2), 163-172.
Proceeding of the 3rd International Conference on Education, Vol. 3, 2017, pp. 137-144 Copyright © 2017 TIIKM ISSN 2424 - 6700 online DOI: https://doi.org/10.17501/icedu.2017.3115
3rd International Conference on Education, 20-22 April 2017, Kuala Lumpur, Malaysia
ENQUIRY PEDAGOGY IN TEACHING TITRATIONS
WITH USING NATURAL INDICATOR
UdanKusmawan,Afnidar, Srihamda, and Deetje Sunarsih
Chemistry Education Department,Universitas Terbuka, Jakarta
Abstract: This article draws on community services led by Lectures from the Department of
Chemistry of Terbuka University (UT), Indonesia. The activities have involved teachers of
chemistry in Tigaraksa High Schools. All the teachers took active participations in guided-
laboratory activities through practicing SSCS Instructional model. This model constitutes an
enquiry method encompassing four scientific phases of Search, Solve, Create and Share. The SSCS
model was introduced to the teachers prior to their practicing laboratory activities. Through the
Search phase, a video was presented to teachers showing a lesson on how a red cabbage can be
used as a natural indicator for acids-bases titration processes. The teachers continuedon moving
forwards onto the other phases while teaching the topic of Titrations. The result indicated that in
general (over 71%) the teachers consented that this method has been an effective vehicle to bring
the environment into in-laboratory activities while teaching Titration topic of using natural
materials. Through the lab activities, it was found that red cabbage is a pH indicator indicated by
the shifting colors from red (at pH of 2) to purple (at pH of 3-6) and stop at blue color (at pH of 7-
9). The color of Purple comes from Sianidin including anthocyanin aglyconeanthocyanidins, which
is formed through hydrolyzed with acid. Finally, it was found that this enquiry method of SSCS has
become an effective model for guiding teachers in integrating the environment into laboratory
activities while teaching the topic of Titration.
Keywords:Natural indicator, environmental, group indicator, SSCS instructional model
Introduction
Issues on how teachers working out on students’ laboratory activities have long been in discussionby
teachers, especially by those who join Teachers’ Group on Subject Matters (read in Indonesian context as
Musyawarah Guru MataPelajaran – MGMP). Frequently, teachers realize that they do not have sufficient
skills in organizing lab activities for students in connection to their environmental actions. Some teachers
are likely to complain the “not enough” infrastructure to conduct practical works on environmental action
for their students.
Through this articel, we assume that, teachers should be able to manage creative laboratory activities
without demanding on fulfillment of laboratory facilities,which are usually expensive and risky. Instead,
the teachers need to find the best method such as the stated teachers’ demand, which was, however,
considred as the way to improve the quality of environment- based activities for students to learning and
experiencing the learning of science.
Teachers’ professional development in improving the quality of laboratory activities in using simple
materials that are available in their surrounding environment may strengthen students' motivation whose
interest in doing such lab-base chemical laboratory processes is poor. Regardless the quality of schools,
the teachers can certainly carry out chemical lab-based activities with using simple materials from the
environment. In this case, teachers can foster the quality of student learning with high abilities in handling
practical works.
To achieve these conditions, the first issue is how to improve teachers’ skill and creativity in developing
chemical lab with using the available and simple environment materials. The second one is how the
Corresponding Author: UdanKusmawan /[email protected]
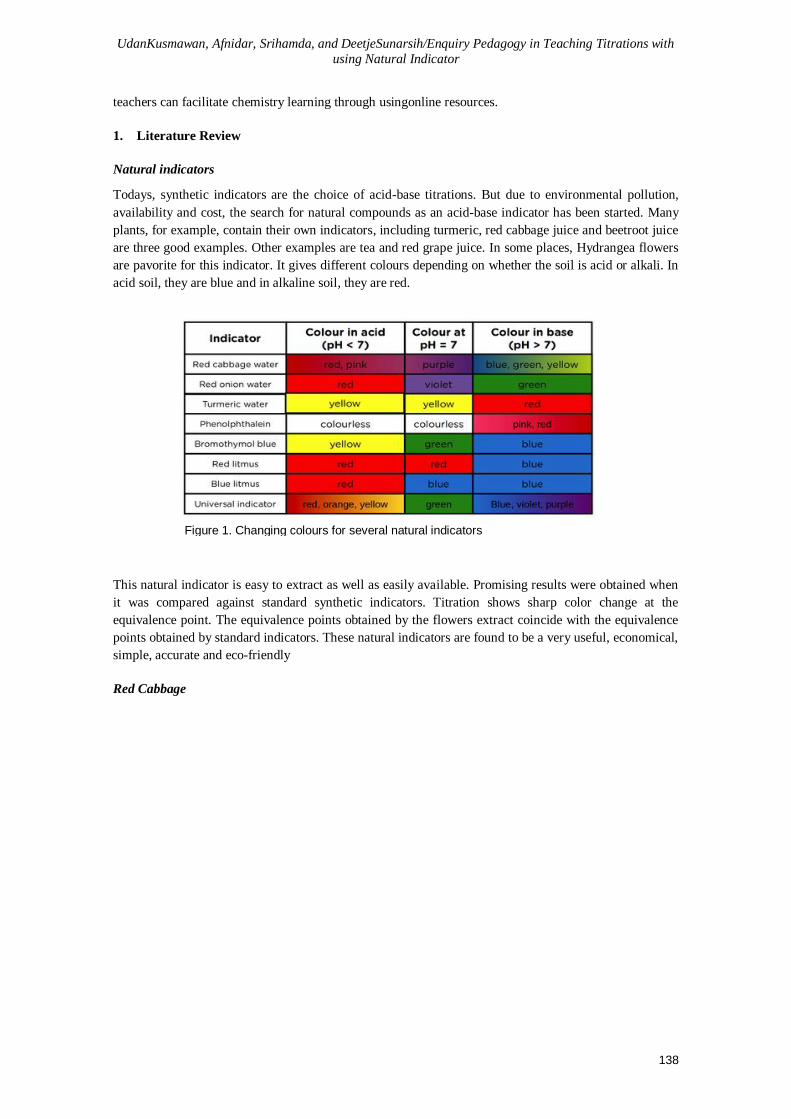
UdanKusmawan, Afnidar, Srihamda, and DeetjeSunarsih/Enquiry Pedagogy in Teaching Titrations with
using Natural Indicator
138
teachers can facilitate chemistry learning through usingonline resources.
1. Literature Review
Natural indicators
Todays, synthetic indicators are the choice of acid-base titrations. But due to environmental pollution,
availability and cost, the search for natural compounds as an acid-base indicator has been started. Many
plants, for example, contain their own indicators, including turmeric, red cabbage juice and beetroot juice
are three good examples. Other examples are tea and red grape juice. In some places, Hydrangea flowers
are pavorite for this indicator. It gives different colours depending on whether the soil is acid or alkali. In
acid soil, they are blue and in alkaline soil, they are red.
This natural indicator is easy to extract as well as easily available. Promising results were obtained when
it was compared against standard synthetic indicators. Titration shows sharp color change at the
equivalence point. The equivalence points obtained by the flowers extract coincide with the equivalence
points obtained by standard indicators. These natural indicators are found to be a very useful, economical,
simple, accurate and eco-friendly
Red Cabbage
Figure 1. Changing colours for several natural indicators

Proceeding of the 3rd International Conference on Education, Vol. 3, 2017, pp. 137-144
139
One of the simple material that is available in the environment is Red Cabbage. This Red cabbage
contains at least thirty-six of the 300 kinds of anthocyanin that play a role in a variety of red and blue
colors in plants (Charronet. Al., 2007). Anthocyanins consist of several rings of carbon to hydrogen or
hydroxyl groups attached. This allows the chemical formation of anthocyanin molecules to take two
forms (in which one of the hydrogen atoms attached to the exterior and one not). As indicated in Figure 1,
Acid material is characterized by having more of the hydrogen atoms (H +) of the hydroxyl group (OH-)
so that when exposed to acid, anthocyanin hydrogen atoms captured and turned red. In alkaline conditions
where there is no excess hydrogen atom, the molecule is the color that appears blue or green (Charron et.
al., 2007), see Figure 2. The pigment molecules are stored in the cells of leaves of red cabbage. When
exposed to heat during cooking, cells that contain anthocyanins open, causing the color pigments
dissolved into the surrounding fluid. as indicated in Figure 3, this explains the color change directly in the
cooking water red cabbage extract to produce a colorless liquid called cabbage (Charron et. Al., 2007),
which can then be directly used as a natural indicator solution. The presence of anthocyanin cabbage can
cause color changes to red (Ekasari, 2010).
Anthocyanin pigments in red cabbage, chemical anthocyanin derivatives single aromatic structure,
namely sianidin, and all made from pigments sianidinpigments with the addition or subtraction of
hydroxyl groups, methylation and glycosylation (Harborne 2005). Anthocyanins are compounds that are
amphoteric, ie have the ability to react either with acids or with bases. In amedium acidicicred of
anthocyanin, and in an alkaline medium turned into purple and blue (Man 1997).
The use of red cabbage as a pH indicator is based on the change in color from red at pH 2 to purple at pH
3-6 and then a blue color around pH 7-9 which is an endpoint. Purple color comes from sianidin including
anthocyanin which is aglyconeanthocyanidins that is formed when it is hydrolyzed with acid.
Pelargonidinwhichorangecolor is caused by the hydroxyl groups less one than sianidin, while the blue
color is generally caused by delfinidin which the hydroxyl groups less one than sianidin (Harborne,
2006). Therefore, it is possible to determine the pH of a solution based on the color change of
anthocyanin pigments of red cabbage juice. The above figure 3 shows the range of colors that can be
achieved with red cabbage in a wide range of pH (Agee, 2006).
Figure 2. Chop red cabbage to extract the pigment.
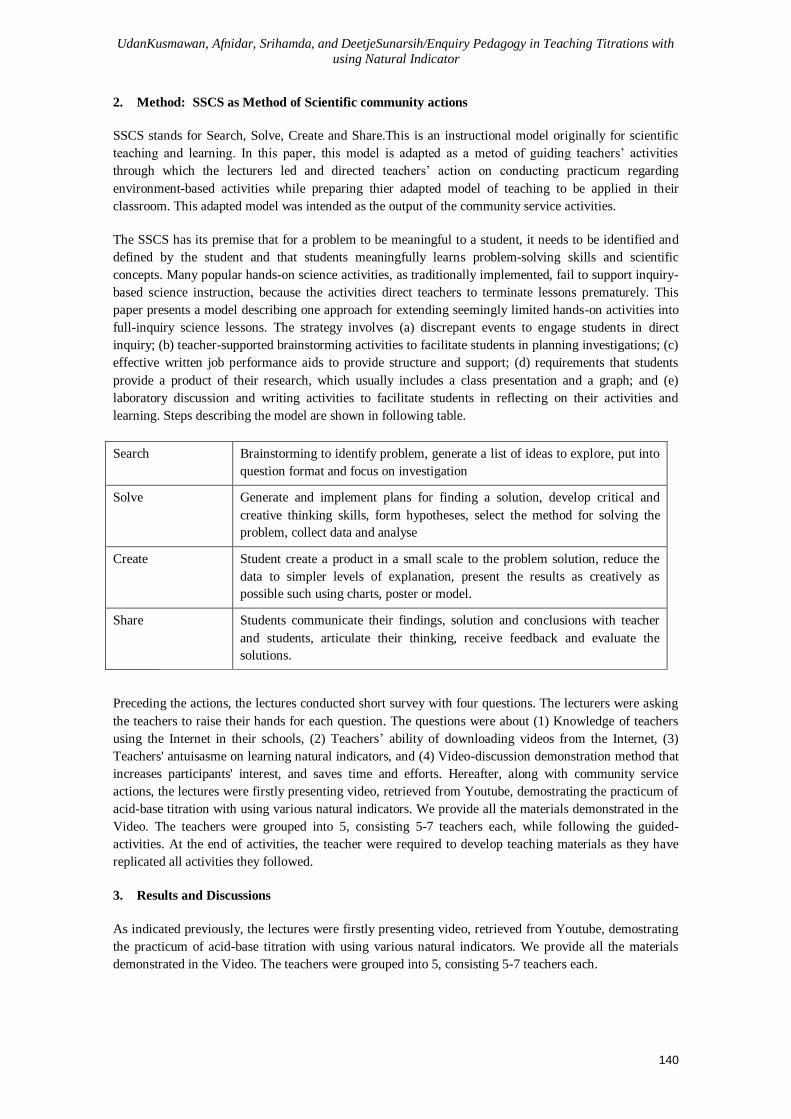
UdanKusmawan, Afnidar, Srihamda, and DeetjeSunarsih/Enquiry Pedagogy in Teaching Titrations with
using Natural Indicator
140
2. Method: SSCS as Method of Scientific community actions
SSCS stands for Search, Solve, Create and Share.This is an instructional model originally for scientific
teaching and learning. In this paper, this model is adapted as a metod of guiding teachers’ activities
through which the lecturers led and directed teachers’ action on conducting practicum regarding
environment-based activities while preparing thier adapted model of teaching to be applied in their
classroom. This adapted model was intended as the output of the community service activities.
The SSCS has its premise that for a problem to be meaningful to a student, it needs to be identified and
defined by the student and that students meaningfully learns problem-solving skills and scientific
concepts. Many popular hands-on science activities, as traditionally implemented, fail to support inquiry-
based science instruction, because the activities direct teachers to terminate lessons prematurely. This
paper presents a model describing one approach for extending seemingly limited hands-on activities into
full-inquiry science lessons. The strategy involves (a) discrepant events to engage students in direct
inquiry; (b) teacher-supported brainstorming activities to facilitate students in planning investigations; (c)
effective written job performance aids to provide structure and support; (d) requirements that students
provide a product of their research, which usually includes a class presentation and a graph; and (e)
laboratory discussion and writing activities to facilitate students in reflecting on their activities and
learning. Steps describing the model are shown in following table.
Search Brainstorming to identify problem, generate a list of ideas to explore, put into
question format and focus on investigation
Solve Generate and implement plans for finding a solution, develop critical and
creative thinking skills, form hypotheses, select the method for solving the
problem, collect data and analyse
Create Student create a product in a small scale to the problem solution, reduce the
data to simpler levels of explanation, present the results as creatively as
possible such using charts, poster or model.
Share Students communicate their findings, solution and conclusions with teacher
and students, articulate their thinking, receive feedback and evaluate the
solutions.
Preceding the actions, the lectures conducted short survey with four questions. The lecturers were asking
the teachers to raise their hands for each question. The questions were about (1) Knowledge of teachers
using the Internet in their schools, (2) Teachers’ ability of downloading videos from the Internet, (3)
Teachers' antuisasme on learning natural indicators, and (4) Video-discussion demonstration method that
increases participants' interest, and saves time and efforts. Hereafter, along with community service
actions, the lectures were firstly presenting video, retrieved from Youtube, demostrating the practicum of
acid-base titration with using various natural indicators. We provide all the materials demonstrated in the
Video. The teachers were grouped into 5, consisting 5-7 teachers each, while following the guided-
activities. At the end of activities, the teacher were required to develop teaching materials as they have
replicated all activities they followed.
3. Results and Discussions
As indicated previously, the lectures were firstly presenting video, retrieved from Youtube, demostrating
the practicum of acid-base titration with using various natural indicators. We provide all the materials
demonstrated in the Video. The teachers were grouped into 5, consisting 5-7 teachers each.

Proceeding of the 3rd International Conference on Education, Vol. 3, 2017, pp. 137-144
141
Search phase
This video presentation constitutes the first phase of the SCSS. Through this phase, to the teachers were
introduced many literatures and links containing this similar information. Among the links introduced to
the the teachers in this phase are as below containing examples of acid-base titration:
• Verificative activities on acid-base titration: https://www.youtube.com/watch?v=vajKeYQbX0w
• Practicum of acid-base titration conducted by SMA Assa’adah XI, Dubai:
https://www.youtube.com/watch?v=V7iVytVYXD4
• Exam on acid-base titration: https://www.youtube.com/watch?v=ufZoJw331Dg
• https://www.youtube.com/watch?v=88JGuO5ENhU
• Exam preparation for acid-base titration: https://www.youtube.com/watch?v=wdIUhhKtDI4
• Extracting red cabbage for acid-base titration: https://www.youtube.com/watch?v=WzedPt_37fc
• Red cabbage acid-base titration by SMP IHBS Jakarta:
https://www.youtube.com/watch?v=zt2U6g0RYKI
Introducing the videos, the lectures were using power point presentation (PPt). The PPt contains
information on title of activities, aims of the activities, activity phases of practicum, example links as
listed above, and finally steps of the activities to be followed by the teachers. This way was to example
the teachers as an appropriate methods to lead students in thier classes while teaching and learning acid-
basetiration.
Throughout presenting the PPt, the lectures suggested that this way of teaching and learning must attract
students’ attention. This is alligned with Djamarah S.B., (2000) recommendation that demonstration
methods was to confirm the intended real and actual processes which require understanding through
activities, as well as movement. He further argued that demonstration methods strengthen learners’ skills
on how to observe movements or processes from the objects presented.
As mentioned, the lectures conducted a short survey with four questions before and after the teachers had
been involved in Search phase. The lecturers were asking the teachers to raise their hands for each
question. Results of the survey and its questions are described in Graph 1.
Based on information in the Graph, it is apparent that activities guided by the lecturers conducted during
the Search phase have enabled to increase the four aspects of teachers’ prior knowledge towards
multimedia for education.
Solve phase
Graph 1. Inital survey to teachers

UdanKusmawan, Afnidar, Srihamda, and DeetjeSunarsih/Enquiry Pedagogy in Teaching Titrations with
using Natural Indicator
142
As Hernandez & Joe (2010) suggested, teaching chemistry with involvement of computer-based
presentation helped learners strengthened thier interest, hence improved their understanding towards the
concepts and principles presented. In this situation, it was intended that the teachers would replicate
impementation strategies in their real classroom.
During this phase, the teachers in group generated and implemented plans for formulating teaching
materials and strategies, developing critical and creative thinking skills to be captured from their students,
and selecting media for presenting the materials appropriately to the methods defined. In addition, they
were collecting and analysing data to enrich thier methods of teaching.
The group conducted discussion on the plans that needed to be fulfiled by all the teachers of the group.
This phase was completed indpendently by all participants in two weeks. All the participants admitted
that this way of collaborative works has strengthened thierexpereinces meaningfully, as indicated in the
Graph 1.
Create phase
Having the teachers in groups prepared all materials to be produced, independently, we were then
discussed how all the materials were arraged and reported. This meeting was aimed at guiding all teachers
to understand the reason why a report was to be created and how the report needed to be shared to other
parties, including their students.
During this phase, having the teachers developed a report, they created a product in a small scale
(including presentation materials), reduced the data to simpler levels of explanation, and presentation
design of the results as creatively as possible such as using charts, and designed posters or models that
might be better or inovative works developed from what have been learned from the lecturers.
Hadimiarso, Y. (1984) suggested that various media being used to facilitate learners’ thinking, intention
and motivation development might be subject to encourage the learners to learn. The existence of media
to accompany verbal communication as frequently happen in lecturing might accomodate
learners’undersnding as they visulize abstract concepts and transmit them into reality.
Finally, throughout this phase, the lecturer accompanied the teachers to devloped material presentations
based on their report.
Share phase
Gagne dan Briggs (1979) argued that teaching and learning (instructional activities) should be a series of
events (creation, events, conditions, etc.) that are deliberately designed to affect learners. Instruction or
learning, on the other hand, is a system that aims to help the students' learning process, which contains a
series of events planned and structured contents which influence and support the learners' learning
processes.
Learning in this work can be defined as a process that requires the presentation of material activity and
scientific attitude of the learners in learning a subject matter which has been determined based on the
applicable curriculum.
Through this phase, all the teachers presented their materials in the mini seminar. Audiences of the
seminar were all participants of the community services, including participating teachers and lecturers.
The lecturers shared critiques and suggestions to improve their material and models.

Proceeding of the 3rd International Conference on Education, Vol. 3, 2017, pp. 137-144
143
4. Conclusion
These community services haveevidently facilitated teachers with strategies to collaboratively manage
thier environmental-based practicum and develop materials to be presented for their classroom purposes.
The teachers have managed creative laboratory activities without demanding on fulfillment of laboratory
facilities, which are usually expensive and risky. Having participated in these activities, the teachers have
experienced a scientific method to improve the quality of environment-based activities for students to
learning and experiencing the learning of science.
Teachers’ professional development in improving the quality of laboratory activities in using simple
materials that were available in their surrounding environment has strengthened students' motivation
whose interest in doing such lab-base chemical laboratory processes is poor. Regardless the quality of
schools, the teachers can certainly carry out chemical lab-based activities with using simple materials
from the environment. In this case, teachers fostered the quality of learning with high abilities in handling
practical works.
5. Reference
Ahmad Walid. 2015. mpd.blogspot.co.id/2015/09/sains-pembelajaran-dan-proses-berpikir.html.
AjiCaturMurdiono. 2010. Karaktrisasitrayek pH danSpektrumAbsorpsiKubisUngu(Brassica oleracea L).
LaporanPenelitan,Yogyakarta: FMIPA UNY
CandraAjityasAnggitSaputra.
2010.KarakterisasiTrayekphdanSpektrukAbsorpsiEkstrakKubisUnguKering (Brassica oleracea)
sebagaiIndikatorAlamiTitrasiAsamBasa, LaporanPenelitian, FMIPA UNY: Yogyakarta
Charron CS, Clevidence B, Britz SJ, Novotny JA. 2007. Effect of dose size on bioavailability of acylated
and nonacylatedanthocyanins from red cabbage (Brassicaoleracea L. Var. capitata). In J Agric Food
Chem 55:5354–62. Ekasari et al., 2010 Primary nutritional content of bio-flocs cultured with different
organic carbon sources and salinity Hayati J Biosci, 17. pp. 125–130
Chigurupati, N., Saiki, L., Geyser, C., Dash, K.A.2002. Evaluation of Red Cabbage Dye as A Potential
Natural Color for Pharmaceutical use, International of Journal Pharmaceutical 2002 July 25; 241(2): 293-
299
Day, R. A Jr., dan Underwood, A.L. 2002. AnalisisKimiaKuantitatif, Jakarta: Erlangga
DiyarSalahudin Ali. 2009. Identification of an Anthocyanin Compound from Strawberry Fruits then
Using as An Indicator in Volumetric Analysis, Journal of Family Medicine, Vol 7 Issue 7
Fessenden, R. J. dan Fessenden, J. S. 1995. Kimia OrganikEdisiketigaJilidI
(TerjemahanHendyanaPujaatmaka), Jakarta: Erlangga
F.R. Saputra, F.S. Rondonuwu, A. Sutresno .2013.Pemanfaatkan EkstrakAntosianinKolMerah (Brassica
OleraceaVar) Sebagai Dye Sensitized dalamPembuatanPrototipe Solar Cell (DSSC),Seminar
NasionalSainsdanPendidikanSains VIII4(1), 332-333,.
Harborne J.B. 2005.Phytochemical Methods New Delhi: Springer (India)Pvt.Ltd; p.17.
Harborne, J.B. 2006. MetodeFitokimia: Penuntun Cara Modern MenganalisisTumbuhan (alihbahasa:
KosasihPadmawinata&IwangSoediro).Bandung:Penerbit ITB.

UdanKusmawan, Afnidar, Srihamda, and DeetjeSunarsih/Enquiry Pedagogy in Teaching Titrations with
using Natural Indicator
144
Hernandez, M. & Joe, K. 2010.Development and Assessment of a Chemistry-Based
ComputerVideoGameas a LearningTool, (Online), (http: //www. eric.ed. gov/ERICWebPortal/search/)
Liliasari. 2007. Scientific Concepts and Generic Science Skills Relationship inthe 21st Century Science
Education. Seminar Proceeding of the First International Seminar of Science Education. 27 October 2007.
Bandung. 13 – 18
Maftuha, D.S. 2013. ImplementasiPemanfaatanIndikatorAlamiuntukPraktikum Kimia
MateriPokokAsamBasasebagaiUpayaPeningkatanKeaktifandanPemahamanKonsepPesertaDidikkelas XI
IPA MA AlMuttaqienPancasila Sakti KabupatenKelatenJawa Tengah, Skripi, Program Studi Kimia
FakultasSainsdanTeknologi UIN SunanKalijagaYokyakarta.
Marwati S. 2011. KestabilanwarnaEkstrakKubisUngu (Brassica oleracea)
sebagaiIndikatorAlamiTitrasiAsamBasa. Prosiding Seminar NasionalPenelitian, PendidikandanPenerapan
MIPA FMIPA UNY, 11 Mei 2011
Marwati S. 2012. AplikasiBeberapaBungaBerwarnasebagaiIndikatorAlamiTitrasiAsamBasa. Prosiding
Seminar NasionalPenelitian, PendidikandanPenerapan MIPA FMIPA UNY, 2 Juni 2012
SeafastCenter. 2012. Merah-UnguAntosianin, PewarnaAlamiuntukPangan (23-43)
Siahaan, L.O., Hutapea, E.R.F., Tambun, R. 2014. EkstraksiPigmenAntosianindariRambutan
(Nepheliumlappaceum) denganPelarutEtanol, JurnalTeknik Kimia USU, 3(3), 32-38
Siti Marwati.2010.
AplikasiBeberapaEkstrakBungaBerwarnasebagaiIndikatorAlamipadaTitrasiAsamBasa, Prosiding
Seminar Nasional FMIPA UNY 2010. Yogyakarta: FMIPA UNY
Siregar, Y.D.I. 2015. PembuatanKertasIndikatorAsamBasadariBungaKembang Sepatu (Hibiscus
rosasinensis), Program Studi Kimia FakultasSainsdanTeknologi UIN SyarifHidayatullah Jakarta.246-252.
Vogel 1994. BukuTeksAnalisisAnorganikKualitatifMakrodanSemimikro (Terjemahan), Jakarta: PT
Kalman Media Pustaka
YustinaDewiNuritasari. 2010. UjiKecermatandanKeakuratanPenggunaanEkstrakKubisUngu (Brassica
oleracea L) sebagaiIndikatorAlamiTitrasiAsamKuatBasaKuat.LaporanPenelitian, Yogyakarta: FMIPA
UNY
Winarti, S., Sarofa, U., dan Anggrahini, D. 2008. Ekstraksi dan StabilitasWarnaUbiJalarUngu
(Ipomoeabatatas L.,) sebagaiPewarna Alami, JurnalTeknikKimia, 3 (1), 207-214
RoestiyahNK.1985: 125, StrategiBelajarMengajar. BinaAksaraJakarta
Soeroso AY., Anna Permanasari&Kardiawarman. 2002.
EnsiklopediSains&KehidupanDepartemenPendidikanNasional

Proceeding of the 3rd International Conference on Education, Vol. 3, 2017, pp. 145-154 Copyright © 2017 TIIKM ISSN 2424 - 6700 online DOI: https://doi.org/10.17501/icedu.2017.3116
3rd International Conference on Education, 20-22 April 2017, Kuala Lumpur, Malaysia
GREEN SKILLS: INNOVATION IN THE SUBJECT OF
DESIGN AND TECHNOLOGY (D&T)
Amarumi Alwi1, Arasinah Kamis
2, Haryanti Mohd Affandi
3, Faizal Amin Nur Yunus
4
and Ridzwan Che Rus5
1, 2, 5Faculty of Technical and Vocational Education, Sultan Idris Education University, Malaysia 3Faculty of Education, National University of Malaysia, Malaysia
4Faculty of Technical and Vocational Education,University Tun Hussein Onn, Malaysia
Abstract: This study explores the innovation of disseminating green skills through the process of
teaching and learning in order to develop environmental sustainability. Green skills need to be
inculcated in the lives of children as they are the agents of sustainable development. This study
investigates the elements of green skills applicable to the practice for the subject of design and
technology in the primary schools, as a measure to protect and conserve the environment. By using a
qualitative research design, excellent teachers for the subjects of living skills and design and
technology (D&T) were interviewed. The focus group method was used to collect data by using
semi-structured questions. The findings show that these green skills elements can be instilled in the
students: solid waste management, green practices and the concept of 3R (Reduce, Reuse and
Recycle). It is proposed that the Ministry of Education could utilize the results of this study to draft
the curriculum for the subject of design and technology, which in turn would facilitate the production
of teaching modules and introduction of green skills elements among the primary school students.
This would be a step in the right direction in preserving and conserving the environment.
Keywords: Green Skills, Sustainable Development, Innovation, Design and Technology
Introduction
Organization for Economic Co-operation and Development, (OECD), (2016) states that green skills are an
ability, also known as technical skills, values and attitudes, needed in the workplace to develop or support the
sustainability of social life, economic activity, and results of business, industry and community. Teenagers view
green jobs as jobs that are not popular and of low status; therefore, they pay less attention to this concept of
green skills (Cedefop, 2012). The concept of green skills should be incorporated in the learning process of
young children because they will be the sustainable catalytic agent who will inherit the environment (Stuhmcke,
2012). Given the growing environmental problems, it is very crucial to create a generation fully aware of the
importance of preserving the environment (SitiRohani, 2013).
Although environmental education has been implemented via the school curriculum for a long time,
environmental awareness remains at a low level (Jamilah and Hasrina, 2011), (Shahromet al. 2015). According
to Saravanan and Ahmad, (2013), students' knowledge of and concerns for the environment are still at a
moderate level. These findings point to a sober situation: green practices in everyday life have not reached the
level that would lead to a reduction of environmental problems. Education about sustainable environment was
introduced in the education system to develop skills, knowledge, attitudes, awareness, understanding, value and
commitment in solving environmental problems (Sola, 2014), (Meenakshi and Leela, 2014). The practice of
implementing elements and skills pertaining to sustainable environment is still at a level not to be proud of
(Hanifah, 2014).
Thus, green skills need to be incorporated into the subject of design and technology as an innovation element
that could generate environmental sustainability; and integration of green skills in the curriculum of technical
Corresponding Author:Amarumi Alwi/[email protected]
AmarumiAlwi, ArasinahKamis, HaryantiMohdAffandi ,Faizal Amin NurYunu and RidzwanCheRus /Green Skills: Innovation in the subject of Design and Technology (D&T)
146
and vocational education is vital. Continuous attempts and efforts must be made to develop the potential of
individuals in an integrated and holistic manner; these can be done by improving the education and public
awareness regarding green skills, and encouraging widespread adoption of green technology is another method
as well. This blends in well with one of the primary aims of the national education, which is to produce
individuals who are harmonious and balanced in every aspect--emotionally, spiritually, intellectually, and
physically, founded on firm belief in God (Siti Nor Syazwani et al. 2014). The focus of this research is to
explore the elements of green skills that can be applied during the process of teaching and learning in design and
technology in primary schools as a measure to protect and conserve the environment.
Literature Review
Education for sustainability development, or ESD in short, began in 2001. The design plan and the
establishment of sustainable programs were implemented formally in the Malaysian education system through
the primary and secondary schools in 2005. ESD is recognized through Sustainable School Environment Award
Program in Malaysia (SLAAS), (2012). The practice of sustainability is an important agenda in making students
more responsible for the Earth in the future, but a study by Siti Rohani, (2013) states that the attitude of the
individual is one of the factors contributing to the environmental problems. Environmental problems are closely
linked with people's lifestyles that emphasize economic development and material gain, while they disregard the
importance of environmental stewardship. An estimated 25,000 tonnes per day of solid waste was generated in
2012, and the Department of National Solid Waste found that food waste constituted 45 per cent of the total
29,000 tonnes of solid waste generated in a single day in Malaysia. However, only 5% is recycled despite many
ongoing recycling campaigns and recycling bins provided in certain places. This is a result of the lack of
knowledge and skills in the solid waste management system, especially in waste separation (Festus and
Ogoeggbunam, 2012), (Licy et al. 2013).
Solid Waste Management Policy, (2016) has been introduced to create a solid waste management system that is
systematic, environmentally friendly, cost-effective, sustainable, and is socially accepted by the people who
stress the preservation of the environment, the choice of technology that is affordable and guarantees public
health. Hasnahet al. (2012) and Fahzy (2014) suggest three elements of 3R, which are Reuse, Reduce and
Recycle as the first core in the solid waste management policy. 3R is also an element of skills that can be trained
and deployed in students, starting with primary school education; aspects of the sustainable environment are
taught through the curriculum as a measure to mitigate the effects of global warming and environmental
pollution (Taylor et al. 2015). Pupils of the primary school today will grow up as adults in the next ten to twenty
years. Therefore, they should be instructed while they are young so that they are aware of the negative impacts
on life brought about by the undesirable events in life (Sharifah Zarina, 2014).
In the study of (Stuhmcke, 2014) the author suggests that knowledge of environmental sustainability could bring
an impact if it is aligned with Trans formative Project-Approach. Teaching about the environment is more
effective when students are taught in and about the environment as well as for the environment compared with
the old approach of simply learning about the environment without involving any project. Environmental
education focuses on students’ perspective of the concepts and theories. This education entails students to be
connected with flora and fauna, forest, mountain, beach or park to create an awareness of and involvement in the
environment. Environmental education aims to encourage an ability to adopt lifestyles that are harmonious with
the natural resources. Australian Education for Sustainability Alliance (AESA), (2014)also suggests the concept
of about, in and for in education.
Green Skills
Green skills refer to the skills, values and attitudes needed by humans to support and build the sustainability and
effectiveness of energy sources as one of the manifestations in the field of green technologies and knowledge
Proceeding of the 3rd International Conference on Education, Vol. 3, 2017, pp. 145-154
147
required in the workplace (SLAAS, 2012), (McDonald et al. 2012). In a sustainable education, green skills are
more focused on skills of maintaining and conserving the environment. International Centre for Technical and
Vocational Education and Training (UNEVOC), (2012) states, that Green Technical Vocational Education and
Training (TVET) covers education that enhances problem-solving skills in everyday life (life management
skills), education in sustainable development in life and entrepreneurship training.
Green skills, better known as green practices in Malaysia, include skills related to measures in conserving the
environment. On the other hand, green technology relates to the application, development of the products and
equipment systems to protect the environment as well as minimize or decrease the negative impact of human
activity Ministry of Energy, Technology and Water, Malaysia (Kettha), (2012). Meanwhile, the objective of
Green Technology Policy is to provide direction and motivation for the people of Malaysia to continue enjoying
good quality of life and a healthy environment.
According to Strietska-Ilina et al. (2011), green skills are knowledge, skills, values and attitudes needed in life
for the growth and support of the creation of a community that has an efficient and sustainable management in
managing available resources. Based on the study of (Pavlova and Huang, 2013), they concluded that elements
of green skills should be included in technical and vocational education as an added value, so no harm would be
done to the environment by people who are science and technology-sensitive, hardworking, law-abiding and
with integrity, in the conducts of their everyday life. Users are suggested to be green by applying green skills in
their daily lives as much as possible, starting with common practices such as bringing lunch to work instead of
using polystyrene (Arasinahet al. 2016).
In (Ifegbesan, 2010) students in the secondary schools of Ogun State recognize the problem of waste in their
schools, but very few waste management practices are in place. It was found that girls engage in activities to
protect the environment, as they are more concerned about environmental problems. It was recommended by
(Wong and Wan, 2008), (Karpiak and Baril, 2008), (Ifegbesan, 2010) to adopt the use of water, separating the
waste and saving electricity. Study by (Corbonel et al.2015)shows that respondents believe the government
should provide incentives and carry out promotions so that green practices will continuously be implemented
such as lessening the use of Styrofoam or plastic containers that are not environmentally friendly, prohibiting
the use of plastic bags and using own containers when buying food. His research also found that adoption of
sustainable practices among students is at a low level because they are less exposed to green skills education.
Design and Technology Subject (D&T)
Standard curriculum of design technology (D&T) was enacted in 2014 with an emphasis on content and learning
standards that need to be known, understood and mastered by students of the primary school years 4, 5 and 6.
This subject provides the students with early exposure of basic skills in the fields of technical, technology
agriculture, home science and cross-curricular elements such as information and communication technology
(ICT), creativity and innovation and entrepreneurship foundation. The elements of standard curriculum of
design technology (D&T) are still retained in Integrated Primary School Curriculum, (KBSR). In addition, the
curriculum also emphasizes the inculcation of moral values, work-it-yourself (Do-it-yourself, DIY), sensitivity
towards surrounding issues and a positive attitude, while the schools carry out activities to produce students who
are tech-savvy, creative and have entrepreneurial characteristics (Dokumen Standard Prestasi, (DKSP), 2014)
The subject of design and technology imparts appropriate lessons that can be applied to add values to our life in
terms of green skills (Zuhair, 2015), (Cedefop, 2014). Green skills provided by the subject of design and
technology serve to produce students who are competent, and hence, this subject should be part and parcel of the
school curriculum (Arasinah et al.2016). By implementing the curriculum, a comprehensive approach can be
utilized to train students who will grow up to appreciate and conserve the environment (Teoh, 2016). As
suggested by (Taylor et al. 2015), a different approach is needed to teach students about green aspects; although

AmarumiAlwi, ArasinahKamis, HaryantiMohdAffandi ,Faizal Amin NurYunu and RidzwanCheRus /Green Skills: Innovation in the subject of Design and Technology (D&T)
148
environmental education has long been taught in school, students do not seem to exhibit good behavior towards
the environment.
Innovation
Green skills are an innovation that can be incorporated into the subject of design and technology; this new
element is skill-oriented as the subject emphasizes practical aspects in the teaching and learning process. Based
on the definition of (Rogers, 2003), innovation is an idea, practice, or new projects that are considered by the
individual or the person who undertakes such innovation. In the process of welcoming a new innovation, an
innovator will experience three stages, namely knowledge, persuasion and finally making a decision. This
process will provide experiences, challenges and consideration to the executor in assessing an innovation
implemented. Green skills may be considered new in Malaysia; however, they have long been adopted in Japan
and Korea.
Practice-based innovation needs strong support in terms of materials and parameters that are clear and
measurable (Warford, 2010). In this case, researchers look at green skills as an idea or habit that can be put into
practice with the support of teachers as the facilitators, who have a clear vision to cultivate the love for the
environment. Innovation takes time but if done consistently, it will provide maximum effect and impact. This is
in line with sustainable practices such as segregation of waste and 3R that can be a challenge in the beginning.
However, if done consistently and are made into a routine, these practices will become a habit (Festus and
Oggoeggbunam, 2012), (Licy et al. 2013), (Fahzy, 2014).
Model of Sustainability
Green skill is an innovation in education acting as a stepping stone to sustainable development. In planning an
innovative green skill, a model of sustainable development was adapted from (Johnson et al. 2014). The process
starts with determining the sustainability factor that influences an innovation, which is to implement the green
skills elements as a measure to conserve the environment. This innovation should be consistent with the
requirements, and there is a positive relationship between executor shareholders. The next step is to proceed
with the sustainability action that involves five stages of development, which are assessment, planning,
implementation, evaluation and re-evaluation, and modification, if necessary. Outcomes will come in two
stages: results that can be seen immediately; and long-distal innovative results which consist of the elements of
green skills applicable to preserve the environment. Green abilities (sustainable innovation) will be used and
evaluated after the process of learning and teaching is completed (Outcomes) for viewing of immediate and
long-term results. Distal outcomes also involve the Ministry of Education and Ministry of Technology, Energy
and Water; they will observe if this innovation is workable and can be adopted. Innovation must have special
features that produce services geared towards certain shareholders who meet specific criteria; (Johnson et al.
2014) in this present case the shareholder is the Ministry of Technology, Energy and Water, who plays a role in
conserving and preserving the environment.
Methodology
This study adopted a qualitative approach, which utilized case studies. Sampling technique was used to
interview respondents in focus groups. The collection of data from a focus group is more effective when the
number is seven to twelve people, as it is easier to hold group discussions (Nagle and Williams, 2012).
According to the list compiled by (Tersine and Ringgs, 1976) there are four criteria that can be used to identify a
panel of experts: (1) have education related to a particular field; (2) have a good track record in a particular
field; (3) have the leisure time to engage in the study until the end; and (4) are willing to spend some time in the
study. Two other researchers, (Armstrong et al. 2000)and (Powel, 2003), stipulate a different set of criteria for
the selection of the panel of experts: background, relevant work experience, willingness to contribute to the

Proceeding of the 3rd International Conference on Education, Vol. 3, 2017, pp. 145-154
149
validity of the study, have a range of opinions, views and knowledge of the latest issues. Therefore, to collect a
research sample, the researchers selected a total of seven teachers who are proficient in subject of life skills or
design and technology. The sample selection criteria are as follows:
An outstanding teacher in the subject of living skills or design and technology.
Has a professional qualification in the field of living skills or design and technology
Has been teaching the subject of living skills for at least five years or the subject of design and
technology for three years; the subject of design and technology was introduced in the primary
schools just 3 years ago.
Semi-structured interviews were used to obtain information from the research respondents. One of the
advantages of a semi-structured interview is that researchers can pose additional questions to find out more
details. The interviews for the focus group were conducted in four hours. The entire sessions of the interviews
were recorded.
Analysis of data
Eight phases of the data collection process were carried out by researchers: the exploration phase of the study
data; transcription phase; the coding phase; organizing phase; data exploration phase for the second interview;
the second transcription phase; encoding process phase; and organizing phase. After an interview of the focus
group was done, the recorded data were transcribed; then a code was created based on the themes identified. The
process of assigning codes to the units of this paragraph makes it easier for researchers to identify the themes for
each step and give clarification regarding the conduct (Yin, 2011). Subsequent to this, the researchers reviewed
and organized the data by category and identified if any data were missing. Any missing data would be updated
after the second interview was conducted. The transcribed data of the second interview were sent to the
participants for review. The processes of encoding and data organization according to the identified five themes
were executed again in detail.
As a measure to validate the data, the researchers requested the respondents to examine the raw data and
confirm its accuracy. In addition, the respondents were also asked to comment on the accuracy and
appropriateness of the categories and themes: were they supported by sufficient evidence or were the reports
made realistic? This procedure adds credibility to the findings, providing an opportunity for participants to
review and clarify the interpretation of the interview transcripts and verify the accuracy of the participants' ideas
(Creswell, 2014). In addition, to ensure reliability of the data, the researchers used the method of audit trail.
Through the audit trail, the researchers reported clearly how the data were collected, how the theme had been
formed and decisions taken during the study. Examination of the colleagues was also carried out. This procedure
provides written feedback and ideas, using the lens of outsiders to assess the results of the research (Maxwell,
2013). For this purpose, the researchers engaged the services of two lecturers who are experts in the field of
technical and vocational education; two lecturers in the field of environment were also consulted because this
research is related to environmental education. The researchers took into account the responses of the panels and
made the necessary modifications and improvements.
Findings
The findings show that the respondents have presented some elements that can be incorporated in the teaching
and learning of the subject of design and technology (D&T), particularly on the topic of home economics (home
science). These elements can be applied to develop innovation among students through the subject of D&T.
Several themes can be obtained from the findings, namely the management of solid waste, green practices and
the concept of 3R-- Reduce, Reuse and Recycle.
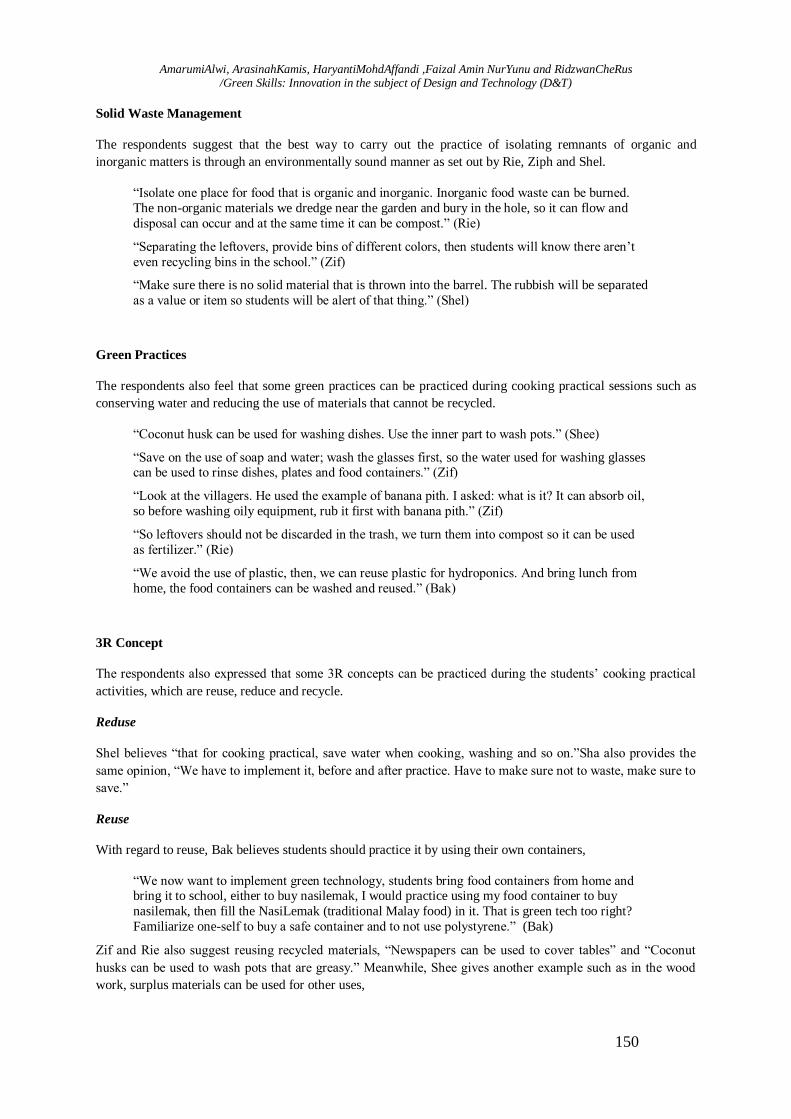
AmarumiAlwi, ArasinahKamis, HaryantiMohdAffandi ,Faizal Amin NurYunu and RidzwanCheRus /Green Skills: Innovation in the subject of Design and Technology (D&T)
150
Solid Waste Management
The respondents suggest that the best way to carry out the practice of isolating remnants of organic and
inorganic matters is through an environmentally sound manner as set out by Rie, Ziph and Shel.
“Isolate one place for food that is organic and inorganic. Inorganic food waste can be burned.
The non-organic materials we dredge near the garden and bury in the hole, so it can flow and
disposal can occur and at the same time it can be compost.” (Rie)
“Separating the leftovers, provide bins of different colors, then students will know there aren’t
even recycling bins in the school.” (Zif)
“Make sure there is no solid material that is thrown into the barrel. The rubbish will be separated
as a value or item so students will be alert of that thing.” (Shel)
Green Practices
The respondents also feel that some green practices can be practiced during cooking practical sessions such as
conserving water and reducing the use of materials that cannot be recycled.
“Coconut husk can be used for washing dishes. Use the inner part to wash pots.” (Shee)
“Save on the use of soap and water; wash the glasses first, so the water used for washing glasses can be used to rinse dishes, plates and food containers.” (Zif)
“Look at the villagers. He used the example of banana pith. I asked: what is it? It can absorb oil,
so before washing oily equipment, rub it first with banana pith.” (Zif)
“So leftovers should not be discarded in the trash, we turn them into compost so it can be used
as fertilizer.” (Rie)
“We avoid the use of plastic, then, we can reuse plastic for hydroponics. And bring lunch from
home, the food containers can be washed and reused.” (Bak)
3R Concept
The respondents also expressed that some 3R concepts can be practiced during the students’ cooking practical
activities, which are reuse, reduce and recycle.
Reduse
Shel believes “that for cooking practical, save water when cooking, washing and so on.”Sha also provides the
same opinion, “We have to implement it, before and after practice. Have to make sure not to waste, make sure to
save.”
Reuse
With regard to reuse, Bak believes students should practice it by using their own containers,
“We now want to implement green technology, students bring food containers from home and bring it to school, either to buy nasilemak, I would practice using my food container to buy
nasilemak, then fill the NasiLemak (traditional Malay food) in it. That is green tech too right?
Familiarize one-self to buy a safe container and to not use polystyrene.” (Bak)
Zif and Rie also suggest reusing recycled materials, “Newspapers can be used to cover tables” and “Coconut
husks can be used to wash pots that are greasy.” Meanwhile, Shee gives another example such as in the wood
work, surplus materials can be used for other uses,

Proceeding of the 3rd International Conference on Education, Vol. 3, 2017, pp. 145-154
151
“So when sawing wood, there will be saw dust. Do not throw the dust as we can use it for
something else. The saw dust can be used to moisten plants.” (Shee)
Recycle
The respondents also suggest that students should be more creative in recycling used materials to produce other
products as stated by Rie,
“I told the students to take old fabric and reuse them to make pot holders, then take old fabrics
and tack them. We are teaching children to use things in the house and avoid expenditure. Those
things can then be used again.” (Rie).
Ziph also suggests the same thing, “Creating menus. Form colored cards into beautiful shapes, there are words
that can be cut into pieces, arrange and paste it. I added to it by teaching students to create the menu by using
recycled materials. Students really like doing things like these. It’s creative.” Shee concurs with Ziph,
“For card decor, we recommend to decorate egg flowers and paste it on the card. Recycle; there
is no need to buy new.” (Shee)
Discussion
Solid waste is the cause of the high level of pollution and represents a great challenge to the environment
(Licyet al. 2013), (Hanifahet al. 2012). Hence, the appropriate green-skill content that should be included first in
the subject of design and technology is solid waste management, because the most effective way to reduce
pollution is to adopt the separation management of solid waste at source before it is discarded or disposed of.
Solid waste management is also recommended to be taught to students starting from the primary level by
(Taylor et al. 2015). This finding is in line with what has been proposed by (Festus and Ogoeggbunam, 2012)
and (DPSP, 2016) who suggest three things in an effective solid waste management: 1) Prevent waste
generation; 2) Reduce waste at source; 3) Reuse of used goods and materials.
Thus, the schools must provide bins that label solid waste in accordance with appropriate and attractive colors as
means to attract students to practice waste segregation in the right way. Students can adopt sustainable practices
to conserve water, separate wastes and save electricity, as the findings of this study support those of (Wong and
Wan, 2008), (Karpiak and Baril, 2008), (Ifegbesan, 2010). When the infrastructures in schools are adequate and
conducive to sustainable development, the impact will be viewed holistically. This finding supports the
suggestion by (Zuhair, 2015), which proposes that a study of infrastructure and related equipment for the
implementation of green technology in the schools should be done; and the results and recommendations must
be incorporated in the school curriculum. This will give students an avenue to practice green skills in the real
world, which revolves around activities of their lives. Stakeholders or the underlying body of education should
play a role in providing support such as in the form of equipment required, in addition to giving knowledge
solely for the success of education related to sustainable environment in schools (Gorbonelet al. 2015), (AESA,
2014).
Green practices involving habits and behaviors that can reduce pollution are also suggested by the respondents.
These green practices consist of mainly steps that can be taken to reduce the accumulation of solid waste and to
reduce the harmful effects to the environment such as using natural resources and turning them into compost.
Proper sanitation methods are also important as they are included in one of the titles of sustainable development
studies based on project approach by (Stuhmcke, 2012) namely environmental friendly cleaning practice or
environmental sensitive cleaning practices.
Hence, the practices of 3R, reduce, reuse and recycle are also important elements in the teaching of
environmental sustainability. Most of us are familiar with this topic, but practicing it or embracing it as a culture
is another matter. Thus, these elements should be included in the teaching process as a step to instill the

AmarumiAlwi, ArasinahKamis, HaryantiMohdAffandi ,Faizal Amin NurYunu and RidzwanCheRus /Green Skills: Innovation in the subject of Design and Technology (D&T)
152
practices of 3R (Fahzy, 2014). Practical activities such as water and energy conservation in daily life are more
effective than the awareness campaign of the environmental programs in schools. This idea is suggested by
(Stuhmcke, 2012) and the recommended conservation practices such as saving electricity and water have
become a culture of sustainability in schools.
Reusing and recycling of materials are two different practices but have the same goal, which is to reduce the
generation of solid waste. Reuse is the practice of reusing items repeatedly, while recycling refers to putting
something in a cycle. We recycle and segregate wastes; they are then distributed to organizations or factories
that process them into new products for our use (DPSP, 2016). According to (Hasnahet al. 2012), reusing items
by improving the products will benefit the public by selling reusable materials, and this process can help reduce
waste and protect the environment. The 3R practices are elements already included in the existing teaching
modules or guidelines of sustainable development in overseas countries; for example,Teachingthe 3 Rs: Reduce,
Reuse, Recycle Keystage 3 in Australia (www.eco-schoolsni.org), and Resource Smart School in Ireland
(resourcesmart.vic.gov.au).
The above-mentioned details are elements of green skills that need to be addressed and can be incorporated into
the skill-oriented subjects such as design and technology (D&T), so that students can think about the
environment and master these sustainability practices. This can give a positive impact to the environment and
create a culture of conservation and love for nature (Festus and Ogoeggbunam, 2012), (Licyet al. 2013),
(Hasnahet al. 2012).
Conclusions
There is a need for green skills to be included in the subject of D&T in primary schools because the elements of
these skills support the principle of environmental sustainability. This is an innovation that should be added to
the curriculum as a skill. Green skills that can be imparted to students include the following: the right solid
waste management practices, green practices and practices of 3R-- Reduce, Reuse and Recycle. As we know,
the 3R method is still very much in demand by members of the global community (Hasnahet al.2012). The
content can also be used as a guide for planning the construction of teaching modules and curriculum
development.
Acknowledgements
The author gratefully acknowledges the Ministry of Higher Education of Malaysia for the funding of the project
FRGS (Fundamental Research Grant Scheme), 2015-0166-107-02 (FRGS/1/2015/SS109/UPSI/03/13). The
author also acknowledges the constructive comments received by the anonymous reviewers.
References
Arasinah, K. Ramlee, M.,Waliza, M.A.W., and BushraLamuna, I., 2016, Green Skills as an Added-Value Element in Producing Competent, Int. Journal of Engineering Research and Application, vol. 6(11) pp.12-21.
Armstrong, A.E. Parsons, S. and Barker, P.J., 2000, An inquiry into moral virtues, especially compassion, in
psychiatric nurses: Findings from a Delphi study, Journal of Psychiatric and Mental Health Nursing, 7(4), pp.
297-306.
Australian Education for Sustainability Alliance [AESA], Education for sustainability and the Australian
Curriculum Project: Final report for Research Phases 1 to 3, Melbourne, VIC, Australia, Date of accessed:
16/05/2015. http://aries.mq.edu.au/publications/other/Education/EfS-in-Aust-Curriculum.pdf
Carbonel, L.G., Adora, M.B., and Agbisit, I.C., 2015, Global Environmental Issues Awareness and The
Perceived Remedial Measures, International Journal of Advanced Research in Management and Social
Sciences, vol. 4(11), pp. 148-161.
Cedefop, Green skills and environmental awareness in vocational education and training, European Centre for
the Development of Vocational Training, Luxembourg, Date of accessed: 12/01/2015.
http://www.cedefop.europa.eu/files/5524_e n.pdf

Proceeding of the 3rd International Conference on Education, Vol. 3, 2017, pp. 145-154
153
Cedefop, Greener Skills and Jobs. OECD Green Growth Studies. OECD Publishing. Date of accessed:
5/05/2015. http://dx.doi.org/10.1787/9789264208704-
Creswell, J.W., 2014. Educational Research: Planning, Conducting and Evaluating Quantitative and
Qualitative Research (4th ed), New Jersey: Pearson Education Inc.
DasarPengurusanSisaPepejal Negara, [DSKP], In Malay, Date of accessed 24/04/2016.
http://jpspn.kpkt.gov.my/.
Dokumen Standard KurikulumdanPantaksiran RBT Tahun 5, [DSKP], 2014, BahagianPendidikanKurikulum,
KementerianPendidikan Malaysia. In Malay.
Fahzy, A. R., 2014, Reduce, Reuse, Recycle: Alternatives for Waste Management, Unpublished, in Extension
Family Resource Management Specialist, Department of Extension Family and Consumer Sciences, New Mexico State University.
Festus, M.O., and Ogoeggbunam, O.B., 2012, Imperatives of environmental education and
awareness,Educational Sciences, pp. 254-258.
Hanifah, M., 2014, Kesedaran dan Komitmen Pendidikan Pembangunan Lestari Dalam Komuniti Sekolah
Menerusi Program Sekolah Lestari di Malaysia,In Malay, PhD Dissertation, Perak, Universiti Pendidikan Sultan
Idris.
Hanifah, M., Yazid, S., Mohmadisa, H.,and Nasir, N., 2016, Model Development on Awareness of Education
for Sustainable Schools Development in Malaysia, International Journal of Geografi. vol. 48 (1), pp.37-46.
Hasnah, A., Dody, D., Noraziah, A.,Maznah, I., andSarifah, Y., 2012, Masyarakat dan amalan pengurusan sisa
pepejal ke arah kelestarian komuniti: Kes isi rumah wanita di Bandar Baru Bangi, Malaysia. In Malay,
GeografiaMalaysia Journal of Society and Space, vol.8(54), pp. 64-75.
Ifegbesan, A., 2010, Exploring Secondary School Students' Understanding and Practices of Waste Management
in Ogun State, Nigeria, International Journal of Environmental and Science Education, vol. 5(2),pp. 201-215.
Jabatan Alam Sekitar, Kementerian Pelajaran Malaysia, Institut Alam Sekitar dan Pembangunan (LESTARI),
Asas pembentukan Sekolah Lestari Anugerah Alam Sekitar, (Ed.ke-3), 2012, In Malay, Jabatan Alam Sekitar,
Putrajaya,
Jamilah, A., and Hasrina, A., 2011, Pengetahuan, SikapdanAmalanMasyarakat Malaysia
TerhadapIsuAlamSekitar,” unpublished, In Malay, UniversitiKebangsaan Malaysia.
Johnson, K., Hays, C., Center, H., and Daley, C., 2014, Building capacity and sustainable prevention innovations: a sustainability, Evaluation and Program Planning Research, vol. 7, pp. 135-149.
Karpiak, C.P., and Baril, G.L., 2008, Moral reasoning and concern for the environment, Journal of
Environmental Psychology, vol. 28(3),pp. 203-208.
Kementerian Tenaga, Teknologidan Air, In Malay, Date of accessed 16/06/2016.
http://www.kettha.gov.my/portal/index.php.
Licy, C., Vivek, R., Saritha, K., Anies, T,. and Josphina, C., 2013, Awareness, Attitude and Practise of Scholl Students toward Household Waste Management, Journal of Environment, pp. 147-150.
Maxwell, J.A., 2013, Qualitative Research Design: An Interactive Approach, Thousand Oaks: Sage.
McDonald, G., Condon, L., andRiordan, M., 2012, The Australian Green Skills Agreement:Policy and Industry
Context, Institutional Response and Green Skills Delivery,” TAFE Directors Australia, Broadway, Australia.
Meenakshi, S., and R. Leela, R., Environmentally Sustainable Consumption: A Review and Agenda for Future,
Research in Global Journal of Finance and Management, 6(4), pp. 367-374.
Mohd Zuhair, A.Z., 2015, Tahap Kesedaran Teknologi hijau dalam Kalangan Guru-guru Kejuruteraan Zon
Utara, In Malay. Master Thesis, Universiti Tun Hessein Onn. Malaysia.
Nagle, B., and Williams, N., 2012. Methodology Brief: Introduction to Focus Groups. Center for Assessment,
Planning and Accountability. Date of accessed 16/07/2015.
http://www.uncfsp.org/projects/userfiles/File/FocusGroupBrief.pdf
Pavlova, M., and Huang, C.L., 2013, Advancing Employability and Green Skills Development: Values
Education in TVET, the Case of the People's Republic of China,Skills development for inclusive and sustainable
growth in developing Asia- Pacific Technical and Vocational Education and Training. Issues, Concerns and
Prospects, vol.18, pp. 327-343. Date of accessed 15/06/2015. http://download.springer.com/static/pdf/487
/chp%253A10.1007%252F978-94-007-5937

AmarumiAlwi, ArasinahKamis, HaryantiMohdAffandi ,Faizal Amin NurYunu and RidzwanCheRus /Green Skills: Innovation in the subject of Design and Technology (D&T)
154
Powel, C., 2003, The Delphi technique. Myths and realities, Journal of Advanced Nursing, vol.19(6), pp.1221-
1225.
Rogers, E.M., 2013, Diffusion of Innovations (5th ed.), New York: Free Press.
Saravanan, R.H., and Ahmad, M., 2013, Amalan Penggunaan Lestari dalam kalangan pelajar tingkatan empat di
daerah Kluang Johor, In Malay, International Conference Geografi Dan Alam Sekitar Kali Ke-4, Malaysia, pp. 169–180,
Shahrom, M.Z.,Noor Ezlin, A.B., Fatihah, S., Othman,J and Hassan,B., 2015, Pendidikan Alam Sekitar:
Bagaimana usaha-usaha dilakukan dalam Proses Pengajaran dan Pembelajaran, unpublished, In Malay, Bangi
Selangor, UKM.
Sharifah Zarina, S. Z., 2014, Pengetahuan Alam Sekitar Dalam Pendidikan Sains Sekolah Rendah Asas
Pembangunan Lestari, In Malay, Jurnal dalam Pembangunan Lestari Di Malaysia, vol. 7, pp. 261-277.
Siti Nor Syazwani, S.,Mohd Safarin, N., and Muhammad Sukri, S., 2014, Integrasi Teknologi Hijau Dalam
Kurikulum Pendidikan Teknik Dan Vokasional (PTV), In Malay, Journal of Technical, Vocational &
Engineering Education, vol. 5, pp. 11-19.
Siti Rohani, J., 2013, Kesedaran Teknologi Hijau Dalam Kalangan Warga Universiti Tun Hussein Onn,In
Malay, Master Thesis, Universiti Tun Hussein Onn.
Sola, A.O., 2014, Environmental education and public awareness, Journal of Educational and Social
Research, 4(3), pp. 333-337.
Strietska-Ilina, O., Hofmann, C., Haro, M.D., and Jeon, S., 2012, Skills for green jobs: A global view,
International Labour Office, Geneva,Date of accessed 11/02/2016. www.ilo.org/publns
Stuhmcke, S. M., 2012. Children As Change Agents For Suistanaibility, An Action Reserach Case Study In a
Kindergarden, PhD Dissertation, Faculty of Education. Queensland University of Technology.
Taylor, N., Quinn, F. and Eames, C., 2015, Educating for Sustainability in Primary Schools Teaching for the
Future, Sense Publishers.
Teaching the 3 Rs: Reduce, Reuse, Recycle Keystage 3.Date of accesed 17/05/2015.
http://gcpcenvis.nic.in/Kids-Student/SV_RS_Reduce_Reuse_Recycle1.pdf
Teoh, E.S., 2016, An Evaluation of Environmental Education in Selected Primary Schools in Pahang, Malaysia,
PhD Dissertation, Perak, Universiti Pendidikan Sultan Idris.
Tersine, R.J., and Ringgs, W.E., 1979, The Delphi technique: A long range planning tool, Business Horizons,
pp. 51-56.
The Green Schools Resource Guide A Practical Resource for Planning and Building Green Schools in Ontario,
Date of accessed 13/05/2015. http://www.edu.gov.on.ca/eng/policyfunding/GreenSchools_Guide.pdf
UNEVOC, International Centre for Technical and Vocational Education and Training. Date of accessed
12/06/2016. http://www.unevoc.unesco.org/International Conference on Sustainable Development.
Yin, R.K., Qualitative Research from Start to Finish, New York: The Guilford Press.
Warford, M.K., 2010, Testing a Diffusion of Innovations in Education Model (DIEM), The Innovation Journal:
The Public Sector Innovation Journal, vol. 10(3), pp. 7-17.
Wong, T.K., and Wan, S.P., 2018, Environmental awareness and behavior in Hong Kong: A decade of
development. TASPPA Partnership with

Proceeding of the 3rd International Conference on Education, Vol. 3, 2017, pp. 155-165 Copyright © 2017 TIIKM ISSN 2424 - 6700 online DOI: https://doi.org/10.17501/icedu.2017.3117
3rd International Conference on Education, 20-22 April 2017, Kuala Lumpur, Malaysia
ENHANCING MATHEMATICS STUDENTS’ MENTAL
COMPUTATION IN CALCULATING PERCENTAGE
BY USING THE BUBBLE METHOD
Nor Halimah Aminah Muhammad Nur Lubis1, Khairul Amilin Tengah
2,
Masitah Shahrill3 and Elvynna Leong
4
1,2,3SultanHassanalBolkiah Institute of Education, Universiti Brunei Darussalam, Brunei 4Faculty of Science, Universiti Brunei Darussalam, Brunei
Abstract:As students progressed from primary to secondary school, they are exposed to the constant
use of calculators in Mathematics. Due to this reason, some of them are becoming too comfortable
and too dependent on calculator even for simple arithmetic. Hence, this study was conducted to
promote mental computational skills amongst secondary students by using the Bubble Method. A
total of 44 mathematics students from two different schools were selected to be the participants of
this study and were involved in intervention lessons using the Bubble Method. Based on the analysis
result of pre-test and post-test, administered before and after the intervention respectively, 11
students were selected for further interview. Based on the findings, the effect of the students‟
performance in calculating percentage has been found to be not statistically significant using the
Bubble method, however, all the students who were interviewed agreed that the Bubble Method
improved their mental computational skill.
Keywords: Bubble Method, Mental Computation, Percentage, Mathematics
Introduction
In order to provide holistic education to achieve fullest potential for all, and to fulfil the needs and challenges of
the social and economic development of the 21st Century for the young generation and develop 21st century
skills amongst students, Brunei Darussalam‟s (hereafter referred to as Brunei) Ministry of Education introduced
a new educational system in 2008 known as the National Education System for the 21st Century or Sistem
Pendidikan Negara Abad ke-21, SPN 21(Ministry of Education, 2013).The curriculum in the SPN21 education
system were organised based on several factors including toemphasisis on essential skills, knowledge and
understanding, particularly in the nine specific learning areas, including mathematics,. One of the skills that is
categorised under the essential skills is numeracy skills. Hence, to adapt to this curriculum, a study was
conducted to enhance the numeracy skills for secondary students.
Teachers play an important role in education. However, being a teacher in this century is challenging,
particularly to experienced teachers who are set on their practicing teacher-centred approach. In order to enact
the SPN21 system, they have to be aware of and adaptable to the current method of teaching that cater the
learning style of the current young generation. This also applies to new teachers and pre-service teachers who
were brought up and taught with the teacher-centred approach. The way a teacher was once taught is a factor
that influenced the way the teacher teaches (Cruickshank et al. 2009). Hence, all teachers, experienced or
amateur, have to keep an open mind and be receptive to the 21st century trends and cultures in teaching and
learning.
Need and significance of the study
Students are early exposed to mental computation from primary level. They would perform simple calculation
Corresponding Author:Nor HalimahAminah Muhammad NurLubis/[email protected]

Nor HalimahAminah Muhammad NurLubis, KhairulAmilinTengah, Masitah Shahrill and Elvynna Leong / Enhancing mathematics students’ mental computation in calculating percentage by using the bubble method
156
mentally or written, but as they advanced to secondary level, with the introduction of calculator andfrequent
used in many math lessons, most of them are inclined to use calculators to calculate simple addition,
multiplication or arithmetic as they progress.
In traditional teaching in Brunei, when introducing a new topic that involves the use of formula(s), mojority
teacherstend to start by introducing a formula to the students which they have to memorize and use to perform a
written algorithm in order to solve mathematics problems. The teacher would follow-up with few worked-out
examples using that given formula and provide similar questions for the students to practice by themselves.
With this practice and drilling, some students are be able to remember and grasp the concept of the formula they
learned. However, SPN21 emphasises on teaching the concept before the students are introduced to the formula
so that they will have better understanding on the formula, which this study is based on.
This study focuses on percentage as it can be easily related to real world context and is commonly used in other
subject area. This is supported by McIntosh and Dole (2000) who state “Percent is one topic within the
mathematics curriculum that is frequently used and applied in other subject areas as well as beyond the
classroom”.
This study exposes the students to mental computation and thus encourage them to be less dependent on
calculator. To make this mental computation skill as a life skill, this study may help students compute
percentages mentally in real life situations, where we do not always have calculator in our hands.
Purpose of the study
The Bubble Method will focus on and promote mental computation skill among secondary school students,
encouraging less reliance on calculator and enhance their skills in computing mentally. In addition, this study
will also investigate how effective the Bubble Method as an alternative method of in calculating percentage, in
addition to prior methods introduced before.
Theoretical Framework of the Research Study
In order to guide and ease the process of this research, the theoritical framework shown in Figure 1 wasused as a
guidence to carry out the study. With the Bubble Method, the lesson will be focusing on mental computation,
and to enhance their knowledge on percentages by using the students‟ prior knowledge on addition, subtraction
and division. This method also uses students‟ previous knowledge on certain topic and build up a new
knowledge on another topic and hence they would understand the concept or meanings behind it.
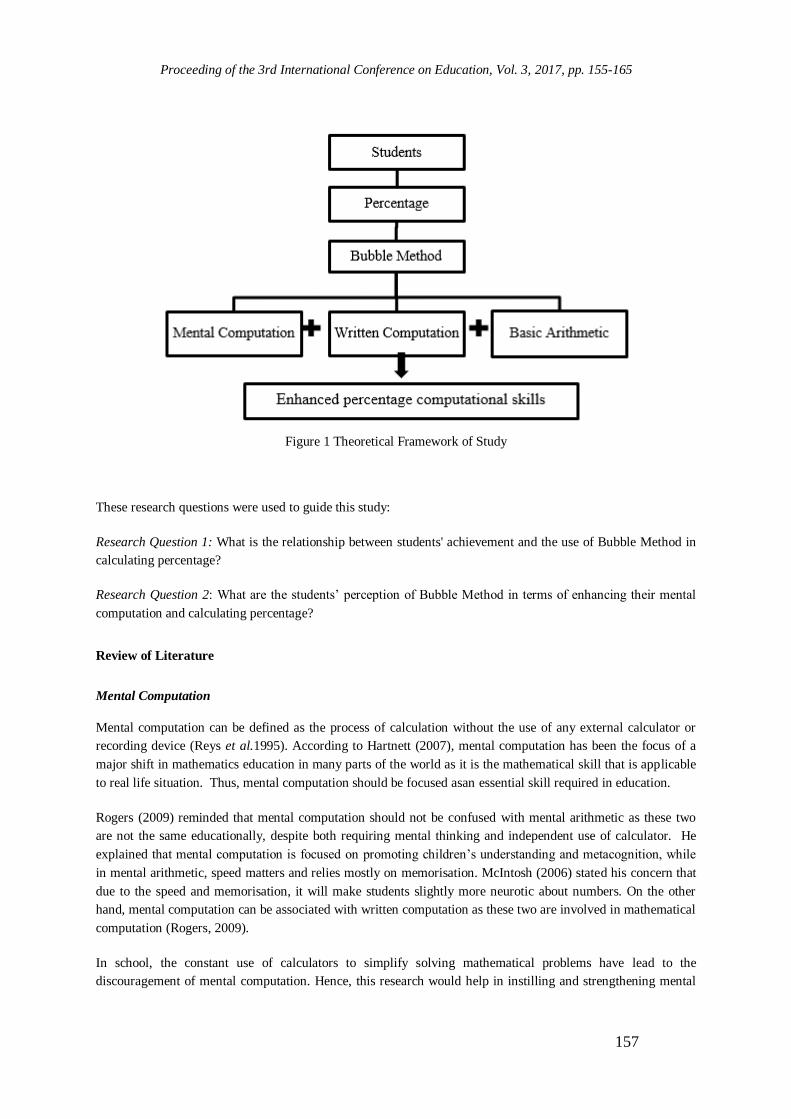
Proceeding of the 3rd International Conference on Education, Vol. 3, 2017, pp. 155-165
157
Figure 1 Theoretical Framework of Study
These research questions were used to guide this study:
Research Question 1: What is the relationship between students' achievement and the use of Bubble Method in
calculating percentage?
Research Question 2: What are the students‟ perception of Bubble Method in terms of enhancing their mental
computation and calculating percentage?
Review of Literature
Mental Computation
Mental computation can be defined as the process of calculation without the use of any external calculator or
recording device (Reys et al.1995). According to Hartnett (2007), mental computation has been the focus of a
major shift in mathematics education in many parts of the world as it is the mathematical skill that is applicable
to real life situation. Thus, mental computation should be focused asan essential skill required in education.
Rogers (2009) reminded that mental computation should not be confused with mental arithmetic as these two
are not the same educationally, despite both requiring mental thinking and independent use of calculator. He
explained that mental computation is focused on promoting children‟s understanding and metacognition, while
in mental arithmetic, speed matters and relies mostly on memorisation. McIntosh (2006) stated his concern that
due to the speed and memorisation, it will make students slightly more neurotic about numbers. On the other
hand, mental computation can be associated with written computation as these two are involved in mathematical
computation (Rogers, 2009).
In school, the constant use of calculators to simplify solving mathematical problems have lead to the
discouragement of mental computation. Hence, this research would help in instilling and strengthening mental
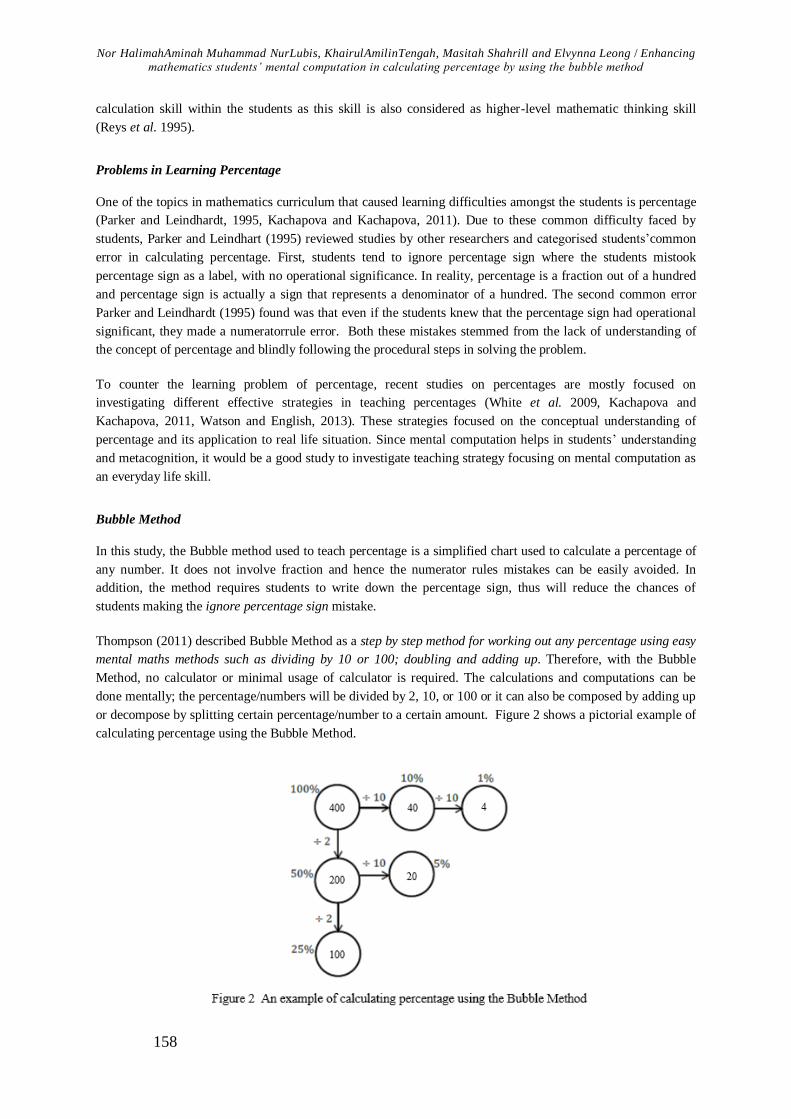
Nor HalimahAminah Muhammad NurLubis, KhairulAmilinTengah, Masitah Shahrill and Elvynna Leong / Enhancing mathematics students’ mental computation in calculating percentage by using the bubble method
158
calculation skill within the students as this skill is also considered as higher-level mathematic thinking skill
(Reys et al. 1995).
Problems in Learning Percentage
One of the topics in mathematics curriculum that caused learning difficulties amongst the students is percentage
(Parker and Leindhardt, 1995, Kachapova and Kachapova, 2011). Due to these common difficulty faced by
students, Parker and Leindhart (1995) reviewed studies by other researchers and categorised students‟common
error in calculating percentage. First, students tend to ignore percentage sign where the students mistook
percentage sign as a label, with no operational significance. In reality, percentage is a fraction out of a hundred
and percentage sign is actually a sign that represents a denominator of a hundred. The second common error
Parker and Leindhardt (1995) found was that even if the students knew that the percentage sign had operational
significant, they made a numeratorrule error. Both these mistakes stemmed from the lack of understanding of
the concept of percentage and blindly following the procedural steps in solving the problem.
To counter the learning problem of percentage, recent studies on percentages are mostly focused on
investigating different effective strategies in teaching percentages (White et al. 2009, Kachapova and
Kachapova, 2011, Watson and English, 2013). These strategies focused on the conceptual understanding of
percentage and its application to real life situation. Since mental computation helps in students‟ understanding
and metacognition, it would be a good study to investigate teaching strategy focusing on mental computation as
an everyday life skill.
Bubble Method
In this study, the Bubble method used to teach percentage is a simplified chart used to calculate a percentage of
any number. It does not involve fraction and hence the numerator rules mistakes can be easily avoided. In
addition, the method requires students to write down the percentage sign, thus will reduce the chances of
students making the ignore percentage sign mistake.
Thompson (2011) described Bubble Method as a step by step method for working out any percentage using easy
mental maths methods such as dividing by 10 or 100; doubling and adding up. Therefore, with the Bubble
Method, no calculator or minimal usage of calculator is required. The calculations and computations can be
done mentally; the percentage/numbers will be divided by 2, 10, or 100 or it can also be composed by adding up
or decompose by splitting certain percentage/number to a certain amount. Figure 2 shows a pictorial example of
calculating percentage using the Bubble Method.

Proceeding of the 3rd International Conference on Education, Vol. 3, 2017, pp. 155-165
159
The example in Figure 2 shows that to calculate 24% of 400, start by entering 400 in the 100% bubble and work
around the bubble by entering the values inside the bubble. Since 24% of 400 is not stated in the bubble,
decompose 24% into 10% + 10% + 1%+ 1%.+ 1%.+ 1%, which will give us 94. Alternatively, we can use 25%
- 1% (100 – 4)
The process of decomposing numbers (McIntosh and Dole, 2006, Hartnett, 2007) and dividing by 2 (Hartnett,
2007, Wiggly, 2008) fall under the category of mental computation strategies. In addition, the researcher also
considers that dividing numbers by 10 or 100 also falls under the same category since it can be done mentally.
In conclusion, the Bubble Method offers a solution to the problems commonly faced in percentage calculation
and therefore, could increase the understanding of the concept of percentage. In addition, the method could help
to strengthen the students‟ computation skill as it involves the use of mental computation which is essentially
applied in real life calculation skills.
Methodology
This research adopted the mixed-methods approach that combines both quantitative and qualitative approach
(Mills, 2014). The two research questions stated in the introduction section were used to guide the study. Figure
3 is an illustration of the instrument used for collecting data for the above purpose.
The participants involved for this study were Year 9 students from two secondary schools in Brunei; an all-boys
and mixed gender school. The participants from all-boys school (Class A) consisted of 14 students, while two
groups from the mixed gender school (Class B and C) consisted of 12 and 18 students respectively. The
participants from the three categories comprised of different level of achievers. Class A, the students were
classified as low achievers, Class B consisted of high achievers and the students in Class C were a mixture of
low and high achievers. Therefore, the total numbers of participants for the lesson intervention were 44 students.
In this study, interventionwas conducted in three sessions of 50-60 minutes lessons, excluding the
administration of pre-test and interview. A pre-test, consisting of 8 questions, was administered by the class
teacher prior to intervention lessons with the purpose of identifying students‟ level of achievement in calculating
percentage as they have learned the topic prior to this study.
4
0
0

Nor HalimahAminah Muhammad NurLubis, KhairulAmilinTengah, Masitah Shahrill and Elvynna Leong / Enhancing mathematics students’ mental computation in calculating percentage by using the bubble method
160
The intervention lessons were constructed with close reference to the learning objectives of percentage set by
Cambridge IGCSE Mathematics syllabus for examination, with multiple percentage calculation used as
examples. For each question, students were asked to work out the problem using their own preferred method,
followed by introduction to the application of the Bubble Method to solve the problem.
Finally, the students were given post-test which consisted of the same questions as the pre-test questions to
measure the effect of intervention on students performance.This was administered on the third session and the
students were given the freedom to answer the post-test with any method they preferred. Paired-sample t-test
between the pre- and post-test was carried out using the Statistical Package for the Social Science (SPSS)
software to check if there exist a significant improvement due to the intervention. In addition, the association
between Bubble Method and the students‟ achievement was measured by calculating the Pearson Chi-squared
value.
For this study, a one-on-one semi-structured interview was conducted to explore the students‟ perspective on the
effect of the bubble on their mental computation skill. To ensure the responses from the participants were
captured, the researcher will use a voice recorder during the interview, suggested by Mills (2014) so that
thorough analysis could be done.
Initially total of 12 out of 44 students were chosen for interview; 4 students from each class to represent their
class. However, due to certain circumstances, only 3 students were interviewed for Class A and 4 students for
each of the other two classes which made a total of 11 students. The students were selected based on the analysis
of the pre-test and post-test.
The structure of the interview was centralised based on the following questions:
1) (a) Can you tell me about yourself as a mathematics student?
(b) How do you find mathematics? Easy, medium or difficult?
2) (a) Do you remember the Bubble Method I introduced during the intervention?
(b) Do you understand the Bubble Method?
(c) How do you find it?
3) (a) What can you understand by the word „mental computation‟?
(b) By comparing the Bubble Method and the usual method you used in calculating percentage, which one
involves more mental computation if no calculators are allowed to be used?
(c) Do you think the Bubble Method enhance your mental computation skill?
4) (a) When you did the post-test, do you realise that the questions were the same as the pre-test?
(b) Do you remember how you perform in the pre-test?
(c) Do you think that have any effect on you performance in the post-test?
(d) If given more time in practicing answering questions using the Bubble Method, do you think you will
perform better in the post-test?
The transcripts from the interview were coded and analysed according to the theme of the responses obtained,
and at instances of responses to open questions, appropriate coding and making sense of the responses and
connection to the research questions was done, as suggested by Lowe (2007).
Result and Discussion
From Table 1, the mean of test score for Class A decreased from 3.36 in the pre-test to 2.43 in the post-test a
significance value of more than 0.05 (p = 0.60). Hence, there is no evidence showing that the intervention had
any effect on the post-test. The reason for this might be due to the level of the students‟ ability. The students
from Class A consisted of low achievers and slow learners. Hence, the decrease in the mean value of pre-test to
post-test for this class could be due to the students‟ lack of interest to study, or weak ability to grasp or fully
utalised the bubble method concept at the given intervention time. Furthermore, the post-test was conducted

Proceeding of the 3rd International Conference on Education, Vol. 3, 2017, pp. 155-165
161
during the last period of the school time during which these students might not give their best effort in
attempting the test.
Table 1Paired sample t-test for Pre and Post Tests
Mean Standard
Deviation
Mean
Difference t-value
Significance
value
Class A Pre 3.36 1.008
-0.93 -2.06 0.60
Post 2.43 1.505
Class B Pre 6.75 1.055
0.83 4.02 0.002
Post 7.58 0.900
Class C Pre 5.44 1.917
0.95 1.84 0.84
Post 6.39 1.614
It can be seen that Class B was the only group with statistically significant difference between the mean in pre-
test and post-test (p < 0.05), with an increase mean of 0.83. Therefore, the intervention did offer some effect on
the post-test result. To measure the size of the difference and the effect of the intervention, Cohen d‟s value was
calculated. It was suggested by Cohen that if d = 0.2, the effect is small, d = 0.5 suggests moderate effect, and d
= 0.8 suggest the effect is large. For Class B results, the calculated value of the effect size, d, for this group was
1.16. Since this value was more than 0.80, the effect size is large and this gives extra evidence that the
intervention did improve the students‟ performance in calculating percentage for this class. The fact that this
class consists of high achievers and fast learners could be the reason of the large effect. Furthermore, the class
teacher informed the researcher that these students‟ mental computation skills were already good and possibly
this intervention have a further positive impact on that mental computation ability.
The result for Class C, shows some improvement after the intervention (mean increase if 0.95) but the difference
was not statistically significant (p > 0.05). However, further analysis on calculating the effect size (d = 0.43)
suggest that the intervention had moderate effect on the result since the value of d obtained was close to 0.5.
This moderate effect could be due to the level of the students‟ achievements that comprised of a combination of
low and high achievers, thus the low results obtained by the low ability students might have affected the
outcome and significance of the overall result.
Table 2 shows the number of students and the percentages of the number of students for each class comparing
their performance and the method they chose to answer the post-test. Negative difference means that the
students scored lower in the post-test than in the pre-test, positive difference means that the students scored
higher in the post-test after the intervention and no difference means that the students scored the same mark in
both pre-test and post-test. For Class A and Class C, we can see that majority of the students preferred Bubble
Method compared to the usual method. As for Class B, equal number of students preferred either Bubble
Method or usual method. However, those who chose mixed method also used Bubble Method to answer some of
the questions. Hence, they also preferred Bubble Method to some extent. If this is the case, then majority of
students from each class preferred Bubble Method compared to usual method.
Table 2Cross tabulation between pre-test and post-test score difference with method used in post-test according
to their class
Negative
Difference
No
Difference
Positive
Difference Total
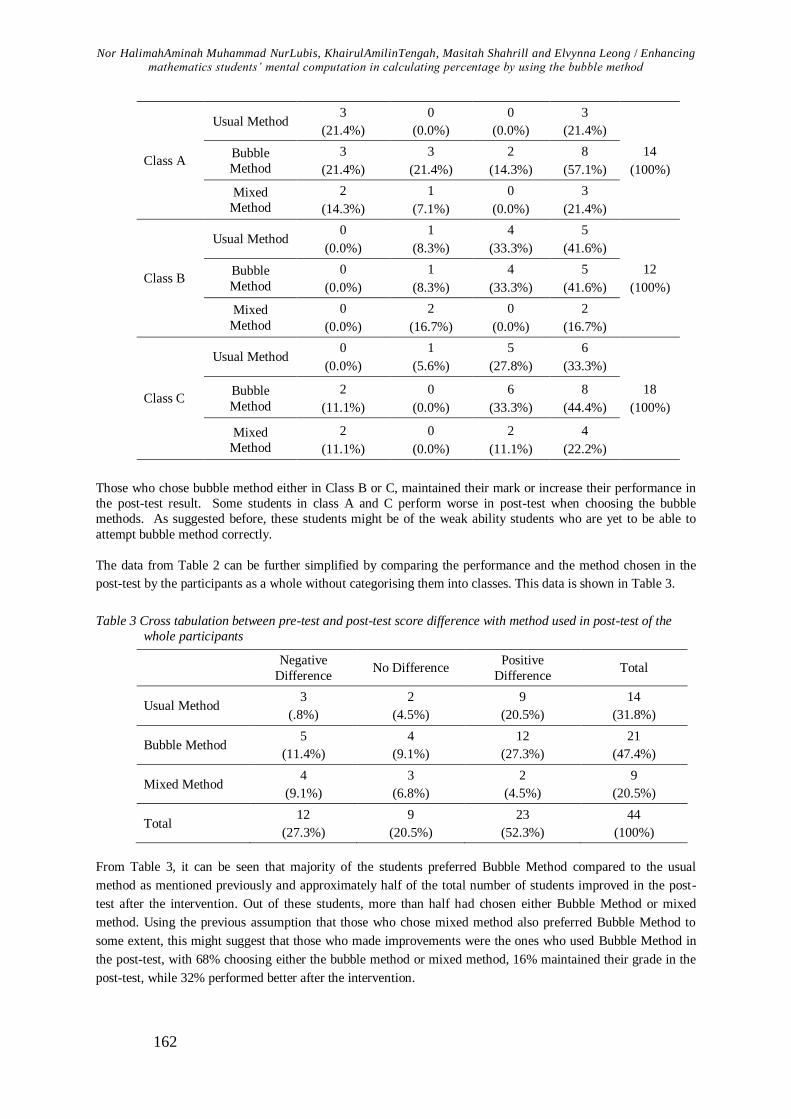
Nor HalimahAminah Muhammad NurLubis, KhairulAmilinTengah, Masitah Shahrill and Elvynna Leong / Enhancing mathematics students’ mental computation in calculating percentage by using the bubble method
162
Class A
Usual Method 3
(21.4%)
0
(0.0%)
0
(0.0%)
3
(21.4%)
14
(100%)
Bubble
Method
3
(21.4%)
3
(21.4%)
2
(14.3%)
8
(57.1%)
Mixed
Method
2
(14.3%)
1
(7.1%)
0
(0.0%)
3
(21.4%)
Class B
Usual Method 0
(0.0%)
1
(8.3%)
4
(33.3%)
5
(41.6%)
12
(100%)
Bubble
Method
0
(0.0%)
1
(8.3%)
4
(33.3%)
5
(41.6%)
Mixed
Method
0
(0.0%)
2
(16.7%)
0
(0.0%)
2
(16.7%)
Class C
Usual Method 0
(0.0%)
1
(5.6%)
5
(27.8%)
6
(33.3%)
18
(100%)
Bubble
Method
2
(11.1%)
0
(0.0%)
6
(33.3%)
8
(44.4%)
Mixed
Method
2
(11.1%)
0
(0.0%)
2
(11.1%)
4
(22.2%)
Those who chose bubble method either in Class B or C, maintained their mark or increase their performance in
the post-test result. Some students in class A and C perform worse in post-test when choosing the bubble
methods. As suggested before, these students might be of the weak ability students who are yet to be able to
attempt bubble method correctly.
The data from Table 2 can be further simplified by comparing the performance and the method chosen in the
post-test by the participants as a whole without categorising them into classes. This data is shown in Table 3.
Table 3 Cross tabulation between pre-test and post-test score difference with method used in post-test of the
whole participants
Negative
Difference No Difference
Positive
Difference Total
Usual Method 3
(.8%)
2
(4.5%)
9
(20.5%)
14
(31.8%)
Bubble Method 5
(11.4%)
4
(9.1%)
12
(27.3%)
21
(47.4%)
Mixed Method 4
(9.1%)
3
(6.8%)
2
(4.5%)
9
(20.5%)
Total 12
(27.3%)
9
(20.5%)
23
(52.3%)
44
(100%)
From Table 3, it can be seen that majority of the students preferred Bubble Method compared to the usual
method as mentioned previously and approximately half of the total number of students improved in the post-
test after the intervention. Out of these students, more than half had chosen either Bubble Method or mixed
method. Using the previous assumption that those who chose mixed method also preferred Bubble Method to
some extent, this might suggest that those who made improvements were the ones who used Bubble Method in
the post-test, with 68% choosing either the bubble method or mixed method, 16% maintained their grade in the
post-test, while 32% performed better after the intervention.

Proceeding of the 3rd International Conference on Education, Vol. 3, 2017, pp. 155-165
163
Student Interviews
The participants of this study were of different achievers and hence, the process of selection based on their
achievement tests was different for each class. From the interview with all 11 students, most of them agreed
with the classification of their achievement level except for the high achievers, they all think that they were of
average achievers instead of what had been told by their class teacher.
When the students were asked on their perspective on mathematics in general, two of them said that
mathematics is easy with a lot of practice. The interview also revealed few areas of mathematics that some of
the students had difficulties in: algebra, equations, formulae, and word problems. The students who had
difficulties in doing word problems were either not good in understanding English or good in English language
but had difficulties in extracting information from the word problem.
In terms of the students‟ perspective on the Bubble Method, majority of the interviewees found the Bubble
method to be simple, easy, and straight forward method. However, four out of the eleven students said that the
method was a little bit confusing and three of them were of the low achievers and preferred to use the usual
method. This gives evidence that the low result in class A (and non-statistical significance of class C) may be
due to the fact that the low ability students are not familiar or able to grasp the intervention concept in the short
period of intervention, thuse causing them not to successfully attempt the post-test using the bubble method.
All of the students, except one, agreed that they realised that the pre-test and post-test consisted of the same
questions. However, only three claimed that there was an effect on their post-test performance. Five of the
students said that even if they knew the questions were the same, it had no effect on their performances in the
post-test and the rest of the students were not sure whether it affected their performances.
To conclude the interview findings, 10 out of the 11 students definitely agreed that the Bubble Method enhanced
their computational skills and required them to use the skills more than the usual method.
Conclusion
The summary of the results and findings from the data collected are presented according to the research
questions of this study.
Research Question 1: What is the relationship between students' achievement and the use of Bubble Method in
calculating percentage?
From the analysis of the pre- and post-test results, there is evidence that supports the intervention of using
Bubble Method to calculate percentage have positive signifiant impact on high ability students‟ performance.
On the other hand, majority of the students who improved in the post-test chose the Bubble Method to calculate
percentage and from the students‟ sample work, there is some evidence showing that the Bubble Method helps
to avoid certain misconception and careless mistake in calculating percentage, hence, enhancing the students‟
performance in solving percentage problems.
In addition, from the result of the interview with the students‟ who chose Bubble Method in the post-test
revealed that they feel more confident in calculating percentage using the Bubble Method compared to the usual
method. Drop in performance of low ability students (in class A, possibly some in Class C) indicates that these
students might not be able to successfully attempt question using the bubble method due to lack of familiarity or
grasping the concept.

Nor HalimahAminah Muhammad NurLubis, KhairulAmilinTengah, Masitah Shahrill and Elvynna Leong / Enhancing mathematics students’ mental computation in calculating percentage by using the bubble method
164
Research Question 2: What are the students’ perception of Bubble Method in terms of enhancing their mental
computation and calculating percentage?
Based on the interview with the students of this study, all of them either agreed or somewhat agreed that the
Bubble Method enhanced their mental computational skill and required them to use more of the skill compared
to the usual method. In terms of using the Bubble Method to calculate percentage, majority of the students found
that the method was interesting, straight forward, and easy to understand. On the other hand, few of the students
pointed out that the method is confusing, time consuming and a lot of things to work on and thus might require
more time and practice to master the concept.
Implications
Even though the statistical data obtained in this study did not offer enough evidence to suggest that Bubble
Method improve the students‟ performance in calculating percentage in general, evidence do support that bubble
method is significant in the improvement in performance of high achievers. This makes bubble method a
possible great follow-up activity or reinforcement for learning purposes in these group of students.
While most found the bubble method interesting, straightforward and easy to understand, some also pointed out
method is confusing, time consuming and involves multiple component. Result in the weak ability students
indicated that more practice and time might be needed for students to fully grasp the concept and successfully
attempt them.
Bubble method can be used not only for the purpose of improving students‟ mental computation, but also as an
alternative method for calculating percentage, as observed in some of the students‟ sample work. Some showed
that they have more confidence in calculating percentage using Bubble Method and this method help reduce the
common mistakes made by students in calculating percentage.
Recommendations
Since this study is a short action research study, it can be repeated where the percentage lesson using the Bubble
Method can be conducted for a longer period of time. With longer period of time and regular practice, the
students would be more familiarised in using the Bubble Method especially for the low achievers who are slow
learners. For future research, it would be good to try introducing the Bubble Method before the usual method to
see if it would affect the preferences of method in calculating percentage. Alternatively, introducing bubble
method in theprimary/elementary level might have that added benefit of early familiarsation and development of
mental computation.
References
Cruickshank, D. R., Metcalf, K. K., and Jenkins, D. B., 2009, The Act of Teaching (5th ed.) (Blacklick, Ohio:
McGraw).
Hartnett, J. E., 2007, Categorisation of Mental Computation Strategies to Support Teaching and to Encourage
Classroom Dialogue. In J.Watson& K. Beswick (Eds). Proceedings 30th annual conference of the Mathematics
Education Research Group of Australasia – Mathematics: Essential Research, Essential Practice, Hobart,
Tasmania, pp. 345-352.
Kachapova, F. andKachapov, I., 2012, Percentage problems in bridging courses. International Journal of Mathematical Education in Science and Technology, 43(5), 654-663.
Proceeding of the 3rd International Conference on Education, Vol. 3, 2017, pp. 155-165
165
Lowe, M., 2007, Beginning Research: A Guide for Foundation Degree Students (New York, NY: Routledge).
McIntosh, A., 2006, Mental computation of school-aged students: Assessment, performance levels and common
errors. In C. Bergsten & B. Grevholm (Eds.). Proceedings of MADIF 5, the 5th Swedish Mathematics Education Research Seminar - Developing and Researching Quality in Mathematics Teaching and Learning, Malmö,
Sweden, pp. 136-145.
McIntosh, A., and Dole, S., 2000, Number sense and mental computation: Implications for numeracy. In
Australian Council for Educational Research (ACER), Proceedings Research Conference - Improving
Numeracy Learning, Brisbane, Australia, pp. 34-37.
Mills, G. E., 2014, Action Research: A Guide for the Teacher Researcher (Australia: Pearson Education).
Ministry of Education, 2013, The National Education System for the 21st Century: SPN21(Revised ed.)
(Berakas: Ministry of Education).
Parker, M., andLeinhardt, G., 1995, Percent: A privileged proportion. Review of Educational Research, 65(4),
421-481.
Reys, R. E., Reys, B. J., Nohda, N., andEmori, H., 1995, Mental computation performance and strategy use of
Japanese students in grades 2, 4, 6 and 8. Journal for Research in Mathematics Education, 26(4), 304-326.
Rogers, A., 2009, Mental Computation in the Primary Classroom. In R. P. Hunting, T. Fitzpatrick, J. A. Milne,
D. J. Itter, D. L. Martin, T. M. Mills, C. T. Lenard (Eds.). Proceedings of the Mathematical Association of
Victoria 46th Annual Conference – Mathematics of Prime Importance, Brunswick, Victoria, pp. 190-199.
Thompson, J., 2011, Bubble method - for finding percentages of any number | Skills Workshop. http://www.skillsworkshop.org/resources/bubble-method-finding-percentages-any-number
Watson, J.and English, L. D., 2013, The power of percent. Australian Primary Mathematics Classroom, 18(4),
pp. 14-18.
White, P., Mitchelmore, M., Wilson, S., andFaragher, R., 2009, Critical Numeracy and Abstraction:
Percentages. Australian Primary Mathematics Classroom, 14(1), 4-8.
Wiggly, A., 2008, Last chant for times tables. TES Newspaper.
https://www.tes.co.uk/article.aspx?storycode=23573
Proceeding of the 3rd International Conference on Education, Vol. 3, 2017, pp. 166-173 Copyright © 2017 TIIKM ISSN 2424 - 6700 online DOI: https://doi.org/10.17501/icedu.2017.3118
3rd International Conference on Education, 20-22 April 2017, Kuala Lumpur, Malaysia
USING CONCRETE MODEL TO ENHANCE CONCEPTUAL
KNOWLEDGE OF LOW ABILITY STUDENTS IN
FACTORISING QUADRATIC EXPRESSION
Eis Farhana Abdul Latiff1, Khairul Amilin Tengah
2,
Masitah Shahrill3 and Elvynna Leong
4
1,2,3Al-Falaah Primary School, Brunei Darussalam, Brunei 4Faculty of Science, Universiti Brunei Darussalam, Brunei
Abstract:This action research focused on the use of concrete models in the teaching and learning of
factorisation by participants from Year 10 low ability classes in Brunei. The study attempts to assist
students‟ difficulties in learning algebra, specifically on factorising quadratic expressions with all
positive coefficients by using simplified algebraic tile as a form of concrete manipulative to aid
teaching and learning. These tiles act as the remedial approach to improve students‟ conceptual
knowledge. Result analysis of 22 students indicated significant difference between the means of pre
and post-tests students‟ results using t-test, suggesting that the implementation of concrete model
does have an effect on students‟ achievements, and could possibly be used as an alternative approach
to teaching this topic. There were also some positive feedback and concerns raised by students on the
use of concrete models in their factorisation learning based on the interview of selected students in
the study.
Keywords: Manipulatives, Algebraic Tile,Factorization, Quadratic Expression
Introduction
The secondary school students in Brunei Darussalam are usually taught using „drilling and practice‟ method
which focuses more on the preparation for test or examination (Badarudin and Khalid, 2008). Badarudin and
colleague claimed that most teachers felt they were judged based on their students‟ examination results,
pressuring them to cover all syllabuses as quickly as possible to prepare students for tests and examinations.
Due to this norm, teachers had limited time to teach students on the conceptual knowledge despite agreeing of
its importance.
A new educational system known as the National Education System for the 21st Century or SistemPendidikan
Negara Abad ke-21 (SPN 21) was introduced in 2008 by the Ministry of Education of Brunei (Ministy of
Education, 2012). In order to achieve one of the aim stated in the SPN21 handbook (i.e. to develop 21st century
skills amongst our students), the Ministry of Education has set up three main learning domains that teachers
should focus on and implement into their classroom practices; knowledge and understanding, essential skills,
and, attitudes and values. Thus, lessons planning need to emphasise more on enriching students‟ conceptual
knowledge through different teaching approaches for the better development of mathematical understanding.
During her child psychology courses, Robert (2010) learned that one‟s learning develops from the concrete to
the semi concrete, or representational, and finally to the abstract or symbolic level. When this learning theory is
applied to mathematics, the use of manipulatives and hands-on learning experiences should precede procedural
symbol manipulation, which leads to her belief that using manipulatives could enhance students‟ conceptual
knowledge on abstract representations.
According to Moyer (2001), manipulative models, invented to purposely represent explicitly and concretely
Corresponding Author:EisFarhana Abdul Latiff/[email protected]
EisFarhana AbdulLatiff, KhairulAmilinTengah, MasitahShahrill and Elvynna Leong/ Using concrete model to enhance conceptual knowledge of low ability students in factorising quadratic expression
167
mathematical ideas that are abstract, enable students to be actively involved in the lesson through hands-on
experiences. This supports McClung‟s (1998) suggestion that incorporating the use of concrete model is one of
the strategies to enrich instructional activities that will produce optimal results in the algebra lesson.
Need and significance of the study
Several studies in the use of manipulative in algebra classrooms have resulted in mixed results. On a positive
outcome, a study by Hinzman (1997) indicated the use of manipulative enhanced students‟ learning and
increased students‟ confidence towards their learning with manipulative materials. On the other hand, McClung
(1998) found that students who did not use manipulative outperformed those taught with manipulative. This
study will provide mathematics teachers the option to utilise the application of concrete model in their
classroom activities to meet diverse students‟ learning needs in mathematics classroom, particularly dealing
with weaker students at secondary level.
Purpose of the Study
The purpose of this study is to use concrete model, „Algebraic Tile‟ as a remedial approach to improve students‟
difficulties in learning algebra specifically on factorising quadratic expression with all positive coefficients.
Majority of the students in Brunei, especially the low ability ones, find it difficult to apply the cross-
multiplication method that is commonly used when attempting questions on factorisation of quadratic
expression. Therefore, the algebra tiles act as an alternative approach in attempting such questions, or as a
bridge concept to connect and explain the cross-multiplication method.
Research Questions
These research questions were used to guide this study:
1. How does the aid of concrete model affect low ability students‟ performance on factorising quadratic
expression in Brunei Darussalam?
2. What are students‟ perceptions on the usefulness and effectiveness of concrete model in learning
factorisation of quadratic expression in Brunei Darussalam?
Review of Literature
Students’ Difficulties in Learning Factorisation of Quadratic Expression
Kotsopoulos (2007) reported that majority of her secondary mathematics students stated learning quadratics is
one of the most conceptually challenging topics, and she observed those who have difficulty with basic
multiplication table fact retrieval will also face difficulty in factorisation of quadratics effectively, since they are
interlinked. Other challenge experienced by students is the ability to recognise and understand varied
representations of the same quadratic relationship.
Recent study by Yahya and Shahrill (2014) on the strategies used in solving algebra by secondary school Year
11 repeating students in Brunei, categorised four main themes of students‟ errors; errors on understanding
factorising quadratic expression, errors on multiplication of factors, errors on addition of integers, and, errors
on the formation of solution for factorisation. They found that: students struggled to define the term as they
could not put common terms or linear expression in brackets; students have lack of fundamental concept in
distinguishing the terms; students used incorrect terms in determining factors; and several errors on adding
negative integers. The researchers also discovered that students‟ answers reflected rote learning and a lack of
relational understanding.
Proceeding of the 3rd International Conference on Education, Vol. 3, 2017, pp. 166-173
168
Concrete Model as a Remedial Approach to Students’ Learning
Pepperset al. (2014) conducted an action research lessons with an eighth-grade pre-algebra, designed on
conceptual understanding for mathematical proficiency of fractions, including fraction equivalences, ordering
fractions, and dividing and multiplying fractions. Positive result was achieved through incorporation of
concrete and virtual manipulative into the classroom activities throughout the year. Improvements were also
observed in students‟ attitudes toward math, their ability to communicate their understanding and subsequently,
their ability to build on the knowledge gained during the intervention lessons. Overall, students showed positive
reactions to both types of manipulative.
Shaw (2002) acknowledged the utilising manipulative and visual representations in mathematics
classroomenabled students to represent their mathematical ideas in multiple ways and subsequently, developed
their conceptual understanding. Thus, with clearer understanding, students‟ misconception could be minimised
and develop the sense of „ownership‟ of knowledge. She believed that if students fully understand a certain
concept in their learning, then anxiety of the subject is lessened, and encourage students to communicate
mathematical ideas and concepts confidently through discussion with their teacher and peers.
However, manipulative should be used correctly in order to achieve successful outcomes (Bogganet al., 2010).
They highlighted the importance of understanding the mathematical concept beforehand so that the learning
goals and objectives could be met with the effective use of correct manipulatives.
Teachers’ Views about using Concrete Model in Mathematics Instruction
There are some studies done on investigating teachers‟ views about using concrete model and other types of
manipulative in their mathematics classroom. Gulkilik and Arikan (2012) conducted a study on determining pre-
service secondary mathematics teachers‟ views on manipulative. From the results, the researchers concluded
that pre-service teachers had some concerns about the usage of manipulative such as time consuming, lack of
technological infrastructure in classrooms and lastly, students‟ and parents‟ expectations about university
entrance exam. Therefore, the teachers did not bother and avoid using manipulative in their lessons.
Methodology
The study adopted an action research approach through qualitative and quantitative methods, using concrete
manipulative of simplified algebraic tiles as part of the intervention lessons. Convenient sampling of two weak
classes in Year 10 in one of the all-boys secondary schools in Brunei-Muara District. In Brunei‟s SPN21
education system, all students follow a common curriculum fromYear 7, and then channelled, based on their
Student Progress Assessment (SPA) results at the end of year 8, to either General Secondary Education
Programme or Applied Secondary Education Programme. The two classes (group I and II) chosen are from the
Applied Secondary Education Programme and will sit for their International General Certificate of Secondary
Education (IGCSE) Examination the following year of their study. In terms of mathematical competencies and
skills, both classes are within the same range of ability and the participants are categorised into the low ability
group. A total of 42 students were initially involved in the study, however due to absenteeism either on the pre-
or post-test, only 22 students were considered in the analysis of this study.
The selected topic for this research study was factorisation of algebraic quadratic expression. Due to the
limitation on the features of the simplified version of algebra tiles, this study will only focus on factorising
quadratic expression with positive coefficients, i.e. 𝑎𝑥2 + 𝑏𝑥 + 𝑐 where 𝑎, 𝑏 and 𝑐 are positive constants. The
two-dimensional model is made from white paper, which comprised of three different sets of 4-sided shapes as
shown in Figure 1 to represent the “one” unit, 𝑥 and 𝑥2. It should be noted that side with 𝑥 was not multiple of
“one” (in this case it was 4.5 of 1) to ensure that corresponding 1 (and 𝑥) will only align with 1 (and 𝑥).

EisFarhana AbdulLatiff, KhairulAmilinTengah, MasitahShahrill and Elvynna Leong/ Using concrete model to enhance conceptual knowledge of low ability students in factorising quadratic expression
169
Figure 1 Algebra Tiles
Prior to the intervention lessons, pre-test was carried out in order to review the students‟ prior knowledge and
identify their basic algebraic factorisationknowledge. The pre-test questions consisted of six items and students
were given thirty minutes to complete them. These students are allowed to use calculators during the test to
avoid the effect of calculation error in this study.
Both classes went through two phases of intervention lessons. In the first lesson, the introduction on the concept
of factorisation and revision on cross-multiplication method, followed by the introduction of factorisation using
algebra tiles were carried out. Each set of algebra tiles were distributed to every student. The teacher first
demonstrated, using two examples of quadratic expression, how to rearrange algebra tiles to get a rectangular
shape in order to find its length and breadth as the factors of the expression. Class activity then followed where
students were required to rearrange algebra tiles on their own. They had to draw the patterns (arrangements) for
each quadratic expression and as the final step, evaluate the lengths and breadths.
On the last day of intervention, the students had to demonstrate three possible patterns for the assigned quadratic
expression. The purpose was to make them realise that no matter how many different patterns they came up
with, they would still get the same answer. At the same time, their teacher would be able to correct any students‟
mistakes and discuss their findings with the whole class, in addition to reinforcement of the intervention
concept.
At the end of the intervention lesson, post-test was conducted in order to determine if there was any
improvement on students‟ learning after utilising the concrete model in their classroom practices. Unlike in the
intervention lessons, only one group was supplemented with algebra tiles during this test while the other group
had to depend solely on their understanding from the intervention practices.Both pre-test and post-test consisted
of the same questions on factorisation algebraic expression with positive coefficient, gradually increasing in
terms of difficulties, with the last two items involving higher coefficients of 𝑥2 as shown in Table 1.
Table 1 Items in pre- and post-test
Item number Question
1 𝑥2 + 𝑥
2 𝑥2 + 2𝑥 + 1
3 𝑥2 + 5𝑥 + 6
4 𝑥2 + 7𝑥 + 12
5 2𝑥2 + 3𝑥 + 1
6 3𝑥2 + 5𝑥 + 2
As suggested by Cohen and Crabtree (2006), semi-structured interviews were conducted on selected students to
provide reliable and comparable qualitative information. Random sample of 6 students from each group were
selected for interview to further explore participants‟ thoughts on the usefulness and effectiveness of learning
factorisation with algebra tiles. The interviews concentrated on three aspects: how do you find mathematics in

EisFarhanaAbdLatiff, Khairul Amilin Tengah, Masitah Shahrill and Elvynna Leong / Using concrete model to enhance conceptual knowledge of low ability students in factorising quadratic expression
170
general; how did you feel when you first encounter algebra tiles; and why did you prefer algebra tiles/cross-
multiplication method.
Students‟ scores in pre- and post- tests were analysed through paired sample t-test using SPSS Statistics 22
software to identify any significant difference in the scores in order to determine whether the intervention on
utilising algebra tiles in learning factorisation has an effect on students‟ performance. In addition, students‟
preferred options in attempting post-test questions were also analysed. The semi-structured interview of selected
students were transcribed, coded and analysed for emerging themes.
Results and Discussion
Due to student absentees during the data collection period, only the results from 22 students were taken into
account; 9 students from group I and 13 students from group II respectively. Table 2 shows the summary of of
students‟ achievements between pre-test and post-test for both groups.
Table 2 Frequency of students’ mark improvement from Pre to Post Tests
Pre Test marks Post test marks Marks improvement No of students
0 0 0 4
0 1 +1 2
0 2 +2 3
0 3 +3 2
0 4 +4 3
0 5 +5 4
0 6 +6 4
In the pre-test, as expected since all participants are in the low ability group, all the students were unsuccessful
in attempting the questions. Out of the 22 students that participated in this study, 50% demonstrated
improvement from their pre-test with scores ranging from 4 to 6 while 31.8% of them scored either 1, 2 or 3.
These students showed significant improvements from their pre-test achievements. There were 4 students who
were still unable to factorise correctly, as indicated in the zero scores in the post-test.
Table 3 Paired sample t- test
Paired Differences
Mean
Std.
Deviation
Std.
Error
Mean
95% Confidence
Interval t df
Sig.
(2-tailed)
Lower Upper
Pre-test –
Post-test -3.1818 2.1960 0.4682 -4.1555 -2.2082 -6.796 21 0.000
Table 3 presents the results from paired sample t-test between the pre- and post-test. The significant (2-tailed)
value of 0.00 (p < 0.05) indicates that there is a significant difference in pre-test and post-test. This means that
the implementation of concrete model in learning factorisation does have a positive effect on students‟
performance.
During the post-test, group I was supplemented with algebra tiles whereas group II had to depend solely on their
understanding from the intervention practices. In order to factorise, both groups were given the options to
choose any method that they feel comfortable with i.e. cross-multiply or utilising algebra tiles or even both. The
percentage of students‟ options on method(s) used in factorising was simplified using the pie chart
representation in Figure 2.

Proceeding of the 3rd International Conference on Education, Vol. 3, 2017, pp. 166-173
171
Figure 2 Pie chart of the students‟ method used in factorisation
Half of the participants in this research study applied cross-multiplication method as their approach to
factorisation while 32% of them utilised algebra tiles and 18% did both ways.
There were a total of 12 were being interviewed for this study. Due to the time constraint with group I, a small
group interview was carried out. However, with group II, a casual one-to-one interview was conducted. These
different interview techniques were designed to elicit the same information from all respondents.
Despite all six students in group I acknowledging their poor mathematics skills is due to lack of practices, they
agree on the importance of practice in learning mathematics. Regardless of their first experience working with
algebra tiles, three of them agreed factorising with the aid of manipulatives was much more easier as they could
figure out the answers easily just by evaluating the length and breadth of the rearranged tiles. Half of group I
interviewees expressed their burden and hardships in learning mathematics. There were times when they
struggled to grasp the mathematics concept especially when the teacher was teaching too fast. Low memory
ability was one of their weaknesses as well. With the aid of algebra tiles, it reduced pressure in learning
factorisation and the lessons became more enjoyable and less stressful.
In the individual interview of members from group II (approximately 5 to 10 minutes each), majority of them
preferred factorising with cross-multiplication method. Among the 6 respondents, half of them were sceptical on
learning factorisation with algebra tiles. They found algebra tiles could cause confusion when it involves higher
coefficients, as there will be many tiles to rearrange and doubted whether this method would be acceptable in
big examination such as in O-Level Examination. Hence they decided to choose cross-multiplication method
after all.
Conclusions
Based on the results and findings discussed earlier, the following research questions are addressed:
Research Question 1: How does the aid of concrete model affect low ability students’ achievement on
factorising quadratic expression in Brunei Darussalam?
Based on the analysis of students‟ achievement tests, learning factorisation with the aid of concrete model does
have a positive effect on students‟ performances in the post-test where 81.8% of them showed improvements
from their pre-test. After the interventions, most of them could factorise the quadratic expressions correctly
using methods that they are comfortable with.
50%
32%
18%
Cross-Multiply
Algebra Tiles
Both
EisFarhana AbdulLatiff, Khairul Amilin Tengah, Masitah Shahrill andElvynna Leong / Using concrete model to enhance conceptual knowledge of low ability students in factorising quadratic expression
172
Six students who decided to utilise algebra tiles as their means to factorise and the other nine who preferred
cross-multiply also performed very well. Some of them may need extra practices with both methods to reduce
the tendency to make mistakes in calculation and computation.
Research Question 2: What are students’ perceptions on the usefulness and effectiveness of concrete model in
learning factorisation of quadratic expression in Brunei Darussalam?
The data collected from student interviews indicated positive feedback from the students. They found that
learning mathematics with the aid of concrete model is more enjoyable and it makes mathematics concept easier
to grasp. They also gained more confidence in factorising quadratic expressions. This could boost their
motivation to learn more and be more engaged in the lesson.
However, there were a few concerns regarding the use of algebra tiles. When higher coefficients are involved, it
may cause difficulty and confusion to rearrange/draw the algebra tiles into rectangular shape because there are
so many tiles involved. The students were afraid this manipulation of algebra tiles would not be acceptable
during exams.
Overall, the majority of them agreed that the aid of concrete model does help their learning in factorisation.
Implications and Recommendations
For future study, researchers can consider expanding the use of concrete model in mathematics learning to other
algebra topics. Mathematics students, especially the low ability ones, find algebra as one of the hardest topics
because the concepts are too abstract. It would be interesting to see how concrete model could improve their
algebraic learning. However, the data collected from this study was not ample enough to determine anything
about the effectiveness of it.
It would also be helpful if the studycould be conducted over a longer period of time, as low ability students may
need more time to fully grasp the concept of concrete model. Also, as this study only involved a small
population of students consisting of all boys, it would be more beneficial for future researchers to do this study
at both all-girls andco-edsecondary schools for comparison and reliability purposes.
References
Badarudin, B. R., and Khalid, M., 2008, Using the jar model to improve students‟ understanding of operations
on integers. In D. D. Bork, B. D. Sondergaard, B. G. Alfonso, & C. C. L. Cheng (Eds.), Proceedings of 11 th
International Congress on Mathematical Education, Belgium, pp. 85-94.
Boggan, M., Harper, S., andWhitmire, A. 2010, Using manipulatives to teach elementary mathematics. Journal
of Instructional Pedagogies, 1-6.
Cohen, D., and Crabtree, B., 2006, Qualitative research guidelines project.Date of access: 21/5/2015. http://www.qualres.org/HomeSemi-3629.html
Gulkilik, H., andArikan, A., 2012, Preservice secondary mathematics teachers‟ views about using multiple
representations in mathematics instruction. Procedia- Social and Behavioral Sciences, 47, 1751-1756.
Hinzman, K. P., 1997, Use of manipulatives in mathematics at the middle school level and their effects on
students’ grades and attitudes.Masters thesis, ERIC database record no. ED411150.
Kotsopoulos, D., 2007, Unraveling students challenges with quadratics: A cognitive approach. Australian
Mathematics Teacher, 63(2), 19-24.

Proceeding of the 3rd International Conference on Education, Vol. 3, 2017, pp. 166-173
173
McClung, L. W., 1998, A study on the use of manipulatives and their effect onstudent achievement in a high
school algebra I class. Masters thesis, ERIC database record no. ED425077.
Ministry of Education, 2013, The National Education System for the 21st Century: SPN21 (Revised ed.). (Brunei
Darussalam: Ministry of Education).
Moyer, P. S., 2001, Are we having fun yet? How teachers use manipulatives to teach mathematics. Educational
Studies in Mathematics, 47, 175-197.
Peppers, D. S., Wan, A., and Phillips, H. E., 2014, A closer look at manipulatives in remediation. Mathematics
Teaching in the Middle School, 20(3), 166-173.
Robert, S. K., 2010, On my mind: The conceptual chicken and the procedural egg. Mathematics Teaching in the
Middle School, 16, 196-198.
Shaw, J. M., 2002, Manipulatives enhance the learning of mathematics. Houghton Mifflin Mathematics.Date of
access: 21/6/2015. http://www.eduplace.com/state/pdf/author/shaw.pdf
Yahya, N., and Shahrill, M., 2014, The strategies used in solving algebra by secondary school repeating
students. Paper presented at the 5th World Conference on Learning, Teaching and Educational Leadership
(WCLTA 2014), Prague, Czech Republic.

Proceeding of the 3rd International Conference on Education, Vol. 3, 2017, pp. 174-185
Copyright © 2017 TIIKM ISSN 2424 - 6700 online DOI: https://doi.org/10.17501/icedu.2017.3119
3rd International Conference on Education, 20-22 April 2017, Kuala Lumpur, Malaysia
TEACHING AND LEARNING OF INTEGERS USING
HANDS-ON VERSUS VIRTUAL MANIPULATIVES
Goh Lin Sen1, KhairulAmilinTengah
2, Masitah Shahrill
3 andElvynna Leong
4
1Raja IsteriPengiranAnakSaleha Secondary School, Ministry of Education, Brunei 2,3Sultan HassanalBolkiah Institute of Education, Universiti Brunei Darussalam, Brunei
4Faculty of Science, Universiti Brunei Darussalam, Brunei
Abstract: The purpose of this action research paper was to investigate the use of manipulatives in
the teaching of addition and subtraction of integers. This research also looked at the impact of
technology integration in the Mathematics classroom towards students’ academic performance,
students’ motivation in learning integers, and students’ attitude towards technology in Mathematics.
The intervention lessons, which included the use of hands-on coloured counters and virtual
manipulatives in the Gizmos application webpage, were carried out in two classes comprising 51
students in a secondary school in Brunei. This research adopted a quantitative approach of analysing
participants' assessment scores, in addition to individual responses to questionnaires, and
observational data collected during the interventions. Analysis of the result indicates that there is
improvement in students’ academic performance, which carries positive impact towards students’
motivation, and students’ attitude from both intervention methods. Another important finding of the
study was, students that achieved higher assessment scores were more motivated and had a more
positive attitude after taking part in the technology-enhanced lessons.
Keywords: Manipulatives, Gizmos Application, Motivation, Attitudes
Introduction
The world today is more competitive than ever.The skills considered noteworthy twenty years ago might not
even be relevant today.Employers are continuously looking for "marketable" graduates that not just have the
academic qualifications, but are also equipped with skills and qualities that meet the market needs or
requirements of the industries.However, schools and universities are lagging behind in meeting these needs
(Baharun and Suleiman, 2009). Morgan (1997) argued that there is gap between the knowledge, skills and
qualities possessed by students and those expected by employers. Consequently, educators are highly depended
on to bring out the best in their students. In 2009, Brunei's Ministry of Education implemented SPN 21, an
acronym for Sistem Pendidikan Negara Abad ke-21 or the 21st Century National Education System (Ministry of
Education, 2013). The main aim of revamping the national system is to restructure the foundation policy for
learning and assessment in schools to align with the 21st century demands and needs (Ministry of Education,
2013).This signalled the desire of the Ministry of Education to upgrade the teaching and learning in schools to
improve education achievement, and holistic development of individuals in Brunei.
The theory of experiential education stipulates that enhancement happen when students learn new knowledge
through active engagement (Hartshorn and Boren, 1990). The use of manipulatives allow students learn to
advance to abstract reasoning via concrete experiences (Reisman, 1982; Heddens, 1986; Ross and Kurtz,
1993).According to Stein and Bovalino (2001):
Manipulatives can be important tools in helping students to think and reason in more meaningful ways.
By giving students concrete ways to compare and operate on quantities, such manipulatives as pattern
blocks, tiles, and cubes can contribute to the development of well-grounded, interconnected
understandings of mathematical ideas.
Teacher’ role is important in designing manipulatives and assisting students in using them successfully. As
useful manipulatives might be,researchers have found that teachers face hurdles in bridging that gap between the
knowledge from the manipulatives,and math symbolisation and abstraction (Kamina and Iyer, 2009). Teachers
Corresponding Author:KhairulAmilin Tengah/ [email protected]

Goh Lin Sen, KhairulAmilinTengah, MasitahShahrill and Elvynna Leong / Teaching and learning of Integers using hands-on
versus virtual manipulatives
175
are unable to connect the concrete stage to the abstract stage and students often fail to apply the correct heuristic
or learning strategies they acquired in attempting the problem-solvingtask (Hoy, 2008).
Coy (1997) suggested these conditions for successful transfer: (a) commonality between the topics, and (b)
learner’s ability to recognition these common elements. Students’ learning can be greatly enhanced with proper
use of manipulatives to assist the teaching of mathematics. Papert (1980) defined manipulatives asobjects to
think with and allow the meaningful use of manipulatives into mathematics lessons to encourage easier grasp of
concept by students to ensure effective learning to take place.
Joubert (2013) stated that there has been increase interest in integrating technology in the process of teaching
and learning of mathematics.This is not surprising, as technology has become part-and-parcel of the everyday
life of thenewer generations. This in-turn has created an opportunity and desire for a shift from a teacher-centred
model education to a learning community model rich in the skill of technology use and information access
(Rodriguez and Berryman, 2002). The use of technology in mathematics lessons has provided students to have
positive attitudes, build confidence in their ability to do mathematics, construct mathematical knowledge, and
visualise abstract mathematical concepts (Kersaint, 2007). Various types of technologycan be used as tools to
enhance student-learning experiences in classrooms. Technology instruction such as computer-mediated
learning replaces traditional exercises and worksheets, letting students solve problems at their own pace and
giving them immediate feedback, both of which are invaluable in studying mathematics. Other technology uses
include use of graphical calculators to assist students in graphs-heavy topics such as functions, and the use of
videos or soft wares to explain certain mathematical concepts in classrooms.
On the other hand, teachers could analyse their students’ performance in a quick and reliable way through
technology. Traditional use of pen and paper marking is a long and tedious process and human error in marking
is always an issue. Use of technology can eliminate these problems. In addition, with so many readily available
interactive software online, feedback for each individual student could be immediate.
It is unfortunate to observe such utilisation of technology in mathematics classrooms in Brunei being very
limited or sometimes not seen at all. Teachers still prefer traditional mathematics teaching, whereby a teacher
demonstrates mathematical skills and procedures to students in a classroom setting, followed by students
practicing and replicating what the teacher has demonstrated.However, this is not so effective when it comes to
students who are less attentive in class and lacking motivation to study. Hence, it is essential to shift
existingteacher-focused teaching strategies to more student-centred learning methodologies such as computer-
mediated learning. Students using technology are more motivated, participated more, and are more likely to
defend their answers in class (Souter, 2002). Whereas in classrooms where technology is being integrated, we
still have to question whether the technology used is effective in student learning or not. Microsoft PowerPoint
are popularly used to display slides of information, which students can easily obtained from their textbooks. Is
this kind of technology enhancement different from the traditional "chalk and talk" teaching approach? It is
important to have instructional strategies when integrating technology: one that takes into account students’
readiness and expected achievement to allow an effective integration.
Fortunately, schools in Brunei have taken steps to increase effective usage of technology in mathematics
classroom nation-wide. One of the ways the Ministry of Education (MOE) attempts to achieve the objectives of
Sistem Pendidikan Negara Abad Ke-21 (SPN 21)is by using the 21st Century Learning Design (21 CLD), a
global professional development program which provides practical frameworks and tools for teachers to
incorporate into their lessons. 21CLD encourages teachers to integrate ICT into parts of their teaching.
Purpose of Project
This paper aims to examine the effect of replacing traditional teaching methods with a student-centred learning
model in using manipulatives to deduce whether there is a positive impact on student academic achievement in
mathematics. In addition, this paper also investigates the effects of technology on student performance, student
motivation to learn and student attitude towards technology. In order to achieve this, the researcher will
implement a teaching plan on the topic of addition and subtraction of integers in a Brunei school.

Proceeding of the 3rd International Conference on Education, Vol. 3, 2017, pp. 174-185
176
Research questions
The research questions used to guide this research include:
1. How does the use of manipulatives affect student academic performance in addition and subtraction of
integers?
2. How does technologyaffect student academic performance in addition and subtraction of integers in
comparison to the hands-on manipulative model?
3. What is the general student attitude towards technology usage in the mathematics classroom?
4. How does technology affect student motivation to learn addition and subtraction of integers?
Review of Literature
Integer Teaching Strategies
The subject of integers is a very important part of the middle school mathematics curriculum as it symbolizes a
move from concrete to abstract thinking (Lamb and Thanheiser, 2006). There are several methods or models
invented to help assist students in learning and understanding the ideas or concept behind calculations involving
integers. To name a few, money, number line, balloons and weights, and two-colour tiles (Cemen, 1993).
Whilst each of the models are useful to some extent, almost all of them have their own disadvantages. Cemen
(1993) recommended the number line to teach the addition and subtraction of integers. She claimed that other
models did not do a good job in the understanding of negatives and subtraction. The money model uses the
concept of receiving and spending money, but when the starting value of money is negative, students have a
hard time understanding 'negative money' (Cemen, 1993). The two-colour tiles model, similar to the counters
model involved in this study, is helpful in showing addition and subtraction of integers, yet it is difficult to
communicate the concept that subtracting a negative integer is the same as adding a positive integer. Cemen
uses the number line method to distinguish between the rules of subtraction and rules of addition on a number
line. The positive or negative sign of the number dictates which movement on the number line, while subtraction
is demonstrated by using the action of "turning around". For example, when subtracting a negative number,it
would require you turn around and then proceed backwards, which in this case is moving right in the positive
direction on the number line (Cemen, 1993).
Lamb and Thanheiser (2006) created another approach to the understanding of addition and subtraction of
integers. They created a software called 'Balloons and Weights', which is a technology-enhanced model of the
paper and pencil version initially reported by Janvier (1983). Helium balloons represent positive integers,
whereas weights represent the negative integers, in describing addition and subtraction of integers. The
software illustrates positive numbers as a hot air balloon "going up" and negative numbers as weights "pulling
down" the hot air balloon. So for instance, when there are more weights than balloons, the hot air balloon moves
downwards, leaving the answer as negative. Depending on the question, subtraction is modelled as "removing"
either the balloons or weights. Lamb and Thanheiser claimed that because of the pulling down direction effect
of the weight and resulting final position, the rules associated with their actions are not as confusing as those of
a typical horizontal number line. They added that the software affords animation that allows visualisation of
what will happen to facilitates students’ test conjectures.
Jennifer L. Miller conducted a study of teaching integer addition and subtraction using net worth (money)
concept in 2013 (Miller, 2013). Her method centred on the concept of asset and debts that would result in net
worth, and consisted of careful unit planning throughout seven days to teach students into understanding this
method. Students were asked to compare net worth in the beginning, leading to modelling different scenarios
using symbols, and finally asked to evaluate number sentences outside of any context. Miller claimed students
understand that taking away debt is a good thing and will result in a positive effect on net worth. This proved
that her curriculum allowed a clear understanding of the abstract concept of why subtracting a negative value
creates a more positive answer; a concept which many other integer pedagogies break down and resulted in
creating more confusion than clarity amongst students. She concluded that the idea of the effects of transactions

Goh Lin Sen, KhairulAmilinTengah, MasitahShahrill and Elvynna Leong / Teaching and learning of Integers using hands-on
versus virtual manipulatives
177
on net worth proved to be one of the most powerful ideas in communicating operational integer concepts
(Miller, 2013).
While many integer pedagogies exist, which best method is remains to be seen (Miller, 2013). For the purpose
of this research, the chips/counter model was chosen as it achieved some minor success in the past during
observation of several teachers in schoolsthroughout Brunei. It is also hoped that the combination of web-based
instruction andpractice with the counters model will build a solid foundation for students in the understanding of
addition and subtraction of integers.
Effects of Technology on Mathematics Education
Stipek (1996) wrote in his book that engaged students are more likely to approach tasks eagerly and to persist in
the face of difficulty. In ouropinion, motivating students should be a priority for teachers as motivation leads to
greater engagement. However, this can be a challenging task, especially in mathematics courses. Active learning
isgenerally defined as any learning method that encourages engagement of students in process. Active students’
engagement in the teaching and learning process will lead to increased student learning and persistence, better
performance and enrich questioning exchange (Bonwell and Eison, 1991). Technology integration in
mathematics lesson can encourage active participation of students in the classroom (Raines and Clark, 2011).
Souter (2002) researched on the effects of technology-enhanced algebra instruction on student academic
performance, student motivation, and student attitude towards algebra. Her action research study, involving four
teachers and five algebra classes, concluded that technology-integrated mathematics lesson has positive impact
on students’ achievement and motivation, foster positive student attitudes, and enhance student outcomes. In
another study conducted by Fitzgerald (2015), she discovered educational benefits in terms of students'
assessment scores when their face-to-face lessons are mirrored to the Cloud as lesson videos and note files for
students to access outside their classrooms. When graphical calculators are usedas technological device to aid
student learning, student achieved better performance and increased confidence in attempting problems
(Quesada, 1996). Susskind (2005) claimed that presentation software such as Microsoft PowerPoint leads to
increased student motivation and better positive attitudes when student attend lecture classes.
Within the past few decades, we have seen a rapid rise in the use of technology in classrooms in the developed
world. National Council of Teachers of Mathematics, NCTM (2000) in their bookPrinciples and Standards for
School Mathematicsstated that technology is essential in teaching and learning mathematics: it influences the
mathematics that is taught and enhances students' learning (p. 24). They added that technology should be
accessible to all students, but should not be used to replace conceptual understanding, computational fluency, or
problem solving skills (NCTM, 2000, p. 6). When technological tools are available, students can focus on
decision-making, reflection, reasoning and problem solving (NCTM, 2000, p. 24).
Mathematics classrooms uses a number of different technologies with varying degrees of success. Technology
can refer to computerised instruction and practice, online videos or presentation software, graphical calculators
and many more. Web-based instruction and practice will focused as the technology in this paper.
Numerous studies have shown that there is a positive impact on student academic achievements when web-
based instruction and practice are used in mathematics classes. A reason of this is that the usage of this
technological tool assists students in learning mathematics concepts. King (1997) meta-analysis investigation of
computer-enhanced instruction on college level mathematics on thirty1986 to 1995 published studies revealed
that there was positive influence on student achievement when computer technology was used and allowed in a
classroom, lab setting or tests. He also found that the usage of computers in instruction and demonstrations was
most beneficial to student learning. In a study conducted by Nguyen and Kulm in 2005 involving 95 students
from two schools in southeast Texas, their quantitative data revealed that students’achievement was statistically
higher in their post-tests after a web-based approach to instruction was done compared to those of normal pencil
and paper teaching. Their results concluded that web-based instruction have positive effect on student-learning,
aid in self-motivation in learning math and problem solving, and encourage students’ independence to learning.

Proceeding of the 3rd International Conference on Education, Vol. 3, 2017, pp. 174-185
178
In a similar study, Hodgeet al. (2009) investigation on1394 college students concluded that students favour web-
based homework as it increases their mathematical understanding more than conventional paper and pencil
work. They also claimed that students were more motivated to complete their homework due to the immediate
feedback they received. Mavrikis and Macioca (2003) stressed that immediate feedback is an advantage feature
in web-based practice. Immediate feedback can help in building students' confidence, especially lower-
achieving students. It encourages the students to do more practice and correct their own mistakes if they are
unsure about a particular mathematics concept or procedure.
Research from both learning theory and classroom studies shows that using manipulatives to help teach
mathematics can positively affect student learning (Sugiyama, 1987; Clements, 1999). Our paperfocused on the
counters model to conclude whether there is any significant impact on student performance in a school in Brunei
comprised of average to lower-achieving students. This paper also looked at the effects on added technology to
enhance students’ learning model further this study.
Methodology
A convenient sampling of 51 average to low achieving studentsfrom a local government co-ed school was
involved in this study. The majority of the students are local Bruneians who come from nearby areas,
comprising of just one racial group (Malay). This study sample of 22 males and 29 females from twoyear 7
classes: Class A - those taught using hands-on manipulatives then followed by virtual manipulatives; Class B -
those taught using only hands-on manipulatives. The age range of the sample was in between 11 and 13 years
old.
Other teachers taught the participants addition and subtraction of integers using the number line model two
weeks prior to this research. Pre-test, consisting of 15 questions on addition and subtraction of integers, were
given to students prior to intervention lessons to determine baseline knowledge of participants in this area. Same
questions, although reshuffled, were used as post-test at the end of the research study for comparison and
analyses purposes. Students completed each test within thirty minutes.For Class A, post-testswere given to
students both after the hands-on intervention lesson and after the virtual manipulative lessons.
In this research's intervention, manipulatives in the form of counters model was used to aid in students' learning
of addition and subtraction of integers. Both groupswere introduced with this hands-on counter model. This was
followed by a virtual manipulative lesson to determine the effects of technology on the teaching and learning of
mathematics to just one of the group (Class A). The intervention in both classes focused on students' active
learning and allowed the participants to arrive at their own conceptual understanding with minimal guidance of
the content from the teacher. Table 1 indicates the summary of activities conducted in the intervention lessons.
Table 1Summary of the activities that incorporated during the study
Hands-on intervention lessons Virtual intervention lessons
Assessment of prior
knowledge Pre-test Post-test 1
Intervention -
1st & 2nd lessons
(Concrete and
representational stage)
1. Exploration sheets given to
students.
2. Red and yellow counters
introduced to students. Explain that
"zero pairing" is made up of one red
counter and one yellow counter (by
using the analogy of army men)
3. Students practice on using the
counters to solve simple
mathematical problems.
1. Exploration sheets given to
students.
2. Exploration sheet provides
systematic instruction to help student
explore the concept of counters
model.
3. Student learning of the use of
counters to solve simple mathematical
problems in Gizmos.

Goh Lin Sen, KhairulAmilinTengah, MasitahShahrill and Elvynna Leong / Teaching and learning of Integers using hands-on
versus virtual manipulatives
179
Intervention -
3rd & 4th lesson
(Abstract stage)
Transition of the use of counters to
the more abstract stage of just using
mathematical symbols.
Includes the use of more challenging
problems (larger numbers) for
students to solve.
Transition of the use of counters to the
more abstract stage of just using
mathematical symbols.
Includes the use of more challenging
problems (larger numbers) for
students to solve.
Assessment of effects of
the intervention Post-test1 Post-test2
The materials that were used in this research study includedone hundred red counters and one hundred yellow
counters, three sets of printed pre-test and post-test questions, three sets of student exploration sheets, two sets
of printed surveys, an ICT lab with twenty personal computers, Gizmos online application from
ExploreLearning. Any statistical analysis was carried out using SPSS software.
The student exploration sheets were designed separately for the hands-on lessons and the technology-enhanced
lessons. Each set of exploration sheets hadsystematic instructions to guide the participants through the whole
activity. There were questions on the exploration sheets with plenty of space for the participants to fill in.
There were two different surveys used at the end of this study: motivational survey and attitudinal survey. The
motivational survey consisted of four questions to determine how motivated students were in learning integers,
and whether the interventions that took place had any effects on their motivation. The attitudinal survey
consisted of three questions that determined general student attitudes towards technology, and whether the
interventions that took place had any effects on their attitudes towards technology. These two surveys both used
a five-level Likert format, where the student participants have to indicate their responses by circling on a scale
of 1 to 5 (1 = strongly disagree; 2 = disagree; 3 = neither agree or disagree; 4 = agree; 5 = strongly agree).
The research framework used to carry out this research can be summarised in figure 1.
Figure 1Research framework used to carry out this study
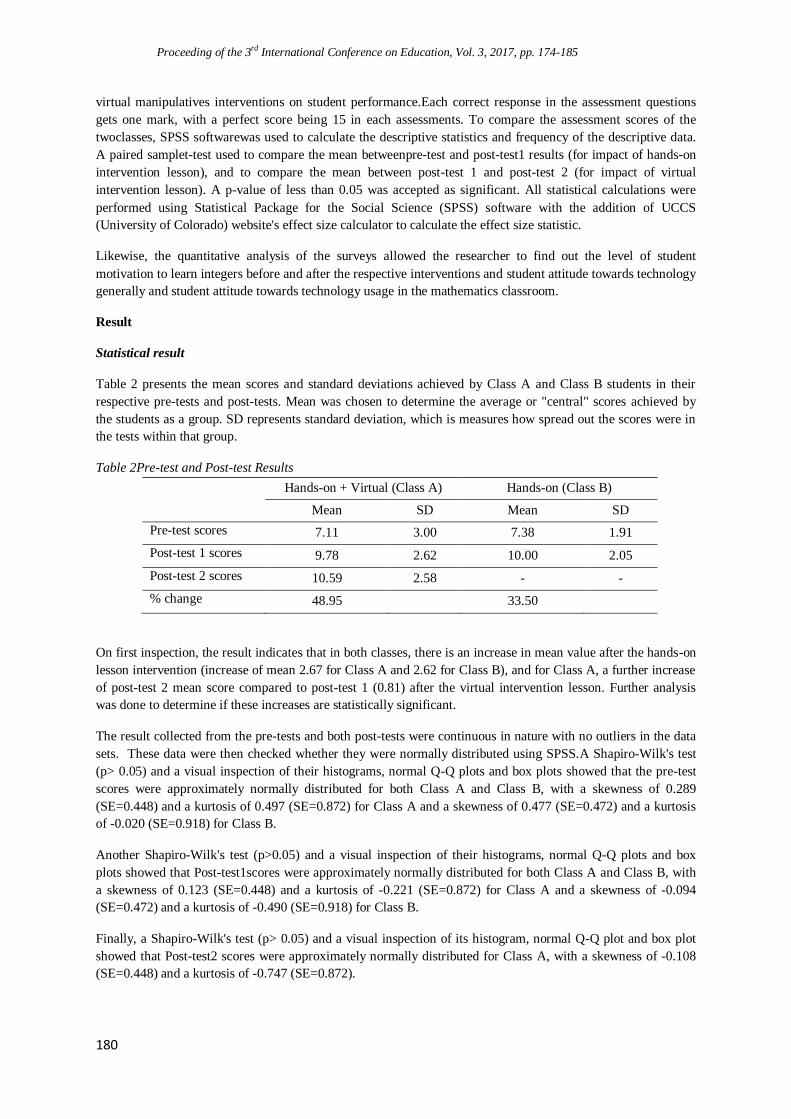
Proceeding of the 3rd International Conference on Education, Vol. 3, 2017, pp. 174-185
180
virtual manipulatives interventions on student performance.Each correct response in the assessment questions
gets one mark, with a perfect score being 15 in each assessments. To compare the assessment scores of the
twoclasses, SPSS softwarewas used to calculate the descriptive statistics and frequency of the descriptive data.
A paired samplet-test used to compare the mean betweenpre-test and post-test1 results (for impact of hands-on
intervention lesson), and to compare the mean between post-test 1 and post-test 2 (for impact of virtual
intervention lesson). A p-value of less than 0.05 was accepted as significant. All statistical calculations were
performed using Statistical Package for the Social Science (SPSS) software with the addition of UCCS
(University of Colorado) website's effect size calculator to calculate the effect size statistic.
Likewise, the quantitative analysis of the surveys allowed the researcher to find out the level of student
motivation to learn integers before and after the respective interventions and student attitude towards technology
generally and student attitude towards technology usage in the mathematics classroom.
Result
Statistical result
Table 2 presents the mean scores and standard deviations achieved by Class A and Class B students in their
respective pre-tests and post-tests. Mean was chosen to determine the average or "central" scores achieved by
the students as a group. SD represents standard deviation, which is measures how spread out the scores were in
the tests within that group.
Table 2Pre-test and Post-test Results
Hands-on + Virtual (Class A) Hands-on (Class B)
Mean SD Mean SD
Pre-test scores 7.11 3.00 7.38 1.91
Post-test 1 scores 9.78 2.62 10.00 2.05
Post-test 2 scores 10.59 2.58 - -
% change 48.95 33.50
On first inspection, the result indicates that in both classes, there is an increase in mean value after the hands-on
lesson intervention (increase of mean 2.67 for Class A and 2.62 for Class B), and for Class A, a further increase
of post-test 2 mean score compared to post-test 1 (0.81) after the virtual intervention lesson. Further analysis
was done to determine if these increases are statistically significant.
The result collected from the pre-tests and both post-tests were continuous in nature with no outliers in the data
sets. These data were then checked whether they were normally distributed using SPSS.A Shapiro-Wilk's test
(p> 0.05) and a visual inspection of their histograms, normal Q-Q plots and box plots showed that the pre-test
scores were approximately normally distributed for both Class A and Class B, with a skewness of 0.289
(SE=0.448) and a kurtosis of 0.497 (SE=0.872) for Class A and a skewness of 0.477 (SE=0.472) and a kurtosis
of -0.020 (SE=0.918) for Class B.
Another Shapiro-Wilk's test (p>0.05) and a visual inspection of their histograms, normal Q-Q plots and box
plots showed that Post-test1scores were approximately normally distributed for both Class A and Class B, with
a skewness of 0.123 (SE=0.448) and a kurtosis of -0.221 (SE=0.872) for Class A and a skewness of -0.094
(SE=0.472) and a kurtosis of -0.490 (SE=0.918) for Class B.
Finally, a Shapiro-Wilk's test (p> 0.05) and a visual inspection of its histogram, normal Q-Q plot and box plot
showed that Post-test2 scores were approximately normally distributed for Class A, with a skewness of -0.108
(SE=0.448) and a kurtosis of -0.747 (SE=0.872).
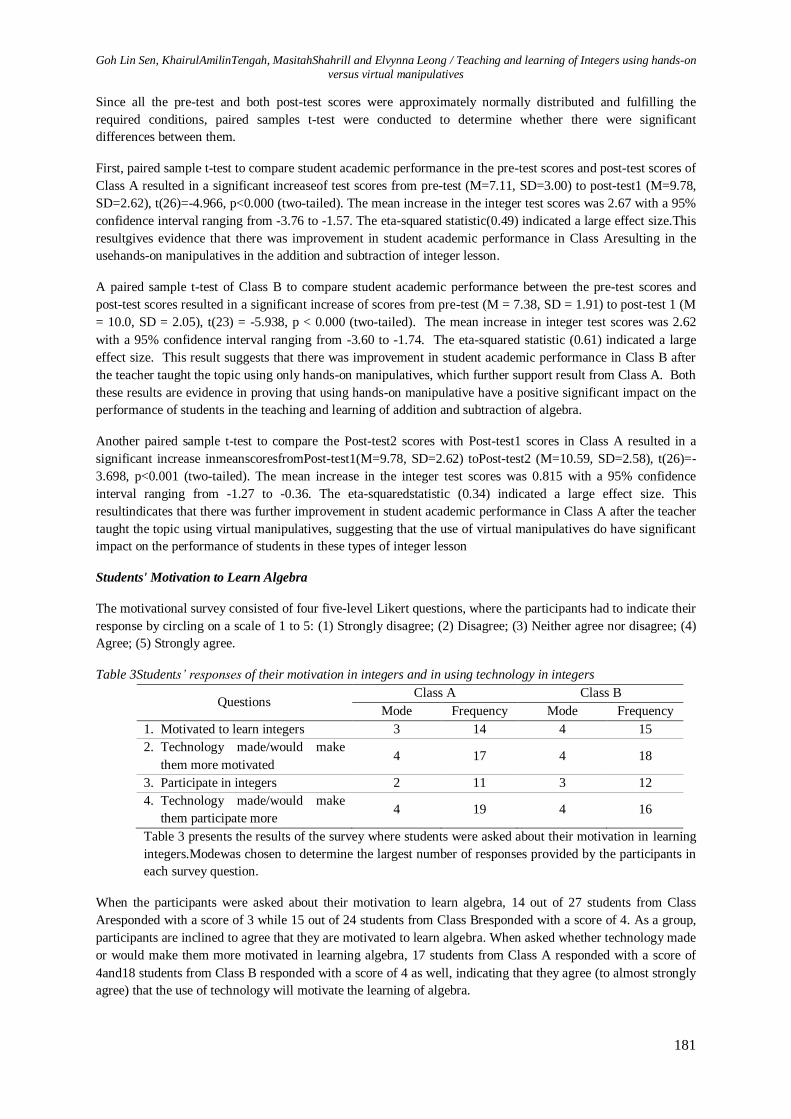
Goh Lin Sen, KhairulAmilinTengah, MasitahShahrill and Elvynna Leong / Teaching and learning of Integers using hands-on
versus virtual manipulatives
181
Since all the pre-test and both post-test scores were approximately normally distributed and fulfilling the
required conditions, paired samples t-test were conducted to determine whether there were significant
differences between them.
First, paired sample t-test to compare student academic performance in the pre-test scores and post-test scores of
Class A resulted in a significant increaseof test scores from pre-test (M=7.11, SD=3.00) to post-test1 (M=9.78,
SD=2.62), t(26)=-4.966, p<0.000 (two-tailed). The mean increase in the integer test scores was 2.67 with a 95%
confidence interval ranging from -3.76 to -1.57. The eta-squared statistic(0.49) indicated a large effect size.This
resultgives evidence that there was improvement in student academic performance in Class Aresulting in the
usehands-on manipulatives in the addition and subtraction of integer lesson.
A paired sample t-test of Class B to compare student academic performance between the pre-test scores and
post-test scores resulted in a significant increase of scores from pre-test (M = 7.38, SD = 1.91) to post-test 1 (M
= 10.0, SD = 2.05), t(23) = -5.938, p < 0.000 (two-tailed). The mean increase in integer test scores was 2.62
with a 95% confidence interval ranging from -3.60 to -1.74. The eta-squared statistic (0.61) indicated a large
effect size. This result suggests that there was improvement in student academic performance in Class B after
the teacher taught the topic using only hands-on manipulatives, which further support result from Class A. Both
these results are evidence in proving that using hands-on manipulative have a positive significant impact on the
performance of students in the teaching and learning of addition and subtraction of algebra.
Another paired sample t-test to compare the Post-test2 scores with Post-test1 scores in Class A resulted in a
significant increase inmeanscoresfromPost-test1(M=9.78, SD=2.62) toPost-test2 (M=10.59, SD=2.58), t(26)=-
3.698, p<0.001 (two-tailed). The mean increase in the integer test scores was 0.815 with a 95% confidence
interval ranging from -1.27 to -0.36. The eta-squaredstatistic (0.34) indicated a large effect size. This
resultindicates that there was further improvement in student academic performance in Class A after the teacher
taught the topic using virtual manipulatives, suggesting that the use of virtual manipulatives do have significant
impact on the performance of students in these types of integer lesson
Students' Motivation to Learn Algebra
The motivational survey consisted of four five-level Likert questions, where the participants had to indicate their
response by circling on a scale of 1 to 5: (1) Strongly disagree; (2) Disagree; (3) Neither agree nor disagree; (4)
Agree; (5) Strongly agree.
Table 3Students’ responses of their motivation in integers and in using technology in integers
Questions Class A Class B
Mode Frequency Mode Frequency
1. Motivated to learn integers 3 14 4 15
2. Technology made/would make
them more motivated 4 17 4 18
3. Participate in integers 2 11 3 12
4. Technology made/would make
them participate more 4 19 4 16
Table 3 presents the results of the survey where students were asked about their motivation in learning
integers.Modewas chosen to determine the largest number of responses provided by the participants in
each survey question.
When the participants were asked about their motivation to learn algebra, 14 out of 27 students from Class
Aresponded with a score of 3 while 15 out of 24 students from Class Bresponded with a score of 4. As a group,
participants are inclined to agree that they are motivated to learn algebra. When asked whether technology made
or would make them more motivated in learning algebra, 17 students from Class A responded with a score of
4and18 students from Class B responded with a score of 4 as well, indicating that they agree (to almost strongly
agree) that the use of technology will motivate the learning of algebra.

Proceeding of the 3rd International Conference on Education, Vol. 3, 2017, pp. 174-185
182
The survey also included questions to determine the participation rate of participants during the study. When
asked whether they participated in integers before the intervention, 11 students from Class A responded with a
score of 2 while 12 students from Class B responded with a score of 3. 19 participants fromClass A responded
with a score of 4 when asked whether technology made/would make them participate more in class, while 16
Class B participants responded with a score of 4 as well. This suggested that students from both classes were
more likely to claim that technology made them more motivated to learn integers and technology made them
participate more in integer classes, despite Class B not being involved in virtual manipulative lesson in this
research.
It was observed that during the intervention lessons, students participated more in class by asking more
questions during the virtual manipulative lesson as compared to the hands-on lesson. The students who used
technology were also more confident in their answers when being asked questions by the teacher. The ease of
usage and better visual explanation provided by the Gizmos application as compared to the hands-on model
might have significant effect on this observation. It was also discovered that the students were less likely
distracted in the virtual lesson, as most of them were keen to learn using the application, compared to hands-on
activity. These observations supports result from questionnaire that claim that technology-enhanced students
are more motivated and participate more in the classroom.
The results collected from Class B supported this view. More than half of the Class B students agreed that
technology would give them more motivation and they would participate more in the classroom if technology is
added. Students from Class B claimed to be more motivated to learn integers if technology is added considering
that they were not exposed to the virtual manipulatives lesson. It would be interesting to see the response of
these students if they had the chance to experience the technology-enhanced lessons like Class A did.
Students’ Attitude towards Technology
The attitudinal survey consisted of three five-level Likert questions, where the participants had to indicate their
response by circling on a scale of 1 to 5: (1) Strongly disagree; (2) Disagree; (3) Neither agree nor disagree; (4)
Agree; (5) Strongly agree.
Table 4Students’ responses of their attitude towards technology
Questions Class A Class B
Mode Frequency Mode Frequency
1. Enjoy/would enjoy using
technology
4 18 4 19
2. Technology makes/would make
mathematics easier to learn
5 15 3 15
3. Use technology frequently in
everyday life
4 18 5 15
Table 4 presents the result of the survey where students were asked about their attitude towards technology.
When students were asked whether they enjoyed or would enjoy using technology in mathematics classroom,
both Class A and Class B students responded with a mode of 4, indicating agreement.
When asked whether technology made or would make mathematics easier to learn,15 out of 27 from Class A
students responded with a score of 5 whereas 15 out of 24 students from Class B responded with a score of 3.
This difference in answer may be related to their recent experience, or lack of, with technology during the
intervention lesson. With Class A having been involved with technology-assisted learning in the virtual
manipulation, they strongly agree with the statement that technology makes mathematics easier to learn by
recent first-hand experience. In the case of Class B, their neither agree nor disagree might possible be
contribute to the fact some might not have experience learning maths via technology, including in this research
process.

Goh Lin Sen, KhairulAmilinTengah, MasitahShahrill and Elvynna Leong / Teaching and learning of Integers using hands-on
versus virtual manipulatives
183
Finally, 18 Class A students responded with a score of 4while 15 Class Bstudents responded with a score of 5
when asked about whether they use technology frequently in their everyday lives, indicating that they strongly
agree that technology is frequently used in students’ everyday life. Majority of students from both classrooms
claimed to use technology frequently in their everyday lives. Perhaps, the similarities in student attitude towards
technology in mathematics education relate to the current generation's positive attitude towards technology in
their daily lives.
Conclusion
The implication of this study is that the use of manipulatives has a significant positive effect on student
academic achievement in algebra lesson. This study also indicated that the integration of technology into the
mathematics classroom could further increase student academic achievement, improve student motivation and
foster positive student attitudes in the mathematics subject. The research also found that the hands-on counters
model helped students in the learning of addition and subtraction of integers. Careful choice of the right
technologies can help students visualise key concepts with better ease, and in some cases, can provide better
explanations than most traditional vocal inputs from teachers.
On the other hand, the positive results of this research demonstrated that the counters model remained a fine
manipulative model within other existing integer pedagogies in tackling the topic of addition and subtraction of
integers. The lower pre-test scores achieved by participants in this study suggested that the number line model
used by other teachers before the intervention may possible be less effective than the counters model. Further
research in the future in this subject area can take into consideration of other integer pedagogies mentioned in
the literature review but not used in this study.
The study also concluded that technology-enhanced students have more motivation to learn mathematics in class
in comparison to hands-on students. The results coincided with other studies that involved technology
enhancement in mathematics classrooms and reported positive outcomes (Souter, 2002; Susskind, 2005; Nguyen
and Kulm, 2005; Fitzgerald, 2015). Even though many teachers might find challenges in integrating technology
into their teaching, they have to comprehend that creative and constructive technology integration provides an
eye-opening experience to students, which can be invaluable in their future. Other studies have investigated the
reasons mathematics teachers rarely use technology in their teaching and found that it was mostly related to their
beliefs on mathematics teaching and learning and their existing pedagogies (Norton et al. 2000). With current
emphasis on technology integration in SPN21, educators in this country are beginning to undergo training on
technology usage in classrooms. Teacher technology training can be a good start to increase the integration of
technology in the mathematics classroom.
References
Baharun, R., and Suleiman, E. S., 2009, Theemployers’ perceptions of what makes graduates marketable.
Academia. edu, pp.1-17.
Bonwell, C. C., and Eison, J. A., 1991, Active Learning: Creating Excitement in the Classroom. 1991 ASHE-
ERIC Higher Education Reports. ERIC Clearinghouse on Higher Education, The George Washington
University, One Dupont Circle, Suite 630, Washington, DC 20036-1183.
Cemen, P. B., 1993, Teacher to teacher: adding and subtracting integers on the number line. Arithmetic
Teacher, 40(7), 388-390.
Clements, D. H., Swaminathan, S., Hannibal, M. A. Z., and Sarama, J., 1999, Young children's concepts of
shape. Journal for Research in Mathematics Education, 192-212.
Coy, W., 1997. Defining discipline. In Foundations of Computer Science (pp. 21-35). Springer
Berlin/Heidelberg.

Proceeding of the 3rd International Conference on Education, Vol. 3, 2017, pp. 174-185
184
Fitzgerald, R. J. E., 2015, Mirroring math lessons to the cloud: an online
technology intervention case study. InSight: Rivier Academic Journal, 11(1).
Hartshorn, R., and Boren, S., 1990, Experiential Learning of Mathematics: Using Manipulatives. ERIC Digest.
Heddens, J.W., 1986,Bridging the gap between the concrete and the abstract. Arithmetic Teacher, 33(6), 14-17.
Hodge, A., Richardson, J. C., and York, C. S., 2009, The impact of a web-based homework tool in university
algebra courses on student learning and strategies. Journal of Online Learning and Teaching, 5(4), 619-929.
Hoy, A.W., 2008, What motivates teachers? Important work on a complex question. Learning and
Instruction, 18(5), pp.492-498.
Janvier, C., 1983, The understanding of directed number. In J. C. Bergeron & N. Herscovics (Eds.), Proceedings
of the Fifth Annual Meeting of the North American Chapter of the International Group for the Psychology of
Mathematics Education, Vol. 2, pp. 295-301. Montreal: Universiti de MontrPal, Faculti de Sciences de
1'Education.
Joubert, M., 2013, Using digital technologies in mathematics teaching: developing an understanding of the
landscape using three “grand challenge” themes. Educational studies in mathematics, 82(3), 341-359.
Kamina, P., and Iyer, N. N., 2009, From concrete to abstract: Teaching for transfer of learning when using
manipulatives. Date of access: 10/11/2015. http://digitalcommons.uconn.edu/nera_2009/6
Kersaint, G., 2007, Toward technology integration in mathematics education: A technology-integration course
planning assignment. Contemporary Issues in Technology and Teacher Education, 7(4), 256-278.
King, H. J., 1997. Effects of computer-enhanced instruction in college-level mathematics as determined by a
meta-analysis (pp. 1-187).
Lamb, L. C., and Thanheiser, E., 2006, Understanding integers: using balloons and weights software. Algebraic
Thinking, 2, 163-164.
Mavrikis, M., and Maciocia, A., 2003, Wallis: a web-based ILE for science and engineering students studying
mathematics. In Workshop of Advanced Technology for Mathematics Education in the 11th International
Conference on Artificial Intelligence in Education, pp. 505-512.
Miller, J. L., 2013, A Curriculum Study: Teaching Integer Addition and Subtraction Using a Net Worth
Concept. Education and Human Development Master's Theses. Paper 366.
Ministry of Education, 2013, The National Education System for the 21st Century: SPN21(Revised ed.)
(Berakas: Ministry of Education).
Morgan, G. J., 1997, Communication skills required by accounting graduates: practitioner and academic
perceptions, Accounting Education, 6(2), 93-107.
National Council of Teachers of Mathematics, NCTM, 2000, Principals and Standards for School Mathematics.
Reston, VA: Author.
Nguyen, D. M., and Kulm, G., 2005, Using web-based practice to enhance mathematics learning and
achievement. Journal of Interactive Online Learning, 3(3), 1-16.
Norton, S., McRobbie, C. J. and Cooper, T. J., 2000. Exploring secondary mathematics teachers’ reasons for not
using computers in their teaching: Five case studies. Journal of Research on Computing in education, 33(1),
pp.87-109.
Papert, S., 1980, Mindstorms: children, computers, and powerful ideas. Basic Books, Inc..
Goh Lin Sen, KhairulAmilinTengah, MasitahShahrill and Elvynna Leong / Teaching and learning of Integers using hands-on
versus virtual manipulatives
185
Quesada, A. R., 1996, On the impact of the first generation of graphing calculators on the mathematics
curriculum at the secondary level. In P. Gomez & B. Waits (Eds.), Roles of Calculators in the Classroom (pp.
143-163). Retrieved from http://ued.uniandes.edu.co/ued/servidor/em/recinf/t g18/ArchivosPDF/ Quesada.pdf
Raines, J. M., and Clark, L. M., 2011, A brief overview on using technology to engage students in
mathematics. Current Issues in Education, 14(2).
Reisman, F. K., 1982, A Guide to the Diagnostic Teaching of Arithmetic (Columbus, Ohio: Charles E. Merrill).
Rodriguez, A. J. and Berryman, C., 2002, Using sociotransformative constructivism to teach for understanding
in diverse classrooms: A beginning teacher’s journey. American Educational Research Journal, 39(4), 1017-
1045.
Ross, R. and Kurtz, R., 1993, Making manipulatives work: A strategy for success. Arithmetic teacher, 40(5),
254-258.
Souter, M. T., 2002, Integrating technology into the mathematics classroom: an action research study. Action
Research Exchange, 1(1), 1-11.
Stein, M. K., and Bovalino, J. W., 2001, Manipulatives: one piece of the puzzle. Mathematics Teaching in the
Middle School, 6(6), 356.
Stipek, D. J., 1996, Motivation and instruction. Handbook of Educational Psychology, 85-113.
Sugiyama, Y., 1987, Comparison of word problems in textbooks between Japan and the U. S. In J.P. Becker,
and T. Miwa (Eds.), Proceedings of U.S. – Japan Seminar on Problem Solving. Carbondale, IL: Board of
Trustees, Southern University.
Susskind, J. E., 2005, PowerPoint’s power in the classroom: enhancing students’ self-efficacy and
attitudes. Computers & Education, 45(2), 203-215.

Proceeding of the 3rd International Conference on Education, Vol. 3, 2017, pp.186-197 Copyright © 2017 TIIKM ISSN 2424 - 6700 online DOI: https://doi.org/10.17501/icedu.2017.3120
3rd International Conference on Education, 20-22 April 2017, Kuala Lumpur, Malaysia
THE FLIPPED CLASSROOM STRATEGY: THE
EFFECTS OF IMPLEMENTATION AT THE
ELEMENTARY SCHOOL LEVEL MATHEMATICS
LESSONS
Tieng Seng Toh1, Khairul Amilin Tengah
2, Masitah Shahrill
3, Abby Tan
4 and Elvynna
Leong5
1International School Brunei, Brunei 2,3Sultan Hassanal Bolkiah Institute of Education, Universiti Brunei Darussalam
4,5Faculty of Science, Universiti Brunei Darussalam
Abstract: Students have been applied great pressure from global expectations and challenges of the
21st century. Brunei Darussalam, with its new education system (SPN21) aims to prepare the
students in facing the challenges and globalized world. This study investigated the effects of flipped
classroom on students‟ academic performance. At the same time, this study helps to provide the
students to improve on their 21st century skills, provide a student-centered learning environment and
allow students to be responsible in their own learning. This study, involving 16 Year 7 participants
from an all-girls high school in Brunei, was an action research study and uses quantitative methods
for data collection. Pre-test, post-test and delayed post-test were given to the students to measure
their learning of mathematics in three teaching cycles involving the topicsWhole Number and
Operations, Integers, and Fractions and Decimals. Analysis of the results from the pre-test, post-test
and delayed post-test indicated an improvement in the overall students‟ performance.
Keywords: Flipped Classroom, Mathematics Lessons, Academic Performance
Introduction
There are many variations in which researchers defines „flipped‟ but the main idea is just the shift in which
students attain the content knowledge outside of the class or before class in any form of medium or media, then,
the in-class time is spend to apply the content through problem solving, deeper coverage and interaction with
peers. Hanover Research (n.d) noted that the term „flipped classroom‟ can be used in many blended instructional
methodologies in which students can access the pre-prepared materials and then engage structured in-class
activities. Moreover, in that research stated that there is no singular model for a flipped classroom, but the
underlying concept is to reverse or invert the traditional approach of teaching and learning, where lecture
materials which can be viewed at home in advance before a class and in-class time can be used to work through
problems, advance conceptual knowledge and engage in peer-centred learning activities. Furthermore, Braseby
(n.d) stated that knowledge can be acquired through many different media including TED talks, YouTube
videos, journals, newspaper, textbooks, or any combination of these other than recorded online lectures.
Bergmann et al. (2011) summarised what is a flipped classroom and what is not. According to them, flipped
classroom is when the teacher is not the „sage on the stage‟, but will be guiding on the side of the students and
the students take their own responsibility for their own learning. Moreover, they stated that flipped classroom
increases the interactions through engagement in students‟ learning, personalised education and contact time
between students and teachers. Additionally, Bergmann et al. (2011) also stated that a flipped classroom is not a
synonym of online videos because most people hear about flipped classroom will think about the videos. In
addition, they further stated that a flipped class is not an online course, or students working unstructured, or
Corresponding Author:Tieng Seng Toh/ [email protected]
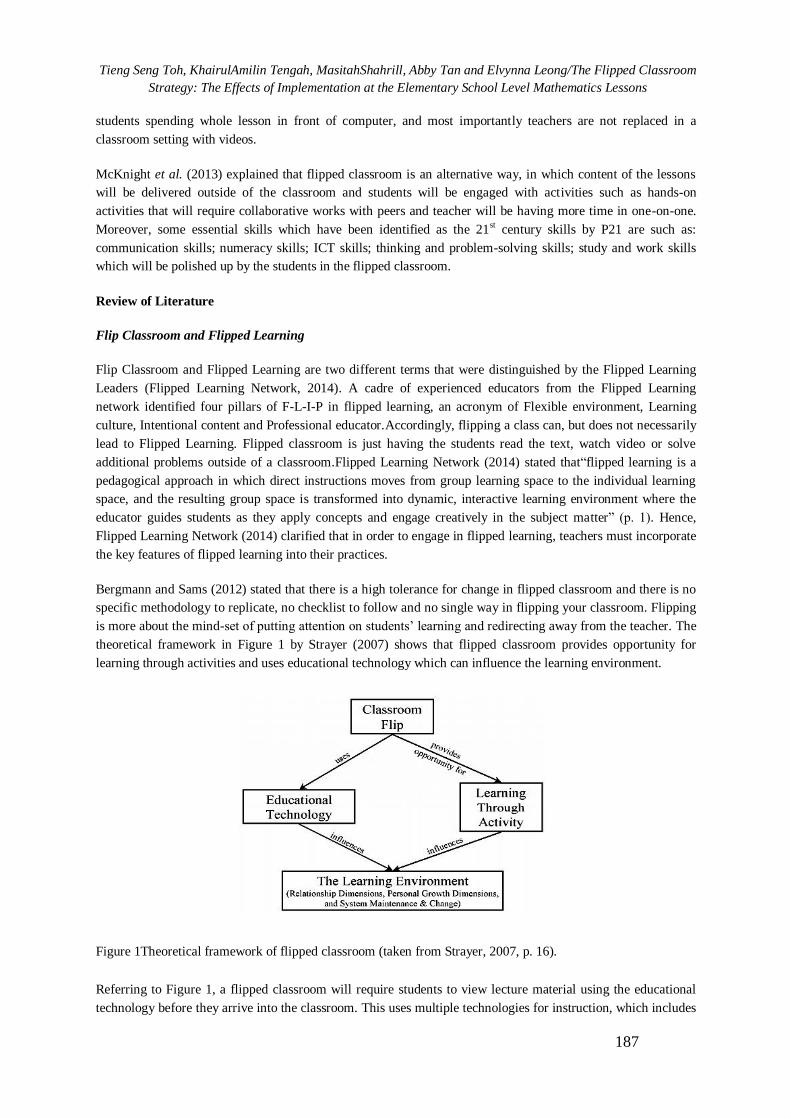
Tieng Seng Toh, KhairulAmilin Tengah, MasitahShahrill, Abby Tan and Elvynna Leong/The Flipped Classroom
Strategy: The Effects of Implementation at the Elementary School Level Mathematics Lessons
187
students spending whole lesson in front of computer, and most importantly teachers are not replaced in a
classroom setting with videos.
McKnight et al. (2013) explained that flipped classroom is an alternative way, in which content of the lessons
will be delivered outside of the classroom and students will be engaged with activities such as hands-on
activities that will require collaborative works with peers and teacher will be having more time in one-on-one.
Moreover, some essential skills which have been identified as the 21st century skills by P21 are such as:
communication skills; numeracy skills; ICT skills; thinking and problem-solving skills; study and work skills
which will be polished up by the students in the flipped classroom.
Review of Literature
Flip Classroom and Flipped Learning
Flip Classroom and Flipped Learning are two different terms that were distinguished by the Flipped Learning
Leaders (Flipped Learning Network, 2014). A cadre of experienced educators from the Flipped Learning
network identified four pillars of F-L-I-P in flipped learning, an acronym of Flexible environment, Learning
culture, Intentional content and Professional educator.Accordingly, flipping a class can, but does not necessarily
lead to Flipped Learning. Flipped classroom is just having the students read the text, watch video or solve
additional problems outside of a classroom.Flipped Learning Network (2014) stated that“flipped learning is a
pedagogical approach in which direct instructions moves from group learning space to the individual learning
space, and the resulting group space is transformed into dynamic, interactive learning environment where the
educator guides students as they apply concepts and engage creatively in the subject matter” (p. 1). Hence,
Flipped Learning Network (2014) clarified that in order to engage in flipped learning, teachers must incorporate
the key features of flipped learning into their practices.
Bergmann and Sams (2012) stated that there is a high tolerance for change in flipped classroom and there is no
specific methodology to replicate, no checklist to follow and no single way in flipping your classroom. Flipping
is more about the mind-set of putting attention on students‟ learning and redirecting away from the teacher. The
theoretical framework in Figure 1 by Strayer (2007) shows that flipped classroom provides opportunity for
learning through activities and uses educational technology which can influence the learning environment.
Figure 1Theoretical framework of flipped classroom (taken from Strayer, 2007, p. 16).
Referring to Figure 1, a flipped classroom will require students to view lecture material using the educational
technology before they arrive into the classroom. This uses multiple technologies for instruction, which includes

Proceeding of the 3rd International Conference on Education, Vol. 3, 2017, pp. 186-197
188
lecture capture online podcasts, tutoring, social networking and recorded lectures (Brame, n.d.). The use of
video or any other pre-recorded media gives student the opportunity to self-control their learning either by re-
watch, rewind, fast-forward if needed or pause, and hence, more human or face-to-face contact with each
student during in-class time (Nawiet al., 2015; Manjanai and Shahrill, 2016). Bruff (2012) pointed out that
flipping a classroom does not necessarily require the use of video. According to him, textbook is also an
educational technology where teachers should embraced to the extent as they could (Best Practices for the
Flipped Classroom, 2013).On the other hand, there are greater time for learning activity where the activity can
be student-led and communication among students can be the dynamic learning through hands-on activity
(Educause, 2012).
Benefits of Flipping a Classroom
According to Bergmann and Sams (2012), they had pointed out some reasons for flipping a classroom such as:
Flipping helps busy students cause flipped classroom create a flexible environment for the learning of the
student; Flipping helps struggling students as educators spend most of the time walking and communicating to
help students who struggle most, compared to the traditional role of teaching where educators spend most of the
time delivering content and student listen passively; Flipping helps students of all abilities to excel because
students do not need to take-notes while hoping they can understand them later. Instead, students can just pause
or rewind the video when necessary so that they actually learn the important concepts, if they are watching
vides.
In addition, Bergmann and Sams (2012) added that Flipping increases interactions either between students to
teacher or students to students, where there are more face-to-face or in-class time. Students have more
opportunity to talk with others, especially during collaborative group activity; Flipping allows for real
differentiation for students with different ability ranges from those who excel, to the average student, to student
who struggle, to students who cannot read. Hence, personalised learning can be modified according to their
ability and Flipping changes classroom management where in traditional teaching approach, students did not
pay attention, often distracted and negatively affected by others while in flipped classroom, students either do
hands-on activity or works in small groups where students‟ distraction or student getting bored is not an issue.
Methodology
The aim of this study was to investigate the effects of flipped classroom on Brunei Secondary Mathematics in
students‟ performance. This study will also be guided by the following research question guided this study: How
does flipped classroom affect the students‟ performances?
Sample and Setting
The sample size was 16 students with average learning ability. The contact hours between students and teacher
were seven periods in a week, which was approximately 25 minutes per period.This study was conducted in an
all-girls high school, situated in the Brunei-Muara district. The school is a mixed ability school, and most of the
students in this school are within this catchment area. This study was conducted to the Year 7 students with an
age range from 11 to 12 years old.

Tieng Seng Toh, KhairulAmilin Tengah, MasitahShahrill, Abby Tan and Elvynna Leong/The Flipped Classroom
Strategy: The Effects of Implementation at the Elementary School Level Mathematics Lessons
189
Procedure
Figure 2Flowchart of teaching and learning in a flipped classroom
This study involved a three cycle action research. The process of flipped classroom for this study in each cycle
can besummarised by Figure 2 above. In the first cycle, during the introduction lesson, a pre-test was conducted
to test students‟ prior knowledge on the topic „Whole Number and Operations‟. After the pre-test 1, students
were given assigned reading materials in the form of textbooks and videos as homework so that they can watch
the videos or do their reading outside of the classroom on their own pace. At the same time, the learning
objectives that they should have achieved at the end of the topic was explained to them.
When they returned for the next lesson in the flipped classroom, a question and answer session took place to
help those students who found difficulties in their assigned „homework. The lesson continued with some hands-
on activity or problem-solving activity to enhance students‟ learning. A post-test was given at the end of the
topic which was approximately two weeks after pre-test 1 and that will be labelled as post-test 1. In the next
lesson, a discussion session took place after the post-test1 was marked. The discussion session was conducted
one-on-one to those students who performed quite weak in their post-test1. This discussion session was aimed to
help those students who faced difficulty in answering the questions from the post-test 1 to perform better. In
addition, a delayed post-test 1 was given after 1 or 2 weeks gap from post-test 1.
Students worked in a small groups (around 4 to 5 students each) for any in-class activities. They were grouped
randomly by the teacher during the introductory lesson and they will be working in the same group throughout
the study. This study repeated for another two cycles, hence covering another two topics which follows the
scheme of work of the Year 7 Secondary Mathematics in Brunei Darussalam. The other two topics covered in
this study were „Integers‟ as well as „Fractions and Decimals‟. All questions in pre-test, post-test and delayed
post-test are set to be in the same questions but the arrangement of the questions are in different sequences.
The process of the second cycle was similar to Cycle 1 (refer to Figure 2). And the test instruments were
labelled as pre-test 2, post-test 2 and delayed post-test 2. In this cycle, the students were assigned to read from
their textbooks only and no videos were used. Whereas in the third cycle, the same process took placed as
shown in Figure 2. The test taken by the students were labelled as pre-test 3 and post-test 3. There was no
delayed post-test 3 in this cycle due to time constrained. In cycle 3, textbook was assigned as reading materials
but students have to answer some „Test Yourself‟ questions after they had done their reading outside of the
classroom and no video was used. The aim of the „Test Yourself‟ questions was to assess students‟
understanding on the content they had read. The questions are available at the end of each section of the
assigned readings in their textbooks, and there are usually three to four questions for them to answer. Students
then discuss the questions in their respective groups in the next flipped classroom lesson followed by in-class
activities to enhance their learning on the mathematics content.
Proceeding of the 3rd International Conference on Education, Vol. 3, 2017, pp. 186-197
190
Data Collection
Mixed method of quantitative and qualitative method will be carried out to collect data in this study. The pre-
test was conducted firstly before a chapter start which test the students‟ prior knowledge on the topic and at the
same time, it will be used as a benchmark to be compared with their post-test and delayed post-test mark. The
post-test will be conducted at the end of the chapter. The aim of the post-test is to measure the learning during
the class, at the same time, it helps in recognising students who need additional helps in the topic. A delayed
post-test was carried out one or two weeks after the post-test. This is to measure the application and the impact
of the learning but not measure the students‟ ability to retain the knowledge (pre- and post-testing). All the pre-
test, post-test and delayed post-test marks were converted to percentages so that the marks can be analysed
easily. The maximum possible marks score for pre-test, post-test and delayed post-test was 100 and the
minimum possible marks score was zero.
Data Analysis
Data were collected by using pre-test, post-test and delayed post-test. Statistical data such as mean and standard
deviation will be calculated to compare the results between the tests in the three cycles. A paired sample t-test
was used to compare the mean difference of pre-test, post-test and delayed post-test in determining whether
there is any significant difference between each other under normal distribution. The use of pairwise t-test was
to compare the pre-test, post-test and delayed post-test of the same students in this study. All the data were
entered and analysed using the SPSS software.
Scope and Limitations
The sample size of the study was 16 students. Due to the small sample size collected in this study, the data
collected may not be used to generalise with the population of Brunei but the data will only be used to
investigate the effects of flipped classroom in this study. In addition, the data may be used as a benchmark or
reference for other researchers especially in Brunei who may be interested to do further investigation on the
study area.
Furthermore, time is also another limiting factor, where this study will only be carried out in a limited time
frame (2 months). Since this study is an action research that involves intact classroom where there are
interactions between teacher and students in a natural classroom setting, so the data collected in that time frame
is just a snapshot of flipped classroom during that time.
In addition, students‟ proficiency in English language may vary. Since this study will be conducted in English
medium only, so some students might find some difficulty in expressing their ideas and may often create
misunderstood which might also affects the peers in evaluating them in regard to the students‟ engagement
during in-class activity. Moreover, it may also influenced the students‟ achievements indirectly.
Furthermore, it may be difficult for some students to access to the computer due to the inadequate or limited
number of computers provided in the school computer lab, time constraint in using a computer in the library
(usually 30 minutes) or cannot afford for the technology which lead to student failing in doing the assigned
„homework‟ in flipped classroom.
Results and Discussions
According to Pallant (2005), there are some general assumption that apply to the use of parametric statistics test
such as the measure of dependent variable is measured using a continuous scale rather than categorical, random
sampling, independence observations, homogeneity of variance and normal distribution of sample.
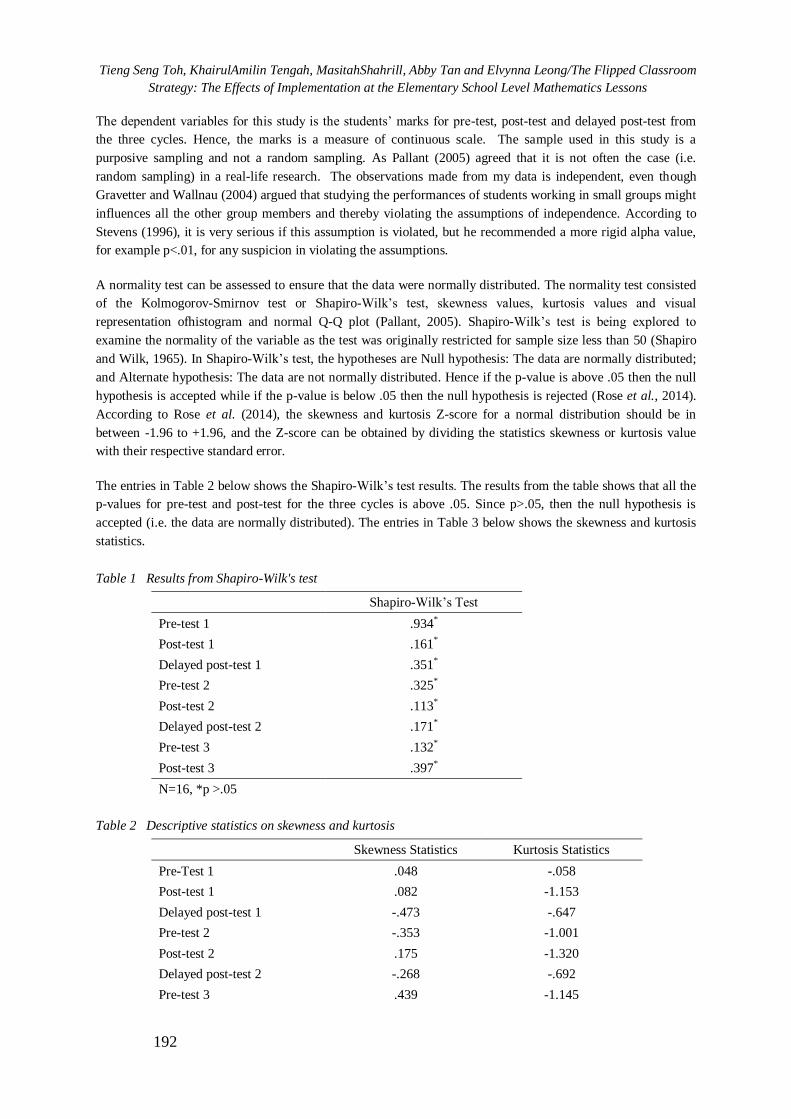
Tieng Seng Toh, KhairulAmilin Tengah, MasitahShahrill, Abby Tan and Elvynna Leong/The Flipped Classroom
Strategy: The Effects of Implementation at the Elementary School Level Mathematics Lessons
192
The dependent variables for this study is the students‟ marks for pre-test, post-test and delayed post-test from
the three cycles. Hence, the marks is a measure of continuous scale. The sample used in this study is a
purposive sampling and not a random sampling. As Pallant (2005) agreed that it is not often the case (i.e.
random sampling) in a real-life research. The observations made from my data is independent, even though
Gravetter and Wallnau (2004) argued that studying the performances of students working in small groups might
influences all the other group members and thereby violating the assumptions of independence. According to
Stevens (1996), it is very serious if this assumption is violated, but he recommended a more rigid alpha value,
for example p<.01, for any suspicion in violating the assumptions.
A normality test can be assessed to ensure that the data were normally distributed. The normality test consisted
of the Kolmogorov-Smirnov test or Shapiro-Wilk‟s test, skewness values, kurtosis values and visual
representation ofhistogram and normal Q-Q plot (Pallant, 2005). Shapiro-Wilk‟s test is being explored to
examine the normality of the variable as the test was originally restricted for sample size less than 50 (Shapiro
and Wilk, 1965). In Shapiro-Wilk‟s test, the hypotheses are Null hypothesis: The data are normally distributed;
and Alternate hypothesis: The data are not normally distributed. Hence if the p-value is above .05 then the null
hypothesis is accepted while if the p-value is below .05 then the null hypothesis is rejected (Rose et al., 2014).
According to Rose et al. (2014), the skewness and kurtosis Z-score for a normal distribution should be in
between -1.96 to +1.96, and the Z-score can be obtained by dividing the statistics skewness or kurtosis value
with their respective standard error.
The entries in Table 2 below shows the Shapiro-Wilk‟s test results. The results from the table shows that all the
p-values for pre-test and post-test for the three cycles is above .05. Since p>.05, then the null hypothesis is
accepted (i.e. the data are normally distributed). The entries in Table 3 below shows the skewness and kurtosis
statistics.
Table 1 Results from Shapiro-Wilk's test
Shapiro-Wilk‟s Test
Pre-test 1 .934*
Post-test 1 .161*
Delayed post-test 1 .351*
Pre-test 2 .325*
Post-test 2 .113*
Delayed post-test 2 .171*
Pre-test 3 .132*
Post-test 3 .397*
N=16, *p >.05
Table 2 Descriptive statistics on skewness and kurtosis
Skewness Statistics Kurtosis Statistics
Pre-Test 1 .048 -.058
Post-test 1 .082 -1.153
Delayed post-test 1 -.473 -.647
Pre-test 2 -.353 -1.001
Post-test 2 .175 -1.320
Delayed post-test 2 -.268 -.692
Pre-test 3 .439 -1.145
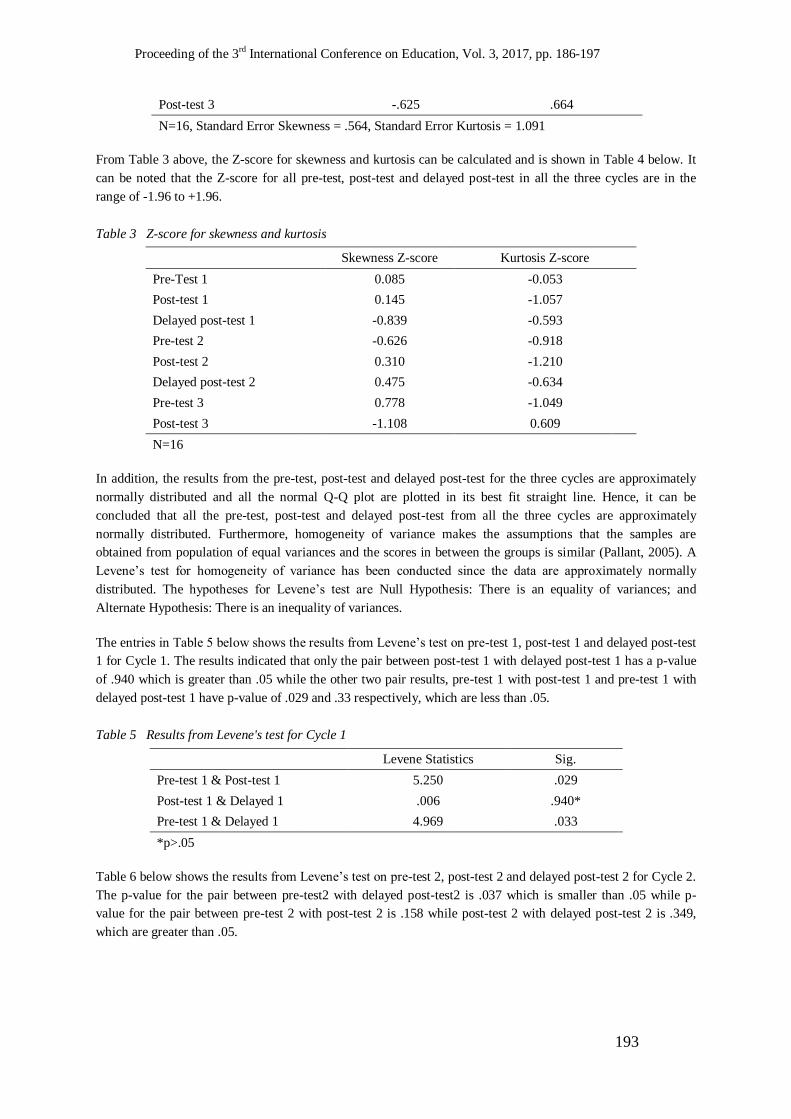
Proceeding of the 3rd International Conference on Education, Vol. 3, 2017, pp. 186-197
193
Post-test 3 -.625 .664
N=16, Standard Error Skewness = .564, Standard Error Kurtosis = 1.091
From Table 3 above, the Z-score for skewness and kurtosis can be calculated and is shown in Table 4 below. It
can be noted that the Z-score for all pre-test, post-test and delayed post-test in all the three cycles are in the
range of -1.96 to +1.96.
Table 3 Z-score for skewness and kurtosis
Skewness Z-score Kurtosis Z-score
Pre-Test 1 0.085 -0.053
Post-test 1 0.145 -1.057
Delayed post-test 1 -0.839 -0.593
Pre-test 2 -0.626 -0.918
Post-test 2 0.310 -1.210
Delayed post-test 2 0.475 -0.634
Pre-test 3 0.778 -1.049
Post-test 3 -1.108 0.609
N=16
In addition, the results from the pre-test, post-test and delayed post-test for the three cycles are approximately
normally distributed and all the normal Q-Q plot are plotted in its best fit straight line. Hence, it can be
concluded that all the pre-test, post-test and delayed post-test from all the three cycles are approximately
normally distributed. Furthermore, homogeneity of variance makes the assumptions that the samples are
obtained from population of equal variances and the scores in between the groups is similar (Pallant, 2005). A
Levene‟s test for homogeneity of variance has been conducted since the data are approximately normally
distributed. The hypotheses for Levene‟s test are Null Hypothesis: There is an equality of variances; and
Alternate Hypothesis: There is an inequality of variances.
The entries in Table 5 below shows the results from Levene‟s test on pre-test 1, post-test 1 and delayed post-test
1 for Cycle 1. The results indicated that only the pair between post-test 1 with delayed post-test 1 has a p-value
of .940 which is greater than .05 while the other two pair results, pre-test 1 with post-test 1 and pre-test 1 with
delayed post-test 1 have p-value of .029 and .33 respectively, which are less than .05.
Table 5 Results from Levene's test for Cycle 1
Levene Statistics Sig.
Pre-test 1 & Post-test 1 5.250 .029
Post-test 1 & Delayed 1 .006 .940*
Pre-test 1 & Delayed 1 4.969 .033
*p>.05
Table 6 below shows the results from Levene‟s test on pre-test 2, post-test 2 and delayed post-test 2 for Cycle 2.
The p-value for the pair between pre-test2 with delayed post-test2 is .037 which is smaller than .05 while p-
value for the pair between pre-test 2 with post-test 2 is .158 while post-test 2 with delayed post-test 2 is .349,
which are greater than .05.

Tieng Seng Toh, KhairulAmilin Tengah, MasitahShahrill, Abby Tan and Elvynna Leong/The Flipped Classroom
Strategy: The Effects of Implementation at the Elementary School Level Mathematics Lessons
194
Table 6 Results from Levene's test for Cycle 2
Levene Statistics Sig.
Pre-test 2 & Post-test 2 2.095 .158*
Post-test 2 & Delayed 2 .904 .349*
Pre-test 2 & Delayed 2 4.782 .037
*p>.05
Table 7 below shows the results of Levene‟s test for pre-test 3 and post-test 3 in Cycle 3. The p-value between
pre-test 3 with post-test 3 is .055, which is greater than .05. The Levene‟s test verified that if the p-value is
above .05, the alternate hypothesis is rejected and it shows there is an equality of variance (Martin and
Bridgmon, 2012).
Table 7 Results from Levene's test for Cycle 3
Levene Statistics Sig.
Pre-test 3 & Post-test 3 3.975 .055*
*p>.05
As referred to Table 5, Table 6 and Table 7 above, it shows that there are some results that shows equality in
variances and some do not. Pallant (2005) recommended to stringent the significant level (p<.01) if inequality of
variance was suspicion when evaluating the results.
Validity and Reliability of Instruments
All the pre- and post-tests were validated by the researchers to ensure that the tests were suitable to assess the
students‟ knowledge on the mathematics content. SPSS software was used, where split-half test was conducted
to check the reliability of the test. The reliability test was performed to all the three pre-tests (pre-tests 1, 2 and
3). Only the pre-tests were used in the reliability test as the questions for the pre- and post-test are the same.
There are 25 questions in total from all the three pre-tests, and by using the split-half method, the Spearman-
Brown coefficient showed 0.705 which is relatively reliable, with a correlations between forms of 0.545.
Analyses result of Pre-test and Post-test
By using SPSS, a paired sample t-test was conducted between the pre-test, post-test and delayed post-test, in
order to find out the effect of flipped classroom on students‟ performance in Year 7 secondary mathematics. The
hypotheses areNull hypothesis: There is no significant difference between the means of the pre-test and post-
test; and Alternate hypothesis: There is a significant difference in between the means of the pre-test and post-
test.
The entries in Table 8 below summarized the mean and standard deviation of students‟ marks for Cycle 1. It can
be noted that the mean marks for post-test 1 (M=79.81, SD=9.874) is higher than the pre-test 1 mean marks
(M=54.13, SD=21.159), while the delayed post-test 1 has a higher mean marks (M=81.63, SD=10.210)
compared to its pre-test and post-test marks.

Proceeding of the 3rd International Conference on Education, Vol. 3, 2017, pp. 186-197
195
Table 8 Descriptive statistics of students’ marks in Cycle 1
M N SD Standard Error Mean
Pre-test 1 54.13 16 21.159 5.290
Post-test 1 79.81 16 9.894 2.474
Delayed post 1 81.63 16 10.210 2.553
M = Mean, SD = Standard Deviation
The entries in Table 9 indicated that the mean marks for post-test 2 (M=65.31, SD=10.910) is higher than the
pre-test 2 mean marks (M=45.69, SD=14.916), while the delayed post-test 2 has a higher mean marks
(M=75.00, SD=9.571) compared to its pre-test and post-test marks.
Table 9 Descriptive statistics of students’ marks in Cycle 2
M N SD Standard Error Mean
Pre-test 2 45.69 16 14.916 3.729
Post-test 2 65.31 16 10.910 2.728
Delayed post 2 75.00 16 9.571 2.393
M = Mean, SD = Standard Deviation
The entries in Table 10 below summarized the mean and standard deviation of students‟ marks for Cycle 3.
From Table 10 above, it shows that the mean marks for post-test 3 (M=55.00, SD=9,980) is higher than pre-test
3 mean marks (M=43.56, SD=13.692). Hence, this shows that there is an improvement in the average marks
between pre-test, post-test and delayed post-test for all the three cycles and the average mean marks for all tests
in all the three cycles was summarized in Figure 3 below.
Table 10 Descriptive statistics of students’ marks in Cycle 3
M N SD Standard Error Mean
Pre-test 3 43.56 16 13.692 3.423
Post-test 3 55.00 16 9.980 2.495
M = Mean, SD = Standard Deviation
Figure 3. Summary of mean marks for all the three cycles
Next, the paired sample t-test differences were generated. The entries in Table 11 shows the results of paired
sample t-test in Cycle 1, and it shows that the mean marks for the first pair between post-test 1 and pre-test 1 is
0
10
20
30
40
50
60
70
80
90
100
Cycle 1 Cycle 2 Cycle 3
Pre-Test
Post-Test
Delayed Post-Test

Tieng Seng Toh, KhairulAmilin Tengah, MasitahShahrill, Abby Tan and Elvynna Leong/The Flipped Classroom
Strategy: The Effects of Implementation at the Elementary School Level Mathematics Lessons
196
25.688 with standard deviation of 6.039, while the second pair between delayed post-test 1 and pre-test 1 mean
is 27.5 with standard deviation 19.796. This shows that the mean between the two pairs (post-test 1 and pre-test
1 with delayed post-test 1 and pre-test 1) increased by approximately 32%. Moreover, the paired sample t-test
shows both pairs, between post-test 1 with pre-test 1 and between delayed post-test 1 with pre-test 1 are
statistically significant at p<.01, which means that the students‟ performed significantly better in their post-test 1
and delayed post-test 1 compared to their pre-test 1.
Table 11 Paired sample t-test results for Cycle 1
M SD Std. Error Mean t df Sig(2-tailed)
Post 1 – Pre 1 25.688 24.157 6.039 4.253** 15 .001
D 1 – Pre 1 27.5 19.796 4.949 5.557** 15 .000
**p<.01, D= Delayed Post-Test, Std. Error Mean= Standard Error Mean, M = Mean, SD = Standard
Deviation
Entries in Table 12 shows the results of paired sample t-test in Cycle 2, and the mean for the first pair between
post-test 2 and pre-test 2 is 19.625 with standard deviation 15.874, while the second pair between delayed post-
test 2 and pre-test 2 mean is 29.313 with standard deviation 12.794. This shows that the mean marks between
these two pair (post-test 2 and pre-test 2 with delayed post-test 2 and pre-test2) have an increase of
approximately 49%. For the third pair in between post-test 3 and pre-test 3, the mean is 11.438 with standard
deviation of 9.906. Furthermore, paired sample t-test shows that the three pairs in Table 12 above have a
statistically significant increase at p<.01, which means students‟ performance in their post-test and delayed post-
test are better than their pre-test.
Table 12 Results from paired sample t-test in Cycle 2 and Cycle 3.
M SD Std. Error Mean t df Sig(2-tailed)
Post 2– Pre 2 19.625 15.874 3.968 4.945** 15 .000
D 2 – Pre 2 29.313 12.794 3.199 9.164** 15 .000
Post 3– Pre 3 11.438 9.906 2.477 4.618** 15 .000
N=16, **p<.01, D= Delayed Post-Test, Std. Error Mean= Standard Error Mean, M = Mean, SD
= Standard Deviation
Although the results from the pre-test, post-test and delayed post-test for all the three cycles shows that there is a
significant increase in the marks, but it does not tell us the magnitude of the intervention‟s effect. Hence, one
way to find it out is by calculating the effect size statistic. One of the most common used effect size statistics is
eta squared and can be calculated using the formula:
𝐸𝑡𝑎 𝑠𝑞𝑢𝑎𝑟𝑒𝑑 =𝑡2
𝑡2 + 𝑁 − 1
Where t is the t-value from paired sample t-test and N is the number of sample. Eta squared ranges from the
value 0 to 1 (Pallant, 2005). Guidelines are being used to interpret the eta squared values, where .01 means
small effect; .06 means moderate effect; and .14 means large effect (Cohen, 1988). From Table 13, the eta
squared statistics are shown for all the pre-test, post-test and delayed post-test in the three cycles. All the eta
squared statistics are larger than .14, hence indicates a large effect size.
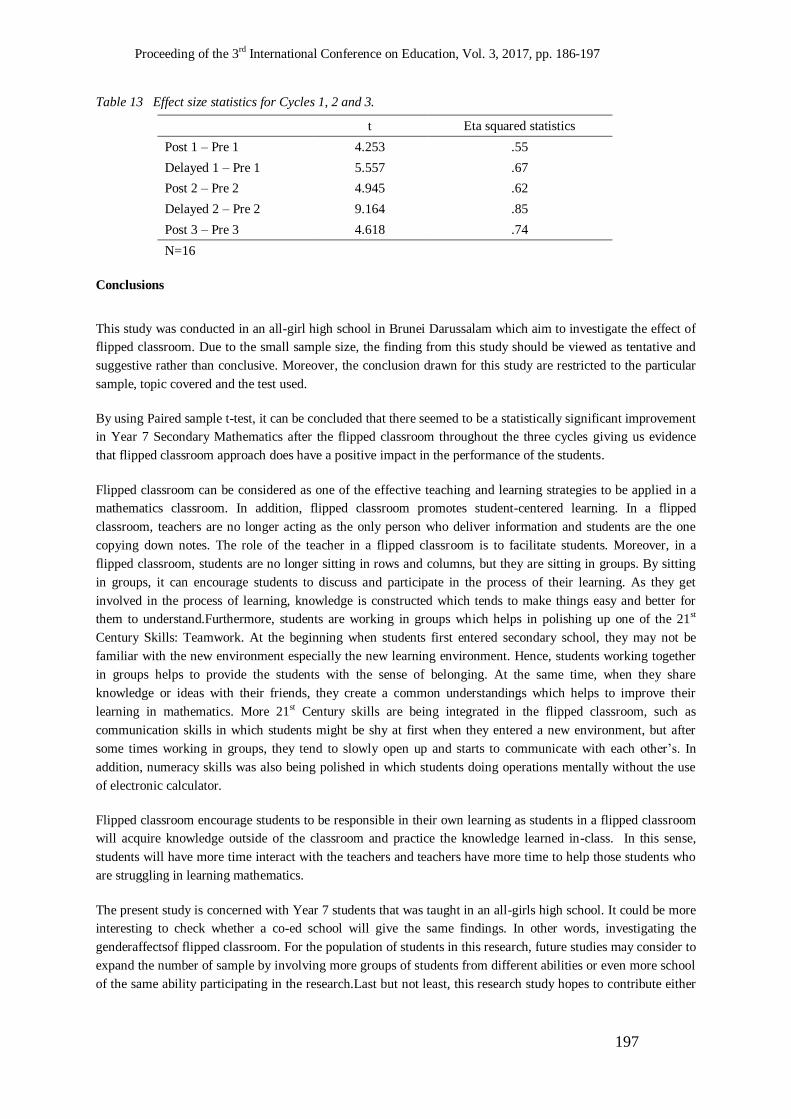
Proceeding of the 3rd International Conference on Education, Vol. 3, 2017, pp. 186-197
197
Table 13 Effect size statistics for Cycles 1, 2 and 3.
t Eta squared statistics
Post 1 – Pre 1 4.253 .55
Delayed 1 – Pre 1 5.557 .67
Post 2 – Pre 2 4.945 .62
Delayed 2 – Pre 2 9.164 .85
Post 3 – Pre 3 4.618 .74
N=16
Conclusions
This study was conducted in an all-girl high school in Brunei Darussalam which aim to investigate the effect of
flipped classroom. Due to the small sample size, the finding from this study should be viewed as tentative and
suggestive rather than conclusive. Moreover, the conclusion drawn for this study are restricted to the particular
sample, topic covered and the test used.
By using Paired sample t-test, it can be concluded that there seemed to be a statistically significant improvement
in Year 7 Secondary Mathematics after the flipped classroom throughout the three cycles giving us evidence
that flipped classroom approach does have a positive impact in the performance of the students.
Flipped classroom can be considered as one of the effective teaching and learning strategies to be applied in a
mathematics classroom. In addition, flipped classroom promotes student-centered learning. In a flipped
classroom, teachers are no longer acting as the only person who deliver information and students are the one
copying down notes. The role of the teacher in a flipped classroom is to facilitate students. Moreover, in a
flipped classroom, students are no longer sitting in rows and columns, but they are sitting in groups. By sitting
in groups, it can encourage students to discuss and participate in the process of their learning. As they get
involved in the process of learning, knowledge is constructed which tends to make things easy and better for
them to understand.Furthermore, students are working in groups which helps in polishing up one of the 21st
Century Skills: Teamwork. At the beginning when students first entered secondary school, they may not be
familiar with the new environment especially the new learning environment. Hence, students working together
in groups helps to provide the students with the sense of belonging. At the same time, when they share
knowledge or ideas with their friends, they create a common understandings which helps to improve their
learning in mathematics. More 21st Century skills are being integrated in the flipped classroom, such as
communication skills in which students might be shy at first when they entered a new environment, but after
some times working in groups, they tend to slowly open up and starts to communicate with each other‟s. In
addition, numeracy skills was also being polished in which students doing operations mentally without the use
of electronic calculator.
Flipped classroom encourage students to be responsible in their own learning as students in a flipped classroom
will acquire knowledge outside of the classroom and practice the knowledge learned in-class. In this sense,
students will have more time interact with the teachers and teachers have more time to help those students who
are struggling in learning mathematics.
The present study is concerned with Year 7 students that was taught in an all-girls high school. It could be more
interesting to check whether a co-ed school will give the same findings. In other words, investigating the
genderaffectsof flipped classroom. For the population of students in this research, future studies may consider to
expand the number of sample by involving more groups of students from different abilities or even more school
of the same ability participating in the research.Last but not least, this research study hopes to contribute either

Tieng Seng Toh, KhairulAmilin Tengah, MasitahShahrill, Abby Tan and Elvynna Leong/The Flipped Classroom
Strategy: The Effects of Implementation at the Elementary School Level Mathematics Lessons
197
directly or indirectly to the educational research for flipped classroom in mathematics especially in secondary
mathematics in Brunei Darussalam.
References
Bergmann, J., and Sams, A, 2012, Flip your Classroom: Reach Every Student in Every Class Every Day
(Eugene, OR: International Society for Technology in Education).
Bergmann, J., Overmyer, J., and Wilie, B., 2011,The flipped class: What it is and what it is not.Date of access: 12/04/2016. http://www.thedailyriff.com/articles/the-flipped-class-conversation-689.php
Best Practices for the Flipped Classroom, 2013, Date of access: 12/04/2016.
http://www.itap.purdue.edu/learning/cdm/supporting/FlippedModel/Flipped%20Classroom%20Best%20Practic
es.pdf
Brame, C. J., n.d., Flipping The Classroom.Date of access: 13/04/2016. https://cft.vanderbilt.edu/wp-
content/uploads/sites/59/Flipping-the-classroom.pdf
Braseby, A. M., n.d.,IDEA PAPER 57: The Flipped Classroom.Date of access: 14/05/2016.
http://ideaedu.org/wp-content/uploads/2015/03/paperidea_57.pdf
Bruff, D., 2012, The Flipped Classroom FAQ. CIRTL Network. Date of access: 12/04/2016.
http://www.cirtl.net/node/7788
Cohen, J., 1988,Statistical Power Analysis for the Behavioral Sciences (Hillsdale, NJ: Erlbaum).
Educause, 2012, 7 Things you should know about flipped classrooms. Date of access: 13/04/2016.
https://net.educause.edu/ir/library/pdf/eli7081.pdf
Flipped Learning Network, 2014, The Four Pillars of F-L-I-P. Date of access:
12/04/2016.http://flippedlearning.org/cms/lib07/VA01923112/Centricity/Domain/46/FLIP_handout_FNL_Web.
Gravetter, F. J., and Wallnau, L. B., 2004, Statistics for Behavioral Sciences (5thed) (Belmont, CA:
Wadsworth/Thomson Learning).
Hanover Research., n.d., Date of access: 12/04/2016.http://www.hanoverresearch.com/insights/best-practices-
for-the-flipped-classroom/?i=k-12-education
Manjanai, S. N. N. P., and Shahrill, M., 2016, Introducing the flipped classroom strategy in the learning of year
nine factorization. International Journal of Interdisciplinary Educational Studies, 11(4), 35-55.
Martin, W. E., and Bridgmon, K. D., 2012,Quantitative and Statistical Research Methods:From
Hypothesis to Results(Somerset, NJ: John Wiley& Sons).
McKnight, P., McKnight, K., M. Arfsrom, K., and Noora Hamdan, 2013,A Review of Flipped Learning.Date of
access: 11/04/2016. http://www.flippedlearning.org/review
Nawi, N., Jawawi, R., Matzin, R., Jaidin, J. H., Shahrill, M., and Mundia, L., 2015, To flip or not to flip: the
challenges and benefits of using flipped classroom in geography lessons in Brunei Darussalam. Review of
European Studies, 7(12), 133-145.
Pallant, J., 2005, SPSS Survival Manual: A Step by Step Guide to using SPSS for Windows (version 12) (New South Wales, Australia: Allen & Unwin).
Rose, S., Spinks, N., and Canhoto, A. I., 2014, Management Research: Applying the Principles (New York, NY:
Routledge).
Shapiro, S. S. and Wilk, M. B., 1965,An analysis of variance test for normality (complete samples). Biometrika,
52(3-4), 591-611.
Stevens, J., 1996, Applied Multivariate Statistics for the Social Sciences (Mahwah, NJ: Lawrence Erlbaum).
Strayer, J. F., 2007, The effects of the classroom flip on the learning environment: A comparison of learning
activity in a traditional classroom and a flip classroom that used an intelligent tutoring system. Doctoral
dissertation, The Ohio State University.
Proceeding of the 3rd International Conference on Education, Vol. 3, 2017, pp. 198-204 Copyright © 2017 TIIKM ISSN 2424 - 6700 online DOI: https://doi.org/10.17501/icedu.2017.3121
3rd International Conference on Education, 20-22 April 2017, Kuala Lumpur, Malaysia
USING VISUAL REPRESENTATIONS AS AN
ALTERNATIVE IN TEACHING SIMULTANEOUS
EQUATIONS
NurNadhirah Haji Nordin1, KhairulAmilin Tengah
2, Masitah Shahrill
3, Abby Tan
4 and
Elvynna Leong5
1Masin Secondary School, Ministry of Education,Brunei 2,3Sultan HassanalBolkiah Institute of Education, Universiti Brunei Darussalam, Brunei
4,5Faculty of Science, Universiti Brunei Darussalam, Brunei
Abstract: It is widely known that students normally struggle in the mathematics topic of algebra.
They tend to steer away from algebraic problems such as solving linear equation with one variable,
let alone simultaneous equations, which require them to determine the values of two variables. This
action research study investigates the effect of replacing the common symbolic representations with
pictorial (static visual) representations in simultaneous equations lessons of 38 low-performing Year
10 students. The data for the study was collected by means of pre- and post-tests and facilitated by
three worksheets as the intervention instruments. During the lessons, pictorial representations were
used in solving simultaneous equations questions. These entailed drawing several pictorials that were
given in the equations. In particular, drawings of burgers, fries, cheese slices, gift boxes and sweets
were used as these were generally relatable to the students in real-life. The students were then
provided with fresh worksheets and subsequently translated their workings from the pictorial part to
x and y. And thus forms the symbolic part of the intervention. From the students‟ pre-test and post-
test scores, it was evident that the pictorial representations helped the students in making significant
improvements in the topic.
Keywords: Algebra, Simultaneous Equations, Pictorial Representation, Mathematics Performance
Introduction
Mathematics has a high relevance and practical applications in real life forming a base for all technological and
scientific studies (Mundia, 2010; Chong and Shahrill, 2016; Fintiet al., 2016; Huda et al., 2017). Despite its
importance, students tend to perform poorly in it. It is also widely known that algebra is one mathematics topic
that students tend to struggle in (Samo, 2008). According to Devlin, algebra is not “arithmetic with letters”
(Devlin, 2011). At the school level, he mentioned that arithmetic and algebra are two different forms of thinking
about numerical issues. Many people find arithmetic hard, but the basic building block of the subject, which are
numbers, exist naturally around us and this makes it possible to learn about arithmetic. This includes counting
and measuring things or checking the baseball scores.
Algebra, on the other hand, is one more step removed from everyday world (Devlin, 2011). He further added
that the x and y dealt with in algebra represent numbers in general, but not particular numbers and the human
brain is not naturally appropriate to think at that level of abstraction. To be able to do so requires effort and
training. Devlin also pressed on the fact that algebraic thinking is different that arithmetical thinking. This
transition between the two may be difficult for some students, as they need to make some adjustments
(Kilpatrick et al., 2001). There is then a need to help support the development of this thinking so that students
make a smooth transition and so that they develop an appreciation of exploiting algebraic tactics to solve
different problems (Caiet al., 2005).
Corresponding Author:NurNadhirah Haji Nordin/[email protected]
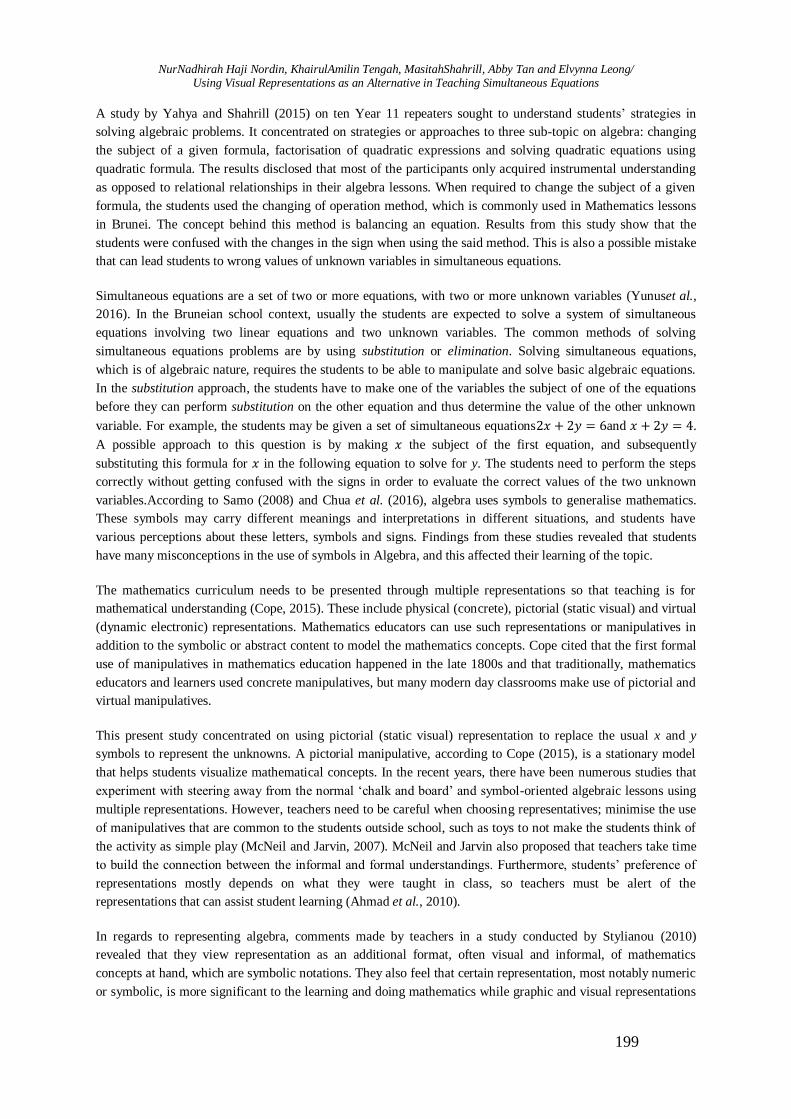
NurNadhirah Haji Nordin, KhairulAmilin Tengah, MasitahShahrill, Abby Tan and Elvynna Leong/ Using Visual Representations as an Alternative in Teaching Simultaneous Equations
199
A study by Yahya and Shahrill (2015) on ten Year 11 repeaters sought to understand students‟ strategies in
solving algebraic problems. It concentrated on strategies or approaches to three sub-topic on algebra: changing
the subject of a given formula, factorisation of quadratic expressions and solving quadratic equations using
quadratic formula. The results disclosed that most of the participants only acquired instrumental understanding
as opposed to relational relationships in their algebra lessons. When required to change the subject of a given
formula, the students used the changing of operation method, which is commonly used in Mathematics lessons
in Brunei. The concept behind this method is balancing an equation. Results from this study show that the
students were confused with the changes in the sign when using the said method. This is also a possible mistake
that can lead students to wrong values of unknown variables in simultaneous equations.
Simultaneous equations are a set of two or more equations, with two or more unknown variables (Yunuset al.,
2016). In the Bruneian school context, usually the students are expected to solve a system of simultaneous
equations involving two linear equations and two unknown variables. The common methods of solving
simultaneous equations problems are by using substitution or elimination. Solving simultaneous equations,
which is of algebraic nature, requires the students to be able to manipulate and solve basic algebraic equations.
In the substitution approach, the students have to make one of the variables the subject of one of the equations
before they can perform substitution on the other equation and thus determine the value of the other unknown
variable. For example, the students may be given a set of simultaneous equations2𝑥 + 2𝑦 = 6and 𝑥 + 2𝑦 = 4.
A possible approach to this question is by making 𝑥 the subject of the first equation, and subsequently
substituting this formula for 𝑥 in the following equation to solve for y. The students need to perform the steps
correctly without getting confused with the signs in order to evaluate the correct values of the two unknown
variables.According to Samo (2008) and Chua et al. (2016), algebra uses symbols to generalise mathematics.
These symbols may carry different meanings and interpretations in different situations, and students have
various perceptions about these letters, symbols and signs. Findings from these studies revealed that students
have many misconceptions in the use of symbols in Algebra, and this affected their learning of the topic.
The mathematics curriculum needs to be presented through multiple representations so that teaching is for
mathematical understanding (Cope, 2015). These include physical (concrete), pictorial (static visual) and virtual
(dynamic electronic) representations. Mathematics educators can use such representations or manipulatives in
addition to the symbolic or abstract content to model the mathematics concepts. Cope cited that the first formal
use of manipulatives in mathematics education happened in the late 1800s and that traditionally, mathematics
educators and learners used concrete manipulatives, but many modern day classrooms make use of pictorial and
virtual manipulatives.
This present study concentrated on using pictorial (static visual) representation to replace the usual x and y
symbols to represent the unknowns. A pictorial manipulative, according to Cope (2015), is a stationary model
that helps students visualize mathematical concepts. In the recent years, there have been numerous studies that
experiment with steering away from the normal „chalk and board‟ and symbol-oriented algebraic lessons using
multiple representations. However, teachers need to be careful when choosing representatives; minimise the use
of manipulatives that are common to the students outside school, such as toys to not make the students think of
the activity as simple play (McNeil and Jarvin, 2007). McNeil and Jarvin also proposed that teachers take time
to build the connection between the informal and formal understandings. Furthermore, students‟ preference of
representations mostly depends on what they were taught in class, so teachers must be alert of the
representations that can assist student learning (Ahmad et al., 2010).
In regards to representing algebra, comments made by teachers in a study conducted by Stylianou (2010)
revealed that they view representation as an additional format, often visual and informal, of mathematics
concepts at hand, which are symbolic notations. They also feel that certain representation, most notably numeric
or symbolic, is more significant to the learning and doing mathematics while graphic and visual representations

Proceeding of the 3rd International Conference on Education, Vol. 3, 2017, pp. 198-204
200
are secondary. The teachers also expressed that having to teach multiple representations to the students would
add burden to their already overloaded curriculum and one teacher went on commenting “If we‟re to go into
such steps for every problem, we would never, ever have time to complete the curriculum” (Stylianou, 2010, p.
337).
There are other studies that favour the use of visual representations. For example, a study carried out by Moyer-
Packenhamet al. (2012) on 19 low-achieving third-grade student. The study revolved around fractions, and was
carried out over the time frame of three weeks. The students were divided into two groups: one group used
Static Pictorial Models (SPM), while the other group used Dynamic Virtual Manipulation (DVM). Both groups
had the same daily objectives. All the students in both groups made significant improvement after the
intervention, with both groups performing equally well on the post-test questions with pictorial representations.
In another study by Suh and Moyer (2007), the use pictorials also showed positive results after their
intervention. In the study that focused on algebraic relationships, the participants: 36 third-grade students were
engaged with different algebraic representations (pictorial, symbolic and word problems). They were
encouraged to use informal strategies to represent their relational thinking. The students were divided into two
groups, placed in two different learning environments. Group One worked with the Virtual Balance Scale
applet, and Group Two worked with a physical manipulative called Hands-On Equations. The students were
required to solve simple linear equations using the two manipulatives. From the post-test, it was analysed that
some students used pictures or drawings to aid them in solving the symbolic parts of the test. So from here it can
be concluded that in some sense, exposing the students with alternative representations other than symbolic
representations can help them in their learning.
Methodology
This study aims to find an alternative teaching approach, which will help enhance low-performing Year 10
students‟ performance. In this study, the students focus on using visual representations, in particular pictorials
(static visual) such as shapes or drawings in place of symbols (to represent the unknown variables) to solve
simultaneous equations. The simultaneous equations involve two equations and two unknown variables of linear
nature.
This study is an action research that employs the use of both quantitative and qualitative methods to collect the
necessary data. Action research is a popular choice because of the freedom that the practitioners have in
controlling their own practices (McNiff and Whitehead, 2010). This study consists of a pre-test at the beginning,
followed by several lessons of intervention where pictorial representations are used and later the students wrote
a post-test.
Sample
The sample for this study is made up of 38 female students from two Year 10 classes, in one of the all-girls
secondary schools in Brunei. The school is located about 40 km from the capital city, Bandar Seri Begawan. The
same Mathematics teacher, who is also the first author, taught both the classes. The students were on the 5-year
secondary level programme, doing normal General Certificate of Education „O‟ Level Mathematics Syllabus
„D‟, as opposed to the International General Certificate of Secondary Education Mathematics. The students do
not have Additional Mathematics background and categorised as low-performing students with low to average
command of mathematical skills.

NurNadhirah Haji Nordin, KhairulAmilin Tengah, MasitahShahrill, Abby Tan and Elvynna Leong/ Using Visual Representations as an Alternative in Teaching Simultaneous Equations
201
Instruments
The testing instrument used to measure the difference in students‟ performance was a set of six simultaneous
equation questions administered to the students as both the pre-test and the post-test. The questions, each
carrying three marks, are of symbolic nature, using the symbols x and y which the students are familiar with.
The maximum mark possible for both the pre-test and post-test is 18 marks.
Prior to the intervention, while marking the pre-test papers, it appeared that majority of the students were
struggling with solving algebraic equations of one variable. Possessing such skill is very important in solving
simultaneous equations and thus, one 22-item worksheet on balancing algebraic equations was prepared. There
were 10 pictorial questions and the remaining questions are of symbolic nature and a total of two periods were
allocated to strengthen the students‟ foundation before moving further into the intervention. The worksheet is
adapted from the pictorial section of an activity sheet from Suh and Moyer (2007). In their research, virtual and
physical algebraic balances were used to develop third-grade students‟ representational fluency.
During the intervention, two sets of worksheets were used where the symbolic representation is replaced. Each
worksheet consists of simultaneous equations questions of pictorial nature. The worksheets were prepared such
that that the students are supposed to find the price of food items (burgers, fries and cheese slices) or the number
of sweets in different gift boxes (round and square boxes). The testing instrument was tested for reliability in
SPSS Version 21, returning a result of Cronbach Alpha α = 0.765. The test papers and worksheets were tested
for validity with two experienced mathematics teachers in the school, which included the Head of the
Mathematics department of the school. Throughout the intervention, a video recorder was used.
Data Collection
The data collection for the research started with a pre-test, administered to all 38 students in the sample. The
students were given 20 minutes to complete the test individually. The pre-test papers were then marked and kept
for future uses. It is clear that students were still struggling with solving algebraic equations of one variable. For
example in the first question of the pre-test, the students were given the set of equations 2𝑦 = 6 and 𝑦 + 3𝑥 =
9. A common mistake done by the students was manipulating the first equation to give them 𝑦 = 6 − 4, and the
second equation to give them 𝑦 + 𝑥 =9
3. This shows that majority of the students were unable to fully grasp the
concept of solving algebraic equations using the change of operations method. The students are used to thinking
that they need to move the terms around, not knowing that the concept behind the move is actually balancing
both sides of the equation. Since being able to solve such questions is vital in any algebraic topic, a worksheet
on using balancing to solve such algebraic questions was then prepared. This was done over two periods (50
minutes): first introduced was an equation as a balance and asking the students what would happen if one „item‟
is taken from one side of the balance but not from the other side. The students were further questioned of how
they were to prevent the balance from collapsing if they take certain „item‟ from one side of the balance or add a
certain „item‟ to one side of the balance.
The intervention followed after, and stretched over the time period of two weeks. The intervention, running
along lesson plans prepared by the first author was divided into two parts: the pictorial part and the symbolic
part. The two worksheets were used in both parts. In the first part, the students solved together with the teacher
who is also the first author, the simultaneous equations by using pictorials. This means that they drew out
whatever pictorials that were given in the equations. In particular, drawings of burgers, fries, cheese slices, gift
boxes and sweets were used as these are not gender-biased and generally all the students can relate to these
items. After the two worksheets were worked through, the students were provided with fresh worksheets and
together with the teacher they translated their working from the pictorial part to x and y. This is the symbolic
part of the intervention. The pictorial part took a significantly longer time as drawing the pictorials take time.

Proceeding of the 3rd International Conference on Education, Vol. 3, 2017, pp. 198-204
202
For both worksheets, the students were given some time to approach the questions and later the teacher
discussed the solutions. At the end of the intervention, the students sat for a post-test and were given 20 minutes
to do so. The post-test was then marked analysed.
Data Analysis
Both the pre-test and post-test were marked such that the students can score two marks for getting one correct
answer (either 𝑥 or 𝑦) with supporting working or both correct answers without working. The remaining one
mark is awarded for employing the correct method (substitution) to solve the question. The pre-test and post-test
scores were keyed in to SPSS Version 21 software. A paired samples t-test with significance level 95% is
appropriate, as this research wants to find if there is a significant difference between the pre-test and post-test
scores of the sample. In order for a paired samples t-test to be used, four assumptions are to be met (Lund and
Lund, 2013):
1. the dependent variable is continuous;
2. the independent variable consists of two categorical groups and the same subjects are present in the
same group (“related” group);
3. there should be no significant outliers in the differences between the two groups; and
4. the distribution of the differences of the dependent variable in the two related groups are
approximately normally distributed.
If any of these assumptions are not met, the alternative for a paired samples t-test, which is the nonparametric
Wilcoxon Signed-Rank test will then be used.
Results
The data for the research question „How does using visual representation, in particular static pictorial in solving
simultaneous equations affect students‟ performance on the topic?‟ was collected by using means of pre-test and
post-test. The same test paper was used as both the pre-test and post-test and the maximum possible mark is 18
marks.
Table 1Descriptive statistics of pre-test and post-test scores
Range Minimum Maximum Mean(M) Std. Deviation(SD)
Pre-test Score 16.00 0.00 16.00 3.6053 4.01039
Post-test Score 16.00 0.00 16.00 7.6053 5.28404
From Table 1, it is clear that students‟ performance improve after intervention. Notably, the number of failures
also decreases. However, four students did not improve after intervention. The scores of three students remained
stagnant. The descriptive statistics for the difference are presented in Table 2 below. The range is between -4 to
14 out of 18 marks, and on average each student improved by 4.00 marks as shown by the mean M.
Table 2Descriptive statistics for the difference between pre-test and post-test scores
Range Minimum Maximum Mean (M) Std. Deviation (SD)
Post-test – Pre-test Score 18.00 -4.00 14.00 4.0000 4.55002
However, the fourth assumption is not met for the paired t-test. When a normality test was run to the difference
between the pre-test and post-test, the significance of the test is less than 0.05, indicating that the difference
between the two tests deviates away from the normal distribution (Table 3).
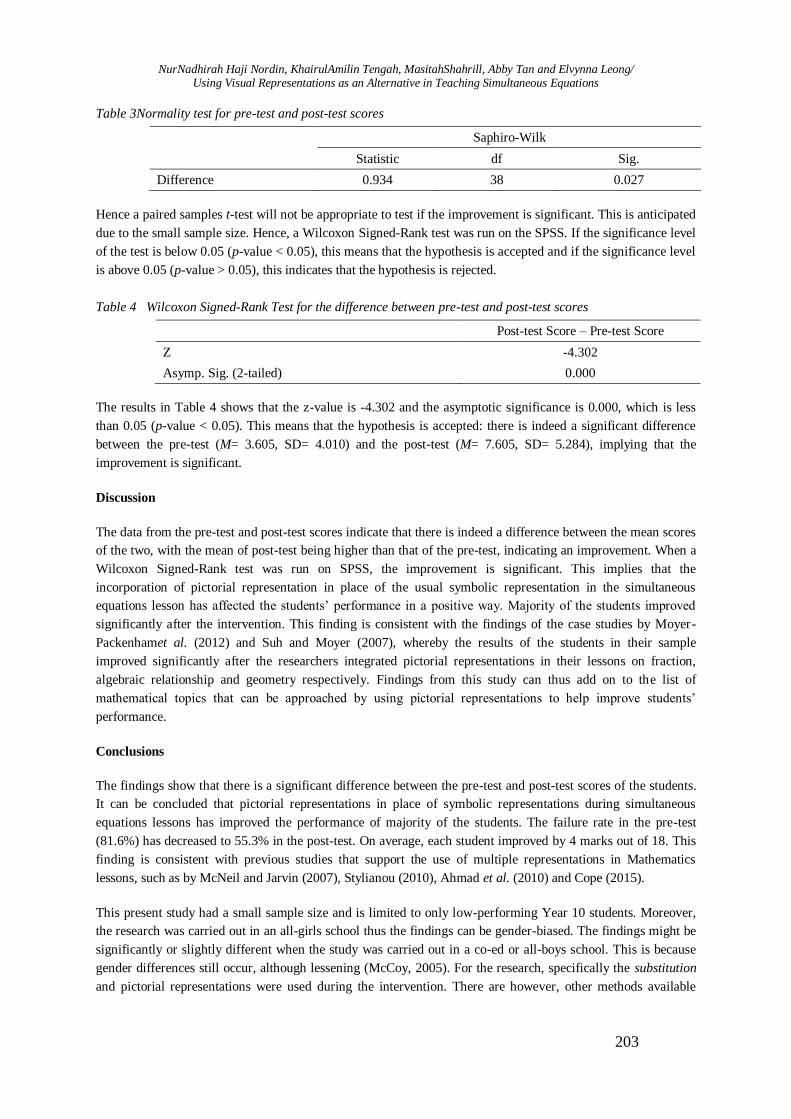
NurNadhirah Haji Nordin, KhairulAmilin Tengah, MasitahShahrill, Abby Tan and Elvynna Leong/ Using Visual Representations as an Alternative in Teaching Simultaneous Equations
203
Table 3Normality test for pre-test and post-test scores
Saphiro-Wilk
Statistic df Sig.
Difference 0.934 38 0.027
Hence a paired samples t-test will not be appropriate to test if the improvement is significant. This is anticipated
due to the small sample size. Hence, a Wilcoxon Signed-Rank test was run on the SPSS. If the significance level
of the test is below 0.05 (p-value < 0.05), this means that the hypothesis is accepted and if the significance level
is above 0.05 (p-value > 0.05), this indicates that the hypothesis is rejected.
Table 4 Wilcoxon Signed-Rank Test for the difference between pre-test and post-test scores
Post-test Score – Pre-test Score
Z -4.302
Asymp. Sig. (2-tailed) 0.000
The results in Table 4 shows that the z-value is -4.302 and the asymptotic significance is 0.000, which is less
than 0.05 (p-value < 0.05). This means that the hypothesis is accepted: there is indeed a significant difference
between the pre-test (M= 3.605, SD= 4.010) and the post-test (M= 7.605, SD= 5.284), implying that the
improvement is significant.
Discussion
The data from the pre-test and post-test scores indicate that there is indeed a difference between the mean scores
of the two, with the mean of post-test being higher than that of the pre-test, indicating an improvement. When a
Wilcoxon Signed-Rank test was run on SPSS, the improvement is significant. This implies that the
incorporation of pictorial representation in place of the usual symbolic representation in the simultaneous
equations lesson has affected the students‟ performance in a positive way. Majority of the students improved
significantly after the intervention. This finding is consistent with the findings of the case studies by Moyer-
Packenhamet al. (2012) and Suh and Moyer (2007), whereby the results of the students in their sample
improved significantly after the researchers integrated pictorial representations in their lessons on fraction,
algebraic relationship and geometry respectively. Findings from this study can thus add on to the list of
mathematical topics that can be approached by using pictorial representations to help improve students‟
performance.
Conclusions
The findings show that there is a significant difference between the pre-test and post-test scores of the students.
It can be concluded that pictorial representations in place of symbolic representations during simultaneous
equations lessons has improved the performance of majority of the students. The failure rate in the pre-test
(81.6%) has decreased to 55.3% in the post-test. On average, each student improved by 4 marks out of 18. This
finding is consistent with previous studies that support the use of multiple representations in Mathematics
lessons, such as by McNeil and Jarvin (2007), Stylianou (2010), Ahmad et al. (2010) and Cope (2015).
This present study had a small sample size and is limited to only low-performing Year 10 students. Moreover,
the research was carried out in an all-girls school thus the findings can be gender-biased. The findings might be
significantly or slightly different when the study was carried out in a co-ed or all-boys school. This is because
gender differences still occur, although lessening (McCoy, 2005). For the research, specifically the substitution
and pictorial representations were used during the intervention. There are however, other methods available
Proceeding of the 3rd International Conference on Education, Vol. 3, 2017, pp. 198-204
204
such as elimination, andseveral other types of representations, such as virtual and concrete representations that
are available and can be used during the intervention.
References
Ahmad, A., Ahmad Tarmizi, R., andNawawi, M., 2010, Visual representations in mathematical word problem
solving among form four students in Malacca. Procedia Social and Behavioral Sciences, 8, 356-361.
Cai, J., Lew, H. C., Morris, A., Moyer, J. C., Ng, S. F., andSchmittau, J., 2005, The development of student‟s
algebraic thinking in earlier grades: a cross-cultural comparative perspective.ZentralblattFürDidaktik Der
Mathematik, 37(1), 5-15.
Chong, M. S. F., and Shahrill, M., 2016, The use of an emerging framework to explore students‟ cognitive
competency. Indian Journal of Science and Technology, 9(16). doi:10.17485/ijst/2016/v9i16/78812.
Chua, G. L. L., Shahrill, M., and Tan, A., 2016, Common misconceptions of algebraic problems: identifying trends and proposing possible remedial measures. Advanced Science Letters, 22(5/6), 1547-1550.
Cope, L., 2015, Math manipulatives: making the abstract tangible. Delta Journal of Education, 5(1), 10-19.
Devlin, K., 2011,What is Algebra? Date of access: 21/10/2016. https://profkeithdevlin.org/2011/11/20/what-is-
algebra/
Finti, H. N. F. M. M., Shahrill, M., and Salleh, S. M., 2016, Integrating virtual manipulative with the use of iPad
in the teaching and learning of fractions. Knowledge Management & E-Learning, 8(4), 581-601.
Huda, M., Hehsan, A., Jasmi, K. A., Mustari, M. I., Shahrill, M., Basiron, B., and Gassama, S. K., 2017,
Empowering children with adaptive technology skills: careful engagement in the digital information age.
International Electronic Journal of Elementary Education, 9(3) 693-708.
Kilpatrick, J., Swafford, J., andFindell, B., 2001, Adding it up: helping children learn mathematics
(Washington, DC: National Academy Press).
Lund, A. and Lund, M., 2013, Dependent t-test using SPSS Statistics. Date of access 21/08/2016. https://statistics.laerd.com/spss-tutorials/dependent-t-test-using-spss-statistics.php
McCoy, L., 2005, Effect of demographic and personal variables on achievement in eighth-grade algebra. The
Journal of Educational Research, 98, 131-135.
McNeil, N., and Jarvin, L., 2007, When theories don‟t add up: disentangling the manipulatives debate. Theory
into Practice, 46(4), 309-316.
McNiff, J., and Whitehead, J., 2010,You and Your Action Research Project (3rd ed.) (Abingdon: Routledge).
Moyer-Packenham, P., Ulmer, L., and Anderson, K., 2012, Examining pictorial models and virtual
manipulatives for third-grade fraction instruction. Journal of Interactive Online Learning, 11(3), 103-113.
Mundia, L., 2010, Problems in learning mathematics: comparison of Brunei junior high school students in
classes with and without repeaters. Journal of Mathematics Research, 2, 150-160.
Samo, M., 2008, Students‟ perceptions about the symbols, letters and signs in algebra and how do these affect their learning of algebra: A case study in a government girls secondary school, Karachi, Pakistan. The Aga
Khan University, Karachi, Pakistan: M.Ed dissertation.
Stylianou, D. A., 2010, Teachers‟ conceptions of representation in middle school mathematics. Journal of
Mathematics Teacher Education, 13(4), 325-343.
Suh, J., and Moyer, P., 2007, Developing students‟ representational fluency using virtual and physical algebra
balances. Journal of Computers in Mathematics and Science Teaching, 26(2), 155-173.
Yahya, N., andShahrill, M., 2015,The strategies used in solving algebra by secondary school repeating students.
Procedia- Social and Behavorial Sciences, 186, 1192-1200.
Yunus, D. H. R. P. H., Shahrill, M., Abdullah, N. A., and Tan, A., 2016, Teaching by telling: Investigating the
teaching and learning of solving simultaneous linear equations. Advanced Science Letters, 22(5/6), 1551-1555.
Proceeding of the 3rd International Conference on Education, Vol. 3, 2017, pp.205-213 Copyright © 2017 TIIKM ISSN 2424 - 6700 online DOI: https://doi.org/10.17501/icedu.2017.3122
3rd International Conference on Education, 20-22 April 2017, Kuala Lumpur, Malaysia
ANALYSING STUDENTS’ PERSPECTIVES ON
GEOMETRY LEARNING FROM THE COMBINATION
OF VAN HIELE PHASE-BASED INSTRUCTIONS AND
GEOGEBRA
Georgina Ling Ling Chua1, Khairul Amilin Tengah
2, Masitah Shahrill
3, Abby Tan
4
and Elvynna Leong5
1Berakas Secondary School, Ministry of Education,Brunei 2, 3 Sultan HassanalBolkiah Institute of Education, Universiti Brunei Darussalam, Brunei
4,5Faculty of Science, Universiti Brunei Darussalam, Brunei
Abstract: Geometry has always been regarded as one of the most important area in Mathematics.
The van Hiele model is one of the renowned theories focusing on the teaching and learning of
geometry. While GeoGebra is a free, open-source dynamic geometry software developed to assist
the teaching and learning of Mathematics in general. This study investigated the effectiveness of van
Hiele phases with GeoGebra in geometric transformations, particularly for the topic of rotation in
geometry. Some of the Year 11 students who participated in this study were interviewed. The focus
of the interview was directed at exploring the students‟ views on van Hiele phase-based learning, the
use of GeoGebra and the thought processes on the topic. The development of the interview analyses
yielded two emerging themes namely, the impact of van Hiele phases and the impact of GeoGebra as
an instructional tool. Although the combination was mainly perceived as positive, there were also
reluctance in accepting due to the readjustment needs of the concepts and applications of the tool
itself.
Keywords: Geometry, Van HieleModel, Geogebra, Students‟ Perceptions
Introduction
The van Hiele theory derived from two Dutch educators, Dina and Pierre van Hiele, with the intention to explain
and identify students‟ difficulties in geometry (Mason, 2009). They introduced the existence of levels and a
teaching structure based on the five van Hiele phases. Alex and Mammen (2012) stated that determining
students‟ performance in geometry was beneficial through the use of van Hiele theory as it could pin down the
aspects that attributes to these difficulties. The van Hiele phases also provide an easier alternative for students to
grasp the abstract nature of geometry. The van Hiele theory is currently the best model used to define students‟
level of thinking in geometry (Battista, 2002). It is a framework used to identify students‟ geometric levels as
well as to provide instructions to help students‟ progress from one level to the next (Fuyset al., 1988).
Abdullah and Zakaria (2011) mentioned that activities following van Hiele‟s approach of learning were more
structured and coordinated. The van Hiele phases form a system of instruction, which starts with the teacher
driving the lessons through investigation of simple examples, and gradually progressing towards problem-
solving activities that demand student initiative, thereby, indicating that each van Hiele phase serves a different
and significant purpose (Serow, 2007). Many studies globally, for example, in Hong Kong (Liu, 2005), India
(Chang and Bhagat, 2015), Malaysia (Abdullah and Zakaria, 2013a) and Turkey (Kutluca, 2013) had shown that
the implementation of van Hiele phase-based learning in classrooms yields positive outcomes in students‟
performance in geometry.
Corresponding Author:Georgina Ling Ling Chua/[email protected]
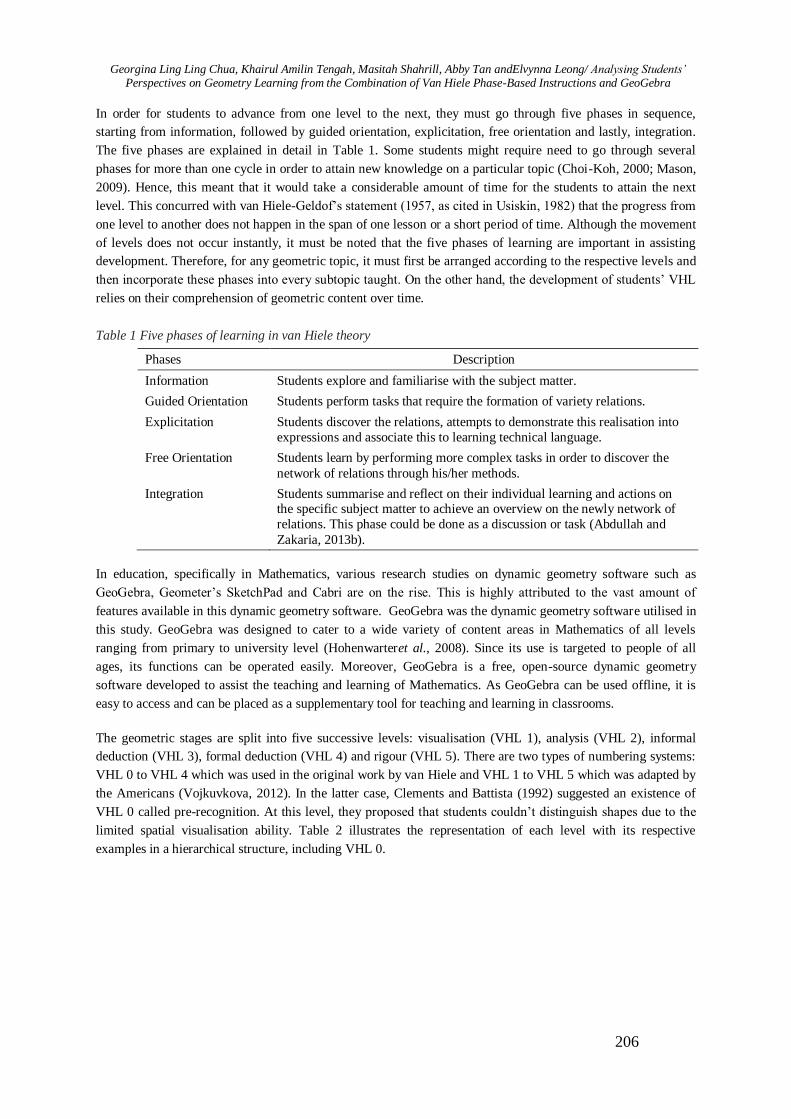
Georgina Ling Ling Chua, Khairul Amilin Tengah, Masitah Shahrill, Abby Tan andElvynna Leong/ Analysing Students’ Perspectives on Geometry Learning from the Combination of Van Hiele Phase-Based Instructions and GeoGebra
206
In order for students to advance from one level to the next, they must go through five phases in sequence,
starting from information, followed by guided orientation, explicitation, free orientation and lastly, integration.
The five phases are explained in detail in Table 1. Some students might require need to go through several
phases for more than one cycle in order to attain new knowledge on a particular topic (Choi-Koh, 2000; Mason,
2009). Hence, this meant that it would take a considerable amount of time for the students to attain the next
level. This concurred with van Hiele-Geldof‟s statement (1957, as cited in Usiskin, 1982) that the progress from
one level to another does not happen in the span of one lesson or a short period of time. Although the movement
of levels does not occur instantly, it must be noted that the five phases of learning are important in assisting
development. Therefore, for any geometric topic, it must first be arranged according to the respective levels and
then incorporate these phases into every subtopic taught. On the other hand, the development of students‟ VHL
relies on their comprehension of geometric content over time.
Table 1 Five phases of learning in van Hiele theory
Phases Description
Information Students explore and familiarise with the subject matter.
Guided Orientation Students perform tasks that require the formation of variety relations.
Explicitation Students discover the relations, attempts to demonstrate this realisation into
expressions and associate this to learning technical language.
Free Orientation Students learn by performing more complex tasks in order to discover the
network of relations through his/her methods.
Integration Students summarise and reflect on their individual learning and actions on the specific subject matter to achieve an overview on the newly network of
relations. This phase could be done as a discussion or task (Abdullah and
Zakaria, 2013b).
In education, specifically in Mathematics, various research studies on dynamic geometry software such as
GeoGebra, Geometer‟s SketchPad and Cabri are on the rise. This is highly attributed to the vast amount of
features available in this dynamic geometry software. GeoGebra was the dynamic geometry software utilised in
this study. GeoGebra was designed to cater to a wide variety of content areas in Mathematics of all levels
ranging from primary to university level (Hohenwarteret al., 2008). Since its use is targeted to people of all
ages, its functions can be operated easily. Moreover, GeoGebra is a free, open-source dynamic geometry
software developed to assist the teaching and learning of Mathematics. As GeoGebra can be used offline, it is
easy to access and can be placed as a supplementary tool for teaching and learning in classrooms.
The geometric stages are split into five successive levels: visualisation (VHL 1), analysis (VHL 2), informal
deduction (VHL 3), formal deduction (VHL 4) and rigour (VHL 5). There are two types of numbering systems:
VHL 0 to VHL 4 which was used in the original work by van Hiele and VHL 1 to VHL 5 which was adapted by
the Americans (Vojkuvkova, 2012). In the latter case, Clements and Battista (1992) suggested an existence of
VHL 0 called pre-recognition. At this level, they proposed that students couldn‟t distinguish shapes due to the
limited spatial visualisation ability. Table 2 illustrates the representation of each level with its respective
examples in a hierarchical structure, including VHL 0.
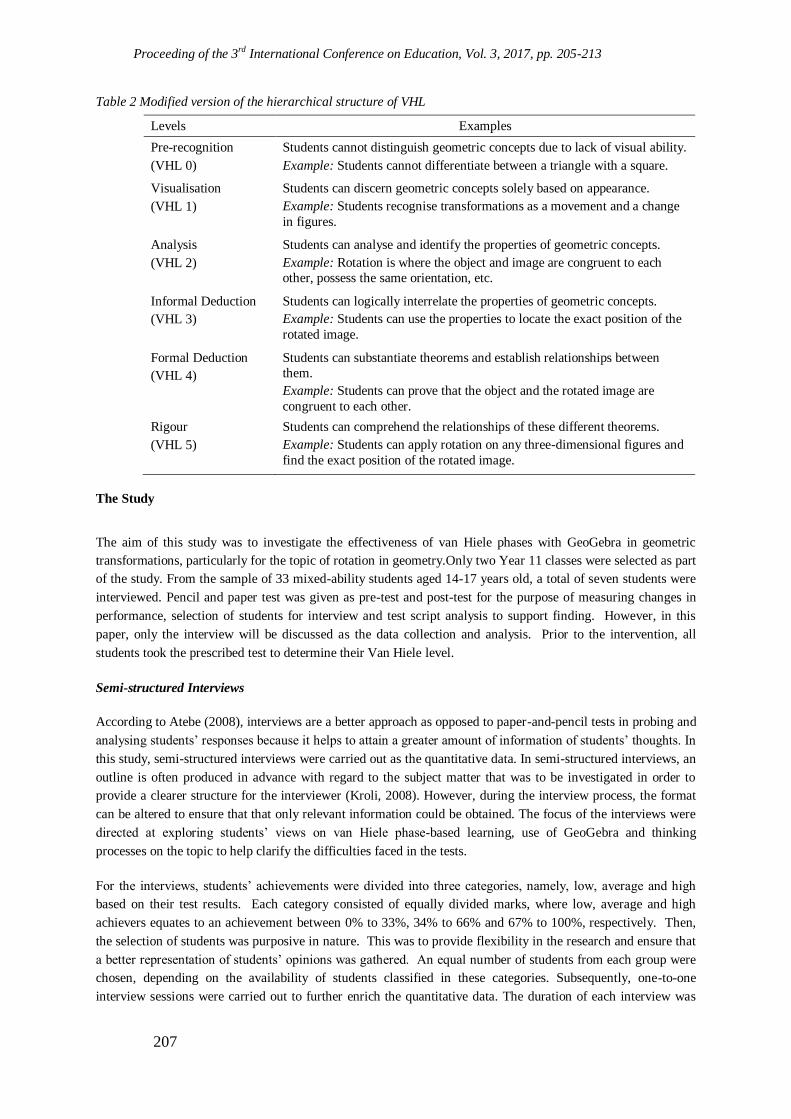
Proceeding of the 3rd International Conference on Education, Vol. 3, 2017, pp. 205-213
207
Table 2 Modified version of the hierarchical structure of VHL
Levels Examples
Pre-recognition
(VHL 0)
Students cannot distinguish geometric concepts due to lack of visual ability.
Example: Students cannot differentiate between a triangle with a square.
Visualisation
(VHL 1)
Students can discern geometric concepts solely based on appearance.
Example: Students recognise transformations as a movement and a change
in figures.
Analysis
(VHL 2)
Students can analyse and identify the properties of geometric concepts.
Example: Rotation is where the object and image are congruent to each
other, possess the same orientation, etc.
Informal Deduction
(VHL 3)
Students can logically interrelate the properties of geometric concepts.
Example: Students can use the properties to locate the exact position of the
rotated image.
Formal Deduction
(VHL 4)
Students can substantiate theorems and establish relationships between
them.
Example: Students can prove that the object and the rotated image are
congruent to each other.
Rigour
(VHL 5)
Students can comprehend the relationships of these different theorems.
Example: Students can apply rotation on any three-dimensional figures and
find the exact position of the rotated image.
The Study
The aim of this study was to investigate the effectiveness of van Hiele phases with GeoGebra in geometric
transformations, particularly for the topic of rotation in geometry.Only two Year 11 classes were selected as part
of the study. From the sample of 33 mixed-ability students aged 14-17 years old, a total of seven students were
interviewed. Pencil and paper test was given as pre-test and post-test for the purpose of measuring changes in
performance, selection of students for interview and test script analysis to support finding. However, in this
paper, only the interview will be discussed as the data collection and analysis. Prior to the intervention, all
students took the prescribed test to determine their Van Hiele level.
Semi-structured Interviews
According to Atebe (2008), interviews are a better approach as opposed to paper-and-pencil tests in probing and
analysing students‟ responses because it helps to attain a greater amount of information of students‟ thoughts. In
this study, semi-structured interviews were carried out as the quantitative data. In semi-structured interviews, an
outline is often produced in advance with regard to the subject matter that was to be investigated in order to
provide a clearer structure for the interviewer (Kroli, 2008). However, during the interview process, the format
can be altered to ensure that that only relevant information could be obtained. The focus of the interviews were
directed at exploring students‟ views on van Hiele phase-based learning, use of GeoGebra and thinking
processes on the topic to help clarify the difficulties faced in the tests.
For the interviews, students‟ achievements were divided into three categories, namely, low, average and high
based on their test results. Each category consisted of equally divided marks, where low, average and high
achievers equates to an achievement between 0% to 33%, 34% to 66% and 67% to 100%, respectively. Then,
the selection of students was purposive in nature. This was to provide flexibility in the research and ensure that
a better representation of students‟ opinions was gathered. An equal number of students from each group were
chosen, depending on the availability of students classified in these categories. Subsequently, one-to-one
interview sessions were carried out to further enrich the quantitative data. The duration of each interview was

Georgina Ling Ling Chua, KhairulAmilin Tengah, MasitahShahrill, Abby Tan andElvynna Leong/ Analysing Students’ Perspectives on Geometry Learning from the Combination of Van Hiele Phase-Based Instructions and GeoGebra
208
approximately 20 to 30 minutes. Efforts were taken to ensure that any external factors such as noise were kept
minimal. Additionally, students were allowed to talk in their mother tongue (Malay language) if they felt more
comfortable. All interviews were audio-recorded and transcribed. The interviews were conducted in a fixed area
to ensure the settings were kept consistent. Additionally, the interviews that were transcribed was analysed by
gathering emerging themes from students‟ responses. The use of interviews supplied a greater depth and
dimension to provide a richer set of data in investigating the effectiveness of van Hiele phases by incorporating
GeoGebra.
Results and Discussions
Prior to the selection of students for interviews, students were grouped into their respective categories (low,
average and high) based on their test achievement. In order to acquire equal representatives and ensure an
optimum amount of information was gathered, three students from each category (high and average) were
chosen. In total, there were seven students involved in the interviews. The profiles of these students are listed in
Table 3. By developing thorough analyses of interviews, two emerging themes were gathered namely, impact of
van Hiele phases and impact of GeoGebra as an instructional tool.
Table 3 Students’ profiles selected for interviews
Student Gender Van Hiele Levels Students achievement
A Male 3 High
B Male 2 High
C Female 2 High
D Female 1 High
E Female 1 Average
F Male 1 Average
G Female 1 Average
Theme 1: Impact of van Hiele Phase
From the interviews, it was gathered that the traditional chalk-and-talk method of teaching had been the main
medium of instruction that were used to teach the topic on rotation. The tools that were commonly used to assist
teachers in teaching the topic were compass and protractor. As a result of chalk-and-talk teaching approach,
some students experienced difficulties in learning the topic. One of the main difficulties was the lack of
comprehension of the topic, which was strongly associated with the delivery of the content. To further intensify
the problem, students expressed that teachers constantly focused on relaying the content through direct
instruction without paying close attention to the needs of the students. Teaching by dictating and question-
answer techniques inhibits the development of students thinking skills (Erdogan et al., 2009).
According to the van Hiele theory, students of lower levels cannot comprehend the learning materials taught at a
higher level of knowledge. From this, competency in language is the foundation in comprehending this
knowledge. Lack of language competence is commonly known as the barrier that obstructs students‟ abilities in
performing well. Setati (2008) stated that the language used is pivotal for learning and thinking and
communicating mathematically is a key to teaching and learning mathematics in school. Majority of the students
expressed that they were able to comprehend the language used in the classroom as the teacher progress from
one lesson to next. However, a significant problem was detected for those students that were not able to the
make sense of the language used, that is, lack of proficiency in the English language. Thus, this meant that the
mathematical terms that were used in the lessons, for example, the concept of „congruent‟ and „similarity‟ was
difficult to grasp.
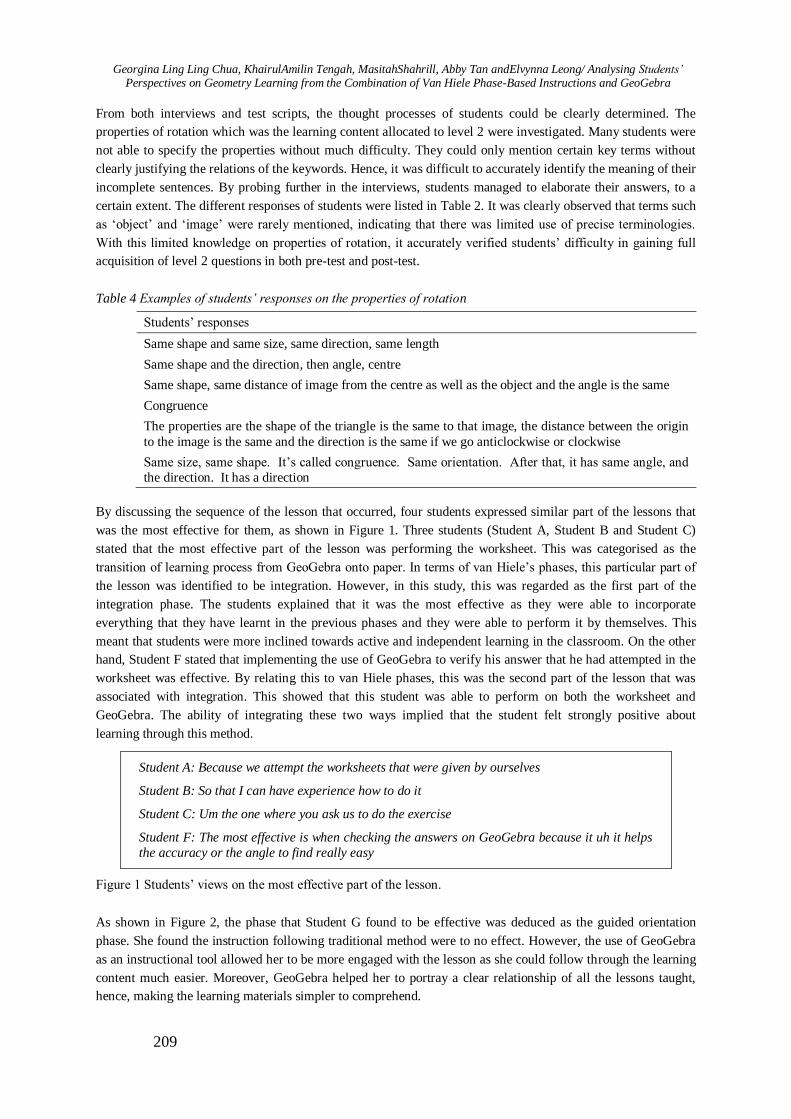
Georgina Ling Ling Chua, KhairulAmilin Tengah, MasitahShahrill, Abby Tan andElvynna Leong/ Analysing Students’ Perspectives on Geometry Learning from the Combination of Van Hiele Phase-Based Instructions and GeoGebra
209
From both interviews and test scripts, the thought processes of students could be clearly determined. The
properties of rotation which was the learning content allocated to level 2 were investigated. Many students were
not able to specify the properties without much difficulty. They could only mention certain key terms without
clearly justifying the relations of the keywords. Hence, it was difficult to accurately identify the meaning of their
incomplete sentences. By probing further in the interviews, students managed to elaborate their answers, to a
certain extent. The different responses of students were listed in Table 2. It was clearly observed that terms such
as „object‟ and „image‟ were rarely mentioned, indicating that there was limited use of precise terminologies.
With this limited knowledge on properties of rotation, it accurately verified students‟ difficulty in gaining full
acquisition of level 2 questions in both pre-test and post-test.
Table 4 Examples of students’ responses on the properties of rotation
Students‟ responses
Same shape and same size, same direction, same length
Same shape and the direction, then angle, centre
Same shape, same distance of image from the centre as well as the object and the angle is the same
Congruence
The properties are the shape of the triangle is the same to that image, the distance between the origin
to the image is the same and the direction is the same if we go anticlockwise or clockwise
Same size, same shape. It‟s called congruence. Same orientation. After that, it has same angle, and
the direction. It has a direction
By discussing the sequence of the lesson that occurred, four students expressed similar part of the lessons that
was the most effective for them, as shown in Figure 1. Three students (Student A, Student B and Student C)
stated that the most effective part of the lesson was performing the worksheet. This was categorised as the
transition of learning process from GeoGebra onto paper. In terms of van Hiele‟s phases, this particular part of
the lesson was identified to be integration. However, in this study, this was regarded as the first part of the
integration phase. The students explained that it was the most effective as they were able to incorporate
everything that they have learnt in the previous phases and they were able to perform it by themselves. This
meant that students were more inclined towards active and independent learning in the classroom. On the other
hand, Student F stated that implementing the use of GeoGebra to verify his answer that he had attempted in the
worksheet was effective. By relating this to van Hiele phases, this was the second part of the lesson that was
associated with integration. This showed that this student was able to perform on both the worksheet and
GeoGebra. The ability of integrating these two ways implied that the student felt strongly positive about
learning through this method.
Student A: Because we attempt the worksheets that were given by ourselves
Student B: So that I can have experience how to do it
Student C: Um the one where you ask us to do the exercise
Student F: The most effective is when checking the answers on GeoGebra because it uh it helps
the accuracy or the angle to find really easy
Figure 1 Students‟ views on the most effective part of the lesson.
As shown in Figure 2, the phase that Student G found to be effective was deduced as the guided orientation
phase. She found the instruction following traditional method were to no effect. However, the use of GeoGebra
as an instructional tool allowed her to be more engaged with the lesson as she could follow through the learning
content much easier. Moreover, GeoGebra helped her to portray a clear relationship of all the lessons taught,
hence, making the learning materials simpler to comprehend.

Proceeding of the 3rd International Conference on Education, Vol. 3, 2017, pp. 205-213
210
Student G: You guide
Interviewer: And then why was it effective to you?
Student G: Because easy to understand, more simple
Figure 2 Excerpt indicating Student G‟s preference of van Hiele phase.
In the free orientation phase, students were in charge of their own learning within their groups as they could
decide the shape of the object, centre of rotation, angle of rotation and direction among themselves. Most of the
students found that the additional time given to explore with the use of GeoGebra was helpful. It allowed them
to communicate with their peers to discuss their findings. Additionally, Student F stated “Because, I, um if I
draw something, I believe it is a challenge for me so it‟s probably a question to figure out where the position is.”
This denoted that this particular student maximised the time given to challenge himself as well as his group
members by constructing random shapes in GeoGebra. As a result of this, they could learn from each other and
seek help from their peers if they faced any difficulties in using GeoGebra.
However, two students (Student D and Student E) showed similar concerns working in a group especially in the
free orientation phase. Their responses were presented in Figure 3. They expressed that majority of the group
members tend to rely on a single member to perform the tasks that he/she wished, while the others watched. The
rest of the group members did not provide any input to the task. Distribution of tasks was not equally divided
within the group and thus, they did not discuss or share ideas together to predict the outcomes. This meant that
these students did not use this phase to their advantage. In spite of this, it should be noted that GeoGebra creates
a diverse range of opportunities for students to freely explore to allow effective learning. Guven (2012) stated
that learning transformations by incorporating all the necessary components into the students‟ own design
induces an advanced comprehension of transformations.
Student D: Sometimes it’s not because they’re not working
Student E: It’s hard for us because when one tries, the others can’t. So all of us pushed the task
to one another and became lazy
Figure 3 Students‟ concerns on group work.
Theme 2: Impact of GeoGebra as an Instructional Tool
Some students portrayed a positive attitude towards the use of GeoGebra. They perceived that learning the topic
on rotation through GeoGebra as fun. They thoroughly enjoyed the learning environment created by GeoGebra.
Furthermore, they felt that learning through the implementation of GeoGebra in the lessons had greatly
benefitted them in different ways, as elicited by the students in Table 5. These positive responses concurred with
a vast majority of studies (Shadaan and Leong, 2013; Mainali, 2014; Rajagopalet al., 2015), in which students
reacted positively towards learning with GeoGebra. Therefore, the usefulness of GeoGebra was not denied in
this study. It had greatly assisted the development of students‟ competency in answering questions on rotation.
Table 5 Students’ opinions on the advantages of using GeoGebra

Georgina Ling Ling Chua, KhairulAmilin Tengah, MasitahShahrill, Abby Tan andElvynna Leong/ Analysing Students’ Perspectives on Geometry Learning from the Combination of Van Hiele Phase-Based Instructions and GeoGebra
211
Advantages Students‟ opinions
Visual If it‟s in the classroom, what‟s that, the whiteboard, can‟t really see the movement, then if it‟s in the ICT, we know where it turns and using ICT is easy to
see the angle of rotation, like 90 degrees, it‟s very easy.
Accuracy It‟s 100 percent correct though.
Ease of use It‟s help me, easy for me to use to find the angles that I don‟t know.
Effectiveness It shows the answer then easy to understand.
Undoubtedly, one of the most frequent responses was the ability to clearly visualise the materials that were
being studied. The responses for observing dynamic motion of rotation were well received by the students. Both
Student E and Student F were impressed with the visuals and their comments were shown in Figure 4. This
denotes that instilling a solid concept of rotation was possible through the use of GeoGebra. Thereby, the
properties and the relationship of the object and image can be easily observed and simultaneously, the
incorporation of GeoGebra could accelerate the learning process.
Interviewer: Amazed? Why are you amazed?
Student E: Because it’s unique, like it’s a new concept for us so we were surprised (translated
version)
Student F: … I was surprised that it can um uh position in different angles which is hard to find
with normal hands to use
Figure 4 Students‟ opinions on the visuals provided in GeoGebra.
Despite acknowledging certain advantages of GeoGebra, some students remained skeptical towards its use.
They preferred the traditional method of instruction in the classroom rather than supplementing instruction with
GeoGebra. These students were identified to be those who were less technologically oriented. They were not
familiar and felt unconfident in using GeoGebra due to the lack of IT skills. They criticised that the exposure to
GeoGebra caused a sudden change in the method of instruction, which made them feel uncomfortable, as they
had always been used to the traditional method of teaching throughout their education. In other words, they were
resistant to change. Thus, they had difficulty coping in a new learning environment. These students have also
stressed that they were not keen in using GeoGebra nor would they give a second chance in using GeoGebra to
aid them in learning geometry in the future. They would rather perform it on paper for practice, in the same way
as the conduct of examinations.
Connolly (2010) stated that geometric transformations are strongly dependent on visualisation. This indicates
that the incorporation of GeoGebra as a teaching tool in van Hiele phase-based instruction was helpful. The
clear visuals largely contributed to the increase in students‟ ability in comprehending the topic on rotation,
which would not have been possible through the traditional method of teaching. Hence, this meant that
GeoGebra played a significant role in helping to clarify the properties that were not clearly visible on the
whiteboard. This is in accordance with the study conducted by Sahaet al. (2010), in which they stated that
GeoGebra provides a medium of learning through visualisation, which stimulates learning and further
strengthen comprehension. This shows a promising potential of the use of GeoGebra in teaching and learning
geometry in school.
Conclusions
The use of GeoGebra as an instructional tool in a classroom had received both positive and negative feedbacks
from the students. With the sudden implementation of GeoGebra, it was understandable that students perceived
negatively on its use. This was because they need to readjust to the concepts and applications with the use of

Proceeding of the 3rd International Conference on Education, Vol. 3, 2017, pp. 205-213
212
GeoGebra within a short time span. Moreover, the implementation of GeoGebra disrupted the normal flow of
the lessons that the students have been used to. In spite of these negative perceptions, there was an increase in
the students‟ results from their test results. Therefore, it can be said that students‟ responses did not signify the
ineffectiveness of GeoGebra as an instructional tool. Instead, students perceived the learning of rotation via
GeoGebra to be unfavourable. It was believed that visuals had greatly contributed to the increase in students‟
performance. Consequently, this study suggested that the exposure of the dynamic feature of GeoGebra in a
mathematics classroom had significantly helped students with visualisation. Visualisation is a crucial element
necessary to conceptualise the idea of rotation. In other words, the ability to visualise is a stepping-stone to
improving students‟ comprehension in the topic.
According to the students‟ responses gathered from interviews, it had been established that the learning
environment with GeoGebra was not suitable for every student. It is the nature of life that no one type of the
instruction can satisfy all the students‟ varied learning needs (Halat, 2007). To address this issue, alternative
approaches must be continuously explored to accommodate different types of learning. However, it must be
reiterated that visualisation plays a very important role in learning rotation. Therefore, the use of instructional
tools that enhances visualisation must be emphasised in the classroom. As an example, a similar study can be
done using physical manipulatives such as acetate paper. Through the influence of acetate paper in rotation,
majority of the students perceived that it has facilitated their learning and visualisation (Enkí, 2014). The
learning environment provided by hands-on learning such as acetate paper can be less intimidating for those
students who did not favour GeoGebra. Since they are required to perform the activities in their classroom, there
is no need for them to manipulate their ways through the unfamiliar GeoGebra and can be more at ease.
Therefore, this extended research can help to pin point the method that is regarded as the most acceptable by the
students to be implemented in future classrooms.
References
Abdullah, A. H., and Zakaria, E., 2011, Students‟perceptions towards the van Hiele‟s phases of learning geometry using geometer‟s sketchpad software. Australian Journal of Basic and Applied Sciences,5(7), 787-
792.
Abdullah, A. H., and Zakaria, E., 2013a, The effects of van Hiele‟s phases of learning geometry on students‟
degree of acquisition of van Hiele levels. Procedia - Social and Behavioral Sciences, 251-266.
Abdullah, A. H., and Zakaria, E., 2013b, Enhancing students‟ level of geometric thinking through van hiele‟s
phase-based learning. Indian Journal of Science and Technology, 6(5), 4432-4446.
Alex, J., andMammen, K., 2012, A survey of South African grade 10 learners' geometric thinking levels in
terms of the van Hiele theory,Anthropologist, 14(2), 123-129.
Atebe, H. U., 2008, Students‟ van Hiele levels of geometric thought and conception in plane geometry: A
collective case study of Nigeria and South Africa.Unpublished PhD thesis, Rhodes University.
Battista, M., 2002, Learning geometry in a dynamic computer environment. Teaching Children Mathematics,
8(6), 333-339.
Chang, C., andBhagat, K., 2015, Incorporating GeoGebra into geometry learning - A lesson from India. Eurasia
Journal of Mathematics, Science and Technology Education, 11(1), 77-86.
Choi-Koh, S. S., 2000, The activities based on van Hiele model using computer as a tool. Journal of the Korea
Society of Mathematical Education Series D: Research in Mathematical Education, 4(2), 63-77.
Clements, D. H., and Battista, M. T., 1992, Geometry and spatial reasoning. In: Handbook of Research on
Mathematics Teaching and Learning, edited by D. A. Grouws.(New York: Macmillan), pp. 420-462.
Connolly, S., 2010, The impact of van Hiele-based geometry instruction on student understanding. Unpublished
Master thesis, St. John Fisher College. Date of access: 05/06/2016.
http://fisherpub.sjfc.edu/mathcs_etd_masters/97
Enkí, K., 2014, Effects of using manipulatives on seventh grade students‟ achievement in transformation
geometry and orthogonal views of geometric figures. Unpublished Master thesis, Middle East Technical
University. Date of access: 08/06/2016. http://etd.lib.metu.edu.tr/upload/12617286/index.pdf
Georgina Ling Ling Chua, KhairulAmilin Tengah, MasitahShahrill, Abby Tan andElvynna Leong/ Analysing Students’ Perspectives on Geometry Learning from the Combination of Van Hiele Phase-Based Instructions and GeoGebra
213
Erdogan, T., Akkaya, R., andÇelebiAkkaya, S., 2009, The effect of the van Hiele model based instruction on the
creative thinking levels of 6th grade primary school students. Educational Sciences: Theory & Practice, 9(1),
181-194.
Fuys, D., Geddes, D., andTischler, R., 1988,The van Hiele model of thinking in geometry among adolescents.
Reston, VA: National Council of Teachers of Mathematics.
Guven, B., 2012,Using dynamic geometry software to improve eight grade students‟ understanding of
transformation geometry. Australasian Journal of Educational Technology, 28(2), 364-382.
Halat, E., 2007, Reform-based curriculum & acquisition of the levels. Eurasia Journal of Mathematics, Science
& Technology Education, 3(1), 41-49.
Hohenwarter, J., Hohenwarter, M., and Lavicza, Z., 2008, Introducing dynamic mathematics software to
secondary school teachers: the case of GeoGebra. Journal of Computers in Mathematics and Science Teaching,
28(2), 135-146.
Kroli, T., 2008, Focus on Disability: Trends in Research and Application (Hauppage, NY: Nova Science
Publishers).
Kutluca, T., 2013, The effect of geometry instruction with dynamic geometry software; GeoGebra on Van Hiele
geometry understanding levels of students. Educational Research and Reviews,8(17), 1509-1518.
Mainali, B. R., 2014, GeoGebra from students‟ perspectives. GeoGebra International Journal of Romania, 3(1),
31-38.
Mason, M., 2009, The van Hiele levels of geometric understanding. Professional Handbook for Teachers,
Geometry: Explorations and Applications. Date of access:
12/05/2016.http://jwilson.coe.uga.edu/EMAT8990/GEOMETRY/mason,%20marguerite.%20the%20van%20hie
le%20levels%20of%20geometric%20understanding.%202002.pdf
Rajagopal, S. A., Ismail, Z., Ali M., and Sulaiman N., 2015, Attitude of secondary students towards the use of
GeoGebra in learning loci in two dimensions. International Education Studies, 8(13), 27-32.
Saha, R. A., Ayub, A. F. M., and Tarmizi, R. A., 2010,The effects of GeoGebra on mathematics achievement:
enlightening coordinate geometry learning. Procedia Social and Behavioral Sciences, 8(1), 686-693.
Serow, P., 2008, Investigating a phase approach to using technology as a teaching tool. In:Navigating Currents
and Charting Directions, edited by M. Goos, R. Brown, and K. Makar.Paper presented at the Proceedings of the
31st Annual Conference of the Mathematics Education Research Group of Australasia, The University of
Queensland, Brisbane, 28 June – 1 July(Adelaide, Australia: MERGA), pp. 445-452.
Setati, M., 2008, Access to mathematics versus access to the language of power: the struggle in multilingual
mathematics classroom. South African Journal of Education, 28(1), 103-116.
Shadaan, P., and Leong, K. E., 2013, Effectiveness of using GeoGebra on students‟ understanding in learning
circles. The Malaysian Online Journal of Educational Technology, 1(4), 1-11.
Usiskin, Z., 1982,Van Hiele Levels and Achievement in Secondary School Geometry (Chicago: University of
Chicago).
Van Hiele-Geldof, D., 1957,The didactics of geometry in the lowest class of the secondary school. Unpublished
doctoral dissertation, University of Utrecht.
Vojkuvkova, I., 2012, The van Hiele model of geometric thinking. In: WDS'12 Proceedings of Contributed
Papers: Part I – Mathematics and Computer Sciences, edited byJ. Safrankova and J. Pavlu. (Prague:
Matfyzpress), pp. 72-75.

Proceeding of the 3rd International Conference on Education, Vol. 3, 2017, pp. 214-226 Copyright © 2017 TIIKM ISSN 2424 - 6700 online DOI: https://doi.org/10.17501/icedu.2017.3123
221
FACTORS AFFECTING TEACHING ABILITIES,
PRACTICES AND MOTIVATION – EVIDENCES FROM
SENIOR SECONDARY SCHOOLS IN DELHI
Charu Jain1
and Narayan Prasad2
1National Council of Applied Economic Research (NCAER), India 2Indira Gandhi National Open University (IGNOU), India
Abstract: Worldwide research provides ample evidences that teachers play an important role in
learning level of students. Hence, improving the quality of teaching process may be one of the
effective means of raising pupil achievement levels. One might expect that teachers themselves are
committed to improve the quality of education. However, in reality often gaps are observed between
the expectations of the society and the way in which teachers practice their profession. Based on the
survey data collected from senior secondary schools in Delhi, this paper aims to identify gaps in the
importance–satisfaction scale of teaching profession and investigating various obstacles faced by
teachers in adopting efficient teaching practices in schools using factor analysis technique. The
findings reveal four broad dimensions affecting teaching practices: school factors, teaching factors,
external and non-teaching factors. Results suggests that while, government should ensure timely
allocation of funds and support to schools, the schools should be able to utilize these funds in best
possible ways in creating healthy environment, where both students and teachers can reflect higher
motivation to learn, practice and participate. This paper emphasizes that quality teaching is a multi-
dimensional process and therefore all associated elements need to work in collaboration.
Keywords: Factor Analysis Technique, Quality Education, Secondary Education, Teaching Practices
Introduction
Indian secondary education system not only provides a crucial link between primary and higher education but
also provides strong human capital base for the country. Moreover, with successful completion of Sarva Siksha
Abhiyan (SSA), one of the largest program run by government for universalisation of primary education in
India, the demand for secondary education has increased further. Therefore, to reap its full benefits in terms of
private and social returns, there is need to shift focus from mere „Quantity‟ expansion to „Quality‟ improvement.
The worldwide research consistently demonstrates that teachers are important factors in improving learning and
achievement level of students. According to Hanushek (2002), teacher quality is the key to improved schools.
Another study shows that the combined variables of teacher quality and instructional strategies are correlated
with student achievement (Okoye, Momoh, Aigbomian and Okecha, 2008). Torff (2005) purports that lack of
pedagogical skill and knowledge is a bigger threat to teacher quality than are certification issues. Berliner (2005)
describes „quality teachers‟ as those who show evidence of certain qualities of teaching: logical, psychological
and moral acts of teaching in the lives of students.
However, there remains an unresolved debate on difference between „teacher‟s quality‟ and „teaching quality‟.
According to Intercultural Development Research Association (IDRA), teaching quality is a multi-layer
approach that refers not only to the teachers‟ credentials, but also to the perspective that teachers bring to the
classroom, the instructional strategies that they use, and the surrounding organization of the school and
community. Recently, one of the newsletters by Harvard School of Education asserts that the definition of
“quality” teaching needs to be linked to whether specific teaching practices are supporting children‟s learning of
a broad range of social, cognitive, and specific academic skills (Susan H. Landry, 2016).
Correspondence Author: Charu Jain/[email protected]

Charu Jain and Narayan Prasad/Factors Affecting Teaching Abilities, Practices and Motivation – Evidences from
Senior Secondary Schools in Delhi
215
One might expect that teachers themselves are committed in improving the quality of education. It is true that
individual teachers are important contributors to student achievement, but they are not the only contributors. The
quality of teaching in a school depends on more than just individual teacher quality. It depends on other factors
as well such as the amount and quality of instructional resources available, teacher professional development,
staffing, and support from administrators and parents. If schools are not well organized and supportive, it is
possible that even good teachers will not be successful (Raudenbush et al., 1992). Successful teaching depends
on many factors, including the level of instructional resources available, staffing levels, continuing professional
development, and support from administrators and parents (Johnson, 1990).
It is clear from above discussion that that improving the quality of teachers and teaching process may be one of
the effective means of raising overall quality of education in schools. Today, teaching is not just confined to
classrooms learning with restricted curriculums. The definitions of what teachers should know and be able to do
have changed over time with change in society‟s values and students coming from varied backgrounds with
different learning and language needs. The job of teaching students to learn and use new information, develop
and apply skills, and think critically is highly complex and demanding. Teachers need a wide range of
knowledge, skills, abilities, and dispositions to perform these many complex tasks.
However, in reality often gaps are observed between the expectations of the parents or society and the way in
which teachers believe that they should practice their profession. This paper emphasizes that making teaching
most effective is not just one dimensional term as it depends upon number of ways in which other resources
works in combination. It is against this background that the research need arose to examine all those dimensions
that may have direct/ indirect impacts on the quality of teaching. The paper portrayals not only the existing
working environments and teaching practices adopted in senior secondary schools in Delhi, but also brings out
various obstacles faced by teachers in achieving their professional goals. Through this study, an effort has been
made to capture teacher‟s perspective on the overall situation of teaching quality in schools.
The paper is divided into six sections; while the first section provides the introduction, the need to conduct this
study, major objectives of this study and research questions. The second section, describes the research
methodology covering study area, research design, study methods, limitations and significance of the study,
while third section presents the major survey findings including teachers characteristics and working profile.
The fourth section examines various factors that affect the quality of teaching practices in schools. The model
and results constitutes the fifth section, while the last section summarizes the findings of this study.
Purpose and Objectives of the Study
The purpose of this study is to investigate the factors affecting the efficiency of teaching abilities and practices
along with the motivation level of teachers. Specifically, the objectives of this study are:
To study various socio-demographic, educational and teaching characteristics of
respondent teachers in selected senior secondary schools in Delhi.
To examine the existing working environment in schools where teachers practice their
profession.
To identify the factors that are considered to be the most important by teachers in
enhancing their professional growth or motivation level and ranking their satisfaction
level on each of these important indicators to analyze where exactly the mismatch is.
Along with this, the paper also seeks to capture the variations in the importance–
satisfaction parameters by type of school ownership.
To develop a model that could identify various factors affecting the efficiency and
teaching abilities of teachers and restricting them in adopting best teaching practices in
schools.

Proceeding of the 3rd International Conference on Education, Vol. 3, 2017, pp. 214-226
216
Research Questions
The following specific research questions guided the study:
Does working conditions in schools or school resources or infrastructural facilities
affects teaching abilities and if yes, how?
Whether salary, job stability or promotions affects their motivation level of teachers?
Does changes in educational policy or other external interferences plays any role in
improving teaching quality in schools?
Research Methodology
Study Area and Population
The capital city of India, Delhi, formed the study area. Delhi accounts about 0.05 percent of the India's
geographical area and consists 1.38 percent of the nation's population. As per Census 2011, population of Delhi
was 16.75 million, with 97.5 percent of the population living in urban area. With high level of literacy of 86.3
percent in 2011, Delhi has made considerable educational progress over the years with improved access to
educational facilities and high enrolment rates. To meet the objectives, study, undertakes primary survey in 41
sample senior secondary schools including private and government schools registered with the Directorate of
Education. From selected sample schools, the target respondents were selected for the face to face personal
interviews. The target respondents were teachers teaching in lower and senior secondary levels of education
(Class IX-XII).
Sample Size
Generally, there is no definite recommendation for the appropriate sample size and researchers end up with the
sample sizes based on their financial limitations, time or cost availability. However, it is important that besides
these limitations, we should calculate the sample size with acceptable or reasonable precision. The literature
shows that the sample size in most of social science studies is calculated using confidence interval, confidence
level and degree of precision. Generally, the rule is that wider the confidence interval; the more certain
researcher can be that whole population answers would be within that range. We have used the following
methodology for sample size calculation (Daniel, 1999).
n = Z2 P(1 - P)
d2
Where n = sample size; Z = Z statistic for a level of confidence; P = expected prevalence or proportion; and d =
precision or confidence interval expressed as decimal.
Using this method, maximum sample size is selected at 95 percent confidence interval level that satisfies the
assumption of normal approximation. Considering this methodology, 160 teachers are selected for the purpose
of personal interviews. The sample size is justified on the grounds of limited resources available and time
constraints.
Sampling Design
A two-stage stratified systematic random sampling technique is considered for the collection of survey data. At
first stage, sample schools are selected, while in second stage teachers are selected for the interviews. Under
first stage, for selection of sample schools, a well defined sampling frame was required which was taken from
the Directorate of Education in Delhi, consisting of detailed information of more than 2200 registered schools,
of which 43.4 percent of schools are government owned, while remaining 56.6 percent are public recognized
schools. The sampling frame provided detailed information on school Id‟s, school name, enrolments and

Charu Jain and Narayan Prasad/Factors Affecting Teaching Abilities, Practices and Motivation – Evidences from
Senior Secondary Schools in Delhi
217
complete address. The list of schools was distributed across 28 administrative zones and 12 administrative
districts (as per the Census of India 2011), which were re-classified into 4 regions north, south, east and west for
wider coverage. For selection purpose, the total schools were divided into eight stratums based on four regions
and school ownership type i.e. government and private. From each of the eight stratums, four schools (2
government schools and 2 private schools) were covered through systematic random sampling. However, in
case of government schools, it was found that due to shortage of classrooms, the schools were organized in
morning and evening shifts (apart from few co-ed schools), separately for boys and girls in Delhi, where each
shift is considered as separate school. Therefore, we have about 25 government schools and 16 private schools
in our sample, together accounting for 41 sample schools in all.
After schools selection, the second stage was the selection of sample teachers. For this, 5 teachers from each
school were selected randomly for various subjects teaching classes from IX-XII. In case of government
schools, where separate morning and evening shifts operates, 3 female teachers from girl‟s government schools
and 2 male teachers from boy‟s government schools were covered. Although, it was a random process to select
teachers from respective schools but their willingness to participate in this survey was also taken into
consideration, hence no quota was fixed for teacher selection between lower and senior secondary levels. On
whole, 160 teachers were covered in our sample for personal interviews, constituting 80 teachers each by private
and government schools. The survey was conducted during the period Sept-Dec 2013.
Study Method and Data Collection Instrument
The quantitative research approach is adopted for the study. Interviews and questionnaires are the main sources
through which data were gathered. For this, a structured questionnaire was used to elicit information from the
teachers including quantifiable and non-quantifiable variables. Through questionnaire, the information was
captured from sample teachers under five broad sections; teachers characteristics, their educational and socio-
economic background, school resources and infrastructure, teaching practices and aptitude, their opinion on
various issues related to quality of education and self development/ satisfaction levels. To rule out the possibility
of non responses, few extra questionnaires were canvassed.
Data Methods and Techniques
Both open and close ended questions were asked from the respondent teachers. In certain cases, to capture their
perceptions and satisfaction level on various quality issues related to school facilities, teaching practices,
students understanding level, professional development etc, ranking and scaling methods were adopted, the
responses of which have been presented here in the form of percentages or weighted average scores. Data
analysis in this paper has been carried out using both bivariate and multivariate techniques. While, bivariate
analysis includes tabulations and two dimensional plot, multivariate techniques includes factor analysis
technique.
Limitations of the Study
Although efforts have been made to cover all aspects including quantifiable and non quantifiable variables
which are affecting the teachers performance, their motivation level, achievements, abilities and satisfaction,
however, there might be certain other for example psychological or personal factors which are not covered in
this study but may have impacts.
Significance of the Study
The findings in the paper are expected to bring a change in the general mindset that improving the quality of
teaching in schools is not only the responsibility of teachers but of overall system in which number of others
factors works in combination. The study will help in identifying various factors that strongly influences the
performance and motivation level of the teachers. The findings can suggest the ways for enhancing the expertise
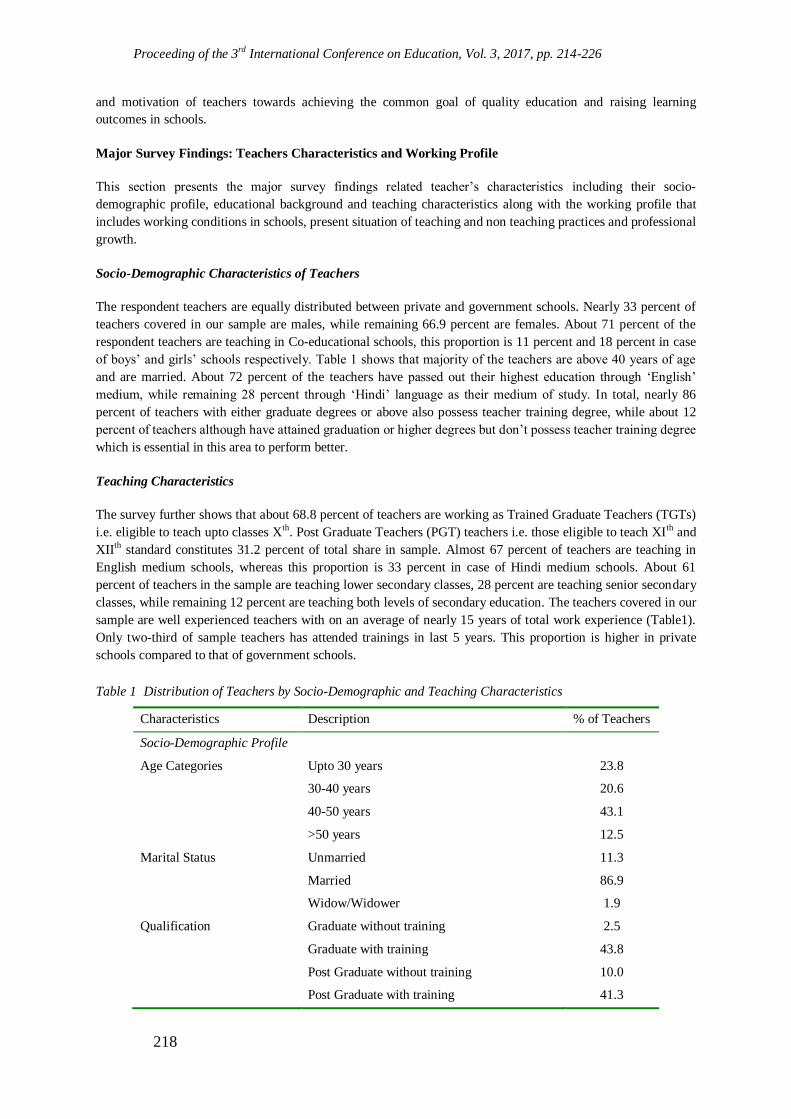
Proceeding of the 3rd International Conference on Education, Vol. 3, 2017, pp. 214-226
218
and motivation of teachers towards achieving the common goal of quality education and raising learning
outcomes in schools.
Major Survey Findings: Teachers Characteristics and Working Profile
This section presents the major survey findings related teacher‟s characteristics including their socio-
demographic profile, educational background and teaching characteristics along with the working profile that
includes working conditions in schools, present situation of teaching and non teaching practices and professional
growth.
Socio-Demographic Characteristics of Teachers
The respondent teachers are equally distributed between private and government schools. Nearly 33 percent of
teachers covered in our sample are males, while remaining 66.9 percent are females. About 71 percent of the
respondent teachers are teaching in Co-educational schools, this proportion is 11 percent and 18 percent in case
of boys‟ and girls‟ schools respectively. Table 1 shows that majority of the teachers are above 40 years of age
and are married. About 72 percent of the teachers have passed out their highest education through „English‟
medium, while remaining 28 percent through „Hindi‟ language as their medium of study. In total, nearly 86
percent of teachers with either graduate degrees or above also possess teacher training degree, while about 12
percent of teachers although have attained graduation or higher degrees but don‟t possess teacher training degree
which is essential in this area to perform better.
Teaching Characteristics
The survey further shows that about 68.8 percent of teachers are working as Trained Graduate Teachers (TGTs)
i.e. eligible to teach upto classes Xth. Post Graduate Teachers (PGT) teachers i.e. those eligible to teach XIth and
XIIth standard constitutes 31.2 percent of total share in sample. Almost 67 percent of teachers are teaching in
English medium schools, whereas this proportion is 33 percent in case of Hindi medium schools. About 61
percent of teachers in the sample are teaching lower secondary classes, 28 percent are teaching senior secondary
classes, while remaining 12 percent are teaching both levels of secondary education. The teachers covered in our
sample are well experienced teachers with on an average of nearly 15 years of total work experience (Table1).
Only two-third of sample teachers has attended trainings in last 5 years. This proportion is higher in private
schools compared to that of government schools.
Table 1 Distribution of Teachers by Socio-Demographic and Teaching Characteristics
Characteristics Description % of Teachers
Socio-Demographic Profile
Age Categories Upto 30 years 23.8
30-40 years 20.6
40-50 years 43.1
>50 years 12.5
Marital Status Unmarried 11.3
Married 86.9
Widow/Widower 1.9
Qualification Graduate without training 2.5
Graduate with training 43.8
Post Graduate without training 10.0
Post Graduate with training 41.3

Charu Jain and Narayan Prasad/Factors Affecting Teaching Abilities, Practices and Motivation – Evidences from
Senior Secondary Schools in Delhi
219
M.Phil/Ph.D with training 2.6
Teaching Characteristics
Designations Trained Graduate Teachers (TGT) 68.8
Post Graduate Teachers (PGT) 31.2
Experience (in yrs) Upto 10 years 35.0
10-20 years 39.4
Above 20 years 25.7
Medium of Instructions English 66.9
Hindi 33.1
Working Conditions in Schools
Despite this fact that most of the senior secondary schools in Delhi provide all necessary facilities to
students/staff due to high completion, there exists a significant difference between government & private
schools. Private schools are ahead of government schools in providing most of the facilities like well equipped
smart classrooms with proper lighting, window panes and ventilation, canteens, electricity supply, school
transport, separate toilets and safe drinking water. The study further suggests that non availability of facilities in
schools in not the issue, the main problem is poor conditions of available facilities, thus pointing towards lack of
proper maintenance and regular servicing of the resources. For e.g. science labs in government schools lack
modern equipments, libraries lack sufficient reading references, water purifiers lacks regular servicing and smart
class technique lacks optimum usage. Lack of sufficient resources leads to low motivation to teach. The
conditions are worst in case of the most basic facilities of food quality in canteens, cleanliness/ lightening and
water supply in toilets and water purifier conditions thus pointing towards serious health implications.
Teaching Practices and Aptitudes
The survey shows that although majority of teachers are teaching the subjects of their specialized area, yet there
is certain proportion of teachers (7 percent) who are even teaching non specialized subjects. This can have a
great impact not only on teaching abilities of such teachers but also on learning and achievement level of
students. In case of teaching aids, more than 90 percent of teachers are using backboards or whiteboards,
followed by equipments that are more or less restricted in science teaching, indicating lacks of sufficient and
modernized teaching aids due to which teachers fails to develop students interest. Even in schools where smart
class techniques are available; its usage is not upto mark due to lack of necessary skills and lack of time due to
pressure of covering up the syllabus. Along with this, the survey also highlights the huge gap in teacher-student
interaction.
Non-Teaching Practices
In addition to teaching responsibilities, teachers are also involved in many other activities related to admissions,
curriculum designing, functioning of school, managerial activities etc which lay an impact on their teaching
capabilities. Among non teaching practices, the most prominent practices are marking papers and organizing
schools activities, as mentioned by almost 86 percent and 77 percent of sample teachers. Nearly 29 percent of
teachers are involved in handling school publications, while 26 percent help in setting examination papers.
Charu Jain and Narayan Prasad/Factors Affecting Teaching Abilities, Practices and Motivation – Evidences from
Senior Secondary Schools in Delhi
2
Professional Growth
Nearly 34 percent of the surveyed teachers have not attended any training since last five years. This proportion
is higher in private schools. Reasons are: lack of opportunities and time, irrelevant to their subjects and doesn‟t
help them in improving their skills. Cost associated with trainings is another issue. Among those who have not
attended the trainings, majority of teachers believes that most of these trainings organized for professional
development of teachers neither provide any linkage between theory and practice, nor do they benefit them in
improving their teaching skills/ learning new technologies.
Factors Affecting Professional Growth: Leading to Inefficient Teaching Practices
This part of the paper is important in the sense that it not only plots two-dimensional importance-satisfaction
scale for indicators considered to be important by teachers for professional growth and higher motivation against
their satisfaction level, but also investigate various factors that restricts the teachers in adopting best efficient
teaching practices in schools.
Importance-Satisfaction Scale
This section plots various factors that respondent teachers consider to be most important for professional growth
and in enhancing their motivation level against their level of satisfaction with these indicators. The responses for
both importance and satisfaction of teachers on pre listed indicators were taken on 5 point likert scale for which
the average scores were calculated and accordingly a priority list was prepared reflecting the highest
important/satisfaction factor followed by next highest and so on. To better present the indicators with their
importance and satisfaction level, a two-dimensional scatter diagram (Importance-Satisfaction Scale) was
plotted. While Y-axis plots indicators on the basis of their importance scaling from high to low, the X-axis plots
satisfaction scale from low to high. Figure 1 & 2 reflects differences in the vision of teachers between private
and government schools on various factors which they consider to be most important for their professional
growth and their satisfaction level.
The figure is further divided into 4 zones; A, B, C and D. Among all zones, zone B is the influential zone which
can be considered as positive strength of schools that motivate teachers to perform better as it offers higher
satisfaction to teachers for the factors that are considered to be the most important. On the other hand, zone A is
the most critical zones restricting the professional growth of teachers because although the indicators falling in
this zone are important for teachers but ranks low on satisfaction.
The findings reveal that in case of Importance-Satisfaction Scale for private schools, the factors that are
considered to be important for teachers professional growth but ranks low on satisfaction scale are job security
and training opportunities to some extent. Best performing indicators are high student motivation, gaining
quality experience and self development opportunities (Figure 1). On the other hand, Importance-Satisfaction
Scale for government schools reveals that among factors which are important for teachers professional
development but scores low on satisfaction scale are lower student motivation and lack of self development
opportunities. Best performing indicators in this case are job security, salary increments, promotion and quality
experience (Figure 2).
Overall, this section highlights the need to understand various factors which demands importance in the
professional life of teachers and how far schools have been able to satisfy teachers on those indicators. There is
need to workmore on issues like job security, salary increments and better training opportunities for teachrers in
private schools, while in case of gvernemtn schools, low students motivation and lower selef development
opportunities are major lacking areas. It is clear from above discussion, that if schools want to improve the
quality of teaching then they must first focus their strategies in enhancing the morale and motivation level of
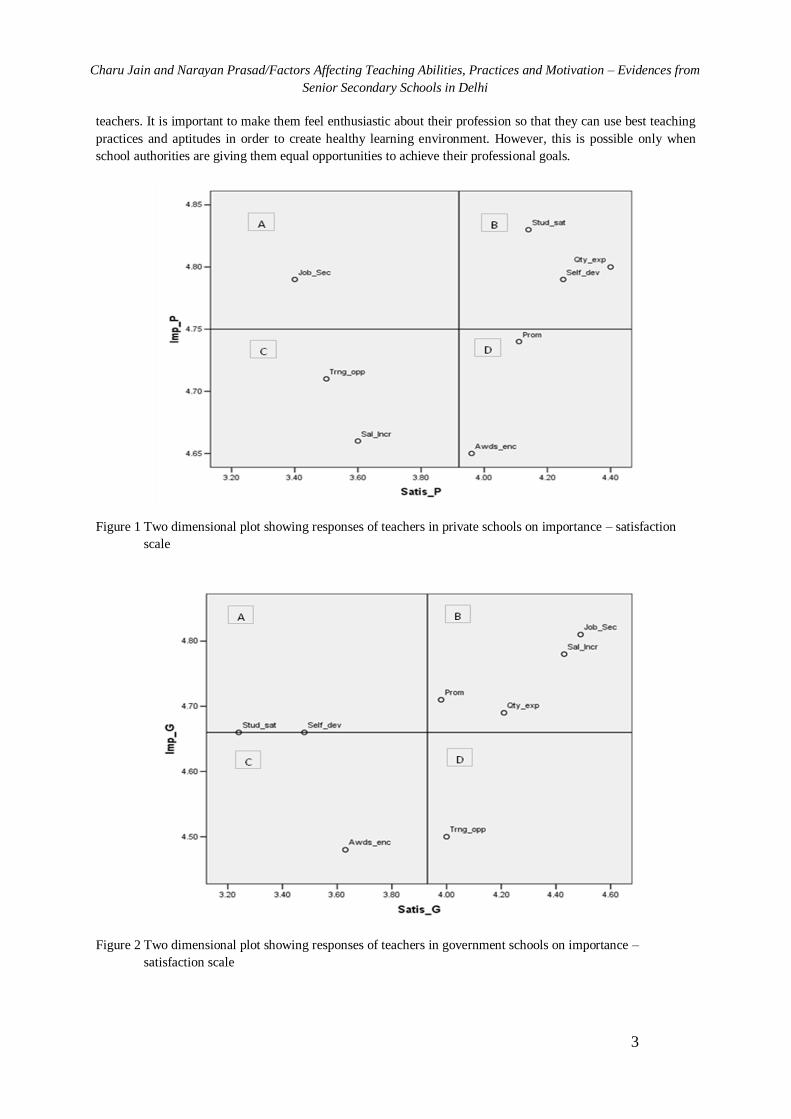
Charu Jain and Narayan Prasad/Factors Affecting Teaching Abilities, Practices and Motivation – Evidences from
Senior Secondary Schools in Delhi
3
teachers. It is important to make them feel enthusiastic about their profession so that they can use best teaching
practices and aptitudes in order to create healthy learning environment. However, this is possible only when
school authorities are giving them equal opportunities to achieve their professional goals.
Figure 1 Two dimensional plot showing responses of teachers in private schools on importance – satisfaction
scale
Figure 2 Two dimensional plot showing responses of teachers in government schools on importance –
satisfaction scale

Proceeding of the 3rd International Conference on Education, Vol. 3, 2017, pp. 214-227
221
Factors Affecting Efficient Teaching Practices
It is generally seen that even competent teachers in schools fails to enhance the quality of teaching and pupil
achievement levels. There are numerous obstacles that frequently challenge these teachers in classrooms, for
example, low wages, precarious social status, poor working conditions, heavy workload, large class sizes, limited
prospects for professional advancement, etc. To understand few such obstacles, responses have been captured
from the teachers on various factors that make overall efforts unsupportive for them and restrict them to adopt
efficient teaching practices. Table 2 presents the descriptive statistics in terms of average scores and standard
deviations on various obstacles faced by teachers. Table shows that larger proportion of teachers has rated lack of
student motivation and large class size as main factors which are affecting their teaching abilities the most. This
is followed by factors like lack of resources and facilities provided by schools, huge work load of additions
duties and responsibilities due to which teachers get less time for their lessons planning.
Table 2 Descriptive Statistics on Various Obstacles in Efficient Teaching Abilities
Factors Mean Std. Dev.
Lack of school resources and facilities 2.76 1.349
Lack of students motivation to learn 2.81 1.256
Large class size 2.80 1.228
Lack of time for planning lessons 2.48 1.165
Lack of adequate teaching material/ aids 2.44 1.227
Lack of professional trainings 2.35 1.255
Interference from Seniors 2.24 1.179
Interference from Parents 2.31 1.193
Polices interferences 2.40 1.275
Huge work load of additional responsibilities 2.54 1.278
Frequent changes in curriculums, structure 2.38 1.170
Others 1.60 1.265
Results and Discussion
Factor Analysis Model
To better understand the affects of above discussed indicators on quality of teaching, factor analysis technique
has been used here. Factor analysis is a technique where each variable is modeled as a linear combination of a
small number of „factors‟ with the addition of a random component term, a little like regression analysis
(Cooper and Weekes, 1983). The factor analysis model takes the following form:
X1 = k11 F1 +………..+ k1m Fm+ u1
X2 = k21 F1 +………..+ k2m Fm+ u2
Where, m denotes the number of factors in the model and m <= number of variables. Unlike regression analysis,
the factors F1, F2,….Fm are hypothetical variables. This method will reload the factors into structures with
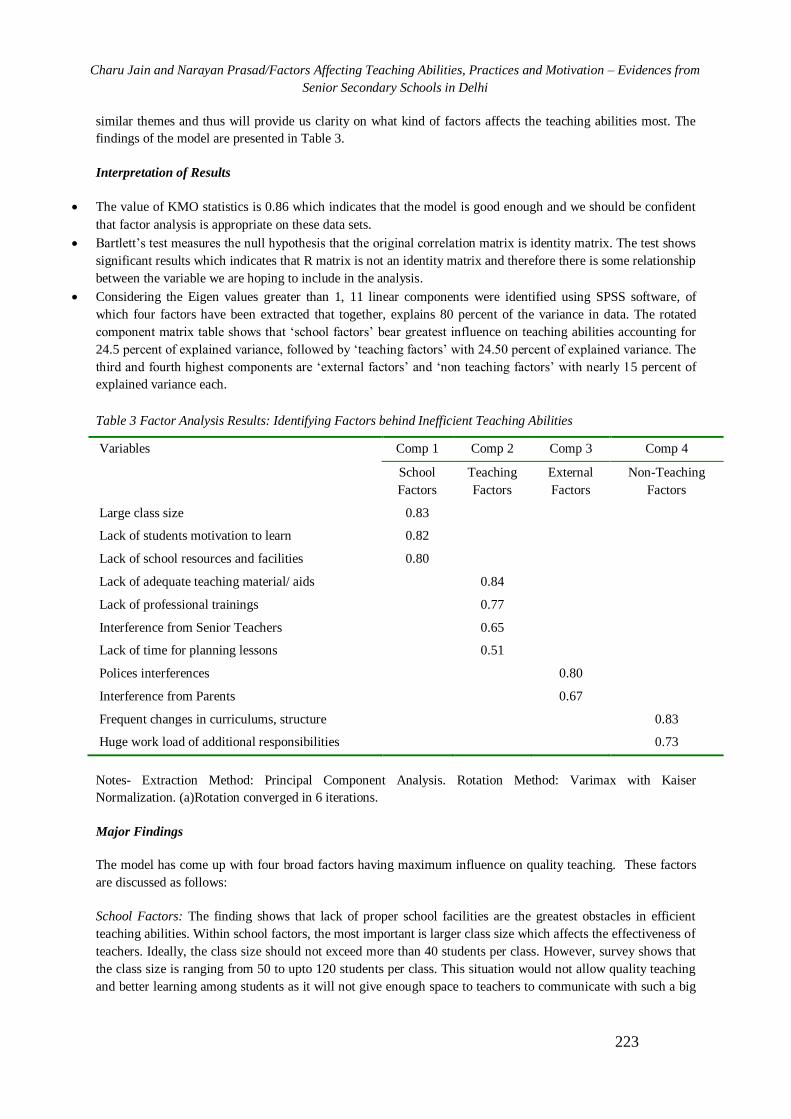
Charu Jain and Narayan Prasad/Factors Affecting Teaching Abilities, Practices and Motivation – Evidences from
Senior Secondary Schools in Delhi
223
similar themes and thus will provide us clarity on what kind of factors affects the teaching abilities most. The
findings of the model are presented in Table 3.
Interpretation of Results
The value of KMO statistics is 0.86 which indicates that the model is good enough and we should be confident
that factor analysis is appropriate on these data sets.
Bartlett‟s test measures the null hypothesis that the original correlation matrix is identity matrix. The test shows
significant results which indicates that R matrix is not an identity matrix and therefore there is some relationship
between the variable we are hoping to include in the analysis.
Considering the Eigen values greater than 1, 11 linear components were identified using SPSS software, of
which four factors have been extracted that together, explains 80 percent of the variance in data. The rotated
component matrix table shows that „school factors‟ bear greatest influence on teaching abilities accounting for
24.5 percent of explained variance, followed by „teaching factors‟ with 24.50 percent of explained variance. The
third and fourth highest components are „external factors‟ and „non teaching factors‟ with nearly 15 percent of
explained variance each.
Table 3 Factor Analysis Results: Identifying Factors behind Inefficient Teaching Abilities
Variables Comp 1 Comp 2 Comp 3 Comp 4
School
Factors
Teaching
Factors
External
Factors
Non-Teaching
Factors
Large class size 0.83
Lack of students motivation to learn 0.82
Lack of school resources and facilities 0.80
Lack of adequate teaching material/ aids 0.84
Lack of professional trainings 0.77
Interference from Senior Teachers 0.65
Lack of time for planning lessons 0.51
Polices interferences 0.80
Interference from Parents 0.67
Frequent changes in curriculums, structure 0.83
Huge work load of additional responsibilities 0.73
Notes- Extraction Method: Principal Component Analysis. Rotation Method: Varimax with Kaiser
Normalization. (a)Rotation converged in 6 iterations.
Major Findings
The model has come up with four broad factors having maximum influence on quality teaching. These factors
are discussed as follows:
School Factors: The finding shows that lack of proper school facilities are the greatest obstacles in efficient
teaching abilities. Within school factors, the most important is larger class size which affects the effectiveness of
teachers. Ideally, the class size should not exceed more than 40 students per class. However, survey shows that
the class size is ranging from 50 to upto 120 students per class. This situation would not allow quality teaching
and better learning among students as it will not give enough space to teachers to communicate with such a big

Proceeding of the 3rd International Conference on Education, Vol. 3, 2017, pp. 214-226
2
strength at a time. Other important variables included in this component are lack of student motivation and lack
of school resources and facilities.
Teaching Factors: This component share same position as school factors do. Within this category, lack of
sufficient teaching aids and professional trainings are the most crucial one. This is largely due to the
government‟s inefficiency in providing sufficient funds to schools for acquiring such equipments or schools
inefficiency in utilizing funds properly. Moreover, lack of personal development opportunities to teachers is also
important factor that inhibits the teaching. In addition, interferences from senior teachers and higher
involvement in non-teaching activities also affect their abilities.
External Factors: Along with school and teaching factors, there are certain external factors which affect the
quality of teaching. The most crucial among all are policy changes. For instance, changes in grading and
examination system which happened recently in Delhi. Then there are policy changes regarding recruitment of
teachers etc. The interference from parents from time to time also restricts teachers to implement best practices
of teaching.
Non Teaching Factors: The finding also captures the implications of non-teaching factors on teaching abilities.
This includes frequent changes in curriculums and burden of additional responsibilities of non-teaching work.
Concluding Remarks
It is evident from the findings that availability of facilities in schools is not a big issue; the biggest challenge is
to have proper functioning and regular maintenance of these facilities. There is need to first focus on improving
the poor conditions of most basic facilities: food in canteens, safe drinking water, sanitation facilities and
classroom conditions since lack of these facilities reduces motivation to teach. Other factors helpful in
enhancing efficient teaching practices in schools are maintaining standard class size, provision of modernized
teaching aids, healthy working environment, opportunities for their professional growth and reduction in
additional work load.
Along with these initiatives, teachers need to change their own behaviors towards improving the learning
processes in classroom. They need to encourage the teacher-students interactions that can lead to higher learning
outcomes. The findings further suggests four broad dimensions; school factors, teaching factors, external factors
and non-teaching factors, the simultaneous improvement in these factors can improve the overall quality of
teaching. While, government should redesign certain policies to ensure timely implementation and delivery of
funds, resources, support and supervision to secondary schools, the schools should try to utilize the allocated
resources in best efficient ways. Finally, there is need to create an environment in schools where students
reflects higher motivation and enthusiasm to learn and participate in various activities.
On whole, paper suggests that quality teaching is a multi-dimensional process where government, schools,
teachers, students and society/parents needs to work in collaboration in order to improve the quality of both
teaching and learning processes in schools.
Acknowledgements
The paper is a part of doctoral thesis awarded in April 2015 from School of Social Sciences (SOSS), Indira
Gandhi National Open University (IGNOU, New Delhi). We are thankful to all teachers and principals of the
selected sample schools in Delhi for providing us the necessary inputs for completing the work. We are thankful
to National Council of Applied Economic Research (NCAER) for providing the funding to participate in
ICEDU 2016 conference and giving us the opportunity to present the major findings of this paper and seeking
suggestions thereof. Last but not the least, the participants at 2nd International Conference on Education
(ICEDU) held at Bangkok, Thailand from 21-22 April 2016 are highly acknowledged for their suggestions and
comments. The views expressed in the paper are those of the authors and do not necessarily reflect the opinion
of the affiliated organizations.

Charu Jain and Narayan Prasad/Factors Affecting Teaching Abilities, Practices and Motivation – Evidences from
Senior Secondary Schools in Delhi
225
References
Ammermueller, A. and Dolton P., 2007, Pupil Teacher Gender Interaction Effects on Scholastic Outcomes in
England and the USA, Centre for European Economic Research (ZEW), Discussion paper no. 06-060.
Angeline Barrett et al., October 2007, Initiatives to Improve the Quality of Teaching and Learning, A review of
recent literature, Background paper prepared for the Global Monitoring Report 2008, UNESCO
2008/ED/EFA/MRT/PI/12.
Aslam, Monazza & Kingdon, Geeta, 2011, What Can Teachers do to Raise Pupil Achievement? Economics of
Education Review, Elsevier, vol. 30(3), pp. 559-574, June.
Bartlett, James E., Kotrlik, Joe W. and Higgins, Chaadwiick C., 2001, Organizational Research: Determining
Appropriate Sample Size in Survey Research, Information Technology, Learning, and Performance Journal,
Vol. 19, No. 1, Spring 2001, pp. 43-50.
Berliner, D.C., 2005. The near impossibility of testing for teacher quality. Journal of Teacher Education, 56 (3),
pp. 205-213.
Best, J.W. and Kahn, J., 1997, Research in Education, New Delhi: Prentice-Hall (7th Ed).
Bridget, Somekh. and Cathy Lewin., 2005, Research Methods in the Social Sciences, Book published by Vistaar
Publications, New Delhi.
Campbell, J., Kyriakides, L., Muijs, D and Robinson, W., 2004, Accessing Teachers Job Effectiveness:
Developing a Differentiated Model, New York; Routledge Falmer.
Case, Anne and Deaton Angus. (Aug 1999). „School Inputs and Educational Outcomes in South Africa‟,
Quarterly Journal of Economics, Vol. 114(3), August, pp. 1047-84.
Cooper, Ron A. and Weekes, Tony J., 1983, Book on Data, Models and Statistical Analysis, published in the
USA by Barnes & Noble Books, New Jersey.
Creswell, J.W., 1998, Qualitative Inquiry and Research Design: Choosing Among Five Traditions, London:
Sage Publication.
Daniel, WW., 1999, Biostatistics: A Foundation for Analysis in the Health Sciences, 7th edition, New York,
John Wiley & Sons.
Dee, T.S., 2007, Teachers and the Gender Gaps in Student Achievement, Journal of Human Resources,
University of Wisconsin Press, Vol. 42(3).
Glewwe, Paul. and Kremer, Michael., 2008, Schools, Teachers, and Education Outcomes in Developing
Countries, in Hanushek, Eric. and Finis, Welch, eds., Handbook of the Economics of Education, Vol. 2.
Amsterdam: North Holland, Chapter 16, pp. 945-1017.
Government of India, 2011, Census of India, Registrar General of India,
Government of NCT of Delhi, 2012-13, Delhi Economic Survey, Planning Department.
Government of NCT of Delhi, 2013, Delhi Statistics Handbook, Directorate of Economics and Statistics.
Hanushek, E.A., Kimko, D.D., 2000, Schooling, Labor-Force Quality, and the Growth of Nations, American
Economic Review, 90(5), pp. 1184-1208.
Hanushek, Erik A., 2002, Teacher Quality, Hoover Press, http://www-
hoover.stanford.edu/publications/books/teacher.html#toc.
Heck, R. H., 2007, Examining the Relationship Between Teacher Quality as an Organizational Property of
Schools and Students‟ Achievement and Growth Rates, Educational Administration Quarterly, 43 (4), pp. 399-
342.
Johnson, S.M., 1990, Teachers at work: Achieving success in our schools, Boston: Basic Books.
Kothari, C.R., 1985, Research Methodology- Methods and Techniques, Wiley Eastern Limited, New Delhi.

Proceeding of the 3rd International Conference on Education, Vol. 3, 2017, pp. 214-226
226
Krejcie, Robert V. and Morgan, Daryle W., 1970, Determining Sample Size for Research Activities,
Educational and Psychological Measurement, 1970, 30, pp. 607-610.
Kremer, Michael. Muraldhiran, Karthik. Chaudhury, Nazmul. Hammer, Jeffrey and Rogers, F. Hasley., 2005,
Teacher Absence in India: A Snapshot, Journal of the European Economic Association.
Kristin Grayson., 2005, Defining Teaching Quality Beyond the Certificate, Teacher Education (2005) 56 (3), pp.
205-213.
http://www.idra.org/IDRA_Newsletter/February_2009_Teaching_Quality/Defining_Teaching_Quality_Beyond
_the_Certificate/#sthash.MPZyIdrR.dpuf.
Lazear, E.A., 2003, Teacher Incentives, Swedish Economic Policy Review, 10(3), pp. 179-214.
Lydiah, L.M. and Nasongo, J.W., 2009, Role of the Head Teacher in Academic Achievement in Secondary
Schools in Vihiga District, Kenya, Current Research Journal of Social Sciences 1(3): pp. 84-92, 2009, ISSN:
2041-3246.
Marlow, C., 1993, Research Methods, Pacific Grove, CA: Brooks/Cole.
Marshall, Catherine. and Rossman, Gretchen B., 2006, Designing Qualitative Research, Thousand Oaks: Sage
Publication, 262 pages (4th edition), Social Science.
Nwachukwu, Prince Ololube., 2006, School Effectiveness and Quality Improvement: Quality Teaching in
Nigerian Secondary Schools, University of Helsinki, Helsinki.
Ogunmade, Taiwo Oludare., Oct 2005, The Status and Quality of Secondary Science Teaching and Learning in
Lagos State Nigeria, Research Thesis work submitted at Education and Social Science, Edith Cowan University,
Perth, Western Australia.
Okoye, N.S., and S.O. Momoh, D.O. Aigbomian, R.E. Okecha., 2008, Teachers‟ Quality, Instructional
Strategies and Students‟ Performance in Secondary School Science, Journal of Instructional Psychology, 34 (4),
pp. 204-211.
Perry, P., 1994, Defining and Measuring the Quality of Teaching, In Green, D (Ed), What is Quality in Higher
Education? Bristol: SRHE and Open University Press.
Raudenbush, S.W., Rowan, B., and Cheong, Y.F., 1992, Contextual effects on the self-perceived efficacy of
high school teachers, Sociology of Education, 65, April, pp. 150–167.
Rivkin, S.G., Hanushek, E.A., and Kain, J.F., 2005, Teachers, Schools and Academic Achievement,
Econometrica, 73(2), pp. 417-458.
Ross, Kenneth N., 2005, Quantitative Research Methods in Educational Planning, UNESCO International
Institute for Educational Planning.
Summers, A. and Wolfe, B., 1977, Do Schools Make a Difference? American Economic Review, 67, pp. 639-
652.
Sungoh, S M., 2010, Quality Issues in Teacher Education, University News, 43(18), 2-8 May.
Susan H. Landry., 2016, Definition of “quality” teaching, Newsletter published by Harvard Graduate School of
Education, Harvard Education Publishing Group, http://hepg.org/hel-home/susan-h-landry-on-the-definition-of-
quality%E2%80%9D-teach.
Taylor, S. J. and Bogdan, R., 1998, In-depth interviewing, In S J Taylor & R Bogdan (eds) Introduction to
Qualitative Research Methods: A Guidebook and Resource John Wiley and Sons.
Torff, B., 2005, Getting it Wrong on Threats to Teacher Quality, Phi Delta Kappan, 87 (4), pp. 302-305.
Wekesa, G.W., 1993, The Impacts of Head Teachers‟ Instructional Leadership on Student Academic
Achievement in Kenya, Columbia, Columbia University.

Proceeding of the 3rd International Conference on Education, Vol. 3, 2017, pp.228-233 Copyright © 2017 TIIKM ISSN 2424 - 6700 online DOI: https://doi.org/10.17501/icedu.2017.3124
3rd International Conference on Education, 20-22 April 2017, Kuala Lumpur, Malaysia
THE DIFFERENCES BETWEEN TRADITIONAL AND
DYNAMIC ASSESSMENT IN DIAGNOSING STUDENTS
WITH READING DISABILITIES AT PRIMARY SCHOOL IN
THE KINGDOM OF BAHRAIN
Danha Al Hajeri, Nadia Tazi and Mansoor A. Sayyah
Arabian Gulf University,Bahrain
Abstract: The study aimed to determine the differences between the traditional and dynamic
assessment in the diagnosis of learning disabilities reading among primary school students in
Bahrain. The researcher used the descriptive approach, where the number of the sample (48)
students. Information of the study was collected using: a word test and a reading comprehension test.
The study results showed no statistically significant differences between the numbers of people
diagnosed with reading difficulties depending on the kind of assessment (traditional/ dynamic) in
favor of the dynamic assessment. The results also showed a statistically significant differences
between the numbers of people diagnosed with difficulties in knowing words depending on the kind
of assessment (traditional/ dynamic) in favor of the dynamic assessment. The results also showed no
statistically significant differences between the number of people diagnosed with difficulties
Reading Comprehension depending on the kind of assessment (traditional/ dynamic) in favor of the
dynamic assessment.
Keywords: Traditional Assessment,Dynamic Assessment,Learning Disabilities,Word Recognition
Disability
Introduction
Educational measurement and evaluation field is considered of one of the main fields in psychology and special
education; it includes a set of procedures that aim to get useful, accurate and truthful information about the
student (Raussan, 1999).
Perhaps one of the most fundamental issues and problems facing learning disabilities is the ambiguity of the
concept of evaluation, as identifying and diagnosing procedures for learning disabilities often lack to the
precision and sophistication, so it is difficult to judge that those pupils suffer from learning disabilities
depending on some of the properties (Shalaby, 2007).
So a novelty trend has emerged in evaluation, namely the dynamic assessment, and was adopted by many
educational programs and proved the effectiveness and impact of the program depending on it, more than the
traditional assessment (Melhem, 2012).
Dynamic assessment focuses on the student development and his performance through the adoption of the
pretest and posttest model, and teaching the pupils between them and noting the progress made in mental and
behavioral performance evolution, and so it is the best and most successful way to detect undiscovered aspects
of the pupils (Alharoub, 2012).
Corresponding Author:Danha Al Hajeri/[email protected]
Danha Al Hajeri, Nadia Tazi and Mansoor A. Sayyah/The Differences between Traditional and Dynamic
Assessment in Diagnosing Students with Reading Disabilities at Primary School in the Kingdom of Bahrain
229
Research Problem
The educational evaluation process for students with learning disabilities is a systematic process to gather
relevant educational information about this disability, in order to take legal and educational decisions when
providing special services (Afif, 2014).
The traditional assessment focuses on determining the pupil’s current level in comparison to his peers, this may
reflect the pupil’s various educational experiences, or a lack of educational opportunities, but does not
necessarily reflects the real level of the pupil (Al-Sheikh, 2004). So the dynamic assessment supporters think
that there is a need to reconsider the traditional assessment that is currently used in tests, and the most important
conditions of which are determining the current performance accurately, and remain neutral in interaction and
objectivity when conducting tests, and judging the students’ level through differentiation degree with a standard
set of peers (AL-Sheikh, 2004).
And Through literature review, we can find that some studies have pointed to the success of such dynamic
assessment (Swanson, 1994; Al-Sheikh, 2004; Swanson & Haward, 2005; Salas, Gonzalez & Assael, 2012).
In light of what mentioned above, on the one hand, and the lack of Arabic studies on dynamic assessment on the
other hand, the researcher aims to examine the differences between the traditional assessment and the dynamic
assessment in the diagnosis of reading disabilities among primary school pupils in Kingdom of Bahrain.
Research Questions:
1. Is the number of students diagnosed with reading disabilities differs depending on the
assessment type (traditional / dynamic)?
2. Is the number of students diagnosed with reading disabilities in the word recognition
skill, differs according to the assessment type (traditional / dynamic)?
3. Is the number of students diagnosed with reading disabilities, in the skill of Reading
Comprehension, differs according to the assessment type (traditional / dynamic)?
Research objectives:
1. To highlight the dynamic assessment a modern trend in the field of evaluation, from
which the number of students diagnosed with reading disabilities can be reduced.
2. Identify the differences between the traditional and the dynamic assessment in the
diagnosis of reading disabilities among primary school students in the Kingdom of
Bahrain.
3. Finding a new assessment method that is based on an attempt to reach into the pupil’s
Zone of Proximal Development.
The ResearchSignificance
1. Studying the dynamic assessment as a modern way of evaluation, to replenish the
Arabic literature in this aspect.
2. Identifying the steps of building dynamic assessment can help the researchers in this
field.
3. Studying the difference between the traditional and the dynamic assessment in the
diagnosis of reading disabilities among the primary school pupils could lead to further
studies to address the dynamic assessment in other skills, such as writing and
arithmetic or with other groups of people with special needs.
Proceeding of the 3rd International Conference on Education, Vol. 3, 2017, pp. 228-233
230
4. The application of dynamic assessment may help in proper diagnosis for people with
reading disabilities, and the exclusion of other groups from entering into with learning
disabilities.
Research Limitations
Spatial limitations: The tools of the current research have been applied in the
following schools: Andalus Primary School for Girls, Fatima Bint Al- Khattab Primary
School for Girls, Khansa Primary School for Girls, Khalid Bin Al Waleed Primary
School for Girls in the cities of Riffa and Isa Town in the Central Governorate in
Bahrain.
Chronological limitations: The tools of the current research have been applied in the
first and second terms in the 2015/2016 academic year.
Problem limits: The current study subject is limited to the differences between the
traditional and the dynamic assessments, according to the theory of the cognitive
structures modification using mediated learning with the students with reading
disabilities in the fourth grade of primary school in the Kingdom of Bahrain.
Theoretical Framework:
Traditional assessment depends on an educational philosophy that emphasizes highlighting individual
differences and exciting competition among individuals for superior level among his peers without trying to
determine the individual 's actual ability, as the narrow look of the traditional assessment that focuses on what
the learner stored in his mind of specific information, is no longer suitable for the current and future
requirements in this century, Al-Jameel (2014) defines the traditional assessment as a type of assessment that
depends on the comparison of the individual’s scores with the overall average for others.
Dynamic assessment is that evaluative way in which access to the possible extent of the individual’s growth
through development that occurs to him or her as a result of the intervention of others who have more
knowledge and ability, and they are called examining teachers or mediators who provide mediating experience
ranging from tips and encouragement to the explanations and simultaneous questions (Bavali, Yamini &
Sadighi, 2011).
Dynamic assessment is an alternative means of traditional assessment which depends on avoiding the obvious
defects of the traditional assessment tools, such as: failure of classification, identification errors, failure at
building of educational programs, non availability of equal learning opportunities, also those traditional rating
tools help in classification, but they do not supports guidance or training programs, and focus on previous
learning (Khedr, 2014).
Dynamic assessment depends on Vygotsky’s cultural social theory, that was affected by the research in
anatomic, neurological, psychological, social and educational fields. This theory refers to the vital role of social
interaction in the growth of individuals and their development process, also it claims that social interaction is the
essence of the individuals learning process and knowledge acquiring (Al-Sheikh, 2004).
Research procedures:
Research Methodology: The research used the descriptive differentiative
methodology, which focuses on identifying the differences between the traditional and
the dynamic assessments in the reading disabilities diagnosis.
Danha Al Hajeri, Nadia Tazi and Mansoor A. Sayyah/The Differences between Traditional and Dynamic
Assessment in Diagnosing Students with Reading Disabilities at Primary School in the Kingdom of Bahrain
231
Research variables: The research includes two types of variables:
A. Independent variable: The traditional assessment or dynamic assessment.
B. The dependent variable: The number of students diagnosed according to the two
assessments (traditional / dynamic) in the word recognition test and reading
comprehension test.
The research sample: the cluster sampling was used for a sample of (504) (69 males
and 435 females) from the fourth grade primary school pupils.
The research tools: The current research used a number of tools, they are divided into
two sections:
A. First: diagnosis tools of learning disabilities:
IQ test: Raven Progressive Matrices Test (Arabized by: Awadh, 1999)
Learning Disabilities Diagnostic Rating Scale (LDDRS) (El-zayat, 2007).
B. Second: The research data collection tools:
Word Recognition test (developed by: Al-Fadhil, 2016).
Reading Comprehension Test (developed by: the researcher).
Research results:
1. The results of the first question: The number of students with reading disabilities
according to traditional assessment is (47) Pupils, and by (97.9%), while according to
the dynamic assessment (39) Pupils, and by (81.3%). A chi - squared test results show
that the difference is statistically significant, with a level of significance value (0.035).
2. The results of the second question: The number of students with word recognition
disability according to traditional assessment is (13) pupils, by (27.1%), while
according to the dynamic assessment (4) pupils, by (8.3%) A chi - squared test results
show that the difference is statistically significant, with a level of significance value
(0.001).
3. The results of the third question: The number of students with reading
comprehension disability according to traditional assessment is (34) Pupils, by
(97.1%), while according to the dynamic assessment (35) Pupils, by (79.5%).
Research recommendations:
1. Adoption of dynamic assessment in the diagnosis of learning disabilities as an
alternative to the traditional assessment
2. Developing the educational services introduced to LD students on the basis of the
Zone of Proximal Development.
3. Developing the educational plans according to the mediated learning experience.
Future research:
1. An experimental study of the effect of dynamic assessment strategies on the
performance of learning disabled and typical children.

Proceeding of the 3rd International Conference on Education, Vol. 3, 2017, pp. 228-233
232
2. A survey Study of the use of dynamic assessment strategies in special education in the
Kingdom of Bahrain.
References
Afif, M., 2014, The purposeful dominant personality pattern and its relationship to achievement motivated: A comparison field study of secondary school students in Mustganm. Platform of Developing Psychological and Educational Practices, 12,151-164.(In Arabic).
Al –Jameel, N., 2014, Building a measure of thought of learning disabled grade 1 primary school pupils. Babylon Center Magazine for Humanistic Studies, 4 (2).410 - 437.(In Arabic).
Al-Fadil, M., 2016,Reading disabilities prevalence rates among primary school students in the Kingdom of Bahrain,Unpublished master thesis, Arabian Gulf University, Bahrain.(In Arabic).
Alharoub, A., 2012, Theoretical issues on the concept of gifted students with learning disabilities. International Journal of Educational Research ,2 (3) 31- 60.(In Arabic).
Al-Melhem, N., 2012,The effect of an enrichment program depending on the dynamic assessment in the development of critical thinking and cognitive beliefs of talented middle school female students, Unpublished master thesis, King Faisal University, Saudi Arabia.(In Arabic).
Al-Sheikh, H. F., 2004,. Comparison between dynamic and Traditional assessment using the (PASS) theory in estimating the performance of an educable mentally retarded sample with impulsive behavior(Cairo: Etrac Publishing and distribution co).(In Arabic).
Awadh, F., 1999,Progressive Matrices Test(Kuwait: Public Authority for Applied Education and Training Press).(In Arabic).
Bavali, M., Yamini, M. and Sadighi, F., 2011, Dynamic assessment in perspective: demarcating dynamic and non- dynamic boundaries. Journal of Language Teaching and Research, 2 (4), 895-902.
El-Zayat, F. M., 2007,Learning Disabilities Diagnostic Rating Scale Manual(Cairo: Publishing House of the universities).(In Arabic).
Khedr, A. B., 2014,The effect of a counseling program based on the dynamic assessment in the development of the slow learners cognitive processes, Unpublished master thesis, Taibah University, Saudi Arabia.(In Arabic).
Rausan, F. (1999). Methods of measurement and diagnosis in special education(Jordan: Dar Alfeqr). (In Arabic).
Salas, N., Gonzalez, F. and Assael, C., 2012, The contribution of dynamic assessment to promote inclusive education and cognitive development of socio-economically deprived children with learning disabilities. Journal of Psychology, 6 (4), 144-168.
Shalabi, A., 2007, The impact of the effectiveness of a remedial teaching program based on the modeled use of Resources room programme to improve the achievement of the learning disabled primary school pupils. A paper presented at the International Conference on School Reform, Al Ain, United Arab Emirates, April.
Swanson, H.L., 1994, The role of working memory and dynamic assessment in the classification of children with learning disabilities. Learning Disabilities Research & Practice, 9 (4), 190-202.
Swanson, L. and Howard, BH, 2005, Children with reading disabilities: Does dynamic assessment help in the classification. Learning Disabilities Quarterly. 28, 202-223.

Proceeding of the 3rd International Conference on Education, Vol. 3, 2017, pp. 234-246 Copyright © 2017 TIIKM ISSN 2424 - 6700 online DOI: https://doi.org/10.17501/icedu.2017.3125
3rd International Conference on Education, 20-22 April 2017, Kuala Lumpur, Malaysia
SELECTED ONGKAH-ONGKAH OF SAMA DILAUT IN
THE PROVINCE OF TAWI-TAWI: THEIR FORMS AND
STYLES OF EXPRESSION
Elvinia Reyes- Alivio, Junefe D. Naquira and Josephine M. Lendio
College of Education, Mindanao State University-Tawi-Tawi College of Technology and Oceanography,
Bongao, Tawi-Tawi, Philippines
Abstract: This study aimed to determine the forms and style of expression of selected ongkah-ongkah
(songs) of SamaDilaut in the province of Tawi-Tawi, the values contained in each song and its influence to the socio-political and economic lives of the SamaDilaut. This study was solely qualitative in nature. The fifteen respondents are from BohehSallang, BongaoPoblacion and Sibutu Municipality where residents are expert in composing folksongs and have been chosen to represent their barangays as contestants in the festivities like: AwwalJamman held during Kamahardikaan sin Tawi-Tawi (Province Day Celebration).
Interview method and focused group discussion (FGD) aided by the interview guide and video recorder were used to gather the necessary data. Data were recorded, transcribed, translated from native tongue to English language, analyzed and interpreted to find out the values contained in the songs and how they influenced the socio-economic and political lives of the Sama folks.
This study found out that the common ongkah-ongkah of the SamaDilaut are the tenes-tenes, sangbay, linggisan, lolay, leleng, anakiluh, budjangmanis, pagparinta. Some Sama folksongs like the tenes-tenes, sangbay, linggisan, pagparinta, anakiluh vary in terms of form and style of expressions,
contained repetition of words and rhyming words. Some are also performed through dancing with the accompaniment of stringed instruments like guitar, gitgit and biula (violin), gabbang (bamboo xylophone), reed flute (sawnay) and tambu (drum). It also determined that the ongkah-ongkah contained socio-economic and political values of the SamaDilaut. Through singing they are able to convince people to buy their homemade products like mats (baloy). Some of them were invited to any celebration to perform, thus helping them to earn a living. These songs also provide entertainment to the community folks.
Keywords:Ongkah-Ongkah, SamaDilaut, Community Folks, Tenes-Tenes, Gabbang
Introduction
The folk literature of Muslim cultural communities in Mindanao, Philippines, may be in prose or in verse. But
the style and form of expressions may vary from one Muslim cultural community to another with what various languages that people speak. Folk literature follows the oral tradition and that folktales, myths, legends, epic
poems, riddles and proverbs are handed down by word of mouth from generation to generation. Moreover, folk
literature in the Muslim cultural communities has a participatory audience. The audience listens, reacts and
retells what he or she hears to another audience, thereby ensuring the transmission of the folk literary materials
to others. Authorship is not individual but it is collective. Basically, the problem that easily comes to mind is the
lack of access to the textual materials of these oral genres, if not absenceMost yet to be collected and
documented (Asain, 2015).
Spotted throughout the Sulu archipelago and other parts of the Philippines like Mindanao, Visayas and Luzon
live the SamaDilaut or Badjaus, Badjau means “man of the seas”. By tradition, the people are sea nomads,
travelling by boat from one island to the next in search of a fishing harvest
The Sama are highly fragmented people with no overall political unity in terms of government patterned system
but have their own political tribal affairs. Specific Sama groups can be distinguished by dialect. However, most
identify themselves with a particular island or island cluster.
SamaDilaut traditional songs are handed down orally through generations. The songs are usually sung during
marriage celebrations (kandulipagkawin), accompanied by dance (pang-igal) and musical instruments like pulau
(flute), gabbang (bamboo xylophone), taunggo’ (kulintang gongs), and in modern times, electronic keyboards.
There are several types of traditional songs, they include: isun-isun, lunsai, nasid, bua-buaanak, and tinggayun.
Corresponding Author:Elvinia Reyes- Alivio/[email protected]
Proceeding of the 3rd International Conference on Education, Vol. 3, 2017, pp. 234-246
235
Among the more specific examples of SamaDilaut songs are three love songs collectively referred to as
Sangbayan. These are DallingDalling, Duldang, and PakiringPakiring. The most well-known of these three is
PakiringPakiring (literally “moving the hips”)’ which is more familiar to the Tausug in its commercialized and
modernized form DayangDayang. The Tausug claim that the song is native to their culture, and whether the
song is originally Tausug or Sama remain controversial. Most Sama-Dilaut folksongs are becoming extinct,
largely due to the waning interest of the younger generations. (https://tobyforreal.wordpress.com/2015/10/21/the-awesome-bajau-tribe/)
According to Bruno (1973), literature is a work of art in which people express the feelings and thought about his
society, his fellowmen and his divine creator from the ancient past to the present days. Some of these
expressions are in a way to what scholars call oral tradition. This includes folktales, ballads, and folksongs,
which passes by word of mouth from generation to generation.
Nettl (2014) in his study on Folk Music said that folk music, type of traditional and generally rural music was
originally passed down through families and other small social groups. Typically, folk music, like folk literature,
lives in oral tradition; it is learned through hearing rather than reading. It is functional in the sense that it is
associated with other activities, and it is primarily rural in origin. The usefulness of the concept varies from
culture to culture.
This study aimed to determine the common ongkah-ongkah (songs) of the SamaDilaut in the province of Tawi-
Tawi their various forms and styles of expression, the values contained in each song and its influence to the socio-political and economic lives of the people. Specifically, this sought to answer the following questions: 1)
What are the common ongkah-ongkah of the SamaDilaut; 2) What are the variations in the ongkah-ongkah in
terms of forms and styles of expression.; 3) Which of the ongkah-ongkah contain social, economic and cultural
values of the SamaDilaut?; and 4) How do the ongkah-ongkah influence the lives of the Sama folks.
Assumptions
1. Local folksongs of the SamaDilaut contain socio-economic and cultural values.
2. Sama folksongs influenced the socio-economic and cultural lives of the SamaDilaut.
Significance of the Study
The result of this study may be of great importance to the English language teachers, students, as well as the
future researchers.Collections, recordings and interpretations of folksongs of indigenous people are important to
the English language teachers in the ESL classroom and for the students to appreciate the ways of life of local
folks. The collection of local folksongs and their interpretations should be included in the ESL curriculum.
Preservation of local literature specially those transmitted by words from generation to generation should make
part of the literature class for the students to appreciate the culture of the indigenous people through unrecorded
songs.
Related Literature
The Sama have existed in their current territories since before the formation of the Sulu Sultanate. They are
related linguistically to the West coast Badjau as well. Second and third generation Sama living in Malaysia
may very well be more familiar with the term Bajau than they are with Sama. They still identify themselves with their home island (BadjauUbian, BadjauSimunul, BadjauTabawan) though some have little understanding about
their homelands located in the Philippines. Those Sama who have been living in Malaysia for many years as
lawful citizens are called BajauPenduduk which in Bahasa Melayu means they are citizens or Lawful residents
of Malaysia. The Sama’s right to reside in Malaysia must be upheld as there is written accounts of their presence
since at least 1770 (Thomas Forrest).
The Sama people can be quite hard to classify. Due to the nomadic nature of the Sama, they can be found in
several countries (especially the Philippines, Malaysia and Indonesia). In Malaysia, they are called Badjaus. In the Philippines, other Filipinos call them Badjaos as Samals, depending on which subgroup of the Sama they
belong to.
To complicate things further, Sinama is the name for at least four language groups of the Philippines which are
then subdivided into numerous dialects depending on what island a person is from. Speakers of Northern
Sinama are unaware of these languages names given them by the linguists, because they identify themselves by
island and region instead of closeness of language. The SamaDilaut has a tendency to answer questions about
Elvinia Reyes- Alivio, Junefe D. Naquira and Josephine M. Lendio/Selected Ongkah-Ongkah of SamaDilaut in
the Province of Tawi-Tawi: Their Forms and Styles of Expression
236
their identity based on what they believe. SamaDeya, on the other hand, will sometimes classify the SamaDilaut
as being completely different from themselves.
The people now live in one of three types of dwellings: Stilt houses on the coast ordinary land houses clustered
along protected shorelines or houseboats. Houses that are raised one to three meters above the ground usually
consist of a rectangular room with an attached kitchen. Small bridges or planks are connecting houses of the
SamaDilaut. Typically, each boat shelter five to six people- a family and maybe one or two other relatives. Two
to six families anchor their boats in a cluster while fishing, sharing food and pooling labor and resources.
Philippine folk songs are results of the culture of the Philippines which is highly influenced by history and the
blending of foreign persuasions and its indigenous civilization. (www.cebu-philippines.net/philippine-folk-
songs.html)
Folk music entertains, tells or supports a story, and transmitted from generation to generation. Most often, the
songs were obtained through oral tradition, rather in written form, and the singer was left with the task of
interpreting the meaning of the lyrics on the basis of his or her cultural milieu. Folk music has been written and
performed portraying every theme imaginable. There are love songs and silly songs. There are songs with
religious themes and songs with secular lyrics. Folksongs portray the good life and they delineate hardship.
(www.encyclopedia.com/topic/Folk_Music.aspx)
According to Bruno (1973), literature is a work of art in which a person expresses his feelings and thoughts
about his society, his fellowmen and his divine creator from the ancient past to the present days. Some of these
expressions are in a way to what scholars call oral tradition. This includes folktales, ballads, and folksongs,
which passes by word of mouth from generation to generation. Nettl (2014) in his study on Folk Music said that
folk music, type of traditional and generally rural music was originally passed down through families and other
small social groups. Typically, folk music, like folk literature, lives in oral tradition; it is learned through
hearing rather than reading. It is functional in the sense that it is associated with other activities, and it is
primarily rural in origin. The usefulness of the concept varies from culture to culture.
Related Studies
Mason (2009) in her folk song and hymn study stressed that “folksongs are a very important part of our cultural
heritage because they draw you into the mood of earlier times and help you to better understand the people”.
A local researcher, Dumago (1997) studied kata-kata in order to preserve and document the folk narratives. She
was able to analyze the idiomatic expression in kata-kata, as a basis for misunderstanding the Tausug language
hereby providing insight into their way of life behavior and culture. In her study, she concluded that the kata-
kata, contains themes on peace, loving, struggles and faith in God.
In a study conducted by Sabal (1997) “LANGAN”, she discovered that Langan is a song usually sung to soothe
the baby to sleep. It is also sang to someone on a journey and during wedding ceremony.
Similar study conducted by Jamma (1993) who found out that the themes of the folksongs among the Sama of
TubigSallang centered on sentimentalism, love, livelihood and a will to exist amidst poverty.
The study on Daman by Amilhamja (1998) who stressed that Daman serves as a vehicle of communication in
family affairs. It creates lively atmosphere in social gatherings and it is a form of an art expressing verbally human thoughts and feelings with careful and meaningful words. She wrote that Daman does not apply to
courtship but it includes conversational words in a friendly relationship.
Meanwhile, Devero (2001) in her study on Sama folksongs concluded that the Sama ways of life lies on their
courtship and love affair. Their family upbringing, their religion, belief in the power of the natural phenomena;
the way they handle their problems of the heart, the way they love and respect their elders and influence other
people to do the same and their belief in the world hereafter are all reflected in their folksongs.
According to Santamaria (2005) in her study entitled “Alter-Lyricism in the SamaLagu-Lagu: Examining the
Creative Sources of the Sangbay Song Tribute and Its Relationships with the Igal Dance Tradition”, Sangbay
expresses its intention and even its character or condition. The “Sangbay” also reveals a conversation between
the song and the dance. The Sangbay is “Igal performance-specific” because the singer reflects about his or her
song but then he or she eventually relates this to the dancer and the dance.

Proceeding of the 3rd International Conference on Education, Vol. 3, 2017, pp. 234-246
237
Lucero (2003) stressed out that the Sama musical tradition closely relates to those of the other groups in the Sulu
area. The oldest musical form, the Luguh is sang in religious and social functions, and has a melancholy tune
and slow tempo. The suwah-suwah (sprouting citrus seed) is a sprightly cheerful that accompanies the pangalay
dance. The Tenes-Tenes, a relatively recent form is a ballad which is sang on any occasion like fishing, and by
anyone, but especially by a young man for his sweetheart. The same melody may be used for different sets of
lyrics. Like the Tenes-Tenes, the Leleng is sang on any occasion, by anyone of any age: children at play, a boy teasing a playmate, a youth singing about a faraway sweetheart, a man fishing or resting, but is also sang on
special occasions like weddings, haircuts, or circumcisions.
The above mentioned reviews of literature and studies are similar to the present study but different in terms of
literary genres, venue, analysis and interpretations.
Methods
This study was solely qualitative in character. The fifteen respondents are from BohehSallang, BongaoPoblacion
and SibutuMunicapality who are experts in composing folksongs and have been chosen to represent their
barangays as contestants I the festivities like: AwwalJamman held during Kamahardikaan Sin Tawi-Tawi or
Province Day Celebration.
Interview method and focused group discussion (FGD) aided by the interview guide were used to gather data.
The recorded data were transcribed, translated from native tongue to English language, analyzed and interpreted
to find out the variations of the songs and values that influence the social, political, economic and cultural lives
of the Sama folks. Based on the analysis and interpretation of the data, the common ongkah-ongkah of the
SamaDilaut are the tenes-tenes, sangbay, linggisan, olay, leleng, anakiluh, budjanganak, pagparinta.
Analysis
A.Tenes-Tenes
The word “tenes” has no other literal meaning in Sinama. It refers to a song titled (just like the word “lolay”).
The most probable and convincing explanation that the word tenes comes from the name jenes the most popular
Sama male singer during the 90’s. He together with other singers in the 90’s popularized this song using organ. His song has always mentioned when they sang a duet or sangbay (praises). Hence, the word “jenes” evolved
into “tenes”.
According to SamarindaSalbayani, a resident of Brgy.BoheSallang, tenes-tenes is a song that reminds a person
to persevere in life, work hard in order to earn a living (like fishing). Nina Maadil, a resident of
BongaoPoblacion, defines tenes-tenes as a song about culture and sang especially during special occasions for
recreation. Jumaatiya, 70 years old describes tenes-tenes as an expression of happiness and enjoyment.
B.Linggisan (bird dance)
Is another song accompanied by a dance called pangalay.Pangalay has a number of versions including the
PangalayLinggisan which can be performed by a solo female performer imitating the movement of a bird flight.
According to Mr. Rapin-Jairi, Director of the IngatKapandayan Reforming Arts of the Notre Dame of Jolo
College, the pangalaylinggisan performed in Sulu characterizes by the graceful movement of the dancer’s arms
and hands flowing in synchrony the gentle blowing of the wind. While in some other parts of Sulu Archipelago including Tawi-Tawi and Sabah, the movements of arms and hands are more pronounced as they are imitating
the waves of Sulu Sea. (pinasmuna.com_ThePangalayDance of Sulu,Aug.31,2013-www.pinasmuna.com2013/8)
C.Sangbay
According to Matthew Santamaria (2005) who conducted a study on “Alter-Lyricism in the SamaLagu-Lagu; Examining the creative sources of the Sangbay song Tribute and Its Relationships with Igal Dance
Tradition”,sangbay expresses its intention and even its character or condition. The “Sangbay’ is also a
conversation between the song and the dance. The sangbay is “igal performance-specific” because the singer
reflects about his or her song but then he and she eventually relates this to a dancer and the dance.
(journals.upd.edu.ph.article).
Sangbay repertoire consisting of lolai, manismalenggangdalling-dalling among others serve as referents for
improvisation performances. A singer pays tribute to the dance by extending the song and by singing with feelings. The dancer repays this tribute to the singer by taking movement cues from the singer and by molding
Elvinia Reyes- Alivio, Junefe D. Naquira and Josephine M. Lendio/Selected Ongkah-Ongkah of SamaDilaut in
the Province of Tawi-Tawi: Their Forms and Styles of Expression
238
the dance performance in certain instances. Sangbay also reveals a conversation between the song and the
dance. Sangbay– a Sama genre literature. Sangbay is a tribute song. Just like the Igal, the Sangbay were songs of
the Sama titles or labels that were sang in variation by singers while accompanying Igal performed in festivities
such as wedding.
D.Leleng
Leleng is sang in any occasion by anyone of any age: children play, boy teasing a playmate, a youth singing
about a faraway sweetheart, or man fishing or resting; it also sung on special occasions like weddings, haircuts
or circumcision.
Leleng like other ongkah- ongkah is sang with the accompaniment of a string instrument like gitgit and biula,
gabbang (a bamboo xylophone) and the kulintangan. (R.C. Lucero, 2003)
In addition, leleng is a song of appreciation. MisiriyaArasani (a resident of BongaoPoblacion) said that it is also
used as lullaby-a song that helps mother in taking care of her child. Leleng is also a stress-reliever song
especially after work.It teaches us how to persevere in life and not to give up in times of hardships. Leleng is
composed and sang depending on the kind of occasion. The SamaDilaut singer can compose at instant a song if
requested.
E.AnakIluh
A kind of lagu-lagu of the SamaDilaut which describes an orphan longing for the love and care of parents. It
also describes the hardships and sad experiences of a child of living with relatives and other people. (Fatima
Sarmiento, resident of Sibutu).
F.BudjangManis
A Samaongkah-ongkah that describes the beauty of a maiden, and her unselfish love to a man. It is sometimes
sad and happy about reminiscing the past. A Sama singer-composer particularly a woman singer, uses words
that describes a lady not only her physical outlook but her inner beauty. (Sahala Miguel, resident of Sibutu)
2. What are the SamaDilautvariationsin terms of form and style of expressions?
Most ongkah-ongkah of the SamaDilaut are more of the historical type than lyrical. These are usually sang and
arranged in quatrains.
Tenes-tenes is a Samalagu-lagu that describes the way of life of the Sama people (like fishing). The tenes sung
by Tullang- a blind singer-composer, describes his life of being an artist where he can earn money out of singing on the public during special occasions like hariraya, paggunting, pagkawin among others. Below is an excerpt
of Tullang’stenes-tenes.
Tenes… teneskinobelansaltahna bay niborda-bordahan
Ah… ah… sa bias bias… bang akuitumagkalangkalangan
Oy… pakalekalekammgadanakan
Pakalekalenakammgadaodanakan oh… minsansuaraitu
Lagaw lagawanmasiruakumagsindilsindilan
Atiyah eh kusinulaysulayan, oh… Mbalakumagkalagkalangan
Bang taentomkumagtundan-tundan
Taentumku bay waktujaman
Jaman, Jaman bay waktu eh…ey
Bay jaman, jamanabasaggihsibaran
Oh bang akumagkalangan…
Maka eh kunigitar-gitalan
Oh daanakam mag-anganangan
Oh bang akuitugantamagkalagihaw Day para atoanasibaran…

Proceeding of the 3rd International Conference on Education, Vol. 3, 2017, pp. 234-246
239
Form: Tenes-tenes consists of a four-line stanza called quatrain. It also contains repetition of words found at the
beginning and end of the line for instance:
borda-bordahan (decorated/made beautiful)
biasbias (embarrassing) magkalangkalangan (singing)
pakalekale (listening)
lagawlagawan (voice of the singer)
magsindilsindilan (crying/singing)
sinulaysulayan (trying)
magtundan-tundan (towing/rowing)
jaman, jaman (moments)
The use of an, mag, pa, si, may are affixes that are also identified and attached to a Sama root word.
English Translation (Transparency) – translated by Mr. PotchongJackaria
A song that was hidden and made beautiful
Ah… ah it’s embarrassing when I’m singing… Oh listen my brothers and sisters
Listen brothers and sisters, oh… Though my voice
is not beautiful. Here I’m still singing
And keep on trying, oh…
I can’t sing
If I remember sailing or rowing boats
I remember the past
Those days were the days… ey
Those days when I was still strong
Every time I sing And play my guitar
Oh… don’t ever dream…
Translation of the song (tenes-tenes) from Sinama (source text) to its English version (target text) was very
difficult and tedious. Translation was made first using fidelity (word for word) in order to get the meaning of the
song.Analysis was made phrase by phrase then moving on to transparency to get the entire thought of the song.
Structure of words was sacrificed deviating from its original form.
Sangbay (Sangbai)
Is another Samaongkah-ongkah. It is a conversation between the song and a dance. It is a tribute song where the
singer pays tribute to the song through a dance – Ma DallinDallin or Igalfor Sama. It is sang with the accompaniment of gabbang (bamboo xylophone), reed flute (sawnay) or tambul (drum) in the absence of
gabbang and performed by a male and a female dancer. Below is an excerpt of the song composed by Tullang
(the blind singer-composer) paying tribute to his brother Tolsi:
Mbal hap suwaraku… ilu nag anta angalang du…
Lilla… lala…lilla… lilla…lala…lilla…lala…lilla
Iyasalih sab sitotohTolsi, iyadus sab takaleku
Bang angalang-ngalangbagayku
Ngandahkamniiyamagsuli-suli
Taentomku bay jamanwktu eh…ey…oy…oy Sam ay dalling… dalling
Bay jamanjamanku bay waktu eh… ey
Iyaru sab salihtakale
Jamanjamannamagtunistunis
Lilla… lala…lilla…lilla…lala…lilla…lala…lilla
Ilu nabalagu-lagusiDayang

Elvinia Reyes- Alivio, Junefe D. Naquira and Josephine M. Lendio/Selected Ongkah-Ongkah of SamaDilaut in
the Province of Tawi-Tawi: Their Forms and Styles of Expression
240
The sangbai by Tullang contains repetition of words for instance: angalang-ngalang (singing); magsuli-suli
(telling stories); jaman-jaman (time/hour); magtunis-tunis(singing songs); ongkah-ongkah (songs). Repetition is
used perhaps to emphasize the singer’s feelings as he sang the Sangbay. Maybe Tullang has been so creative the
way he sings and composes his songs. This is compared to the poem written by Robert Frost “Stopping by the
Woods on a Snowy Evening” he repeats the last line “and miles to gobefore I sleep, and miles to go before I
sleep”. Repetition is a literary device that adds meaning to the text – sometimesit is catchy or funny.
English Translation: (translated by PotchongJackaria)
My voice is not that good… but I am still singing
Lilla… lala…lilla… lala…lilla…lala
And brother Tolsi, I heard him too
If my friend is singing
Look at him telling stories
I really miss (remember) those days… oh… oh
My darling… darling
Those were my days… hey
I also heard him During his days singing songs
Here comes the song, baby…
Translation of the song using fidelity and transparency were necessary to get into the thought of the song. The
above translation describes the singer himself and his singing voice that is not so beautiful. It also describes his
past experience when he was with his brother Tolsi.
AnakIluh
Is another Samaongkah-ongkah that describes an orphan who was left by his parents and is living with a relative
or non-relatives. It also consists of a four-line stanza and the singer-composer observed the use of rhyming
words in the song. Below is the lyrics of the song AnakIluhwhicjh was sung by SamarindaSalbayani, a resident
of Brgy. BoheSallang.
Naya’ miskinantallunganmagdanakan
Dikayuhitu, toongan
DikayuhmopohnangisNapinmihaonggoh Kahillingsianakiluh
Mikilasiyakamihaiya’ usaha
Kapintapakullumnasiyalina
PaddiparasahanmakapanyabotniTuhan
Angeyna the tutu tapamuan
NgamuhNapiniyaniAllahutaala
Kapintapakallumnasiyalina
Kahillingasiyaka “paddiparasahan ta
Susa du bang mbalniyaonggommah ta”
The song AnakIluh contains some rhyming words, for instance:
magdanakan – toongan
artasahan ta – mmah ta
English translation (transparency) – translated by Mr. PotchongJackaria
There were three poor siblings
One of them, the youngest
One was crying while washing
Still longing for their mother

Proceeding of the 3rd International Conference on Education, Vol. 3, 2017, pp. 234-246
241
The orphans said The eldest think of looking for job
So that he can feed his siblings
He felt bad and prayed to the Lord, “Why did He make us like this”
He still prays to God
So that he can feed/sustain his family
The eldest said, “I feel bad,
It’s really hard if we have no parents”.
The use of rhyming words in this song makes it more pleasant to hear and catchy. It also helps one to easily
remember the lyrics of the song.
BudjangManis
A Samaongkah-ongkah that talks about beauty and selfish love. The singer-composer of this song,
PagalMelican, resident of Sibutu, also used four-lines for each stanza called quatrain.
Niiyahdanda-dandabudjanglanduhmanis
Maniusnamanisnamanismakatangis
Dandatahahbuun, ungnalanduhpansung ManismakapunungsiDanda ma-erom
Subulbilahina ma simanismuka
Katisnaaltahnalaepamuwanna
Tudjummahinahmattoajarina
Paggapamuratasigapinangantin
Sigakmanusiyahpabunyugmagkawin
Si lalladayahanmakalanduhhansam
TaabutbinatalansiDandaparagan
Hangkandandalahiniyalallasiddi
Miskinmakalammihbaimagkabilahi
Dandapinihana,.mbal ta tammuna
Taabutngalammalallamonoh di na
Maeromlingkatanasaltagatunang
Makasimiskinanlallalanjang-lanjang
Kaamkapakilannmaksihkamtoongan Masdigamduwanganmagdikayuhsuratan
There are repetition of words used in this song, it also contains rhyming words, such as;
manis – makatangis inangantin – magkawin
tunang – lanjang
toongan – suratan
English translation (transparency) – translated by Mr. PotchongJackaria
There was a beautiful maiden who was so beautiful
Her beauty makes one cry That maiden with long hair, and high nose
Elvinia Reyes- Alivio, Junefe D. Naquira and Josephine M. Lendio/Selected Ongkah-Ongkah of SamaDilaut in
the Province of Tawi-Tawi: Their Forms and Styles of Expression
242
Whose beauty can make one unconscious
A man fell in love with her
He has given away everything he has
And ask her hand in marriage
From the maiden’s parents
The wedding day came
People were happy joining the procession
The man was rich and very handsome
But just about the final ceremony ends, the bride ran away
The reason why she ran away was because of the other man
He was poor and not handsome, but they are in love He (the fiancée) searched for her but couldn’t find her
When he got tired and became hopeless, he committed suicide
The beautiful maiden has a sweetheart
The poor and tall man
Oh, you the religious leaders bear witnesses
The two are meant for each other
The song BudjangManis is translated from Sinama to its English version. Translation was made first using
fidelity (word for word) then transparency in order to get the meaning of the song.
The above translation describes the love story of a beautiful maiden who ran away on her wedding day and
which tells something about the selfish love the beautiful maiden has. The song also illustrates the simple living
of the SamaDilaut and their adherence to traditional practices/ laws. One is the NO intervention of public
officials on the arrangement of parents or negotiation between the parents of the woman and the man with
regard to marriage. Another is the giving back of the “dowry” to the family of the groom. For the SamaDilaut
people, the one who abducted the woman should be responsible to return the dowry (the same amount with the
one given to the woman) unlike to that of the other Muslim tribes. These are few of the traditional practices of
the SamaDialut which still exist in the present time and are illustrated in the song, BudjangManis.
Pagparinta
Is a Samaongkah-ongkah that talks about politics or governance among the SamaDilautcommunity. The singer-
composer, SamarindaSalbayani, resident of Brgy. BoheSallang seldom use rhyming words. There is also no
repetition of words in this song.
Itiyahsinulayannapangissangissahan
Na ma kitaminaanmagpartintatoongan
Ahekarupanabangsi Mayor bay naan
Na he tam pagsukulan
Aheka bay pamunanna, murana election
Subay heh tam nientomnabinututoongan
Si Jasper kohinaannaahekapanabangan
Na ahapgihinaaannaehnaamarintanailu bay Makita
Mal du takalupa, abinutu heh ta
Pasalle ta a taggolnaamarinta
Na amuwanankitaaheyapanabangna
Some of the rhyming words in this song are:
toongan – naan
ngissahan – naan
toongan – panabangan

Proceeding of the 3rd International Conference on Education, Vol. 3, 2017, pp. 234-246
243
heh ta – amarinta
English translation (transparency) – translated by Mr.PotchongJackaria
Here I am trying, as a test
He has been governing us well
The mayor has helped us many times
We should give thanks for it
He has given us many things, and the election is near
We should not forget him and should vote for him He is Jasper, he has helped us many times
He has led us well
We will not forget him and will vote for him
We should let the one
who has tried to govern
Who always give and help us.
The above translation describes pagparinta or governance as an election campaign song of Mayor Jasper Que
written in Sinama dialect.
3. Which of these Sama folksongs (lagu-lagu) contain socio-economic and cultural values of the
SamaDilaut?
A. Tenes-Tenes
“Oh listen my brothers and sisters”, a line from the song’ Tenes-Tenes sung by Tullang( a blind singer-
compopser), which indicates unity, love, and friendship among SamaDilaut people. It describes the simple living
of the SamaDilaut and their engagement in social gatherings (paglami-lamihan). “Here I am retelling the song
of ourforefathers” is another line from the song which gives us the idea to value what our forefathers has left for
us. Aside from socio-cultural values, Tenes-Tenes also contains economic values, “If I remember sailing or
towing boats”, which shows that SamaDilaut people are engaged in fishing that serves as their primary source to
earn a living. Moreover, SamaDilaut are considered as seafaring people, “I have travelled differentshores”,
describing their life in the sea, travelling from one place to another.
B. Sangbay
It is another song accompanied with the dance Igal and a Samalagu-lagu that is sung to give praise and
appreciation to other people. The Sangbay sung by SamarindaSalbayani is a song that gives glimpse from the
past. “Here I am retelling the story that has a lesson”. This indicates that the song contains socio-economic
values.
C. AnakIluh.
Is another Samaongkah-ongkah which tells a story of an orphan child. This song makes us realized how
important family is, and the role of parents in the family. This song contains socio-cultural values since it
focuses on the role of the parents, and the family, in general.
“Napinmihaonggohmmah ta”, “Susa du bang mbalniyaonggohmmah ta”, are lines from the song, AnakIluh,
whish support the idea on the importance of parents in the family. These lines indicate a child (Napin) who
always look for his parents and find it very hard without their presence. Thus, parents play a very important role
in the society.
D. BudjangManis
Is another Samaongkah-ongkah which talks about beauty,.“ Niyahdanda-dandabudjanglanduhmanis”. This song
tells a story of a beautiful maiden who could melt anybody’s heart. BudjangManis is also a song about selfish
love “ TaabutbinatalansiDandaparagan”. The song also tells about the beautiful maiden who ran away with the
man whom she loved the most on her wedding day. The second stanza of the song, presents the socio-cultural
values. It shows respect for women and obedience of children to parents.
Elvinia Reyes- Alivio, Junefe D. Naquira and Josephine M. Lendio/Selected Ongkah-Ongkah of SamaDilaut in
the Province of Tawi-Tawi: Their Forms and Styles of Expression
244
Subulbilahina ma simanismuka
Katisnaaltahnalaepamuwanna
Pagganiyahwaktomahandanaiya
Tudjummahinahmattoajarina
E. Pagparinta
Is an election campaign song sung by the SamaDialut. The song illustrates an individual asking favor or support
from the people for the coming election.
This song, in general, talks about the political life of the people. It gives details on what the person has done for
the people so that they will vote for him.
“He is Jasper, he has helped us many tim[es
He has led us well
We will not forget him and will vote for him We should let the one who has been tried to govern, give, and help”.
Findings
On the basis of the analysis band interpretation of the data gathered, the following are the findings:
The common ongkah-ongkah(folksongs) of the SamaDilaut are Pagparinta, AnakIluh, BudjangManis,
TekGoyak, Pila Na Baleleng, Igal-Igal, Duldang, Leleng, Leyang-leyangInah Ku, Tenes-Tenes, andLolay.
Most ongkah-ongkah of the SamaDilaut are more of the historical type than lyrical. These are usually sung and
arranged in quatrains. SamaDilaut folksongs vary in terms of style and form of expression. For instance, the
Sangbay of Tullang contains repetition of words such as angalang-ngalang (singing); magsuli-suli (telling
stories). Repetition is a literary device that adds meaning to the text. It perhapsemphasizes the singer’s feelings
as he sings the Sangbay. Tenes-tenes is a Samalagu-lagu that describes the way of life of the Sama people (like
fishing). It also contains repetition of words found at the beginning and of the line such as borda-bordahan and
magkalang-kalangan. However, other Samalagu-lagu have no repeated words used, but contains rhyming words
such as manis-tangis. The use of rhyming words catches the attention of the listeners and helps one to remember
the lyrics of the song.
Some the SamaDilautongkah-ongkah are performed through dancing with the accompaniment of instruments
like gabbang(bamboo xylophone; reed flute (sawnay); or tambul (drum) in the absence of gabbang.
It was also determined in this study that some Samaongkah-ongkah contain socio-economic and cultural values.
“Oh, listen my brothers and sisters”, A line from the song Tenes-Tenes sung by Tullang, which shows unity,
love, and friendship among the SamaDilaut. Aside from socio-cultural values, Tenes-Tenes also contains
economic values, “IfI remember sailing or towing boats”, which shows that SamaDilaut people are engaged in
fishing and it serves as their primary source of living. Sangbay, a tribute song accompanied with dance, also presents socio-cultural values, “Here I am retelling a story that has a lesson”.
It was also found out in this study that some Samaongkah-ongkah of the SamaDilaut affect their socio-economic
and cultural lives. To them, these songs help them earn a living. Through singing they are able to convince
people to buy their products and provide entertainment to the community.
Conclusion
On the basis of the findings of this study, it is concluded that local folksongs of the SamaDilautvaried terms of
forms and styles of expressions. The ongkah-ongkah also contain socio-economic and cultural values and
influence the socio-economic and cultural lives of the SamaDilaut.
Recommendations
Based on the findings and conclusion of this study, the following are hereby recommended:

Proceeding of the 3rd International Conference on Education, Vol. 3, 2017, pp. 234-246
245
The collection of local folksongs and their interpretations should be included in the English Curriculum.
Preservation of local literature specifically those transmitted by words from generation to generation should be
made part of the lesson in the literature class.
Courses like Asian, European and American literatures offered by the English Department should include
folksongs for the students to appreciate the culture of indigenous people and their ways of life through
unrecorded songs..Future researchers could also use this study as a reference if they will engage in similar study.
Acknowledgement
1. Mr. PotchongJackaria- Translator
2. Dr. Forma L. Gonzales- Language Expert, Faculty Researcher and a Faculty of the Language
Department
3. Dr. Abduljami S. Ishmael- Sociologist and Faculty of the Social Science Department
4. Dr. Moh’d. MuktarTahil- Faculty, Social Science Department
5. Junefe D. Naquira- Co-Researcher
6. Josephine M. Lendio- Co- Researcher
7. SamaDilaut Residents of Sibutu, BohehSallang and BongaoPoblacion
8. Tullang and Wife- for the songs
9. Prof. Sukinur-ain M. Delasas- Director, Tambuli Dance Troupe
References
Bruno, Giordano (1973). Literature-IMDb.www.imdb.com>title> literature. Retrieved November 5, 2015.
Bruno, Nettl (2014) Folk and Traditional Music of the Western Continents. Prentice-Hall,Inc.ISBN 0-13-
323247-6 https://en.m.wikipedia.org>wiki>Bruno... Retrieved December 10,2015
Santamaria Matthew. (2005) Alter-Lyricism in the SamaLagu-Lagu: Examining the Creative Sources of the
Sangbay Song Tribute and Its Relationships with the Igal Dance Tradition. UP Diliman Journals Online.
Journals.upd.edu.ph>article>viewFile. Retrieved October 16, 2015.
Mason, Charlotte (2009). Folksong and Hymn Study.www.charlottemasonhelp.com>2009/07. Retrieved January
18, 2016
Asain, Calbi A. (2015)Folk Literature of the Muslim Cultural Communities. ncca.gov.ph Posted April, 2015.
Retrieved December 12,2015
Forrest, Thomas (1969? 1779). Borneo Studies in History, Society and Culture. Edited by Victor T. King,
Zawawi Ibrahim, NoorHasharina Hassan. http://books.google.com.ph>books. Retrieved October 22, 2015
(n.d.). Retrieved September 7, 2015, from https://www.allaboutsikhs.com/punjab-the-folk-songs-and-music
(n.d.). Retrieved October 26, 2015, from Copyright 2015 Kawman Sama Online: Sinama Social Network for
Sama and Bajau.
(n.d.). Retrieved October 26, 2015, from Folk Literature of the Muslim Cultural Communities-National
Commission for Culture and the Arts.
(n.d.). Retrieved October 26, 2015, from www.cebu-philippines.net/philippine-folk-songs.html
(n.d.). Retrieved January 18, 2016, from musicwww.encyclopedia.com/topic/Folk_Music.aspx
(n.d.). Retrieved January 18, 2016, from
www.encyclopediaukraine.com/display.asp?linkpath=pages%5CF%5CO%folksongs.html
(n.d.). Retrieved January 18, 2016, from https://tobyforreal.wordpress.com/2015/10/21/the-awesome-bajau-tribe

Elvinia Reyes- Alivio, Junefe D. Naquira and Josephine M. Lendio/Selected Ongkah-Ongkah of SamaDilaut in
the Province of Tawi-Tawi: Their Forms and Styles of Expression
246
Encyclopedia American International. (1972).
Amilbangsa. (2012). "Pangalay; Ancient Dance Heritage of Sulu". Retrieved January 24, 2016, from
m.inquirer.net/newsinfo/247943
Amilhamja, R. (1998). Daman. Undergraduate Thesis. MSU-TCTO.
Cruz, D. (n.d.). Philippine Folksong and Literature.
Devero. (2001). "Sama Folksongs".
Dumago. (1997). Kata-Kata.
www.cebu-philippines.net/philippine-folk-songs.html)
Mason, C. (n.d.). Retrieved January 23, 2016, from www.charlottemasonhelp.com/2009/07/folk-song-and-
hymn-study.html?m=1
Nettl, B. (n.d.). Retrieved January 24, 2016, from Folk Music: global.britannica.com/art/folk-music
Sabal. (1997). "LANGAN".
Santamaria. (2005). "Alter-Lyricicsm in the Sama Lagu-Lagu:vExamining the Creative Sources of the Sangbay
Song Tribute and Its Relationships with the Igal Dance Traditio".
Thompson, S. (n.d.). Retrieved January 23, 2016, from Folk Literature: www.britannica.com/art/folk-
literature/Major-Forms-of-folk-literature
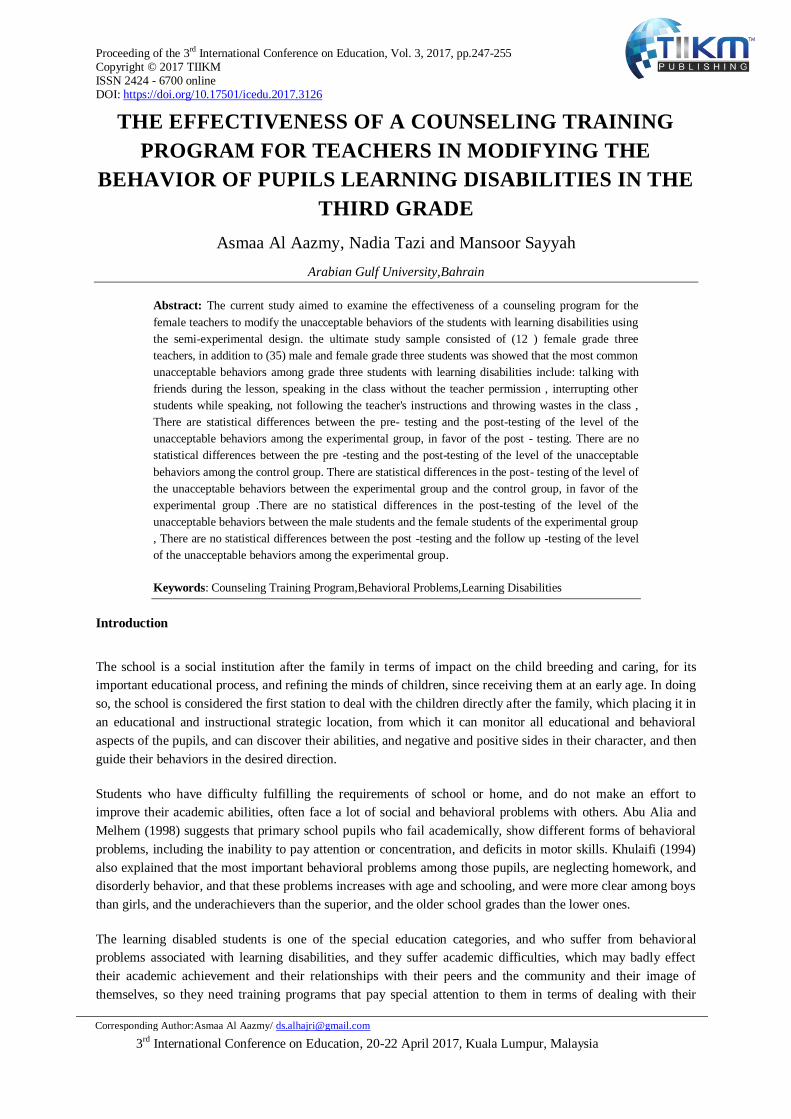
Proceeding of the 3rd International Conference on Education, Vol. 3, 2017, pp.247-255 Copyright © 2017 TIIKM ISSN 2424 - 6700 online DOI: https://doi.org/10.17501/icedu.2017.3126
3rd International Conference on Education, 20-22 April 2017, Kuala Lumpur, Malaysia
THE EFFECTIVENESS OF A COUNSELING TRAINING
PROGRAM FOR TEACHERS IN MODIFYING THE
BEHAVIOR OF PUPILS LEARNING DISABILITIES IN THE
THIRD GRADE
Asmaa Al Aazmy, Nadia Tazi and Mansoor Sayyah
Arabian Gulf University,Bahrain
Abstract: The current study aimed to examine the effectiveness of a counseling program for the
female teachers to modify the unacceptable behaviors of the students with learning disabilities using
the semi-experimental design. the ultimate study sample consisted of (12 ) female grade three
teachers, in addition to (35) male and female grade three students was showed that the most common
unacceptable behaviors among grade three students with learning disabilities include: talking with
friends during the lesson, speaking in the class without the teacher permission , interrupting other
students while speaking, not following the teacher's instructions and throwing wastes in the class ,
There are statistical differences between the pre- testing and the post-testing of the level of the
unacceptable behaviors among the experimental group, in favor of the post - testing. There are no
statistical differences between the pre -testing and the post-testing of the level of the unacceptable
behaviors among the control group. There are statistical differences in the post- testing of the level of
the unacceptable behaviors between the experimental group and the control group, in favor of the
experimental group .There are no statistical differences in the post-testing of the level of the
unacceptable behaviors between the male students and the female students of the experimental group
, There are no statistical differences between the post -testing and the follow up -testing of the level
of the unacceptable behaviors among the experimental group.
Keywords: Counseling Training Program,Behavioral Problems,Learning Disabilities
Introduction
The school is a social institution after the family in terms of impact on the child breeding and caring, for its
important educational process, and refining the minds of children, since receiving them at an early age. In doing
so, the school is considered the first station to deal with the children directly after the family, which placing it in
an educational and instructional strategic location, from which it can monitor all educational and behavioral
aspects of the pupils, and can discover their abilities, and negative and positive sides in their character, and then
guide their behaviors in the desired direction.
Students who have difficulty fulfilling the requirements of school or home, and do not make an effort to
improve their academic abilities, often face a lot of social and behavioral problems with others. Abu Alia and
Melhem (1998) suggests that primary school pupils who fail academically, show different forms of behavioral
problems, including the inability to pay attention or concentration, and deficits in motor skills. Khulaifi (1994)
also explained that the most important behavioral problems among those pupils, are neglecting homework, and
disorderly behavior, and that these problems increases with age and schooling, and were more clear among boys
than girls, and the underachievers than the superior, and the older school grades than the lower ones.
The learning disabled students is one of the special education categories, and who suffer from behavioral
problems associated with learning disabilities, and they suffer academic difficulties, which may badly effect
their academic achievement and their relationships with their peers and the community and their image of
themselves, so they need training programs that pay special attention to them in terms of dealing with their
Corresponding Author:Asmaa Al Aazmy/ [email protected]
Asmaa Al Aazmy, Nadia Tazi and Mansoor Sayyah/The Effectiveness of a Counseling Training
Program for Teachers in Modifying the Behavior of Pupils Learning Disabilities in the Third Grade
248
behaviors and adjust them, in order to help them adapt with the community and the school, so the primary task
of the teacher is to help the student to acquire different types of behavior which prepare him to be a good and
happy citizen who is capable of participating in the production in his society.
A lot of students with learning disabilities suffer from some behavioral problems. Being with normal
intelligence or above average, and possibly higher, these students with LD are more aware of his failure in the
school, they can also be more sensing to the implications of his academic failure on their homes. This
consciousness leads to many kinds of psychological tensions and frustrations that create increasing bad
emotional impact due to his inability to improve his academic level at school, and the implications of this
situation in both school and home (Zayat, 2006).
Research Problem:
Many educators and scholars in the field of education noted that the behavioral problems of students negatively
affect their academic achievement and the nature of the relationship between them and their peers, as well as
their relationships with their teachers and members of his family.
It is often clear to the teacher that students with learning disabilities suffer from behavioral and social problems.
Teachers themselves may be the target of these pupils aggression. Teachers also find out that those pupils do not
comply with the different school rules and demands. Sometimes teachers note that some students are unusually
quiet, or withdraw from social situations and interactions, or do not have friends (Abdullah, 2006).
Research Questions:
What are the unacceptable most frequent behaviors among students with learning disabilities in the third
grade?
Is there any statistically significant differences between the pre and post testing of the unacceptable
behaviors level among the experimental group?
Is there any statistically significant differences between the pre and post testing of the unacceptable
behaviors level among the control group?
Is there any statistically significant differences between the experimental group and the control group in
the post testing of the unacceptable behaviors level?
Is there any statistically significant differences between the males and females of the experimental group in
the unacceptable behaviors level?
Is there any statistically significant differences between the post and the follow-up testing of the
unacceptable behaviors level among the experimental group?
Research objectives:
To identify the most repeated behavioral problems among the third grade primary pupils.
To develop a counseling training program that aim to guide and train regular classroom teachers on how to
deal with behavioral problems of students with learning disabilities, and to verify its effectiveness.
To raise the teachers awareness of the importance of adjusting the unacceptable behaviors among students
with learning disabilities in the regular class, and train them on some behavior modification techniques.
The Research Significance
The results of the current research may be useful for those who work in the field of education, and may
help them in how to deal with pupils with behavioral problems in order to improve their behavior, and may
help to avoid unacceptable behaviors in the classroom.

Proceeding of the 3rd International Conference on Education, Vol. 3, 2017, pp. 247-255
249
The current research highlights the importance of preventive interventions in controlling the student’s
behavior in the classroom, through helping the teacher to know and understand some of the methods and
strategies to face any unacceptable behavior by a pupil.
The current research changes the intervention programs orientation from the pupil to be counseling
programs for the teacher.
Theoretical Framework:
Despite the differing views on the concept of learning disabilities, there is consensus that problems of the
individuals with learning disabilities are real problems and deserve appropriate educational intervention, as they
pose a big problem for many people who suffer from them, as they face real challenges that are not confined to
academic aspects, but these challenges extend to affect the social aspects of their lives as well.
There is no doubt that these problems create a need to guide this group of students. As MacMillan and
Siperstein (2002) confirm that students with learning disabilities who display behavioral problems, are
considered in urgent need of effective interventions because they face academic and behavior problems.
This chapter deals with the theoretical framework, through the following axes: the first axis presents the learning
disabilities, the second axis presents behavior, the third axis presents counseling, in addition to the literature
review related to the subject of study.
Axis I: Learning Disabilities
The concept of learning disabilities:
The field of learning disabilities, as any area, faces of the problem of the definition and the exact description of
the patterns of different behavioral models for children with learning disabilities, and the ensuing confusion and
differences in defining a clear concept of learning disabilities, or confine it to a specific area of study, resulting
in moving many specialists and interested parents to claim for a specific definition of learning disabilities
(Chalfant & ding, 2003).
Historical development, through which the concept of learning disabilities has passed, has led to the emergence
of a variety of different definitions, it addressed the lack of student 's ability to learn normally despite the
availability of mental capacity necessary to learn, and the safety senses such as sight, hearing, and the
availability of appropriate educational opportunities, In addition to the emotional balance, and the lack of
economic constraints or social problems.
And it is obvious that the National Joint Committee on Learning Disabilities NJCLD definition in (1994) is the
most accepted definitions in this area, which defines learning disabilities as: " a general term refers to a
heterogeneous group of disorders, which expresses itself through significant function difficulties in the
acquisition and use of the capabilities of listening, talking, reading, writing, Inference or mathematical abilities,
which are endogenous disorders, and are supposed to be due to a defect in the central nervous system, and can
occur during an individual 's life. It can also be accompanied with self - control problems, and the problems of
cognition and social interaction, but these problems alone do not create learning disabilities. Although learning
disabilities can simultaneously occur with some other disability conditions (such as: senses disabilities,
intellectual disability, or substantial emotional disturbance), or with external influences (such as cultural
differences or insufficient or inadequate teaching / learning), but they - learning disabilities – are not a result of
these conditions or influences (Elison, 2001).

Asmaa Al Aazmy, Nadia Tazi and Mansoor Sayyah/The Effectiveness of a Counseling Training
Program for Teachers in Modifying the Behavior of Pupils Learning Disabilities in the Third Grade
250
The concept of behavioral problems:
Kauffman (1985) refers to the problem or disruptive behavior as: a kind of behavior seen unbearable by those
with power in a culture. Kaufman adds that disruptive behavior is determined by a child’s inability to formulate
his behavior in the daily environment in a way that keeps him away from being blamed by others, and help him
to get accepted by them. He believes that the difference between behave and troubled behavior is in degree and
not in type, normal children do almost everything troubled children do, but not in the same circumstances or the
same rate. Shouting, fighting and urinating.. etc. represent behavioral patterns that can be expected from both
normal children and troubled children, but the circumstances and the rate and intensity of these behaviors among
the troubled children are different from normal children.
The relationship between behavioral problems and learning disabilities:
Studies indicate that students with learning disabilities are more tending and more likelihood to utter
unacceptable and rejection indicating words, and fail to respond to social initiatives by ordinary classmates, and
in return these learning disabled students receive more verbal phrases to take into account the feelings of others
and even more phrases that address competing more than ordinary children (Gable, R, et al, 1998)
The second axis: behavior modification
Definition of behavior:
Behavior is a phenomenon that human behavior scientists study, and there is no doubt that our definition of
behavior has a dramatic impact on the strategies of measurement and treatment that we use. In general we can
define behavior as all the actions and activities of the individual weather visible or not visible. Johnston and
Pennypacker (1980) claims that the scientific definition of the behavior should take into account the interaction
between the individual and the environment, which suggests that this process is of continuous interaction.
Behavior is not a static thing, but it changes, which does not happen in isolation but in the environment.
Johnston and Pennypacker define behavior as "that part of the interaction of the organism with his environment,
through which the organism’s movement or part of it can be explored in space and time, which results in a
change to the measure in at least one aspect of the environment. This means that behavior is a phenomenon that
is studied bythe science of human behavior, and means the interaction between the individual and his
environment (Al - Khatib, 2001).
The importance of behavior modification:
Behavior modification is a learning method that includes the formation of new behavioral patterns, and curbs the
unacceptable habits and responses, and promotes and strengthens acceptable responses, i.e. increasing
acceptable behavior, the formation of new behavior to be learned, and weakening unacceptable behavior. The
importance of behavior modification can be shown in the following points:
It works to train the student (or any person with a disorder) on the skills needed to deal successfully with
different situations at home, school and the surrounding environment.
It increases the capacity of the student’s interaction and social acceptance.
It helps to develop self - concept among students and increase their self confidence. It helps the student to
overcome the symptoms and problems associated with the disorder through more self control, and the
control of responses and increase the motivation and its insistence on completing the work, and increase its
focus during the performance, so as to ensure its academic and social success (Al-Abadi, 2005).
Behavior modification strategies:

Proceeding of the 3rd International Conference on Education, Vol. 3, 2017, pp. 247-255
251
Behavior modification approach is a therapeutic approach, emerged from the traditional behavioral school,
led by Skinner. This approach depend on the principle of reward and punishment when the individual
performs certain behavioral patterns, so acceptable behavioral patterns are rewarded, and the unwanted
behavioral patterns are punished (Al-Zayat, 1998).
The literature Review
Previous studies are reviewed in two axes: studies on the behavioral characteristics of people with learning
disabilities, and studies of programs and strategies used in decreasing and modifying unacceptable
behavior.
The first axis: studies on the behavioral characteristics of people with learning disabilities
Almakanin, Al-Abdellat & Alnagadat (2014) aimed to identify behavioral problems among students with learning
disabilities and their relationship to social efficient from the teachers and peers points of view. The study sample
consisted of (135) male and female students with learning disabilities enrolled in the resources rooms in the schools of
the Southern Region directorates, in Jordan. The study used a measure of two forms, the first form is for teachers and
the second for ordinary students to judge the behavioral problems among students with learning disabilities, the study
also used Walker - McConnell Social efficiency and School adjustment measure. Results of the study showed that the
behavioral problems prevailed among students with learning disabilities, according to teachers’ estimates are: problems
associated to the dimension of ADHD, followed by the problems associated with the dimension of the withdrawal, then
the problems associated with the dimension of stubbornness, then the problems associated with the dimension of
aggression, and the least prevailed behavioral problems are associated with the dimension of dependence. While the
peers estimates of the most prevailed behavioral problems among students with learning disabilities are associated with
the dimension of ADHD, followed by the problems associated with the dimension of the stubbornness, then the
problems associated with the dimension of dependence, then the problems associated with the dimension of
withdrawal, and the least prevailed behavioral problems are associated with the dimension of aggression.
Huwaidi and Yamani (2007) study aimed to identify unacceptable behavior from the point of view of teachers among
the third and sixth grades students of public elementary schools. The number of respondents (249) teachers teaching
these two grades in 19 elementary schools in four governorates in Bahrain. The study used a questionnaire consisted of
(54) items, each of which represents unacceptable behavior, and cover four behavioral areas. The most important
findings indicate that the unacceptable behaviors in common among students are related to those directed towards grade
pupils, followed by those directed to class property, while the least common were those directed towards the teacher, it
turns out that unacceptable behavior is common among male students more than females, while there is no significant
differences between the students of the third and sixth grades.
The second axis: studies of the programs and strategies to reduce and modify unacceptable behavior
Jameel’s study (2005) aimed to verify the effectiveness of a counseling program to modify teachers' attitudes towards
children with learning disabilities, the study sample consisted of (60) male and female teachers of primary school in
Alexandrian. The study findings showed the following: There are significant differences between the experimental and
control groups after applying the counseling Program for the experimental group. There are significant differences
between the pre and post testing of the experimental group in favor of the post testing., and there are no statistically
significant differences between mean scores of the experimental group on attitudes scale directly after the application of
the program and after two months of follow-up.
Sutherland and Wehby (2001) conducted a study that aimed to evaluate the impact of teachers’ behaviors in teaching
such as (variety of teaching methods and classroom activities to achieve academic goals, and providing opportunities for
students to respond to academic tasks, and promoting correct responses) on the behavior of pupils with behavioral and
emotional disorders. the study sample consisted of (20) teachers working in kindergarten through eighth grade, divided
into two groups; (10) teachers in the experimental group, and (10) teachers in the control group. The sample also
included (216) pupils from 20 school classes, of whom (112) pupils with behavioral disorders, and were divided into
experimental and control groups, and (48) learning disabled pupils, and were divided into 20 in the experimental group

Asmaa Al Aazmy, Nadia Tazi and Mansoor Sayyah/The Effectiveness of a Counseling Training
Program for Teachers in Modifying the Behavior of Pupils Learning Disabilities in the Third Grade
252
and (28) in the control group, and (20) students were classified as having mental retardation, and were divided into (14)
in the experimental group, and (6) in the control group. The age range of the respondents is ranging from (5-15) years,
and they all have behavioral problems in the classroom.
We conclude the following:
The possibility of reducing or limiting unacceptable behaviors, and through the use of a set of the strategies that fit the
nature of the problematic behavior, and this is sought by the current study, by focusing on a group of the strategies that
have proven their effectiveness through previous studies, and applied with these pupils to reduce their unacceptable
behaviors.
The unacceptable behaviors can also be reduced by the use of behavior modification mechanisms, as the good behavior
game, verbal reinforcing and token economy and the cost of the response, as well as reinforcing incentives, and varying
teaching methods and classroom activities to achieve academic goals, and providing opportunities for students to
respond to academic tasks, and promoting correct responses. And that's what the current study tried to work with, by
focusing on a range of behavior modification techniques such as behavioral contract, the cost of the response, and
behavior formation through a counseling program.
There is no doubt that the results of previous studies have helped in shaping the problem of the current study and
formulating it in the light of the nature of behavioral problems of the people with learning disabilities, that are different
from those of the ordinary, as well as to proposing a program that includes a range of behavior modification mechanisms
that proved effective in reducing the unacceptable behaviors, as illustrated by the results of previous studies, and thus the
current research methodology was determined, to work to reduce the unacceptable behaviors, and the tools necessary to
determine the most repeated problems.
In addition, the results of previous studies have contributed to identify current research variables, and then the theoretical
framework introduced in the light of those variables.
Finally, the current research results were discussed in the light of the findings to him the results of previous studies,
according to its relation tothe current research results.
Research procedures:
Research Methodology: The research used the quasi experimental methodology, which focuses
on identifying the effect of an independent variable on a dependent one. In this study, the effect of
a counseling program for teachers on modifying the learning disabled students’ unwanted behavior
is verified.
Research variables: The research includes two types of variables:
A. Independent variable: A suggested counseling program for female teachers.
B. The dependent variable: Learning disabled students’ unwanted behaviors.
The research sample: The research sample consisted of two main groups, the teachers’ group (n
=12), which and was distributed into an experimental group (n=6) and a control group (n=6), and
the primary school students’ group (n=35), which was also distributed into two subgroups; the
experimental group (n=19), of which (10) males, and (9) females, and the control group (16), of
which (6) males, and (10) females.
The research tools: The current research used a number of tools, they are divided into two sections:
A. First: diagnosis tools of learning disabilities:
IQ test: Raven Progressive Matrices Test (Arabized by: Awadh, 1999)

Proceeding of the 3rd International Conference on Education, Vol. 3, 2017, pp. 247-255
253
Learning Disabilities Diagnostic Rating Scale (LDDRS) (El-zayat, 2007).
B. Second: The research tools:
The training program for class female teachers (prepared by the researcher), which consists
of 12 sessions, consisting of five mechanisms; behavioral contracts, cost of response,
behavior formation, excessive correction and exclusion from positive reinforcement.
The Unwanted Behaviors Questionnaire (developed by: Huwaidi and Yamani, 2007).
The Unwanted Behaviors checklist (prepared by the researcher).
Research results:
The results of the first question: The unwanted behaviors among the LD students are as follows:talking with colleagues
during the lesson came first, speaking in the class without the teacher's permission came second, interrupting other
colleagues while speaking came third, not following the teacher’s instruction came fourth, throwing the dirt in the class
came fifth.
The results of the second question: There are statistical differences between the pre testing and the post testing of the
experimental group, on theunwanted behaviors questionnaire, and the unwanted behaviors checklist, in favor of the pre
testing, which means that the unwanted behaviors decreased after the counseling program.
The results of the third question: There are no statistical differences between the pre testing and the post testing of the
control group, on the unwanted behaviors questionnaire, and the unwanted behaviors checklist..
The results of the fourth question: There are statistical differences between the experimental and the control group in the
post testing on the unwanted behaviors questionnaire. That the unwanted behaviors are less among the experimental group
more than the control group in the post testing, and the unwanted behaviors checklist.
The results of the fifth question: There are no statistical differences between the experimental group males and females, in
the post testing, on the unwanted behaviors questionnaire, and the unwanted behaviors checklist.
The results of the sixth question: There are no statistical differences between the post testing and the follow up testing of
the experimental groupon the unwanted behaviors questionnaire, and the unwanted behaviors checklist.
Research recommendations:
Adoptingthe behavior formation and the behavior contract in lessening the unwanted behaviors among the LD students in
primary schools.
Developing counseling programs for the teachers and parents of LD students, to raise their awareness of LD.
Developing behavioral, intervention programs, in the light of the LD students’ characteristics.
Training teachers on the behavior modification techniques, to reduce the students unwanted behaviors.
Future research:
Conducting studies similar to this one, on different samples, with different age ranges, and different environments.
Conducting a comparative study to compare the efficiency of the behavior contract technique and the behavior formation
technique in modifying the students’ unwanted behaviors in the class .
Conducting a study to find out the prevalence of behavioral problems among LD students in the primary school.
Asmaa Al Aazmy, Nadia Tazi and Mansoor Sayyah/The Effectiveness of a Counseling Training
Program for Teachers in Modifying the Behavior of Pupils Learning Disabilities in the Third Grade
254
Conducting a study to find out the effect of behavioral problems on other educational phases among LD students.
References
Abadi, M., 2005, Contemporary strategies for the class administration and organization (Oman, Seeb: Aldhamra Library
for Publishing and distribution).
Abdullah, A., 2006, Some cognitive variables for kindergarten children with deficits in the academic skills as an indicator of
learning disabilities. A paper presented in the International Conference on Learning Disabilities, Riyadh, Kingdom of Saudi
Arabia, from 28 October -2 November, 1427, 19-22 / 11/2006.
Abu Alia, M. and Melhem, A. Q., 1998, Effectiveness of the Resource Room Program in reducing behavioral problems
among a sample of female students with academic learning disabilities from the third and fourth grades of Amman City
Schools. Muatah Journal for Research and Studies, 13 (6), 11 - 39.
Aldhaher, Q., 2004, Behavior Modification (2nd Ed.) (Amman: Dar Wael for printing and publishing).
Al-Khatib, J. (2001). Modification of the human behavior (Kuwait: Alfalah Publishing And distribution Library).
Almakaneen, H., Abdullat, B. and Nagadat, H., 2014, behavioral Problems among Students with difficulties learning and
their relationship to Social efficiency from the teachers and peers point of View. Journal of Jordan at Science Education, 10
(4). 503 - 516.
Al-Zayat, F.M., 1998, learning disabilities the theoretical and the diagnostic and therapeutic foundations. (Cairo:
Publishing House of the universities).
Al-Zayat, F. M., 2006, Remedial teaching mechanisms for people with attention deficit hyperactivity disorder. International
Conference on Learning Disabilities, Riyadh, Kingdom of Saudi Arabia, from 28 October -2 November 1427, 19-22 /
11/2006.
Chalfant, J. and Ding, F., 2003, Approach to operationalizing An the definition of learning Disabilities . Learning
disabilities Journal, 9 (4), 34-49.
Cooper, JO, Heron, TE, and Heward, W.L., 1987, Behavior analysis All Applied (Columbus: Merrill Publication Company).
Craighead, WE, Kazdin, AE. and Mahoney, MJ., 1981, Modification Behavior: Principles, issues, and applications
(Boston: Houghton Mifflin Company).
Elison, M., 2001, Behavioral Variables in two learning disabilities Subtypes. Journal of Learning Disabilities, 28, 35 - 46.
Huwaidi, M. and Yamani, S., 2007, unacceptable behaviors from the primary stage teachers and students point of view in
the Kingdom of Bahrain. Journal of Educational and Psychological Sciences, 8 (1) 13 - 44.
Johnston, J. & Pennypacker, H., 1980, Strategies and tactics of human behavioral research (Mahwah, NJ: Lawrence
Erlbaum).
Kavale, K.A and Forness, S.R., 1996, Social skill deficits and learning disabilities: A meta-analysis. Journal of Learning
Disabilities, 29 (3), 226-237.
Kazdin, A.E., 1978, Behavior modification of History: Experimental foundations of contemporary research. (Baltimore:
University Park Press).
MacMillan, D.L, and Siperstein, G.N., 2002, Learning disabilities as operationally defined by schools. In: R. Bradley with
In, L. Danielson, & D. Hallahan (Eds.), Identification of Learning Disabilities: Research to Practice. (Mahwah NJ:
Erlbaum), pp. 520-586.

Proceeding of the 3rd International Conference on Education, Vol. 3, 2017, pp. 247-255
255
Sutherland, K. S. and Wehby, J. H., 2001, Exploring the relationship between increased opportunities to respond to
academic requests and the academic and behavioral outcomes of students with EBD. Special and Remedial Education, 22 ,
113-121.

Proceeding of the 3rd International Conference on Education, Vol. 3, 2017, pp.256-265 Copyright © 2017 TIIKM ISSN 2424 - 6700 online DOI: https://doi.org/10.17501/icedu.2017.3127
3rd International Conference on Education, 20-22 April 2017, Kuala Lumpur, Malaysia
THE EFFECT OF DESIGNING A BLENDED LEARNING
ENVIRONMENT ON ACHIEVEMENT AND DEEP
LEARNING OF GRADUATE STUDENTS AT THE
ARABIAN GULF UNIVERSITY
Ahmed Nouby and Tayseer Alkhazali
Arabian Gulf University,Bahrain
Abstract: The present study aimed to investigate the effect of designing a blended learning environment on achievement and deep learning of the Arabian Gulf university students in a design and presentation of instructional materials' graduate course. A blended learning environment was designed to provide opportunity for integrating the learning management system "moodle" with face-to-face classroom interaction. To investigate research questions, a quasi experimental design was used. The study sample consisted of 19 male and female graduate students pursuing their studies at the "Distance Teaching and Training Program" in the College of Graduate Studies. To explore the extent to which students learnt the course content, an achievement test was used. A deep learning scale was also used
to investigate the depth of learning acquired by students who studied the course content through the blended learning environment. Results of the study showed that students' scores on the post application of the achievement test were improved. No statistically significant differences were found between students' mean scores in the pre and post applications of the depth of learning scale. However, mean of students' scores in the post application of the depth of learning scale was noticed to be slightly higher than that of the pre application. Such higher mean might represent slight improvement in the depth of learning among students.
Keywords: Blended Learning Environment, Achievement, DeepLearning,Arabian Gulf University
Introduction
Recent technological breakthroughs have led to improvements in almost all educational practices. Such
improvements helped teachers educators to develop their pedagogical practices, which in turn impacted
performance of learners whose cognitive and/or knowledge acquisition has increased widely because of integrating advanced e-learning technologies in instruction. Learning via electronic media has become an
integral part of formal educational systems in educational institutions including universities, in particular
(Delacey& Leonard, 2002; Koohang& Harman, 2005; Mason & Rennie, 2006). Further developments in
pedagogical practices have led to emergence of the concept of “blended learning” which mixes traditional
learning and electronic learning. Blended learning has emerged as a natural growth of e-learning. It (blended
learning) came as an attempt to overcome weaknesses of both traditional and electronic forms of learning.
Blended learning as an approach to learning has gained momentum because of its widespread integration in
educational organizations and training centers (Rovai& Jordan, 2004; Young, 2002). Utilization of blended
learning (mixed learning) has proven to enhance and increase the effectiveness and efficiency of teaching and
learning in both instructional and training environments (Bersin& Associates, 2003). Condie and Livingston
(2007) asserted that modification of instructional practices takes place by mixing traditional learning with internet based learning which in turn leads students to: Focus on desired instructional skills such as critical
thinking, carry out their responsibilities in the process of learning, and organize the process of learning
resource utilization. Moreover, mixing traditional and electronic forms of learning (i.e., blended learning)
provides learners with electronic instructional resources viewed to be lacking in traditional learning
environments. As such, it became extremely important to transform traditional learning environment into
blended learning environment where traditional face-to-face classroom engagements are mixed with e-learning
activities. Such a state of affairs contributed in many ways to improvements in learners' achievement of a wide
variety of learning outcomes including learning of concepts and deep learning that will be investigated in this
research paper.
Blended Learning
Recently, it has been repeatedly argued that the term "blended learning" has become a corporate buzzword (Graham, 2004, Lamb, 2001). No clear single definition is available, and no clear common understanding of
what blended learning is all about is available either (Garrison &Kanuka, 2004; Rossett, 2002; Singh & Reed,
Corresponding Author:Ahmed Nouby / [email protected]

Ahmed Nouby and TayseerAlkhazali/The Effect of Designing a Blended Learning Environment on
Achievement and Deep Learning of Graduate Students at the Arabian Gulf University
257
2001; Thomson, 2002). In general, blended learning related literature usually addresses five critical questions
and/or issues that are still not clearly agreed upon by prominent researchers in the field. Such issues include:
Definition of the term blended learning; reasons for that currently exist; difficulties and challenges
encountered by instructors and trainers when blending; and future directions and trends of blended learning
systems (Garrison &Kanuka, 2004, Graham, 2006, Osguthorpe& Graham, 2003). What is clearly agreed upon
among a great many researchers is the following points of departure: Blended learning is a big educational
thing that is replacing e-learning; blended learning is a new innovative way which combines face-to-face
residential learning and computer mediated learning; and the potential that blended learning could become the only way of learning in the future.As a newly developed learning approach that embraces the traditional values
of face-to-face teaching and integrates the best practices of computer mediated learning activities. In blended
learning, electronic learning tools utilize lectures, lessons, and training sessions that usually take place in
regular classrooms connected to internet communication. In this context, Fransen (2006) states that blended
learning is a mix of traditional face-to-face learning and e-learning activities including choices related to the
way content is learnt, different communication tools between teacher and his/her students, between students
themselves, and between students and instructional content to be learnt. Trapp (2006) views blended learning
as an integration of electronic instructional media and traditional teaching methods. Various delivery modes of
instructional materials including a mix of direct lecturing, online communication, self learning activities,
electronic performance support system, and learning management systems are utilized in blended learning
(Kirkley and Kirkley, 2005; 2006). In brief, it can be stated that main components of blended learning as a
newly developed instructional approach include: Face-to-face regular classroom interactions between teachers and their students; traditional learning materials such as printed textbooks, workbooks, work sheets; computer
based learning through e-learning environment, an electronic assessment and feedback. Most importantly, the
learner in blended learning is the center of the learning process (Collis, 2003; Hartman, Dziuban, &Moskal,
1999; Morgan, 2002).
Why Blending?
As strong advocates of blended learning environments, Morgan (2002) and Young (2002) described such
environments as ones that allow users to have the "best of both worlds." if they are well designed. Beyond this
very general statement, research cited in the blended learning literature suggested three main reasons for
adopting blended learning approach over other learning options: (1) effective pedagogical practices, (2)
increased convenience and access to knowledge, and (3) greater cost effectiveness (Graham, 2006). Only as
examples of such reasons, proponents of blended learning environments mentioned the following benefits for blended learning:
- increase in the level of active learning strategies used (Collis, 2003; Morgan, 2002); the learner
rather than the teacher becomes the center of the learning process (Hartman, Dziuban, &Moskal,
1999; Morgan, 2002);
- peer-to-peer learning gets greater emphasis (Collis, 2003);
- flexibility in meeting individual differences and learning styles increased mentoring of individual
learners (Voci& Young, 2001; Waddoups& Howell, 2002);
- the possibility of social interaction and easy communication with distant experts, mentors,
professionals, or peers (Levine & Wake, 2000);
- increased access and convenience to instructional materials (Collis, 2003; Morgan, 2002; Singh &
Reed, 2000);
- reducing learning costs compared to other learning systems (Bersin& Associates, 2003; Singh & Reed, 2001);
- using instructional technology tools and applications in the process of design, implementation and
utilization of instructional materials (Driscoll, 2002; Dziuban, Hartman, &Moskal, 2004; Rossett,
2002; Thomson, 2002); and
- disseminating of knowledge through internet which eliminates information technology literacy
(Graham, 2004; Driscoll, 2002).
Within the context of blended learning benefits, it was argued by Voci& Young (2001) that blended learning
takes into account variation in learning styles of students and allows them to learn at their own pace according
to their individual abilities. Blended learning enables learners to learn independently and be in control of the
learning process coupled with facilitating cooperative learning as well as using advanced instructional
technologies (Dziuban, Hartman, &Moskal, 2004), who in their study found that academic achievement of students, taught through blended learning was very much better than that of students totally taught on the
Proceeding of the 3rd International Conference on Education, Vol. 3, 2017, pp. 256-265
258
internet or taught in traditional classrooms.Results of their study also revealed that many students expressed
dissatisfaction with learning totally on the internet as they miss face-to-face interaction provided in blended
learning. Also in this context, Noirid&Srisa-ard (2007) asserted that blended learning had the potential to
increase learners' comprehension and application of newly acquired skills. Similarly, results of a great many
studies asserted that blended learning has become a learning mode that is increasingly being adopted in
educational and training environments as an effective strategy to improve learning and training outcomes compared to online learning alone (Bersin& Associates; Graham, Allen, &Ure, 2003; Morgan, 2002; Reay,
2001; Rooney, 2003).
Proponents of blended learning such as Collis, 2003; Dziuban, Hartman, and Moskal, 2004; Graham, 2006;
Harman &Koohang, 2005; and Krause, 2007 argued that in order that blended learning programs are
implemented effectively, the following issues must be considered: maintaining good planning to integrate e-
learning technology in a blended learning environment, and to identify function of every medium and how to
accurately use it in the blended learning program by teachers and learners; making sure that learners and
teachers have skills needed to utilize e-learning technology in blended learning environment; ensuring that
equipment, references and different resources needed for blended learning are available; starting the blended
learning program with an introducing session where teachers and learners get to meet face-to-face to explain
objectives, strategies, and implementation procedures of the blended learning program; and ensuring that
teachers are available to respond to learners' enquiries whether online or face-to-face.
Deep Learning
Higher education institutions including colleges and universities are doing their utmost efforts to provide their
learners with the best and most rewarding educational experiences. Realizing that time is ripe to update the
entirely lecture-based traditional pedagogical practices, many universities have begun to change their existing
teaching-learning practices and strategies in order to enhance students' learning experiences. Adoption of deep
learning strategies in colleges and universities is believed to be one factor that leads students' productive
learning experiences (Floyd, Harrington, and Santiago, 2009). In their design–based research study, Shearer,
Gregg, and Joo (2015) explored the concept of deep learning through a series of design changes in a graduate
education course in order to build upon learning activities that instructors expect to reflect deep levels of
learning. Even though the classification of learning preferences into deep and surface learning was developed
by Marton and Saljo back in 1976, there is still no set definition of deep learning and surface learning as approaches to study. Biggs (1987), Entwistle (1981), and Ramsden (1992) elaborated on the classification
proposed by Marton and Saljo and mentioned a list of features that characterize deep learning as an approach
to study: It (deep learning) is connected with intrinsic motivation; focuses on learning principles; relates new
knowledge to previously learnt knowledge; relates students' theoretically acquired ideas to their everyday life
practical situations or experiences ; relates and distinguishes evidence and argument; organizes and structures
content into coherent; connects parts of the subject matter to each other and to real world situations; students
comprehend the world by re-interpreting acquired knowledge; students learn beyond the instructional goals of
the specified courses; finally, and deep learning is perceived to be more intellectually challenging, exciting,
and more satisfying.
Research Questions
1. What are the instructional design standards for designing a blended learning environment?
2. What is the effect of designing a blended learning environment on the Arabian Gulf University students' learning of concepts in a graduate course about the design and presentation of instructional materials?
3. What is the effect of designing a blended learning environment on the Arabian Gulf University students'
deep learning in a graduate course about the design and presentation of instructional materials?
Research Hypotheses
1. Designing a blended learning environment has an effect on the Arabian Gulf University students' learning of
concepts in a graduate course about the design and presentation of instructional materials.
2. Designing a blended learning environment has an effect on the Arabian Gulf University students' deep
learning in a graduate course about the design and presentation of instructional materials.
Research Aims
The present study aimed to investigate the effect of designing a blended learning environment on the Arabian
Gulf University students':
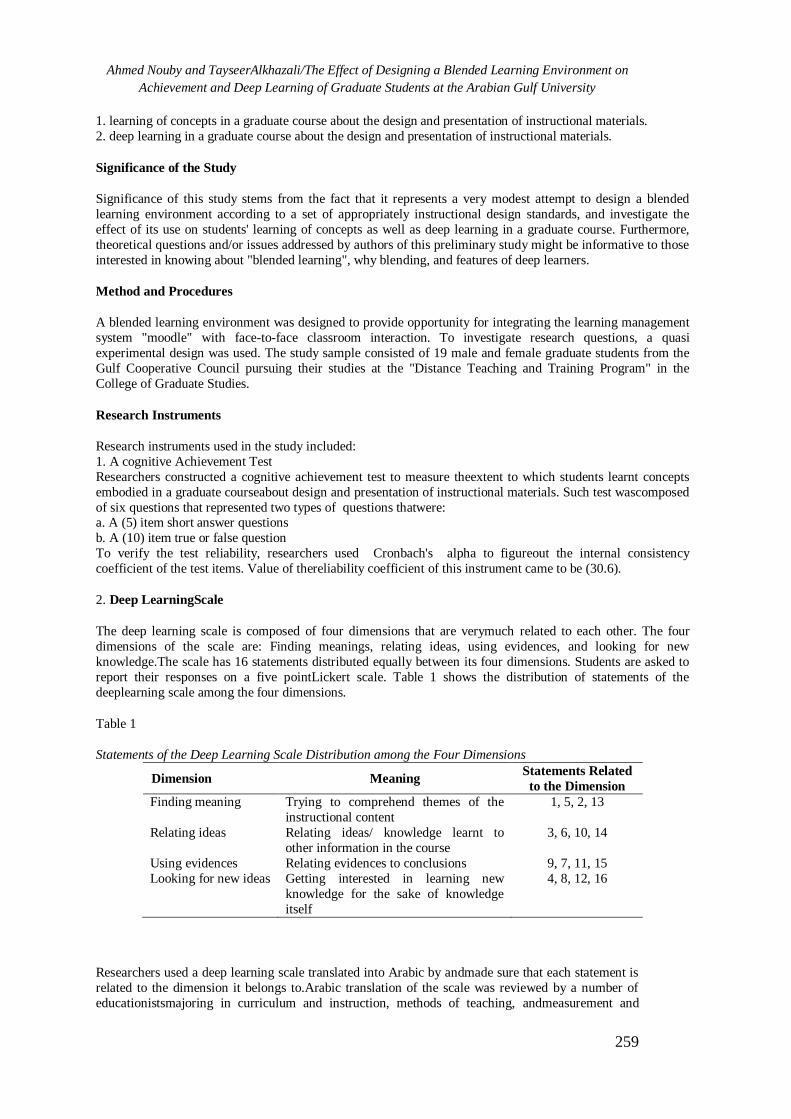
Ahmed Nouby and TayseerAlkhazali/The Effect of Designing a Blended Learning Environment on
Achievement and Deep Learning of Graduate Students at the Arabian Gulf University
259
1. learning of concepts in a graduate course about the design and presentation of instructional materials.
2. deep learning in a graduate course about the design and presentation of instructional materials.
Significance of the Study
Significance of this study stems from the fact that it represents a very modest attempt to design a blended
learning environment according to a set of appropriately instructional design standards, and investigate the
effect of its use on students' learning of concepts as well as deep learning in a graduate course. Furthermore,
theoretical questions and/or issues addressed by authors of this preliminary study might be informative to those
interested in knowing about "blended learning", why blending, and features of deep learners.
Method and Procedures
A blended learning environment was designed to provide opportunity for integrating the learning management
system "moodle" with face-to-face classroom interaction. To investigate research questions, a quasi
experimental design was used. The study sample consisted of 19 male and female graduate students from the
Gulf Cooperative Council pursuing their studies at the "Distance Teaching and Training Program" in the
College of Graduate Studies.
Research Instruments
Research instruments used in the study included:
1. A cognitive Achievement Test
Researchers constructed a cognitive achievement test to measure theextent to which students learnt concepts
embodied in a graduate courseabout design and presentation of instructional materials. Such test wascomposed
of six questions that represented two types of questions thatwere: a. A (5) item short answer questions
b. A (10) item true or false question
To verify the test reliability, researchers used Cronbach's alpha to figureout the internal consistency
coefficient of the test items. Value of thereliability coefficient of this instrument came to be (30.6).
2. Deep LearningScale
The deep learning scale is composed of four dimensions that are verymuch related to each other. The four
dimensions of the scale are: Finding meanings, relating ideas, using evidences, and looking for new
knowledge.The scale has 16 statements distributed equally between its four dimensions. Students are asked to
report their responses on a five pointLickert scale. Table 1 shows the distribution of statements of the
deeplearning scale among the four dimensions.
Table 1
Statements of the Deep Learning Scale Distribution among the Four Dimensions
Dimension Meaning Statements Related
to the Dimension
Finding meaning Trying to comprehend themes of the
instructional content
1, 5, 2, 13
Relating ideas Relating ideas/ knowledge learnt to
other information in the course
3, 6, 10, 14
Using evidences Relating evidences to conclusions 9, 7, 11, 15
Looking for new ideas Getting interested in learning new
knowledge for the sake of knowledge
itself
4, 8, 12, 16
Researchers used a deep learning scale translated into Arabic by andmade sure that each statement is
related to the dimension it belongs to.Arabic translation of the scale was reviewed by a number of
educationistsmajoring in curriculum and instruction, methods of teaching, andmeasurement and
Proceeding of the 3rd International Conference on Education, Vol. 3, 2017, pp. 256-265
260
evaluation. Reviewers were asked to judge the scale’s content validity, its Arabic translation, and
proper wording andrelevance of the statements for each dimension. Internal consistency reliability of
the scale was ascertained through using alpha Cronbach’s coefficient. As the reliability value came to
be (0.86), it was viewed to be acceptable and the scale was appropriate to be used in the study.
Research Procedures
The e-learning environment (moodle) was blended with the face-to-face classroom interaction to create a blended learning environment. The course on “Design and Presentation” of instructional
materials was uploaded on “moodle”, and each student enrolled in the course was provided with
username and password to access the e-learning environment.
Study System and the Teaching-Learning Methods Adopted by the Distance Teaching and Training
Program
Faculty members in charge of the distance teaching and training program adopt a flexible instructional strategy
in which blended learning is employed in carrying out instructional activities as follows:
- Studying the courses (modules) required by admitted students to the master master degree program in distance
teaching and training starts the first week of the first semester of the academic year. Completion of instructional
activities of each module takes four consecutive weeks. During the first week, students meet their instructor in a
computer lab for 30 hours of extensive face-to- face meetings during which the instructor goes over the course
syllabus; explains the course outlines, objectives, and instructional strategies and assessment. An introduction to the virtual learning environment (moodle) takes place during the first meeting of this week. Students are
provided with a course book and other related printed materials to the module content. After presenting the main
ideas of instructional topics included in the three units of the module, the instructor asks students to carry out
learning activities individually, peer groups, or in small groups. Toward the completion of the learning
activities, students present them in class and get feedback from class discussions.
- As the course (module) instructional materials are uploaded on the virtual learning environment (moodle),
students can communicate with their instructors while working on their self learning activities and assignments
during the second week. Furthermore, students can meet with their instructors face-to-face. To activate
cooperative learning, instructors may place some related topics on the moodle and ask students to discuss them
in small groups. E-blogs might be used by instructors in the program.
- During the third and fourth week of the course students free themselves to complete assignments required and submit them electronically on or before due dates.
Design of the Experimental Treatment Materials
The ASSURE instructional design model was used to develop materials of the experimental treatment. This
model provides a systematic way to plan then develop lessons that effectively integrates the use of instructional
media to help assure effective teaching learning practices. Furthermore, the ASSURE model is one of the
instructional design models that can be used by teachers to develop instructional processes making use of
whatever media, resources, facilities or support services are available in classrooms. Each letter of the six letter
ASSURE acronym refers to a step in the instructional design process.
Analyze Learners' Characteristics:
The first step in the ASSURE instructional design model is to analyze the general and specific characteristics
of learners such as age, grade level, motivation level , interests, attitudes, preferred learning styles, and
academic abilities. As such, analysis of characteristics of students representing the present study sample revealed that all 19 male and female students were enrolled in the diploma and master degree programs in
distance teaching and training in the College of Graduate Studies. They come from the State of Kuwait and the
Kingdom of Bahrain. All of them hold a BA or BSc degree in a recognized field of study. It soon became clear
that students representing the sample of the study were intrinsically motivated and very much interested in
pursuing their master and doctorate degrees in the field of distance teaching and training.
Sate Objectives:
In this step of the ASSURE instructional design model standards and learning objectives of the module are
stated. Instructional designer or teacher trainer must specify what the students or trainers will know or will be

Ahmed Nouby and TayseerAlkhazali/The Effect of Designing a Blended Learning Environment on
Achievement and Deep Learning of Graduate Students at the Arabian Gulf University
261
able to do as a result of learning or training. Learning objectives should be stated as specific as possible, and
should be observable and measurable. And in the present research, designing of a blended learning
environment aims to enhance students’ interaction with the instructor and with each other for the purpose of
achieving learning objectives of the module. Interaction with instructional resources and making use of
whatever learning facilities available helps students to accomplish learning or training activities.
Select Media and Materials:
In this step of ASSURE model adoption for planning and developing instructional lessons is to select
instructional technologies, media and materials that are suitable to the learners or trainers and appropriate for the specified learning objectives. In this piece of research a set of instructional materials and a variety of
individual and group of teaching learning activities were designed. Examples of such instructional materials
and activities available for students on the “moodle” included lectures, demonstrations, powerpoint
presentations, discussions, and individual, peer or cooperative group activities. Such instructional materials and
activities were selected to help learners achieve stated objectives of the module.
Utilize Media and Materials:
In this step of the ASSURE instructional design model the instructor or trainer plans to utilize selected media
and materials effectively. A detailed strategy is developed by the instructor or trainer to clarify the following
critical questions: How to use selected media and materials, how much time is needed to go over the materials,
what kind of equipment is needed, what assessment tools or methods used, and what instructional sequence is
appropriate for carrying out instruction? And in this study, the instructor identified the main topics of the
module and explained their learning objectives, determined time needed to discuss each topic, demonstrated methods of presentation and assessment strategies of students’ assignments. Students were added in the module
that has been uploaded on the virtual learning environment “moodle”. Students were also trained to access the
module electronically in order to be able to practice blended learning.
Require Learners’ Responses:
In this step of the ASSURE model a description of how students will handle the information included in the
designed instructional plan is provided by the instructor or trainer. The description shows how the instructor or
trainer intends to make learners actively involved in the instructional activities. As active learning participation
by students is critical for learning to take place, it is extremely important to emphasize role of the learner in
constructing learning activities and practicing them. Activating the notion of the active learning in the present
study, instructor of the module employed dialogue and discussion techniques to motivate students to actively
participate in the learning process. In some cases students were asked to comment on viewpoints proposed by instructor of the module or by their classmates.
Evaluate and Revise Lesson Plan:
Toward the end of offering instructional or training activities, it is extremely significant to conduct
comprehensive evaluation of the learning process for the purpose of finding out whether or not the learning
objectives are actualized. Elements of the learning process that should be evaluated may include presentations,
instructional activities, media and equipment used, support services, and learners themselves. Such
comprehensive evaluation seeks answers to questions like:
- Did the students achieve learning objectives? If so, how well they mastered learning objectives?
- Did the presentations and techniques used help learners or trainees accomplish learning requirements of the
instructional module? Were the students or trainees satisfied with whatever knowledge or skills acquired?
- Did the assessment strategies used match the stated learning objectives?
- Can all learners or trainees use instructional materials properly? - Did the module activities carried out by students encourage them to get involved in blended learning? Did
such activities affect students' attitudes toward learning on virtual learning environments?
Based upon answers to such questions, the instructor or trainer decides whether or not stated learning
objectives are achieved, and revisions follow suit.
Results of the Study

Proceeding of the 3rd International Conference on Education, Vol. 3, 2017, pp. 256-265
262
Results Related to Students' Achievement:
Table 2(T) test results of the significance level of the difference between the experimental group mean scores of
the pre and post applications of the achievement test
Experimental Group
Test Results
Mean SD (t)
value
df Signific
ance
Level
Pre application of the
achievement test
6.1053 0.31530
23.065 18 0.000
Post application of the
achievement test
18.8947 2.53629
Table 2 reveals the difference between the experimental group mean scores of the pre and post applications of
the achievement test. The t test value of (0.000) proved to be statistically significant at (a= 0.05). The mean
score of the experimental group post application of the achievement test was higher than that of the pre
application. This higher value of the mean score may prove that designing a blended learning environment has
a positive effect on students' achievement and/or learning of concepts addressed in the design and presentation
module.
Results Related to Students' Deep Learning:
Table 3(T) test results of the significant level of the difference between the experimental group mean scores of
the pre and post applications of the deep learning scale
Experimental
Group Test
Results
Mean SD (t) value df Significance
Level
Pre application of the
deep learning scale
63.12
50
8.46857
1.388 15 0.186
Post application of the
deep learning scale
65.3750 7.30183
Table 3 reveals the difference between the experimental group mean scores of the pre and post applications of
the deep learning scale. The t test value of (0.186) proved to be statistically insignificant at (a= 0.05). The
mean score of the experimental group post application of the deep learning scale was slightly higher than that
of the pre application. This slightly higher value of the mean score may indicate that designing a blended
learning environment has a modest positive effect on deep learning of students enrolled in the design and
presentation module.
Discussion of Results
With respect to the first research hypothesis related to learning concepts introduced in the design and
presentation module, results of statistical analysis revealed that a statistically significant difference existed between the experimental group mean scores of the pre and post applications of the achievement test. Such
difference was in favor of the post application. The higher value of the mean scores may prove to a large extent
that designing a blended learning environment has a positive effect on students' achievement and/or learning of
concepts addressed in the design and presentation of the distance teaching and training module. Such positive
effect might be interpreted in terms of the effectiveness of the blended learning approach adopted by the
instructor to handle instructional activities of the module. Students got very actively involved in the learning
processes and methods that varied between face-to-face meetings with instructor and e-learning in the virtual
learning environment (moodle). It could be argued that the moodle learning environment enabled students to
establish their own learning community where they get involved in discussions, electronic dialogues, and
cooperative learning activities to accomplish their learning tasks and assignments of the module.As for
statistical analysis of results of students on the deep learning scale, it was shown that no statistically significant

Ahmed Nouby and TayseerAlkhazali/The Effect of Designing a Blended Learning Environment on
Achievement and Deep Learning of Graduate Students at the Arabian Gulf University
263
difference existed between the experimental group mean scores of the pre and post applications of the deep
learning scale. This result might be due to students' interest in learning theoretical parts of the module and their
concentration on completing their assignments as quickly as possible as time available is very limited. Students
did not have enough time to enact deep learning features in their learning of the module. Furthermore, students
responded positively to the statements of the deep learning scale in both applications of the scale, as its
statements were general and simple. Hence, there were no statistically significant differences in the pre and
post applications of the scale. However, the mean score of the experimental group post application of the deep
learning scale was slightly higher than that of the pre application. This slightly higher value of the mean score may indicate that designing a blended learning environment has a modest positive effect on deep learning of
students enrolled in the design and presentation module.
References
Bersin& Associates. (2003). Blended learning: What works?: An industry study of the strategy,
implementation, and impact of blended learning: Bersin& Associates.
Biggs, J. B. (1987). Student approaches to learning and studying. Hawthorn, Victoria: Australian Council for
Educational Research.
Collis, B. (2003). Course redesign for blended learning: Modern optics for technical professionals.
International Journal of Continuing Engineering Education and lifelong Learning, 13(1/2), 22-38.
Condie, R., & Livingston, K. (2007). Blending online learning with traditional approaches: changing practices.
British Journal of Educational Technology, 38(2), 337-348.
Delacey, B. J. & Leonard, D. A. (2002). Case study on technology and distance in education at the Harvard Business School. Educational Technology & Society, 5 (2).
Driscoll, M. (2002). Blended learning: Let’s get beyond the hype.e-learning, 54.
Dziuban, C.D., Hartman, J. &Moskal, P.D. (2004). Blended Learning. EdUCAUSE Center for Applied
Research. Research Bulletin, 7. http://net.educause.edu/ir/library/pdf/ERB0407.pdf
Entwistle, N. J. (1981). Styles of learning and teaching: An integrated outline of educational psychology for
students, teachers and lecturers. Chichester: Wiley.
Floyd, K. S., Harrington, S. J., and Santiago, J. (2009). The effect of engagement and perceived course value
on deep and surface learning strategies. Informing Science: the International Journal of an Emerging
Transdiscipline, 12, 181-190.
Fransen, J. (2006) Eennieuwewerkdefinitie van blended learning (A New Working Definition of Blended
Learning). Dutch Open UniversityJournal ‘OnderwijsInnovatie’, year 8, issue 2, pages 26-29.
Garrison, R. &Kanuka, H. (2004). Blended learning: Uncovering its transformative potential in higher
education. Internet and Higher Education, 7, 95-105.
Graham, C. R. (2006). Blended learning systems: definition, current trends, and future directions. In Handbook
of Blended Learning: Global Perspectives, Local Designs, edited by C. J. Bonk and C. R. Graham, pp. 3-21,
San Francisco, CA: Pfeiffer Publishing.
Graham, C. R., Allen, S., &Ure, D. (2003). Blended learning environments: A review of the research literature.
Unpublished manuscript, Provo, UT.
Harman, K., &Koohang, A. (2005). Discussion board: A learning object. Interdisciplinary. Journal of
Knowledge & Learning Objects. 1, 67-77. Retrieved from http://ijello.org/Volume1/v1p067-077Harman.pdf

Proceeding of the 3rd International Conference on Education, Vol. 3, 2017, pp. 256-265
264
Hartman, J. L., Dziuban, C., &Moskal, P. (1999). Faculty satisfaction in ALNs: A dependent or independent
variable? Paper presented at the Sloan Summer ALN Workshops: Learning Effectiveness and Faculty
Satisfaction, Urbana, Il.
Kirkley, S. E. and Kirkley, J. R. (2005). Creating next generation blended learning environments using mixed
reality, video games and simulations. TechTrends, 49(3), 42-53.
Kirkley, J. R. and Kirkley, S. E. (2006). Expanding the boundaries of blended learning: Transforming learning with mixed and virtual reality technologies. In Handbook of Blended Learning: Global Perspectives, Local
Designs, edited by C. J. Bonk and C. R. Graham, pp. 533-549, San Francisco, CA: Pfeiffer Publishing.
Koohang, A., & Harman, K. (2005). Open source: A metaphor for e-learning. Informing Science.
TheInternational Journal of an Emerging Transdiscipline, 8, 75-86. Retrieved
fromhttp://inform.nu/Articles/Vol8/v8p075-086Kooh.pdf
Krause, K. (2007). Griffith UniversityBlended Learning Strategy.Document number 2008/0016252.
Lamb, J. (2001). “Blended Learning” is the new buzz phrase. FT.com
Levine, S. L., & Wake, W. K. (2000). Hybrid teaching: Design studios in virtual space. Paper presented at the
National Conference on Liberal Arts and the education of Artists, SVA, New York.
Marton, F., &Saljo, R. (1976). On qualitative differences in learning I: Outcomes and process. British Journal
of Educational Psychology, 46, 4-11.
Mason, R., & Rennie, F. (2006). Elearning: The Key Concepts. Taylor & Francis Group. New York.
Morgan, K. R. (2002). Blended Learning: A Strategic Action Plan for a New Campus. Seminole, FL:
University of Central Florida.
Noirid, S., &Srisa-ard, B. (2007). E-learning Models: A Review of Literature.
Osguthorpe, R., & Graham, C. (2003). Blended learning environments definitions and directions. The
Quarterly Review of Distance Education, 43(3), 227-448.
Pereira, J., Pleguezuelos, E., Meri, A., Molina-rose, A., Molina-tomas, & M., Masdeu, C. (2007). Effectiveness
of using blended learning strategies for teaching and learning human anatomy. [Electronic version]. Black
Synergy Journals for Learning, research and professional practice, 41 (2), 189-195.
Ramsden, P. (2003). Learning to teach in higher education. London: RoutledgeFalmer.
Reay, J. (2001). Blended learning- a fusion for the future. Knowledge Management Review, 4(3), 6.
Rooney, J. E. (2003). Blended learning opportunities to enhance educational programming and meetings. Association Management, 55(5), 26-32.
Rossett, A. (2002). The ASTD E-Learning Handbook: McGraw-Hill.
Rovai, A. P.& Jordan, M. (2004).Blended Learning and Sense of Community: A comparative analysis with
traditional and fully online graduate courses. The International Review of Research in Open and Distance
Learning, 5, ISSN: 1492-3831. http://www.irrodl.org/index.php/irrodl/article/view/192/274
Shearer, R. L.; Gregg, A.; Joo, K. P. (2015). Deep learning in distance Education: Are we achieving the goal?
American Journal of Education, 29(2), 126-134.
Singh, H. & Reed, C. ( 2001). Achieving Success with Blended Learning.Centra Software. ASTD State of the
Industry Report. American Society for Training & Development, Retrieved, Jun, 2008. From
http://www.centra.com/download/whitepapers/blendedlearning.pdf

Ahmed Nouby and TayseerAlkhazali/The Effect of Designing a Blended Learning Environment on
Achievement and Deep Learning of Graduate Students at the Arabian Gulf University
265
Thomson, I. (2002). Thomson job impact study: The next generation of corporate learning. Retrieved July 7,
2003, from the World Wide Web:http://www.netg.com/DemosAndDownloads/Downloads/ JobImpact.pdf.
Trapp, S. (2006).Blended Learning Concepts – a Short Overview. Innovative Approaches for Learning and
Knowledge Sharing, EC-TEL Workshops Proceedings, ISSN1613-0073, p. 28-35, 2006.
Voci, E. & Young, K. (2001). Blended Learning working in a leadership development programme. Industrial
& Commercial Training, 33)5(, 157-160.
Waddoups, G., & Howell, S. (2002). Bringing online learning to campus: The hybridization of teaching and
learning at Brigham Young University. International Review of Research in Open and Distance Learning, 2(2).
Young, J. R. (2002). 'Hybrid' teaching seeks to end the divide betweentraditional and online instruction.
Chronicle of Higher Education, A33.
Proceeding of the 3rd International Conference on Education, Vol. 3, 2017, pp.266-279 Copyright © 2017 TIIKM ISSN 2424 - 6700 online DOI: https://doi.org/10.17501/icedu.2017.3128
3rd International Conference on Education, 20-22 April 2017, Kuala Lumpur, Malaysia
EXTENT OF VIABILITY OF UTILIZING INTERNET SHOPS
AS AN ALTERNATIVE LABORATORY IN INTERNET AND
COMPUTING FUNDAMENTALS: BASIS FOR A PROPOSED
ACADEME-INDUSTRY LINKAGE PROGRAM
Kurt B. Catolico
Glan School of Arts and Trades
Abstract: This study attempted to determine the extent of viability of utilizing internet shops as an
alternative laboratory in Internet and Computing Fundamentals taking into consideration the
marketing; technical; management and organization; financial and socio-economic aspects of a
feasibility study. Respondents of the study were internet shop owners in Barangay Poblacion, Glan,
Sarangani Province whose shops were in close proximity to Glan School of Arts and Trades.
The study found out that the extent of utilizing internet shops as an alternative laboratory for grade
nine Internet and Computing Fundamentals students of Glan School of Arts and Trades is much
viable. Hence, an academe-industry linkage program is proposed. This program will serve as a guide
in the implementation of the venture which is an innovative approach to address the gap between
grade nine students who have access to the school computer laboratory from those who do not have.
Keywords: Extent of Viability of Utilizing Internet Shops, Internet Shops as Alternative Laboratory,
Internet and Computing Fundamentals, Academe-Industry Linkage Program
Introduction
The government has been spending much to provide learners with meaningful learning approaches in teaching
computer skills. Fisher (2014) emphasized that technology continues to move on a pace and is used increasingly
to support and enhance teaching and learning. Several studies have already proven that learning could be
significantly improved with the use of computers.
But considering the number of students and the limited learning and financial resources of the Glan School of
Arts and Trades (GSAT), three out of eight grade nine class sections for school year 2014-2015 have been
unable to gain access to the school computer laboratory due to conflicting schedules. Although the school had
been granted a set of 50 computers, still it is not enough to cater the need for hands-on activities of 1,402 grade
seven to grade nine Internet and Computing Fundamentals (ICF) students of GSAT for school year 2014-2015.
Adding to the problem is that these computers have been experiencing system failures attributable to its weak
infrastructure. Tinio (2002) as cited by Jayoma (2013) mentioned the existence of barriers that hinder the use of
computers in the teaching and learning process in her study that covers public high schools throughout the
country.
Bingimlas (2009a) echoed the same difficulties in his study that was conducted outside of our country. The
biggest obstacle identified was the lack of enough computers attributable to the burgeoning student population.
Further hindrances included were lack of funds for operations and maintenance. Problems attributed to weak
infrastructure and scheduling enough computer and internet time for different classes were also noted.
It is in this view that the teacher-researcher conducted this study to look at the extent of viability of utilizing
internet shops noticeably mushrooming in close proximity to schools nowadays as an alternative laboratory for

Kurt B. Catolico/Extent of Viability of Utilizing Internet Shops as an Alternative Laboratory in Internet and
Computing Fundamentals: Basis for a Proposed Academe-Industry Linkage Program
267
hands-on activities of grade nine students in their Internet and Computing Fundamentals subject. This venture is
expected to bridge the gap between students who have access to the school computer laboratory and those who
do not have.
Statement of the Problem
This study aimed to determine the extent of viability of utilizing internet shops as an alternative laboratory in
Internet and Computing Fundamentals.
More specifically, it sought to answer the following questions:
1. What is the extent of viability of utilizing internet shops as an alternative laboratory for
grade nine GSAT ICF students when analyzed according to the following aspects:t
Marketing;
Technical;
Management and Organization;
Financial;
Socio-economic?
2. What academe-industry linkage program can be proposed based on the finding of the
study?
Methodology
Research Design
The nature of the study called for the extensive use of the feasibility study which according Fonollera (2009) is
an evaluation tool used to determine the practicality of a certain idea. It is a tool that systematically explores
whether a given idea will work and whether it should be pursued further for implementation. The study also
used survey method of research.
Research Locale
This study was conducted at Barangay Poblacion, Glan, Sarangani Province which boasts of its pristine
shorelines dotted with strips of powdery white-sand beach resorts facing the Celebes Sea which is among the
Philippines' best beaches. Glan is among the earliest Christian towns in Mindanao testified by its century-old
traditions and the colonial-era structures that stand until today.
Research Respondents
The respondents of this study were the identified internet shop owners currently operating their businesses
within Barangay Poblacion, Municipality of Glan, Province of Sarangani and in close proximity to the Glan
School of Arts and Trades. Table 1 shows the distribution of respondents.

Proceeding of the 3rd International Conference on Education, Vol. 3, 2017, pp. 266-279
268
Instrumentation
A survey questionnaire was prepared as research instrument in gathering the data. It is the best instrument that
can supply the necessary information to complete this study. The said instrument was used to measure the extent
of viability of this venture. It was structured wherein the respondents gave their responses by rating the extent of
viability of the indicators as guided by a five-point scale. The indicators were grouped according to the aspects
of a feasibility study which are marketing; technical; organization and management; financial and socio-
economic. The scale assigned five as the highest rating which can be interpreted as very much viable. This is
followed by four which can be interpreted as much viable; then three as viable; two as less viable; and one
which is the lowest as not viable.
Statistical Tools
Weighted mean was used as a statistical tool to treat the research data.
Results and Concluding Discussions
This study determined the extent of viability of utilizing internet shops as an alternative laboratory for grade
nine Glan School of Arts and Trades students in their Internet and Computing Fundamentals subject. This was
identified using a survey questionnaire that considered the marketing; technical; management and organization;
financial; and socio-economic aspects of a feasibility study; and measured using weighted mean.
The marketing survey focused on how internet shops can accommodate three class sections of grade nine GSAT
ICF students who do not have access to the school computer laboratory which is approximately 50 students per
class. The marketing survey obtained a mean score of 3.80 which is the lowest among the five aspects of a
feasibility study being surveyed and can be interpreted as much viable. The survey shows that internet shops
have limited capacity. Two out of five respondent internet shops can accommodate for as much as 60% of the
students, the rest can accommodate only 10 to 30 percent. In terms of the days and hours that the students can be
accommodated by these shops, it shows that during school days and school hours, internet shops are not jam-
packed. Internet shops are operating at its peak after school hours, between 11:00 am to 1:00 pm and from 5:00
pm to 7:00 pm. Table 2 shows the result of the marketing survey.
The technical survey focused on the existence of computer hardware and software required to carry out the
purpose of utilizing internet shops as alternative laboratory for grade nine GSAT ICF students. Moreover, it
focused on the safety of the students which is of paramount concern. The technical survey result shows a high
mean score which is 4.67 that can be interpreted as very much viable. This means that internet shops are
technically ready to admit students who need their services. Table 2 shows the technical survey result of the
study.
The management and organization survey focused on the acceptability and permissibility of the internet shop to
enter into a Memorandum of Agreement with the school for the shop to be used as an alternative laboratory for
grade nine GSAT ICF students. This survey also dealt with how the shop could manage to prioritize students
from walk-in customers during the agreed laboratory time and to provide additional equipment if necessary. The
management and organization survey obtained a mean score of 4.67 which is similar to that of the technical
aspect and can be interpreted as very much viable. This means that the shop is eager to help the school in
enhancing the computer skills of the students who have no access to the school computer laboratory. Table 2
shows the management and organization survey result.
The financial survey focused on the computer usage rate the internet shop can offer to the students. Moreover, it
tackled on other discount deal on top of the discounted rate that the shop can offer. The survey obtained a mean

Proceeding of the 3rd International Conference on Education, Vol. 3, 2017, pp. 266-279
269
score of 3.93 which can be interpreted as much viable. The survey shows that internet shops are willing to lower
their usage rate from Php12.00 to Php10.00. Further, the shops are also willing to offer additional discount deal
such as a free one hour laboratory time for every 10 hours of laboratory time used. Most of the internet shops
affirmed that they would earn additional income when they would forge partnership with the school in using
their shops as an alternative laboratory in ICF. Table 2 shows the financial survey result.
The socio-economic survey focused on the contribution of the internet shop to the economy; to the school
community and their acceptability of the venture which they can adopt as their corporate social responsibility.
The survey obtained a mean score of 3.93 which is the same as that of the financial aspect and can be interpreted
as much viable. It shows that internet shops are willing to forge partnership with the school and are considering
this linkage as part of their corporate social responsibility. Table 2 shows the result of the socio-economic
survey.
The overall result of the survey attained a grand mean of 4.20. This result leads to an understanding that the
extent of viability of utilizing internet shops as alternative laboratory for Glan School of Arts and Trades grade
nine students in Internet and Computing Fundamentals is much viable. Table 2 shows the result of the study
which is conducted to five internet shops that are in close proximity to GSAT.
Marketing Aspect
Ferrell (2013) described marketing as a process of creating, distributing, promoting, and pricing goods, services,
and ideas to facilitate satisfying exchange relationships with customers and develop and maintain favourable
relationships with stakeholders in a dynamic environment. This aspect discusses the process as mentioned by
Ferrell that would satisfy the need of the customers—the students who have no access to the school computer
laboratory. These students need equitable access to computer resources to develop their computer skills.
Specifically, this aspect discusses the product this venture is expected to offer; the target market for this venture;
the estimated market share; the market demand and supply; the pricing method; and the location of these
internet shops.
Product. Ferrell (2013) defined product as a good, service or idea. This venture is evaluating the practicality of
the idea that internet shops can be utilized as an alternative venue for hands-on activities of grade nine GSAT
students in their ICF subject. With this venture, internet shops are expected to offer services to students by
letting them use computers during the agreed laboratory time at a discounted rate for their laboratory work in
ICF and attending to technical problems that might arise during the aforementioned laboratory activity. The
services that would be rendered to these student customers are geared towards bridging of the gap between
GSAT grade nine students who have access to the school computer laboratory from those who do not have.
Target Market. Ferrell (2013) explained target market as a group of customers on which marketing efforts are
focused. The target market then for this venture is the grade nine GSAT ICF students who do not have access to
the school computer laboratory. Out of eight class sections for grade nine GSAT students for school year 2014-
2015, three sections have been unable to gain access to the school computer laboratory due to conflicting
schedules. These three sections were composed of 149 students. It is approximately 50 students per class. Table
3 shows the projection of grade nine students who would be availing of the service of internet shops being an
alternative laboratory for their hands-on activities in ICF for the next five school years. In order to come up with
this projection, data for this school year and the last two school years were used. In school year 2012-2013,
there were 154 students who were not able to avail of the services of the school computer laboratory while for
school year 2013-2014, the number decreased a little bit to 152. The decreasing number of students is attributed
to the decreasing enrolment due to the establishment of integrated schools as observed by the school records
officer. The projection was computed based on the above stated data using the average rate of decrease. To get
the rate of decrease for school years 2012-2013 and 2013-2014, 154 was subtracted to 152 then the difference of

Kurt B. Catolico/Extent of Viability of Utilizing Internet Shops as an Alternative Laboratory in Internet and
Computing Fundamentals: Basis for a Proposed Academe-Industry Linkage Program
270
two was divided by 154 and then multiplied by 100. The rate of decrease is 1.30%. To get the rate of decrease
for school years 2013-2014 and 2014-2015, 152 was subtracted to 149 then the difference of three was divided
by 152 and then multiplied by 100. The rate of decrease resulted to 1.97%. Now, to get the average rate of
decrease, 1.30% was added to 1.97% which summed up to 3.27%. The sum was then divided by two to get the
average rate of decrease which is 1.64%. Using the average rate of decrease, it is estimated that the number of
target students would decrease by two students per school year until school year 2019-2020.
Estimated Market Share. The market share refers to the portion of the market that can be catered by the venture
since they cannot be catered by the school computer laboratory. To compute for the market share, the enrolled
grade nine GSAT students for school year 2014-2015 had to be determined. School records showed 395 enrolled
grade nine students of GSAT for school year 2014-2015. Grade nine students who have no access to the school
computer laboratory have already been identified earlier. They were 149 students. To get the number of students
who have access to the school computer laboratory, the total number of grade nine students which is 395 was
subtracted with 149. This resulted to a difference of 246. With these data at hand, the market share could then be
computed. The estimated market share of this venture was computed by dividing 149 by 395 then multiplied by
100. This resulted to 38%. In computing the percentage of grade nine students catered by the school computer
laboratory, 246 was divided by 395 multiplied by 100. This resulted to 62%. Figure 1 shows the pie graph of
estimated market share of the venture.
Market Demand and Supply. The market demand refers to the number of students of Glan School of Arts and
Trades who need the services of a partner internet shop as an alternative laboratory for their hands-on activities
in their Internet and Computing Fundamentals subject. These are grade nine students who have no access to the
school computer laboratory. The demand had been identified earlier to be 149 students for school year 2014-
2015. Based on the projected number of students who have no access to the school computer laboratory as
shown in Table 3 on the previous page, the demand is decreasing. For the next five school years, the demand is
estimated to reach only to 139 students. This is approximately 46 students in a class. The cause of the decreasing
demand had been identified earlier as being brought about by the establishment of integrated schools. This was
based on the observation and investigation of GSAT records officer. She explained further that those students
from other barangays especially those from far flung areas had opted to enrol in integrated schools in their
respective communities to save on transportation costs. Supply on the other hand refers to how the identified
need would be met. Supply then would be focusing on the accommodation capacity internet shops can offer for
the market which was identified earlier as the students with no access to the computer laboratory. The
accommodation capacity of internet shops is limited as compared to the average number of students per class
that reached 50 students for school year 2014-2015. The most that an internet shop could cater is only 60% of
students in a class. This is based on the survey conducted which showed that there were two shops that have 30
computer units available for use of students. The survey further attested that internet shops could cater students
only during off peak hours which is school hours. It starts from 7:00 until 11:00 in the morning and from 1:00 to
5:00 in the afternoon. The internet shops are jam-packed at 11:00 in the morning to 1:00 in the afternoon. Peak
hours resume from 5:00 in the afternoon until 7:00 in the evening. This scenario implies that students are the
primary market of these internet shops.
Pricing Method. Internet shops identified as respondents of this study uniformly charge their customers
Php12.00 per hour of computer usage. This means that the pricing method used is the competition-based pricing
strategy specifically the going-rate pricing. According to Mutya (2014), this approach to pricing charges the
same price with that of major competitors.
Location. These internet shops are strategically located near schools which have a constant flow of potential
customers who are students. Figure 2 shows the strategic location of the said internet shops.
Proceeding of the 3rd International Conference on Education, Vol. 3, 2017, pp. 266-279
271
Technical Aspect
Technical Process. In this section, the whole process of the venture will be discussed. First, a feasibility study
should be conducted to know if the venture of utilizing internet shops as an alternative laboratory in ICF is
viable or not. This step would facilitate in identifying which shop should be chosen to partner with. Then, pre-
operating activities should be done. Pre-operating activities include the setting up of the linkage program
committee. This should then be followed by the drafting of the Memorandum of Agreement. According to
Department of Education Western Australia (2010), a Memorandum of Agreement is a written agreement that
helps establish the ground rules for any partnership activities being ventured into. In this venture, it is the
linkage program committee that would spearhead the drafting of the Memorandum of Agreement. A series of
conferences and consultations should be made before finalizing the Memorandum of Agreement. After that, the
signing of the Memorandum of Agreement would follow. Signing of the Memorandum of Agreement signifies
the launching of the proposed linkage program. Then, identifying class sections and students who have no
access to the school computer laboratory should be conducted. Next should be the holding of an orientation
program for parents to understand the venture and gain their all out support. This should be followed by the
scheduling of laboratory time in the partner internet shop. Profiling of computer skills of students would come
next. This is done to determine the level of knowledge a student already possess in using the computer. This
would be used as basis in pairing students during the conduct of laboratory work at the partner internet shop to
maximize the limited accommodation capacity. Then, orienting students on laboratory activities in the partner
internet shop should follow. Lastly, coordinating with the partner internet shop in the preparation for the start of
laboratory activities should be done. After the pre-operating activities, operating activity would follow. This
includes conducting laboratory activities in the partner internet shop. Post-operating activity would be the last
process. This includes conducting post-conferences to evaluate and monitor the implementation of the venture.
Figure 3 shows the service flow chart.
Laboratory Activity Needs. For the skills development of the identified grade nine GSAT ICF students who
have no access to the school computer laboratory, the venture would be needing facilities; machinery and
equipment; furniture and fixtures; and utilities. Facilities include the internet shop room and a comfort room.
Machinery and equipment include computers that are networked and connected to the internet; and cooling
devices such as airconditioner and electric fans. Furniture and fixtures needed are tables and chairs. Utilities
include water and electricity. Table 4 shows the particulars, quantities and specifications of the needs previously
mentioned.
Laboratory Schedule. The total laboratory hours needed is 22 which would start on July and end on February of
the school year totalling to eight months of operation. Laboratory schedule in the partner internet shop is
tentatively scheduled as shown in Table 5.
Safety and Health Requirements. Safety and health requirements are needed in obtaining the necessary annual
permit to operate from government agencies and offices such as the Bureau of Internal Revenue, Bureau of Fire
Protection, Department of Health, Municipal Planning and Development Office, Office of the Barangay Captain
and Office of the Municipal Mayor. These requirements ensure the health, safety, peace, comfort, convenience
and the general welfare of the students who would be availing of the services of the partner internet shop. Based
on the survey conducted, all internet shops have fire extinguishers, fire exits and electrical safety devices
installed such as circuit breakers and magnetic switches. Other considerations such as good ventilation, suitable
lighting, enough working space, cleanliness and sanitation of the area and the imposition of the solid waste
management are evident in the shops.

Kurt B. Catolico/Extent of Viability of Utilizing Internet Shops as an Alternative Laboratory in Internet and
Computing Fundamentals: Basis for a Proposed Academe-Industry Linkage Program
272
Management and Organization Aspect
Organizational Form and Structure. The venture is a partnership between the school and the internet shop which
can best accommodate the number of grade nine students who have no access to the school computer laboratory.
Department of Education Western Australia (2010) stated that one of the reasons a school enters into
partnerships is to provide an opportunity to share skills, effort, cost, and resources for mutual benefit. The
school and the internet shop are two separate entities that would work closely and collaboratively in providing
students with equitable access to computer resources. With this, the school is able to solve its computer-related
problem while the shop earns additional income. Furthermore, this venture would use a simple structure of
management. Robbins and Judge (2011) stated that the simple structure is not elaborate because it has a low
degree of departmentalization and authority is centralized in a single person. The venture would be headed by
the school administrator who is the person in authority. All persons in the organizational chart are already
existing and currently functioning in their respective area and capacity. For the purpose of this venture, a
partnership would be established thus, the need to appoint a linkage program coordinator arises to help the
school administrator in managing the implementation of the venture. Figure 4 shows the organizational
structure of the venture.
Job Specification and Description. For the effective operation of the program, a linkage program committee
should be established. A linkage program coordinator then is needed. He or she should be chosen from among
the faculty of the vocational department teaching Internet and Computing Fundamentals. The succeeding
paragraph discusses the qualifications of the proposed internet shop linkage program committee coordinator.
The linkage program committee coordinator must: (a) be an ICF Teacher; (b) have at least 5 years experience as
an ICF teacher; (c) be a Computer Hardware Servicing NC-II passer; (d) be good in oral and written
communication skills.
The subsequent paragraphs discuss the duties and responsibilities of each person in the implementation of the
proposed linkage program.
The Vocational School Administrator should: (a) initiate the establishment of the linkage program committee;
(b) appoint a linkage program coordinator; (c) work closely with the linkage program coordinator in line with
the planning, implementation, evaluation and monitoring of the program; (d) attend conferences called for the
purpose.
The Vocational Department Head should: (a) assist the school administrator in the establishment of the linkage
program committee and the appointment of the linkage program coordinator; (b) work closely with the school
administrator and the linkage program coordinator in line with the planning, implementation, evaluation and
monitoring of the program; (c) attend conferences called for the purpose.
The Linkage Program Committee Coordinator should: (a) spearhead the drafting of the Memorandum of
Agreement and other documents required; (b) seek to sustain the partnership between the school and the partner
internet shop; (c) consolidate the needed reports; (d) schedule conferences needed in the conduct of the linkage
program; (e) preside over planning, monitoring, and evaluation conferences; (f) work closely with the school
administrator, the department head, the internet shop owner, the ICF teacher and the shop assistant in line with
the planning, implementation, evaluation, and monitoring of the program.
The Internet Shop Owner should: (a) work closely with the linkage program coordinator, the ICF teacher and
the shop assistant in line with the planning, implementation, evaluation and monitoring of the program; (b)
attend conferences called for the purpose.

Proceeding of the 3rd International Conference on Education, Vol. 3, 2017, pp. 266-279
273
The ICF Teacher should: (a) assist the linkage program coordinator in preparing the needed documents; (b)
prepare the necessary reports; (c) orient students on the guidelines for the safe and orderly conduct of laboratory
activities; (d) supervises laboratory activities in the partner internet shops; (e) work closely with the linkage
program coordinator, the internet shop owner and the shop assistant in line with the planning, implementation,
evaluation and monitoring of the program; (f) attend conferences called for the purpose.
The Shop Assistant should: (a) ensure the readiness of the shop prior to a scheduled laboratory activity; (b) work
with the ICF teacher during laboratory activities whenever technical assistance is needed; (c) work closely with
the linkage program coordinator, the internet shop owner and the ICF teacher in line with the planning,
implementation, evaluation and monitoring of the program; (d) attend conferences called for the purpose.
Pre-Operating Activities. These are activities prior to the conduct of laboratory work in the partner internet
shop. These include: Conduct of a feasibility study; establishment of the linkage program committee; drafting
and eventually the signing of the Memorandum of Agreement after a series of consultations and conferences
with the school’s stakeholders; identification of class sections and students who have no access to the school
computer laboratory; profiling of computer skills of the students; holding of an orientation program for parents;
scheduling of laboratory time; orienting students on laboratory activities in the partner internet shop; and
coordinating with the partner internet shop in preparation for the start of laboratory activities. Figure 5 shows a
Gantt chart which illustrates the schedule of activities prior to the implementation of the venture.
Documentary Requirements. This venture requires the drafting of a memorandum of agreement between the
school and the partner internet shop that will serve as a guide in the implementation of the venture. Other
needed documents include a linkage program. This program reflects the description and rationale of the venture.
It also reflects the objectives, the methodology matrix, the laboratory schedule and the means of evaluation and
verification.
Financial Aspect
Financial Assumptions. Revenue from the venture would be realized through the delivery of services of the
partner internet shop. Accounting for the revenue is essential in the preparation of the income statement.
According to Brigham (2014), an income statement is a report that summarizes the revenues, expenses and
profits during a reporting period of a particular business or venture. Assumptions that would serve as a guide in
the preparation of the income statement are discussed in the succeeding paragraphs.
The income statement of the venture is to be prepared at the end of the school year. Service Income from the
venture is to be projected for the next five years. Fanollera (2009) emphasized that projected financial
statements such that of an income statement generally cover the first five years. It is assumed that the internet
shop which can best accommodate the number of students would be used as basis in the computation of service
income. It would not be computed based on the number of target students but rather on the full capacity of the
partner internet shop. The annual service income that would be generated by this venture was derived from
determining the accommodation capacity of the partner internet shop which in this case is 30 students per hour
based on the maximum number of computer available for the use of students which is 30 computer units. This
was then multiplied to the regular rate per hour which is Php12.00. The product then was multiplied to the total
number of laboratory hours in one school year which is 22 hours. The result was multiplied again to the number
of class sections who would be benefiting from the venture which is three sections to finally arrive at the annual
service income of the venture.
Since income is to be projected for the next five years, the regular computer usage rate for the first year of
operation should be subjected to increase using the average inflation rate for the last five years. This is done to
cover also the rising expenses due to inflation. According to Harrison (2010) inflation is an increase in the price

Kurt B. Catolico/Extent of Viability of Utilizing Internet Shops as an Alternative Laboratory in Internet and
Computing Fundamentals: Basis for a Proposed Academe-Industry Linkage Program
274
of goods or services that is not offset by an increase in quality. To compute for the average inflation rate,
inflation rates for the last five years should be determined. The year 2010 obtained an inflation rate of 3.8%.
For the year 2011 it was 4.7%. It was 3.2% for the year 2012. It plummeted to 2.9% in the year 2013. The year
2014 reaped a rise to 4.2%. These figures were summed up and then divided by five to get the average inflation
rate of 3.76%. With this, the regular computer usage rate of Php12.00 for the first year was subjected to increase
by 3.76% in the following year up to the fifth year. Table 6 shows the projected service income.
The estimated expenses directly attributable to the operation of the venture were determined through interviews
with internet shop owners. Expenses included were salaries and wages of the shop assistant; depreciation of
facilities, equipment, furniture and fixtures; rent of the shop room; internet connection fee; utilities which
consist of electricity and water; permit and licenses; and repairs and maintenance of the computer units.
Depreciation expense was computed using the straight-line method. Harrison (2010) elaborated that in the
straight line-method, an equal amount of depreciation is assigned to each year or period of asset use. Harrison
added that in order to come up with depreciation expense using the aforementioned method, estimated useful
life of the asset is determined. Estimated useful life is the length of service expected from using the asset. In this
case, the estimated useful life of computers was assumed to be five years. The useful lives of other laboratory
needs such as other machines and equipment; and furniture and fixture were assumed to be 10 years.
Depreciation was computed by determining the total amount of depreciable assets. The amount was then divided
by the useful lives of the determined depreciable assets to get the annual depreciation expense. From the annual
depreciation expense, the hourly depreciation expense could then be computed. This was then multiplied to the
total number of laboratory hours in a school year then multiplied again by the total number of class sections who
would be benefitting from the venture to arrive at the total depreciation expense of the venture. Other expenses
were also computed by getting the hourly expense multiplied to the total number of laboratory hours in a school
year then multiplied again by the total number of class sections who would be benefitting from the venture.
These expenses were assumed to increase using the previously computed average inflation rate for the last five
years which is 3.76%. Appended supporting schedules that show the amount of each of the specified expenses
are presented on page 72, 73 and 74.
Valencia and Roxas (2013) stated that a registration for VAT business of a taxpayer becomes compulsory when
the annual gross sales or receipts of the business exceed 1,919,500.00 a year. Since internet shops were not able
to reach that requirement, they were not qualified to be considered a VAT business, hence, they were generally
subjected to three percent other percentage tax on gross sales or receipts. Table 6 shows the projected income
statement to be generated by the partner internet shop through the venture.
Socio-Economic Aspect
This section discusses the contribution of the venture to the government; its effect to the students; its
contribution to the school; and the corporate social responsibility.
Contribution to the Government. This venture has a significant contribution to the economy. With an additional
income, the partner internet shop could pay more taxes thus generating more income to the government in
funding government projects such as infrastructures and social services that improve living conditions of the
people in the community.
Effect to the Students. According to Geselbracht (2000) as cited by Bingimlas (2009) that this venture when
pushed through would result to the provision of quality access to computer resources for grade nine GSAT ICF
students. Geselbracht added that with this, interest of students in learning could greatly improve which would
then result to improved learning outcomes.

Proceeding of the 3rd International Conference on Education, Vol. 3, 2017, pp. 266-279
275
Contribution to the School. This venture would help the school in bridging the gap between students who have
access to the school computer laboratory from those who do not have.
Corporate Social Responsibility. This venture can be considered as the corporate social responsibility of the
partner internet shop. The partner internet shop is engaged in an activity that is very beneficial to the educational
community. The discounted rate and additional discount deal that the partner internet shop is willing to offer
would be a great contribution to the community as a whole because it advocates the aim of the community to
become a one sharing and caring community.
Fanollera (2009) stated that the result of a feasibility study serves as a basis for deciding to pursue its
implementation or not. With the findings of this study, the proposed idea of utilizing internet shops as an
alternative laboratory in ICF worked and should be pursued.
Based on the findings of the study, an academe-industry linkage program is proposed. Profeta (2003) as cited by
Hagos and Dejarme (2008) asserted that personal growth and development are best achieved by an educational
method that combines classroom learning with periodic intervals of planned and supervised practical experience
outside of the academe. Below is the proposed academe-industry linkage program.
References
Bingimlas, K. A. (2009). Barriers to the successful integration of ICT in teaching and learning: a review of the
literature. Eurasia Journal of Mathematics, Science and Technology Education.
Brigham, E., et. al. (2014). Core concepts of financial management. Singapore: Cengage Learners Asia.
Department of Education Western Australia (2010). A guide to establishing partnership arrangements between
schools and registered training providers. Retrieved on January 22, 2015 from
http://www.det.wa.edu.au/
curriculumsupport/vetis
Fanollera, D. (2009). Module 1: Feasibility study, project proposal and business plan. Zamboanga:Western
Mindanao State University Printing Press.
Ferrell, O. C., et. al. (2013). Marketing. Singapore: Cengage Learning Asia.
Hagos, L. & Dejarme E. (2008). Enhancing curriculum in Philippines school in response to global community challenges. Our Lady of Fatima University. Retrieved on September 10, 2014 from
http://ro.ecu.edu.au/cgi/view content.cgi?article=1020&context=ceducom.
Harrison, W. T. (2010). Financial accounting: International financial reporting standards. Singapore: Pearson
Education South Asia.
Mutya, R. F. (2014). Elements of marketing. Quezon City: National Book Store.
Robbins, S. P. & Judge, T. A. (2011). Organizational behavior. Singapore: Pearson Education South Asia.
Valencia, E. G. and Roxas, G. F. (2013). Transfer and business taxation: Principles and laws with accounting
applications. Baguio City: Valencia Educational Supply.
Appendices
Table 1 Distribution of Respondents
Respondents f %
Greenzone Internet Cafe 1 20%
Redzone Internet Cafe 1 20%
Rage Quit Internet Cafe 1 20%
Ghaga Taping Portrait and
Internet Cafe 1 20%
Hotspot Internet Cafe 1 20%
Total 5 100%

Proceeding of the 3rd International Conference on Education, Vol. 3, 2017, pp. 266-279
276
Table 2 Extent of Viability of Utilizing Internet Shops as an Alternative Laboratory in ICF
Indicators Mean Score Description
1. Marketing Aspect 3.80 Much Viable
2. Technical Aspect 4.67 Very Much Viable
3. Management and
Organization Aspect 4.67 Very Much Viable
4. Financial Aspect 3.93 Much Viable
5. Socio-economic Aspect 3.93 Much Viable
Grand Mean 4.20 Much Viable
Table 3 Projected Number of Grade Nine Students who have no Access to the School Computer
Laboratory for the Next Five School Years
SYSYsS 2015 - 2016 2016 - 2017 2017 - 2018 2018 - 2019 2019 - 2020
Projected Number of Students 147 145 143 141 139
Projected Average Number of
Students per Class 49 48 48 47 46
Figure 1. Estimated Market Share of the Venture
Figure 2. Location Map of Glan School of Arts and Trades and Internet
Shops

Kurt B. Catolico/Extent of Viability of Utilizing Internet Shops as an Alternative Laboratory in Internet and
Computing Fundamentals: Basis for a Proposed Academe-Industry Linkage Program
277
Figure 3. Service Flow Chart of the Venture
Table 4 Laboratory Activity Needs
Particulars Quantity Specifications
Facilities
Shop Room 1 Can accommodate 50 students.
Comfort Room 2 Genderized
Machineries and Equipment
Personal Computers 30
Internet connected; networked;
with access to a printer;
with other peripherals such as
webcam, speaker or headphone,
microphone, back-up devices; installed with MS Word, Excel,
PowerPoint and Internet
Explorer;
installed with a firewall and an
anti-virus software.
Airconditioning Unit 1 Window type; 2.5 horse power.
Electric Fan 2 Stand Fan
Furniture and Fixtures
Long Tables 6 With division and can cater 5
computers per table.
Table/Counter 1 Designed for cashiering and for
the server.
Chairs 31 Mono-block plastic chairs
Table 5Tentative Laboratory Schedule
Learning Outcome No. of Lab
Hours Time
1. Access the Web 4 3rd and 4th week of July
2. Search the Web 3 3rd and 4th week of August
3. Download Web Pages 3 3rd and 4th week of September

Proceeding of the 3rd International Conference on Education, Vol. 3, 2017, pp. 266-279
278
4. Send and Receive E-mail 5 3rd week of October/1st and 2nd week of
November
5. Create PowerPoint Presentation 7 3rd and 4th week of January/1st and 2nd week of
February
Total No. of Lab Hours 22
Figure 4. Organizational Chart of the Venture
Activities
2015
J
a
n
F
e
b
M
a
r
A
p
r
M
a
y
J
u
n
J
u
l
1. Conducting of a feasibility study.
2. Setting up of the linkage program committee.
3. Drafting of the Memorandum of
Agreement.
4. Signing of the Memorandum of
Agreement.
5. Identifying class sections and students who have no
access to the school computer laboratory.
6. Holding of an orientation program for parents.
7. Scheduling of laboratory time.
8. Profiling of students’ computer skills.
9. Orienting students on laboratory activities in the
partner internet shop.
10. Coordinating with the partner internet shop in
preparation for the start of laboratory activities.
11. Start of Implementation.

Kurt B. Catolico/Extent of Viability of Utilizing Internet Shops as an Alternative Laboratory in Internet and
Computing Fundamentals: Basis for a Proposed Academe-Industry Linkage Program
279
Figure 5. Gantt Chart for Pre-Operating Activities
Table 6 Projected Income Statement for the Next Five Years
Partner Internet Shop
Income Statement
(Income to be Generated through Partnership with GSAT)
For the School Year ended March 2016, 2017, 2018, 2019, 2020
2016 2017 2018 2019 2020
Service Income 23,760.00 24,653.38 25,580.34 26,542.16 27,540.15
Expenses
Salaries and
Wages 458.33 475.56 493.44 512.00 531.25
Depreciation 1,397.45 1,449.99 1,504.51 1,561.08 1,619.78
Rent 916.67 951.14 986.90 1,024.01 1,062.51
Internet
Connection 183.33 190.22 197.38 204.80 212.50
Utilities 504.17 523.13 542.80 563.21 584.38
Permit and
Licenses 71.70 74.40 77.19 80.10 83.11
Repairs and
Maintenance 114.58 118.89 123.36 128.00 132.81
Total Expense 3,646.23 3,783.33 3,925.58 4,073.18 4,226.33
Operating Income 20,113.77 20,870.05 21,654.76 22,468.98 23,313.81
Business Tax (3% of
Gross Income) 712.80 739.60 767.41 796.26 826.20
Net Income 19,400.97 20,130.45 20,887.35 21,672.72 22,487.61

Proceeding of the 3rd International Conference on Education, Vol. 3, 2017, pp. 280-298 Copyright © 2017 TIIKM ISSN 2424 - 6700 online DOI: https://doi.org/10.17501/icedu.2017.3129
3rd International Conference on Education, 20-22 April 2017, Kuala Lumpur, Malaysia
AMBITION LEVEL AND ITS RELATION TO
EXCESSIVE COMPETITION AMONG MUSICALLY
GIFTED STUDENTS AT THE HIGHER INSTITUTE
OF MUSICAL ARTS IN KUWAIT
Mashail K. H. Boshehri1, Fatima Ahmed Al-Jasim
2 and Mohammed J. Jamalallail
3
1Researcher in Gifted Education 2,3Arabian Gulf University, Bahrain
Abstract: This study aimed at investigating the Ambition Level and its Relation to Excessive
Competition among Musically Gifted Students at the Higher Institute of Musical Arts in Kuwait. The
researcher used the Descriptive Method. The study sample consisted of (123) students (69 males)
and (54 females). The researcher used two instruments to gather information, the scale of ambition
level and the scale of excessive competition. The study results showed the following: there are no
statistical significance between the mean of musically gifted students in Kuwait on the dimensions of
ambition (optimism, acceptance of novelty, tolerance of frustration) by different specialties, except
the dimension of the ability to set goals where there were statistical significant differences in favor of
students in the piano specialty. The results also showed that there were no statistically significant
differences between the means of musically gifted students in Kuwait in the total score on the scale
of excessive competition depending by different specialties. There was an average, positive and
statistically significant correlation between the total score of the ambition level ambition and the
total score of the excessive competition among musically gifted students. The level of competition
among musically gifted students can be predicted from the dimensions of ambition level.
Keywords: Ambition Level, Excessive Competition, Musically Talented, Kuwait
Study Background
Ambition is one of the most important features that have played a major role in the rapid development around
the world in recent times. It is the drive that sharpens mettles and organize ideas to raise the level of life from
one level to another advanced one. As long as the human being has ambition, there is no limit to scientific and
civilizational development because it is one of the important factors influencing human activities and ideas. The
level of nation's progress is measured by the ambitions of their members. Thus, ambition can be considered one
of the most important constants that can distinguish one person from another, and this constant is affected by
environmental, psychological and social factors.
The level of ambition is the motive and impulse for work to raise attainment, achievement and success in
various areas, as the level of ambition is an essential part of the psychological construction of the human being.
It promotes optimistic beliefs in the individual to be able to control various forms of psychological pressure. The
person who believes in his ability to achieve his intention can manage his life in a more subjective and active
manner, which in turn increases his sense of control over the environment and its challenges (Harbi, 2014).
The level of ambition is usually related to gifted students due to the mental characteristics and traits they
possess. High ambition is one of the characteristics of the gifted student. The gifted have many characteristics
such as the ability to recognize relationships, strong memory, the multiplicity of interests, the perception of
substances, the high expectations of self and others, vulnerability, compassion, and the desire to be accepted by
others. They are emotionally stable and less prone to nervousness and mental distraction than ordinary students.
Corresponding Author: Mashail KH. Boshehri

Mashail KH. Boshehri1, Fatima Ahmed Al-Jasim and Mohammed J. Jamalallail/Ambition Level and its Relation to Excessive Competition among Musically Gifted Students at the Higher Institute of Musical arts in Kuwait
281
Their thinking is characterized by quality, originality and addressing and treating ideas. They have a wide range
of interests, and they are hard workers. They feel joy of achievement, and they have motivation to find new
ways to work. They are more challenging and have a hard time backing back. They are characterized by
divergent thinking, excitement and deep awareness. Most gifted people are distinguished in cognitive processes,
moral maturity, leadership and good humor (Garwan, 2004). ).
Al-Jabbari’s study (2008) revealed that the level of psychological and social compatibility and the level of
ambition among the students of the Technical Institute in Kirkuk is higher than the assumed mean in the scale.
There is a negative correlation between psychological and social compatibility and the level of ambition, and
there are no statistically significant differences in psychological and social compatibility and its relation to the
ambition of the students of the Institute based on the variables of gender and specialization.
Barakat’s study (2009) dealt with the relation of self-concept to the ambition level of Al-Quds Open University
students in light of the variables of gender, specialization, and the academic achievement. The results of the
study showed that the level of self-concept and the level of ambition of the study sample was within the average
level, and that there is a positive correlation between the self-concept and the ambition level of the university’s
students. The results also showed that there were statistically-significant differences in the grades of students on
the scales of self-concept and the ambition level based the variable of academic achievement in favor of the
student group with high achievement, and there was were significant differences in these grades based gender
and specialization.
The aim of Salem, Qumbel and Al-Khalifa’s study (2012) was to find out the correlation between achievement
motivation, locus of control, ambition level, and academic achievement of university students in Sudan. The
study showed a statistically significant negative correlation between the achievement motivation and locus of
control, a positive correlation between the achievement motivation and ambition level, and a statistically
significant interaction between the levels of achievement motivation and levels of locus of control over
scholastic attainment.
The aim of Kazmi's study (Kazmi, 2012) was to identify anxiety as an indicator of the ambition level among
gifted students as well as the relationship between ambition and anxiety among academically superior students.
The results of the study showed that the achievement pattern of students depends on the level of ambition and
anxiety. The more the students’ anxiety to get higher grades, the less their ambition; whereas students with no
anxiety have a higher level of ambition.
The aim of Salhi’s study (2013) was to reveal the correlation between the psychological stress and the level of
academic ambition of students residing in the University of Ouargla. The study sample consisted of female and
male and female students residing in the university dorms. The sample size was 255 students. The study used
the scale of the psychological stress as well as the scale of ambition level prepared by the researcher. The results
of the study showed that there were no differences between the female and male students residing in the
university dorms in the level of psychological stress. The results of the study also showed that there were no
differences between the students residing in the university dorms in the degree of psychological stress according
to their academic grade in the first year and third year. The results of the study also showed there were
differences in the psychological stress level among students from the Faculty of Social and Human Sciences and
the Faculty of Natural Sciences and Life.
The aim of Chen’s study (Chen, 2014) was to identify the impact of self-efficacy on the ambition level of
college students and to identify the differences between international and local students in the international
community colleges of the in the United States in how self-efficacy affect the ambition level of students. The
results of the study showe there were no statistically significant differences in the level of self-efficacy among
international and local students. The results of the study showed that the factors of self-efficacy (effort,

Proceeding of the 3rd International Conference on Education, Vol. 3, 2017, pp. 280-298
282
initiation, and time management) affect the ambition level of both international and local students in community
colleges.
There is a clear assumption regarding the ambition level and the intensity of goal pursuit that the high level of
ambition simulates the behavior of the student and perpetuates and drive this behavior towards a specific goal.
The results of Cochran’s study (Cochran, 2009) who is one of the first researchers to be concerned with the
topic of ambition and the level of excessive competition and conflict among gifted students. Gifted, highly
ambitious students are found to be highly motivated and often seek rewards or awards by seeking more learning.
Gallagher’s study (2002) shows that low motivation, perseverance and ambition of the gifted are influenced by
many factors, the most important of which are environmental factors and conditions surrounding them, which
appear in the methods of education, which depend on strict and harsh methods and the lack of freedom of
opinion and self-reliance. Parents and teachers don’t show encouragement and appreciation for achievement,
which lead to a weak parental relationship between children and parents and between the teacher and students.
Gallagher shows that the gifted person in this case may resort to the group of comrades and colleagues to obtain
gratification, satisfaction and appreciation. Hence, he show behaviors that may be negative towards the family
and the school and this leads to increased punitive aspects of the gifted, which in turn affects their level of
ambition and perseverance for learning and acquiring skills.
Sanda, Harrod and Hamilton (as reported in Attar, 2012) say that gifted students do not develop skills and social
relationships because they do not feel strong competition among peers and thus cancel their friends' presence in
the same level of sharing interests, dispositions and needs. As a result, they feel loneliness and isolation. The
more the mental age and level of intelligence or talent, the greater the gap or space between gifted students and
ordinary colleagues. They become unacceptable and very competitive, and do not feel comfort and harmony
with them, leading to more loneliness and withdrawal.
Competition is one of the fundamental aspects of social relationships within peer groups. Each gifted teenager
has a special style of competition, which appears in his own requirements and defines the goals he is working
hard to achieve. In adolescence, the individual has an awareness of many aspects that surround him, such as the
social and economic aspects of his family. If he reaches the middle stage of education, he will be aware of the
meanings of social symbols, just like mature adults. In addition, the phenomenon of competition has many
entanglements in the attitudes of the gifted towards achieving personal fulfillment. It compels the responsible
person whether in the family or school to take full precautions in how to deal with the gifted teenager because of
his gravity that reflects positively or negatively on the family and society (Cochran, 2009).
Although competition is a strong and vital motivation in its wide use among students in learning in the
classroom, which in turn develops the performance of musically gifted students, it shows talents randomly and
with organization, resulting in the loss of the importance of talent. It may turn into excessive competition when
it turns into selfishness and individuality in the behavior of students, and jealousy and progress appear more.
The student may resort to illegitimate and twisted methods to show his talent as the best among his peers
(Cantador&Conde, 2010).
One of the studies aimed at identifying the level of scientific competitiveness among graduate students and the
impact of academic competition on students in the educational system is Kretsinger’s study (2003). The results
showed that the focus on excellence is the motivation of many students towards competition. The results also
showed that students depend on illegal methods to obtain high grades and achieve excellence because of the
competition motivated, which affects the psychology of students and their relations with each other.
The aim of Ponzo’s study (2009) was to identify the impact of competition among students on their academic
achievement. The results of the study showed a statistically significant direct correlation between the academic

Mashail KH. Boshehri1, Fatima Ahmed Al-Jasim and Mohammed J. Jamalallail/Ambition Level and its Relation to Excessive Competition among Musically Gifted Students at the Higher Institute of Musical arts in Kuwait
283
performance of students and the degree of competition. The students who achieved better results had schools
providing more competitive environments.
Among the studies that examined the impact of competition in education, the advantages and disadvantages of
competition among students themselves during their learning process, and the impact of competitive learning on
student motivation and academic performance is the study of Cantador and Conde (Cantador&Conde, 2010).
The results showed the need to balance competition and cooperation, and to focus on learning objectives rather
than competition itself. The results of the study showed that there is an impact of competition on students'
academic achievement.
Lam’s study (2010) examined the effects of competition on the motivation of Chinese students in the classroom
environment. The study used the experimental method as the researcher relied on taking notes during the writing
lesson. The results of the study showed that the competitive group was more distinguished in academic
performance and tend to learn more. This group relied on self-assessment after failure. The results of the study
showed no statistically significant differences between non-competition and achievement.
Joanne and Fong’s study (Joanne & Fong, 2015) showed that competition within the classroom reduced self-
efficacy among students, while there was no self-efficacy among students with the lack of competition among
students for writing, as there was no significant change in observation.
The results of previous studies support the conclusion that the use of competition in illegal ways may affect the
psychology and academic achievement of students, and focus should be on learning objectives rather than
competition.
Since the gifted has multiple different talents, musical excellence is considered one of the most important types
of talents of students. Al-Momani et al. (2011) notes that arts are one of the most important extracurricular
activities in students' cognitive and creative development, as they provide serious opportunities for the
development of social, emotional and creative skills such as developing self-esteem, developing personality
traits and the ability to recognize individual differences between individuals. It is also a fertile way to express
oneself in a non-verbal way and represents a high level of thinking. It paves the way for the practice of different
types of arts, which will lead to the development of creative skills and cognitive abilities of students.
In this context, Boyd’s study (2013) points out that the arts curriculum offered to gifted students in art institutes
is an important part of the teaching process, ensuring that arts are an important criterion for judging the quality
of education as they provide those students with many and varied opportunities in various artistic fields such as
the educational theater, drawing, singing, chanting and music. Music is a form of art that is consistent with the
programs of the academically talented and gifted. It is found within the range of multiple intelligences identified
by Gardner in his famous theory, referring to the level of musical intelligence. The individual with musical
intelligence distinguishes the multiple different musical tones and recognizes its temporal rhythm with a sense
of melodic modes, enhanced ability to process sounds and musical melodies for the purpose of creating tunes
and musical compositions, excitement for the emotional effects of music elements, and mastery and
professionalism of playing musical instrument(s) (KendEr, 2000).
Given the importance of this topic, the current research considers there is an urgent need to identify the
relationship between the level of ambition and excessive competition among musically gifted students at the
Higher Institute of Musical Arts in of Kuwait.

Proceeding of the 3rd International Conference on Education, Vol. 3, 2017, pp. 280-298
284
Research Problem
Ambition is characteristic of gifted students in all fields, and the musically gifte students are no exception. It is
an influential factor and a motivation for achievement and excellence. It also affects the level of his tendency
towards competition. It may raise the level of his ability to compete and excel others. On the other hand, this
competition may turn into an illegal competition and affects the abilities and skills of the gifted in the field of
his talent and excellence.
Therefore, the problem of research is to verify the relationship between the level of ambition and the excessive
competition of musically gifted students at the Higher Institute of Musical Arts in Kuwait.
The research seeks to answer the following questions:
1. What is the ambition level of musically gifted students at the Higher Institute of
Musical Arts in Kuwait?
2. What is the level of excessive competition among musically gifted students at the
Higher Institute of Musical Arts in Kuwait?
3. What is the correlation between the ambition level and the excessive competition
among musically gifted students at the Higher Institute of Musical Arts in Kuwait?
4. Can the competition level among musically gifted students be predicted through the
dimensions of the ambition level of?
Research Importance
The importance of research is twofold:
Theoretical Importance
1. The research contributes to the identification of an important factor affecting the
ambition level, which is the competition among the gifted and its relation to the factor
of excessive competition, which may affect the way the student's ambition forms to
become more selfish and introverted in his behavior. This issue may be important to
many educators in the field of psychology and requires attention and study from other
aspects.
2. Investigate the impact of some factors affecting the musically gifted students to provide
the appropriate atmosphere and conditions for their growth and to ensure their
continued excellence.
3. Research will be an important factor in revealing the most important dimensions of
ambition and its relation to the excessive competition among musically gifted students.
4. The importance of research comes from the scarcity of Arabic studies that dealt with
the subject of the ambition level and its relation to the excessive competition among
musically gifted students in general and the absence of any Arabic study, within the
limits of the researcher's knowledge, which dealt with the research topic.
5. This research is an attempt to overcome the shortage in the Kuwaiti environment,
especially among musically gifted students at the Higher Institute of Musical Arts in
Kuwait, which may provide a solution to the problem of researchers and those
interested in this field.
6. Using the scales of the ambition level and excessive competition and adjusting them to
suit the musically gifted students in Kuwait.
Practical importance
1. Using Muawad and Abdul Azim’s scale of ambition level (2005) and modifying it to
suit musically gifted students in Kuwait.

Mashail KH. Boshehri1, Fatima Ahmed Al-Jasim and Mohammed J. Jamalallail/Ambition Level and its Relation to Excessive Competition among Musically Gifted Students at the Higher Institute of Musical arts in Kuwait
285
2. UsingMoawad and Mohammed’s scale of excessive competition (1998) and modifying
it to suit musically gifted students in Kuwaitand the Kuwaiti environment.
3. Make appropriate recommendations to reduce the intensity of competition and its
disadvantages to the ambition level of musically gifted students by providing the
necessary care.
Research Terms
Musical talent:
It is defines as the ability to recognize, produce, and appreciate different musical styles. This talent appears
among students who have a sense of sound level, rhythm, poetic meter, timbre, tune and tones of different
degrees and perceiving their meanings (Feierabend, 2015: 1).
Ambition Level:
It is a relatively consistent feature that distinguishes individuals from each other in readiness and access to goals
characterized by a kind of difficulty, struggle, responsibility, perseverance and tendency to excel (Yousfi, 2013,
38).
Excessive Competition:
Rikman et al. (1996) defines excessive competition as an indeterminate need in the individual to compete and
win while avoiding loss at all costs as a means of maintaining or reinforcing feelings of self-entitlement with a
tendency to manipulate, aggressively exploit, and discredit others in different situations. (Reported in:
Muhammad and Moawad, 1997, 3).
Research Limits
The following research is confined to the following limits:
Human Limits: The research was limited to a sample of musically gifted students at the
Higher Institute of Musical Arts in Kuwait.
Time Limits: The research was applied during the second semester 2014/2015.
Spatial Boundaries: The Higher Institute of Musical Arts in Kuwait.
Objective Limits: The results of this research were generalized in light of the
characteristics of the sample and the tools used in the research.
Research Hypotheses
First Hypothesis: The level of ambition of musically gifted students varies according to specialties: instruments,
voices, composition, piano, education.
Second Hypothesis: The level of excessive competition varies among musically gifted students varies according
to specialties: instruments, voices, composition, piano, education.
Third Hypothesis: There is a statistically significant correlation between the ambition level and the excessive
competition among musically gifted students.
Proceeding of the 3rd International Conference on Education, Vol. 3, 2017, pp. 280-298
286
Fourth Hypothesis: The level of excessive competition among musically gifted students can be predicted
through the dimensions of ambition (optimism - ability to set goals - acceptance of novelty - tolerance of
frustration).
Research Methodology
The current research seeks to determine the relationship between the ambition level and the excessive
competition among musically gifted students at the Higher Institute of Musical Arts. Therefore, the study
procedures fall under the descriptive approach. It seeks to identify the nature of the relationship between the
ambition level of and the excessive competition among musically gifted students at the Higher Institute of
Musical Arts.
Research Community
The target research community here is all male and female students at the Higher Institute of Musical Arts from
the first grade to the fourth grade of all specialties (instruments - voices - composition - piano - education) in
Kuwait (135) students.
Research Sample
The sample size was (123) male and female (69 males) and (54 females) with a mean age of 23.3 years. The
sample was distributed over the four years. The research sample was divided into the following specialties: 51
students in instruments, 16 students in voices, 13 students in composition, 19 students in piano, and 24 students
in education.
Research Tools
Two tools were used: the scale of ambition level and the scale excessive competition to achieve the research
objectives. A survey of 30 students from the preparatory stage at the Higher Institute of Musical Arts was
conducted to verify the psychometric properties of the tools.
First: Scale of Ambition Level
The objective of this scale is to measure the ambition level which consists of four dimensions: optimism, the
ability to set goals, acceptance of novelty, and tolerance of frustration. It was prepared by Muawad and Abdul-
Azim in 2005. They applied the scale on a sample of male and female university students. The scale consists of
(36) words and the following dimensions: optimism, the ability to set goals, acceptance of novelty, and tolerance
of frustration.
The psychometric characteristics of the scale were calculated by the scale designer by calculating the validity of
the scale using the method of criterion validity by calculating the correlation between the scores of the sample
on the scale and their scores on the scale of ambition level for adults prepared by Kamlia Abdel Fattah 1975.
The correlation coefficient was statically significant (0.86), indicating that the scale has an appropriate degree of
validity.
As for the test consistency, the scale designer calculated the stability after applying it to a sample of (152)
individuals in two ways. The first was by re-testing after a time interval of two weeks, and the correlation
coefficient between the two applications (0.78). The other method was the split-half method as the correlation
coefficient between the test halves was calculated and found to be 0.79. It is not significantly different from the
consistency value in the first method.
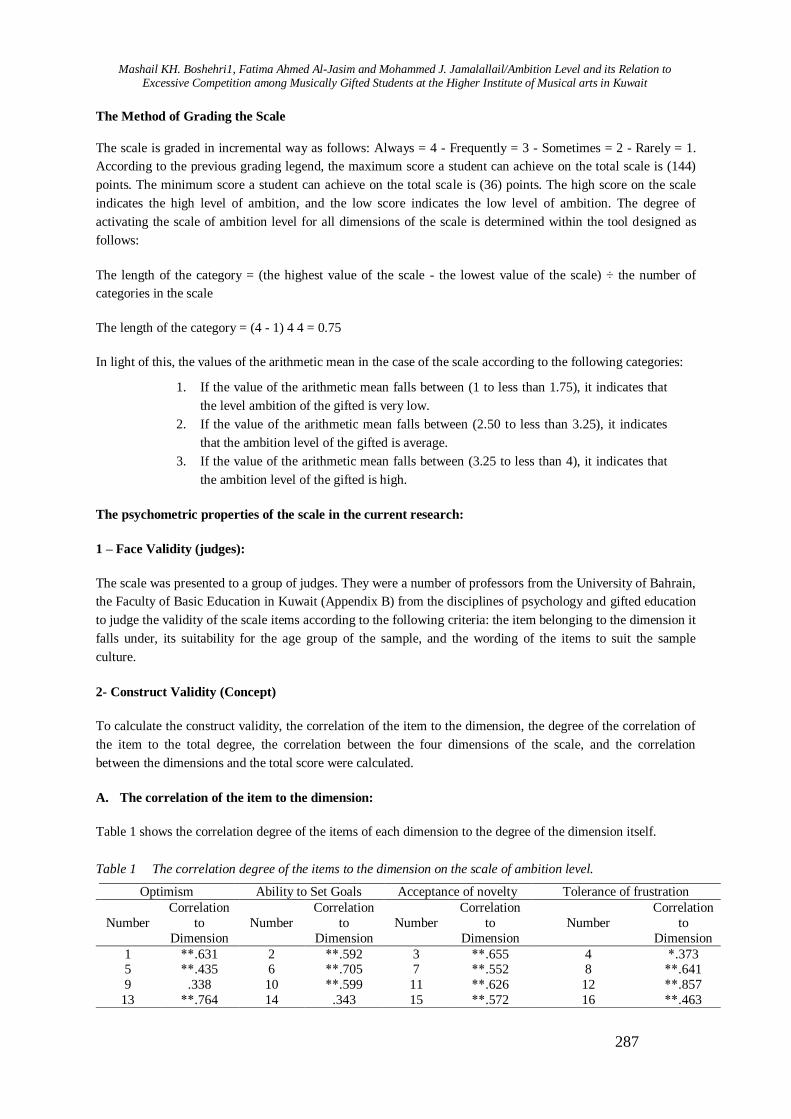
Mashail KH. Boshehri1, Fatima Ahmed Al-Jasim and Mohammed J. Jamalallail/Ambition Level and its Relation to Excessive Competition among Musically Gifted Students at the Higher Institute of Musical arts in Kuwait
287
The Method of Grading the Scale
The scale is graded in incremental way as follows: Always = 4 - Frequently = 3 - Sometimes = 2 - Rarely = 1.
According to the previous grading legend, the maximum score a student can achieve on the total scale is (144)
points. The minimum score a student can achieve on the total scale is (36) points. The high score on the scale
indicates the high level of ambition, and the low score indicates the low level of ambition. The degree of
activating the scale of ambition level for all dimensions of the scale is determined within the tool designed as
follows:
The length of the category = (the highest value of the scale - the lowest value of the scale) ÷ the number of
categories in the scale
The length of the category = (4 - 1) 4 4 = 0.75
In light of this, the values of the arithmetic mean in the case of the scale according to the following categories:
1. If the value of the arithmetic mean falls between (1 to less than 1.75), it indicates that
the level ambition of the gifted is very low.
2. If the value of the arithmetic mean falls between (2.50 to less than 3.25), it indicates
that the ambition level of the gifted is average.
3. If the value of the arithmetic mean falls between (3.25 to less than 4), it indicates that
the ambition level of the gifted is high.
The psychometric properties of the scale in the current research:
1 – Face Validity (judges):
The scale was presented to a group of judges. They were a number of professors from the University of Bahrain,
the Faculty of Basic Education in Kuwait (Appendix B) from the disciplines of psychology and gifted education
to judge the validity of the scale items according to the following criteria: the item belonging to the dimension it
falls under, its suitability for the age group of the sample, and the wording of the items to suit the sample
culture.
2- Construct Validity (Concept)
To calculate the construct validity, the correlation of the item to the dimension, the degree of the correlation of
the item to the total degree, the correlation between the four dimensions of the scale, and the correlation
between the dimensions and the total score were calculated.
A. The correlation of the item to the dimension:
Table 1 shows the correlation degree of the items of each dimension to the degree of the dimension itself.
Table 1 The correlation degree of the items to the dimension on the scale of ambition level.
Tolerance of frustration Acceptance of novelty Ability to Set Goals Optimism
Correlation
to
Dimension
Number
Correlation
to
Dimension
Number
Correlation
to
Dimension
Number
Correlation
to
Dimension
Number
*.373 4 **.655 3 **.592 2 **.631 1 **.641 8 **.552 7 **.705 6 **.435 5
**.857 12 **.626 11 **.599 10 .338 9
**.463 16 **.572 15 .343 14 **.764 13

Proceeding of the 3rd International Conference on Education, Vol. 3, 2017, pp. 280-298
288
Table 1 shows that most of the correlation coefficients of the item scores to the scores of the dimension to which
they belong are statistically significant at (0.01) and (0.05), indicating a high degree of consistency of the scale
clauses and that they measure where they claim to be measuring, except the correlation coefficient of item (32)
in the dimension of tolerance of frustration. It was (0.355), which is not statistically significant. The item will be
retained although it is not significant, while modifying the formulation to be clearer for the study sample.
A. Correlation Between Dimensions:
Table 2 deals with the degree of correlation between the four dimensions of the motivation level (optimism -
ability to set goals – acceptance of novelty - tolerance of frustration).
Table 2 The correlation degree between the dimensions of the scale of ambition level.
Total Score Tolerance of frustration Acceptance of novelty Ability to Set
Goals Dimension
**.822 **.458 **.636 **.571 Optimism
**.830 **.830 **.500 - Ability to Set
Goals
**.811 **.538 - -
Acceptance of
novelty **.770
- - - Tolerance of
frustration
Table 2 shows that all correlations between dimensions are statistically significant and ranges between (0.830-
0.458), indicating a high degree of scale consistency. All correlations between the dimensions and the total score
were statistically significant and ranged between (0.830-0.770), indicating a high degree of consistency for the
scale sentences.
3. Scale Consistency:
The consistency of the four dimensions of the scale was verified using Cronbach's alpha and half-split
coefficients. The degree of constancy in the alpha coefficient ranged from (0.803 - 0.644), and in the half-split,
it ranged from (0.509 - 0.744), indicating high consistency for scale.
Second: The Excessive Competition Scale
The aim of the excessive competition scale is to measure the degree of excessive competition among students in
general and in the current study the students at the Higher Institute of Musical Arts in Kuwait.
It was written and prepared by Muawad and Muhammad in 1998. The applied the scale on a sample of (179)
individuals, consisting of (42) items. After extracting the validity and consistency of the scale, some sentences
were deleted, so the number of items became (30) items.
**.614 20 **.577 19 **.703 18 **.644 17
**.659 24 *.431 23 **.586 22 **.607 21
*.403 28 *.439 27 **.543 26 **.624 25
.355 32 **.520 31 **.661 30 *.450 29
.340 34 .204 33
**.631 36 **.488 35

Mashail KH. Boshehri1, Fatima Ahmed Al-Jasim and Mohammed J. Jamalallail/Ambition Level and its Relation to Excessive Competition among Musically Gifted Students at the Higher Institute of Musical arts in Kuwait
289
The psychometric characteristics of the scale were calculated by the scale designer by calculating the validity of
the scale using more than one method, including: Criterion-Related Validity by calculating the correlation
coefficient between the scores of a sample of (118) individuals consisting of (57) males and (61) females on the
scale and their grades on the self-assessment scale of Hussein Al-Derini et al. and the narcissism scale of Abdel-
Raqib El-Beheiry in 1985. The correlation coefficient was -0.71 and 0.79 respectively.
In 1990 and 1994, Rikman and others calculated the validity of the excessive competition scale by finding the
correlation coefficient between it and the scale of both self-assessment and narcissism. The correlation
coefficient with the first was negative significant and the second was positive significant. The second way is the
construct validity by calculating the internal correlations between the four dimensions of the scale as well as
between the total score of excessive competition and each dimension of it. All correlations were found to be
significant at (0.01) level. The correlations ranged between 1- and 1+. The correlations between each factor and
the total score of the scale ranged between (0.83 - 0.76). ). It is significant at the level of (0.01).
As for the test consistency, the scale designer calculated the consistency after applying it to a sample of (118)
individuals of (57) males and (61) females in two ways: the value of Cronbach's alpha for both the scale of
excessive competition and its four dimensions. The values of alpha ranged between (0.75 - 0.66). The values of
consistency coefficients by the retest method ranged between (0.81 - 0.69) and it is significant function at (0.01).
The psychometric properties of the scale in the current research:
Face Validity (judges):
The scale was presented to a group of judges from the disciplines of psychology and gifted education to judge
the validity of the scale items according to the following criteria: the item belonging to the dimension it falls
under, its suitability for the age group of the sample, and the wording of the items to suit the sample culture.
Construct Validity:
A. The correlation of the item to the total score:
The correlation coefficient of items to the total score was calculated, and Table 3 shows this.
Table 3 Total correlation coefficient of items to the total score
Table 3 shows that most of the correlation coefficients of item scores to the total score of the scale are
statistically significant at (0.01), indicating a high degree of consistency for the scale items. However, the
correlation of sentences (4-6-9-15-22-28-29) to the total score is not statistically significant but because of the
importance of these sentences, they will be retained after modifying its wording.
B. Consistency
Correlation
to
Dimension
Sentence
Number
Correlation
to
Dimension
Sentence
Number
Correlation
to
Dimension
Sentence
Number
Correlation
to
Dimension
Sentence
Number
Correlation
to
Dimension
Sentence
Number
**.509 25 **.561 19 **.511 13 *.412 7 *.366 1
*.390 26 **.610 20 *.405 14 *.445 8 **.530 2
**.545 27 **.525 21 .269 15 .235 9 **.726 3
.343 28 .289 22 **.547 16 **.599 10 .312 4
.280 29 **.459 23 **.567 17 **.478 11 **.695 5
**.654 30 **.469 24 **.536 18 *.419 12 .317 6

Proceeding of the 3rd International Conference on Education, Vol. 3, 2017, pp. 280-298
290
When calculating the consistency degree, it was found that the consistency coefficient Cronbach's alpha was
(0.803) and the half-split was (.627).
Research Steps and Procedures
1. The researcher prepared the research introduction which includes the research preface
and its importance, the research problem, objectives, hypotheses, terminology, and
methodology, research community, sample, and tools, and methods of statistical
processing.
2. The researcher prepared the theoretical framework, which includes the variables of
research, the ambition level, excessive competition and musical talent, through the
researcher's review of Arabic and foreign references.
3. The researcher prepared the theoretical literature after reviewing the Arabic and foreign
studies and researches related to the subject of the research through the published and
unpublished MS and PhD thesis in the periodicals, scientific sites and university
libraries.
4. Standardization of the research tools on the survey sample and calculating its validity
and consistency.
5. Choosing a research sample.
6. Application of research tools on the research sample.
7. Conducting the appropriate statistical treatment and verifying the research hypotheses.
8. Reaching and discussing research results in the framework of previous studies and the
theoretical framework.
9. Suggesting some recommendations and future proposed research.
Research Results
Results related to the first hypothesis of the research
To validate the hypothesis that "the ambition level of musically gifted students varies by specialty," the
arithmetic mean and standard deviation of the scores of musically gifted students in Kuwait were calculated on
the ambition scale of by specialty, as shown in Table 4.
Table 4 Arithmetic means and standard deviations of the scores of the sample members in the ambition level by different specialties
Education Piano Composition Voices Instruments Dimension
Standar
d
Deviati
on
Arithm
etic
Means
Standar
d
Deviati
on
Arithm
etic
Means
Standard
Deviatio
n
Arithme
tic
Means
Standar
d
Deviati
on
Arithm
etic
Means
Standar
d
Deviati
on
Arith
metic
Mean
s
0.39 3.37 0.37 3.61 0.46 3.42 0.37 3.62 0.44 3.50 Optimism
0.49 3.12 0.43 3.62 0.39 3.42 0.35 3.36 0.49 3.37 Ability to
Set Goals
0.37 3.16 0.31 3.49 0.32 3.32 0.38 3.21 0.46 3.33 Acceptance
of novelty
0.45 3.15 0.48 3.43 0.43 3.15 0.51 3.41 0.56 3.21 Tolerance of
frustration
0.34 3.20 0.35 3.54 0.34 3.33 0.33 3.40 0.42 3.35 Total Score
Averag
e High High High High
Judgment
Level

Mashail KH. Boshehri1, Fatima Ahmed Al-Jasim and Mohammed J. Jamalallail/Ambition Level and its Relation to Excessive Competition among Musically Gifted Students at the Higher Institute of Musical arts in Kuwait
291
Through the table, the arithmetic means for piano students was 3.40, followed by the arithmetical mean for
voices students (3.40), followed by the arithmetic mean for instruments students (3.35), followed by the
arithmetic mean for the composition students of the students of the composition (3.33), and followed by the
arithmetic mean for students of the education specialty which was (3.20). We note that there are apparent
differences for the sample in the ambition level according to different specialties. Based on these results, it can
be judges that the ambition level was high in the specialty of instruments, voices, composition and piano, while
the ambition level among the students of education was average. To examine the significance of these
differences, one-way analysis of variance (ANOVA) was used. Table 5 shows the results of this test.
Table 5 Results of one-way analysis of variance (ANOVA) to detect the significance of differences in the
ambition level according to different specialties
Significance
Level F value Mean Square
Freedom
Scores
Sum of
Squares
Variance
Source Dimension
0.234
1.41 0.25 4 0.98 Between
Groups
Optimism 0.17 118 20.43 Within
Groups
122 21.41 Total
0.012
3.35 0.69 4 2.77 Between
Groups Ability to set
goals 0.21 118 24.38 Within
Groups
122 27.14 Total
0.093
2.04 0.32 4 1.29 Between
Groups Acceptance
of novelty 0.16 118 18.59
Within
Groups
122 19.88 Total
0.209
1.49 0.39 4 1.56 Between
Groups Tolerance of
frustration 0.26 118 30.74
Within
Groups
122 32.30 Total
0.070
0.070 0.32 4 1.28 Between
Groups 0.070
0.14 118 16.90 Within
Groups
122 18.18 Total
By reviewing the statistical data of Table 5, which shows the results of the one-way analysis of variance
(ANOVA), we note that there are no statistically significant differences between the means of musically gifted
students in Kuwait and the total score of the ambition level scale. The results showed that differences between
the means of musically gifted students in Kuwait on the dimensions of ambition (optimism, acceptance of
novelty, and tolerance of frustration) by different specialties are not statistically significant. The results showed
that differences between the means of musically gifted students in Kuwait on the dimension of the ability to set
goals were statistically significant. Its significance level was 0.012, which is less than (α = 0.05). To know the
position of differences between any two specialties, the Bonferroni test was used for post-comparisons, as
shown in Table (6).

Proceeding of the 3rd International Conference on Education, Vol. 3, 2017, pp. 280-298
292
The results of the Bonferroni test shown in Table 6 show that the difference is statistically significant among
students in the specialties of education and piano, in favor of students in the piano specialty. Their average score
on the dimension of the ability to set goals was the highest.
Table 6 Benfroni test results for post-comparisons to locate the position of significance of differences between means of musically gifted students in Kuwait on the dimension of the ability to set goals
The difference between the two means
Education Piano Composition Voices Instruments Specialty
0.25 0.25 0.05 0.01 - Instruments 0.24 0.26 0.06 - - Voices
0.30 0.20 - - - Composition
*0.50 - - - - Piano
- - - - - Education
* Statistically significant at significance level of 0.05
Results related to the second research hypothesis
To validate the hypothesis that "the level of excessive competition among musically gifted students varies by
specialty," the mathematical mean and standard deviation of the scores of musically gifted students in Kuwait
were calculated on the scale of excessive competition by specialty, as shown in Table 7.
Table 7 The arithmetic means and standard deviations of the scores of the sample members in the level of excessive competition by specialty
Judgment Standard Deviation SpecialtyArithmetic Mean
Average 0.65 3.31 Instruments
Average 0.61 3.05 Voices
Average 0.55 3.16 Compositions
Average 0.68 3.34 Piano
Average 0.57 3.01 Education
Through Table 7, the mean of piano students was 3.34 with a standard deviation of 0.68, followed by the mean
of the instruments students which was 3.31 with a standard deviation of 0.65, followed by the mean of
composition students which was 3.16 with a standard deviation of 0.55, followed by the mean of voices students
which was 3.05 with a standard deviation of 0.61, and followed by the mean of education specialty students
which was 3.01 with a standard deviation of 0.57. We note that there are apparent differences for the sample in
the competition level according to different specialties. It’s noted that the judgment for all specialties is average
and to detect the significance of differences between averages, one-way analysis of variance (ANOVA) was
used. Table 8 shows the results of this test.
Table 8 Results of one-way analysis of variance (ANOVA) to detect the significance of differences in the excessive ambition level by different specialties
Significance Level
Observed
F
value
Mean
Square
Freedom
Scores
Sum of
Squares Variance source
0.236 1.41 0.55 4 2.20 Between
Groups
0.39 118 46.16 Within Groups
122 48.36 Totals
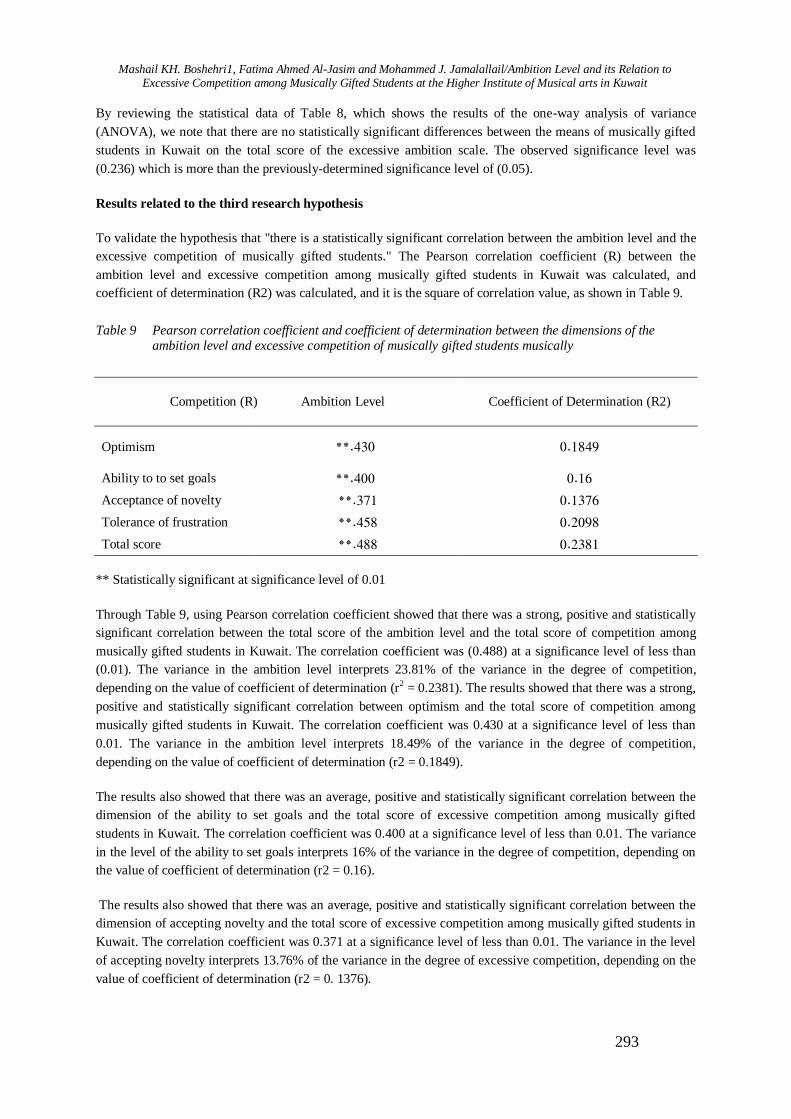
Mashail KH. Boshehri1, Fatima Ahmed Al-Jasim and Mohammed J. Jamalallail/Ambition Level and its Relation to Excessive Competition among Musically Gifted Students at the Higher Institute of Musical arts in Kuwait
293
By reviewing the statistical data of Table 8, which shows the results of the one-way analysis of variance
(ANOVA), we note that there are no statistically significant differences between the means of musically gifted
students in Kuwait on the total score of the excessive ambition scale. The observed significance level was
(0.236) which is more than the previously-determined significance level of (0.05).
Results related to the third research hypothesis
To validate the hypothesis that "there is a statistically significant correlation between the ambition level and the
excessive competition of musically gifted students." The Pearson correlation coefficient (R) between the
ambition level and excessive competition among musically gifted students in Kuwait was calculated, and
coefficient of determination (R2) was calculated, and it is the square of correlation value, as shown in Table 9.
Table 9 Pearson correlation coefficient and coefficient of determination between the dimensions of the
ambition level and excessive competition of musically gifted students musically
Coefficient of Determination (R2) Competition (R) Ambition Level
0.1849 **.430 Optimism
0.16 **.400 Ability to to set goals
0.1376 **.371 Acceptance of novelty
0.2098 **.458 Tolerance of frustration
0.2381 **.488 Total score
** Statistically significant at significance level of 0.01
Through Table 9, using Pearson correlation coefficient showed that there was a strong, positive and statistically
significant correlation between the total score of the ambition level and the total score of competition among
musically gifted students in Kuwait. The correlation coefficient was (0.488) at a significance level of less than
(0.01). The variance in the ambition level interprets 23.81% of the variance in the degree of competition,
depending on the value of coefficient of determination (r2 = 0.2381). The results showed that there was a strong,
positive and statistically significant correlation between optimism and the total score of competition among
musically gifted students in Kuwait. The correlation coefficient was 0.430 at a significance level of less than
0.01. The variance in the ambition level interprets 18.49% of the variance in the degree of competition,
depending on the value of coefficient of determination (r2 = 0.1849).
The results also showed that there was an average, positive and statistically significant correlation between the
dimension of the ability to set goals and the total score of excessive competition among musically gifted
students in Kuwait. The correlation coefficient was 0.400 at a significance level of less than 0.01. The variance
in the level of the ability to set goals interprets 16% of the variance in the degree of competition, depending on
the value of coefficient of determination (r2 = 0.16).
The results also showed that there was an average, positive and statistically significant correlation between the
dimension of accepting novelty and the total score of excessive competition among musically gifted students in
Kuwait. The correlation coefficient was 0.371 at a significance level of less than 0.01. The variance in the level
of accepting novelty interprets 13.76% of the variance in the degree of excessive competition, depending on the
value of coefficient of determination (r2 = 0. 1376).

Proceeding of the 3rd International Conference on Education, Vol. 3, 2017, pp. 280-298
294
The results also showed that there was an average, positive and statistically significant correlation between the
dimension of tolerating frustration and the total score of excessive competition among musically gifted students
in Kuwait. The correlation coefficient was 0.458 at a significance level of less than 0.01. The variance in the
level of tolerating frustration interprets 20.9% of the variance in the degree of excessive competition, depending
on the value of coefficient of determination (r2 = 0. 2098).
Results related to the fourth research hypothesis
To validate the hypothesis that "the level of excessive competition among musically gifted students can be
predicted through the dimensions of the ambition level," the multiple stepwise regression analysis was used as
the dimensions of the ambition level are the independent variables and the level of excessive competition for
gifted students is the dependent variable.
Table 10 Results of the multiple stepwise regression analysis for the prediction of the excessive ambition level among musically gifted students through the dimensions of ambition level
Significance
Observed
Test
Value
F
Coefficient of
Determination
R2
Correlation
Coefficient
R
Mean
Square
Freedom
Scores
Sum of
Squares
Variance
source
0.000 9.51 0.244 0.494 0.55 4 11.79 Regression
0.39 118 36.57 Residual
122 48.36 Total
The results of Table 10 show that the regression model is generally effective. The level of competition among
musically gifted students can be predicted through the dimensions of the ambition level. It was found that the
regression model is statistically significant at the significance level of (0.01). Table 11 shows the regression
coefficients of the results of multiple stepwise regression analysis for the prediction of the excessive ambition
level among musically gifted students through the dimensions of ambition.
Table 11 Regression coefficients for the results of multiple stepwise regression analysis for the prediction of the excessive ambition level among musically gifted students through the dimensions of ambition
Regression Coefficient Model Level
0.655 Regression
0.113 Optimism 0.175 Ability to to set goals
0.150 Acceptance of novelty
0.330 Tolerance of frustration
From Table 11, the prediction equation can be formed as follows:
Competition degree = 0.655 + 0.113 * (Optimism) + 0.175 * (Ability to set goals) + 0.150 * (accept novelty) +
0.330 * (tolerance of frustration)
Discussion of Research Findings
Discussion of the Findings of the Research First Hypothesis
Mashail KH. Boshehri1, Fatima Ahmed Al-Jasim and Mohammed J. Jamalallail/Ambition Level and its Relation to Excessive Competition among Musically Gifted Students at the Higher Institute of Musical arts in Kuwait
295
The findings showed that there were no statistically significant differences between the means of musically
gifted students in Kuwait in the total score on the ambition level by specialty. Their ambition level was also high
in all dimensions of ambition. This result is consistent with the study of Yung (1998) which states that the
ambition level is influenced by a number of factors, which can be summarized in three areas. The first area is
related to the person, his composition, mental abilities, emotional state and future vision. The second is related
to factors of the environment around the individual. This may be due to the satisfaction with the specialties
studied by students and the conviction that they are useful and appropriate to their tendencies. This may also be
attributed to the fact that the Higher Institute of Musical Arts is interested in musical talents unlike other
faculties of educational or scientific specialties in Kuwait. As a result, the graduate of the secondary school who
is less interested in the scientific subjects and more talented in the musical subjects resorts to the Higher
Institute of Musical Arts to hone his artistic talent. The students at the Higher Institute of Musical Arts have
high mental capacities through joining this type of specialty as no student can join this specialty without having
high artistic mental capacities. These capacities and capabilities distinguish this students from other students in
other specialties as his sets his sights on a goal that commensurate with the artistic capacities he has. Then, he
develops his plan to reach that goal. This process needs non-trivial mental abilities through which he can judge
things, his capacities and what the goal needs. So, the capacities the student has, the higher his ambition level.
The researcher thinks that the absence of statistically significant differences in the ambition level of in the
sample of the current study despite the different musical specialties can also be attributed to the fact that
curricula in these areas receive great attention any care by those who teach students, in addition to the fact that
school curricula they teach stimulate their capacities, contributing ultimately to achieving their ambition level.
The findings also showed that the differences between the means of musically gifted students in Kuwait on the
dimensions of ambition (optimism, accepting novelty, tolerating frustration) by different specialities are is
statistically significant, while the results indicated that the differences between the means of musically gifted
students in Kuwait in the dimension of the ability to set goals is statistically significant for students in the piano
specialty as their average score on the dimension of the ability to set goals was higher. If there is a high level of
ambition on the dimension of the ability to set goals for piano students only, this may be due to the existence of
some factors that inspire and enhance the student’s ambition. In this case, the student's ambition increases and it
is referred to as the situation which affects him. One of these factors may be the presence of a group of people
and raters when the student plays solo piano directly. During this, he feels encouragement from others and
receives support for his excellence in this aspect, which leads to more ambition to reach a higher level. Piano
students also have self-efficacy factors in terms of effort, initiation and time management. They take more
shares of musical notes than the rest of the students in other specialities. This increases their ambition level in
comparison with other specialties.
Discussion of the Findings of the Research Second Hypothesis
The findings of the research indicate that there are no statistically significant differences between the means of
musically gifted students in Kuwait in the total score on the excessive competition scaly by specialty. This is a
satisfactory result because the presence of excessive competition may cause negative behavior among students.
This result is consistent with the study of Malini (2011), which states that the use of excessive competition
before mastering the scientific material, skill or behavior leads to a negative behavior in students. Excessive
competition also lead to the development of vanity and pride in some students and to envy and feelings of
weakness in others. This may be due to the fact that the work of art and music in particular is an integrated work
on the level of performance. It consists of somewhat different artistic (musical) specialties, and since they
participate at the same time in performing the artwork, excessive competition may have no place. Natural or
normal (average) occurs among those enrolled in these different artistic specialties on the basis that they are
independent to a certain extent and in favor of work and each have a relatively different area. Any amount of
excessive competition that may occur among students in different specialties generates negative feelings

Proceeding of the 3rd International Conference on Education, Vol. 3, 2017, pp. 280-298
296
towards others and the desire to place obstacles and constraints to others that prevent them from creativity,
excellence and success. This is not required or not possible in musical bands. The excessive competition of one
person may lead to a flaw in the entire musical band as reported on the disadvantages of competition (Jimerson,
2003).
Discussion of the Findings of the Research Third Hypothesis
The findings of the research showed that there is a strong, positive and statistically significant correlation
between the total score on the ambition level and the overall score of excessive competition among musically
gifted students in Kuwait. This finding may indicate that the ambition level is associated with moderate
competition rather than excessive one. That’s why the correlations are average. This is because ambition does
not put one in jeopardy, i.e. excessive completion. The student seeks to achieve his goal through honest
competition. This may be due to the fact that the person who exercises excessive competition is more likely to
think about others and reducing their capacities and does not recognize the abilities or qualifications of others.
At the same time, he claims that all they have achieved is the result of lying, deceit, cheating, or any other
misconduct. He does not focus on personal fulfillment and developing his abilities in his specialty. His ambition
is only to prove that others are unable to achieve, belittle them, question their abilities, ethics and honesty, and
undermine their credibility in one way or another. He underestimates other students and question their
achievements without exerting the effort required to catch up with them and accomplish similar or better
achievements.
Discussion of the Findings of the Research Fourth Hypothesis
The findings of the research show that the competition level among musically gifted students can be predicted
from the dimensions of ambition (optimism, the ability to set goals, acceptance of novelty, and tolerance of
frustration). Al-Nabhan points out that in order for the prediction to be accurate and meaningful, the correlation
coefficient must be strong. The correlation and regression are complementary. Since there is a statistically
significant correlation between excessive competition and variables and the regression model is generally
effective, we can predict the competition level among students from the dimensions of ambition. This may be
due to the fact that the student who has the behavior of excessive competition always focuses on the other
student who competes with him and forgets to develop himself and work on developing his skills. His first
priority is what the other student achieves and forgets optimism. He always tends to be pessimistic and afraid of
getting grades and level less than the level of his colleague. It can be said that the greater the competition the
greater the level of ambition to get a high level. The student with excessive competition ignores the drawing
plans and setting goals for completion during the specialization. He focuses only on the idea of getting a level
higher than his colleagues. He does not care about getting a different skill or capacity outside the scope of his
studies. Hence, he does not accept any renewal in his life in contrast to the person who has a positive
competition and does not mind to acquire any skill within his objectives to achieve them. This may be because
the student who has the behavior of excessive competition often feels failure and frustration when he fails in a
certain academic aspect or musical skill. He considers his failure as destructing for his personality and declining
in the idea of excessive competition. This generates hatred of other colleagues.
Research Recommendations
In light of the findings of this research, which proved the importance of the musically gifted, the importance of
the ambition level and its relationship to excessive competition. With reference to previous studies, we can
propose the following recommendations:
1. Taking care of musically gifted students and guiding them towards raising the level of
their ambition and motivation in various fields.

Mashail KH. Boshehri1, Fatima Ahmed Al-Jasim and Mohammed J. Jamalallail/Ambition Level and its Relation to Excessive Competition among Musically Gifted Students at the Higher Institute of Musical arts in Kuwait
297
2. Training teachers on how to raise the level of ambition among students, especially the
musically gifted in Kuwait.
3. Educating gifted people of all kinds about the importance of competition,
distinguishing between illegal excessive competition and stimulating average
(moderate) competition that may help to achieve a good learning environment and raise
their level of motivation.
4. Focusing on the dimensions of competition and the level of ambition as a strong
incentive in the field of learning, which help creativity and innovation, and contribute
to improving the performance of academic students
References
First: Arabic References
Al-Nabhan, Musa (2006). Fundamentals of Statistics in Education, Humanities and Social Sciences. Second Edition. Al Falah Library for Publishing and Distribution. Al Ain: United Arab Emirates.
Barakat, Ziad. (2009). The Relationship of the Self Concept to the Level of Ambition among the Students of Al-
Quds Open University and their Relation to some Variables (unpublished master’s thesis). Al-Quds Open
University, Palestine.
Ben Gathefa, Sharifa. (2014). Decision-making and its Relation to Thinking Methods and Ambition Level of
employees in Public Institutions (unpublished doctoral thesis). University of Setif 2, Algeria.
Jabari, Mohammed. (2008). Psychological and Social Compatibility and its Relation to the Ambition Level
among Students of the Technical Institute in Kirkuk, Journal of the University of Kirkuk (Humanities), Volume
(3), extracted from the link http://www.iasj.net/iasj?func=fulltext&aId=435 81
Grewan, Fathi. (2004). Talent, Excellence and Creativity. Amman: Arab Thought House.
Harbi, congratulations. (2014). Concern about the Future and its Relation to Self-esteem and the Ambition Level
among High School Students in Riyadh City. (Unpublished master thesis) Naif Arab University for Security
Sciences, Saudi Arabia.
Salem, Hebatullah, Qumabil, Kubshur, & Al Khalifa, Omar. (2012). The Relationship between Achievement
Motivation, the Control Position, the Ambition Level, Academic Achievement of Students in Institutions of
Higher Education in Sudan. The Arab Journal for the Development of Excellence, 3 (4), 81-96.
Salhi, Hana. (2013). The Relationship of Psychological Stress to the Ambition Level of University Students
Residing in the University of Ouargla (a memorandum submitted to complete the requirements of the master's
degree). University of Ouargla, Algeria.
Attar, Saida. (2012). Problems of Outstanding Students in the Algerian School: A Field Study in Secondary
Schools of Tlemcen. Journal of Humanities and Education (8). 200-169
Al-Momani, Mamoun; Hamouri, Khalid; Yunus, Najati& Al Qaraan, Jehad (2011). The Relationship between
the Level of Musical Abilities and Academic Achievement of Academically Outstanding Students. Jordanian
Journal of Arts, Volume (4), Issue (1), 29-43.
Yousfi, Dalal. (2013). Social Anxiety and its Relation to the Ambition Level among Students in the Second
Year of Secondary School (unpublished master’s thesis). University of Mohamed KhiedrBiskra, Algeria.
Second: Foreign References
Boyd, J. (2013). The relationship between music participation and mathematicsachievement in middle school
students. (A Dissertation Presented in Partial Fulfillment of the Requirements for the Degree Doctor of Education) Liberty University, USA.
Cantador, I. &Conde J. (2010).Effects of competition in education: A casestudy in an e-learning environment.
Universidad Autónoma de Madrid Campus de Cantoblanco. Spain.
Chen, Yu. (2014). The influence of self-efficacy on degree aspiration among domestic and international
community college students Graduate, Theses and Dissertations. Paper 14026.
Proceeding of the 3rd International Conference on Education, Vol. 3, 2017, pp. 280-298
298
Cochran, C. (2009). Effects of social support on the social self-concepts of gifted Adolescents. Research Gate.
University of Virginia, USA.
Cretsinger, M. (2003). Academic competitiveness amonggraduate students. The Graduate School University of
Wisconsin-Stout.
Feierabend, M. (2015). Musicand Intelligence in the Early Years, Ph.D.unpublished thesis.
Gallagher, J. (2002). Society’s role in educating gifted students: the role of public policy. USA, The National
Research Center On The Gifted And Talented.
Jimerson, L. (2003). The competitive disadvantage: Teacher Compensation in Rural America.The Rural School
and Community Trust .
Joanne, C. &fong, L. (2015). Using Medical Incidents to Teach: Effects of Vicarious Experience on Nursing
Students’ Self-Efficacy in Performing Urinary Catheterization. Journal of Nursing Education, 54 (2)80.
Kazmi, S. (2012).Anxiety as predictor of aspiration amongacademic achievers.The Online Journal of New
Horizons in Education. Volume 3, Issue 4.
Kender, M. (2000). an exploration of musical intelligence, (Thesis submitted to the Faculty of Virginia
Polytechnic Institute and State University in Partial Fulfillment of the Requirements for the Degree of Masters
of Science in Human Development).
Lam, S., Yim P., Law, J. & Cheung, R. (2010). The effects of competition on achievement motivation in
Chinese classrooms.British Journal of Educational Psychology.Volume 74, Issue 2, 281–296.
Malini, K. (2011). The Effects of Unhealthy Competition.Innerspace Therapy
Ponzo, M. (2009). The effects of school competition on the achievement of Italian students. Working Paper n.
20.
Young, D. (1998). Ambition, self-concept, and achievement: A structural equation model for comparing rural
and urban Students.Journal of Research in Rural Education. Vol. 14, No.1, pp. 34-44
Proceeding of the 3rd International Conference on Education, Vol. 3, 2017, pp. 299-304 Copyright © 2017 TIIKM ISSN 2424 - 6700 online DOI: https://doi.org/10.17501/icedu.2017.3130
3rd International Conference on Education, 20-22 April 2017, Kuala Lumpur, Malaysia
NEW PARADIGM FOR CLOUD COMPUTING
CURRICULUM BY MEETING INDUSTRY NEEDS:
CCSE AND EMC2 AS CASE STUDY
Kawther Aldhlan and Mahreen Nasir
University of Hail, Saudi Arabia
Abstract: With the recent advances in technology and computing, it has become vital to update and
revise the curriculum for Computer Science undergraduate students. The curriculum should meet the
challenges and requirements of the industry by providing state of the art knowledge to the students.
The main goal of any professional degree is to produce skilled graduates who can compete
successfully in the job market. The traditional taught curriculum does fulfil the degree requirements,
though it needs to be compatible with new industry trends as well. This paper is an attempt to
highlight the importance of introducing new computing courses and certifications by having
Academic Alliance between Educational Institutes and leading Industry partners. This is supported
by discussing the Academic Alliance of College of Computer Science and Software Engineering
(CCSE), University of Hail (UoH), with top leading industry partner like Egan Marino Corporation
(EMC2). Various aspects of this alliance resulting in offering new elective course in the curriculum
and as certified training course will be mentioned. Additionally, a survey was conducted to take
students’ feedback regarding such certified courses. The paper will discuss in detail the outcomes of
the survey in addition to the results of the courses offered as part of this alliance
Keywords: Curriculum, Cloud Computing, Learning and Teaching, Higher Education
I. Introduction
The field of Information technology is growing rapidly. This technological revolution has changed the way information can
be processed, stored and used later for further analysis. It is the need of the hour to incorporate these new tech trends into
undergraduate curriculum in order to equip students and make them aware of the recent advancements. As an example, the
concept of “Cloud Computing” has become a norm in the industry. It has been widely used in academia and industry for
various purposes. One of them being the storage of huge amounts of information. Since this paradigm is and will be the
future need, it is necessary to make it part of professional degree programs. It is required that the course curriculum be
designed in a way to address not only the theoretical concepts but also provide hands-on training to students to become
familiar with the architecture and various phases of Cloud development and maintenance. This will facilitate the students in
having the relevant practical experience to find a successful position in the job market. Keeping this vision in mind, College
of Computer Science and Software Engineering, University of Hail, always seeks to bring excellence in education towards
its students. This is achieved by signing Memorandum of Understanding (MOU) with high tech industry partner like Egan
Marino Corporation (EMC2) to introduce “Cloud Infrastructure and Services(CIS)” as an elective course in the
undergraduate curriculum. Besides this, a separate certification track is also offered to students.
The rest of the paper is organized as follows. Section II outlines the background. Details of Academic Alliance
of University of Hail and offering of Cloud Infrastructure and Services course along with its results are
mentioned in section III. Section IV outlines the students’ view point based on the survey. Survey results are
discussed in section V. The paper is concluded in section VI.
II.Background
Producing skilled graduates should be the main target of any professional degree. To achieve this target the program
curriculum must be outcomes based. Outcomes-based education has recently gained much attention to enhance the teaching
Corresponding Author: Kawther Aldhlan / [email protected]
Kawther Aldhlan and Mahreen Nasir/New Paradigm for Cloud Computing Curriculum by Meeting Industry
Needs: Ccse and EMC2 as Case Study
300
and learning process in various fields. According to (Butler,2004) Outcome based education (OBE) is a process of reshaping
the curriculum, practices and evaluations to reflect high order learning achievements. So, the main aim is to increase the
knowledge and develop skills by incorporating relevant changes. Additionally, as the main aim is to meet industry
challenges while designing the curriculum is to consider the requirements of future stake holders. Keeping this idea the best
approach for learning is to first specify what needs to be achieved. Once clear objectives (product or outcome) has been
determined the policies, processes and methods can be put into place to achieve the goal.(Tuker,2004,Butler, 2004).
A) EMC2 Academic Alliance
EMC2-An American multinational corporation which deals with providing services for storage of data,
security of information, virtualization, cloud computing and other products in order to provide data storage
,management, analysis and protection to businesses. In order to fill the skill gap, EMC2 is making alliance with
universities which are offering accredited degree programs. The vison is to prepare students to meet future IT
industry challenges in the field of cloud computing.
IT organizations of tomorrow will present many opportunities and challenges. IT professionals will be
responsible for huge amounts of data from varying sources with diverse formats. There will be a need not only
to construct and maintain the assets but also to provide services in order to facilitate business for their smooth
operations. This requires strong implications for both traditional and emerging IT roles and skills. Academic Alliance programs will fulfil these future needs by offering open curriculum based education on many new
technologies such as cloud management, big data, information storage, back up and recovery. The main focus is
to deliver core principles and concepts independent of any vendor. This helps the students in developing high
skills and market knowledge.
The universities in kingdom of Saudi Arabia are fully aware of the demanding future requirements and to meet
them, various universities have signed (MOU) with EMC2. Table 1. shows the details.
III.University of Hail as Partner Institute
University of Hail signed MOU with EMC2, in fall 2014. This alliance lead to the introduction of the course
“Cloud Infrastructure and services (CIS)” as an elective course to under graduate students in college of
Computer Science and Software Engineering. Also, certified short training course for CIS was also offered to
students.
A)Course Design
The CIS course provides knowledge about the cloud infrastructure, service models, various deployment options
and the key considerations while shifting towards cloud computing. The course focuses on in depth
technologies which are needed to construct various environments including traditional, virtualized, and cloud
data center environments. These technologies consist of implementing virtualization at compute, storage,
networking, desktop and application levels. Additional insights are provided on topics as backup/recovery,
business continuity, security and management. Students will study about the major requirements involved in
migrating from classic data center to a cloud computing environment. At the end of the course, student’s will
have sufficient knowledge for making required analysis about moving to cloud infrastructure and selecting the
most suitable deployment option for their company or institution.
B)Course Objectives and Aims
Upon completion of this course, the student will learn about:
• Various transition phases while shifting to cloud from the classic data center.
• Virtualization technology at various levels including compute, storage, network, desktop and application
layers
• Virtual Data Center’s business continuity solutions.
• Key characteristics, services, and deployment models of Cloud
• The Cloud infrastructure components and service management processes
• The Cloud security concerns and solutions
• Key considerations for migration to the Cloud

Proceeding of the 3rd International Conference on Education, Vol. 3, 2017, pp. 299-304
301
C)Text Book
1. EMC provided CIS Students Guide
2. Cloud Computing Bible, Barrie Sosinsky,2011,ISBN:978-0-470-90356-8 Wiley Publishing Inc.
D)Learning Outcomes
The students will be able to:
Understand the main concepts, key technologies, strengths, and limitations of cloud computing.
Identify the infrastructure and models of cloud including Software as a Service, Platform as a Service,
Infrastructure as a Service, public, private and hybrid cloud.
Discuss the main concepts in cloud security and privacy.
Identify and analyze various problems and provide appropriate solutions.
E)Laboratory Session
To provide practical experience to students, lab sessions were also offered by using NDG access as provided by
EMC2. To equip students with necessary skills, a separate lab is dedicated for EMC-CIS course in College of
Computer Science & Software Engineering.
Table 1. Universities in Saudi Arabia Having Alliance with EMC2
Sr. No. University Region
1. King Khalid University Aseer
2. King Fahad University of Petroleum &
Minerals
Eastern
3. King Abdul Aziz University Makkah
4. Umm ul Qura University
5. Taibah University Madina
6. Qassim University Qassim
7. University of hail Hail
8. Al Yamamh University
Riyadh 9. Imam University
10. King Saud University
11. Prince Sultan University
12. Taif University Taif
13. King Abdullah University of Science and
Technology
Western
F)Certification Track
Besides offering the course as an elective, a separate certification track was also offered, so that students who
are unable to enroll in the course can still acquire updated knowledge by registering in the certification track.

Kawther Aldhlan and Mahreen Nasir/New Paradigm for Cloud Computing Curriculum by Meeting Industry
Needs: Ccse and EMC2 as Case Study
302
G)Results of the CCSE students
The results of the students were very satisfactory among the past three years and showed excellent performance of students. Results are shown in Table 2. and Table 3. respectively along with graphs in Figure.1 and Figure.2.
Table 2. Cloud Infrastructure & Services(CIS) Course Result
Year/Semester Pass % Fail %
2014-15 81% 19%
2015-16 100% 0%
2016-17 100% 0%
Figure. 1. Students’ Statistics in Cloud Infrastructure and Services Course
Table 3. Cloud Infrastructure & Services EMC2 Certification Exam Result
Year/Semester Pass % Fail %
2014-15 79% 21%
2015-16 70% 30%
2016-17 92% 8%
Figure. 2. Students’ Statistics in Cloud Infrastructure and Services Certification Exam

Proceeding of the 3rd International Conference on Education, Vol. 3, 2017, pp. 299-304
303
IV. Importance of the Academic Partnership from Students’ Point of View
To assess the importance of the academic partnership from the students’ point of view in CCSE at UoH, a
survey was conducted among 480 undergraduate students from different programs representing the sophomore
and senior students. The study was applied during first semester of 2016/2017. A total of 214 responses were
received from participants via the blackboard. The survey was designed to have 14 questions including the demography part.
A) Results of the Study
The results of the study are illustrated in Figure 3, Figure 4, Figure 5 and Figure 6. The results were very
encouraging and indicated that this partnership enhance the opportunities of getting good job, enriching the
students technical skills in addition to preparing future industry professionals. Also, it is vital to mention the
notable achievements of University of Hail that it ranked on top amongst all the partner institutions in the
Kingdom in having the highest no. of enrolled students in CIS course and having the highest success rate of
students consecutively for the years 2014-16.
V. Recommendations and Conclusions
To compete with new technology trends, it is recommended that more universities in the kingdom should
introduce such advance level courses as part of their curriculum (Alamri et al., 2013,Haleem et al.,2013). It is
suggested that both the faculty and students be equipped with the state of art industry knowledge. This will not
only improve the standard of higher education in the kingdom but also serve to complement the skill gap.
This paper attempted to highlight the growing importance of academic alliance between educational institutes
and industry partners by incorporating advance courses like cloud computing in the curriculum. The example of
introduction of cloud computing course at University of Hail in collaboration with EMC2 was discussed along
with the details about the course design, outcomes and taught modules. This was supported by providing results
of the various batches of students which proved to be very successful. Additionally, the survey results clearly
exhibited the strong demand and importance of these courses among the students.
Figure.3. Passing an industry offered course help in getting good job
Figure. 4. University should have partnerships with Microsoft, Oracle etc

Kawther Aldhlan and Mahreen Nasir/New Paradigm for Cloud Computing Curriculum by Meeting Industry
Needs: Ccse and EMC2 as Case Study
304
Figure.5. Certification Courses can improve students skills
Figure.6. Such courses can prepare future industry professionals
References
Alamri, Bayan Hashr, and M. Rizwan Jameel Qureshi. "Usability of Cloud Computing to Improve Higher
Education." (2015).
A. Schwill, "Computer science education based on fundamental ideas," Samways, Brain (Hrsg.): Information
Technology–Supporting change through teacher education. London: Chapman & Hall, pp. 285-291, 1997.
Haleem, Muhammad, and Adnan Albar. "Towards Cloud Computing at IS Department, King Abdulaziz
University." Middle Eastern & African Journal of Educational Research MAJER Issue: 4 (2013).
Wong, Gary KW, and H. Y. Cheung. "Outcome-Based Teaching and Learning in Computer Science Education
at Sub-degree Level." International Journal of Information and Education Technology 1.1 (2011): 40-46.
Tucker, B. "Literature review: outcomes-focused education in universities."Learning Support Network, Curtin
University of Technology (2004).
Butler, Mollie. "Outcomes based/Outcomes focused education overview."Unpublished dissertation. University
of Sydney, Sydney (2004).

Proceeding of the 3rd International Conference on Education, Vol. 3, 2017, pp. 305-314 Copyright © 2017 TIIKM ISSN 2424 - 6700 online DOI: https://doi.org/10.17501/icedu.2017.3131
3rd International Conference on Education, 20-22 April 2017, Kuala Lumpur, Malaysia
INTEGRATING ELEMENT OF GREEN SKILLS
IN THE 21st CENTURY LEARNING
Bushra Limuna Ismail¹, Arasinah Kamis2, Che Ghani Che Kob
3, Tee Zee Kiong
4 and
Mohd Bekri Rahim5
¹,2,3 Sultan Idris Education University, Malaysia 4,5Tun Hussein Onn University, Malaysia
Abstract: The outline of introducing green skills for a sustainable development is contained in the
document called Transformation of Technical Vocational Education and Training (TVET), which is
part of the 11th Malaysia Plan. There is a need to incorporate green skills into TVET programs to
achieve sustainable development in the country, and in turn stimulate inclusive economic growth.
The Ministry of Education, Malaysia launched the initiatives of the 21st century education in 2015.
The secondary school standard curriculum framework has integrated knowledge, skills and values,
and explicitly included the 21st century skills in the lesson for students. This study aims to explore
the elements of green skills that can be integrated into the curriculum of STEM subjects (science,
technology, engineering and mathematics). Qualitative research design was used to collect data from
individuals through interviews, and focus group discussions; the information was then triangulated
with the findings of the analysis document. The purposive sampling technique was used to select
respondents. The findings reveal that there are 10 elements of green skills that can be integrated into
the learning of the 21st century skills: communication skills, intellectual skills, interpersonal skills,
self-management skills, learning skills, career development skills, environmental awareness skills,
green practices skills, STEM skills and entrepreneurship skills. There is a necessity to incorporate
the elements of green skills into the school curriculum, which will add value to the overall education.
The students produced will form a pool of skilled manpower; they can act as catalyst to propel the
nation towards sustainable development.
Keywords: 21st Century Skills, Green Skills, Green Technology, Sustainability
Introduction
21st century learning skills are learning abilities required by students in the new millennium. 21st century skills
can be applied to different abilities required in this age. 21st century skills is include communication skills,
which comprise reading, counting and writing, science and engineering skills, interpersonal and intrapersonal
skills. In order to produce a generation who has 21st century skills, an instructor/teacher needs to ace different
fields, stay up to date with the latest approaches and training methods, be knowledgeable in instructional method
utilizing the most recent innovation and apply the qualities that promote formation of moral values and good
character.
The statement "21st-century aptitudes" is generally used to refer to certain center abilities, for example,
cooperation, computerized proficiency, basic considering, and critical thinking that entrust schools to help
students succeed in today’s world. (Rich, 2010). The Assessment and Teaching of 21st-century Skills
consortium (AT21CS, 2012), places skills, learning, and states of mind into four classifications: methods for
considering, methods for working, devices for working, and living in this world. Most focus on similar types of
complex thinking and communication attainment and all of them are geared towards teaching and learning
instead of rote skill. These abilities are also commonly referred to as higher-order thinking skills, deeper
learning out-comes, complex thinking and communication skills (Larson and Miller, 2011).

Bushra Limuna Ismail, Arasinah Kamis, Che Ghani Che Kob, Tee Zee Kiong and Mohd Bekri Rahim/
Integrating Element of Green Skills in the 21st Century Learning
306
Workforce and management training groups often call 21st century skills as "soft" or "interpersonal" skills.
Meanwhile professional training course of study call them "applied" skills or "workforce" skills. Numerous
adolescent advancement programs allude to them as "life and career" skills. Researcher regularly utilize the
expression "non-cognitive" skills. "Technology literacy" is specified as 21st century sub-expertise. With several
terminologies, they can be defined differently as well. To different instructive associations and organizations, it
is, information-science skills, digital media smoothness, advanced computer and internet communications, and
“technacy,” a more current term used to portray a profound learning of mechanical frameworks as indicated by
Silva, (2009).
Council of Australian Governments (COAG) expressed “Green Skills” as reference to one of the skills based on
the preservation of sustainable development in terms of technical knowledge, values and attitudes needed in the
workforce to develop and support the social, economic and environmental elements established in business,
industry and society. Green skills can also be understood as the knowledge and skills needed to live and work in
ways that are environmentally responsible, and to address the impact of climate change.
Green Skills in Education
Education requires students to be competitive in this millennium. 21st century skills can be associated with a
variety of skills that are needed such as communication skills, (consist of reading, writing and problem solving),
science and technology skills, and interpersonal and intrapersonal skills. For a country to develop a generation
who has 21st century skills, in line with the basic concept of green technology, a student must master a variety
of skills, including applying green skills to themselves to increase their quality and value added to compete in
today's era of globalization.
The goal of the National Green Technology Policy in Malaysia is to provide direction and motivation to the
people of Malaysia so they can continues to enjoy a good quality of life and a healthy environment. The
commitment of the solid waste towards green growth will ensure that the environment and natural resources are
well preserved and protected for future generations (Vona et al. 2015: Fien and Guevara, 2013: Mohd Khairul,
2006). The strategic plan of the first transformation of vocational education is to provide vocational education
curriculum that can generate human capital for employability and prepare individulals who are willing to pursue
higher education. Hence, the transformation of the education curriculum should be implemented (Pavlova and
Huang, 2012).
The 11th Malaysian Plan in the fifth strategic plan recorded building the culture of green technology among
students is a necessary beginning of each level through the development of more effective syllabus. Therefore, it
is vital that green technologies and green skills are nurtured from an early stage in primary school education
rather than waiting until secondary-level education. The objectives is that the value should be synonymous with
the students. With this, when they move to higher levels of education they will be able to apply their skills in
green technology to produce a product, they will also be able to carry out activities in accordance with their
acquired skills and knowledge before taking into consideration the development of green growth (Coljin, 2014:
Fien and Guevara, 2013).
Recognizing that fact, ACET 2015 had eight key items on their agenda, focused on strengthening the TVET as
contained in the Declaration of Kuala Lumpur in preparation to meet the requirements of the job market and
adapt to the challenge of the 21st century. The fourth item on the agenda it is to integrate green skills (greening
skills) for sustainable development in TVET platform to achieve sustainable development, including poverty
reduction and economic growth.
Therefore to ensure that this agenda is achieved, the country should implement standardized programs to
systematically introduce elements of green skills in the curriculum at school level. At higher education level the
TVET system should have a comprehensive institutional approach for training and learning and also look at
increasing professional capacity of teachers and trainers.

Proceeding of the 3rd International Conference on Education, Vol. 3, 2017, pp. 305-314
307
Stregthening Education for a Succesful Student
The education system in Malaysia has to be suitable for the 21st century in order to become an industrialized
country. Therefore the education system must shift to emphasize on quality to enable Malaysia to achieve this
vision. Teaching and learning activities at all levels of education need to be creative and innovative in terms of
knowledge and skills.
Student need to be equipped with more knowledge and skills as only competent students who will eventually
enter the workforce in the future can meet various challenges and know how to grab opportunities. The current
world is characterized by rapid and uncertain changes with technological advancement, requiring the need to
equip students with multi-tasking and skills that can make them a skilful workforce. This is important to ensure
their skills are relevant to the current and future job market, thus making them more employable.
The development of the country depends much on its nation. There is a much need to equip its citizen with
necessary qualities. Such an effort will help produce educated and matured people who are able to contribute to
nation building and have the willingness to do more than what is expected of them. The country needs people
who are capable of sustaining the country’s development and ready to bring the nation to achieve greater
heights.
Education in Malaysia
A typical student in Malaysia undergoes three formal levels of education process; primary, secondary, and
higher education. Primary or elementary levels aim to provide students with foundation knowledge reading,
writing and arithmetic skills. Secondary level is an extension of primary level. Logically, student at this level
should be taught more than just a basic knowledge (Mariam, 2009). Student need to be taught various skills to
make them competent. At this level, higher order thinking and analytical skills such as the ability to apply
critical evaluation are the skills needed to be imparted to the students.
Green skills is a valuable element of in producing competent students (Arasinah et al. 2016). It refers to the
skills required in the development of a green economy and also awareness of environmental issues (Arasinah et
al. 2016). Green skills must be taught in schools to educate the younger generation on the importance of
sustainability practices through education. Development of training curriculum in terms of teaching and learning
in green skills are needed in TVET education. This can be seen through the Secondary School Standard
Curriculum (SSSC) to produce students of the 21st century that emphasizes learning skills in which students
experience in-depth understanding of the inquiry approach and problem-based learning approach based on
Science, Technology, Engineering and Mathematics (STEM), to train them in problem solving and decisions
making.
Research Methodology
Qualitative methods were used for this study in which respondents were interviewed in depth (in-depth
interviews) with several experts. Focus group discussion method was also included for information gathering
and answer the research questions. Semi-structured interview question were used for this research. The purpose
of this in-depth interview is to get as much relevant information. Through this method, there was also real-life
interaction with the people interviewed.
Four experts were interviewed and seven members of the focus group were selected from expert teachers for this
study. The selection of respondents based on predetermined criteria. Interviews were conducted by using a
recording device. The researcher also took note of the reaction of experts and discussion group members. The
data obtained from the interviews were transcribed and then analyzed to identify themes. In addition to that,
document analysis was also used as analytical documents, blueprints and reports related to the study.
Findings
The findings of in-depth interviews and focus group discussions also revealed that there are 10 elements that
can be considered green skills in the integration of the 21st century skills, namely: (1) communication skills; (2)
intellectual skills; (3) interpersonal skills; (4) self-management skills; (5) learning skills; (6) career development
Bushra Limuna Ismail, Arasinah Kamis, Che Ghani Che Kob, Tee Zee Kiong and Mohd Bekri Rahim/
Integrating Element of Green Skills in the 21st Century Learning
308
skills; (7) environmental awareness skills; (8) green practices skills; (9) STEM skills; and (10) entrepreneurship
skills This is because the success of a student is measured during their working life. Although the success of the
school achievement is different for every individual, it still measure some aspects of the same skills. The focus
of teaching should not be focussed on academics alone but should emphasizes a variety of skills including
attitudes, personality and other values that ultimately contribute to the students' employability, and most
importantly is the concern for the environment.
1. Communication Skills
Findings from interviews with experts and focus groups are unanimous concerning the fact that communication
skills are very important for students to help them deal with the outside world after the end of school life.
Communication is very important in ensuring that all information can be communicated properly. Every student
should have the skills to form a good relationship with each other. This refers to the statement expressed by the
respondents as follows:
Panel 1:
“Now we are heading towards the skills of the 21st century ... e.g. communication skills are
important ... because I've been invited as a jury to evaluate the projects carried out by students ...
in terms of the model is good ... but when asked related SOP is quite difficult for the student to explain”
The results of a survey conducted by psychologists and communication experts, showed that people who
possess good communication skills are deemed favourable among employers (Abdullah and Ainon, 2003).
Elements in communication skills include; (1) speaking skills; (2) listening skills; (3) assess skills; (4) writing
skills; and (5) reading. Results showed that these elements of communication skills among students are crucial
for their future career.
2. Intellectual Skills
As indicated by Cambridge University, intellectual skills refer to basic, logical, combining and critical thinking
skills. Scholar incorporate the osmosis of new learning, the advancement of a basic examination of considered
data, and the use of essential information in more extensive settings.
Panel 2:
“Students will demonstrate skill in the application of scientific proficiency and methods,
including the collection, analysis, and interpretation of data, and communicating of the final
results”
Group Discussion:
“The skills will develop our students in writing… reading, speaking, listening, interpretation and information literacy skills… which are vital for academician work”
In view of the other two points of view, the training needs some sense, which incorporates the information
driven and expertise centered approach. Logical thought, as one of the key scholarly skills that are anticipated
from students, has progressively turned into the concentration of contemporary researchers and educators (Ding
et al. 2016). An extreme goal of instruction is to set up our future specialists with required information and
abilities. This includes equipping students to become proficient in thinking so they can utilize logical reasoning
to devise causal from observation. The students must have high-level thinking skills.
Proceeding of the 3rd International Conference on Education, Vol. 3, 2017, pp. 305-314
309
3. Interpersonal Skills
Interpersonal skills are becoming significant to students as they enable students to deal with any individual
regardless of what type of character he or she is. Interpersonal skills incorporate responsiveness in
correspondence, trustworthiness, accommodation, great way, regard, thoughtfulness and sympathy.
Furthermore, interpersonal skills are centered around undivided attention, very much created composed and oral
correspondence, understanding the perspectives and places of others in the gathering, enthusiastic development,
and subjective adaptability. If a leader has well-developed interpersonal skills, he or she will be able to promote
a healthy atmosphere of confidence and reliance in the workplace and build valuable relationships among team
members. This also related to the statement of:
Panel 3:
“A decent feeling of overseeing one-self is the essential part of interpersonal intelligence … .we
additionally called it as soft skills”
Group Discussion:
“Skills that are particularly detectable to others and they are the competency of a person to
translate and deal with his/her own emotions, activities, inspirations and that of others in the
social settings”
Students need to know how to manage individuals in the gathering exchange. With regards to skills, they should
know how to discuss appropriately with their gathering. In the event that the student has an issue with
interpersonal skills, the goal of exchange will not meet the objective. Lopez and Marlow (2002) characterized
interpersonal skills as an accomplishment that one needs to keep in mind the end goal to discuss viably with
someone else or a gathering of individuals. An individual with estimable interpersonal skills is guaranteed to
land a not too bad position and set up wonderful compatibility in the work environment with administrators and
partners. Skills like confidence, cooperation, stretch administration, authority qualities, critical thinking,
correspondence, steadiness, basic leadership, outrage administration and listening abilities are named as
interpersonal skills (Vijayalakshmi, 2016).
4. Self-Management Skills
Self-management is a key ability that will help students all throughout their lifetime. It includes setting
objectives and time management. Students need to create inspiration and fixation skills which will help them to
be more confident. Effective self-management will help them to minimize stress and give them more chances to
get involved in school activities. A key skills in self-management is self-direction. It alludes to people
observing, controlling and coordinating parts of their learning for themselves.
Panel 2:
“Students need to have the ability to feel more productive in doing things regardless of the daily
routine environment. They must have the skills that will help them communicate efficiently with
peer…..”
Panel 4:
“Any employer is interested in hiring a productive person who has ability in self-management
skills. It is highly important to develop these skills in every student as they are going to build
their career soon after finishing tertiary education”

Bushra Limuna Ismail, Arasinah Kamis, Che Ghani Che Kob, Tee Zee Kiong and Mohd Bekri Rahim/
Integrating Element of Green Skills in the 21st Century Learning
310
5. Learning Skills
Learning skills are not subject particular, they are non-specific skills. This is because different subjects require
different methods of learning. For instance, numerical skill, in the vast majority, depends on visual/spatial
deduction and the acknowledgment of example, meanwhile, dialect ability typically depends on etymological
memory and the ability to rearrange sound-related refinements. These are all skill sets that can be taught and
incorporated either inside related subjects or in a non-exclusive learning abilities preparing program.
Group Discussion:
“...an inside and out human quality, a joining of information, abilities, individual qualities and
understanding utilized fittingly and viably….the process of learning incorporate subjective,
metacognitive and affective skills…”
These skills can be taught to each student. Once any student has acquired the particular 'learning skills' they are
expected to handle, comprehend, recall and apply the knowledge, skills and information given to them at school
and their learning capacity makes strides. They then acquire confidence in their own particular capacities, their
accomplishment in all school subjects improves, and they achieve better result in tests and exams, these
outcomes clearly show increase in their knowledge.
ATC21S has characterized these abilities of a knowledge-based economy as those that advance joint effort with
others and association through innovation and has placed 21st-century skills globally into four general
classifications:
Ways of thinking - creativity, critical thinking, problem-solving, decision-making and learning
Ways of working - communication and collaboration
Tools for working - information and communications technology (ICT) and information literacy
Skills for living in the world - citizenship, life and career, and personal and social responsibility
6. Career Development Skills
The competences needed to advance in one’s career change along with development are known as career
development skills. The Self Career management process is consist of three steps, which the worker must be
aware of; (1) which competences he needs, (2) how he can develop them and (3) who has to support him to do it
(Guglielmi, 2015). It is very crucial for each student to know how to make their pitch to employers after
completing their tertiary education.
7. Environmental Awareness Skills
Environment includes all living and non-living objects. Individuals live on the Earth and utilize the natural
assets like air, land and water to meet their everyday needs. Advancement likewise implies addressing the
necessities of the general population. In the event that we utilize any natural asset, for example, ground water
past its point of confinement of substitution, we may lose it for eternity. Accordingly, there is a need to create
"awareness" of environmental protection. While effort are being made at the national and global level to ensure
our environment preserved, it is likewise the duty of each resident to utilize our ecological assets with care. One
of the panel members’ comments it is imperative to create the environmental awareness:
Panel 1:
“We utilize natural assets in our everyday life. These resources are renewable and non-renewable. We must be more careful in consuming non-renewable resource like coal and oil…

Proceeding of the 3rd International Conference on Education, Vol. 3, 2017, pp. 305-314
311
… Natural resources of land, air and water must be used wisely as a trust to guarantee a solid
domain for the present and who and future generations”
From this point of view, the mindfulness in securing nature is exceptionally critical. One prominently effective
case was empowering the utilization of reusable mugs (rather than disposable mugs), the utilization of paper bag
(rather than plastic bag), attempt to use recycled paper, limit the utilization of vitality or acquiring of green
items. The recycling program has been conducted on numerous occasions to promote environmental education
and awareness of environmentally friendly habit and values to the general public.
8. Green Practices Skills
The establishment of Green Practices Commission of University City in Missouri in 2008 is to support
manageable practice and projects that enhance the wellbeing and personal satisfaction history of their group;
restore and secure the common assets, and reinforce the economy. Green practices skills can prompt all the more
environmentally friendly and ecologically responsible decision and lifestyles which can protect the environment.
Panel 4:
“Nowadays people bring the bag for shopping…...they don’t use plastic bag cause they will be
charged 20 cents for each plastic bags. The government also encourage people to buy electric
product which less energy ……”
Considering the right factors, and taking the right path for greening the environment everyone should have green
practices skills. Gundogan, (2012) stress the importance of:
assessing the life cycle of products and processes, including their afterlife period
using renewable and readily available inputs throughout the life-cycle
selecting all material and energy inputs and outputs to be as inherently non-hazardous as possible
choosing materials, components, or process alternatives that have reduced environmental impacts
designing for disassembly and recycling
preventing waste
9. Stem Skills
The education in the United States needs a more extensive, more planned procedure for precollege training in
science, technology, engineering, and mathematics (STEM). That system ought to incorporate all the STEM
profession and address the requirement for more noteworthy assorted qualities in the STEM for a workforce
with deep technical and personal skills, and for a STEM-literate citizen prepared to address the grand challenge
of the 21st century (Rodger, 2010).
The European Commission, (2007) has set out eight key items for lifelong learning skills in terms of
communication in the native language, communication in foreign languages, numerical competency and
fundamental capabilities in science and innovation, advanced ability, figuring out how to learn, social and urban
skills, feeling of activity and business and social mindfulness and expression). Different views from Binkley,
Erstad, Herman, Raizen, Ripley, Miller and Rumble (2012) attempt to classify abilities by individual and moral
angles (living in this world), working (dividing them in tools for working and ways of working) and thinking
(ways of thinking).
Among the most essential skills for any student (managing STEM or not) is the logical or algorithmic
considering, now also called computational thinking. This term rises decisively within the discussion on digital

Bushra Limuna Ismail, Arasinah Kamis, Che Ghani Che Kob, Tee Zee Kiong and Mohd Bekri Rahim/
Integrating Element of Green Skills in the 21st Century Learning
312
literacy skills (Seoane-Pardo, 2016). Notwithstanding that it additionally relates to the announcement from the
panel with respect to of STEM abilities:
Panel 2:
“Such skills for instance ICT skills could be instructed through any subjects, provided that it is
made deliberately and with the satisfactory educational methodologies and student is aware of
the importance of STEM subjects”
Although several policy and curriculum documents are now recognizing the important role of the respective
disciplines in STEM integration, including engineering, little attention is given on connecting core content
knowledge and processes across the disciplines (English, 2016). The coordination of science, technology,
engineering and mathematics skills is viewed as critical for financial advancement. This is on account of STEM
skills are esteemed by each area. This is critical as student with better mentalities towards maths and science
have appeared to score better in these subjects (TIMSS, 2010). These understudies are likewise more prone to
settle on STEM subject decisions and proceed into STEM career in the future.
10. Entrepreneurship Skill
Entrepreneurship Skills are connected to leadership, torisk taking, development and change management and
they relate to soft skills (Cimatti, 2016). The key qualities are characteristics, for example, creativity, the
capacity to continue going despite hardship, and the social abilities expected to assemble awesome groups. For
instance, if somebody needs to start a business, it is normal to consider the particular abilities that support these
qualities. It is likewise vital to cultivate entrepreneurial skills in the event that he or she engages in work that
would build up a business, or "take things forward" more generally.
Some experts think of entrepreneurs as individuals who will go out on a limb that other individuals will most
certainly not. Others characterize them as individual who start and build successful businesses. Contemplating
the first of these definition, enterprise does not really include starting your own particular business. Many
individuals who don not work for themselves are perceived as business people inside their associations. This is
reflected in one of the panel’s comments as below:
Panel 3:
“….students need to have basic knowledge skills on entrepreneurship…..because nowadays we
are moving globally…not all student will being employed after finish their school…maybe they
want to venture into business…this skills is very important to them…..”
Many scholars and policy makers agree that entrepreneurship is highly relevant for the success of today’s
societies owing to its effects on economic and technological development and the creation of new jobs (Baumol,
et al. 2007). Thus today, entrepreneurial thinking and acting is seen as a 21st century skill, one of the basic
meta-capabilities that the young generation will need to develop to be successful in life. (Obschonka et al.
2016).
Conclusion
Environmental education and training for greening skills needs to be addressed at all levels of educations and it
has plays an extremely significant part in promoting mindfulness towards sustainability. An integrated approach
should takes into consideration how the range of abilities can be tended to at various levels of training
education. This requires an effective green framework, policy and practices for creating a highly skilled and
Proceeding of the 3rd International Conference on Education, Vol. 3, 2017, pp. 305-314
313
creative workforce and talent pool that are critical to achieving sustainable inclusive economic development in
the 21st century. In this global economic challenges, people should have the awareness of the importance of
sustainability and the need for green skills. This is in line with technical and vocational education that is needed
to produce high-skilled labour who know the importance of sustainable development. TVET sector needs to take
advantage of opportunities and worker productivity in the economy as well as building competitiveness in
facing the challenges of change and development. Due to that, there is a clear evidence to show that TVET has
assumed a key role in upgrading green improvement (Ramlee, 2015).
Acknowledgements
The author gratefully acknowledges the Ministry of Higher Education of Malaysia for the funding of the project
FRGS (Fundamental Research Grant Scheme), 2015-0166-107-02 (FRGS/1/2015 /SS109 /UPSI/03/13). The
author also acknowledges the constructive comments received by the anonymous reviewers.
References
Abdullah Hassan & Ainon Mohd. (2003). Kemahiran Interpersonal Untuk Guru Bestari. (Kuala Lumpur:
Utusan Publication & Distributors Sdn. Bhd.)
Arasinah Kamis, Ramlee Mustapha, Waliza Abdul Wahab & Bushra Limuna. (2016). Green Skills as an Added-
Value Element in Producing Competent Students. Int. Journal of Engineering Research and Application Vol.
6(11), 12-21.
Baumol, W. J., Litan, R. E., & Schramm, C. J. (2007). Good capitalism, bad capitalism, and the economics of
growth and prosperity. (New Haven, CT: Yale University Press).
Binkley, M., Erstad, O., Herman, J., Raizen, S., Ripley, M., Miller-Ricci, M., & Rumble, M. (2012). Defining
21st Century Skills. In P. Griffin, B. McGaw, and E. Care (Eds.), Assessment and teaching of 21st Century
Skills (pp. 17–66). Springer, Netherlands
Cimatti, B. (2016). Assessment of Soft Skills and Their Role for the Quality of Organizations and Enterprises.
International Journal for Quality Research 10(1) 97–130
Ding, L., Wei, X., & Mollohan, K. (2016). Does Higher Education Improve Student Scientific Reasoning
Skills? International Journal of Science and Mathematics Education, 14(4), 619-634.
Dychtwald, K., Erickson, T. J., & Morison, R. (2006). Workforce crisis. How to Beat the Coming Shortage of
Skills and Talent. (New York).
English, L. D. (2016). STEM education K-12: perspectives on integration. International Journal of STEM
education, 3(1), 3.
EUROPEAN COMMISSION, (2007). Key Competences for Lifelong Learning. European Reference
Framework. Office for Official Publications of the European Communities, (Luxembourg).
Fein, J. & Guevara, J. R. (2013). Skills for a Green Economy: Practice, Possibilities and Prospect. Technical and
Vocational Education and Traning Issues, Concern and Prospect (19), 255-263.
Gündoğan, M. B., & Eby, G. (2012). A green touch for the future of distance education. Procedia-Social and
Behavioral Sciences, 55, 789-798.
Guglielmi, D. (2015). Employability: Competences to Manage Boundaryless Careers. Speech at “Soft Skills and
Their Role in Employability – New perspectives in teaching, assessment and certification”, workshop in
Bertinoro, FC, Italy.
Larson, L.C., & Miller, T.N. (2011). 21st Century Skills: Prepare Student for the Future. Kappa Delta Pi Record,
47(3), 121-123

Bushra Limuna Ismail, Arasinah Kamis, Che Ghani Che Kob, Tee Zee Kiong and Mohd Bekri Rahim/
Integrating Element of Green Skills in the 21st Century Learning
314
Lopez, C., & Marlow-Ferguson, R. (2002). World Education Encyclopaedia: A Survey Of Educational Systems
Worldwide. (Gale Group).
Mariam Adawiyah Zulkifli. (2009). Highlighting the Importance of Cognitive Engagement among Students of
Higher Learning Institutions in Strengthening Higher Education for a Succesful Workforce. (Ampang Press
Sdn. Bhd.).
Mohd Khairul, A.,M. (2006). Menyemai Teknologi Hijau di Malaysia. Dewan Kosmik, pp. 6-14.
Obschonka, M., Hakkarainen, K., Lonka, K., & Salmela-Aro, K. (2016). Entrepreneurship as a 21st Century
Skill: Entrepreneurial Alertness and Intention in the Transition to Adulthood. Small Business Economics. 1-15.
Pavlova, M. & Huang, C. L. (2012). Advancing Employability and Green Skills Development: Values
Education in TVET, the Case of The People's Republic of China. In Skills Development for Inclusive and
Sustainale Growth in Developing Asia-Pacific. (pp. 327-343). (Spinger Netherlands).
Ramlee Mustapha. (2015). Green and Sustainable Development for TVET in Asia. The International Journal of
Technical and Vocational Education.133-142 Rich, E. (2010). How do you Define 21st Century Learning?-Education Week. Retrieved February 13, 2017
from.http://www.edweek.org/tsb/articles/2010/10/12/01panel.h04.html
Rodger W. B. (2010). What Is STEM Education? American Association for the Advancement of Science;
Vol.329
Silva, E. (2009). Measuring skills for 21st-century learning. The Phi Delta Kappan, 90(9), 630–634.
http://doi.org/10.1177/003172170909000905
Seoane-Pardo, A. M. (2016). Computational Thinking Beyond STEM: An Introduction To Moral Machines And
Programming Decision Making In Ethics Classroom. Proceedings of the Fourth International Conference on
Technological Ecosystems for Enhancing Multiculturality (pp. 37-44). ACM.
TIMSS, (2010) International Mathematics and Science Reports. Available from
http://timss.bc.edu/timss2007/intl_reports.html (November 20, 2015)
Vijayalakshmi, V. (2016). Soft Skills-The Need of the Hour for Professional Competence: A Review on
Interpersonal Skills and Intrapersonal Skills Theories. International Journal of Applied Engineering
Research, 11(4), 2859-2864.
Vona, F. Marin, G. Consoli, D. & Popp, D. (2015). Green Skills. National Bureau of Economic Research, No.
w21116.

Proceeding of the 3rd International Conference on Education, Vol. 3, 2017, pp.315-327
Copyright © 2017 TIIKM ISSN 2424 - 6700 online DOI: https://doi.org/10.17501/icedu.2017.3132
3rd International Conference on Education, 20-22 April 2017, Kuala Lumpur, Malaysia
SPEECH ACTS ON THE POSTERS IN HANDLING
REFUGEES IN FREIBURG
Rezki Auliya Handarta
Universitas Gadjah Mada, Indonesia
Abstract:The aim of this pragmatic study is to describe the types and the forms of the
speech acts on the posters in handling refugees in Freiburg, Germany.This study is a
descriptive study that aims to understand the phenomenon of language containing in the use
of posters in handling refugees in Freiburg then analyzed and described carefully to make
the conclusion.The writer used informants and form of written media namely posters as the source to obtain data. The informants in this study are the staff and the coordinator of the
social institutions that handle refugees in Freiburg. The Germany government gives the
handling of refugees into social institutions at the local level. They then organize and guide
refugees how to live in Germany and in the camps where they live. In Freiburg, social
institutions use posters for something important and to guide refugees live or do activities
without telling them repeatedly. Posters that they wrote contain much more in the kind of
speech acts namely assertive, directive, and phatic. The forms of the speech acts are positive
declarative sentences, negative declarative sentences, positive imperative sentences, negative
imperative sentences, and positive introgative sentences.
Keywords:Pragmatics, Speech Acts, Posters, Refugees
Introduction
Human and language are two inseparable things. Language is the instrument used to communicate in daily life.
According to Chaer and Agustina (2004:11), the main function of language is as the communication or the
interaction tool. Through communication act, every speaker intend to deliver the purpose or certain aim towards
speaking partner with language as the media. According to Rani (2004:37), there is a speech act in language
communication. In a communication, it can be assumed that a speaker articulate the utterance in the aim to
inform something towards the speaking partner and expecting the speaking partner (listener/reader) to
understand the thing that will be or have been communicated.
Germany’s government has recently posted the poster that intended for the refugees that installed in
refugees’ camp, symbolized by a male picture, crouch under the bath shower with black poop behind him and
red-cross line stamped on it (source: okezone.com from WND report, Thursday 21st January 2016). The note
under the poster saidplease do not poop in the shower!. What found interesting is in several posters in Germany
that intended for the refugees are added with symbolized pictures. According to this circumstance, it can be said
that a communication process is already conducted through speech act concept by using words and sentences
stamped on that posters. By the existence of these posters, the refugees’ management actor in Germany,
especially in Freiburg, is able to indirectly giving a message or intention towards the refugees which in this case
the refugees’ management actor act as the speaker and the refugees act as the posters’ readers. This situation is
related to the concept expressed by Allan in Lambut (2014:2) regarding the speech act, which explain that the
writers or actors that appoint a poster’s writer can be assumed as the speaker. Each word printed or wrote on
those posters are the utterance that expressed with prosody ɸ. That written utterance is being read by the readers,
as also being heard orally by the listeners. This process occurs in certain context. Aside from that, Wijana (2010:
92) said that speech is every act shape that conducted by the speaker in using their language.
Germany is one of the European countries that declared their willingness in helping the refugees. This
willingness is implemented on the policy issued in the middle of September 2015. This policy known as
Flüchtlinge Willkommenwhich interpretatively symbolized the country openness towards refugees from the
Corresponding Author: Rezki Auliya Handarta/[email protected]
Rezki Auliya Handarta/Speech Acts on the Posters in Handling Refugees in Freiburg
316
countries inflicted in conflict and war like Syria. This issued policy is in line with what expressed by Angela
Merkel as the Germany’s Chancellor that Germany is the country built in accordance with law and humanity,
thus Germany would be more self-open towards refugees issue rather than other European countries. Compared
to other European countries, Germany is indeed more responsive and being positive in managing European
refugees crisis.In handling refugees, the Germany’s government utilized and trusted the process to
organizations, local institutions, or church communities to educate, empower, and manage the refugees’
potency. They use written media to communicate with refugees in the form of posters. The actor in handling
refugeesin Germany especially in Freiburg is using poster for important matters and also to guide them to live
their daily life in refugees’ camp as well as how to run activities such as using kitchen, bathroom, or public
space accordingly to prevent repeated advice by the The actor in handling refugees and made them aware of the
rule and being discipline towards it. These posters not only written in Germany language but include translation
in English and Arabic. The interesting part is these posters also include picture or illustration because some of
the refugees are illiterate and weren’t able to fully understand the meaning.
According to the organization that manages the refugees, the poster utilization also found valuable to ease the
refugees towards information, because the poster works as media that can be known and seen visually. The
Germany’s culture also being adamant towards explanation regarding simple matter especially for things related
to living in Germany, for example in how to manage the kitchen, they would only explain at one time and
reluctant to give another repetition, however, the refugees always come in question whenever they face the
situation again. This explanation is acquired by the researcher after conducting the interview with Franz Grasser
who is the leader in the social organization of refugees’ management (Diakonisker Werk) for refugees’ camp in
Lorracherstrasse 45, Freiburg. He also explains to the researcher about the reason behind the poster inscribed
with don’t poop in the shower!and the illustration on the poster that shows someone in a special shower-
bathroom with poop under him which being “X” marked on the entire picture. Franz explains that this thing
used to happen in the past because the refugees are unfamiliar with the type of bathroom in Germany which
totally different with what they have in the past hometown. He also added that although the poster has been
posted, this thing keeps happening that made them to continuously redesign the poster with more assertive
illustration. This matter not only related to language only but culture as well. He also added that the duty of a
translator in his social organization not only to translate the language but to translate culture as well. The
translators hired are the immigrants who work in Germany, especially in Freiburg or the students who currently
studying in Freiburg and most of them are from Syria. According to Franz, the Syria refugees are easier to
communicate due to their ability in speaking English.
Several refugees are still unable to adapt to Germany’s culture and conduct full interaction. Some of the
informants explain that this condition happened because: 1) they still want to return to their own country, 2) they
have severe trauma after long journey, the journey itself not only exhausting but also filled with horrible
experience, and 3) they still hold the tradition or religion’s aqeedah especially for women in keeping their
distance when interacting with others while communication and interaction conducted and experienced by
refugees’ management actor towards refugees that arrive in Freiburg, Germany has to emerge as the form of
responsibility and instinct as social creature. The communication intended to guide the refugees to live and
adapt to new environment. The communication process with the refugees begins by introducing Germany
culture, especially in Freiburg as well as the language and speech manner used by local people to create mutual
understanding.
The authority in handling refugeesin Freiburg is conducting the verbal communication with the refugees in oral
and written manner. The verbal communication with oral language is easy to be conducted whenever the
refugees are able to speak Germany or English although some refugees are having a limitation in mastering
those two languages. However if language barriers occur, the social organization will use translators and in the
emergency situation when the translators. Refugees’ camp in Bissierstrasse 9 that use refugees’ children to
communicate because based on their experience, refugees’ children only need about three months to learn
Proceeding of the 3rd International Conference on Education, Vol. 3, 2017, pp.315-327
317
Germany language, thus the authority in handling refugeeswould be focus on teaching the Germany language to
refugees’ children to ease and bridge the communication with their parents or families.
The refugees in Germany will inevitably have to build communication with Germany citizen especially in the
social organization where they being assisted. This matter is difficult and become more complicated due to the
women refugees situation that conditioning them to distant themselves that probably influenced by the culture
and how to communicate in their origin countries. Regarding this situation, however, they should keep
interacting with the organization that responsible to assist them because this condition would help the authority
to controls and guides their way of life in Germany especially in Freiburg.
The authority that manages or handlesthe refugees in Freiburg has their own time to interact with the refugees.
However, if there are any urgent matters, they all prepared to leave at any moment needed. For the general and
technical things, the authority in handling refugees in Freiburg use written media namely posters so it can be
seen, remembered and understood by the public, especially the refugees.This research is intended to explain
what is the type of the posters in handling refugees in Freiburg and what is the form of speech act expression on
the posters in handling refugees in Freiburg.The result of this research is intended to be useful in theoretical,
practical and academic aspects.
1. Theoretical value: this research is intended to be useful in developing scientific knowledge of socio and
cultural science, especially linguistic science.
2. Practical value: this research is intended to be input for community, philanthropist, and policy maker
that work and related to the refugees’ management, especially in Indonesia.
3. Academic Value: this research is intended to give contribution through empirical ideas regarding
phenomenon and speech act in the communication process and refugees’ management which currently
become a global issue. In that order, this research is expected to be a reference for other researchers in
conducting similar research or another research related to this theme.
Theoretical Framework
Speech is a word expressed by a speaker to his/her speaking partner when communicating. Speech in the
pragmatic study can be understood as the form of speech act itself and as the product of one speech act (Nadar,
2009: 7). Leech (1993:20) expressed a similar opinion that considering speech in pragmatic context as the
product of verbal act (not the verbal act itself).According to Wijana (1996: 12), speech used in pragmatic
context is a form of speech act. In that case, the speech that being produced is a form of speech act. For
example, in the sentence of “Is your hair growing too long?”, this sentence can be defined both as a question and
imperative sentence. In its relation to pragmatic context, it can be asserted that there is a fundamental difference
between sentence and utterance. The sentence is a grammatical entity as the result of linguistic that identified
through the user in a certain situation. From the definition above, an utterance can be defined as the speech
resulted from speech act which conceives certain meaning/significance and utilized in a certain situation.
Speech act is a linguistic symptom that occurs in the communication process. According to Cunningsworth (via
Tarigan, 1990: 41), the speech act theory is the theory that centers it concern on the utilization of language in
communicating aim and purpose of the speaker as well as the meaning of the utilized language. Aside from that,
Rani (2004: 37) has revealed that in communication, speech act is contained in it, language communication not
only a symbol, word, and sentence but would be correctly mentioned as the product or results of manifested
symbol or sentence. A speech act is not only a direct representative of the elements meaning.Speech act is the
utterance product resulted as part of social interaction (Sumarsono, 2009: 323).Chaer and Agustina (2004: 50)
define speech act as the psychological individual symptom determined by the language ability of the speaker in
facing certain circumstances. A speech act pressures more in meaning or definition of act in one utterance.In
that meaning, it can be understood that speech act used by someone highly determined by several factors, such
as language, speak partner, situation and language structure used in that act. Based on the description above, it

Rezki Auliya Handarta/Speech Acts on the Posters in Handling Refugees in Freiburg
318
can be concluded that speech act is a social interaction activity conducted by human individual to express the
meaning and purpose of language that being used in facing certain circumstances.
According to Wijana (1996: 18), Illocutionary act is an utterance that used to express or inform as well as
conducting a particular thing. Illocutionary speech act is the speech act that identified by explicit performative
sentence. Illocutionary speech act usually related to granting permission,expressing gratefulness, ordering,
offering, and promising (Chaer and Agustina, 2004: 53). Nadar (2009: 14) also expressed a similar opinion that
mentions Illocutionary act as the act to be achieved by the speaker in the time of uttering something and could
be an act of expressing promise, apologize, threat, forecast, order and etc. In that meaning, it can be said that
illocutionary act is not only means to inform but also refers to conduct something.According to Searle (via
Tarigan, 1986: 46-48), illocutionary act can be classified into five criteria: a) Assertive: this speech act is
involving speaker towards proposition truth that being expressed. For example: declaring/expressing, informing,
suggesting, boasting, complaining, demanding, or reporting, b) Directive: this speech act is intended to emerge
several effects through listener action, for example: reserving, ordering, begging, asking, suggesting, and
advising, c) Commissive: this speech act is involving speaker in the upcoming actions, for example: promising,
vowing, offering, and praying, d) Expressive: this speech act has functions to express, reveal, or inform the
psychological attitude of the speaker towards an expression of a condition predicted by illocutionary act, for
example; expressing gratefulness, congratulate, forgiving, pardoning, praising, expressing condolence, and
etc,e) Declarative: the declarative speech act is the condition when the illocutionary performance is successful,
will inducing good correspondence between proportionality and reality, for example: surrendering, firing,
releasing, baptizing, giving name, isolating, appointing, determining, punishing, convicting, and etc.
The latest perspective regarding speech act from Kreidler (1998:183-194) in his book; Introducing English
Semantics, divide speech act into seven categories, which are:1) Assertive Utterances: assertive utterance occurs
because the speaker is using language to narrate what they knew and believed, such as expressing, announcing,
explaining, showing, mentioning, and reporting., 2) Performative Utterances: performative utterance is the
speech act that officially creates or cause what to expressed, for example announcing, baptizing, mentioning,
nominating, naming, and sentencing, 3) Verdictive Utterances: verdictive utterance occurs because the speaker
is assessing someone else action, usually the speaking partner, for example, accusing, being responsible, and
express gratefulness, 4) Expressive Utterances: Expressive utterance occurs because of speaker action, the
failure of the speaker and consequences emerged by that failure, for example, confessing, being sympathetic,
forgiving, and etc, 5) Directive Utterances: Directive utterance contains the meaning of the speaker in acquiring
speaking partner permission to conduct or not conduct an activity. Directive utterance consists of three types,
which are commands, request, and suggestions, 6) Commissive Utterances: commissive utterances is the speech
act that tied a speaker to conduct an action, for example, agreeing, asking, offering, resisting, promising, and
vowing, 7) Phatic Utterances: phatic utterance is one of the speech act that aimed to create a relation between
speaker and speaking partner.
Methodology
This research is descriptive study aimed to understand the linguistic phenomenon which found in the poster in
handling refugees in Freiburg, then being analyzed and described diligently to create proper conclusion.This
research is using a qualitative type of data. Qualitative data is the data in the form of information, sentence, or
words, which in this context is a poster. Qualitative data is used as a foundation to analyze speech act in the
posters in handling refugeesin Freiburg, Germany.Data is collected with observation and writing technique. By
using writing technique, the researcher will record directly utterances that found in the poster in handling
refugeesin Freiburg. Aside from that, phone camera as the supporting tool is needed to acquire data. The phone
camera is used to take the pictures of posters in handling refugeesin Freiburg that has been studied and also
using interview technique as supporting tool.Identificationand interview method are used to analyze the data.
Proceeding of the 3rd International Conference on Education, Vol. 3, 2017, pp.315-327
319
Identification method is the method conducted by determining one type of speech act. The speech acts that own
similarities in characteristic are classified into one type of speech act, while the speech acts that own different
characteristic are classified into the different type of speech act.The interview method is used as in-depth
analysis towards discovered data by conducting a direct interview with actor that wrote the posters in handling
refugeesin Freiburg as well as interviewing the refugees as the target for those posters. It can be explained as
well that in the process of analyzing data, the researcher uses pragmatic analysis in the form of language
analysis in the pragmatic perspective (Rustono, 1999:18). This analysis is conducted to determine the speaker
intention that either expressed explicitly and/or implicitly behind the sentence used or posters’ discourse towards
the refugees in Freiburg.The result of data analysis is presented by using general words into written report. The
formulation of data analysis result is presented by using general words that usually referred as an informal
method. According to Sudaryanto (1993: 145), the informal method is the method that utilized general words in
presenting data analysis. Speaking in further, Jati Kesuma (2007: 74), stated that the meaning of the utilization
of general words in the presentation of data analysis result are the words that easy to understand while be read.
Kinds of Speech Acts on the Posters in Handling Refugees in Freiburg
Some of those speech acts are had by the posters in handling refugees in Freiburg and the data are explained as
follows:
a) Assertive Act
Based on Searle (1969), an assertive act is a speech act binding the speakers for the truth on what they
say or write. The intention of the speech act expresses the speakers or writers’ belief about the matter of the
external reality or tells people about something. It means that in this speech act, the speakers or writers try to
make sentences, words, or utterances produced in accordance with the facts. The assertive act can be in the form
ofthe utterances for expressing, reporting, making a hypothesis, informing,showing, mentioning, concluding,
describing, etc.
The assertive acts found in the posters of handling refugees in Freiburg can be seen through the data
with their explanations as follows:
1) Cookers are no personal property!
(Poster 1, data a)
Context: The writer announces about the status of the cookers in the kitchen of the refugees’ camp.
The utterance of the poster is the assertive acts because it contains the facts about the status of the
cookers in the kitchen of the refugees’ camp. Delivering the facts on the utterance of the poster is informatively
delivered for the readers, especially the refugees staying in the camp and using the kitchen facilities. It is
marked by the utterance Cookers are no personal property! (The cookers are not private properties). The
utterance refers to delivering facts or information, that is, all cookers in the refugee camp are not personal
properties. The statement of the speech is the form of the claim or the act affirming the authority in handling
refugees toward something and it must be known by the readers and interlocutors. Therefore, the utterance
above is classified as an assertive act.
2) Library opened Monday and Thursday from 5.00 to 6.30 pm.
(Poster 6)
Context: The writer of the poster gives information on the operational schedule of the library in the
refugee camp.
The speech act of the poster above is an assertive act because it contains the fact or the announcement about the
opening hours or the operational time of the library in the refugees’ camp. The utterance of the poster is
addressed to the readers that want to use the library as a place for reading. The information containing the
opening hours of the library also contains a conclusion that besides the informed or printed time on the poster,
the library is not operating or closed.Therefore, the informative explanation of the utterance delivered by the
writer of the poster is an assertive act.

Rezki Auliya Handarta/Speech Acts on the Posters in Handling Refugees in Freiburg
320
3) Are you new in town?
Would you like to get to know people and make contacts?
Would you like to jam with some other musicians?
Do you like homemade food? Do you miss playing football?
Then this platform is for you! (Poster 10, data a, b, c, d, e and f)
Context: The writer of the poster offers a community or activity that can be followed by the refugees to
satisfy their social needs.
The utterances of the poster above use assertive acts because they contain the writer’s belief about the condition
of the refugees who need a community or a communication space to socializing, doing hobbies, and getting to
know each other. The writer’s knowledge and conviction about what is needed by the refugees is expressed in
the utterances and the writer gives a response in the informative explanation marked by a lingual sign Then this
platform is for you! It refers to the information about the community giving services or information to the
readers or refugees who are new comers and still need guides about how they live, socialize, and stay in
Germany especially in Freiburg. Therefore, the speech acts in the utterances of the poster above are assertive
speech acts.
4) Compact guide for refugees and foreigners
How does local transport works?
Where am I allowed to ride my bike?
And who actuallly has the right of way?
The free app for everyone who wants to get around town safety.
(Poster 12, data a, b, c, d, and e)
Context: The writer of the poster gives information to the refugees about the presence of the
application that can be used to know transportation systems and ways to mobilize in Freiburg.
The utterances of the poster above show assertive acts because they contain the writer’s belief about the reader’s
need to know the transportation system and mobilization in Germany especially in Freiburg and the fact of the
application that can be used to know them. The utterances above are especially addressed to the refugees or the
foreigners who newly come in Freiburg. This case is tagged by a lingual marker Compact guide for refugees and
foreigners. The informative explanation of the transportation systems and ways how to mobilize in the city
safely is delivered by the lingual marker How does local transport works? and The free app for everyone who
wants to get around town safety . It refers and brings the readers on the answer or conclusion of the application
that can be used to the refugees or foreigners about the transportation and mobilization in Freiburg. Therefore,
the utterances of the poster above are categorized as assertive acts.
5) Woman and men are equal and have the same rights. We cannot tolerate violance in any room.
Violance against women and children is a crime in Germany!
(Poster 15, data b, d, and f )
Context: The refugees handling authority writes the poster dan sticks it in the refugees’ camp as the
code of conduct and information that must be known together and remembered.
The utterances of the poster above include assertive acts because those contain the writer’s belief and conclusion
about human rights, especially the status of the equality of rights between men and women in Germany. The
speaker also confirms his attitude towards the infraction of the human rights especially in the form of the
violence tagged by the lingual marker We cannot tolerate violance in any room. Besides, the poster also
contains the informative explanation of the violence on women and children. This action is considered as the
criminal action and against the law in Germany, so it contains a conclusion that the refugees doing the action
will be processed into the legal recourse. Therefore, the utterances of the poster above show the characteristic of
the assertive act.
6) Attention: if you are absent for more than two weeks, you will be deregistered automatically! That
means, you will not reserve any money from the office of social affairs, neither do you have heakth
insurance! Likewise, the Ministry of Migration and Refugees (BAMF) cannot reach you to carry out
the process of asylum.

Proceeding of the 3rd International Conference on Education, Vol. 3, 2017, pp.315-327
321
(Poster 15, data n, o, and p)
Context: The writer delivers the information about the code of conduct or the rule related to the
residence status in the refugee camp for the refugees.
The speech act of the poster above is an assertive act because it contains the information addressed to the
refugees that stay in the refugee camp. The information is about the absence and staying rules if the refugees
want to leave the refugee camp in some time. Besides, the poster includes the information of the residence status
if the refugees leave the camp more than the specified time. Therefore, the utterances of the poster above refer to
the characteristic of the assertive act.
b) Directive Act
Searle (via Leech, 1993) states that the directive act is an illocutionary act which have a purpose to produce an
effect in the form of the action done by the speaker or the interlocutor. Yule (1996: 93) also says that the
directive act is the speech act used by the speaker to order other people to do something. Therefore, it can be
concluded that the directive act is a speech act addressed by the speaker to the interlocutor to do something
which is desired, expected, or ordered by the speaker. Below here are examples of directive speech acts
contained on the posters of handling the refugees in Freiburg and their description as follows:
1) Visitors are allowed to stay maximum three days and you need to apply one week before at the social
office. Therefore we need copies of the identity cards of the visitors.
(Poster 2, data a and data b)
Context: The writer (the actor in handling refugees) delivers the information about the staying rule for
the visitors in the refugee camp and what must be done about this case.
The utterances of the poster below are directive acts because those contain the writer’s wish to be done by the
interlocutors or the readers of the poster. The purpose of the utterances states that it is permitted to the visitors to
stay or visit maximally for three days and supposed to tell the authorized party one week before. In this case the
party is a social organization given an assignment to handle the refugees. The matter is tagged by a lingual
marker Visitors are allowed to stay maximum three days and you need to apply one week before at the social
office. Besides, the utterance Therefore we need copies of the identity cards of the visitors delivered to the
readers of the poster especially the visitors who will visit and stay temporarily in the refugees’ camp is about the
matters that must be done or the requirement that must be submitted to get a residence permit or visit maximally
for three days in the refugees’ camp. Therefore, delivering to do something in the utterances is categorized as a
directive act.
2) Behaviour in the event of fire. Keep calm. Report the fire. Get to safety. Try to extinguish the fire. (Poster 21)
Context: The writer of the poster orders the readers to do some activities delivered in the utterances of
the poster if the fire is happening.
The speech act of the poster above is a directive act because it contains an order about what must be done if the
fire is happening, that is, they keep calm, report the fire, haste to find a safe place, or try to extinguish the fire.
The directive marker of the utterances is tagged by the imperative words Keep, Report, Get to, and Try.
Therefore, the speaker hopes the readers to do activities delivered through the poster if the fire is happening.
Therefore, the command delivered by the speaker or writer shows the characteristic of the directive act.
3) The kitchen should not be used until further notice, due to mold.
(Poster 22) Context: On one of the refugee camp building floors, there is a kitchen that is banned to be used
because it will be sterilized and cleaned.
The speech act of the poster is a directive act because the writer of the poster wants the refugees not to use the
kitchen provisionally due to mold and it will be be sterilized and cleaned. The directive marker in the sentence
above is the imperative words “should not be used”. Besides, there is a lingual negation marker, so the utterance

Rezki Auliya Handarta/Speech Acts on the Posters in Handling Refugees in Freiburg
322
contains a prohibition or a command not to do what the writer prohibits, that is, the refugees are banned to use
the kitchen provisionally. Therefore, it can be concluded that the speech act of the poster is a directive act.
4) The green bin is for: Newspaper, magazines, paper bags, cardboards boxes (cut up). The brown bin is
for: Fruit and vegetables waste, leftover food, flowers, plants. The yellow bin is for: Tins, cans, empty
aerosols, drink cartons, plastic packaging. The black bin is for: Nappies, sweepings, hygiene products,
textiles, rubber and plastic parts, ashes. (Poster 13, data a, b, c, and d)
Context: The writer of the poster informs about what the types of waste that can be inserted or thrown
into the bins that has been separated by colours.
The speech act of the poster above is a directive act because it contains the speaker’s aim to the interlocutors so
that they throws the waste in accordance with the information of the colour classification of the bins based on
the types of waste that can be inserted into the bins. The utterances of the poster are addressed to the readers
especially the refugees in the refugees’ camp so that they apply discipline in sanitation cases. The writer gives
the information of bin colours and types of waste that can be thrown into the bins so that the readers do
something that is delivered and based on the information of the utterances in the poster, that is, they should
throw the waste based on the colours and types of waste which have been attached. Therefore, the utterances of
the poster are categorized as directive acts.
5) Please do not poop in the shower!
(Poster 23)
Context: The writer forbids the refugeesto poopin the shower ofthe refugee camp because it is onlyused
totake a bath.
The speech actinthe sentence of the poster aboveis a directiveact because in this situation, the writer who is the
authority in handling refugeeasksthe refugees not to usethe showerto poop. In the Germany culture, the shower
and toilet to defecating has been separated. Therefore, the prohibition of defecating in the showersalso becomes
a commandto defecate in the toiletthat has been provided. The directive actin the utterance of the posteris
taggedbythe use of the imperative words “Do not”. The wordsrefer toa prohibition to defecate or poop in the
shower. Therefore, the utterance of the posteris a directive act.
6) Obligation to stay in the place of residence: if you live here, you have to sleep here. If you want to be
absent for a longer period of time, please apply to the facility managers.
(Poster 15, data land data m)
Context: The writer of the poster conveys the code of the conduct in staying in the refugees’ camp.
The utterances of the poster aboveare directive acts becausethose containa commandto the interlocutorsto do
something. The speaker wants to the readers or the refugees to obey the rulesrelated totheir residence,that is,if
they are registered ascertaincamp residents, they must stay in the camp. If they want to leave the campthat is
their residence temporarily, they immediately have to reportor ask permission to the facility managers in the
refugees’ camp. Therefore, the utterances above which illustrate the speaker’s willto be doneby the interlocutors
refer tothe directive acts.
7) Come over! Let’s plant and garden together!
(Poster 25, data c and data e)
Context: The writer of the poster invites the refugees to do outdoor activities with gardening in an area
together.
The utterances in the poster are the directive acts because those contain an invitation to do the following
activities: gardening and planting trees together. The imperative words Let’s plant show a directive act. Besides,
the beginning of the discourse is also started by the imperative utterance Come over! It can be concluded that the
writer invites the readers of the poster to do some activities. The activities are planting trees and gardening
together. Therefore, the utterances in the poster are directive acts.
8) Visitors have to register with CDS Security!
(Poster 26)
Proceeding of the 3rd International Conference on Education, Vol. 3, 2017, pp.315-327
323
Context: In front of the gates of the refugee camp, there is a poster addressed to visitors, families,
friends, and the refugees' relation who occupy the refugees’ camp to report themselves in order to get
admission into the refugees’ camp.
The utterance of the poster is a directive act because it is addressed to the visitors or the refugees’ relation who
want to enter the refugees’ camp to report to the camp security so that they are given admission and registered
as visitors. The authority in handling refugees will give ID Card especially if the visitors area permitted to enter
with some requirements. The lingual marker showing that the utterance of the poster is a directive act is in the
words have to. The lingual marker refers to the writer’s will to the readers of the poster to do something obliged.
In this case, the utterance is addressed to the visitors who will enter into the refugees’ camp either non refugees,
refugees’ relation in the camp, or the refugees who are not registered to stay in the camp. Therefore, the
utterance in the poster is a directive act.
9) Please don’t litter! Trash is only to be thrown in the trash can. Bulk trash as e.g furniture should be
thrown in the big barrels! Shopping carts must not be brought onto the compound, they belong to the
supermarket.
(Poster 15, data h, i, j, and k) Context: The writer of the poster conveys the code of the conduct about the waste in the refugees’
camp.
The utterances of the poster above are the directive acts because those contain a command not to do something
or a prohibition, that is, the readers is forbidden to throw the rubbish carelessly or litter the environment. The
prohibition is shown by a lingual marker Please don’t litter! And also the command to do something is shown
by a lingual marker Bulk trash as e.g furniture should be thrown in the big barrels! It is the objectification of the
writer’s will so that the readers or the refugees do what is delivered through the utterances. Therefore, the
purpose addressed to the readers through the poster above shows the characteristic of the directive act.
c) Phatic Act
Kreidler (1998) in his book Introducing English Semantics states that a phatic is the speech act having a purpose
to create a relationship between the speaker and dan the interlocutor. According to Wijaya (2010), a phatic act is
a speech act which is used by the speaker to make a contact with other people and has the essential meaning to
hold or establish a relationship between the speaker and the interlocutor. Below here are examples of the phatic
acts found in this study and their explanations as follow:
10) We warmly welcome you here at the Bissierstraβe, no matter which color of skin, culture, nationality,
religion or gender you have!
(Poster 28) Context: The writer of the poster expresses his view on the refugees and posts it on the bulletin board in
the refugee camp.
The utterance of the poster above is included in the phatic act because it contains an attitude statement toward
the refugees who are being or will live in the Bissierstraβe refugee camp. The statement has a purpose to create
a good relationship between the writer or speaker, who are the actors in handling refugees, with the readers or
interlocutors, who are the refugees. It also has a purpose to create a good relationship among the fellow readers
or interlocutors. Therefore, it can be concluded that the writer of the poster expresses the utterance by using the
phatic act.
11) We are looking forward to all who come. (Poster 19, data j)
Context: The writer of the poster closes a discourse in the poster with the utterance that inspires and
tries to attract the reader's sympathy in order to participate in the event which will be followed by the
writer or the authority in handling refugees.
The utterance of the poster above is categorized as a phatic act because it includes delivering an attitude and
created relationships to the readers who will participate in the activity held by the writer. This case has a

Rezki Auliya Handarta/Speech Acts on the Posters in Handling Refugees in Freiburg
324
purpose to create a good relationship between the writer of the poster and the readers. Therefore, the utterance
shows the characteristic of the phatic act.
12) We are looking forward to spending time with you!
(Poster 25, data d)
Context: The writer of the poster conveys the utterance that describes the evocative elements and
emotional closeness of the activity that will be done. The activity is gardening with people from different cultural backgrounds and different countries.
The utterance above is a phatic act because it is expressed to create a relationship and appeal the sensation of the
emotional closeness to the readers. This case can represent the situation happened if the readers participate in
this gardening activity held by the writer of the poster. Therefore, it can be concluded that the utterance above is
delivered to create a relationship between the speaker and the interlocutor. The elements creating the
relationship show the characteristic of the phatic act.
Forms Of Speech Acts On The Posters In Handling Refugees In Freiburg
The forms of speech acts on the posters in handling refugees in Freiburg are explained using mood of sentences.
The following forms of speech acts on the posters in handling refugees are described below.
a) Positive Declarative Sentence
According to Wijana (2009), declarative sentence is a sentence that is conventionally used to inform about
something. Forms of declarative sentences on posters in handling refugees in Freiburg contain more information
or announcements addressed to the refugees because it has become the main task of the poster's writer in this
case the authority of handling refugees in guiding and providing services to the refugees as the commitment of
Germany in general which has declared its openness to refugees. Kridalaksana (1993) explains that declarative
sentences are generally to state or tell something. In written form, it is marked with (.) or nothing on the end of a
sentence. Below are examples of speech acts on the posters in handling refugees in Freiburg shaped declarative
sentences and an explanation.
1) Counselling for pregnant women and mothers with children up to three years.
(Poster 5)
Context: Writer of the poster informs about counseling services for pregnant women and mothers with
children under three years.
Assertive speech act above has a declarative tone so that the intonation or sentence written form is positive
declarative sentence because it contains no negation marker in it. Assertive speech act which is formed is
positive declarative sentence. It has informative aspect regarding the counseling services given to women who
are pregnant and mothers who have children under three years in the camp of refugees. It is also informed that
those who are not included or mentioned in the poster cannot get counseling.
2) DRK-Sosialdienst closed from 12.30 till 13.30.
(Poster 11)
Context: Writer of the poster conveys information regarding office hours rest or services of the
organization which has the authority in handling refugees.
Assertive speech act on the poster above has the form of a positive declarative sentence because it contains no
negation marker. The declarative sentence contains facts about break time of the social organization that has a
duty in handling refugees. Besides, this poster also gives an informative description that the time on the poster
from 12:30 till 13:30, the authority of the handling refugees is closed or not operating.
b) Negative Declarative Sentence
Proceeding of the 3rd International Conference on Education, Vol. 3, 2017, pp.315-327
325
Here are examples of negative declarative sentences marked by the negation lingual marker or negation element
in it.
3) When you knock and I don’t react, this simply means I am busy. Secondly, I don’t give people houses
or apartments, I am not the right person to talk to.
(Poster 8, data c dan e)
Context: Writer of the poster tells the readers especially refugees about the status of the writer in the camp of refugees.
Assertive speech acts above which are formed are declarative sentences. Declarative sentences which are
formed are negative declarative sentences because they contain elements of negation in them. The negation
markers are marked with a marker lingual don’t on the data c and e and am not in the data e. The utterances
above contain information, beliefs, and explanation of the writer on the status of work in the camp of refugees.
The utterances on the poster above are aimed to the readers that the refugees who stay in the camp of refugees
where the writer works. Informative utterances above show the writer intends to convey something that
previously most of the readers in this case the refugees do not know.
4) We cannot tolerate violance in any room.
(Poster 15, data d)
Context: The authority in handling refugees wrote a poster and put it in the camp of refugees as rules
and information that should be known, shared and remembered.
Assertive speech act above is formed as negative declarative sentence because there is a negation element in it.
Lingual marker cannot is a form consisting of modal can and negation not. The utterance contains affirmation of
the writer towards human rights violations especially in the form of violence.
c) Positive Imperative Sentence
According to Wijana (2009), the imperative sentence is the sentence which is used to express a command,
invitation, request, or ordering. Kridalaksana (1993) explains that sentennce which has imperative intonation in
general is a sentence that contains the meaning of command or prohibition, in written form marked with (.) Or
(!). On the posters in handling refugees in Freiburg, imperative sentences nearly all are used and addressed to
the refugees because the authority are guiding refugees how to live and move well in the camp of refugees and
in the neighborhood especially in Freiburg. Below are examples of speech acts on posters in handling refugees
in Freiburg which are formed as positive imperative sentences because there is no negation marker in them.
5) Join us at the Refugee Women’s Cafe and let us make plans together.
(Poster 20)
Context: The authority in handling refugees made activitiy in the field of art specifically for the women refugees.
Directive speech act on the poster above has intonation as imperative that the sentence is positive imperative
sentence. Positive imperative intonation is marked by the absence of negation lingual marker and there are
command words in it such as Join us and let us. The imperative sentence above is aimed to invite the refugees
especially women to participate in activity related to the arts and a meeting to plan and discuss the activities or
works to be made regarding with arts.
6) Smoking is prohibited in all rooms!
(Poster 27, data a)
Context: Writer of poster writes a ban on smoking in all indoor refugees’ camp as a discipline rule
which must be obeyed.
Directive speech act on the poster above has the imperative intonation. Sentence which is formed is positive
imperative sentence because it does not contain element of negation. Marker lingual is prohibited, which means
"forbidden" in the poster sentence refers to the desire of the writer to the readers of the poster for not doing
smoking in all rooms in the refugees’ camp without exception.
d) Negative Imperative Sentence

Rezki Auliya Handarta/Speech Acts on the Posters in Handling Refugees in Freiburg
326
Below are examples of speech acts on the posters in handling refugees in Freiburg which have the forms of
negative imperative sentences.
7) Please do not disturb anyone’s sleep.
(Poster 15, data g)
Context: The writer of poster tells the readers of poster to pay attention about the rule regarding hours
or time of sleep and a ban on making a nuisance on the rest time in refugees’ camp. Directive speech act on the poster above has a form of negative imperative sentence. Imperative intonation and
lingual marker do not disturb is a marker of negative imperative sentence on the poster because there is a
negative marker in it to show the utterance as a ban. Negative imperative sentence is formed containing the
intent to prohibit the camp’s residents to not create a disturbance at the rest time that has been set. The poster is
also intended to make the refugees using the effective time specified in the utterance to take a rest and not use it
for other things that can interfere with the comfort and good environment for residents themselves, other
residents, as well as the refugees’ camp itself.
8) The kitchen should not be used until further notice, due to mold.
(Poster 22)
Context: In one of refugees’ camp especially in one building floor there is a kitchen that is banned to be used because it would be sterilized and cleaned.
Directive speech act above has imperative tone marked with the word should with negation not. Therefore, the
form is negative imperative sentence. The sentence indicates a prohibition. Writer in the poster wants the
refugees to not use the kitchen for a while due to mold and to be cleaned or sterilized.
e) Positive Introgative Sentence
Wijana (2009) revealed that introgatif sentence is a sentence that is used to ask something. Introgative sentence
in written form marked with (?) (Kridalaksana, 1993). On posters in handling refugees in Freiburg, introgative
sentences which are formed do not really ask something and expect answers from readers but bring the readers
to the conclusion, belief, or the fact that the speaker or writer wants to be informed through the posters. The
following examples introgative sentences on the posters in handling refugees in Freiburg and its description:
9) Looking for work?
(Poster 4)
Context: The actor in handling refugees tells about job vacancy that can be proposed or is required by
refugees.
Assertive speech act above has a form of introgative sentence. Sentence which is formed above is positive
introgative sentence because it does not have negation marker in it. The utterance above can be answered with
yes / no. However, the intention of the question is not merely asking if the readers in this case refugees looking
for job because the writer's purpose in this case the actor in handling refugees in Freiburg provides information
on job vacancy that can be proposed by refugees while being refugees in Freiburg, Germany.
10) Do you know someone who would like to learn write and read in Germany?
(Poster 3, data a)
Context: Writer of poster conveys information about the Germany language course which can be
followed by the refugees.
Directive speech act on the poster above has the form of introgative sentence. Introgative sentence which is
formed is positive introgative sentence because it does not have negation marker in it. The utterance ask
question about people who want or need to learn Germany languange. Positive introgative sentence on the
poster above is actually intended to invite the readers of poster which is marked by the next sentence (On
Thursday 10-12 am Karilina Kurkowska (Karo) is at Bissierstraβe 9 for all questions concerning German
classes, poster 3 data b) containing invitatin to join and learn Germany language that can be followed by the
refugees to write and read in Germany language.
Conclusion
Proceeding of the 3rd International Conference on Education, Vol. 3, 2017, pp.315-327
327
Many of the refugees are still not able to adapt to Germany’s culture. Moreover, they do not quickly blend and
cover themselves with the surrounding community association especially with the Germany people in Freiburg.
It happens because:1) they still want to return to their country,2) deep trauma after a long journey and a trip
which was not only exhausting but also full of bad experiences.3) they still hold strong traditions or religious
belief especially in women who maintain a distance in interaction.In facing the barriers in communcation with
the refugees, the actors in social institutions do: a)the use of translators, b) the use of Google translate, c)the use
of refugees’ children.
In handling refugees, the actors in social organizations also use the written media in communicating with
refugees that is poster. The use it for something important and to guide the way the refugees live or do activities
such as using a kitchen, bathroom, or other public facilities without telling them repeatedly and made them
always see it and run disciplines. The posters contain much more in the types of speech acts namely assertive,
directive, and phatic. The forms of speech acts which are formed in the posters in handling refugees in Freiburg
arepositive declarative sentences, negative declarative sentences, positive imperative sentences, negative
imperative sentences, and positive introgative sentences.
References:
Chaer, Abdul and Leonie Agustina, 1995, Sosiolinguistik: Perkenalan Awal (Jakarta: Rineka Cipta).
Coumming, Louise, 1999,Pragmatics, A Mutidiciplinary Perspective(New York: Oxford UniversityPress).
Djajasudarma, T. Fatimah, 1993,Metode Linguistik: Ancangan Metode Penelitian dan Kajian. (Bandung: PT
Eresco).
Jati Kesuma, Tri Mastoyo, 2007,Pengantar (Metode) penelitian Bahasa(Yogyakarta: Carasvatibooks).
Kreidler, Charles W, 1998, Intrducing English Semantics, (New York: Routledge).
Lambut, Fransiscus K, 2014,Tindak Tutur Ilokusi dalam Papan Peringatan pada Sarana Publik di Kota
Melbourne (Yogyakarta: UGM).
Leech, Geoffrey, 1982,The Principles of Pragmatics, Translated. Oka, M.D.D. and Setyadi Setyapranata,
1993,Prinsip-Prinsip Pragmatik (Jakarta: Universitas Indonesia Press).
Mulyana, 2005,Kajian Wacana (Yogyakarta: Tiara Wacana).
Nababan, P.W.J, 1987,Ilmu Pragmatik: Teori dan Penerapannya(Jakarta: Dikti).
Nadar, F.X, 2009,Pragmatik dan Penelitian Pragmatik(Yogyakarta: Graha Ilmu).
Rani, Abdul, 2004,Analisis Wacana: Sebuah Kajian Bahasa dalam Pemakaian(Malang: Bayumedia Publishing).
Rohmadi. Muhammad, 2004,Pragmatik: Teori dan Analisis(Yogyakarta: Lingkar Media).
Rustono, 1999,Pokok-Pokok Pragmatik(Semarang: Ikip Semarang Press).
Searle, J.R, 1969, Speech acts: An Essay in the Philosophy of Language(Cambridge: Cambridge University
Press).
Sudaryanto, 1993, Metode dan Aneka Teknik Analisis Bahasa(Yogyakarta: Duta Wacana University Press).
Sumarsono, 2009,Sosiolinguistik(Yogyakarta. Pustaka Pelajar)
Tarigan, Henry Guntur, 1986, Pengajaran Pragmatik(Bandung: Angkasa).
Wijana, I Dewa Putu, 1996,Dasar-dasar Pragmatik(Yogyakarta: Andi Offset).
Yule, George, 1996,Pragmatics, New York: Oxford University Press, Translated. Indah Fajar Wahyuni,
2006,Pragmatik(Yogyakarta: Pustaka Pelajar).

Proceeding of the 3rd International Conference on Education, Vol. 3, 2017, pp. 328-341 Copyright © 2017 TIIKM ISSN 2424 - 6700 online DOI: https://doi.org/10.17501/icedu.2017.3133
3rd International Conference on Education, 20-22 April 2017, Kuala Lumpur, Malaysia
MOTHER TONGUE-BASED MATHEMATICS ILOKO
LANGUAGE COMPETENCE OF GRADE I PUPILS IN
BAUANG DISTRICT, DIVISION OF LA UNION
Eloisa A. Rivera Department of Education, Philippines
Abstract: The study aimed to determine the Mother Tongue-Based Mathematics Iloko Language Competence of Grade I pupils of Bauang District, Division of La Union, which will serve as basis in developing a Mother Tongue-Based Mathematics Skillbook for Grade I. It identified the profile of the respondents along Socio-Economic Status, Ethnic Background, and Dominant Language Used as well as the level of competence in Mother Tongue-Based Mathematics of the Grade I pupils along
Conceptual Skills, Analytical Skills, Computational Skills and Problem Solving Skills. It also determined the significant relationship between the respondents’ profile variables and their Mother Tongue-Based Mathematics Competence as well as the strengths and weaknesses in Mother Tongue-Based Mathematics. The descriptive method of research was used in this study, and documentary analysis was utilized in gathering the needed data for the profile of the respondents. The study determined the level of competence of the respondents with a validated and reliable competence test which was constructed by the researcher. The results of the competence test were used as basis in the development of a Mother Tongue-Based Mathematics Skillbook. Based on the data gathered, the following were the salient findings of the study. A great majority of the respondents were Ilokanos
who are of low socio-economic status. The pupils have High Competence in Conceptual and Analytical Skills and Moderate Competence in Computational and Problem Solving Skills. There existed a significant relationship between the respondents’ ethnic background and their level of competence, as well as dominant language and their level of competence but there is no significant relationship between the respondents’ socio-economic status and their level of competence in Mother Tongue-Based Mathematics. Conceptual Skills and Analytical Skills were discovered as the respondents’ strengths while Computational skills and Problem Solving skills were discovered as their weaknesses. A validated skillbook was developed to address the identified weaknesses of the
respondents.
Keywords: Analytical skills, Computational Skills, Conceptual Skills, Problem Solving Skills, Mother Tongue, Mother Tongue-Based Mathematics
Introduction
The 21st century has been swamped with changes and challenges brought about by modern science and
technology. Every aspect of human life has been through radical adjustments, and the international community has
to adapt to these multitude of innovative technical and scientific undertakings.
To be abreast with these changes, and to be one with the modern world requires quality education which has
become the modern man’s primordial concern. Educators and school administrators have been geared to effect and sustain an efficient and effective paradigm shift to address the transformations in these contemporary times
(Cristobal, 2014).
Quality education springs from quality instruction, and since Mathematics is an essential subject in any
educational system, this subject must also be taught with competence and learned from excellent instruction.
Mathematics has a major role not only in the advancement and innovations in science and technology. It too
provides a solid foundation to the many aspects of man’s daily activities, and it sheds light on the comprehension
of complexities inherent in apparently quite simple situations (mathforum.org). Even in the simplest of man’s
undertakings, Mathematics is necessary so that everyone needs sufficient competence in the fundamental
operations, as well as thorough understanding of its basic concepts. One needs the ability to compute numbers in
any form and apply this in seeking solutions to any problem that may arise. As such, principles and standards for
school Mathematics emphasize that students learn important Mathematical concepts or processes with understanding.
However, according to the Third International Mathematics and Science Study (TIMMS) which was carried out to
students in the final year of secondary school undertaken in 2008, the Philippines had an average scale score of
355 in Advanced Mathematics courses. This was the lowest average achievement among the countries who
Corresponding Author: Eloisa A. Rivera/ [email protected]

Eloisa A. Rivera/Mother Tongue-Based Mathematics Iloko Language Competence of Grade I Pupils in Bauang
District, Division of La Union
329
participated in the study. This is a proof of the claim of many about the worsening levels of Mathematics and
Science competency of Filipino students in international assessment tests. This they say, can be attributed to
problems in the country’s basic education sector which critics have described as being in an alarming state.
The aforementioned scenarios attest that the Philippine educational system has been hounded by a host of challenges posed by low-level achievements of learners particularly in the field of Science and Mathematics. One
reason is that many children in the Philippines study Mathematics in a language they do not understand. Rinon
(2015) said that the mother tongue of most Filipino children in the Philippines is neither Filipino nor English.
Using these languages may not help the child carry out basic functions in his own contextual milieu. In class,
listening to the strange sound and accent may at first enchant the child, but as the lessons become cognitively
demanding he begins to feel disillusioned. The language barrier consequently stores up episodes of
communication breakdowns between the teacher and the child as well as between the child and the unknown
concept. Daunted by the feeling of not being able to communicate well in the foreign language, the child
eventually drops out of school. Many children today leave school too early because the language of instruction has
failed to facilitate their learning.
The K-12 Mathematics Curriculum has been crafted to provide the necessary solid foundation in Mathematics. But to further improve the dismal state of learning the subject in basic education, DEPED Order no. 31, s. 2009 has
been implemented. This mandates the use of the Mother Tongue as a medium of instruction from Kindergarten to
Grade III and is also taught as a subject. This DEPED Order is the Mother Tongue-Based Multilingual Education
(MTBMLE) Program which has been carried out in 2012-2013. This program has been anchored from researches
worldwide, which found out that top performing countries in International Mathematics and Science studies are
those that always make reference to the language they already know and that in international Mathematics
competitions, the high performing countries are those that allow their students to use their home language
(http://conferences.cluteonline.com).
In Nolasco’s Multilingual Education Primer (2011), it was also cited that young learners start from where they are
and from what they already know. This could mean that the mother tongue is the primary tool in learning how to read and write as well as in learning about other subjects such as Mathematics, Science and Health, and Social
Studies.
With the adoption of the MTBMLE Program in the Philippine Educational System, the stakeholders pin their
hopes for an improvement in the quality of teaching and learning. But then, due to the novelty of the program, and
the alacrity of its implementation, the dearth of instructional resources, references, books and materials for the use
of teachers as well as learners especially in Mother Tongue Based Mathematics is a real problem the basic
education teacher is beset with.
This is true, especially in Bauang District. As observed, the learners’ materials used by the teachers and pupils are
not enough to provide effective teaching-learning situation for the acquisition of basic skills in Mother Tongue-
Based Mathematics. In fact, the learners’ material provided by the DEPED in Mathematics for Grade I, Quarters 1 and 2 are written in English. This is the reason why teachers were having a hard time to supplement their lesson.
The lack of additional references, learners’ material and supplementary materials is one of the manifestations of
difficulties in teaching Mother Tongue-Based Mathematics.
Considering the low performance in Mathematics and the shortage of references, learners’ material and
supplementary materials for Grade I pupils, the researcher has crafted a skillbook which can serve as a ready
reference for the Grade I teacher, and as an authentic workbook for the learner.
Theoretical Framework
The Mother Tongue-Based Multilingual Education Program strongly argues that learners learn best when they are taught in a language that they understand. It is for this reason that teachers in the primary schools are now
mandated to teach in the mother tongue, so that the objective to provide quality education can be achieved.
Relative to the notion on the native language as a means to facilitate learning, the Nativist theory (Shaffer, 2002)
endorsed by Chomsky explains that humans are biologically programmed to gain knowledge. This theory posits
that the human brain has an innate device, the LAD (Language Acquisition Device) which enables children to
acquire a language at their earliest years from their homes and from the people they have grown with. This says
that when the child goes to school for the first time, he already has a language to use when he communicates with
his teachers and classmates. This language is his mother tongue, and this is the language which his teacher must
utilize when he teaches inside the classroom, and even when he communicates with him beyond school time. This

Proceeding of the 3rd International Conference on Education, Vol. 3, 2017, pp. 328-341
330
language will not only make him learn the lessons better, but will also make him feel welcome in the new
environment, the affective factor which bears a positive influence to education in early childhood.
However, the Social Interactionist theory by Vygotsky stresses the environment as the most crucial influence in
learning .This theory claims that the ―significant others‖ in the learner’s life have the biggest role to play when
learners learn. This then points at the teacher as a crucial influence since he is the person who the learner associates with most of the time especially in the elementary grades. The teacher has to possess mastery of the
subject matter, aside from his pedagogical expertise. This theory is substantiated by Skinner with his Behaviorist
theory (Gleason and Ratner, 2009). This theory maintains that learning is enhanced by imitation and
reinforcement. From this theory is the idea that learners learn from what is provided to them by the teachers, which
they imitate and is retained in them through reinforcement. The teacher does not only explain the lesson well, but
also gives the pupils a number of exercises and drills in order for the pupils to achieve mastery and retention of
what has been learned.
The theory on Multiple Intelligences upheld by Gardner reiterates the idea that mathematical or logical intelligence
is one of the eight intelligences that people can have. And similar to the other intelligences which are linguistic,
spatial, bodily-kinesthetic, musical, interpersonal, intrapersonal and naturalist, a certain amount of one’s
knowledge and skill in Mathematics is innate. Yet, the great majority of this ability may come from learning.
Another theory that relates to this study is the Experiential Learning theory asserted by David Kolb (Duka, 2007).
Kolb says that learners learn better and faster if the lessons being taught to them are within the sphere of their own
experiences, enabling them to relate these lessons with what they already know and what they have gone through.
A knowledge of the learner’s experiences can then be the teacher’s springboard when he explains the day’s
lessons. As such, the learners will have a better grasp of what the teacher is trying to elucidate upon them. This
theory is very much related to the Constructivist theory which also argues that knowledge is constructed when the
learner is able to draw ideas from his own experiences and connects them to new ideas encountered. Especially for
lessons in Mathematics, pupils need to construct their own understanding of each mathematical concept, so that
the primary role of teachers is not to lecture but to create situations which are familiar to these pupils that will
foster their enthusiasm to build the necessary mental constructions.
The aforementioned theories explain that Mathematics can be learned by anyone, with the teacher’s expertise of
the subject matter and his appropriate pedagogy. However, teaching can become more effective with the teacher’s
personal knowledge of the pupils’ background and experiences. The teacher’s ability to speak the learner’s
language will bring about better comprehension and understanding, and his awareness of the pupils’ experiences
will enable him to utilize these as springboard for lessons or materials for drills and subsequent activities. As such,
learning becomes interesting and is also attained with meaning.
Conceptual Framework
The Mother Tongue-Based Multilingual Education Program has been implemented with the conviction that it will
upgrade the quality of education in the country. The DEPED has subscribed to the idea that when learners are
taught in a language they know best, they will learn better, improving them not only on their communication skills but more on their cognitive skills. And this, experts say, is true to all the subject areas wherein the learners are
supposed to be enrolled in. Consequently, Mathematics in the preschool is now being taught in the locality’s
language, and thus, it is presumed that the learners would become more competent in Math because they can
understand the lessons quite well as the teacher now conducts the lesson in the language they have used since
birth.
On the other hand, since ethnicity relates to cultural factors such as nationality, culture, ancestry, language and
beliefs, this variable may also influence the learners’ ability to grasp their lessons even in a Mathematics class. If
the teacher talks in a language similar to the learners’ language, making them learn lessons faster and better, then
sharing with them the same culture, ancestry, and beliefs may also make the learners understand lessons easier.
This can be so, because they will be able to relate the lessons with what the learners know and care about, since
the teachers are aware of the learners’ background, their lives, their practices and experiences.
Further, the learners’ socio-economic status can also be a factor to consider with regard to the learners’ aptitude to
learn lessons, in Math, and even in all the subjects, because the financial capacity and the status in society of the
learners’ families can determine their exposure to factors that can enhance the development of their mental
faculties. A financially - capable family can provide additional information from the recent advances in technology
Eloisa A. Rivera/Mother Tongue-Based Mathematics Iloko Language Competence of Grade I Pupils in Bauang
District, Division of La Union
331
and children who are socially-adjusted encounter a variety of experiences which can enhance learning, while those
who are less fortunate may just depend only on the basic information and limited experiences that a school may
bring.
Along with the MTBMLE, the K-12 Mathematics Curriculum has been designed to foster the Mathematics Competence of primary school pupils. This is apportioned into five content areas which are Numbers and
Numbers Sense, Measurement, Geometry, Patterns and Algebra, and Probability and Statistics. The major skills
which these areas deem to exploit and consequently develop in every learner are conceptual, analytical,
computational and problem solving skills. With this set of objectives in mind, teachers are compelled to realize
that the curriculum provides a strong foundation in Mathematics literacy. More importantly, it postulates
necessary concepts and life skills needed by Filipino learners as they proceed to the next stage in their life as
learners and as Filipino citizens (K-12 Curriculum Guide in Mathematics).
Mathematical competence is gained with a thorough understanding of basic Mathematical concepts. But this
would not be enough to further hone the different skills that the subject hinges on. A plenitude of exercises, drills
and activities devised by the Mathematics teacher in accordance with the learners’ needs, capacities and
experiences would help sustain their interest which in the long run would reinforce their knowledge of the
necessary Mathematical concepts and principles. Such would make the learners learn and appreciate the subject, and in an environment of familiarity and fun, the primary school pupils specially, would discover and develop
their ability to conceptualize, analyze, compute and solve Math problems. Without their knowing, they would
have refurbished their Mathematical skills.
Nevertheless, there is a dearth of mother tongue-based Mathematics references and materials that the
Mathematics teacher in the primary grades can use nowadays. Ordoño (2012) says that, to attain quality
education, there must be excellence in education service through the learners’ printed and audiovisual materials.
This thought has paved the way for the researcher to craft a Mother Tongue- Based Mathematics Skillbook for
Grade I.
The research paradigm in Figure 1 explains further the flow of this study which leads to the formulation of the
said skillbook. The Input-Process-Output (IPO) model was used as the researcher’s guide.
The input variables are the profile of the respondents along socio-economic status, ethnic background, and dominant language used as well as the level of competence of Grade I pupils in Mother Tongue-Based
Mathematics along conceptual skills, analytical skills, computational skills and problem solving skills.
The process includes the analysis of the profile of the respondents, the level of competence of Grade II pupils in
Mother Tongue-Based Mathematics, the correlational analysis between the respondents’ profile variables and
Mother-Tongue Based Mathematics Competence. Included in the process as well is the identification of the
students’ strengths and weaknesses of the Grade II Pupils in Mother Tongue-Based Mathematics. These
strengths and weaknesses were the bases for the researcher in the crafting of the Mother Tongue- Based
Mathematics Skillbook for Grade I.
Statement of the Problem
The study aimed to determine the Competence in Mother Tongue-Based Mathematics of Grade I pupils of
Bauang North and Bauang South Districts, Division of La Union, as basis in developing a Mother Tongue-Based Mathematics Sillbook for Grade I.
Specifically it sought to answer the following questions:
1. What is the profile of the respondents along:
a. Socio-economic status;
b. Ethnic background; and
c. Dominant Language used?
2. What is the level of competence in Mother Tongue-Based

Proceeding of the 3rd International Conference on Education, Vol. 3, 2017, pp. 328-341
332
Mathematics of the Grade II pupils along:
a. Conceptual Skills;
b. Analytical Skills;
c. Computational Skills;
d. Problem Solving Skills?
3. Is there a significant relationship between the Respondents’ Profile Variables and their Mother Tongue-Based Mathematics Competence?
4. What are the strengths and weaknesses in Mother Tongue-Based Mathematics of the Grade I pupils in
Bauang North District and Bauang South Districts, Division of La Union?
5. What validated Skillbook in Mother Tongue-Based Mathematics can be proposed to enhance the Mathematics competence of the Grade I Pupils?
Importance of the Study
This research will benefit several groups of people: the curriculum designers, teachers, pupils, stakeholders, the
researcher herself and future researchers.
DEPED La Union, especially the Curriculum designers will gain insight on the crafting of learners’ materials which
will enhance the competence of pupils in Mother Tongue-Based Mathematics;
Grade I Math Teachers will be provided with the skillbook which they can utilize to supplement discussions of lessons
and activities;
Grade I pupils will understand better the concepts and lessons in Mathematics I, hence enhance their mastery of
Mathematical concepts and applications and will improve their competence in Mathematics I, as they are guided by
the Skillbook which has been prepared in consideration of their level and weaknesses;
Stakeholders, especially parents and members of the community will be motivated to guide the learners in their
lessons and other schoolworks because they too can already comprehend such, because these are now given in the
Mother Tongue;
The researcher will be guided by the Skillbook to teach the learners better and make them realize the importance of
Mathematics and the value of the native language;
And future researchers who can engage in a similar type of research will be encouraged to craft a Skillbook in the Mother Tongue, in order to facilitate learning and thereby develop the competence of the learners.
Research Design
The descriptive method of research was used in the study, as it aimed to gather data about existing conditions.
Calmorin (2015) describes descriptive design as the collection of data to test hypothesis or to answer questions
regarding the present status of a certain study. The study also used correlational analysis. Aiken (2002) defines
correlational analysis as the use of statistical correlation to evaluate the strength of the relations between variables.
Sources of Data
The respondents in this study were the Grade I pupils of Bauang North and Bauang South Districts, Division of La
Union for who were enrolled in the 10 schools in Bauang North District and 14 schools in Bauang South District.

Eloisa A. Rivera/Mother Tongue-Based Mathematics Iloko Language Competence of Grade I Pupils in Bauang
District, Division of La Union
333
Stratified sampling was used to determine the sample from the population consisting of 1, 509 pupils. The Slovin’s
formula at 0.5 margin of error was used to determine the sample size.
Instrumentation and Data Collection
Documentary analysis of the DEPED students’ profile was used to gather the respondents’ profile along socio-
economic status, ethnic background and dominant language used
The researcher-made Mathematics competence test based on the Basic Concepts of Grade I Mathematics as culled
from DEPEd standards was also used by the researcher as the main data-gathering tool in the study. The 40-item
test was divided into 5 areas of Grade I Mathematics: -Numbers and Number Sense, Geometry, Patterns and
Algebra, Measurement, Statistics and Probability
Moreover, the test was made in accordance with Bloom’s Taxonomy of Cognitive Skills for Mathematics which
includes Conceptual, Analytical, Computational and Problem Solving Skills (Please see Appendix D).
Tools for Data Analysis
The data which were gathered, collated, and tabulated were subjected to statistical analysis and
interpretation using the appropriate statistical tools.
For problem 1, frequency counts and percentages were used to determine the profile of the respondents along socio-economic status, ethnic background, and dominant language used.
For problem 2, the level of competence of the Grade I pupils in Mother Tongue-Based Mathematics
was analyzed using frequency counts, percentages, and mean percentages. Frequency count was used
to determine how many pupils fall in each item and respective rates were computed. The scores
gathered were given corresponding descriptive equivalent.
For problem 3, the Pearson-Product Moment of Correlation (r) was used to determine the significance
of relationship between respondents’ profile variables and level of Mother Tongue-Based
Mathematics Competence.
For problem 4, the strengths and weaknesses were deduced from the findings, particularly on the
level of competence through statistical ranking. Areas with 61-100 percent were considered strengths;
otherwise, 60 and below were considered weaknesses.
The MS Excel Data Analysis Tool and STATEXT were employed in treating the data.
Ethical Considerations
To observe and uphold ethical standards in the conduct of this research, conditions were strictly
considered by the researcher.
A letter of communication was secured from the DEPED Division of La Union to serve as permission
to the conduct of the study in the identified elementary schools. Likewise, a letter of communication
was presented to the District Supervisors, principals and school heads to serve as permission to gather
data pertinent to the study.
The respondents were not forced nor harmed in securing the needed data for this study and their
names were not mentioned in any part of this research.
Reliability and validity measures of the research instruments were appropriately conducted, and
documentation was properly observed for sourcing and referencing of materials.
Findings:
Profile of the Respondents
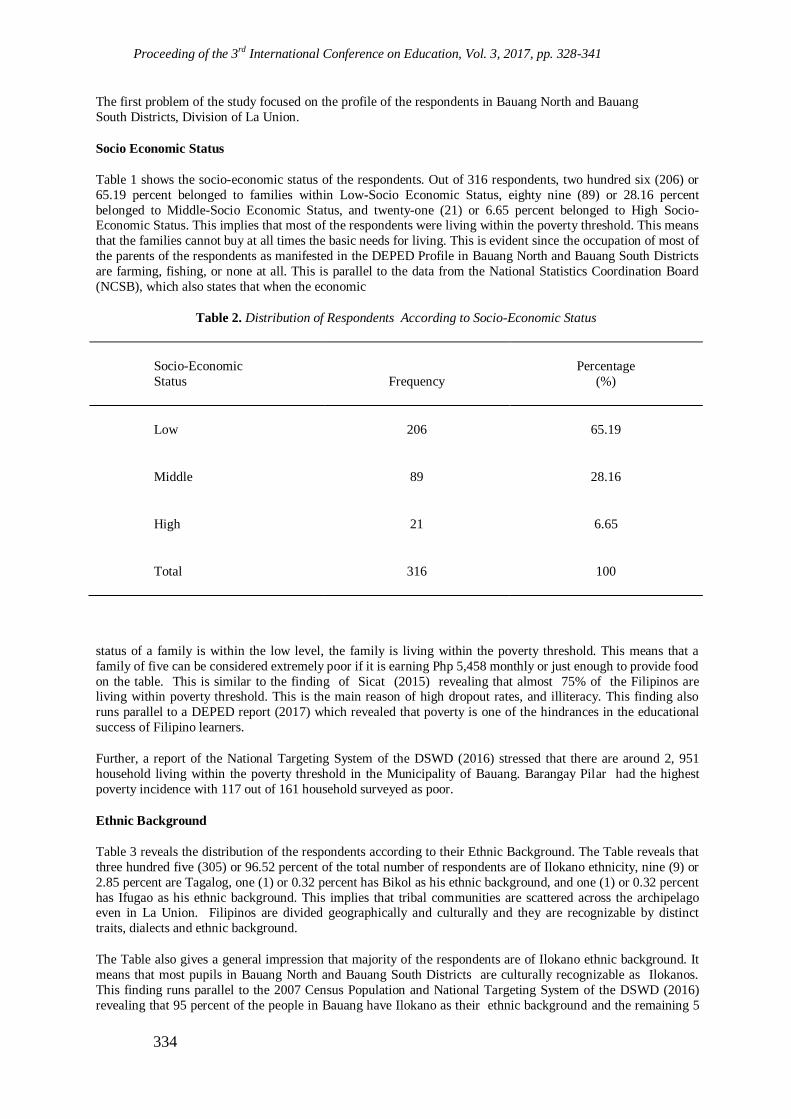
Proceeding of the 3rd International Conference on Education, Vol. 3, 2017, pp. 328-341
334
The first problem of the study focused on the profile of the respondents in Bauang North and Bauang
South Districts, Division of La Union.
Socio Economic Status
Table 1 shows the socio-economic status of the respondents. Out of 316 respondents, two hundred six (206) or
65.19 percent belonged to families within Low-Socio Economic Status, eighty nine (89) or 28.16 percent
belonged to Middle-Socio Economic Status, and twenty-one (21) or 6.65 percent belonged to High Socio-Economic Status. This implies that most of the respondents were living within the poverty threshold. This means
that the families cannot buy at all times the basic needs for living. This is evident since the occupation of most of
the parents of the respondents as manifested in the DEPED Profile in Bauang North and Bauang South Districts
are farming, fishing, or none at all. This is parallel to the data from the National Statistics Coordination Board
(NCSB), which also states that when the economic
Table 2. Distribution of Respondents According to Socio-Economic Status
Socio-Economic
Status
Frequency
Percentage
(%)
Low 206 65.19
Middle 89 28.16
High 21 6.65
Total 316 100
status of a family is within the low level, the family is living within the poverty threshold. This means that a
family of five can be considered extremely poor if it is earning Php 5,458 monthly or just enough to provide food
on the table. This is similar to the finding of Sicat (2015) revealing that almost 75% of the Filipinos are living within poverty threshold. This is the main reason of high dropout rates, and illiteracy. This finding also
runs parallel to a DEPED report (2017) which revealed that poverty is one of the hindrances in the educational
success of Filipino learners.
Further, a report of the National Targeting System of the DSWD (2016) stressed that there are around 2, 951
household living within the poverty threshold in the Municipality of Bauang. Barangay Pilar had the highest
poverty incidence with 117 out of 161 household surveyed as poor.
Ethnic Background
Table 3 reveals the distribution of the respondents according to their Ethnic Background. The Table reveals that
three hundred five (305) or 96.52 percent of the total number of respondents are of Ilokano ethnicity, nine (9) or
2.85 percent are Tagalog, one (1) or 0.32 percent has Bikol as his ethnic background, and one (1) or 0.32 percent
has Ifugao as his ethnic background. This implies that tribal communities are scattered across the archipelago even in La Union. Filipinos are divided geographically and culturally and they are recognizable by distinct
traits, dialects and ethnic background.
The Table also gives a general impression that majority of the respondents are of Ilokano ethnic background. It
means that most pupils in Bauang North and Bauang South Districts are culturally recognizable as Ilokanos.
This finding runs parallel to the 2007 Census Population and National Targeting System of the DSWD (2016)
revealing that 95 percent of the people in Bauang have Ilokano as their ethnic background and the remaining 5

Eloisa A. Rivera/Mother Tongue-Based Mathematics Iloko Language Competence of Grade I Pupils in Bauang
District, Division of La Union
335
percent are of different ethnicity such as Bikol, Bisaya, Cuyunon, Hiligaynon, Kapampangan, Maranao,
Maguindanao, Pangasinan, Tausug, Tagalog, Waray, Ifugao and others.
Table 3.Distribution of Respondents According to Ethnic Background
Ethnic Background Frequency Percentage
(%)
Bikol 1 0.32
Ilocano 305 96.52
Tagalog 9 2.85
Ifugao 1 0.32
Total 316 100
Dominant Language Used
Table 4 presents the distribution of the respondents according to Dominant Language Used. Out of 316
respondents, two hundred ninety-six (296) or 93.67 percent used Iloko as their dominant language while the
remaining twenty (20) or 6.33 percent used Tagalog as their dominant language. This is understandable since
majority of them have Ilokano ethnic background. This implies that the pupils used Iloko as their dominant language.
The finding is in support to the 2015 Census of Population which discloses that the Municipality of Bauang
has a population of 69, 837 and the dialect spoken by majority of the people is Ilokano, although there are other
minor dialects such as Tagalog and Pangasinense used by the residents. English is also understood by many but
is not widely spoken.
Table 4.Distribution of Respondents According to Dominant Language
Dominant
Language
Frequency Percentage
(%)
Iloko 296 93.67
Tagalog 20 6.33
316 100
Level of Competence of the Respondents in Mother Tongue-Based Mathematics
The succeeding tables present the level of Mother Tongue-Based competence of the respondents in Bauang North and Bauang South Districts, Division of La Union along conceptual skills, analytical skills, computational
skills, and problem-solving skills.
Conceptual Skills
Generally,the level of Mother Tongue-Based Mathematics Competence of the pupils along conceptual skills has
a grand mean of 71.52 percent of correct answers which means that they have High Competence in conceptual
skills. This means that the respondents have mastered the concepts, definitions, terms, descriptions and other
facts in

Proceeding of the 3rd International Conference on Education, Vol. 3, 2017, pp. 328-341
336
Mathematics. The finding is consistent with the K-12 Curriculum Guide in Mathematics, which holds that
concepts are mastered first since these start the acquisition of learning. Rosete (2006) also stressed that
conceptual skills are very important because these serve as the foundation of Mathematics skills.
Numbers and Numbers Sense ranks the highest with 76.90 percent of correct answers. This means that the pupils
have mastered the basic mathematical terms, definitions and concepts
Table 5. Level of Competence of the Respondents along Conceptual Skills
Content Areas Percentage (%) Descriptive
Equivalent
Rank
1. Numbers and
Number Sense
76.90 High 1
2. Geometry 73.42 High 2
3. Patterns and
Algebra
67.41 High 5
4. Measurement 70.57 High 3
5. Statistics and
Probability
68.99 High 4
Mean 71.52 High
of whole numbers. They are familiar with mathematical terms, definitions and descriptions necessary in learning
number facts. This finding is similar to the findings of various researches such as that of Villareal (2009) which
revealed that the Grade V pupils in San Fernando District II have High Competence in whole numbers. Ducusin
(2011) also found out that the pupils have initially mastered the basic concepts on whole numbers and the pupils
are highly capable of reading and writing whole numbers, determining place value and rounding off numbers.
Similarly, Sagun (2001) also revealed that Grade V pupils had mastery and competence on the basic concepts of
whole numbers. The National Council of Mathematics (2008) also reported that almost all students demonstrate
mastery of basic number facts.
On the other hand, the finding is in contrast to that of Novida (2005), revealing that Grade III pupils of Candon
City Division have not mastered the very basic concepts on whole numbers including the concepts of the four
fundamental operations. The finding is also in contrast to that of Manzano (2004), revealing that the students performed low in Mathematics, especially in mastering concepts of whole numbers. Similarly, the study of Rizalde
(2012) revealed that the students have poor performance in basic concepts of real numbers, ratio and proportion,
and recognizing and naming fractions. Culaste (2011) also stressed that the Mathematics competence of the pupils
are below average level in terms of numerical comprehension, number sense estimation and procedural
calculation.
The Table also shows that Patterns and Algebra ranks the lowest among the conceptual skills with 67.41 percent of
correct answers. This implies that the pupils are having difficulty in mastering concepts along patterns and algebra
since it requires actual application of basic number patterns and figures. This is similar to the study of Rodriguez
(2010) revealing that students performed weak in Algebra especially in linear patterns.
Analytical Skills
Table 6 shows the level of competence of the respondents along analytical skills.
Generally, the pupils have High Competence in analytical skills with a mean of 64.87 percent of correct answers.
This implies that the pupils are good in comprehension and analysis of mathematical
Table 6.Level of Competence of the respondents along Analytical Skills

Eloisa A. Rivera/Mother Tongue-Based Mathematics Iloko Language Competence of Grade I Pupils in Bauang
District, Division of La Union
337
Content Areas Percentage
(%)
Descriptive
Equivalent
Rank
1. Numbers and Number
Sense
65.82 High 2.5
2. Geometry 66.14 High 1
3. Patterns and
Algebra
63.29 High 4.5
4.
Measurement
65.82 High 2.5
5. Statistics
and
Probability
63.29 High 4.5
Mean 64.87 High
equations and problems. This could be attributed to the adaptation of the word problems to the local context.
Geometry, the subject which requires more analysis and probing, ranks the highest with 66.14 percent of correct
answers along analytical skills. This implies that the pupils received more exposure on reasoning and on analyzing
figures in Geometry. This is true since Geometry focuses much on analyzing shapes and illustrations of different
figures. This finding negates the finding of Carreon (2009), that the Grade V pupils were moderately competent in
geometry. Sagun (2001) also revealed that Grade V pupils in the private schools in San Fernando La Union, were
competent in Geometry. Similarly, Novida (2005) also revealed that Grade III pupils show near mastery in spatial
figures.
However, the finding negates that of four researches along the same field. Ducusin (2011), found out that Grade V pupils still lack the basic analytical skills to illustrate geometric figures. Ducusin’s finding is similar to the study
of Villareal (2009) which revealed that the respondents have fairly adequate skills in working with spatial figures.
Similarly, the finding of Rodriguez (2010) revealed that her respondents have difficulty in illustrating figures. And
Carreon (2009) also revealed that the students are weak in application and analysis in factoring, decimals and
Geometry.
Although described as high competence, Patterns and Algebra and Statistics and Probability rank the lowest
among analytical skills which both marked 63.29 percent of correct answers. This is similar to the study of
Carreon (2009), revealing that the pupils have moderate competence in statistics and graphs but they experience
difficulty in interpreting it. Similarly Millares (2001) also found out that the pupils are moderately competent in
patterns because more exercises, drills and exposure have been provided for the pupils. However, they are weak in
interpreting graphs. The finding of Novida (2005) also revealed that interpreting graphs is the error commonly committed by the pupils hence considered to be the least mastered competency.
In contrary to the present finding, Ducusin (2011) found out that graphs and number patterns are the areas which
rank the highest. This means that the pupils are very good in reading and interpreting graphs and analyzing
number patterns. Sagun (2001) also revealed that the pupils were excellent in constructing and interpreting graphs.
Computational Skills
Table 7 shows the competence of the respondents along computational skills.
Generally, the level of Mother Tongue Based Mathematics Competence of the respondents along computational
skills has a grand mean of 60.13 percent of correct answers. This means that the pupils have Moderate Competence
in terms of their computational skills. This implies that the pupils are capable of performing mathematical
operations. This also means that the pupils are able to solve problems involving Numbers and Number Sense,
Patterns and Algebra, Geometry, Measurement, and Statistics, but they have not fully mastered such competency.
Statistics and Probability ranks the highest with 65.82 percent of correct answers. This means that the pupils understand better the basic computation skills when these are translated in graphs. This is similar to the study of De
Castro (2005), which showed that the Grade V pupils are very good in computation especially in graphs. Ledda

Proceeding of the 3rd International Conference on Education, Vol. 3, 2017, pp. 328-341
338
(2006) also revealed that the pupils are more interested and performed better in statistics and graphs than in the other
areas.
Numbers and Number Sense ranks the lowest with 55.06 percent of correct answers. This means that the pupils
had not fully mastered the computational skills on this area which includes the two basic operations-addition and
subtraction, and fractions. This shows that the
Table 7. Level of Competence of the Respondents along Computational Skills
Content Areas Percentage
(%)
Descriptive
Equivalent
Rank
1. Numbers and
Number Sense
55.06 Moderate 5
2. Geometry 59.81 High 3
3. Patterns and
Algebra
63.29 Moderate 2
4. Measurement 57. 91 Moderate 4
5. Statistics and
Probability
65.82 High 1
Mean 60.13 Moderate
pupils were not fully equipped with basic computational skills needed for the subject. The finding is in line
with the finding of Rivera (2009), when she found out that majority of the pupils manifest high level difficulty
in their computation skills especially on fractions. Similarly, Villareal (2009) also found out that the pupils are
poor in performing operations involving fractions and decimals since they have low mastery in all topics under
rational numbers. Novida (2005) also mentioned that the pupils had inadequate knowledge and skills working
with ratio, fractions and decimals. Rodriquez (2010) likewise revealed that topics on rounding off numbers,
place value and value of numbers and mastery of the basic operations were neglected and not emphasized.
Manzano (2004) also found out that the students performed low in Mathematics particularly in the computation
of the four fundamental operations. This finding runs parallel to the study of Tamayo (2005) revealing that the
pupils are weak in computational skills on the four fundamental operations. Further, Ducusin (2011) revealed that the performance of the Grade V pupils in rational numbers is near mastery which means that the pupils
still have misconceptions on operations of fractions and decimals.
Problem Solving Skills
Table 8 illustrates the level of competence of the respondents along problem solving skills.
Generally, the level of Mother Tongue-Based Mathematics Competence along problem-solving skills has a
grand mean of 46.20 percent of correct answers which means that the respondents have Moderate Competence
in problem solving skills. This means that the pupils are capable of analyzing and solving Mathematics
problems especially that these are adopted to the local context. It can be inferred from the finding that the
respondents in Bauang North and Bauang South Districts can analyze, solve and interpret word problems. This
is rooted from their high competence in analytical skills and moderate competence in computational skills,
since a good foundation of analytical and computational skills are necessary in solving word problems.
Statistics and Probability ranks the highest with 49.68 percent of correct answers. This implies that the pupils are more interested to solve problems in graphs since this area ranks also the highest in computational skills.
This means that a good foundation in computational skills will lead to better competence in problem solving
skills. This is similar
Table 8.Level of Competence of the Respondents along Problem Solving Skills
Content Areas Percentage
(%)
Descriptive
Equivalent
Rank
1.Number and Number
Sense
45.57 Moderate 4
2.Geometry 49.37 Moderate 2
3.Patterns and Algebra 45.89 Moderate 3

Eloisa A. Rivera/Mother Tongue-Based Mathematics Iloko Language Competence of Grade I Pupils in Bauang
District, Division of La Union
339
4.Measurement 40.19 Low 5
5.Statistics and
Probability
49.68 Moderate 1
Mean 46.20 Moderate
to the finding of Carreon (2009) that pupils are very good in problem solving involving tables and graphs.
Similarly, De Castro (2005) also mentioned that the pupils have high competence in interpreting graphs and
solving problems involving graphs.
It is also noticeable that measurement ranks the lowest with 40.19 percent of correct answers. This implies that
most of the pupils find it difficult to solve word problems involving measurement. This can be attributed to the
conversion factors and lack of actual application like actual measuring and manipulating concrete materials.
This is the reason why real understanding of concepts was not attained. This is similar to the finding of Novida
(2005), that measurement is one of the common errors of the Grade III pupils in Candon District. The pupils
find difficulty in problem solving involving perimeter, area and measures of time. Ducusin (2011) also found
out that the pupils show near mastery in measurement. This means that most of the pupils find it difficult to
solve problems in measurement. Likewise, the finding is similar to Villareal’s (2009), that the pupils had great
difficulties in problem solving involving measurement . This is also comparable to the finding of Sagun
(2011) that the pupils had great difficulty in problems involving perimeter, area and volume.
Conceptual Skills received the highest mean percentage among the four (4) skills. This implies that concepts
are learned first since these serve as the foundation of all the other skills. However it is also noticeable that among the four (4) skills, Problem Solving Skills received the lowest mean. This is due to the fact that this
skill requires more rigorous analysis and computation before one can actually come up with an approach to the
problems and eventually to a correct solution. The finding is similar to that of Culaste (2011) that the Grade VI
pupils showed difficulty in applying knowledge and changing preferences in order to solve a problem. Rivera
(2010), also revealed that students have minimum competence in problem solving which is similar to the
finding of Rosete (2006) which found out that most of the respondents did poorly in solving problems. The
National Council of Mathematics (2008) also reported that almost all students encountered difficulty in
mathematical problems. The pupils used inappropriate solution, and committed many computational errors.
Correlation Between Respondents’ Mother-Tongue Based Mathematics Competence and their Profile
Variables
Socio-economic status has negligible significant correlation to conceptual skills, analytical skills, computational
skills and problem solving skills. This means that a pupil who has high socio- economic status does not
automatically have a mastery of basic skills in mathematics. There are pupils who belong to the lower class who
actually perform better than those who belong to the upper class of the society. This is similar to the finding of
Millares (2001) that socio-economic circumstances do not have significant effect on the individual’s choice and
pursuit of a career.
A documentary also from GMA Reporters’ Notebook says that pupils who are deprived of material wealth
persevere a lot in pursuing education. Similarly, Gabriel (2012) also discovered that socio-economic status had a
very small correlation with the Mathematics proficiency of pupils.
The Table also shows that ethnic background has substantial significant correlation to problem solving skills but
not to conceptual, analytical and computational skills. This implies that a learner whose ethnic background is Ilokano has higher competence in Mother Tongue-based Mathematics, especially in problem solving skills. It
implies that when a learner grows in the language he is exposed to, he is able to master it. This is also
understandable since the pupils understand the language of the word problem. This implies further that the focus
of the understanding is on how to solve the problem. This is in contrast when the problem is in English because
the pupils have to focus on understanding both the content and the language. The finding is also in support to the
Mother Tongue-Based Multi-Lingual Education (MTB-MLE) – a part of the K-12 basic education reform
program which provides a strong foundation in Mathematics literacy and creates a smoother path to acquire
basic mathematics skills. The Department of Education (DEPEd) also affirms that using language at home
(MTB-MLE) inside the classroom during the early years of schooling produces better and fast learners.

Proceeding of the 3rd International Conference on Education, Vol. 3, 2017, pp. 328-341
340
Also, it is noticeable that ethnic background has a significant but negligible correlation to conceptual skills.
This means that learners who have Ilokano as their ethnic background do not automatically have higher
competence on conceptual skills. This is so because the understanding of mathematical concepts is not
dependent on ethnicity. There are concepts in Mathematics which cannot be translated in Iloko.
Moreover, ethnic background has also significant but low correlation to computational skills. This implies that
ethnic background has minimum connection to computational skills. This means that ethnic background minimally affects the way pupils compute different number patterns. Since the Language used is Iloko, they are
able to understand in their context.
Dominant language used has substantial significant correlation to analytical and problem solving skills but
not to conceptual and computational skills. This implies that when the dominant language used and the
medium of instruction are the same, significant learning takes place especially in analysis and problem solving.
It is a fact that language used in class affects learning.
This finding is in consonance with what is stipulated in DEPEd order no. 74 s. 2009, that children learn best in
a language that is familiar to them. Although children can learn a language other than their mother tongue, they
learn best—especially in the early years— in an environment in which the language used to teach is also one
they speak in their home, with their parents, their siblings, and friends. This is especially true in environments
where children have little or no exposure to a second or foreign language. Moreover, since the school is a new
social environment to children starting their education, learning in a mother tongue language also helps to ease this transition, providing a bridge from the ―known‖ to the ―unknown.‖
Also, there is a significant but low correlation between dominant language used and conceptual skills and
dominant language used and computational skills. This implies that there is really minimum connection
between dominant language used and conceptual and computational skills. This is similar to the finding in the
correlation between ethnic background and conceptual skills and computational skills. It then implies that
language used minimally affects the understanding and manipulation of mathematical skills and algorithms.
Findings
The following are the salient findings of the study.
1. A great majority of the respondents were Ilokanos who are of low socio economic status.
2. The pupils had High Competence in Conceptual and Analytical Skills and Moderate Competence in
Computational and Problem Solving Skills. 3. There existed a significant relationship between the respondents’ ethnic background and their dominant
language but not with respondents’ socio-economic status to the Level of Competence in Mother Tongue-
Based Mathematics, to their ethnic background, dominant language and socio-economic status.
4. Conceptual Skills and Analytical Skills were the respondents’ strengths while Computational skills and
Problem Solving skills are their weaknesses.
5. A validated Skillbook was developed to address the identified weaknesses of the respondents.
Conclusions
In the light of the above-cited findings, the following conclusions were drawn:
1. The Grade II pupils are Ilokano who come from below average class of families
2. The Grade II pupils are good in Mathematics. 3. The pupils’ ethnic background and dominant language used influence their Mathematical skills.
4. The pupils’ skills in Computation and Problem Solving need enhancement.
5. The validated Skillbook is an instructional material that can be used as reference of teachers, or as a
workbook for the learners.
Recommendations
Based on the conclusions of the study, the researcher recommends the following: 1. Teachers and Grade I pupils should adopt and use the Skillbook to improve the mathematical
competence of the pupils and to equip them with the needed skills especially in problem solving and
higher-order thinking.

Eloisa A. Rivera/Mother Tongue-Based Mathematics Iloko Language Competence of Grade I Pupils in Bauang
District, Division of La Union
341
2. A regular assessment of the competence level of the pupils in Mother Tongue-Based Mathematics should be conducted.
3. A parallel study should be undertaken in all the other subject areas to find out the difficulties from the implementation of the MTB-MLE program in order that these could be addressed the soonest.
4. Also, parallel studies should be undertaken in order to encourage teachers to design and craft relevant
and authentic instructional materials.
5. Continuous seminars, trainings, and workshops in the utilization and pedagogy using the Mother
Tongue should be undertaken to enhance the linguistic and pedagogy skills of Basic Education
Teachers.
Proceeding of the 3rd International Conference on Education, Vol. 3, 2017, pp. 328-341
342
References:
Calderon, J.F and E.C Gonzales (2005). Research Methods and Thesis Writing. Quezon City: Rex Book Store
Inc.
Calmorin, L.P and M. A. Calmorin (2003). Research Methods and Thesis Writing. Quezon City: Rex Bookstore, Inc.
Duka, D.D. (2007). Lincensure Examination for Teachers 4th Edition. Manila City: Manila Review
Center Institute.
Department Order # 31 series of 2009
Department Order #74 series of 2009
Double Exposure in Mathematics; a Glimpse of Mother Tongue First. Department of Education
K-12 Curriculum Guide as of January 2012
National Targeting System of DSWD 2016.
National Statistic Office 2007 Census Population
Multi-Lingual Education Primer 2011
Cristobal, Joseph M. Capabilities and Needs of the Faculty of Lorma Colleges along Instruction, Research
and Instruction: Basis for a Training Program. Master Thesis. Saint Louis College. San Fernando City La
Union. 2014
Carreon, Rowena D. Activity Book in Math V. Masters Thesis. Don Mariano Marcos Memorial State
University, San Fernando City, La Union. 2009.
Dacanay, Rosemarie C. Basic Learning Skills of Preschoolers in Sta. Lucia District: Basis for a Learning
Activity Package. Masters’ Thesis. Saint Louis College.San Fernando. City La Union. 2011
De Castro, Sally L. Worksheets as Aids in Enhancing the Mathematical Abilities of Grade V Pupils. Masters’
Thesis. Don Mariano Marcos Memorial State University, Agoo Campus. 2005
Ducusin, Rosalie M. Mathematics Performance and Personal Attributes of Grade V pupils: A basis for an
Instructional Package. Masters’ Thesis. Saint Louis College. San Fernando City La Union. 2011.
Novida, Novelita C . Proposed Worktext in Elementary Mathematics III. Masters’ Thesis. Saint Louis
College, San Fernando City, La Union. 2005.
Ragma, Feljone. G. Competence of Mathematics Teachers in the Private Secondary Schools in San Fernando
City, La Union: Basis For Two-Pronged Training Program. Masters’ Thesis. Saint Louis College, San Fernando
City, La Union. 2011.
Rinon, Bernardita B. Teaching Literature in the Mother Tongue: Its Impact on the Learning Process and
Appreciation of One’s Culture. Published. Bicol University: 2011.

Proceeding of the 3rd International Conference on Education, Vol. 3, 2017, pp. 342-352 Copyright © 2017 TIIKM ISSN 2424 - 6700 online DOI: https://doi.org/10.17501/icedu.2017.3134
3rd International Conference on Education, 20-22 April 2017, Kuala Lumpur, Malaysia
THEORY OF CHANGE: A SUCCESS OR A FAILURE FOR
SCHOOL IMPROVEMENT, A DISCUSSION BASE ON
MALAYSIAN CONTEXT
R. Sudha Nair
Putra International College, Malaysia
Abstract: This is a review paper aim to analysis Michael Fullan‘s article of Theory of Change
(2006). In his article, he had discussed based on three sections which are flawed change theories,
theories of action with merit and what the prospects are for future of these theories of change in
knowledge. In each section, topics have been broken further into smaller components and analyzed.
This paper provides comparison and contrast base in the context of the researcher‘s own background.
The Theory of Change base in Malaysian context is looked upon as a challenge and even though
there are many that are agreeable to Fullan‘s article, there are also drawbacks. The paper is presented
with ideas, theories and other research in this field, thus providing a review of relevant literature to
support the researcher‘s arguments.
Keywords: Theory of Change, Success, Failure, School Improvement
Introduction
The Canadian grand wizard of ―school change,‖ Dr. Michael Fullan, the author of the article of Change
Theory: As a Force for School Improvement is still on top and controlling the public agenda after three decades.
As a ―Senior Advisor‖ to the Ontario Premier and Minister of Education since April 2004, and a former Dean of
Education at University of Toronto (1988-2003), he exerts a powerful but largely hidden influence over the
school reform agenda in Ontario, Britain, and far beyond. He is noted for his knowledge on educational reform,
and has consulted to school districts, teacher groups, research institutes, and governments.
Change theory as a force for school improvement by Michael Fullan (2006), discusses three main issues in his
article. These include the drawbacks of change theories, the theories of action which produce results and its
prospects for future use. The author has highlighted the flaws that exist in changed theories and how it is not
producing the change that is required out of it.Gabriele (Susan, 2002) in her article ―The ―roundtable‖ for
school learning and planning groups mentioned that different theories approach in a systemic educational
change varies in philosophies, strategies, models, and methods and searching for the theory that will create
conditions is necessary for systemic change.In order to achieve this Gabriele declared that conditions to include
would be an ―ideal-based, holistic, continuing, participatory, user-friendly, easy to adjust/improve, and
emancipatory‖ for effective change to occur in education (Susan 2002). As such, it does not come as a surprise
that the many theories of educationthat exist have weaknesses and flaws. Fullan (2006) claims that the flaws can
be seen in the standard based reform initiatives, professional learning communities or framework that focus on
the development and retention of quality leaders in schools.Fullan had also discussed what theories of action
appear to have more merits (theories with better results) and using the changed knowledge more fully so that it
can be benefited in future. These theories of actions are a set of assumptions about how one can move from its
current state to its desired future (Elmore, Fiarman, and Teitel, 2009) and Fullan has identified seven core
premises which are motivation, capacity building, learning in and changing context, a bias for reflective action,
tri-level engagement and finally persistence and flexibility in staying the course. Fullan also discusses the
negative aspects of these components.
The author has given ample of examples to prove his points (Refer Figure 1 on the topics that will be discussed).
This approach has its roots in the 1960s, when Kirkpatrick used the model to examine the effects of training on
students (Eseryel, 2002). It has grown in recognition in the last two decades, partially in response to the need
Corresponding Author:R. Sudha Nair/ [email protected]/[email protected]
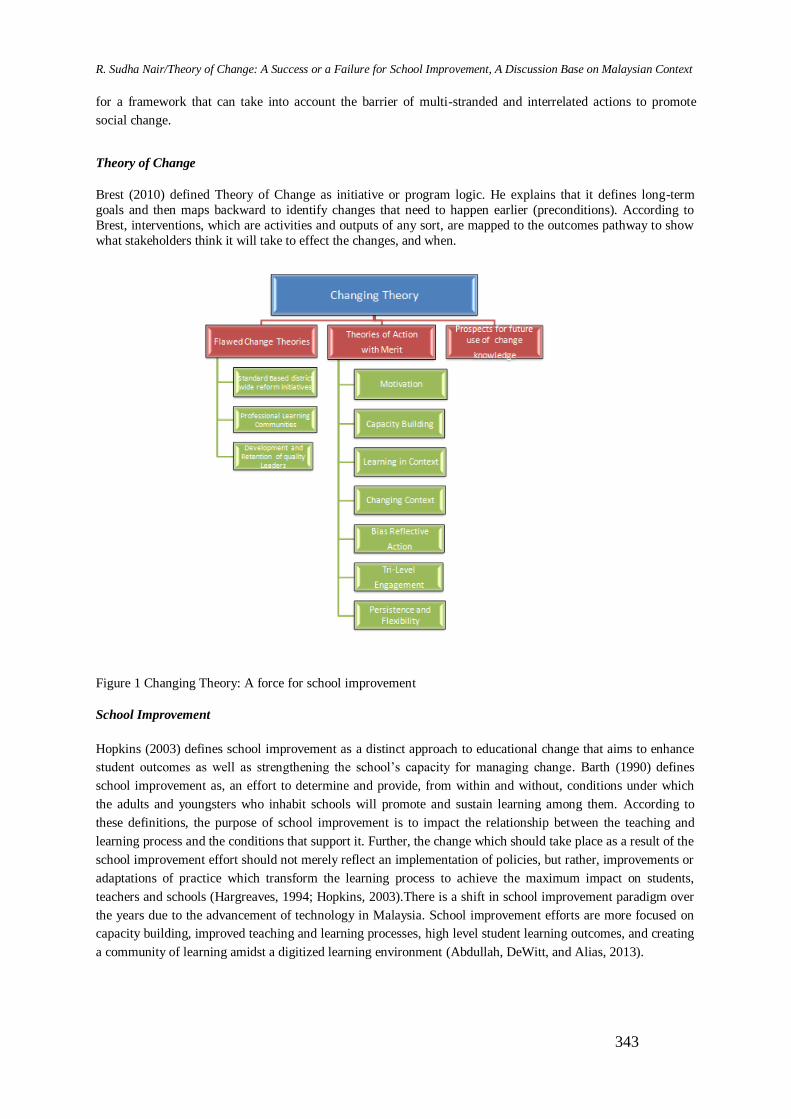
R. Sudha Nair/Theory of Change: A Success or a Failure for School Improvement, A Discussion Base on Malaysian Context
343
for a framework that can take into account the barrier of multi-stranded and interrelated actions to promote
social change.
Theory of Change
Brest (2010) defined Theory of Change as initiative or program logic. He explains that it defines long-term
goals and then maps backward to identify changes that need to happen earlier (preconditions). According to
Brest, interventions, which are activities and outputs of any sort, are mapped to the outcomes pathway to show
what stakeholders think it will take to effect the changes, and when.
Figure 1 Changing Theory: A force for school improvement
School Improvement
Hopkins (2003) defines school improvement as a distinct approach to educational change that aims to enhance
student outcomes as well as strengthening the school‘s capacity for managing change. Barth (1990) defines
school improvement as, an effort to determine and provide, from within and without, conditions under which
the adults and youngsters who inhabit schools will promote and sustain learning among them. According to
these definitions, the purpose of school improvement is to impact the relationship between the teaching and
learning process and the conditions that support it. Further, the change which should take place as a result of the
school improvement effort should not merely reflect an implementation of policies, but rather, improvements or
adaptations of practice which transform the learning process to achieve the maximum impact on students,
teachers and schools (Hargreaves, 1994; Hopkins, 2003).There is a shift in school improvement paradigm over
the years due to the advancement of technology in Malaysia. School improvement efforts are more focused on
capacity building, improved teaching and learning processes, high level student learning outcomes, and creating
a community of learning amidst a digitized learning environment (Abdullah, DeWitt, and Alias, 2013).

Proceeding of the 3rd International Conference on Education, Vol. 3, 2017, pp. 342-352
344
Discussion Base on Fullan’s Framework
Flawed Change Theories
Fullan (2006) stated that if teachers intend to help students to develop the skills and competencies of
knowledge-creation, professional knowledge should be developed among teachers by having the necessary
experience. Figure 2 shows the components of flawed change theories and the topic discussion in Malaysian
context.
Figure 2. Flawed Change Theories
Fullan highlighted on initiatives taken where fund was provided for external improvement. However the final
outcome was the districts were unable to change and improve practice on a large taken where fund was
provided for external improvement scale (Allen, Osthoff, White,and Swanson, 2005) when it comes to district
reform initiatives. In Malaysia, the operation expenditure allocated for the primary and secondary education
accounted for nearly half the total education operating expenditure as a whole (Kementerian Pelajaran
Malaysia, 2009). As the main provider of education funds for primary, secondary and higher level of schooling,
the federal government of Malaysia through the Ministry of Education and Ministry of Higher Education
contributed about 98% of the total financing (Shahril@Charil Marzuki, 2008). The government formally
recognized selected schools with guided financial autonomy known as Pusat Tanggungjawab (PTj) or
Autonomy Center (Responsibility Center) was created to ensure allocation are provided. However, the failure of
some principals to allocate resources based on the school objectives and priorities shows weaknesses on the
division of fund. Similar to what Fullan had claimed, the fund provided fail to bring improvement as expected
in certain schools. Radzi, Ghani, Siraj, and Afshari (2013) highlighted that the School Audit Division in its
Annual Report has reported that some principals of PTj schools failed to list their objectives based on priorities
and to provide a proper strategic plan for schools to reach their objectives (Kementerian Pelajaran Malaysia,
2007).
The Malaysian public examination taken by form 3 students is known as ‗PenilaianMenengah Rendah‘ (PMR)
national examination was replaced with ‗Pentaksiran Berasaskan Sekolah‘(PBS) or School Base Assessment in
2014. In 2016, a student‘s ‗Ujian Pencapaian Sekolah Rendah‘ (UPSR) or Primary School Achievement Test,
grade will no longer be derived from a national examination alone, but from a combination of School Base
Assessment (PBS) and the national examination. The format of the Malaysian Certificate ofEducation or ‗Sijil
PelajaranMalaysia‘(SPM) remains the same, with most subjects assessed through the nationalexamination, and
some subjects through combination of examinations and centralised assessments.

R. Sudha Nair/Theory of Change: A Success or a Failure for School Improvement, A Discussion Base on Malaysian Context
345
Initial feedback on the rollout of PBS suggests that teachers have yet to fully grasp the magnitude of the change.
Some teachers and schools are also struggling to develop their own assessment tasks and instruments for the
school assessment component (Malaysian Blueprint, 2013-2025). However, it is highlighted by Sudha and
Hanipah (2016) that when shaping a curriculum it is important to have characteristics like interdisciplinary,
research intensiveness, community engagement, academic literacy and global connectedness into it and the
successfulness of the implementation is still doubtful(Nair and Hussin, 2016) in higher education in Malaysian
context. Therefore school or higher learning institutions should take serious consideration on the characteristics
for improvement. For instance, the Ministry of Education, Malaysia upholds ICT as an enabler to propel
education to greater heights (Ministry of Education, Malaysia, 2006). However, the challenge lies in the
principal‘s autonomy to implement change due to the hierarchical organizational structures and centralized
school management.
In addition, the current heavy content of STEM (Science, Technology, English and Maths) curriculum places
greater emphasis on content at the expense of practical aspects, and does not sufficiently emphasise its
relevance to everyday life. This makes it more difficult for students to understand STEM‘s value or usefulness
to them (Blueprint, 2016). Recent ranking of ‗PISA 2015 Average Scores‘ , Malaysian was ranked 446 for
Maths, Reading 431 and Science 443, compared to Singapore which was first in all three (Business Insider,
2016). Currently, 20% of schools have Science labs that are damaged and no longer functional. Some schools
also lack modern equipment and facilities (Blueprint, 2016). This makes the effective teaching and learning of
STEM, especially through the use of practical lab work, more challenging to deliver and affects the interest of
students. Another concern is that the number of students enrolled in Science, Technology, Engineering and
Mathematics (STEM)-related programmes in higher secondary and tertiary levels is on a decline (The New
Straits Times, 2016). The STEM curriculum serves to educate students in an interdisciplinary and applied
approach. Last year, it was reported that the target for students enrolling in the stream is not being met annually
at the school and tertiary levels. Those in the know have warned that not having a sufficient STEM-related
workforce will lead to further technical dependency on foreign workers (The New Straits Times 2016). The
main reason students shy away from STEM subjects were because many experienced difficulty and complexity
in grasping the basic conceptual knowledge. Meanwhile, research has shown a direct correlation between the
use of STEM curriculum with preschoolers and an increase in collaboration skills, vocabulary, and the ability to
create and discuss scientific relationships (The New Straits Times, 2016).
The Malaysia Education Blueprint 2013-2025 has outlined strategies through various initiatives to enhance
science teaching and learning, including pre-service training and ongoing professional development for
teachers. Malaysia also has been liberal with funds used for educational purposes especially in higher learning
institutions (Cheong, Hanipah, Sudha, Noorzareith, Noraiti and Zainuddin, 2016). The government‘s policy in
education, particularly higher education is to bring it in line with the country‘s manpower planning and to
provide the country with the right the right and adequate supply of trained manpower to keep pace with
economic growth 2030 in future (EPU, 2016). Fullan admits, standards, assessment, curriculum and
professional development are encouraged yet they are as quoted, ―seriously incomplete theories action because
they do not get close to what happens in classrooms and school cultures‖ (Fullan, 2006) and also difficulty in
gaining results in the learning.
Fullan mentioned Professional Learning Communities (PLC) in his article which involves
communities of learners where teachers and school leaders work together to improve learning conditions and
results of students in given schools (Fullan, 2006). A study by Abdullah and Ghani (2014) in Professional
Learning Community in Secondary Schools in Malaysia showed that the teachers can be active in their learning
and improve their schools as to enhance the learning performance of the students in the first four characteristic
dimensions referred to the practice of shared values, goals, mission and vision among teachers which play an
important role in shaping the PLC in secondary school. Also, it reveals the importance of principals as key
leaders play an important role in shaping the PLC in their respective schools, as to provide support and
guidance to teachers. In addition, collective learning and application dimension also have four characteristics
which showed teachers are more focused on their need to improve work performance and improve teaching
methods. On the other hand, the secondary schools in Malaysia are very much focused on the revision of the

Proceeding of the 3rd International Conference on Education, Vol. 3, 2017, pp. 342-352
346
student workbook and hold a formal observation whereas, peer observations is poorly implemented. However,
the schools that have adopted the PLC shows all the teachers work harder to ensure they continue to be
implemented properly and constantly improving for a better future (Abdullah and Ghani, 2014). As highlighted
by Fullan, he focuses on learning, a collaborative culture with best practices, action orientation and
commitments will bring results. This can be identified in Ghani‘s sample of 676 teachers, whom exhibits shared
and supportive leadership, shared value, objectives, mission and vision, collective learning and application,
personal learning practices and supportive conditions.
Theories of Action with Merit
Fullan (2006) has identified motivation, capacity building with a focus on results, learning and changing
context, bias for reflective action and tri-level engagement as the seven core premises that underpin change
knowledge (Refer Figure 3). Figure 3 shows each case study base on Fullan‘s theories of action with merit in
Malaysian context. Motivation is a strong desire or passion in a person that encourages the person to try and do
something in order to succeed. It is a construct that is built out of individual learning activities and experiences,
and it varies from one situation or context to another (Bandura, 1997) and Fullan has stated it being one of the
core premise for change knowledge. The International Islamic University Malaysia‘s Alumni organized an
educational trip in a rural school in Sabah (The Borneo Post, 2017). According to the article, the key themes
which became the emphasis of the motivation program are to increase awareness among students on the
importance of having ambition in life, time management, and strategy for the UPSR examination. Some of the
activities are motivational talks and group discussion with facilitator. The university is concerned about the
education performance of students in Sabah and is committed in organizing more motivational programs in
rural areas this year voluntarily(The Post Borneo,2017.

R. Sudha Nair/Theory of Change: A Success or a Failure for School Improvement, A Discussion Base on Malaysian Context
347
Figure 3. Theories of Action with Merit
Capacity building, with a focus on results, is crucial (Fullan, 2007). Fullan had defined it as any strategy that
increases the collective effectiveness of a group to raise the bar and close the gap of student learning. The
author believes that in change theory, capacity building comes first followed by judgement, as it is most
motivational as the theory specifies that nothing will count unless people develop new capacities. Too often the
evaluation and monitoring component of a reform is not given the time and resources it really requires; new
programmes are planned before the evaluation is complete, or an evaluation is cut altogether due to budget
shortfalls (OECD, 2009). The Government of Malaysia and the United Nations for Education, Sciences, Culture
and Communications Organization (UNESCO) signed a Memorandum of Understanding (MOU) on 15th
November 2011 under the Malaysia UNESCO Cooperation. The establishment of Malaysian Cooperative Trust
Fund which will contribute to enhance South-South cooperation for capacity building in education and science
for the benefit of the Least Developed Countries, Small Island States in Asia and the Pacific and in support of
the Priority Africa agenda of UNESCO (OECD, 2009). This will involve the participation of national experts,
practitioners, international experts, senior advisors and climate change negotiators. As Fullan (2007) states, the
more one invests in capacity building, the more one has the right to expect greater performance.
The third and fourth premises that Fullan touched on are learning and change in context. In Fullan‘s
article, he pointed out that Elmore (2000) pinpointed issue that there is almost no opportunity for teachers to
engage in continuous and sustained learning as they are less observing and less being observed! Fullan further
stresses the need to have ―capacity to change the larger context‖ where schools and districts learn from each
other. A larger context can produce positive or negative impact and he highlights the importance of principals.
Knowledge and motivation would be the plus points however conflicts, bureaucracy and managerial issues
would be challenges that one meets along it. Recruiting top-performing principals and rewarding good principal
performance are both important. Providing strong principal training is useful, too. Learning at work—learning
in context—occurs, for example, when principals are members of a district's inter-visitation study team for
which they examine real problems—and the solutions they have devised—in their own systems. Learning out of
context takes place when principals go to a workshop or conference. Such learning can be valuable for further
development, but it is not the kind of applied learning that really makes a difference. A research by Tajasom
and Ariffin (2011) in urban secondary schools in northern Malaysia found that transformational leadership has
an effect on four aspects of school climate (affiliation, innovation, professional interest, and resource adequacy)
whereas transactional leadership only effect participatory decision making. Yusof (2012) had conducteda study
to analyze the relationship between school climate and teachers‘‘ commitment. The population involved five
primary schools in Penang, Malaysia. The finding showed that transparency of the institution level and
teachers‘ commitments in the five schools were high. Teachers‘ professional behavior also contributes towards
teachers‘ commitment. In a study by Raman, Ling and Khalid (2015), which focused on five excellent schools
in the district of Kubang Pasu, Kedah, showed that dimensions such as collaborative leadership, teachers‘
professional behavior; and working pressure have positive significant relationship with teachers‘ commitment.
Teachers‘ professional behavior was deemed as the determinant for teachers‘ commitment. In conclusion, the
result findings of the study can contribute to all types of schools and school administrators. Malaysia realizes
the need for constant renewal in its teaching profession especially when rapid changes are made in Malaysia‘s
education system (PIER, 1996). In action-research, ‗theories‘ are not validated independently and then applied
to practice. They are validated through practice Elliot, 1991 as cited in PIER, 1996. Despite the advancement of
new instructional technologies, the teachers‘ role in the classroom cannot be by-passed, rather it should be
strengthened with the teacher now playing the role of facilitating the acquisition of knowledge – the
constructivist (PIER 1996).
Fullan (2006) stated that one needs to dig a bit deeper to understand the theory of action underpinning the bias
for reflective action. He recalls back of Dewey‘s words, that ― it is not that we learn by doing but that we learn
by thinking about what we are doing‖. One has to agree with Fullan who concluded that people learn through
Proceeding of the 3rd International Conference on Education, Vol. 3, 2017, pp. 342-352
348
doing, reflection, inquiry, evidence, more doing and so on. When talking about thinking skills, a great deal has
been done to promote the teaching of higher order thinking skills in Malaysian classroom (Rajendran, 2001). It
was also suggested that modern skills like for instance precise and rational thought, training in basic logic,
reasoning and critical thinking are essential for all students. This clearly notes of the intention of promoting
thinking skills in Malaysian schools such as Smart School, Human Capital Development Plan and School Base
Assessment System (Othman and Mohamad, 2014).
Previously, a study conducted by Rajendran (2001) among Malay and English Language teachers
perceived that they were better prepared in term of their knowledge and pedagogical skills rather than teaching
higher order thinking skills. And yet, they are expected to teach the content as well as higher order thinking
skills. This is aligned with what Hashim (2002) who stated that ―the biggest problem with the teaching of
critical and creative thinking is teachers‘ lack of understanding and knowledge and the accompanying skills on
thinking. No proper education and training on thinking have been offered to all teachers, especially in-service
teachers whereas the Ministry and subject teachers prefer to adopt the infusion approach in teaching thinking‖.
Choy and Cheah (2009) noted that teachers did not seem to understand the requirement needed to cultivate
critical thinking among students. Overall, the transformation of the Malaysian education system particularly in
the area of thinking skill development is an ongoing process. It is yet to achieve its mature level (Othman and
Mohamad 2014). There are many initiatives taken by government and private sectors to overcome these
problems. Recently, there was a workshop conducted with 48 secondary school English teachers. Sponsored by
StarNie (Star Newspaper in Education), it was aimed to convey creative methods of using newspaper as a
resource in language classes. StarNie noted that HOTS (Higher Order Thinking Skills) and ‗21st Century
Learning Skills‘ are terms that are heavily used of late (The Star Malaysia, 2017). It is hoped for teachers to
become better, to come out and listen to people who inspire. It is expected that this workshop will be held up to
September, 2017, and primary and secondary teachers are encouraged to participate. There are many initiatives
taken in all quarters in encouraging critical thinking. For instance, the KDU‘s College Damansara Jaya campus,
held a two hour competition aimed to expose pupils to HOTs in Mathematics as well as the Sakamoto Math
method – a method originated from Japan that provides a simple yet systematic and structured technique to
analyse questions in a logical way (The Star Malaysia, 2017). The idea is that they need to be able to think and
answer without relying heavily on text-books. There were about 300 participants from 14 schools in Petaling
Utama, Selangor that took part. A research by Ganapathy, Singh,Kaur and Kit (2017) identified that there are
several important insights on the potential opportunities of technologies in facilitating higher order thinking but
success lies on the tasks that are appropriately designed for promoting the content. This goes at par with the
announcement of the Prime Minister Najib Razak on introducing computational thinking and computer science
in the curricula for both Malaysian primary and secondary schools starting from 2017 under a #mydigitalmaker
movement and 9200 teachers will be trained for this purpose (TodayOnLine, August 11, 2016).
Tri-level engagement is essential for systemic educational reform efforts. This engagement includes
the school/community, district, and state. Fullan (2006) explained that complete alignment of levels is often
unachievable, but a ―permeable connectivity‖ is ideal, where ―mutual interaction and influence within and
across the three levels‖ takes place and results in change in the system concurrently. However, the missing thing
would be the strategy about school or its district culture. A good example of tri-level engagement in Malaysian
context can be seen through the initiative under the Department of National Unity, ‗Perpaduan‘ pre-school were
established in urban areas where a ‗friendly neighbor-hood scheme‘ existed. Each preschool class has a
Preschool Coordinating Committee made up of members of the local community who provide advice on the
operation of the preschool and organize various activities for parents. Classes are conducted at community halls
(rented or free of charge), housing estates, private property, shop-houses (rented) or built by the Ministry. In
2007, there were 1496 ‗Perpaduan‘ preschools with a total enrolment of 38,952 children (Ball 2007).The
concern now is to make sure that all these core premises are cultivated and to achieve this there should be
persistence and flexibility.

R. Sudha Nair/Theory of Change: A Success or a Failure for School Improvement, A Discussion Base on Malaysian Context
349
Fullan, 2007 claims that using change knowledge for school and system improvement yields result and it
matters. In Malaysia, The Literacy and Numeracy Screening (LINUS) programme was introduced aiming at
ensuring that all Malaysian children acquire basic literacy and numeracy skills after three years of mainstream
primary education. The main aim of the training programme is to introduce the teachers to the differentiated
pedagogical skills for pupils with learning disabilities and techniques to identify pupils with special needs and
learning difficulties (Kang Soon Chen 2012). A research was conducted by Wei and Hutagalung (2014) to
determine the effectiveness of LINUS screening test. The study identified that the programme does benefit
students who fall behind in education system and remedial coaching can be given for students to catch up. Here
as stated by Fullan (2007) being persistence and flexible is built in the action theory.
Prospects for future use of change knowledge
Surveying Fullan‘s writings and line of products, it is next to impossible to identify where he actually stands on
the goals and purpose of school reform. Ten years ago, he lauded George W. Bush‘s No Child Left
Behind agenda, while expressing reservations about the ―too narrow tests, short time lines, little capacity
building, and punitive strategy.‖ Since then, he has beenserving on the Advisory Board of Microsoft‘s Partners
in Learning and advocating large-scale system change that produces ―real results.‖ Conservative school
reformers remain as sceptical as teacher unionists about Fullan‘s real motives, strategies, and objectives.
Michael Fullan Enterprises Inc. rides the sharp edge of the North American school reform divide. ―A big feature
of our work,‖ he now says, ―is to play down accountability in favour of capacity building, and then re-enter
accountability later.‖ All of the new private sector services are tailored to provide ―solutions‖ to the
problems posed by reform. Fullan (2006) seem to have so many ideas of reformation. However most that has
been undertaken have proven successful in Malaysia. Consider how governmental policy and accountability are
re-framed as a problem which the private solution provider can help to solve. As a result, parents are driven to
seek out solutions outside the system for their children, or leave the public school system altogether.Some of the
challenges highlighted in Malaysian STEM implementation were the necessity of adopting and implementing a
holistic approach to learning, the need to consider the applied dimension of knowledge (what we know is as
important as what we can do with that knowledge), necessity of revising the traditional structure of the
curriculum, the organization of learning experiences, the teaching approaches, and the assessment systems
(Amadio 2015). The future of educational change is very much a matter of if accountability and
professional learning community will be developed and draw on each others' essential resources. Fullan ,2006
summarized that the ultimate goal of change was when people visualize themselves as shareholders with a stake
in the success of the system as a whole, with the pursuit of meaning as the intangible key. Of course one need to
agree as quoted by Fullan (2006) large scale successful reform occurs in a thousand small ways during the
journey. Fullan warned not to go on a journey without equipped with an active and open-ended grasp of change
knowledge. In other words be more receptive to alternative strategies, don‘t wait before it happens, and be
among the promoter!
Limitation to Fullan’s Theory
More than ten years have passed since the publication of the New Meaning of Educational Change (Fullan
2007) and great educational changes have already taken place in schools all over the world. It is for sure that
education stakeholders could gain abundantly by reading this book. However, could the unsatisfied working
conditions of educational stakeholders greatly be improved even if all the educational changes mentioned by
Fullan have already occurred? The answer may not be that positive. In fact, many teachers and principals all
over the world today still overwork because they are occupied by the same duties as those ten years ago, though
the former are more certain and collaborative. For example, instead of handing out papers, giving remarks,
inputting grades into computers and finally analyzing and evaluating the grade, teachers could input questions
on computers and then release to students by using a virtual learning platform. With the help of educational
technology, they could have courses online at their own paces, and thus student-directed change can be

Proceeding of the 3rd International Conference on Education, Vol. 3, 2017, pp. 342-352
350
achieved. As a matter of fact, educational revolution has already taken place in some schools where all courses
are taught online and where teachers mainly focus on teaching instead of ―controlling students and organizing
classes‖. Florida Virtual School (FLVS) is a public school, where all courses are taught online. And the online
courses are just as real as the dedicated, certified teachers who teach them. As far as Malaysia is concerned, the
announcement of the Prime Minister of integrating computational thinking and computer science in the
curricula is plausible with the 21st century need is a positive move towards changes. Changes should always be
there if a country wants to compete globally. It is without doubt that for every decision will have drawback,
however this should not stop a country from producing intellectual community with high income as per the
country‘s vision. Of course, the vision and objectives are not something that can be achieved overnight, it takes
time and careful planning.
Conclusion
The review above can be summarized with a few findings. First, theory of change is both a process and a
product, second the quality of a theory of change process rests on ‗making assumptions explicit‘ and making
strategic thinking realistic and transparent. Next, the time and resource needed to work effectively with theory
of change needs to be taken seriously. Finally, working with theory of change thinking can be challenging but it
can create a strong organising framework to improve programme design, implementation, evaluation and
learning (Vogel, 2012). The issues raised by Fullan need much investigation. Not all outcomes are negative as
far as changing theory is concerned. School structure will continue to evolve, and the reform theories proven
effective by research will continue to be refined in this 21st century.
Reference List
Allen, L.E., Osthoff, E., White, P. and Swanson, J., 2005. A Delicate Balance: District Policies and Classroom
Practice. Cross City Campaign for Urban School Reform.
Abdullah, Zuraidah, and Muhammad Faizal A. Ghani. 2014."Professional Learning Community in Secondary
Schools Community in Malaysia." Journal of Education and Learning (EduLearn) 8.3 : 227-248.
Amadio.M., 2015. International Stem High-Level Policy Forum―Evidence-Based Science Education In
Developing Countries‖, 26-27 May 2015, Kuala Lumpur, Malaysia.
Ball, Jessica, 2011. "UNESCO, 2010."
Bandura, A., 1997. Self-efficacy: The exercise of self-control.
Blueprint, M.E., 2016. Blueprint 2013-2025.(2013). Ministry of Education, Malaysia.
Barth, R.S., 1990. Improving schools from within: Teachers, parents, and principals can make the difference.
Jossey-Bass Inc., Publishers, 350 Sansome Street, San Francisco, CA 94104-1310.
Business Insider, Malaysia. 2016, Dec 7. Retrieved from http://www.businessinsider.my/pisa- worldwide-ranking-of-math-
science-reading-skills-2016-12/?r=US&IR=T#5VlcY1PbFfxT56vS.97on 17/4/2017).
Brest, P., 2010. The power of theories of change. Stanford Social Innovation Review, 8(2), pp.47-51.
Hopkins, D., 2003. School improvement for real. Routledge.
Cheong, K. M., Hanipah, H., R Sudha, N., Noorzareith, S., Noriati, A. K., and Zainuddin, J. (2016).

R. Sudha Nair/Theory of Change: A Success or a Failure for School Improvement, A Discussion Base on Malaysian Context
351
The Relevance Of The Seven Premises Discussed By Fullan‘s Change Theory In Higher Education In
Malaysia. The Social Sciences, 11(9), 2206-2209.
Choy, S.C. and Cheah, P.K., 2009. Teacher perceptions of critical thinking among students and its influence on
higher education. International Journal of teaching and learning in Higher Education, 20(2), pp.198-206.
Elmore, R.F., 2000. Building a new structure for school leadership. Albert Shanker Institute.
Elmore, R.F., Fiarman, S.E. and Teitel, L., 2009. Instructional rounds in education: A network approach to
improving teaching and learning. Harvard Education Press. 8 Story Street First Floor, Cambridge, MA 02138.
Eseryel, D., 2002. Approaches to evaluation of training: Theory & practice. Educational Technology
& Society, 5(2), pp.93-98.
Eyal, O., 2009. Degeneracy, resilience and free markets in educational innovation. Systems Research and
Behavioral Science, 26(4), pp.487-491.
Farr Gabriele, S., 2002. The ―Roundtable‖ for school learning and planning groups: planting a seed for systemic
renewal. Kybernetes, 31(9/10), pp.1361-1368.
Fullan, M., 2006. Change theory: A force for school improvement (Centre for Strategic Education Seminar
Series Paper No. 157). Victoria: SCE.
Fullan, M., 2007. The new meaning of educational change. Routledge.
Fullan, M., 2007. Change theory as a force for school improvement. In Intelligent leadership (pp. 27-39).
Springer Netherlands.
Ganapathy, M., Singh, M.K.M., Kaur, S. and Kit, L.W., 2017. Promoting Higher Order Thinking Skills via
Teaching Practices. 3L: Language, Linguistics, Literature®, 23(1).
Hargreaves, A., 1994. Changing teachers, changing times: Teachers' work and culture in the postmodern age.
Teachers College Press.
Hashim, R., 2002. Investigation on the teaching of critical and creative thinking in Malaysia. Jurnal Pendidikan
Islam, 10(1), pp.39-56.
Henk, M., 2010. Change theories in education. We Teach We Learn.
Kang Soon Chen. Linus programme for Early Child, 2012, Sept
5.http://www.thestar.com.my/news/nation/2012/09/05/linus-programme-for-early-learning/.
OECD. Centre for Educational Research and Innovation (CERI), 2009. Working out change: systemic
innovation in vocational education and training. OECD, Paris, France.
Othman, N. and Mohamad, K.A., 2014. Thinking Skill Education and Transformational Progress in
Malaysia. International Education Studies, 7(4), pp.27-32.
Programme for Innovation, Excellence & Research (PIER). 1996. Report by Educational Planning Research
Division: Ministry Of Education Malaysia.
Rajendran, N., 2001. The Teaching of Higher-Order Thinking Skills in Malaysia. Journal of Southeast Asian
Education, 2(1), pp.42-65.

Proceeding of the 3rd International Conference on Education, Vol. 3, 2017, pp. 342-352
352
Raman, A., Ling, C.C. and Khalid, R., 2015. Relationship between school climate and teachers‘ commitment in
an excellent school of Kubang Pasu District, Kedah, Malaysia. Mediterranean Journal of Social Sciences, 6(3
S1), p.163.
Sudha, N.R., and Hanipah, H. (2016). Shaping The Curriculum: A Characteristics Approach And Its Impact On
Teaching And Learning. Social Sciences, 11(9), 2054-2057.
Tajasom, A. and Ariffin Ahmad, Z., 2011. Principals' leadership style and school climate: teachers' perspectives
from Malaysia. International Journal of Leadership in Public Services, 7(4), pp.314-333.
The Borneo Post (Sabah): 2017-02-09 - Motivation programs for rural students. Retrieved
fromhttps://www.pressreader.com/malaysia/the-borneo-post sabah/20170209/281547995634176.
The New Straits Time. 2016-3-15. Science too daunting too many students. 15-3-2016.
http://www.nst.com.my/news/2017/03/151648/science-too-daunting-too-many-students.
The Star NIE, PressReader, 2017-3-5. Putting the Fun Back in Reading. Retrieved from
https://www.pressreader.com/malaysia/the-star-malaysia/20170305/283029759397893.
Vogel, I., 2012. Review of the use of ‗Theory of Change‘in international development. UK: Department for
International Development (DFID).
Wei, Y.S. and Hutagalung, F., 2014. LINUS assessment accordance with the cognitive level among year 1
students in a School Klang District. Manag. Technol. Knowl. Serv. Tourism Hosp, 1, pp.123-126.
Yusof, N.M., 2012. School Climate and Teachers‘ Commitment: A Case Study of Malaysia.

Proceeding of the 3rd International Conference on Education, Vol. 3, 2017, pp. 353-363 Copyright © 2017 TIIKM ISSN 2424 - 6700 online DOI: https://doi.org/10.17501/icedu.2017.3135
3rd International Conference on Education, 20-22 April 2017, Kuala Lumpur, Malaysia
SOCIAL CAPITAL, MIGRATION AND SOCIAL
INTEGRATION
Le Thi Mai
Ton Duc Thang University, Faculty of Social Sciences & Humanities,
Department of Sociology, Hochiminh City, Vietnam
Abstract: Migrant marriage has been as a response to the globalized world. The important issue
with regards to this research is to understand how immigrants integrate into the host for individuals
and community development in this context. This paper focuses upon the ways in which social
capital is utilizes to promote the integration of Vietnamese women marriaged to Taiwan husbands
into their family and the host. Social capital constitutes “resources that can be used by the actors to
realize their interests”. Social integration is interpreted as being the process of inclusion and
acceptance of individuals in a system, the creation of relationships among individuals and their
subsequent attitudes towards society. This paper is based on a case study undertaken in 2014 on the
Penghu Islands and in Taipei, Taiwan. Main findings: The values and norms of responsibility of
women in family has been developed and practiced effectively by Vietnamese women marriaged to
Taiwan husbands to integrate into their family. The regulations and legal environment for
immigrants have created favorable conditions for their integration into the host. Traditional
Vietnamese cooking skills are chosen by many Vietnamese women as a kind of social capital for
their access to the Taiwanese job market. The social integration is reflected through: social-
economic, culture integration and citizenship. It is hoped that research results are useful scientific
basis for developing policies that promote the social integration of immigrants for the development
of individuals and the social community.
Keywords: Social Capital, Social Integration, Vietnam-Taiwan Migration Marriage
1. Introduction
Migrant marriage in which one person migrates from his or her own country to the new spouse‟s country, has
been as a response to the globalized world. The phenomenon of young rural women of the Mekong Delta
Vietnam marrying foreigners, mostly from Taiwan and South Korea began in the 1990s when the 'Doi Moi'
economic reforms opened Vietnam to foreign capital. This phenomenon has been developing over the past 30
years since the 1990s. More than their two generations have settled in Taiwan. Cross-border marriage has
become a feature of Vietnamese integration into the global community. By 2010, the total number of
Vietnamese women married to foreigners was over 80 thousand, 40 percent of whom were married to
Taiwanese husbands (Han-woo & Cuong, 2015). The newest statistical report of naturalized foreigners
(excluding China, Hong Kong, and Macau) obtaining the citizenship of R.O.C. from Jan. 1, 2003 to Dec. 31,
2012 showed that among the 5,004 foreigners, 94.3% of them belong to foreign spouses with 77% (3,855) of
the foreign spouses having immigrated from Vietnam. According statistics of Department of Household
Registration Ministry of Interior (M.O.I, 2103), among the total number of naturalized spouses from
Southeastern Asian countries, Vietnamese spouses account for almost 77%. (YU Teng-Huang, 2014, p. 21).
As former Minister of M.O.I., Lee Hong-yuan said, the rise in the divorce rate, 2.41% in 2013, the third
highest in the world, could partly be ascribed to the increasing number of transnational marriages in
Taiwan because a great number of foreign spouses either from Mainland China or Southeast Asian countries
often have a hard time adapting themselves to Taiwan‟s culture or customs, leading to a high divorce rate
among transnational couple (Wu, 2013, YU Teng-Huang, 2014). The important issue with regards to this
research is to understand how immigrants integrate into the host for individuals and community development in
this context. Therefore, the ways in which social capital is utilizes to promote the integration of Vietnamese
Corresponding Author: Le Thi Mai/ [email protected]

Le Thi Mai/Social Capital, Migration And Social Integration
354
women marriaged to Taiwanese husbands into their family and the host and programs for the sake of
empowerment, education were focused to provide these marriage immigrants are analyzed in this paper.
Using a wide range of literature that focuses upon the ways in which social capital have been found to
promote or hinder integration of Vietnamese spouses into their husband‟s family, local communities in
Taiwan. The following topics were found in the literature: the concepts, the role of social capital in social and
economic integration, the influence of the host languages proficiencies and inter-ethnic contact in
neighborhoods on building social capital, and how policy and legislative contexts affect development of
social capital and then, facilitate migrants‟ social integration.
Bourdieu (1986), who first analyzed social capital systematically, defined social capital as “the
aggregate of the actual or potential resources which are linked to the possession of a durable network
of more or less institutionalized relationships of mutual acquaintance or recognition.” It is important to
mention the definition by Coleman in analyzing the role of social capital in migrant integration. Coleman
defined that Social capital constitutes “resources that can be used by the actors to realize their interests”
(Coleman, 1990, p. 305). To emphasize function of social capital that facilitate one‟s social integration,
Coleman claim that social capital consists of some aspect of social structures that useful for certain action of
actors within the structure. Thus, for social capital to exist, relations among persons have to be changed in
order to facilitate action. At the meantime, Coleman also analyses the mechanisms that generate social capital
(reciprocity expectations and group enforcement of norms), the consequences of possessing social capital
(privileged access to information) and the social organization that provides the context for both resources and
effects to materialize (Portes, 1998). According to Coleman (1990, p. 306), there are two main sources of
social capital: consumerist motivation (internalized norms, bounded solidarity) and instrumental motivation
(reciprocity exchange, enforceable trust). The expectation of reciprocity by those who agreed to provide
someone with access to information depends on how far the person making the claims feels obliged to repay,
when and in what form. This depends on the level of trustworthiness of the social environment. Thus, social
capital functions among other things as a source of control (Coleman, 1990) and a source of resources
mediated by non-family networks (Bourdieu, 1986), facilitating access to jobs, market and loans. These view
is similar to concept by Bourdieu and Wacquant (1992, p. 119), “Social capital is the sum of the resources,
actual or virtual, that accrue to an individual or a group by virtue of possessing a durable network of more or
less institutionalized relationships of mutual acquaintance and recognition”. It was said that people access to
social capital through membership in interpersonal networks and social institutions and then convert it into
other forms of capital to improve or maintain their position in society (Bourdieu, 1986, Coleman, 1988).
“Migrant networks are sets of interpersonal ties that connect migrants, former migrants, and non-migrants to
one another through relations of kinship, friendship, and shared community origin. Network connections
increase the likelihood of international migration because they lower the costs and risks of movement and
increase the expected net returns to migration. Having a tie to someone who has migrated yields social capital,
people can draw upon to access to an important kind of financial capital”. (Alberto Palloni, et al,. 2001, p.
1263-1264)
Burt (1997) suggests that social capital is a quality of individuals; it contributes to an individual's human
capital, while Yli-Renko, Autio and Sapienza (2001) examined social interaction, relationship quality and
network ties as dimensions of social capital. Social interaction is necessary to establish the network ties and
relationship quality defines the strength of those ties. These three dimensions of social capital help to produce
competitive advantages.
Kitching et al., described ethnic diasporas as a form of social capital by defining social capital not only as
„resources‟, but also as „opportunities available to agents occupying particular positions‟ (2009, p. 694). Thus,
evaluating the quality and variety of social ties and networks is crucial in assessing the usefulness of social

Proceeding of the 3rd International Conference on Education, Vol. 3, 2017, pp. 353-363
355
capital. Dahinden (2013), analyzed network social capital as one possible form of social capital and an
asset in a network to underline the importance of resources (variety and quality of contacts) are available
in networks. It sounds that the more differentiated social relations, the better the quality of social capital.
Those networks are characterized by a high variety of diverse ties, both „strong and weak ties‟ (Granovetter,
1973). As social beings, humans are inevitably enmeshed in interpersonal webs of strong ties to close
friends and relatives and weak ties to more distant relatives, casual acquaintances, and friends of friends. By
drawing on the social ties, an individual can mobilize the social capital embedded within it to gain
valuable information, moral support, and material assistance. (Gunawan Prayitno et al., 2014).
Social integration is defined as the harmonious and coherent processes of the structure of a social system
(Koramaz, 2014). Social integration is the stability of relations among parts within a system like whole (Le,
2014). Social integration is interpreted as the process of inclusion and acceptance of individuals in a system, the
creation of relationships among individuals and their attitudes toward society. Social integration is also further
developed as structural integration (e.g. the acquisition of rights and the access to position and status in the core
institutions of the host society); Cultural integration; Interactive integration (e.g. the acceptance and inclusion of
immigrants in the primary relationships and social network of the host society) and identification integration
(e.g. inclusion in a new society on the individual level. It is reflected by a feeling of belonging to the host
society and identifying with it) (Bosswick & Heckmann, 2006). Additionally, cultural integration also can
indicate how much engagement they conduct through their abilities in the local community or the extent of
integration with their family members in Taiwan. Vietnamese spouses‟ self-identity has the possibility of
double belonging because of their constant contact with their natal home or through their remittances.
The literature shows that social networks do play a significant role among migrants in the initial settlement
process, helping to find a job or accommodation and giving support - especially buffering to some extent the
negative effects of weak cultural and economic capital, as well as lack of a stable legal status. At this stage
ethnic networks do constitute a source of bonding social capital. With time, these can lead to the
development of ethnic places, such as shops, business and restaurants, where migrants and native
inhabitants meet, and which can then become a source of bridging social capital. The extension of good
quality ethnic networks, based on strong ties and mutual trust (which thus constitute bonding capital), via
weak ties to wider social networks, seems to provide the best of the two types of capital - in an optimal form
of providing opportunities for chance encounters, leading to attachment to place and social integration. The
overview of the literature studying the role of social capital in the social integration of migrants at the local
level has demonstrated the importance of taking a broader spatial perspective. Not only in terms of actual
research, showing the importance of the broader context, including the institutional context, but also in terms of
policy design and implementation.
In this paper, my concern is to deepen our understandings of the socialization of immigrant women, specifically
focusing on immigrants to Taiwan. Some Vietnamese scientists (An et al., 2005, the Vietnam Committee of
Population, Family and Children in 2005) comment that less examination exists on Vietnamese marriage
migrant life in their husband‟s homes due to limited finance curtailing the ability to conduct surveys in Taiwan.
We hope that the findings of this research conducted in Taiwan will fills a gap in the previous literature on this
limitation, giving the reader an objective and lively insights. The existing research outlined in this section
contributed greatly to the conceptualization of this paper and is drawn upon throughout the article in order to
illustrate, support and query our own findings.
2. Methodology
We used a qualitative methodology to guide this study because marriage/family itself is a complicated
construct established, formulated and transformed by, through and within social practices. The specific
research methods include: in-depth interview, group discussion, participant observation. During the research,

Le Thi Mai/Social Capital, Migration And Social Integration
356
we observed the informants‟ activities, participating in their normal life and listening to their stories, organized
some travels, having lunch in their restaurants or visiting their homes in the evenings whenever permitted. A
two-hour in-depth interview was conducted in Vietnamese. The time could be adjusted according to
circumstances. We interviewed some informants several times due to the need for more information and for
exploring the new themes noticed from previous interviews. Additional, we used also semi-structured
interview to interview some related parties, such as the husbands and in-laws, neighbors or villagers, to
collect data during visiting their homes. Our work experiences and networks had been useful resources for
carrying out the interviews: we are working with lecturers and researchers in National Penghu University
(NPU) and the Vietnamese students who were studying in NPU, Mango, Pengho Islands, Taiwan.
Recruitment of informants and sampling methods. Informants were recruited from two sources. First, through
the introduction of our students studying at NPU in Penghu Islands and National Cultural University in
Yang Min Shan, Taipei, we went to see Vietnamese women married to Taiwanese husbands. They have
reputation in the Vietnamese women's community there. A snowball sampling method was developed then,
to trace the social networks of the informants and as well to find new interviewees of which 26 informants
were met through this method. Five interviewees were met randomly in the fieldwork. These 31
Vietnamese women were identified as key informants. The selection criteria of these informants included: all
informants were involved in Taiwan-Vietnamese marriages; being from different social backgrounds,
including farming, small trader, worker, education attainment, self-employment, and all informants married
Taiwanese husbands after the “Doi moi” attracting foreigner investment in 1990s. We considered these
standards important because it not only symbolized globalization but also the beginning of rapid social
changes in Vietnam.
Profile of research participants. Maximum variation of data was also given attention in our consideration and
it “aims to select cases that provide for wide variations in the experience or processes being examined.
Various attributes such as age (from 25 to 46 years old), educational level (from primary school to the student
of university), social class (up to middle class) and occupation before marriage were taken into account and
also identified as important factors. We introduced our research topic and purpose to the informants and
obtained their consent for interview and recording.
2.1 Terminology
Coleman‟s definition is used as working one here by which Social capital is defined constituting “resources that
can be used by the actors to realize their interests” (Coleman, 1990, p. 305). Social capital of Vietnamese
marriage immigrants is identified two dichotomy categories: individual/cognitive social capital and
general/structure one. Their individual social capital was examined by the filial daughters socialized in Vietnam
as: traditional cooking skills, take care all members in the family specially children, obedience to the mother-in-
law, be responsible to both natal family and husband's family, faithful, honest, very diligent about earning
money, tolerant of hardship, and Mandarin proficiencies before their marriage…. Their general/structure social
capital was examined by daughters of shared origin, casual friends, acquaintances, even friends of friends who
have been got marriage to Taiwanese husband prior to Taiwan as well as Taiwanese governmental procedures
and regulations as favorable conditions for them to integrate into the host such as Mandarin language courses,
vocational courses before they want to start a small business or work at anywhere. Social integration here is the
stability of relations among parts within a system like whole (Le, 2014, Le et al, 2017, p. 62-63, 72 in detail).
2.2. Theoretical Approach
Social network analysis was used in this research to show how Vietnamese brides took advantage of
relationships, experiences and opportunities to empower themselves to access social integration and achieve
their goals. For example, social network analysis was used to show how Vietnamese brides access social

Proceeding of the 3rd International Conference on Education, Vol. 3, 2017, pp. 353-363
357
resources and supports such as courses for learning the Mandarin language and other training courses that the
Taiwanese government opened up for them to improve their capacity. Crucially, these endeavors also enabled
Vietnamese brides to access the labor market or participate in social activities. The sustainable livelihood
approach was used in this research to analyze why the majority of rural women in South Vietnam chose
marriage to foreign husbands as a strategy to escape poverty, a means to get the financial capacity of their own
to support Vietnamese natal families, even as a means increase their social mobility and ascend to a higher
social class. (Le et al., 2017, p. 63-64 in detail). These views were conceptualized and reflected within the
content of in depth interviews, group discussions and fieldwork observations.
2. 3. Data
Research information in this paper is mainly derived from interviews and observations conducted in 2014. The
analyses here were based on information from 31 Vietnamese immigrant spouse marriage Taiwanese husband
between the periods 1990-2014 who are settling in the Penghu or Pescadores Islands and Taipei for at least 5
years. This investigated was ethnographic in approach, involving months of intensive participant-observation
and we actively participated in community activities involving members from transnational marriage families.
Connections were continued by mobile phone, face-to-face interviews when they came back Vietnam. (Le,
2017: 64 in detail).
3. Results
3.1. The values and norms of responsibility of women in family has been developed and practiced effectively by
Vietnamese women marriaged to Taiwan husbands to integrate into their family.
To build confidence within the husband's family, it is not an easy process. It chiefly depends on the individual
woman and her willingness to work hard, exhibit respect and gain trust. Information from group discussions
conducted in Magong City, on the Penghu Islands revealed the initial difficulties associated with building these
relationships. Popular behaviors of Vietnamese brides in this first period involved them trying their best to
satisfy the husband and the husband's family members by responding to their expectations.
When I came here, I was so sad and homesick, my husband is very gentle. My husband‟s family once had a
fishing boat going to the sea, now he works as a wall-paint man. At that time, my mother in law is old and too
sick to go. I had to take care for her daily meanwhile I am suffering from vomiting by being pregnant. Forced
by no one but being Vietnamese bride, I wake up at 6 am every morning to cook vegetarian for mother-in-law
to eat, cook porridge, cook food for all members in husband‟s family to eat. I remember at that time money was
not available. Then I just nursed my new baby and took care of mother-in-law seriously. Everyday I had to suck
out phlegm, to wear diapers, change up, bath and shampoo her. I did it from my heart. My mother-in-law was
very gentle and she loved me too. I worked hardly up to 36 hours daily... money was very tight,... (49 years old,
from Phu Yen province, the Middle Vietnam)
What I need is chances and I always believe that my chances are here. It is too poor to be a farmer, so
many poor rural girls like us without much education and skills, have preferred to being migrant spouse. It all
depends on how well I meet my husband family's expectations for a daughter in law. I have known the
marriages of some Vietnamese spouses are unsuccessful, not as they expected. Most of them sacrifice and
suffer for the happiness of their children. They have worked hard to achieve the goal. In case of divorce, they
try to fulfill the responsibility of caring for children and meet the conditions for their children to go to good
quality schools. "Do it all for our children" is a statement that is often heard (46 years old, from Saigon City).
The informants had expressed different thoughts and ideas on daughters‟ filial roles. According to their
perceptions of filial piety, “sending money back home” was of great significance for them. Their conversations
could be categorized into three overlapping themes: 1) The “remittances” theme came from those who felt
Le Thi Mai/Social Capital, Migration And Social Integration
358
guilty about their absence from physical care of parents, so they wanted to remit their natal parents as a
compensate; 2) The “status” theme came from those who considered that sending money home was a way
to indicate their financial capability and a means to improve their status at home as well; 3) The “face” theme
came from those who had associated the activity of sending money home with the “face” issue. At the same
time, with the remittances from the migrant daughters, the parents and siblings also gained more chances to
achieve some development. Reciprocally, they would help to increase their daughters‟ status in their
husbands‟ families. Following are their voices from a group discussion in Penghu Islands:
Every time I visit home (in Vietnam), I always gives some money to my parents… just want to show my small
gratitude, reducing my worry (36 years old, from Quang Ninh province, the North Vietnam ); Through giving money
to parents, I also want them to know that my life here is good, so they do not need to worry about me (33 years
old, from Dong Nai province, the South Vietnam). How can a daughter live a comfortable life while turning a blind
eye to her parents‟ poor life? My parent‟s house is build by my remittance for 3 years. They are proud of me,…
Then, villagers often conversed with my mother “Your daughter is so filial”. Many beautiful houses in my
natal village belong to those families have daughters abroad. Of course, there are also brides who cannot
make any contribution to their families. People around will spread the gossip like “she has married a terrible
guy” or “she has been trafficked into prostitution.” The parents will also lose face (46 years old, from Can Tho
province, the South Vietnam). I am sent money to both my parent and parent-in-law monthly. My husband is
becoming belief in me. Both sides of parents are equally important. My business run effectively due to support
of my husband‟s family (49 years old, from Phu Yen province, the Middle Vietnam).
3.2. The regulations and legal environment for immigrants, Vietnamese immigrant spouse network are
considered as dimensions of structural social capital that have created affiliated conditions for their integration
into the host. The social integration is reflected through: citizenship; social-economic and culture integration.
Under the provisions of the Taiwan Government, Vietnamese wives who first arrived in Taiwan, had to apply
for temporary residence registration immediately. The wife's application must be signed by her Taiwanese
husband in the role of her guarantor. At the same time, Vietnamese brides often enrolled in Mandarin language
classes organized by local authorities to support them. A Vietnamese lady teaching in these classes explained:
“There were classes for Vietnam brides. They teach two languages as Vietnamese – Mandarin or Mandarin -
Vietnamese. Since Vietnamese women married Taiwanese men were very much. I completed that course and
was granted Certification. Now I do enrichment teacher Vietnamese to children and adults here”. (Le, 2017, p.
67 in detail)
A Vietnamese spouse of 36 years old from natal village in Long An province said
Here they organize courses for "new residents", for those who come from other countries to Taiwan. There are
also many activities, such as: I am now studying interpreting classes, yoga classes. Each month also held an
afternoon meeting for the Vietnamese spouses clustered talking and eating. They make biscuits and tea for us to
eat, drinking and talking together. My children are young, a son of second grader, and a girl of third grader. So,
I have to guide them learning… sometimes my husband did not agree to let me to the meeting. Every time I
meet my friends at those meetings, I am very happy, reduces my homesickness. We exchange with each other
about work, family life, and especially happy if someone returns to Taiwan after a visiting native family, there
are many things to say.
Voice from Vietnamese spouses themselves reflected that the local government has not only created a useful
legal environment that facilitates the need for them to integrate into society but also organized activities to cater
to their spiritual needs. In a group discussion, a woman of 38 years old from Soc Trang province of Vietnam
told us that:

Proceeding of the 3rd International Conference on Education, Vol. 3, 2017, pp. 353-363
359
“My village was named “Taiwan Island” because roughly 90% its daughters married Taiwan husbands. We
have each other's phone numbers to contact. We often inform each other of new government regulations that
relate to us and all that is needed to help from our friends.”.
Another Vietnamese spouse of 36 years old, from Quang Ninh province said:
At first period, I did not know how to read Mandarin, just say a few sentences so it's totally up to the husband.
Since going to class of Mandarin, I feel comfortable and confident in communication with my husband, other
family members and neighbors. After 3 years, I was granted ID by local authorities. I studied a vocational
training course and now am a worker in a seafood processing facility. In Taiwan, anyone who wants to go to
work, regardless of job, must attend a vocational training.
A Vietnamese spouse of 49 years old, coming Taiwan from Phu Yen province said:
Most of rural Western Mekong Delta women married Taiwanese in Penghu. I told the newer the rules and
procedures of the Taiwan Government so that they can quickly get the certificate... I helped some women who
met difficult from their husbands by giving them civil statuses to my family so that they were eligible for ID. I
got some women to work in my restaurant when they have not found suitable jobs yet... With the support of
local authorities, I am mobilizing Vietnamese brides here to take place in community activities to meet the
requirements of local government for establishing the Vietnamese Association in Penghu…. Lecturers at the
National Penghu University are very enthusiastic in teaching classes for foreign women marrying Taiwanese.
They help us a lot. These short-term classes provide the basic knowledge necessary for those who want to go to
work. The government requires the certificates needed for each job….
The economic incorporation of Vietnamese immigrant spouses provided a useful illustration of whether migrant
networks can be beneficial. Along the street 111 Taiwan Taipei city, Shihlin District, Dexing East Road, there
are 10 food outlets/restaurants, of which about 50% are owned by Vietnamese immigrant spouses. Employers
often help newcomers by getting them to work for living. Each month they earn about 21 thousand Yuan,
working from 8 to 10 hours per day. Customers are both Vietnamese and local people. They come here not only
to eat Vietnamese dishes but also to meet and communicate to each other the experiences of success and failure.
This is evidence of the way in which immigrants have used their social networks and co-ethnic social capital to
participate in labor markets. Niche employment in retail, restaurants, and services (nail shop, etc.) are common
in Vietnamese immigrants female spouse here.
3.3. The social integration is reflected through: social-economic, culture integration and citizenship.
Traditional Vietnamese cooking skills are chosen first of all by many Vietnamese migrant spouses as a kind of
social capital for their access to the Taiwanese job market, even for social mobility.
Out of the 31 informants, 17 considered their earning ability had increased after their marriages. The latters
agreed that there were job opportunities in Taiwan came more easily regardless of their socio-economic
backgrounds and they were able to find work in spite of being limited in skills and education. However, they
all talked about the opportunities brought by mobility with what were socialized in Vietnam. Vietnamese
migrant spouses began running their own businesses in order to build up not only their financial basis to send
more money back to their natal families but also to elevate their social statuses from within Taiwan. Following
is story of Vietnamese migrant spouse as a case:
I was born in Phu Yen, Nha Trang province, Vietnam. Being the youngest in my family, I am loved by all.
Then, I and my family migrated to Saigon and traded. I was used to run a business of video cafes. Because of
the sad love story, I wanted to go away and then got married to Taiwanese man by my friend‟s introduction. My
husband‟ family was so poor. My children were young, the husband‟ younger sister gave a birth. My mother-in-

Le Thi Mai/Social Capital, Migration And Social Integration
360
law was sick and then, I alone had to take care daily for 4 children and an elderly in big family. After the death
of mother-in-law, we had no money, we were bickering each other daily, I decided to go outside to work.
I did not expect to get rich over night and would be satisfied with some money. It all depends on my work
hard. At that time, I worked all day for earning only 8,000 Yuan. Finally, to escape difficult poor life, I called
back my older brother in Vietnam to learn how to cook “Pho” a kind of Vietnamese traditional beef noodle for
sale. I rent this store just sell “Vietnam Pho Restaurant”, just look after the baby. Ten years ago, the store did
not have a restaurant brand. The “Pho” is cooked quality, customers like then, they go online advertising it... At
that time I have some acquaintances as the lecturers in National Penghu University (NPU), whenever the school
has any activities, I go there to cook or make Vietnamese dishes brought there inviting them to eat and to
advertise as well. Students and teachers there also advertised it, and the shop started to freeze. Taiwanese guests
write multiple postings. Many films about life of Vietnamese spouses in Taiwan are producted
(https://www.youtube.com/watch?v=2d-hTLHKteg, 2015,
https://www.youtube.com/watch?v=72cb50qy8Ic&t=60s.). I actively encourage Vietnamese women here and
join them in activities related to the local election event and organize parties for Christmas or Mid-Autumn
Festival for children. Especially now I am focusing on fulfilling the conditions for the establishment of the
Vietnamese Women's Union in Penghu.
Now it seems to say that difficulties have passed, I have fulfilled obligations to children and husband. I now
focus on how to earn enough money for my children to attend high quality schools. My son is in 9th grade 9 and
my daughter is 7th grade. What I possess today, besides my own efforts, results from the help of the kindhearted
Taiwanese, from the local government. I try my best to contribute to the development of the Vietnamese
community here as well as the Penghu community and Taiwan in general.
When doing fieldwork in community, one positive comment we often heard about Vietnamese spouses was
capable. In the traditional definition, capable mainly referred to a wife‟s excellent abilities and skills to
manage household chores and duties. However, in conversations with our informants, we found that in
addition to the traditional definition, capable was also associated with a Vietnamese spouse‟s ability to
make money. They were smarter at finding money though not all these wives came from prosperous
families. They had been aware of the opportunities brought by practice social capital for their access to the
Taiwanese job market and taken steps earlier than others to engage in relevant family businesses.
4. Conclusion and discussion
There are many researches related to Vietnamese spouses living in Taiwan. Most of them found negative
impressions of “foreign brides”, particularly those who come from relatively poorer countries. (Hsia, 2010,
Wang & Hsiao, 2009). Contrary to the most of results that explored in last researches, findings in this case
study have shown that what Vietnamese migrant spouses participated in this study need is a chance to create a
change for their better life. Migrant marriage was chosen as a means by them. Migration is becoming more and
more common in the globalized world. It is important then, is to understand how immigrants integrate into the
host and what makes sense is to create the affiliated conditions for migrants to integrate into the host for their
development so that they contribute effectively to the host society.
During the fieldwork we found that informants became more talkative and comfortable after having met
several of them together in their familiar environment. For example, the “Vietnam Pho Restaurant” run by a
Vietnamese spouse from Ho Chi Minh City near 北辰市場 (Beichen) Market was a popular place for
many Vietnamese spouses to hold regular or occasional parties and gatherings and exchanging gossip.
These events were good opportunities for us to make participant observations and to hear different voices
and stories from them.

Proceeding of the 3rd International Conference on Education, Vol. 3, 2017, pp. 353-363
361
Evidences from this study reflected Vietnamese migrant spouse‟s acumen in taking advantage of social capital
that was socialized in Vietnam and negotiating difficulties to integrate to the host. In public opinion,
Vietnamese spouses are often viewed as pragmatic women who care only about money rather than love. If
Vietnam spouses are looking for money, why would majority of them got married to poor rural Taiwanese men?
The intimate practices of these spouses within marriages have indicated that they are not country bumpkins but
women with both traditional and modern-oriented values. They are smart women who are aware of the market
logic and care a lot about filial daughter and self-development. Above all, they are aware that they can perform
their femininities as “Vietnamese brides” in this marriage to serve their ends. What “Vietnamese brides” care
about is not the exact amount of money but the future-orientated meanings associated with the money. This
could explain why some Vietnamese brides were satisfied with not so rich Taiwanese husbands. For them,
money is important but it is also relative although they try to grasp possible chances for better life.
Most of Vietnamese migrant spouses have shown great adaptability to new circumstances, successfully
renegotiating their identities in the host. The findings from interviewing these Vietnamese participants gained
more insight into the new social networks constructed by Vietnamese spouses from the dynamic of
empowering themselves through working or running their own businesses in the host society, and of creating a
wide variety of interactions with locals or local communities. In conversations, there is a strong desire for
development. Although many of these Vietnamese spouses had achieved certain benefits, opportunity, and
autonomy through their marriage mobility, gender had always been a vital factor in shaping their intimate
relationships and family responsibilities. Financial capability played an important role in affecting their
bargaining power within the marriage. The differences among Vietnamese spouses, in their varied marital
concerns and strategies were not only cultural, but also attributable to the material conditions under which
these relationships were forged and negotiated. Vietnamese spouses who did not get the marriage as their
expectation because of the reasons from Taiwanese husbands (such as domestic violent, unemployment,
sickness,…) were suffering for the happiness of their children. In the case of divorce, most of them are
responsible for raising children without any from their children‟s fathers.
Proccess of social integration of Vietnamese migrant spouses to Taiwan in this study supports claim of Kim Y
that, diaspora is a place of identity, living with, living through difference, and the diaspora are always
producing themselves anew. Identity is always in process, always constituted within and it must be
negotiated. The nature of diaspora involves identity as a subjective condition marked by contingency,
differences of power and position, internal differentiation, inner conflict and contestation, indeterminacy and
continual construction (Kim Y, 2011: 10). An immigrant‟s lack of citizenship may limit Vietnamese migrants
spouse‟s access to destination-country institutions and organizations. This limitation then, would be addressed
by government interventions in the capacity building for immigrants. It is hoped that these findings will
shed light on the difficulties of these Vietnamese migrant spouses and also benefit current and future
immigrants to overcome such difficulties and to better adjust themselves to living in Taiwan. Efforts to
overcome the difficulties and differences to integrate into the Taiwanese society of Vietnamese migrant
spouses is the source of inspiration of films and reporters,… Example: 澎湖另一種家鄉味 (Penghu - A
hometown flavor) producted by Ministry of Internal Affairs, Director: 陸孝文 (Luc Hieu Van), 2015,
https://www.youtube.com/watch?v=2d-hTLHKteg. The protagonist of the film is one of the Vietnamese
migrant spouses who participated in our survey. This film contributes to increase the reliability and vibrancy of
the findings of this article.
With the influx of new marriage immigrants coming to Taiwan since the 1990s, to help them to settle down in
Taiwan, it should be taken a bottom-up or grass-rooted approach through research and then action taken from
the results gathered from research and through focus on aspects such as the conditions for these Vietnamese
migrant spouses to engage in governmental activities and to develop more suitable methods to assist these
spouses in overcoming some of their current social problems such as mal-adjustment to a new society,

Le Thi Mai/Social Capital, Migration And Social Integration
362
something which definitely affects the value of their lives after emigrating to Taiwan. The results of this survey
also suggest the need for research and implementation of projects, such as the capacity building project for the
social integration of migrant women; Assess the socioeconomic contributions of immigrants to Taiwanese
society and the role of interventions and supporting of government in relation to immigrants‟ contributions to
individual and community development from a gender perspective.
Acknowledgements
This research is funded by the Foundation for Science and Technology Development of Ton Duc Thang
University (FOSTECT), website: http://fostect.tdt.edu.vn, under Grant FOSTECT.2015.BR.21. We also
appreciate and say thanks those Vietnamese women married Taiwanese men had agreed to participate in this
survey. We would also like to thank the help of our graduated students and colleagues in Taiwan. Without their
enthusiastic and effective cooperation, we could not carry out this study. We would like to express our sincere
thanks to Dr. Dominic Hewson, an Irish colleague for English editing and proofreading of this article.
References
Alberto Palloni, Douglas S. Massey, Miguel Ceballos, Kristin Espinosa, and Michael Spittel., 2001, Social
Capital and International Migration: A Test Using Information on Family Networks. American Journal of
Sociology, Vol. 106, No. 5 (March 2001), pp. 1262-1298.
Bosswick, W., & Heckmann, F., 2006, Integration of migrants: Contribution of local and regional authorities.
European Foundation for the Improvement of Living and Working Conditions.
Bourdieu, Pierre, and Loic Wacquant., 1992, An Invitation to Reflexive Sociology. Chicago: University of
Chicago Press.
Bourdieu, Pierre., 1986, “The Forms of Capital.” Pp. 241–58 in Handbook of Theory and Research for the
Sociology of Education, edited by John G. Richardson. NewYork: Greenwood Press.
Burt, R.S., 1997, "The Contingent Value of Social Capital." Administrative Science Quarterly 42, 339- 365.
Coleman, J.S., 1990, Foundations of Social Theory. Cambridge: Harvard University Press.
Coleman, James S. „Norms as Social Capital‟, in Gerard Radnitzky and Peter Bernholz (eds), Economic
Imperialism: The Economic Approach Applied Outside the Field of Economics, New York: Paragon House
Publisher. 1988; 133-55.
Dahinden, J., 2013, „Cities, migrant incorporation, and ethnicity: A network perspective on boundary work‟, Journal of International Migration and Integration, 14(1): 39-60.
Granovetter, M., 1973, „The strength of weak ties‟, American Journal of Sociology 78(6): 1360-1380.
Grzymała-Kazłowska., 2005, „From ethnic cooperation to in-group competition: undocumented Polish
workers in Brussels‟, Journal of Ethnic and Migration Studies, 31(4): 675-697.
Gunawan Prayitno, Kakuya Matsushima, Hayeong Jeong and Kiyoshi Kobayashi., 2014, Social Capital and
Migration in Rural Area Development. Procedia Environmental Sciences 20 (2014) 543 – 552.
Han-woo, L. & Cuong, B. T. (2015). Viẹt Nam – Hàn Quôc: Mọt phân tu thê ky chia se cùng phát triên Nhà
xuât ban Đai hoc quôc gia Tp. Hô Chí Minh (Vietnam – South Korean: A quarter of a century of shared
development. Publisher of Vietnam National University, Ho Chi Minh City)
Hsia, H.-C. (Ed.)., 2010, For better or for worse: Comparative research on equity and access for marriage
migratns. Hong Kong: Asia Pacific Mission For Migrants.
Kim, Y., 2011, Transnational migration, media and identity of Asian women:
diasporic daughters. New York: Routledge.

Proceeding of the 3rd International Conference on Education, Vol. 3, 2017, pp. 353-363
363
Kitching, J., Smallbone, D. and Athayde, R., 2009, „Ethnic diasporas and business competitiveness: minority-
owned enterprises in London‟, Journal of Ethnic and Migration Studies, 35(4): 689-705.
Koramaz, E. K., 2014, The spatial context of social integration. Social indicators research, 119 (1), 49-71
Le Thi Mai, 2014, Social Integration of Vietnamese People Residing Abroad. International Conference
Proceedings. ISBN: 978-969-9948-01-5. P. 534-577. http://www.globalilluminators.org/wp-content/uploads/2014/09/409.pdf.
Le Thi Mai, Bui Loan Thuy and Do Xuan Ha, 2017, Social Integration of Vietnamese Women Married to
Foreigners (Case Study in Penghu Islands and Taipei, Taiwan). Journal of Management and Marketing Review.
Vol 2 (1) 59 – 74 (2017). ISSN 0128-2603 © 2017.
Phan, A., Phan, Q. T., Nguyen, Q., 2005, Hiẹn tuơng phu nư Viẹt Nam lây chông Đài Loan. Thành phô Hô Chí
Minh. Nhà xuât ban Tre. (The phenomenon of Vietnam women married Taiwan Husband. Ho Chi Minh City.
Young Publisher)
Pengli HUANG (黄鹏丽), 2014, Gender, Mobility, and the Space in-between: Vietnamese Brides Negotiating the
Boundaries of Tradition and Modernity at the China-Vietnam Border. for the Degree of Doctor of Philosophy at
The University of Hong Kong. in November 2014
Portes, 1998, „Social capital: Its origins and applications in modern sociology‟, Annual Review of Sociology
24: 1-24.
Tien, C. Y., & Wang, H. Z., 2006, Masculinity and cross-border marriages: Why Taiwanese men seek
Vietnamese women to marry? Taiwan Journal of Southeast Asian Studies, 3(1), 1-36. (in Chinese)
Wang, H.-Z., & Hsiao, H.-H. M. (Eds.), 2009, Cross-border marriages with Asian Characteristics. Taipei,
Taiwan Academia Sinica, Center for Asia-Pacific Area studies
Wu, S., 2013, Talk of the Day -- Transnational marriages and divorce rate. Central News Agency.2013-08-26.
http://www.taiwannews.com.tw/etn/news_content.php?id=2287379
Yli-Renko, H., E. Autio, and H.J. Sapienza, 2001, "Social Capital, Knowledge Acquisition, and Knowledge
Exploitation in Young Technology-Based Firms". Strategic Management Journal 22, 587-613.
YU Teng-Huang, 2014, Vietnamese Spouses’ Cultural and Social Identity in Taiwan. A Dissertation for the
degree of Doctor of Philosophy in Asia Pacific Studies. Ritsumeikan Asia Pacific University. Beppu City,
Japan.
陸孝文 (Luc Hieu Van), 2015, 澎湖另一種家鄉味 (Penghu - A hometown flavor)
https://www.youtube.com/watch?v=2d-hTLHKteg; or https://www.youtube.com/watch?v=iDNvRanLSTs. Date
of access: 21/11/2015.
30分鐘 蜻蜓 https://www.youtube.com/watch?v=8X0iIKGpgDA Date of access: 21/11/2016.
10分鐘澎湖的家鄉味https://www.youtube.com/watch?v=72cb50qy8Ic&t=60s. Date of access: 21/11/2016.

Proceeding of the 3rd International Conference on Education, Vol. 3, 2017, pp. 364-372 Copyright © 2017 TIIKM ISSN 2424 - 6700 online DOI: https://doi.org/10.17501/icedu.2017.3136
3rd International Conference on Education, 20-22 April 2017, Kuala Lumpur, Malaysia
GRID METHOD APPROACH IN TEACHING BASIC
VECTOR CONCEPTS FOR FUNDAMENTAL PHYSICS
Nur Asyikin A.N1, M.I.M Yusof
2, Abu Hassan H.
3, N.A.Johari
4, Masnitamj
5 and
Raudzatul F6
1Centre of Foundation Studies, Universiti Teknologi MARA(UiTM), Malaysia 3Faculty of Applied Science, Universiti Teknologi MARA (UiTM), Malaysia
Abstract: Fundamental physics used a lot of basic vector concepts. Topics such as projectile motion, forces, momentum, static equilibrium and impulse require students to understand well the basic vector concepts. Many students have difficulty in understanding physics ideas and concepts because they could not grasp the vector concepts well. In this research, the grid method was introduced in teaching the vector concepts. Instructors would start with lecture on vectors and proceed with some exercises. The exercise requires the
students to get the answer using a grid paper facilitated by the instructors. A seven item quiz was applied as pre-post test in order to evaluate the effectiveness of this method compared to the normal method. Two sets of data were analysed using paired sample t-test. The first set of data comes from the experimental group which uses the new method and the second set of data comes from the control group which apply normal method in introducing the vectors. When comparing the mean scores, 5.74 mean score is for the experimental group while the control group scored a mean of 4.11. The gain score for the experimental was 0.7 while for the control group was 0.3. The post test for experimental correct responses is higher compared to the control group after the grid method was introduced. This shows that the learning gain is higher and students grasp the concepts well and improve their understanding on basic vector concepts when mean score
for students in experimental group is 5.25 while control group 4.43 from the final examination results that involve vector concept.
Keyword: Vector Concepts, Grid Method, Experimental Group, Control Group, Gain Score
I. Introduction
Vector is a mathematical concept that is integral in the learning of physics (Barniol & Zavala, 2014),(Buncher, 2015), (Meltzer, 2002), (Turnbull, Doughty, Sawtelle, & Caballero, 2015). Students may be able define vector as
a quantity having magnitude and direction, but majority of them failed to solve physics problems involving vector
concept (Barniol, 2014), (Kwon, 2013), (Barniol & Zavala, 2013). Since a substantial amount of the physics
contents are based on vector concepts (Pepper, Chasteen, Pollock, & Perkins, 2012), (Barniol et al., 2016),
(Zavala & Barniol, 2014), a lot of the students could not achieve a better grade or failed physics because they had
a lot of misconception of the vector‟s properties (Nguyen & Meltzer, 2003), (Kwon, 2013), (Barniol & Zavala,
2009). Another challenge faced by physics‟ teachers and lecturers in particular is the attention span of the Z
generation. Z generation also known as the post-millennial generation tend to have difficulties to focus for more
than three minutes, (Vallon, 2016), (Corey Seemiller, 2016), (Darnell, 2009) .Active learning is one of the best ways to engage this type of students in learning difficult concepts and ideas. Therefore, a strong understanding of
the vectors concept using a hands-on type of learning skill could solve the problem of learning physics
concept.(Darnell, 2009)
Vector concepts used a lot in Foundation studies syllabus. The topics that involved vectors include, motion in 1D
and 2D, Forces, Static Equilibrium, Momentum and Impuls, Electric and Magnetic, and Inductive. This shows
that vector contribute more than 70% in the syllabus. Therefore the basic vector concepts are very important for
the students to score their final examinations. At this institution, we prepare the students with strong foundation in
science and mathematics as a pre-requisite to enter universities. Students come from high school or equivalent to
GCE-O level. They have been exposed to vectors but lack the proper understanding of vectors. The topic of vector
is taught during the first and second weeks (3 – 4 hrs). During these hours of lecture and tutorial, students have to
quickly and effectively grasp the concept and ideas of vectors from definition till addition and subtraction of
vectors.
Most researchers used additional worksheet (Wutchana, Bunrangsri, & Emarat, 2015), (Barniol, 2016) to improve student‟s understanding on vector concept. Most of the questions have figures or illustrations of vectors based on
question with a single vector or multiple vectors(Wutchana et al., 2015), (Barniol, 2016). Some questions may
Corresponding Author: Nur Asyikin A.N/ [email protected]

Nur Asyikin A.N, M.I.M Yusof, Abu Hassan H., N.A.Johari, Masnitamj and Raudzatul F/Grid Method Approach in
Teaching Basic Vector Concepts for Fundamental Physics
365
require the students to sketch or draw the vectors on a plain paper, (Barniol, 2016)(Wutchana et al., 2015). In this
study, grid method was proposed for teaching and learning of vectors. Students will be engaged in active learning
throughout the lesson. In introducing this method, bear in mind that previous studies have shown that there are
four major concerns for instructors to take into consideration (Wutchana et al., 2015) :
1. Instructors should start with introducing the vector concept based on the definition of the vector itself and
briefly explain to students.
2. Instructors need to make students understand that a vector can be moved and while moving the magnitude
and the direction must be preserved.
3. While adding two or more vectors, one vector‟s tip must be attached to the other vector‟s tail
4. The resultant vector is drawn from the tail of the initial vector to the tip of the final vector.
Based on these four major concerns, new lecture notes and the guided questions of vector using the grid method were designed. Hoping that this method could help students learn physics more effectively and reduce the
difficulties in solving problems involving vector concept in topics such as forces, momentum, kinematics,
electricity and magnetism.
There were three major parts in the lecture notes. The instructor will first introduce the vector quantities in particular the understanding of the meaning of magnitude and direction of a vector and properties of vectors. The
second part is finding resultant of the vectors using addition of vectors. The third part demonstrates the difference
between addition and subtraction of vectors by using the same vectors (Nguyen & Meltzer, 2003).
The grid method consists of notes and exercises using grid paper. This grid method used to highlight the
mathematics concept behind the vector. This would be very useful for the students that having problems in
mathematics. Therefore when started with introducing the mathematics then the students have clear picture on the
basic vector concepts. This might help them to get more understanding the vector in physics and can easily solve
the problems or the applications in other physics concept which is base on the vector concept.
Different with the tradisional or nornal method, lecturers will directly introuced students with the physics by assuming the students already clear the mathematics behind the physics. The fact is, most of the students fail to
understand the physics concept and the application when they missed to understand the mathematics of the
physics.
This method would slowly solve this problems escpecially for students that are very weak in their mathematics.
Besides the exercise also will give more time for students to slowly understand the concept and use the concepts
tosolve problems for further lesson which involve the vector concepts.
Basic vector concept involved the addition and substraction where students also need to clear the characteristics of
the vector before able to solve the addition and substraction problems. Characteristics of a vetor is the magnitude
and the direction of the vector.
II. Methodology
Participants
In our institution, we have 75 classes. This method was used to two classes for control and two classes for experimental. Two different instructors will teach two different methods to their students. Total samples are 200
students involve for this research.
To investigate the effectiveness of using the grid method on teaching the vector concept, the students are placed
into two groups. The first group which is the control group is taught by an instructor using previous accepted
method of teaching vector concept. The second group is taught using the grid method.
A quiz consisting of seven questions were used as pre and post-test. The quiz was chosen based on the vector
concept covered for foundation levels (Nguyen & Meltzer, 2003) The questions were to evaluate the student‟s
understanding of magnitude and direction of the vectors, addition and subtraction of vectors and other properties
of vector.
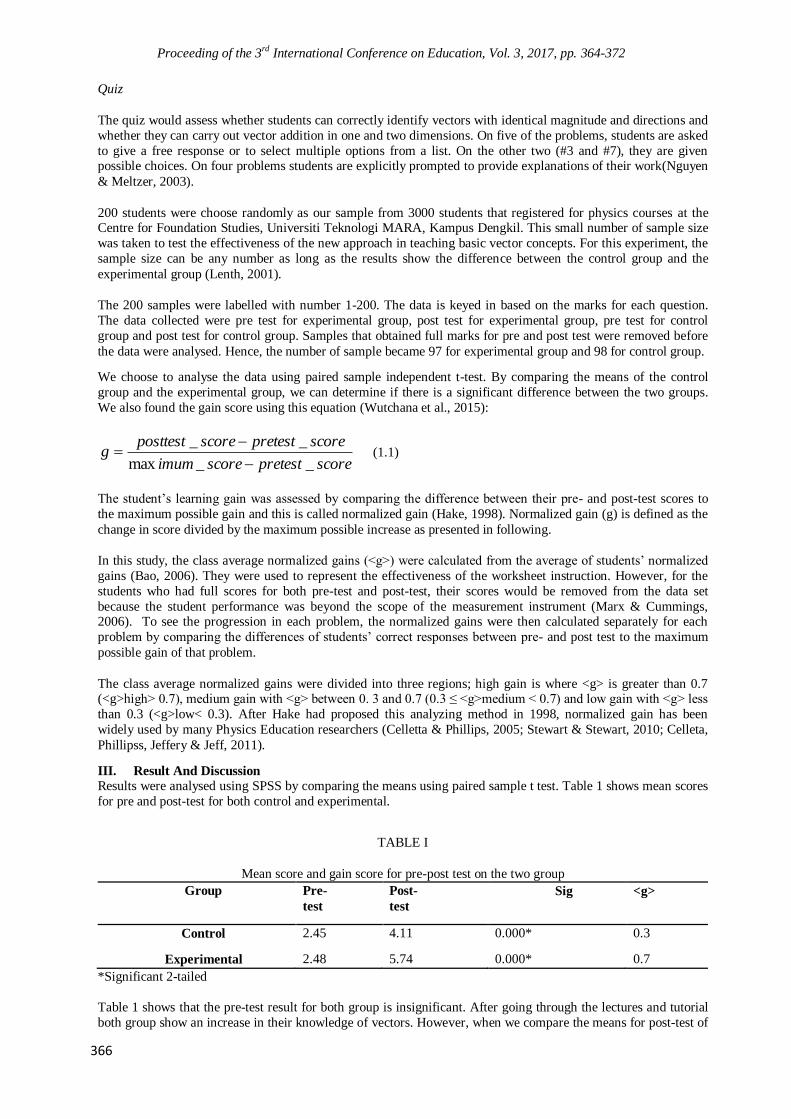
Proceeding of the 3rd International Conference on Education, Vol. 3, 2017, pp. 364-372
366
Quiz
The quiz would assess whether students can correctly identify vectors with identical magnitude and directions and
whether they can carry out vector addition in one and two dimensions. On five of the problems, students are asked
to give a free response or to select multiple options from a list. On the other two (#3 and #7), they are given possible choices. On four problems students are explicitly prompted to provide explanations of their work(Nguyen
& Meltzer, 2003).
200 students were choose randomly as our sample from 3000 students that registered for physics courses at the Centre for Foundation Studies, Universiti Teknologi MARA, Kampus Dengkil. This small number of sample size
was taken to test the effectiveness of the new approach in teaching basic vector concepts. For this experiment, the
sample size can be any number as long as the results show the difference between the control group and the
experimental group (Lenth, 2001).
The 200 samples were labelled with number 1-200. The data is keyed in based on the marks for each question.
The data collected were pre test for experimental group, post test for experimental group, pre test for control
group and post test for control group. Samples that obtained full marks for pre and post test were removed before
the data were analysed. Hence, the number of sample became 97 for experimental group and 98 for control group.
We choose to analyse the data using paired sample independent t-test. By comparing the means of the control
group and the experimental group, we can determine if there is a significant difference between the two groups.
We also found the gain score using this equation (Wutchana et al., 2015):
scorepretestscoreimum
scorepretestscoreposttestg
__max
__
(1.1)
The student‟s learning gain was assessed by comparing the difference between their pre- and post-test scores to
the maximum possible gain and this is called normalized gain (Hake, 1998). Normalized gain (g) is defined as the
change in score divided by the maximum possible increase as presented in following.
In this study, the class average normalized gains (<g>) were calculated from the average of students‟ normalized
gains (Bao, 2006). They were used to represent the effectiveness of the worksheet instruction. However, for the
students who had full scores for both pre-test and post-test, their scores would be removed from the data set
because the student performance was beyond the scope of the measurement instrument (Marx & Cummings, 2006). To see the progression in each problem, the normalized gains were then calculated separately for each
problem by comparing the differences of students‟ correct responses between pre- and post test to the maximum
possible gain of that problem.
The class average normalized gains were divided into three regions; high gain is where <g> is greater than 0.7 (<g>high> 0.7), medium gain with <g> between 0. 3 and 0.7 (0.3 ≤ <g>medium < 0.7) and low gain with <g> less
than 0.3 (<g>low< 0.3). After Hake had proposed this analyzing method in 1998, normalized gain has been
widely used by many Physics Education researchers (Celletta & Phillips, 2005; Stewart & Stewart, 2010; Celleta,
Phillipss, Jeffery & Jeff, 2011).
III. Result And Discussion
Results were analysed using SPSS by comparing the means using paired sample t test. Table 1 shows mean scores
for pre and post-test for both control and experimental.
TABLE I
Mean score and gain score for pre-post test on the two group
Group Pre-
test
Post-
test
Sig <g>
Control 2.45 4.11 0.000* 0.3
Experimental 2.48 5.74 0.000* 0.7
*Significant 2-tailed
Table 1 shows that the pre-test result for both group is insignificant. After going through the lectures and tutorial
both group show an increase in their knowledge of vectors. However, when we compare the means for post-test of
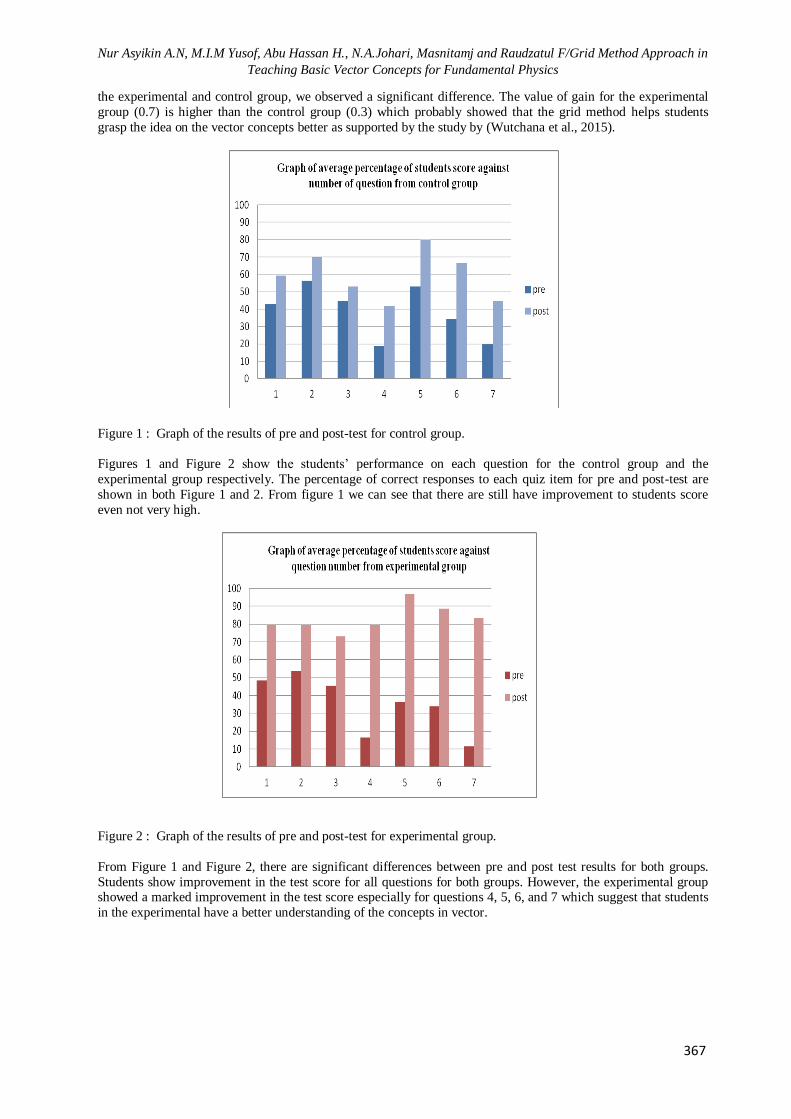
Nur Asyikin A.N, M.I.M Yusof, Abu Hassan H., N.A.Johari, Masnitamj and Raudzatul F/Grid Method Approach in
Teaching Basic Vector Concepts for Fundamental Physics
367
the experimental and control group, we observed a significant difference. The value of gain for the experimental
group (0.7) is higher than the control group (0.3) which probably showed that the grid method helps students
grasp the idea on the vector concepts better as supported by the study by (Wutchana et al., 2015).
Figure 1 : Graph of the results of pre and post-test for control group.
Figures 1 and Figure 2 show the students‟ performance on each question for the control group and the
experimental group respectively. The percentage of correct responses to each quiz item for pre and post-test are
shown in both Figure 1 and 2. From figure 1 we can see that there are still have improvement to students score
even not very high.
Figure 2 : Graph of the results of pre and post-test for experimental group.
From Figure 1 and Figure 2, there are significant differences between pre and post test results for both groups.
Students show improvement in the test score for all questions for both groups. However, the experimental group showed a marked improvement in the test score especially for questions 4, 5, 6, and 7 which suggest that students
in the experimental have a better understanding of the concepts in vector.
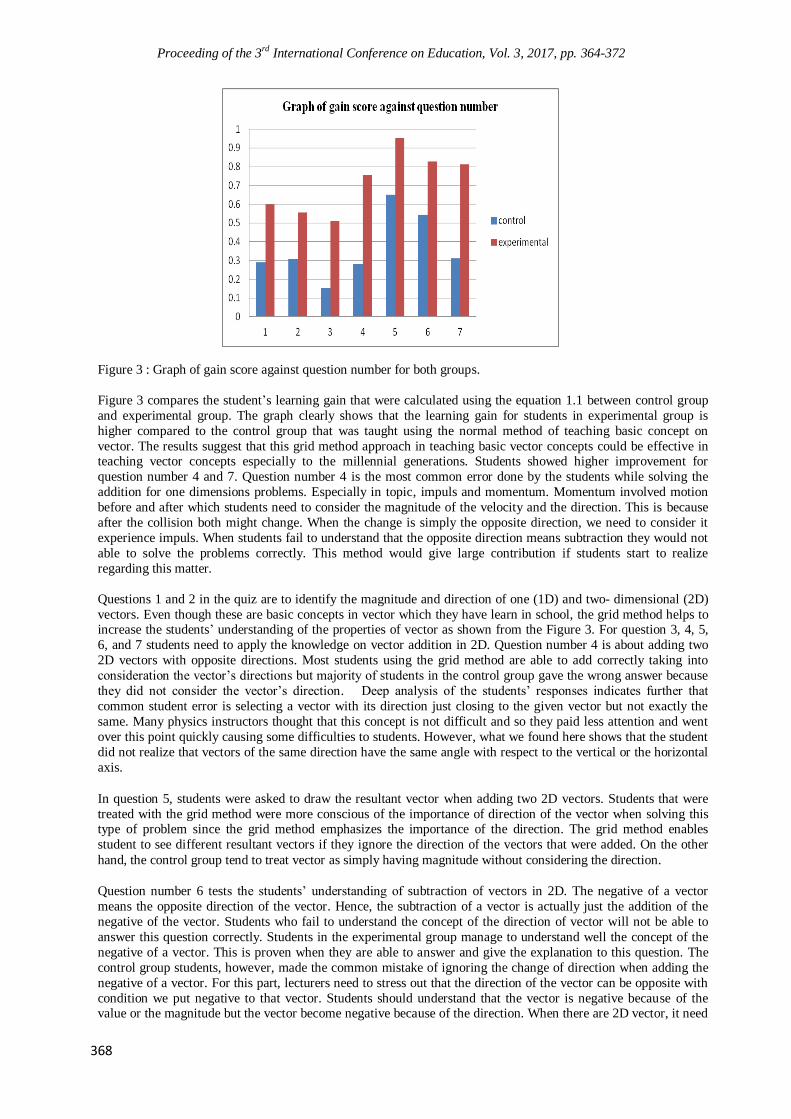
Proceeding of the 3rd International Conference on Education, Vol. 3, 2017, pp. 364-372
368
Figure 3 : Graph of gain score against question number for both groups.
Figure 3 compares the student‟s learning gain that were calculated using the equation 1.1 between control group
and experimental group. The graph clearly shows that the learning gain for students in experimental group is
higher compared to the control group that was taught using the normal method of teaching basic concept on
vector. The results suggest that this grid method approach in teaching basic vector concepts could be effective in teaching vector concepts especially to the millennial generations. Students showed higher improvement for
question number 4 and 7. Question number 4 is the most common error done by the students while solving the
addition for one dimensions problems. Especially in topic, impuls and momentum. Momentum involved motion
before and after which students need to consider the magnitude of the velocity and the direction. This is because
after the collision both might change. When the change is simply the opposite direction, we need to consider it
experience impuls. When students fail to understand that the opposite direction means subtraction they would not
able to solve the problems correctly. This method would give large contribution if students start to realize
regarding this matter.
Questions 1 and 2 in the quiz are to identify the magnitude and direction of one (1D) and two- dimensional (2D)
vectors. Even though these are basic concepts in vector which they have learn in school, the grid method helps to increase the students‟ understanding of the properties of vector as shown from the Figure 3. For question 3, 4, 5,
6, and 7 students need to apply the knowledge on vector addition in 2D. Question number 4 is about adding two
2D vectors with opposite directions. Most students using the grid method are able to add correctly taking into
consideration the vector‟s directions but majority of students in the control group gave the wrong answer because
they did not consider the vector‟s direction. Deep analysis of the students‟ responses indicates further that
common student error is selecting a vector with its direction just closing to the given vector but not exactly the
same. Many physics instructors thought that this concept is not difficult and so they paid less attention and went
over this point quickly causing some difficulties to students. However, what we found here shows that the student
did not realize that vectors of the same direction have the same angle with respect to the vertical or the horizontal
axis.
In question 5, students were asked to draw the resultant vector when adding two 2D vectors. Students that were
treated with the grid method were more conscious of the importance of direction of the vector when solving this type of problem since the grid method emphasizes the importance of the direction. The grid method enables
student to see different resultant vectors if they ignore the direction of the vectors that were added. On the other
hand, the control group tend to treat vector as simply having magnitude without considering the direction.
Question number 6 tests the students‟ understanding of subtraction of vectors in 2D. The negative of a vector
means the opposite direction of the vector. Hence, the subtraction of a vector is actually just the addition of the
negative of the vector. Students who fail to understand the concept of the direction of vector will not be able to
answer this question correctly. Students in the experimental group manage to understand well the concept of the
negative of a vector. This is proven when they are able to answer and give the explanation to this question. The
control group students, however, made the common mistake of ignoring the change of direction when adding the
negative of a vector. For this part, lecturers need to stress out that the direction of the vector can be opposite with
condition we put negative to that vector. Students should understand that the vector is negative because of the value or the magnitude but the vector become negative because of the direction. When there are 2D vector, it need

Nur Asyikin A.N, M.I.M Yusof, Abu Hassan H., N.A.Johari, Masnitamj and Raudzatul F/Grid Method Approach in
Teaching Basic Vector Concepts for Fundamental Physics
369
to be resolve and from the resolution vector students suppose know whether the vector is negative or positive for
each component.
The concept that was tested in question 7 was on the method of adding 2D vectors using either head to tail method or parallelogram method. Grid method encourage students to use head to tail method to find the resultant vector.
Before using head to tail method they need to understand that when moving or translating a vector, the direction
and magnitude is still preserved. For the control group, they were not able to apply the methods.
This study were extended further by looking at the students‟ performance in their final examination. The students
score for questions related to the application of vectors normalized to be comparable to the mean score as in Table
1. Interestingly, the experimental group of students obtained a mean score of 5.25 while the control group
obtained a mean score of 4.43. This result shows an almost similar score to the post-test for both control and
experimental group.
IV. CONCLUSION
The results clearly show that the weakness of students in understanding vector concepts lie in the difficulty to imagine or correctly define the direction of a vector. The grid method has been shown to increase the student‟s
awareness and understanding of the importance of the direction of a vector. The successful of this method not
solely on the method but include the active learning that involved when students hands on doing the exercise
together with their lecturers. This method involved two ways interactions which make students would not feel
bored. This early intervention of sensing the importance of both properties of vectors will help the students in
solving vector problem in forces, momentum, motion in one and two dimension and so forth. Therefore, grid
method would be the simplest way in introducing vector concept at the introductory level of physics. We believe
that when the basic vector concept is clear, then the students will be better prepared to face more challenging
problems on vectors. This method, however still needs more research to prove its effectiveness.
Acknowledgement
This research was carried out under the grant sponsored by Universiti Teknologi MARA: 600-RMI/DANA 5/3/ARAS (50/2015). The authors are thankful to UiTM for giving young researchers the opportunity to find new
methods to improve teaching and learning. Special mention and appreciation also to the two instructors that help
implement this method when teaching vectors in their class.
References
Barniol, P. (2016). A Tutorial Worksheet to Help Students Develop the Ability to Interpret the Dot Product as a A
Tutorial Worksheet to Help Students Develop the Ability to Interpret the Dot Product as a Projection, (August).
Barniol, P., & Zavala, G. (n.d.). Students ‟ Difficulties with Unit Vectors and Scalar Multiplication of a Vector.
Barniol, P., & Zavala, G. (2009). Investigation of Students ‟ Preconceptions and Difficulties with the Vector
Direction Concept at a Mexican University.
Barniol, P., & Zavala, G. (2013). Testing Students ‟ Understanding of Vector Concepts, 65–68.
Buncher, J. B. (2015). Algebra-Based Students and Vector Representations : Arrow vs . ijk.
Corey Seemiller, M. G. (2016). Generation Z Goes to College. wiley.
Darnell, B. (n.d.). Teaching and Learning: The Millenials and Generation Z.
Engelhardt, P. V. (n.d.). An Introduction to Classical Test Theory as Applied to Conceptual Multiple-choice Tests
Abstract :, 1–40.
Hawkins, J. M., Thompson, J. R., Wittmann, M. C., Eleanor, C., & Frank, B. W. (n.d.). Students ‟ Responses To
Different Representations Of A Vector Addition Question.
Kwon, O. (2013). Conceptualizing vectors in college geometry: a new framework for analysis of student
approaches and difficulties. Conference on Research in Undergraduate Mathematics Education: Crume Xvi, 2,
555–565.

Proceeding of the 3rd International Conference on Education, Vol. 3, 2017, pp. 364-372
370
Lenth, R. V. (2001). Some Practical Guidelines for Effective Sample Size Determination. The American
Statistician, 55(3), 187–193.
Meltzer, D. E. (2002). The relationship between mathematics preparation and conceptual learning gains in
physics : A possible “„ hidden variable ‟” in diagnostic pretest scores, 1259–1268.
Nguyen, N., & Meltzer, D. E. (2003). Initial understanding of vector concepts among students in introductory
physics courses, (February 2002), 630–638.
Pepper, R. E., Chasteen, S. V, Pollock, S. J., & Perkins, K. K. (2012). Observations on student difficulties with
mathematics in upper-division electricity and magnetism, 10111, 1–15.
Barniol., Topics, S., & Tecnol, G. Z. (2014). Force , velocity , and work : The effects of different contexts on
students ‟ understanding of vector concepts using isomorphic problems,
Shaffer, P. S., & Mcdermott, L. C. (2005). A research-based approach to improving student understanding of the
vector nature of kinematical concepts Vectors and Operational Definitions, 921–931.
Southey, P., & Allie, S. (2014). Vector Addition in Different Contexts Follow up Interviews, 243–246.
Turnbull, A., Doughty, L., Sawtelle, V., & Caballero, M. D. (2015). Student Ideas around Vector Decomposition
in the Upper Division, 2–5.
Vallon, D. (2016). Agents of Social Change: A Model for Targeting And Engaging Generation Z across
Platforms. Advertising Research, 56(4), 112–118.
Wutchana, U., Bunrangsri, K., & Emarat, N. (2015). Teaching Basic Vector Concepts : A Worksheet for the
Recovery of Students ‟ Vector Understanding, 7(1), 18–28.
Zavala, G., & Barniol, P. (n.d.). Students ‟ Understanding of Dot Product as a Projection in No-context , Work
and Electric Flux Problems.
Appendix

Nur Asyikin A.N, M.I.M Yusof, Abu Hassan H., N.A.Johari, Masnitamj and Raudzatul F/Grid Method Approach in
Teaching Basic Vector Concepts for Fundamental Physics
371
Vector concept Quiz
Name: ___________________ Student ID:_____________________
Class: _____________________
1. Consider the list below and write down all vectors that have the same magnitudes as each other. For
instance if vectors W and X had the same magnitude, and the vectors Y, Z and A had the same magnitude as each
other (but different from W and X) then you should write the following : W=X, Y=Z=A.
A B C D E F G H I
2. List all the vectors that have the same direction as the first vector listed, A. if there are none please explain
why.
A B C D E F G
Answer :___________________ Explain ___________________
3. Below are shown vectors A and B. consider R, the vector sum (the “resultant”) of A and B, where R=A+B.
which of the four other vectors shown (C,D,E,F) has most nearly the same direction as R?
A C D E F
B
Answer: _________________________
4. In the space to the right, draw R where R=A+B. Clearly label it as vector R. explain your work.
A
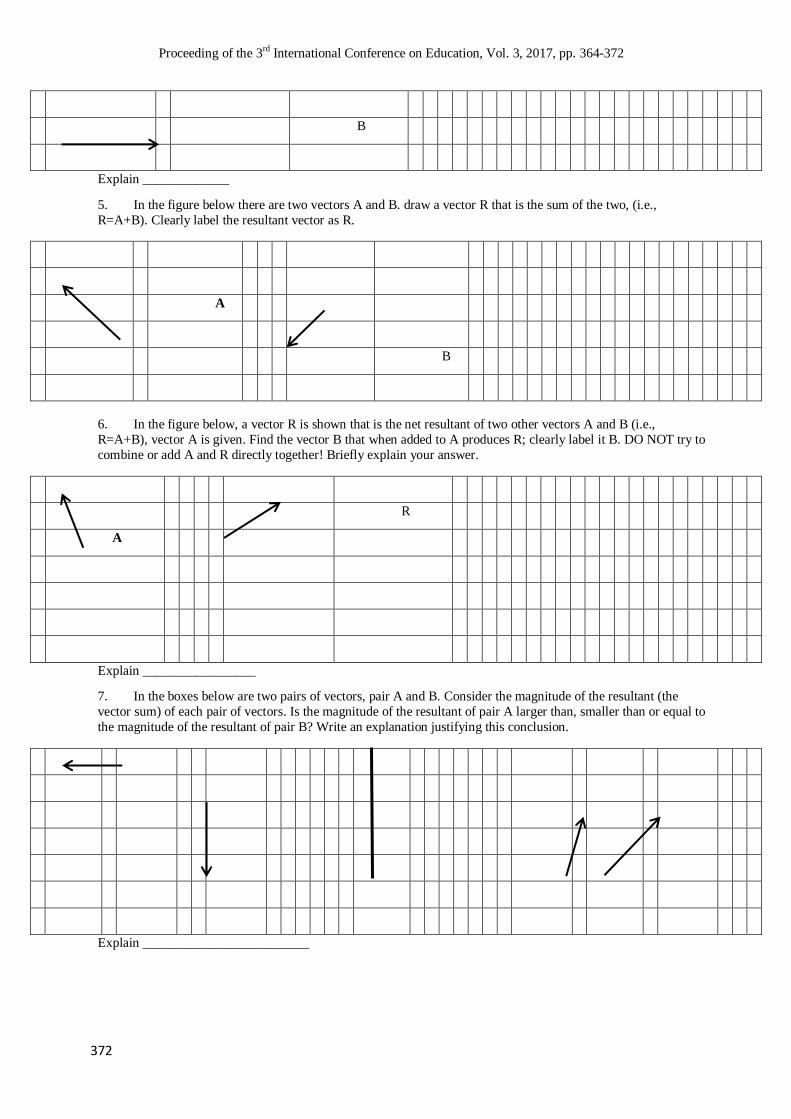
Proceeding of the 3rd International Conference on Education, Vol. 3, 2017, pp. 364-372
372
B
Explain _____________
5. In the figure below there are two vectors A and B. draw a vector R that is the sum of the two, (i.e.,
R=A+B). Clearly label the resultant vector as R.
A
B
6. In the figure below, a vector R is shown that is the net resultant of two other vectors A and B (i.e.,
R=A+B), vector A is given. Find the vector B that when added to A produces R; clearly label it B. DO NOT try to
combine or add A and R directly together! Briefly explain your answer.
R
A
Explain _________________
7. In the boxes below are two pairs of vectors, pair A and B. Consider the magnitude of the resultant (the
vector sum) of each pair of vectors. Is the magnitude of the resultant of pair A larger than, smaller than or equal to
the magnitude of the resultant of pair B? Write an explanation justifying this conclusion.
A
B
B A
Explain _________________________

Proceeding of the 3rd International Conference on Education, Vol. 3, 2017, pp. 373-380 Copyright © 2017 TIIKM ISSN 2424 - 6700 online DOI: https://doi.org/10.17501/icedu.2017.3137
3rd
International Conference on Education, 20-22 April 2017, Kuala Lumpur, Malaysia
NURTURING PROACTIVE, CREATIVE AND
COMMUNICATIVE LEARNERS THROUGH SOCIAL MEDIA
Christopher Pang, Xiu Er, Chuang and Christian Chia
Nanyang Polytechnic, Singapore
Abstract: The study investigates the effectiveness of using social media, within a self-determined or
personalised learning environment, to nurture proactive, creative, and communicative learners with
high self-efficacy and autonomy. Research has shown that interactivity, collaboration, learner
negotiation and personalisation enabled by Web 2.0 can spur developmental growth of
communication skills. Using a quasi-experiment with pre- and post-tests involving 184 business
students taking Effective Writing Skills, the study found that a self-determined, personalised learning
environment resulted in students demonstrating higher levels of pro-activity, autonomy and creativity
that contributed to the growth of communication capabilities, when compared to control groups. It
was also noted that peer influence could significantly affect communication outcomes in a social
media enhanced learning environment. This study is significant because it examines how
communication skills can be developed through the educational use of social media. It also addresses
the demand to produce graduates with strong communicative skills. The research outcomes of this
study can inform pedagogical practice in preparing future-ready articulate graduates.
Keywords: Social Media, Self-Determined Learning, Learner Autonomy, Writing Skills
Introduction
Communication skills, as defined as oral and written abilities, have been repeatedly flagged by employers and
even members of parliament, as generally lacking in local tertiary graduates – a problem that is experienced by
both universities and polytechnics in Singapore. Thus, there is an urgent need to address the achievement gap in
linguistic productive skills, particularly at the tertiary level. Strong communication skills remain a desired
competence employers want, especially in a highly connected and always connected workplace. The workplace
is also evolving as organisationsutilise a plethora of technologies across a wide spectrum of industries, sectors
and roles. A future-ready graduate thus, has to cope not only with a fast changing economic landscape but also
with one where technology is used pervasively. Communication skills as well as digital literacy skills are so
tightly intertwined to the extent that they almost need to be taught as a unified whole. The educational use of
social media, therefore, has a role in this new future state of affairs. This is significant as strong communication
skills are a critical attribute of a future-ready graduate.
A review of current research suggests that proactivity and interactivity, which are dimensions associated with
Web 2.0, can spur further developmental growth in communicative abilities (Kao and Craigie, 2014;
Suthiwartnarueput and Wasanasomsithi, 2012; Yu, 2014). Communication skills also require self-practice,
which underpins the importance of learner autonomy (Omar, Embi and Yunus, 2012), where learners are
required to take responsibility of their learning. The advent of Web 2.0 also requires a shift towards
personalisation if students are to become strong communicators. So, a pedagogical model that addresses the
achievement gap in communication skills could potentially lead to more articulate graduates. Therefore,
exploring pedagogical approaches that support self-determined and personalised learning are critical in
achieving identified outcomes and desired competencies. Self-determined and personalised learning share a
natural affinity with learning via social media or new media. This is because of social media’s ability to
engender expressiveness and develop authorial voices, which is key to becoming proficient communicators.
Most students are also bored with school. The repetitive nature of school and its predictable routines may build
discipline but it may also contribute to rote, and almost robotic learning (Kao and Craigie, 2014). Allowing
students a greater say in their own education, makes it more personalised, which could potentially lead to
students taking a more active, rather than passive role in learning. Hence, this research can potentially transform
learning about language and communication at the tertiary level.
Corresponding Author:Christopher Pang / [email protected]
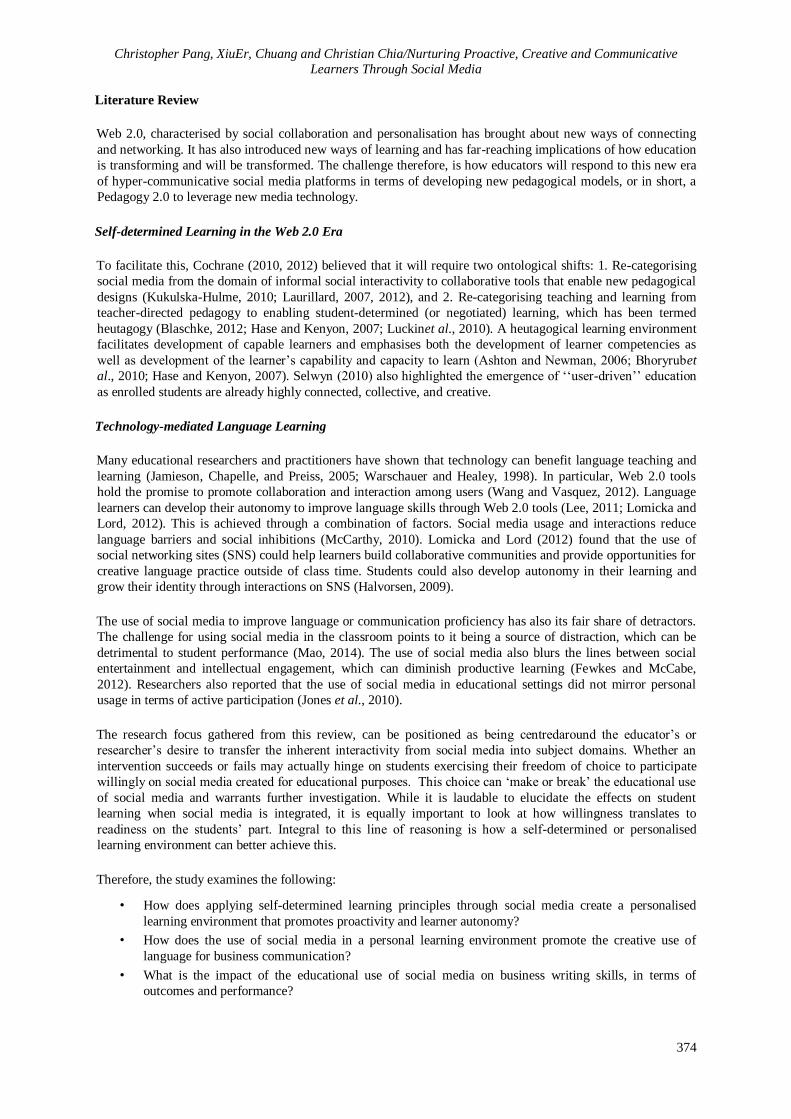
Christopher Pang, XiuEr, Chuang and Christian Chia/Nurturing Proactive, Creative and Communicative
Learners Through Social Media
374
Literature Review
Web 2.0, characterised by social collaboration and personalisation has brought about new ways of connecting
and networking. It has also introduced new ways of learning and has far-reaching implications of how education
is transforming and will be transformed. The challenge therefore, is how educators will respond to this new era
of hyper-communicative social media platforms in terms of developing new pedagogical models, or in short, a
Pedagogy 2.0 to leverage new media technology.
Self-determined Learning in the Web 2.0 Era
To facilitate this, Cochrane (2010, 2012) believed that it will require two ontological shifts: 1. Re-categorising
social media from the domain of informal social interactivity to collaborative tools that enable new pedagogical
designs (Kukulska-Hulme, 2010; Laurillard, 2007, 2012), and 2. Re-categorising teaching and learning from
teacher-directed pedagogy to enabling student-determined (or negotiated) learning, which has been termed
heutagogy (Blaschke, 2012; Hase and Kenyon, 2007; Luckinet al., 2010). A heutagogical learning environment
facilitates development of capable learners and emphasises both the development of learner competencies as
well as development of the learner’s capability and capacity to learn (Ashton and Newman, 2006; Bhoryrubet
al., 2010; Hase and Kenyon, 2007). Selwyn (2010) also highlighted the emergence of ‘‘user-driven’’ education
as enrolled students are already highly connected, collective, and creative.
Technology-mediated Language Learning
Many educational researchers and practitioners have shown that technology can benefit language teaching and
learning (Jamieson, Chapelle, and Preiss, 2005; Warschauer and Healey, 1998). In particular, Web 2.0 tools
hold the promise to promote collaboration and interaction among users (Wang and Vasquez, 2012). Language
learners can develop their autonomy to improve language skills through Web 2.0 tools (Lee, 2011; Lomicka and
Lord, 2012). This is achieved through a combination of factors. Social media usage and interactions reduce
language barriers and social inhibitions (McCarthy, 2010). Lomicka and Lord (2012) found that the use of
social networking sites (SNS) could help learners build collaborative communities and provide opportunities for
creative language practice outside of class time. Students could also develop autonomy in their learning and
grow their identity through interactions on SNS (Halvorsen, 2009).
The use of social media to improve language or communication proficiency has also its fair share of detractors.
The challenge for using social media in the classroom points to it being a source of distraction, which can be
detrimental to student performance (Mao, 2014). The use of social media also blurs the lines between social
entertainment and intellectual engagement, which can diminish productive learning (Fewkes and McCabe,
2012). Researchers also reported that the use of social media in educational settings did not mirror personal
usage in terms of active participation (Jones et al., 2010).
The research focus gathered from this review, can be positioned as being centredaround the educator’s or
researcher’s desire to transfer the inherent interactivity from social media into subject domains. Whether an
intervention succeeds or fails may actually hinge on students exercising their freedom of choice to participate
willingly on social media created for educational purposes. This choice can ‘make or break’ the educational use
of social media and warrants further investigation. While it is laudable to elucidate the effects on student
learning when social media is integrated, it is equally important to look at how willingness translates to
readiness on the students’ part. Integral to this line of reasoning is how a self-determined or personalised
learning environment can better achieve this.
Therefore, the study examines the following:
• How does applying self-determined learning principles through social media create a personalised
learning environment that promotes proactivity and learner autonomy?
• How does the use of social media in a personal learning environment promote the creative use of
language for business communication?
• What is the impact of the educational use of social media on business writing skills, in terms of
outcomes and performance?

Proceeding of the 3rd International Conference on Education, Vol. 3, 2017, pp. 373-380
375
Methodology
The study involved an intervention and used a quasi-experiment design with pre- and post-tests and a control
group. Eight Year One classes from a polytechnic in Singapore taking Effective Writing Skills were involved in
the study. Four classes were assigned as experimental groups while the remaining groups acted as the control
groups. The experimental groups received the intervention while the control groups received traditional
instruction. The class sizes were similar at between 21 to 24 students per class. Full-time tutors with at least
three years’ experience taught these classes. Students were of similar profiles at ages between 18 to 22 years old
and have passed a standardised English as a First Language test at the secondary level.
The pre- and post-tests were timed writing proficiency tests scored using rubrics. In the pre-test, students had to
identify errors and edit a passage in 60 mins. In the post-test, students completed two professional writing tasks.
Two self-reported questionnaires were administered at the start and at the end of the intervention. The first
questionnaire measured social media habits and self-perceived language proficiency, learning preferences and
self-directedness characteristics. The second questionnaire measured levels of proactivity and self-determined
learning characteristics. In addition, the post-tests on professional writing proficiency were also coded for
creative expression through content analysis.
Intervention Design
This study uses an intervention that incorporated self-determined learning principles to allow for a personalised
learning environment mediated by social media. The intervention lasted eight weeks and covered professional
writing. The control groups continued with the traditional, diathetic face-to-face tutorials with classroom
activities and elearning modules hosted on Blackboard (a learning management system). The intervention was
developed based on Blaschke and Kenyon’s design guidelines (2016) that advocated:
• A degree of ownership to determine what and how they learn (this itself a Web 2.0
characteristic);
• The opportunity to negotiate the nature of assignments to complete;
• The opportunity to co-create new learning activities, with the tutor as a facilitator;
• A personal learning environment that is technology-mediated;
• Embracing technology and use of social media’s collaborative tools to achieve negotiated
goals;
• Self-assessment their own learning progress through reflective practice Table 1 shows the
transformed learning intervention.
Table 1 Self-determined versus traditional learning design.
- Self-determined
- Learning Contract - Explanation of Writing Principles and Strategies
- Explanation of Writing Principles and Strategies - Facilitated Writing Coaching Sessions
- Facilitated Writing Coaching Sessions - Review of Reference Text Examples
- Online Review of Professional Writing - Tutor-led Practice Exercises
- Democratic Decision to Decide Class Delivery - Discussion of Past Test Questions
Dates and Formats
- Co-created Learning
- Online and In-class Student-led Practice Exercises
- Online and In-class Discussion for Past Test Questions
- Online Self-Reflection
- Traditional
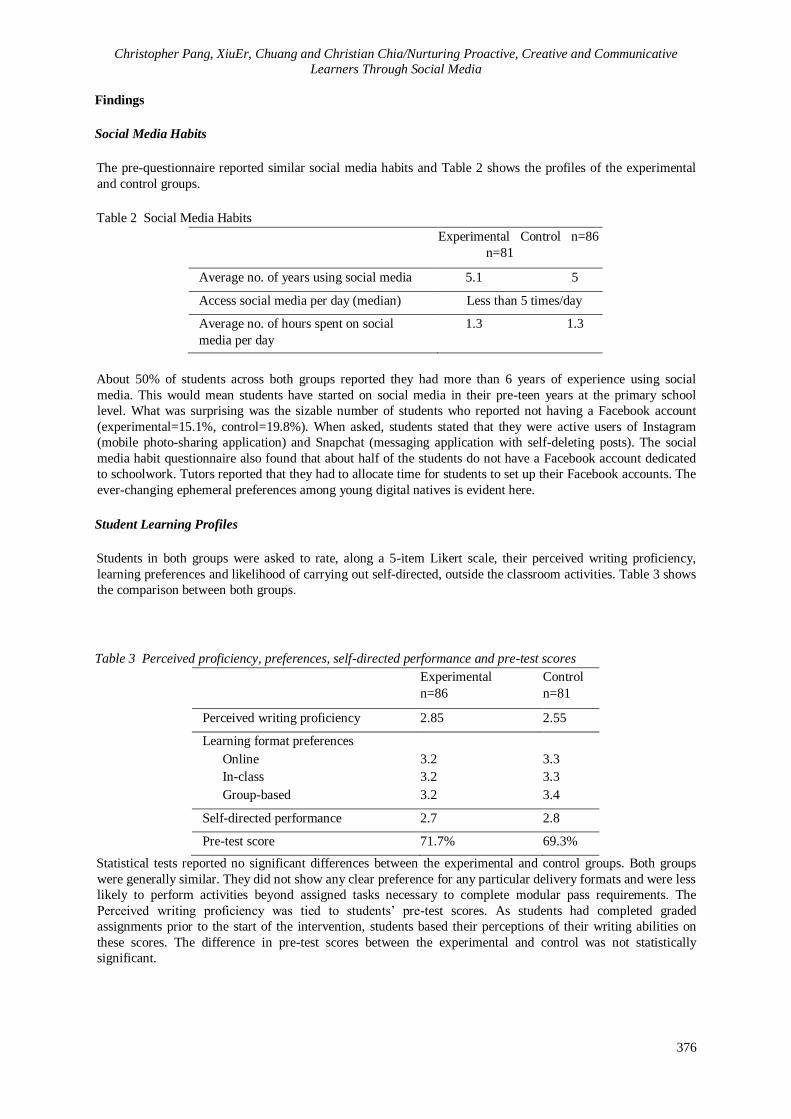
Christopher Pang, XiuEr, Chuang and Christian Chia/Nurturing Proactive, Creative and Communicative
Learners Through Social Media
376
Findings
Social Media Habits
The pre-questionnaire reported similar social media habits and Table 2 shows the profiles of the experimental
and control groups.
Table 2 Social Media Habits
Experimental Control n=86
n=81
Average no. of years using social media 5.1 5
Access social media per day (median) Less than 5 times/day
Average no. of hours spent on social
media per day
1.3 1.3
About 50% of students across both groups reported they had more than 6 years of experience using social
media. This would mean students have started on social media in their pre-teen years at the primary school
level. What was surprising was the sizable number of students who reported not having a Facebook account
(experimental=15.1%, control=19.8%). When asked, students stated that they were active users of Instagram
(mobile photo-sharing application) and Snapchat (messaging application with self-deleting posts). The social
media habit questionnaire also found that about half of the students do not have a Facebook account dedicated
to schoolwork. Tutors reported that they had to allocate time for students to set up their Facebook accounts. The
ever-changing ephemeral preferences among young digital natives is evident here.
Student Learning Profiles
Students in both groups were asked to rate, along a 5-item Likert scale, their perceived writing proficiency,
learning preferences and likelihood of carrying out self-directed, outside the classroom activities. Table 3 shows
the comparison between both groups.
Table 3 Perceived proficiency, preferences, self-directed performance and pre-test scores
Experimental
n=86
Control
n=81
Perceived writing proficiency 2.85 2.55
Learning format preferences
Online
In-class
Group-based
3.2
3.2
3.2
3.3
3.3
3.4
Self-directed performance 2.7 2.8
Pre-test score 71.7% 69.3%
Statistical tests reported no significant differences between the experimental and control groups. Both groups
were generally similar. They did not show any clear preference for any particular delivery formats and were less
likely to perform activities beyond assigned tasks necessary to complete modular pass requirements. The
Perceived writing proficiency was tied to students’ pre-test scores. As students had completed graded
assignments prior to the start of the intervention, students based their perceptions of their writing abilities on
these scores. The difference in pre-test scores between the experimental and control was not statistically
significant.
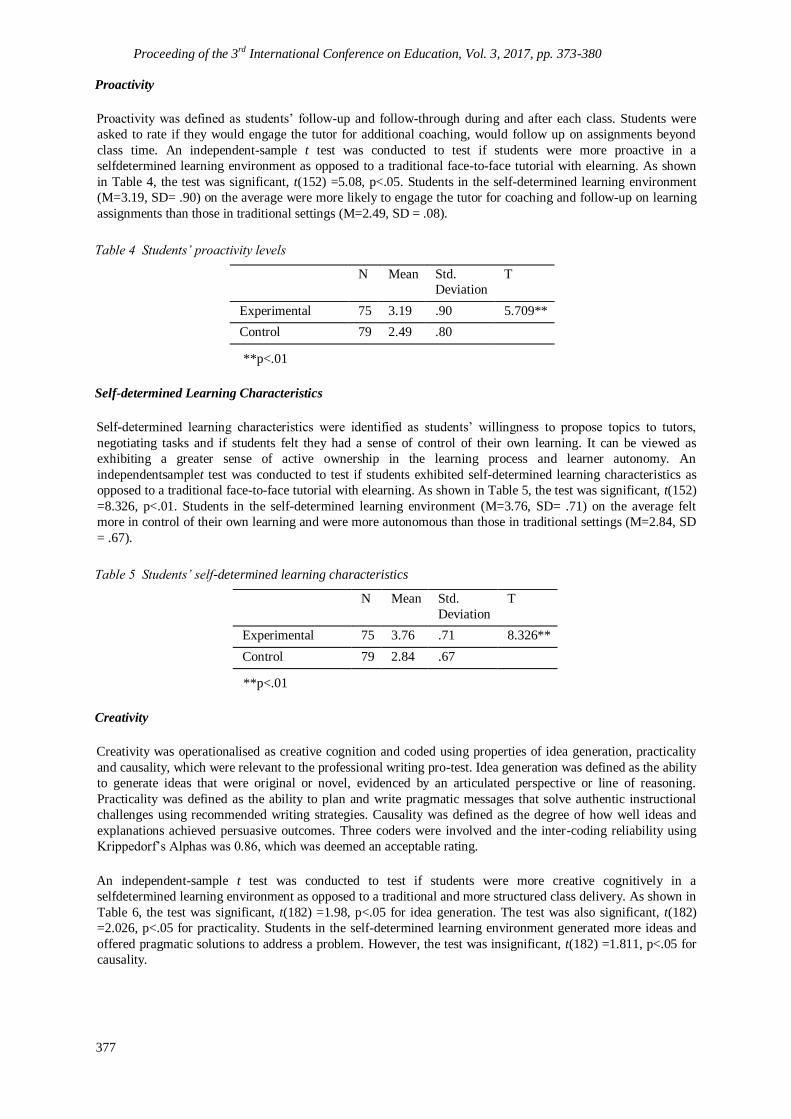
Proceeding of the 3rd International Conference on Education, Vol. 3, 2017, pp. 373-380
377
Proactivity
Proactivity was defined as students’ follow-up and follow-through during and after each class. Students were
asked to rate if they would engage the tutor for additional coaching, would follow up on assignments beyond
class time. An independent-sample t test was conducted to test if students were more proactive in a
selfdetermined learning environment as opposed to a traditional face-to-face tutorial with elearning. As shown
in Table 4, the test was significant, t(152) =5.08, p<.05. Students in the self-determined learning environment
(M=3.19, SD= .90) on the average were more likely to engage the tutor for coaching and follow-up on learning
assignments than those in traditional settings (M=2.49, SD = .08).
Table 4 Students’ proactivity levels
**p<.01
Self-determined Learning Characteristics
Self-determined learning characteristics were identified as students’ willingness to propose topics to tutors,
negotiating tasks and if students felt they had a sense of control of their own learning. It can be viewed as
exhibiting a greater sense of active ownership in the learning process and learner autonomy. An
independentsamplet test was conducted to test if students exhibited self-determined learning characteristics as
opposed to a traditional face-to-face tutorial with elearning. As shown in Table 5, the test was significant, t(152)
=8.326, p<.01. Students in the self-determined learning environment (M=3.76, SD= .71) on the average felt
more in control of their own learning and were more autonomous than those in traditional settings (M=2.84, SD
= .67).
Table 5 Students’ self-determined learning characteristics
**p<.01
Creativity
Creativity was operationalised as creative cognition and coded using properties of idea generation, practicality
and causality, which were relevant to the professional writing pro-test. Idea generation was defined as the ability
to generate ideas that were original or novel, evidenced by an articulated perspective or line of reasoning.
Practicality was defined as the ability to plan and write pragmatic messages that solve authentic instructional
challenges using recommended writing strategies. Causality was defined as the degree of how well ideas and
explanations achieved persuasive outcomes. Three coders were involved and the inter-coding reliability using
Krippedorf’s Alphas was 0.86, which was deemed an acceptable rating.
An independent-sample t test was conducted to test if students were more creative cognitively in a
selfdetermined learning environment as opposed to a traditional and more structured class delivery. As shown in
Table 6, the test was significant, t(182) =1.98, p<.05 for idea generation. The test was also significant, t(182)
=2.026, p<.05 for practicality. Students in the self-determined learning environment generated more ideas and
offered pragmatic solutions to address a problem. However, the test was insignificant, t(182) =1.811, p<.05 for
causality.
N Mean Std.
Deviation
T
Experimental 75 3.76 .71 ** 8.326
Control 79 2.84 .67
N Mean Std.
Deviation
T
Experimental 75 3.19 .90 5.709**
Control 79 2.49 .80

Christopher Pang, XiuEr, Chuang and Christian Chia/Nurturing Proactive, Creative and Communicative
Learners Through Social Media
378
Table 6 Students’ creativity cognition levels
N Mean Std.
Deviation
t
Experimental
Idea Generation
Practicality
Causality
92
3.64
3.98
3.84
1.36
1.06
1.13
1.982*
2.026*
1.811
Control
Idea Generation
Practicality
Causality
92
3.25
3.65
3.52
1.32
1.12
1.22
*p<.05
Discussion
The findings on the educational benefits of a self-determined, personalised learning environment are consistent
with other research studies done on social media and communicative abilities. Active use of social media
facilitated deeper thinking and understanding though the evaluation of personal preferences via self-reflection
(Blaschke, 2012). Another similar finding revolved around how communication and connectedness between
peers and tutors also improved significantly (Halvorsen, 2009; Wang and Vasquez, 2012). Students also
demonstrated greater autonomy and independence. A self-determined learning environment encouraged
students to follow through on a heightened ownership of learning to proactively taking charge of their own
learning. An ownership of the learning process also activated a greater sense of responsibility and maturity.
Initially, when students were given the option to determine the delivery and format of classes, tutors reported
that their classes suggested cancelling all face-to-face tutorials. As students deliberated, they opted for a varied
delivery approach – a mix of face-to-face and virtual classes. When asked why, students upon reflecting wanted
a variety of delivery styles, as they were bored with a repetitive delivery mode. Students also opted for optional
face-to-face classes instead of cancelling all classes as they recognised that it was also important to cater to
those who preferred face-to-face sessions. As a result, students were more engaged as they were able to express
their learning preferences and there was sufficient room for negotiating a differentiated delivery. In addition,
students were also more comfortable proposing topics they would like covered, to their tutors and charting their
own and the class’ learning paths. The negotiated curriculum, thereby, provided an unexpected benefit of
tailoring learning for a wider cross section of students, making learning more personal and relevant. This also
resulted in students outperforming their peers in the control groups.
Blaschke (2012) further explained that when students recognised the relevance of a social media learning
activity, they exhibited increased cognitive engagement. This focus on relevance is significant. Besides making
learning more relevant to the individual, learning activities must also be relevant to the medium. Porting an
existing activity and expecting it to have immediate active participation is unlikely to work in social media. This
is an important issue to address. Tailoring learning activities to appeal to students’ preference for social
mediaready content is critical to lesson success. A review of the postings showed that students were more likely
to respond to an activity if their comments would be read when shared. In fact, students pointed out the response
time from tutors was often too slow – they expected an instantaneous response as they would on any regular
social media platforms they use. Using social media thus automatically resulted in a heavier workload on tutors
outside regular office hours. Also, the viral-ness of an activity and its potential for comments to be reposting
was also a factor for consideration. Students posted solutions and exercises that maximised the potential of
being liked, shared and reposted and prioritised this attribute over a solution that educators might prefer instead.
This presents a pedagogical challenge for educators. If educators take the stand that learning content designed to
fulfil a desired outcome should come first (pedagogy before technology), they run the risk of lowered and
disengaged participation. The situation becomes more acute as there is the possibility of content and activities
being seen as unattractive and dull, when viewed in social media terms. If educators first set up a social media
as a learning medium and populate it with content and activities (technology before pedagogy), they run the risk
of creating a pedagogically unsound learning model that emphasises instruction and interaction over outcomes.

Proceeding of the 3rd International Conference on Education, Vol. 3, 2017, pp. 373-380
379
The obvious solution is of course, to integrate the two. That is easier said than done. Even though this study
attempted to integrate pedagogy with technology, not all blended tutorials and the activities were wholly
successful. The more successful activities made use of the collaborative nature of social media and provided the
opportunity to create social-media-worthy postings. The less successful examples also followed a similar vein
integrating pedagogy and technology but did not enjoy the same level of participation due to a perceived lack of
relevance and attractiveness. In analysing why such activities failed to elicit the sought-after active participation
on social media, it was observed that the initiation of postings by opinion leaders was key. If the students whom
the classes perceived as peer opinion leaders posted first, it was more likely to enjoy greater participation. This
is not unlike what current online influencers e.g. bloggers with sizable followers, do in popular social media
sites. It was observed that there was also a normalising effect on subsequent postings that followed the opinion
leaders’ posts. Even in the educational use of social media, the leaders-and-followers phenomenon appears to
influence discussion and activity levels.
In cultivating student communication skills, the use of social media presents a unique opportunity that allows
for solving problems collaboratively in small groups, larger teams or an entire learning community. This
emerged phenomenon has been suggested by numerous studies examining the potential of using social media
for collaborative problem solving within a blended learning environment (Radwan, Ballera, and Ateya, 2015).
In our study, the students’ increased creative cognition in terms of idea generation and practicality of solutions
were significantly better than their peers. Tutors reported a more astute handling of communicative tasks and a
heightened ability to articulate the solution relevant to the presented situation and intended recipients.
The use of social media also showcased the affinity for technology-mediated learning by students as digital
natives. Students were able to propose more efficient ways to invite classmates into the Facebook writing
groups (not a single email invite was sent and it was done quickly and effortlessly using a snowball approach).
They also exhibited clear expertise in using Facebook’s ability to track the history of a conversation and
revisions in documents for use in comparing different drafts and learning from revised writing improvements. In
fact, when students were elected as the groups’ moderators, at times they prove themselves to be more capable
and responsive than their tutors. The use of social media allowed students to step up and own the learning
process too.
Conclusion and Future Direction
The use of social media within a self-determined learning environment holds promise in several areas. The first
is the collaborative platform allowed for a negotiated curriculum that offered more relevant and differentiated
learning. The second is the increased learning ownership as it promotes autonomy and independence. These are
essential qualities necessary for cultivating proactive learners. The third area is the opportunity to co-create
learning activities in small groups and as a class. This opportunity is a result of two factors – 1) social media
itself offers the modal flexibility for negotiating a shared curriculum and 2) the collaborative learning aspect
that allows for a public showcase, easy sharing and instant distribution of solutions within a learning
community.
There are also several areas for future studies. The effect of peer opinion leaders when social media is used
educationally warrants further investigation. Another area of interest is how the use of social media impacts
individual and group-based assessments as ideas, solutions and perspectives are rapidly. Overall, this study
presents important considerations for any educator seeking to leverage social media and provides some insights
and possibilities for designing a curriculum and associated learning activities.
References
Ashton, J. and Newman, L., 2006. An unfinished symphony: 21st century teacher education using knowledge
creating heutagogies. British Journal of Educational Technology, 37(6), pp.825-840.
Blaschke, L.M. and Hase, S., 2016. Heutagogy: A holistic framework for creating Twenty-First-Century
selfdetermined learners. In The Future of Ubiquitous Learning (pp. 25-40). Springer Berlin Heidelberg.
Blaschke, L.M., 2012. Heutagogy and lifelong learning: A review of heutagogical practice and self-determined
learning. The International Review of Research in Open and Distributed Learning, 13(1), pp.56-71.

Christopher Pang, XiuEr, Chuang and Christian Chia/Nurturing Proactive, Creative and Communicative
Learners Through Social Media
380
Bhoyrub, John, John Hurley, Gavin R. Neilson, Mike Ramsay, and Margaret Smith. "Heutagogy: An alternative
practice based learning approach." Nurse Education in Practice 10, no. 6 (2010): 322-326.
Cochrane, T., 2012. Anmlearning journey: mobile web 2.0 critical success factors. International Journal of
Handheld Computing Research (IJHCR), 3(2), pp.44-57.
Cochrane, T.D., 2010. Exploring mobile learning success factors. Alt-j, 18(2), pp.133-148.
Fewkes, A.M. and McCabe, M., 2012. Facebook: Learning tool or distraction?.Journal of Digital Learning in
Teacher Education, 28(3), pp.92-98.
Halvorsen, A., 2009. Social networking sites and critical language learning. Handbook of research on Web 2.0
and second language learning, pp.237-258.
Hase, S. and Kenyon, C., 2007. Heutagogy: A child of complexity theory. Complicity: An International Journal
of Complexity and Education, 4(1).
Jamieson, J., Chapelle, C.A. and Preiss, S., 2005. CALL evaluation by developers, a teacher, and
students. CALICO journal, pp.93-138.
Jones, N., Blackey, H., Fitzgibbon, K. and Chew, E., 2010. Get out of MySpace!.Computers & Education,
54(3), pp.776-782.
Kao, P.C. and Craigie, P., 2014. Effects of English usage on Facebook and personality traits on achievement of
students learning English as a foreign language. Social Behavior and Personality: an international journal,
42(1), pp.17-24.
Kukulska-Hulme, Agnes. 2010. Mobile learning as a catalyst for change. Open Learning: The Journal of Open
and Distance Learning, 25(3) pp. 181–185.
Laurillard, D., 2013. Teaching as a design science: Building pedagogical patterns for learning and technology.
Routledge.
Lee, L., 2011. Blogging: Promoting learner autonomy and intercultural competence through study
abroad. Language Learning & Technology, 15(3), pp.87-109.
Lomicka, L. and Lord, G., 2012. A tale of tweets: Analyzing microblogging among language
learners. System, 40(1), pp.48-63.
Luckin, R., Clark, W., Garnett, F., Whitworth, A., Akass, J., Cook, J., Day, P., Ecclesfield, N., Hamilton, T. and
Robertson, J., 2010. Learner-generated contexts: A framework to support the effective. Web 2.0-Based
ELearning: Applying Social Informatics for Tertiary Teaching: Applying Social Informatics for Tertiary
Teaching, p.70.
Mao, J., 2014. Social media for learning: A mixed methods study on high school students’ technology
affordances and perspectives. Computers in Human Behavior, 33, pp.213-223.
McCarthy, J., 2010. Blended learning environments: Using social networking sites to enhance the first year
experience. Australasian Journal of Educational Technology, 26(6).
Omar, H., Embi, M.A. and Yunus, M.M., 2012. ESL learners' interaction in an online discussion via
Facebook. Asian Social Science, 8(11), p.67.

Proceeding of the 3rd International Conference on Education, Vol. 3, 2017, pp. 373-380
381
Radwan, A., Ballera, M., &Ateya, I. L. 2015. Collaborative problem solving using public social network media:
analyzing student interaction and its impact to learning process. International Journal of Digital Information
and Wireless Communications, 3(1): 25-42
Selwyn, N., 2010. Looking beyond learning: Notes towards the critical study of educational technology. Journal
of Computer Assisted Learning, 26(1), pp.65-73.
Suthiwartnarueput, T. and Wasanasomsithi, P., 2012. Effects of using Facebook as a medium for discussions of
English grammar and writing of low-intermediate EFL students. Electronic Journal of Foreign Language
Teaching, 9(2), pp.194-214.
Wang, S. and Vasquez, C., 2012. Web 2.0 and second language learning: What does the research tell us. Calico
Journal, 29(3), pp.412-430.
Warschauer, M. and Healey, D., 1998. Computers and language learning: An overview. Language
teaching, 31(02), pp.57-71.
Yu, L.T., 2014. A case study of using Facebook in an EFL English writing class: The perspective of a writing
teacher. JALT CALL Journal, 10(3), pp.189-202.