3-Central-Luzon-RDP-2017-2022.pdf - The National ...
344
-
Upload
khangminh22 -
Category
Documents
-
view
7 -
download
0
Transcript of 3-Central-Luzon-RDP-2017-2022.pdf - The National ...


Central Luzon Regional Development Plan 2017-2022 | v
Table of Contents
Foreword by President Rodrigo R. Duterte
Message of Socioeconomic Planning Secretary Ernesto M. Pernia
Message of RDC Chairman Edgardo D. Pamintuan
Preface by NEDA Regional Director Severino C. Santos
15th Regional Development Council III Resolution No. 03-01-2017
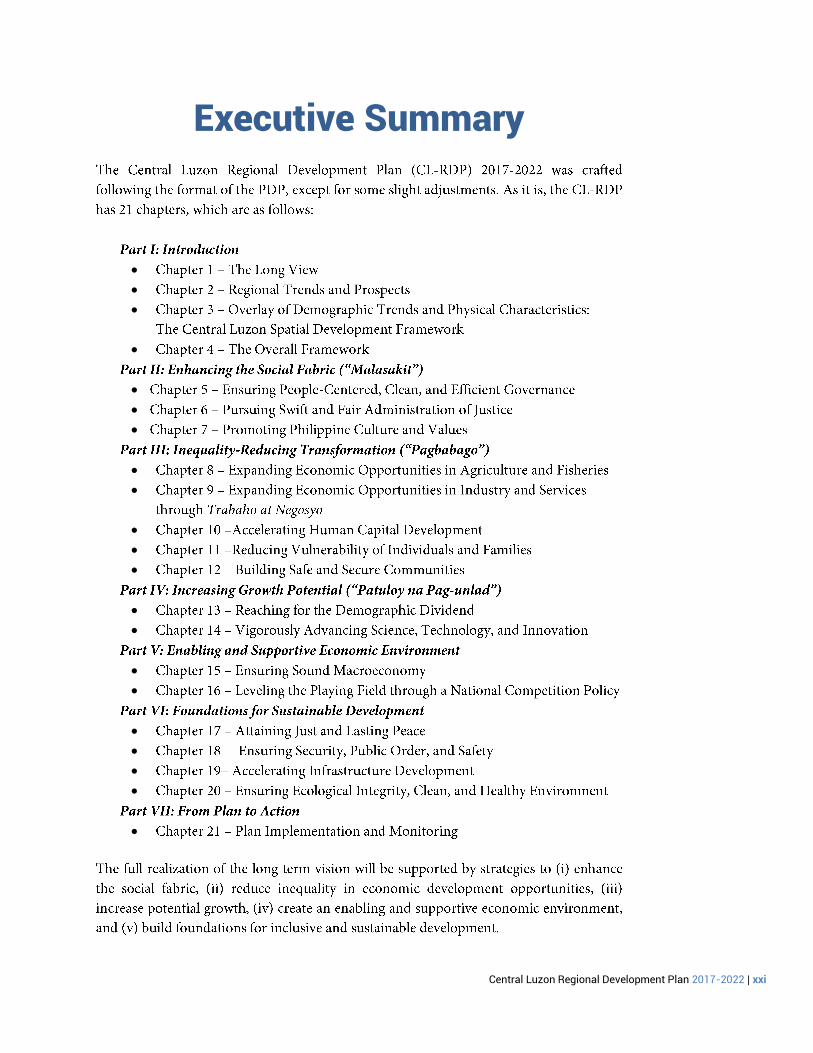
Executive Summary
Part I Introduction
Part II Enhancing the Social Fabric (“Malasakit”)
Part III Inequality-Reducing Transformation (“Pagbabago”)
Part IV Increasing Growth Potential (“Patuloy na Pag-unlad”)

vi | Central Luzon Regional Development Plan 2017-2022
Part V
Enabling and Supportive Economic Environment
Part VI Foundations for Sustainable Development
Part VII From Plan to Action
List of Acronyms
Glossary
References
CLRDP 2017-2022 Planning Committees
Schedule of CLRDP 2017-2022 Consultations
Plan Secretariat
Central Luzon Regional Development Plan 2017-2022 | vii
List of Tables and Figures
Part I: Introduction

viii | Central Luzon Regional Development Plan 2017-2022
Part II: Enhancing the Social Fabric (“Malasakit”)

Central Luzon Regional Development Plan 2017-2022 | ix
Part III: Inequality-Reducing Transformation (“Pagbabago”)

x | Central Luzon Regional Development Plan 2017-2022

Central Luzon Regional Development Plan 2017-2022 | xi
Part V: Enabling and Supportive Economic Environment

xii | Central Luzon Regional Development Plan 2017-2022
Part VI: Foundations for Sustainable Development

Central Luzon Regional Development Plan 2017-2022 | xiii
xiv | Central Luzon Regional Development Plan 2017-2022
Part VII: From Plan to Action

Central Luzon Regional Development Plan 2017-2022 | xv
Foreword

xvi | Central Luzon Regional Development Plan 2017-2022
Message

Central Luzon Regional Development Plan 2017-2022 | xvii
Message

xviii | Central Luzon Regional Development Plan 2017-2022
Preface


Central Luzon Regional Development Plan 2017-2022 | xxi
Executive Summary

xxii | Central Luzon Regional Development Plan 2017-2022
Goal Sector Outcomes Strategies
(1) Enhancing the Social Fabric (“Malasakit”)
Ensuring People-centered, Clean, and Efficient Governance
Citizenry fully engaged and empowered
Strengthen participatory governance
Modernize public access to government information
Intensify feedback mechanisms Corruption reduced Strengthen anti-corruption
efforts Seamless service delivery achieved
Improve LGU competitiveness
Enhance public service through human resource development
Pursing Swift and Fair Administration of Justice
Access to civil, criminal, commercial justice system enhanced
Improve access to justice information
Sector efficiency and accountability improved
Reduce backlogs and ensure good governance in the justice system
Improve judicial systems and infrastructure
Promoting Philippine Culture and Values
Diverse cultures valued
Generate, develop, produce, disseminate, and improve access to information about Filipino culture
Expand inclusive cultural structures as civic spaces for dialogue and cultural exchange

Central Luzon Regional Development Plan 2017-2022 | xxiii
Goal Sector Outcomes Strategies “Pagkamalikhain” or creative excellence advanced
Build appreciation of Filipino creativity
Values for the common good inculcated and lived
Determine a set of core values that foster the common good
Mainstream cultural education in basic, technical, vocational, and
higher education Culture-sensitive governance and development strengthened
Strengthen the protection of the rights of vulnerable sectors of society and free them from discrimination and fear through the strict implementation of laws
Pursue institutional reforms for cultural development
(2) Inequality-Reducing Transformation (“Pagbabago”)
Expanding Economic Opportunities in Agriculture and Fisheries
Agriculture and fishery sector productivity improved
Increase access to credit
Provide access to technology
Rationalize land use allocation
Agriculture and fishery-based enterprises increased
Promote value-adding agricultural products
Marketing and financing services increased
Establish regional and local trading centers
Promote co-operative farming
Adaptation to climate change improved
Increase support for research and development in disaster risk reduction climate change adaptation
Provide comprehensive infrastructure support
Expanding Economic Opportunities in Industry and Services through Trabaho at Negosyo
Competitiveness and innovativeness of the Industry and Services sectors increased
Simplify and harmonize regulatory requirements in business registration and licensing, and loan processing
Improve access to market, technology and innovation, and connectivity
Strengthen government-industry-academe linkages
Promote green economy Local and foreign investments increased
Strengthen value and supply chain linkages
Pursue development of emerging industries
Productivity, innovative capacity and resilience of MSMEs improved
Strengthen linkages between MSMEs and large corporations
Increase access to finance and technology
Provide a window for rehabilitation of MSMEs during disaster
Promote consumer welfare Accelerating Human Capital Development
Enhanced and sustained quality care for all life stages guaranteed
Scale-up preventive, promotive, curative, rehabilitative, and, palliative health care programs
Access to functional service delivery network ensured
Elicit multi-sector, multi-stakeholder support for health
Health financing sustained
Expand health insurance coverage and benefits

xxiv | Central Luzon Regional Development Plan 2017-2022
Goal Sector Outcomes Strategies Quality, accessible, relevant, and liberating basic education for all ensured
Raise the quality of education and make it accessible
Make education relevant to urgent needs and opportunities
Quality of higher and technical education for equity and global competitiveness improved
Promote excellence among higher education institutions
Ensure globally competitive training programs
Employability increased and productivity improved
Promote skills development and retooling through continuing education and training
Encourage women’s active participation in the labor market
Ensure safety in the workplace Strengthen employment
facilitation services Labor mobility and income security enhanced
Provide income support and emergency employment
Reducing Vulnerability of Individuals and Families
Universal and transformative social protection (SP) for all achieved
Strengthen convergence mechanism for SP programs at the national and local levels
Establish comprehensive and efficient data management system for vulnerable sectors
Intensify social protection programs for OFs and their families
Building Safe and Secure Communities
Access to affordable, adequate, safe, and secure shelter expanded
Strengthen housing as a platform to address poverty and improve social outcomes
Establish stronger partnerships with stakeholders
Support the creation of a Department of Housing and Urban Development (DHUD)
(3) Increasing Growth Potential (“Patuloy na Pag-unlad”)
Reaching for the Demographic Dividend
Quality of human capital improved
Push for the full implementation of the Responsible Parenthood and Reproductive Health (RPRH) Law
Improve quality of education Unemployment and underemployment among the young population reduced
Ensure that job opportunities for the youth match the skills requirement of industries
Vigorously Advancing Science, Technology, and Innovation
Increased STI utilization in Agriculture, Industry, and Services sectors
Promote commercialization and utilization of technologies from publicly funded R&D.
Develop a vibrant Intellectual Property Rights (IPR) culture
Increased investments in STI-based start-ups, enterprises, and spin-offs
Encourage more innovative financing mechanisms and private sector investments
Provide support mechanisms for startups and MSMEs in the region
Enhanced creative capacity for knowledge and technology generation,
Support research and development agenda
Increase funding for human resource development
Tap foreign and Overseas Filipinos (OFs) expertise

Central Luzon Regional Development Plan 2017-2022 | xxv
Goal Sector Outcomes Strategies
acquisition, and adoption
Strengthen STI infrastructure
Establish and promote innovation hubs and other similar mechanisms
Foster STI culture Strengthened open collaboration among actors in the STI Ecosystem
Strengthen Tri-partite collaboration
Intensify international cooperation in STI
(4) Enabling and Supportive Economic Environment
Ensuring Sound Macroeconomy
Governance improved
Improve public financial management
Access to financing improved
Expand coverage and simplify loan processes
Leveling the Playing Field through a National Competition Policy
Anti-competitive practices diminished
Review potentially anti-competition legislation and policies that may substantially prevent, restrict, or lessen competition
Promote competition-related policies and best practices
Conduct capacity building activities for government agencies and other institutions
Barriers to entry reduced
Limits to entrepreneurship reduced
(5) Foundations for Sustainable Development
Attaining Just and Lasting Peace
Just and lasting peace achieved
Strengthen peace initiatives and activities
Empower communities and increase their capacity to address conflicts and reduce their vulnerability
Intensify Barangay Peacekeeping Action teams
Ensuring Security, Public Order and Safety
National Security, Public Order, and Safety ensured
Intensify campaign against organized crime groups
Strengthen police force Modernize and decongest jails
and detention centers Strengthen campaign against
illegal drugs Intensify fire hazard
management capabilities Accelerating
Infrastructure Development
Enhanced growth and productivity
Improve internal access and interregional connectivity
Increase supply of clean and renewable energy
Modernize agriculture and fishery infrastructures
Strengthen the digital infrastructure
Improved basic and social infrastructure services
Ensure water security
Provide health, education, and housing facilities
Address gaps in basic, governance, and protective infrastructures
Improved resiliency Increase resilience to climate and geologic hazards
Improve response and hasten early recovery
Enhanced environmental quality
Improve sanitation and wastewater disposal
Improve solid waste disposal and management
Improve air quality

xxvi | Central Luzon Regional Development Plan 2017-2022
Goal Sector Outcomes Strategies Enhanced infrastructure planning and management
Improve infrastructure governance
Optimize resources and investments in infrastructure
Ensuring Ecological Integrity, Clean, and Healthy Environment
Sustained functioning of ecosystem services
Intensify sustainable management of natural resources through adoption of ridge-to-reef approach
Expand development of resource-based enterprises or industries
Mainstream ecosystem valuation into national and local development planning
Improved environmental quality
Strengthen enforcement of environmental laws
Promote sustainable consumption and production
Increased adaptive capacities and resilience of communities and ecosystems
Implement risk and climate-sensitive land use
Strengthen implementation of prevention, mitigation, and preparedness, particularly at the local levels across sectors
Strengthen implementation of response, recovery, and rehabilitation efforts


Chapter 1 Introduction | 5
1
The Long View The President issued Memorandum Circular (MC) No. 12, s. 2016 directing the National Economic and Development Authority (NEDA) to coordinate the preparation of the Philippine Development Plan (PDP), Public Investment Program (PIP), and Regional Development Plans (RDPs)/Investment Programs (RDIPs) for the period 2017 to 2022.
The Long Term Vision

6 | Central Luzon Regional Development Plan 2017-2022
The Development Agenda
Chapter 1 Introduction | 7


Chapter 2 Regional Trends and Prospects | 11
2
Regional Trends and Prospects
Indicator Actual
(2015) 2017 2018 2019 2020 2021 2022
GRDP
growth rate (%)
5.6 5.9 -6.9 6.3 -7.3 6.3 -7.3 6.3 -7.4 5.8 -6.8 6.3 -7.3
AHFF 0.6 3.0 -4.0 5.0 -6.0 5.0 -6.0 5.0 -6.0 3.0 -4.0 5.0 -6.0
Industry 7.1 7.2 -8.2 7.2 -8.2 7.2 -8.2 7.2 -8.2 6.7 - 7.7 7.2 -8.2
Services 6.2 5.7 -6.7 5.7 -6.8 5.7 -6.8 5.7 -6.9 5.7 -6.7 5.7 -6.8
GRDP per capita (Php) 63,455 68,327 71,773 75,748 80,336 85,459 91,020
Employment rate (%) 93.4 93.7 94.0 94.3 94.6 94.8 95.1
Unemployment rate (%) 6.6 6.3 6.0 5.7 5.4 5.2 4.9
Poverty Incidence
(percentage among
population)
11.2 10.6 10.2 9.8 9.4 8.9 8.5
Aurora 26.3 24.8 23.8 22.7 21.6 20.4 19.3
Bataan 2.0 1.5 1.2 0.9 0.7 0.5 0.4
Bulacan 4.5 3.8 3.4 3.0 2.6 2.2 1.9
Nueva Ecija 22.6 21.6 21.0 20.4 19.6 18.9 18.2
Pampanga 4.9 4.3 3.9 3.4 3.0 2.6 2.3
Tarlac 18.1 18.8 19.3 19.8 20.4 21.1 21.8
Zambales 16.8 17.2 17.4 17.7 18.0 18.3 18.6

12 | Central Luzon Regional Development Plan 2017-2022


Chapter 3 Overlay of Demographic Trends and Physical Characteristics: The Central Luzon Spatial Development Framework | 15
3
Overlay of Demographic Trends and Physical Characteristics: The Central Luzon Spatial Development Framework
Regional Profile
Politico-administrative Subdivision, Location, and Physical Characteristics
Province
Land Resources (ha) Marine Resources (ha)
Forest Built-up/
A&D SAFDZ Total % share
Municipal
Waters % share
Aurora 255,511.85 33,022.27 28,348.38 316,882.50 14.86 353,095.00 43.65
Bataan 57,631.54 44,006.20 31,454.62 133,092.36 6.24 176,709.43 21.85
Bulacan 99,931.01 99,028.42 67,650.29 266,609.72 12.50 36,105.38 4.46
Nueva Ecija 199,284.00 266,517.47 75,104.95 540,906.42 25.36 -- --
Pampanga 48,827.08 83,237.17 76,240.51 208,304.76 9.77 4,473.26 0.55
Tarlac 116,505.82 89,241.06 97,923.33 303,670.21 14.24 -- --
Zambales 248,028.33 57,961.53 57,620.41 363,610.27 17.05 238,452.32 29.48
Total 1,025,719.63 673,014.13 434,342.49 2,133,076.25 100.00 808,835.39 100.00
% share 48.09 31.55 20.36 100.00 -- --

16 | Central Luzon Regional Development Plan 2017-2022

Chapter 3 Overlay of Demographic Trends and Physical Characteristics: The Central Luzon Spatial Development Framework | 17

18 | Central Luzon Regional Development Plan 2017-2022
Population and Urban Hierarchy

Chapter 3 Overlay of Demographic Trends and Physical Characteristics: The Central Luzon Spatial Development Framework | 19
Area Census Year Doubling Time
1990 2000 2010 2015 Year No. of Years Population (in million)
Central Luzon 6.3 8.2 10.1 11.2 2049 34 Metro Manila 7.9 9.9 11.9 12.9 2057 42 CALABARZON 6.0 9.1 12.3 14.4 2037 22 GCR 20.3 27.2 34.3 38.5 2045 30 Philippines 60.7 76.5 92.3 100.9 2054 39
Growth Rate (%) Central Luzon -- 2.6 2.1 2.0 -- -- Metro Manila -- 2.3 1.8 1.7 -- -- CALABARZON -- 4.2 3.1 3.2 -- -- GCR -- 3.0 2.3 2.3 -- -- Philippines -- 2.3 1.9 1.8 -- --
Share to Philippines (%) Central Luzon 10 11 11 11 -- -- Metro Manila 13 13 13 13 -- -- CALABARZON 10 12 13 14 -- -- GCR 33 36 37 38 -- --

20 | Central Luzon Regional Development Plan 2017-2022

Chapter 3 Overlay of Demographic Trends and Physical Characteristics: The Central Luzon Spatial Development Framework | 21
Access and Proximity

22 | Central Luzon Regional Development Plan 2017-2022

Chapter 3 Overlay of Demographic Trends and Physical Characteristics: The Central Luzon Spatial Development Framework | 23

24 | Central Luzon Regional Development Plan 2017-2022
Development Issues and Challenges Urban/Settlement Expansion and Food Security

Chapter 3 Overlay of Demographic Trends and Physical Characteristics: The Central Luzon Spatial Development Framework | 25

26 | Central Luzon Regional Development Plan 2017-2022
Urban Efficiency and Capacity
Land Use Conflicts and Vulnerability

Chapter 3 Overlay of Demographic Trends and Physical Characteristics: The Central Luzon Spatial Development Framework | 27
Luzon Spatial Development Framework

28 | Central Luzon Regional Development Plan 2017-2022
Concentration Strategy
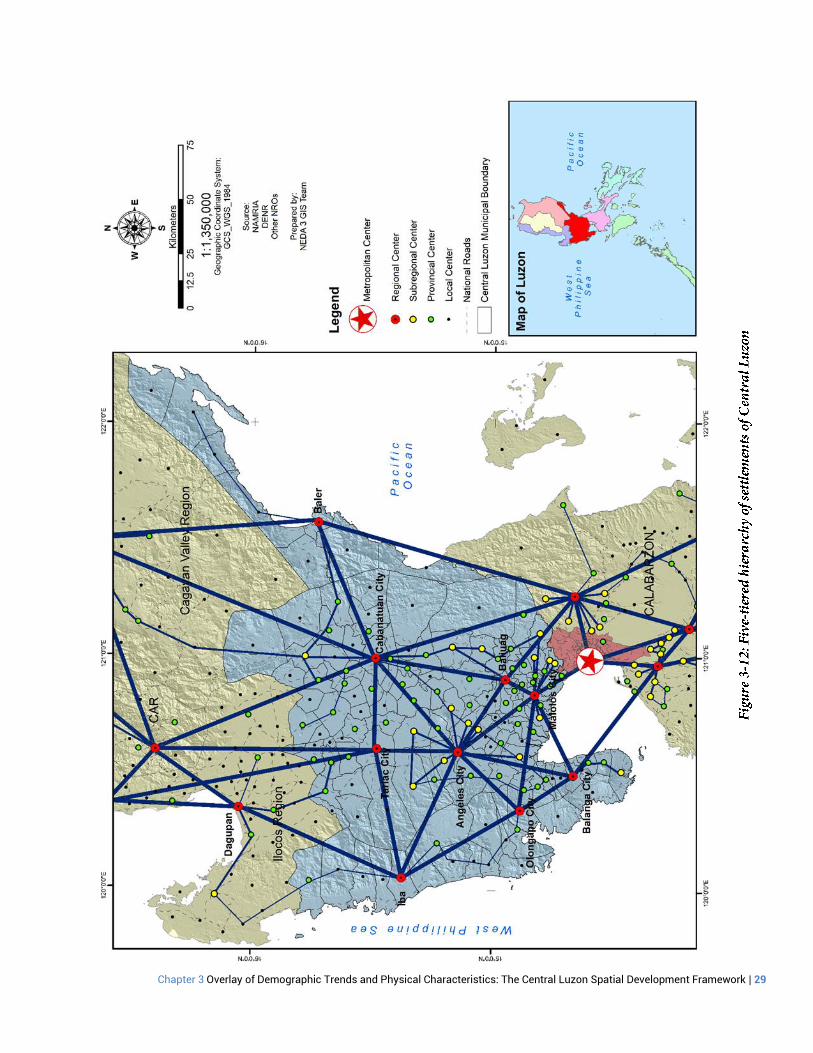
Chapter 3 Overlay of Demographic Trends and Physical Characteristics: The Central Luzon Spatial Development Framework | 29

30 | Central Luzon Regional Development Plan 2017-2022
Connectivity Strategy

Chapter 3 Overlay of Demographic Trends and Physical Characteristics: The Central Luzon Spatial Development Framework | 31
Vulnerability Reduction Strategy

32 | Central Luzon Regional Development Plan 2017-2022

Chapter 3 Overlay of Demographic Trends and Physical Characteristics: The Central Luzon Spatial Development Framework | 33
Source: JICA/DPWH,

34 | Central Luzon Regional Development Plan 2017-2022

Chapter 3 Overlay of Demographic Trends and Physical Characteristics: The Central Luzon Spatial Development Framework | 35

36 | Central Luzon Regional Development Plan 2017-2022
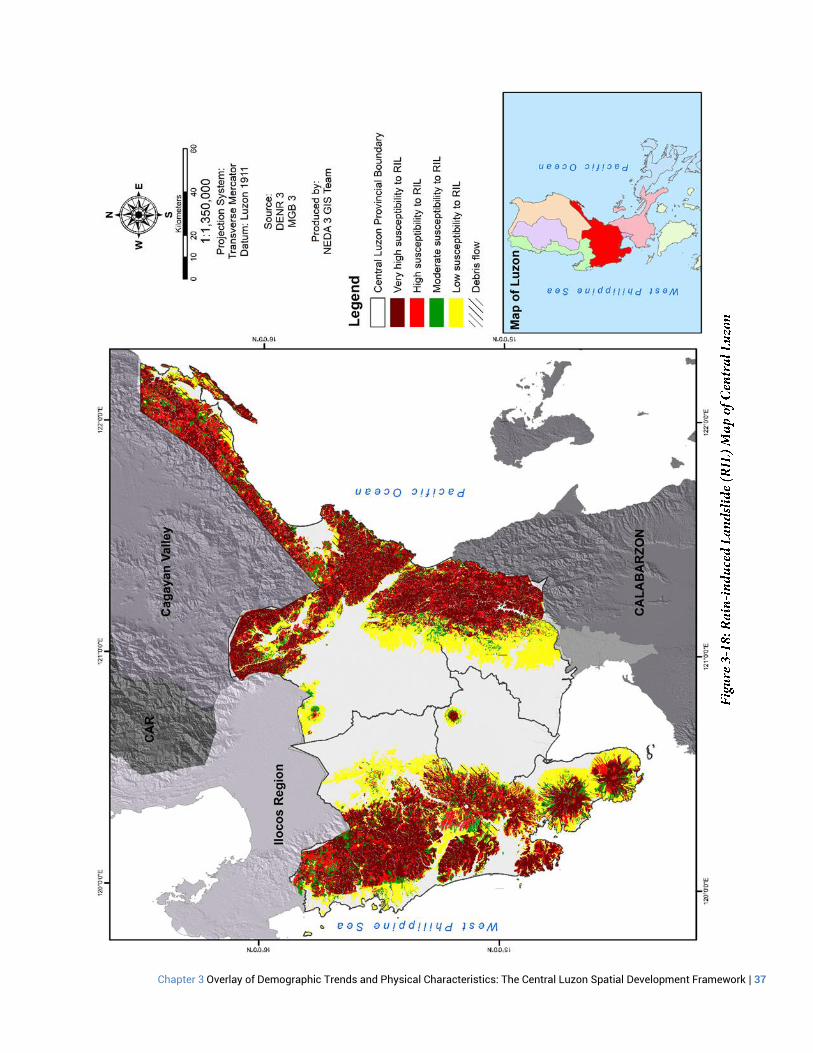
Chapter 3 Overlay of Demographic Trends and Physical Characteristics: The Central Luzon Spatial Development Framework | 37


Chapter 4 The Overall Framework | 41
4
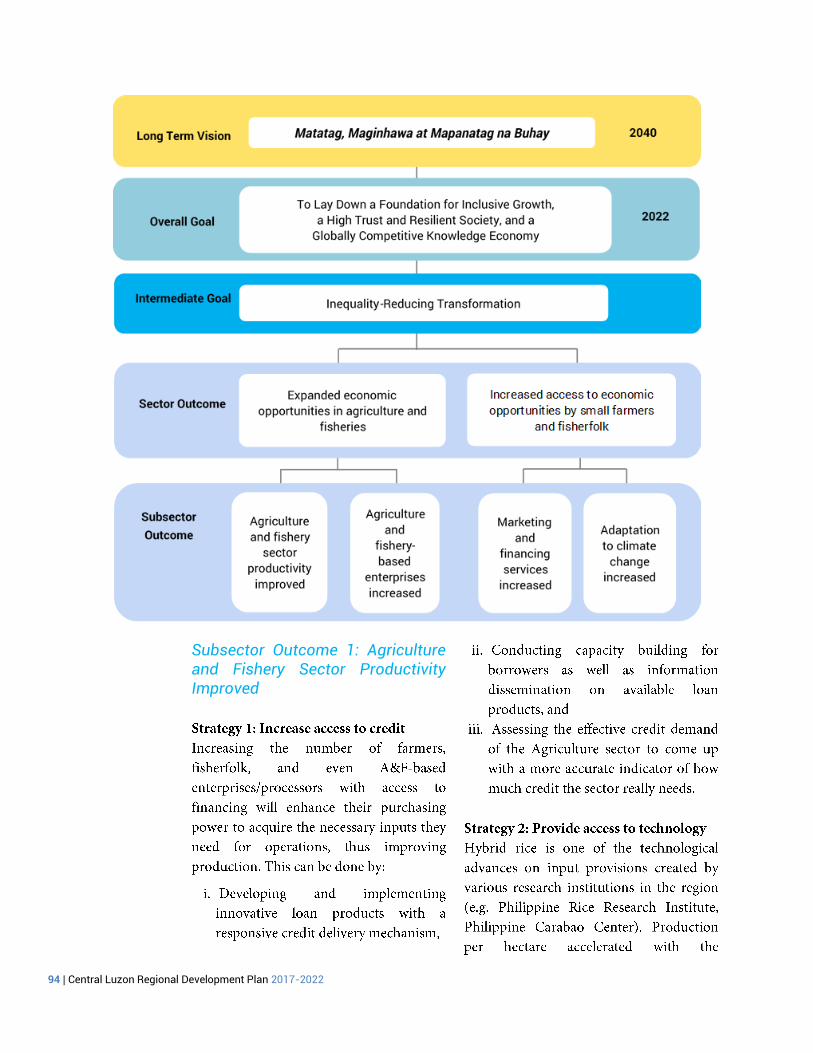
The Overall Framework The Central Luzon Regional Development Plan (CL-RDP) 2017-2022 was formulated in consonance with the Philippine Development Plan (PDP) 2017-2022. The PDP is anchored on the President’s 0-10 point Socio-economic Agenda, geared towards the attainment of the country’s Long Term Vision (LTV): Ambisyon Natin 2040.
The CL-RDP follows the development agenda of the Philippine Development Plan 2017-2022, highlighting the role of the region in achieving national development goals and objectives. The framework that was adopted is shown in Figure 4-1.
The PDP 2017-2022 lays down a solid foundation for a more inclusive growth, a high trust and resilient society, and a globally-competitive knowledge economy through its emphasis on “Malasakit, Pagbabago para sa Patuloy na Pag-unlad.”
Assessment and Challenges

42 | Central Luzon Regional Development Plan 2017-2022
Strategies
Indicator Target Accomplishment
2014 2015 2016 2014 2015 2016
GRDP Growth Rate 6.1-7.1 6.6-7.6 7.1-8.1 9.3 5.3 9.5
Agriculture 5.5-6.5 6.0-7.0 6.5-7.5 6.0 0.6 0.6
Industry 5.5-6.5 6.0-7.0 6.5-7.5 15.9 6.7 16.0
Services 7.0-8.0 7.5-8.5 8.0-9.0 4.1 5.7 5.9
Unemployment rate 8.0 7.5 7.0 8.1 7.8 6.6
Poverty incidence among population
17.75 11.2

Chapter 4 The Overall Framework | 43

44 | Central Luzon Regional Development Plan 2017-2022

Chapter 4 The Overall Framework | 45

46 | Central Luzon Regional Development Plan 2017-2022


Chapter 5 Ensuring People-centered, Clean & Efficient Governance | 51
5
Ensuring People-centered, Clean, and Efficient Governance The active participation of the civil society through citizen engagement and empowerment plays a key role in furthering the best interest of the whole community. This reinforces the PDP 2017-2022 pillar of “Malasakit” or enhancing the social fabric. In order to ensure credibility and reliability at all levels of development administration, transparent, accountable, and responsive governance must be delivered. The present administration’s desire for a corrupt-free government entails strictly following the rule of law and effectively and efficiently implementing processes that the community expects and deserves.
This chapter attempts to assess these elements and provide strategic solutions to achieve the region’s goal of building effective, accountable, and inclusive institutions at all levels, one of the Sustainable Development Goals advocated by the United Nations.
Assessment and Challenges
Citizen engagement and participation

52 | Central Luzon Regional Development Plan 2017-2022
Access to government information
Provinces
2014 2015 2016
No. of
Projects
Amount
(in Php million)
No. of
Projects
Amount
(in Php million)
No. of
Projects
Amount
(in Php million)
Aurora 78 51.66 106 101.34 111 119.24
Bataan 57 37.44 126 150.00 108 180.00
Bulacan 95 79.85 215 269.57 297 363.99
Nueva Ecija 144 226.80 219 400.70 239 475.70
Pampanga 158 149.69 234 275.00 293 329.99
Tarlac 87 96.96 149 230.00 119 274.99
Zambales 39 52.43 147 172.74 175 209.98
TOTAL 658 693.84 1,119 1,626.35 1,342 1,953.91

Chapter 5 Ensuring People-centered, Clean & Efficient Governance | 53
Delivery of public goods and services
Provinces Total no
of LGUs
No. of LGUs
with website
%
Share
Aurora 8 1 13
Bataan 12 7 58
Bulacan 24 16 67
Nueva
Ecija
32 12 38
Pampanga 22 13 59
Tarlac 18 11 61
Zambales 14 7 50
TOTAL 130 67 52

54 | Central Luzon Regional Development Plan 2017-2022

Chapter 5 Ensuring People-centered, Clean & Efficient Governance | 55
Anti-corruption efforts
Agency Rating
Total Excellent Good Acceptable Failed
Bureau of Internal Revenue 5 5 10
Government Service Insurance System 6 6
Home Development Mutual Fund 10 10
Land Bank of the Philippines 4 1 5
Selected Local Government Units 1 6 7
Land Registration Authority 3 9 1 13
Land Transportation Office 7 21 2 1 31
Philippine Health Insurance Corporation 10 10 20
Philippine Statistics Authority 1 5 6
Social Security System 10 4 1 15
TOTAL 57 61 4 1 123

56 | Central Luzon Regional Development Plan 2017-2022
LGU Competitiveness
Agency/Office Date Conferred
1. BIR - RDO No. 21A North Pampanga February 06, 2015
2. BIR - RDO No. 23A Talavera, Nueva Ecija February 06, 2015
3. GSIS - Malolos, Bulacan February 06, 2015
4. LTO - Angeles District Office February 06, 2015
5. SSS - Balanga City Branch February 06, 2015
6. SSS - San Fernando, Pampanga Branch February 06, 2015
7. BIR Paniqui July 03, 2015
8. GSIS - Tarlac Branch July 20, 2015
9. GSIS - Bataan Branch July 20, 2015
10. HDMF Angeles MSB December 15, 2015
11. HDMF Cabanatuan MSB December 15, 2015
12. HDMF Malolos MSB December 15, 2015
13. HDMF Marilao-Meycauayan MSB December 15, 2015
14. HDMF San Fernando MSB December 15, 2015
15. HDMF San Fernand HBC December 15, 2015
16. HDMF Subic MSB December 15, 2015
17. HDMF Tarlac MSB December 15, 2015
18. PHIC Iba LHIO December 15, 2015
19. PHIC Olongapo LHIO December 15, 2015
20. PHIC San Fernando LHIO December 15, 2015
21. SSS Camiling Branch December 15, 2015
Province Ranking
2016 2015
Aurora 20 49
Bataan 7 13
Bulacan 24 44
Nueva Ecija 39 47
Pampanga 32 18
Tarlac 51 62
Zambales 71 28

Chapter 5 Ensuring People-centered, Clean & Efficient Governance | 57
Strategic Framework
Subsector Outcome 1: Citizenry fully engaged and empowered
Year Collection Collection Efficiency (%)
2013 11,408.07 88
2014 13,141.17 92
2015 14,044.22 101

58 | Central Luzon Regional Development Plan 2017-2022

Chapter 5 Ensuring People-centered, Clean & Efficient Governance | 59
Subsector Outcome 2: Corruption reduced
Subsector Outcome 3: Seamless service delivery achieved

60 | Central Luzon Regional Development Plan 2017-2022
Research and Development Agenda
Future Competitiveness Scenarios of Central Luzon Provinces
Public-Private Sector Partnership (PSRs) in Local Development
Assessment of e-Governance in Central Luzon Local Government Units (LGUs)

Chapter 5 Ensuring People-centered, Clean & Efficient Governance | 61
RDP Targets
Indicators Baseline End of Plan
Target Agency
Responsible Year Value
Percentage of Provinces, Cities, and
Municipalities fully compliant with FDP
2015 90% Increasing DILG
Number of LGUs that conducted Citizen
Satisfactory Survey
2015 5 Increasing
Number of Barangays with MASA MASID Increasing DILG
Institutionalization of Citizen
Participatory Audit (CPA)
COA
Number of LGUs with websites 2015 67% Increasing DILG
Service offices passing the ARTA Report
Card Survey
2015 Excellent:
57;
Good: 61;
Acceptable:
4
Increasing
(Excellent)
CSC
Number of LGUs awarded the Seal of
Good Local Governance
2015 4 provinces;
2 cities;
27 mun.
Increasing DILG
Improved percentile ranking in the Cities
and Municipalities Competitiveness Index
2016 Higher ranking
and scores
NCC
Number of LGUs with CDP and/or CLUP 2016 77 Increasing DILG, HLURB
Percentage of LGUs with ELA 2016 70% Increasing DILG
Number of LGUs that availed the
Performance Challenge Fund (PCF)
2015 33 Increasing DILG
Number of LGUs assisted with Business
Permit and Licensing System Automation
2015 45 Increasing DILG, DTI
Tax collection efficiency 2015 101% Increasing BLGF


Chapter 6 Swift and Fair Administration of Justice | 65
6
Pursuing Swift and Fair Administration of Justice To further enhance the social fabric, the region seeks to uphold the Sustainable Development Goal (SDG) of promoting the rule of law and providing equal accessibility to justice. This is in keeping with the pledge of the Department of Justice to provide every person with equal access to justice, faithfully safeguard constitutional rights, and ensure that no one is deprived of the due process of law.
This chapter provides the framework for effectively and efficiently accomplishing
Central Luzon’s objective of providing swift and fair justice. In pursuing this goal,
it very important to advocate partnerships between the stakeholders and other
concerned offices in the justice sector in order to encourage responsiveness and
consistency.
Assessment and Challenges
2014 2015
Number of cases received 43,495 45,393
Number of cases
resolved/disposed
33,222 38,048
Disposition rate 76% 84%

66 | Central Luzon Regional Development Plan 2017-2022
Strategic Framework
Subsector Outcome 1: Access to civil, criminal, commercial justice system enhanced
Province/City
Nature of Dispute
Settled Cases Unsettled Cases
Estimated Gov’t
Savings (in
thousand Php) Criminal Civil Others Total
Aurora 1,037 1,023 315 2,375 1,835 540 17,43.50
Bataan 2,712 4,658 2,312 9,682 8,142 1,540 77,349
Bulacan 12,494 21,009 11,158 44,661 31,503 13,158 299,278.50
Nueva Ecija 4,481 5,897 2,285 12,663 11,250 1,413 106,875
Pampanga 1,940 6,329 2,866 11,135 8,682 2,453 82,479
Tarlac 381 914 311 1,606 1,403 203 13,328.50
Zambales 2,921 3,512 2,064 8,617 6,416 2,201 60,952
Angeles City 1,617 1,575 609 3,801 2,296 1,505 21,812
Olongapo City 3,104 3,096 88 6,288 3,980 2,308 37,810
TOTAL 30,687 48,013 22,008 100,828 75,507 25,321 717,316.50
% Share to total 30.44% 47.62% 21.83% 100% 75% 25% 100%

Chapter 6 Swift and Fair Administration of Justice | 67
Subsector Outcome 2: Sector efficiency and accountability improved

68 | Central Luzon Regional Development Plan 2017-2022
Research and Development Agenda
Review of the region’s current justice system
RDP Targets Indicators
Baseline End of Plan Target
Agency Responsible Year Value
Case disposition rate 2015 84% Increasing DOJ
Govt. Estimated Savings (due to settled
cases)
2016 717.3 Million
Php
Increasing DILG
Cases settled (Katarungang
Pambarangay)
2016 75,507 Increasing DILG


Chapter 7 Promoting Philippine Culture and Values | 71
7
Promoting Philippine Culture and Values Another way to enhance the social fabric and build better relations among the people is to engender an awareness of and an appreciation for the culture that drives people’s attitudes and behavior.
This chapter discusses the priority areas of the cultural agenda, which include the following: i) safeguarding and enshrining fundamental cultural rights, ii) achieving equity and inclusion in the access of cultural resources and services to empower communities and create harmony while recognizing cultural diversity, and iii) sustaining and enhancing cultural assets to foster creativity and innovation for socio-economic growth.
Assessment and Challenges
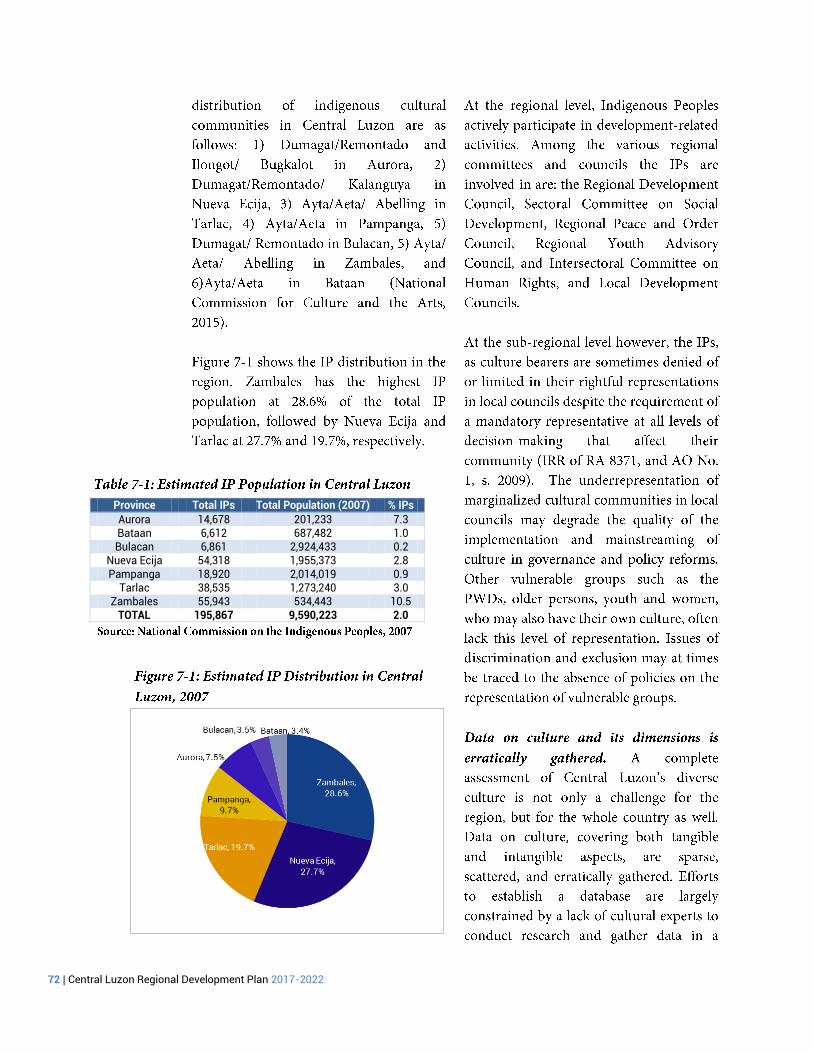
72 | Central Luzon Regional Development Plan 2017-2022
Province Total IPs Total Population (2007) % IPs
Aurora 14,678 201,233 7.3 Bataan 6,612 687,482 1.0 Bulacan 6,861 2,924,433 0.2
Nueva Ecija 54,318 1,955,373 2.8 Pampanga 18,920 2,014,019 0.9
Tarlac 38,535 1,273,240 3.0 Zambales 55,943 534,443 10.5
TOTAL 195,867 9,590,223 2.0

Chapter 7 Promoting Philippine Culture and Values | 73

74 | Central Luzon Regional Development Plan 2017-2022
Name Location Description AURORA
1. Aurora Quezon Marker
2. Baler Catholic Church
3. Quezon Memorial Park
Baler This historic marker was built in honor of Doña Aurora Aragon Quezon, the wife of Commonwealth President Manuel L. Quezon. Aurora Quezon was known for her untiring efforts in social welfare, especially for the benefit of the people of Aurora province. Like her husband, she was born in the town of Baler. She died in an ambush on the mountain roads of Nueva Ecija leading to the province that now bears her name.
The structure is an old church with a simple facade. Here, the last Spanish garrison of four officers and 50 men was besieged by Filipino insurgents from June 27, 1898 to July 2, 1899. This was the last pocket of resistance of the Spanish Armed Forces to surrender to American troops. This is also where the La Campana de Baler, an ancient bell, was used and later stored as a relic.
This quiet park of trees and lawns was developed in honor and in memory of the late president Manuel L. Quezon. A marker fenced by concrete and set on a circular cement platform serves as a landmark of Baler, the birthplace of Quezon.
BATAAN 1. Bankal Settlements
2. Philippine-Japanese Friendship Tower
3. Fall of Bataan Marker 4. Surrender Site Marker 5. Death March Marker 6. Lamao World War II Marker 7. Dambana ng Kagitingan (Shrine
of Valor)
Abucay
Bagac Balanga Balanga Limay Limay Pilar
This is a barangay created for the Aetas to maintain their traditional customs and practices.
A landmark symbolizing peace, friendship and reconcilitation between the Philippines and Japan, this monument tower was built in 1975 by the Risho Kosekei Group. A landmark which commemorates the Fall of Bataan in memory of the war veterans during World War II, the marker symbolizes the courage and the enduring commitment of a Filipino soldier to his country. This is the place where the last defense of Bataan was given up during World War II. On 9 April, 1942, Maj. Gen. Edward King Jr., commander of the U.S. forces in Luzon officially surrendered to Col. Hakaru Haf at the compound of Balanga Elementary School under a mango tree. This landmark commemorates the infamous death march. This marker, found in a town overlooking Manila Bay and Corregidor, commemorates the bravery of those who fought in WW II. A national shrine atop Mt. Samat, this immortalizes the agony of the Filipino and the Americans against the forces of aggression and articulates the commitment of the Filipino people to freedom and human dignity.
BULACAN 1. Barasoain Church
Malolos
A national shrine, it is the site of the Constitutional Convention of the First Philippine Republic. In its convent the University of the Philippines was first

Chapter 7 Promoting Philippine Culture and Values | 75
Name Location Description 2. Barasoain Museum 3. Obando Fertility Dance 4. Biak na Bato National Park 5. Pulilan Fiesta Carabao Festival
Malolos Obando Bocaue Pulilan
housed. Today, it has become the symbol of the province's glorious past and the site of great events. A museum managed by the National Historical Institute, it displays the religious artifacts of the province. This is celebrated from May 15-19. Couples who are childless can take this occasion to appeal for heavenly intercession and dance to please the Virgin of Salambao, St. Pascual de Bailon, and Sta. Clara. Maidens and bachelors who want to find spouses can also dance for mates. Farmers also thank the Virgin for bountiful harvests. A huge split boulder which is the mountain hideout of the revolutionary forces during the Spanish regime and the place where the Malolos Constitution was signed by Gen. Emilio Aguinaldo and Pedro Paterno. It is where the historic Biak-na-Bato Republic was established. Thousands of work animals, mostly carabaos, are led on a parade on the streets of the town every May 1415 to honor its patron saint, St. Isidro Labrador . The carabaos genuflect or kneel in front of the church and are decorated with garlands and shaved for the occasion.
NUEVA ECIJA 1. Camp Pangatian 2. General Luna Statue and Marker 3. Dalton Pass
Cabanatuan City Cabanatuan City Carranglan
The shrine now honors the brave rescue of 512 allied prisoners of war by Filipino guerillas led by the late Governor Eduardo L. Joson. The camp is a popular tourist destination area for veterans of World War II and their families who visit the country under the Reunion of Peace Program. A statue of General Luna astride a horse stands at the plaza of Cabanatuan City in front of the Cathe-dral. Gen. Luna was assassinated in the city which subsequently adopted him. Located in Capintalan, Carranglan, Nueva Ecija the place is about 5 hectares and accessible to any kind of transportation along the Maharlika Road. The place has a monument of General Dalton with the historical accounts of World War II.
PAMPANGA 1. San Pedro-Cutud Lentern Rites 2. Piyestang Tugak (Frog Festival)
San Fernando (Cutud, San Pedro) San Fernando
A re-enactment of Christ's passion and death is done every year during the lenten season. The re-enactment is complete with the passion play and culminates with the actual nailing of at least three flagellants on wooden crosses atop a makeshift calvary. Pyestang tugak started in 2003 to perpetuate the beautiful traditions that emerged through the years in catching and cooking frogs that used to abound in the rice fields of Pampanga. The citizens of San Fernando have reserved a special day every year to honor this amphibian because of its important contributions to the environment, the economy and culture. It also resembles the Fernandino in many ways, including its resiliency.

76 | Central Luzon Regional Development Plan 2017-2022
Name Location Description 3. Sisig Festival
4. Sinukwan Festival
5. Archdiocesian Museum & Archives
6. Giant Lantern Festival 7. Apo Fiesta
Angeles City San Fernando San Fernando San Fernando Angeles City
The annual "Sisig Festival" (Sadsaran Qng Angeles) is held every year during the month of December in Angeles City, Pampanga, celebrating the Kapampangan dish. It started in 2003 and was made an annual festival to promote the city's culinary prowess. The Sinukwan Festival relives the Kapampangan spirit with a week-long calendar of cultural revivals capped by a grand street-dance parade in the streets of San Fernando, with towns outdoing each other to the tune of “Atin Cu Pung Singsing.” The festival memorializes Aring Sinukwan, god of the ancient Kapampangans. This contains antiques and exquisite works of art depicting cultural heritage, inclination to humanities, artistic skills and Roman Catholic inspiration of the Pampangos. The museum is at the second floor of Guerero building in the University of the Assumption. The archdiocesan archives can be found at the ground floor of the Mother of Good Counsel Seminary. Days before Christmas, giant lanterns made of colored crepe and japanese paper with frames of intricate tinwires, structures containing electrical mechanisms, and a thousand bulbs highlight the San Fernando Giant Lantern Festival. The lanterns dance, blink and brilliantly twinkle in kaleidoscopic pattern in cadence with the band music. Celebrations begin with consecutive masses at the Holy Rosary Cathedral after which the faithful kiss the feet of the image of the reclining Christ.
TARLAC 1. Sto. Domingo Death March
Marker 2. Capas Death March Monument 3. Camp O'Donnell
Capas Capas
This is the site where about 60,000 Filipino soldiers were cramped like sardines in closed box-cars that were unloaded to start the second phase of the tragic Death March, which was about 1.5 km. north from Capas town proper. Even from the "disembarkation" point, more than 30,000 of these defenders of democracy perished from the inhuman treatment they were subjected to during the trip from Abucay and Mariveles, Bataan to San Fernando, Pampanga. This monument is a historical marker of the infamous concentration where nearly 30,000 Filipino and American soldiers that participated in the Death March perished in 1942. It depicts the endurance and heroism of valiant soldier-defenders three kilometers from the town proper along the highway. A name that rings a familiar if sad chord in the hearts of World War II veterans and orphans, O'Donnell is a sentimental must in the itinerary of history. A concentration camp and subsequently serving as burial grounds for thousands of Filipino soldiers who perished during the World War II, the site was the ultimate destination of the infamous Death March.

Chapter 7 Promoting Philippine Culture and Values | 77
Name Location Description 4. Tarlac Provincial Capitol and
Maria Cristina Park
Tarlac
An imposing historical landmark in the province is the seat of the provincial government, the Capitol Building. Constructed atop a hill, it provides a panoramic view of the town of Tarlac and its surrounding environs. It has ornamental plants abloom during most of the year. The construction of this edifice work was initiated by Governor Manuel de Leon in 1906, and it was completed under the governorship of the late Hon. Jose Espinosa in 1909. True to the vision of its founders, the CAPITOL today is a must in the provincial travel itinerary of domestic and foreign tourists.
ZAMBALES 1. Mt. Pinatubo 2. Binabayani 3. Kalighawan 4. Magsaysay Ancestral House
Botolan Subic Subic Castillejos
Made famous for its catastrophic eruption in 1991, it is now a source of travel and study among tourists and travelers visiting Central Luzon. Among the travel destinations covered by Mt. Pinatubo are Botolan Resettlement Sites in Taugtog, Loob-Bunga and Baquilan where one may indulge in community immersion with the culture-bound native Aetas; Bucao River, now completely covered with lahar, where one may engage in a walking Safari towards the foothills of the dreaded volcano; Pinatubo lake in San Mar-celino, Zambales to see a panoramic vista of the volcano and an opportunity to walk up to the Pi-natubo crater. A Zambales version of Ati-atihan, this is a war dance between the Christians and the Aetas, and is being celebrated every 30th of November during the feast of San Andres, patron saint of Masinloc. People believe that with Binabayani they are assured of bountiful harvest. Kalighawan, which means happiness, is a province wide festival of Zambales where in all the thirteen (13) municipalities participate. It includes a cleanliness and beautification contest and some other projects. It is celebrated every 2nd week of February at the capital town of Iba. An old house of late President Ramon Magsaysay that is found in Castillejos, Zambales, it is in need of being restored as a historical landmark and probable museum for Zambales.

78 | Central Luzon Regional Development Plan 2017-2022
Strategic Framework

Chapter 7 Promoting Philippine Culture and Values | 79
Subsector Outcome 1: Diverse cultures valued
Subsector Outcome 2: “Pagkamalikhain” or creative excellence advanced
Subsector Outcome 3: Values for the common good inculcated and lived

80 | Central Luzon Regional Development Plan 2017-2022
Subsector Outcome 4: Culture-sensitive governance and development strengthened

Chapter 7 Promoting Philippine Culture and Values | 81
Research and Development Agenda Study on how social values are being tackled in public institutions (i.e. schools)
Integration of Families Displaced by Armed Conflicts

82 | Central Luzon Regional Development Plan 2017-2022
RDP Targets Indicators
Baseline End of Plan Target
Agency Responsible Year Value
Sector Outcome: Philippine Culture and Values Promoted Subsector Outcome 1: Diverse cultures valued Number of cultural events and festivals Increasing DOT Number of cultural infrastructures Increasing Number of established cultural or tribal centers showcasing indigenous culture, arts, crafts and music
Increasing DOT-LGUs
Subsector Outcome 2: Values for the common good inculcated and lived
Percentage of schools conducted with culture-sensitivity and/or volunteerism trainings
100% DepED
Percentage of schools conducted with culture-sensitivity and/or volunteerism trainings
100% CHED
Percentage of RLAs conducted with culture-sensitivity and/or volunteerism trainings
100% CSC
Subsector Outcome 3: “Pagkamalikhain” or creative excellence advanced
Documentation of local artists Increasing LGUs Number of local exhibits of creative arts Increasing DOT-LGUs Subsector Outcome 4: Culture-sensitive governance and development strengthened
Percentage of LGUs with Local Culture and Arts Councils
Increasing DOT-LGUs


Chapter 8 Expanding Economic Opportunities in Agriculture and Fisheries | 87
8
Expanding Economic Opportunities in Agriculture and Fisheries Another pillar that supports PDP 2017-2022 is “Pagbabago”. This pillar seeks to reduce inequality among the people by providing equal economic opportunities to everyone. One way of accomplishing this goal is by ensuring food security, which is often associated with self-sufficiency especially for key food commodities such as rice, corn, livestock and poultry, fishery resources, among others. The Philippines has been increasing its efforts in providing affordable and accessible food. Central Luzon, as one of the country’s food baskets, has a major role in helping the country reach this goal.
This chapter considers the different elements of the Agriculture and Fisheries
subsectors and recommends strategies to guarantee the sectors’ growth for the
improvement of the well-being of poor farming/fishing communities particularly
in the rural and coastal areas.
Assessment and Challenges
Commodity Production
(MT) Contribution to
National (%) Rank
Rice 3,304,310 18 1 Corn 271,319 4 10 Onion 142,344 64 1 Lowland Veg. 117,696 23 1 Pork 422,534 20 1 Chevon 8,968 12 3 Chicken Meat 609,509 37 1 Chicken Eggs 91,125 21 2 Duck Meat 14,239 42 1 Duck Eggs 15,703 37 1 Tilapia 124,410 48 1 Black Tiger Prawn 24,165 49 1 Mudcrab 4,154 25 2 Milkfish 55,539 14 3

88 | Central Luzon Regional Development Plan 2017-2022
Province 2011 2012 2013 2014 2015 Total Average
Yield Area Yield Area Yield Area Yield Area Yield Area Yield Area Yield Area Aurora 85 23 91 24 88 22 95 23 87 22 446 114 89 23 Bataan 124 31 135 31 140 32 155 32 152 32 705 159 141 32 Bulacan 228 60 351 80 367 82 372 82 351 79 1,669 383 334 77
Nueva Ecija 1,313 287 1,587 304 1,673 315 1,931 318 1,581 308 8,085 1,533 1,617 307 Pampanga 310 69 388 84 420 91 433 92 426 90 1,977 426 395 85
Tarlac 451 117 549 124 585 135 639 136 570 134 2,794 646 559 129 Zambales 105 30 119 30 137 33 140 33 138 34 639 161 128 32
Total 2,616 617 3,221 677 3,409 711 3,765 717 3,304 700 16,316 3,421 3,263 684
2010 2011 2012 2013 2014 2015 Average Aurora 3.66 3.73 3.93 3.98 4.10 3.96 3.89 Bataan 4.16 3.97 4.33 4.34 4.80 4.76 4.39 Bulacan 3.77 3.78 4.41 4.47 4.54 4.43 4.23 Nueva Ecija 4.58 4.58 5.22 5.30 6.07 5.12 5.15 Pampanga 4.64 4.51 4.61 4.61 4.73 4.71 4.64 Tarlac 4.21 3.86 4.46 4.34 4.68 4.25 4.30 Zambales 3.81 3.46 3.94 4.14 4.19 4.10 3.94 Central Luzon 4.34 4.24 4.77 4.80 5.25 4.72 4.69

Chapter 8 Expanding Economic Opportunities in Agriculture and Fisheries | 89
2011 2012 2013 2014 2015
Target 4.85 5.2 5.11 5.2 5.28
Actual 4.85 5.2 5.16 5.53 5.73
4.4
4.6
4.8
5
5.2
5.4
5.6
5.8
Yie
ld p
er
he
cta
re

90 | Central Luzon Regional Development Plan 2017-2022
Crops Yield/Ha
(MT) Farmgate Price
per Kg (Php) Gross Value (Php '000)
Okra 13.74 22.82 313.54 Onion 13.25 31.43 416.54 Garlic 3.80 81.48 309.38
Eggplant 11.08 17.75 196.74 Rice 4.72 18.56 87.66
Commodity 2013 2014 2015 Total Share to
Grand Total (%)
Hog 362,341 380,674 422,534 1,165,549 92 Cattle 18,938 18,411 18,314 55,663 4 Goat 8,030 8,635 8,968 25,633 2 Carabao 6,537 6,914 6,886 20,337 2 Total 395,846 414,634 456,702 1,267,182 100

Chapter 8 Expanding Economic Opportunities in Agriculture and Fisheries | 91
0
50,000
100,000
150,000
200,000
250,000
300,000
350,000
400,000
450,0002
01
1
20
12
20
13
20
14
20
15
Zambales
Tarlac
Pampanga
Nueva Ecija
Bulacan
Bataan
Aurora0
100,000
200,000
300,000
400,000
500,000
600,000
700,000
20
11
20
12
20
13
20
14
20
15
Zambales
Tarlac
Pampanga
Nueva Ecija
Bulacan
Bataan
Aurora
259,399
269,560
278,047
263,282
272,652
250,000
255,000
260,000
265,000
270,000
275,000
280,000
2012 2013 2014 2015 2016
Vo
lum
e o
f P
rod
uc
tio
n
Year

92 | Central Luzon Regional Development Plan 2017-2022
Province Freshwater Fishpond
Brackishwater Fishpond
Total
Aurora 76.47 33.92 110.39 Bataan 94.22 4,097.8 4,192.02 Bulacan 605.43 11,678.58 12,284.01
Nueva Ecija 1,480.10 1,480.1 Pampanga 4,812.73 11,678.34 16,491.07
Tarlac 1,089.01 1,089.01 Zambales 153.18 1,552.98 1,706.16
Total 8,311.14 29,041.62 37,352.76

Chapter 8 Expanding Economic Opportunities in Agriculture and Fisheries | 93
Strategic Framework
94 | Central Luzon Regional Development Plan 2017-2022
Subsector Outcome 1: Agriculture and Fishery Sector Productivity Improved

Chapter 8 Expanding Economic Opportunities in Agriculture and Fisheries | 95
Subsector Outcome 2: Agriculture and Fishery-based Enterprises Increased
Subsector Outcome 3: Marketing and Financing Services Increased

96 | Central Luzon Regional Development Plan 2017-2022
Subsector Outcome 4: Adaptation to Climate Change Improved

Chapter 8 Expanding Economic Opportunities in Agriculture and Fisheries | 97
Research and Development Agenda Study of Rural Transportation Issues
Water Management in Agriculture
Industry analysis of Priority Agricultural Products of Central Luzon i.e., Bamboo and Cacao, and Other High Value Crops/Commodities

98 | Central Luzon Regional Development Plan 2017-2022
RDP Targets
Indicators Baseline End of Plan
Target 2022
Agency Responsible Year Value
Yield of major commodities (in metric tons per hectare) a. Palay 2016 4.75 Increasing PSA b. Corn 2016 5.47 Increasing PSA c. Onion 2015 15.65 Increasing PSA d. Mango 2015 2.05 Increasing PSA Volume of production (in thousand metric tons) a. Hog 2016 462.43 Increasing PSA b. Carabao 2016 6.77 Increasing PSA c. Cattle 2016 18.79 Increasing PSA d. Goat 2016 8.84 Increasing PSA e. Chicken 2016 590.99 Increasing PSA f. Chicken eggs 2016 93.56 Increasing PSA g. Duck 2016 12.39 Increasing PSA h. Duck eggs 2016 17.51 Increasing PSA i. Tilapia 2015 124.41 Increasing PSA j. Milkfish 2015 24.17 Increasing PSA k. Tiger prawn 2015 4.15 Increasing PSA l. Mudcrab 2015 55.54 Increasing PSA m. Municipal 2015 26.95 Increasing PSA n. Commercial 2015 6.60 Increasing PSA


Chapter 9 Expanding Economic Opportunities in Industry and Services through Trabaho at Negosyo | 101
9
Expanding Economic Opportunities in Industry and Services through Trabaho at Negosyo The CLRDP 2017-2022 aims to reduce inequality by expanding economic opportunities in Industry and Services through continuous support for the various sub-sectors that provide immense contributions to the regional output and that exhibit potential success in developing a globally competitive and resilient economy.
This chapter provides insights on how the different segments of society in Central Luzon may participate in the development process and share in the benefits of the strong growth of the Industry and Services sectors.
Assessment and Challenges
2011 2012 2013 2014 2015
Industry 16.61% 6.81% 1.96% 18.72% 3.80%
Services 9.39% 9.40% 9.68% 6.43% 6.79%
0%2%4%6%8%
10%12%14%16%18%20%

102 | Central Luzon Regional Development Plan 2017-2022
Other Regions, 486,564 ,
52%
NCR, 210,039 ,
22%
CALABARZON, 144,909 , 15%
Central Luzon, 105,476 , 11%
0 5 10 15 20 25 30
Others
Retailing
Services
Food Processing
Trading
20,000
21,000
22,000
23,000
24,000
25,000
26,000
27,000
1,120
1,140
1,160
1,180
1,200
1,220
1,240
1,260
1,280
1,300
2013 2014 2015
Ph
p m
illi
on
Jobs generated Domestic Sales

Chapter 9 Expanding Economic Opportunities in Industry and Services through Trabaho at Negosyo | 103
5,000
5,200
5,400
5,600
5,800
6,000
6,200
2012 2013 2014 2015
US
$ m
illi
on

104 | Central Luzon Regional Development Plan 2017-2022

Chapter 9 Expanding Economic Opportunities in Industry and Services through Trabaho at Negosyo | 105
0
50,000
100,000
150,000
200,000
250,000
2007 2008 2009 2010 2011 2012 2013 2014 2015
Ph
p m
illi
on
-
10,000
20,000
30,000
40,000
50,000
60,000
70,000
80,000
90,000
BOI PEZA CDC SBMA AFAB SME Dev't. &InvestmentFacilitation
BusinessName
Registration2012 2013 2014 2015

106 | Central Luzon Regional Development Plan 2017-2022

Chapter 9 Expanding Economic Opportunities in Industry and Services through Trabaho at Negosyo | 107
0
500,000
1,000,000
1,500,000
2,000,000
2,500,000
3,000,000
3,500,000
4,000,000
2012 2013 2014 2015
Total Domestic Foreign
68%
8%
7%
6%
5%3% 2%1%
Subic-Clark
Bataan
Pampanga
Zambales
Aurora
Bulacan
Tarlac
Nueva Ecija
Area Number
Aurora 255 Bataan 23,233 Bulacan 701 Nueva Ecija 18 Pampanga 224,481 Tarlac 952 Zambales 6,385 Subic-Clark 526,474

108 | Central Luzon Regional Development Plan 2017-2022
Region and Major Industry Group 2012 2013 2014
Region 3 - Central Luzon (All Industries) 3,877 3,990 4,118 Agriculture, Hunting and Forestry 753 777 769 Fishing and Aquaculture 67 68 63
Agriculture, Hunting and Forestry 820 845 832 Mining and Quarrying 12 13 17 Manufacturing 419 435 439 Electricity, Gas, Steam and Air Conditioning Supply 13 15 10 Water Supply; Sewerage, Waste Management and Remediation Activities 9 6 6 Construction 299 332 358
Industry 752 801 830 Wholesale and Retail Trade; Repair of Motor Vehicles and Motorcycles 800 812 876 Transportation and Storage 372 369 393 Accommodation and Food Service Activities 188 187 202 Information and Communication 40 36 44 Financial and Insurance Activities 52 54 60 Real Estate Activities 14 16 17 Professional, Scientific and Technical Activities 19 19 25 Administrative and Support Service Activities 104 121 111 Public Administration and Defense; Compulsory Social Security 176 169 161 Education 131 130 139 Human Health and Social Work Activities 46 49 51 Arts, Entertainment and Recreation 65 68 67 Other Service Activities 269 288 281 Activities of Households as Employers; Undifferentiated Goods and Service-producing Activities of Households for Own Use
29 26 29
Activities of Extraterritorial Organizations and Bodies - - - Service 2,305 2,344 2,456

Chapter 9 Expanding Economic Opportunities in Industry and Services through Trabaho at Negosyo | 109
Strategic Framework
Subsector Outcome 1:
Competitiveness and
Innovativeness of the Industry and
Services Sectors Increased

110 | Central Luzon Regional Development Plan 2017-2022

Chapter 9 Expanding Economic Opportunities in Industry and Services through Trabaho at Negosyo | 111
Subsector Outcome 2: Local and
Foreign Investments Increased
Subsector Outcome 3: Productivity,
Innovative Capacity and Resilience
of MSMEs Improved

112 | Central Luzon Regional Development Plan 2017-2022

Chapter 9 Expanding Economic Opportunities in Industry and Services through Trabaho at Negosyo | 113
Research and Development Agenda Growth of MSMEs
Promoting Entrepreneurial Learning
Impact of Financing Programs for Start-ups in Central Luzon
RDP Targets Indicators
Baseline End of Plan Target
Agency Responsible Year Value
Sector Outcome 1: Economic Opportunities in Industry and Services Sectors Expanded Manufacturing GVA as a proportion of GDP 2015 32.2 Increasing PSA Employment generated from Industry sector (in thousands)
2014 830 Increasing PSA
Employment generated from Services sector (in thousands)
2014 2,456 Increasing PSA
Subsector Outcome A: Competitiveness and innovativeness of Industries and Services sectors increased Industry and Services exports (US$ million) 2015 5,374.25
Increasing DTI on
monitoring Number of tourist arrivals (‘000 persons) 2015 3,596 Increasing DOT Number of DOT-accredited establishments 2015 143 Increasing DOT Subsector Outcome B: Local and Foreign Investments Increased Total approved investments (Php million) 2015 50,243.19 Increasing DTI on
monitoring Business Name Registration (BNR) 2015 13,267.92 Board of Investments 2015 20,785.52 Philippine Economic Zone Authority (PEZA) 2014 7,548.35 Subic Bay Metropolitan Authority (SBMA) 2015 4,095.80 Authority of Freeport Area of Bataan (AFAB) 2015 6,228.40 Others (SME Development, Big Tickets both Direct and Monitored)
2015 881.56
Sector Outcome 2: Access to economic opportunities for MSMEs in Industry and Services Increased Subsector Outcome: Productivity, innovative capacity and resilience of MSMEs increased SME assisted (number) 2015 10,390 Increasing DTI Jobs generated from MSMEs (‘000 persons) 2015 25,963 Increasing DTI Domestic sales generated by SMEs (Php million) 2015 1,273 Increasing DTI


Chapter 10 Accelerating Human Capital Development | 117
10
Accelerating Human Capital Development In support of the PDP 2017-2022 pillar “Pagbabago,” Central Luzon seeks to increase access to economic opportunities, particularly among subsectors and economic groups that lag behind. This may enable ordinary Filipinos to feel a “pagbabago” or change in their lives. One of the components of reducing inequality is strengthening human development outcomes.
This chapter provides strategies for accelerating human development by focusing on three sectors, namely: i) Nutrition and health, ii) Basic, Higher, and Technical Education, and iii) Labor and Employment.
Assessment and Challenges
Nutrition and Health
17.8
23.2
8.46.1
16.6
23.1
7.56
0
5
10
15
20
25
Underweight Stunting Wasting Overweight
2013 2015

118 | Central Luzon Regional Development Plan 2017-2022
2014 Actual 2015 Actual 2015 Target
Infant mortalityrate
4.86 4.14 4.53
Child mortalityrate
8.69 6.74 5.36
Maternalmortality rate
36.53 43 35.3
05
101520253035404550
Ra
te

Chapter 10 Accelerating Human Capital Development | 119
Aurora Bataan Bulacan Nueva Ecija Pampanga Tarlac Zambales
2013 675 2725 6963 6723 6491 3809 2224
2014 681 2815 8028 6954 6790 3781 2528
0
1,000
2,000
3,000
4,000
5,000
6,000
7,000
8,000
9,000

120 | Central Luzon Regional Development Plan 2017-2022
Basic, Higher, and Technical Education
Literacy Rate 2008 2013
Philippines Central Luzon
Philippines Central Luzon
Basic 95.6 97.8 96.5 98.2 Functional 86.4 92.1 90.3 92.3

Chapter 10 Accelerating Human Capital Development | 121
96.2291.75 89.74
97.88
0.82 0.44
95.64 92.32 90.52 94.61
0.39 1.44
0
20
40
60
80
100
120
Net enrolmentrate
Cohortsurvival rate
Completionrate
Graduationrate
Repetitionrate
Dropout rate
SY 2013-14 SY 2014-15
73.72
85.5 82.77
96.5
1.83 2.17
72.7982.62 80.2
89.75
0.83 2.92
0
20
40
60
80
100
120
Net enrolmentrate
Cohortsurvival rate
Completionrate
Graduationrate
Repetitionrate
Dropout rate
SY 2013-14 SY 2014-15
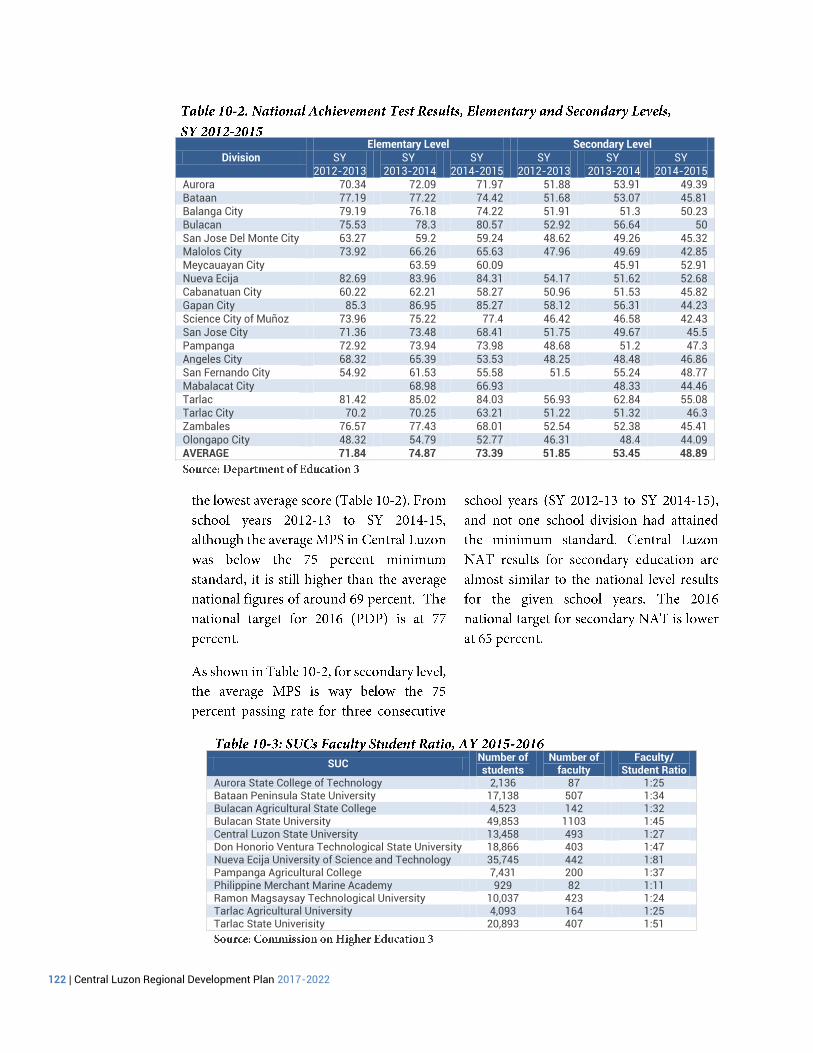
122 | Central Luzon Regional Development Plan 2017-2022
Division Elementary Level Secondary Level
SY 2012-2013
SY 2013-2014
SY 2014-2015
SY 2012-2013
SY 2013-2014
SY 2014-2015
Aurora 70.34 72.09 71.97 51.88 53.91 49.39 Bataan 77.19 77.22 74.42 51.68 53.07 45.81 Balanga City 79.19 76.18 74.22 51.91 51.3 50.23 Bulacan 75.53 78.3 80.57 52.92 56.64 50 San Jose Del Monte City 63.27 59.2 59.24 48.62 49.26 45.32 Malolos City 73.92 66.26 65.63 47.96 49.69 42.85 Meycauayan City 63.59 60.09 45.91 52.91 Nueva Ecija 82.69 83.96 84.31 54.17 51.62 52.68 Cabanatuan City 60.22 62.21 58.27 50.96 51.53 45.82 Gapan City 85.3 86.95 85.27 58.12 56.31 44.23 Science City of Muñoz 73.96 75.22 77.4 46.42 46.58 42.43 San Jose City 71.36 73.48 68.41 51.75 49.67 45.5 Pampanga 72.92 73.94 73.98 48.68 51.2 47.3 Angeles City 68.32 65.39 53.53 48.25 48.48 46.86 San Fernando City 54.92 61.53 55.58 51.5 55.24 48.77 Mabalacat City 68.98 66.93 48.33 44.46 Tarlac 81.42 85.02 84.03 56.93 62.84 55.08 Tarlac City 70.2 70.25 63.21 51.22 51.32 46.3 Zambales 76.57 77.43 68.01 52.54 52.38 45.41 Olongapo City 48.32 54.79 52.77 46.31 48.4 44.09 AVERAGE 71.84 74.87 73.39 51.85 53.45 48.89
SUC Number of students
Number of faculty
Faculty/ Student Ratio
Aurora State College of Technology 2,136 87 1:25 Bataan Peninsula State University 17,138 507 1:34 Bulacan Agricultural State College 4,523 142 1:32 Bulacan State University 49,853 1103 1:45 Central Luzon State University 13,458 493 1:27 Don Honorio Ventura Technological State University 18,866 403 1:47 Nueva Ecija University of Science and Technology 35,745 442 1:81 Pampanga Agricultural College 7,431 200 1:37 Philippine Merchant Marine Academy 929 82 1:11 Ramon Magsaysay Technological University 10,037 423 1:24 Tarlac Agricultural University 4,093 164 1:25 Tarlac State Univerisity 20,893 407 1:51

Chapter 10 Accelerating Human Capital Development | 123
Higher Education
Technical Education
TVET enrollees TVET graduatesTVET programs
assessed TVET programs
certified
2014 Actual 252,529 232,391 150,679 139,191
2015 Actual 299,988 305,270 176,739 162,373
2015 Target 181,915 176,455 116,426 102,454
0
50,000
100,000
150,000
200,000
250,000
300,000
350,000

124 | Central Luzon Regional Development Plan 2017-2022
Labor and Employment
11.113.0 15.9
14.3 13.516.1
8.5 9.0 8.7 8.1 7.86.6
2011 2012 2013 2014 2015 2016
Underemployment Rate (%)
Unemployment Rate (%)

Chapter 10 Accelerating Human Capital Development | 125
Strategic Framework
Subsector Outcome 1: Enhanced and sustained quality care for all life stages guaranteed

126 | Central Luzon Regional Development Plan 2017-2022
Subsector Outcome 2: Access to functional service delivery network ensured

Chapter 10 Accelerating Human Capital Development | 127
Subsector Outcome 3: Health financing sustained
Subsector Outcome 4: Quality, accessible, relevant, and liberating basic education for all ensured

128 | Central Luzon Regional Development Plan 2017-2022
Subsector Outcome 5: Quality of higher and technical education for equity and global competitiveness improved
Subsector Outcome 6: Employability increased and productivity improved

Chapter 10 Accelerating Human Capital Development | 129
Subsector Outcome 7: Labor mobility and income security enhanced
130 | Central Luzon Regional Development Plan 2017-2022
Research and Development Agenda
Survey on Public Basic Emergency
Obstetric and Newborn Care
(BEmONC) services
Curriculum restructuring:
technology-enriched, value-laden,
community-involved, and industry-
linked
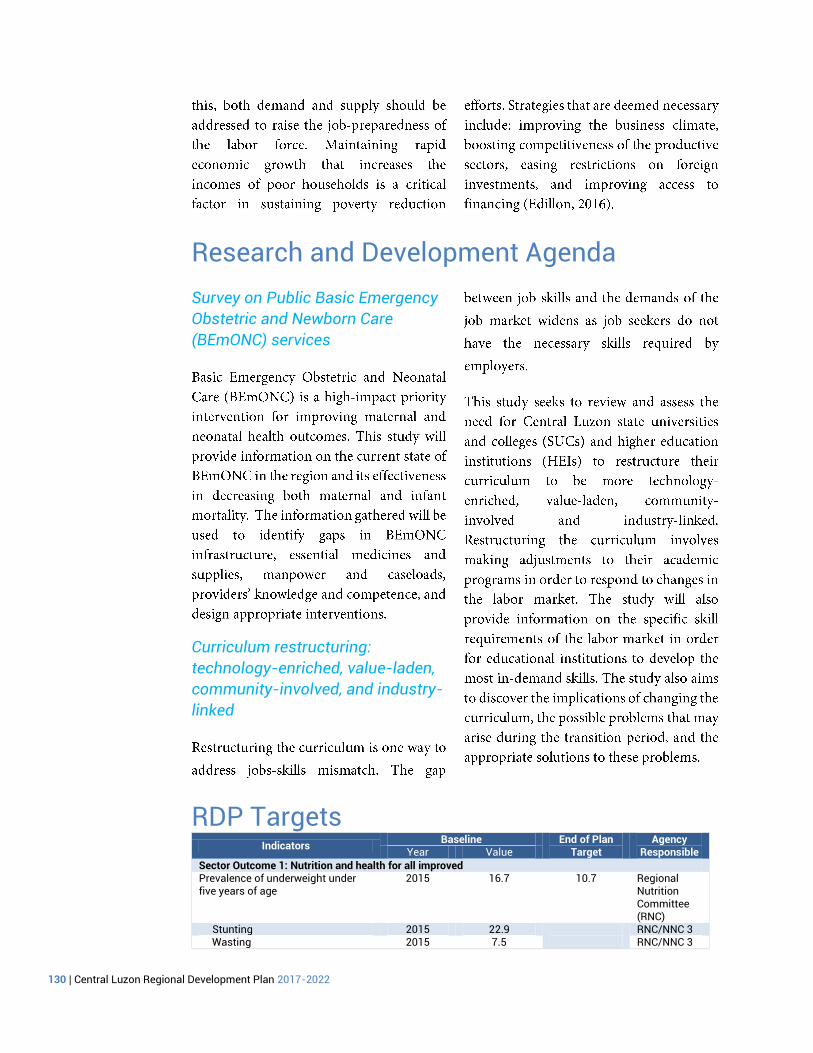
RDP Targets Indicators
Baseline End of Plan Target
Agency Responsible Year Value
Sector Outcome 1: Nutrition and health for all improved Prevalence of underweight under five years of age
2015 16.7 10.7 Regional Nutrition Committee (RNC)
Stunting 2015 22.9
RNC/NNC 3 Wasting 2015 7.5 RNC/NNC 3

Chapter 10 Accelerating Human Capital Development | 131
Indicators Baseline End of Plan
Target Agency
Responsible Year Value Overweight 2015 5.9 Decreasing or
No increase in prevalence
RNC/NNC 3 Maternal mortality rate 2015 43 DOH 3 Infant mortality rate 2015 4.14 DOH 3 Under-five mortality rate 2015 DOH 3 Child mortality rate 2015 6.74 DOH 3 Contraceptive prevalence rate (%) 2015 36.38 65 DOH 3 Facility-based delivery ratio (%) 2015 89.55 90 HIV/AIDS cases 2015 0.03 Maintain less
than 1% of the population prevalence rate
DOH 3
Teenage pregnancy cases (no.) 2015 23,674 NHIP coverage rate 2015 76.5 100% PhilHealth 3 Total fertility rate 2013 2.8 2.1 DOH 3,
POPCOM, RPRH-RIT Members, LGUs and other concerned stakeholders
Unmet need for family planning For limiting For spacing
2013
13.1 6.8 6.3
Zero unmet need by 2018 (poor population) and by 2022 (all population)
Sector Outcome 2: Lifelong learning opportunities for all ensured (Basic, Higher and Technical Education) Net enrolment rate (%)
Elementary
Secondary
SY 2015-
2016
93.85 75.47
98.67 80.08
DepED 3
Completion rate (%) Elementary
Secondary
SY 2015-
2016
89.14 72.44
89.06 76.87
DepED 3
Cohort survival rate (%) Elementary Secondary
SY 2015-
2016
93.16 80.52
98.86 85.44
DepED 3
Achievement rate (%) Elementary Secondary
SY 2015-
2016
73.39 48.89
84.19 77.69
DepED 3
Drop-out rate (%) Elementary Secondary
SY 2015-
2016
1.31 3.28
1.01 1.78
DepED 3
Literacy rate Simple Functional
2013
98.2 92.3
Increasing
DepED 3
Higher education enrolment (no.) AY 2015-2016
362,743 Increasing CHED 3
Higher education graduates (no.) AY 2015-2016
67,503 Increasing CHED 3
No. of enrolled in TVET programs 2016 226,054 256,708 TESDA 3 No. of graduates in TVET programs 2016 224,467 231,037 TESDA 3 No. of persons assessed in TVET programs
2016 121,587 161,726 TESDA 3
No. of persons certified in TVET programs
2016 103,349 137,467 TESDA 3
TVET certification rate (%) 2016 85 85 TVET employment rate (%) 2016 61 65 TESDA 3 Sector Outcome 3: Income earning abilities increased (Labor and Employment) Employment rate 2016 93.4 95.1 DOLE 3/
NEDA 3 Unemployment rate 2016 6.6 4.9 DOLE 3/
NEDA 3 Underemployment rate 2016 16.1 Decreasing DOLE 3/
NEDA 3


Chapter 11 Reducing Vulnerabilities of Individuals and Families | 135
11
Reducing the Vulnerability of Individuals and Families Reducing inequality also entails reducing the vulnerability of individuals and families (social protection), and communities (housing) because vulnerability and poverty are closely linked. This chapter contributes to the desired goal of reducing inequality in human development by providing guidelines in building socio-economic resiliency through the following sectors: i) Social Protection, and ii) Shelter Security.
Assessment and Challenges
Social Protection
MDG target by 2015 Year
Subsistence Incidence
among population
Poverty incidence
among population
6.6% subsistence incidence among population
2015 3 11.2
17.75% poverty incidence among population
2012 3.8 12.9
2009 4.3 13.7

136 | Central Luzon Regional Development Plan 2017-2022
2011 2012 2013 2014 2015
Pantawid Pamilya 25,327 194,095 254,368 287,901 292,161
SEA-K/SLP 2,862 3,855 5,892 5,414 10,757
Supplemental Feeding 136,766 158,974 153,396 144,389 137,914
Social Pension 8,472 11,072 14,174 22,327 74,837
-
50,000
100,000
150,000
200,000
250,000
300,000
350,000
No
. o
f B
en
efi
cia
rie
s
Area No. of
Beneficiaries Program Amount
(Php)
Central Luzon 292,161 3,035,963,500.00 Aurora 8,231 95,392,100.00 Bataan 17,723 188,111,200.00 Bulacan 69,012 724,220,700.00 Nueva Ecija 85,797 847,505,300.00 Pampanga 52,418 559,354,100.00 Tarlac 39,770 422,011,600.00 Zambales 19,210 199,368,500.00

Chapter 11 Reducing Vulnerabilities of Individuals and Families | 137
Aurora Bataan BulacanNueva Ecija
Pampanga Tarlac Zambales
Level 1 26 1,165 1,534 8,871 633 1,172 1,125
Level 2 5,891 14,173 48,038 60,296 41,912 32,816 15,374
Level 3 1,976 2,014 13,170 6,021 6,584 3,430 1,480
-
10,000
20,000
30,000
40,000
50,000
60,000
70,000
5%
82%
13%
Level 1 Level 2 Level 3

138 | Central Luzon Regional Development Plan 2017-2022
0
5,000
10,000
15,000
20,000
25,000
2011 2012 2013 2014 2015

Chapter 11 Reducing Vulnerabilities of Individuals and Families | 139
Strategic Framework

140 | Central Luzon Regional Development Plan 2017-2022
Subsector Outcome: Universal and transformative social protection for all achieved
Research and Development Agenda
Assessment of management of social protection institutions in Central Luzon (i.e. GSIS, SSS, ECC, PhilHealth, HDMF, OWWA)
Key Drivers of Poverty Reduction

Chapter 11 Reducing Vulnerabilities of Individuals and Families | 141
RDP Targets Indicators
Baseline End of Plan Target (2022)
Agency Responsible Year Value
Subsector Outcome: Universal and transformative social protection program for all Filipino Poverty incidence Among population Among families
2015
11.2 8.9
7.9 6.4
DSWD/ PSA/ NEDA 3
Subsistence incidence Proportion of poor senior citizens covered by social pension
2016 69,352 beneficiaries
110,380 beneficiaries (3% increase per year
DSWD 3
Percentage of poor families covered by Philhealth as identified under the Listahanan and LGU Sponsored Program
2016 100% or 322,622 of the
Listahanan I identified HHs
(PhilHealth, GAA, DSWD
Listahanan II data)
100% or 244,593 of the Listahanan II identified HH (PhilHealth GAA, DSWD Listahanan II data)
DSWD 3
Coverage of emergency employment programs during crisis (economic, financial, disaster-related)
2016 13,436 HH for microenterprise
development and 6,591 HH for employment facilitation
Proportion of individuals affected by natural and man-made calamities provided relief assistance
2016 100% of the affected families
provided with relief assistance
(30% from the DSWD and 70%
from the affected LGUs as per guidelines)
100% of the affected families provided with relief assistance (40% from the DSWD and 60% from the affected LGUs)
DSWD 3


Chapter 12 Building Safe and Secure Communities | 145
12
Building Safe and Secure Communities The quality of shelter and the kind of communities people live in can be either a source of vulnerability or a means to enhance both development opportunities and human development outcomes. This chapter contributes to the desired goal of reducing inequality in human development by highlighting strategies to support marginalized sectors, local governments, and the private sector in building safe and secure communities that will allow more families to enjoy a matatag, maginhawa, at panatag na buhay—strongly-rooted, comfortable and secure—as part of building socioeconomic resilience.
Assessment and Challenges
Regions Initial needs
(as of Jan 1, 2011)
Incremental housing need
2011 2012 2013 2014 2015 2016 Total
PHILIPPINES 1,225,343 688,318 701,396 714,723 728,302 742,140 756,241 5,556,463 NCR 292,234 56,087 57,153 58,239 59,346 60,473 61,622 645,154 CAR 10,861 9,060 9,233 9,408 9,587 9,769 9,954 67,872 Region I 55,312 36,135 36,822 37,521 38,234 38,961 39,701 282,686 Region II 30,323 25,964 26,457 26,960 27,472 27,994 28,526 193,696 Region III 101,441 63,151 64,351 65,574 66,820 68,089 69,383 498,809 CALABARZON 135,068 82,250 83,813 85,406 87,028 88,682 90,367 652,614 MIMAROPA 28,931 27,491 28,013 28,546 29,088 29,641 30,204 201,914 Region V 61,738 46,599 47,484 48,386 49,305 50,242 51,197 354,950 Region VI 85,425 55,426 56,479 57,552 58,646 59,760 60,896 434,185 Region VII 79,815 50,248 51,203 52,176 53,167 54,177 55,207 395,993 Region VIII 41,081 37,380 38,090 38,814 39,551 40,303 41,069 276,288 Region IX 38,322 31,411 32,007 32,615 33,235 33,867 34,510 235,967 Region X 52,094 35,347 36,019 36,703 37,401 38,111 38,836 274,512 Region XI 66,099 42,139 42,940 43,756 44,587 45,435 46,298 331,255 Region XII 54,442 36,344 37,035 37,739 38,456 39,186 39,931 283,133 Caraga 29,572 23,011 23,448 23,894 24,347 24,810 25,281 174,362 ARMM 62,584 23,886 24,340 48,370 25,274 25,754 26,243 236,451
Source: Housing and Urban Development Coordinating Council (December 2013)

146 | Central Luzon Regional Development Plan 2017-2022
Strategic Framework

Chapter 12 Building Safe and Secure Communities | 147
Subsector Outcome: Access to affordable, adequate, safe, and secure shelter expanded

148 | Central Luzon Regional Development Plan 2017-2022
Research and Development Agenda
Assessment of Various Socialized Housing Programs in Central Luzon
Impact assessment of the provision of adequate and decent housing on poverty and social outcomes in the region
RDP Targets Indicators
Baseline End of Plan Target (2022)
Agency Responsible Year Value
Subsector Outcome: Access to affordable, adequate, safe, and secure shelter expanded
Total housing need 2011-2016 498,809 Decreasing HUDCC Number of informal settler families
2016 117,670 Decreasing NHA
Proportion of urban population living in slums
Decreasing


Chapter 13 Reaching for the Demographic Dividend | 153
13
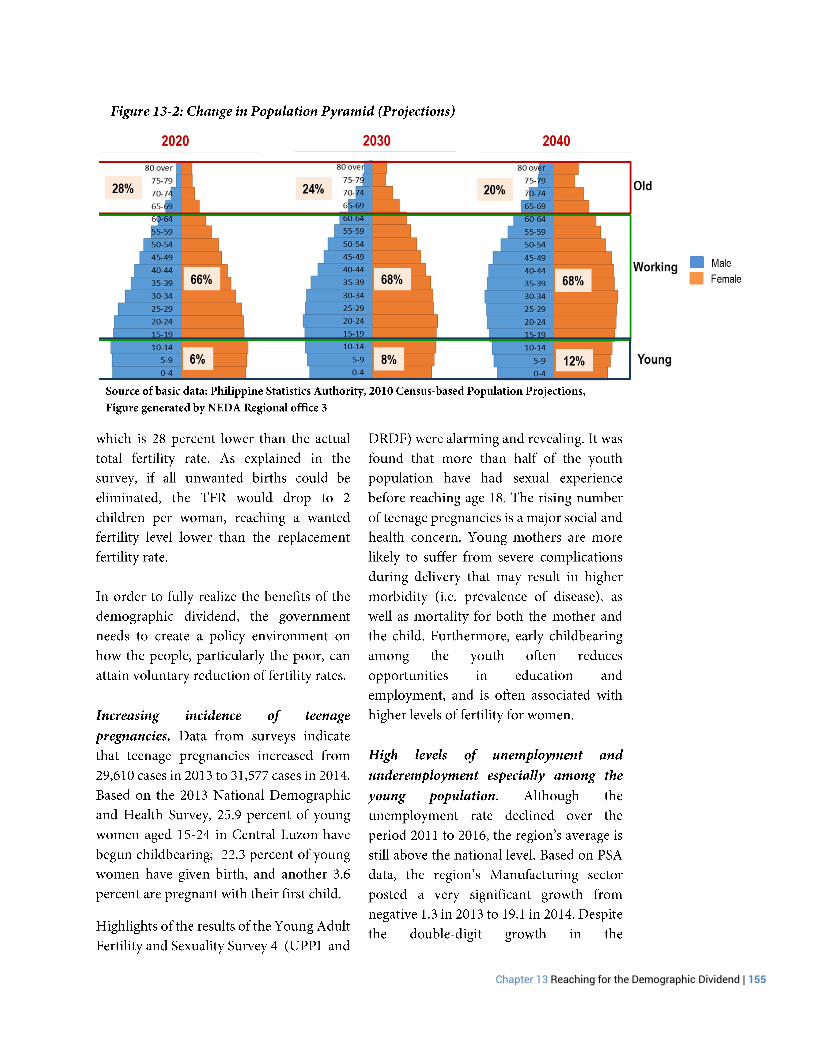
Reaching for the Demographic Dividend “Patuloy na Pag-unlad” or Increasing Growth Potential is the third development pillar that supports PDP 2012-2017. This intermediate goal can be further accelerated by maximizing the gains from the demographic dividend—economic growth fuelled by population growth. The United Nations Population Fund (UNFPA) defined demographic dividend as “a boost in economic productivity that occurs when there are growing number of people in the work force relative to the number of dependents.” As stated in the PDP 2017-2022, the demographic dividend stems from the demographic transition when fertility (birth) and mortality (death) rates decline. Because of this transition, the age distribution changes to an extent that less spending is required to meet the needs of the youngest and oldest age groups. This demographic transition needs to be observed and carefully planned for in order to enable the economy to harvest the demographic dividend. Optimizing the demographic dividend is one of the key strategies to be implemented at the national and sub-national levels. This chapter provides an overview of the key challenges and corresponding strategies to ensure that as the demographic window opens, human capital will become highly productive and not only boost economic growth but also reduce poverty. Assessment and Challenges

154 | Central Luzon Regional Development Plan 2017-2022
Chapter 13 Reaching for the Demographic Dividend | 155

156 | Central Luzon Regional Development Plan 2017-2022
Strategic Framework
Subsector Outcome 1: Quality of human capital improved
Chapter 13 Reaching for the Demographic Dividend | 157
Subsector Outcome 2: Unemployment and underemployment among the young population reduced

158 | Central Luzon Regional Development Plan 2017-2022
Research and Development Agenda
Study on factors influencing high youth unemployment in the region
Study on the high teen pregnancy rates in Central Luzon
RDP Targets Indicators
Baseline End of Plan Target Agency Responsible Year Value
Subsector Outcome 1: Quality of human capital improved
Total fertility rate 2013 2.8 2.1 DOH 3/ POPCOM 3
Total wanted fertility rate 2013
2.0 Equals total fertility rate
DOH 3/ POPCOM 3
Contraceptive prevalence rate 2013 61.2 65 DOH 3/ POPCOM 3
Unmet need for family planning -limiting -spacing
2013
13.1 6.8 6.3
Zero unmet need by 2018 (poor population) and by 2022 (all population)
DOH 3/ POPCOM 3
Maternal mortality rate 2015 43 Decreasing or no increase in prevalence
DOH 3
Teenage pregnancy cases 2015 23,674 Decreasing DOH 3/ POPCOM 3
National achievement test results -elementary -secondary
SY 2014-2015
73.39 48.89
Within the 75% minimum standard
DepED 3
Subsector Outcome 2: Youth unemployment reduced
Young adult unemployment rate 2013 21.1 Decreasing PSA Higher education graduates (no.) 2015-
2016 67,503 Increasing CHED 3
TVET employment rate TESDA 3


Chapter 14 Vigorously Advancing Science, Technology and Innovation | 161
14
Vigorously Advancing Science, Technology and Innovation Science, technology and innovation (STI) is a vital foundation for future economic development. The present administration has given importance to the promotion of science, technology, and the creative arts to enhance innovation and creative capacity towards self-sustaining and inclusive development and has made it an integral element of its 0-10 point Socio-Economic Agenda. STI also plays an important role in achieving the region’s sustainable and inclusive development objectives. Access to new and appropriate technologies can drive productivity, build skills, and create jobs that can ultimately improve living conditions and help reduce poverty. Long-term investments in building local STI capacity can lead to innovations to benefit existing firms, create new firms or even build entirely new industries that can provide high-quality jobs for the people in the region. Technology adoption also allows the region’s industries and people to access foreign technologies to benefit from innovations created in other countries. STI can also lead to the creation of new public goods and services that will allow Central Luzon to better address development needs, especially of the disadvantaged in the areas of health, education, energy, disaster resiliency, and climate change adaptation, among others. Due to the long gestation period involved in developing this capacity, it is important to sow these early. This chapter discusses the priority strategies and outcomes needed to increase the region’s potential growth though innovation, which will build the foundation for a globally competitive knowledge economy.
Assessment and Challenges

162 | Central Luzon Regional Development Plan 2017-2022

Chapter 14 Vigorously Advancing Science, Technology and Innovation | 163

164 | Central Luzon Regional Development Plan 2017-2022

Chapter 14 Vigorously Advancing Science, Technology and Innovation | 165
Strategic Framework
Subsector Outcome 1: Increased STI utilization in agriculture, industry, and services sectors

166 | Central Luzon Regional Development Plan 2017-2022
Technology adoption promoted and accelerated
Sector Outcome Innovation stimulated
STI utilization in agriculture, industry and
services sectors
increased
Subsector
Outcome
Investments in STI-based
start-ups, enterprises
and spin offs increased
Creative capacity for knowledge
and technology generation, acquisition,
and adoption enhanced
Open collaboration among actors
in the STI ecosystem
strengthened
Increasing Growth Potential Intermediate Goal
Matatag, Maginhawa at Mapanatag na Buhay Long Term Vision 2040
Overall Goal 2022
To Lay Down a Foundation for Inclusive Growth, a High Trust and Resilient Society, and a
Globally Competitive Knowledge Economy

Chapter 14 Vigorously Advancing Science, Technology and Innovation | 167
Subsector Outcome 2: Increased investments in STI-based start-ups, enterprises and spin-offs
Subsector Outcome 3: Enhanced creative capacity for knowledge and technology generation, acquisition and adoption

168 | Central Luzon Regional Development Plan 2017-2022

Chapter 14 Vigorously Advancing Science, Technology and Innovation | 169

170 | Central Luzon Regional Development Plan 2017-2022
Subsector Outcome 4: Strengthened open collaboration among actors in the STI ecosystem

Chapter 14 Vigorously Advancing Science, Technology and Innovation | 171
RDP Targets
Indicators Baseline End of Plan
Target Agency
Responsible Year Value Proportion of high tech agriculture, industry and services value added in sectoral value added
-- No data To be determined
Share of agriculture, forestry and fisheries and industry and services R&D to sectoral Gross Value Added
-- No data To be determined
Total number of Filipino patent registered
2016 31 42
Total number of Filipino utility model registered
2016 555 833
Total number of Filipino industrial design registered
2016 516 691
Percent of Technology Business Incubations locators that graduated
-- No data To be determined
R&D expenditure as proportion of GDP 2013 0.14 0.50 WEF-Global Competitiveness Report (GCR) Innovation Ranking among ASEAN member rankings
2016 5/7 Improved
Researchers (in full time equivalent) per million population
2013 270 300
WED-GCR Technological Readiness Ranking among ASEAN member countries
2016 4/7 Improved
Number of Technology Transfer Agreements
-- No data To be determined
Number of scientific articles published by Filipino authors
2013 To be determined


Chapter 15 Ensuring Sound Macroeconomy | 177
15
Ensuring Sound Macroeconomy In order to achieve the region’s intermediate goals of reducing inequality and increasing growth potential, Central Luzon needs to sustain a stable, sound, and supportive macroeconomic and financial climate. Providing this economic environment sends a clear signal to the private sector to confidently invest and create jobs in the region. Macroeconomic stability is a keystone in generating investments and fuelling economic growth. This chapter lays down the strategies for the region to continue capitalizing on its robust economy so that all the sectors of society, especially the poor, will share in the fruits of its growth.
Assessment and Challenges
Population and GRDP Growth Targets

178 | Central Luzon Regional Development Plan 2017-2022
7.1 7.2
4.5
9.3
5.3
9.5
6.9 7.3 7.3 7.46.8
7.3
0.0
2.0
4.0
6.0
8.0
10.0
12.0
2011 2012 2013 2014 2015 2016 2017 2018 2019 2020 2021 2022
5.14.4
2.5
7.3
4.6
7.9
0
2
4
6
8
10
2011 2012 2013 2014 2015 2016

Chapter 15 Ensuring Sound Macroeconomy | 179
Sect
or
2011
20
12
2013
20
14
2015
20
16
Ave
. GR
2010
-201
5 in
Php
m
illio
n %
Sh
are
in P
hp
mill
ion
%
Shar
e in
Php
m
illio
n %
Sh
are
in P
hp
mill
ion
%
Shar
e in
Php
m
illio
n %
Sh
are
in P
hp
mill
ion
%
Shar
e I.
AG
RIC
ULT
UR
E, H
UN
TIN
G,
FOR
ESTR
Y A
ND
FIS
HIN
G
89,6
46
16.4
97
,832
16
.8
103,
125
1
7.0
11
4,64
9 1
7.1
11
5,32
7 1
6.4
11
6,05
3 15
.0
4.3
a.
Agr
icul
ture
and
Fo
rest
ry
70,8
61
13
79,0
64
13.6
83
,943
1
3.8
95
,400
1
4.3
96
,200
1
3.7
97
,056
12
.6
5.3
b.
Fis
hing
18
,785
3.
4 18
,768
3.
2 19
,182
3
.2
19,2
49
2.9
19
,126
2
.7
18,9
96
2.5
(0.1
) II.
IN
DU
STR
Y 23
3,02
1 42
.6
245,
523
42.2
4
9,26
3
41.
0
88,
953
4
3.2
3
08,3
78
43.
8
358,
837
46.4
9.
8 a.
M
inin
g an
d Q
uarr
ying
2,
155
0.4
3,05
3 0.
5 3,
730
0.6
3,
404
0.5
2,
071
0.3
2,
493
0.3
11.5
b.
Man
ufac
turin
g 18
7,73
6 34
.3
194,
000
33.4
19
1,42
5 3
1.5
22
7,99
7 3
4.1
24
3,91
5 3
4.6
28
6,41
4 37
.0
10.3
c.
C
onst
ruct
ion
30,8
37
5.6
35,4
54
6.1
38,2
43
6.3
40
,542
6
.1
45,0
58
6.4
47
,996
6.
2 7.
9 d.
E
lect
ricity
, Gas
and
W
ater
Sup
ply
12,2
94
2.2
13,0
16
2.2
15,8
64
2.6
17
,010
2
.5
17,3
33
2.5
21
,932
2.
8 10
.4
III.
SER
VIC
ES
224,
163
41
238,
027
40.9
25
4,86
0 4
2.0
26
5,38
6 3
9.7
28
0,57
9 3
9.8
29
8,38
5 38
.6
5.6
a.
Tra
nspo
rt, S
tora
ge
& C
omm
unic
atio
n 54
,102
9.
9 57
,274
9.
9 59
,519
9
.8
62,3
40
9.3
67
,102
9
.5
70,2
95
9.1
5.0
b.
Tra
de a
nd R
epai
r of
Mot
or V
ehic
les,
M
otor
cycl
es, P
erso
nal
and
Hou
seho
ld G
oods
46,4
02
8.5
49,4
88
8.5
528,
769
8.7
53
,577
8
.0
55,9
42
7.9
58
,978
7.
6 4.
6
c.
Fin
anci
al
Inte
rmed
iatio
n 31
,728
5.
8 34
,211
5.
9 38
,688
6
.4
43,2
65
6.5
45
,734
6
.5
48,7
14
6.3
9.0
d.
Rea
l Est
ate,
R
entin
g an
d B
usin
ess
Act
iviti
es
42,1
44
7.7
451,
672
7.8
49,4
62
8.1
51
,329
7
.7
54,7
91
7.8
57
,780
7.
5 6.
5
e.
Pub
lic
Adm
inis
trat
ion
& D
efen
se, C
ompu
lsor
y So
cial
Sec
urity
13,0
70
2.4
13,8
86
2.4
14,4
30
2.4
15
,032
2
.2
15,2
32
2.2
16
,088
2.
1 3.
6
f.
Oth
er S
ervi
ces
36,7
16
6.7
38,0
02
6.5
39,8
86
6.6
39
,840
6
.0
41,7
77
5.9
46
,527
6.
0 4.
2

180 | Central Luzon Regional Development Plan 2017-2022
Revenues
Province 2013 2014 2015 Aurora 539.11 591.90 674.34 Bataan 1,228.45 1,607.66 1,701.27 Bulacan 2,690.55 3,256.54 3,588.73 Nueva Ecija 1,798.42 2,031.23 2,298.45 Pampanga 1,897.42 2,194.94 2,393.06 Tarlac 1,413.27 1,588.56 1,828.31 Zambales 942.18 1,089.95 1,143.49 Central Luzon 10,509.40 12,360.78 13,627.65

Chapter 15 Ensuring Sound Macroeconomy | 181
Wages and Labor Productivity
Prices and Inflation
Source: BLGF

182 | Central Luzon Regional Development Plan 2017-2022
Financial Inclusion
Banking System
Commodity Group 2014 2015
Average Inflation Rate 3.6 1.3
I. Food and Non-Alcoholic Beverages 6.3 2.9
II. Alcoholic Beverages and Tobacco 3.0 5.4
III. Clothing and Footwear 2.3 2.3
IV. Housing, Water, Electricity, Gas and Other
Fuel
1.3 (2.1)
V. Furnishings, Household Equipment, and
Routine Maintenance of the House
1.1 1.1
VI. Health 3.2 1.6
VII. Transport 1.6 (1.0)
VIII. Communication (1.1) (0.9)
IX. Recreation and Culture 2.1 1.3
X. Education 7.1 5.2
XI. Restaurants, Miscellaneous Goods &
Services
1.1 0.7
28%
26%17%
11%
8%7%
2%Pampanga
Bulacan
Nueva Ecija
Tarlac
Zambales
Bataan
Aurora
Total No. of Banks = 1,088

Chapter 15 Ensuring Sound Macroeconomy | 183
Cooperatives
Strategic Framework
Area
2014 2015
Total
Universal
and
Commercial
Banks
Thrift
Banks
Rural and
Cooperative
Banks
Total
Universal
and
Commercial
Banks
Thrift
Banks
Rural and
Cooperative
Banks
Central Luzon 1,033 490 211 332 1,088 510 232 346
Aurora 18 3 4 11 19 3 6 10
Bataan 77 30 20 27 79 30 24 25
Bulacan 271 130 77 64 285 141 80 64
Nueva Ecija 177 73 32 72 190 76 35 79
Pampanga 291 149 45 97 306 153 49 104
Tarlac 112 54 18 40 117 55 20 42
Zambales 87 51 15 21 92 52 18 22
Source: Bangko Sentral ng Pilipinas

184 | Central Luzon Regional Development Plan 2017-2022
Subsector Outcome 1: Governance Improved
Subsector Outcome 2: Access to Financing Improved

Chapter 15 Ensuring Sound Macroeconomy | 185
Research and Development Agenda
Transforming RDC into an Effective National Government Resource Mobilizer: Ensuring Fiscal Sustainability
Best practices in Local Government Public Finance Management

186 | Central Luzon Regional Development Plan 2017-2022
Impact of Financing Programs for Start-ups in Central Luzon
RDP Targets
Indicators Baseline End of Plan
Targets Agency
Responsible Year Value
Sector Outcome 1: Stable, Sound, and Supportive Regional Macroeconomic and Financing Climate Sustained GRDP growth rate (high case scenario at constant prices)
2015 5.3 7.3
GRDP growth rate (low case scenario at constant prices)
2015 5.3 6.3
GRDP per capita growth rate 2015 4.6 6.5
Agriculture, fishery and forestry output (growth rate)
2015 0.6 6.0 PSA
Industry output (growth rate) 2015 6.7 8.2 PSA
Services output (growth rate) 2015 5.7 6.8 PSA
Low and stable inflation rate 2015 1.3 Decreasing PSA
Subsector Outcome A: Governance Improved
Regional revenue generation of provinces (Php million)
2015 13,627.6 Increasing BLGF
Average IRA dependency ratio (%) 2015 79 Decreasing BLGF
Subsector Outcome B: Access to Financing Improved
Number of registered cooperatives
2016 88 Increasing CDA
Average number of banks per province
2015 73 Increasing BSP
Number of ATMs 2015 1,569 Increasing BSP
Loans-to-deposits ratio 2015 24 Increasing BSP


Chapter 16 Leveling the Playing Field through a National Competition Policy | 189
16
Leveling the Playing Field through a National Competition Policy Competitiveness is the ability of a nation to produce, under free and fair market conditions, goods and services which meet the test of international markets while simultaneously maintaining and expanding real incomes of its people over the long term (Dimian & Danciu, 2011). Competitiveness can be studied and monitored at the firm level and the local or national level. Enhancing the competitiveness of local government units encourages them to have a supportive economic environment, to generate and sustain high employment, and to improve the standard of living of their people. Competition at the firm level allows the market to perform better by providing an equal chance for all firms, regardless of size and type, to fairly operate and grow. It induces productivity by providing a wider array of goods and services that buyers or consumers can take advantage of; hence, it may potentially result in lower prices and improved quality for consumers. The enactment of Republic Act (RA) No. 10667 or the Philippine Competition Act (PCA) on July 21, 2015 reinforces the efforts of the government to sustain inclusive economic growth. The PCA provides for the formulation of a National Competition Policy (NCP) which aims to steer the regulations and administrative procedures of government agencies toward promoting competition, strengthening the enforcement of anti-trust laws, and effectively ensuring competitive neutrality. This chapter provides guidelines for improving consumer welfare and enhancing market productivity by detailing strategies that support the Philippine Competition Act.
Assessment and Challenges

190 | Central Luzon Regional Development Plan 2017-2022
Province 2016
Ranking
2015
Ranking
Aurora 63 49
Bataan 7 13
Bulacan 24 44
Nueva Ecija 39 47
Pampanga 32 18
Tarlac 51 62
Zambales 71 28

Chapter 16 Leveling the Playing Field through a National Competition Policy | 191
Strategic Framework
Subsector outcome 1: Anti-competitive practices diminished
Subsector outcome 2: Barriers to entry reduced

192 | Central Luzon Regional Development Plan 2017-2022
Subsector outcome 3: Limits to entrepreneurship reduced

Chapter 16 Leveling the Playing Field through a National Competition Policy | 193
Research and Development Agenda
Future Competitiveness Scenarios of Central Luzon Provinces
RDP Targets
Indicators Baseline End of Plan
Target Year Value
Sector Outcome 1: Consumer Welfare Improved
Sector Outcome 2: Market Efficiency Improved
Provincial Competitiveness Rankings
- Aurora 2016 63 Increasing
- Bataan 2016 7 Increasing
- Bulacan 2016 24 Increasing
- Nueva Ecija 2016 39 Increasing
- Pampanga 2016 32 Increasing
- Tarlac 2016 51 Increasing
- Zambales 2016 71 Increasing


Chapter 17 Attaining Just and Lasting Peace | 199
17
Attaining Just & Lasting Peace In order for a region to flourish, development should be inclusive and sustainable. One of the Sustainable Development Goals included in the development agenda of the PDP 2017-2022 is the promotion of peaceful and inclusive societies. Peace and order is also part of the President’s 0-10 point Socio-economic Agenda. This chapter provides the framework for achieving the desired intermediate goal of building the foundations for inclusive and sustainable development by providing strategies to accomplish just and lasting peace.
Assessment and Challenges

200 | Central Luzon Regional Development Plan 2017-2022

Chapter 17 Attaining Just and Lasting Peace | 201
Strategic Framework
Subsector Outcome: Just and lasting peace achieved

202 | Central Luzon Regional Development Plan 2017-2022

Chapter 17 Attaining Just and Lasting Peace | 203
Research and Development Agenda
Emerging Peace and Security Threats in Central Luzon
RDP Targets Indicators
Baseline End of Plan Target
Agency Responsible Year Value
Number of barangays with BPATs 2015 3,058 Increasing PNP Number of NPA Remnant Events 2017 83 Decreasing NOLCOM Number of Manpower 2016 169 Decreasing NOLCOM Number of Firearms 2016 127 Decreasing NOLCOM


Chapter 18 Ensuring Security, Public Order and Safety ꟾ 207
18
Ensuring Security, Public Order and Safety Security and public order play important roles in laying the foundations for sustainable development. These are likewise critical in establishing inclusive growth and building a high-trust and resilient society. This chapter also supports the PDP 2017-2022 development agenda of promoting peaceful and inclusive societies for sustainable development at all levels. As such, this chapter shall contribute to the intermediate goals of enhancing the social fabric, reducing inequality, and increasing growth potential by providing strategies for safeguarding security, public order, and safety.
Assessment and Challenges
Criminality
2013 2014 2015
Central Luzon 1:1,491 1:1,351 1:1,198
Aurora 1:416 1:384 1:353
Bataan 1:1,401 1:1,223 1:1,179
Bulacan 1:2,338 1:2,097 1:1,911
Nueva Ecija 1:1,330 1:1,214 1:1,012
Pampanga 1:2,189 1:1,950 1:1,664
Angeles City 1:897 1:838 1:775
Tarlac 1:1,195 1:1,095 1:941
Zambales 1:1,125 1:1,026 1:975
Olongapo City 1:759 1:685 1:653

208 ꟾ Central Luzon Regional Development Plan 2017-2022
Detention centers and facilities
22
,82
6
22
,12
8
20
,16
9
38
,32
9
14
,50
2
42
,72
2
Index Crimes Non-Index Crimes
2013 2014 2015
2013 2014 2015
Total Crime Volume 44,954 58,498 57,224
Average Monthly Crime Rate
(%)
33.39 43.45 42.51
Crime Clearance Efficiency (%) 28.29 54.15 67.15
Crime Solution Efficiency (%) 19.99 42.91 53.61
85
34
9
35
8
56
8
52
4
41
2
30
6

Chapter 18 Ensuring Security, Public Order and Safety ꟾ 209
The fight against illegal drugs
Fire hazards
Province
2013 2014 2015
Average Jail
Population
Ideal
Capacity
Occupancy
Rate (%)
Average Jail
Population
Ideal
Capacity
Occupancy
Rate (%)
Average Jail
Population
Ideal
Capacity
Occupancy
Rate (%)
Aurora 5 6 85 5 6 81 4 6 61
Bataan 1,362 390 349 1,669 390 428 2,034 390 521
Bulacan 507 142 358 561 142 396 957 142 675
Nueva Ecija 1,227 216 568 1,449 216 671 1,709 216 791
Pampanga 2,353 449 524 2,537 449 565 2,989 449 666
Tarlac 290 70 412 320 70 455 430 70 612
Zambales 806 263 306 803 263 305 932 263 354
690
983
1,718
437
1,003
1,392
184
1,206
1,867
2013
2014
2015
Pushers Users Pushers and Users

210 ꟾ Central Luzon Regional Development Plan 2017-2022
Strategic Framework
Subsector Outcome: National Security, Public Order and Safety ensured
2013 2014 2015
No. of BFP
Personnel
Firemen to
Population Ratio
No. of BFP
Personnel
Firemen to
Population Ratio
No. of BFP
Personnel
Firemen to
Population Ratio
Central Luzon 1,304 1:8,603 1,287 1:8,717 1,462 1:7,673
Aurora 62 1:3,457 64 1:3,349 74 1:2,896
Bataan 128 1:5,943 123 1:6,184 134 1:5,676
Bulacan 264 1:12,470 256 1:12,860 276 1:11,928
Nueva Ecija 318 1:6,766 311 1:6,918 338 1:6,365
Pampanga 285 1:9,157 289 1:9,030 334 1:7,814
Tarlac 141 1:9,688 135 1:10,119 175 1:7,806
Zambales 106 7773 109 1:7,559 131 1:6,289
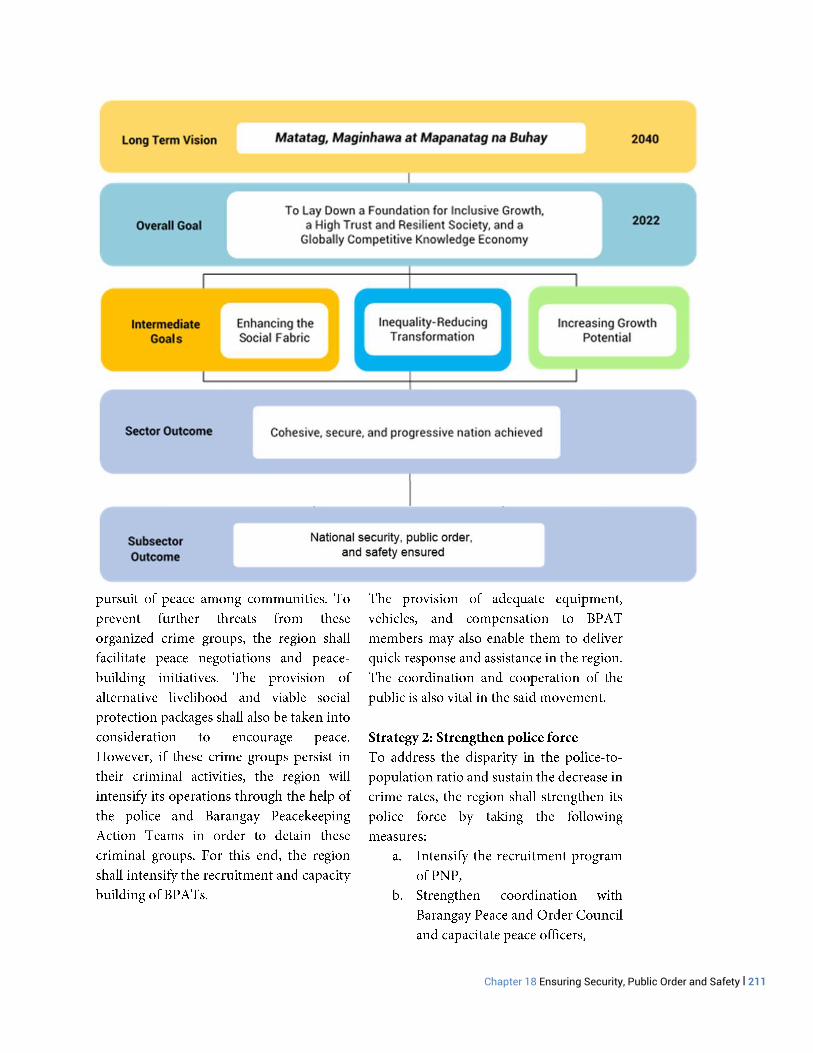
Chapter 18 Ensuring Security, Public Order and Safety ꟾ 211

212 ꟾ Central Luzon Regional Development Plan 2017-2022

Chapter 18 Ensuring Security, Public Order and Safety ꟾ 213
Research and Development Agenda Assessment of program on drug surrenderers
RDP Targets
Indicators Baseline End of Plan
Target Agency
Responsible Year Value Number of barangays with BPATs 2015 3,058 Increasing PNP Average Monthly Crime Rate 2015 42.51 Decreasing PNP Crime Clearance Efficiency 2015 67.15 Increasing PNP Crime Solution Efficiency 2015 53.61 Increasing PNP Police-to-Population Ratio 2015 1:1,198 Decreasing PNP Occupancy/congestion Rate of Prisons and Detention Centers
2015 426% Decreasing BJMP
Number of fire incidences 2015 1,751 Decreasing BFP Number of LGUs without fire stations 2015 13 Decreasing BFP Firemen-to-population ratio 2015 1:7,673 Decreasing BFP


Chapter 19 Accelerating Infrastructure Development | 217
19
Accelerating Infrastructure Development Enhancing infrastructure is one of the key drivers toward a progressive and well-developed economy. Investments in infrastructure are essential to attaining sustainable development and empowering the community. This chapter aims to provide the principles for achieving and sustaining the high growth trajectory that will reduce inequality and increase potential growth in the region.
Assessment and Challenges
Internal access and connectivity
CAR NCR NIR I II III IV-A IV-B V VI VII VIII IX X XI XII XIII
Average IRI 6.88 4.69 4.93 4.1 4.88 3.92 4.11 5.3 4.22 5.22 4.23 3.48 4.16 4.9 4.23 4.36 4.94
0
1
2
3
4
5
6
7
8
IRI
Va
lue
Good
Fair
Poor

218 | Central Luzon Regional Development Plan 2017-2022
Region/ Province Paved Unpaved
Total % Paved Concrete Asphalt Gravel Earth
Central Luzon 1,109.21 1,153.65 81.84 - 2,344.70 96.51
Aurora 198.12 5.90 51.16 - 255.18 79.95
Bataan 142.70 158.40 22.40 - 323.50 93.08
Bulacan 178.77 164.16 - - 342.93 100.00
Nueva Ecija 251.73 266.27 7.39 - 525.39 98.59
Pampanga 170.50 158.67 0.89 - 330.06 99.73
Tarlac 157.88 217.97 - - 375.85 100.00
Zambales 9.51 182.28 - - 191.79 100.00

Chapter 19 Accelerating Infrastructure Development | 219
Expressway Road Distance (Km) Remarks
North Luzon
Expressway (NLEx)
83.7 2-8 lanes divided expressway connecting
Manila and Pampanga
Subic-Tipo
Expressway
8.8 Two (2) lane expressway traversing the
provinces of Zambales and Bataan
NLEx Spur Road
(Bulacan)
0.1 The Tabang Spur road connects with NLEx-
Tabang Exit and Maharlika Highway going to
Cagayan Valley
Subic-Clark-Tarlac
Expressway
(SCTEx)
93.77 Four (4)-lane expressway north of Manila
Tarlac-
Pangasinan-La
Union (TPLEx)
41 (Tarlac Section) Four (4)-lane expressway north of Manila
Central Luzon Link
Expressways
(CLLEx)
66.4 Detailed Engineering Design ongoing
Total 269.77 --
Region Motor Vehicles Registered
2015 2016 %INC (DEC)
CAR 60,965 73,179 20.0
I 275,014 298,206 8.4
II 240,489 234,737 -2.4
III 581,886 599,311 3.0
IV-A 620,511 652,342 5.1
NCR 1,288,730 1,342,021 4.1
PHILIPPINES 4,797,839 5,037,586 5.0

220 | Central Luzon Regional Development Plan 2017-2022
Flight Classification 2014 2015
Flight Passenger Cargo Tonnage Flight Passenger Cargo Tonnage Total 6,651 877,757 47,982 6,057 868,528 35,012 Domestic 936 90,948 1,280 948 41,824 2,217 International 5,715 786,809 46,702 5,709 826,704 32,795

Chapter 19 Accelerating Infrastructure Development | 221
Water Resources
0
20,000
40,000
60,000
80,000
100,000
120,000
140,000
2011 2012 2013 2014 2015
Year
Port Operator Container Traffic
Actual Capacity
Manila International Container terminal (MICT)
International Container Terminal Services Inc. (ICTSI)
1,960,699 2,500,000
Manila North Harbor (domestic)
Manila North Harbor Port Inc. (MNHPI)
1,137,455 2,000,000
Manila South Harbor Asian Terminals Inc. (ATI)
877,593 1,200,000
Batangas Port ATI 188,077 350,000 Subic Port ICTSI 123,558 600,000

222 | Central Luzon Regional Development Plan 2017-2022
Phil NCR CAR I II III IVA IVB V
85 9077
91 96 99 9178 79
Phil NCR CAR I II III IVA IVB V
9498
87
99 99 99 99
87 86

Chapter 19 Accelerating Infrastructure Development | 223
Energy
Project Name Cost
(Php billion)
Implementation
Period Status
Pampanga Delta Development Project (PDDP) Flood Control
Component
2.9 1993-2002 Completed
PHUMP 1 1.8 1996 – 2001 Completed
PHUMP 2 3.1 1999 – 2006 Completed
PHUMP 3 4.9 2014 – 2018 Completed
PHUMP 4 3.3 2017 – 2019 On-going
Rio Chico River Improvement Project 0.5 2014 – 2018 with initial
implementation
Tarlac River Overall Improvement Works 10.7 2014 – 2018 F/S updating
ongoing
Dinalupihan-Hermosa Flood Control and Regional
Development Plan Project
3.3 2014 – 2018 WALPP
TOTAL 30.5 -- --
Coal, 38.0%
Natural Gas, 23.2%
Hydro, 18.1%
Oil Based, 13.4%
Geothermal, 5.8%
Wind, 0.9% Solar

224 | Central Luzon Regional Development Plan 2017-2022
Plant Type 2014 2013 Difference
GWh %Share GWh %Share GWh %
Coal 27,346 48.17 25,756 46.98 1,591 6.18
Oil-based 2,342 4.13 1,601 2.92 742 46.34
Natural Gas 18,686 32.92 18,783 34.26 (98) -0.52
Geothermal 3,817 6.72 3,399 6.2 419 12.32
Hydro 4,357 7.68 5,156 9.4 (798) -15.49
Wind 152 0.27 66 0.12 86 131.59
Biomass 65 0.11 60 0.11 6 9.35
Total Generation 56,766 54,820 1,947 3.55
Sector Installed Capacity
(MW) as of 2010
Target Capacity Addition by Total Capacity Addition
(MW) 2011-2030
Total Installed
Capacity by 2030 2015 2020 2025 2030
Geothermal 899.0 100.0 720.0 - - 820.0 1,719.0
Hydro 2,346.0 182.0 2,169.5 1,510.0 - 3,861.5 6,207.5
Biomass 9.0 97.3 - - - 97.3 106.3
Wind 33.0 841.0 840.0 432.0 - 2,103.0 2,136.0
Solar - 228.1 - - - 228.1 228.1
Ocean - - 35.5 - - 35.5 35.5
Total 3,287.0 1,438.4 3,765.0 1,942.0 - 7,145.4 10,432.4

Chapter 19 Accelerating Infrastructure Development | 225
Infrastructure support for agriculture and fisheries
Province Connections
Potential Served
Aurora 49,700 47,658 96%
Bataan 181,300 178,244 98%
Nueva Ecija 393,200 364,718 93%
Pampanga 356,600 349,201 98%
Tarlac 243,900 239,068 98%
Zambales 141,600 136,991 97%
Total 1,366,300 1,315,880 96%
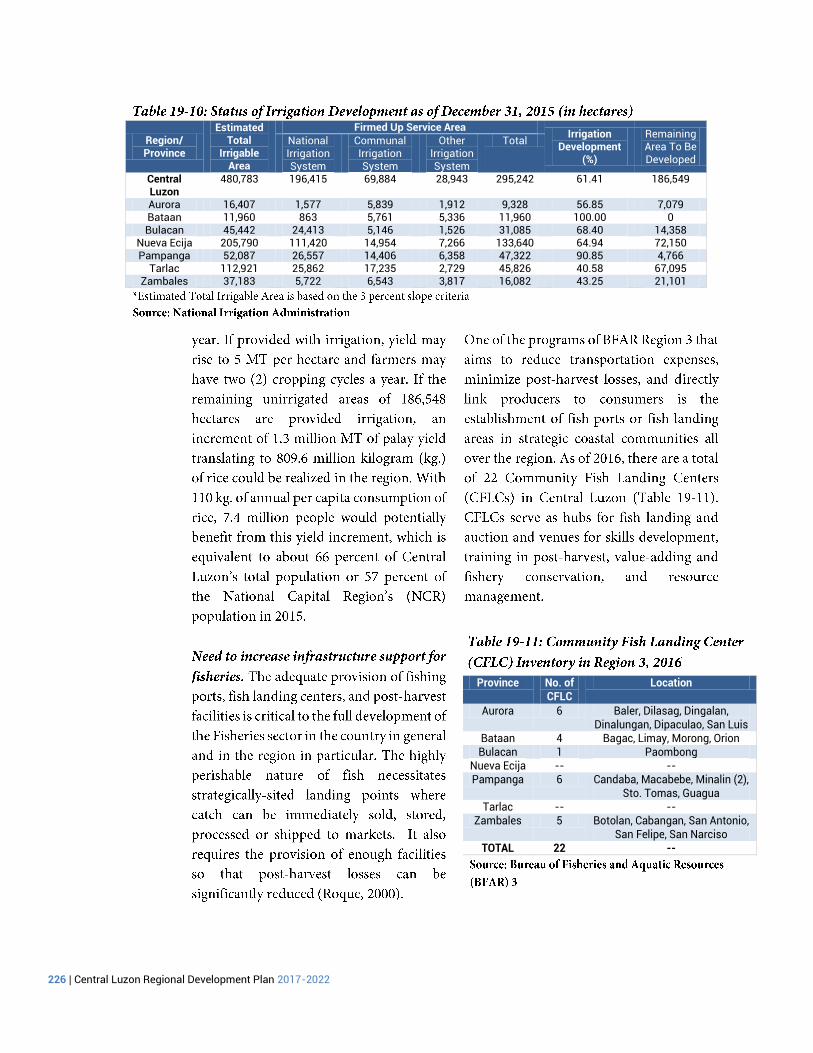
226 | Central Luzon Regional Development Plan 2017-2022
Region/ Province
Estimated Total
Irrigable Area
Firmed Up Service Area Irrigation
Development (%)
Remaining Area To Be Developed
National Irrigation System
Communal Irrigation System
Other Irrigation System
Total
Central Luzon
480,783 196,415 69,884 28,943 295,242 61.41 186,549
Aurora 16,407 1,577 5,839 1,912 9,328 56.85 7,079 Bataan 11,960 863 5,761 5,336 11,960 100.00 0 Bulacan 45,442 24,413 5,146 1,526 31,085 68.40 14,358
Nueva Ecija 205,790 111,420 14,954 7,266 133,640 64.94 72,150 Pampanga 52,087 26,557 14,406 6,358 47,322 90.85 4,766
Tarlac 112,921 25,862 17,235 2,729 45,826 40.58 67,095 Zambales 37,183 5,722 6,543 3,817 16,082 43.25 21,101
Province No. of CFLC
Location
Aurora 6 Baler, Dilasag, Dingalan, Dinalungan, Dipaculao, San Luis
Bataan 4 Bagac, Limay, Morong, Orion Bulacan 1 Paombong
Nueva Ecija -- -- Pampanga 6 Candaba, Macabebe, Minalin (2),
Sto. Tomas, Guagua Tarlac -- --
Zambales 5 Botolan, Cabangan, San Antonio, San Felipe, San Narciso
TOTAL 22 --

Chapter 19 Accelerating Infrastructure Development | 227
Information and Communications Technology (ICT) Infrastructure
Region Population(estimated) Installed Lines Subscribed Lines Teledensity
Installed Subscribed
CAR 1,833,760 68,958 41,371 3.76 2.26
I 5,573,460 105,226 62,508 1.89 1.12
II 3,594,040 32,380 23,596 0.90 0.66
III 10,931,380 304,600 190,563 2.79 1.74
IV 16,233,460 617,656 329,301 3.80 2.03
V 6,164,700 108,061 57,566 1.75 0.93
NCR 12,086,820 3,707,882 1,827,859 30.68 15.12
TOTAL 101,174,880 5,940,741 3,196,747 5.87 3.16

228 | Central Luzon Regional Development Plan 2017-2022
Social Infrastructure
Region AM FM TV CATV TV Relay TV Translator DTU/DBS MMDS TOTAL
NCR 31 24 23 55 0 0 1 3 138
CAR 12 26 11 19 4 6 0 0 78
I 38 54 24 19 4 6 0 0 221
II 21 56 29 66 3 4 0 1 180
III 17 40 23 177 2 9 3 0 271
IV 38 104 47 269 7 3 1 0 469
V 38 102 48 114 6 7 0 0 315

Chapter 19 Accelerating Infrastructure Development | 229
Region / Province School Buildings Classrooms
Central Luzon 259 1,017
Aurora 6 15
Bataan 34 75
Bulacan 106 574
Nueva Ecija 56 144
Pampanga 29 121
Tarlac 10 24
Zambales 18 64
Source: Department of Education (DepEd)
Province Cost No. of Programmed
Facilities
Status
Completed Ongoing Not started
Aurora 4,279,091.67 3 3 - -
Bataan 995,000.00 2 2 - -
Bulacan 18,415,655.04 17 13 4 -
Nueva Ecija 17,558,636.85 15 14 1 -
Pampanga 13,741,464.75 13 12 1 -
Tarlac 265,237,729.54 9 8 1 -
Zambales 7,145,295.51 6 6 - -
TOTAL 327,372,873.36* 65 58 7 -

230 | Central Luzon Regional Development Plan 2017-2022
Protective and Governance Infrastructures
Province Cost No. of Programmed
Facilities
Status
Completed Ongoing Not started
Aurora - - - - -
Bulacan 7,500,000.00 5 5 - -
Nueva Ecija 9,000,000.00 6 6 - -
Pampanga 5,766,000.00 4 4 - -
Tarlac 1,500,000.00 1 1 - -
Zambales 1,500,000.00 1 1 - -
TOTAL 25,266,000.00* 17 17 - -
3632
3697
3761
3826
3890
3,500
3,600
3,700
3,800
3,900
4,000
2012 2013 2014 2015 2016

Chapter 19 Accelerating Infrastructure Development | 231
Environmental management
Infrastructure Planning and Management
Province Number Municipality
Aurora 3 Casiguran, Dilasag,
Dinalungan
Bataan -
Bulacan 1 Dona Remedios
Trinidad
Nueva Ecija 5 Bongabon, Carranglan,
Gabaldon, Nampicuan,
Pantabangan
Pampanga -
Tarlac 2 Anao, Pura
Zambales 2 Cabangan, San Narciso
Total 13 --

232 | Central Luzon Regional Development Plan 2017-2022
Strategic Framework
Subsector Outcome 1: Enhanced Growth and Productivity

Chapter 19 Accelerating Infrastructure Development | 233

234 | Central Luzon Regional Development Plan 2017-2022

Chapter 19 Accelerating Infrastructure Development | 235
Road Classification Functional Role
HSH1/ Toll Expressways
1. North Luzon Expressway (NLEx)
2. NLEx Extension to Tabang (Tabang Spur Road)
3. Tipo-Subic Expressway
4. Tarlac-Pangasinan-La Union Expressway (TPLEx)
5. Subic-Clark-Tarlac Expressway (SCTEx)
6. Central Luzon Link Expressway (CLLEx)
HSH 2/ North-South Backbone
7. Manila North Road (MNR)/ MacArthur Highway
8. Cagayan Valley Road (CVR)/ Maharlika Highway
9. Plaridel Bypass Road
East-West lateral
10. Gapan-San Fernando-Olongapo Road
11. Iba-Tarlac-Sta. Rosa-Pantabangan-Baler Road
12. Capas-Botolan Road
13. Sta. Cruz – Mangatarem Road
Strategic Road
14. Baler-Casiguran Road
15. Dinadiawan- Maddela Road
16. Olongapo-Bugallon Road
17. Roman Highway
18. Mariveles-Bagac Road
19. Angeles-Dinalupihan
20. Bagac-Morong-Subic Road
National Secondary and Local Roads
21. Key provincial, city, municipal, and tourism road links
22. Key barangay and farm-to-market (FMR) roads
Interregional connectivity
Internal access & circulation
-do-
Interregional connectivity
-do-
-do-
Interregional connectivity
-do-
-do-
Internal access & circulation
-do-
-do-
Interregional connectivity
Internal access & circulation
Interregional connectivity
-do-
Internal access & circulation
-do-
-do-
-do-
- do-
- do-

236 | Central Luzon Regional Development Plan 2017-2022
Road Classification Recommended measures to improve LOS
HSH 1/ Toll Expressways
Address traffic bottlenecks and widen NLEx to accommodate the traffic from SLEx-NLEx connector, CLLEx, TPLEx, SCTEx and other major roads
Rehabilitate and widen the connecting roads leading to and from tollway exits and entries
Continue implementing integrated ticketing systems (e.g. electronic and manual) for all tollways in Central Luzon to lessen queuing time in toll booths and plazas
Conduct preparatory studies and integrated master planning activities for new tollways in Central Luzon and the greater capital to include but not limited to i) Cavite-Manila-Bataan Expressway; ii) Manila Bay Bridge to connect Bataan, Corregidor, and Cavite
HSH 2/ North-South Arterial Backbone
Continue the rehabilitation and widening activities in MNR and CVR
Construct additional bypasses, flyovers, or underpass structures in major urban centers (e.g. Tarlac City & Gapan City) along CVR and MNR
Secure or fence the RROW of, and regulate the number of new intersections along the new Plaridel bypass road to sustain the LOS it currently provides
East-West Laterals Complete the rehabilitation and widening activities in GSO road all the way to Gapan City
Widen and flood-proof the Tarlac-Sta. Rosa section and fully pave the all-weather sections of Pantabangan-Baler road of the Iba-Baler lateral road link
Implement the Capas-Botolan road to fully integrate Zambales into the regional economy and open the western seaboard to development
Complete the Sta. Cruz-Mangatarem road to develop the Zambales northern tip through its integration with south-western Pangasinan and northern Tarlac
Strategic Roads
Complete the remaining unpaved sections of Baler-Casiguran road
Widen congested sections of the Olongapo-Bugallon road Complete the widening and rehabilitation of Roman highway to link Bataan freeport, the
industrial areas and urban centers in Bataan to GSO road and SCTEx Fully pave the Mariveles-Bagac Road and Bagac-Morong-Subic Road to fully open
western areas of Bataan peninsula to development Implement regular road maintenance activities in Angeles-Dinalupihan road
Pursue the Tourism Road Infrastructure Program (TRIP) of DPWH Local Roads Key provincial, city, municipal, and local tourism road links, including critical barangay
and farm-to-market (FMR) roads will be prioritized for inclusion in the local infrastructure support programs of national agencies

Chapter 19 Accelerating Infrastructure Development | 237

238 | Central Luzon Regional Development Plan 2017-2022

Chapter 19 Accelerating Infrastructure Development | 239

240 | Central Luzon Regional Development Plan 2017-2022

Chapter 19 Accelerating Infrastructure Development | 241
Subsector Outcome 2: Improved Basic and Social Infrastructure Services

242 | Central Luzon Regional Development Plan 2017-2022

Chapter 19 Accelerating Infrastructure Development | 243

244 | Central Luzon Regional Development Plan 2017-2022
Subsector Outcome 3: Improved Resiliency

Chapter 19 Accelerating Infrastructure Development | 245
Subsector Outcome 4: Enhanced Environmental Quality

246 | Central Luzon Regional Development Plan 2017-2022
Subsector Outcome 5: Enhanced Infrastructure Planning and Management

Chapter 19 Accelerating Infrastructure Development | 247
Research and Development Agenda
Integrated land use and transportation master plan study for the major urban centers and interregional transportation hubs of Central Luzon
A study evaluating the feasibility of establishing a Bus-Rapid Transit (BRT) system as an affordable alternative to a mass rail transit in Metro Clark Area (MCA)

248 | Central Luzon Regional Development Plan 2017-2022
Market hinterland expansion and logistics development study for Clark International Airport (CRK)
A comprehensive study on the renewable energy (RE) potentials of Central Luzon
Transbasin water resources study for power generation, irrigation, and water supply
A study to identify climate adaptation pathways to address localized urban inundation and basin-wide flooding through non-structural interventions
RDP Targets
Indicators Baseline End of Plan
Target Agency
Responsible Year Value
Subsector Outcome 1: Enhanced Growth and Productivity Percent paved national road to total
national road in kilometers
2015 96.51 100 DPWH
Percent of permanent bridge to total
bridge along national roads
2015 100 100 DPWH
Average International Roughness Index
(IRI)
2016 3.92 3.0 DPWH

Chapter 19 Accelerating Infrastructure Development | 249
Indicators Baseline End of Plan
Target Agency
Responsible Year Value
Number of Motor Vehicles Registered 2016 599,311 decreasing LTO
Annual international and domestic
passenger traffic in Clark International
Airport (CRK)
2015 868,528 increasing CIAC
Annual international and domestic flights
in CRK
2015 6,057 Increasing CIAC
Annual international and domestic cargo
tonnage at CRK (number)
2015 35,012 Increasing CIAC
Volume of containerized cargoes handled
(TEU) in Subic Port
2015 123,558 160,625 (5% annual increase)
SBMA
Subic Port utilization rate (in percent) 2015 21 Increasing SBMA
Percentage of HHs provided with electric
power supply
2015 96 100 DOE
Percent of established post-harvest
facilities (unit)
2015 1,023 Increasing BFAR
Community Fish Landing Centers (CFLCs) 2016 22 Increasing BFAR
Number of LGUs with free public wifi
services
2016 14 Increasing DICT
Average broadband speed (in Mbps) 2016 4.3 (national average)
Increasing DICT
Subsector Outcome 2: Improved Basic and Social Infrastructure Services Proportion of families with access to safe
water supply (in %)
2014 99 100 PSA
Percentage of irrigated area out of total
irrigable area
2016 48.63 58.80 NIA/NIA-UPRIIS
Classroom backlogs in the region 2014 1,017 decreasing DepEd
Number of Health Facility Enhancement
Program (HFEP) facilities established
2015 75 increasing DOH
Housing backlogs 2016 498,809 decreasing NHA
Proportion of fire-truck to population
(ideal 1:28,000)
2016 1:37,150 1:28,000 BFP
Average Occupancy rate of prison and
correctional Facilities (in percent)
2015 526 decreasing BJMP
Number of municipalities without fire
stations
2015 13 0 BFP
Subsector Outcome 3: Improved Resiliency Number of flood control and drainage
structures completed
2015 249 increasing DPWH
Subsector Outcome 4: Enhanced Environmental Quality Number of materials recovery facilities
(MRFs)
2016 514 increasing DENR-EMB/DILG
Number Sanitary Landfills in the region 2015 19 increasing DENR-EMB/DILG
Percentage of HHs with access to basic
sanitation i.e. sanitary toilets
2014 99 100 PSA
Air quality monitoring stations 2014 5 increasing DENR-EMB


Chapter 20 Ensuring Ecological Integrity, Clean, and Healthy Environment | 253
20
Ensuring Ecological Integrity, Clean, and Healthy Environment In recent years, the importance of environment and natural resources has been underscored as a critical and determining factor in achieving sustainable development. Natural resources are now viewed as economic assets and are referred to as natural capital. Ecosystem services such as provisioning (e.g. food, raw materials, freshwater), regulating (e.g. local climate and air quality, carbon sequestration and storage, erosion prevention), supporting (e.g. habitats for species, maintenance of genetic diversity), and cultural (e.g. recreation, tourism) are the functions the environment delivers to the entire population. The succeeding sections will provide an overview and assessment of the Environment and Natural Resources sector of Central Luzon. The underlying reasons why ecosystem services are at risk or threatened, such as mismanagement, degradation and overexploitation of the region’s environmental resources, will be examined and explained. Finally, strategies to restore and rehabilitate these will be presented as priority measures to ensure that a healthy and well-functioning environment will be handed down for future generations to enjoy.
Assessment and Challenges
Forest Governance and Management

254 | Central Luzon Regional Development Plan 2017-2022
Coastal and Marine Resources Rehabilitation and Management
Land classification (2015) Forest Cover (2010)
Region/ Province
Total Area (ha)
Certified Alienable and
Disposable (A & D)
Percent Share
(%) Forestland
Percent Share
(%)
Total (ha)
Closed Open Mangrove
Central Luzon
2,147,036 1,204,649 56.1 942,387 43.9 520,704 225,352 294,331 1,021
Aurora 323,954 132,008 40.8 191,946 59.3 218,588 132,548 85,518 521 Bataan 137,291 69,975 51.0 67,316 49.0 31,617 10,618 20,791 208 Bulacan 262,505 185,333 70.6 77,172 29.4 58,720 35,266 23,387 67 Nueva Ecija 528,433 343,257 65.0 185,176 35.0 74,604 9,530 65,074 - Pampanga 218,068 172,616 79.2 45,452 20.8 7,465 773 6,607 85 Tarlac 305,345 184,975 60.6 120,370 39.4 34,842 5,407 29,435 - Zambales 371,440 116,485 31.4 254,995 68.6 94,869 31,209 63,519 140
Tenurial Instrument Number of
Sites Tenured Area (ha)
Percent Share (%)
Integrated Forest Management Agreement (IFMA) 27 148,192.41 61.16 Socialized Industrial Forest Management Agreement (SIFMA)
251 6,199.01 2.56
Agroforestry Farm Lease Agreement (AFFLA) 7 1,860.50 0.77 Tree Farm Lease Agreement (TFLA) 34 2,516.37 1.04 Forest Land Grazing Management Agreement (FLGMA)/ Forest Land Grazing Lease Agreement (FLGLA)/ Pasture Lease Agreement
50 16,787.44 6.93
Special Land Use Permit (SLUP) 32 708.67 0.29 Forest Land Use Agreement (FLAG) 1 1.47 0.00 Forest Land Use Agreement for Tourism (FLAgT) 1 2.9 0.00 Community Based Forest Management Agreement (CBFMA)
116 65,316.42 26.96
Private Forest Development Agreement (PFDA) 2 600.00 0.25 Foreshore Lease Agreement (FLA) 21 39.73 0.02 Miscellaneous Lease Agreement (MLA) 4 62.60 0.03 PP 1 2.00 0.00 TOTAL 547 242,289.52 100.00

Chapter 20 Ensuring Ecological Integrity, Clean, and Healthy Environment | 255
Biodiversity Conservation and Protected Area Management
Name of Protected Area Location Legislation Date Area (ha.)
Regional Total 284,295.95 A. National Parks (6) 1. Minalungao NP Gapan and Gen. Tinio,Nueva Ecija Republic
Act 5100 6/11/1967 2,018.00
2. Biak-na-Bato NP San Miguel, Bulacan Proc. 223 11/16/1937 2,117.00 3. Mt. Arayat NP Arayat and Magalang,Pampanga Proc. 203 9/16/1937 3,715.23 4. Bataan NP Hermosa, Orani, Samal, Abucay,
Pila, Balanga, Bagac and Morong, Bataan; (Subic, Zambales)
Proc. 192 11/27/1987 23,688.00
5. Olongapo Naval Base Perimeter NP
Olongapo City, Zambales Proc. 478 10/22/1968 9.04
6. Aurora Memorial NP Bongabon, Nueva Ecija; and Baler, Quezon
Proc. 130 5/19/1949 5,676.00
B. Game Refuge and Bird Sanctuary (1) 12.35 1. Lake Malimanga Bird and Fish Sanctuary
Candeleria, Zambales Proc. 1949 3/14/1980 12.35
C. Watershed Forest Reserve (11) 223,071.10 1. Watershed Purposes of Mariveles (Palanas)
Mariveles, Bataan E.O. 20 2/25/1919 325
2. Olongapo WFR Olongapo, Zambales Proc. 66 3/20/1987 6,335.00

256 | Central Luzon Regional Development Plan 2017-2022
Name of Protected Area Location Legislation Date Area (ha.) 3. Angat Watershed and Forest Range (Pilot)
Norzagaray, San Jose,Bulacan and Montalban,Nueva Vizcaya
Proc. 391 4/30/1968 6,600.00
4. Talavera Watershed Reservation
Sta. Fe, Nueva Vizcaya; Carranglan, Lupao, San Jose and Pantabangan, Nueva Ecija
Proc. 350 12/12/1938 37,295.00
5. Pantabangan-Caranglan Watershed Reservation
Pantabangan, Caranglan, Nueva Ecija
Proc. 561 5/21/1969 84,500.00
6. Doña Remedios/General Tinio Watershed
Doña Remedios, Bulacan; Gen. Tinio, Nueva Ecija
Proc. 230 3/23/1988 20,760.00
7. Calabgan WFR Casiguran, Aurora Proc. 915 6/1/1992 4803 8. Dipaculao WFR Dipaculao, Aurora Proc. 116 6/10/1987 1786 9. Dibalo-Pingit-Zabali- Malayat WFR
Baler, San Luis, Aurora Proc. 908 5/25/1992 4528
10. Aurora Watershed Forest Reserve
Aurora Proc. 34 2/4/1936 430
11. Angat Watershed Forest Reserve (Metro Water District)
Montalban, San Jose,Rizal, Norzagaray,Bulacan and Angat,San Rafael, Nueva Ecija
Proc. 71 3/10/1927 55,709.10
D. Protected Landscape (5) 16,421.23 1. Dinadiawan River Protected Landscape
Dipaculao, Aurora Proc. 278 4/23/2000 3,371.33
2. Amro River Protected Landscape
Casiguran and Dilasaga, Aurora Proc. 274 4/23/2000 6,471.08
3. Talaytay Protected Landscape
Dinalungan, Aurora Proc. 283 4/23/2000 3,526.29
4. Simbahan-Talagas Protected Landscape
Dinalungan, Aurora Proc. 267 4/23/2000 2,266.49
5. Roosevelt Protected Landscape
Hermosa and Dinalupihan,Bataan Proc. 273 4/23/2000 786.04
E. Marine Reserve (1) 7,568.00 1. Masinloc and Oyon Bay Marine Reserve
Masinloc, Oyon, Zambales Proc. 231 8/18/1993 7,568.00

Chapter 20 Ensuring Ecological Integrity, Clean, and Healthy Environment | 257
Mining
Classification Province Area (ha.) Percent
Share (%)
Existing Mineral Production and Sharing Agreement (MPSA)
Aurora 2,092.52 4.08 Bataan 7,542.38 14.55 Bulacan 7,873.73 15.37 Nueva Ecija 156.48 0.31 Pampanga 613.65 1.20 Tarlac 2,187.00 4.27 Zambales 30,858.33 60.23 Subtotal 51,234.10 100.00
Exploration Permit (EP) Aurora 8,667.00 29.55 Bataan - - Bulacan 3,563.43 12.15 Nueva Ecija - - Pampanga - - Tarlac - - Zambales 17,099.65 58.30 Subtotal 29,330.08 100.00
Province Protected Area coverage (ha)
% Share
2015 DENR Budget Allocation on Protected Area Development and
Management (Php)
2016 DENR Budget Allocation on Protected Area Development and
Management (Php)
Aurora 27,182.19 9.56 6,833,000.00 17,904,000.00 Bataan 24,799.04 8.76 2,186,000.00 2,003,000.00 Bulacan 64,426.10 22.66 14,769,000.00 879,000.00 Nueva Ecija
150,249.00 52.85 15,379,000.00 1,463,000.00
Pampanga 3,715.23 1.31 490,000.00 5,355,000.00 Tarlac - - 206,000.00 1,485,000.00 Zambales 13,924.39 4.90 755,000.00 2,590,000.00

258 | Central Luzon Regional Development Plan 2017-2022
Pollution
0
100
200
300
400
500
600
2010 2011 2012 2013 2014
San Fernando Station(Pampanga)
Intercity Station (Bocaue,Bulacan)
Saluysoy Station(Meycauayan, Bulacan)
Standard based on R.A. 8749
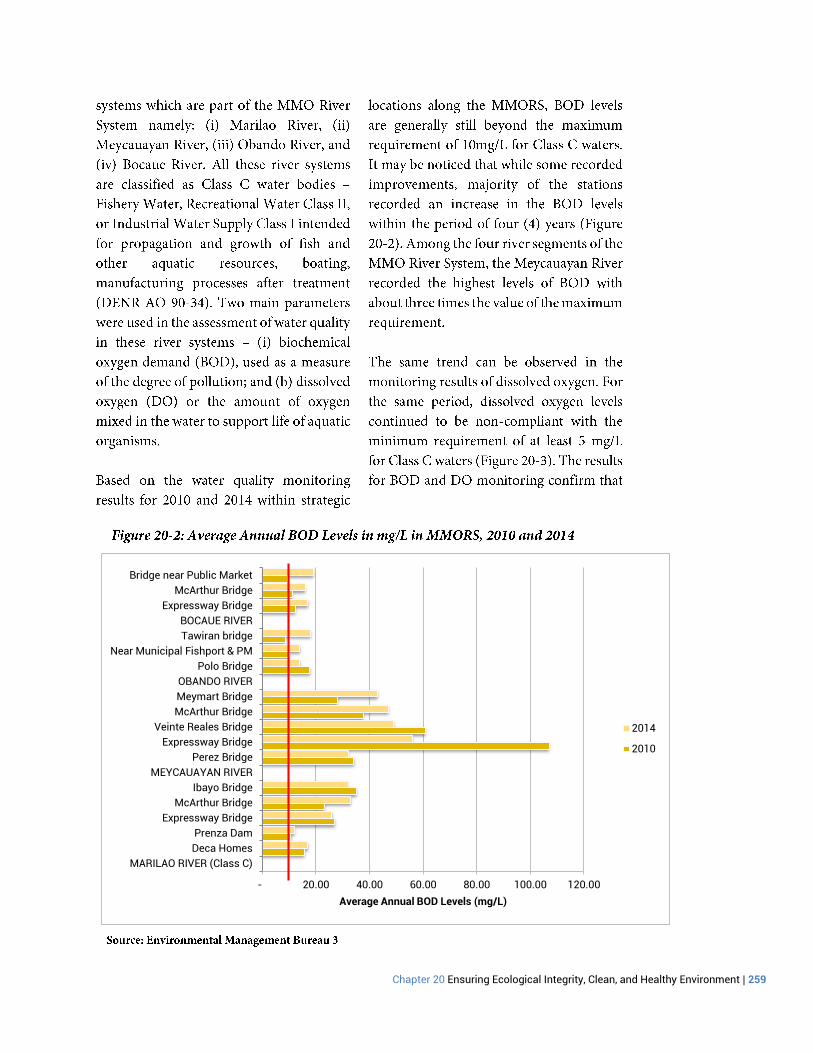
Chapter 20 Ensuring Ecological Integrity, Clean, and Healthy Environment | 259
- 20.00 40.00 60.00 80.00 100.00 120.00
MARILAO RIVER (Class C)
Deca Homes
Prenza Dam
Expressway Bridge
McArthur Bridge
Ibayo Bridge
MEYCAUAYAN RIVER
Perez Bridge
Expressway Bridge
Veinte Reales Bridge
McArthur Bridge
Meymart Bridge
OBANDO RIVER
Polo Bridge
Near Municipal Fishport & PM
Tawiran bridge
BOCAUE RIVER
Expressway Bridge
McArthur Bridge
Bridge near Public Market
Average Annual BOD Levels (mg/L)
2014
2010

260 | Central Luzon Regional Development Plan 2017-2022
- 1.00 2.00 3.00 4.00 5.00 6.00 7.00
MARILAO RIVER (Class C)
Deca Homes
Prenza Dam
Expressway Bridge
McArthur Bridge
Ibayo Bridge
MEYCAUAYAN RIVER
Perez Bridge
Expressway Bridge
Veinte Reales Bridge
McArthur Bridge
Meymart Bridge
OBANDO RIVER
Polo Bridge
Near Municipal Fishport & PM
Tawiran bridge
BOCAUE RIVER
Expressway Bridge
McArthur Bridge
Bridge near Public Market
Average Dissolved Oxygen (DO) Level (mg/L)
2014
2010
Province City/Municipality Date Received
Aurora 1. Maria Aurora 1/26/2015 Bataan 2. Dinalupihan 4/23/2015
3. Pilar 2/11/2015 Bulacan 4. Plaridel 7/23/2015
5. San Jose del Monte City 2/10/2014 6. San Rafael 5/28/2015 7. Santa Maria 7/30/2015
Nueva Ecjia 8. Laur 3/9/2007 9. San Jose City 1/29/2015
Pampanga 10. Angeles City 7/21/2015 11. Candaba 10/15/2015 12. Guagua 5/6/2015 13. Mabalacat City 3/30/2015 14. City of San Fernando 5/20/2015 15. Sta. Rita 3/26/2015
Tarlac 16. La Paz 3/4/2015 17. Moncada 11/24/2015 18. Victoria 11/12/2014

Chapter 20 Ensuring Ecological Integrity, Clean, and Healthy Environment | 261
Climate Change and Disaster Risk Management

262 | Central Luzon Regional Development Plan 2017-2022
Institutionalizing natural capital accounting and valuation of ecosystem services
Strategic Framework
Subsector Outcome 1: Sustained functioning of ecosystem services
Province No. of Province/
City/ Municipality
No. of Disaster Preparedness
Passers
Percentage (%)
Aurora 9 6 66.67 Bataan 13 10 76.92 Bulacan 25 21 84.00 Nueva Ecija 33 31 93.94 Pampanga 23 21 91.30 Tarlac 19 14 73.68 Zambales 15 14 94.29

Chapter 20 Ensuring Ecological Integrity, Clean, and Healthy Environment | 263

264 | Central Luzon Regional Development Plan 2017-2022

Chapter 20 Ensuring Ecological Integrity, Clean, and Healthy Environment | 265

266 | Central Luzon Regional Development Plan 2017-2022
Chapter 20 Ensuring Ecological Integrity, Clean, and Healthy Environment | 267
Subsector Outcome 2: Improved environmental quality

268 | Central Luzon Regional Development Plan 2017-2022

Chapter 20 Ensuring Ecological Integrity, Clean, and Healthy Environment | 269
Subsector Outcome 3: Increased adaptive capacities and resilience of communities and ecosystems

270 | Central Luzon Regional Development Plan 2017-2022

Chapter 20 Ensuring Ecological Integrity, Clean, and Healthy Environment | 271
Research and Development Agenda
Biodiversity assessment of critical habitats, key biodiversity areas, and watersheds
Establishment of natural resources monitoring system
Alternative ways to convert waste to energy
Research and development for cleaner production technologies
Vulnerability assessment of coastal areas in the region to climate change
Analysis of the disaster preparedness of critical infrastructure
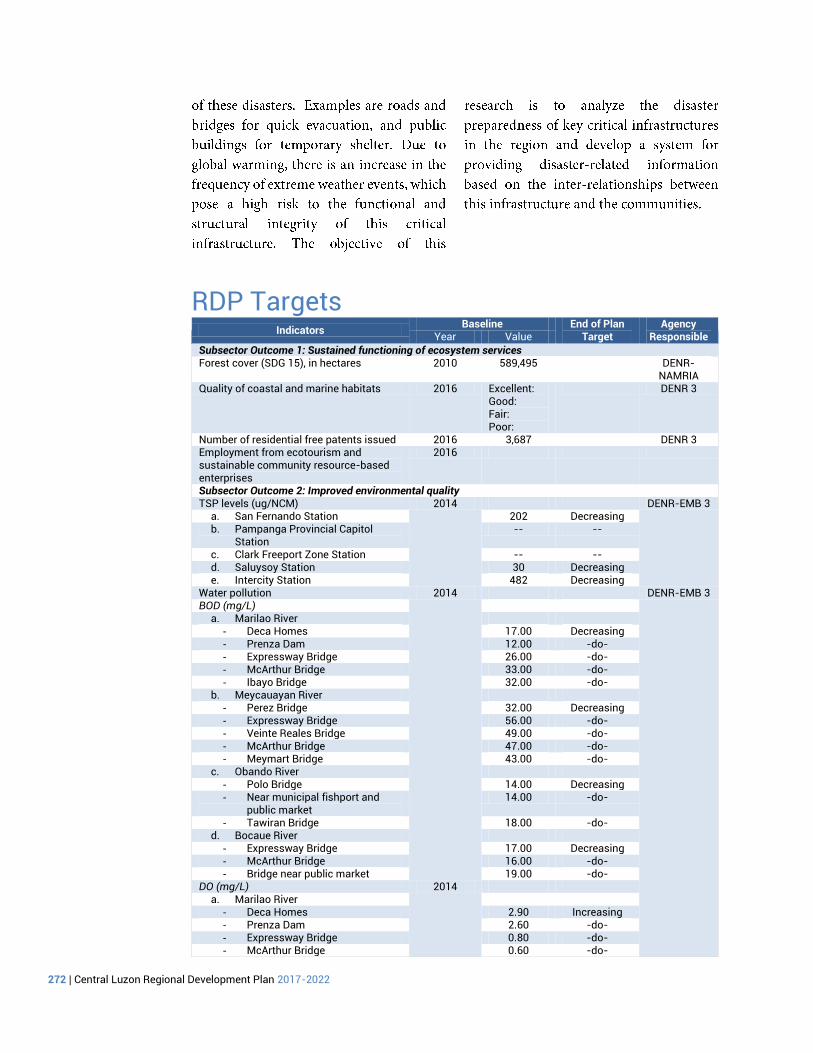
272 | Central Luzon Regional Development Plan 2017-2022
RDP Targets
Indicators Baseline End of Plan
Target Agency
Responsible Year Value
Subsector Outcome 1: Sustained functioning of ecosystem services Forest cover (SDG 15), in hectares 2010 589,495 DENR-
NAMRIA Quality of coastal and marine habitats 2016 Excellent:
Good: Fair: Poor:
DENR 3
Number of residential free patents issued 2016 3,687 DENR 3 Employment from ecotourism and sustainable community resource-based enterprises
2016
Subsector Outcome 2: Improved environmental quality TSP levels (ug/NCM) 2014 DENR-EMB 3
a. San Fernando Station 202 Decreasing b. Pampanga Provincial Capitol
Station -- --
c. Clark Freeport Zone Station -- -- d. Saluysoy Station 30 Decreasing e. Intercity Station 482 Decreasing
Water pollution 2014 DENR-EMB 3 BOD (mg/L)
a. Marilao River - Deca Homes 17.00 Decreasing - Prenza Dam 12.00 -do- - Expressway Bridge 26.00 -do- - McArthur Bridge 33.00 -do- - Ibayo Bridge 32.00 -do-
b. Meycauayan River - Perez Bridge 32.00 Decreasing - Expressway Bridge 56.00 -do- - Veinte Reales Bridge 49.00 -do- - McArthur Bridge 47.00 -do- - Meymart Bridge 43.00 -do-
c. Obando River - Polo Bridge 14.00 Decreasing - Near municipal fishport and
public market 14.00 -do-
- Tawiran Bridge 18.00 -do- d. Bocaue River
- Expressway Bridge 17.00 Decreasing - McArthur Bridge 16.00 -do- - Bridge near public market 19.00 -do-
DO (mg/L) 2014 a. Marilao River
- Deca Homes 2.90 Increasing - Prenza Dam 2.60 -do- - Expressway Bridge 0.80 -do- - McArthur Bridge 0.60 -do-

Chapter 20 Ensuring Ecological Integrity, Clean, and Healthy Environment | 273
Indicators Baseline End of Plan
Target Agency
Responsible Year Value - Ibayo Bridge 0.60 -do-
b. Meycauayan River - Perez Bridge 1.64 Increasing - Expressway Bridge 0.27 -do- - Veinte Reales Bridge 0.23 -do- - McArthur Bridge 0.19 -do- - Meymart Bridge 0.23 -do-
c. Obando River - Polo Bridge 1.90 Increasing - Near municipal fishport and
public market 0.80 -do-
- Tawiran Bridge 1.20 -do- d. Bocaue River
- Expressway Bridge 1.79 Increasing - McArthur Bridge 1.84 -do- - Bridge near public market 1.81 -do-
Area (in ha) assessed and mapped for soil fertility status and soil fertility management
2016 DA-BSWM
Solid waste diversion rate 2016 DENR-EMB 3 Subsector Outcome 3: Increased adaptive capacities and resiliency of ecosystems and communities Number of LGUs with completed vulnerability assessments and climate and disaster risk assessment
2016 Increasing DILG 3
Number of approved CC/DRRM-enhanced plans
2016 Increasing DILG 3
Number of LGUs with operating early warning systems (EWS) in place
2016 Increasing DILG 3


Chapter 21 Plan Implementation and Monitoring | 279
21
Plan Implementation and Monitoring

280 | Central Luzon Regional Development Plan 2017-2022

Chapter 21 Plan Implementation and Monitoring | 281
CL-RDP Chapter Sector
Coordination Mechanism
NEDA Secretariat
Chapter 3 – The Central Luzon Spatial Development Framework RDC III-RLUC NEDA3-PFPD Chapter 5 – Ensuring People-centered, Clean and Efficient Governance
RDC III-SCDA NEDA3-DRD
Chapter 6 – Pursuing Swift and Fair Administration of Justice RDC III-SCDA NEDA3-DRD Chapter 7 – Promoting Philippine Culture and Values RDC III-SCSD NEDA3-PMED Chapter 8 – Expanding Economic Opportunities in Agriculture and Fisheries
RDC III-SCED NEDA3-PFPD
Chapter 9 – Expanding Economic Opportunities in Industry and Services through Trabaho at Negosyo
RDC III-SCED NEDA3-PFPD
Chapter 10 –Accelerating Human Capital Development RDC III-SCSD NEDA3-PMED Chapter 11 –Reducing Vulnerability of Individuals and Families RDC III-SCSD NEDA3-PMED Chapter 12 –Building Safe and Secure Communities RDC III-SCSD NEDA3-PMED Chapter 13 – Reaching for the Demographic Dividend RDC III-SCSD NEDA3-PMED Chapter 14 – Vigorously Advancing Science, Technology, and Innovation
RDC III-SCED NEDA3-PFPD
Chapter 15 – Ensuring Sound Macroeconomy RDC III-SCED NEDA3-PFPD Chapter 16 – Leveling the Playing Field through a National Competition Policy
RDC III-SCED NEDA3-PFPD
Chapter 17 – Attaining Just and Lasting Peace RDC III-SCDA NEDA3-DRD Chapter 18 – Ensuring Security, Public Order and Safety RDC III-SCDA NEDA3-DRD Chapter 19 – Accelerating Infrastructure Development RDC III-SCID NEDA3-PDIPBD Chapter 20 – Ensuring Ecological Integrity, Clean, and Healthy Environment
RDC III-SCED NEDA3-PFPD
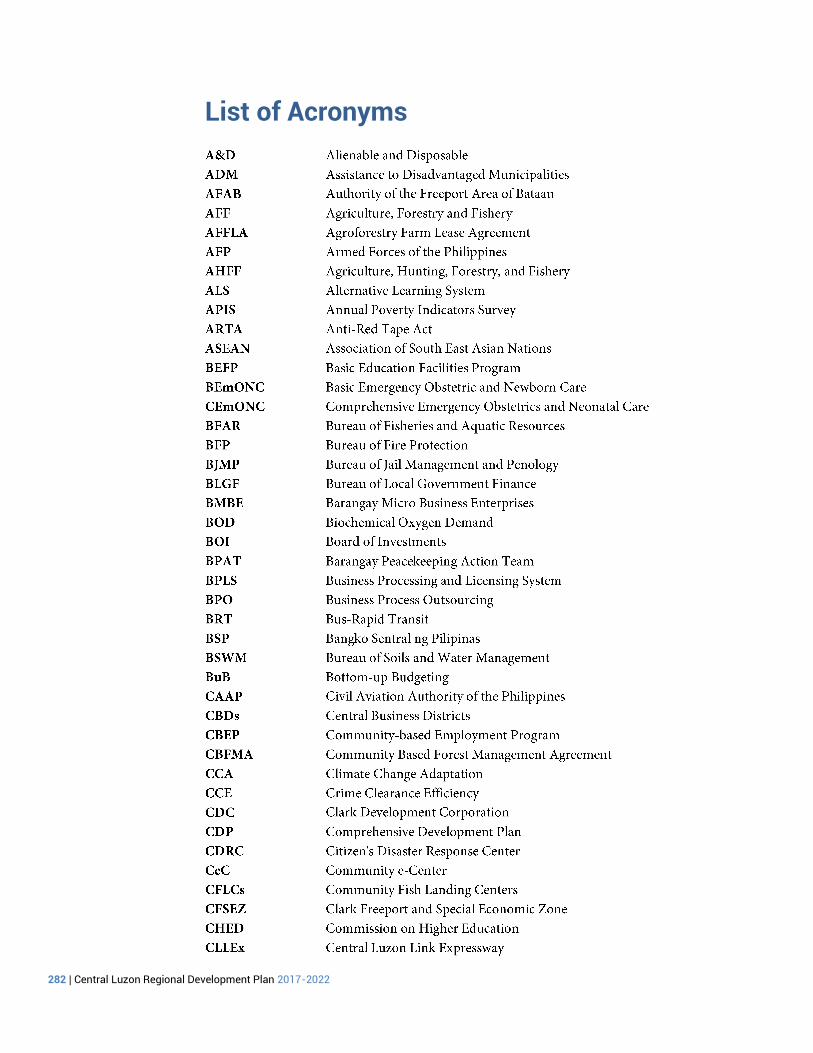
282 | Central Luzon Regional Development Plan 2017-2022
List of Acronyms

List of Acronyms | 283

284 | Central Luzon Regional Development Plan 2017-2022

List of Acronyms | 285

286 | Central Luzon Regional Development Plan 2017-2022

List of Acronyms | 287

288 | Central Luzon Regional Development Plan 2017-2022
GLOSSARY

Glossary | 289

290 | Central Luzon Regional Development Plan 2017-2022

Glossary | 291

292 | Central Luzon Regional Development Plan 2017-2022

Glossary | 293

294 | Central Luzon Regional Development Plan 2017-2022

Glossary | 295
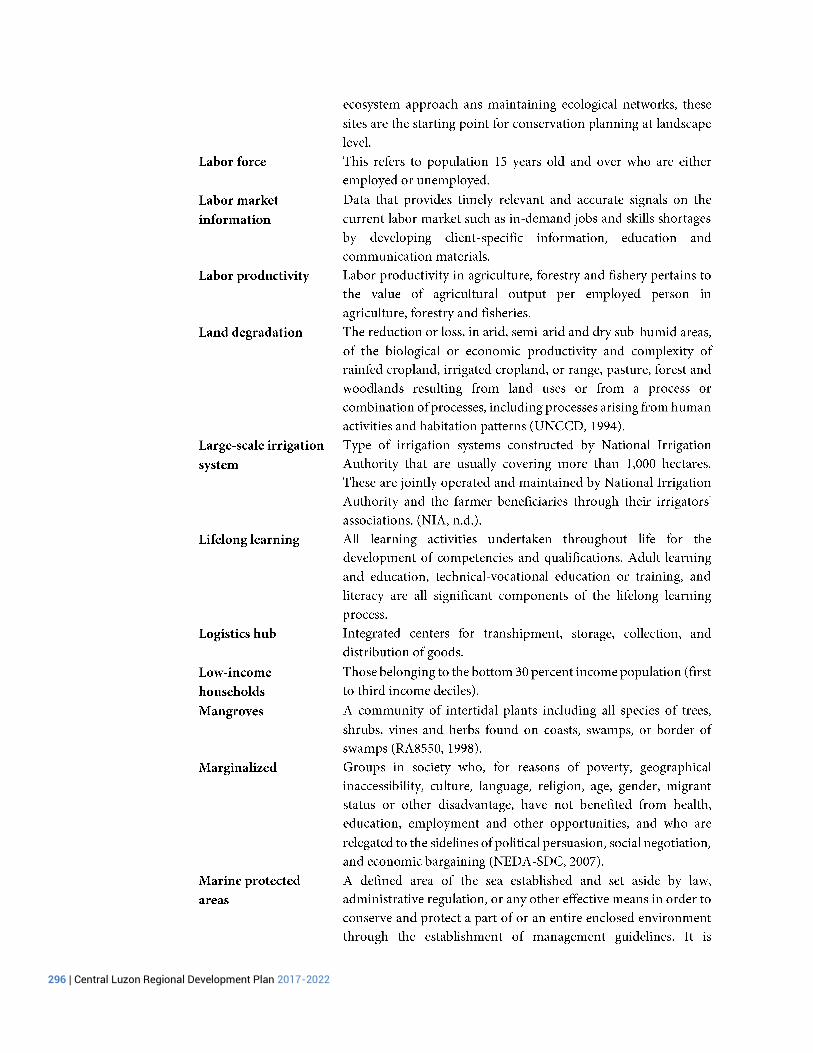
296 | Central Luzon Regional Development Plan 2017-2022

Glossary | 297

298 | Central Luzon Regional Development Plan 2017-2022

Glossary | 299

300 | Central Luzon Regional Development Plan 2017-2022

Glossary | 301

302 | Central Luzon Regional Development Plan 2017-2022

Glossary | 303
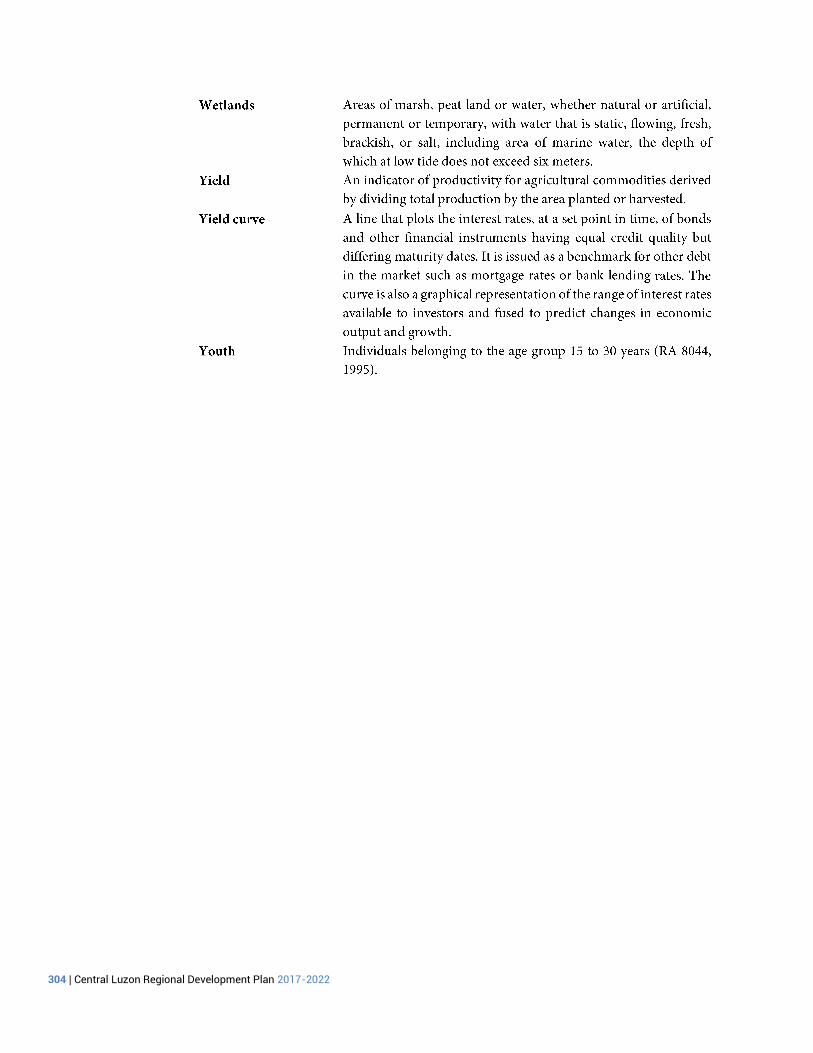
304 | Central Luzon Regional Development Plan 2017-2022

References | 305
References
rom

306 | Central Luzon Regional Development Plan 2017-2022

References | 307

308 | Central Luzon Regional Development Plan 2017-2022

References | 309

310 | Central Luzon Regional Development Plan 2017-2022

References | 311

312 | Central Luzon Regional Development Plan 2017-2022
CLRDP 2017-2022 Planning Committees
REGIONAL PLANNING COMMITTEE ON ECONOMIC DEVELOPMENT

CLRDP 2017-2022 Planning Committees | 313
REGIONAL PLANNING COMMITTEE ON INFRASTRUCTURE DEVELOPMENT
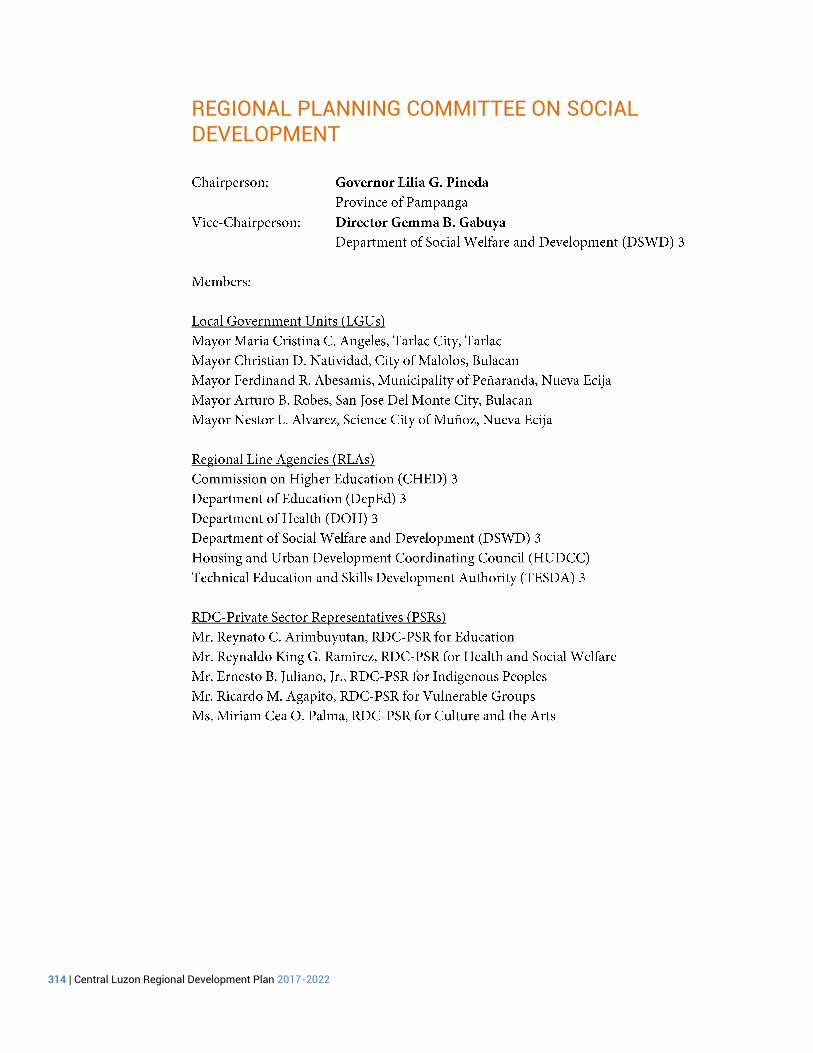
314 | Central Luzon Regional Development Plan 2017-2022
REGIONAL PLANNING COMMITTEE ON SOCIAL DEVELOPMENT

CLRDP 2017-2022 Planning Committees | 315
REGIONAL PLANNING COMMITTEE ON DEVELOPMENT ADMINISTRATION
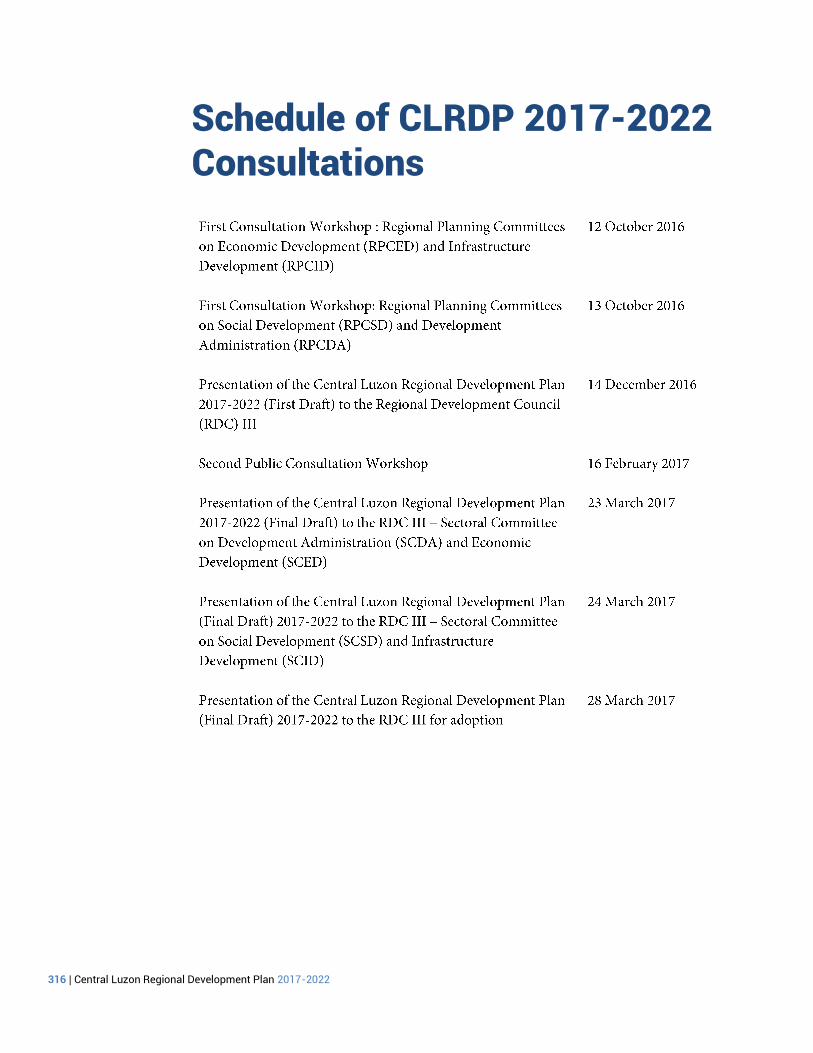
316 | Central Luzon Regional Development Plan 2017-2022
Schedule of CLRDP 2017-2022 Consultations

Plan Secretariat | 317
Plan Secretariat
Policy Formulation and Planning Division