Breeding dispersal in black‐headed gull: the value of familiarity in a contrasted environment
Journal of Affective Disorders 126 (2010) 113–124
Contents lists available at ScienceDirect
Journal of Affective Disorders
j ourna l homepage: www.e lsev ie r.com/ locate / j ad
Research report
Regional brain metabolic correlates of self-reported depression severitycontrasted with clinician ratings
Matthew S. Milak a,c,⁎, John Keilp a,c, Ramin V. Parsey a,c, Maria A. Oquendo a,c,Kevin M. Malone a,c, J. John Mann a,b,c
a Department of Psychiatry, Columbia University, 1051 Riverside Drive, Mail Unit 42, New York, NY 10032, United Statesb Department of Radiology, Columbia University, 1051 Riverside Drive, Mail Unit 42, New York, NY 10032, United Statesc Department of Molecular Imaging and Neuropathology, New York State Psychiatric Institute, 1051 Riverside Drive, Mail Unit 42, New York, NY 10032, United States
a r t i c l e i n f o
⁎ Corresponding author. Department of Psychiatry,1051RiversideDrive,Mail Unit 42, NewYork, NY 10032,212 543 2952; fax: +1 212 543 6017.
E-mail address: [email protected] (M.S. Milak
0165-0327/$ – see front matter © 2010 Elsevier B.V.doi:10.1016/j.jad.2010.03.002
a b s t r a c t
Article history:Received 16 June 2009Received in revised form 2 March 2010Accepted 2 March 2010Available online 9 April 2010
Background: We compared brain-map correlations of relative cerebral glucose metabolism(rCMRglu) with psychopathologic factors derived from the self-rated Beck Depression Inventory(BDI) and factors from the clinician-rated Hamilton Depression Rating Scale (HDRS) factors,seeking an anatomic basis for differences in self and clinician ratings.Methods: [18F]-FDG Positron Emission Tomography generated rCMRglu, SPM-estimated, voxel-level, brain correlation maps with BDI factor scores and HDRS factor scores in medication-freemajor depressive disorder.Results: Regional brain correlates of BDI are more extensive than HDRS, even when adjusting forvariance accounted for by the HDRS. Factors comprising the BDI were associated with distinctcortical and subcortical regions. The degree of overlap in factor correlation brainmaps is explainedby the variance shared by BDI and HDRS factor scores.Conclusion: Self and clinician-rated aspects of depression have common and distinctneuroanatomic correlates that reflect correlations between rating scales, but correlationsbetween glucose metabolism and self-rated depression were anatomically more extensive inthis sample. Findings highlight the importance and biological underpinnings of these subjectivefeatures of major depression.
© 2010 Elsevier B.V. All rights reserved.
Keywords:DepressionPETFDGFactor analysisBrain regions
1. Introduction
Clinician ratings of the symptom severity of major depres-sion have been the gold standard for evaluation of efficacy ofantidepressant treatments for more than 40 years. However,subjective aspects of the disorder may be more relevant forsocial and functional recoveries, long-term adjustment, treat-ment adherence, or associated behaviors, such as suicide at-tempts. Subjective severity of depression is only modestly
Columbia University,United States. Tel.:+1
).
All rights reserved.
correlated with clinician-rated severity (shared variance rangeis 10–25%) (Adda et al., 1997; Akdemir et al., 2001; Hautzinger,1991; Uehara et al., 2005; Wichowicz et al., 2004), respondsmore slowly to antidepressant treatment (Adda et al., 1997;Ambrosini et al., 1999; Posternak and Miller, 2001; Thaseet al., 1991), and is a stronger predictor of suicide attempts(Grunebaum et al., 2005; Mann et al., 2008, 1999; Oquendoet al., 2007;Oquendo et al., 2004).Wehave previously reportedthat in untreated major depression, component factors ofthe clinician-rated Hamilton Depression Rating Scale correlatewith glucose metabolism in distinct brain regions (Milaket al., 2005). Factor analysis of the Hamilton Depression RatingScale (HDRS) and Beck Depression Inventory (BDI) indicatesthat the BDI captures subjective “cognitive factors” that are
114 M.S. Milak et al. / Journal of Affective Disorders 126 (2010) 113–124
only minimally represented in the HDRS. When these scalesare combined for factor analyses, the two scales tend to yieldorthogonal factors (Steer et al., 1987; Uher et al., 2008).
These differences raise the question as to whethersubjective perception of depression severity and its compo-nents involves different neural circuits or brain regionscompared with clinician ratings, that may explain thelimited correlation between the scales, as well as differencesbetween these set of symptoms in their temporal responseto antidepressant treatment. Therefore, we comparedcorrelation maps of Positron Emission Tomography (PET)[18F]-FDG relative regional cerebral metabolic rates ofglucose in untreated major depression, at the voxel level,with total score and factor scores of HDRS and BDI. Wesought to determine whether the total score and the factorscores for the clinician-rated scale and the self-rated scalecorrelate with different brain regions. We hypothesized thatcorrelations with the “objective” clinician-rated measurewould be stronger, and would likely incorporate regionsassociated with “subjective” self-rated symptoms. Thepatient sample and the PET scan data were almost thesame as our previously published study on correlates of theHDRS (Milak et al., 2005).
2. Methods
2.1. Subjects
40 depressed patients (Table 1) who met DSM-IV(American Psychiatric Association, 1994) criteria for currentMajor Depressive Disorder, and with a score of 16 or greateron the 17-item Hamilton Depression Rating Scale (HDRS)(Hamilton, 1960), were enrolled into the study after givingwritten informed consent as approved by the InstitutionalReview Board. Comorbidities: 1) One subject had dysthymia.2) Five subjects had comorbid anxiety disorders (3 PTSD, 2panic disorder, 1 simple phobia). 3) No subject had currentsubstance abuse or dependence, 14 of 40 subjects had pasthistories of substance dependence (11 alcohol [3 of thesewith additional cocaine, 2 with additional marijuana] and 3marijuana). 4) Sixteen of 40 subjects had a past suicideattempt. Patients were administered the HDRS and BeckDepression Inventory (BDI) (Beck and Beamesderfer, 1974)within minutes of each other on the day of the PET scan.Demographics, past psychiatric and medical histories, devel-opmental and family histories were recorded on the Colum-bia Baseline Demographic Form. Three subjects who had been
Table 1Demographic and clinical data for subjects undergoing Positron EmissionTomography (N=40).
Mean SD
Age (y) 38.8 13.5Education (y) 15.5 2.8Age at 1st MDE (y) 24.5 15.0Number of MDEs 3.7 2.5GAF 43.9 10.2% Female 57.5
Abbreviations: MDE=Major Depressive Episode; GAF = Global Assessmenof Functioning; Min = minimum; Max = maximum.
t
in our previously published study of the HDRS and regionalbrain metabolism (Milak et al., 2005) were not included herebecause they did not complete the BDI.
2.2. Depression rating
Subjects were administered both the Hamilton DepressionRating Scale (HDRS, 24-item scale) and Beck DepressionInventory (BDI), as part of an extensive clinical assessmentincluding both diagnostic interviews and multiple self-reportrating scales. Total scores were computed, as well as factorscores derived from a previously reported factor analysis ofboth scales (Grunebaum et al., 2005). Correlations betweenrCMRglu and the five factor scores from the HDRS (depressedmood, loss of motivation, anxiety, insomnia, and thoughtdisturbance) have previously been reported (Milak et al.,2005). Factor scores derived for the BDI were labeled:1. Subjective Depression (items 1, 2, 4, 12, 13, 15, 17 and 21;corresponding to ratings of sadness, loss of future orientation,dissatisfaction, indecisiveness, concernabout appearance,workinhibition, feeling tired and loss of libido), 2. Self-Blame (items3, 5, 6, 7 and8; ratings of senseof failure, feelings of guilt, feelingpunished, sense of disappointment, and self-consciousness),and 3. Somatic Complaints (items 16, 18 and 19; ratings of sleepdisturbance, appetite disturbance and weight loss).
2.3. PET studies
This was a treatment-seeking sample, all of whom wereunmedicated at the time of their scans. Subjects who werenot medication free when first recruited were tapered offtheir medication such that they were medication free for aminimum of 14 days prior to scanning (6 weeks in the case offluoxetine and one month in the case of oral antipsychotics).Patients were free of medical illnesses based on history,physical examination and laboratory tests. Pregnant femaleswere excluded. Pre-menopausal female subjects were studiedwithin five days after onset of menses.
Scan details were described previously (Milak et al., 2005).A bolus of approximately 10 mCi [18F]-FDG was administeredintravenously. Subjects gazed at cross hairs in a dimmed roomduring the first 15min of the 18F-FDG distribution phase,rested quietly for another 15 min before moving to thescanner where they lay supine for 10 more minutes prior tothe emission scan.
2.4. Image analysis
Statistical analysis was performed using Statistical Para-metric Mapping (SPM 99) (Institute of Neurology, UniversityCollege of London, UK) implemented in Matlab 5 (Math-works Inc., USA) (Friston et al., 1995). The summedreconstructed frames were spatially transformed into theMNI (Montreal Neurological Institute, McGill University, CA)standard template to remove the inter-subject structuralvariability (Friston et al., 1995). Affine transformation wasperformed to determine the 12 optimal parameters toregister the brain PET to the MNI template. Spatiallynormalized images were smoothed by convolution with anisotropic Gaussian kernel of 12 mm. The effects of globalmetabolismwere controlled by normalizing individual voxel
115M.S. Milak et al. / Journal of Affective Disorders 126 (2010) 113–124
counts to total gray matter counts (global normalization andproportional scaling in SPM). To determine the regionswhere rCMRglu correlates with factors of BDI, a voxel-levelcorrelation analysis was performed using the general linearmodel. Height thresholdwas set a priori to pb0.01 and extentthreshold was set to pb0.05 after correction for multiplecomparisons by SPM. Stereotaxic coordinates reported areTalairach Atlas (Talairach and Tournoux, 1988) coordinates,converted from MNI coordinates (Brett, 1999).
Correlation maps between clinical ratings and rCMRgluwere generated in SPM. The first of these compared therelationship between BDI total score and rCMRglu with thatbetween HDRS (24 item) total score and rCMRglu. BDI andHDRS scores were then statistically adjusted to remove theirshared variance, via linear regression. This provided ameasure of depression severity that was unique to eachscale. This unique variancewas then compared to rCMRglu todetermine if the residual variance in either scale wasindependently associated with underlying metabolism.Brain regional correlation maps with each scale and itsfactor scores were compared for overlap, then the degree ofoverlap was compared to the degree to which scale scorescorrelated with each other. Finally, associations between the3 factors of the BDI and rCMRglu that measure differentaspects of psychopathology were examined, to determine ifthese factors could be distinguished by their correlationwithdifferent brain regions.
3. Results
3.1. BDI scores: correlation with HDRS and component factors
In an expanded cohort of 246 depressed subjectsevaluated by the same research team, BDI and HDRS scoreswere modestly correlated (r=0.41, pb0.001; 17.0% sharedvariance). A correlation matrix of factor scores derivedseparately from the BDI and HDRS (Table 2) show modest
Table 2Correlations between the 24-item Hamilton Depression Rating Scale (HDRS-24) and the Beck Depression Inventory (BDI) and their respective factorscores (N=246).
BF1 BF2 BF3 BDI total
HF1 Pearson correlation 0.40 0.44 0.10 0.40Psychicdepression
p (2-tailed) 0.00 0.00 0.11 0.00% variance shared 16% 19% 1% 16%
HF2 Pearson correlation 0.32 0.01 0.40 0.26Loss ofmotivatedbehavior
p (2-tailed) 0.00 0.93 0.00 0.00% variance shared 10% 0% 16% 7%
HF3 Pearson correlation 0.12 0.22 0.12 0.18Psychosis p (2-tailed) 0.07 0.00 0.07 0.01
% variance shared 1% 5% 1% 3%HF4 Pearson correlation 0.08 0.06 0.20 0.13
Anxiety p (2-tailed) 0.21 0.35 0.00 0.04% variance shared 1% 0% 4% 2%
HF5 Pearson correlation −0.10 0.07 0.37 0.10Sleepdisturbance
p (2-tailed) 0.88 0.29 0.00 0.11% variance shared 1% 0% 14% 1%
HDRS-24 Pearson correlation 0.37 0.33 0.36 0.41Total score p (2-tailed) 0.00 0.00 0.00 0.00
% variance shared 14% 11% 13% 17%
Abbreviations: HF1–5 = HDRS factor 1–5; BF1–3 = BDI factor 1–3.
correlations even across the scales (Grunebaum et al., 2005).Overall, the factor structures of the two scales are mostlydifferent.
In the sample that received PET scans (N=40) (meanBDI=31.6±10.0;meanHDRS-24=29.9±6.3), the correlationmatrixwas similar to the expanded sample above (Table 3). BDIand HDRS total scores were correlated moderately. The BDISubjective Depression factor correlated with Loss of Motivationfactor and with the Thought Disturbance factor. The BDI Self-Blame factor correlated with Depressed Mood. BDI SomaticComplaint correlated with HDRS Loss of Motivation andThought Disturbance.
3.2. Neuroanatomic correlates of the BDI total score
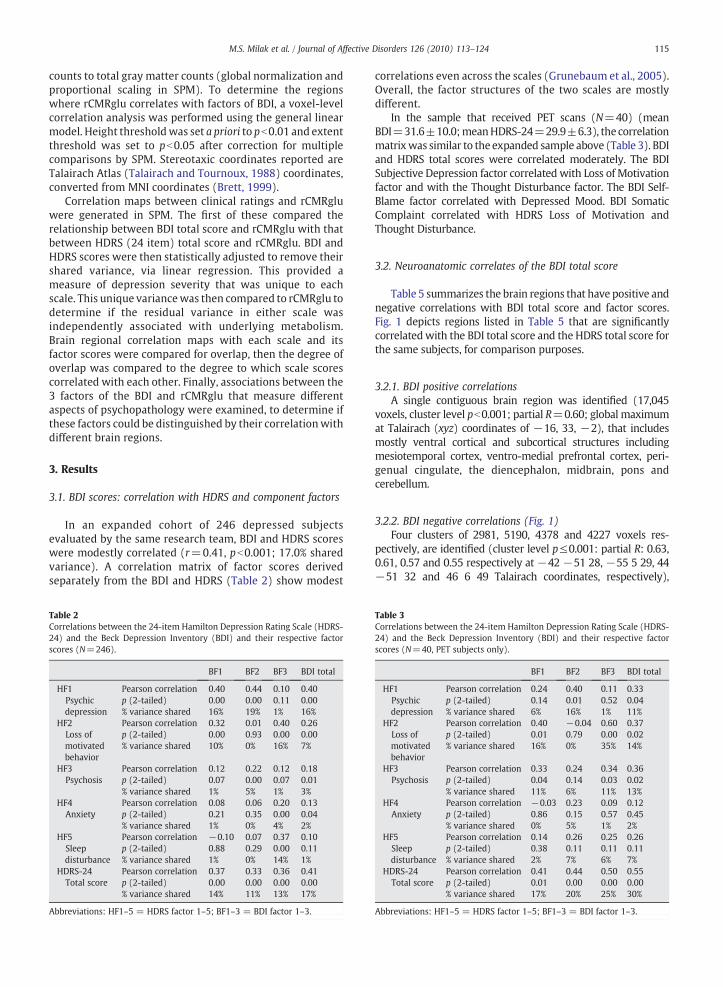
Table 5 summarizes the brain regions that have positive andnegative correlations with BDI total score and factor scores.Fig. 1 depicts regions listed in Table 5 that are significantlycorrelatedwith the BDI total score and the HDRS total score forthe same subjects, for comparison purposes.
3.2.1. BDI positive correlationsA single contiguous brain region was identified (17,045
voxels, cluster level pb0.001; partial R=0.60; global maximumat Talairach (xyz) coordinates of −16, 33, −2), that includesmostly ventral cortical and subcortical structures includingmesiotemporal cortex, ventro-medial prefrontal cortex, peri-genual cingulate, the diencephalon, midbrain, pons andcerebellum.
3.2.2. BDI negative correlations (Fig. 1)Four clusters of 2981, 5190, 4378 and 4227 voxels res-
pectively, are identified (cluster level p≤0.001: partial R: 0.63,0.61, 0.57 and 0.55 respectively at −42 −51 28, −55 5 29, 44−51 32 and 46 6 49 Talairach coordinates, respectively),
Table 3Correlations between the 24-item Hamilton Depression Rating Scale (HDRS-24) and the Beck Depression Inventory (BDI) and their respective factorscores (N=40, PET subjects only).
BF1 BF2 BF3 BDI total
HF1 Pearson correlation 0.24 0.40 0.11 0.33Psychicdepression
p (2-tailed) 0.14 0.01 0.52 0.04% variance shared 6% 16% 1% 11%
HF2 Pearson correlation 0.40 −0.04 0.60 0.37Loss ofmotivatedbehavior
p (2-tailed) 0.01 0.79 0.00 0.02% variance shared 16% 0% 35% 14%
HF3 Pearson correlation 0.33 0.24 0.34 0.36Psychosis p (2-tailed) 0.04 0.14 0.03 0.02
% variance shared 11% 6% 11% 13%HF4 Pearson correlation −0.03 0.23 0.09 0.12
Anxiety p (2-tailed) 0.86 0.15 0.57 0.45% variance shared 0% 5% 1% 2%
HF5 Pearson correlation 0.14 0.26 0.25 0.26Sleepdisturbance
p (2-tailed) 0.38 0.11 0.11 0.11% variance shared 2% 7% 6% 7%
HDRS-24 Pearson correlation 0.41 0.44 0.50 0.55Total score p (2-tailed) 0.01 0.00 0.00 0.00
% variance shared 17% 20% 25% 30%
Abbreviations: HF1–5 = HDRS factor 1–5; BF1–3 = BDI factor 1–3.
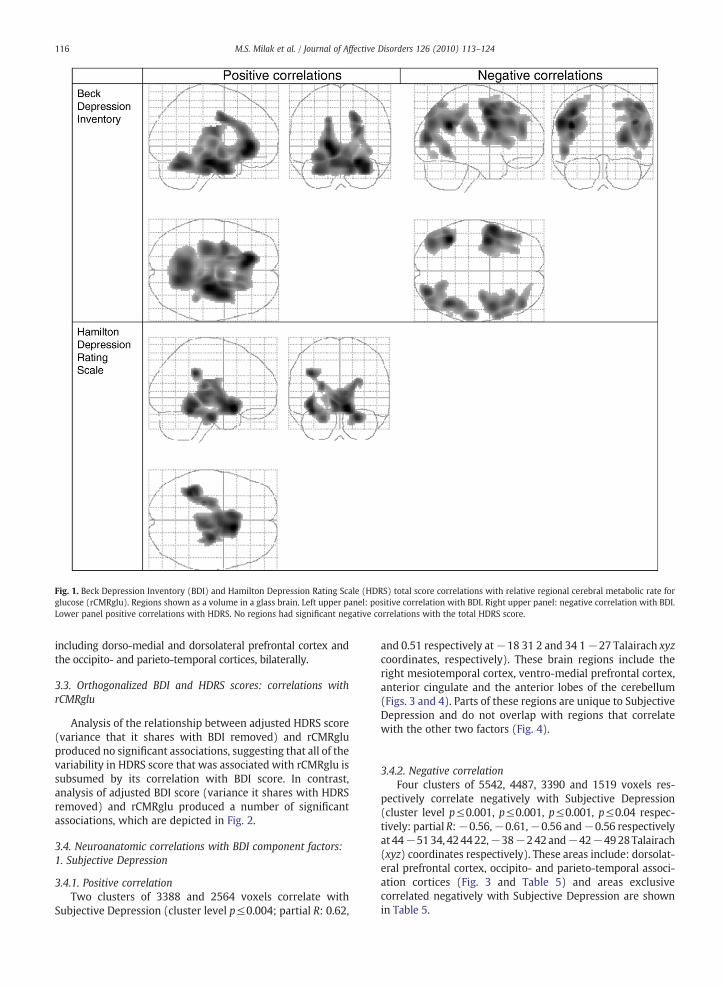
Fig. 1. Beck Depression Inventory (BDI) and Hamilton Depression Rating Scale (HDRS) total score correlations with relative regional cerebral metabolic rate forglucose (rCMRglu). Regions shown as a volume in a glass brain. Left upper panel: positive correlation with BDI. Right upper panel: negative correlation with BDI.Lower panel positive correlations with HDRS. No regions had significant negative correlations with the total HDRS score.
116 M.S. Milak et al. / Journal of Affective Disorders 126 (2010) 113–124
including dorso-medial and dorsolateral prefrontal cortex andthe occipito- and parieto-temporal cortices, bilaterally.
3.3. Orthogonalized BDI and HDRS scores: correlations withrCMRglu
Analysis of the relationship between adjusted HDRS score(variance that it shares with BDI removed) and rCMRgluproduced no significant associations, suggesting that all of thevariability in HDRS score that was associated with rCMRglu issubsumed by its correlation with BDI score. In contrast,analysis of adjusted BDI score (variance it shares with HDRSremoved) and rCMRglu produced a number of significantassociations, which are depicted in Fig. 2.
3.4. Neuroanatomic correlations with BDI component factors:1. Subjective Depression
3.4.1. Positive correlationTwo clusters of 3388 and 2564 voxels correlate with
Subjective Depression (cluster level p≤0.004; partial R: 0.62,
and 0.51 respectively at−18 31 2 and 34 1−27 Talairach xyzcoordinates, respectively). These brain regions include theright mesiotemporal cortex, ventro-medial prefrontal cortex,anterior cingulate and the anterior lobes of the cerebellum(Figs. 3 and 4). Parts of these regions are unique to SubjectiveDepression and do not overlap with regions that correlatewith the other two factors (Fig. 4).
3.4.2. Negative correlationFour clusters of 5542, 4487, 3390 and 1519 voxels res-
pectively correlate negatively with Subjective Depression(cluster level p≤0.001, p≤0.001, p≤0.001, p≤0.04 respec-tively: partial R:−0.56,−0.61,−0.56 and−0.56 respectivelyat 44−5134, 424422,−38−242and−42−4928Talairach(xyz) coordinates respectively). These areas include: dorsolat-eral prefrontal cortex, occipito- and parieto-temporal associ-ation cortices (Fig. 3 and Table 5) and areas exclusivecorrelated negatively with Subjective Depression are shownin Table 5.
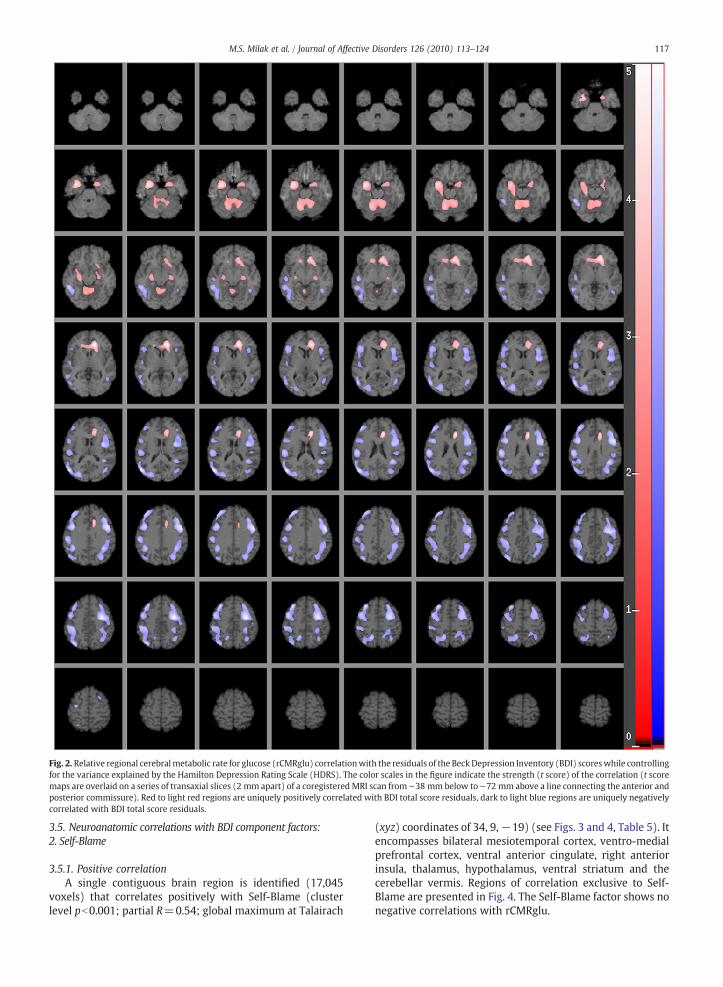
Fig. 2. Relative regional cerebralmetabolic rate for glucose (rCMRglu) correlationwith the residuals of the Beck Depression Inventory (BDI) scoreswhile controllingfor the variance explained by the Hamilton Depression Rating Scale (HDRS). The color scales in the figure indicate the strength (t score) of the correlation (t scoremaps are overlaid on a series of transaxial slices (2 mm apart) of a coregistered MRI scan from ∼38 mm below to ∼72 mm above a line connecting the anterior andposterior commissure). Red to light red regions are uniquely positively correlated with BDI total score residuals, dark to light blue regions are uniquely negativelycorrelated with BDI total score residuals.
117M.S. Milak et al. / Journal of Affective Disorders 126 (2010) 113–124
3.5. Neuroanatomic correlations with BDI component factors:2. Self-Blame
3.5.1. Positive correlationA single contiguous brain region is identified (17,045
voxels) that correlates positively with Self-Blame (clusterlevel pb0.001; partial R=0.54; global maximum at Talairach
(xyz) coordinates of 34, 9,−19) (see Figs. 3 and 4, Table 5). Itencompasses bilateral mesiotemporal cortex, ventro-medialprefrontal cortex, ventral anterior cingulate, right anteriorinsula, thalamus, hypothalamus, ventral striatum and thecerebellar vermis. Regions of correlation exclusive to Self-Blame are presented in Fig. 4. The Self-Blame factor shows nonegative correlations with rCMRglu.
Fig. 3. Regions shown as a volume in a glass brain. Maps of correlations of relative regional glucose metabolic rate (rCMRglu) in major depression with severity odepression as measured by the three Beck Depression Inventory (BDI)-derived factor scores.
118 M.S. Milak et al. / Journal of Affective Disorders 126 (2010) 113–124
3.6. Neuroanatomic correlations with BDI component factors:3. Somatic Complaint
3.6.1. Positive correlationTwo clusters of 9259 and 2613 voxels respectively correlate
positively with Somatic Complaint (cluster level p≤0.003 n:
f
partial R: 0.56, and 0.51 respectively at 24 −11−16 and 8−65−22 Talairach (xyz) coordinates respectively). Theseareas include thebilateralmesiotemporal cortex, hippocampus,amygdala, anterior cingulate, thalamus, epithalamus, ventrallentiform nuclei, pontine nuclei and the anterior lobes of thecerebellum (Figs. 3 and 4).
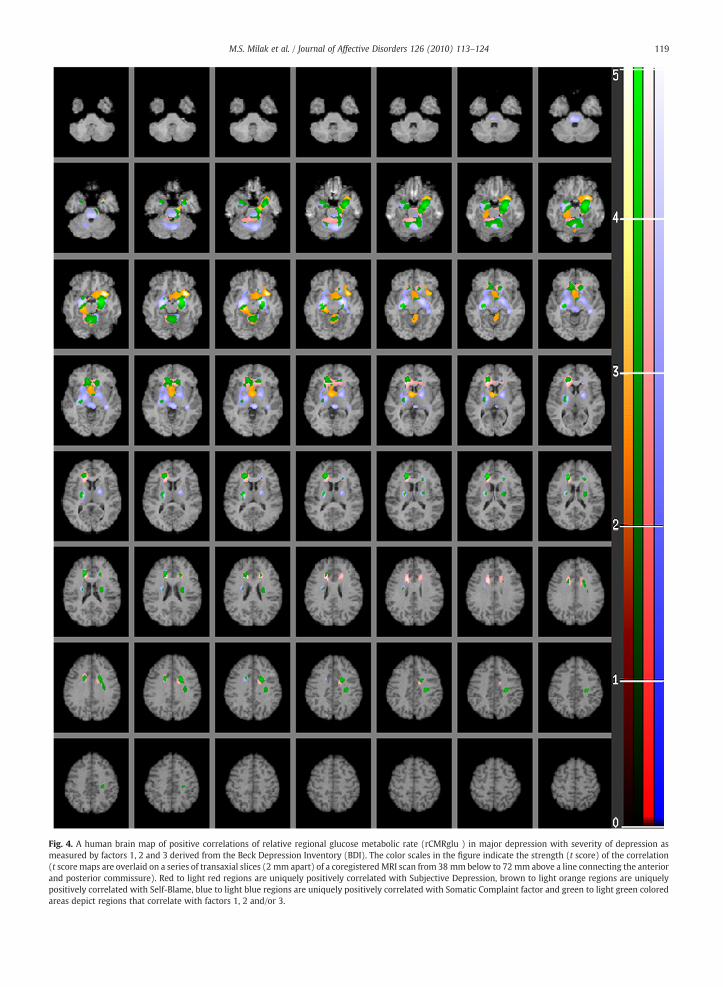
Fig. 4. A human brain map of positive correlations of relative regional glucose metabolic rate (rCMRglu ) in major depression with severity of depression asmeasured by factors 1, 2 and 3 derived from the Beck Depression Inventory (BDI). The color scales in the figure indicate the strength (t score) of the correlation(t score maps are overlaid on a series of transaxial slices (2 mm apart) of a coregistered MRI scan from 38 mmbelow to 72 mm above a line connecting the anteriorand posterior commissure). Red to light red regions are uniquely positively correlated with Subjective Depression, brown to light orange regions are uniquelypositively correlated with Self-Blame, blue to light blue regions are uniquely positively correlated with Somatic Complaint factor and green to light green coloredareas depict regions that correlate with factors 1, 2 and/or 3.
119M.S. Milak et al. / Journal of Affective Disorders 126 (2010) 113–124
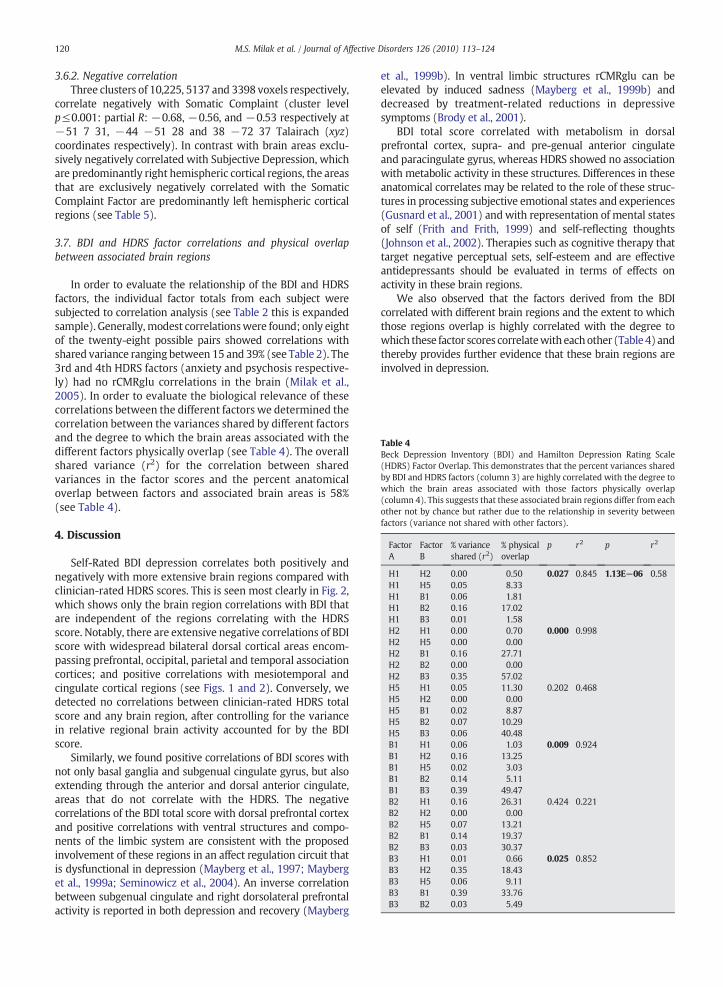
Table 4Beck Depression Inventory (BDI) and Hamilton Depression Rating Scale(HDRS) Factor Overlap. This demonstrates that the percent variances sharedby BDI and HDRS factors (column 3) are highly correlated with the degree towhich the brain areas associated with those factors physically overlap(column 4). This suggests that these associated brain regions differ from eachother not by chance but rather due to the relationship in severity betweenfactors (variance not shared with other factors).
FactorA
FactorB
% varianceshared (r2)
% physicaloverlap
p r2 p r2
H1 H2 0.00 0.50 0.027 0.845 1.13E−06 0.58H1 H5 0.05 8.33H1 B1 0.06 1.81H1 B2 0.16 17.02H1 B3 0.01 1.58H2 H1 0.00 0.70 0.000 0.998H2 H5 0.00 0.00H2 B1 0.16 27.71H2 B2 0.00 0.00H2 B3 0.35 57.02H5 H1 0.05 11.30 0.202 0.468H5 H2 0.00 0.00H5 B1 0.02 8.87H5 B2 0.07 10.29H5 B3 0.06 40.48B1 H1 0.06 1.03 0.009 0.924B1 H2 0.16 13.25B1 H5 0.02 3.03B1 B2 0.14 5.11B1 B3 0.39 49.47B2 H1 0.16 26.31 0.424 0.221B2 H2 0.00 0.00B2 H5 0.07 13.21B2 B1 0.14 19.37B2 B3 0.03 30.37B3 H1 0.01 0.66 0.025 0.852B3 H2 0.35 18.43B3 H5 0.06 9.11B3 B1 0.39 33.76B3 B2 0.03 5.49
120 M.S. Milak et al. / Journal of Affective Disorders 126 (2010) 113–124
3.6.2. Negative correlationThree clusters of 10,225, 5137 and 3398 voxels respectively,
correlate negatively with Somatic Complaint (cluster levelp≤0.001: partial R: −0.68, −0.56, and −0.53 respectively at−51 7 31, −44 −51 28 and 38 −72 37 Talairach (xyz)coordinates respectively). In contrast with brain areas exclu-sively negatively correlated with Subjective Depression, whichare predominantly right hemispheric cortical regions, the areasthat are exclusively negatively correlated with the SomaticComplaint Factor are predominantly left hemispheric corticalregions (see Table 5).
3.7. BDI and HDRS factor correlations and physical overlapbetween associated brain regions
In order to evaluate the relationship of the BDI and HDRSfactors, the individual factor totals from each subject weresubjected to correlation analysis (see Table 2 this is expandedsample). Generally, modest correlationswere found; only eightof the twenty-eight possible pairs showed correlations withshared variance ranging between 15 and 39% (see Table 2). The3rd and 4th HDRS factors (anxiety and psychosis respective-ly) had no rCMRglu correlations in the brain (Milak et al.,2005). In order to evaluate the biological relevance of thesecorrelations between the different factors we determined thecorrelation between the variances shared by different factorsand the degree to which the brain areas associated with thedifferent factors physically overlap (see Table 4). The overallshared variance (r2) for the correlation between sharedvariances in the factor scores and the percent anatomicaloverlap between factors and associated brain areas is 58%(see Table 4).
4. Discussion
Self-Rated BDI depression correlates both positively andnegatively with more extensive brain regions compared withclinician-rated HDRS scores. This is seen most clearly in Fig. 2,which shows only the brain region correlations with BDI thatare independent of the regions correlating with the HDRSscore. Notably, there are extensive negative correlations of BDIscore with widespread bilateral dorsal cortical areas encom-passing prefrontal, occipital, parietal and temporal associationcortices; and positive correlations with mesiotemporal andcingulate cortical regions (see Figs. 1 and 2). Conversely, wedetected no correlations between clinician-rated HDRS totalscore and any brain region, after controlling for the variancein relative regional brain activity accounted for by the BDIscore.
Similarly, we found positive correlations of BDI scores withnot only basal ganglia and subgenual cingulate gyrus, but alsoextending through the anterior and dorsal anterior cingulate,areas that do not correlate with the HDRS. The negativecorrelations of the BDI total score with dorsal prefrontal cortexand positive correlations with ventral structures and compo-nents of the limbic system are consistent with the proposedinvolvement of these regions in an affect regulation circuit thatis dysfunctional in depression (Mayberg et al., 1997; Mayberget al., 1999a; Seminowicz et al., 2004). An inverse correlationbetween subgenual cingulate and right dorsolateral prefrontalactivity is reported in both depression and recovery (Mayberg
et al., 1999b). In ventral limbic structures rCMRglu can beelevated by induced sadness (Mayberg et al., 1999b) anddecreased by treatment-related reductions in depressivesymptoms (Brody et al., 2001).
BDI total score correlated with metabolism in dorsalprefrontal cortex, supra- and pre-genual anterior cingulateand paracingulate gyrus, whereas HDRS showed no associationwith metabolic activity in these structures. Differences in theseanatomical correlates may be related to the role of these struc-tures in processing subjective emotional states and experiences(Gusnard et al., 2001) andwith representation of mental statesof self (Frith and Frith, 1999) and self-reflecting thoughts(Johnson et al., 2002). Therapies such as cognitive therapy thattarget negative perceptual sets, self-esteem and are effectiveantidepressants should be evaluated in terms of effects onactivity in these brain regions.
We also observed that the factors derived from the BDIcorrelated with different brain regions and the extent to whichthose regions overlap is highly correlated with the degree towhich these factor scores correlatewith eachother (Table4) andthereby provides further evidence that these brain regions areinvolved in depression.
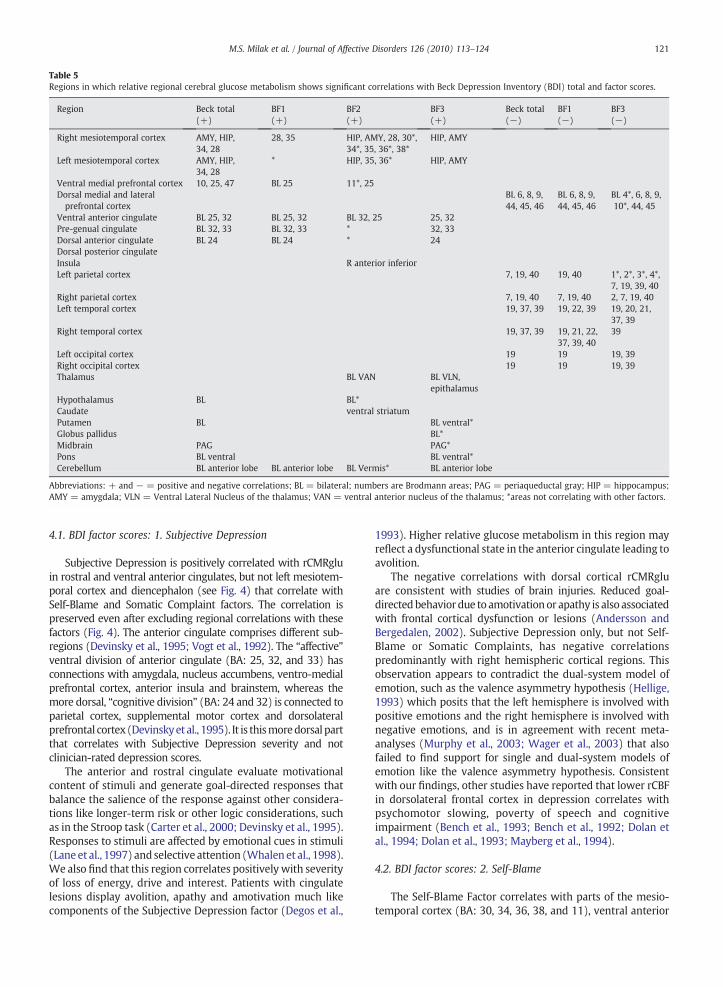
Table 5Regions in which relative regional cerebral glucose metabolism shows significant correlations with Beck Depression Inventory (BDI) total and factor scores.
Region Beck total(+)
BF1(+)
BF2(+)
BF3(+)
Beck total(−)
BF1(−)
BF3(−)
Right mesiotemporal cortex AMY, HIP,34, 28
28, 35 HIP, AMY, 28, 30*,34*, 35, 36*, 38*
HIP, AMY
Left mesiotemporal cortex AMY, HIP,34, 28
* HIP, 35, 36* HIP, AMY
Ventral medial prefrontal cortex 10, 25, 47 BL 25 11*, 25Dorsal medial and lateralprefrontal cortex
BL 6, 8, 9,44, 45, 46
BL 6, 8, 9,44, 45, 46
BL 4*, 6, 8, 9,10*, 44, 45
Ventral anterior cingulate BL 25, 32 BL 25, 32 BL 32, 25 25, 32Pre-genual cingulate BL 32, 33 BL 32, 33 * 32, 33Dorsal anterior cingulate BL 24 BL 24 * 24Dorsal posterior cingulateInsula R anterior inferiorLeft parietal cortex 7, 19, 40 19, 40 1*, 2*, 3*, 4*,
7, 19, 39, 40Right parietal cortex 7, 19, 40 7, 19, 40 2, 7, 19, 40Left temporal cortex 19, 37, 39 19, 22, 39 19, 20, 21,
37, 39Right temporal cortex 19, 37, 39 19, 21, 22,
37, 39, 4039
Left occipital cortex 19 19 19, 39Right occipital cortex 19 19 19, 39Thalamus BL VAN BL VLN,
epithalamusHypothalamus BL BL*Caudate ventral striatumPutamen BL BL ventral*Globus pallidus BL*Midbrain PAG PAG*Pons BL ventral BL ventral*Cerebellum BL anterior lobe BL anterior lobe BL Vermis* BL anterior lobe
Abbreviations: + and − = positive and negative correlations; BL = bilateral; numbers are Brodmann areas; PAG = periaqueductal gray; HIP = hippocampus;AMY = amygdala; VLN = Ventral Lateral Nucleus of the thalamus; VAN = ventral anterior nucleus of the thalamus; *areas not correlating with other factors.
121M.S. Milak et al. / Journal of Affective Disorders 126 (2010) 113–124
4.1. BDI factor scores: 1. Subjective Depression
Subjective Depression is positively correlated with rCMRgluin rostral and ventral anterior cingulates, but not left mesiotem-poral cortex and diencephalon (see Fig. 4) that correlate withSelf-Blame and Somatic Complaint factors. The correlation ispreserved even after excluding regional correlations with thesefactors (Fig. 4). The anterior cingulate comprises different sub-regions (Devinsky et al., 1995; Vogt et al., 1992). The “affective”ventral division of anterior cingulate (BA: 25, 32, and 33) hasconnections with amygdala, nucleus accumbens, ventro-medialprefrontal cortex, anterior insula and brainstem, whereas themore dorsal, “cognitive division” (BA: 24 and 32) is connected toparietal cortex, supplemental motor cortex and dorsolateralprefrontal cortex (Devinskyet al., 1995). It is thismoredorsal partthat correlates with Subjective Depression severity and notclinician-rated depression scores.
The anterior and rostral cingulate evaluate motivationalcontent of stimuli and generate goal-directed responses thatbalance the salience of the response against other considera-tions like longer-term risk or other logic considerations, suchas in the Stroop task (Carter et al., 2000; Devinsky et al., 1995).Responses to stimuli are affected by emotional cues in stimuli(Lane et al., 1997) andselective attention (Whalen et al., 1998).We also find that this region correlates positively with severityof loss of energy, drive and interest. Patients with cingulatelesions display avolition, apathy and amotivation much likecomponents of the Subjective Depression factor (Degos et al.,
1993). Higher relative glucose metabolism in this region mayreflect a dysfunctional state in the anterior cingulate leading toavolition.
The negative correlations with dorsal cortical rCMRgluare consistent with studies of brain injuries. Reduced goal-directedbehaviordue to amotivationor apathy is also associatedwith frontal cortical dysfunction or lesions (Andersson andBergedalen, 2002). Subjective Depression only, but not Self-Blame or Somatic Complaints, has negative correlationspredominantly with right hemispheric cortical regions. Thisobservation appears to contradict the dual-system model ofemotion, such as the valence asymmetry hypothesis (Hellige,1993) which posits that the left hemisphere is involved withpositive emotions and the right hemisphere is involved withnegative emotions, and is in agreement with recent meta-analyses (Murphy et al., 2003; Wager et al., 2003) that alsofailed to find support for single and dual-system models ofemotion like the valence asymmetry hypothesis. Consistentwith our findings, other studies have reported that lower rCBFin dorsolateral frontal cortex in depression correlates withpsychomotor slowing, poverty of speech and cognitiveimpairment (Bench et al., 1993; Bench et al., 1992; Dolan etal., 1994; Dolan et al., 1993; Mayberg et al., 1994).
4.2. BDI factor scores: 2. Self-Blame
The Self-Blame Factor correlates with parts of the mesio-temporal cortex (BA: 30, 34, 36, 38, and 11), ventral anterior
122 M.S. Milak et al. / Journal of Affective Disorders 126 (2010) 113–124
nucleus of thalamus, hypothalamus and cerebellar vermis, allbrain regions having no correlations with Subjective Depres-sion or Somatic Complaints factors (see Table 5).
Self-Blame in MDD has previously been reported tocorrelate with lower absolute metabolism bilaterally in frontalcortex and supracallosal cingulate, andwith higher rCMRglu indorsal right insula, dorsal regions of left middle and superiortemporal gyri, right cerebellum (anterior lobe, vermis), andmesencephalon (Dunn et al., 2002). These regions have alsobeen implicated in recognizing facial emotion (George et al.,1993), transformations of the body-in-space (Bonda et al.,1995), anticipatory anxiety (Reiman et al., 1989), and ininterpretation of figurative aspects of language (Bench et al.,1992; Bottini et al., 1994). Self-Blame may involve impairedprocessing of environmental cues regarding affect conveyedeither by language or facial expressions leading the individualto assign negative self-appraisals.
Active maintenance of negative emotion is associated withincreased amygdala activity (Schaefer et al., 2002) anddetection of fearful faces is associated with amygdala overactivation in major depression, that is reversed by treatment(Sheline et al., 2001). The effortful reduction of subjectiveexperience of negative affect via reappraisal of negative socialemotions is associated with decreased activation of theamygdala and medial orbito-frontal cortex and increasedactivation of the lateral andmedial prefrontal regions (Ochsneret al., 2002), and is the opposite of the pattern of activationfound here and in other studies of major depression (Drevets,2000;Mayberg, 1997;Mayberg et al., 1999b). Thus, Self-Blamemay be understood as resulting from a failure of regulation ofnegative self-directed emotions and its correlation withactivity in these regions may be part of the biologicalunderpinning of the symptoms covered by Self-Blame factor.
The BDI Self-Blame factor is also the component of thisscale that can distinguish individuals with a past history ofsuicide attempt (Grunebaum et al., 2005).
4.3. BDI factor scores: 3. Somatic Complaints
Somatic Complaints, but not Subjective Depression or Self-Blame, is positively correlated with activity in deeper brainstructures including ventro-lateral thalamus, epithalamus,putamen, globus pallidus, periaqueductal gray, midbrain,superior colliculi and ventral pons, but not the hypothalamus.Items loading on Somatic Complaints were insomnia, weightloss, loss of appetite and somatic concerns. The thalamusmonitors physical state via sensory inputs and may mediatethe somatic concerns including appetite (Killgore et al., 2003;McGilchrist et al., 1993; Reilly, 1998). In addition, SomaticComplaints factor also positively correlated with the anteriorcingulate (Table 5 and Fig. 4). Higher normalized rCBF incingulate was previously found to correlate with somaticsymptoms (Bench et al., 1993). Moreover, subgenual anteriorcingulate (Devinsky et al., 1995; Paus, 2001) is involved inautonomic and conditioned responses to emotionally salientstimuli, while the subgenual ventral PFC (Rolls, 2000) isimplicated in the evaluation and regulation of autonomic andendocrine response to negatively charged emotional stimulisuch as fear (Sullivan and Gratton, 1999). Our study suggeststhat exaggerated thalamic responses to sensory inputs may
underlie somatic symptoms associated with Somatic Com-plaints factor.
4.4. Orthogonalized BDI and HDRS score correlations withrCMRglu
To remove shared variance between the HDRS and BDI aswell as HDRS and rCMRglu, we partialled out HDRS scores fromboth the BDI scores and rCMRglu. The residuals of these BDIscores show both extensive positive and negative correlationswith the residuals of cerebralmetabolic activity (see Fig. 2). Thissuggests that the self-rated BDI captures biologically relevantcomponents of depression severity and related neural circuitrythat the HDRS does not. In contrast, residualized HDRS scores(removing variance shared with BDI) do not correlate withcerebral metabolic activity, suggesting that all regional activityvariance due to HDRS scores, in this sample, is accounted for inthe BDI score.
This finding suggests that measuring depression severitysolely via the HDRS will miss clinically important and bio-logically relevant aspects of depressive symptomatology.
4.5. Limitations
One limitation of this study is that we examined a restingstate and not changes in brain activity in the context of acognitive or mood challenge. However, identifying psycho-pathological correlates of resting activity in brain regions inMDD suggests functional studies of cognition and moodregulation to further evaluate the role of these brain regionsin the pathogenesis of major depression.
4.6. Consequences for measurement of treatment effects
The degree of overlap in brain region correlates of the BDIand HDRS is strongly associated with the degree of correla-tion between HDRS and BDI factor scores (Steer et al., 1987).The subjective experience of major depression, as reflected bythe self-reported BDI, appears to relate to a more extensivearray of brain structures thought to be responsible for theperception, production and/or regulation of emotion com-pared with the clinician-rated HDRS factors. HDRS showsassociations primarily with brain structures thought to beresponsible for autonomic or neurovegetative responses toemotionally salient stimuli (Milak et al., 2005). The subjectivesense of depression may be more deeply rooted in alteredbrain physiology than previously suspected.
The emphasis on “objectivity” in clinical ratings of depres-sion may overlook fundamental aspects of the disorder relatedto the subjective experience ofmajor depression that this studyshows also involve brain regions that differ from thoseassociated with clinician-rated depression severity. The timecourse of clinical response to antidepressant treatment alsoappears to be different with clinician-rated depression re-sponding more quickly than subjective severity of majordepression (Adda et al., 1997; Ambrosini et al., 1999; Posternakand Miller, 2001; Thase et al., 1991).
The BDI and its correlated brain regions and the HDRS andits correlated brain regions need to be evaluated as potentialindependent predictors of clinical response to various antide-pressant therapies. Our findings illustrate that the subjective
123M.S. Milak et al. / Journal of Affective Disorders 126 (2010) 113–124
symptomsof depressionhave distinct biological correlates thatare not captured by clinician ratings.
Role of funding sourceFunding for this study was provided by NIMH Grants MH40695,
MH62185, RR00645 and NARSAD; the funding agencies had no further rolein study design or in the collection, analysis and interpretation of data; inthe writing of the report; and in the decision to submit the paper forpublication.
Conflict of interestDr. Mann has unrelated grants from Novartis and GSK, all other authors
declare that they have no conflicts of interest.
Acknowledgements
Dr. Shuhua Li assisted with the polychoric statistics.This study was supported in part by NIH Grants MH40695,
MH62185, RR00645 and NARSAD.
References
Adda, C., Lefevre, B., Reimao, R., 1997. Narcolepsy and depression. Arq.Neuropsiquiatr. 55, 423–426.
Akdemir, A., Turkcapar, M.H., Orsel, S.D., Demirergi, N., Dag, I., Ozbay, M.H.,2001. Reliability and validity of the Turkish version of the HamiltonDepression Rating Scale. Compr. Psychiatry 42, 161–165.
Ambrosini, P.J., Wagner, K.D., Biederman, J., Glick, I., Tan, C., Elia, J., Hebeler, J.R.,Rabinovich, H., Lock, J., Geller, D., 1999. Multicenter open-label sertralinestudy in adolescent outpatients with major depression. J. Am. Acad. ChildAdolesc. Psychiatry 38, 566–572.
American Psychiatric Association, T.F.o.D.-I., 1994. Diagnostic and StatisticalManual of Mental Disorders: DSM-IV. American Psychiatric Association,Washington, DC.
Andersson, S., Bergedalen, A.M., 2002. Cognitive correlates of apathy intraumatic brain injury. Neuropsychiatry Neuropsychol. Behav. Neurol. 15,184–191.
Beck, A.T., Beamesderfer, A., 1974. Assessment of depression: the depressioninventory. Mod. Probl. Pharmacopsychiatry 7, 151–169.
Bench, C.J., Friston, K.J., Brown, R.G., Scott, L.C., Frackowiak, R.S., Dolan, R.J.,1992. The anatomy of melancholia-focal abnormalities of cerebral bloodflow in major depression. Psychol. Med. 22, 607–615.
Bench, C.J., Friston, K.J., Brown, R.G., Frackowiak, R.S., Dolan, R.J., 1993.Regional cerebral blood flow in depression measured by positronemission tomography: the relationship with clinical dimensions.Psychol. Med. 23, 579–590.
Bonda, E., Petrides, M., Frey, S., Evans, A., 1995. Neural correlates of mentaltransformations of the body-in-space. Proc. Natl. Acad. Sci. U. S. A. 92,11180–11184.
Bottini, G., Corcoran, R., Sterzi, R., Paulesu, E., Schenone, P., Scarpa, P.,Frackowiak, R.S., Frith, C.D., 1994. The role of the right hemisphere in theinterpretation of figurative aspects of language. A positron emissiontomography activation study. Brain 117 (Pt 6), 1241–1253.
Brett, M., 1999. The MNI brain and the Talairach atlas.Brody, A.L., Saxena, S., Mandelkern, M.A., Fairbanks, L.A., Ho, M.L., Baxter, L.R.,
2001. Brain metabolic changes associated with symptom factor im-provement in major depressive disorder. Biol. Psychiatry 50, 171–178.
Carter, C.S., Macdonald, A.M., Botvinick, M., Ross, L.L., Stenger, V.A., Noll, D.,Cohen, J.D., 2000. Parsing executive processes: strategic vs. evaluativefunctions of the anterior cingulate cortex. Proc. Natl. Acad. Sci. U. S. A. 97,1944–1948.
Degos, J.D., da Fonseca, N., Gray, F., Cesaro, P., 1993. Severe frontal syndromeassociated with infarcts of the left anterior cingulate gyrus and the headof the right caudate nucleus. A clinico-pathological case. Brain 116 (Pt 6),1541–1548.
Devinsky, O., Morrell, M.J., Vogt, B.A., 1995. Contributions of anteriorcingulate cortex to behaviour. Brain 118 (Pt 1), 279–306.
Dolan, R.J., Bench, C.J., Liddle, P.F., Friston, K.J., Frith, C.D., Grasby, P.M.,Frackowiak, R.S., 1993. Dorsolateral prefrontal cortex dysfunction in themajor psychoses; symptom or disease specificity? J. Neurol. Neurosurg.Psychiatry 56, 1290–1294.
Dolan, R.J., Bench, C.J., Brown, R.G., Scott, L.C., Frackowiak, R.S., 1994.Neuropsychological dysfunction in depression: the relationship toregional cerebral blood flow. Psychol. Med. 24, 849–857.
Drevets, W.C., 2000. Functional anatomical abnormalities in limbic andprefrontal cortical structures in major depression. Prog. Brain Res. 126,413–431.
Dunn, R.T., Kimbrell, T.A., Ketter, T.A., Frye,M.A.,Willis,M.W., Luckenbaugh,D.A.,Post, R.M., 2002. Principal components of the Beck Depression Inventoryand regional cerebral metabolism in unipolar and bipolar depression. Biol.Psychiatry 51, 387–399.
Friston, K., Holmes, A., Worsley, K., Poline, J., Frith, C., Frackowiak, R., 1995.Statistical parametric maps in functional imaging: a general linearapproach. Hum. Brain Mapp. 2, 189–210.
Frith, C.D., Frith, U., 1999. Interacting minds—a biological basis. Science 286,1692–1695.
George, M.S., Ketter, T.A., Gill, D.S., Haxby, J.V., Ungerleider, L.G., Herscovitch,P., Post, R.M., 1993. Brain regions involved in recognizing facial emotionor identity: an oxygen-15 PET study. J. Neuropsychiatry Clin. Neurosci. 5,384–394.
Grunebaum, M.F., Keilp, J., Li, S., Ellis, S.P., Burke, A.K., Oquendo, M.A., Mann, J.J.,2005. Symptom components of standard depression scales and pastsuicidal behavior. J. Affect. Disord. 87, 73–82.
Gusnard, D.A., Akbudak, E., Shulman, G.L., Raichle, M.E., 2001.Medial prefrontalcortex and self-referential mental activity: relation to a default mode ofbrain function. Proc. Natl. Acad. Sci. U. S. A. 98, 4259–4264.
Hamilton, M., 1960. A rating scale for depression. J. Neurol. Neurosurg.Psychiatry 23 (56–62), 56–62.
Hautzinger, M., 1991. The Beck Depression Inventory in clinical practice.Nervenarzt 62, 689–696.
Hellige, J.B., 1993. Hemispheric Asymmetry: What's Right and What's Left.Harvard University Press, Cambridge, Mass.
Johnson, S.C., Baxter, L.C., Wilder, L.S., Pipe, J.G., Heiserman, J.E., Prigatano, G.P.,2002. Neural correlates of self-reflection. Brain 125, 1808–1814.
Killgore, W.D., Young, A.D., Femia, L.A., Bogorodzki, P., Rogowska, J.,Yurgelun-Todd, D.A., 2003. Cortical and limbic activation during viewingof high- versus low-calorie foods. NeuroImage 19, 1381–1394.
Lane, R.D., Reiman, E.M., Ahern, G.L., Schwartz, G.E., Davidson, R.J., 1997.Neuroanatomical correlates of happiness, sadness, and disgust. Am. J.Psychiatry 154, 926–933.
Mann, J.J.,Waternaux, C., Haas, G.L.,Malone, K.M., 1999. Toward a clinicalmodelof suicidal behavior in psychiatric patients. Am. J. Psychiatry 156, 181–189.
Mann, J.J., Ellis, S.P., Waternaux, C.M., Liu, X., Oquendo, M.A., Malone, K.M.,Brodsky, B.S., Haas, G.L., Currier, D., 2008. Classification trees distinguishsuicide attempters in major psychiatric disorders: a model of clinicaldecision making. J. Clin. Psychiatry 69, 23–31.
Mayberg, H.S., 1997. Limbic-cortical dysregulation: a proposed model ofdepression. J. Neuropsychiatry Clin. Neurosci. 9, 471–481.
Mayberg, H.S., Lewis, P.J., Regenold, W., Wagner Jr., H.N., 1994. Paralimbichypoperfusion in unipolar depression. J. Nucl. Med. 35, 929–934.
Mayberg, H.S., Brannan, S.K., Mahurin, R.K., Jerabek, P.A., Brickman, J.S.,Tekell, J.L., Silva, J.A., McGinnis, S., Glass, T.G., Martin, C.C., Fox, P.T., 1997.Cingulate function in depression: a potential predictor of treatmentresponse. NeuroReport 8, 1057–1061.
Mayberg,H.S., Liotti,M., Brannan, S.K.,McGinnis, S.,Mahurin, R.K., Jerabek, P.A.,Silva, J.A., Tekell, J.L., Martin, C.C., Lancaster, J.L., Fox, P.T., 1999a. Reciprocallimbic-cortical function and negative mood: converging PET findings indepression and normal sadness. Am. J. Psychiatry 156, 675–682.
Mayberg, H.S., Liotti, M., Brannan, S.K., McGinnis, S., Mahurin, R.K., Jerabek, P.A.,Silva, J.A., Tekell, J.L., Martin, C.C., Lancaster, J.L., Fox, P.T., 1999b. Reciprocallimbic-cortical function and negative mood: converging PET findings indepression and normal sadness. Am. J. Psychiatry 156, 675–682.
McGilchrist, I., Goldstein, L.H., Jadresic, D., Fenwick, P., 1993. Thalamo-frontalpsychosis. Br. J. Psychiatry 163, 113–115.
Milak, M.S., Parsey, R.V., Keilp, J., Oquendo, M.A., Malone, K.M., Mann, J.J.,2005. Neuroanatomic correlates of psychopathologic components ofmajor depressive disorder. Arch. Gen. Psychiatry 62, 397–408.
Murphy, F.C., Nimmo-Smith, I., Lawrence, A.D., 2003. Functional neuroanat-omy of emotions: a meta-analysis. Cogn. Affect. Behav. Neurosci. 3,207–233.
Ochsner, K.N., Bunge, S.A., Gross, J.J., Gabrieli, J.D., 2002. Rethinking feelings:an FMRI study of the cognitive regulation of emotion. J. Cogn. Neurosci.14, 1215–1229.
Oquendo, M.A., Galfalvy, H., Russo, S., Ellis, S.P., Grunebaum, M.F., Burke, A.,Mann, J.J., 2004. Prospective study of clinical predictors of suicidal actsafter a major depressive episode in patients with major depressivedisorder or bipolar disorder. Am. J. Psychiatry 161, 1433–1441.
Oquendo, M.A., Bongiovi-Garcia, M.E., Galfalvy, H., Goldberg, P.H., Grunebaum,M.F., Burke, A.K., Mann, J.J., 2007. Sex differences in clinical predictors ofsuicidal acts after major depression: a prospective study. Am. J. Psychiatry164, 134–141.
124 M.S. Milak et al. / Journal of Affective Disorders 126 (2010) 113–124
Paus, T., 2001. Primate anterior cingulate cortex: where motor control, driveand cognition interface. Nat. Rev. Neurosci. 2, 417–424.
Posternak, M.A., Miller, I., 2001. Untreated short-term course of majordepression: a meta-analysis of outcomes from studies using wait-listcontrol groups. J. Affect. Disord. 66, 139–146.
Reilly, S., 1998. The role of the gustatory thalamus in taste-guided behavior.Neurosci. Biobehav. Rev. 22, 883–901.
Reiman, E.M., Fusselman, M.J., Fox, P.T., Raichle, M.E., 1989. Neuroanatomicalcorrelates of anticipatory anxiety. Science 243, 1071–1074.
Rolls, E.T., 2000. Precis of the brain and emotion. Behav. Brain Sci. 23,177–191 discussion 192–233.
Schaefer, S.M., Jackson, D.C., Davidson, R.J., Aguirre, G.K., Kimberg, D.Y.,Thompson-Schill, S.L., 2002. Modulation of amygdalar activity by theconscious regulation of negative emotion. J. Cogn. Neurosci. 14, 913–921.
Seminowicz, D.A., Mayberg, H.S., McIntosh, A.R., Goldapple, K., Kennedy, S.,Segal, Z., Rafi-Tari, S., 2004. Limbic-frontal circuitry in major depression:a path modeling metanalysis. NeuroImage 22, 409–418.
Sheline, Y.I., Barch, D.M., Donnelly, J.M., Ollinger, J.M., Snyder, A.Z., Mintun,M.A., 2001. Increased amygdala response to masked emotional faces indepressed subjects resolves with antidepressant treatment: an fMRIstudy. Biol. Psychiatry 50, 651–658.
Steer, R., Beck, A., Riskind, J., Brown, G., 1987. Relationships between the BeckDepression Inventory and the Hamilton Psychiatric Rating Scale forDepression in depressed outpatients. J. Psychopathol. Behav. Assess. 9,327–339.
Sullivan, R.M., Gratton, A., 1999. Lateralized effects of medial prefrontal cortexlesions on neuroendocrine and autonomic stress responses in rats. J.Neurosci. 19, 2834–2840.
Talairach, J., Tournoux, P., 1988. Co-planar Stereotaxic Atlas of the HumanBrain: 3-Dimensional Proportional System — an Approach to CerebralImaging. Thieme Medical Publishers, New York, NY.
Thase, M.E., Simons, A.D., Cahalane, J., McGeary, J., Harden, T., 1991. Severity ofdepression and response to cognitive behavior therapy. Am. J. Psychiatry148, 784–789.
Uehara, T., Sato, T., Sakado, K., 2005. Correlations among depression ratingscales and a self-rating anxiety scale in depressive outpatients. Psychiatryon-line.
Uher, R., Farmer, A., Maier, W., Rietschel, M., Hauser, J., Marusic, A., Mors, O.,Elkin, A.,Williamson, R.J., Schmael, C., Henigsberg, N., Perez, J., Mendlewicz,J., Janzing, J.G., Zobel, A., Skibinska, M., Kozel, D., Stamp, A.S., Bajs, M.,Placentino, A., Barreto, M., McGuffin, P., Aitchison, K.J., 2008. Measuringdepression: comparison and integration of three scales in the GENDEPstudy. Psychol. Med. 38, 289–300.
Vogt, B.A., Finch, D.M., Olson, C.R., 1992. Functional heterogeneity incingulate cortex: the anterior executive and posterior evaluative regions.Cereb. Cortex 2, 435–443.
Wager, T.D., Phan, K.L., Liberzon, I., Taylor, S.F., 2003. Valence, gender, andlateralization of functional brain anatomy in emotion: a meta-analysis offindings from neuroimaging. NeuroImage 19, 513–531.
Whalen, P.J., Bush, G., McNally, R.J., Wilhelm, S., McInerney, S.C., Jenike, M.A.,Rauch, S.L., 1998. The emotional counting Stroop paradigm: a functionalmagnetic resonance imaging probe of the anterior cingulate affectivedivision. Biol. Psychiatry 44, 1219–1228.
Wichowicz, H., Sumila, A., Stolcman, M., 2004. Assessment of presence anddegree of depression in elderly, chronic ill patients: application selectedscales advantages and disadvantages of this method of diagnosis. Przegl.Lek. 61, 1374–1377.
Copyright © 2022 FDOKUMEN


![Credit ratings failures and policy options [with Discussion]](https://static.fdokumen.com/doc/165x107/633fd3e6d10f841e2f086984/credit-ratings-failures-and-policy-options-with-discussion.jpg)