Titan's atmosphere simulation experiment using continuum UV‐VUV synchrotron radiation
Upload
independentCategory
view
1download
0
ARTICLE IN PRESS YICAR:7979JID:YICAR AID:7979 /FLA [m5+; v 1.64; Prn:1/08/2006; 16:01] P.1 (1-7)
Icarus ••• (••••) •••–•••www.elsevier.com/locate/icarus
Reflectance spectra and chemical structure of Titan’s tholins:Application to the analysis of Cassini–Huygens observations
J.-M. Bernard a, E. Quirico a,∗, O. Brissaud a, G. Montagnac b, B. Reynard b, P. McMillan c, P. Coll d,M.-J. Nguyen d, F. Raulin d, B. Schmitt a
a Laboratoire de Planétologie de Grenoble, Université Joseph Fourier - CNRS, Bâtiment D de Physique, B.P. 53, 38041 Grenoble cedex 9, Franceb Laboratoire de Sciences de la Terre, Ecole Normale Supérieure de Lyon, 46 Allée d’Italie, 69364 Lyon cedex 7, France
c Christopher Ingold Laboratories, Department of Chemistry, University College London, 20, Gordon Street, London WC1H 0AJ, UKd Laboratoire Interuniversitaire des Systèmes Atmosphériques, Université Paris XII–Paris VII, 61 av. du Gal de Gaulle, 94010 Créteil cedex, France
Received 19 November 2005; revised 9 May 2006
Abstract
Titan’s tholins are used as analogs of Titan’s aerosols and N-rich organic solids present on many icy surfaces. However, it is not clear whetheror not they are relevant analogs, and which kind of tholins should be used among a wide set available in literature. This paper presents reflectancespectral data of two tholins selected as end-members of a series of samples covering a very wide range of continuous chemical and opticalproperties. These samples were formed under experimental conditions fairly consistent with Titan’s stratosphere. A general framework for usingthese laboratory data to the analysis of spectral observation of Titan’s surface or other objects is suggested. Furthermore, the study reports the firstin situ unambiguous identification of aromatics compounds and evidences variations in the sp2 carbon structure, which controls the absorptionproperties in the visible/NIR. These results also point out it is very unlikely to derive quantitative chemical information (e.g., N content, sp2/sp3
ratio) from remote sensing reflectance data.© 2006 Elsevier Inc. All rights reserved.
Keywords: Titan; Organic chemistry; Satellites, surfaces
1. Introduction
The dense atmosphere of Titan is mostly composed of N2
with a few percent of methane. It is the site of an intense chem-istry where different kinds of aerosols form from radiolysisand/or photochemical reactions with solar photons and ener-getic particles incoming from Saturn’s magnetosphere. Theseaerosols are expected to sediment onto the surface and toform a more or less thick layer, possibly transported throughhydrocarbon-rich fluids (Tomasko et al., 2005). The formationmechanisms and chemical composition of these aerosols are un-known.
For more than twenty years, experiments carried out in sev-eral laboratories have attempted to simulate Titan’s atmospheric
* Corresponding author. Fax: +33 (0) 4 76 51 41 46.E-mail address: [email protected] (E. Quirico).
Please cite this article as: J.-M. Bernard et al., Reflectance spectra and chemical strobservations, Icarus (2006), doi:10.1016/j.icarus.2006.06.004.
0019-1035/$ – see front matter © 2006 Elsevier Inc. All rights reserved.doi:10.1016/j.icarus.2006.06.004
chemistry and to produce aerosol analogues that are now termedTitan’s tholins (e.g., Sagan and Khare, 1979; reviews by Coll etal., 1997; Imanaka et al., 2004). The general framework of theseexperiments involves the irradiation of an initial gas mixture byenergetic particles and/or photons, during experimental condi-tions that are assumed to be close to those prevailing in Titan’satmosphere. The resulting tholins are then recovered and stud-ied using different techniques in order to determine their chem-ical composition and their spectral properties, that are requiredfor interpreting the observational data (e.g., Khare et al., 1984;McDonald et al., 1994; Coll et al., 1999; Ramirez et al., 2002;Bernard et al., 2003). However, there is up to now no observa-tional evidence that Titan’s tholins are valid analogs of Titan’saerosols. The chemical pathways forming tholins, in any exper-imental set-up, are certainly very different than processes whichdo form the yellowish aerosols in Titan’s atmosphere (pho-tochemistry, diffusion through large scale in the atmosphere,etc.). One may consider that the more relevant tholins originate
ucture of Titan’s tholins: Application to the analysis of Cassini–Huygens

ARTICLE IN PRESS YICAR:7979JID:YICAR AID:7979 /FLA [m5+; v 1.64; Prn:1/08/2006; 16:01] P.2 (1-7)
2 J.-M. Bernard et al. / Icarus ••• (••••) •••–•••
from experiments where the atmospheric composition of Titanis reproduced in terms of nature and abundance of moleculesformed at the gaseous state (e.g., Bernard et al., 2003). Un-fortunately, none of the experiments carried out up to now hasbeen able to accurately mimic, qualitatively and quantitatively,the gaseous composition of Titan’s atmosphere. Moreover, evenfor experimental conditions roughly similar to those expectedin Titan, slight variations of experimental parameters (pressure,temperature, discharge intensity, etc.) induces large variationsin the chemical composition and spectral properties of tholins(Coll et al., 1997; Khare and Sagan, 2002; Bernard et al., 2002;Imanaka et al., 2004). Consequently, it is not possible to fix theprecise set of experimental conditions and samples that are themost relevant to Titan’s chemistry. This problem is of partic-ular concern for anyone who wants to analyze observationalspectral data, as the current state of literature is rather con-fusing. A wide set of optical constants and reflectance spectraare available, but they originate from various samples and ex-perimental conditions, with many of them irrelevant to Titan’sconditions (e.g., Khare et al., 1984; Cruikshank et al., 1991;Imanaka et al., 2004).
This short paper reports a first attempt in defining a new gen-eral framework for using tholins as analogs of Titan’s aerosolsfor the analysis of spectral observations. Instead of tentativelyproviding the chimeric “ideal analog,” a continuous set oftholins was produced from a DC-discharge experiment withphysical conditions consistent with those of Titan’s stratosphere(Coll et al., 1999; Bernard et al., 2002). Two tholins were se-lected as the two end-members of this series exhibiting a contin-uous range of visible optical properties (i.e., with visual colorsranging from yellowish to brown/black). Their reflectance spec-tra have been measured in the range 0.4–4.5 µm, covering mostof the solar range of interest for both the DISR and VIMS in-struments, and they have been discussed in terms of analysisof spectral observations of Titan’s surface. These new experi-mental data are the ones which were used for the preliminaryanalysis of the DISR data of the surface of Titan (Tomasko etal., 2005).
This paper also reports the first reliable Raman study of Ti-tan’s tholins, by resonant UV Raman spectroscopy. Aromaticscompounds have been unambiguously detected in situ, and theirabundance was found to correlate with sample color (e.g., visi-ble gap). The amorphous structure of the samples is evidenced,as well as variation in the (C, N) skeleton between the two end-members. Thanks to these results, the chemical informationwhich could be derived from reflectance spectral observationsis discussed.
2. Experimental
The samples were produced from a N2:CH4 = 98%:2%gaseous mixture (P = 0.9 mbar) exposed to an electric dis-charge (current 30 mA) in an open gas flow system. The exper-imental set-up located in LISA (Créteil, France) is describedin detail elsewhere (Bernard et al., 2003; Coll et al., 1999).The elemental composition of the samples was determined us-ing a standard combustion/oxidation technique (ICSN-CNRS,
Please cite this article as: J.-M. Bernard et al., Reflectance spectra and chemical strobservations, Icarus (2006), doi:10.1016/j.icarus.2006.06.004.
France). The structures and chemical compositions of sampleswere investigated by UV Raman microspectrometry (244 nmexcitation), using a Labram HR800 Jobin-Yvon Raman spec-trometer equipped with a microscope (×40 objective), and bymid-IR spectrometry on KBr pellets using an FTIR Nicolet800 spectrometer (7000–400 cm−1 spectral range). The bidi-rectional reflectance spectra were measured using a homemadespectrogonio radiometer (Brissaud et al., 2004), in the spectralrange 0.4–4.5 µm, using a collimated incident flux at normalincidence collected at an emergence angle of 30◦ (±2◦).
3. Results and discussion
3.1. Color, texture and elemental composition of samples
Two samples were extracted from the reactor walls sur-face: one close to the gas inlet point (BB), and the other atthe middle of the tube (YO). These samples have differentmacroscopic colors and elemental compositions: the BB sam-ple was black/brown, and had C/N = 1.72, C/H = 0.95, [C +N]/[H] = 1.50; YO was yellow/orange, C/N = 2.56, C/H =0.72, [C + N]/[H] = 1.00 (Fig. 1). Both samples exhibited largetextural, optical and chemical variations at the micrometricscale (Fig. 1). Black spheroidal nodules (∼50 µm) were presentwithin YO samples, associated with the most abundant smallermicrograins that had wide variations in color ranging fromwhite to black, through yellow, orange and red. In BB, mostof the micrometer-sized components were brown or black, withtextures that included needles, nodules, etc. For each sample,the macroscopic color reported represents an averaged contri-bution from the various micrometric constituents.
3.2. Transmission mid-IR spectra
The transmission infrared spectra (Fig. 1) are consistent withthose of bulk tholins produced previously by other groups (e.g.,Imanaka et al., 2004) and of hydrogenated CNx thin films (e.g.,Mutsukura and Akita, 1999). The main differences between thespectra of both samples observed here are: (1) the presencewithin YO samples of spectral features indicating CH2 and CH3aliphatic groups (2850–2950 cm−1), and (2) the structure ofthe band at ∼2200 cm−1 assigned to nitrile (–CN) and/or iso-cyanide (–NC) functional groups. The absence of the aliphaticfunctional groups in BB is consistent with its high C/H ratio,and this might indicate an increase of the sp2/sp3 ratio withrespect to YO (Imanaka et al., 2004). The spectral variationsin the structure of the band at 2200 cm−1 provide evidencefor different nitrogen speciation within the two samples. Pre-vious investigations using various band decomposition modelshave provided inconsistent results, as different N-bearing com-pounds were tentatively identified, finally demonstrating thatthe interpretation is not univocal (Imanaka et al., 2004; Mut-sukura and Akita, 1999, personal unpublished data).
3.3. Reflectance spectra
In order to model reflectance spectra of Titan, in particularDISR and VIMS data from the Cassini/Huygens mission, and
ucture of Titan’s tholins: Application to the analysis of Cassini–Huygens

ARTICLE IN PRESS YICAR:7979JID:YICAR AID:7979 /FLA [m5+; v 1.64; Prn:1/08/2006; 16:01] P.3 (1-7)
Reflectance spectra of Titan’s tholins 3
Fig. 1. The mid-IR spectra of the tholins BB and YO. The dotted rectangles point out the main differences between both spectra, including (left) the presence/absenceof the stretching and anti-stretching vibration modes of the CH2/CH3 aliphatic organic functions and (right) the spectral structure of the band at ∼2200 cm−1 due toCN, NC, and, maybe, NN vibrations. Optical micrographs of the samples are shown at the top of the figure: (left) sample BB, containing mostly black componentswith various textures (a spheroidal nodule is in the field of view); (right) sample YO, containing components with various colors ranging between black to yellow.
other reddish surfaces (e.g., Triton, Pluto, Hyperion, etc.), it isnecessary to derive the optical constants of the organic materialanalogs and/or their reflectance spectra. Determining the opti-cal constants in the UV–vis range is a very complicated task.A critical issue is the optical quality of the sample and, gener-ally, a reliable quantitative determination of optical constants ismostly achieved for thin films directly condensed onto a win-dow. As tholins produced in this study were powder, we did notattempt to determine their optical constants. Nevertheless, re-flectance spectra might be more useful than optical constants.Thus, Titan’s aerosols have submicrometric sizes, similar to thewavelength of visible photons. Assuming they form the darkorganic layer at Titan’s surface, reflectance modeling could notbe performed as the optical geometric approximation (grain size� wavelength) of these models would be no longer valid.
Reflectance spectra of samples BB and YO are presentedand compared in Fig. 2, for the visible–near-IR range (0.4–4 µm). Unlike the mid-IR transmission spectra (Fig. 1: 4000–450 cm−1, 4.5–22 µm), the vis–NIR reflectance spectra arevery different between the samples. The overall bidirectional re-flectance of BB is low, 0.27 at maximum around 2.5 µm. A red-dish slope dominates the spectrum from 0.5 µm (reflectance∼0.025) to about 2 µm (∼0.25). In the visible range, the result-ing color can be described as “reddish black.” No absorptionband is visible within the spectral region of the DISR instru-ment. Above this wavelength, weak bands are present at 1.96,2.25, and 2.52 µm, as well as a strong and broad feature at
Please cite this article as: J.-M. Bernard et al., Reflectance spectra and chemical strobservations, Icarus (2006), doi:10.1016/j.icarus.2006.06.004.
∼3 µm, that is partly due to the –NH2 functional group (ad-sorbed water also contributes to this feature).
The reflectance spectrum of YO is quite different. Its over-all reflectance is much higher than that of BB, reaching a valueof 0.8 at 1.3 µm. The reflectance increases strongly from 0.4 to1.1 µm, resulting in a much larger reddish slope. Above 1.3 µm,the reflectance decreases but with an overall value much higherthan that of BB. These photometric and spectral variations areconsistent with the bright yellow–orange macroscopic color ob-served of the sample. In the near-IR region, several absorptionbands are observed (∼1.05, 1.19, 1.52, 1.74, 1.94, 1.99, 2.29,2.51 µm). These bands are due to various overtones and combi-nations of the fundamental N–H, C–H, C–N, C–C, etc. modesobserved in the mid-IR. Due to the high transparency of thismaterial in the near-IR region, photons penetrate deeper into thegranular medium of YO than the BB sample, resulting in moreintense absorption bands. A firm assignment of these bands isnot yet established and will be the subject of future studies.Note that the stretching and anti-stretching modes of the CH2and CH3 functional groups (∼3.4–3.5 µm) are clearly observ-able in YO, but only marginally in BB.
3.4. UV Raman spectra
All components in BB and YO, independent of their size,color, and shape (i.e., nodules, micrograins, needles, etc.), ex-hibited a strong fluorescence signal under 514 nm laser irradi-ation. The shape of the fluorescence spectrum was correlated
ucture of Titan’s tholins: Application to the analysis of Cassini–Huygens

ARTICLE IN PRESS YICAR:7979JID:YICAR AID:7979 /FLA [m5+; v 1.64; Prn:1/08/2006; 16:01] P.4 (1-7)
4 J.-M. Bernard et al. / Icarus ••• (••••) •••–•••
Fig. 2. The visible and NIR reflectance spectra of tholins BB and YO. The mixed vertical lines and the arrow show the spectral range of the DISR UV photometerand vis–NIR spectrometers. The dotted grey area show the wavelength ranges out of Titan’s atmospheric windows, allowing surface observations from the VIMSspectrometer and ground-based telescopes. Note that adsorbed atmospheric water contributes to the broad feature at ∼3 µm.
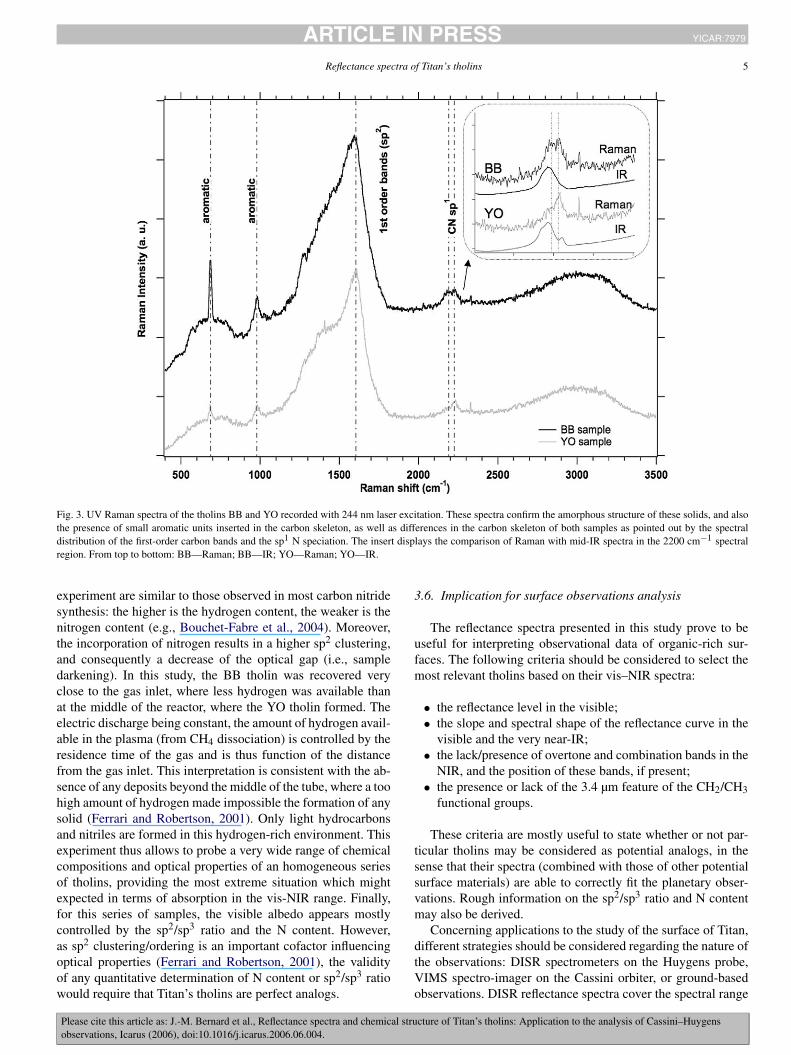
with the color, evidencing chemical and structural variationswithin the samples. Using 244 nm excitation avoids excitationof the fluorescence signal and allows collection of a Ramanspectrum of the mainly sp2-bonded solid (Ferrari and Robert-son, 2001; Ferrari et al., 2003). The UV Raman spectra of BBand YO (Fig. 3), as measured on the more abundant black–brown and yellow components, respectively, provide severalclues on the chemical structure. For both samples, the broadand asymmetric shape of the first-order carbon band with itsmaximum near ∼1600 cm−1 points to an amorphous structure(Rodil et al., 2001; Ferrari et al., 2003). The carbon skele-ton appears different between the two samples, as the spec-tral distribution of this feature points to different sp2/sp3 ratioand/or sp2 clustering among BB and YO spectra (Ferrari etal., 2003). Note that the evolution trend of this spectral dis-tribution as function of the N abundance is consistent withthe measurements of Rodil et al. (2001). The narrow featuresobserved at ∼687 and ∼980 cm−1 are assigned to breathingmodes of small aromatic rings (fivefold or sixfold), likely N-substituted regarding the low C/N ratio, and inserted within theamorphous (C, N, H) network. Note that this identification endsthe debate on the presence of aromatic compounds in tholins,which were not systematically detected in earlier experimentsand/or might be subjected to artefact analysis of pyrolysis data(Khare et al., 1984; Sagan et al., 1993; Ehrefreund et al., 1995;Coll et al., 1999). The peak intensity (normalized to the max-imum peak in the first-order carbon band at ∼1600 cm−1) ofthe spectral features of these breathing modes points to a higheraromaticity of BB versus YO, which is consistent with the lackof CH2 and CH3 aliphatic functions and the higher C/H ratio.
Please cite this article as: J.-M. Bernard et al., Reflectance spectra and chemical strobservations, Icarus (2006), doi:10.1016/j.icarus.2006.06.004.
These spectra also exhibit spectral features due to chemicallybonded CN and/or NC near 2200 cm−1. In BB, two featuresare observed at ∼2185 and 2225 cm−1, whereas mostly a sin-gle peak at ∼2225 cm−1 is observed in YO. There is no clearconnection with the CN/NC features observed in the infrared(Figs. 1, 3). These UV–Raman data might provide new informa-tion on the nature of the (C, N) skeleton; however, unambiguousidentification of these bands band must be completed first.
3.5. Chemical structure and absorption properties of Titan’stholins
The absorption properties of tholins in the UV–vis–near-IRspectral ranges are controlled by π–π∗ electronic transitions(Nassau, 1983). The qualitative and quantitative description ofthe sp2 structure of these solids is thus a key step for under-standing their optical properties. The very dark color of BB,compared to the brighter yellow–orange color of YO, is corre-lated with the absence of the aliphatic CH2 and CH3 stretchingand anti-stretching vibration modes, with an increase of aromat-ics abundance and with a higher C/H ratio. This suggests theabsorption in the UV–visible correlates with the carbon sp2/sp3
ratio. However, UV–visible absorption is also controlled by sp2
clustering (ring versus conjugated chain, size of aromatic units,etc.) and by compositional factors (presence of heteroatoms,etc.). In sample BB, the larger sp2/sp3 ratio partly results fromthe increase of the abundance of small aromatic units. How-ever, some changes in the amorphous carbon skeleton are alsoinvolved between both samples, likely contributing to the opti-cal properties. It is worth noting that the trends observed in this
ucture of Titan’s tholins: Application to the analysis of Cassini–Huygens
ARTICLE IN PRESS YICAR:7979JID:YICAR AID:7979 /FLA [m5+; v 1.64; Prn:1/08/2006; 16:01] P.5 (1-7)
Reflectance spectra of Titan’s tholins 5
Fig. 3. UV Raman spectra of the tholins BB and YO recorded with 244 nm laser excitation. These spectra confirm the amorphous structure of these solids, and alsothe presence of small aromatic units inserted in the carbon skeleton, as well as differences in the carbon skeleton of both samples as pointed out by the spectraldistribution of the first-order carbon bands and the sp1 N speciation. The insert displays the comparison of Raman with mid-IR spectra in the 2200 cm−1 spectralregion. From top to bottom: BB—Raman; BB—IR; YO—Raman; YO—IR.
experiment are similar to those observed in most carbon nitridesynthesis: the higher is the hydrogen content, the weaker is thenitrogen content (e.g., Bouchet-Fabre et al., 2004). Moreover,the incorporation of nitrogen results in a higher sp2 clustering,and consequently a decrease of the optical gap (i.e., sampledarkening). In this study, the BB tholin was recovered veryclose to the gas inlet, where less hydrogen was available thanat the middle of the reactor, where the YO tholin formed. Theelectric discharge being constant, the amount of hydrogen avail-able in the plasma (from CH4 dissociation) is controlled by theresidence time of the gas and is thus function of the distancefrom the gas inlet. This interpretation is consistent with the ab-sence of any deposits beyond the middle of the tube, where a toohigh amount of hydrogen made impossible the formation of anysolid (Ferrari and Robertson, 2001). Only light hydrocarbonsand nitriles are formed in this hydrogen-rich environment. Thisexperiment thus allows to probe a very wide range of chemicalcompositions and optical properties of an homogeneous seriesof tholins, providing the most extreme situation which mightexpected in terms of absorption in the vis-NIR range. Finally,for this series of samples, the visible albedo appears mostlycontrolled by the sp2/sp3 ratio and the N content. However,as sp2 clustering/ordering is an important cofactor influencingoptical properties (Ferrari and Robertson, 2001), the validityof any quantitative determination of N content or sp2/sp3 ratiowould require that Titan’s tholins are perfect analogs.
Please cite this article as: J.-M. Bernard et al., Reflectance spectra and chemical strobservations, Icarus (2006), doi:10.1016/j.icarus.2006.06.004.
3.6. Implication for surface observations analysis
The reflectance spectra presented in this study prove to beuseful for interpreting observational data of organic-rich sur-faces. The following criteria should be considered to select themost relevant tholins based on their vis–NIR spectra:
• the reflectance level in the visible;• the slope and spectral shape of the reflectance curve in the
visible and the very near-IR;• the lack/presence of overtone and combination bands in the
NIR, and the position of these bands, if present;• the presence or lack of the 3.4 µm feature of the CH2/CH3
functional groups.
These criteria are mostly useful to state whether or not par-ticular tholins may be considered as potential analogs, in thesense that their spectra (combined with those of other potentialsurface materials) are able to correctly fit the planetary obser-vations. Rough information on the sp2/sp3 ratio and N contentmay also be derived.
Concerning applications to the study of the surface of Titan,different strategies should be considered regarding the nature ofthe observations: DISR spectrometers on the Huygens probe,VIMS spectro-imager on the Cassini orbiter, or ground-basedobservations. DISR reflectance spectra cover the spectral range
ucture of Titan’s tholins: Application to the analysis of Cassini–Huygens

ARTICLE IN PRESS YICAR:7979JID:YICAR AID:7979 /FLA [m5+; v 1.64; Prn:1/08/2006; 16:01] P.6 (1-7)
6 J.-M. Bernard et al. / Icarus ••• (••••) •••–•••
extending from the UV up to 1.65 µm (Fig. 2). The shape ofthe reflectance curve is firstly an excellent criteria for discrim-inating different tholins: YO has a rather constant reflectancelevel between 1 and 1.65 µm, while this latter continuously in-creases for BB. The presence/absence of the spectral feature at1.52 µm is also a good marker of the type of tholins. The spec-tral slope in the visible and the visible–NIR absolute reflectancelevels should also be considered, but only in connection withthe other criteria because they also strongly depend on parame-ters such as the texture and abundance of organic materials atthe surface.
For analyzing observations obtained through Titan’s at-mosphere (VIMS, ground based observations), the ratio be-tween reflectances measured at the center of different at-mospheric windows would be particularly useful. We suggestin particular to consider the series of windows with centralwavelength ranging between 1.075 and 2.02 µm, which shouldprovide information about the spectral shape and slope of thereflectance spectrum in this spectral region. However distin-guishing tholins types through these near-IR ratios may proveto be tricky as other surface materials, such as widespreadwater ice (Lellouch et al., 2004), may strongly dominate partof the spectrum. The next atmospheric window centered at2.75 µm should be considered here with care as adsorbed wa-ter from ambient atmosphere contributed to the experimentalspectra. The last window around 4.95 µm (2020 cm−1) is notuseful to distinguish tholins types (Fig. 1) and unfortunatelyneither the CH2/CH3 fundamental bands (3.4–3.5 µm) nor theCN/NC bands (4.48–4.58 µm) are observable through Titan’satmosphere. The UV–visible spectral range and the very near-IR (especially up to about 1 µm) should also be used with greatcaution, regarding the large uncertainty currently affecting thederived surface albedo due to the yet ill-known scattering con-tribution by atmospheric aerosols to the reflected flux. Howeverthe situation should strongly improve with the new atmosphericand aerosol observations of Titan by the Huygens probe instru-ments, especially DISR. The much better modeling of aerosolscattering and CH4 absorption that will ensue should allowus to extract from the windows a series of segments of thesurface spectrum. This will open the possibility to probe thevisible slope and some of the near-IR bands occurring in YOtholins type, especially the 1.05 and 1.52 µm bands as well asthe wing of the 1.99 µm band (Fig. 2). The bands or spectralslopes extracted from each of these narrow windows will alsohelp to differentiate between tholins-like and other types of sur-face materials (ices, minerals, etc.). The wide 2.75 µm windowmay also prove to be useful (Coustenis et al., 2006) but labora-tory spectra of tholins in controlled dry atmosphere should berecorded before.
4. Conclusions
Titan’s tholins are used as analogs of Titan’s aerosols andN-rich organic solids present on many icy surfaces. However, itis not clear whether or not they are relevant analogs, and whichkind of tholins should be used among a wide set available inliterature. This paper presents reflectance spectral data of two
Please cite this article as: J.-M. Bernard et al., Reflectance spectra and chemical strobservations, Icarus (2006), doi:10.1016/j.icarus.2006.06.004.
tholins selected as end-members of a series of samples coveringa very wide range of continuous chemical and optical proper-ties. These samples were formed under experimental conditionsfairly consistent with Titan’s stratosphere. A general frameworkfor using these laboratory data to the analysis of spectral obser-vation of Titan’s surface or other objects is suggested. Note thatthese samples have been used for performing the preliminaryanalysis of the DISR spectra of Titan’s surface (Tomasko et al.,2005).
Furthermore, the study reports the first reliable in situ unam-biguous identification of aromatics compounds through Ramanspectroscopy. Variations in the sp2 carbon structure among bothsamples, which controls the absorption properties in the vis-ible/NIR, are also evidenced. This is the first attempt in usingUV Raman spectroscopy for investigating these samples. Theseresults finally point out it is very unlikely to derive quantitativechemical information (e.g., N content, sp2/sp3 ratio) from re-mote sensing reflectance data.
Acknowledgments
This work has been supported by the French Centre Nationald’Etudes Spatiales (CNES), by the Groupement de Recherchesen Exobiologie (GDR CNRS Exobio) and by the ProgrammeNational de Planétologie (PNP-CNRS). J.-M. Bernard is sup-ported by a CNES post-doc position. P.F. McMillan is sup-ported by a Wolfson Foundation, Royal Society Research MeritAward fellowship. Two anonymous reviewers are acknowl-edged for interesting reviews which improved the manuscript.
References
Bernard, J.-M., Coll, P., Raulin, F., 2002. Variation of C/N and C/H Ratiosof Titan’s Aerosols Analogues. ESA SP 518. ESA Publications Division,Noordwijk, pp. 623–625.
Bernard, J.-M., Coll, P., Coustenis, A., Raulin, F., 2003. Experimental simu-lation of Titan’s atmosphere: Detection of ammonia and ethylene oxide.Planet. Space Sci. 51, 1003–1011.
Bouchet-Fabre, B., Godet, C., Lacerda, M., Charvet, S., Zellama, K., Ballu-taud, D., 2004. Stoichiometry and infrared absorption of amorphous a-C1−xNx :H carbon nitride films. J. Appl. Phys. 95, 3427–3436.
Brissaud, O., Schmitt, B., Douté, S., Rabou, P., Grundy, W., Filly, M., 2004.Spectrogonio radiometer for the study of the bidirectional reflectance andpolarization functions of planetary surfaces. I. Design and tests. Appl.Opt. 43, 1926–1937.
Coll, P., Coscia, D., Gazeau, M.C., Guez, L., Raulin, F., 1997. Review andlatest results of laboratory investigations of Titan’s aerosols. Origins LifeEvol. Biosphere 28, 195–213.
Coll, P., Coscia, D., Smith, N., Gazeau, M.-C., Ramirez, S.I., Cernogora, G.,Israel, G., Raulin, F., 1999. Experimental laboratory simulation of Titan’satmosphere: Aerosols and gas phase. Planet. Space Sci. 47, 1331–1340.
Coustenis, A., Negrão, A., Salama, A., Schulz, B., Lellouch, E., Rannou, P.,Drossart, P., Encrenaz, Th., Schmitt, B., Boudon, V., Nikitin, A., 2006.Titan’s 3-micron spectral region from ISO high-resolution spectroscopy.Icarus 180, 176–185.
Cruikshank, D.P., Allamandola, L.J., Hartmann, W.K., Tholen, D.J., Brown,R.H., Matthews, C.N., Bell, J.F., 1991. Solid CN bearing material on outerSolar System bodies. Icarus 94, 345–353.
Ferrari, A.C., Robertson, J., 2001. Resonant Raman spectroscopy of disordered,amorphous, and diamondlike carbon. Phys. Rev. B 64, 754141-13.
Ferrari, A.C., Rodil, S.E., Robertson, J., 2003. Interpretation of infrared andRaman spectra of amorphous carbon nitrides. Phys. Rev. B 67, 155306.
ucture of Titan’s tholins: Application to the analysis of Cassini–Huygens

ARTICLE IN PRESS YICAR:7979JID:YICAR AID:7979 /FLA [m5+; v 1.64; Prn:1/08/2006; 16:01] P.7 (1-7)
Reflectance spectra of Titan’s tholins 7
Ehrefreund, P., Boon, J.J., Commandeur, J., Sagan, C., Thompson, W.R., Khare,B., 1995. Analytical pyrolysis experiments of Titan aerosol analogues inpreparation for the Cassini–Huygens mission. Adv. Space Res. 15, 335–342.
Imanaka, H., Khare, B.N., Elsila, J.E., Bakes, E.L.O., McKay, C.P., Cruik-shank, D.P., Sugita, S., Matsui, T., Zare, R.N., 2004. Laboratory experi-ments of Titan tholin formed in cold plasma at various pressures: Implica-tions for nitrogen-containing polycyclic aromatic compounds in Titan haze.Icarus 168, 344–366.
Khare, B.N., Sagan, C., 2002. Analysis of the time-dependent chemical evolu-tion of Titan haze tholin. Icarus 160, 172–182.
Khare, B.N., Sagan, C., Arakawa, E.T., Suits, F., Callcott, T.A., Williams,M.W., 1984. Optical constants of organic tholins produced in a simulatedtitanian atmosphere: From soft X-ray to microwave frequencies. Icarus 60,127–137.
Lellouch, E., Schmitt, B., Coustenis, A., Cuby, J.-G., 2004. Titan’s 5-micronlightcurve. Icarus 168, 209–214.
McDonald, G.D., Thompson, W.R., Heinrich, M., Khare, B.N., Sagan, C.,1994. Chemical investigation of Titan and Triton tholins. Icarus 108, 137–145.
Mutsukura, N., Akita, K.-I., 1999. Infrared absorption spectroscopy measure-ments of amorphous CNx films prepared in CH4/N2 r.f. discharge. ThinSolid Films 349, 115–119.
Please cite this article as: J.-M. Bernard et al., Reflectance spectra and chemical strobservations, Icarus (2006), doi:10.1016/j.icarus.2006.06.004.
Nassau, K., 1983. Color in organic molecules. In: The Physics and Chemistryof Color. Wiley & Sons, New York, pp. 109–139.
Ramirez, S.I., Coll, P., da Silva, A., Navarro-Gonzalez, R., Lafait, J., Raulin, F.,2002. Complex refractive index of Titan’s aerosol analogues in the 200–900nm domain. Icarus 156, 515–529.
Rodil, S.E., Ferrari, A.C., Robertson, J., Milne, W.I., 2001. Raman and infraredmodes of hydrogenated amorphous carbon nitride. J. Appl. Phys. 89, 5425–5430.
Sagan, C., Khare, B.N., 1979. Tholins: Organic chemistry of interstellar grainsand gas. Nature 277, 102–107.
Sagan, C., Khare, B., Thompson, W.R., McDonal, G.D., Wing, M.R., Bada,J.L., Vo-Dinh, T., Arakawa, E.T., 1993. Polycyclic aromatic hydrocar-bons in the atmospheres of Titan and Jupiter. Astrophys. J. 414, 399–405.
Tomasko, M.G., Archinal, B., Becker, T., Bézard, B., Bushroe, M., Combes, M.,Cook, D., Coustenis, A., de Bergh, C., Dafoe, L.E., Doose, L., Douté, S.,Eibl, A., Engel, S., Gliem, F., Grieger, B., Holso, K., Howington-Kraus, E.,Karkoschka, E., Keller, H.U., Kirk, R., Kramm, R., Küppers, M., Lanagan,P., Lellouch, E., Lemmon, M., Lunine, J., McFarlane, E., Moores, J., Prout,M., Rizk, B., Rosiek, M., Rueffer, P., Schröder, S.E., Schmitt, B., See, C.,Smith, P., Soderblom, L., Thomas, N., West, R., 2005. Rain, winds, andhaze: A close-up view from the descent to Titan’s surface. Nature 438, 765–778.
ucture of Titan’s tholins: Application to the analysis of Cassini–Huygens
Copyright © 2022 FDOKUMEN