Reference values and psychometric properties of the Lower Extremity Motor Coordination Test
8
ORIGINAL ARTICLE Reference Values and Psychometric Properties of the Lower Extremity Motor Coordination Test Marina B. Pinheiro, MSc, a Aline A. Scianni, PhD, a Louise Ada, PhD, b Christina D. Faria, PhD, a Luci F. Teixeira-Salmela, PhD a From the a Department of Physical Therapy, Federal University of Minas Gerais, Belo Horizonte, Minas Gerais, Brazil; and b Discipline of Physiotherapy, Faculty of Health Science, The University of Sydney, New South Wales, Australia. Abstract Objectives: (1) To create predictive nomograms for the dominant and nondominant limbs on the Lower Extremity Motor Coordination Test (LEMOCOT) using reference values, and (2) to determine the inter- and intrarater reliability for the LEMOCOT; the best scoring method (first vs mean of the first 2 vs mean of the last 2 vs mean of 3 vs the highest of 3 trials); the best testing method (direct vs video observation); and the ability to detect real change (smallest real difference [SRD] and standard error of the measurement [SEM]). Design: Normative and methodological study. Setting: Metropolitan area. Participants: Healthy individuals (NZ320, 50% women) in 7 age groups: 20 to 29, 30 to 39, 40 to 49, 50 to 59, 60 to 69, 70 to 79, and 80 years. Each group had 50 participants, except for 80 years (nZ20). Interventions: Not applicable. Main Outcome Measure: LEMOCOT. Results: Age and sex explained 48% of the variance in the LEMOCOT scores for the dominant limb and 44% for the nondominant limb (125<F<148; P< .001). No significant differences were found regarding the different scoring methods (.12<F<1.02; .10<P< .92), and all of them demonstrated good reliability (intraclass correlation coefficients between .90 and .99; P< .001). There was agreement between scores from direct and video observation (limits of agreement 1.99 to 1.85; 1.55 to 1.62). Appropriate SEM (2.27e1.85) and SRD (6.27e5.11) values were found. Conclusions: Reference values were determined for the LEMOCOT, and predictive nomograms were created based on age and sex. The LEMOCOT is reliable, needing only 1 trial (after familiarization) to generate reliable scores; can be scored from either direct or video observation; and has the ability to detect real change over time. Archives of Physical Medicine and Rehabilitation 2014;-:------- ª 2014 by the American Congress of Rehabilitation Medicine Adequate coordination of the lower limbs is necessary to perform activities of daily living 1 and to live independently. 2 Loss of co- ordination is associated with physical disability after stroke, 3-5 in the elderly, 6 in individuals with developmental coordination dis- orders, 7 and in individuals with mental retardation. 8 Since thera- peutic intervention is often aimed at improving coordination, 9,10 it is necessary to use adequate instruments to accurately measure this impairment. The Lower Extremity Motor Coordination Test (LEMOCOT) was developed to measure lower limb coordination. 1 It has good construct validity in stroke, both convergent validity (ie, the cor- relation between LEMOCOT scores and motor tests) and diver- gent validity (ie, the correlation between LEMOCOT scores and cognitive tests). 1 The LEMOCOT also has adequate clinical util- ity, 11 has the ability to detect changes in coordination after stroke 12 and low back pain, 13 and is a good predictor of social participation after stroke rehabilitation. 12,14 In clinical settings, reference values are necessary for assessing the level of deficit and establishing realistic goals. 15,16 The usefulness of a measurement of coordination in a health condition depends on the ability to compare it with reference valuesdthat is, a measurement of Supported by the Brazilian Funding Agencies: Coordenac ¸a ˜o de Pessoal de Nı ´vel Superior (grant no. BEX0344/07-0), Conselho Nacional de Desenvolvimento Cientı ´fico e Tecnolo ´gico (grant no. 476298/2008-3), and Fundac ¸a ˜o de Amparo a ` Pesquisa do Estado de Minas Gerais (grant no. 00040-08). Disclosures: none. 0003-9993/14/$36 - see front matter ª 2014 by the American Congress of Rehabilitation Medicine http://dx.doi.org/10.1016/j.apmr.2014.03.006 Archives of Physical Medicine and Rehabilitation journal homepage: www.archives-pmr.org Archives of Physical Medicine and Rehabilitation 2014;-:-------
Transcript of Reference values and psychometric properties of the Lower Extremity Motor Coordination Test

edicine and Rehabilitation
Archives of Physical M journal homepage: www.archives-pmr.orgArchives of Physical Medicine and Rehabilitation 2014;-:-------
ORIGINAL ARTICLE
Reference Values and Psychometric Properties of theLower Extremity Motor Coordination Test
Marina B. Pinheiro, MSc,a Aline A. Scianni, PhD,a Louise Ada, PhD,b
Christina D. Faria, PhD,a Luci F. Teixeira-Salmela, PhDa
From the aDepartment of Physical Therapy, Federal University of Minas Gerais, Belo Horizonte, Minas Gerais, Brazil; and bDiscipline ofPhysiotherapy, Faculty of Health Science, The University of Sydney, New South Wales, Australia.
Abstract
Objectives: (1) To create predictive nomograms for the dominant and nondominant limbs on the Lower Extremity Motor Coordination Test
(LEMOCOT) using reference values, and (2) to determine the inter- and intrarater reliability for the LEMOCOT; the best scoring method (first vs
mean of the first 2 vs mean of the last 2 vs mean of 3 vs the highest of 3 trials); the best testing method (direct vs video observation); and the
ability to detect real change (smallest real difference [SRD] and standard error of the measurement [SEM]).
Design: Normative and methodological study.
Setting: Metropolitan area.
Participants: Healthy individuals (NZ320, 50% women) in 7 age groups: 20 to 29, 30 to 39, 40 to 49, 50 to 59, 60 to 69, 70 to 79, and �80
years. Each group had 50 participants, except for �80 years (nZ20).
Interventions: Not applicable.
Main Outcome Measure: LEMOCOT.
Results: Age and sex explained 48% of the variance in the LEMOCOT scores for the dominant limb and 44% for the nondominant limb
(125<F<148; P<.001). No significant differences were found regarding the different scoring methods (.12<F<1.02; .10<P<.92), and all of them
demonstrated good reliability (intraclass correlation coefficients between .90 and .99; P<.001). Therewas agreement between scores from direct and
video observation (limits of agreement �1.99 to 1.85; �1.55 to 1.62). Appropriate SEM (2.27e1.85) and SRD (6.27e5.11) values were found.
Conclusions: Reference values were determined for the LEMOCOT, and predictive nomograms were created based on age and sex. The
LEMOCOT is reliable, needing only 1 trial (after familiarization) to generate reliable scores; can be scored from either direct or video
observation; and has the ability to detect real change over time.
Archives of Physical Medicine and Rehabilitation 2014;-:-------
ª 2014 by the American Congress of Rehabilitation Medicine
Adequate coordination of the lower limbs is necessary to performactivities of daily living1 and to live independently.2 Loss of co-ordination is associated with physical disability after stroke,3-5 inthe elderly,6 in individuals with developmental coordination dis-orders,7 and in individuals with mental retardation.8 Since thera-peutic intervention is often aimed at improving coordination,9,10 itis necessary to use adequate instruments to accurately measurethis impairment.
Supported by the Brazilian Funding Agencies: Coordenacao de Pessoal de Nıvel Superior
(grant no. BEX0344/07-0), Conselho Nacional de Desenvolvimento Cientıfico e Tecnologico (grant
no. 476298/2008-3), and Fundacao de Amparo a Pesquisa do Estado de Minas Gerais (grant no.
00040-08).
Disclosures: none.
0003-9993/14/$36 - see front matter ª 2014 by the American Congress of Re
http://dx.doi.org/10.1016/j.apmr.2014.03.006
The Lower Extremity Motor Coordination Test (LEMOCOT)was developed to measure lower limb coordination.1 It has goodconstruct validity in stroke, both convergent validity (ie, the cor-relation between LEMOCOT scores and motor tests) and diver-gent validity (ie, the correlation between LEMOCOT scores andcognitive tests).1 The LEMOCOT also has adequate clinical util-ity,11 has the ability to detect changes in coordination afterstroke12 and low back pain,13 and is a good predictor of socialparticipation after stroke rehabilitation.12,14
In clinical settings, referencevalues are necessary for assessing thelevel of deficit and establishing realistic goals.15,16 The usefulness of ameasurement of coordination in a health condition depends on theability to compare it with reference valuesdthat is, a measurement of
habilitation Medicine

2 M.B. Pinheiro et al
coordination using the same instrument in healthy controls.15 How-ever, reference values for the LEMOCOT have not yet been estab-lished. Determining useful referencevalues requires that the accuracy,precision, and stability of the instrument are adequate, since poorinstrument performance could introduce bias.17-19
The scoring method of the original study1 describing theLEMOCOT used the mean of 2 trials to obtain the final score. Mostsubsequent studies either did not report the number of trials9,20-22 orused the best13 or the mean of the last 2 out of 3 trials.23 Therefore, itwould be helpful to determine the least number of trials necessary toobtain reliable and consistent results24 in order to optimize use of theLEMOCOTwithin clinical settings. Furthermore, the investigation ofother testing methods, such as via video, could increase its applica-bility by being useful in situations that require blinded assessors ormeasurement across multiple sites. In addition, instruments are usedto measure change over time. To detect real clinical change, thedifference between scores generated by 2 independent assessmentsshould be greater than the error.15,25 Although the LEMOCOT test-retest reliability has been previously investigated,1 its inter- andintrarater reliability, the best scoring method, the best testingmethod,and its ability to detect real change have not yet been determined.
Since the LEMOCOT has already proved to be useful withinclinical and research contexts, the main purpose of this study was tocreate predictive nomograms from reference values of the dominantand nondominant lower limbs in healthy individuals, to enable thereference value appropriate for a given individual to be easilydetermined. The current study also aimed to determine inter- andintrarater reliability for the LEMOCOT; the best scoring method(first vs mean of the first 2 vs mean of the last 2 vs mean of 3 vs thehighest of 3 trials); the best testing method (direct vs videoobservation); and the ability to detect real change (smallest realdifference [SRD] and standard error of the measurement [SEM]).
Methods
Participants
Healthy individuals were recruited from the general community ofthe city of Belo Horizonte, Brazil, by means of advertisements inuniversities, local clubs, and associations. Volunteers were includedif they (1) were aged �20 years; (2) had no neuromusculoskeletal/cardiovascular disorders; (3) had no pain in the lower limbs; (4) hadlower limb range of motion necessary to perform the test; (5) had nouncorrected visual deficits; and (6) had no cognitive impairments asdetermined by the cutoff scores on the Mini-Mental State Exami-nation.26,27 They were collected in 7 age groups: 20 to 29, 30 to 39,40 to 49, 50 to 59, 60 to 69, 70 to 79, and�80 years. The study wasapproved by the University Ethics Committee, and participantsprovided consent before data collection.
Participants’ demographic and anthropometric data, includingsex, age, body mass, height (to calculate body mass index [BMI]),and lower limb dominance, which was defined as the leg that theywould use to kick a ball and climb a step,28 were collected. Level of
List of abbreviations:
BMI body mass index
CI confidence interval
ICC intraclass correlation coefficient
LEMOCOT Lower Extremity Motor Coordination Test
SEM standard error of measurement
SRD smallest real difference
physical activity was determined using a questionnaire derivedfrom the Behavioral Risk Factor Surveillance System Survey,which has acceptable psychometric properties.29-31 Physical ac-tivity was classified as vigorous, moderate, insufficient, or inactive,according to the frequency, duration, and intensity of the 2 physicalactivities that participants most often engaged in. The intensity wasclassified based on the metabolic expenditure of the activity inrelation to the participant’s maximal cardiorespiratory capacity.32
Measurement of reference values
A sample size of 108 subjects would be required to include 4 in-dependent variables (age, sex, BMI, physical activity level) in theregression analyses.19 Since samples for studies to determinereference values should be broad and representative of the popula-tion heterogeneity,15 the target sample was expanded to 50 for eachage group (ie, 350) to increase the external validity of the study.
All participants performed the LEMOCOT, with first their domi-nant and then their nondominant limb, following previously describedprocedures.1 They sat on a chair with the seat height adjusted to 100%of their shank length, without shoes, with their feet resting flat on athin rigid foam, heels on the proximal target, and with knees at 90� offlexion. Then, after a familiarization trial, they were instructed toalternately touch the proximal and distal targets placed 30cm apartwith their big toe, for 20 seconds. Theywere instructed not to sacrificethe accuracy of the touches or the quality of themovement to increasespeed, and the number of touched targets was counted.
Measurement of inter- and intrarater reliability,best scoring method, best testing method, andability to detect real change
Thirty participants (mean age� SD, 42�15y; 17 men) performed 3LEMOCOT trials with both limbs and were recorded using a videocamera (Sony DCR-DVD408a). To determine interrater reliability, 2examiners (M.B.P., L.F.T.-S.) who had previous experience with theLEMOCOT independently scored the test at the same time, usingdirect observation. To determine intrarater reliability, the videoswere randomly analyzed at normal speed by 1 examiner (M.B.P.) on2 occasions, 30 days apart. To determine the best scoring method,the scores from the first trial, the mean of the first 2 and last 2 trials,the mean of 3 trials, and the highest value of 3 trials were compared.To determine the best testing method, scores obtained from directversus video observations were compared by 1 examiner (M.B.P.).To determine SEM and SRD, 30 participants (mean age � SD,46�17y; 9men) performed 1 trial on 2 occasions at the same time ofthe day, 5 to 7 days apart.15 The intraclass correlation coefficients(ICCs) were used to calculate the SEM and SRD.33,34
Statistical analyses
Descriptive statistics were calculated for all outcomes. Tests fornormality and for equality of variances for the LEMOCOT scoreswere carried out with SPSS for Windows (release 15.0).b Thepaired Student t test was used to compare the LEMOCOT scoresbetween the dominant and nondominant limbs. Stepwise multiplelinear regression analyses were performed to produce predictiveequations for both limbs, based on 4 input variables, as well astheir interactions. The 4 selected variables included the commonlyconsidered characteristics of age, sex, and BMI.17 The level ofphysical activity was also included because it has been shown toinfluence coordination.35 For efficiency of clinical use, nomo-grams were created based on the prediction equations.
www.archives-pmr.org

Reference values for Lower Extremity Motor Coordination Test 3
Repeated-measures analyses of variance were used to comparescores from the first trial, the mean of the first 2 and last 2 trials,the mean of 3 trials, and the highest of 3 trials. ICCs3,1 werecalculated to assess intrarater reliability, whereas ICCs2,1 werecalculated to assess interrater and test-retest reliability. ICCs >.75were indicative of good reliability, and those <.75 of poor tomoderate reliability.15 Bland and Altman limits of agreement werecalculated to investigate the agreement between the scores ob-tained by direct and video observation.33
The SEM and SRD were calculated as follows: SEMZsO(1.00� r), where s is the SD and r is the test-retest ICC15,33,34; andSRDZ1.96*SEM*O2.36
The SEM and SRD were expressed as percentages and SEMvalues <15% were considered acceptable.34 For all analyses, thesignificance level was set at 5%.
Results
Characteristics of participants
To equalize representation from age decades, 320 participantswere recruited in 7 age strata (fig 1). Each group had 50 partici-pants (50% women), except for the group �80 years (nZ20)(table 1). BMI tended to be toward the upper range of normal, andoverall level of physical activity was low.
Fig 1 Flow diagram of th
www.archives-pmr.org
Reference values
The LEMOCOT scores according to age, sex, and limb dominanceare shown in table 2. Higher scores were observed for the domi-nant limb (tZ10.2; mean difference, 2.23; 95% confidence in-terval [CI], 1.79e2.65; P<.001). Therefore, the regressionanalyses were carried out separately for the 2 limbs, and signifi-cant prediction equations were found. The regression equations intable 3 show that age alone could explain 41% (F1,317Z222;P<.001) of the variance in the LEMOCOT scores for the dominantlimb and 38% (F1,317Z194; P<.001) for the nondominant limb.When sex was included in the model, these explained variancevalues increased to 48% (F1,316Z148; P<.001) and 44%(F1,316Z125; P<.001), respectively. Age was negatively corre-lated with the LEMOCOT scores, indicating that lower valueswere associated with increased age. Men showed higher scores,but age was a stronger predictor than sex. The variables level ofphysical activity and BMI did not significantly improve the ac-curacy of the model and thus were not included in the predictionequations. Nomograms for the LEMOCOT scores were created(figs 2 and 3) based on the following prediction equations:
LEMOCOT scoreðdominant limbÞZ� :37ðageÞ þ 6:0ðsexÞ þ 51
LEMOCOT scoreðnondominant limbÞZ� :34ðageÞ þ 5:3ðsexÞ þ 48
e recruitment process.

Table 1 Participants’ characteristics according to age groups and sexes (NZ320)
Age Group (y) Sex (n) Age (y) BMI (kg/m2) Physical Activity Levels: n
20e29 Men (25) 22.9�2.1 (20e29) 23.4�2.7 (19.3e31.2) Ina: 9; Ins: 11; Mod: 4 Vig:1
Women (25) 23.2�2.2 (20e29) 22.1�3.7 (18.4e34.8) Ina: 12; Ins: 9; Mod: 1; Vig: 3
30e39 Men (25) 33.1�3.2 (30e39) 26.8�3.5 (18.4e33.7) Ina: 5; Ins: 14; Mod: 4; Vig: 2
Women (25) 34.1�3.6 (30e39) 23.7�4.1 (16.9e31.6) Ina: 17; Ins: 3; Mod: 3; Vig: 2
40e49 Men (25) 45.0�2.8 (40e49) 25.8�0.8 (17.8e31.4) Ina: 12; Ins: 6; Mod: 3; Vig: 4
Women (25) 44.5�3.0 (40e49) 25.0�6.1 (18.1e42.6) Ina: 16; Ins: 4; Mod: 2; Vig: 3
50e59 Men (25) 54.8�3.0 (50e59) 27.0�5.1 (18.0e37.7) Ina: 11; Ins: 5; Mod: 5; Vig: 4
Women (25) 54.4�2.7 (50e59) 25.0�3.2 (19.1e31.6) Ina: 13; Ins: 6; Mod: 4; Vig: 2
60e69 Men (25) 65.0�3.6 (60e69) 25.4�4.6 (18.1e35.5) Ina: 14; Ins: 8; Mod: 1; Vig: 2
Women (25) 65.0�2.5 (60e69) 28.1�5.5 (17.2e45.0) Ina: 11; Ins: 11; Mod: 2; Vig: 1
70e79 Men (25) 75.3�2.4 (70e79) 25.1�3.1 (19.4e31.2) Ina: 6; Ins: 1; Mod: 1; Vig: 17
Women (25) 74.4�2.8 (70e79) 27.5�5.4 (18.7e37.3) Ina: 6; Ins: 11; Mod: 2; Vig: 6
�80 Men (10) 85.4�4.0 (80e93) 24.1�2.3 (19.8e27.3) Ina: 1; Ins: 2; Mod: 0; Vig: 7
Women (10) 82.7�2.9 (80e88) 22.9�4.7 (16.6e30.0) Ina: 1; Ins: 0; Mod: 0; Vig: 9
NOTE. Values are mean � SD (range [minimumemaximum]) or as otherwise indicated.
Abbreviations: Ina, inactive; Ins, insufficient; Mod, moderate; Vig, vigorous.
4 M.B. Pinheiro et al
where age is expressed in years and sex is expressed as a number(male, 1; female, 0).
Inter- and intrarater reliability, best scoringmethod, best testing method, and ability to detectreal change
There were no significant differences between the LEMOCOTscores derived from the first trial, the mean of the first 2 and last 2trials, the mean of 3 trials, or the highest value of 3 trials(.12<F<1.02; .10<P<.92). The ICCs of all combinations of trialswere excellent for interrater (.91<ICC<.99; P>.001) and intra-rater (.90<ICC<.99; P>.001) reliability.15,33 Therefore, scoresfrom the first trial were used for subsequent analyses.
The Bland and Altman agreement plots are given in figure 4. Themean difference between direct and video observation was close to0 for both the dominant (mean difference, 0.1; 95% CI,�0.3 to 0.5)
Table 2 LEMOCOT scores of dominant and nondominant lower limbs ac
dominant and nondominant lower limbs
Age Group (y) Sex
L
Dominant
20e29 Men 51.4�7.0 (40e67)
Women 46.2�7.0 (34e62)
30e39 Men 53.4�7.9 (39e69)
Women 44.2�8.9 (27e65)
40e49 Men 48.2�7.2 (29e66)
Women 41.6�8.5 (23e58)
50e59 Men 43.3�7.1 (31e58)
Women 37.2�9.1 (20e58)
60e69 Men 40.1�9.5 (21e58)
Women 34.2�8.5 (20e49)
70e79 Men 34.4�8.9 (21e56)
Women 27.9�7.8 (15e47)
80þ Men 24.9�7.8 (17e39)
Women 28.6�8.2 (13e40)
NOTE. Values are mean � SD (range [minimumemaximum]) or mean (95% C
and nondominant limbs (mean difference, �0.3; 95% CI, �0.7 to0.1). The error was also unbiased, since the differences were evenlyand randomly spread and the limits of agreement were small.
The test-retest ICCs, the SEM, and the SRD values for bothlimbs are shown in table 4. The ICC values were high, and theSEM% values were <15%. Low values were also found for theSRD and SRD%. The SRD values for the dominant (6.27) andnondominant (5.11) limbs represent the amount of error related tothe measurement.
Discussion
This study has determined the LEMOCOT reference values inhealthy individuals. Separate nomograms for the dominant andnondominant lower limbs were created given the age and the sex,which were based on the obtained predictive equations. Overall, theLEMOCOT demonstrated good psychometric properties.
cording to age group and sex (NZ320), and difference between the
EMOCOT Scores
Difference Between
LEMOCOT Scores
Nondominant
Dominant Minus
Nondominant
46.7�6.5 (37e63) 3.4 (1.8e4.9)
44.1�7.6 (29e60)
50.6�6.4 (39e66) 2.4 (1.2e3.7)
42.1�8.7 (30e64)
45.1�8.2 (25e65) 3.1 (1.9e4.2)
38.6�7.7 (26e50)
42.3�7.0 (29e55) 1.3 (0.4e2.2)
35.6�9.8 (18e55)
37.4�9.3 (19e53) 2.5 (1.6e3.3)
32.0�7.6 (20e45)
32.9�8.2 (19e53) 1.2 (0.4e1.9)
27.3�7.9 (14e45)
22.9�7.8 (15e40) 1.5 (0.6e3.0)
27.6�7.4 (14e37)
I).
www.archives-pmr.org

Table 3 Linear prediction equations for the LEMOCOT scores of
the dominant and nondominant lower limbs (NZ320)
Variable b b
Adjusted
R2 SEE
Dominant Lower
Limb
Step 1
Constant 60.10�1.37 NA NA NA
Age �0.37�0.03 �.64 .41 8.63
Step 2
Constant 51.14�1.87 NA NA NA
Age �0.37�0.02 �.64 NA NA
Sex 6.02�0.91 .27 .48 8.09
Nondominant
Lower Limb
Step 1
Constant 56.13�1.34 NA NA NA
Age �0.34�0.02 �.62 .38 8.38
Step 2
Constant 48.23�1.84 NA NA NA
Age �0.34�0.02 �.62 NA NA
Sex 5.31�0.89 .25 .44 7.96
NOTE. All regressions were statistically significant (P<.05). LEMOCOT domi-
nant:�.37 (age)þ 6.02 (sex)þ 51.14, SEE: 8.09; LEMOCOT nondominant:
�.34 (age)þ 5.31 (sex)þ 48.23, SEE: 7.96. Sex: menZ1, womenZ0.
Abbreviations: b, regression coefficients followed by the respective SE; b,
standardized regression coefficient; NA, not applicable; R2, coefficient of
determination; SEE, standard error of the estimate.
Fig 2 Nomogram for the LEMOCOT scores of the dominant and
nondominant lower limbs according to age for the men (nZ160).
Reference values for Lower Extremity Motor Coordination Test 5
Reference values
The main purpose of investigating reference values is to use them asa standard for comparison.15 The predictive equations used to createthe nomograms were based on regression analyses. Although this isthe most recommended method, some inconsistencies may occur ifthe sample is not representative and assumptions are not met.37
However, this study investigated a broad sample, with varied char-acteristics, recruited across a metropolitan setting, and the analysesmet all of the model’s assumptions for accuracy and generaliza-tion.19,37 Therefore, the predictive equations should be generalizableto similar samples, although this needs to be formally tested.37 In linewith other studies,17,38-41 age and sex were found to be significantpredictors of the LEMOCOT scores. Younger age and male sex wereassociated with better coordination, and this pattern has also beenfound for lower limb strength.42-44 Neither BMI nor level of physicalactivity was a significant predictor of the LEMOCOT scores. BMIwas included as a composite of body mass and height; however,Lanzino et al41 found that height correlatedmore strongly with timedcoordination tests than body mass or BMI. Our finding that BMI didnot predict coordination may be because the height of the chair wasadjusted to the length of the shank, different from Lanzino.41
Similarly, the type of physical activity undertaken may be moreimportant in predicting coordination than the level of activity.45,46
Inter- and intrarater reliability, best scoringmethod, best testing method, and ability to detectreal change
Various psychometric properties of the LEMOCOT were investi-gated in this study because the quality of an instrument is a
www.archives-pmr.org
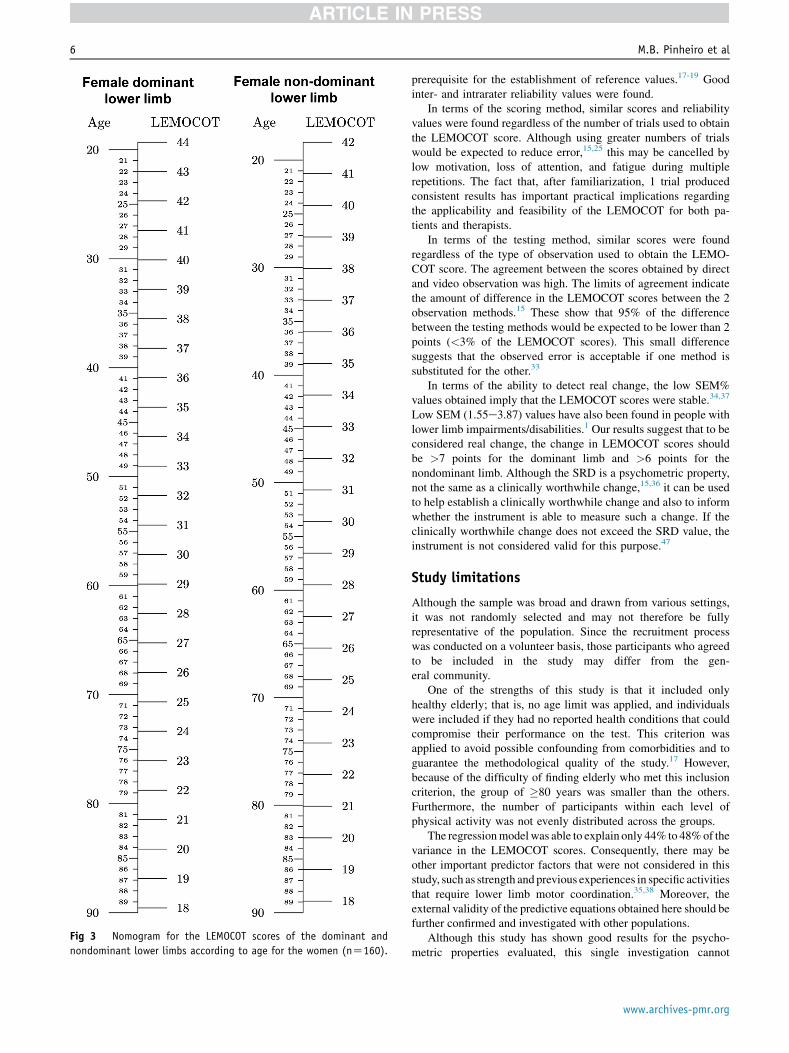
Fig 3 Nomogram for the LEMOCOT scores of the dominant and
nondominant lower limbs according to age for the women (nZ160).
6 M.B. Pinheiro et al
prerequisite for the establishment of reference values.17-19 Goodinter- and intrarater reliability values were found.
In terms of the scoring method, similar scores and reliabilityvalues were found regardless of the number of trials used to obtainthe LEMOCOT score. Although using greater numbers of trialswould be expected to reduce error,15,25 this may be cancelled bylow motivation, loss of attention, and fatigue during multiplerepetitions. The fact that, after familiarization, 1 trial producedconsistent results has important practical implications regardingthe applicability and feasibility of the LEMOCOT for both pa-tients and therapists.
In terms of the testing method, similar scores were foundregardless of the type of observation used to obtain the LEMO-COT score. The agreement between the scores obtained by directand video observation was high. The limits of agreement indicatethe amount of difference in the LEMOCOT scores between the 2observation methods.15 These show that 95% of the differencebetween the testing methods would be expected to be lower than 2points (<3% of the LEMOCOT scores). This small differencesuggests that the observed error is acceptable if one method issubstituted for the other.33
In terms of the ability to detect real change, the low SEM%values obtained imply that the LEMOCOT scores were stable.34,37
Low SEM (1.55e3.87) values have also been found in people withlower limb impairments/disabilities.1 Our results suggest that to beconsidered real change, the change in LEMOCOT scores shouldbe >7 points for the dominant limb and >6 points for thenondominant limb. Although the SRD is a psychometric property,not the same as a clinically worthwhile change,15,36 it can be usedto help establish a clinically worthwhile change and also to informwhether the instrument is able to measure such a change. If theclinically worthwhile change does not exceed the SRD value, theinstrument is not considered valid for this purpose.47
Study limitations
Although the sample was broad and drawn from various settings,it was not randomly selected and may not therefore be fullyrepresentative of the population. Since the recruitment processwas conducted on a volunteer basis, those participants who agreedto be included in the study may differ from the gen-eral community.
One of the strengths of this study is that it included onlyhealthy elderly; that is, no age limit was applied, and individualswere included if they had no reported health conditions that couldcompromise their performance on the test. This criterion wasapplied to avoid possible confounding from comorbidities and toguarantee the methodological quality of the study.17 However,because of the difficulty of finding elderly who met this inclusioncriterion, the group of �80 years was smaller than the others.Furthermore, the number of participants within each level ofphysical activity was not evenly distributed across the groups.
The regressionmodelwas able to explain only 44% to 48%of thevariance in the LEMOCOT scores. Consequently, there may beother important predictor factors that were not considered in thisstudy, such as strength and previous experiences in specific activitiesthat require lower limb motor coordination.35,38 Moreover, theexternal validity of the predictive equations obtained here should befurther confirmed and investigated with other populations.
Although this study has shown good results for the psycho-metric properties evaluated, this single investigation cannot
www.archives-pmr.org

Fig 4 Bland and Altman agreement plots between direct and video observations for the dominant (nZ30) and nondominant lower limbs
(nZ30). The difference values between the scores obtained by direct and video observations were plotted against the mean scores. Abbrevia-
tions: ILA, inferior limit of agreement; mean, mean difference scores; SLA, superior limit of agreement.
Reference values for Lower Extremity Motor Coordination Test 7
definitively establish the psychometric properties ofthe LEMOCOT.
Conclusions
Reference values were determined for the LEMOCOT in healthyindividuals aged �20 years, and the prediction equations wereused to create nomograms so that predicted LEMOCOT scorescould be calculated given the age and the sex. These nomogramscan readily be used in clinical settings to estimate the level ofimpairment in lower limb motor coordination in adults. By findingan individual’s age in the appropriate nomogram for limb domi-nance and sex, the LEMOCOT score for a healthy individual canbe established. This score can then be compared with the observedscores, and the deficit estimated. During testing, only 1 trial, afterfamiliarization, is enough to generate reliable LEMOCOT scores,and direct or video observation can be used interchangeably. Achange in the LEMOCOT score >7 points for the dominant limband >6 points for the nondominant limb indicates real change.Comparisons of clinically obtained measurements with referencevalues are legitimate only if the methods used to obtain theclinical scores resemble those used to obtain the referencevalues.18 Therefore, when using the LEMOCOT, the proceduresdescribed in this study should be followed to obtain measures thatcan be referenced against the current data.
Suppliers
a. SonyEurope Limited, The Heights, Brooklands, Weybridge,Surrey KT13 0XW, UK
b. SPSS Inc, 233 S Wacker Dr, 11th Fl, Chicago, IL 60606.
Table 4 Test-retest reliability coefficients, SEM, SEM%, SRD,
and SRD% of the LEMOCOT (nZ30)
LEMOCOT Score
Test-Retest ICC
(95% CI) SEM SEM% SRD SRD%
Dominant lower limb .96 (.93e.98) 2.27 5.23 6.27 14.45
Nondominant
lower limb
.97 (.94e.99) 1.85 4.61 5.11 12.75
www.archives-pmr.org
Keywords
Lower extremity; Motor skills; Reference values; Rehabilitation;Reproducibility of results
Corresponding author
Luci F. Teixeira-Salmela, PhD, Departamento de Fisioterapia,Universidade Federal de Minas Gerais, Avenida Antonio Carlos,6627, Campus Pampulha, 31270-901, Belo Horizonte, MinasGerais, Brasil. E-mail address: [email protected].
Acknowledgments
We thank John Henry Salmela, PhD, for copyediting the manu-script, which included English language revisions and overall style.
References
1. Desrosiers J, Rochette A, Corriveau H. Validation of a new lower-
extremitymotor coordination test. Arch PhysMedRehabil 2005;86:993-8.
2. Novak AC, Brouwer B. Strength and aerobic requirements during stair
ambulation in persons with chronic stroke and healthy adults. Arch
Phys Med Rehabil 2012;93:683-9.
3. Canning CG, Ada L, Adams R, O’Dwyer NJ. Loss of strength con-
tributes more to physical disability after stroke than loss of dexterity.
Clin Rehabil 2004;18:300-8.
4. Canning CG, Ada L, O’Dwyer NJ. Abnormal muscle activation
characteristics associated with loss of dexterity after stroke. J Neurol
Sci 2000;176:45-56.
5. Kautz SA, Brown DA. Relationships between timing of muscle exci-
tation and impaired motor performance during cyclical lower extremity
movement in post-stroke hemiplegia. Brain 1998;121:515-26.
6. Gill TM, Gahbauer EA, Han L, Allore HG. Factors associated with
recovery of prehospital function among older persons admitted to a
nursing home with disability after an acute hospitalization. J Gerontol
A Biol Sci Med Sci 2009;64:1296-303.
7. Zwicker JG, Missiuna C, Harris SR, Boyd LA. Developmental coor-
dination disorder: a review and update. Eur J Paediatr Neurol 2012;16:
573-81.

8 M.B. Pinheiro et al
8. Franciosi E, Baldari C, Gallotta MC, Emerenziani GP, Guidetti L.
Selected factors correlated to athletic performance in adults with
mental retardation. J Strength Cond Res 2010;24:1059-64.
9. Scianni A, Teixeira-Salmela LF, Ada L. Effect of strengthening ex-
ercise in addition to task-specific gait training after stroke: a rando-
mised trial. Int J Stroke 2010;5:329-35.
10. Carr J, Shepherd R. Neurological rehabilitation: optimizing motor
performance. Oxford: Butterworth-Heinemann; 1998.
11. Tyson S, Connell L. The psychometric properties and clinical utility of
measures of walking and mobility in neurological conditions: a sys-
tematic review. Clin Rehabil 2009;23:1018-33.
12. Desrosiers J, Malouin F, Richards C, Bourbonnais D, Rochette A,
Bravo G. Comparison of changes in upper and lower extremity im-
pairments and disabilities after stroke. Int J Rehabil Res 2003;26:
109-16.
13. Yıldırım Y, Bilge K, Erbayraktar S, Sayhan S. Assessment of lower
extremity motor coordination in operated patients. J Musculoskelet
Res 2008;11:107-15.
14. Desrosiers J, Noreau L, Rochette A, Bravo G, Boutin C. Predictors of
handicap situations following post-stroke rehabilitation. Disabil
Rehabil 2002;24:774-85.
15. Portney LG, Watkins MP. Foundations of clinical research: applica-
tions to practice. 3rd ed. Upper Saddle River: Prentice-Hall; 2009.
16. Mathiowetz V, Kashman N, Volland G, Weber K, Dowe M, Rogers S.
Grip and pinch strength: normative data for adults. Arch Phys Med
Rehabil 1985;66:69-74.
17. Henny J, Petitclerc C, Fuentes-Arderiu X, et al. Need for revisiting the
concept of reference values. Clin Chem Lab Med 2000;38:589-95.
18. Solberg HE, Stamm D. International Federation of Clinical Chemistry,
Scientific Division: approved recommendation on the theory of
reference values. Part 4. Control of analytical variation in the pro-
duction, transfer and application of reference values. Eur J Clin Chem
Clin Biochem 1991;29:531-5.
19. Tabachnick B, Fidell LS. Using multivariate statistics. 5th ed. Boston:
Pearson Allyn and Bacon; 2007.
20. Desrosiers J, Rochette A, Noreau L, Bourbonnais D, Bravo G,
Bourget A. Long-term changes in participation after stroke. Top
Stroke Rehabil 2006;13:86-96.
21. Dyer JO, Maupas E, Melo SA, Bourbonnais D, Forget R. Abnormal
coactivation of knee and ankle extensors is related to changes in
heteronymous spinal pathways after stroke. J Neuroeng Rehabil 2011;
8:1-13.
22. Dyer JO, Maupas E, de Andrade Melo S, Bourbonnais D, Fleury J,
Forget R. Transmission in heteronymous spinal pathways is modified
after stroke and related to motor incoordination. PLoS One 2009;4:
e4123.
23. Hong S-J, Goh EY, Chua SY, Ng SS. Reliability and validity of step
test scores in subjects with chronic stroke. Arch Phys Med Rehabil
2012;93:1065-71.
24. Faria CD, Teixeira-Salmela LF, Neto MG, Rodrigues-de-Paula F.
Performance-based tests in subjects with stroke: outcome scores,
reliability and measurement errors. Clin Rehabil 2012;26:460-9.
25. Tyson SF. Measurement error in functional balance and mobility tests
for people with stroke: what are the sources of error and what is the
best way to minimize error? Neurorehabil Neural Repair 2007;21:
46-50.
26. Brucki SMD, Nitrini R, Caramelli P, Bertolucci PHF, Okamoto IH.
Suggestions for utilization of the mini-mental state examination in
Brazil [Portuguese]. Arq Neuropsiquiatr 2003;61:777-81.
27. Bertolucci P, Brucki S, Campacci S, Juliano Y. The mini-mental state
examination in a general population: impact of educational status
[Portuguese]. Arq Neuropsiquiatr 1994;52:1-7.
28. Bell J, Gabbard C. Foot preference changes through adulthood. Lat-
erality 2000;5:63-8.
29. Ainsworth BE, Bassett DR Jr, Strath SJ, et al. Comparison of three
methods for measuring the time spent in physical activity. Med Sci
Sports Exerc 2000;32:S457-64.
30. Evenson KR, Eyler AA, Wilcox S, Thompson JL, Burke JE. Test-
retest reliability of a questionnaire on physical activity and its corre-
lates among women from diverse racial and ethnic groups. Am J Prev
Med 2003;25:15-22.
31. Yore MM, Ham SA, Ainsworth BE, et al. Reliability and validity of
the instrument used in BRFSS to assess physical activity. Med Sci
Sports Exerc 2007;39:1267-74.
32. Centers for Disease Control and Prevention. Physical activity
trendsdUnited States, 1990-1998. MMWR Morb Mortal Wkly Rep
2001;50:166-9.
33. de Vet HCW, Terwee CB, Knol DL, Bouter LM. When to use
agreement versus reliability measures. J Clin Epidemiol 2006;59:
1033-9.
34. Beckerman H, Roebroeck ME, Lankhorst GJ, Becher JG,
Bezemer PD, Verbeek AL. Smallest real difference, a link between
reproducibility and responsiveness. Qual Life Res 2001;10:571-8.
35. Reed ES. The primacy of action in development. In: Latash M,
Turvey ML, editors. Dexterity and development. Mahwah: Lawrence
Erlbaum; 1996. p 431-51.
36. Lexell JE, Downham DYP. How to assess the reliability of measure-
ments in rehabilitation. Am J Phys Med Rehabil 2005;84:719-23.
37. Field A. Discovering statistics using SPSS. 2nd ed. London: Sage
Publications; 2005.
38. Nedelec B, Dion K, Correa JA, Desrosiers J. Upper Extremity Per-
formance Test for the Elderly (TEMPA): normative data for young
adults. J Hand Ther 2011;24:31-42.
39. Bohannon RW. Comfortable and maximum walking speed of adults
aged 20-79 years: reference values and determinants. Age Ageing
1997;26:15-9.
40. Bowling A, Bond M, Jenkinson C, Lamping DL. Short Form 36
(SF-36) Health Survey questionnaire: which normative data
should be used? Comparisons between the norms provided by the
Omnibus Survey in Britain, the Health Survey for England and
the Oxford Healthy Life Survey. J Public Health Med 1999;21:
255-70.
41. Lanzino DJ, Conner MN, Goodman KA, Kremer KH, Petkus MT,
Hollman JH. Values for timed limb coordination tests in a sample of
healthy older adults. Age Ageing 2012;41:803-7.
42. Meldrum D, Cahalane E, Conroy R, Fitzgerald D, Hardiman O.
Maximum voluntary isometric contraction: reference values and
clinical application. Amyotroph Lateral Scler 2007;8:47-55.
43. Neder A, Nery LE, Shinzato GT, Andrade MS, Peres C, Silva AC.
Reference values for concentric knee isokinetic strength and power in
nonathletic men and women from 20 to 80 years old. J Orthop Sports
Phys Ther 1999;29:116-26.
44. Andrews AW, Thomas MW, Bohannon RW. Normative values for
isometric muscle force measurements obtained with hand-held dyna-
mometers. Phys Ther 1996;76:248-59.
45. Hecimovich M. Sport specialization in youth: a literature review. J Am
Chiropr Assoc 2004;41:32-41.
46. Fransen J, Pion J, Vandendriessche J, et al. Differences in physical
fitness and gross motor coordination in boys aged 6-12 years
specializing in one versus sampling more than one sport. J Sports Sci
2012;30:379-86.
47. Hebert R, Spiegelhalter DJ, Brayne C. Setting the minimal metrically
detectable change on disability rating scales. Arch Phys Med Rehabil
1997;78:1305-8.
www.archives-pmr.org