Reference crop evapotranspiration derived from geo-stationary satellite imagery: a case study for...
32
HESSD 7, 4925–4956, 2010 Reference crop evapotranspiration H. A. R. de Bruin et al. Title Page Abstract Introduction Conclusions References Tables Figures Back Close Full Screen / Esc Printer-friendly Version Interactive Discussion Discussion Paper | Discussion Paper | Discussion Paper | Discussion Paper | Hydrol. Earth Syst. Sci. Discuss., 7, 4925–4956, 2010 www.hydrol-earth-syst-sci-discuss.net/7/4925/2010/ doi:10.5194/hessd-7-4925-2010 © Author(s) 2010. CC Attribution 3.0 License. Hydrology and Earth System Sciences Discussions This discussion paper is/has been under review for the journal Hydrology and Earth System Sciences (HESS). Please refer to the corresponding final paper in HESS if available. Reference crop evapotranspiration derived from geo-stationary satellite imagery – a case study for the Fogera flood plain, NW-Ethiopia and the Jordan Valley, Jordan H. A. R. de Bruin 1 , I. F. Trigo 2,6 , M. A. Jitan 3 , N. Temesgen Enku 4 , C. van der Tol 5 , and A. S. M. Gieske 5 1 Associate Professor Emeritus Wageningen University, freelance researcher, Bilthoven, The Netherlands 2 Instituto de Meteorologia, Lisbon, Portugal 3 NCARE, Dept. Water and Environment, Amman, Jordan 4 Department of Water Resources Engineering, Bahir Dar University, Ethiopia 4925
Transcript of Reference crop evapotranspiration derived from geo-stationary satellite imagery: a case study for...

HESSD7, 4925–4956, 2010
Reference cropevapotranspiration
H. A. R. de Bruin et al.
Title Page
Abstract Introduction
Conclusions References
Tables Figures
J I
J I
Back Close
Full Screen / Esc
Printer-friendly Version
Interactive Discussion
Discussion
Paper
|D
iscussionP
aper|
Discussion
Paper
|D
iscussionP
aper|
Hydrol. Earth Syst. Sci. Discuss., 7, 4925–4956, 2010www.hydrol-earth-syst-sci-discuss.net/7/4925/2010/doi:10.5194/hessd-7-4925-2010© Author(s) 2010. CC Attribution 3.0 License.
Hydrology andEarth System
SciencesDiscussions
This discussion paper is/has been under review for the journal Hydrology and EarthSystem Sciences (HESS). Please refer to the corresponding final paper in HESSif available.
Reference crop evapotranspirationderived from geo-stationary satelliteimagery – a case study for the Fogeraflood plain, NW-Ethiopia and the JordanValley, JordanH. A. R. de Bruin1, I. F. Trigo2,6, M. A. Jitan3, N. Temesgen Enku4, C. van der Tol5,and A. S. M. Gieske5
1Associate Professor Emeritus Wageningen University, freelance researcher, Bilthoven,The Netherlands2Instituto de Meteorologia, Lisbon, Portugal3NCARE, Dept. Water and Environment, Amman, Jordan4 Department of Water Resources Engineering, Bahir Dar University, Ethiopia
4925

HESSD7, 4925–4956, 2010
Reference cropevapotranspiration
H. A. R. de Bruin et al.
Title Page
Abstract Introduction
Conclusions References
Tables Figures
J I
J I
Back Close
Full Screen / Esc
Printer-friendly Version
Interactive Discussion
Discussion
Paper
|D
iscussionP
aper|
Discussion
Paper
|D
iscussionP
aper|
5University of Twente, Dept. ITC, Enschede, The Netherlands6Instituto Dom Luiz, Lisbon, Portugal
Received: 25 June 2010 – Accepted: 2 July 2010 – Published: 23 July 2010
Correspondence to: H. A. R. de Bruin ([email protected])
Published by Copernicus Publications on behalf of the European Geosciences Union.
4926

HESSD7, 4925–4956, 2010
Reference cropevapotranspiration
H. A. R. de Bruin et al.
Title Page
Abstract Introduction
Conclusions References
Tables Figures
J I
J I
Back Close
Full Screen / Esc
Printer-friendly Version
Interactive Discussion
Discussion
Paper
|D
iscussionP
aper|
Discussion
Paper
|D
iscussionP
aper|
Abstract
First results are shown of a project aiming to estimate daily values of reference cropevapotranspiration ET0 from geo-stationary satellite imagery. In particular, for Woreta,a site in the Ethiopian highland at an elevation of about 1800 m, we tested a radiation-temperature based approximate formula proposed by Makkink (MAK) adopting ET05
evaluated with the version of the Penman-Monteith equation described in the FAO Ir-rigation and Drainage paper 56 as the most accurate estimate. More precisely weused the latter with measured daily solar radiation as input (denoted by PMFAO-Rs).Our data set for Woreta concerns a period where the surface was fully covered withshort green non-stressed vegetation. Our project was carried out in the context of10
the Satellite Application Facility on Land Surface Analysis (LANDSAF) facility. Amongothers, the scope of LANDSAF is to increase benefit from the EUMETSAT SatelliteMeteosat Second Generation (MSG). In this study we applied daily values of down-ward solar radiation at the surface obtained from the Spinning Enhanced Visible andInfrared Imager (SEVIRI) radiometer. In addition, air temperature at 2 m was obtained15
from 3-hourly forecasts provided by the European Centre for Medium-Range WeatherForecasts (ECMWF).
Both MAK and PMFAO-Rs contain the psychrometric “constant”, which is propor-tional to air pressure, which, in turn, decreases with elevation. In order to test elevationeffects we tested MAK and its LANDSAF input data for 2 sites in the Jordan Valley20
located about 250 m b.s.l.Except for a small underestimation of air temperature at the Ethiopian site at 1800 m,
the first results of our LANDSAF-ET0 project are promising. If our approach to deriveET0 proves successfully, then the LANDSAF will be able to initiate nearly real time freedistribution of ET0 for the full MSG disk.25
4927

HESSD7, 4925–4956, 2010
Reference cropevapotranspiration
H. A. R. de Bruin et al.
Title Page
Abstract Introduction
Conclusions References
Tables Figures
J I
J I
Back Close
Full Screen / Esc
Printer-friendly Version
Interactive Discussion
Discussion
Paper
|D
iscussionP
aper|
Discussion
Paper
|D
iscussionP
aper|
1 Introduction
Nowadays the method proposed by Allen et al. (1998) to determine evaporative de-mands of agricultural crops has become generally recognized as the most accurateand has been adopted as a standard approach. It is a concept in which the refer-ence evapotranspiration, ET0, is introduced and in which the water requirements of a5
particular crop (ETcrop) are obtained with
ETcrop =KcET0 (1)
where Kc is a crop factor. For a full description of this approach see Allen et al. (1998).ET0 is the evapotranspiration under the given meteorological conditions from a ref-
erence surface, notably, an extensive, hypothetical grass reference crop with specific10
characteristics. The methodology requires input data gathered over a horizontal ex-tensive surface similar to the hypothetical extensive grass field. Although standardweather stations as specified by the World Meteorological Organization refer to sim-ilar grass fields, such stations are rare in semi-arid regions. The reason is obvious:it is very difficult to maintain grass in the required conditions in the dry season. As a15
consequence the number of weather stations fulfilling the requirements that the inputparameters are gathered over well-watered grass is small in most semi-arid regions,while the density of weather stations is sparse anyway in most of semi-arid regions.
It is the objective of this study to present an alternative methodology to derive ET0from geostationary satellite images and additional information provided by operational20
weather forecast models for irrigation advice purposes. In the methodology proposedhere, ET0 relies essentially on daily values of downward solar flux at the surface ob-tained from the Spinning Enhanced Visible and Infrared Imager (SEVIRI) radiometeronboard Meteosat Second Generation (MSG), provided by the Satellite Application Fa-cility on Land Surface Analysis (hereafter LANDSAF; see also Trigo et al. 2010). If25
the approach analyzed here to derive ET0 proves successfully, the LANDSAF will ini-tiate the retrieval and distribution in near real time or off-line of that parameter fromSEVIRI/MSG, as described below.
4928

HESSD7, 4925–4956, 2010
Reference cropevapotranspiration
H. A. R. de Bruin et al.
Title Page
Abstract Introduction
Conclusions References
Tables Figures
J I
J I
Back Close
Full Screen / Esc
Printer-friendly Version
Interactive Discussion
Discussion
Paper
|D
iscussionP
aper|
Discussion
Paper
|D
iscussionP
aper|
It should be stressed that the alternative method to be developed is not meant toreplace the current FAO-methodology by Allen et al. (1998). In contrast, this approachis highly recommended and taken as standard reference for this study. But then theinput data should be collected over well-watered grass or a similar surface.
The LANDSAF-ET0 activity is still under development, not at least because validation5
is needed under a wide range of environmental and climatic conditions. In this researchnote some first results of a case study for a location in Ethiopia will be presented. Forthis purpose we will use some data collected in or close to the Fogera flood plain nearlake Tana in NW Ethiopia which has an elevation of about 1800 m. In order to studyelevation effects on ET0 we will use data gathered at two stations in the Jordan valley10
located about 250 m b.s.l. in addition.
2 The FAO Penman-Monteith equation
It is recalled that ET0 is the evapotranspiration under the given meteorological condi-tions from a hypothetical grass reference crop with specific characteristics. By definitionthis reference grass crop has a height of 0.12 m, a fixed surface resistance of 70 s m−1
15
and an albedo of 0.23. The reference surface closely resembles an extensive surfaceof green, well-watered grass of uniform height, actively growing and completely shad-ing the ground. The fixed surface resistance of 70 s m−1 implies a moderately dry soilsurface resulting from about a weekly irrigation frequency. Allen et al. (1998) providesguidelines on how to calculate ET0 from standard weather data. The methodology20
concerns an application of the Penman-Monteith equation (hereafter denoted as PM-FAO) using the aforementioned surface resistance of 70 s m−1 and an aerodynamicresistance given by
ra =208u2
. (2)
where u2 is the wind speed at 2 m.25
4929

HESSD7, 4925–4956, 2010
Reference cropevapotranspiration
H. A. R. de Bruin et al.
Title Page
Abstract Introduction
Conclusions References
Tables Figures
J I
J I
Back Close
Full Screen / Esc
Printer-friendly Version
Interactive Discussion
Discussion
Paper
|D
iscussionP
aper|
Discussion
Paper
|D
iscussionP
aper|
This relation is derived from neutral logarithmic flux-profile expressions for watervapor transfer using a roughness length for momentum z0m=0.123 h, a roughnesslength governing transfer of heat and vapor z0h =0.1z0h and a zero-plane displacementd=2/3 h, with vegetation height h=0.12 m. Furthermore, Eq. (2) implies that besidesthe wind speed, humidity and temperature data are collected at 2 m too.5
For this hypothetical grass surface the Penman-Monteith model can be written as(Allen et al., 1998):
ETo =0.408∆(Rn−G)+γ 900
T+273u2 (es−ea)
∆+γ (1+0.34u2)(mm/day) (3)
in which Rn is the net radiation at the crop surface (MJ m−2 day−1), G is soil heat fluxdensity (MJ m−2 day−1), assumed zero on daily bases, T the mean daily air temperature10
at 2 m height (◦C), es the saturation vapor pressure at air temperature (kPa), ea actualvapour pressure (kPa), ∆ the slope of the saturation water vapor pressure -temperaturecurve (kPa/◦C) and γ is psychometric constant (kPa /◦C). The latter is proportional toair pressure and is slightly T dependent also. Note that D≡es−ea the saturation vaporpressure deficit (kPa),15
Dealing with daily mean values one should account for non-linearity effects. Moreor less implicitly, Allen et al. (1998) recommend to solve for these effects by using thefollowing equations:
es =e0 (Tmax)+e0 (Tmin)
2(4)
and20
ea =e0 (Tmin)RHmax+e0 (Tmax)RHmin
2(5)
where a bar means a 24 h average, RH is the relative humidity and the suffixes maxand min indicate maximum and minimum value in a day. In general, D determined from
4930

HESSD7, 4925–4956, 2010
Reference cropevapotranspiration
H. A. R. de Bruin et al.
Title Page
Abstract Introduction
Conclusions References
Tables Figures
J I
J I
Back Close
Full Screen / Esc
Printer-friendly Version
Interactive Discussion
Discussion
Paper
|D
iscussionP
aper|
Discussion
Paper
|D
iscussionP
aper|
daily mean RH and T is smaller than D evaluated with D = es−ea using Eqs (4) and(5). Moreover, it is recommended to use ∆ at the mean daily temperature.
Net radiation is given by
Rn = (1−α)Rs−Rnl (6)
in which α is the albedo (assumed to be 0.23), Rs the incoming short-wave radiation5
and Rnl the net long-wave radiation. Following Allen et al. (1998) the latter is approxi-mated with
Rnl =σ
T 4maxK
+T 4minK
2
(0.34−0.14
√ea
)(1.35
Rs
Rs0−0.35
)(MJm−2day−1) (7)
where σ is the Stefan-Boltzmann constant (4.903×10⁻⁹ MJ K−4 m−2 day−1), TminKand TmaxK are the absolute minimum and maximum temperature and Rs0 the clear-sky10
incoming solar radiation evaluated from the extraterrestrial radiation for daily period Ra:
Rs0 = (0.75+2.10−5z)Ra (8)
with z the station elevation a.s.l. in m.The physics behind expression (7) is outside the scope of this research note.
3 Approach15
The subject of this study concerns the evapotranspiration over a hypothetical grassreference crop with the characteristics described above. Because in the real world suchsurfaces are non-existing, it is difficult to verify experimentally any formula for ET0 andto develop an alternative satellite based method. Based on several lysimeter studieswe are confident that PMFAO with incoming short-wave radiation measured directly is20
the most accurate ET0 estimate. This version of the Penman-Monteith equation will bedenoted as PMFAO-Rs. Our alternative method will be compared with PMFAO-Rs.
4931

HESSD7, 4925–4956, 2010
Reference cropevapotranspiration
H. A. R. de Bruin et al.
Title Page
Abstract Introduction
Conclusions References
Tables Figures
J I
J I
Back Close
Full Screen / Esc
Printer-friendly Version
Interactive Discussion
Discussion
Paper
|D
iscussionP
aper|
Discussion
Paper
|D
iscussionP
aper|
On purpose, we do not adopt as “best” ET0 estimate PMFAO formula where netradiation is observed directly. The main reason is that net radiation depends on theactual surface temperature, by which it is effected by water stress. We will discuss thislater.
So, the objective of this study is to derive a simplified ET0 formula requiring input data5
that can be retrieved from remotely sensed solar radiation, in particular those availablefrom the LANDSAF, that compares well with PMFAO-Rs.
As early as 1957 Makkink showed that the evapotranspiration of well-watered shortgrass in The Netherlands can be estimated with a simple radiation based formula: that,in energy units reads, as:10
LvET =c1∆
∆+γRs+c2 (9)
where Lv is the latent heat of vaporization, c1(−) and c2 (W m−2) are constants, ET theevapotranspiration of well-watered grass. The other quantities are defined above. Theunits are W m−2.
De Bruin (1987) showed that in “normal” Dutch summers when water stress is rare,15
the evapotranspiration of short grass at Cabauw (The Netherlands) can be estimatedaccurately with a simplified Makkink formula (hereafter denoted as MAK):
ETMAK =cmak1λ
∆∆+γ
Rs (10)
in which λ is the latent heat of vaporization.De Bruin (1987) reported that cmak=0.65. Moreover, he argued that the method is20
not applicable in the Dutch winter season. Later this was confirmed by Van Kraalingenand Stol (1997), who found that cmak= 0.63 for the growing season in The Netherlands.
Jitan (2005) studied MAK and compared it with PMFAO and he estimated for theJordan Valley (Dair Alla station) cMAK= 0.81.
Stewart et al. (1999) and Watts et al. (2000) developed a methodology for calcu-25
lating ET0 based on the Makkink approach using GOES data to estimate the solar4932

HESSD7, 4925–4956, 2010
Reference cropevapotranspiration
H. A. R. de Bruin et al.
Title Page
Abstract Introduction
Conclusions References
Tables Figures
J I
J I
Back Close
Full Screen / Esc
Printer-friendly Version
Interactive Discussion
Discussion
Paper
|D
iscussionP
aper|
Discussion
Paper
|D
iscussionP
aper|
radiation. Field measurement of water consumption for wheat and cotton in the Yaquivalley (Garatuza et al., 1998) showed good agreement with results obtained fromEq. (10). A useful product has been developed for northern Mexico, see Garatuzaand Watts (2003).
Schuttemeyer (2005) and Schuttemeyer et al. (2007) applied MAK derived from the5
(first generation) METEOSAT images successfully in Ghana (see also de Bruin et al.,2004). They used partly ideas by Choudhury and de Bruin (1998) and a procedure todetermine the solar radiation by Schilling et al. (2004).
Jacobs et al. (2004) applied daily solar radiation estimates derived from GOES im-agery as input in the Penman-Monteith equation to estimate wetland evapotranspira-10
tion. Similarly, Bois et al. (2007) applied MSG-derived solar radiation to determineET0. Recently, Sinclair and Pegram (2010) propose to use LANDSAF solar radiation ina numerical weather forecast model for ET0 estimations in South Africa.
Recently, Temesgen (2009) showed that ET0evaluated with MAK performed well fortwo stations in the Fogera flood plain. Furthermore, Jitan (2004, 2005) applied MAK15
with a revised coefficient for stations in the Jordan Valley.It should be stressed that experience shows that in arid conditions the Makkink for-
mula tends to underestimate ET0 (Allen et al., 1998; Gavilan et al., 2008; Irmak etal., 2008). The authors are well aware of this feature. “These conditions will also beconsidered in subsequent studies. Then alternative radiation-temperature based meth-20
ods, such as proposed by Hargreaves, revised by Hargreaves and Allen (1985) will bestudied too.
This case study for the fairly humid location in the Fogera flood plain is meant toshow some first results of the LANDSAF-ET0 project. The elevation of this region isabout 1800 m a.s.l. In order to investigate elevation effects on ET0 (e.g. through the25
psychrometric constant γ) we will consider applications of our method to the JordanValley in Jordan also, which is located about 250 m b.s.l.
4933

HESSD7, 4925–4956, 2010
Reference cropevapotranspiration
H. A. R. de Bruin et al.
Title Page
Abstract Introduction
Conclusions References
Tables Figures
J I
J I
Back Close
Full Screen / Esc
Printer-friendly Version
Interactive Discussion
Discussion
Paper
|D
iscussionP
aper|
Discussion
Paper
|D
iscussionP
aper|
4 Experimental
The Fogera flood plain is located east of Lake Tana in North West Ethiopia, about625 km from the capital Addis Ababa. The terrain is fairly flat.
The Fogera flood plain is frequently affected by floods. There have been floodsrecorded in the years of 1996, 1998, 1999, 2000, 2001, 2003 and 2006. The 19965
flood set a new record for flooded area, while 2006 flood was recorded with its longduration and damage. In the year 2006, the heavy rain, caused rising of the Lake level,overtopping of Ribb and Gumara rivers and high volume of water flow in the smallercatchments making thousands of people homeless, caused death of thousands cattleand led to large crop losses. In general, the dry season is from November through10
April, so the wet season is between May through September (Temesgen, 2009). Themean air pressure during the observation period was 82 kPa. A map of the flood plainis shown in Fig. 1.
In 2008 ITC installed an automatic weather station at Woreta, see Fig. 1. For theperiod July 2008 – early November 2008 daily data of air temperature and global ra-15
diation are available as well all input data required for PMFAO-Rs. The surface wasshort grass that during this period did not suffer water stress. We will also use somedata gathered at Bahir Dar, a station of the national meteorological office. At this sta-tion solar radiation is not observed directly, but is estimated from measured sunshineduration. For more details see Temesgen (2009).20
We will use a set of micrometeorological data also gathered at two stations located inthe Jordan Valley in Jordan as well. The Jordan valley is Jordan’s premier agriculturalproduction area. The mild winter in the Valley, due to its b.s.l. elevation (−170 in thenorth down to −404 m near the Dead Sea), give it great potential for the productionof off-season fruits and vegetables. The area of the Jordan Rift Valley extends from25
the lake of Tabarieh in the North to the Red Sea in the South, passing through theDead Sea. The north area of the Dead Sea is called the Jordan Valley, while thearea south of it is called southern Ghors, and Wadi Arabah. Rainfall in Jordan Valley
4934

HESSD7, 4925–4956, 2010
Reference cropevapotranspiration
H. A. R. de Bruin et al.
Title Page
Abstract Introduction
Conclusions References
Tables Figures
J I
J I
Back Close
Full Screen / Esc
Printer-friendly Version
Interactive Discussion
Discussion
Paper
|D
iscussionP
aper|
Discussion
Paper
|D
iscussionP
aper|
varies from 100 mm in the South to about 400 mm in the North. For more informationabout this irrigation region see Fardous (1983), Shatanawi et al. (1986), Ghawi andShatanawi (1986), Mazahreh (1993) and (Shatanawi et al., 1986, 1994).
Irrigation agriculture has been practiced in the Jordan Valley since the dawn of hu-man civilization. The formal development of irrigated agriculture started in the early5
1950s in the Zarqa Triangle. In those days scientific agricultural research institutionswere established, which lead, among others, to the establishment of The National Cen-ter for Agricultural Research and Extension (NCARE) previously called NCARTT.
In the Jordan Valleys three agro-meteorological stations were installed by NCAREin the year 2000, and the data are published at the web site www.ncare.gov.jo/imis.10
Among other variables all input data for PMFAO-Rs are observed operationally. In thisstudy we use data collated at Dairalla and Karameh. The mean air pressure in theregion is about 104 kPa. The Dairalla station is located at a latitude of 32◦ 13′ E andlongitude of 35◦37′ N, and an altitude of −224 m b.s.l. The annual precipitation is about277 mm a year. This Karameh station was established in the year 1983, it is located15
at a latitude of 32◦12′ N and longitude of 35◦37′ E, and an altitude of about −240 b.s.l.The annual precipitation in this area is about 155 mm. For the locations of the stationssee Fig. 2.
For this research note we used the operationally available incoming solar radia-tion Rs or Daily Down-welling Surface Short-wave Radiation Flux (DSSF) provided20
by the LANDSAF (Trigo et al., 2010). Daily Rs values, accumulated between 00:00and 24:00 UTC, are obtained from instantaneous flux estimated every 30-min from SE-VIRI/MSG data. The values are estimated at the original pixel resolution of 3 km atthe sub-satellite point (Geiger et al., 2008). For details see http://landsaf.meteo.pt/products/prods.jsp.25
Air temperature at 2 m (T2 m) is obtained from forecasts provided by the EuropeanCentre for Medium-range Weather Forecasts (ECMWF) model. The initial 3-h T2 mforecasts (steps between 12 h and 36 h) at a resolution of about 25 km, are linearlyinterpolated in time to hourly, and bi-linearly interpolated in space to the SEVIRI/MSG
4935

HESSD7, 4925–4956, 2010
Reference cropevapotranspiration
H. A. R. de Bruin et al.
Title Page
Abstract Introduction
Conclusions References
Tables Figures
J I
J I
Back Close
Full Screen / Esc
Printer-friendly Version
Interactive Discussion
Discussion
Paper
|D
iscussionP
aper|
Discussion
Paper
|D
iscussionP
aper|
resolution. The 2 m temperature values undergo a further adjustment to correct differ-ences between ECMWF mode surface orography and SEVIRI pixel altitude, using aconstant lapse rate of 0.6 7◦C/100 m.
5 Results
For the period 1 July–8 November 2008 we compared the daily LANDSAF incoming5
solar radiation and ECMWF air temperatures estimates with the corresponding valuesmeasured at Woreta. The results are shown in Figs. 3 and 4. It is seen that the theLANDSAF estimates of Rs compare fairly, but the ECMWF air temperatures are sys-tematically too low (about 2 centigrade). As mentioned in the previous section, ECMWFtemperature is adjusted by means of a constant lapse rate to take into account the ele-10
vation differences between ECMWF model (1956 m) and actual station height (1811 m),leading to a correction of +0.95 ◦C. In Fig. 5 daily ET0 evaluated with PMFAO-Rs forWoreta is compared with ET0 determined with MAK using MSG LANDSAF incomingsolar radiation and ECMWF air temperature. Apparently, orographic adjustment wasnot enough to reduce the systematic underestimation of T (Fig. 4) which results in15
some underestimation of ET0. This is confirmed in Fig. 6, where measured T is usedinstead of the ECMWF T values.
In order to show the sensitivity of ET0 to solar radiation we plotted in Fig. 7 ET0evaluated with PMFAO using the same locally measured input data, except solar ra-diation at Woreta and at Bahir Dar about 40 km apart. In Bahir Dar solar radiation is20
determined from the measured sunshine duration, whereas at Woreta Rs is measureddirectly. Temesgen (2009) showed that the other input parameters for PMFAO of thesetwo stations compared well. Apparently, Rs from sunshine duration leads to systematicerrors in ET0.
4936

HESSD7, 4925–4956, 2010
Reference cropevapotranspiration
H. A. R. de Bruin et al.
Title Page
Abstract Introduction
Conclusions References
Tables Figures
J I
J I
Back Close
Full Screen / Esc
Printer-friendly Version
Interactive Discussion
Discussion
Paper
|D
iscussionP
aper|
Discussion
Paper
|D
iscussionP
aper|
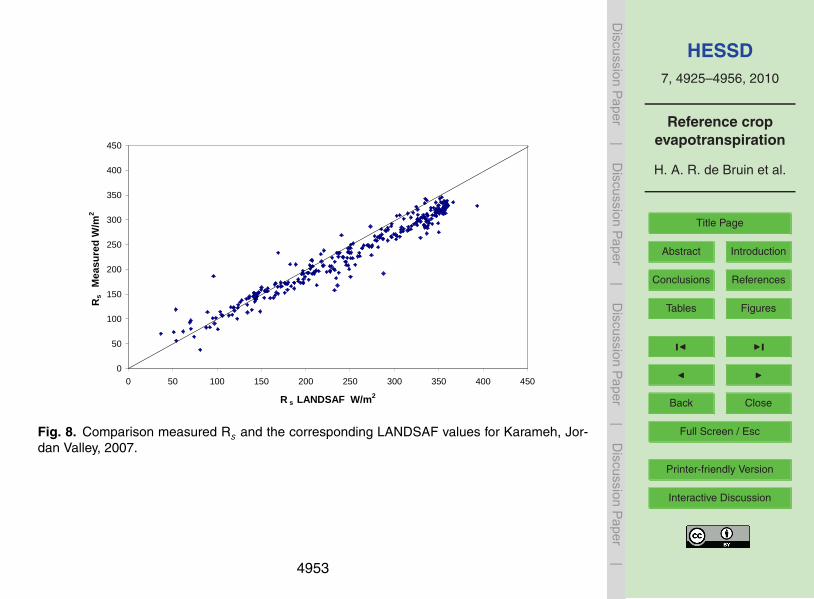
In order to test our approach for a region with a significantly different elevation andthus a much higher air pressure, we compared solar radiation and air temperature for2 sites in the Jordan valley (see experimental). In Fig. 8 the daily measured solarradiation at Karameh is compared with the LANDSAF values for most of 2007. It isseen that the correlation is high, but when Rs exceeds 200 W m−2 the LANDSAF data5
are up to 50 W m−2 greater than the measured values. We found the same for thenearby station. There are several reasons that can explain this conditional bias, suchas insufficient atmospheric correction due to aerosol scattering.
Figure 9 shows a comparison between spatially interpolated and orographically cor-rected ECMWF 2m temperatures with in situ observations. The correspondence is10
very good. Again we obtained the same results for the other nearby station.It appeared that MAK performs fairly well, i.e. ET0 as evaluated by NCATT for local
applications compare well with MAK (See Fig. 10).To illustrate the potential availability of the LANDSAF ET0 “product” we show a map
of ET0 for Ethiopia and adjacent countries for 15 February 2010. This map is produced15
just a day before preparing the manuscript of this research note. See Fig. 11.
6 Discussion and conclusions
In this case study it is shown that for the Fogera flood plain ET0 determined fromLANDSAF solar radiation data and using MAK compares well with the ground truthPMFAO-Rs when the locally measured air temperature is used. This is due to the fact20
that the MAK perform well in this region. It is noted that the elevation of the experimen-tal site is about 1800, where the mean air pressure is about 82 kPa. This reflects in arelative low value for the psychometric constant γ. In turn this tends to enhance ET0.
In this remote region with high elevation the LANDSAF-ECMWF temperature differsfrom the observed value. The reason for this underestimate is not known yet. Recently25
Abreham (2009) and Alemseged (2010) showed that the LANDSAF surface tempera-ture product is useful to estimate temperatures of and near Lake Tana,
4937

HESSD7, 4925–4956, 2010
Reference cropevapotranspiration
H. A. R. de Bruin et al.
Title Page
Abstract Introduction
Conclusions References
Tables Figures
J I
J I
Back Close
Full Screen / Esc
Printer-friendly Version
Interactive Discussion
Discussion
Paper
|D
iscussionP
aper|
Discussion
Paper
|D
iscussionP
aper|
Considering the comparison between ET0 determined with PMFAO for two adjacentstations in the region, where at one station Rs is measured directly and at the otherevaluated from sunshine duration, and the good quality of the LANDSAF incomingsolar radiation product, we tend to conclude that the application of the latter for irrigationpractice is advantageous over using locally measured sunshine duration.5
The obvious advantage of the LADSAF ET0 product is that it can be made availablealmost real-time on MSG-pixel scale for entire Africa and the Middle East.
We recall that PNFAO-Rs is considered the best estimate of ET0for cases where theinput parameters are measured correctly over non-stressed short grass. On purpose,the version of the PMFAO formula where net radiation is observed directly is not taken10
as a reference. Among others, the reason is that net radiation depends on the ac-tual surface temperature, which plays a part in a complex feedback mechanism withwind speed (De Bruin et al., 2005). For surfaces with an albedo of about 23% theincoming solar radiation is independent of any surface property, which is an advantagehere because ET0 refers to a hypothetical reference surface. In practice, many (if not15
all) meteorological data are gathered over a (grass) surface suffering soil water stress.What are the consequences? Allen et al. (1998; Annex 6) mention the effect on airtemperature and humidity, i.e. it is to be expected that in the dry season the air tem-perature is lower and the humidity above the non-stressed FAO surface higher thanover the stressed fields (see also Allen, 1996 and Allen et al., 1996). But there are20
also effects on net radiation. De Bruin (1987) found for a grass site in The Netherlandsthat the measured net radiation was not representative for non-stressed grass in theextreme dry summer of 1976. Recently, the first author of this paper found for a sta-tion in Burkina Faso that in the dry season the measured net radiation over bare soilis significantly smaller than Rn estimates with the empirical formula proposed by De25
Bruin (1987) for hypothetic non-stressed grass. These findings will be published in aseparate paper.
An additional argument not to consider PMFAO with measured net radiation as inputas the best approach is the fact that instrumentally net radiation sensors still are not
4938

HESSD7, 4925–4956, 2010
Reference cropevapotranspiration
H. A. R. de Bruin et al.
Title Page
Abstract Introduction
Conclusions References
Tables Figures
J I
J I
Back Close
Full Screen / Esc
Printer-friendly Version
Interactive Discussion
Discussion
Paper
|D
iscussionP
aper|
Discussion
Paper
|D
iscussionP
aper|
perfect (see e.g. Kustas et al., 1998 and Kohsiek et al., 2008).Internationally, a radiation-temperature based formula for ET0 by Priestley and Taylor
(1972), here denoted by PT, is better known. (see e.g. Van Kraalingen and Stol 1997;Utset et al., 2004, Pereira, 2004; Suleiman and Hoogenboom, 2007, 2009):
LvET=α∆
∆+γRn (11)5
in which α is constant and Rn is the net radiation. The (rounded) value of Priestley-Taylor parameter α is 1.3. For reason mentioned above we think that this approachshould be used only above well-watered short grass.
For a grass site in East Netherlands de Bruin and Stricker (2000) confirmed that bothPT and MAK give good results under non-stressed conditions. They found that PM-10
FAO appears to be more sensitive to errors in the meteorological input data than MAK.Their explanation is that there is a feedback mechanism between the surface temper-ature and the wind speed that effectively reduces the influence of wind, at least whenthe surface is well-watered. This has been confirmed later by De Bruin et al. (2005)for an alfalfa site in Idaho under advective conditions. Because this feed-back mech-15
anism is not included in the PMFAO, by choosing a fixed wind-function, PM-FAO ismore sensitive to errors in input data. Finally, it is noted that according to the generalPenman-Monteith equation evapotranspiration of a surface close to the so-called equi-librium state, i.e. with α close to 1, is independent of changes in ra and thus in windspeed (Thom, 1977).20
The above arguments justify the application of a formula such as MAK using solarradiation and temperature as input only. In turn, this consideration justifies the use ofMAK with solar radiation and temperature provided by the LANDSAF facility. The latteris available for remote regions in Africa and the Middle East.
In conclusion, the LANDSAF-ET0 approach presented in this research note is very25
promising, but more work has to be done to test the method under a wider range ofenvironmental conditions. Considering the studies by e.g. Gavilan et al. (2008) andothers it is most likely that for more arid and windy regions the Makkink formula tested
4939

HESSD7, 4925–4956, 2010
Reference cropevapotranspiration
H. A. R. de Bruin et al.
Title Page
Abstract Introduction
Conclusions References
Tables Figures
J I
J I
Back Close
Full Screen / Esc
Printer-friendly Version
Interactive Discussion
Discussion
Paper
|D
iscussionP
aper|
Discussion
Paper
|D
iscussionP
aper|
here has to be adapted. We might come up with different radiation-temperature basedLANDSAF-ET0 estimates for various climatologic classes.
As noted above the authors are well aware of the fact that in arid conditions the MAKtends to underestimate ET0 (Allen et al., 1998; Gavilan et al., 2008; Irmak et al., 2008).In those conditions horizontal advection of sensible heat supplied by the dry upwind5
terrain tends to enhance evapotranspiration (De Bruin et al., 2005; Berengena1 andGavilan, 2007). The physics behind advection is still not solved entirely. Strictly speak-ing, ET0 is defined for an extensive hypothetical non-stressed grass surface. The LaCrau field experiment revealed that close to dry-to-wet step change evaporation de-creases fast with height (De Bruin et al, 1991), whereas for very large irrigated alfalfa10
fields in Idaho the measured ET did not vary much in the first 10 m above the surfaceDe Bruin et al. (2004). This implies that under advective conditions the size of theexperimental irrigated field plays an important role. Moreover, in highly advective thesensible heat flux is negative, by which the air is stably stratified. Then the aerody-namic resistance will be smaller than predicted by Eq. (1). Clearly, advection effects on15
the hypothetical quantity ET0 requires further discussions in the irrigation community.Possibly, it is wise to introduce an advective-free crop reference ET as standard andto describe advection effects separately. In that case the Makkink formula might be anappropriate choice. This topic is outside the scope of this paper.
Another interesting feature of our study is the effect of mean air pressure on ET020
through the psychrometric “constant” γ, which appears in PMFAO, MAK and PT. Atthe Ethiopian site γ is about 0.055 kPa/K and in the Jordan valley 0.066 kPa/K. Thisdifference is not negligible. Elevation effects on ET0 are reported by Vanderlinden etal. (2008). In this context, it is interesting to note that Delclaux et al. (2008) estimatedactual evaporation of Lake Titicaca with an elevation of almost 4 km. The found that25
MAK was applicable for this lake provided one accounts for heat storage in the waterbody. Air pressure effects are not accounted for in other radiation based ET0 estimatessuch as that by Hargreaves of that by Alexandris et al. (2006). We conclude thatpressure effect on ET0 needs further investigations.
4940

HESSD7, 4925–4956, 2010
Reference cropevapotranspiration
H. A. R. de Bruin et al.
Title Page
Abstract Introduction
Conclusions References
Tables Figures
J I
J I
Back Close
Full Screen / Esc
Printer-friendly Version
Interactive Discussion
Discussion
Paper
|D
iscussionP
aper|
Discussion
Paper
|D
iscussionP
aper|
Acknowledgements. The authors would like to express their gratitude to Esayas Kaba aca-demic vice dean of Engineering Faculty of Bahir Dar University for his cooperation to use lab-oratory equipment during the field campaign and for his valuable input during importing fieldequipment. Tom Rientjes is acknowledegd for his assistance during the Woreta field experi-ment. In addition, we like to thank Ruduwan Mehadi for his cooperation to get meteorological5
data easily at Bahir Dar. This work was carried out within the framework of the Satellite Ap-plication Facility on Land Surface Analysis (LSA SAF), funded by EUMETSAT. The authorsthanks the directors and members of staff of NCARE who assisted with data collection andprocessing for the stations in the Jordan Valley. The first author is very grateful to Rick Allen,Pedro Gavilan and Antonio Martınez-Cob for very valuable discussions and for providing him10
with recent important literature.
References
Alebachew, A.: Open water evaporation estimation using ground measurements and satelliteremote sensing: a case study of Lake Tana, Ethiopia, Enschede, MSc thesis, ITC, 94 pp.,2009.15
Alemseged, B.: Remote sensing of the annual heat storage changes on Lake Tana, Ethiopia,Enschede, MSc thesis ITC, 73 pp., 2010.
Alexandris, S., Kerkides, P., and Liakatas, A.: Daily reference evapotranspiration estimates bythe “Copais” approach, Agr. Wat. Manag., 32, 371–386, 2006.
Berengena, J. and Gavilan, P.: Reference Evapotranspiration Estimation in a Highly Advective20
Semiarid Environment, J. of Irrig. and Drain. Engin., ASCE, 131, 147–163, 2005.Bois, B., Pieria, P., Van Leeuwen, C., Wald, L., Huard, F., Gaudillere, J.-P., and Saur, E.: Using
remotely sensed solar radiation data for reference evapotranspiration estimation at a dailytime step, Agr. Forest. Meteorol. 148(4), 619–630, 2007.
Choudhury, B. J. and De Bruin, H. A. R.: First order approach for estimation unstressed tran-25
spiration from meteorological satellite data, Adv. Space Res., 16(6), 167–176, 1995.De Bruin, H. A. R.: From Penman to Makkink, Comm. Hydrol. Res. TNO, Den Haag. Proc. and
Inform., 39, 5–30, 1987.De Bruin, H. A. R., Bink, N. J., and Kroon, L. J. M.: Fluxes in the surface layer under advective
4941

HESSD7, 4925–4956, 2010
Reference cropevapotranspiration
H. A. R. de Bruin et al.
Title Page
Abstract Introduction
Conclusions References
Tables Figures
J I
J I
Back Close
Full Screen / Esc
Printer-friendly Version
Interactive Discussion
Discussion
Paper
|D
iscussionP
aper|
Discussion
Paper
|D
iscussionP
aper|
conditions, in: Land surface evaporation, edited by: Schmugge, T. J. and Andre, J. C., 157–171, 1991.
De Bruin, H. A. R. and Stricker, J. N. M.: Evaporation of grass under non-restricted soil moistureconditions, Hydrolog. Sci. J., 45(3), 391–406, 2000.
De Bruin, H. A. R., Moene, A. F., and Bosveld, F. C.: An integrated MSG-scintillometer network5
system to monitor sensible and latent heat fluxes, in: Proceedings of the Second MSG RAOWorkshop 9-10, ESA report SP-582, 2004.
De Bruin, H. A. R., Hartogensis, O. K., Allen, R. G., and Kramer, J. W. J. L.: Note on theRegional Advection Perturbations in an Irrigated Desert (RAPID) Experiment, Theor. Appl.Climatol., 80, 143–152, doi:10.1007/s00704-004-0095-y, 2005.10
Delclaux, F., Coudrain, A., and Condom, Th.: Evaporation estimation on Lake Titicaca: asynthesis review and modelling, Hydrol. Process., 21, 1664–1677, 2008.
Fardous, A. A.: Determination of crop coefficients for some direct and indirect methods ofestimating evapotranspiration in Jordan Valley. M. Sc. Thesis, University of Jordan, Amman-Jordan, 1983.15
Garatuza-Payan, J., Shuttleworth, W. J., Encina, D., McNeil, D. D., Stewart, J. B., De Bruin,H. A. R., and Watts, C. J.: Measurement and modelling evaporation for irrigated crops innorth-west Mexico. Hydrol. Proc., 12, 1397–1418, 1998.
Garatuza-Payan, J., and Watts, C. J.: Use of remote sensing for estimating ET for NW Mexico,ICID Workshop on Remote Sensing of ET for large Regions, 2003.20
Gavilan, P., Estevez, J., and Berengena, J.: Comparison of Standardized Reference Evapo-transpiration Equations in Southern Spain, J. Irrig. Drain, E-ASCE, 134, 1–12, 2008.
Geiger, B., Meurey, C., Lajas, D., Franchisteguy, L., Carrer, D., and Roujean, J.-L.: Near real-time provision of downwelling shortwave radiation estimates derived from satellite observa-tions, Meteorol. Appl., 15, 411–420, doi:10.1002/met.84, 2008.25
Ghawi, I. O. and Shatanawi, M. R.: Water Consumption of Broad Beans and Beans in theCentral Jordan Valley, Damascus University Journal, 10, 11–23, 1986.
Hargreaves, G. H. and Allen, R. G.: History and evaluation of Hargreaves equation, J. Irrig.Drain, E.-ASCE, 129, 53–63, 2003.
Irmak, A., Irmak, S., and Martin, D. L.: Reference and Crop Evapotranspiration in South Central30
Nebraska. I: Comparison and Analysis of Grass and Alfalfa-Reference Evapotranspiration.J. Irrig. Drain, E.-ASCE, 6, 690–699, 2008.
Jacobs, J. M., Anderson, M. C., Friess, L. C., and Diak, G. R.: Solar radiation, longwave
4942

HESSD7, 4925–4956, 2010
Reference cropevapotranspiration
H. A. R. de Bruin et al.
Title Page
Abstract Introduction
Conclusions References
Tables Figures
J I
J I
Back Close
Full Screen / Esc
Printer-friendly Version
Interactive Discussion
Discussion
Paper
|D
iscussionP
aper|
Discussion
Paper
|D
iscussionP
aper|
radiation and emergent wetland evapotranspiration estimates from satellite data in Florida,USA. Hydrol Sci, 49, 461–476, 2004.
Jitan, M. A.: Combining Ground Measurements and Satellite Information For Evaluation ofEvapotranspiration and Management of Irrigation in The Jordan Valley. MED-AQUA -2 Con-ference Amman-Jordan 14-15, 2004.5
Jitan, M. A.: Evapotranspiration of Major Crops in the Jordan Valley Using Remote SensingTechniques Compared with Estimated Field Measurement Using Eddy-Correlation,(2005),Ph.D. Thesis, University of Jordan, Jordan, 2005.
Kohsiek, W., Liebethal, C., Foken, T., Vogt, R., Oncley, S. P., Bernhofer, Ch., and De Bruin, H.A. R.: The Energy Balance Experiment EBEX-2000, Part III: Behaviour and quality of the10
radiation measurements, Bound.-Lay. Meteorol., 123, 55–75, 2007.Kustas, W. P, Prueger, J. H., Hipps, L. E., Hatfeld, J. L., and Meek, D.: Inconsistencies in net
radiation estimates from use of several models of instruments in a desert environment, Agr.Forest Meteorol., 90, 257–263, 1998.
Lecina-Brau, S., and Martinez-Cob, A.: Evaluacion lisimetrica de la evapotranspiracion de ref-15
erencia semihoraria calculada con el metodo FAO Penman-Monteith, XVIII Congreso Na-cional de Riegos, Huelva, 2000.
Makkink, G. F.: Testing the Penman formula by means of lysimeters, J. Inst. Water Eng., 11(3),277–288, 1957.
Pereira, A. R.: The Priestley–Taylor parameter and the decoupling factor for estimating refer-20
ence evapotranspiration, Agr. Forest Meteorol., 125, 305–313, 2004.Pinker, R. T., Laszio, I., Goodrich, D., and Pandithurai, G.: Satellite estimates of surface fluxes
for the extended San Pedro Basin: sensitivity to aerosols, Agr. Forest Meteorol., 105, 43–54,2000.
Priestley, C. H. B. and Taylor, R. J.: On the assessment of surface heat flux and evaporation25
using large scale parameters, Mon. Weath. Rev., 100, 81–92, 1972.Rubio, E., Mejuto, M., Calera, A., Vela, A., Castano, S., and Moratalla, A.: Validation of an
Operational Modelling of Evapotranspiration and Direct Recharge, in: Proceedings of the10th International Symposium SPIE, Barcelona, 2003.
Sinclair, S. and Pegram, G. G. S.: A comparison of ASCAT and modelled soil moisture over30
South Africa, using TOPKAPI in land surface mode. Hydrol. Earth Syst. Sci., 14, 613–626,2010,http://www.hydrol-earth-syst-sci.net/14/613/2010/.
4943

HESSD7, 4925–4956, 2010
Reference cropevapotranspiration
H. A. R. de Bruin et al.
Title Page
Abstract Introduction
Conclusions References
Tables Figures
J I
J I
Back Close
Full Screen / Esc
Printer-friendly Version
Interactive Discussion
Discussion
Paper
|D
iscussionP
aper|
Discussion
Paper
|D
iscussionP
aper|
Suleiman A. and Hoogenboom, G.: Comparison of Priestley-Taylor and FAO-56 Penman-Monteith for Daily Reference Evapotranspiration Estimation in Georgia. J. Irrig. Drain, E-ASCE, 133(1), 175–182, 2007.
Suleiman A. and Hoogenboom, G.: A comparison of ASCE and FAO-56 reference evapotran-spiration for a 15-min time step in humid climate conditions, J. Hydrol., 375, 326–333, 2009.5
Schillings, C., Mannstein, H., and Meyer, R.: “Operational method for deriving high resolutionsolar direct normal irradiance from satellite data”, Solar Energy, 76, 475–484, 2004.
Schuttemeyer, D.: “The surface energy balance over drying semi-arid terrain in West Africa”,Ph-D thesis Wageningen University, pp 154, 2005.
Schuttemeyer, D., Schillings, Ch., Moene, A. F., De Bruin, H. A. R.: “Satellite-based actual10
evapotranspiration over drying semi-arid terrain in West Africa”, under review, J. Appl. Mete-orol. Clim., 46, 97–111, 2007.
Shatanawi, M. R., Ghawi, I., and Sharaiha, R. : Actual consumptive use of wheat and barely inthe Jordan Valley. DIRASAT, 14(1), 49–67, 1986.
Shatanawi, M. R., Ghawi, I., Fayyad, M., Habbab, M., Taimeh, A., Abu Awwad, A., Wolf, J.,15
Gleason, J., Salti, S., Ababneh, M., Jitan, M., and Hamdan, M.: Irrigation management andwater quality in the central Jordan valley. A baseline report prepared for the USAID missionto Jordan. Prepared by the water and environment research and study center, University ofJordan. Amman – Jordan, 2003.
Stewart, J. B., Watts, C. J., Rodriguez, J. C., De Bruin, H. A. R., Van den Berg, A. R., and20
Garatuza-Payan, J.: Use of satellite data to estimate radiation and evaporation for north-west Mexico, Agr. Water Manage., 38, 181–193, 1999.
Temesgen Enku, N.: Estimation of evaporation from satellite remote sensing and meteorologi-cal data over the Fogera flood plain, Ethiopia, Enschede, MSc thesis ITC, 89 p, 2009.
Trigo, I. F., DaCamara, C. C., Viterbo, P., Roujean, J.-L., Olesen, F., Barroso, C., Camacho-de25
Coca, F., Carrer, D., Freitas, S. C., Garcıa-Haro, J., Geiger, B., Gellens-Meulenberghs, F.,Ghilain, N., Melia, J., Pessanha, L., Siljamo, N., and Arboleda, A.: The Satellite ApplicationFacility on Land Surface Analysis, Int. J. Remote Sens., in press, 2010.
Utset, A., Farre, I. Martınez-Cob, A., and Cavero, J.: “Comparing Penman-Monteith andPriestley-Taylor approaches as reference-evapotranspiration input for modeling maize wa-30
ter use under Mediterranean conditions”, Agr. Water Mane., 66, 205–219, 2004.Vanderlinden, K., Giradez, J. V., and Van Meirvenne, M.: Spatial Estimation of Reference
Evapotranspiration in Andalusia, Spain. J. of Hydrometeorol, 9, 242–255, 2008.
4944

HESSD7, 4925–4956, 2010
Reference cropevapotranspiration
H. A. R. de Bruin et al.
Title Page
Abstract Introduction
Conclusions References
Tables Figures
J I
J I
Back Close
Full Screen / Esc
Printer-friendly Version
Interactive Discussion
Discussion
Paper
|D
iscussionP
aper|
Discussion
Paper
|D
iscussionP
aper|
Van Kraalingen, D. W. G. and Stol, W.: Evapotranspiration Modules for Crop Growth Simulation,Quantities Approaches in System analysis, vol. 11. pp 29, 1997.
Watts, C. J, Rodrıguez, J. C., Payan, J. G., De Bruin, H. A. R., and Stewart, J.: Estimacionde evaporacion y radiacion solar en el valle del Yaqui, Sonora, usando datos de satelite,Ingenierıa Hidraulica en Mexico, 14, 45–53, 2000.5
4945

HESSD7, 4925–4956, 2010
Reference cropevapotranspiration
H. A. R. de Bruin et al.
Title Page
Abstract Introduction
Conclusions References
Tables Figures
J I
J I
Back Close
Full Screen / Esc
Printer-friendly Version
Interactive Discussion
Discussion
Paper
|D
iscussionP
aper|
Discussion
Paper
|D
iscussionP
aper|
Fig. 1. Map of the Fogera flood plain.
4946

HESSD7, 4925–4956, 2010
Reference cropevapotranspiration
H. A. R. de Bruin et al.
Title Page
Abstract Introduction
Conclusions References
Tables Figures
J I
J I
Back Close
Full Screen / Esc
Printer-friendly Version
Interactive Discussion
Discussion
Paper
|D
iscussionP
aper|
Discussion
Paper
|D
iscussionP
aper|
10
1
2 Figure 2 Map of the two Jordan stations. 3
4
5
For this research note we used the operationally available incoming solar radiation Rs or Daily 6
Down-welling Surface Short-wave Radiation Flux (DSSF) provided by the LANDSAF (Trigo 7
et al., 2010). Daily Rs values, accumulated between 0 and 24 UTC, are obtained from 8
instantaneous flux estimated every 30-min from SEVIRI/MSG data. The values are estimated 9
at the original pixel resolution of 3 km at the sub-satellite point (Geiger et al., 2008). For 10
details see http://landsaf.meteo.pt/products/prods.jsp. 11
Air temperature at 2m (T2m) is obtained from forecasts provided by the European Centre for 12
Medium-range Weather Forecasts (ECMWF) model. The initial 3-hourly T2m forecasts 13
(steps between 12h and 36h) at a resolution of about 25 km, are linearly interpolated in time 14
to hourly, and bi-linearly interpolated in space to the SEVIRI/MSG resolution. The 2m 15
temperature values undergo a further adjustment to correct differences between ECMWF 16
mode surface orography and SEVIRI pixel altitude, using a constant lapse rate of 0.67ºC / 17
100m. 18
Fig. 2. Daily incoming solar radiation comparison: measured and LANDSAF-MSG; WoretaJuly–November 2008
4947

HESSD7, 4925–4956, 2010
Reference cropevapotranspiration
H. A. R. de Bruin et al.
Title Page
Abstract Introduction
Conclusions References
Tables Figures
J I
J I
Back Close
Full Screen / Esc
Printer-friendly Version
Interactive Discussion
Discussion
Paper
|D
iscussionP
aper|
Discussion
Paper
|D
iscussionP
aper|
21
7
0
5
10
15
20
25
30
0 5 10 15 20 25 30
R s measured MJ/(m2.day)
Rs
LA
ND
SA
F M
J/(m
2 .day
)
1
Figure 3 Daily incoming solar radiation comparison: measured and LANDSAF-MSG; Woreta 2
July-November 2008 3
4
05
1015
2025
0 5 10 15 20 25
T2 measured (0C)
T2
EC
MW
F (
0 C)
5 Figure 4 As Figure 3, except for air temperature at 2 m. 6
Fig. 3. As Fig. 3, except for air temperature at 2 m.
4948

HESSD7, 4925–4956, 2010
Reference cropevapotranspiration
H. A. R. de Bruin et al.
Title Page
Abstract Introduction
Conclusions References
Tables Figures
J I
J I
Back Close
Full Screen / Esc
Printer-friendly Version
Interactive Discussion
Discussion
Paper
|D
iscussionP
aper|
Discussion
Paper
|D
iscussionP
aper|
21
7
0
5
10
15
20
25
30
0 5 10 15 20 25 30
R s measured MJ/(m2.day)
Rs
LA
ND
SA
F M
J/(m
2 .day
)
1
Figure 3 Daily incoming solar radiation comparison: measured and LANDSAF-MSG; Woreta 2
July-November 2008 3
4 0
510
1520
25
0 5 10 15 20 25
T2 measured (0C)
T2
EC
MW
F (
0 C)
5 Figure 4 As Figure 3, except for air temperature at 2 m. 6 Fig. 4. ET0 evaluated with PMFAO-Rs and the MAK-LANDSAF method. Not corrected for
underestimation of T by LANDSAF-ECMWF.
4949

HESSD7, 4925–4956, 2010
Reference cropevapotranspiration
H. A. R. de Bruin et al.
Title Page
Abstract Introduction
Conclusions References
Tables Figures
J I
J I
Back Close
Full Screen / Esc
Printer-friendly Version
Interactive Discussion
Discussion
Paper
|D
iscussionP
aper|
Discussion
Paper
|D
iscussionP
aper|
22
1
2
0
1
2
3
4
5
6
0 1 2 3 4 5 6
ET0 LANDSAF mm/day
ET
0 P
MF
AO
-Rs
mm
/day
3 Figure 5 ET0 evaluated with PMFAO-Rs and the MAK-LANDSAF method. Not corrected for 4
underestimation of T by LANDSAF-ECMWF. 5
6
Fig. 5. ET0 evaluated with PMFAO-Rs and the MAK-LANDSAF method. Not corrected forunderestimation of T by LANDSAF-ECMWF.
4950

HESSD7, 4925–4956, 2010
Reference cropevapotranspiration
H. A. R. de Bruin et al.
Title Page
Abstract Introduction
Conclusions References
Tables Figures
J I
J I
Back Close
Full Screen / Esc
Printer-friendly Version
Interactive Discussion
Discussion
Paper
|D
iscussionP
aper|
Discussion
Paper
|D
iscussionP
aper|
23
0
1
2
3
4
5
6
0 1 2 3 4 5 6
ET0 LANDSAF T2 measured mm/day
ET
0 P
MF
AO
-Rs
mm
/day
1 Figure 6 As Figure 5, but with locally measured temperature 2
3
0
1
2
3
4
5
6
0 1 2 3 4 5 6
PMFAO_Rs Woreta mm/day
PM
FA
O B
ahir
Dar
mm
/day
4 Figure 7 ET0 measured at Woreta using PMFAO-Rs versus ET0 measured at Bahir Dar using 5
PNFAO with sunshine duration as input. The distance between Bahir Dar and Woreta is about 50 km. 6
Fig. 6. As Fig. 5, but with locally measured temperature
4951

HESSD7, 4925–4956, 2010
Reference cropevapotranspiration
H. A. R. de Bruin et al.
Title Page
Abstract Introduction
Conclusions References
Tables Figures
J I
J I
Back Close
Full Screen / Esc
Printer-friendly Version
Interactive Discussion
Discussion
Paper
|D
iscussionP
aper|
Discussion
Paper
|D
iscussionP
aper|
23
0
1
2
3
4
5
6
0 1 2 3 4 5 6
ET0 LANDSAF T2 measured mm/day
ET
0 P
MF
AO
-Rs
mm
/day
1 Figure 6 As Figure 5, but with locally measured temperature 2
3
0
1
2
3
4
5
6
0 1 2 3 4 5 6
PMFAO_Rs Woreta mm/day
PM
FA
O B
ahir
Dar
mm
/day
4 Figure 7 ET0 measured at Woreta using PMFAO-Rs versus ET0 measured at Bahir Dar using 5
PNFAO with sunshine duration as input. The distance between Bahir Dar and Woreta is about 50 km. 6
Fig. 7. ET0 measured at Woreta using PMFAO-Rs versus ET0 measured at Bahir Dar usingPNFAO with sunshine duration as input. The distance between Bahir Dar and Woreta is about50 km.
4952
HESSD7, 4925–4956, 2010
Reference cropevapotranspiration
H. A. R. de Bruin et al.
Title Page
Abstract Introduction
Conclusions References
Tables Figures
J I
J I
Back Close
Full Screen / Esc
Printer-friendly Version
Interactive Discussion
Discussion
Paper
|D
iscussionP
aper|
Discussion
Paper
|D
iscussionP
aper|
24
1
0
50
100
150
200
250
300
350
400
450
0 50 100 150 200 250 300 350 400 450
R s LANDSAF W/m2
Rs
Mea
sure
d W
/m2
2 Figure 8 Comparison measured Rs and the corresponding LANDSAF values for Karameh, Jordan 3
Valley, 2007. 4
5
Fig. 8. Comparison measured Rs and the corresponding LANDSAF values for Karameh, Jor-dan Valley, 2007.
4953

HESSD7, 4925–4956, 2010
Reference cropevapotranspiration
H. A. R. de Bruin et al.
Title Page
Abstract Introduction
Conclusions References
Tables Figures
J I
J I
Back Close
Full Screen / Esc
Printer-friendly Version
Interactive Discussion
Discussion
Paper
|D
iscussionP
aper|
Discussion
Paper
|D
iscussionP
aper|
25
0
5
10
15
20
25
30
35
40
0 5 10 15 20 25 30 35 40
T2 LANDSAF (oC)
T2
mea
sure
d (
oC
)
1 Figure 9 As Figure 8, except for air temperature at 2m. 2
3
0
1
2
3
4
5
6
7
8
9
0 1 2 3 4 5 6 7 8 9
ET 0 FAO mm/day
ET
0 M
AK
mm
/day
4 Figure 10 ET0 according to PMFAO compared with MAK; Karameh, Jordan Valley, 2007. 5
6
Fig. 9. As Fig. 8, except for air temperature at 2 m.
4954

HESSD7, 4925–4956, 2010
Reference cropevapotranspiration
H. A. R. de Bruin et al.
Title Page
Abstract Introduction
Conclusions References
Tables Figures
J I
J I
Back Close
Full Screen / Esc
Printer-friendly Version
Interactive Discussion
Discussion
Paper
|D
iscussionP
aper|
Discussion
Paper
|D
iscussionP
aper|
25
0
5
10
15
20
25
30
35
40
0 5 10 15 20 25 30 35 40
T2 LANDSAF (oC)
T2
mea
sure
d (
oC
)
1 Figure 9 As Figure 8, except for air temperature at 2m. 2
3
0
1
2
3
4
5
6
7
8
9
0 1 2 3 4 5 6 7 8 9
ET 0 FAO mm/day
ET
0 M
AK
mm
/day
4 Figure 10 ET0 according to PMFAO compared with MAK; Karameh, Jordan Valley, 2007. 5
6
Fig. 10. ET0 according to PMFAO compared with MAK; Karameh, Jordan Valley, 2007.
4955

HESSD7, 4925–4956, 2010
Reference cropevapotranspiration
H. A. R. de Bruin et al.
Title Page
Abstract Introduction
Conclusions References
Tables Figures
J I
J I
Back Close
Full Screen / Esc
Printer-friendly Version
Interactive Discussion
Discussion
Paper
|D
iscussionP
aper|
Discussion
Paper
|D
iscussionP
aper|
26
1 Figure 11 Example of a LANDSAF ET0 map (in mm/day) covering Ethiopia and Jordan. 2
Fig. 11. Example of a LANDSAF ET0 map (in mm/day) covering Ethiopia and Jordan.
4956