Reduction of cortical TrkA but not p75NTR protein in early-stage Alzheimer's disease
12
Reduction of Cortical TrkA but Not p75 NTR Protein in Early-Stage Alzheimer’s Disease Scott E. Counts, PhD, 1 Muhammad Nadeem, MD, 1 Joanne Wuu, ScM, 1 Stephen D. Ginsberg, PhD, 2 H. Uri Saragovi, PhD, 3 and Elliott J. Mufson, PhD 1 Degeneration of cholinergic nucleus basalis (NB) cortical projection neurons is associated with cognitive decline in late-stage Alzheimer’s disease (AD). NB neuron survival is dependent on coexpression of the nerve growth factor (NGF) receptors p75 NTR and TrkA, which bind NGF in cortical projection sites. We have shown previously a significant re- duction of NB perikarya expressing p75 NTR and TrkA protein during the early stages of AD. Whether there is a con- comitant reduction in cortical levels of these receptors during the progression of AD is unknown. p75 NTR and TrkA protein was evaluated by quantitative immunoblotting in five cortical regions (anterior cingulate, superior frontal, su- perior temporal, inferior parietal, and visual cortex) of individuals clinically diagnosed with no cognitive impairment (NCI), mild cognitive impairment (MCI), mild/moderate AD, or severe AD. Cortical p75 NTR levels were stable across the diagnostic groups. In contrast, TrkA levels were reduced approximately 50% in mild/moderate and severe AD compared with NCI and MCI in all regions except visual cortex. Mini-Mental Status Examination scores correlated with TrkA levels in anterior cingulate, superior frontal, and superior temporal cortex. The selective reduction of cortical TrkA levels relative to p75 NTR may have important consequences for cholinergic NB function during the transition from MCI to AD. Ann Neurol 2004;56:520 –531 Cholinergic projection neurons of the basal forebrain nucleus basalis (NB) provide the major source of cho- linergic innervation to the cerebral cortex 1 and play a key role in cognitive and attentional behaviors. 2,3 These neurons undergo extensive degeneration in late- stage Alzheimer’s disease (AD), suggesting that reduced cortical cholinergic transmission contributes to ad- vanced AD symptoms. 2,4–6 The pathogenic mechanisms underlying NB degen- eration in AD are unclear. However, cholinergic NB neuronal survival appears to depend on the binding, internalization, and retrograde transport of nerve growth factor (NGF) secreted by target neurons in the cortex. 7–10 Cholinergic NB neurons express two recep- tors that are anterogradely transported and bind NGF in the cortex: the pan-neurotrophin receptor p75 NTR and the NGF-specific receptor tyrosine kinase TrkA. 11,12 p75 NTR is a member of the tumor necrosis factor receptor family and binds NGF with relatively low affinity (K d 10 9 ). 13,14 The p75 NTR receptor lacks intrinsic catalytic activity but interacts with downstream signaling molecules to elicit either a pro- apoptotic or an antiapoptotic signal that likely depends on cell context (eg, cell type, presence or absence of specific binding partners). 15 TrkA binds NGF with rel- atively high affinity (K d 10 11 ) when co-expressed with p75 NTR . 14,16 Catalytic, NGF-bound TrkA com- plexes are internalized as specialized “signaling endo- somes” 17–19 and promote the survival and cholinergic phenotype of NB neurons. 10,20,21 Recently, quantitative unbiased stereological studies showed that the number of NB neurons expressing ei- ther p75 NTR or TrkA protein was reduced approxi- mately 50% in elderly subjects clinically diagnosed with mild cognitive impairment (MCI) or mild/mod- erate AD compared with subjects with no cognitive impairment (NCI). 22,23 In contrast, the number of NB perikarya expressing the cholinergic markers choline acetyltransferase (ChAT, the synthetic enzyme for ace- tylcholine, or ACh) or the vesicular ACh transporter From the 1 Department of Neurological Sciences, Rush University Medical Center, Chicago, IL; 2 Center for Dementia Research, Nathan Kline Institute, Departments of Psychiatry and Physiology and Neuroscience, New York University School of Medicine, and 3 Department of Pharmacology and Therapeutics, Oncology and the Cancer Center, Lady Davis Institute-Jewish General Hospital, Mon- treal, Quebec, Canada. Received Apr 5, 2004, and in revised form Jun 10. Accepted for publication Jun 11, 2004. Published online Sep 30, 2004, in Wiley InterScience (www.interscience.wiley.com). DOI: 10.1002/ana.20233 Address correspondence to Dr Mufson, Alla and Solomon Jesmer Chair in Aging, Rush University Medical Center, 1735 W. Harrison Street, Suite 300, Chicago, IL 60612. E-mail: [email protected] 520 © 2004 American Neurological Association Published by Wiley-Liss, Inc., through Wiley Subscription Services
-
Upload
independent -
Category
Documents
-
view
1 -
download
0
Transcript of Reduction of cortical TrkA but not p75NTR protein in early-stage Alzheimer's disease

Reduction of Cortical TrkA but Notp75NTR Protein in Early-Stage
Alzheimer’s DiseaseScott E. Counts, PhD,1 Muhammad Nadeem, MD,1 Joanne Wuu, ScM,1 Stephen D. Ginsberg, PhD,2
H. Uri Saragovi, PhD,3 and Elliott J. Mufson, PhD1
Degeneration of cholinergic nucleus basalis (NB) cortical projection neurons is associated with cognitive decline inlate-stage Alzheimer’s disease (AD). NB neuron survival is dependent on coexpression of the nerve growth factor (NGF)receptors p75NTR and TrkA, which bind NGF in cortical projection sites. We have shown previously a significant re-duction of NB perikarya expressing p75NTR and TrkA protein during the early stages of AD. Whether there is a con-comitant reduction in cortical levels of these receptors during the progression of AD is unknown. p75NTR and TrkAprotein was evaluated by quantitative immunoblotting in five cortical regions (anterior cingulate, superior frontal, su-perior temporal, inferior parietal, and visual cortex) of individuals clinically diagnosed with no cognitive impairment(NCI), mild cognitive impairment (MCI), mild/moderate AD, or severe AD. Cortical p75NTR levels were stable across thediagnostic groups. In contrast, TrkA levels were reduced approximately 50% in mild/moderate and severe AD comparedwith NCI and MCI in all regions except visual cortex. Mini-Mental Status Examination scores correlated with TrkA levelsin anterior cingulate, superior frontal, and superior temporal cortex. The selective reduction of cortical TrkA levelsrelative to p75NTR may have important consequences for cholinergic NB function during the transition from MCI to AD.
Ann Neurol 2004;56:520–531
Cholinergic projection neurons of the basal forebrainnucleus basalis (NB) provide the major source of cho-linergic innervation to the cerebral cortex1 and play akey role in cognitive and attentional behaviors.2,3
These neurons undergo extensive degeneration in late-stage Alzheimer’s disease (AD), suggesting that reducedcortical cholinergic transmission contributes to ad-vanced AD symptoms.2,4–6
The pathogenic mechanisms underlying NB degen-eration in AD are unclear. However, cholinergic NBneuronal survival appears to depend on the binding,internalization, and retrograde transport of nervegrowth factor (NGF) secreted by target neurons in thecortex.7–10 Cholinergic NB neurons express two recep-tors that are anterogradely transported and bind NGFin the cortex: the pan-neurotrophin receptor p75NTR
and the NGF-specific receptor tyrosine kinaseTrkA.11,12 p75NTR is a member of the tumor necrosisfactor receptor family and binds NGF with relativelylow affinity (Kd � 10�9).13,14 The p75NTR receptor
lacks intrinsic catalytic activity but interacts withdownstream signaling molecules to elicit either a pro-apoptotic or an antiapoptotic signal that likely dependson cell context (eg, cell type, presence or absence ofspecific binding partners).15 TrkA binds NGF with rel-atively high affinity (Kd � 10�11) when co-expressedwith p75NTR.14,16 Catalytic, NGF-bound TrkA com-plexes are internalized as specialized “signaling endo-somes”17–19 and promote the survival and cholinergicphenotype of NB neurons.10,20,21
Recently, quantitative unbiased stereological studiesshowed that the number of NB neurons expressing ei-ther p75NTR or TrkA protein was reduced approxi-mately 50% in elderly subjects clinically diagnosedwith mild cognitive impairment (MCI) or mild/mod-erate AD compared with subjects with no cognitiveimpairment (NCI).22,23 In contrast, the number of NBperikarya expressing the cholinergic markers cholineacetyltransferase (ChAT, the synthetic enzyme for ace-tylcholine, or ACh) or the vesicular ACh transporter
From the 1Department of Neurological Sciences, Rush UniversityMedical Center, Chicago, IL; 2Center for Dementia Research,Nathan Kline Institute, Departments of Psychiatry and Physiologyand Neuroscience, New York University School of Medicine, and3Department of Pharmacology and Therapeutics, Oncology and theCancer Center, Lady Davis Institute-Jewish General Hospital, Mon-treal, Quebec, Canada.
Received Apr 5, 2004, and in revised form Jun 10. Accepted forpublication Jun 11, 2004.
Published online Sep 30, 2004, in Wiley InterScience(www.interscience.wiley.com). DOI: 10.1002/ana.20233
Address correspondence to Dr Mufson, Alla and Solomon JesmerChair in Aging, Rush University Medical Center, 1735 W. HarrisonStreet, Suite 300, Chicago, IL 60612. E-mail: [email protected]
520 © 2004 American Neurological AssociationPublished by Wiley-Liss, Inc., through Wiley Subscription Services
(VAChT) was unchanged in MCI and mild AD com-pared with NCI.24 These striking observations sug-gested that many cholinergic NB neurons undergo aphenotypic silencing of NGF receptor expression in theabsence of frank cell loss during the early stages of cog-nitive decline. Whether the reduction in NGF receptorexpression in NB neurons translates into a decrease incortical p75NTR or TrkA protein levels during the pro-gression of AD remains unknown. Although corticalTrkA levels are decreased in late-stage AD,25,26 thereare no data on p75NTR protein expression in the cortexduring any stage of this disease. A reduction in corticalNGF receptor levels during the prodromal stage of ADwould suggest that cholinergic NB cortical projectionneurons are at risk early in the disease process due to adeficit in NGF receptor–mediated signaling. To ad-dress this issue, we performed quantitative immuno-blotting experiments to measure p75NTR and TrkAprotein levels in five cortical NB projection regions(anterior cingulate, superior frontal, superior temporal,inferior parietal, and visual cortex) in tissue samples de-rived from the Religious Orders Study (ROS), an on-going longitudinal study of aging and AD in elderlyCatholic clergy.23,27–29 The cognitive function of theseindividuals was classified as NCI, MCI, or AD. Wealso examined whether changes in NGF receptor pro-tein levels within the cortex were associated with per-formance on specific tasks of cognition and attention.
Subjects and MethodsSubjectsCortical tissue samples were evaluated from 49 individualswho were participants in the ROS, a longitudinal clinicalpathological study of aging and AD (see Table 1).23,27–29
The Human Investigations Committee of Rush UniversityMedical Center approved the study. Each participant agreedto an annual detailed clinical evaluation and to brain dona-tion at the time of death. For all subjects, cognitive testingscores were available within the last year of life; the averageinterval from last evaluation to time of death was 7.2 � 3.7months, with no significant differences among the three di-agnostic groups (p � 0.07). Subjects were categorized asNCI (n �18; mean age, 83.1 � 6.4 years; mean MMSE,28.1 � 1.5), MCI insufficient to meet criteria for dementia(n � 16; age, 83.7 � 5.6 years; MMSE, 26.0 � 2.6), ormild/moderate AD (n � 15; age, 85.3 � 6.5 years; MMSE,15.2 � 7.9). Cortical samples also were obtained from 12age-matched patients of the Rush Alzheimer’s Disease Center(RADC, see Table 1). These patients were clinically evalu-ated within 12 months of death, and severe AD was diag-nosed (MMSE, 5.4 � 4.8).
Clinical Evaluation: Religious OrdersStudy PopulationDetails of the ROS clinical evaluation have been publishedelsewhere.23,27–29 In brief, a team of investigators performeda complete annual clinical evaluation that included assess-
ments for stroke30 and parkinsonian signs.31 Trained neuro-psychology technicians administered a battery of tests mea-suring performance in five cognitive domains: orientation,attention, memory, language, and perception.32 An impairedscore for each domain required impairment on multiple testswithin that domain. A board-certified clinical neuropsychol-ogist used these results to summarize impairment in each ofthe five cognitive domains as not present, possible, or prob-able. After review of all clinical data from that year and ex-amination of the participant, a board-certified neurologistwith expertise in the evaluation of the elderly made a clinicaldiagnosis. The diagnosis of dementia and AD followed therecommendations of the joint working group of the NationalInstitute of Neurological and Communicative Disorders andStroke and the Alzheimer’s Disease and Related DisordersAssociation (NINCDS/ADRDA).33 There are no consensuscriteria for the clinical classification of MCI. Our MCI pop-ulation was defined as those persons rated as impaired onneuropsychological testing by the neuropsychologist but whowere not found to have dementia by the examining neurol-ogist.23,27–29 These criteria are similar to, or compatible with,those used by others in the field to describe persons who arenot cognitively normal but do not meet established criteriafor dementia.34–36 A postmortem interview was conducted atthe time of death to identify medical conditions that oc-curred during the interval between the last clinical evaluationand death. Finally, a consensus conference of neurologistsand neuropsychologists reviewed all available data and madea summary clinical diagnosis.
Clinical Evaluation: Rush Alzheimer’s DiseaseCenter PopulationTwelve cases of autopsy-proven severe AD from the RADCBrain Bank were matched for age, postmortem interval(PMI), and education with the ROS diagnostic groups (seeTable 1). The clinical diagnosis of AD was made following astandardized ADC evaluation at a consensus conference, uti-lizing NINCDS/ADRDA33 and the Diagnostic and StatisticalManual of Mental Disorders, Third Edition –Revised (DSM-IIIR)37 criteria.
Pathological Evaluation and Tissue PreparationBrains from both ROS and RADC cohorts were processed atautopsy as previously published.28,29,38 The PMI did not dif-fer across groups (p � 0.76, see Table 1). A neuropatholo-gist conducted a gross examination of brain neuropathologyand cases were excluded if they exhibited significant non-ADtypes of pathological conditions (eg, brain tumors, encepha-litis, large strokes, multiple lacunar infarctions). Brains werecut into 1cm-thick slabs. One hemisphere was immersion-fixed in 4% paraformaldehyde, and the opposite hemispherewas snap-frozen in liquid nitrogen. Samples of gray matterfrom the anterior cingulate, superior frontal, superior tempo-ral, inferior parietal, and visual cortex were dissected basedon fiduciary landmarks. All dissections were performed ondry ice to prevent tissue thawing and stored at �80°C untilassayed.
A complete neuropathological analysis was performed onparaffin-embedded sections with special attention to lesionsthat might contribute to dementia, including brainstem and
Counts et al: Cortical NGF Receptors in AD 521
cortical Lewy bodies as well as strokes. A pathological diag-nosis was made for each case by a neuropathologist blindedto the clinical diagnosis. Designations of “normal” (for ADor other dementing processes), “possible” or “probable AD”,or “definite AD” were based on Consortium to Establish aRegistry for Alzheimer’s Disease (CERAD) criteria, semi-quantitative estimation of neuritic plaque density, an age-adjusted plaque score, and presence or absence of demen-tia.39 All cases received Braak scores based on neurofibrillarytangle pathology,40 and each case was assigned an NationalInstitute on Aging (NIA)–Reagan diagnostic criteria–baseddiagnosis (see Table 1).41
AntibodiesA mouse monoclonal p75NTR antibody (NGFR5; NeoMar-kers, Fremont, CA) was used to detect cortical p75NTR pro-tein. The specificity of NGFR5 is well established in the lit-erature.5,22 Because cortical levels of �-tubulin areunchanged in AD brain relative to aged control brain,42,43 amonoclonal antibody to �-tubulin (Chemicon, Temecula,CA) was used as an internal control for protein loading. Inpilot studies, we verified by immunoblotting and densitom-etry that �-tubulin levels were unchanged in samples fromthe different clinical diagnostic groups examined in thisstudy; equivalent total protein loading for each sample wasalso assessed by Coomassie blue staining of the same gels(data not shown).
A rabbit polyclonal TrkA antiserum raised against the Nterminus of TrkA (Research Diagnostics, Flanders, NJ) wasused to detect cortical TrkA protein. The specificity of theantiserum was determined using naive NIH-3T3 mouse fi-broblast cells, NIH-3T3 cells transfected with human trkAor human trkC cDNA,44 and SH-SY5Y human neuroblas-toma cells transfected with human trkB cDNA45 (a gift fromDr Garrett M. Brodeur, Children’s Hospital of Philadel-phia). Rabbit polyclonal antisera to TrkB or TrkC46 (giftsfrom Dr David R. Kaplan, Hospital for Sick Children, To-ronto, Ontario, Canada) were used to verify TrkB and TrkCprotein expression in the transfected cell lines. Finally, weused a well-characterized mouse monoclonal TrkA antibody,5C3,23,26,47 in an independent set of experiments to corrob-orate results attained using the rabbit TrkA antiserum.
Quantitative ImmunoblottingTissue samples from anterior cingulate, superior frontal, su-perior temporal, inferior parietal, and visual cortex were son-icated in ice-cold homogenization buffer (20mM Tris, 1mMEGTA, 1mM EDTA, 10% sucrose, pH 7.4) containing pro-tease inhibitors (2mg/ml leupeptin, 0.01U/ml aprotinin,1mg/ml pepstatin A, 1mg/ml antipain, 2.5mg/ml chymosta-tin, 10mM benzamidine, 0.1mM phenylmethyl sulfonyl flu-oride, 0.4mg/ml N-p-Tosyl-L-phenylalanine chloromethylketine (TPCK), 0.4mg/ml N-�-p-Tosyl-L-lysine chlorom-ethyl ketone (TLCK), 0.4mg/ml soybean trypsin inhibitor,0.1mM sodium fluoride, and 0.1mM sodium orthovana-date). S1 fractions were prepared by centrifugation at 1,000rpm for 10 minutes at 4°C. Protein concentration was de-termined by the Bradford method (Bio-Rad, Hercules, CA)using bovine serum albumin as the protein standard. Sampleproteins were denatured in sodium dodecyl sulfate (SDS)
loading buffer to a final concentration of 5mg/ml. Sampleproteins (50�g/sample) were separated by SDS–polyacrylam-ide gel electrophoresis (PAGE; 10% acrylamide) and trans-ferred to polyvinylidene fluoride membranes (Immobilon P;Millipore, Bedford, MA) electrophoretically. Membraneswere cut horizontally at the approximately 90kDa molecularweight marker (Bio-Rad) and blocked in TBS/0.1% Tween-20/5% milk for 30 minutes at room temperature. The tophalf of the membrane (proteins migrating at Mr �90kDa)was incubated overnight at 4°C with rabbit TrkA antiserum(1:1,000; Research Diagnostics), and the bottom half of themembrane (proteins migrating at Mr �90kDa) was incu-bated with mouse anti–p75NTR (NGFR5, 1:200; NeoMark-ers) and mouse anti-�-tubulin (1:75,000; Chemicon) mono-clonal antibodies in blocking buffer. After several rinses, theblots were incubated for 1 hour at room temperature witheither horseradish peroxidase (HRP)–conjugated goat anti–rabbit IgG secondary antibody (1:10,000; Bio-Rad) for de-tection of TrkA or HRP-conjugated goat anti–mouse IgGsecondary antibody (1:8,000; Pierce, Rockford, IL) for de-tection of p75NTR and �-tubulin. Immunoreactive proteinswere visualized simultaneously by enhanced chemilumines-cence (Amersham Biosciences, Piscataway, NJ) and quanti-fied by densitometry using NIH Image 1.63. No immuno-reactive bands were detected on blots probed with the anti–rabbit or anti–mouse secondary IgG alone (data not shown).TrkA and p75NTR-immunoreactive signals were normalizedto �-tubulin signals for quantitative analysis. Each samplewas analyzed three times in independent experiments.
Statistical AnalysisData were summarized in means, standard deviations, fre-quencies, and percentages. Because the levels of TrkA andp75NTR protein were measured in triplicates (three indepen-dent experiments), we examined the between-subject versuswithin-subject (ie, between-triplicate) variation by variancecomponent analysis and found the intraclass correlation to behigh (above 0.8, in all regions). The average of the triplicatefrom each subject therefore was used in analyses. Because ofthe skewness in TrkA and p75NTR values when normalizedto �-tubulin signals, log transformations were used to pro-vide a measure that was closer to normal distribution. Therelationship among the TrkA or p75NTR values for the fivecortical regions was examined using Spearman’s rank corre-lation. We compared the clinical, demographic, and patho-logical characteristics, as well as the TrkA and p75NTR pro-tein levels, among the diagnosis groups using an one-wayanalysis of variance (ANOVA) or Fisher’s exact test. Tukey’sstudentized range test, Newman–Keuls, or Bonferroni posthoc analysis was used for multiple comparisons, as appropri-ate. The relationship between TrkA or p75NTR and the clin-ical variables was assessed by Spearman’s rank correlation orKruskal–Wallis test. The level of statistical significance wasset at 0.01 (two-tailed).
ResultsCase DemographicsTable 1 shows characteristics of the sample populationby diagnostic group. The NCI, MCI, and mild/mod-erate AD individuals from the ROS and severe AD in-
522 Annals of Neurology Vol 56 No 4 October 2004
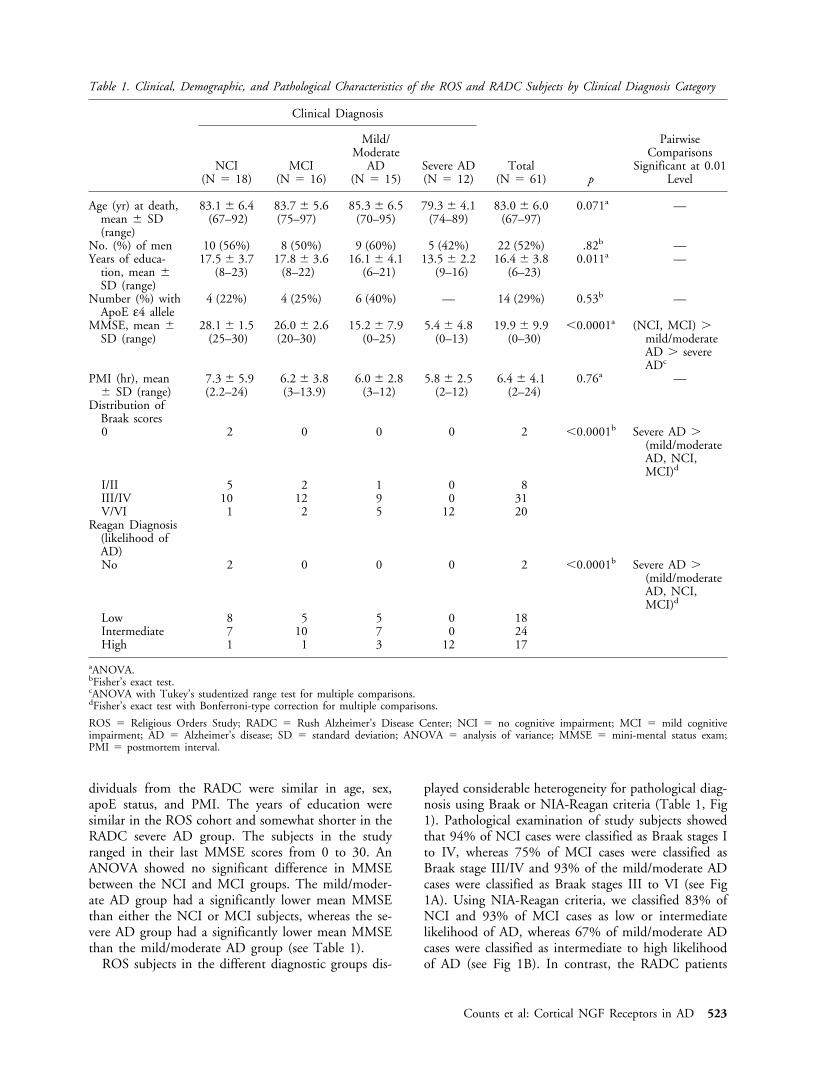
dividuals from the RADC were similar in age, sex,apoE status, and PMI. The years of education weresimilar in the ROS cohort and somewhat shorter in theRADC severe AD group. The subjects in the studyranged in their last MMSE scores from 0 to 30. AnANOVA showed no significant difference in MMSEbetween the NCI and MCI groups. The mild/moder-ate AD group had a significantly lower mean MMSEthan either the NCI or MCI subjects, whereas the se-vere AD group had a significantly lower mean MMSEthan the mild/moderate AD group (see Table 1).
ROS subjects in the different diagnostic groups dis-
played considerable heterogeneity for pathological diag-nosis using Braak or NIA-Reagan criteria (Table 1, Fig1). Pathological examination of study subjects showedthat 94% of NCI cases were classified as Braak stages Ito IV, whereas 75% of MCI cases were classified asBraak stage III/IV and 93% of the mild/moderate ADcases were classified as Braak stages III to VI (see Fig1A). Using NIA-Reagan criteria, we classified 83% ofNCI and 93% of MCI cases as low or intermediatelikelihood of AD, whereas 67% of mild/moderate ADcases were classified as intermediate to high likelihoodof AD (see Fig 1B). In contrast, the RADC patients
Table 1. Clinical, Demographic, and Pathological Characteristics of the ROS and RADC Subjects by Clinical Diagnosis Category
Clinical Diagnosis
Total(N � 61) p
PairwiseComparisons
Significant at 0.01Level
NCI(N � 18)
MCI(N � 16)
Mild/Moderate
AD(N � 15)
Severe AD(N � 12)
Age (yr) at death,mean � SD(range)
83.1 � 6.4(67–92)
83.7 � 5.6(75–97)
85.3 � 6.5(70–95)
79.3 � 4.1(74–89)
83.0 � 6.0(67–97)
0.071a —
No. (%) of men 10 (56%) 8 (50%) 9 (60%) 5 (42%) 22 (52%) .82b —Years of educa-
tion, mean �SD (range)
17.5 � 3.7(8–23)
17.8 � 3.6(8–22)
16.1 � 4.1(6–21)
13.5 � 2.2(9–16)
16.4 � 3.8(6–23)
0.011a —
Number (%) withApoE ε4 allele
4 (22%) 4 (25%) 6 (40%) — 14 (29%) 0.53b —
MMSE, mean �SD (range)
28.1 � 1.5(25–30)
26.0 � 2.6(20–30)
15.2 � 7.9(0–25)
5.4 � 4.8(0–13)
19.9 � 9.9(0–30)
�0.0001a (NCI, MCI) �mild/moderateAD � severeADc
PMI (hr), mean� SD (range)
7.3 � 5.9(2.2–24)
6.2 � 3.8(3–13.9)
6.0 � 2.8(3–12)
5.8 � 2.5(2–12)
6.4 � 4.1(2–24)
0.76a —
Distribution ofBraak scores0 2 0 0 0 2 �0.0001b Severe AD �
(mild/moderateAD, NCI,MCI)d
I/II 5 2 1 0 8III/IV 10 12 9 0 31V/VI 1 2 5 12 20
Reagan Diagnosis(likelihood ofAD)No 2 0 0 0 2 �0.0001b Severe AD �
(mild/moderateAD, NCI,MCI)d
Low 8 5 5 0 18Intermediate 7 10 7 0 24High 1 1 3 12 17
aANOVA.bFisher’s exact test.cANOVA with Tukey’s studentized range test for multiple comparisons.dFisher’s exact test with Bonferroni-type correction for multiple comparisons.
ROS � Religious Orders Study; RADC � Rush Alzheimer’s Disease Center; NCI � no cognitive impairment; MCI � mild cognitiveimpairment; AD � Alzheimer’s disease; SD � standard deviation; ANOVA � analysis of variance; MMSE � mini-mental status exam;PMI � postmortem interval.
Counts et al: Cortical NGF Receptors in AD 523
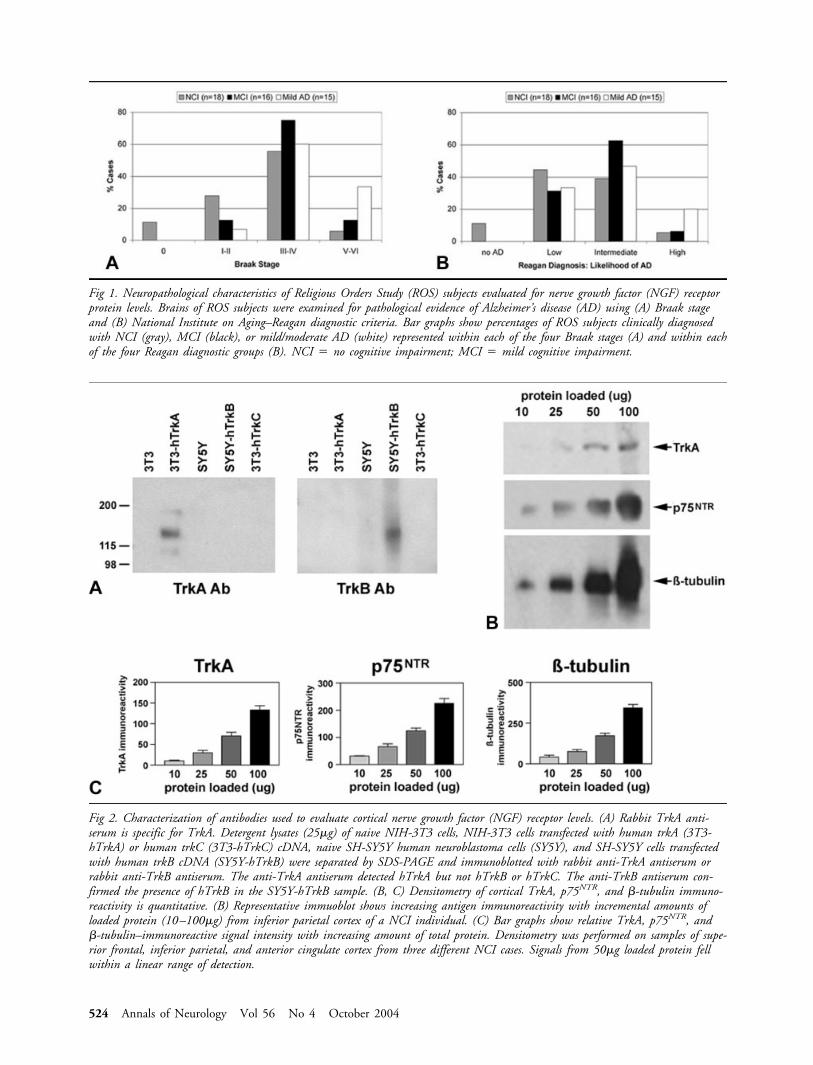
Fig 2. Characterization of antibodies used to evaluate cortical nerve growth factor (NGF) receptor levels. (A) Rabbit TrkA anti-serum is specific for TrkA. Detergent lysates (25�g) of naive NIH-3T3 cells, NIH-3T3 cells transfected with human trkA (3T3-hTrkA) or human trkC (3T3-hTrkC) cDNA, naive SH-SY5Y human neuroblastoma cells (SY5Y), and SH-SY5Y cells transfectedwith human trkB cDNA (SY5Y-hTrkB) were separated by SDS-PAGE and immunoblotted with rabbit anti-TrkA antiserum orrabbit anti-TrkB antiserum. The anti-TrkA antiserum detected hTrkA but not hTrkB or hTrkC. The anti-TrkB antiserum con-firmed the presence of hTrkB in the SY5Y-hTrkB sample. (B, C) Densitometry of cortical TrkA, p75NTR, and �-tubulin immuno-reactivity is quantitative. (B) Representative immuoblot shows increasing antigen immunoreactivity with incremental amounts ofloaded protein (10–100�g) from inferior parietal cortex of a NCI individual. (C) Bar graphs show relative TrkA, p75NTR, and�-tubulin–immunoreactive signal intensity with increasing amount of total protein. Densitometry was performed on samples of supe-rior frontal, inferior parietal, and anterior cingulate cortex from three different NCI cases. Signals from 50�g loaded protein fellwithin a linear range of detection.
Fig 1. Neuropathological characteristics of Religious Orders Study (ROS) subjects evaluated for nerve growth factor (NGF) receptorprotein levels. Brains of ROS subjects were examined for pathological evidence of Alzheimer’s disease (AD) using (A) Braak stageand (B) National Institute on Aging–Reagan diagnostic criteria. Bar graphs show percentages of ROS subjects clinically diagnosedwith NCI (gray), MCI (black), or mild/moderate AD (white) represented within each of the four Braak stages (A) and within eachof the four Reagan diagnostic groups (B). NCI � no cognitive impairment; MCI � mild cognitive impairment.
524 Annals of Neurology Vol 56 No 4 October 2004
clinically diagnosed with severe AD were classified asBraak stage V/VI and high likelihood of AD (see Ta-ble 1).
Antibody CharacterizationSpecificity of the rabbit polyclonal TrkA antiserumused in this study was determined by immunoblottingdetergent lysates of naive NIH-3T3 cells, NIH-3T3cells transfected with human trkA (3T3-hTrkA) ortrkC cDNA (3T3-hTrkC), naive SH-SY5Y cells, andSH-SY5Y cells stably transfected with human trkBcDNA (SY5Y-hTrkB) (Fig 2). The TrkA antibody de-tected an immunoreactive band migrating at approxi-mately 140kDa only in the 3T3-hTrkA lysates (see Fig2A, left panel). The presence of TrkB protein in theSY5Y-hTrkB lysates was confirmed by stripping andreprobing the blot with TrkB antiserum (see Fig 2A,right panel). TrkC antiserum confirmed the presenceof this protein in the 3T3-hTrkC lysates.
To ensure that densitometric measurements ofTrkA, p75NTR, and �-tubulin–immunoreactive signalson the blots were quantitative, we immunoblotted se-rial dilutions of cortical lysates with the TrkA, p75NTR,or �-tubulin antibodies to create a standard curve foreach antigen (see Fig 2B). Quantitative analysis dem-onstrated that the immunoreactive signal for each an-tigen fell along a linear range of detection when 50�gof total protein was loaded (see Fig 2C).
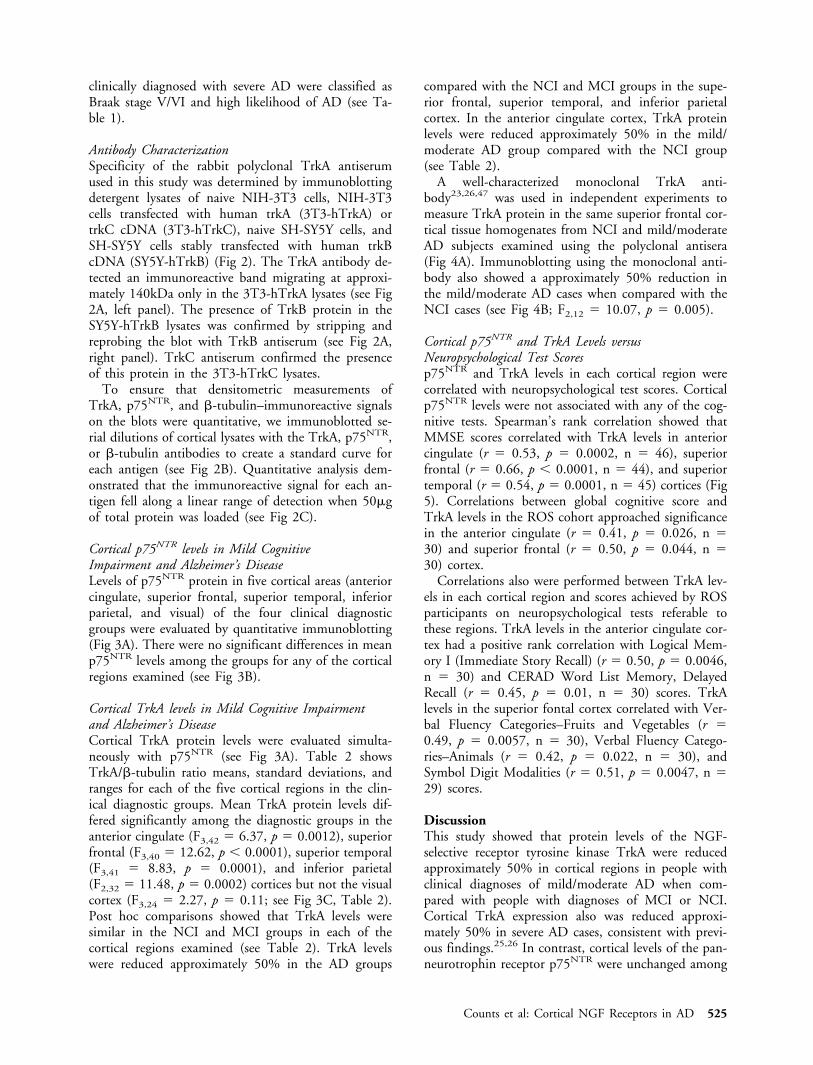
Cortical p75NTR levels in Mild CognitiveImpairment and Alzheimer’s DiseaseLevels of p75NTR protein in five cortical areas (anteriorcingulate, superior frontal, superior temporal, inferiorparietal, and visual) of the four clinical diagnosticgroups were evaluated by quantitative immunoblotting(Fig 3A). There were no significant differences in meanp75NTR levels among the groups for any of the corticalregions examined (see Fig 3B).
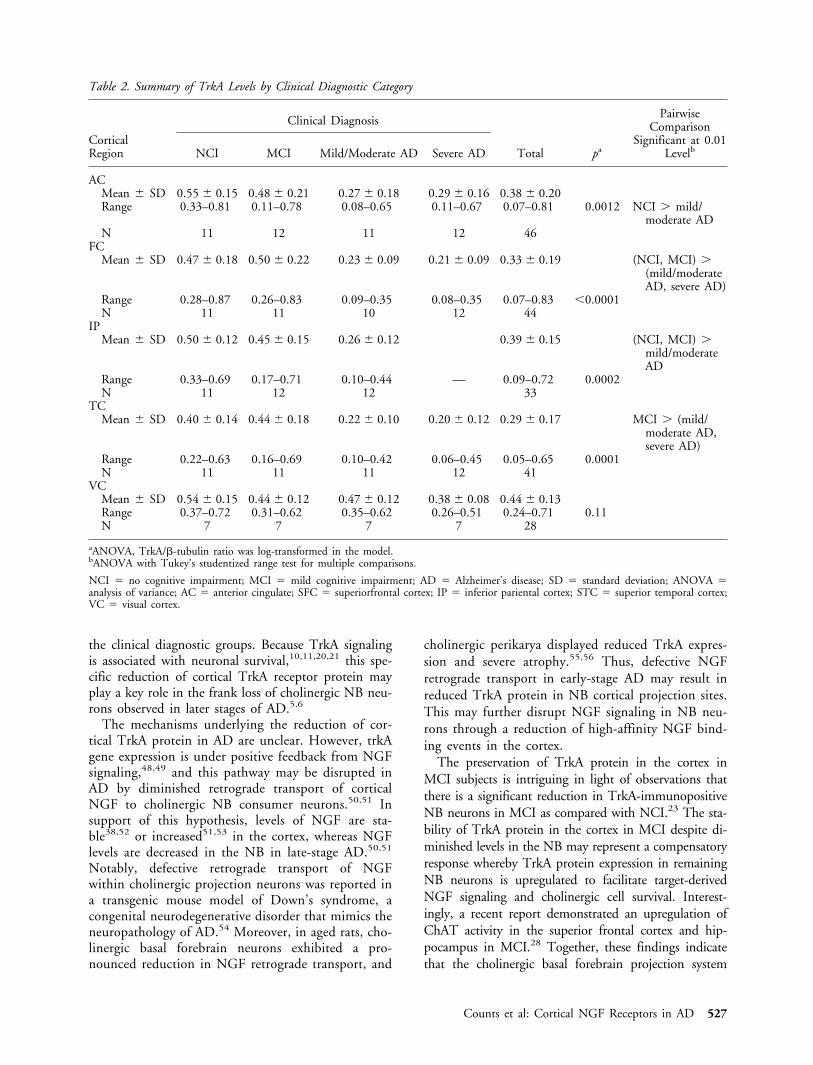
Cortical TrkA levels in Mild Cognitive Impairmentand Alzheimer’s DiseaseCortical TrkA protein levels were evaluated simulta-neously with p75NTR (see Fig 3A). Table 2 showsTrkA/�-tubulin ratio means, standard deviations, andranges for each of the five cortical regions in the clin-ical diagnostic groups. Mean TrkA protein levels dif-fered significantly among the diagnostic groups in theanterior cingulate (F3,42 � 6.37, p � 0.0012), superiorfrontal (F3,40 � 12.62, p � 0.0001), superior temporal(F3,41 � 8.83, p � 0.0001), and inferior parietal(F2,32 � 11.48, p � 0.0002) cortices but not the visualcortex (F3,24 � 2.27, p � 0.11; see Fig 3C, Table 2).Post hoc comparisons showed that TrkA levels weresimilar in the NCI and MCI groups in each of thecortical regions examined (see Table 2). TrkA levelswere reduced approximately 50% in the AD groups
compared with the NCI and MCI groups in the supe-rior frontal, superior temporal, and inferior parietalcortex. In the anterior cingulate cortex, TrkA proteinlevels were reduced approximately 50% in the mild/moderate AD group compared with the NCI group(see Table 2).
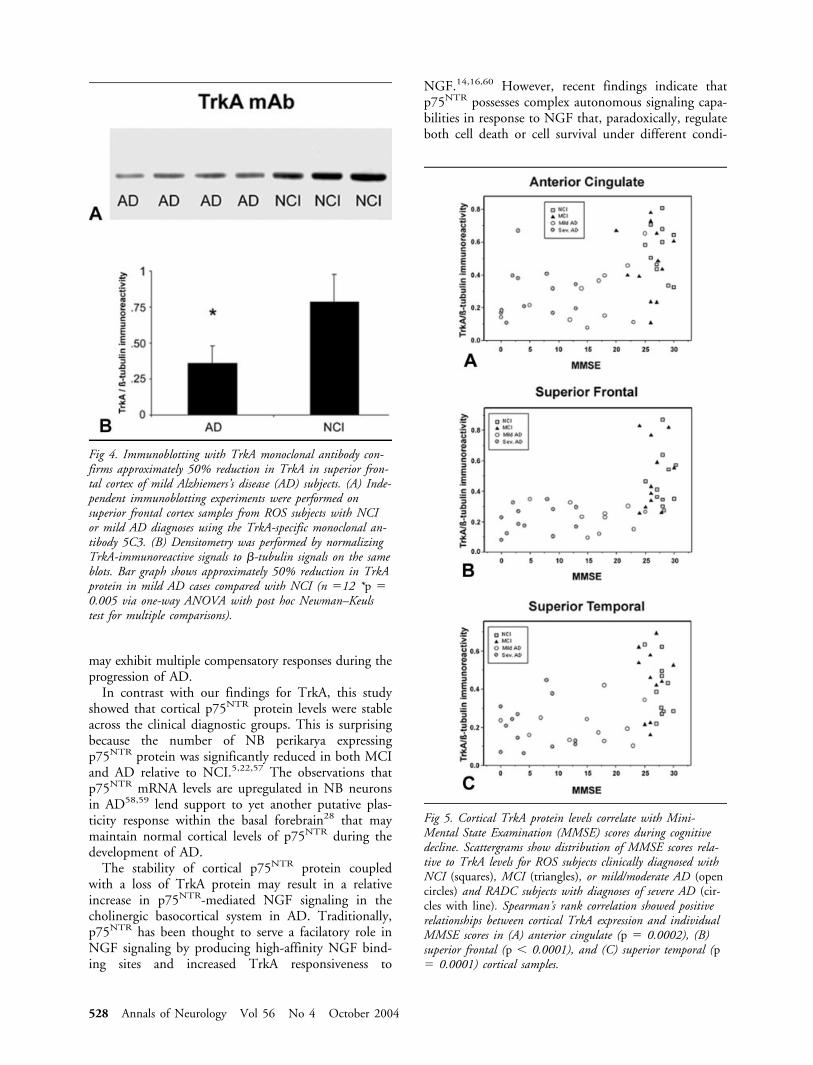
A well-characterized monoclonal TrkA anti-body23,26,47 was used in independent experiments tomeasure TrkA protein in the same superior frontal cor-tical tissue homogenates from NCI and mild/moderateAD subjects examined using the polyclonal antisera(Fig 4A). Immunoblotting using the monoclonal anti-body also showed a approximately 50% reduction inthe mild/moderate AD cases when compared with theNCI cases (see Fig 4B; F2,12 � 10.07, p � 0.005).
Cortical p75NTR and TrkA Levels versusNeuropsychological Test Scoresp75NTR and TrkA levels in each cortical region werecorrelated with neuropsychological test scores. Corticalp75NTR levels were not associated with any of the cog-nitive tests. Spearman’s rank correlation showed thatMMSE scores correlated with TrkA levels in anteriorcingulate (r � 0.53, p � 0.0002, n � 46), superiorfrontal (r � 0.66, p � 0.0001, n � 44), and superiortemporal (r � 0.54, p � 0.0001, n � 45) cortices (Fig5). Correlations between global cognitive score andTrkA levels in the ROS cohort approached significancein the anterior cingulate (r � 0.41, p � 0.026, n �30) and superior frontal (r � 0.50, p � 0.044, n �30) cortex.
Correlations also were performed between TrkA lev-els in each cortical region and scores achieved by ROSparticipants on neuropsychological tests referable tothese regions. TrkA levels in the anterior cingulate cor-tex had a positive rank correlation with Logical Mem-ory I (Immediate Story Recall) (r � 0.50, p � 0.0046,n � 30) and CERAD Word List Memory, DelayedRecall (r � 0.45, p � 0.01, n � 30) scores. TrkAlevels in the superior fontal cortex correlated with Ver-bal Fluency Categories–Fruits and Vegetables (r �0.49, p � 0.0057, n � 30), Verbal Fluency Catego-ries–Animals (r � 0.42, p � 0.022, n � 30), andSymbol Digit Modalities (r � 0.51, p � 0.0047, n �29) scores.
DiscussionThis study showed that protein levels of the NGF-selective receptor tyrosine kinase TrkA were reducedapproximately 50% in cortical regions in people withclinical diagnoses of mild/moderate AD when com-pared with people with diagnoses of MCI or NCI.Cortical TrkA expression also was reduced approxi-mately 50% in severe AD cases, consistent with previ-ous findings.25,26 In contrast, cortical levels of the pan-neurotrophin receptor p75NTR were unchanged among
Counts et al: Cortical NGF Receptors in AD 525
Fig 3. Cortical levels of TrkA but not p75NTR are reduced approximately 50% in subjects clinically diagnosed with mild or severeAlzheimer’s disease (AD). (A) Representative immunoblots of detergent lysates (50�g) from superior frontal (top), superior temporal(middle), or visual (bottom) cortex were separated by SDS-PAGE and immunoblotted for TrkA, p75NTR, and �-tubulin. (B) Cor-tical levels of p75NTR protein are unchanged across clinical diagnosis. Densitometry was performed by normalizing TrkA- orp75NTR-immunoreactive signals to �-tubulin signals on the same blots. Box plots show relative p75NTR protein levels in each corti-cal area examined for no cognitive impairment (NCI), mild cognitive impairment (MCI), mild AD, and severe AD cases. (C)Cortical levels of TrkA were reduced approximately 50% in anterior cingulate, superior frontal, superior temporal, and inferiorparietal cortex in mild AD subjects compared with subjects diagnosed with NCI or MCI (p � 0.01 via one-way analysis of vari-ance with post hoc Tukey’s studentized range test for multiple comparisons; see Table 2).
526 Annals of Neurology Vol 56 No 4 October 2004
the clinical diagnostic groups. Because TrkA signalingis associated with neuronal survival,10,11,20,21 this spe-cific reduction of cortical TrkA receptor protein mayplay a key role in the frank loss of cholinergic NB neu-rons observed in later stages of AD.5,6
The mechanisms underlying the reduction of cor-tical TrkA protein in AD are unclear. However, trkAgene expression is under positive feedback from NGFsignaling,48,49 and this pathway may be disrupted inAD by diminished retrograde transport of corticalNGF to cholinergic NB consumer neurons.50,51 Insupport of this hypothesis, levels of NGF are sta-ble38,52 or increased51,53 in the cortex, whereas NGFlevels are decreased in the NB in late-stage AD.50,51
Notably, defective retrograde transport of NGFwithin cholinergic projection neurons was reported ina transgenic mouse model of Down’s syndrome, acongenital neurodegenerative disorder that mimics theneuropathology of AD.54 Moreover, in aged rats, cho-linergic basal forebrain neurons exhibited a pro-nounced reduction in NGF retrograde transport, and
cholinergic perikarya displayed reduced TrkA expres-sion and severe atrophy.55,56 Thus, defective NGFretrograde transport in early-stage AD may result inreduced TrkA protein in NB cortical projection sites.This may further disrupt NGF signaling in NB neu-rons through a reduction of high-affinity NGF bind-ing events in the cortex.
The preservation of TrkA protein in the cortex inMCI subjects is intriguing in light of observations thatthere is a significant reduction in TrkA-immunopositiveNB neurons in MCI as compared with NCI.23 The sta-bility of TrkA protein in the cortex in MCI despite di-minished levels in the NB may represent a compensatoryresponse whereby TrkA protein expression in remainingNB neurons is upregulated to facilitate target-derivedNGF signaling and cholinergic cell survival. Interest-ingly, a recent report demonstrated an upregulation ofChAT activity in the superior frontal cortex and hip-pocampus in MCI.28 Together, these findings indicatethat the cholinergic basal forebrain projection system
Table 2. Summary of TrkA Levels by Clinical Diagnostic Category
CorticalRegion
Clinical Diagnosis
Total pa
PairwiseComparison
Significant at 0.01LevelbNCI MCI Mild/Moderate AD Severe AD
ACMean � SD 0.55 � 0.15 0.48 � 0.21 0.27 � 0.18 0.29 � 0.16 0.38 � 0.20Range 0.33–0.81 0.11–0.78 0.08–0.65 0.11–0.67 0.07–0.81 0.0012 NCI � mild/
moderate ADN 11 12 11 12 46
FCMean � SD 0.47 � 0.18 0.50 � 0.22 0.23 � 0.09 0.21 � 0.09 0.33 � 0.19 (NCI, MCI) �
(mild/moderateAD, severe AD)
Range 0.28–0.87 0.26–0.83 0.09–0.35 0.08–0.35 0.07–0.83 �0.0001N 11 11 10 12 44
IPMean � SD 0.50 � 0.12 0.45 � 0.15 0.26 � 0.12 0.39 � 0.15 (NCI, MCI) �
mild/moderateAD
Range 0.33–0.69 0.17–0.71 0.10–0.44 — 0.09–0.72 0.0002N 11 12 12 33
TCMean � SD 0.40 � 0.14 0.44 � 0.18 0.22 � 0.10 0.20 � 0.12 0.29 � 0.17 MCI � (mild/
moderate AD,severe AD)
Range 0.22–0.63 0.16–0.69 0.10–0.42 0.06–0.45 0.05–0.65 0.0001N 11 11 11 12 41
VCMean � SD 0.54 � 0.15 0.44 � 0.12 0.47 � 0.12 0.38 � 0.08 0.44 � 0.13Range 0.37–0.72 0.31–0.62 0.35–0.62 0.26–0.51 0.24–0.71 0.11N 7 7 7 7 28
aANOVA, TrkA/�-tubulin ratio was log-transformed in the model.bANOVA with Tukey’s studentized range test for multiple comparisons.
NCI � no cognitive impairment; MCI � mild cognitive impairment; AD � Alzheimer’s disease; SD � standard deviation; ANOVA �analysis of variance; AC � anterior cingulate; SFC � superiorfrontal cortex; IP � inferior pariental cortex; STC � superior temporal cortex;VC � visual cortex.
Counts et al: Cortical NGF Receptors in AD 527
may exhibit multiple compensatory responses during theprogression of AD.
In contrast with our findings for TrkA, this studyshowed that cortical p75NTR protein levels were stableacross the clinical diagnostic groups. This is surprisingbecause the number of NB perikarya expressingp75NTR protein was significantly reduced in both MCIand AD relative to NCI.5,22,57 The observations thatp75NTR mRNA levels are upregulated in NB neuronsin AD58,59 lend support to yet another putative plas-ticity response within the basal forebrain28 that maymaintain normal cortical levels of p75NTR during thedevelopment of AD.
The stability of cortical p75NTR protein coupledwith a loss of TrkA protein may result in a relativeincrease in p75NTR-mediated NGF signaling in thecholinergic basocortical system in AD. Traditionally,p75NTR has been thought to serve a facilatory role inNGF signaling by producing high-affinity NGF bind-ing sites and increased TrkA responsiveness to
NGF.14,16,60 However, recent findings indicate thatp75NTR possesses complex autonomous signaling capa-bilities in response to NGF that, paradoxically, regulateboth cell death or cell survival under different condi-
Fig 4. Immunoblotting with TrkA monoclonal antibody con-firms approximately 50% reduction in TrkA in superior fron-tal cortex of mild Alzhiemers’s disease (AD) subjects. (A) Inde-pendent immunoblotting experiments were performed onsuperior frontal cortex samples from ROS subjects with NCIor mild AD diagnoses using the TrkA-specific monoclonal an-tibody 5C3. (B) Densitometry was performed by normalizingTrkA-immunoreactive signals to �-tubulin signals on the sameblots. Bar graph shows approximately 50% reduction in TrkAprotein in mild AD cases compared with NCI (n �12 *p �0.005 via one-way ANOVA with post hoc Newman–Keulstest for multiple comparisons).
Fig 5. Cortical TrkA protein levels correlate with Mini-Mental State Examination (MMSE) scores during cognitivedecline. Scattergrams show distribution of MMSE scores rela-tive to TrkA levels for ROS subjects clinically diagnosed withNCI (squares), MCI (triangles), or mild/moderate AD (opencircles) and RADC subjects with diagnoses of severe AD (cir-cles with line). Spearman’s rank correlation showed positiverelationships between cortical TrkA expression and individualMMSE scores in (A) anterior cingulate (p � 0.0002), (B)superior frontal (p � 0.0001), and (C) superior temporal (p� 0.0001) cortical samples.
528 Annals of Neurology Vol 56 No 4 October 2004
tions. Significantly, NGF stimulation of p75NTR in theabsence of TrkA induces apoptosis in neurons61–63 andmature oligodendrocytes.64,65 These observations sug-gest that reduced cortical TrkA is permissive top75NTR-mediated signaling related to cell death in ADand may contribute to the selective vulnerability ofcholinergic NB neurons during disease progression.
Recent studies suggest that the physiological conse-quences of TrkA and p75NTR signaling may depend ontheir interactions with the NGF precursor protein,proNGF. ProNGF appears to be the predominant formof NGF present in the cortex of aged intact humans andproNGF levels increase up to twofold in the cortex ofsubjects diagnosed with MCI or AD.66,67 Curiously,separate studies demonstrated that recombinant cleavage-resistant proNGF elicits both neurotrophic and apopto-tic activities. For example, proNGF was shown to bindTrkA with high affinity and promoted the survival ofsensory neurons and neurite outgrowth of sympatheticneurons and PC12 cells.68,69 On the other hand, an-other form of recombinant proNGF that binds top75NTR with high affinity promoted apoptosis in sym-pathetic neurons.70 Therefore, elucidating the outcomeof proNGF signaling through TrkA and p75NTR recep-tors will be critical for determining the effects of in-creased proNGF signaling on the cholinergic basocorti-cal system during the progression of AD.
This study showed a positive correlation betweendecreasing cortical TrkA levels and lower cognitivetest scores in the clinical cohorts examined. In partic-ular, we found strong relationships between theamount of TrkA protein in anterior cingulate, supe-rior frontal, and superior temporal cortices and indi-vidual MMSE scores. These findings suggest that re-duced TrkA may perturb NB function resulting inimpairments in cognitive domains during early stagesof the disease. Interestingly, studies in nonhuman pri-mates indicate that restoration of NGF signaling mayprove efficacious for the prevention of cholinotrophicdysfunction in AD,9,71,72 and a phase I clinical trial isunder way wherein autologous fibroblasts geneticallymodified to secrete human NGF are grafted directlyinto the region of the NB in patients with mildAD.73 This therapeutic strategy may bypass putativedefects in retrograde transport and may even restoreTrkA protein expression in the brains of patients withAD. In addition, the ongoing development of TrkA-specific peptidomimetics has provided the ground-work for another potential approach to improvingNGF signaling during the prodromal stages ofAD.74 –76 Most recently, we have demonstrated the invivo efficacy of a selective, partial agonist of TrkA incognitively impaired aged rats.77 Intraventricular in-fusion of this peptidomimetic resulted in long-lastingcognitive improvement in spatial memory tasks, sig-nificantly higher density of cortical VAChT-positive
fiber staining, and increased cell size of VAChT-positive soma in the NB of the rodent.77 These datasuggest that partial activation of TrkA can upregulatethe cholinergic phenotype of the basocortical projec-tion system and improve cognition in the absence ofp75NTR activation.
In summary, we report that the transition from MCIto AD is characterized by a selective reduction of cor-tical TrkA protein but stable expression of corticalp75NTR. Whether TrkA reductions are a primary eventin the pathogenesis of AD or a secondary response toother pathological changes remains unknown. How-ever, the NGF receptor imbalance reported in thisstudy may have deleterious effects on cholinergic basalforebrain function because of deficits in TrkA-mediated and/or alterations in proapoptotic p75NTR-mediated NGF signaling. The correlation between cor-tical TrkA levels and MMSE scores suggest thatcholinotrophic abnormalities may play a key role incognitive impairment during early stages of AD.
This was supported by grants from the NIH (National Institute onAging, AG09466, AG10161, AG00257, E.J.M.; AG14449,AG10668, E.J.M., S.D.G.; National Institute of Neurological Dis-orders and Stroke, NS43939, S.D.G.; National Cancer Institute,CA94520, S.D.G.); the Alzheimer’s Associations (S.D.G.); the Ca-nadian Institutes of Health Research (MOP13265, H.U.S.) and theIllinois Department of Public Health (S.E.C.).
We are indebted to the altruism and support of the hundreds ofnuns, priests, and brothers participating in the Religious OrdersStudy. A list of participating groups can be found at the Web site:http://www.rush.edu/rumc/page-R12394.html. We also are in-debted to the dedication of Dr D. A. Bennett, and Dr E. J. Coch-ran for clinical and pathological evaluations, and to T. Colvin, B.Howard, G. Klein and W. Fan for data retrieval.
References1. Mesulam MM, Mufson EJ, Levey AI, Wainer BH. Cholinergic
innervation of cortex by the basal forebrain: cytochemistry andcortical connections of the septal area, diagonal band nuclei,nucleus basalis (substantia innominata), and hypothalamus inthe rhesus monkey. J Comp Neurol 1983;214:170–197.
2. Bartus RT. On neurodegenerative diseases, models, and treat-ment strategies: lessons learned and lessons forgotten a genera-tion following the cholinergic hypothesis. Exp Neurol 2000;163:495–529.
3. Coyle JT, Price DL, DeLong MR. Alzheimer’s disease: a disor-der of cortical cholinergic innervation. Science 1983;219:1184–1190.
4. DeKosky ST, Harbaugh RE, Schmitt FA, et al. Cortical biopsyin Alzheimer’s disease: diagnostic accuracy and neurochemical,neuropathological, and cognitive correlations. IntraventricularBethanecol Study Group. Ann Neurol 1992;32:625–632.
5. Mufson EJ, Bothwell M, Kordower JH. Loss of nerve growthfactor receptor-containing neurons in Alzheimer’s disease: aquantitative analysis across subregions of the basal forebrain.Exp Neurol 1989;105:221–232.
6. Whitehouse PJ, Price DL, Clark AW, et al. Alzheimer disease:evidence for selective loss of cholinergic neurons in the nucleusbasalis. Ann Neurol 1981;10:122–126.
Counts et al: Cortical NGF Receptors in AD 529
7. Humpel C, Weis C. Nerve growth factor and cholinergic CNSneurons studied in organotypic brain slices. Implication in Alz-heimer’s disease? J Neural Transm Suppl 2002:253–263.
8. Hatanaka H, Nihonmatsu I, Tsukui H. Nerve growth factorpromotes survival of cultured magnocellular cholinergic neuronsfrom nucleus basalis of Meynert in postnatal rats. Neurosci Lett1988;90:63–68.
9. Burgos I, Cuello AC, Liberini P, et al. NGF-mediated synapticsprouting in the cerebral cortex of lesioned primate brain. BrainRes 1995;692:154–160.
10. Lad SP, Neet KE, Mufson EJ. Nerve growth factor: structure,function and therapeutic implications for Alzheimer’s disease.Curr Drug Target CNS Neurol Disord 2003;2:315–334.
11. Kaplan DR, Miller FD. Signal transduction by the neurotro-phin receptors. Curr Opin Cell Biol 1997;9:213–221.
12. Sobreviela T, Clary DO, Reichardt LF, et al. TrkA-immunoreactive profiles in the central nervous system: colocal-ization with neurons containing p75 nerve growth factor recep-tor, choline acetyltransferase, and serotonin. J Comp Neurol1994;350:587–611.
13. Chao MV, Bothwell MA, Ross AH, et al. Gene transfer andmolecular cloning of the human NGF receptor. Science 1986;232:518–521.
14. Mahadeo D, Kaplan L, Chao MV, Hempstead BL. High affin-ity nerve growth factor binding displays a faster rate of associ-ation than p140trk binding. Implications for multi-subunitpolypeptide receptors. J Biol Chem 1994;269:6884–6891.
15. Roux PP, Barker PA. Neurotrophin signaling through the p75neurotrophin receptor. Prog Neurobiol 2002;67:203–233.
16. Hempstead BL, Martin-Zanca D, Kaplan DR, et al. High-affinity NGF binding requires coexpression of the trk proto-oncogene and the low-affinity NGF receptor. Nature 1991;350:678–683.
17. Delcroix JD, Valletta JS, Wu C, et al. NGF signaling in sensoryneurons: evidence that early endosomes carry NGF retrogradesignals. Neuron 2003;39:69–84.
18. Grimes ML, Zhou J, Beattie EC, et al. Endocytosis of activatedTrkA: evidence that nerve growth factor induces formation ofsignaling endosomes. J Neurosci 1996;16:7950–7964
19. Ye H, Kuruvilla R, Zweifel LS, Ginty DD. Evidence in supportof signaling endosome-based retrograde survival of sympatheticneurons. Neuron 2003;39:57–68.
20. Klesse LJ, Parada LF. Trks: signal transduction and intracellularpathways. Microsc Res Tech 1999;45:210–216.
21. Sofroniew MV, Howe CL, Mobley WC. Nerve growth factorsignaling, neuroprotection, and neural repair. Annu Rev Neu-rosci 2001;24:1217–1281.
22. Mufson EJ, Ma SY, Dills J, et al. Loss of basal forebrainP75(NTR) immunoreactivity in subjects with mild cognitiveimpairment and Alzheimer’s disease. J Comp Neurol 2002;443:136–153.
23. Mufson EJ, Ma SY, Cochran EJ, et al. Loss of nucleus basalisneurons containing trkA immunoreactivity in individuals withmild cognitive impairment and early Alzheimer’s disease.J Comp Neurol 2000;427:19–30.
24. Gilmor ML, Erickson JD, Varoqui H, et al. Preservation ofnucleus basalis neurons containing choline acetyltransferase andthe vesicular acetylcholine transporter in the elderly with mildcognitive impairment and early Alzheimer’s disease. J CompNeurol 1999;411:693–704.
25. Hock C, Heese K, Muller-Spahn F, et al. Decreased trkA neu-rotrophin receptor expression in the parietal cortex of patientswith Alzheimer’s disease. Neurosci Lett 1998;241:151–154.
26. Mufson EJ, Lavine N, Jaffar S, et al. Reduction in p140-TrkAreceptor protein within the nucleus basalis and cortex in Alz-heimer’s disease. Exp Neurol 1997;146:91–103.
27. Bennett DA, Wilson RS, Schneider JA, et al. Natural history ofmild cognitive impairment in older persons. Neurology 2002;59:198–205.
28. DeKosky ST, Ikonomovic MD, Styren SD, et al. Upregulationof choline acetyltransferase activity in hippocampus and frontalcortex of elderly subjects with mild cognitive impairment. AnnNeurol 2002;51:145–155.
29. Kordower JH, Chu Y, Stebbins GT, et al. Loss and atrophy oflayer II entorhinal cortex neurons in elderly people with mildcognitive impairment. Ann Neurol 2001;49:202–213.
30. Goldstein LB, Samsa GP. Reliability of the National Institutesof Health Stroke Scale. Extension to non-neurologists in thecontext of a clinical trial. Stroke 1997;28:307–310.
31. Bennett DA, Shannon KM, Beckett LA, et al. Metric propertiesof nurses’ ratings of parkinsonian signs with a modified UnifiedParkinson’s Disease Rating Scale. Neurology 1997;49:1580–1587.
32. Pittman J, Andrews H, Tatemichi T, et al. Diagnosis of demen-tia in a heterogeneous population. A comparison of paradigm-based diagnosis and physician’s diagnosis. Arch Neurol 1992;49:461–467.
33. McKhann G, Drachman D, Folstein M, et al. Clinical diagno-sis of Alzheimer’s disease: report of the NINCDS-ADRDAWork Group under the auspices of Department of Health andHuman Services Task Force on Alzheimer’s Disease. Neurology1984;34:939–944.
34. Flicker C, Ferris SH, Reisberg B. Mild cognitive impairment inthe elderly: predictors of dementia. Neurology 1991;41:1006–1009.
35. Petersen RC, Smith GE, Waring SC, et al. Mild cognitiveimpairment: clinical characterization and outcome. Arch Neurol1999;56:303–308.
36. Rubin EH, Morris JC, Grant EA, Vendegna T. Very mild se-nile dementia of the Alzheimer type. I. Clinical assessment.Arch Neurol 1989;46:379–382.
37. Association AP. Diagnostic and Statistical Manual of MentalDisorders. Rev 3rd ed. Washington, DC: American PsychiatricAssociation, 1987.
38. Mufson EJ, Ikonomovic MD, Styren SD, et al. Preservation ofbrain nerve growth factor in mild cognitive impairment andAlzheimer disease. Arch Neurol 2003;60:1143–1148.
39. Mirra SS, Heyman A, McKeel D, et al. The Consortium toEstablish a Registry for Alzheimer’s Disease (CERAD). Part II.Standardization of the neuropathologic assessment of Alzhei-mer’s disease. Neurology 1991;41:479–486.
40. Braak H, Braak E. Neuropathological stageing of Alzheimer-related changes. Acta Neuropathol 1991;82:239–259.
41. The National Institute on Aging and Reagan Institute WorkingGroup on Diagnostic Criteria for the Neuropathological Assess-ment of Alzheimer’s Disease. Consensus recommendations forthe postmortem diagnosis of Alzheimer’s disease. Neurobiol Ag-ing 1997;18:S1–S2.
42. Nieto A, Montejo de Garcini E, Avila J. Altered levels of mi-crotubule proteins in brains of Alzheimer’s disease patients.Acta Neuropathol (Berl) 1989;78:47–51.
43. Sze CI, Bi H, Kleinschmidt-DeMasters BK, et al. Selective re-gional loss of exocytotic presynaptic vesicle proteins in Alzhei-mer’s disease brains. J Neurol Sci 2000;175:81–90.
44. Lee HB, Zaccaro MC, Pattarawaparan M, et al. Syntheses andActivities of new C10 ß-turn peptidomimetrics. J Org Chem2004;69:701–713.
45. Ho R, Eggert A, Hishiki T, et al. Resistance to chemotherapymediated by TrkB in neuroblastomas. Cancer Res 2002;62:6462–6466.
46. Fryer RH, Kaplan DR, Feinstein SC, et al. Developmental andmature expression of full-length and truncated TrkB receptorsin the rat forebrain. J Comp Neurol 1996;374:21–40.
530 Annals of Neurology Vol 56 No 4 October 2004
47. LeSauteur L, Maliartchouk S, Le Jeune H, et al. Potent humanp140-TrkA agonists derived from an anti-receptor monoclonalantibody. J Neurosci 1996;16:1308–1316.
48. Holtzman DM, Li Y, Parada LF, et al. p140trk mRNA marksNGF-responsive forebrain neurons: evidence that trk gene ex-pression is induced by NGF. Neuron 1992;9:465–478.
49. Li Y, Holtzman DM, Kromer LF, et al. Regulation of TrkAand ChAT expression in developing rat basal forebrain: evi-dence that both exogenous and endogenous NGF regulate dif-ferentiation of cholinergic neurons. J Neurosci 1995;15:2888–2905.
50. Mufson EJ, Conner JM, Kordower JH. Nerve growth factor inAlzheimer’s disease: defective retrograde transport to nucleusbasalis. Neuroreport 1995;6:1063–1066.
51. Scott SA, Mufson EJ, Weingartner JA, et al. Nerve growth fac-tor in Alzheimer’s disease: increased levels throughout the braincoupled with declines in nucleus basalis. J Neurosci 1995;15:6213–6221.
52. Allen SJ, MacGowan SH, Treanor JJ, et al. Normal beta-NGFcontent in Alzheimer’s disease cerebral cortex and hippocam-pus. Neurosci Lett 1991;131:135–139.
53. Crutcher KA, Scott SA, Liang S, et al. Detection of NGF-likeactivity in human brain tissue: increased levels in Alzheimer’sdisease. J Neurosci 1993;13:2540–2550.
54. Cooper JD, Salehi A, Delcroix JD, et al. Failed retrogradetransport of NGF in a mouse model of Down’s syndrome: re-versal of cholinergic neurodegenerative phenotypes followingNGF infusion. Proc Natl Acad Sci USA 2001;98:10439–10444.
55. De Lacalle S, Cooper JD, Svendsen CN, et al. Reduced retro-grade labelling with fluorescent tracer accompanies neuronal at-rophy of basal forebrain cholinergic neurons in aged rats. Neu-roscience 1996;75:19–27.
56. Cooper JD, Lindholm D, Sofroniew MV. Reduced transport of[125I]nerve growth factor by cholinergic neurons and down-regulated TrkA expression in the medial septum of aged rats.Neuroscience 1994;62:625–629.
57. Salehi A, Ocampo M, Verhaagen J, Swaab DF. P75 neurotro-phin receptor in the nucleus basalis of meynert in relation toage, sex, and Alzheimer’s disease. Exp Neurol 2000;161:245–258.
58. Ernfors P, Lindefors N, Chan-Palay V, Persson H. Cholinergicneurons of the nucleus basalis express elevated levels of nervegrowth factor receptor mRNA in senile dementia of the Alzhei-mer’s type. Dementia 1990;1:138–145.
59. Mufson EJ, Li JM, Sobreviela T, Kordower JH. Decreased trkAgene expression within basal forebrain neurons in Alzheimer’sdisease. Neuroreport 1996;8:25–29.
60. Barker PA, Shooter EM. Disruption of NGF binding to thelow affinity neurotrophin receptor p75LNTR reduces NGFbinding to TrkA on PC12 cells. Neuron 1994;13:203–215.
61. Bamji SX, Majdan M, Pozniak CD, et al. The p75 neurotro-phin receptor mediates neuronal apoptosis and is essential fornaturally occurring sympathetic neuron death. J Cell Biol 1998;140:911–923.
62. Friedman WJ. Neurotrophins induce death of hippocampalneurons via the p75 receptor. J Neurosci 2000;20:6340–6346
63. Frade JM, Rodriguez-Tebar A, Barde YA. Induction of celldeath by endogenous nerve growth factor through its p75 re-ceptor. Nature 1996;383:166–168.
64. Yoon SO, Casaccia-Bonnefil P, Carter B, Chao MV. Com-petitive signaling between TrkA and p75 nerve growth factorreceptors determines cell survival. J Neurosci 1998;18:3273–3281.
65. Casaccia-Bonnefil P, Carter BD, Dobrowsky RT, Chao MV.Death of oligodendrocytes mediated by the interaction of nervegrowth factor with its receptor p75. Nature 1996;383:716–719.
66. Fahnestock M, Michalski B, Xu B, Coughlin MD. The precur-sor pro-nerve growth factor is the predominant form of nervegrowth factor in brain and is increased in Alzheimer’s disease.Mol Cell Neurosci 2001;18:210–220.
67. Peng S, Wuu J, Mufson EJ, Fahnestock M. IncreasedproNGF levels in subjects with mild cognitive impairmentand mild Alzheimer’s disease. J Neuropathol Exp Neurol2004;63:641– 649.
68. Fahnestock M, Yu G, Coughlin MD. ProNGF: a neurotrophicor an apoptotic molecule? Prog Brain Res 2004;146:107–110.
69. Rattenholl A, Lilie H, Grossmann A, et al. The pro-sequencefacilitates folding of human nerve growth factor from Esche-richia coli inclusion bodies. Eur J Biochem 2001;268:3296–3303.
70. Lee R, Kermani P, Teng KK, Hempstead BL. Regulation of cellsurvival by secreted proneurotrophins. Science 2001;294:1945–1948.
71. Conner JM, Darracq MA, Roberts J, Tuszynski MH. Non-tropic actions of neurotrophins: subcortical nerve growth factorgene delivery reverses age-related degeneration of primate corti-cal cholinergic innervation. Proc Natl Acad Sci USA 2001;98:1941–1946
72. Tuszynski MH, Sang H, Yoshida K, Gage FH. Recombinanthuman nerve growth factor infusions prevent cholinergic neu-ronal degeneration in the adult primate brain. Ann Neurol1991;30:625–636.
73. Tuszynski MH, Blesch A. Nerve growth factor: from animalmodels of cholinergic neuronal degeneration to gene therapy inAlzheimer’s disease. Prog Brain Res 2004;146:441–449.
74. Debeir T, Saragovi HU, Cuello AC. A nerve growth factor mi-metic TrkA antagonist causes withdrawal of cortical cholinergicboutons in the adult rat. Proc Natl Acad Sci USA 1999;96:4067–4072.
75. LeSauteur L, Wei L, Gibbs BF, Saragovi HU. Small peptidemimics of nerve growth factor bind TrkA receptors and affectbiological responses. J Biol Chem 1995;270:6564–6569.
76. Maliartchouk S, Feng Y, Ivanisevic L, et al. A designed pep-tidomimetic agonistic ligand of TrkA nerve growth factor re-ceptors. Mol Pharmacol 2000;57:385–391.
77. Bruno M, Seltzer A, Quirion R, et al. Long-lasting rescue ofaged-associated deficits in cognition and the CNS cholinergicphenotype by a partial agonist peptidomimetic ligand of TrkA.J Neurosci (in press).
Counts et al: Cortical NGF Receptors in AD 531