Reducing Nutrient Losses in Europe and Implications for Farming - In the Light of the Water...
10
20 - Campinas, SP - August/2005 15 th Congress - Developing Entrepreneurship Abilities to Feed the World in a Sustainable Way REDUCING NUTRIENT LOSSES IN EUROPE AND IMPLICATIONS FOR FARMING - IN THE LIGHT OF THE WATER FRAMEWORK DIRECTIVE Brian H. Jacobsen 1 Jens Abildtrup Jens Erik Ørum ABSTRACT An analysis for the implementation of the Nitrate Directive in the EU indicates that probably only three of 15 countries have implemented the directive satisfactorily. These countries are Sweden, Finland, Denmark and Austria, however other countries are in the process of getting their implementation accepted. As an example, the Netherlands has been forced to abandon the MINAS system in order to get its implementation accepted by the EU. The continues by describ- ing the costs related to implementation of the Aquatic Plan II in Denmark. The costs have been calculated to 70 million € or 2,0 € per kg N in reduced leaching. The farmers have paid 60% of the costs. The paper then describes the measures taken in Denmark and the associated costs for the state and the farmers. The next challenge for European farmers is the Water Framework Directive (WFD) with high environmental goals where only a slight deviation from the natural state is accepted. This might have a great affect on farming especially in livestock intensive countries and regions in Europe. The paper describes an example of a regional analysis covering the River Basin of Ringkøbing Fjord in Denmark, which indicates the calculations needed to find the measures and costs in order to comply with parts of the WFD. The analysis show that the geographical position of the measures are very important in order to achieve the expected nutri- ent reduction. The current income varies a lot in the River basin and this might also influence where to find the most cost effective location of measures. The WFD covers all water and the task of finding the most cost efficient combinations of measures to achieve the goals for streams, lakes, fjords and groundwater will clearly be a challenge. The paper concludes that exceptions from the WFD will have to be based on well founded cost-benefit analyses. Key words: Water Framework Directive, Reducing Nutrient losses, cost effective measures 1. INTRODUCTION The environmental regulation has a growing influence on the activities farmers are carry- ing out across Europe and in the rest of the world. The society today does not accept pollution and so the regulations are getting gradually tighter. The regulations are becoming wider and more complex as they involve e.g. leaching of nutrients (nitrogen and phosphorus), pesticides, emission of ammonia, emissions of CFC’s and smell. At the same time, regulations regarding animal welfare and protection of biodiversity in the farmland also affects the farming practices. Sometimes the regulations on one area support reductions in another area, but sometimes the aims are conflicting. This paper focuses on the measures related to reducing nutrient losses (primarily nitrogen) and the related costs. There is first a short discussion on the implementation of the Nitrate 1 Senior researcher at the Food and Resource Economics Institute in Copenhagen. Graduate from the Royal Veterinary and Agricultural University (RVAU) in Copenhagen. He has a M.Sc. from Reading University and a Ph.D. from RVAU. Current research deals with environmental economics and the costs of reducing N- and P-leaching, ammonia emission and emission of green house gases from agriculture. Lately, research has included the costs of handling animal manure using separation techniques and the cost of introducing new technologies in organic farming. He is currently involved in several projects related to analyses prior to the implementation of the Water Framework Directive in Denmark. Food and Resource Economics Institute, Denmark (e-mail [email protected])
Transcript of Reducing Nutrient Losses in Europe and Implications for Farming - In the Light of the Water...
20� - Campinas, SP - August/2005
15th Congress - Developing Entrepreneurship Abilities to Feed the World in a Sustainable Way
reducing nutrient losses in europe and iMplications for farMing - in the
light of the water fraMeworK directive
Brian H. Jacobsen1
Jens Abildtrup Jens Erik Ørum
aBstractAn analysis for the implementation of the Nitrate Directive in the EU indicates that probably
only three of 15 countries have implemented the directive satisfactorily. These countries are Sweden, Finland, Denmark and Austria, however other countries are in the process of getting their implementation accepted. As an example, the Netherlands has been forced to abandon the MINAS system in order to get its implementation accepted by the EU. The continues by describ-ing the costs related to implementation of the Aquatic Plan II in Denmark. The costs have been calculated to 70 million € or 2,0 € per kg N in reduced leaching. The farmers have paid 60% of the costs. The paper then describes the measures taken in Denmark and the associated costs for the state and the farmers. The next challenge for European farmers is the Water Framework Directive (WFD) with high environmental goals where only a slight deviation from the natural state is accepted. This might have a great affect on farming especially in livestock intensive countries and regions in Europe. The paper describes an example of a regional analysis covering the River Basin of Ringkøbing Fjord in Denmark, which indicates the calculations needed to find the measures and costs in order to comply with parts of the WFD. The analysis show that the geographical position of the measures are very important in order to achieve the expected nutri-ent reduction. The current income varies a lot in the River basin and this might also influence where to find the most cost effective location of measures. The WFD covers all water and the task of finding the most cost efficient combinations of measures to achieve the goals for streams, lakes, fjords and groundwater will clearly be a challenge. The paper concludes that exceptions from the WFD will have to be based on well founded cost-benefit analyses.
Key words: Water Framework Directive, Reducing Nutrient losses, cost effective measures
1. introduction The environmental regulation has a growing influence on the activities farmers are carry-
ing out across Europe and in the rest of the world. The society today does not accept pollution and so the regulations are getting gradually tighter. The regulations are becoming wider and more complex as they involve e.g. leaching of nutrients (nitrogen and phosphorus), pesticides, emission of ammonia, emissions of CFC’s and smell. At the same time, regulations regarding animal welfare and protection of biodiversity in the farmland also affects the farming practices. Sometimes the regulations on one area support reductions in another area, but sometimes the aims are conflicting.
This paper focuses on the measures related to reducing nutrient losses (primarily nitrogen) and the related costs. There is first a short discussion on the implementation of the Nitrate
1Senior researcher at the Food and Resource Economics Institute in Copenhagen. Graduate from the Royal Veterinary and Agricultural University (RVAU) in Copenhagen. He has a M.Sc. from Reading University and a Ph.D. from RVAU. Current research deals with environmental economics and the costs of reducing N- and P-leaching, ammonia emission and emission of green house gases from agriculture. Lately, research has included the costs of handling animal manure using separation techniques and the cost of introducing new technologies in organic farming. He is currently involved in several projects related to analyses prior to the implementation of the Water Framework Directive in Denmark. Food and Resource Economics Institute, Denmark (e-mail [email protected])
Campinas, SP - August/2005 - 20�
IFma 2005 - Brazil
Directive in Europe with focus on the implementation in the Netherlands and Denmark (sec-tion 2). As the future regulation will be more regionally based, the next section concerns the implementation of the Water Framework Directive using a regionally oriented analysis from the County of Ringkøbing in Denmark (section 3). The paper finishes with a short discussion of the future challenges with respect to the implementation of the WFD in Europe and the effects on farming (section 4).
2. the nitrate directive and iMpleMentation in europe
2.1. situation in the mid 1990’tiesThe Nitrate Directive (91/676/EEC) was adopted in 1991. The overall purpose was to pre-
vent and reduce nitrate pollution of the aquatic environment. The intentions regarding imple-mentation in seven European Countries is described in Rude and Frederiksen (1994). The ac-tion plans should be implemented no later than 1999.
The EU reported in 2001 on the implementation of the Nitrate Directive in the 15 member states (EC, 2002). The report shows that the Nitrogen load in 1997 is highest in The Nether-lands (over 250 kg N pr. ha), followed by Denmark, Germany and Ireland (200-250 kg N per ha). The nitrogen load is the total load including atmospheric deposition, fixation, livestock ma-nure and mineral fertiliser. The countries mentioned also have the highest N surplus in the EU. For the 15 EU countries, the total use of mineral fertiliser is falling and the livestock numbers as well as the animals per farm are growing. The total nitrogen application is 18 million tons N for the 15 EU-countries of which 9-10 million tons N come from mineral fertiliser and 8-9 million tons N from animal manure (figures from 1997).
Looking at the progress in the 1990’ties, the development in the nitrogen losses to the water system is different in different regions:
• decrease in Finland and parts of France (south and east)• stability in Denmark and parts of Austria• contrasting results in the Netherlands, Greece and Germany• increases in North-West France, parts of Austria and the Southern part of Sweden. The share of the country which is defined as a nitrogen vulnerable zones (NVZ) (and cov-
ered by the directive) differs a lot from country to country. It is 100% in Finland, Denmark, Germany, The Netherlands and Austria, but less than 10% in Belgium, Ireland, Sweden, UK and most of the Mediterranean countries. For the latter countries, this is less than the EU recom-mendation. It is probably only the implementation in Denmark, Sweden, Finland and Austria which fulfil the requirements in the Nitrate directive. For the other countries analyses are under way and they might end with an acceptance of the implementation, but the commission have started court procedures against a number of the “old” 15 EU countries.
2.2. current perspectives in the uK and the netherlands In a forthcoming OECD report a comparison between United Kingdom, The Netherlands
and Denmark is made with respect to instrument mixes used for environmental policies (OECD, 2005). It also describes the recent changes in legislation in England and the Netherlands to fulfil the Nitrate Directive.
It is noted that England will increase its area with NVZ from 8 to 47% of the total agricultural area in England (not the United Kingdom). The manure application will after 4 years (in 2006) be restricted to 170 kg N per ha. This increase in the NVZ-area is not expected to cause major
210 - Campinas, SP - August/2005
15th Congress - Developing Entrepreneurship Abilities to Feed the World in a Sustainable Way
changes in the farming practices and the environmental consequences will therefore probably be small. The implementation is not followed by subsidies or compensation (OECD, 2005). In general the discussion in the UK related to the WFD is more focused on phosphorus losses than nitrogen although the nitrate concentration in the groundwater is increasing (RPA, 2003).
The Dutch introduced the MINAS system in 1998 following other strategies to reduce nitro-gen losses (Jacobsen, 2002 and OECD, 2005). The N-leaching and ammonia losses were very high and so new measures were needed. The staring point of N-surplus of roughly 300 kg N pr. ha in the mid 1980’ties was very high. MINAS is N-surplus accounting system where surplus over a certain level is taxed. The levy free Nitrogen surplus has been reduced from 300 kg N pr. ha in 1998 to 140 kg N per ha for grassland on sandy soil over the past 10 years. For phosphate, the levy free limit has been reduced from 18 in 1998 to 9 kg P per ha in 2005.
Some of the problems with the MINAS system have been high levy-free surplus, exclusion of mineral P as input, low levies, fictive transportation of animal manure (fraud) and many legal battles (Jacobsen, 2002 and OECD, 2005)). In short, the measures implemented from the beginning did not correspond with the change needed, but large progress in the reduction of nutrients has been made over the years. However, the progress has come to late to convince EU of the advantages of the MINAS system (Anonymous, 2005).
In the Netherlands there has been a belief that the measures ought to be enough and some times the political/administrative implementation has reduced the effect. As an example the levy free limit on P was going to be reduced to zero (including mineral fertiliser) around 2003, but this was later changed to 9 kg P excluding mineral P. The changes were probably made as it became clear that the costs were too high and it was difficult to get a majority behind legislation which would achieve the necessary reductions. This was also because of lack of direct links between surplus and environmental quality.
Another aspect has been the lack of self control which is an essential part of the Danish fertiliser system. The “self control” comes as farmers selling and buying animal manure have opposite interests, which ensures a market price and inclusion in the fertiliser accounts. In the Netherlands some farmers have levy free surpluses which were so high, that they have had room to “sell” unused N-surpluses to farmers with high surpluses. This leads to fictive transport of manure in the fertiliser accounts from one part to another part of the country. In these cases,. the buyer and the seller have had an interest in hiding the fact that the transportation was fictive as the buyer received money for selling his excess surplus .
Compared to 1990, the number of pigs in 2002 has decreased by 20% in the Netherlands and the number of cattle by 25%. Compared to other EU countries, the large decrease of pigs stands out, however it does follow a large increase in the pig production in the years prior to 1995. Other European countries have also expected a similar decrease in the number of cattle due to the milk quota. Overall the reduction in the manure production in The Netherlands is 27% regarding N and 22% for P from 1990 to 2002. The Manure production peaked in 1995.
Following the decisions by the European Court of Justice in 2003 the Dutch government will use crop and soil specific fertilization standard as in Denmark (third action plan). The MINAS system will be abandoned by 1st of January, 2006. (Anonymous, 2005). The aim is to reach the realisation of 50 mg nitrate per litre or less in the upper ground water.
Even under the new regime there will be mandatory sampling, analyses and weighing of animal manure and this might still create problems as the self control might not work leading to more court cases. The termination of the MINAS system is a pity from a general environmental point of view as the use of surpluses is generally perceived to be closer associated with the environmental impact than application norms. The MINAS has helped dairy farmers especially
Campinas, SP - August/2005 - 211
IFma 2005 - Brazil
to think in terms of N-surplus and it has been effective on these farms, whereas is has not been effective on arable farms (OECD, 2005). It should be noted that taxation of the Nitrogen sur-plus, at the farm level, is not considered legally sound in Denmark as the calculation can not be preformed objectively (Jacobsen et al., 2004, see also www.vmp3.dk for more reports in Dan-ish). Therefore, it was suggested that the taxation was carried out at the sector level.
It is likely that The Netherlands will get a derogation from the nitrate directive concerning the application of 250 kg N per ha on grassland for a limited number of years (perhaps 2009). The Dutch argue in their derogation request that the animal manure production in the future will stay below the 2002 level, but the derogation might affect the N-application on no less than 45% of the Dutch agricultural area.
The total fertiliser application standards are not in place yet, but the derogation will allow farmers to apply 400/450 kg N per ha on sand/clay soil using the application standards from 2009. The field N-surplus on these farms will be 106 and 140 kg N per ha and the farm gate surplus will be 157-191 kg N per ha for the two farm types (Anonymous, 2005). The difference between farm and field surplus is mainly the ammonia emission, which is still relative high. The Dutch government argue, that the N-efficiency is high (over 60%) (Anonymous, 2005). However, the issue is how much N-leaching per hectare is acceptable to reach the environmen-tal standard for the water system and whether this is 40% loss of 450 kg N or 40% loss of e.g. 250-300 kg N per ha. On the other hand, phosphate application standards will also be included, although they are not a part of the Nitrate Directive.
Calculations have shown that these changes might reduce income by 25% in the livestock sector (Hoop et al., 2004). The calculations do not seem to indicate a further reduction in nutri-ent surplus and there may even be a slight increase due to more pigs than during a continued MINAS system. Under the new system using Manure Agreements, there is a fear that it might prove more difficult to reinforce compliance with the application norms than was the case with the MINAS system. Again it is important that the administrative set up is constructed to ensure that the goals are met. This could lead to higher requirements on utilisation of N in animal ma-nure or lower fertiliser application standards.
2.3. Measures and costs to fulfil the Nitrate directive in DenmarkThe implementation of the Nitrate directive in Denmark through the Action Plan for the
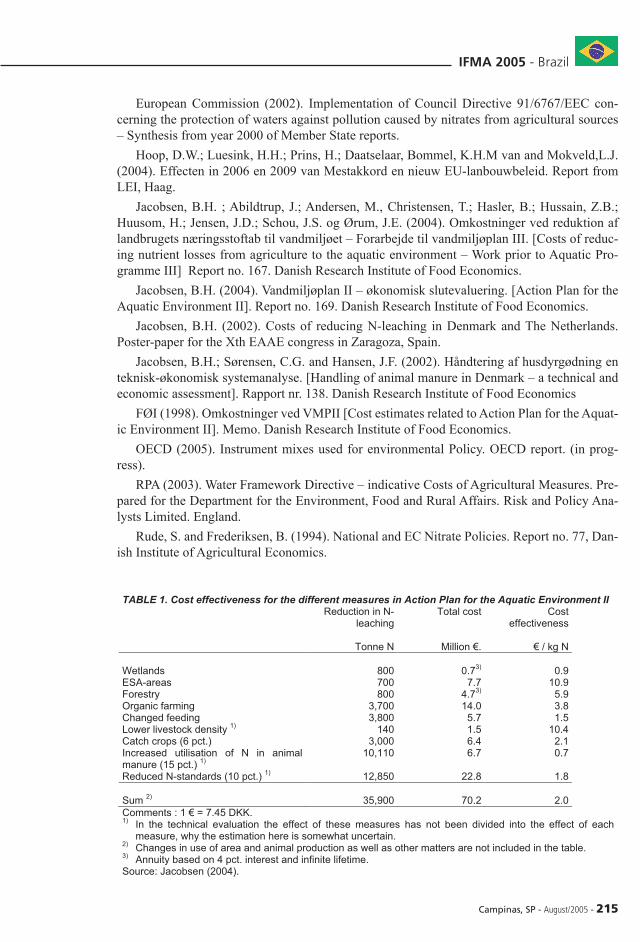
Aquatic Environment II (Action Plan II) has been accepted by the EU. The Danish Research Institute of Food Economics has carried out the analysis of the costs related to the measures used in this plan. Based on the results from the technical evaluation of Action Plan II, the cost effectiveness of each measure is calculated (Jacobsen, 2004) (se table 1).
The total costs connected to the area related measures (top 4 in table 1) have been 27 mil-lion € per year. The reduction in costs compared to expectations are mainly due to a lower area with voluntary agreements. The area related measure carries half the costs, but only 16 pct. of the reduction in N-leaching. It should be noted that the area related measures serve a range of purposes which have not been valued, such as lower phosphorus loss, lower pesticide usages and nature diversity.
One of the most important farm related measures has been the reduction of nitrogen stan-dards by 10 pct. The total costs of a reduction of 10 pct. in N-standards are estimated to 23 million €. The 10 pct. reduction in standard nitrogen norms reduces the yield by 1.0 hkg per ha (barley or wheat) in the short run. The costs are calculated using a sector-model in order to include behavioural response to the N-norm. On top of that comes the long term effect. There is some uncertainty related to this calculation as the long term effect of lower N application
212 - Campinas, SP - August/2005
15th Congress - Developing Entrepreneurship Abilities to Feed the World in a Sustainable Way
is uncertain and not covered by many trails. Changes in feeding have reduced the N-leaching more than expected and the costs related to the implementation are limited.
All in all, the cheapest measures are wetlands, better utilisation of N in animal manure and changes in feeding. The ESA-schemes (ESA = environmental sensitive schemes) and lower density on animal farms are among the most expensive when the cost is related only to the re-duction in N-leaching. The area-related measures have not achieved the expected aim, mainly due to the lower area. On the other hand the reduction in N-leaching due to the farm related measures have achieved the expected level and on top of this comes the additional measures (structural changes and other changes), which ensure that the total aim has been achieved. The total cost is 70 million € and the cost effectiveness is 2.0 € pr. kg N in reduced leaching.
3. regional analyses to improve water qualityThe Water Framework Directive (WFD) (2000/60/EF) will guide most of the actions and
regulations related to losses of nutrients in Europe in the coming years. The reason is partly that the aim of the directive is broader than previous directives as e.g. The Nitrate Directive as both groundwater and surface water are included. Another reason is the high environmental aims put forward in the directive allowing only a slight deviation from a reference situation without human activity. For countries or regions with intensive farming like Denmark, The Netherlands etc. it will be hard to obtain good ecological status, which is the minimum requirement.
Compared to the Nitrate Directive, the WFD is far more focused on the environmental indi-cators in the rivers, streams, lakes and fjords – and less on the amount of nitrogen applied per ha. The regional aspect will therefore be more important than in the Nitrate directive. From an economic viewpoint, the interesting element in the WFD is the extended use of cost efficiency when choosing which measures to implement. In article 4 there is a possibility for member states to accept lower targets if the costs associated with the required measures on a given location are disproportional with the effect. It seems likely that derogations following article 4 require cost-benefit analyses. There is therefore a need for analyses which looks closely at the costs and the effect for each measure at a given location. The following section describes how regional analyses could be carried out using the River Basin for the Fjord of Ringkøbing as an example. The analyses can be seen as the type of analyses required regarding fjords, but it does not include streams, lakes or groundwater.
3.1. introduction to the ringkøbing fjord river BasinRingkøbing County is situated on the western part of Jutland in Denmark. The County has,
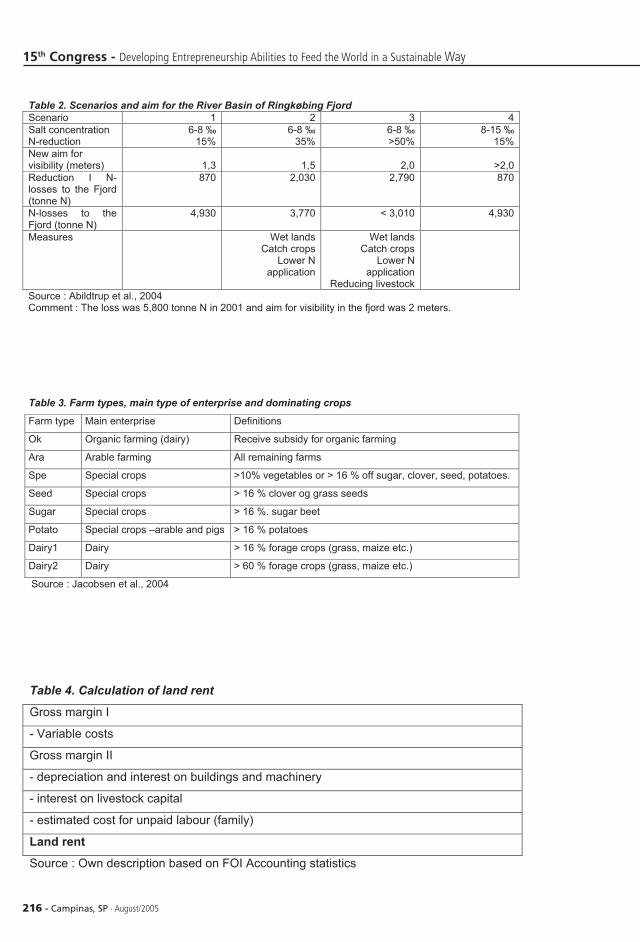
contemplated what was needed to fulfil the requirements included in WRD. It is expected that a visibility in the Fjord of approx. 2 meters is required. To complicate matters even more, it is not just a question of a reduction in nutrients, but also a question of which salt content is preferred. The conclusion is that the current high-salt concentration strategy is not acceptable, although it has been easier to achieve the environmental goals set by the county with a high salt concentra-tion. When the salt level is an issue, it is because it is possible via a lock to get seawater into the Fjord (Abildtrup et al., 2004).
The river basin covers an area of 347,700 ha of which 211,000 ha (61%) is agricultural land. The animal production constitutes 210,000 LU, where one unit is 100 kg N (ab storage). One LU is 0,85 of a large dairy cow.
With a low-salt concentration strategy there is a need to reduce the nitrogen losses to the Fjord by another 20 % or 35 % on top of the 15% which is expected from measures already implemented in Action Plan II (se above).
Campinas, SP - August/2005 - 213
IFma 2005 - Brazil
3.2. environmental and economic setup Danish Institute of Agricultural Sciences (DIAS) and Danish Hydraulic Institute (DHI)
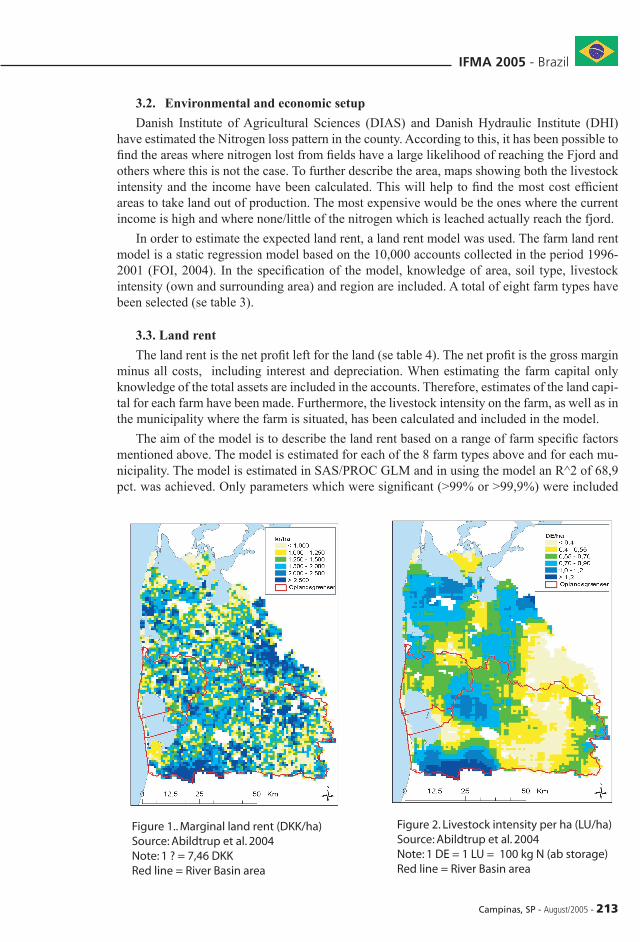
have estimated the Nitrogen loss pattern in the county. According to this, it has been possible to find the areas where nitrogen lost from fields have a large likelihood of reaching the Fjord and others where this is not the case. To further describe the area, maps showing both the livestock intensity and the income have been calculated. This will help to find the most cost efficient areas to take land out of production. The most expensive would be the ones where the current income is high and where none/little of the nitrogen which is leached actually reach the fjord.
In order to estimate the expected land rent, a land rent model was used. The farm land rent model is a static regression model based on the 10,000 accounts collected in the period 1996-2001 (FOI, 2004). In the specification of the model, knowledge of area, soil type, livestock intensity (own and surrounding area) and region are included. A total of eight farm types have been selected (se table 3).
3.3. land rent The land rent is the net profit left for the land (se table 4). The net profit is the gross margin
minus all costs, including interest and depreciation. When estimating the farm capital only knowledge of the total assets are included in the accounts. Therefore, estimates of the land capi-tal for each farm have been made. Furthermore, the livestock intensity on the farm, as well as in the municipality where the farm is situated, has been calculated and included in the model.
The aim of the model is to describe the land rent based on a range of farm specific factors mentioned above. The model is estimated for each of the 8 farm types above and for each mu-nicipality. The model is estimated in SAS/PROC GLM and in using the model an R^2 of 68,9 pct. was achieved. Only parameters which were significant (>99% or >99,9%) were included
Figure 1.. Marginal land rent (DKK/ha) Source: Abildtrup et al. 2004 Note: 1 ? = 7,46 DKK Red line = River Basin area
Figure 2. Livestock intensity per ha (LU/ha)Source: Abildtrup et al. 2004 Note: 1 DE = 1 LU = 100 kg N (ab storage)Red line = River Basin area
214 - Campinas, SP - August/2005
15th Congress - Developing Entrepreneurship Abilities to Feed the World in a Sustainable Way
in the model. As part of the yearly variation in income is due to management, it is found to be satisfactory to be able to explain 69 pct. of the variation in the land rent. The model framework is possible to use throughout Denmark. Each farm has a geographical reference which allows the land rent valued to be placed on a map. As seen on figure 4.1. and 4.2, there is some cor-relation in some areas between livestock intensity and marginal land rent. Some of the areas where potatoes are grown (the north east of the river basin) also have a high land rent. The analyses also show that the marginal land rent per livestock unit is low in livestock intensive areas. The explanation is that the increasing transportation costs etc. reduces the marginal gain per livestock unit.
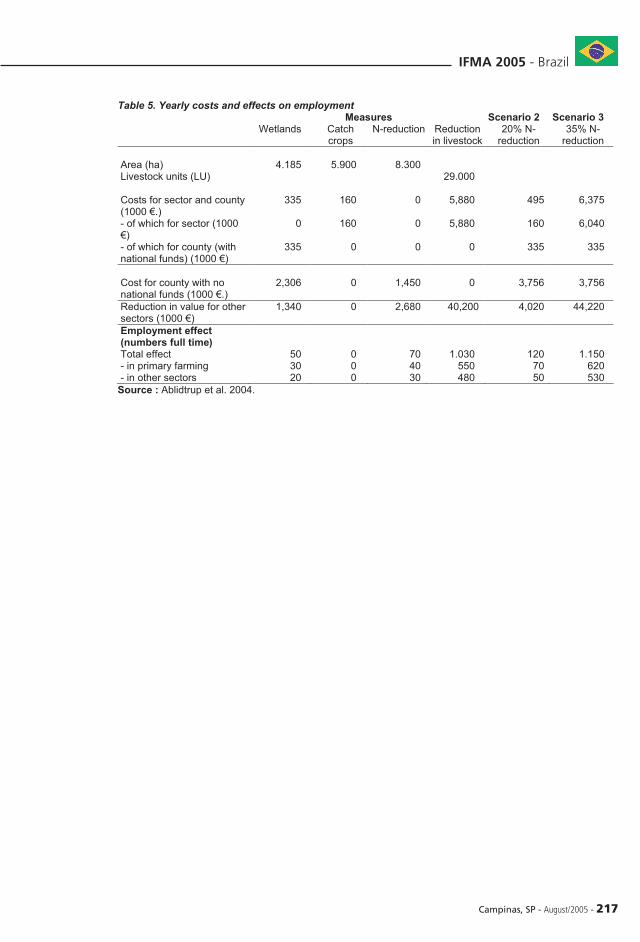
3.4. Measures and costsFor each measure in table 2 the costs and the environmental effects have been estimated. Of
the original 4 scenarios only two scenarios are left as scenario 4 is no longer an option as the County Council wants to reduce the salt content. Furthermore, scenario 1 does not reach the environmental aim, leaving only scenario 2 or 3 as the real options. In table 5, the cost for the primary sector as well as costs in associated industries, both up – and down are shown. Also the effect of employment have been forecasted based on input and output tables for Ringkøbing County. The analyses show that it will be expensive to reach the environmental goals in sce-nario 3, which is the likely aim under the Water Framework Directive. The calculations have been carried out for the county, which is the reason why the costs for state are not described in detail. The expected cost for the farms in scenario 3 is 6 million € or 208 € per livestock unit by which the production is reduced. Based on this analyses the county is now looking for other measures aiming at an reduction somewhere in between scenario 2 and 3, which does not include a reduction in the numbers of livestock.
4.discussion The implementation of the Water Framework Directive will change farming in many live-
stock intensive regions in Europe if the environmental targets are to be met. In Denmark most of the streams comply with the Directive, but most lakes and Fjords do not. To comply with the WFD with the present aims a 10 pct., reduction in agricultural land is likely. Preliminary results from Germany, the Netherlands and the United Kingdom seem to indicate that many tough measures will have to be implemented to reach the targets. The WFD covers all water and the task of finding the most cost efficient combinations of measures to achieve the goals for streams, lakes, fjords and groundwater will clearly be a challenge. Just finding cost efficient plans for fjords as Ringkøbing Fjord is difficult. The conclusion is also, that in order to get derogations from WFD, well founded cost-benefit analyses will have to be performed. Achiev-ing compliance with WFD in 2015 seems unrealistic for many countries, but analyses on how to implement the Directive seem to indicate that the process of implementation is well under way in many countries.
referenceAbildtrup, J.; Ørum, J.E.; Jensen, J.D. og Jacobsen, B.H: (2004). Økonomiske analyser af
virkemidler til reduktion af næringsstofbelastningen til Ringkøbing Fjord. [Economic analyses of measures to reduce nutrient losses to Ringkøbing Fjord]. Working Paper nr. 04/2004 , Føde-vareøkonomisk Institut.
Anonymous (2004). The Dutch derogation request – concerning the Nitrate Directive (91/676/EEC). The Dutch Government.
Campinas, SP - August/2005 - 215
IFma 2005 - Brazil
European Commission (2002). Implementation of Council Directive 91/6767/EEC con-cerning the protection of waters against pollution caused by nitrates from agricultural sources – Synthesis from year 2000 of Member State reports.
Hoop, D.W.; Luesink, H.H.; Prins, H.; Daatselaar, Bommel, K.H.M van and Mokveld,L.J. (2004). Effecten in 2006 en 2009 van Mestakkord en nieuw EU-lanbouwbeleid. Report from LEI, Haag.
Jacobsen, B.H. ; Abildtrup, J.; Andersen, M., Christensen, T.; Hasler, B.; Hussain, Z.B.; Huusom, H.; Jensen, J.D.; Schou, J.S. og Ørum, J.E. (2004). Omkostninger ved reduktion af landbrugets næringsstoftab til vandmiljøet – Forarbejde til vandmiljøplan III. [Costs of reduc-ing nutrient losses from agriculture to the aquatic environment – Work prior to Aquatic Pro-gramme III] Report no. 167. Danish Research Institute of Food Economics.
Jacobsen, B.H. (2004). Vandmiljøplan II – økonomisk slutevaluering. [Action Plan for the Aquatic Environment II]. Report no. 169. Danish Research Institute of Food Economics.
Jacobsen, B.H. (2002). Costs of reducing N-leaching in Denmark and The Netherlands. Poster-paper for the Xth EAAE congress in Zaragoza, Spain.
Jacobsen, B.H.; Sørensen, C.G. and Hansen, J.F. (2002). Håndtering af husdyrgødning en teknisk-økonomisk systemanalyse. [Handling of animal manure in Denmark – a technical and economic assessment]. Rapport nr. 138. Danish Research Institute of Food Economics
FØI (1998). Omkostninger ved VMPII [Cost estimates related to Action Plan for the Aquat-ic Environment II]. Memo. Danish Research Institute of Food Economics.
OECD (2005). Instrument mixes used for environmental Policy. OECD report. (in prog-ress).
RPA (2003). Water Framework Directive – indicative Costs of Agricultural Measures. Pre-pared for the Department for the Environment, Food and Rural Affairs. Risk and Policy Ana-lysts Limited. England.
Rude, S. and Frederiksen, B. (1994). National and EC Nitrate Policies. Report no. 77, Dan-ish Institute of Agricultural Economics.
TABLE 1. Cost effectiveness for the different measures in Action Plan for the Aquatic Environment II Reduction in N-
leaching Total cost Cost
effectiveness Tonne N Million €. € / kg N Wetlands 800 0.73) 0.9 ESA-areas 700 7.7 10.9 Forestry 800 4.73) 5.9 Organic farming 3,700 14.0 3.8 Changed feeding 3,800 5.7 1.5 Lower livestock density 1) 140 1.5 10.4 Catch crops (6 pct.) 3,000 6.4 2.1 Increased utilisation of N in animal manure (15 pct.) 1)
10,110 6.7 0.7
Reduced N-standards (10 pct.) 1) 12,850 22.8 1.8 Sum 2) 35,900 70.2 2.0 Comments : 1 € = 7.45 DKK. 1) In the technical evaluation the effect of these measures has not been divided into the effect of each
measure, why the estimation here is somewhat uncertain. 2) Changes in use of area and animal production as well as other matters are not included in the table. 3) Annuity based on 4 pct. interest and infinite lifetime. Source: Jacobsen (2004).
21� - Campinas, SP - August/2005
15th Congress - Developing Entrepreneurship Abilities to Feed the World in a Sustainable Way
Table 2. Scenarios and aim for the River Basin of Ringkøbing Fjord Scenario 1 2 3 4 Salt concentration N-reduction
6-8 ‰ 15%
6-8 ‰ 35%
6-8 ‰ >50%
8-15 ‰ 15%
New aim for visibility (meters)
1,3
1,5
2,0
>2,0
Reduction I N-losses to the Fjord (tonne N)
870 2,030 2,790 870
N-losses to the Fjord (tonne N)
4,930 3,770 < 3,010 4,930
Measures Wet lands Catch crops
Lower N application
Wet lands Catch crops
Lower N application
Reducing livestock
Source : Abildtrup et al., 2004 Comment : The loss was 5,800 tonne N in 2001 and aim for visibility in the fjord was 2 meters.
Table 3. Farm types, main type of enterprise and dominating crops
Farm type Main enterprise Definitions
Ok Organic farming (dairy) Receive subsidy for organic farming
Ara Arable farming All remaining farms
Spe Special crops >10% vegetables or > 16 % off sugar, clover, seed, potatoes.
Seed Special crops > 16 % clover og grass seeds
Sugar Special crops > 16 %. sugar beet
Potato Special crops –arable and pigs > 16 % potatoes
Dairy1 Dairy > 16 % forage crops (grass, maize etc.)
Dairy2 Dairy > 60 % forage crops (grass, maize etc.)
Source : Jacobsen et al., 2004
Table 4. Calculation of land rent
Gross margin I
- Variable costs
Gross margin II
- depreciation and interest on buildings and machinery
- interest on livestock capital
- estimated cost for unpaid labour (family)
Land rent
Source : Own description based on FOI Accounting statistics
Campinas, SP - August/2005 - 21�
IFma 2005 - Brazil
Table 5. Yearly costs and effects on employment Measures Scenario 2 Scenario 3 Wetlands Catch
crops N-reduction Reduction
in livestock 20% N-
reduction 35% N-
reduction Area (ha) 4.185 5.900 8.300 Livestock units (LU) 29.000 Costs for sector and county (1000 €.)
335 160 0 5,880 495 6,375
- of which for sector (1000 €)
0 160 0 5,880 160 6,040
- of which for county (with national funds) (1000 €)
335 0 0 0 335 335
Cost for county with no national funds (1000 €.)
2,306
0
1,450
0
3,756
3,756
Reduction in value for other sectors (1000 €)
1,340 0 2,680 40,200 4,020 44,220
Employment effect (numbers full time)
Total effect 50 0 70 1.030 120 1.150 - in primary farming 30 0 40 550 70 620 - in other sectors 20 0 30 480 50 530
Source : Ablidtrup et al. 2004.