Red River Valley Water Supply Project December 2007
562
’ ())* $ %! ! ! " # &!! GARRISON DIVERSION -- -----
-
Upload
khangminh22 -
Category
Documents
-
view
2 -
download
0
Transcript of Red River Valley Water Supply Project December 2007

�������������� �������� �� � ���� ������������������� ������������� ������'��())*�
��������� ��� ��� ����� ����������������� � � ����$ ���� �������������������� ������������������������������ %��!������!�������� �!�"���#������ &�!���������! �� ����
������������������������������������������������������������
GARRISON DIVERSION
-- ------~---

Final Environmental Impact Statement Red River Valley Water Supply Project Barnes, Burleigh, Cass, Cavalier, Eddy, Foster, Grand Forks, Griggs, Kidder, McLean, Nelson, Pembina, Ransom, Richland, Sargent, Sheridan, Steele, Stutsman, Traill, Walsh, and Wells Counties in North Dakota and Becker, Clay, Otter Tail, Polk, and Wilken Counties in Minnesota Prepared by the U.S. Department of the Interior, Bureau of Reclamation and the State of North Dakota, Garrison Diversion Conservancy District Cooperating Agencies: • U.S. Army Corps of Engineers • U.S. Environmental Protection
Agency • U.S. Fish and Wildlife Service • U.S. Forest Service • U.S. Geological Survey • Three Affiliated Tribes (Mandan,
Hidatsa, and Arikara Nation)
• North Dakota State Historic Preservation Office
• Minnesota Department of Natural Resources
• Lake Agassiz Water Authority • Fargo, North Dakota • Grand Forks, North Dakota • Moorhead, Minnesota • West Fargo, North Dakota
Abstract: The Department of the Interior, Bureau of Reclamation and the state of North Dakota propose to construct the Project to develop and deliver a bulk water supply to meet both short-term and long-term future water needs of the Red River Valley in North Dakota and Minnesota. The proposed action would include construction of features and facilities needed to develop and deliver sufficient water to existing infrastructure for distribution to municipal, rural, and industrial water users in the service area. The service area includes 13 counties in eastern North Dakota and three cities in western Minnesota. The proposed Project would supply water to meet the water needs of people and industries in the Red River Valley through the year 2050. This FEIS (final environmental impact statement) has been prepared pursuant to the National Environmental Policy Act to analyze the effects of the proposed project on environmental and human resources in the Red River and Missouri River Basins. This document responds to all substantive public comments on both the draft EIS and supplemental draft EIS. It also identifies the GDU Import to Sheyenne River Alternative as the preferred alternative. For Further Information Contact: Signe Snortland, Environmental Specialist Dakotas Area Office, Bureau of Reclamation P.O. Box 1017, Bismarck ND 58501 Telephone: (701) 221-1278 Fax: (701) 250-4326 e-mail: [email protected] Filing Number: FES 07-52 Filing Date: December 21, 2007

Red River Valley Water Supply Project FEIS
Table of Contents Chapter One Purpose and Need ................................................... 1-1
Introduction ....................................................................................................1-1 Proposed Action ............................................................................................. 1-2 Purpose and Need ......................................................................................... 1-3
MR&I Water Supply Need ..................................................................................1-4 Water Quality Need ............................................................................................1-6 Aquatic Environment Need.................................................................................1-7 Recreation Need ................................................................................................1-7 Water Conservation Need ..................................................................................1-8
Authorization and History ............................................................................... 1-9 Study Approach............................................................................................ 1-10
Needs and Options Report...............................................................................1-10 Partnership with State of North Dakota ............................................................1-10
Cooperating Agencies .................................................................................. 1-11 Scope of the EIS .......................................................................................... 1-12
Actions Within the Geographic Scope..............................................................1-12 Actions Outside the Scope of the EIS ..............................................................1-12 Alternatives.......................................................................................................1-14 Potential Impacts..............................................................................................1-15 Impacts to Canada ...........................................................................................1-16
Purpose of FEIS........................................................................................... 1-17 Concerns and Issues Related to the Proposed Action ................................. 1-18Overview of the FEIS ...................................................................................1-20What Comes Next? ...................................................................................... 1-21
Record of Decision ...........................................................................................1-22 Chapter Two Alternatives .............................................................. 2-1
Introduction ....................................................................................................2-1 Drought and Future Water Shortage ..............................................................2-3 StateMod Hydrologic Modeling Results..........................................................2-5
Modeling the No Action Alternative ....................................................................2-5 Modeling the Action Alternatives ........................................................................2-6
Alternative Screening Process ..................................................................... 2-11 Initial Screening................................................................................................2-11
Alternatives Studied in the SDEIS and FEIS ................................................ 2-13 No Action Alternative........................................................................................2-15 Action Alternative Features ..............................................................................2-18 North Dakota In-Basin Alternative ....................................................................2-31 Red River Basin Alternative .............................................................................2-35 GDU Import to Sheyenne River Alternative......................................................2-39 GDU Import Pipeline Alternative ......................................................................2-43 Missouri River Import to Red River Valley Alternative......................................2-47 Preferred Alternative ........................................................................................2-51
Alternatives Considered But Eliminated .......................................................2-51 Alternatives Eliminated After Initial DEIS Scoping ...........................................2-55
i
Red River Valley Water Supply Project FEIS
Alternatives Eliminated During DEIS or SDIES Preparation ............................2-55 Alternatives Eliminated in the FEIS ..................................................................2-60
Cost of Alternatives ...................................................................................... 2-65 Cost of Construction, OM&R, and Annualized Costs of Alternatives ...............2-65 Phasing Construction of Alternatives ...............................................................2-67
Summary of Environmental Consequences ................................................. 2-69 Comparison of Advantages and Disadvantages of the Alternatives............. 2-72
Consequences of No Action.............................................................................2-72 Identification of the Preferred Alternative .........................................................2-79
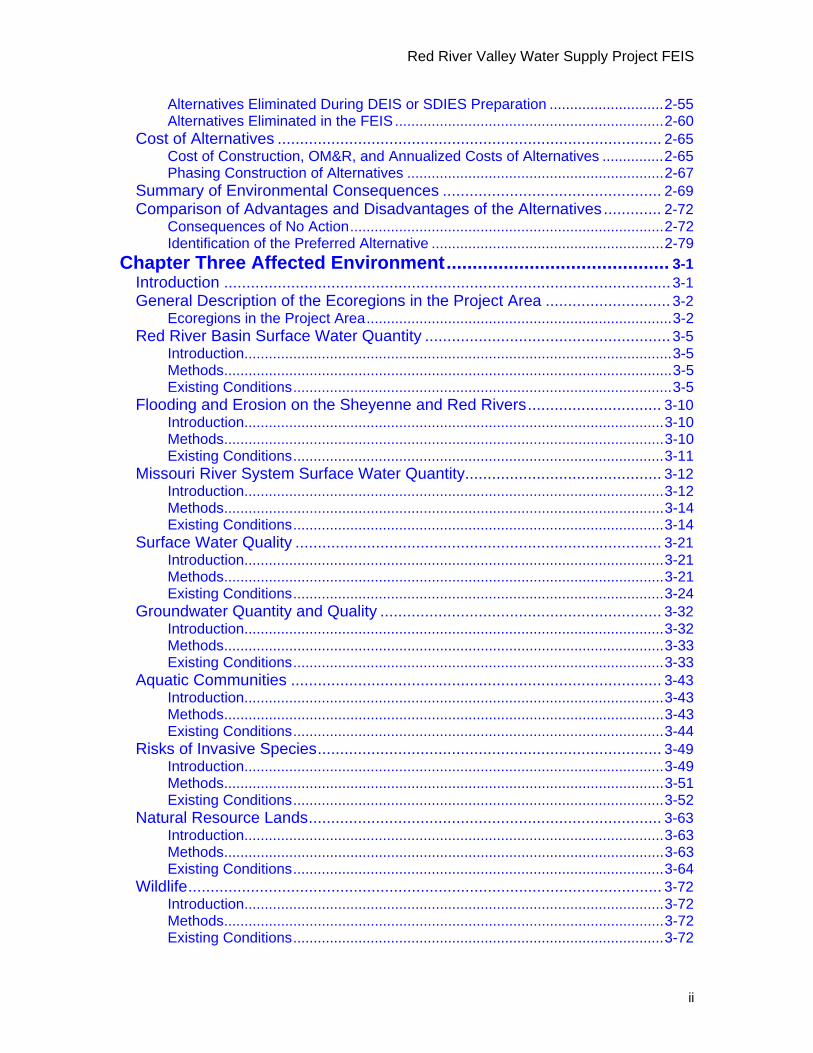
Chapter Three Affected Environment........................................... 3-1 Introduction ....................................................................................................3-1 General Description of the Ecoregions in the Project Area ............................ 3-2
Ecoregions in the Project Area...........................................................................3-2 Red River Basin Surface Water Quantity ....................................................... 3-5
Introduction.........................................................................................................3-5 Methods..............................................................................................................3-5 Existing Conditions.............................................................................................3-5
Flooding and Erosion on the Sheyenne and Red Rivers.............................. 3-10 Introduction.......................................................................................................3-10 Methods............................................................................................................3-10 Existing Conditions...........................................................................................3-11
Missouri River System Surface Water Quantity............................................ 3-12 Introduction.......................................................................................................3-12 Methods............................................................................................................3-14 Existing Conditions...........................................................................................3-14
Surface Water Quality .................................................................................. 3-21 Introduction.......................................................................................................3-21 Methods............................................................................................................3-21 Existing Conditions...........................................................................................3-24
Groundwater Quantity and Quality ............................................................... 3-32 Introduction.......................................................................................................3-32 Methods............................................................................................................3-33 Existing Conditions...........................................................................................3-33
Aquatic Communities ................................................................................... 3-43 Introduction.......................................................................................................3-43 Methods............................................................................................................3-43 Existing Conditions...........................................................................................3-44
Risks of Invasive Species............................................................................. 3-49 Introduction.......................................................................................................3-49 Methods............................................................................................................3-51 Existing Conditions...........................................................................................3-52
Natural Resource Lands............................................................................... 3-63 Introduction.......................................................................................................3-63 Methods............................................................................................................3-63 Existing Conditions...........................................................................................3-64
Wildlife.......................................................................................................... 3-72 Introduction.......................................................................................................3-72 Methods............................................................................................................3-72 Existing Conditions...........................................................................................3-72
ii

Red River Valley Water Supply Project FEIS
Federally Protected Species of Special Concern ......................................... 3-74 Introduction.......................................................................................................3-74 Methods............................................................................................................3-75 Existing Conditions...........................................................................................3-75
Protected Areas............................................................................................ 3-88 Introduction.......................................................................................................3-88 Methods............................................................................................................3-88 Existing Conditions...........................................................................................3-88
Historic Properties ........................................................................................ 3-95 Introduction.......................................................................................................3-95 Methods............................................................................................................3-97 Existing Conditions...........................................................................................3-98
Indian Trust Assets..................................................................................... 3-102 Introduction.....................................................................................................3-102 Methods..........................................................................................................3-103 Existing Conditions.........................................................................................3-103
Social and Economic Conditions ................................................................ 3-106 Introduction.....................................................................................................3-106 Methods..........................................................................................................3-106 Existing Conditions.........................................................................................3-106
Environmental Justice ................................................................................ 3-114 Introduction.....................................................................................................3-114 Methods..........................................................................................................3-114 Existing Conditions.........................................................................................3-114
Chapter Four Environmental Impacts .......................................... 4-1 Introduction ....................................................................................................4-1
Adaptive Management .......................................................................................4-2 Red River Basin Surface Water Quantity .......................................................4-7
Introduction.........................................................................................................4-7 Methods..............................................................................................................4-7 Results ...............................................................................................................4-8 Cumulative Effects ...........................................................................................4-30 Summary ..........................................................................................................4-30 Environmental Mitigation ..................................................................................4-33
Flooding and Erosion on the Sheyenne and Red Rivers.............................. 4-34 Introduction.......................................................................................................4-34 Methods............................................................................................................4-35 Results .............................................................................................................4-37 Cumulative Effects ...........................................................................................4-40 Summary ..........................................................................................................4-40 Environmental Mitigation ..................................................................................4-41
Missouri River System Water Quantity......................................................... 4-42 Introduction.......................................................................................................4-42 Methods............................................................................................................4-43 Results .............................................................................................................4-45 Cumulative Effects ...........................................................................................4-50 Summary ..........................................................................................................4-51 Environmental Mitigation ..................................................................................4-51
iii

Red River Valley Water Supply Project FEIS
Surface Water Quality ..................................................................................4-52 Introduction.......................................................................................................4-52 Methods............................................................................................................4-52 Results .............................................................................................................4-57 Cumulative Effects ...........................................................................................4-83 Summary ..........................................................................................................4-83 Environmental Mitigation ..................................................................................4-85
Groundwater................................................................................................. 4-86 Introduction.......................................................................................................4-86 Methods............................................................................................................4-86 Results .............................................................................................................4-87 Summary ..........................................................................................................4-96 Cumulative Effects ...........................................................................................4-99 Environmental Mitigation ..................................................................................4-99
Aquatic Communities ................................................................................. 4-101 Introduction.....................................................................................................4-101 Methods..........................................................................................................4-101 Results ...........................................................................................................4-105 Summary ........................................................................................................4-120 Cumulative Effects .........................................................................................4-124 Environmental Mitigation ................................................................................4-124
Risk of Invasive Species ............................................................................ 4-125 Introduction.....................................................................................................4-125 Methods..........................................................................................................4-126 Results ...........................................................................................................4-129 Cumulative Effects .........................................................................................4-147 Summary ........................................................................................................4-147 Environmental Mitigation ................................................................................4-148
Natural Resource Lands.............................................................................4-150 Introduction.....................................................................................................4-150 Methods..........................................................................................................4-150 Results ...........................................................................................................4-151 Cumulative Effects .........................................................................................4-162 Summary ........................................................................................................4-163 Environmental Mitigation ................................................................................4-164
Wildlife........................................................................................................ 4-171 Introduction.....................................................................................................4-171 Methods..........................................................................................................4-171 Results ...........................................................................................................4-172 Cumulative Effects .........................................................................................4-174 Summary ........................................................................................................4-174 Environmental Mitigation ................................................................................4-174
Federally Protected Species and Species of Special Concern .................. 4-176 Introduction.....................................................................................................4-176 Methods..........................................................................................................4-177 Results ...........................................................................................................4-180 Cumulative Effects .........................................................................................4-188 Summary ........................................................................................................4-189 Environmental Mitigation ................................................................................4-189
iv

Red River Valley Water Supply Project FEIS
Protected Areas.......................................................................................... 4-192 Introduction.....................................................................................................4-192 Methods..........................................................................................................4-192 Results ...........................................................................................................4-192 Cumulative Effects .........................................................................................4-203 Summary ........................................................................................................4-203 Environmental Mitigation ................................................................................4-204
Historic Properties ...................................................................................... 4-206 Introduction.....................................................................................................4-206 Methods..........................................................................................................4-206 Results ...........................................................................................................4-207 Cumulative Effects .........................................................................................4-211 Summary ........................................................................................................4-211 Environmental Mitigation ................................................................................4-213
Indian Trust Assets..................................................................................... 4-214 Introduction.....................................................................................................4-214 Methods..........................................................................................................4-214 Results ...........................................................................................................4-214 Cumulative Effects .........................................................................................4-217 Summary ........................................................................................................4-218 Environmental Mitigation ................................................................................4-219
Social and Economic Issues ...................................................................... 4-220 Introduction.....................................................................................................4-220 Methods..........................................................................................................4-221 Results ...........................................................................................................4-229 Cumulative Effects .........................................................................................4-248 Summary ........................................................................................................4-248 Environmental Mitigation ................................................................................4-248
Environmental Justice ................................................................................ 4-249 Introduction.....................................................................................................4-249 Methods..........................................................................................................4-249 Results ...........................................................................................................4-249 Cumulative Effects .........................................................................................4-253 Summary ........................................................................................................4-253 Environmental Mitigation ................................................................................4-253
Chapter Five Consultation and Coordination .............................. 5-1 Public Involvement Program .......................................................................... 5-1
Scoping Notice ...................................................................................................5-1 Public Scoping Meetings ....................................................................................5-1 Public Hearings ..................................................................................................5-2 Website ..............................................................................................................5-3 Newsletters.........................................................................................................5-3
Cooperating Agency Team............................................................................. 5-4 Technical Team.............................................................................................. 5-4 Resource Meetings ........................................................................................ 5-6 Environmental Protection Agency Consultation ............................................. 5-8 Endangered Species Act Consultation ........................................................... 5-8 Native American Consultation ...................................................................... 5-10 Cultural Resources Consultation .................................................................. 5-10
v

Red River Valley Water Supply Project FEIS
Coordination and Compliance with Other Applicable Laws, Regulations, and Policies.................................................................................................. 5-11
Archeological Resource Protection Act of 1979 ...............................................5-11 Boundary Waters Treaty of 1909 .....................................................................5-11 Clean Water Act of 1977 (as amended) ...........................................................5-11 Farmland Protection Policy Act of 1995 ...........................................................5-12 Fish and Wildlife Coordination Act of 1958 (as amended) ...............................5-12 Migratory Bird Treaty Act and Executive Order 13186 (January 2001)............5-12 Native American Graves Protection and Repatriation Act (Public Law 101-601) .......................................................................................5-13 National Historic Preservation Act of 1966 (as amended)................................5-13 National Invasive Species Act of 1996 .............................................................5-13 National Wildlife Refuge System Administration Act of 1966 ...........................5-13 Rivers and Harbors Appropriation Act of 1899.................................................5-14 Safe Drinking Water Act of 1974 (as amended)...............................................5-14 Executive Order 13112 for Invasive Species ...................................................5-14 Executive Order 12114 for Environmental Effects Outside the United States. 5-14 Other Executive Orders....................................................................................5-15 Corps of Engineers Lake Ashtabula Water Control Manual.............................5-15 North Dakota State Burial Law.........................................................................5-15 State Water Rights ...........................................................................................5-15 Minnesota’s Endangered Species Statute and Associated Rules....................5-16 Minnesota Environmental Policy Act ................................................................5-16 Minnesota Statute 307.8 (Private Cemetaries) ................................................5-16 Minnesota Wetland Conservation Act of 1991 (as amended) ..........................5-16 Minnesota Invasive Species Laws ...................................................................5-16 Missouri River Water Rights Summary ............................................................5-17
List of Preparers ........................................................................................... 5-18 Kimball Banks, Financial Assistance Officer, Reclamation ..............................5-18 Mark Deutschman, Registered Professional Engineer, Houston Engineering .5-18 Darrin Goetzfried, P.E., Hydraulic Engineer, Reclamation...............................5-18 Greg Hiemenz, Environmental Specialist, Reclamation...................................5-18 Patience Hurley, Public Involvement Specialist, Reclamation .........................5-18 David Johnson, Engineer, Garrison Diversion Conservancy District ...............5-18 Dean Karsky, Civil Engineer, Reclamation.......................................................5-18 Richard McCabe, Environmental Consultant, Garrison Diversion....................5-19 Elizabeth Nell McPhillips, Natural Resource Specialist, Reclamation..............5-19 Merri Mooridian, Communications Directory, Garrison Diversion ....................5-19 Steven Piper, Economist, Reclamation ............................................................5-19 Alison Schlag, Environmental Specialist, Reclamation ....................................5-19 Allen Schlag, Hydrologist, Reclamation ...........................................................5-19 Signe Snortland, Environmental Specialist, Reclamation ................................5-20 Ron Sutton, Fisheries Biologist, Reclamation ..................................................5-20 Alicia Waters, Program Analyst, Reclamation..................................................5-20
Distribution List............................................................................................. 5-20 Agencies and Contact Person..........................................................................5-20
Literature Cited............................................................................. LC-1
vi

Red River Valley Water Supply Project SDEIS
List of Tables
Table 1.1 – 2050 Maximum Annual Water Demands. ...............................................................1-5 Table 1.2 – EIS Cooperating Agencies....................................................................................1-11 Table 1.3 – Issues Identified During Public Scoping and Addressed in the SDEIS. ................1-20 Table 2.1 – Ranked Lowest Naturalized Annual Flows at Emerson, Manitoba for 71
years (1931 – 2001). .................................................................................................2-5 Table 2.2 – StateMod Hydrologic Modeling Results. .................................................................2-6 Table 2.3 – Storage Based Upon Permitted Water Rights in Lake Ashtabula. ..........................2-9 Table 2.4 – Depletion Results for Missouri River Import Alternatives. .....................................2-10 Table 2.5 – No Action Water Supply Projects in the Red River Valley Through 2050. ............2-17 Table 2.6 – Features in the Action Alternative. ........................................................................2-18 Table 2.7 – Biota Water Treatment Plant Capacity Requirements. .........................................2-19 Table 2.8 – Features Proposed for Inclusion in North Dakota In-Basin Alternative. ................2-32 Table 2.9 – North Dakota In-Basin Alternative Cost Estimate. ................................................2-32 Table 2.10 – Features Proposed for Inclusion in Red River Basin Alternative. .......................2-36 Table 2.11 – Red River Basin Alternative Cost Estimate.........................................................2-36 Table 2.12 – Features Proposed for Inclusion in GDU Import to Sheyenne River
Alternative. ..............................................................................................................2-40 Table 2.13 – GDU Import to Sheyenne River Alternative Cost Estimate. ................................2-41 Table 2.14 – Features Proposed for Inclusion in GDU Import Pipeline Alternative. ................2-45 Table 2.15 – GDU Import Pipeline Alternative Cost Estimate..................................................2-45 Table 2.16 – Features Proposed for Inclusion in Missouri River Import to Red River
Valley Alternative.....................................................................................................2-48 Table 2.17 – Missouri River Import to Red River Valley Alternative Cost Estimate. ................2-49 Table 2.18 – Disposition of 11 Alternatives Disclosed During 2002 Public Scoping
Meetings..................................................................................................................2-52 Table 2.19 – Summary of Alternative Cost Estimates. ............................................................2-65 Table 2.20 – Infrastructure Costs.............................................................................................2-66 Table 2.21 – Alternative and Infrastructure Construction Costs. .............................................2-67 Table 2.22 – Alternative and Infrastructure OM&R Costs. .......................................................2-67 Table 2.23 – Number of Water Supply Features in Alternatives and Percent Cost of
Initial Construction Phase........................................................................................2-68 Table 2.24 – Summary of Environmental Impacts That Could Result From Construction
of the Action Alternatives and/or a 1930s-Type Drought as Compared to No Action.................................................................................................................2-69
Table 2.25 – North Dakota In-Basin Alternative.......................................................................2-74 Table 2.26 – Red River Basin Alternative. ...............................................................................2-75 Table 2.27 – GDU Import to Sheyenne River Alternative. .......................................................2-76 Table 2.28 – GDU Import Pipeline Alternative. ........................................................................2-77 Table 2.29 – Missouri River Import to Red River Valley Alternative. .......................................2-78 Table 3.1 – Water Permits for Storage in Lake Ashtabula.........................................................3-6 Table 3.2 – Current (2002) Missouri River Depletions by Reach.............................................3-14 Table 3.3 – Current Missouri River Conditions Average Annual Benefits during Drought
(1930-1941).............................................................................................................3-15 Table 3.4 – Current Missouri River Conditions Average Annual Benefits for the 1930-2002
Period. .....................................................................................................................3-16 Table 3.5 – Select Water Quality Analysis for the Red and Sheyenne Rivers.........................3-25
vii

Red River Valley Water Supply Project SDEIS
Table 3.6 – IJC Objectives at Emerson, Manitoba, Canada, on the Red River. ......................3-29 Table 3.7 – Water Quality of Selected Aquifers in the Red River Valley in North Dakota........3-34 Table 3.8 – Water Quality of the Surficial Aquifers of the Red River Basin, Minnesota...........3-40 Table 3.9 – Potentially Invasive Species – Plants, Algae, Microorganisms, and
Disease Agents. ......................................................................................................3-51 Table 3.10 – Potentially Invasive Species – Aquatic Invertebrates and Aquatic Vertebrates. .3-52 Table 3.11 – Wetlands Currently in 400-foot-wide Project Pipeline Corridors. ........................3-64 Table 3.12 – Wetlands Currently Overlying Aquifers Proposed for Development. ..................3-65 Table 3.13 – Inventory of Native Prairie in the 400-Foot-Wide Pipeline Corridors in the
Missouri River and Red River Basins......................................................................3-68 Table 3.14 – Native Prairie Overlying Aquifers Proposed for Project Development in the
Red River Basin. .....................................................................................................3-68 Table 3.15 – Inventory of Woodlands in the 400-Foot-Wide Pipeline Corridors in the
Missouri River and Red River Basins......................................................................3-69 Table 3.16 – Inventory of Woodlands Overlying Aquifers Proposed for Development in the
Red River Basin. .....................................................................................................3-70 Table 3.17 – Riparian Area Acres in the Proposed Project Area in the Red River Basin. .......3-70 Table 3.18 – Summary of Cultural Resource Site Type Classes Within the Area of Potential
Effect for Each Alternative.......................................................................................3-98 Table 3.19 – Population of the Regional Counties and Dominant Urban Areas. ...................3-107 Table 3.20 – Income, Poverty Rate, and Home Ownership Rate for States and Counties....3-108 Table 3.21 – Agricultural Acres and Products Value in the Red River Valley North Dakota
Counties. ...............................................................................................................3-109 Table 3.22 – Lake Ashtabula Recreation...............................................................................3-111 Table 3.23 – Race and Ethnic Origin of Red River Valley Counties. .....................................3-115 Table 4.1 – Comparison of Present 2005 Conditions to the No Action Alternative for Lake
Ashtabula Volumes. ..................................................................................................4-6 Table 4.2 – Comparison of Present 2005 Conditions to the No Action Alternative for Lake
Ashtabula Volumes. ..................................................................................................4-9 Table 4.3 – Comparison of the No Action Alternative to Action Alternatives for Lake
Ashtabula Volumes. ................................................................................................4-11 Table 4.4 – Comparison of Present 2005 Conditions and the No Action Alternative Flows
on the Sheyenne River Near Kindred, North Dakota. .............................................4-13 Table 4.5 – Comparison of the No Action Alternative Flows to Action Alternative Flows
on the Sheyenne River Near Kindred, North Dakota. .............................................4-14 Table 4.6 – Comparison of the Present 2005 Conditions With No Action Alternative Flows
on the Red River at Fargo, North Dakota................................................................4-18 Table 4.7 – Comparison of No Action Alternative to Action Alternative Flows on the Red
River at Fargo, North Dakota. .................................................................................4-18 Table 4.8 – Comparison of Present 2005 Conditions with No Action Alternative Flows on the
Red River at Emerson, Manitoba. ...........................................................................4-19 Table 4.9 – Comparison of No Action Alternative to Action Alternative Flows on the Red
River at Emerson, Manitoba....................................................................................4-19 Table 4.10 – Comparison of the Present 2005 Condition to No Action Alternative for
Averaged Volumes 1931 – 2001. ............................................................................4-23 Table 4.11 – Comparison of the No Action Alternative to Action Alternative for Averaged
Volumes 1931 - 2001 ..............................................................................................4-23 Table 4.12 – Comparison of Present 2005 Conditions to the No Action Alternative on the
Sheyenne River at Kindred, 1931-2001. .................................................................4-25 Table 4.13 – Comparison of Project Alternatives on the Sheyenne River at Kindred,
1931-2001. ..............................................................................................................4-26
viii

Red River Valley Water Supply Project SDEIS
Table 4.14 – Comparison of Present 2005 Conditions to the No Action Alternative on the Red River, 1931-2001 .............................................................................................4-28
Table 4.15 – Comparison of Project Alternatives on the Red River, 1931-2001. ....................4-29 Table 4.16 – Flood Stage Elevations and Flow in cfs at Gages on the Sheyenne and Red
Rivers. .....................................................................................................................4-35 Table 4.17 – Recurrence Intervals of Bankfull Conditions Near Kindred on the Sheyenne
River (18,962 days analyzed)..................................................................................4-37 Table 4.18 – New Bankfull Flows Near Kindred on the Sheyenne River for All Alternatives
(18,962 days analyzed). ..........................................................................................4-38 Table 4.19 – Future Missouri River Depletions for Water Supply and Irrigation Projects
from Planning Documents. ......................................................................................4-44 Table 4.20 – Combined Missouri River Basin Public Water System and Industrial Demand
Projections - 2000 to 2050. .....................................................................................4-44 Table 4.21 – Total Annual Depletions Forecasted to 2050......................................................4-45 Table 4.22 – 1930s Average Monthly Depletions From the Missouri River for Import
Alternatives .............................................................................................................4-45 Table 4.23 – Water Quality Meetings: Workshops, Conference Calls, and Participants. ........4-53 Table 4.24 – Applicable Water Quality Numeric Standards and Objectives. ...........................4-57 Table 4.25 – Estimated Annual Loads of Selected Water Quality Constituents in the
Red River at Emerson Comparing Dry and Wet Years. ..........................................4-81 Table 4.26 – Effects of Alternatives When Compared to No Action.........................................4-84 Table 4.27 – Summary of Environmental Consequences of No Action and Environmental
Impacts That Could Result From Construction of the Action Alternatives and/or a 1930s-Type Drought................................................................................................4-97
Table 4.28 – Habitat-Preference Guild Representatives Modeled for the Sheyenne River and Red River of the North by Season..................................................................4-102
Table 4.29 – Water levels in Lake Ashtabula in the Period of Record from 1931 – 2001......4-105 Table 4.30 – Water levels in Lake Ashtabula During a Drought from 1931 – 1940. ..............4-105 Table 4.31 – Summary of Action Alternative Fish Habitat Scores at Lisbon on the Sheyenne River Compared to No Action. .............................................................4-108 Table 4.32 – Summary of Action Alternative Fish Habitat Scores at Pigeon Point on the Sheyenne River Compared to No Action. ..................................................4-108 Table 4.33 – Summary of Action Alternative Fish Habitat Scores at Norman on the Sheyenne River Compared to No Action. .............................................................4-108 Table 4.34 – Summary of Action Alternative Mussel Habitat Scores at Lisbon on the Sheyenne River Compared to No Action. .......................................................4-109 Table 4.35 – Summary of Action Alternative Mussel Habitat Scores at Pigeon Point on the Sheyenne River Compared to No Action. .........................................4-109 Table 4.36 – Summary of Action Alternative Mussel Habitat Scores at Norman on the Sheyenne River Compared to No Action. .......................................................4-109 Table 4.37 – Summary of Action Alternative Fish Habitat Scores at Moorhead on the Red River Compared to No Action. .................................................................4-111 Table 4.38 – Summary of Action Alternative Fish Habitat Scores at Frog Point on the Red River Compared to No Action. .................................................................4-111 Table 4.39 – Summary of Action Alternative Lake Sturgeon Habitat Scores at Moorhead on the Red River Compared to No Action............................................4-111 Table 4.40 – Summary of Action Alternative Lake Sturgeon Habitat Scores at Frog Point on the Red River Compared to No Action. ..................................................4-112 Table 4.41 – Summary of Action Alternative Mussel Habitat Scores at Moorhead on the
Red River Compared to No Action. .......................................................................4-113
ix

Red River Valley Water Supply Project SDEIS
Table 4.42 – Summary of Action Alternative Mussel Habitat Scores at Frog Point on the Red River Compared to No Action. .......................................................................4-113
Table 4.43 – Fisheries Analyzed in Corps Missouri River Depletion Effects Study. ..............4-113 Table 4.44 – Comparison of Three Missouri River Import Alternatives to the No Action
Alternative (1930-1941) During a 1930s-Type Drought. .......................................4-114 Table 4.45 – Comparison of Three Missouri River Import Alternatives to the No Action
Alternative (1930-2002).........................................................................................4-114 Table 4.46 – Comparison of Three Missouri River Import Alternatives to the No Action
Alternative (1930-1941).........................................................................................4-115 Table 4.47 – Comparison of Three Missouri River Import Alternatives to the No Action
Alternative (1930-2002).........................................................................................4-115 Table 4.48 – Amount of Time Alternatives Met the North Dakota Game and Fish
Department Aquatic Needs Recommendations Through 1931 to 2001................4-118 Table 4.49 – Meeting the North Dakota Game and Fish Aquatic Needs
Recommendations During 1930s-Type Drought. ..................................................4-118 Table 4.50 – Risk of Successful Invasion for Open Water Conveyance Without
Treatment. ............................................................................................................4 -130 Table 4.51 – Risk of Successful Invasion for Piped Conveyance Without Treatment. .........4 -131 Table 4.52 – Risk of Successful Invasion for Piped Conveyance With Treatment. ..............4 -132 Table 4.53 – Offsetting Restoration for a Single Representative Invasive Organism
(Red River and Lake Winnipeg). ..........................................................................4 -137 Table 4.54 – Offsetting Restoration for a Single Representative Invasive Organism
(Red Lake River and Red Lake)...........................................................................4 -138 Table 4.55 – Offsetting Restoration for 31 Potentially Invasive Species (Red River and
Lake Winnipeg). ...................................................................................................4 -139 Table 4.56 – Offsetting Restoration for 31 Potentially Invasive Species (Red Lake River
and Red Lake)......................................................................................................4 -139 Table 4.57 – Expected Direct and Indirect Output Impacts for All Canadian Provinces
Given a Jump Dispersal Event. ............................................................................4 -141 Table 4.58 – Offsetting Restoration for a Single Representative Invasive Species in Lake
Winnipeg With Effective Treatment. .....................................................................4 -142 Table 4.59 – Offsetting Restoration for 31 Potentially Invasive Species in Lake Winnipeg
With Effective Treatment. .....................................................................................4 -142 Table 4.60 – Combined Treatment and Conveyance Risk Reduction. .................................4 -144 Table 4.61 – Consequences of No Action and Estimated Impacts of Proposed Buried
Pipelines on Wetlands..........................................................................................4 -152 Table 4.62 – Percent of Aquifer Covered by Wetlands.........................................................4 -152 Table 4.63 – Estimated Impact Area of Aquifer Features. ....................................................4 -153 Table 4.64 – No Action Consequences and Estimated Temporary Impacts to Wetlands
by Proposed Buried Pipelines. .............................................................................4 -153 Table 4.65 – Consequences of No Action and Estimated Temporary and Permanent
Impacts to Native Prairie. .....................................................................................4 -155 Table 4.66 – Consequences of No Action and Estimated Temporary and Permanent
Impacts to Woodlands..........................................................................................4 -156 Table 4.67 – Rivers and Streams Crossed by Buried Pipeline Construction. .......................4 -158 Table 4.68 – Riparian, Agricultural, and Developed Acres Within 0.25 Mile of Rivers in
the Area of Potential Effects.................................................................................4 -158 Table 4.69 – Potentially Impacted Wetlands within the Riparian Influence Area along the
Sheyenne and Red Rivers. ..................................................................................4 -158 Table 4.70 – Potentially Impacted Forests and Grasslands in Riparian Areas Along the
Sheyenne and Red Rivers. ..................................................................................4 -159
x

Red River Valley Water Supply Project SDEIS
Table 4.71 – The Number of Months in the Extreme Low Flow Category During a 1930s-Type Drought.............................................................................................4 -159
Table 4.72 – Consequences of No Action and Summary of Effects to Riparian Areas by Alternative During a 1930s-Type Drought. ...........................................................4 -160
Table 4.73 – The Number of Months in the Extreme Low Flow Category During the 71-year Period of Record. .....................................................................................4-160
Table 4.74 – Consequences of No Action and Summary of Effects to Riparian Natural Resource Lands During a 71-year Period of Record. ...........................................4-161
Table 4.75 – Acres of Potential Wildlife Habitat Impacted by the Action Alternatives Compared to the Consequences of No Action ......................................................4-172
Table 4.76 – Federally Listed Species That May Be Present in the Project’s Areas of Potential Effects. ...................................................................................................4-178
Table 4.77 – Number of Months of Extreme Low Flow at The Lisbon Gage on the Sheyenne River and Assessment of Impacts to Protected Areas Near This Gage..............................................................................................................4-193
Table 4.78 – Number of Months of Extreme Low Flow at the Kindred Gage on the Sheyenne River and Assessment of Impacts to Protected Areas Near This Gage. ....................................................................................................................4-193
Table 4.79 – Number of Individual Service Easements and Fee Title Property Areas as Identified by the Service (2005), Potentially Crossed by Pipelines or in Aquifer Development Areas...............................................................................................4-195
Table 4.80 – Number of Months of Extreme Low Flow at the Grand Forks Gage on the Red River and Assessment of Consequences of No Action and Impacts of Action Alternatives on Protected Areas.................................................................4-200
Table 4.81 – Summary of Consequences of No Action and Estimated Impacts on Protected Lands. ...................................................................................................4-203
Table 4.82 – Number of Historic Properties Recorded in Project Area of Potential Effects in North Dakota and Minnesota.............................................................................4-208
Table 4.83 – Summary of the Consequences of No Action and Potential Impacts to ITAs by Action Alternatives............................................................................................4-218
Table 4.84 – Economic Impact Region. .................................................................................4-221 Table 4.85 – Impact Of Water Shortages on Output..............................................................4-224 Table 4.86 – Impact of Various Shortages on Production. ....................................................4-225 Table 4.87 – Range of Annual Water Shortage Regional Impacts – No Action Alternative...4-226 Table 4.88 – Approximate Annual Impacts From Imposing Drought Contingency Goals. .....4-228 Table 4.89 – Annual Regional Economic Impact During 1930s-Type Drought......................4-228 Table 4.90 – Summary of Alternative Cost Estimates. ..........................................................4-230 Table 4.91 – Infrastructure Costs...........................................................................................4-231 Table 4.92 – Alternative and Infrastructure Construction Costs. ...........................................4-232 Table 4.93 – Alternative and Infrastructure OM&R Costs. .....................................................4-232 Table 4.94 – One-Time Total Construction Impacts. .............................................................4-233 Table 4.95 – Annual OM&R Related Impacts. .......................................................................4-233 Table 4.96 – Per Month Household and per 1,000 Gallon Repayment Rates. ......................4-235 Table 4.97 – Industrial Repayment Rates per Acre-Foot.......................................................4-236 Table 4.98 – Current Per Month Household and per 1,000 Gallon Water Rates...................4-236 Table 4.99 – Per Month Household and per 1,000 Gallon Repayment Rates. ......................4-236 Table 4.100 – Fishing and Water Related Activity Expenditures. ..........................................4-239 Table 4.101 – Average Drought Year Negative Recreation Based Regional Impacts at
Lake Ashtabula as Compared to Total Visitation in 1999......................................4-239 Table 4.102 – Recreation Based Regional Impacts at Lake Ashtabula Compared to
No Action...............................................................................................................4-240
xi

Red River Valley Water Supply Project SDEIS
Table 4.103 – Impacts on Hydropower Benefits Compared to No Action..............................4-243 Table 4.104 – Impacts on Hydropower Revenues Compared to No Action. .........................4-243 Table 4.105 – Impacts on Navigation Benefits Compared to No Action. ...............................4-245 Table 4.106 – Annual Recreation Impacts Compared to No Action. .....................................4-247 Table 4.107 – Annual Household Repayment Rates in the Service Area..............................4-250 Table 4.108 – Repayment Costs of Each Alternative as a Percentage of a Typical
Water Bill. ..............................................................................................................4-251 Table 4.109 – Typical Monthly Residential Water Bills as a Percentage of Median
Household Income. ...............................................................................................4-251 Table 5.1 – Resource Meeting Topic, Attendees, Dates and Locations. ...................................5-6
List of Figures
Figure 1.1 – The Proposed Project is in the Red River Basin in North Dakota and Minnesota..................................................................................................................1-1
Figure 1.2 – Area of the Proposed Project.................................................................................1-3 Figure 1.3 – Sequence of Events in DWRA that Pertain to the Project. ..................................1-23 Figure 2.1 – Graph Illustrating the Difference Between Surface Water Supply and the
Future Fargo-Moorhead Water Demand During a 1934 Flow Year ..........................2-3 Figure 2.2 – No Action Alternative ...........................................................................................2-16 Figure 2.3 – Biota Water Treatment Processes Previously Considered in DEIS.....................2-20 Figure 2.4 – In-Filter DAF Biota Water Treatment Process Suggested by the Province of
Manitoba. ................................................................................................................2-21 Figure 2.5 – North Dakota In-Basin Alternative. ......................................................................2-31 Figure 2.6 – Red River Basin Alternative. ................................................................................2-35 Figure 2.7 – GDU Import to Sheyenne River Alternative. ........................................................2-40 Figure 2.8 – GDU Import Pipeline Alternative. .........................................................................2-44 Figure 2.9 – Missouri River Import to Red River Valley Alternative. ........................................2-48 Figure 3.1 – Ecoregions in the Project’s Area of Potential Effects.............................................3-2 Figure 3.2 – Area of Potential Effect of the Project. ...................................................................3-4 Figure 3.3 – Lake Ashtabula Pools as Defined in the Corps’ Operating Plan............................3-6 Figure 3.4 – Sheyenne River Watershed...................................................................................3-7 Figure 3.5 – Glacial Lake Agassiz (from Krenz and Leitch 1993). .............................................3-7 Figure 3.6 – The Red River Flows North Into Lake Winnipeg in Manitoba, Canada..................3-9 Figure 3.7 – Missouri River Drainage System and U.S. Army Corps of Engineers’ System
Dams. ......................................................................................................................3-12 Figure 3.8 – Map of the Storage Capacity of Corps of Engineers in the U.S. Showing the
Missouri River Reservoirs as the Largest in North America....................................3-13 Figure 3.9 – GDU Principal Supply Works, except for New Rockford Canal, Which is
Outside the Scope of this Project. ...........................................................................3-19 Figure 3.10 – Potentially Affected Aquifers..............................................................................3-32 Figure 3.11 – Groundwater Appropriations and Historic Use From Select Aquifers in North
Dakota. ....................................................................................................................3-33 Figure 3.12 – Groundwater Use for the Year 2003 From Select Aquifers in Minnesota. .........3-41 Figure 3.13 – Sheyenne River Reaches Investigated by Reclamation (2003a). .....................3-43
xii

Red River Valley Water Supply Project SDEIS
Figure 3.14 – Distribution of New Zealand Mudsnail is in the Western U.S. in 1995 and 2006. .......................................................................................................................3-61
Figure 3.15 – Map of Major Existing Water Transfers Between the Hudson Bay Basin and the Missouri River, Mississippi River, and Great Lakes Basins. .............................3-62
Figure 3.16 – Overview Map of the Project Area of Potential Effects. .....................................3-96 Figure 3.17 – Number of Cultural Resources by Type per Alternatives...................................3-99 Figure 3.18 – Map of Missouri River Basin Indian Tribes. .....................................................3-104 Figure 4.1– Projected Change in the Palmer Drought Severity Index Over The 21st Century,
Based on Two Widely Used Models..........................................................................4-5 Figure 4.2– Location of Key Gages Analyzed Along the Sheyenne and Red Rivers. ...............4-8 Figure 4.3– Lake Ashtabula Average Monthly Volumes During a Drought 1931 – 1940.........4-10 Figure 4.4– Lake Ashtabula Monthly Volumes During 1934....................................................4-10 Figure 4.5– Average Monthly Flows Near Kindred, North Dakota During a Drought
1931 – 1940. ...........................................................................................................4-12 Figure 4.6– Average Monthly Flows Near Kindred, North Dakota During 1934.......................4-12 Figure 4.7– Average Monthly Flows at Fargo, North Dakota, During a Short-term Drought
1931 – 1940. ...........................................................................................................4-16 Figure 4.8– Average Monthly Flows at Fargo, North Dakota During 1934. .............................4-16 Figure 4.9– Average Monthly Flows at Emerson, Manitoba, During a Drought
1931 – 1940. ...........................................................................................................4-17 Figure 4.10– Average Monthly Flows at Emerson, Manitoba in 1934. ....................................4-17 Figure 4.11– Comparison of Average Monthly Volumes in Lake Ashtabula (1931 – 2001).....4-22 Figure 4.12– Comparison of Average Monthly Flows on the Sheyenne River Near Kindred
for the Project Alternatives 1931 – 2001. ................................................................4-25 Figure 4.13– Comparison of Average Monthly Flows on the Red River at Fargo for All
Project Alternatives 1931 – 2001. ...........................................................................4-27 Figure 4.14 – Comparison of Average Monthly Flows on the Red River at Emerson,
Manitoba, for all Project Alternatives, 1931 – 2001.................................................4-28 Figure 4.15 – Typical River Cross-Section Showing Bankfull and the Floodplain. ..................4-34 Figure 4.16 – An Example of How the Historic Hydrograph Was Used to Extract Daily
Flow Data From Modeled Data For USGS Gage 5059000 on the Sheyenne River Near Kindred, North Dakota...........................................................................4-36
Figure 4.17 – Missouri River Basin Storage Comparison (1930-1944). ..................................4-46 Figure 4.18 – Missouri River Basin Storage Comparison Between Import Alternatives
(1930 - 1944)...........................................................................................................4-47 Figure 4.19 – Mainstem Project Storage. ................................................................................4-48 Figure 4.20 – Average Annual Total Flood Control Benefits, 1930s-Type Drought. ................4-48 Figure 4.21 – Average Annual Total Water Supply Benefits, 1930-1941. ...............................4-49 Figure 4.22 – Site Locations Discussed in Water Quality Modeling Results............................4-56 Figure 4.23 – Simulated TDS Concentrations for Steady Flow on the Sheyenne River. .........4-59 Figure 4.24 – Simulated Sulfate Concentrations for Steady Flow on the Sheyenne River. .....4-60 Figure 4.25 – Simulated Chloride Concentrations for Steady Flow on the Sheyenne River....4-60 Figure 4.26 – Simulated TDS for Steady Flow on the Red River.............................................4-62 Figure 4.27 – Simulated Sulfate Concentrations for Steady Flow on the Red River................4-62 Figure 4.28 – Simulated Chloride Concentrations for Steady Flow on the Red River. ............4-63 Figure 4.29 – Simulated TDS Concentrations for Unsteady Flow on the Sheyenne River. .....4-65 Figure 4.30 – Simulated Sulfate Concentrations for Unsteady Flow on the Sheyenne
River. .......................................................................................................................4-66 Figure 4.31 – Simulated Chloride Concentrations for Unsteady Flow on the Sheyenne
River. .......................................................................................................................4-66
xiii

Red River Valley Water Supply Project SDEIS
Figure 4.32 – Simulated Sodium Concentrations for Unsteady Flow on the Sheyenne River. .......................................................................................................................4-67
Figure 4.33 – Simulated Total Phosphorus Concentrations for Unsteady Flow on the Sheyenne River.......................................................................................................4-67
Figure 4.34 – Median TDS Concentrations for Unsteady Flow on the Red River....................4-68 Figure 4.35 – Median Sulfate Concentrations for Unsteady Flow on the Red River................4-69 Figure 4.36 – Median Chloride Concentrations for Unsteady Flow on the Red River..............4-70 Figure 4.37 – Median Sodium Concentrations for Unsteady Flow on the Red River...............4-70 Figure 4.38 – Median Total Phosphorus Concentrations for Unsteady Flow on the Red
River. .......................................................................................................................4-71 Figure 4.39 – Proposed Brightwood, Gwinner, Spiritwood, and Milnor Channel Wellfield.......4-89 Figure 4.40 – Approximate Locations of Proposed ASR Well Sites in the West Fargo
North Aquifer. ..........................................................................................................4-92 Figure 4.41 – Approximate Locations of Proposed ASR Wells in the Fargo South Aquifer.....4-93 Figure 4.42 – Buffalo Aquifer, Existing Well, Proposed Wells, and Surrounding Features......4-94 Figure 4.43 – Moorhead Aquifer and Associated Features. ....................................................4-95 Figure 4.44 – Proposed Wellfield Pelican River Sand-Plain and Otter Tail Surficial
Aquifers. ..................................................................................................................4-96 Figure 4.45 – Relationship between Flow and Habitat for Longnose Dace Spawning at
the Lisbon Site on the Sheyenne River. ...............................................................4 -104 Figure 4.46 – 10th Percentile Flow and Habitat for Representative Fish Species with
Minimal Habitat from the Aquatic Needs Analysis.................................................4-104 Figure 4.47 – A “Bathtub Curve” Represents the Lifetime Distribution of Failures for Many
Engineering Systems. ...........................................................................................4-128 Figure 4.48 – 10,000-day Simulation of the Life-Time Distribution of Control System
Failures. ................................................................................................................4-134 Figure 4.49 – Comparison of Invasion Probabilities With Effective Treatment ......................4-136 Figure 4.50 – Current distribution of New Zealand Mudsnail in North America. ....................4-145 Figure 4.51 – Predicted Distribution of New Zealand Mudsnail in North America. ................4-146 Figure 4.52 – Bar Chart Comparing Number of Cultural Resources Recorded in the Area
of Potential Effects of the Alternatives in North Dakota and Minnesota. ...............4-208 Figure 4.53 – Bar Chart Comparing the Density by Action Alternatives of Recorded
Cultural Resources per Square Mile. ....................................................................4-209 Figure 4.54 – Economic Impact Region of the Proposed Project. .........................................4-222
xiv

Red River Valley Water Supply Project FEIS Chapter One Purpose and Need
Chapter One Purpose and Need
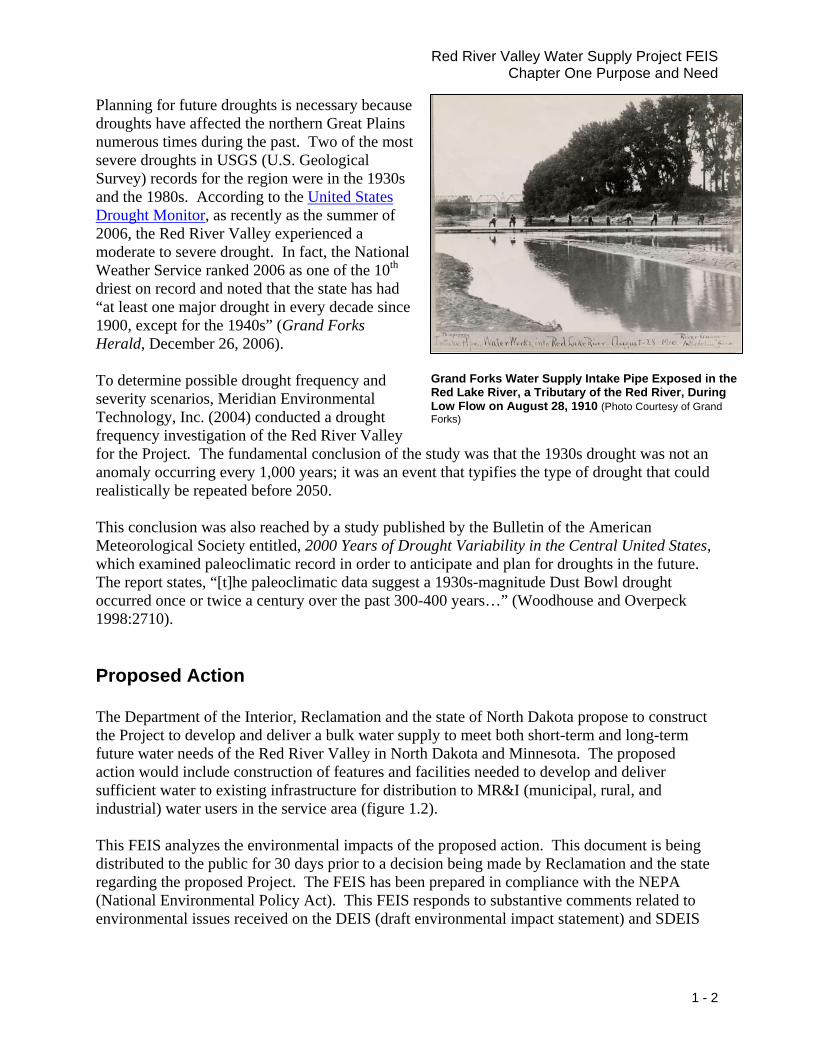
Introduction The proposed Project (Red River Valley Water Supply Project) is located in the Red River Valley in the Red River Basin in North Dakota and Minnesota (figure 1.1). Most of the people living in the Red River Valley rely on the drought-prone Red River of the North and its tributaries as their primary or sole source of water (figure 1.1). Studies predict that the present water supplies would be inadequate during a severe drought similar to one that occurred in the Red River Valley during the 1930s. For example, in 1934 there were nearly five consecutive months of zero flow in the Red River at Fargo, North Dakota. During such a shortage, it would take 1,200 truckloads of water per day to supply Fargo’s basic indoor household water needs. That is a truckload of water arriving every minute around the clock forfive months to meet the current water needs. Given the predicted future population growth in the valley, the projected water supply shortages will become even greater in the future (see Reclamation (Bureau of Reclamation) 2005a). The proposed Project would supply water to meet the comprehensive water needs of people and industries in the Red River Valley through the year 2050. Analyses in this FEIS (final environmental impact statement) focus on water shortages that would occur during a drought similar in severity to the 1930s. The water demands include future projected increases in population and industrial growth.
Without the Project During a 1930s-Type Drought, 1,200 Truckloads of Water Would Be Needed Each Day in Fargo to Supply Basic Indoor Water Needs
Figure 1.1 – The Proposed Project is in the Red River Basin in North Dakota and Minnesota.
1 - 1
Red River Valley Water Supply Project FEIS Chapter One Purpose and Need
Planning for future droughts is necessary because droughts have affected the northern Great Plains numerous times during the past. Two of the most severe droughts in USGS (U.S. Geological Survey) records for the region were in the 1930s and the 1980s. According to the United States Drought Monitor, as recently as the summer of 2006, the Red River Valley experienced a moderate to severe drought. In fact, the National Weather Service ranked 2006 as one of the 10th driest on record and noted that the state has had “at least one major drought in every decade since 1900, except for the 1940s” (Grand Forks Herald, December 26, 2006). To determine possible drought frequency and severity scenarios, Meridian Environmental Technology, Inc. (2004) conducted a drought frequency investigation of the Red River Valley for the Project. The fundamental conclusion of the study was that the 1930s drought was not an anomaly occurring every 1,000 years; it was an event that typifies the type of drought that could realistically be repeated before 2050. This conclusion was also reached by a study published by the Bulletin of the American Meteorological Society entitled, 2000 Years of Drought Variability in the Central United States, which examined paleoclimatic record in order to anticipate and plan for droughts in the future. The report states, “[t]he paleoclimatic data suggest a 1930s-magnitude Dust Bowl drought occurred once or twice a century over the past 300-400 years…” (Woodhouse and Overpeck 1998:2710). Proposed Action The Department of the Interior, Reclamation and the state of North Dakota propose to construct the Project to develop and deliver a bulk water supply to meet both short-term and long-term future water needs of the Red River Valley in North Dakota and Minnesota. The proposed action would include construction of features and facilities needed to develop and deliver sufficient water to existing infrastructure for distribution to MR&I (municipal, rural, and industrial) water users in the service area (figure 1.2). This FEIS analyzes the environmental impacts of the proposed action. This document is being distributed to the public for 30 days prior to a decision being made by Reclamation and the state regarding the proposed Project. The FEIS has been prepared in compliance with the NEPA (National Environmental Policy Act). This FEIS responds to substantive comments related to environmental issues received on the DEIS (draft environmental impact statement) and SDEIS
Grand Forks Water Supply Intake Pipe Exposed in the Red Lake River, a Tributary of the Red River, During Low Flow on August 28, 1910 (Photo Courtesy of Grand Forks)
1 - 2

Red River Valley Water Supply Project FEIS Chapter One Purpose and Need
(supplemental draft environmental impact statement) with revisions in text, appendixes, and responses to comments in Appendix M.1.
Purpose and Need The proposed Project would supply water to meet the needs of people and industries in the Red River Valley through the year 2050. The purpose of the proposed action in this FEIS was established by Congress and is defined to meet the “comprehensive water quality and quantity needs of the Red River Valley” through year 2050 [DWRA (Dakota Water Resources Act) Section 8(c)(2)(A)]. The quality and quantity needs are defined by DWRA as MR&I water supplies, water quality, aquatic environment, recreation, and water conservation measures [DWRA Section 8(b)(2)]. The DWRA only authorizes construction of features that meet water supply needs, including MR&I water supply demands, groundwater recharge, and streamflow augmentation [Section 8(a)(2)].
Figure 1.2 – Area of the Proposed Project.
1 - 3

Red River Valley Water Supply Project FEIS Chapter One Purpose and Need
MR&I Water Supply Need Studies indicate there is a need to provide water to people and industries in the service area, which includes the 13 eastern counties of North Dakota, plus the Minnesota communities of Breckenridge, Moorhead, and East Grand Forks (figure 1.2). The 2000 census population of the service area is 315,522, and the current water demand is 65,664 ac-ft (acre-feet). The estimated population in the service area in 2050 would be 479,252, and total maximum annual MR&I water demand would be 113,702 ac-ft. This water demand includes water for recreation and incorporates water conservation measures. The quantification of this water demand was accomplished in the Final Needs and Options Report (Reclamation 2005a). The water demand was limited to water for municipalities, rural water systems, industries, and recreation. The Project’s authorizing legislation, DWRA, specifically precluded irrigation from the Project.
1 - 4
These needs were quantified in the Final Needs and Options Report (Final Report on Red River Valley Water Needs and Options), which is a needs assessment and engineering study (Reclamation 2005a). This report was prepared and published pursuant to DWRA Section 8(b). These needs, which address water resource sustainability, were considered in formulating and evaluating alternatives. Water resource sustainability is the necessary planning and management of water resources to provide an adequate supply of high quality water while providing for the economic, environmental, and social needs of future generations (Kenel and Schlaman 2005). The needs for the proposed action are described in the following section in the order specified in the DWRA: MR&I water supplies, water quality, aquatic environment, recreation, and water conservation measures.
Water Quantity Terms Acre-Foot (ac-ft) - An ac-ft is the volume of water that would cover 1 acre to a depth of 1 foot, which equals 43,560 cubic feet of water or 325,851 gallons. At its normal summer operating level, Lake Ashtabula holds about 70,000 ac-ft of water. Ac-ft is also used to quantify the volume of groundwater held in storage in an aquifer. Cubic Feet per Second (cfs) - Represents the rate at which water flows in a river, pipeline, or from a well. A cubic foot of water is equal to 7.48 gallons. If 1,000 cfs of water from Baldhill Dam were released for an entire day, that would equal 86.4 million cubic feet of water or 1,983 ac-ft/day. Millions of Gallons per Day (mgd) - This term is used when discussing water treatment plant capacity. For example, a water treatment plant has a capacity of 30 million gallons/day. This means that the water treatment plant can treat a volume of 30 million gallons of water in one day. Conversion Factors 1 cfs for a year = 724 ac-ft 1 ac-ft = 325,851 gallons 1 million gallons/day = 1.55 cfs for a day Water Demand = population x (per capita water demand – water conservation) + industrial water demands + recreation consumptive use. Water Shortage = water demand – available water (without the Project).
Estimating MR&I Water Demand The year 2050 maximum annual future water demand for the Red River Valley service area is projected to be 113,702 ac-ft, as shown in table 1.1. This is the Scenario One water demand in the Final Needs and Options Report. Water conservation savings of 4,300 ac-ft are included in this water demand (see the water conservation needs section in this chapter).

Red River Valley Water Supply Project FEIS Chapter One Purpose and Need
Table 1.1 summarizes five categories of water demands. The rural water system category includes future water demands for 12 rural water systems in North Dakota. Thirteen cities are included in the North Dakota municipal demands, and three cities are in the Minnesota municipal demands. Although there currently are more independent municipal water systems in the North Dakota portion of the Red River Valley, a review of these water systems estimated that only 13 would be independent systems by 2050. It was assumed that in the future the other smaller municipal systems likely would be served by the 12 rural water systems. Future municipal and rural water demands were estimated by multiplying Reclamation’s population estimates for the Red River Valley (Reclamation 2003b) by the per-capita municipal and rural water demands, which were reduced by water conservation (Reclamation 2005a; Reclamation 2004b). Water conservation would save approximately 1.4 billion gallons (4,300 ac-ft) of water annually Project-wide. A more detailed discussion of these conclusions is in section 2.1 of the Final Needs and Options Report (Reclamation 2005a). Industrial water demands include known historic uses and future demand estimates. Existing industries’ water demand estimates were based on historic water use in the service area. Future industrial water demands are discussed in the Industrial Water Needs Assessment for the Red River Valley Water Supply Project (Bangsrud and Leistritz 2004). The intermediate industrial demand scenario from this report was used in the water demand estimates. Future consumptive use for recreation water demands is the last category listed in table 1.1. Existing recreation water demands are included in municipal and rural water demands. When planning a water system, engineers also determine the peak-day water demand, which is the most water that a system would need in a day based upon historic use. Peak-day deliveries were developed to formulate alternatives, as discussed in chapter two, to ensure the alternatives would be adequately sized to meet all demand situations. The method for estimating peak-day demands is explained in section 2.2 of the Final Needs and Options Report (Reclamation 2005a). Potential options for meeting peak-day water demands were considered during alternative formulation, including increasing pipeline capacity, providing additional storage, and/or finding alternative sources of groundwater.
Table 1.1 – 2050 Maximum Annual Water Demands.2050 Maximum Annual Water Water Demand Demand (ac-ft)
Rural Water 8,804 North Dakota Municipal 68,165 Minnesota Municipal 11,276 Industrial 25,039Future Recreation1 417
Total 113,702
Data summarized from table 2.11.3, chapter two, Final Needs and Options Report (Reclamation 2005a). 1 Existing recreation is included in rural and municipal water demands.
1 - 5

Red River Valley Water Supply Project FEIS Chapter One Purpose and Need
Water Quality Need There is a need to meet water quality standards in the Red River Valley. Analyses of surface water quality are based upon current North Dakota and Minnesota standards established under the CWA (Clean Water Act). The most likely future federal drinking water standards that would be promulgated under the SDWA (Safe Drinking Water Act) for MR&I systems by 2050 are identified in Water Quality Needs, Regulatory Overview of the Safe Drinking Water Act (Reclamation 2003d). All Project water sources considered generally meet the current CWA standards and after treatment meet current and projected SDWA standards.
Fargo Water Treatment Plant
Historic water quality in the Red River Valley is discussed in the USGS report, Quality of Streams in the Red River of the North Basin, Minnesota, North Dakota, and South Dakota (Tornes 2005). USGS found that historically water quality in the Red River Basin was generally suitable for intended uses, but there have been exceedances of standards or criteria. Most exceedances were brief, and many occurred prior to current levels of wastewater treatment. The report states, “concentrations of major ions, including sulfate and specific conductance, have approached and occasionally exceeded water quality standards or criteria and may continue to do so. These exceedances are to be expected because of base flow that is sustained from groundwater discharge from several aquifers, some of which are known to contain high concentrations of dissolved salts that contain sulfate and other ions” (Tornes 2005:2). Given the generally adequate historic and predicted future water quality in streams, the water quality need identified through the Needs and Options Report and other studies did not significantly influence development of Project alternatives. Water System Assessment Executive Summary Final Report (Reclamation 2004c) evaluated municipalities with a population of 500 or more and assumed that smaller communities would be served by rural water systems by the year 2050. All of the MR&I water systems in the Red River Valley currently meet National Primary Drinking Water Regulations; however, a few have changed their water sources to comply with the lower arsenic regulation. Other systems will be required to make significant treatment upgrades to meet the recently implemented and future drinking water regulations governing filtration, disinfection, and disinfection byproducts. Some of the MR&I water systems currently have problems meeting non-enforced National Secondary Drinking Water Regulations for total dissolved solids, pH, and sulfate. All of these issues can be addressed with readily available treatment technologies under any of the proposed alternatives. Although lead and mercury were occasionally reported in the USGS data, these detections may have been the result of sample contamination. More recent studies show that concentrations of these trace elements generally are below detection limits. Current water quality in the Red River Valley is described in chapter three in the surface water quality and groundwater sections.
1 - 6

Red River Valley Water Supply Project FEIS Chapter One Purpose and Need
Aquatic Environment Need Aquatic needs are one of the water needs identified in the purpose and need for the Project. An aquatic need is a non-consumptive use of water. Aquatic needs take the form of flow targets or minimum volumes of water that would be reserved for aquatic use. The FEIS includes two approaches for defining the aquatic need for the Red River Valley study area: 1) a basic aquatic need and 2) target flows on the Sheyenne and Red Rivers recommended by North Dakota Game and Fish Department. All the action alternatives developed in the Final Needs and Options Report (Reclamation 2005a) included a basic aquatic need, which is maintenance of a minimum Fish and Wildlife Conservation Pool of 28,000 ac-ft (1257 msl (mean sea level)) in Lake Ashtabula and a minimum release of 13 cfs from Baldhill Dam. Lake Ashtabula is a reservoir behind Baldhill Dam that was constructed by the Corps (Corps of Engineers) on the Sheyenne River near Valley City, North Dakota (figure 1.2). The 13 cfs flow is released by the Corps in their operation of Baldhill Dam. All the alternatives were modeled and designed to meet this basic aquatic need. The North Dakota Game and Fish Department also recommended minimum flows for aquatic needs as follows: • A minimum release of 23 cfs from Baldhill Dam year round. • A minimum spring flush of 215 cfs on the Sheyenne River for a period of 48-72 hours from
April 6-10. • A minimum average flow of 69 cfs on the Sheyenne River below Baldhill Dam in April. • Year round instream flows of 68 cfs at Fargo on the Red River. • Year round instream flows of 23 cfs below the Fargo intake on the Sheyenne River. Chapter four, aquatic communities section, and Appendix B.1 discuss how often the North Dakota Game and Fish Department aquatic flow recommendations would be met by the alternatives.
Release of 17 cfs From Baldhill Dam at Lake Ashtabula
Recreation Need Recreation water needs are split into consumptive and non-consumptive water needs in the Recreation Needs Assessment, Final Report (Reclamation 2003c). Consumptive recreation water needs are those that require withdrawal of surface water or groundwater for watering recreation facilities. By 2050 in North Dakota, the maximum annual consumptive
Fishing Is a Non-Consumptive Recreation Water Need
1 - 7
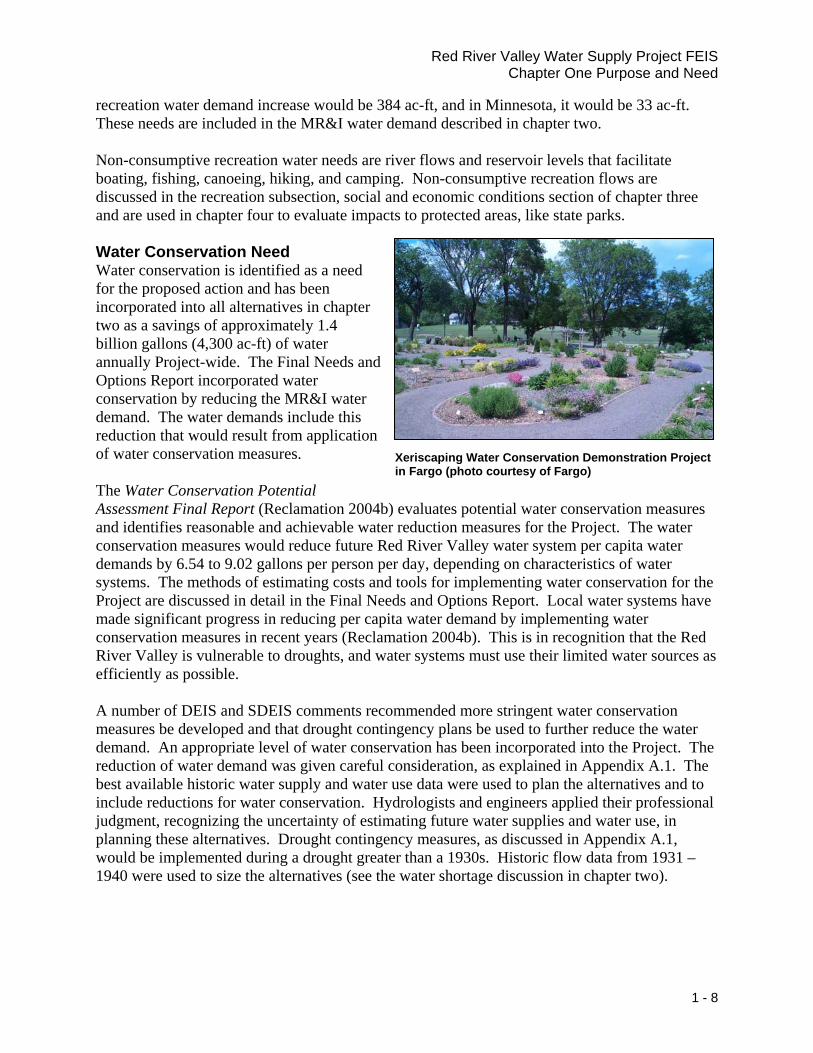
Red River Valley Water Supply Project FEIS Chapter One Purpose and Need
recreation water demand increase would be 384 ac-ft, and in Minnesota, it would be 33 ac-ft. These needs are included in the MR&I water demand described in chapter two. Non-consumptive recreation water needs are river flows and reservoir levels that facilitate boating, fishing, canoeing, hiking, and camping. Non-consumptive recreation flows are discussed in the recreation subsection, social and economic conditions section of chapter three and are used in chapter four to evaluate impacts to protected areas, like state parks. Water Conservation Need Water conservation is identified as a need for the proposed action and has been incorporated into all alternatives in chapter two as a savings of approximately 1.4 billion gallons (4,300 ac-ft) of water annually Project-wide. The Final Needs and Options Report incorporated water conservation by reducing the MR&I water demand. The water demands include this reduction that would result from application of water conservation measures. The Water Conservation Potential Assessment Final Report (Reclamation 2004b) evaluates potential water conservation measures and identifies reasonable and achievable water reduction measures for the Project. The water conservation measures would reduce future Red River Valley water system per capita water demands by 6.54 to 9.02 gallons per person per day, depending on characteristics of water systems. The methods of estimating costs and tools for implementing water conservation for the Project are discussed in detail in the Final Needs and Options Report. Local water systems have made significant progress in reducing per capita water demand by implementing water conservation measures in recent years (Reclamation 2004b). This is in recognition that the Red River Valley is vulnerable to droughts, and water systems must use their limited water sources as efficiently as possible. A number of DEIS and SDEIS comments recommended more stringent water conservation measures be developed and that drought contingency plans be used to further reduce the water demand. An appropriate level of water conservation has been incorporated into the Project. The reduction of water demand was given careful consideration, as explained in Appendix A.1. The best available historic water supply and water use data were used to plan the alternatives and to include reductions for water conservation. Hydrologists and engineers applied their professional judgment, recognizing the uncertainty of estimating future water supplies and water use, in planning these alternatives. Drought contingency measures, as discussed in Appendix A.1, would be implemented during a drought greater than a 1930s. Historic flow data from 1931 – 1940 were used to size the alternatives (see the water shortage discussion in chapter two).
Xeriscaping Water Conservation Demonstration Project in Fargo (photo courtesy of Fargo)
1 - 8

Red River Valley Water Supply Project FEIS Chapter One Purpose and Need
Authorization and History
The DWRA (Public Law 106-554) provides the underlying authority for the Project. Section 8 directs the Secretary of the Interior to conduct a comprehensive study of the water quality and quantity needs of the Red River Valley in North Dakota and possible options for meeting those needs. It also directs the Secretary of the Interior and the state of North Dakota to “jointly prepare and complete a draft environmental impact statement concerning all feasible options to meet the comprehensive water quality and quantity needs of the Red River Valley and the options for meeting those needs including delivery of Missouri River water to the Red River Valley” [Section 8(c)(2)(A)]. The DWRA only authorizes the construction of features that meet water supply requirements, including MR&I water supply needs, groundwater recharge, and streamflow augmentation [Section 8(a)(2)]. If the Secretary of the Interior selects an alternative that includes the delivery of Missouri River water, additional Congressional approval is required prior to commencing construction of such an alternative [Section 8(a)(3)(B)]. Under this authority, two documents have been prepared to assist with planning and decision-making related to the Project: (1) the Final Needs and Options Report and (2) this EIS. The first is a needs assessment and engineering study prepared by Reclamation, on behalf of the Secretary. Reclamation (the lead Federal agency) and the state of North Dakota, represented by Garrison Diversion (Garrison Diversion Conservancy District) jointly prepared the second document, the EIS. The DWRA is an amendment to previous legislation. In 1944 the U.S. Congress passed the Flood Control Act (of which the Missouri-Basin Pick Sloan Act is a part), which authorized construction of dams on the Missouri River and its tributaries. The initial stage of GDU (Garrison Diversion Unit) was authorized in 1965, and construction began in 1967. The GDU project was designed to divert Missouri River water to central and eastern North Dakota for irrigation, municipal and industrial water supply, fish and wildlife conservation and development, recreation, flood control, and other project purposes. Most of the currently authorized GDU Principal Supply Works have been completed (Snake Creek Pumping Plant, McClusky Canal, and New Rockford Canal). Lonetree Reservoir, which would have connected the McClusky and New Rockford Canals, has been deauthorized (DWRA Section 2(i)(5)). McClusky Canal currently delivers water for fish and wildlife, recreation, and irrigation. Although the canal was constructed to cross into the Hudson Bay Basin, a plug at mile marker 59 blocks flow out of the Missouri River Basin, in accordance with an agreement with Canada (figure 1.2). New Rockford Canal has never been put into service. The GDU project was reauthorized in 1986, which reduced emphasis on irrigation and increased emphasis on meeting the MR&I water needs throughout North Dakota. The 1986 Reformulation Act, which amended the 1965 Act, authorized a Sheyenne River water supply and release feature, including a water treatment plant, capable of delivering 100 cfs of water to eastern North
1 - 9

Red River Valley Water Supply Project FEIS Chapter One Purpose and Need
Dakota. Appraisal-level studies of water needs and options in the Red River Valley began in 1994 and were completed in 2000 under the direction of the Executive Steering Committee, North Dakota Water Management Collaborative Process. These studies laid the foundation for the Final Needs and Options Report, which was authorized by the DWRA. Study Approach Needs and Options Report Reclamation began evaluating existing and future water needs of the Red River Valley under the authority of the 1986 Reformulation Act prior to passage of the DWRA. The first phase of this investigation was completed in April 1998 with an appraisal-level MR&I water needs assessment (Reclamation 1998). An additional aspect of the first phase was the Instream Flow Needs Assessment (Reclamation 1999b). In January 2000, an appraisal-level study of alternatives to meet the MR&I needs was completed (Reclamation 2000b). Reclamation entered into an agreement with the USGS in June 2000 to update the Sheyenne and Red River databases, compile existing water quality data for the study area, and identify any relevant data gaps.
Previous Red River Study Reports
Preliminary work on the next phase of Red River Valley studies began in June 2000, under a Memorandum of Understanding signed by Reclamation, North Dakota State Water Commission, and Garrison Diversion under the authority of the 1986 GDU Reformulation Act (P.L. 99-294). Two teams of stakeholders (Technical Team and Study Review Team) were organized, and study planning was initiated. Gubernatorial designees from states that could be affected by the Project and representatives of federal, tribal, state, local agencies, and environmental groups were invited to serve on the teams. The two stakeholder teams were consolidated into a single Technical Team whose members continued to review and comment on plans of study and draft reports for the Final Needs and Options Report. After completion, the Draft Needs and Options Report was distributed to the Technical Team, the public, and potentially affected states for a 120-day review mandated by the DWRA. The Final Needs and Options Report served as the source of needs assessment information and alternatives analyzed in the DEIS. Partnership with the State of North Dakota In a 2002 memorandum of understanding with Reclamation, Governor John Hoeven authorized Garrison Diversion to be the state's primary contact and to serve as joint lead for North Dakota on the Project EIS. Garrison Diversion is an instrumentality/political subdivision of the state of North Dakota, created by Chapter 61-24 of the North Dakota Century Code, which states that it is “to make available within the district, waters diverted from the Missouri River for irrigation, domestic, municipal, and industrial needs, and for hydroelectric power, recreation, fish, wildlife,
1 - 10

Red River Valley Water Supply Project FEIS Chapter One Purpose and Need
and other beneficial and public uses” (61-24-01(4)). Garrison Diversion consists of 28 North Dakota counties, with a mission statement "to provide a reliable, high quality and affordable water supply for the benefit of North Dakota." The memorandum of understanding is posted on the Project web site at www.rrvwsp.com and attached as a supporting document. Reclamation, as the lead federal agency, and Garrison Diversion, on behalf of the State, acted as joint lead agencies in conducting environmental analyses, preparing this FEIS, and involving the public. Roles and responsibilities of each agency are described in the memorandum of understanding. Garrison Diversion is responsible for coordination with North Dakota state agencies. Reclamation is responsible for federal oversight of the preparation and content of the EIS and coordination with other federal agencies, tribes, and State Historic Preservation Offices. Lake Agassiz Water Authority Lake Agassiz Water Authority was created by the North Dakota state legislature to provide for the supply and distribution of water to the people in the Red River Valley in North Dakota. The board of directors consists of five municipal representatives and five water district representatives. It was also formed to provide a voice for the “affected local communities” in the process of selecting an alternative to meet the water needs of the Red River Valley (see “what comes next?” section). Lake Agassiz Water Authority has provided comments throughout the EIS study process from the users’ perspective. If an action alternative is selected in the ROD (Record of Decision), according to North Dakota Century Code 61-39-01, Garrison Diversion would construct the Project using local, state, and federal funds. Garrison Diversion would contract with Reclamation for the delivery of water and repayment of GDU project costs. Garrison Diversion would enter into one or more contracts with Lake Agassiz Water Authority for bulk water delivery. Lake Agassiz Water Authority “may enter into water supply contracts with member cities and water districts for the resale of this water for consumption within or outside the state” (North Dakota Century Code 61-39-01). Cooperating Agencies A Cooperating Agency Team was established to provide data, assist in review, conduct analyses, and contribute to the EIS (table 1.2). Federal, tribal, state, and local governmental agencies were invited to be cooperating agencies if they had jurisdiction by law or special expertise with respect to any environmental impact related to this proposed federal action. Cooperating agencies participated in meetings, shared information about resources, helped refine alternatives and analyze impacts, and reviewed preliminary draft chapters of the DEIS. Table 1.2 – EIS Cooperating Agencies.
U.S. Army Corps of Engineers North Dakota State Historic Preservation U.S. Environmental Protection Agency Office U.S. Fish and Wildlife Service Minnesota Department of Natural Resources U.S. Forest Service Lake Agassiz Water Authority U.S. Geological Survey Cities of Fargo, West Fargo, Grand Forks, Three Affiliated Tribes and Moorhead
1 - 11

Red River Valley Water Supply Project FEIS Chapter One Purpose and Need
Scope of the EIS The Council on Environmental Quality regulations for implementing NEPA defines the scope of an EIS as consisting of the range of actions, alternatives, and potential impacts to be considered. The planning horizon for the Project is the year 2050, which is the temporal scope of the Project. This date was selected based on projections used in the Final Needs and Options Report. Planning a water supply system for the year 2050 is consistent with the typical service life of project features, such as water treatment plants, pumping plants, and storage reservoirs. Actions Within the Geographic Scope The FEIS considers actions within the geographic scope of the Project that may be connected, cumulative, or similar. Connected actions are those that automatically trigger other actions that cannot, or will not, proceed unless other actions are taken previously or simultaneously. These actions could be interdependent parts of a larger action and depend on the larger action for their justification. Cumulative actions are “other past, present, and reasonably foreseeable future actions regardless of what agency (Federal or non-Federal) or person undertakes such other actions” (40 CFR Section 1508.7). Similar actions, which when viewed with other reasonably foreseeable or proposed agency actions, have similarities that provide a basis for evaluating their environmental consequences together, such as common timing or geography. A cumulative action was identified in the Red River Basin. The cumulative effects of a Devils Lake Outlet are considered and discussed in the “Red River Basin surface water quantity” and “surface water quality” sections in chapter four and in Appendix B.1. Devils Lake is located in a 3,810-square-mile closed basin watershed in northeastern North Dakota (figure 1.2). Devils Lake has risen approximately 26 feet since 1993 causing regional flooding. To alleviate flooding, the state of North Dakota has constructed a state-funded outlet, and the Corps has issued a ROD for a federal outlet, but it has not been constructed. Both outlets and the Project would use the Sheyenne and Red Rivers to transport water, so the reasonably foreseeable cumulative effects of the Project and the Devils Lake Outlet are evaluated in this FEIS. Analysis of future depletions from the Missouri River system are described in Appendix C, and the cumulative effects of those depletions are discussed in the appropriate resource sections in chapter four. Actions Outside the Scope of the EIS The following actions are outside the scope of this FEIS:
An inlet to Devils Lake: Devils Lake is a sub-basin that was proposed to receive water from the Missouri River in previous GDU authorizations, but DWRA Section 8(f) prohibits funding for any facility that would transfer Missouri River water to Devils Lake. It states, “No funds authorized under this Act may be used to carry out the portion of the feasibility study of the Devils Lake Basin, North Dakota, authorized under the Energy and Water Development Appropriations Act of 1993 (Public Law 102-377), that addresses the needs of the area for stabilized lake levels through inlet controls, or to otherwise study any facility or carry
1 - 12

Red River Valley Water Supply Project FEIS Chapter One Purpose and Need
out any activity that would permit the transfer of water from the Missouri River drainage basin into Devils Lake, North Dakota.” Nearly identical language in the 2003 Energy and Water Development Appropriations Act prohibits funding for construction of an inlet by the Corps of Engineers. Because DWRA is an amendment to the original authorizing legislation for Garrison Diversion, the prohibition against using “funds authorized under this Act . . . to carry out any activity that would permit the transfer of water from the Missouri River drainage basin into Devils Lake” includes the use of previously constructed GDU facilities. The GDU Principal Supply Works, including the Snake Creek Pumping Plant, McClusky Canal, and New Rockford Canal, were constructed with “funds authorized under this Act.” Therefore, these facilities could not be used to “carry out any activity that would permit the transfer of water from the Missouri River drainage basin into Devils Lake.”
Therefore, the co-leads concluded that construction of an inlet to Devils Lake that would rely on GDU facilities as a water source is prohibited. While the repeal of these statutory prohibitions is possible, to assume such an action by Congress would be speculative. A non-federal inlet that conveys Missouri River water to Devils Lake without using the GDU Principal Supply Works has not been proposed and would be prohibitively expensive for state or local interests.
An agency need not speculate about all conceivable impacts, but it must evaluate the reasonably foreseeable significant effects of the proposed action. In this context, reasonable foreseeability means that the impact is sufficiently likely to occur that a person of ordinary prudence would take it into account in reaching a decision. Since no federal, state, or private entity has a viable plan for an inlet to Devils Lake, we have concluded that it is not a reasonably foreseeable future action, and therefore, it was not evaluated in the EIS.
Irrigation - the Project’s authorizing legislation,
DWRA, specifically precludes irrigation from the Project:
o Development of irrigation in the Hudson Bay Basin/Devils Lake Sub-Basin
DWRA Section 5(a) specifically authorizes the development of 5,000 acres of irrigation in the Oakes Test Area, 13,700 acres in the Turtle Lake service area, 10,000 acres along McClusky Canal, and 1,200 acres along New Rockford Canal. However, according to DWRA Section 5(a)(2), none of the authorized irrigation may be developed in the Hudson Bay Basin or in the Devils Lake Sub-Basin.
Development of Irrigation in the Hudson Bay Basin is Outside the Scope of the Project
1 - 13

Red River Valley Water Supply Project FEIS Chapter One Purpose and Need
o Irrigation along the McClusky Canal: Although development is authorized, irrigation along the McClusky Canal was not evaluated, because that irrigation development does not depend on any of the action alternatives and is already occurring.
o Irrigation along the New Rockford Canal:
Because the New Rockford Canal was considered but eliminated from use in any of the Project’s proposed alternatives, development of irrigated acres along the New Rockford Canal is outside the scope of this Project (see chapter two, “alternatives considered but eliminated” section).
o Irrigation in the Oakes Test Area: Actions that could supply water to the James River and the Oakes Test Area during periods of reduced water demand in the Red River Valley are outside the scope of this Project. Such water delivery would require construction of a James River release structure from one of the Missouri River import alternatives as it crosses the James River. These actions are infeasible due to the high cost of using treated water for irrigation; the unreliability of the source, because it could be delivered only when excess water was available; and potential impacts to the Arrowwood National Wildlife Refuge by two of the import alternatives. It is not reasonably foreseeable that a release structure on the James River would be built (see the “alternatives considered but eliminated” section in chapter two).
Rose Creek Bypass Feature - The Rose Creek Bypass conveyance feature is outside the
scope of the EIS and therefore not included in the alternatives (see chapter two). The Rose Creek Bypass is a local infrastructure water supply distribution feature and not considered part of a bulk water supply project. The main purpose of this feature would be to supplement flows at Fargo on the Red River to meet the 68 cfs minimum flow target recommended by the North Dakota Game and Fish Department. Due to the high cost of the feature, instead of supplementing flows, the 68 cfs target would be met by a “preclude.” Fargo and Moorhead would be precluded from withdrawing water from the Red River whenever the flows would drop below 68 cfs in order to meet the aquatic needs flow targets recommended by the North Dakota Game and Fish Department (see Appendix B.1).
Alternatives In addition to the proposed action, Reclamation considered the following alternatives: 1) No Action Alternative, as required by NEPA implementing regulations, and 2) a reasonable range of alternatives to meet the purpose and need. The alternatives and associated mitigation measures considered are described in chapters two (alternatives) and four (environmental consequences) and Appendix L.1. Some alternatives propose using water resources found within the Red River Basin. Red River Basin water sources that were evaluated are in North Dakota, South Dakota, and Minnesota and include surface and groundwater options. Other alternatives propose importing water from the Missouri River to the service area.
1 - 14

Red River Valley Water Supply Project FEIS Chapter One Purpose and Need
Potential Impacts The potential impacts that may result from the proposed action and alternatives are direct, indirect, and cumulative. For example, the potential environmental impacts associated with the possible transfer of non-native organisms from the Missouri River Basin to the Hudson Bay Basin are being examined in this FEIS. The potential ecological and economic consequences are evaluated in chapter four. A depletion analysis on the Missouri River from its headwaters to the confluence of the Mississippi River is included for alternatives proposing to import water from the Missouri River. The environmental impacts of the alternatives are evaluated in chapter four. The geographic area analyzed for possible impacts of the proposed action and alternatives for this FEIS appears in figure 1.2. The geographic scope of potential impacts primarily encompasses portions of two major drainage basins – the Red River Basin, of which the Red River Valley is a part, and the Missouri River Basin. The primary features in the Red River Basin that would be affected by the alternatives are the Sheyenne River, Lake Ashtabula, and the Red River. The Missouri River is the primary feature in the Missouri River Basin that would be affected. Sheyenne River The Sheyenne River is a tributary to the Red River in the Hudson Bay Basin. The portion of the Sheyenne River potentially affected by the Project runs from 8 miles above Lake Ashtabula (the reservoir created by Baldhill Dam) to the river’s confluence with the Red River north of Fargo, North Dakota. Water users would rely on the Sheyenne River as a water source under all of the proposed alternatives. Lake Ashtabula Baldhill Dam located approximately 16 miles north of Valley City, North Dakota, impounds water from the upper Sheyenne River into Lake Ashtabula, which the Corps manages. The dam was constructed by the Corps to augment low flow to meet downstream water supply needs and pollution abatement objectives and to reduce flooding in the Sheyenne River Valley. Recreation, fish, and wildlife enhancement are secondary objectives of the Baldhill Dam and Lake Ashtabula Reservoir Regulation Manual. Lake Ashtabula would store water for all action alternatives, as well as the No Action Alternative. Red River The Red River is a meandering river that begins where the Otter Tail River and Bois de Sioux River join at Wahpeton, North Dakota, and Breckenridge, Minnesota, and flows north into Manitoba, Canada. Parts of South Dakota, North Dakota, and Minnesota in the United States and Manitoba in Canada are drained by the Red River. The Red River Basin is a sub-basin of the Hudson Bay Basin.
Sheyenne River Below Baldhill Dam
Overview of Lake Ashtabula
Red River at Fargo
1 - 15
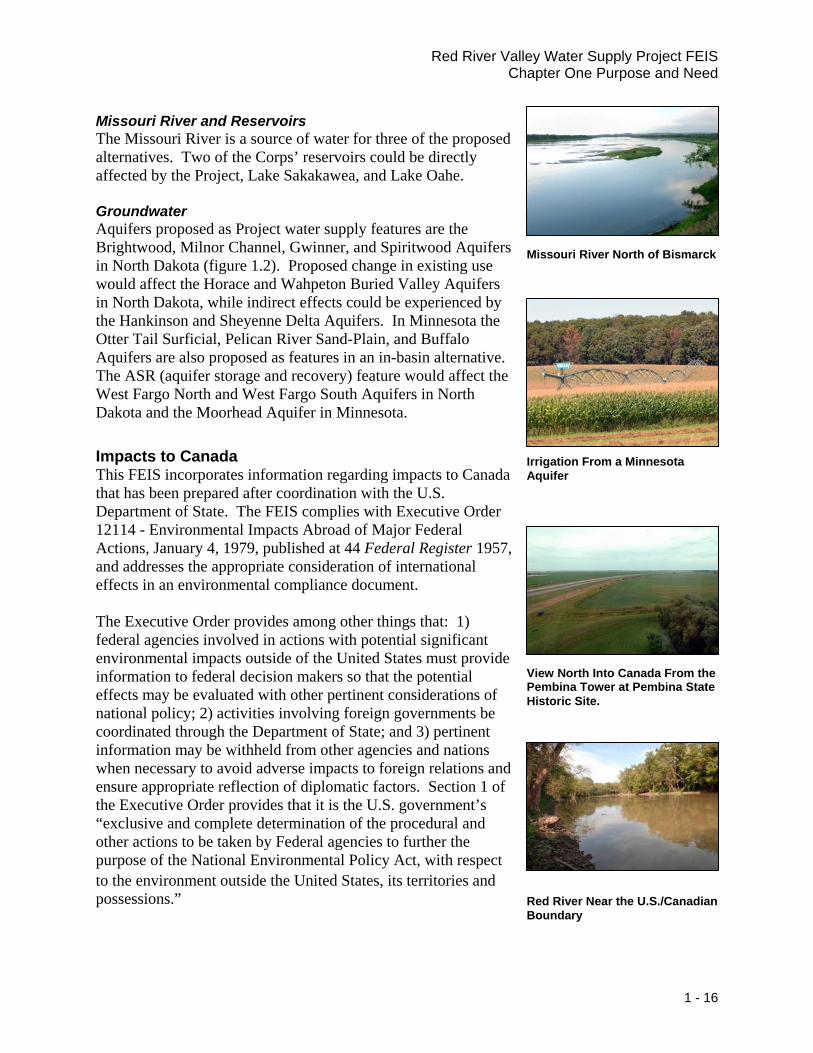
Red River Valley Water Supply Project FEIS Chapter One Purpose and Need
Missouri River and Reservoirs The Missouri River is a source of water for three of the proposed alternatives. Two of the Corps’ reservoirs could be directly affected by the Project, Lake Sakakawea, and Lake Oahe. Groundwater Aquifers proposed as Project water supply features are the Brightwood, Milnor Channel, Gwinner, and Spiritwood Aquifers in North Dakota (figure 1.2). Proposed change in existing use would affect the Horace and Wahpeton Buried Valley Aquifers in North Dakota, while indirect effects could be experienced by the Hankinson and Sheyenne Delta Aquifers. In Minnesota the Otter Tail Surficial, Pelican River Sand-Plain, and Buffalo Aquifers are also proposed as features in an in-basin alternative. The ASR (aquifer storage and recovery) feature would affect the West Fargo North and West Fargo South Aquifers in North Dakota and the Moorhead Aquifer in Minnesota. Impacts to Canada This FEIS incorporates information regarding impacts to Canada that has been prepared after coordination with the U.S. Department of State. The FEIS complies with Executive Order 12114 - Environmental Impacts Abroad of Major Federal Actions, January 4, 1979, published at 44 Federal Register 1957, and addresses the appropriate consideration of international effects in an environmental compliance document. The Executive Order provides among other things that: 1) federal agencies involved in actions with potential significant environmental impacts outside of the United States must provide information to federal decision makers so that the potential effects may be evaluated with other pertinent considerations of national policy; 2) activities involving foreign governments be coordinated through the Department of State; and 3) pertinent information may be withheld from other agencies and nations when necessary to avoid adverse impacts to foreign relations and ensure appropriate reflection of diplomatic factors. Section 1 of the Executive Order provides that it is the U.S. government’s “exclusive and complete determination of the procedural and other actions to be taken by Federal agencies to further the purpose of the National Environmental Policy Act, with respect to the environment outside the United States, its territories and possessions.”
Missouri River North of Bismarck
Irrigation From a Minnesota Aquifer
View North Into Canada From the Pembina Tower at Pembina State Historic Site.
Red River Near the U.S./Canadian Boundary
1 - 16

Red River Valley Water Supply Project FEIS Chapter One Purpose and Need
Reclamation has complied with the Executive Order by informing the Department of State of the Project and by providing technical support to the Department of State for its consultation with Canada. The Department of State has counseled Reclamation regarding the diplomatic sensitivities of the issues involved. While not legally required as part of the FEIS, this document incorporates available information regarding impacts to Canada in light of the unique aspects of the Project; e.g., the provisions of Article IV of the Boundary Waters Treaty of 1909 and the provisions of section 1(h) of Public Law 89-108, as amended by the DWRA. The Boundary Waters Treaty provides that “boundary waters and waters flowing across the [U.S.-Canadian] boundary shall not be polluted on either side to the injury of health or property on the other [side of the international boundary].” The DWRA requires that prior to construction of any water systems authorized under the Act that deliver Missouri River water into the Hudson Bay Basin, the Secretary, in consultation with the Secretary of State and the Administrator of the EPA (Environmental Protection Agency), must determine that adequate treatment can be provided to meet the requirements of the Boundary Waters Treaty. Reclamation notes that the statutory provisions of NEPA (and the Council on Environmental Quality’s regulations implementing NEPA) do not require assessment of environmental impacts within the territory of a foreign country. However, as a voluntary measure, to further the purposes of the Executive Order, and for the purpose of efficiency and convenience, this FEIS includes an appropriate evaluation of potential impacts of Project alternatives on waters flowing across the United States-Canadian border and of areas within Canada. Purpose of the FEIS Reclamation and North Dakota have prepared this FEIS in response to substantive comments on the DEIS and SDEIS related to environmental issues. Comments were received from reviewing tribes, state and federal agencies, organizations, and interested and potentially affected members of the public. New information became available, and additional analyses relevant to environmental concerns and issues were conducted in response to these comments. The additional analyses in the SDEIS addressed surface water hydrologic modeling, water needs, water quality, Missouri River flow depletions, aquatic resources, historic properties, and social economic issues. In addition, USGS completed a supplemental report that evaluated the risk of transfer of potentially invasive species from the Missouri River into the Red River and Hudson Bay Basins in relation to potential treatment and conveyance failures. Public comments, new information, and additional analyses led Reclamation and North Dakota to prepare a SDEIS, which was a thorough revision of the DEIS. In addition, two alternatives evaluated in the DEIS were eliminated from consideration and a federally-preferred alternative was identified in the SDEIS. Reclamation and North Dakota addressed many comments received on the DEIS in the substantially revised text of the SDEIS.
1 - 17

Red River Valley Water Supply Project FEIS Chapter One Purpose and Need
Some changes were incorporated into the FEIS in response to comments on the SDEIS, but these revisions do not significantly change the impact analysis or results presented in the SDEIS. There are four primary changes from the SDEIS:
1) Reclamation prepared a final biological assessment in compliance with the ESA (Endangered Species Act), which is Appendix G.1.
2) The Corps (2007) analyzed the effects of forecasted depletions and sedimentation on the Missouri River mainstem reservoir system, which is summarized in chapter four “Missouri River system water quantity” section. Impacts to other resources quantified by the Corps analysis are discussed in various sections of chapter four and Appendix C.
3) To address regional climate change, Reclamation reviewed the technical literature and summarized available climate change information for the Project area (see chapter four, “climate change” section).
4) Appendix M.1 responds to comments received on the DEIS and SDEIS, and Appendix M.2 contains all of the comment documents.
Concerns and Issues Related to the Proposed Action
Reclamation and North Dakota identified public and agency concerns and issues relevant to the proposed action to be considered and analyzed in the EIS. The cooperating agencies offered additional concerns and issues. Concerns were also raised by members of the public and agencies at scoping meetings held October 28 - November 8, 2002, in Fargo, Valley City, Grand Forks, Pembina, Wahpeton, and Bismarck, North Dakota (Reclamation and Garrison Diversion 2003b). Breakout Session During Public Scoping Additional public meetings were held June 16-23, 2003, to review alternatives identified for further study. Issues regarding alternatives were expressed during these meetings in Grand Forks, Fargo, and Valley City, North Dakota, and Breckenridge, Minnesota (Reclamation and Garrison Diversion 2003a). Concerns and issues were also identified through consultation meetings with federal, tribal, state, and local agencies in North Dakota and Minnesota and from written comments submitted by agencies, tribes, organizations, and the public. A DEIS was released for public review on December 30, 2005. Public hearings on the DEIS were held in February and March 2006 in Bismarck, Fargo, Grand Forks, Valley City, North Dakota, and Perham and Warroad, Minnesota. Hearings were also held on the Red Lake (Red Lake Band of Chippewa), Fort Berthold (Three Affiliated Tribes), and Standing Rock Reservations (Standing Rock Sioux Nation). A SDEIS was distributed for public review on January 31, 2007. Public hearings on the SDEIS were held in February and March 2007 in Bismarck, Fargo, Fort Yates, and New Town, North Dakota.
1 - 18

Red River Valley Water Supply Project FEIS Chapter One Purpose and Need
The scope of analysis for this FEIS focuses on responding to the following statement:
If Reclamation and North Dakota construct and operate the Project, then the effect(s) on other relevant resources/issues would be…
Based upon information obtained through scoping, discussion with interested and/or affected parties, and existing laws and regulations, Reclamation and North Dakota identified the following resources, issues, or concerns as potentially relevant to the proposed action. The FEIS proceeded with analysis of impacts by answering the following question for the resources and significant issues to be analyzed in detail:
• Surface water quantity • Erosion and flooding on the Sheyenne and Red Rivers • Surface water quality • Groundwater quantity and quality • Aquatic communities • Risks of invasive species • Natural resource lands in Project right-of-ways, overlying aquifers, and adjacent to
streams and reservoirs (riparian habitat) • Wildlife - specifically mammal and migratory bird habitat • Threatened and endangered species and species of special concern • Protected areas – federal lands, especially Service fee title and easement lands and
national wildlife refuges; state lands, like parks and wildlife management areas; and areas of special interest under state or private programs because of native habitats or other natural features
• Federal and state protected species • Historic properties • Indian trust assets • Social and economic conditions • Environmental justice
Other potentially relevant resources, issues, or concerns may be identified during the process of completing this EIS and would be considered and analyzed as appropriate. Resources and issues that were raised during the public scoping period on the DEIS and are relevant to the alternatives analyzed in this FEIS are listed in table 1.3.
How would construction and operation of the Project affect the following resources, issues, and concerns?
1 - 19

Red River Valley Water Supply Project FEIS Chapter One Purpose and Need
Table 1.3 – Issues Identified During Public Scoping in the FEIS. Topic Location in FEIS Alternatives Chapter Two – Alternatives; Appendixes A.2 and A.3 Aquatic Environment Chapters Three and Four – Aquatic Communities; Appendixes D.1,
D.2, and D.3 Canada Chapters Three and Four – Red River Basin Surface Water Quantity;
Surface Water Quality; Aquatic Communities; Risks of Invasive Species; Species of Special Concern; Appendixes A.4, A.5, B.2, F, G.2, and L.1
Cumulative Impacts Chapters Four – Cumulative Effects Subsections; Appendixes C and E
Drought Chapter Two – Drought and Future Water Shortage; Chapter Four – Red River Basin Surface Water Quantity, Missouri River System Water Quantity, Surface Water Quality, and Social and Economic Issues; and Appendix A.1
Economic and Financial Issues Chapters Three and Four - Social and Economic Conditions; Appendix K.1 and K.2
Environmental Justice Chapters Three and Four – Environmental Justice Flooding and Erosion Chapters Three and Four – Flooding and Erosion on the Sheyenne and
Red Rivers Historic Properties Chapters Three and Four – Historic properties; Appendix I Legal Issues Chapter Five – Coordination and Compliance with Applicable Laws,
Regulations, and Policies Natural Resources Chapters Three and Four – Aquatic Resources; Natural Resource
Lands; Wildlife; Protected Areas; Appendixes D.1, D.2, D.3, E, H, L.1 and L.2
Purpose and Need Chapter One – Purpose and Need; Appendix A.1 Risk of Transfer of Potentially Chapters Three and Four – Risk of Invasive Species; Appendixes A.4, Invasive Species from the Missouri A.5, F, and L.1 River Basin to the Hudson Bay Basin Threatened and Endangered Species Chapters Three and Four – Federally Protected Species and Species and Species of Special Concern of Special Concern; Appendixes G.1 and G.2 Tribal Issues Chapters Three and Four – Indian Trust Assets and Environmental
Justice; Appendix J Water Conservation Chapter One – Water Conservation Need; Appendix A.1 Water Quality Chapters Three and Four – Surface Water Quality; Groundwater
Quantity and Quality Water Quantity Chapters Three and Four – Red River Basin Surface Water Quantity;
Flooding and Erosion on the Sheyenne and Red Rivers; Missouri River System Surface Water Quantity; Groundwater Quantity and Quality; Appendixes B.1, B.2, and C
Overview of the FEIS The FEIS is organized in the same manner as the SDEIS. This chapter establishes the purpose and need for the Project. Chapter two describes the process used to develop alternatives, discusses the alternatives considered in detail, describes the alternatives that were considered but eliminated from detailed study, and provides a summary comparison of alternatives and associated consequences or impacts. It also identifies the federal and state preferred alternative.
1 - 20

Red River Valley Water Supply Project FEIS Chapter One Purpose and Need
Chapter three describes the environment and resources that could be affected by the proposed action and alternatives. Chapter four describes and analyzes the impacts of each alternative considered in detail. It also includes other considerations required by the NEPA, including the relationship between short-term uses of the environment and long-term productivity, and the assessment of irreversible and irretrievable commitment of resources. Chapter five includes consultation and coordination activities with other federal, tribal, and state agencies and describes applicable federal and state laws, regulations, and executive orders. What Comes Next? The following flowchart (figure 1.3) displays the projected sequence of events for fulfillment of the sections of the DWRA that pertain to the Project. The chart has two components - one for the needs and options study and another for analysis of effects on the environment, along with subsequent implementation of the proposed Project. The needs and options part has been completed and documented with a report that developed and refined the Project’s proposed action. This report will be submitted to Congress as part of a Project package. The DEIS was completed in December 2005, and in response to comments, it was revised into a SDEIS, which was released for public review in January 2007. Public comment on the DEIS remained open while the SDEIS was being prepared. The 45-day public review and comment period on the SDEIS was extended for 30 days until April 25, 2007. Four public hearings were held in February and March 2007 prior to preparation of this FEIS. The FEIS responds to all substantive public comments on both the DEIS and SDEIS. The FEIS is available to the public prior to a final decision on implementation of the proposed action. There will be minimum 30 day period between availability of the FEIS and issuance of a ROD. Comments on the FEIS may be offered to Reclamation and North Dakota for consideration. Following release of the FEIS, the Secretary of the Interior, in consultation and coordination with the state of North Dakota in coordination with affected local communities, will select an alternative for implementation (DWRA Section 8(d)(1)). The NEPA process is then completed with the issuance of a ROD. The Project may then follow one of two pathways:
1) If an import alternative is selected, a Comprehensive Report that identifies the proposed alternative, environmental issues, effects on Minnesota and Missouri River states, and compliance with the Boundary Waters Treaty will be sent to Congress. A Missouri River import alternative would necessitate authorization by Congress prior to implementation.
2) If an in-basin alternative is selected, the Project may be implemented under the DWRA. It is possible that future events or actions following the ROD may change the possible pathways and outcomes shown in figure 1.3. However, the flowchart indicates the most current and expected course of events at this time.
1 - 21

Red River Valley Water Supply Project FEIS Chapter One Purpose and Need
Record of Decision The Secretary of the Interior has made no final decisions regarding the proposed action at the time of publication of the FEIS. Accordingly, it is important for the reader to understand that mere identification of a federally preferred alternative or biota treatment process does not indicate that the Secretary has made any final decisions with respect to the proposed action identified in this FEIS. Any final decisions by the Secretary with respect to the proposed action will be included in a ROD. Follow issuance of this FEIS and consultation with the Administrator of the EPA and the Secretary of State, the Secretary anticipates selecting an approach to treatment of water if a Missouri River import alternative is selected. As analyzed in this FEIS, Reclamation expects that the In-filter DAF approach suggested by Manitoba in their written comments and at the December 2006 U.S.- Canada consultation meeting in Washington, D.C. is, based on the best available information, the treatment approach for this alternative. No sooner than 30 days after the EPA has published the notice of availability for the FEIS, Reclamation will issue a ROD. Significant comments received and issues raised in the FEIS will be identified. The Secretary’s selected alternative and the alternatives considered in the FEIS will be disclosed. Alternative(s) considered environmentally preferable will also be identified. Factors considered with respect to the alternatives and how these considerations entered into the decision will be discussed. Reclamation will include environmental commitments, means to avoid or minimize environmental harm, and any monitoring or enforcement activities to ensure that environmental commitments will be met, if an action alternative is selected.
1 - 22

DAKOTA WATER RESOURCES ACT Red River Valley Water Supply Project
DEIS* (issue d D ecem ber 2005) Draft Report on
Red River Valley Water Needs and Options
If more than 1 year after passage of DWRA, submit
status report to Congress with estimated completion date
(sent November 20021
If more than 1 year after DEIS submit status report tO Congress with estimated
completion date
If Secre tary selects in -basin
alternative
Within 180 days of Record of Decision
enter into cooperative agreement with state
for construction
Final P roject design & construction
SDEIS Qanuary 2007)
Conduct the study in an open
and pubic manner
Needs are: MR&I Water quality Aquatic
environment Recreation Water
conservation n'leasures
Draft report sent to potentially affected States for 120 day review
(May 2005)
Comprehensive Report is sent to Congress 90
days after FE IS
Report transmitted to
Congress (forthcoming)
* Reclamation a nd Garriso n D iversion, on behalf of the Sta te of North D akota, determined that it was appro priate to ublish a SDE IS as art of the N E PA rocess.
Red River Valley Water Supply Project FEIS Chapter One Purpose and Need
Figure 1.3 – Sequence of Events in the DWRA That Pertain to the Project.
1 - 23

Red River Valley Water Supply Project FEIS Chapter One Purpose and Need
1 - 24

Red River Valley Water Supply Project FEIS Chapter Two Alternatives
Chapter Two Alternatives
Introduction
In chapter one the purpose and need for the Project are explained. This chapter describes the range of reasonable alternatives developed to meet the purpose and need as well as the No Action Alternative, which is the future without the Project. Six alternatives have been considered in detail and evaluated in this FEIS.
The alternatives include the No Action Alternative and five action alternatives designed to supplement local water supplies to alleviate the predicted water shortage and meet the comprehensive water demand. The chapter also briefly describes alternatives that were considered but eliminated from further study and the reasons for doing so. It concludes with a comparison of the alternatives under consideration, engineering costs, and summary of the potential environmental effects of the action alternatives and the consequences of the No Action Alternative.
Construction of a MR&I Water Supply Project Similar to the Proposed Project
The alternatives evaluated in the SDEIS and FEIS are: • No Action – The No Action Alternative is the future without the Project. This alternative
includes all planned or reasonably foreseeable federal, state, tribal, and local water supply projects that could be constructed in the service area by 2050.
• North Dakota In-Basin – The primary feature of this alternative is a buried pipeline that would capture excess Red River flows downstream (north) of Grand Forks and convey water to Lake Ashtabula for storage and release in response to downstream water demands.
• Red River Basin – The primary features of this alternative are groundwater wellfields in the Pelican River and Otter Tail Surficial Aquifers in Minnesota and a buried pipeline that would convey that water to the Fargo-Moorhead area.
• GDU Import to Sheyenne River - The primary feature of this alternative is a buried pipeline from the McClusky Canal to Lake Ashtabula. The Missouri River water would be
2 - 1

Red River Valley Water Supply Project FEIS Chapter Two Alternatives
stored in the lake and released to meet downstream water demands. The alternative includes a biota water treatment plant to reduce the risk of transferring invasive species into the Hudson Bay Basin.
• GDU Import Pipeline - The primary feature of this alternative is a buried pipeline from the McClusky Canal to the Fargo-Moorhead area. The alternative includes a biota water treatment plant to reduce the risk of transferring invasive species into the Hudson Bay Basin.
• Missouri River Import to Red River Valley - The primary feature of this alternative is a buried pipeline from the Missouri River south of Bismarck to the Fargo-Moorhead, Grand Forks, and Wahpeton areas. The alternative includes a biota water treatment plant to reduce the risk of transferring invasive species into the Hudson Bay Basin.
Some alternatives were eliminated or modified between the DEIS and the SDEIS. This includes elimination of the Lake of the Woods and GDU Replacement Pipeline Alternatives, which is explained later in the “alternatives considered but eliminated” section. Some of the remaining alternatives were modified to address concerns raised during DEIS review or to make improvements to the alternatives. For instance, the Elk Valley Aquifer conversion feature was eliminated due to high negative economic costs, while greater use of the Buffalo Aquifer was considered as a water supply for Moorhead, Minnesota. Adjustments in hydrologic modeling also affected all the alternatives, particularly the GDU Import to Sheyenne River Alternative that was revised to incorporate North Dakota Game and Fish Department recommendations on aquatic flows.
2 - 2

Red River Valley Water Supply Project FEIS Chapter Two Alternatives
Drought and Future Water Shortage
Water demand = population x (per capita water demand – water conservation) + industrial water demands + recreation consumptive use.
Water Shortage = available water (without the Project) – water demand.
There is a difference between the quantified water demand that the alternatives are designed to meet and the quantified water shortage. The water demand is equal to the population multiplied by the per capita water demand, minus water conservation, plus industrial water demands, plus recreation consumptive use. The future (2050) maximum annual water demand for the Project is estimated at 113,702 ac-ft (table 1.1). The water shortage is the difference between the water available in the Red River Valley minus the water demand that is removed from the water sources by water users (figure 2.1). Implementation of drought contingency measures was not included in water demand estimates because of the high economic impact costs of water shortages, which are quantified in chapter four, “social and economic issues” section. The status of drought contingency planning in the Red River Valley and an explanation for why such measures were not included in water demand estimates is in Appendix A.1.
During years of normal and high precipitation, there would be adequate water sources to meet future water demands in the Red River Valley, but during a severe drought there could be water shortages. Water shortages were estimated for the service area using a hydrologic model called StateMod. StateMod is a computer modeling program used to evaluate timing of river flows, water withdrawals, return flows, and evaporation at many locations throughout the Red River Basin. StateMod modeling results are discussed below and in Appendix B.1. For use in the StateMod model, USGS developed a naturalized flow database for the Sheyenne and Red Rivers using historic flow data from 1931-2001. This time period represents the best available data for the period of record. The earliest year that there were sufficient flow data for modeling was 1931.
Based on a drought frequency investigation, Meridian Environmental Technology, Inc. (2004:62) identified the 1930s as a “realistic and statistically significant representation of an extreme din that it typifies the most extreme event anticipated until at least 2050.” To determine the water shortage during a severe drought, Reclamation modeled future water demands with return flows using 1931 through 1941 flows. Ultimately, all alternatives considered in detail were modeled
rought
Figure 2.1 – Graph Illustrating the Difference Between Surface Water Supply and the Future Fargo-Moorhead Water Demand During a 1934 Flow Year.
2 - 3

Red River Valley Water Supply Project FEIS Chapter Two Alternatives
for the full period of record (1931 through 2001) to show patterns of water shortages.
The No Action Alternative modeling run predicted that if population and industrial growth increase as predicted and the Project is not constructed by 2050, the maximum water shortage in the Red River Valley could be as high as 55,000 ac-ft per year during a 1930s-type drought event. This assumed that future water demands would be served from the existing surface water system of reservoirs and natural flows. Results of the StateMod hydrologic modeling runs and discussion of how this modeling was used during alternative formulation are discussed in more detail in Appendix B.1.
Red River in 1936 During a Period of No Flow
2 - 4

Red River Valley Water Supply Project FEIS Chapter Two Alternatives
StateMod Hydrologic Modeling Results
This section summarizes the StateMod hydrologic modeling results for each of the six alternatives considered in the SDEIS and FEIS. A more detailed discussion of hydrologic modeling is in Appendix B.1. The results were used in designing the size of the alternatives.
Modeling the No Action Alternative The No Action Alternative is the future of the Red River Valley service area without a Project. Currently the water systems in the Red River Valley primarily depend on surface water to meet their water needs due to limited availability of groundwater. As explained in the Final Needs and Options Report (Reclamation 2005a, table 5.3.1), approximately 14,000 ac-ft are available annually from groundwater sources in the Red River Valley, and that volume is not expected to increase in the future. Therefore, the water systems in the valley will become even more dependent on surface water sources in the future. Unfortunately, surface water sources are the most vulnerable to drought. The future Red River Valley water demand is estimated at 113,702 ac-ft with approximately 101,024 ac-ft (table 5.3.1 Final Needs and Options Report) or almost 90% coming from surface water sources. The 101,024 ac-ft total only represents the Project surface water demand. The StateMod model also includes all other existing surface water permitted demands that are not Project related.
The results of the No Action Alternative StateMod hydrologic modeling depends directly on how well the existing surface water sources in the Red River Valley meet the annual 101,024 ac-ft water demand. The No Action modeling run also includes analysis of existing non-Project demands because these deplete water supplies based on permit dates. There are three major surface water sources in the Red River Valley that can meet the future demand: the Sheyenne River including Lake Ashtabula storage, the Red River, and the Red Lake River. The StateMod model compares the 101,024 ac-ft demand with the available natural flows in these river systems.
Table 2.1 – Ranked Lowest Naturalized Annual Flowsat Emerson, Manitoba for 71 years (1931 – 2001).
Rank Year Annual
Naturalized Flow (ac-ft)
1 1934 240,2362 1931 442,0373 1935 474,0594 1939 498,1795 1933 596,4486 1937 603,458
The critical period in terms of water in the Red River Valley is the 1930s drought. During this drought all ten years ranked in the top 15 driest years on record for the valley as shown in table 2.1. Modeling shows under No Action that the upper Red River near South Dakota is the first to experience low flow events. That forces the Fargo-Moorhead area to rely on the Sheyenne River and storage in Lake
7 1936 627,3808 1940 638,0879 1961 683,01410 1977 712,58511 1938 739,69412 1932 757,45713 1990 800,28514 1988 976,28715 1959 1,097,747
71 year statistics Minimum 240,236Maximum 9,677,655Average 3,115,424
2 - 5

Red River Valley Water Supply Project FEIS Chapter Two Alternatives
Ashtabula to meet water needs. Modeling results show that the maximum annual shortage would be 55,000 ac-ft at the height of the drought.
The 55,000 ac-ft shortage is greater than previously reported in the DEIS (Scenario One shortage was 37,000 ac-ft), because the original shortage did not include operational considerations for meeting peak-day demands. To assure peaking demands are met, more water has to be released from Baldhill Dam to serve downstream needs. Water released from Lake Ashtabula into the Sheyenne River takes approximately 20 days to travel to Fargo. Because of travel time and difficulties in anticipating peak-day water demands approximately 20 days in advance, more water has to be released than ultimately might be needed. The Final Needs and Options Report (Reclamation 2005a, Appendix B), explained how water demands were adjusted to account for travel time for water supplies delivered via the Sheyenne and Red Rivers. The total modified surface water demand to meet peak day downstream needs is 134,746 ac-ft (Appendix B.1). Therefore, the worst year shortage of 55,000 ac-ft is approximately 41% (55,000 ac-ft / 137,746 ac-ft) of the total annual water demand.
Modeling the Action Alternatives Table 2.2 summarizes the results of the StateMod hydrologic modeling conducted on the five action alternatives evaluated in the SDEIS and FEIS. Table 2.2 shows the modeling results for the primary water source feature for each alternative.
The second column shows the capacity requirement for each alternative/feature. The third column shows the volume of the average annual depletion of the primary water source during the 1930s, while column four shows the volume of the 71-year average annual depletion of the primary water source. The primary source of water for the North Dakota In-Basin Alternative would be the Red River north of the confluence with the Red Lake River near Grand Forks. For the Red River Basin Alternative it would be groundwater in Minnesota, and the other three alternatives would use Missouri River water. The StateMod hydrologic model used 71-years of naturalized flow as the basis for this analysis. This is referred to in the table as the “period of record.”
Table 2.2 – StateMod Hydrologic Modeling Results.
Alternative – Main Conveyance Feature
Main Conveyance Feature Capacity
Plus 5% for Losses
(cfs)
1930s Average Year Volume Plus 5% for
Losses (ac-ft)
Period of Record Average Volume
Plus 5% for Losses (ac-ft)
North Dakota In-Basin – Grand Forks to Lake Ashtabula Pipeline 48 21,153 7,075
Red River Basin – Minnesota Groundwater and Pipeline 43 21,023 4,522
GDU Import to Sheyenne River – McClusky Canal to Lake Ashtabula Pipeline 122 80,239 31,686
GDU Import Pipeline – McClusky Canal to Fargo Pipeline 85 57,824 57,824
Missouri River Import to Red River Valley – Bismarck to Fargo Pipeline 119 62,042 28,111
2 - 6

Red River Valley Water Supply Project FEIS Chapter Two Alternatives
The alternatives include a number of water supply features that when combined would solve the water shortage problem. All the water supply features, with the exception of the features listed in table 2.2, have fixed water resource volumes. For example, some of the alternatives use existing groundwater from the Buffalo Aquifer to serve Moorhead. The StateMod hydrologic model runs for these alternatives use the Buffalo Aquifer as a source of water, which reduced the size of the main conveyance feature. The action alternatives would all supplement existing water supplies.
Table 2.2 shows the water supply features that vary in capacity depending on the configuration of the alternative. The North Dakota In-Basin and Red River Basin Alternatives use similar modeling assumptions; thus, the results shown in table 2.2 are similar. The 71-year period of record results vary a little more than the other results in table 2.2. This is because the North Dakota In-Basin Alternative uses Lake Ashtabula as a regulating reservoir. There are losses associated with reservoir evaporation, but there is a need to maintain the reservoir at a nearly full capacity. Keeping the reservoir nearly full reduces the size of the main conveyance feature in this alternative during a drought.
The Missouri River import alternatives in table 2.2 have different depletion volumes. This is because each alternative is unique in a number of ways. Each Missouri River import alternative has additional in-basin water supply features. The GDU Import to Sheyenne River Alternative uses Lake Ashtabula as a regulating reservoir and serves the water demand by releasing water down the Sheyenne River, while the other two import alternatives pipe water directly to existing water systems in the Red River Valley.
StateMod hydrologic modeling results can also be dramatically different because of assumptions used in developing the model runs. StateMod is an accounting model that identifies water demands that must be met from water sources. Each model run is set up with water source priorities.
For example, Fargo may have three different sources of water available in the model to meet its full needs. It can draw upon those sources based on the priority date for each of its water permits. Senior permits have priority over junior permits. In all cases, Fargo can draw water from natural flows on the Red and Sheyenne Rivers or from Lake Ashtabula based on its water rights depending upon the availability of water from those sources (see table 2.3). However, when available, Fargo can draw water from a supplemental source. The Project water could either be drawn upon as a supplement when all other sources are depleted or as a primary source to be used before looking elsewhere. The annual depletions vary depending on how these water supply priorities
Baldhill Dam and Lake Ashtabula Would Store Water for Use by All the Alternatives
2 - 7

Red River Valley Water Supply Project FEIS Chapter Two Alternatives
are set in the model. A more detailed description of the operational assumptions associated with each alternative is explained in each alternative description later in this chapter.
The results shown in table 2.2 provide a good example of this modeling situation. The model run for the GDU Import Pipeline Alternative was set up to serve Fargo’s water demand with the import pipeline as the first priority, natural flows second, and releases from Lake Ashtabula last. The Missouri River Import to Red River Valley Alternative was modeled with Fargo’s demand being served first from natural flows in the river, second from Lake Ashtabula releases and finally from the Missouri River via a buried pipeline. Notice that the depletion volume (including 5% for losses) was very similar during the critical drought period of the 1930s at volumes of 57,824 ac-ft and 62,042 ac-ft, respectively. This is the critical drought period where both alternatives have to function at full capacity to meet water demands. However, the 71-year average depletions are quite different at 57,828 ac-ft and 28,111 ac-ft, respectively. The GDU Import Pipeline Alternative is greater at 57,824 ac-ft, because the pipeline from the Missouri River was prioritized first in the model run while the other import alternative used natural or Lake Ashtabula flows as the first priority. The priorities generally were selected to minimize the size of Project features.
The following discussion shows how assumptions used in the development of modeling runs influenced the modeling results. It is difficult to anticipate how each of the five alternatives/features in table 2.2 will eventually be operated if constructed. If for example, full water treatment (meeting SDWA standards) is included in one of the Missouri River pipeline alternatives that may eliminate the need to expand water treatment in the Red River Valley. In that case the alternative would be modeled like the GDU Import Pipeline Alternative and operate all the time to provide potable water, regardless of the water supply situation in the Red River Valley. However, if biota treated water is not potable, additional water treatment capacity would be required in the Red River Valley and the local communities would have a choice whether they import water or use local supplies when available. The depletion results between the two Missouri River pipeline import alternatives demonstrate a rough range (28,111 ac-ft to 57,824 ac-ft) of how these two alternatives could operate depending on treatment capabilities or other criteria such as water quality differences.
The modeling results also depend on how Lake Ashtabula is operated in the various alternatives. Fargo, Lisbon, Grand Forks, Valley City, and West Fargo have water permits granting water rights for water in Lake Ashtabula that they can call on as needed. Table 2.3 shows each city’s allocated storage, priority date, and beneficial use date. This information was confirmed by the June 21, 2006, letter from the North Dakota State Water Commission (North Dakota State Water Commission 2006). All alternatives were modeled based on the allocated storage, priority date, and beneficial use date provided by the North Dakota State Water Commission.
A fish and wildlife conservation pool at 28,000 ac-ft (1,257 msl (mean sea level)) has been historically recognized for the benefit of aquatic life in Lake Ashtabula. The 28,000 ac-ft of storage is included in the 63,916 ac-ft of allocated storage shown in table 2.3, which sets up a potential competing priority for water rights in Lake Ashtabula. The cities have the right to call for water up to the limitations of their allocated permits. This could potentially drain the reservoir to dead pool. This is not considered a reasonable outcome, so all alternatives were
2 - 8

Red River Valley Water Supply Project FEIS Chapter Two Alternatives
modeled maintaining the 28,000 ac-ft conservation pool, while still maintaining the water storage rights of the five cities.
Table 2.3 – Storage Based Upon Permitted Water Rights in Lake Ashtabula.
City Priority Date Beneficial Use Date Permitted Amount (ac-ft)
Grand Forks January 23, 1960 July 1, 1967 20,023West Fargo July 25, 1961 July 1, 2001 954Fargo June 27, 1963 December 31, 1972 35,880Valley City July 1, 1963 July 1,1980 6,686Lisbon October 14, 1982 December 1, 2007 373
63,916Total
The GDU Import to Sheyenne River Alternative is unique, because it is designed to import water into Lake Ashtabula and to use it as a regulating reservoir to serve downstream water needs. It is also the only alternative designed to meet the aquatic needs recommended by the North Dakota Game and Fish Department (see chapter one, “aquatic environment need” section).
Meeting the North Dakota Game and Fish Department recommended aquatic needs flows increased the volume of water required during the 1930s flow years, which accounts for this alternative having the highest Missouri River depletion volume during a 1930s-type drought at 86,469 ac-ft (see table 2.4). However, the 71-year average volume of 31,686 ac-ft is much lower than the GDU Import Pipeline Alternative, because it would be used less frequently during non-drought time periods. The North Dakota In-Basin Alternative also conveys water into Lake Ashtabula, but modeling results indicate that flows in the Red River downstream of the confluence with the Red Lake River are insufficient to meet the recommended aquatic need flow targets. A review of the 71-year period of record modeling results (see hydrology Appendix B.1) for each of the Missouri River import alternatives shows that each of the alternatives would be operated to some extent in all 71 years, but the operation varies from alternative to alternative. Table 2.4 shows the minimum, maximum, and average annual depletion results for each of the Missouri River import alternatives. The Missouri River depletions vary by year and alternative, because the water supplies in the Red River Basin vary each year due to climate. The GDU Import to Sheyenne River Alternative only needs 1,192 ac-ft of imported water as the minimum annual depletion, because adequate water is available in the Red River Valley, while as much as 86,469 ac-ft is needed in the most severe drought year.
The Action Alternatives Would Maintain the Fish and Wildlife Conservation Pool in Lake Ashtabula
The GDU Import to Sheyenne River Alternative has the greatest variation in annual depletions, because the alternative is designed to maintain water levels in Lake Ashtabula and meet aquatic
2 - 9

Red River Valley Water Supply Project FEIS Chapter Two Alternatives
flow targets in the rivers. Natural runoff above Lake Ashtabula is adequate to maintain lake levels in normal to wet climatic years, but supplemental water is needed in drier years. The GDU Import Pipeline Alternative has the least variation in annual depletion, because in the development of the model run, it was assumed that the import pipeline was the first priority for meeting water needs.
Table 2.4 – Depletion Results for Missouri River Import Alternatives.
Alternative/Feature Minimum Annual
Depletion w/ 5% Losses
(ac-ft)
Maximum Annual Depletion
w/ 5% Losses (ac-ft)
Period of Record Average Volume
w/5% Losses (ac-ft)
GDU Import to Sheyenne River – McClusky Canal to Lake Ashtabula Pipeline 1,192 86,469 31,686GDU Import Pipeline – McClusky Canal to Fargo Pipeline 57,824 57,824 57,824Missouri River Import to Red River Valley – Bismarck to Fargo Pipeline 21,382 68,769 28,111
The Missouri River Import to Red River Valley Alternative results fall between the other two alternatives in terms of depletions. The minimum annual depletion for this alternative (21,382 ac-ft) is more than the GDU Import to Sheyenne River Alternative, because during non-drought periods water is being supplied to Grand Forks via spur pipeline. This buried pipeline delivers 20 cfs to Grand Forks to improve water quality. This pipeline is modeled to run under all climatic conditions.
2 - 10

Red River Valley Water Supply Project FEIS Chapter Two Alternatives
Alternative Screening Process Interdisciplinary Team – A multi-discipline team integrating the natural and social sciences, including the environmental design arts, established to develop and prepare the SDEIS. The interdisciplinary team includes Reclamation and Garrison Diversion staff and consultants.
A multi-step process was used to formulate alternatives for further study in the DEIS. Alternatives were formulated through a systematic process using public involvement, technical information, interdisciplinary and interagency discussions, and professional judgment.
NEPA and Council on Environmental Quality regulations require agencies to evaluate a range of reasonable alternatives. To be considered reasonable, an alternative must: 1) meet the identified purpose and need for action, to a large degree and 2) be practical or feasible from a technical and economic standpoint. An agency need not evaluate every possible alternative when the potential number of alternatives is very large but should consider a realistic range of alternatives that reasonably could be considered and that would meet the project’s purpose and need. For example, redundant alternatives, alternatives that result in unacceptable adverse impacts, alternatives that have similar environmental impacts, or do not fulfill the purpose and need can be eliminated from further study.
Initial Screening The process began with public scoping of 11 alternatives identified during previous Project studies (Reclamation 2000b) and included alternatives that used the GDU Principal Supply Works, as required by DWRA Section 5(a)(5). Initial public scoping meetings were held October through November 2002 to seek public comment on these alternatives and to identify issues related to them. After the public scoping meetings, an interdisciplinary team (see chapter five for a list of participants) developed six general categories of alternatives from the 11 alternatives developed during the previous Red River studies (Reclamation and Garrison Diversion 2003a).
These six general categories of alternatives were:
No Action Alternative - This alternative is the future without the Red River Valley Water Supply Project.
North Dakota In-Basin Alternative - An in-basin alternative that would use water sources primarily from within the Red River Valley in North Dakota.
Red River Basin Alternative - New surface or groundwater sources from Minnesota would be used to supplement the existing water supply within the Red River Valley in North Dakota.
GDU Import to Sheyenne River Alternative - Missouri River import alternative would use all or part of the existing GDU Principal Supply Works and the Sheyenne River to convey water to the Red River Valley.
2 - 11

Red River Valley Water Supply Project FEIS Chapter Two Alternatives
GDU Import Pipeline Alternative - Missouri River import alternative would use part of the existing GDU Principal Supply Works and a buried pipeline system to deliver water to the Red River Valley. Two alternatives were developed under this general category in the DEIS, but only one was evaluated in the SDEIS. The eliminated alternative is identified in the “alternatives considered but eliminated” section of this chapter.
Missouri River Import to Red River Valley Alternative - Missouri River import alternative would use a buried pipeline to convey water directly from the Missouri River to the Red River Valley.
To ensure the EIS considered a range of reasonable alternatives, one or more specific alternatives from each general category were identified for detailed study. The interdisciplinary team developed alternative screening criteria based upon Council on Environmental Quality guidelines, legal mandates, and previous Project studies to formulate alternatives for detailed study, and to identify alternatives (or features of alternatives) to be eliminated. The first screening criteria addressed the need to include an alternative, while the other criteria were reasons to exclude alternatives.
The criteria were:
The alternative is mandated by law or regulation. The alternative could cause unreasonable environmental harm based upon analysis from
the Red River Valley Water Needs Assessment Phase II; Appraisal of Alternatives to Meet Projected Shortages Report (Reclamation 2000b).
The alternative could not be reasonably implemented. The alternative is largely duplicative of another more desirable, reasonable, or feasible
alternative.
These criteria were applied to specific alternatives and features to identify the most desirable, most feasible, or most reasonable alternative(s) in each general category.
2 - 12

Red River Valley Water Supply Project FEIS Chapter Two Alternatives
Alternatives Studied in the SDEIS and FEIS
Eleven alternatives were initially identified for analysis based upon previous studies of the Red River Valley. These eleven were used in the initial 2002 public scoping meetings described in chapter one. Using scoping input during preparation of the DEIS, the initial eleven alternatives were screened and modified into seven alternatives.
ALTERNATIVES IN THE SDEIS and FEIS
No Action – This alternative is the future without the Red River Valley Water Supply Project.
IN-BASIN ALTERNATIVES North Dakota In-Basin – would use water supply sources primarily within the Red River Valley of North Dakota to meet shortages.
Red River Basin – would use available surface and/or groundwater from the Red River Basin in Minnesota and North Dakota to supplement existing water sources to meet shortages.
A second set of public meetings in June 2003 gave the public an opportunity to comment on the seven alternatives to be analyzed in detail in the DEIS (Reclamation and Garrison Diversion 2003a). An eighth alternative was added (Lake of the Woods) in the fall of 2004, and public input was requested through the project’s website www.rrvwsp.com and the fall 2004 newsletter on that alternative.
IMPORT ALTERNATIVES GDU Import to Sheyenne River – would meet water shortages by linking the GDU Principal Supply Works to the Sheyenne River via pipeline. The Principal Supply Works include the Snake Creek Pumping Plant on Lake Sakakawea, Audubon Lake, and McClusky Canal.
GDU Import Pipeline – would use the GDU Principal Supply Works and a pipeline system for conveying water into the Red River Valley to meet the shortages.
Missouri River Import to Red River Valley – would use a pipeline from the Missouri River to import water to meet the shortages of the Red River Valley.
The DEIS was released for public comment and review in December 2005. Based on the concerns raised by a number of comments, the Lake of the Woods Alternative was eliminated from further consideration. Both the Minnesota legislature and the Commissioner of MNDNR (Minnesota Department of Natural Resources) would be required to approve a permit to access water from Lake of the Woods. Given the MNDNR strong objection to this alternative, along with the objections of local communities, it was unreasonable to presume that this alternative would be feasible. The GDU Water Supply Replacement Pipeline Alternative was also eliminated from further consideration due to cost. The rationale for eliminating these alternatives from further consideration in the SDEIS is in the “alternatives considered but eliminated” section of this chapter.
The six alternatives evaluated in the SDEIS and FEIS include the No Action Alternative and five action alternatives. A no action alternative is always included in an EIS and is the basis to which all other alternatives are compared [40 CFR Section 1502.14(d)]. All five of the action alternatives propose to supplement existing water supplies with in-basin or imported water to
2 - 13

Red River Valley Water Supply Project FEIS Chapter Two Alternatives
meet the water shortages identified. All the action alternatives include a reduction for water conservation with an estimated water savings of 4,300 ac-ft per year.
Each of the five action alternatives would provide a bulk water supply to municipalities, rural water systems, and industries. The distribution of this water would be the responsibility of the rural water systems, municipalities, and industries; thus, distribution to the end user is not considered in this EIS.
Nineteen different water supply features are proposed for use in the five action alternatives. The preferred alternative in the ROD may be a different combination of the 19 features evaluated in this FEIS. Some of the action alternatives changed between the EIS and the Final Needs and Options Report (Reclamation 2005a); however, the feature descriptions and operational assumptions described in the Final Needs and Options Report are still applicable if more detailed information is required.
2 - 14

Red River Valley Water Supply Project FEIS Chapter Two Alternatives
■
■
■
■
■
■
■
■
■
■
■
No Action Alternative
The No Action Alternative is the future without the Project. This alternative includes all planned or reasonably foreseeable federal, state, tribal, and local water supply projects that could be constructed in the service area by 2050 (figure 2.2; table 2.5).
Appendix A.2 describes in detail how the No Action Alternative was developed. No Action activities generally fall into two types of projects: 1) those that are planned or proposed and 2) those that are reasonably foreseeable, such as intake modifications.
The Red River Would Continue to Be a Primary Water Source in the No Action Alternative
The predictions are based upon two sets of assumptions. The first set includes general assumptions about the activities, while the second set identifies specific water system features. Some assumptions relate to future water system work, while other assumptions address how the alternative was analyzed in hydrologic modeling.
No Action Alternative General Assumptions Addresses planned and reasonably foreseeable water system improvement activities to
provide additional sources of water supply through 2050 without the Project. Includes the same proposed service area as the action alternatives - 13 counties in
eastern North Dakota plus the Minnesota cities of East Grand Forks, Moorhead, and Breckenridge.
Evaluates the same future water demands as the action alternatives through hydrologic modeling.
Includes water systems and municipalities seeking new in-basin local water sources. Implements drought contingency measures to assure essential water needs, such as
health and safety, would be met without the Project. These measures would have environmental, financial, and social impacts (see chapter four, “social and economic issues” section).
Excludes a Missouri River import feature, because it is not reasonably foreseeable without the Project.
Incorporates water conservation. Assumes that historic climate trends would continue. Presumes that overall land use would not change significantly.
Water System Specific Assumptions The following features are in the No Action Alternative:
Red River, Sheyenne River, and tributaries are used as water sources. Lake Ashtabula existing reservoir storage is a primary water supply source.
2 - 15

Red River Valley Water Supply Project FEIS Chapter Two Alternatives
■
■
Existing groundwater sources are used as water supply sources. New in-basin water supplies could include untapped groundwater sources for small
communities and rural water systems, as well as purchase of groundwater and surface water irrigation rights, where feasible.
Figure 2.2 shows the locations, and table 2.5 lists the water supply related projects planned or reasonably foreseeable in the Red River Valley service area through 2050. These have an estimated construction cost in 2005 dollars of $24,307,000 and annual OM&R (operation, maintenance, and repair) costs of $1,023,000. Annual OM&R costs were not specifically estimated for the No Action Alternative; however, these costs average approximately 1% of construction costs for the action alternatives, so 1% was used to estimate No Action Alternative annual OM&R costs in table 2.5. The annual estimated cost of running a water conservation program at $780,000, as developed by Reclamation (2004b), is also included under the No Action Alternative. Table 2.5 lists map index numbers to locate proposed improvements on figure 2.2. No Action projects are estimated to deliver an additional 4,895 ac-ft of water, which would not meet the purpose and need of the Project.
Figure 2.2 – No Action Alternative (see table 2.5 for a list of projects).
2 - 16

Red River Valley Water Supply Project FEIS Chapter Two Alternatives
Table 2.5 – No Action Water Supply Projects in the Red River Valley Through 2050.
City/Rural Water System Proposed Improvements
Volume of Water from New Source
(ac-ft)
Construction Cost
(2005 $)
Annual OM&R Costs
(2005 $)
Map Index Number
Planned Projects or Improvements
CRWUD1 Water System Expansion
$1,039,000 $10,390 13
Drayton Red River Lowhead Dam Improvements $2,600,000 $26,000 2
Enderlin 4 New Wells 600 $450,000 $4,500 14
Fargo-Moorhead Metro Area
Lowhead Dam Construction, Raw Water Intakes - 2 on Red River and 1 on Sheyenne River $7,500,000 $75,000 10
Fargo-Moorhead Metro Area
Raw Water Intake Expansion $1,010,000 $10,100 11
Grafton Red River Intake Replacement $500,000 $5,000 4 Grafton Red River Lowhead Dam $2,450,000 $24,500 5 Gwinner New Well 100 $100,000 $1,000 15 Langdon/LRWD1 Mount Carmel Intake Improvements $500,000 $5,000 1 Moorhead Well Field Improvements 800 $354,000 $3,540 12 Park River Fordville Aquifer Development 610 $215,000 $2,150 6 Southeast Water Users District
Service to Windermere, Lidgerwood, Hankinson, and 550 Rural Users $531,000 $5,310 16
Tri-County Water District/Hillsboro
Galesburg Aquifer Development 1,660 $245,000 $2,450 8
Valley City Sheyenne River Lowhead Dam Improvements $750,000 $7,500 9
Reasonably Foreseeable Projects or Improvements Drayton Intake Improvements/Replacement
$2,500,000 $25,000 3
GFTWD1 Additional Groundwater Appropriations 1,125 $ 2,813,000 $28,130 7
Grafton Red River Intake Replacement (additional work) $750,000 $7,500 4
All Water Conservation $0 $780,000 Totals 4,895 $24,307,000 $1,023,000
1CRWUD – Cass Rural Water Users District, LWRD – Langdon Rural Water District, GFTWD – Grand Forks-Traill Water District
2 - 17

Red River Valley Water Supply Project FEIS Chapter Two Alternatives
Action Alternative Features
Five action alternatives are evaluated in the SDEIS and FEIS. This section of the FEIS describes these action alternatives and their associated costs. The alternatives are a combination of water supply features that were assembled into alternatives to meet the purpose and need of the Project (table 2.6). These water supply features are described in the next section.
Table 2.6 – Features in the Action Alternative.
Alternatives
Features Fe
atur
e N
umbe
r
No
Act
ion
Nor
th D
akot
a In
-Bas
in
Red
Riv
er B
asin
GD
U Im
port
to
Shey
enne
Riv
er
GD
U Im
port
Pi
pelin
e
Mis
sour
i Riv
er
Impo
rt to
Red
Riv
er
Valle
y
Biota Water Treatment Plants 1 x x x Bismarck to Fargo/Grand Forks Pipeline 2 x CRWUD Interconnection with Fargo 3
x x x x x GDU Principal Supply Works 4 x x GFTWD Interconnection with Grand Forks 5 x x x x x Grand Forks to Lake Ashtabula Pipeline 6 x McClusky Canal to Fargo Pipeline 7 x McClusky Canal to Lake Ashtabula Pipeline 8
x
Minnesota Groundwater and Pipeline 9 x Moorhead ASR 10
x x x Moorhead Peak-day - Expanded Use of Buffalo Aquifer 11 x x
Moorhead – Full Use of Buffalo Aquifer 12 x New Groundwater to Serve Industries 13
x x x Peak-day Water Demand using Storage 14 x x Pipeline to Industries in Southeast North Dakota 15 x x Relocate Grafton River Intake 16 x x x x x Water Conservation 17 x x x x x x West Fargo North ASR 18
x x West Fargo South ASR 19 x x
Five alternatives or combinations of water supply features are presented in this FEIS. Because there are 19 water supply features, a number of other combinations of features are possible. The purpose of the EIS is to evaluate the impacts of alternatives, which is achieved by quantifying the impacts of each feature. As the Project is formulated through the planning and NEPA
2 - 18

Red River Valley Water Supply Project FEIS Chapter Two Alternatives
process, the alternative selected in the ROD may vary from the five alternatives considered in this FEIS, but the selected alternative will only include water supply features from these alternatives. Because all the water supply features are evaluated, the impacts have been adequately assessed in this FEIS, and a revised alternative ultimately could be selected in the ROD.
Table 2.6 lists a matrix of the alternatives and identifies water supply features included in each alternative. Some features would be used only in one alternative, while other features, like water conservation, would be used in all alternatives. The features are numbered from 1 to 19 and are listed in alphabetical order.
Some alternative and features, such as methods to meet peak-day demands, ASR (aquifer storage and recovery), and development of new groundwater sources, can be interchanged to some degree among alternatives. The alternative costs listed later in this chapter will be revised for the selected alternative if some of these interchangeable features are substituted for other features in the ROD. All of the action alternative capacity estimates include 5% for pipeline losses. Water supply features are described below.
Biota Water Treatment Plants Each of the Missouri River import alternatives would use a biota WTP (water treatment plant) to reduce the risk of transfer of invasive species from the Missouri River Basin to the Hudson Bay Basin. The GDU Import to Sheyenne River and GDU Import Pipeline Alternatives each would have a biota WTP located adjacent to the McClusky Canal (Mile Marker 58, three miles north of McClusky, North Dakota). The Missouri River Import to Red River Valley Alternative would have a biota WTP located beside the Missouri River south of Bismarck, North Dakota.
Table 2.7 shows the capacity of each biota WTP for each alternative. The capacity requirements are based on StateMod modeling results, which are discussed in detail in Appendix B.1. The biota WTP average annual water production values in ac-ft were used for estimating annual OM&R costs.
Table 2.7 – Biota Water Treatment Plant Capacity Requirements.
Alternative and
Biota WTP Location
Capacity Requirement 1
(mgd)
Capacity Requirement 1
(cfs)
Annual Average Water Treated
(ac-ft)
GDU Import to Sheyenne River – Adjacent to McClusky Canal near McClusky, North Dakota 78.8 122 31,686
GDU Import Pipeline – Adjacent to McClusky Canal near McClusky, North Dakota 54.9 85 57,824
Missouri River Import to Red River Valley – Adjacent to Missouri River south of Bismarck, North Dakota
76.9 119 28,111
1Includes 5% for pipeline losses.
2 - 19

Red River Valley Water Supply Project FEIS Chapter Two Alternatives
Three biota water treatment options were considered for the Missouri River import alternatives. The Reclamation (2005c) report, Water Treatment Plant for Biota Removal and Inactivation Preliminary Design & Cost Estimates, estimated the cost of a number of potential types of biota treatment for the Missouri River import alternatives. Two of the treatment options presented in this report, Basic Treatment and Microfiltration (figure 2.3), were evaluated in the EIS.
Figure 2.3 – Biota Water Treatment Processes Previously Considered in DEIS.
A third water treatment option, In-filter DAF (Dissolved Air Flotation) was also evaluated. The In-filter DAF option was recommended by Manitoba Water Stewardship in their comment on the DEIS (Dwight Williamson, letter of June 30, 2006). The treatment options are described in greater detail below.
Figure 2.3 shows schematics of the two biota water treatment processes considered in the EIS, as described on page 17 of Reclamation (2005c). The Basic Treatment WTP option includes coagulation, flocculation, sedimentation, UV disinfection, chlorination, and chloramines. The Microfiltration option uses coagulation, pin-floc, microfiltration, UV disinfection, chlorination, and chloramines. Comments on the DEIS raised concerns about the effectiveness of biota treatment processes that lacked filtration. The Microfiltration option provides filtration while the Basic Treatment option does not.
Appendix A.4, Ultraviolet Light Disinfection Effectiveness, addresses these concerns by summarizing the results of a literature search of studies that investigated the effectiveness of UV inactivation of various organisms. The organisms are Giardia sp., Cryptosporidium sp., and Myxoblus cerebralis ( whirling disease). The conclusion of the studies was that UV could effectively inactivate these organisms with turbidity as high as 4 NTUs (nephelometric turbidity units). Other studies showed effective inactivation at higher turbidity levels. Given the typically low turbidity of Missouri River water, Basic Treatment, which includes a pretreatment process of coagulation, flocculation and sedimentation, would produce water with less than 4 NTUs of turbidity consistently.
Table A.5.1 in Appendix A.5 shows that each of the biota treatment options considered in the EIS would achieve the log removal or treatment credit requirements required under the SDWA
2 - 20

Red River Valley Water Supply Project FEIS Chapter Two Alternatives
by inactivation. However, a multi-barrier process that includes removal by filtration, rather than relying on inactivation by UV, would provide a higher level of protection from transfer of invasive species.
The Manitoba Water Stewardship letter recommended that the In-filter DAF regime followed by UV, and chlorine/chloramines disinfection be considered as a water treatment option. This treatment process includes filtration, as shown in figure 2.4. The J.F. Sato and Associates (2007) report, Water Treatment Plant for Biota Removal and Inactivation Feasibility Study Cost Estimate, which is appended to the EIS as a supporting document, developed the design and cost estimates for the In-filter DAF option recommended by Manitoba.
Figure 2.4 – In-filter DAF Biota Water Treatment Process Suggested by the Province of Manitoba.
A conference call in December 2006, between Manitoba, Reclamation, and North Dakota, discussed the biota water treatment goals identified by Manitoba Water Stewardship in their letter of June 30, 2006. During the call, Manitoba Water Stewardship further clarified their treatment goals. These treatment goals are listed below in the blue box. In-filter DAF or some other comparable treatment process that includes filtration would meet Manitoba’s treatment goals.
Manitoba Water Stewardship Biota Water Treatment Goals
Parameter Treated Water Goals for Biota Prior to Inter-basin Transfer Comments
Turbidity <0.3 NTU This is necessary to ensure effectiveness of disinfection against viruses.
Disinfection-resistant Protozoa such as Myxobolus cerebralis
2.5 log (99.68%) removal This should be achieved in a minimum of two separate barriers including filtration followed by ultraviolet (UV) disinfection.
Other Protozoa with similar characteristics as Giardia and Cryptosporidium
4 log (99.99%) total removal/inactivation with a minimum of 2.5 log by removal
This should be achieved in three separate barriers with disinfection achieved by UV and chlorination or ozonation.
Viruses 4 log (99.99%) inactivation This can be achieved through disinfection.
2 - 21

Red River Valley Water Supply Project FEIS Chapter Two Alternatives
Construction (capital) and OM&R costs were estimated in Reclamation (2005c) for the treatment processes shown in figure 2.3. These water treatment option cost estimates were updated by the Reclamation Denver Technical Service Center in two technical memorandums (Reclamation 2007a and 2007b). Manitoba In-filter DAF treatment process was received after the Reclamation (2007) report was completed, so costs for the treatment option were not provided in the SDEIS. The J.F. Sato and Associates (2007) report developed the design and cost estimates for the Manitoba recommended In-filter DAF treatment option for the FEIS. These biota WTP cost estimates were used to update Missouri River import alternatives costs estimates, as shown in Appendix A.5, table A.5.2.
The OM&R cost estimates were based on the annual average biota WTP production estimates in ac-ft in table 2.7. Review of modeling results shows that each of the Missouri River import alternatives would be used to some degree as a water supply in all 71 years of modeling; therefore, average production values are sufficient for OM&R cost estimates.
All the biota water treatment options include chlorine and chloramines for disinfection and residual maintenance. During meetings on July 26-27, 2006, and August 28, 2006, with Reclamation, North Dakota, and EPA-Region 8 staff, EPA staff clarified their position on the use of chlorine to inactivate microorganisms. They also raised concerns about potential disinfection byproduct issues with the Missouri River import alternatives. EPA was particularly concerned about the GDU Import Pipeline and Missouri River Import to Red River Valley Alternatives, because these convey water via buried pipeline directly into WTPs in the Fargo/Moorhead area. The use of chlorine combined with the extended travel time from the McClusky Canal/Missouri River to the Fargo area could, in the opinion of EPA, create potentially harmful levels of disinfection byproducts. EPA was particularly concerned with the Basic Treatment option (figure 2.3), which does not include filtration that removes a substantial amount of the precursors (organic carbon) which form disinfection byproducts when exposed to chlorine. EPA staff also noted that they had no concerns about disinfection byproducts on the GDU Import to Sheyenne River Alternative, because that alternative would release water directly into the Sheyenne River above Lake Ashtabula. Disinfection byproducts would be volatized when exposed to air and mixing in a large body of water, so these are not a concern in this alternative.
Because chlorine would be required to inactivate potentially invasive species, the EPA staff recommended that a treatment process including filtration be considered for the GDU Import Pipeline and Missouri River Import to Red River Valley Alternatives. Therefore, either the In-filter DAF or Microfiltration treatment options could be considered for those two alternatives in the EIS.
Chloramines would be used with filtration for residual management, however, based on EPA recommendations, chloramine treatment was eliminated from consideration for the GDU Import to Sheyenne River Alternative. The chlorine used in the alternative would provide an adequate residual, and any disinfection byproducts formed would be eliminated after the water would be released into the Sheyenne River.
Biota Water Treatment Plant for Missouri River Import Alternatives Each of the Missouri River import alternatives would use a biota WTP to reduce the risk of transfer of invasive species from the Missouri River Basin to the Hudson Bay Basin.
2 - 22

Red River Valley Water Supply Project FEIS Chapter Two Alternatives
Reclamation evaluated a range of multi-barrier treatment processes, any of which would reduce the risk of importing invasive species. Reclamation will further assess both domestic and transboundary considerations regarding biota transfer during the EIS process.
•
•
•
Reclamation identified a multi-barrier approach that includes removal of potentially harmful organisms for all the Missouri River import alternatives. This multi-barrier approach was identified because:
In the course of analyzing specific comments on the EIS and in ongoing discussions with Manitoba by representatives of the U.S. Government, Reclamation has gained a better understanding of Manitoba’s concerns regarding risks associated with an interbasin water transfer.
Reclamation believes the treatment processes proposed in this EIS addresses concerns regarding invasive species raised in comments on earlier draft versions of this EIS by Minnesota Pollution Control Agency, MNDNR, Missouri Department of Natural Resources, Red Lake Nation, White Earth Reservation Tribal Council, Audubon Dakota, and the public (see Appendix M).
Reclamation noted Manitoba’s conclusion that a multi-barrier approach that includes removal by filtration provides for greater risk reduction than a multi-barrier approach that does not include a removal process. The treatment approaches identified by Reclamation that include microfiltration and UV or in-filter DAF and UV are consistent with the treatment goals proposed by Manitoba, provide for appropriate levels of risk reduction and risk management, and are compatible with the purpose and need of the Project.
Identification of Biota Treatment Option for each Missouri River Import Alternative Appendix A.5 compares biota treatment option costs, risk reduction from each treatment process, and failure analysis results for each Missouri River import alternative. The analysis showed that the In-filter DAF treatment option, which includes pre-treatment, media filtration, UV, and chlorination, is the most cost effective biota treatment process for each alternative.
The In-filter DAF treatment option meets Manitoba’s treatment goals; however, Reclamation will continue to evaluate potential treatment options that meet these goals as the Project progresses. This analysis may reveal other more cost effective treatment options within the range of those evaluated in this EIS.
GDU Import to Sheyenne River Alternative Biota WTP The In-filter DAF or a comparable, cost effective treatment process was identified as the biota treatment option for this alternative. The biota treatment option identification process is provided in Appendix A.5. The biota WTP including an intake structure has an estimated construction cost of $124,403,000, with an annual OM&R cost of $2,625,000.
Chloramines would not be used in this alternative, based upon EPA recommendations. This alternative releases water into the Sheyenne River above Lake Ashtabula after treatment to
2 - 23

Red River Valley Water Supply Project FEIS Chapter Two Alternatives
inactivate microorganisms. Aquatic life is very sensitive to chlorine, so any residual concentrations would be removed prior to releasing Project water into the Sheyenne River above Lake Ashtabula.
GDU Import Pipeline Alternative Biota WTP The In-filter DAF or a comparable, cost effective treatment process was identified as the biota treatment option for this alternative. The biota treatment option identification process is described in Appendix A.5. This biota WTP including an intake structure has an estimated construction cost of $89,161,000 and an annual OM&R cost of $4,716,000.
Missouri River Import to Red River Valley Alternative Biota WTP The In-filter DAF or a comparable, cost effective treatment process was identified as the biota treatment option for this alternative. The biota treatment option identification process is described in Appendix A.5. The biota WTP including an intake structure has an estimated construction cost of $163,762,000 and an annual OM&R cost of $2,518,000. The overall cost of the treatment plant is higher, because the intake structure is more expensive than the other Missouri River import alternatives.
Bismarck to Fargo/Grand Forks Pipeline This feature is a 276 mile long buried pipeline conveyance system that would transport Missouri River water from a biota WTP south of Bismarck to the Fargo and Grand Forks areas. The buried pipeline from the biota WTP to Fargo has a capacity of 119 cfs. The buried pipeline that serves Grand Forks starts at Casselton and would deliver 20 cfs of Project water to blend with existing surface water sources to improve water quality. Booster pump stations and storage tanks are also included based on hydraulic and operational considerations. The annual OM&R costs for the feature are based on average annual water conveyance of 28,111 ac-ft, which was derived from StateMod hydrologic modeling results, as shown in table 2.7. Review of modeling results shows that the feature was used in all 71 years of modeling, so no additional maintenance flows (to account for non-use years) were added to the 28,111 ac-ft annual total. This feature is only used in the Missouri River Import to Red River Valley Alternative. The feature has an estimated construction cost of $841,785,000 and an annual OM&R cost of $2,947,000.
Cass Rural Water User District Interconnection with Fargo This feature includes the cost of CRWUD (Cass Rural Water Users District) interconnection with Fargo and purchase of water to meet estimated shortages. Reclamation’s analysis of CRWUD existing groundwater sources in chapter three reveals that the water system would have adequate water supplies for its Phase II and III service areas but not for its Phase I area. The Phase I area is adjacent to Fargo, so in this alternative the CRWUD would interconnect with the Fargo water system and would purchase water to meet its total Phase I service area needs. The feature has a 2.1 cfs (942 gpm) buried pipeline interconnection between Fargo and the CRWUD distribution system. The annual OM&R cost for the CRWUD Phase I service area is based on average annual water demand, which is 340 ac-ft. This feature is used in all the action alternatives. The feature has an estimated construction cost of $6,437,000 and an annual OM&R cost of $170,000.
2 - 24

Red River Valley Water Supply Project FEIS Chapter Two Alternatives
GDU Principal Supply Works The GDU Principal Supply Works would be used to deliver Missouri River water by two of the five alternatives. This feature incorporates the cost of the GDU Principal Supply Works that would be repaid to the federal government based on the capacity used by each alternative. An explanation of assigned costs is in the Final Needs and Options Report, Appendix C, Attachment 7 (Reclamation 2005a). For estimating purposes the incremental share of GDU Principal Supply Works is $90,414 per cfs for construction and $735 per cfs for annual OM&R.
The GDU facilities were constructed in the late 1960s and 1970s and have been minimally maintained. Some major repairs or enhancements would be required if the facilities were used to supply water to the Red River Valley. The repair or enhancements include Snake Creek Pumping Plant intake channel work, McClusky Canal slide repair, and modifying control structures for remote monitoring and winter operations. Detailed descriptions of Principal Supply Works repairs, rehabilitation and cost estimates are in Update of Garrison Diversion Unit Principal Supply Works Costs (Reclamation 2005d). This feature is used in the GDU Import to Sheyenne River and GDU Import Pipeline Alternatives. For the GDU Import to Sheyenne River Alternative, the estimated construction cost is $11,030,000 and the annual OM&R cost is $90,000. For the GDU Import Pipeline Alternative the construction cost is about $7,685,000 and the annual OM&R cost is $63,000.
GDU McClusky Canal
Grand Forks-Traill Water District Interconnection With Grand Forks This feature is a buried pipeline that would interconnect GFTWD (Grand Forks-Traill Water District) to Grand Forks. Groundwater analysis shows that GFTWD would experience a water shortage in the future, and that the water system needs to purchase water from Grand Forks. Twenty-six miles of buried pipeline with 2.8 cfs (1,257 gpm) of pipeline capacity would interconnect with the Grand Forks WTP to meet the estimated shortages. OM&R cost estimates are based on an annual average water purchase of 230 ac-ft. The feature has an estimated construction cost of $7,474,000 and an annual OM&R cost of $144,000. This feature is used in all the action alternatives.
Grand Forks to Lake Ashtabula Pipeline This 88 mile long buried pipeline would capture available flows below the confluence of the Red and Red Lake Rivers and convey it to Lake Ashtabula. The water would be stored in Lake Ashtabula until needed to meet downstream MR&I water demands. A river intake would withdraw the water from the Red River below the confluence of the Red and Red Lake Rivers north of Grand Forks. The intake would be located behind an existing lowhead dam, and a pumping station would be constructed adjacent to the river. The pumping station and conveyance pipeline would have a capacity of 48 cfs. Based on hydraulic and operational considerations, booster pump stations and storage tanks are also included in this feature.
2 - 25

Red River Valley Water Supply Project FEIS Chapter Two Alternatives
This feature would operate continuously during a 1930s-type drought when there would be more water in the lower Red River than in the upper portion of the river. During short-term drought events, the pipeline could be used intermittently. Normally, OM&R cost estimates are based on an average annual volume of water conveyed, which is 7,075 ac-ft. However, a review of modeling results shows that the feature is used in 63 of 71 years. The feature would be operated periodically, about one month a year during non-drought periods, to assure reliable operations. Based on flow capacities, this would be 2,900 ac-ft for 8 years. The total annual average volume of water conveyed through the feature would be 7,402 ac-ft. The feature has an estimated construction cost of $256,159,000 and an annual OM&R cost of $1,411,000. This feature is used in the North Dakota In-Basin Alternative.
Overview of Lake Ashtabula
McClusky Canal to Fargo Pipeline This 196 mile long buried pipeline feature would convey water from a biota WTP adjacent to the McClusky Canal to the Fargo area. The main conveyance pipeline would have a capacity of 85 cfs. The feature also includes booster pump stations and storage reservoirs needed for hydraulic considerations. The annual OM&R costs for the feature are based on average annual water conveyance of 57,824 ac-ft derived from StateMod hydrologic modeling results listed in table 2.7. Review of modeling results shows that the feature is used in all 71 years of modeling, so no additional maintenance flows (to account for non-use years) are in the 57,824 ac-ft annual total. The feature has an estimated construction cost of $723,148,000 and an annual OM&R cost of $1,906,000. This feature is used in the GDU Import Pipeline Alternative.
McClusky Canal to Lake Ashtabula Pipeline This 123 mile long buried pipeline feature would convey water from a biota WTP located beside McClusky Canal to Lake Ashtabula. The conveyance feature is sized to maintain Lake Ashtabula within target operation elevations (above 28,000 ac-ft fish and wildlife conservation pool), while at the same time accounting for Baldhill Dam releases into the Sheyenne River to meet MR&I water demands in the Red River Valley. The pipeline would have a capacity of 122 cfs with a 116 cfs terminating structure to release Project water into the Sheyenne River above Lake Ashtabula. The annual OM&R costs for the feature are based on average annual water conveyance of 31,686 ac-ft derived from StateMod hydrologic modeling results, as shown in table 2.7. According to the hydrologic model, the feature is used all 71 years of modeling, so no additional maintenance flows (to account for non-use years) are in the 31,686 ac-ft annual total. The feature has an estimated construction cost of $465,396,000 and an annual OM&R cost of $1,011,000. This feature is used in the GDU Import to Sheyenne River Alternative.
2 - 26

Red River Valley Water Supply Project FEIS Chapter Two Alternatives
Minnesota Groundwater and Pipeline This feature proposes developing wellfields and constructing a buried pipeline to deliver Minnesota groundwater to the Fargo/Moorhead area. The wellfields would be located in Becker, Clay, and Otter Tail Counties and would include portions of Pelican River Sand-Plain and Otter Tail Surficial Aquifers. The wellfields and conveyance pipeline are sized to meet the water shortage estimated by hydrologic modeling. The wellfields would yield a total of 43 cfs or 19,300 gpm (gallons per minute). The feature has a network of 162 miles of buried pipelines in the two aquifer areas linking wells to the main 36 mile long conveyance pipeline. The main conveyance pipeline would be sized to carry 43 cfs.
Based on hydrologic modeling, the average annual yield from the wellfields would be 4,522 ac-ft. The volume is relatively small, because it represents an average water demand over a 71-year hydrologic analysis. The conveyance feature capacities are much higher because of high demand during a 1930s-type drought. Other than during a drought, the wellfields would be used minimally to provide an adequate water supply to the valley. A review of modeling results shows that the Minnesota groundwater feature would be used in 14 of 71 years. To assure reliable operations the feature would be operated about one month a year during non-drought periods. This would be a flow of 2,559 ac-ft for 57 of 71 years. The total annual average volume of water conveyed through the feature would be 6,576 ac-ft. The feature has an estimated construction cost of $214,305,000 and an annual OM&R cost of $2,483,000. This feature is used in the Red River Basin Alternative.
Moorhead Aquifer Storage and Recovery This ASR system feature would include two dual purpose ASR wells in the Moorhead Aquifer. The purpose of this feature would be to stabilize water levels in the aquifer so the water source could be used indefinitely. The ASR feature would inject treated water from the Moorhead WTP into the Moorhead Aquifer to recharge it during periods of adequate surface water supply. Groundwater would be withdrawn from the aquifer as needed. The Moorhead ASR feature has a capacity of 1.0 cfs (449 gpm). Annual OM&R costs are based on recharge during an average year at 120 ac-ft. The OM&R costs also include the cost of treating water to use in recharging the aquifer. The feature has an estimated construction cost of $1,639,000 and an annual OM&R cost of $128,000. This feature is used in the North Dakota In-Basin, Red River Basin, and GDU Import Pipeline Alternatives.
Moorhead Peak-Day - Expanded Use of Buffalo Aquifer This feature would increase the well capacity of the Buffalo Aquifer to meet Moorhead’s future peak-day water demands. Moorhead currently pumps an average of 1.9 cfs (853 gpm) annually from the Buffalo Aquifer. This feature would expand wellfield capacity from its present 6.0 cfs (2,693 gpm) capacity to 7.0 cfs (3,142 gpm). This would be a net expansion in wellfield capacity of 1.0 cfs (449 gpm). The existing wellfield pipeline is in poor condition and would be replaced. The new buried pipeline would run from the two Buffalo wellfields to the Moorhead WTP.
Annual OM&R costs are based on increasing well capacity to meet peak-day water needs. The maximum annual withdrawal for peaking is 519 ac-ft. The increase in groundwater capacity would be 14.3% based on a 1.0 cfs increase. Moorhead’s average annual withdrawal from the
2 - 27

Red River Valley Water Supply Project FEIS Chapter Two Alternatives
expanded Buffalo Aquifer wellfield would increase by 74 ac-ft. The feature has an estimated construction cost of $2,727,000 and an annual OM&R cost of $65,000. This feature is used in the North Dakota In-Basin and Red River Basin Alternatives.
Moorhead – Full Use of Buffalo Aquifer This is a new water supply feature that was not investigated in the Final Needs and Options Report or evaluated in the DEIS. The feature would expand development of the Buffalo Aquifer to potentially serve Moorhead’s total needs during drought after its existing water supply in the Red River is depleted. Twelve 750 gpm wells (9,000 gpm or 20 cfs) would be added to the existing well capacity of 2,700 gpm for a potential total of 11,700 gpm. Approximately 20 miles of collector and conveyance pipelines would move water to the existing Moorhead WTP. This buried pipeline would replace an existing pipeline that currently serves two wellfields.
Average annual water production by the wellfields could be as high as 13,660 ac-ft during a severe drought, with as little as 1,000 ac-ft during non-drought years for maintenance flows. Assuming the 13,660 ac-ft would be used for 10 years and the remaining 61 years would be 1,000 ac-ft, the composite annual average wellfield production and conveyance flows for estimating OM&R costs would be 2,800 ac-ft per year. The feature has an estimated construction cost of $16,942,000 and an annual OM&R cost of $571,000. This feature is used in the GDU Import Pipeline Alternative.
New Groundwater to Serve Industries This feature develops new groundwater capacity to supply existing and future industrial water demands in southeastern North Dakota near Wahpeton. The feature proposes wellfields in the Brightwood, Gwinner, Milnor Channel, and Spiritwood Aquifers. The feature includes 65 miles of buried pipeline interconnecting wells and 35 miles of main conveyance pipeline running east into the Wahpeton area. The maximum annual wellfield production would be 5,330 ac-ft with a 71-year average water demand of 760 ac-ft. The main conveyance pipeline would have a capacity of 9 cfs (4,039 gpm). Industries served by this feature would include the existing Cargill Corn Processing Plant near Wahpeton and a proposed new industrial water demand near Wahpeton. Booster pump stations and storage tanks for this feature are based on hydraulic and operational considerations.
Agricultural Processing Plant in the Red River Valley
Annual OM&R costs are based on an average annual water demand of 760 ac-ft. Some periodic operation of these facilities, at a volume of 540 ac-ft for approximately one month per year, would be required during non-drought periods to assure reliable operations. Therefore, the total annual volume of water used for OM&R cost estimates is 1,300 ac-ft. Water treatment is not part of this feature; industries would treat the water to their own specifications prior to use. The feature has an estimated construction cost of $54,364,000 and an annual OM&R cost of
2 - 28

Red River Valley Water Supply Project FEIS Chapter Two Alternatives
$564,000. This feature is used in the North Dakota In-Basin, Red River Basin, and GDU Import Pipeline Alternatives.
Peak-Day Water Demand Using Storage This feature would store water to meet peak-day water demands for some selected cities that lack other methods, such as groundwater or an imported supply. Drayton, East Grand Forks, Grafton, Langdon, and LRWD (Langdon Rural Water District) need sufficient storage to meet peak-day water demands for the North Dakota In-Basin and Red River Basin Alternatives. The total storage capacity would be 15 Mgal (million gallons) which includes 1.9 Mgal of storage for Dayton, 7.9 Mgal for East Grand Forks, 2.7 Mgal for Grafton, and 2.5 Mgal for Langdon and LRWD. The storage feature would work by capturing water from the system’s existing surface water source, storing it, and using it as needed when existing sources are insufficient. Cost estimates for OM&R are based on maintaining raw water storage reservoirs plus pumping costs equal to 6% of average annual water demands for the five water systems, which is 180 ac-ft. The feature has an estimated construction cost of $28,547,000 and an annual OM&R cost of $58,000. This feature is used in the North Dakota In-Basin and Red River Basin Alternatives.
Pipeline to Industries in Southeast North Dakota This 48 mile long buried pipeline feature would deliver water to existing and new industries in southeastern North Dakota from the Fargo area. The feature includes a 9 cfs (4,039 gpm) buried pipeline to the Wahpeton area, pumping plants(s), and operation storage. Industries to be served include the existing Cargill Corn Processing Plant near Wahpeton and proposed new industrial water demands near Wahpeton. The maximum annual shortage conveyed to the southeast industries would be 5,330 ac-ft. Annual OM&R costs are based on an average annual water demand for these industries of 760 ac-ft. Some periodic operation of these facilities at an annual volume of 540 ac-ft (approximately one month per year) would be required during non-drought periods to assure reliable operations. Therefore, the total annual volume of water used for OM&R cost estimates is 1,300 ac-ft. Water treatment is not part of this feature; industries would treat the water to their own specifications prior to use. The feature has an estimated construction cost of $41,404,000 and an annual OM&R cost of $46,000. This feature is used in the GDU Import to Sheyenne River and Missouri River Import to Red River Valley Alternatives.
Relocate Grafton River Intake This feature would relocate Grafton’s intake from its present location east of Grafton on the Red River to approximately five miles north (downstream) on the Red River behind an existing lowhead dam. This would increase water depth under low flow conditions to ensure reliable intake operation. The intake structure is currently sized at 5 cfs (2,244 gpm). The OM&R costs of the intake relocation are based on the additional annual energy costs of conveying an average of 930 ac-ft through an additional 5 miles of buried pipeline. This feature is used in all the action alternatives. The feature has an estimated construction cost of $3,689,000 and an annual OM&R cost of $30,000.
Water Conservation Water savings from water-system-based water conservation programs are accounted for in the per capita water demand estimates in the Final Needs and Options Report (Reclamation 2005a). These water conservation water savings are estimated in the Report on the Red River Valley
2 - 29

Red River Valley Water Supply Project FEIS Chapter Two Alternatives
Water Supply Project Needs and Options, Water Conservation Potential Assessment Final Report (Reclamation 2004b). Project-wide, approximately 1.4 billion gallons (4,300 ac-ft) per year would be saved at an approximate annual cost of $780,000. This feature is used in all the action alternatives.
West Fargo North Aquifer Storage and Recovery This feature proposes to construct an ASR system in the West Fargo North Aquifer to meet future water demands of West Fargo during a drought. During normal or wet periods West Fargo would be served by the Fargo regional WTP, which would withdraw water from the Red and Sheyenne Rivers. The ASR feature includes 45 groundwater wells and 15 miles of buried pipelines interconnecting wells and a main conveyance pipeline running from the wellfield to a regional WTP in the Fargo area.
Treated water from a regional WTP would recharge the aquifer periodically to restore previously lost capacity. This stored groundwater would be used by West Fargo during droughts when diminished flows in the Sheyenne River would be used by Fargo and Moorhead. Hydrologic modeling reveals that West Fargo would be completely dependent on ASR water during a 1930s-type drought. The West Fargo North Aquifer ASR Project is designed to handle West Fargo’s peak-day water needs, which are 14.5 cfs (9.4 mgd).
The ASR system would be used continuously during a 1930s-type drought, intermittently during minor droughts, and not at all during normal or wet climate conditions. Conservatively, the ASR system would be relied upon during about 10 of the 71 modeled flow years, plus one month each non-use year to ensure reliable operations. The maximum annual water demand is 4,261 ac-ft. Cost estimates for OM&R are based on 10 years of maximum annual usage over 71 years, or an average annual use of 600 ac-ft plus one month of average use at 290 ac-ft for a total of 890 ac-ft per year. The feature has an estimated construction cost of $50,852,000 and an annual OM&R cost of $1,245,000. This feature is used in the North Dakota In-Basin and Red River Basin Alternatives.
West Fargo South Aquifer Storage and Recovery This feature would use groundwater from the West Fargo South Aquifer to meet peak-day water demands of Fargo. The feature includes 36 groundwater wells plus 24 miles of buried pipelines interconnecting wells and a main conveyance pipeline running from the wellfield to Fargo. To assure that there would be no long-term depletion of the aquifer, an ASR feature would be constructed. Groundwater wells would be developed for a capacity of 39.3 cfs. The maximum annual demand for Fargo is 37,682 ac-ft, and approximately 6% of annual demands would be served from the ASR system, which is 2,270 ac-ft. The aquifer would be recharged with treated water. The estimated maximum annual water withdrawal would be 2,270 ac-ft.
Annual OM&R cost estimates are based on average annual peak-day demand. Conservatively, the ASR system would be relied upon during about 10 of the 71 modeled flow years, plus one month each non-use year to ensure reliable operations. Cost estimates for OM&R are based on 10 years of maximum annual usage over 71 years, or an average annual use of 320 ac-ft plus one month of average use at 190 ac-ft, for a total of 510 ac-ft. The feature has an estimated construction cost of $45,404,000 and an annual OM&R cost of $1,009,000. This feature is used in the North Dakota In-Basin and Red River Basin Alternatives.
2 - 30

Red River Valley Water Supply Project FEIS Chapter Two Alternatives
North Dakota In-Basin Alternative
This alternative would supplement existing water supplies and use the Red River and other North Dakota water sources to meet future water demands. The alternative includes 11 water supply features, including water conservation. The main water supply feature is a 48 cfs buried pipeline that captures Red River flows downstream of Grand Forks and conveys flows back to Lake Ashtabula for storage and release to meet MR&I water demands. The alternative also includes developing new groundwater sources in southeastern North Dakota to serve industries. To supplement water supplies during a drought, ASR systems are proposed for Fargo, Moorhead, and West Fargo. Moorhead would continue to draw on Minnesota groundwater sources for some of its water demand. Additional storage reservoirs would be needed by communities in the northern part of the Red River Valley. The CRWUD and GFTWD would connect to the Fargo and Grand Forks municipal systems. The intake for Grafton would be relocated north on the Red River behind an existing lowhead dam to improve reliability during low flow river conditions. Figure 2.5 shows alternative features, which are listed and described in table 2.8. Table 2.9 shows the construction and OM&R cost estimates for the alternative.
Figure 2.5 – North Dakota In-Basin Alternative.
2 - 31

Red River Valley Water Supply Project FEIS Chapter Two Alternatives
Table 2.9 – North Dakota In-Basin Alternative Cost Estimate.
Features Construction
Cost (2005 dollars)*
Annual OM&R*
CRWUD Interconnection with Fargo $6,437,000 $170,000GFTWD Interconnection with Grand Forks $7,474,000 $144,000Grand Forks to Lake Ashtabula Pipeline $256,159,000 $1,411,000Moorhead ASR $1,639,000 $128,000Moorhead Peak-Day - Expand Use of Buffalo Aquifer $2,727,000 $65,000New Groundwater to Serve Industries $54,364,000 $564,000Peak-Day Water Demand using Storage $28,547,000 $58,000Relocate Grafton River Intake $3,689,000 $30,000Water Conservation $0 $780,000West Fargo North ASR $50,852,000 $1,245,000West Fargo South ASR $45,404,000 $1,009,000
Total $457,292,000 $5,604,000* Costs in the table are rounded to the nearest $1,000.
Table 2.8 – Features Proposed for Inclusion in North Dakota In-Basin Alternative.
Proposed Features Description of Proposed Features
CRWUD Interconnection with Fargo Install a 2.1 cfs (942 gpm) service connection with Fargo. GFTWD Interconnection with Grand Forks Build a 2.8 cfs (1,257 gpm) service connection with
Grand Forks. Grand Forks to Lake Ashtabula Pipeline Includes 88 miles of 48 cfs pipeline that transports water
to supplement water levels in Lake Ashtabula. Moorhead ASR Recharge 120 ac-ft of groundwater annually to maintain
aquifer water levels. Moorhead Peak-Day - Expand Use of Buffalo Aquifer Expand the wellfield capacity of the aquifer by 1.0 cfs
(449 gpm). New Groundwater to Serve Industries Develop new wellfields in the Spiritwood, Gwinner,
Brightwood, and Milnor Channel Aquifers to supply 9 cfs (4,039 gpm) of water to current and new industries through 35 miles of conveyance pipeline.
Peak-Day Water Demand using Storage Construct 15 Mgal of storage to meet peak-day demands in Drayton, East Grand Forks, Grafton, Langdon, and LRWD.
Relocate Grafton River Intake Relocate Grafton’s existing 5 cfs (2,244 gpm) river intake 5 miles north on the Red River.
Water Conservation * Save approximately 1.4 bgals (billion gallons) (4,300 ac-ft) project-wide.
West Fargo North ASR Construct ASR system to provide 14.5 cfs of wellfield capacity for drought events and peak-day demands for West Fargo.
West Fargo South ASR Construct ASR system to provide 39.3 cfs of wellfield capacity for peak-day demands for Fargo.
* This feature is also in the No Action Alternative.
2 - 32

Red River Valley Water Supply Project FEIS Chapter Two Alternatives
Operational Description The primary water supply feature in the North Dakota In-Basin Alternative is a buried pipeline that would convey water from the Red River below the confluence of the Red and Red Lake Rivers north of Grand Forks back to Lake Ashtabula. The buried pipeline would originate downstream of the Grand Forks intake and the Red River’s confluence with Red Lake River and upstream of Grand Forks’ sanitary sewer discharge. The feature would operate when storage capacity is available in Lake Ashtabula and flows in the Red River are sufficiently high.
Hydrologic modeling was designed to first meet Grand Forks, East Grand Forks, and all other northern North Dakota water demands before any water was made available to convey to Lake Ashtabula. In effect, the pipeline has the lowest water permit in the hydrologic model to assure that senior Red River water permits are served first. Return flows from Grand Forks and East Grand Forks are not conveyed back to Lake Ashtabula and are available for use by downstream water users.
The alternative is designed to maintain a minimum Lake Ashtabula reservoir capacity of 28,000 ac-ft and a minimum release of 13 cfs from Baldhill Dam to meet basic aquatic needs in the Sheyenne River. No additional flows are reserved in the Red River for minimum stream flows. From a modeling standpoint all the surface water dependent cities in the Red River Valley service area could call on water from Lake Ashtabula under the Thompson-Acker Plan. Five cities have existing permits, as listed in table 2.3, and the remaining cities would be required to share unallocated water rights reserved by the State Engineer. More detailed information on the allocation of Lake Ashtabula storage is in table 2.3 and is described in the chapter three water quantity section.
This alternative is designed to deliver maximum month water demands from the Sheyenne and Red Rivers to the Fargo-Moorhead area either from natural flows or from Lake Ashtabula releases. Daily peaking demands are served using a number of individual features. The West Fargo South ASR feature would serve Fargo’s peaking demands and expansion of the Buffalo Aquifer covers Moorhead’s peaking demands. West Fargo is modeled to use surface water from the Sheyenne River; however, during a severe drought, the West Fargo North ASR feature is designed to meet its full demands, including peaking. The alternative is also designed to deliver maximum month peak-day water demands from the Red and Red Lake Rivers in the Grand Forks–East Grand Forks area. This eliminates the need for separate peak-day water supply features. This is possible, because the return flows from the Fargo-Moorhead area are sufficient to meet water needs in Grand Forks. Communities downstream from Grand Forks are modeled to meet maximum month demands from the river with additional storage to cover peak-day demands. The existing and future industrial water demands in the Wahpeton area would be served from the Red River first. After these supplies are depleted, the industries would use a groundwater feature to be developed in southeastern North Dakota.
The water demands shortages for CRWUD and GFTWD (they have some existing groundwater sources) and the total demand for LRWD rural systems are served indirectly from surface water in the hydrologic model. CRWUD demand annual shortage of 963 ac-ft is included in the Fargo demand and GFTWD annual shortage of 828 ac-ft is included in the Grand Forks demand. CRWUD relies on existing Page and Sheyenne Delta Aquifers and Red River surface water,
2 - 33

Red River Valley Water Supply Project FEIS Chapter Two Alternatives
while GFTWD relies on both Elk Valley Aquifer groundwater and water from the Red River. In the model the LRWD annual demand of 216 ac-ft is served from the Red River at Pembina; although, the district actually draws water from the upper South Pembina River at Mount Carmel Dam.
The viability of this alternative depends on accurate estimation of future flows downstream (north) of Grand Forks that would be used to maintain adequate Lake Ashtabula storage during a drought. Any underestimation of these Red River flows during a 1930s-type drought would compromise the viability of this alternative. The other alternatives do not have similar risks associated with their modeling.
The pipeline from the Red River below Grand Forks to Lake Ashtabula would convey water to maintain Lake Ashtabula at seasonally targeted elevations. The lake level would be maintained to avoid dropping below 28,000 ac-ft (see Appendix B.1). An operating plan for Lake Ashtabula releases to serve downstream water users would be developed for the Project as part of final engineering.
Baldhill Dam (Lake Ashtabula) is operated under a master operating plan that would be modified to manage flow releases to downstream Project customers. Because the travel time for water released from Baldhill Dam could take 20 days to reach Fargo during low flow drought events, the Project would develop a water management process or tool. This process or tool would consider climatic forecasts, seasonal water demands, river conditions, and available storage to estimate releases to serve downstream water needs.
2 - 34

Red River Valley Water Supply Project FEIS Chapter Two Alternatives
Red River Basin Alternative
This alternative would supplement existing water supplies and would draw on a combination of the Red River, other North Dakota water sources, and Minnesota groundwater sources to meet future demands. The alternative includes 11 water supply features, including water conservation. The main water supply feature would be a series of wellfields developed in Minnesota with an interconnecting conveyance buried pipeline serving the Fargo-Moorhead metropolitan area. The alternative also would include developing new groundwater sources in southeastern North Dakota to serve industries.
To supplement water supplies during a drought, ASR systems are proposed for Fargo, Moorhead, and West Fargo. Moorhead would continue to draw on Minnesota groundwater sources for some of its water demand. Additional storage reservoirs would be needed by communities in the northern end of the Red River Valley. The CRWUD and GFTWD would connect to the Fargo and Grand Forks municipal systems. The Grafton intake would be relocated north behind an existing lowhead dam to improve reliability during low flow river conditions. Figure 2.6 shows alternative features, which are listed and described in table 2.10. Table 2.11 lists construction and OM&R cost estimates for the alternative.
Figure 2.6 – Red River Basin Alternative.
2 - 35

Red River Valley Water Supply Project FEIS Chapter Two Alternatives
Table 2.10 – Features Proposed for Inclusion in Red River Basin Alternative.
Proposed Features Description of Proposed Features
CRWUD Interconnection with Fargo Install a 2.1 cfs (942 gpm) service connection with Fargo. GFTWD Interconnection with Grand Forks Build a 2.8 cfs (1,257 gpm) service connection with
Grand Forks. Minnesota Groundwater and Pipeline Develop a new 43 cfs wellfield and pipeline network (162
miles) in Otter Tail County and construct a 36 mile pipeline to convey groundwater to Fargo and Moorhead.
Moorhead ASR Recharge 120 ac-ft of groundwater annually to maintain aquifer water levels.
Moorhead Peak-Day - Expand Use of Buffalo Aquifer Expand wellfield capacity of the aquifer by 1.0 cfs (449 gpm).
New Groundwater to Serve Industries Develop new wellfields in the Spiritwood, Gwinner, Brightwood, and Milnor Channel Aquifers to supply 9 cfs (4,039 gpm) of water to current and new industries through 35 miles of conveyance pipeline.
Peak-Day Water Demand using Storage Construct 15 Mgal of storage to meet peak-day demands in Drayton, East Grand Forks, Grafton, Langdon, and LRWD.
Relocate of Grafton River Intake Relocate Grafton’s existing 5 cfs (2,244 gpm) river intake 5 miles north on Red River.
Water Conservation * Save approximately 1.4 bgals (4,300 ac-ft) project-wide. West Fargo North ASR Construct ASR system to provide 14.5 cfs of wellfield
capacity for drought events and peak-day demands for West Fargo.
West Fargo South ASR Construct ASR system to provide 39.3 cfs of wellfield capacity for peak-day demands for Fargo.
* This feature is also in the No Action Alternative.
Table 2.11 – Red River Basin Alternative Cost Estimate.
Features Construction
Cost (2005
dollars)*
Annual OM&R*
CRWUD Interconnection with Fargo $6,437,000 $170,000GFTWD Interconnection with Grand Forks $7,474,000 $144,000Minnesota Groundwater and Pipeline $214,305,000 $2,483,000Moorhead ASR $1,639,000 $128,000Moorhead Peak-Day - Expand Use of Buffalo Aquifer $2,727,000 $65,000New Groundwater to Serve Industries $54,364,000 $564,000Peak-Day Water Demand using Storage $28,547,000 $58,000Relocate of Grafton River Intake $3,689,000 $30,000Water Conservation $0 $780,000West Fargo North ASR $50,852,000 $1,245,000West Fargo South ASR $45,404,000 $1,009,000
Total $415,438,000 $6,676,000* Costs in the table are rounded to the nearest $1,000.
2 - 36

Red River Valley Water Supply Project FEIS Chapter Two Alternatives
Operational Description The primary water supply feature of the Red River Basin Alternative is a series of groundwater wells in the Pelican River and Otter Tail Surficial Aquifers with an interconnected network of buried pipelines and a conveyance pipeline into the Fargo-Moorhead area. The feature would operate when flows in the Sheyenne and Red River cannot meet the maximum month demands for Fargo, West Fargo, and Moorhead. When natural flows in the Red and Sheyenne River do not meet the maximum month demands, the Minnesota wellfield is used to supplement flows to meet the water demands. When demands exceed the capacity in the wellfield pipeline as well as natural flows in the Sheyenne and Red Rivers, Fargo, West Fargo, and Moorhead would call for releases from Lake Ashtabula to meet the rest of the monthly demands.
The alternative is designed to maintain a minimum Lake Ashtabula reservoir capacity of 28,000 ac-ft (fish and wildlife conservation pool) and a minimum release of 13 cfs from Baldhill Dam to meet basic aquatic needs in the Sheyenne River. No flows are reserved in the Red River for aquatic needs. All the surface water dependent cities in the Red River Valley service area can call on water from Lake Ashtabula. Five cities have existing permits, as listed in table 2.3, and the remaining cities would be required to share unallocated water rights reserved by the State Engineer. More detailed information on the allocation of Lake Ashtabula storage is in table 2.3 and is described in the chapter three “Red River Basin surface water quantity” section.
This alternative is designed to provide maximum month water demands from the Sheyenne and Red Rivers for the Fargo-Moorhead area from natural flows, supplemental flows from Minnesota groundwater, or releases from Lake Ashtabula. Daily peaking demands are served using a number of individual features. The West Fargo South ASR feature serves Fargo’s peaking demands, and expansion of the Buffalo Aquifer covers Moorhead’s peaking demands. In the future West Fargo would be served from the Sheyenne River; however, during a severe drought, the West Fargo North ASR feature is designed to meet West Fargo’s full demands, including peaking.
The alternative is also designed to provide maximum month peak-day water demands from the Red and Red Lake Rivers in the Grand Forks–East Grand Forks area. This eliminates the need for separate daily peaking features. Communities downstream of Grand Forks are modeled to meet maximum month demands from the river with additional storage to cover peak-day demands. The existing and future industrial water demands in the Wahpeton area would be served from the Red River first, and once those supplies are depleted, the industries would use a groundwater feature to be developed in southeastern North Dakota.
The water demands shortages for CRWUD and GFTWD (they have some existing groundwater sources) and the total demand for LRWD rural systems are served indirectly from surface water in the hydrologic model. CRWUD demand annual shortage of 963 ac-ft is included in the Fargo demand, and GFTWD annual shortage of 828 ac-ft is included in the Grand Forks demand. CRWUD relies on existing wells in the Page and Sheyenne Delta Aquifers and Red River surface water, while GFTWD relies on both Elk Valley Aquifer groundwater and water from the Red River. In the model the LRWD annual demand of 216 ac-ft is served from the Red River at Pembina; although, the district actually draws water from the upper South Pembina River at Mount Carmel Dam.
2 - 37

Red River Valley Water Supply Project FEIS Chapter Two Alternatives
The Red River Basin Alternative, particularly the Minnesota groundwater source (Pelican River and Otter Tail Surficial Aquifers), was included as a reasonable alternative at the request of MNDNR; however, it was not modeled in strict accordance with the conditions provided in a December 17, 2001, letter from the MNDNR. The letter states “[o]btaining water from Minnesota for municipalities along the Red River (North Dakota and Minnesota) for use only during drought, and on a temporary basis.” The letter goes on to state “…Development of an effective program and commitment by North Dakota to focus economic development on industries and commercial enterprises that do not consume water, and making it clear in regulatory permits that new water-using industries will need to plan for obtaining water on their own for use during droughts.”
Neither of these conditions was adhered to in hydrologic modeling, because under the stated conditions the alternative would fail to meet the purpose and the need for the Project. The groundwater sources would have to be used concurrently with North Dakota water sources for the alternative to be viable. However, if the modeling followed MNDNR conditions to exhaust North Dakota water sources before using Minnesota groundwater, a much larger Minnesota groundwater feature would need to be developed.
As currently designed, the buried pipeline from the proposed Minnesota wells is 43 cfs in size. The peak-day water demand for the Fargo-Moorhead area, including existing and new industries, is about 156 cfs, which is far greater. This does not account for municipalities as far away as Valley City that have no other viable water supplies once their surface water and storage supplies from Lake Ashtabula are depleted. Additional buried pipelines would have to be constructed to serve multiple communities, including Valley City, to follow MNDNR’s first condition.
In addition, considering the size of the Pelican River and Otter Tail Surficial Aquifers, a capacity of 156 cfs or larger is not technically possible, so developing a Minnesota groundwater alternative following MNDNR’s first condition is not reasonable. The MNDNR’s second condition prohibits future industries from using any Minnesota groundwater during a drought. The hydrologic model did not include this limitation, because serving the water needs of future industries is part of the purpose and need of the Project.
An operation plan would coordinate conveyance of Minnesota groundwater with other in-basin water supply features, primarily Lake Ashtabula storage. The pipeline would convey water depending on available Sheyenne and Red River flows. During a 1930s-type drought, the Corps in coordination with the Project would release water from Baldhill Dam based on permitted water rights, as shown in table 2.3. This operating plan would be developed during final engineering.
Baldhill Dam (Lake Ashtabula) is operated under a master operating plan that would be modified to manage flow releases to downstream Project customers. Because the travel time for water released from Baldhill Dam could take 20 days to reach Fargo during low flow drought events, the Project would develop a water management process or tool. This process or tool would consider climatic forecasts, seasonal water demands, river conditions, and available storage to estimate releases to serve downstream water needs.
2 - 38

Red River Valley Water Supply Project FEIS Chapter Two Alternatives
GDU Import to Sheyenne River Alternative
This alternative would supplement existing water supplies to meet future water needs with a combination of the Red River, other North Dakota in-basin sources, and imported Missouri River water. The alternative uses eight water supply features including water conservation. The primary feature of this alternative would be a 122 cfs buried pipeline from the McClusky Canal to Lake Ashtabula that would release treated Missouri River water into the Sheyenne River approximately 8 miles above the reservoir. The pipe would be sized so peak-day demands could be met by Lake Ashtabula releases into the Sheyenne River.
The alternative would use the existing Principal Supply Works constructed as part of the GDU, so repayment of a portion of these original construction costs is included in the estimate (see Appendix K.1 for repayment details). The CRWUD and GFTWD would connect to the Fargo and Grand Forks municipal systems. The Grafton intake would be relocated north on the Red River behind an existing lowhead dam to improve reliability during low river flow. The alternative would include a buried pipeline from Fargo to the Wahpeton area to serve industrial water demands in southeastern North Dakota.
The alternative has sufficient capacity to serve MR&I water systems in northeastern North Dakota from the pipeline running to Lake Ashtabula (see blue box). Most of the water systems currently use groundwater sources, but it is reasonably foreseeable that they may need service in the future. Because this is a bulk water supply Project, the cost of distributing water in northeastern North Dakota is not included in the alternative.
Northeastern North Dakota Water Systems ADM Corn Processing (Walhalla) Agassiz Water District Dakota Water Users District (includes Cooperstown) Grand Forks Traill Water District Langdon (includes Langdon Rural Water District) Larimore North Valley Water District (includes Pembina) Park River Traill Rural Water District (includes Hillsboro, Galesburg, Mayville, and American Crystal Sugar) Tri-County Rural Water District Walsh Rural Water District (includes Minto)
The alternative would have a biota WTP adjacent to the McClusky Canal to reduce the risk of transferring invasive species into the Hudson Bay Basin. The In-filter DAF or a comparable, cost effective treatment process was identified for this alternative. The treatment process includes DAF pre-treatment, filtration, UV disinfection, and chlorination. Aquatic life is very sensitive to chlorine, so any residual concentrations would be removed prior to releasing Project water into the Sheyenne River above Lake Ashtabula. This feature is discussed in more detail previously in this chapter and in Appendix A.5.
Figure 2.7 shows alternative features which are listed and described in table 2.12. Table 2.13 shows the construction and OM&R cost estimates for the alternative.
2 - 39

Red River Valley Water Supply Project FEIS Chapter Two Alternatives
2 - 40
Figure 2.7 – GDU Import to Sheyenne River Alternative. Table 2.12 – Features Proposed for Inclusion in GDU Import to Sheyenne River Alternative.
Proposed Features Description of Proposed Features
Biota WTP Build McClusky Canal biota WTP with a capacity ranging from 78.8 Mgal per day (122 cfs). Would include intake structures and clearwell pumps to convey water to the Sheyenne River release structure.
CRWUD Interconnection with Fargo Install a 2.1 cfs (942 gpm) service connection with Fargo. GDU Principal Supply Works Repay the incremental costs of the GDU Principal
Supply Works based on capacity used by the alternative. GFTWD Interconnection with Grand Forks Build a 2.8 cfs (1,257 gpm) service connection with
Grand Forks. McClusky Canal to Lake Ashtabula Pipeline Construct 123 miles of 122 cfs pipeline from McClusky
Canal Mile Marker 58 to Lake Ashtabula. Includes Sheyenne River release structure.
Pipeline to Industries in Southeastern North Dakota Build 48 miles of 9 cfs (4,039 gpm) pipe from Fargo to Wahpeton to serve industries.
Relocate Grafton River Intake Relocate Grafton’s existing 5 cfs (2,244 gpm) river intake 5 miles north on Red River.
Water Conservation* Save approximately 1.4 bgals (4,300 ac-ft) project-wide. * This feature is also in the No Action Alternative.

Red River Valley Water Supply Project FEIS Chapter Two Alternatives
Table 2.13 – GDU Import to Sheyenne River Alternative Cost Estimate.
Features Construction
Cost (2005 dollars)*
Annual OM&R*
Biota WTP (includes McClusky Canal Intake) 1 $124,403,000 $2,625,000CRWUD Interconnection with Fargo $6,437,000 $170,000GDU Principal Supply Works $11,030,000 $90,000GFTWD Interconnection with Grand Forks $7,474,000 $144,000McClusky Canal to Lake Ashtabula Pipeline $465,396,000 $1,011,000Pipeline to Industries in Southeastern North Dakota $41,404,000 $46,000Relocate Grafton River Intake $3,689,000 $30,000Water Conservation $780,000
$659,833,000 $4,896,000Total * Costs in table are rounded to the nearest $1,000. 1 Biota WTP costs (not including intake) were updated in June 2007.
Operational Description The alternative is designed to maintain a minimum Lake Ashtabula reservoir capacity of 28,000 ac-ft (fish and wildlife conservation pool). The alternative also is designed to meet the aquatic flow targets identified by the North Dakota Game and Fish Department, which are listed in chapter one in the aquatic needs section. However, the 68 cfs flow at Fargo on the Red River was modeled as a target and not a supplemental flow. When the flow falls below 68 cfs at the USGS gage site near Fargo, all permits are shut off and users are forced to alternative water supplies. All the surface water dependent cities in the Red River Valley service area can call on water from Lake Ashtabula. Five cities have existing permits, as listed in table 2.3. The other cities would share unallocated water rights reserved by the State Engineer. More detailed information on Lake Ashtabula water permits is in table 2.3 and is described in the chapter three water quantity section.
This alternative is designed to deliver maximum month peak-day water demands via the Sheyenne and Red Rivers for all surface water dependent MR&I systems in the Red River Valley service area. The hydrologic model was set up to first serve MR&I water system demands from natural flows and then release water from Lake Ashtabula to meet the remaining demands. In order to meet the North Dakota Game and Fish Department aquatic flow recommendations, the model had Fargo and Moorhead relying upon the Sheyenne River and releases from Lake Ashtabula when the Red River was at 68 cfs or less downstream from city intakes.
The alternative would include a buried pipeline from the Sheyenne River near the Fargo area to the Wahpeton area to meet existing and future industrial demands in southeastern North Dakota. The water demand shortage for CRWUD and GFTWD (they have some existing groundwater sources) and the total demand for LRWD rural systems are served indirectly from surface water in the hydrologic model. CRWUD demand annual shortage of 963 ac-ft is included in the Fargo demand, and GFTWD annual shortage of 828 ac-ft is in the Grand Forks demand. CRWUD relies on existing wells in the Page and Sheyenne Delta Aquifers and Red River surface water, while GFTWD relies on both Elk Valley Aquifer groundwater and water from the Red River. In
2 - 41

Red River Valley Water Supply Project FEIS Chapter Two Alternatives
the model the LRWD annual demand of 216 ac-ft is served from the Red River at Pembina; although, the district actually draws water from the upper South Pembina River at Mount Carmel Dam.
The hydrologic model developed for the alternative also includes maximum month peak-day demands to serve municipal and rural water systems in northeastern North Dakota directly from the McClusky Canal to Lake Ashtabula pipeline. A capacity of 19.6 cfs was included in the pipeline to serve the northeastern water systems that may want to be served by the Project in the future (see above).
The biota WTP and conveyance pipeline would be operated to maintain Lake Ashtabula at seasonally targeted elevations and the Fish and Wildlife Conservation Pool at a minimum of 28,000 ac-ft. An operating plan for Lake Ashtabula releases to serve downstream water users would be developed during final engineering.
Baldhill Dam (Lake Ashtabula) is operated under a master operating plan that would be modified to manage flow releases to downstream Project customers. Because the travel time for water released from Baldhill Dam could take approximately 20 days to reach Fargo during low flow drought events, the Project would develop a water management process or tool. This process or tool would consider climatic forecasts, seasonal water demands, river conditions, and available storage to estimate releases to serve downstream water needs.
2 - 42

Red River Valley Water Supply Project FEIS Chapter Two Alternatives
GDU Import Pipeline Alternative
This alternative would supplement existing water supplies to meet future water needs by conveying treated water from the Missouri River via the McClusky Canal and a buried pipeline to the Red River Valley. The alternative includes 10 water supply features, including water conservation measures. The primary feature of the alternative would be an 85 cfs buried pipeline from McClusky Canal to the Fargo metropolitan area. The alternative would use the existing Principal Supply Works constructed as part of the GDU, so repayment of a portion of these original construction costs is included in the alternative estimate (Appendix K.1). The alternative would develop new groundwater sources in southeastern North Dakota to serve industries and expand use of the Buffalo Aquifer to serve Moorhead. The CRWUD and GFTWD would connect to the Fargo and Grand Forks municipal systems. The Grafton intake would be relocated north on the Red River behind an existing lowhead dam to improve reliability during low river flow.
The alternative would include a biota WTP adjacent to the McClusky Canal to reduce the risk of transferring invasive species into the Hudson Bay Basin. The In-filter DAF or a comparable, cost effective treatment process, was identified for this alternative. The treatment process is DAF pre-treatment, filtration, UV disinfection, chlorination and chloramines for residual management (see Appendix A.5). Figure 2.8 shows alternative features, which are listed and described in table 2.14. Table 2.15 shows the construction and OM&R cost estimates for the alternative.
Operational Description The primary water supply feature of the GDU Import Pipeline Alternative is a buried pipeline from the McClusky Canal to the Fargo metro area. The alternative supplies maximum month peak-day demands for the cities of Fargo and West Fargo. Local industries would be served through a combination of water from the pipeline, natural flows, and releases from Lake Ashtabula. No groundwater features in the Fargo area are required in this alternative. This alternative includes full expansion of the Buffalo Aquifer groundwater supply feature to meet the maximum month peak-day demands for Moorhead. Modeling assumes that Moorhead has priority over Fargo to flows in the Red River but would draw upon the Buffalo Aquifer when river flows are insufficient.
The hydrologic model was set up with the assumption that the Fargo, West Fargo, and local industry would use the import pipeline as their primary water supply. When their water demand exceeds the pipeline capacity, then Fargo and West Fargo would turn to available natural flows in the Sheyenne or Red River and finally call for water from Lake Ashtabula, based on their individual storage rights. The hydrologic model in this alternative maintains the import pipeline at a reasonable capacity, while at the same time managing Fargo and West Fargo’s storage allocation in Lake Ashtabula.
2 - 43

Red River Valley Water Supply Project FEIS Chapter Two Alternatives
Figure 2.8 – GDU Import Pipeline Alternative.
The alternative is designed to maintain a minimum Lake Ashtabula reservoir capacity of 28,000 ac-ft (Fish and Wildlife Conservation Pool) and a minimum release of 13 cfs from Baldhill Dam for basic aquatic needs. No flow was reserved in the Red River for aquatic needs. All the surface water dependent cities in the Red River Valley service area can call on water from Lake Ashtabula. Five cities have existing permits, as listed in table 2.3, and the remaining cities would share unallocated water rights reserved by the State Engineer. More detailed information on storage based upon permitted water rights in Lake Ashtabula is in table 2.3 and is described in the chapter three water quantity section.
The alternative is also designed to provide maximum month peak-day water demands for all surface water dependent MR&I systems downstream (north) of the Fargo-Moorhead area. This eliminates the need for any groundwater or storage features to meet peak-day demands. Existing and future industrial water demands in the Wahpeton area would be served from the Red River first, and once those supplies are depleted, the industries would use a groundwater feature that would be developed in southeastern North Dakota.
2 - 44

Red River Valley Water Supply Project FEIS Chapter Two Alternatives
Table 2.15 – GDU Import Pipeline Alternative Cost Estimate.
Features Construction Cost (2005 dollars)*
Annual OM&R*
Biota WTP (includes McClusky Canal intake) 1 $89,161,000 $4,716,000CRWUD Interconnection with Fargo $6,437,000 $170,000GDU Principal Supply Works $7,685,000 $63,000GFTWD Interconnection with Grand Forks $7,474,000 $144,000McClusky Canal to Fargo Pipeline $723,148,000 $1,906,000Moorhead ASR $1,639,000 $128,000Moorhead – Full use of Buffalo Aquifer $16,942,000 $571,000New Groundwater to Serve Industries $54,364,000 $564,000Relocate Grafton River Intake $3,689,000 $30,000Water Conservation
$780,000
Total $910,539,000 $9,072,000* Costs in table are rounded to the nearest $1,000. 1 Biota WTP costs (not including intake) were updated in June 2007.
Table 2.14 – Features Proposed for Inclusion in GDU Import Pipeline Alternative. Proposed Features Description of Proposed Features
Biota WTP Build McClusky Canal biota WTP with a capacity of 54.9 Mgal per day (85 cfs). Would include an intake structure and clearwell pump to convey water to the Red River Valley.
CRWUD Interconnection with Fargo Install a 2.1 cfs (942 gpm) service connection with Fargo. GDU Principal Supply Works Repay the incremental costs of the GDU Principal Supply
Works based on the capacity used by the alternative. GFTWD Interconnection with Grand Forks Build a 2.8 cfs (1,257 gpm) service connection with
Grand Forks. McClusky Canal to Fargo Pipeline Includes 197 miles of pipe from McClusky Canal to the
Fargo area. The main pipeline capacity is 85 cfs. Moorhead ASR Recharge 120 ac-ft of groundwater annually to maintain
aquifer water levels. Moorhead – Full use of Buffalo Aquifer Includes construction of 12 – 750 gpm wells, plus 20
miles of collection and conveyance pipeline, terminating at the Moorhead WTP.
New Groundwater to Serve Industries Develop new wellfields in the Spiritwood, Gwinner, Brightwood, and Milnor Channel Aquifers to supply 9 cfs (4,039 gpm) of water to current and new industries through 35 miles of conveyance pipeline.
Relocate Grafton River Intake Relocate Grafton’s existing 5 cfs (2,244 gpm) river intake 5 miles north on the Red River.
Water Conservation* Save approximately 1.4 bgals (4,300 ac-ft) project-wide. * This feature is also in the No Action Alternative.
2 - 45

Red River Valley Water Supply Project FEIS Chapter Two Alternatives
In the hydrologic model, the water demands shortages for CRWUD and GFTWD (they have some existing groundwater sources) and the total demand for LRWD rural systems are served indirectly from surface water. CRWUD demand annual shortage of 963 ac-ft is included in the Fargo demand and GFTWD annual shortage of 828 ac-ft is included in the Grand Forks demand. CRWUD relies on existing wells in the Page and Sheyenne Delta Aquifers and Red River surface water, while GFTWD relies on both Elk Valley Aquifer groundwater and water from the Red River. In the model the LRWD annual demand of 216 ac-ft is served from the Red River at Pembina; although, the district actually draws water from the upper South Pembina River at Mount Carmel Dam.
An operating plan would coordinate conveyance of treated Missouri River water to the service area along with existing in-basin water supply features, primarily Lake Ashtabula storage. The pipeline would convey water as needed, depending on availability of existing in-basin water sources. The Corps in coordination with the Project would release water from Baldhill Dam, based on permitted water rights, as shown in table 2.3. This operating plan would be developed during final engineering.
Baldhill Dam (Lake Ashtabula) is operated under a master operating plan that would be modified to manage flow releases to downstream Project customers. Because the travel time for water released from Baldhill Dam could take approximately 20 days to reach Fargo during low flow drought events, the Project would develop a water management process or tool. This process or tool would consider climatic forecasts, seasonal water demands, river conditions, and available storage to estimate releases to serve downstream water needs. It would also consider other sources of water, such as an import from the Missouri River.
2 - 46

Red River Valley Water Supply Project FEIS Chapter Two Alternatives
Missouri River Import to Red River Valley Alternative
This alternative would supplement existing water supplies to meet future water needs by conveying treated water in a buried pipeline from the Missouri River south of Bismarck directly to Fargo, Grand Forks, and Wahpeton areas. The alternative includes seven water supply features with water conservation measures. The principal feature would be a 119 cfs buried pipeline from the Missouri River at Bismarck to Fargo with a 21 cfs buried pipeline spur to Grand Forks. The Missouri River water would be collected from a series of horizontal wells constructed in sediments underlying the Missouri River south of Bismarck. A buried pipeline from Fargo to the Wahpeton area would serve industries. The CRWUD and GFTWD would connect to Fargo and Grand Forks municipal systems. The Grafton intake would be relocated north on the Red River behind an existing lowhead dam to improve reliability during low river flow.
The alternative would include a biota WTP adjacent to the Missouri River to reduce the risk of transferring invasive species into the Hudson Bay Basin. The In-filter DAF or a comparable, cost effective treatment process was identified for this alternative. The treatment process includes DAF pre-treatment, filtration, UV disinfection, chlorination and chloramines for residual management (see Appendix A.5). Figure 2.9 shows alternative features listed and described in table 2.16. Table 2.17 displays the construction and OM&R cost estimates for the alternative.
Operational Description The primary water supply feature of the Missouri River Import to Red River Valley would be a conveyance buried pipeline from the Missouri River south of Bismarck to the Fargo and Grand Forks areas. The alternative would deliver maximum month peak-day demands to all MR&I systems in the Red River Valley service area. All MR&I systems would receive their peak-day demands from surface water, with the exception of Moorhead, which would draw maximum month demands from surface water and peak-day demands from the Buffalo Aquifer. Groundwater features in this alternative would be used only by Moorhead. Existing and future industrial demands in the Wahpeton area would be met by a buried pipeline from the Fargo area.
The alternative is designed to maintain a minimum Lake Ashtabula reservoir capacity of 28,000 ac-ft (fish and wildlife conservation pool) and a minimum release of 13 cfs from Baldhill Dam for basic aquatic needs. The hydrologic model was set up so that the Fargo metropolitan area (including West Fargo and local industries) would draw water from natural flows first, call for Lake Ashtabula water second, and draw water from the import pipeline last of all. All the surface water dependent cities in the Red River Valley service area could call on water from Lake Ashtabula. Five cities have existing permits, as listed in table 2.3, and the remaining cities would share unallocated water rights reserved by the State Engineer. More detail on the storage based upon permitted water rights in Lake Ashtabula is described in the chapter three “Red River Basin surface water quantity” section. Moorhead would meet its maximum month demands with surface water and peak-day demands from the Buffalo Aquifer.
2 - 47

Red River Valley Water Supply Project FEIS Chapter Two Alternatives
Table 2.16 – Features Proposed for Inclusion in Missouri River Import to Red River Valley Alternative.
Proposed Features Description of Proposed Features
Biota Water Treatment Plant Build a biota treatment plant with a capacity of 76.9 Mgal per day (119 cfs). Would include an intake structure and clearwell pumps to convey water to the Red River Valley.
Bismarck to Fargo/Grand Forks Pipeline Construct a 276 mile pipeline from south of Bismarck to Fargo 119 cfs with an additional pipeline to Grand Forks (21 cfs). Includes booster pump stations and storage tanks.
CRWUD Interconnection with Fargo Install a 2.1 cfs (942 gpm) service connection with Fargo. GFTWD Interconnection with Grand Forks Construct a 2.8 cfs (1,257 gpm) service connection with
Grand Forks. Pipeline to Industries in Southeastern North Dakota Build 48 miles of 9 cfs (4,039) pipe from Fargo to
Wahpeton to serve industries. Relocate Grafton River Intake Relocate Grafton’s existing 5 cfs (2,244 gpm) river intake
5 miles north on Red River. Water Conservation* Save approximately 1.4 bgals (4,300 ac-ft) project-wide. * This feature is also in the No Action Alternative.
Figure 2.9 – Missouri River Import to Red River Valley Alternative.
2 - 48

Red River Valley Water Supply Project FEIS Chapter Two Alternatives
Table 2.17 – Missouri River Import to Red River Valley Alternative Cost Estimate. Construction
Features Cost Annual OM&R* (2005 dollars)*
Biota WTP (includes intake)1 $163,762,000 $2,518,000Bismarck to Fargo/Grand Forks Pipeline $841,785,000 $2,947,000CRWUD Interconnection with Fargo $6,437,000 $170,000GFTWD Interconnection with Grand Forks $7,474,000 $144,000Pipeline to Industries in Southeastern North Dakota $41,404,000 $46,000Relocate Grafton River Intake $3,689,000 $30,000Water Conservation $0 $780,000
Total $1,064,551,000 $6,635,000* Costs in table are rounded to the nearest $1,000. 1 Biota WTP costs (not including intake) were updated in June 2007.
The alternative is also designed to deliver maximum month peak-day water demands to all surface water dependent MR&I systems downstream (north) of the Fargo-Moorhead area. This alternative would eliminate the need for any groundwater or storage features to meet peak-day demands. The alternative would serve Grand Forks with a 21 cfs pipeline. Hydrologic modeling assumed that Grand Forks would use imported water first, natural flows second, and Lake Ashtabula water last. Existing and future industrial water demands in the Wahpeton area would be served from the Red River first. After those supplies are depleted, the industries would use water from the pipeline from Fargo.
The water demands shortages for CRWUD and GFTWD (they have some existing groundwater sources) and the total demand for LRWD rural systems are served indirectly from surface water in the hydrologic model. CRWUD demand annual shortage of 963 ac-ft is included in the Fargo demand, and the GFTWD annual shortage of 828 ac-ft is in the Grand Forks demand. CRWUD currently relies on existing wells in the Page and Sheyenne Delta Aquifers and Red River surface water, while GFTWD uses Elk Valley Aquifer groundwater and water from the Red River. In the model the LRWD annual demand of 216 ac-ft is served from the Red River at Pembina; although, the district actually draws water from the upper South Pembina River at Mount Carmel Dam.
An operating plan would coordinate conveyance of treated Missouri River water to the service area along with existing in-basin water supply features, primarily Lake Ashtabula storage. The pipeline would convey water as needed, depending on availability of existing in-basin water sources. The Corps in coordination with the Project would release water from Baldhill Dam, based on permitted water rights, as shown in table 2.3. This operating plan would be developed during final engineering.
Baldhill Dam (Lake Ashtabula) is operated under a master operating plan that would be modified to manage flow releases to downstream Project customers. Because the travel time for water released from Baldhill Dam could take approximately 20 days to reach Fargo during low flow
2 - 49

Red River Valley Water Supply Project FEIS Chapter Two Alternatives
drought events, the Project would develop a water management process or tool. This tool would consider climatic forecasts, seasonal water demands, river conditions, and available storage to estimate releases to serve downstream water needs. It would also consider other sources of water, such as an import from the Missouri River.
2 - 50

Red River Valley Water Supply Project FEIS Chapter Two Alternatives
Preferred Alternative
Reclamation and North Dakota have identified the preferred alternative as the GDU Import to Sheyenne River Alternative. The reasons for this identification are explained later in this chapter.
Alternatives Considered but Eliminated
According to NEPA, an EIS must consider a full range of alternatives that includes all reasonable alternatives. The EIS must “rigorously explore and objectively evaluate all reasonable alternatives, and for alternatives which were eliminated from detailed study, briefly discuss the reasons for their having been eliminated…Reasonable alternatives include those that are practical or feasible from the technical and economic standpoint and using common sense, rather than simply desirable from the standpoint of the applicant” [Federal Register 46(55)].
During the DEIS scoping process, the public commented on various alternatives and features. Table 2.18 shows the disposition of the 11 alternatives disclosed during the initial scoping process in October and November 2002. After preliminary analysis using screening criteria developed by Reclamation and North Dakota, some of these appraisal-level alternatives and features were eliminated from detailed study. The DEIS evaluated eight alternatives proposed for this Project. The SDEIS and FEIS evaluated only six alternatives, because two of the alternatives were eliminated from further evaluation based on comments received on the DEIS. The two alternatives eliminated were the Lake of the Woods and GDU Water Supply Replacement Pipeline Alternatives. The following discussion explains the reasons for eliminating the alternatives and features from further study.
Alternatives Eliminated After Initial DEIS Scoping
Alternative 2 - In-Basin, Kindred Reservoir The construction of a new reservoir on the Sheyenne River near Kindred, North Dakota was eliminated from further consideration because it duplicated other alternatives, had more extensive environmental impacts, and was not technically feasible. Three alternatives considered for further study by the Project proposed construction or modification of dams on the Sheyenne River. To cover a full range of alternatives, one of these was evaluated in detail. Previous studies (Reclamation 2000b; Corps 1982) show that construction of Kindred Dam would cause greater environmental impacts than other Sheyenne River dam alternatives explained below. For that reason Kindred Dam was eliminated from detailed study. The North Dakota In-Basin Alternative that combines in-basin groundwater, a pipeline from north of Grand Forks to Lake Ashtabula, and ASR was chosen for further study.
During DEIS public scoping, many concerns were raised regarding impacts associated with construction of a new dam. Previous studies by Reclamation (2000b) and by the Corps (1982) identified significant adverse effects to river fisheries near Kindred and West Fargo in the
2 - 51

Red River Valley Water Supply Project FEIS Chapter Two Alternatives
Sheyenne River and in the Red River near Fargo, as well as significant impacts to riparian, wetland, and upland habitats from dam construction and inundation. Many known or potential cultural resources would be adversely affected by construction and operation of the dam. There would be adverse social impacts due to farm and ranch buyouts and relocation of residents. In addition, there might be impacts to habitat of the threatened western prairie fringed orchid from raising the water table in the Sheyenne Delta Aquifer System.
Table 2.18 – Disposition of 11 Alternatives Disclosed During 2002 Public Scoping Meetings.
Alternative Disposition No Action Alternative Evaluated in detail as the No Action Alternative, as required by NEPA.
Alternative 2 - In-Basin, Eliminated from detailed study. Hydrologic modeling demonstrated that upstream
Preliminary flood inundation mapping shows that a new Kindred Dam and resulting reservoir would, during periods of normal to high precipitation, inundate the vast majority of existing riparian habitat associated with the Sheyenne National Grasslands. Several thousand acres of the Sheyenne National Grasslands would be lost, including approximately 4,000 acres of riparian
Kindred Reservoir flows were insufficient to fill this reservoir and Lake Ashtabula. Alternative 3 - In-Basin, Evaluated further and determined that upstream flows were not sufficient to Enlarged Lake Ashtabula support additional storage. Revised and combined with some features of
Alternative 4 to make the North Dakota In-Basin Alternative. Alternative 4 - In-Basin, Eliminated from detailed study. Included large-scale desalinization which would be Groundwater extremely costly and of questionable yield. Environmental impacts associated with
brine disposal could also be significant. Alternative 5 - Import, Evaluated in detail as the Missouri River Import to Red River Valley Bismarck to Fargo Pipeline Alternative. Modified to include a pipeline from Fargo to Grand Forks.
Alternative 6 - Import, Lake Eliminated from detailed study. Similar to Bismarck to Fargo pipeline alternative, Oahe to Wahpeton Pipeline except the Red River would be used to convey water from Wahpeton to other
communities on the Red River. The Bismarck to Fargo pipeline would provide substantially better raw water quality to municipalities than a Lake Oahe to Wahpeton pipeline, and the river reach from Wahpeton to Fargo loses surface water to groundwater.
Alternative 7a - Import, Eliminated from detailed study. Very similar to Alternative 7c. Would convey Using McClusky and New untreated Missouri River water through an area that may be in the Hudson Bay Rockford Canals drainage.
Alternative 7b - Import, End Eliminated from detailed study. Very similar to Alternative 7c. Would convey of McClusky Canal to treated Missouri River water from the McClusky Canal directly to the Sheyenne Sheyenne River River. Could increase channel erosion in Sheyenne River as compared to
Alternative 7c due to insertion point located in a portion of the channel that has less capacity.
Alternative 7c - Import, Evaluated in detail as the GDU Import to Sheyenne River Alternative. DWRA McClusky and New Rockford requires evaluation of at least one alternative that uses the GDU Principal Supply Canals with Northern Route Works. Alternative 7c has fewer impacts to the Sheyenne River than Alternative Pipeline 7b, and a lower risk of biota transfer than Alternative 7a. The use of New Rockford
Canal was considered but eliminated as a feature. Alternative 7d - Import, Eliminated from detailed study. Very similar to Alternative 7c, but includes a 25 cfs McClusky Canal and pipeline to Grand Forks to improve raw water quality. Alternative 8 also conveys Pipeline to Upper Sheyenne Missouri River water via pipeline to Grand Forks. and Grand Forks Alternative 8 - Import, Evaluated in detail as the GDU Import Pipeline Alternative. Similar to Alternative Western Red River Valley 7, but does not use the Sheyenne River for conveyance. Improved raw water Pipeline quality and potentially fewer impacts to Sheyenne River than Alternative 7.
2 - 52

Red River Valley Water Supply Project FEIS Chapter Two Alternatives
habitat with no readily available course of action to mitigate this loss.
Western Prairie Fringed Orchid
During full pool and flood pool operations of the proposed dam, the reservoir would be at, or above, an elevation of 1,000 feet above msl. The Sheyenne Delta Aquifer below the Sheyenne National Grasslands typically lies 2 to10 feet below the ground surface. Up to 6 miles away from the edge of the reservoir, the Sheyenne National Grasslands rise to an elevation of only 1,065 msl. Drainage of the Sheyenne National Grasslands with such little gradient could be slowed, resulting in increased groundwater-surface water interaction. While soil moisture is essential to support of the threatened western prairie fringed orchid, which occupies ephemeral wetland swales on the Sheyenne National Grasslands, this plant cannot tolerate excessive moisture. Given a rise in groundwater levels at the edge of the reservoir, adverse impacts to the habitat of the western prairie fringed orchid could occur due to reduced drainage capacity of the Sheyenne National Grasslands.
In addition to the environmental concerns, preliminary modeling results indicated that about 90,000 to 110,000 ac-ft (over a ten-year period) of water would be available for storage during a drought of similar duration and intensity to the 1930s. Assuming a starting conservation pool of about 40,000 ac-ft, up to 150,000 ac-ft of water would be the total water budget for Kindred Reservoir. Evaporation and transpiration losses from the proposed Kindred Reservoir were estimated to be 70 centimeters (cm) (27.5 inches) of evaporation per year based upon an USGS estimate for Lake Ashtabula. The approximate surface area of Kindred Reservoir was projected to be 14,000 acres.
Given these parameters, the annual evaporation and transpiration losses would be up to 31,500 ac-ft. Therefore, since the potential losses over a ten-year period (315,000 ac-ft) would exceed the volume of water stored over ten years (90,000 to 110,000 ac-ft), it is very unlikely that the reservoir could store a sufficient volume of water for Project purposes. The high loss to storage ratio is due to the very flat proposed reservoir site, which has a high surface area to volume ratio. The Corps originally proposed Kindred Dam as a flood control feature, so excessive losses related to evaporation did not factor into their consideration of the viability of the dam. However, Kindred Dam would not be viable as a water storage reservoir during a 1930s-type drought.
Alternative 3 - Enlarging Lake Ashtabula This feature was eliminated from further consideration, because inadequate runoff was available to fill an enlarged Lake Ashtabula during a 1930s-type drought. During Phase II studies a key feature of the in-basin alternatives involved raising Baldhill Dam to increase storage in Lake Ashtabula (Reclamation 2000b). Previous Phase II hydrologic studies indicated that additional spring runoff could be captured in an enlarged reservoir for later use. However, hydrologic modeling and the naturalized flow database were updated in the Final Needs and Options Report (Reclamation 2005a), and modeling results projected that runoff above Lake Ashtabula would be insufficient to fill an enlarged reservoir during a 1930s-type drought.
2 - 53

Red River Valley Water Supply Project FEIS Chapter Two Alternatives
Alternative 4 - In-Basin, Groundwater This alternative, which exclusively uses groundwater to meet future water shortages, was eliminated from further consideration because a similar alternative, North Dakota In-Basin, would be more economically feasible and would have fewer environmental and socioeconomic impacts (Reclamation 2000b). During initial public scoping, concerns were raised about some proposed groundwater sources, such as the high salinity in the Dakota Aquifer and the resulting costs and potential environmental impacts associated with disposal of brine from desalinization. There were also concerns regarding economic and socioeconomic impacts associated with buying existing irrigation groundwater permits.
Previous studies estimated that the transfer of groundwater irrigation rights to municipal users would reduce irrigated land by about 7,300 acres while restricting further development (Reclamation 2000b). In addition, increased withdrawals from the Sheyenne Delta Aquifer could adversely impact the western prairie fringed orchid (Reclamation 1999a).
Alternative 6 - Import, Lake Oahe to Wahpeton Pipeline This alternative was eliminated from further consideration because a similar alternative (Missouri River Import to Red River Valley Alternative) that would better meet the water quality needs of the valley was chosen for further study. The Lake Oahe to Wahpeton Pipeline would use the Red River to convey Missouri River water to cities and industries along the Red River.
Lake Oahe Dam Fargo, Moorhead, and Grand Forks have expressed the desire to have both a reliable water quantity and improved water quality. Using the Red River to convey Project water, as proposed in this alternative, would result in poorer raw water quality for treatment plants, as compared to the Missouri River Import to Red River Valley Alternative. In addition, significantly higher losses in the stream channel of the Red River from Wahpeton to Fargo during a drought would require a higher capacity pipeline than a pipeline running from Bismarck to Fargo.
Alternative 7a – Import, Using McClusky and New Rockford Canals This alternative proposed using the Missouri Coteau route to connect the McClusky and New Rockford Canals. From the New Rockford Canal the water would be released into the upper Sheyenne River near Warwick. This reach of the Sheyenne River has insufficient channel capacity to convey anticipated Project flows, so it was eliminated from future consideration.
New Rockford Canal
2 - 54

Red River Valley Water Supply Project FEIS Chapter Two Alternatives
Alternative 7b – Import, End of McClusky Canal to Sheyenne River This feature would eliminate use of the New Rockford Canal by connecting the McClusky Canal directly to the upper Sheyenne River about 10 miles southwest of Maddock, North Dakota. The mean annual flow in the Sheyenne River at the nearest USGS gage is approximately 12 cfs. This reach of the Sheyenne River has insufficient channel capacity to convey anticipated Project flows, so it was eliminated from consideration.
Alternative 7c – Import, McClusky and New Rockford Canals with Northern Route Pipeline This alternative proposed using the northern route to connect the McClusky and New Rockford Canals. From the New Rockford Canal the water would be released into the upper Sheyenne River near Warwick. The New Rockford Canal was eliminated as a water conveyance feature for a number of reasons. If the New Rockford Canal were used, a pipeline from the McClusky Canal to the New Rockford Canal would pass through an area within the Hudson Bay Basin. The New Rockford Canal is in the Missouri River Basin. Thus, as originally configured, water would be conveyed from the Missouri River Basin, through the Hudson Bay Basin, back to the Missouri River Basin, and then to the Red River Valley in the Hudson Bay Basin. This would require treatment of the water at two locations to reduce the risk of transferring invasive species. By eliminating the New Rockford Canal, treatment would only be required at one location in the proposed GDU Import to Sheyenne River and GDU Import Pipeline Alternatives. In addition, water losses due to evaporation and seepage in the New Rockford Canal would be eliminated, and construction, and OM&R costs would be reduced when compared to using a pipeline for conveyance.
The canal also has a capacity of 1,600 cfs when only 85 cfs to 122 cfs of capacity would be needed for the alternatives. However, the canal would need to be rehabilitated at an estimated cost of $20 million for the facility to be reliable. An open canal also has much higher OM&R costs as compared to a buried pipeline. The New Rockford Canal would require an additional $400,000 per year of OM&R costs.
Alternative 7d – Import, McClusky Canal and Pipeline to Upper Sheyenne and Grand Forks This feature would improve raw water quality in Grand Forks and adjacent rural water systems with a pipeline import of 25 cfs of Missouri River water from the New Rockford Canal instead of using the Red River for conveyance. It was eliminated because it duplicates another alternative which includes a pipeline to Grand Forks, the Missouri River Import to Red River Valley Alternative.
Alternatives Eliminated during DEIS or SDEIS Preparation
Additional Small Dams on the Red River New lowhead dams on the Red River would each impound a few hundred ac-ft of water. Given the estimated water shortage of 55,000 ac-ft, additional lowhead dams on the Red River could not meet the purpose and need of the Project. Furthermore, such dams can be a safety hazard for boating and fill up with silt, rendering them useless over time.
2 - 55

Red River Valley Water Supply Project FEIS Chapter Two Alternatives
Alternative Locations for New Industries and Limiting Growth in the Valley The purpose of this Project, as mandated by Congress, is to meet the comprehensive water quality and quantity needs of the Red River Valley in North Dakota. Reclamation used the best available data to estimate where new industrial demands will develop in the valley and where populations will increase. Locating new industries outside of the Red River Valley and
alternatives to limit population growth are outside the scope of this EIS.
Complete Lonetree Dam and Reservoir This would be a variation of the GDU to Sheyenne Import Alternative, except that the pipeline connecting the McClusky and New Rockford Canals would be replaced by Lonetree Reservoir. Originally Lonetree Reservoir was designed to regulate project flows for GDU moving water to the east. Lonetree Reservoir was not included in any alternatives, because it was deauthorized by the DWRA. The proposed location of this reservoir has been developed as a wildlife management area. Elimination of Lonetree Dam also eliminates loss of riparian habitat and impacts on the upper Sheyenne River.
Devils Lake Water Supply
Lonetree Wildlife Management Area
This alternative was eliminated because of potentially
insufficient water quantity and poor water quality. In the early 1940s, the elevation of Devils Lake was more than 47
feet below the peak stage recorded in 2001 (Corps 2003a). If similar low-water levels occurred during a future drought, Devils Lake would not have enough water to meet the projected shortages in the Red River Valley. Also, Devils Lake would become highly saline at low-water levels such as those of the early 1940s, and release of that water to the Sheyenne River could violate water quality standards.
GDU Water Supply Replacement Pipeline The GDU Water Supply Replacement Pipeline Alternative was includedFinal Needs and Options Report (Reclamation 2005a) and evaluated in thDEIS. The alternative proposed to use water imported from the Missouri Riverreplace all MR&I water supplies in theservice area and to meet future water demands. The alternative had an estimatecost of $2.2 to $2.5 billion (Reclamation 2005a). Other alternatives, which wouldsupplement rather than replace existing water sources, would cost significantly less
in the
e
to
d
, GDU Water Supply Replacement Pipeline Evaluated in the DEIS.
2 - 56

Red River Valley Water Supply Project FEIS Chapter Two Alternatives
at a range of $415 million to $1.0 billion. Because this alternative would cost two to five times more than the other alternatives considered in the DEIS, it was eliminated from further consideration in the SDEIS because of cost. Irrigation Water Use EfficienConversion of Water Uses Under this concept, improved irrigation efficiency would provide “new water” for meeting MR&I water needs. But there is relatively little surface water irrigation in thRed River Valley, and nearly all irrigation surface water rights are junior to municwater rights. Therefore, conversion of agricultural surface water rights to MR&I water would have little or no effect on shortages during a drought. Conversion of groundwater rights from irrigation to MR&I would be possible, but generally construction of distribution systems to major demand centers would be cost prohibitive and economicainfeasible. Therefore, conversion o
cy and
e
ipal
lly f water uses was eliminated as a major feature of any
rks
nomic impact
d Canal,
ey ta
of r.
The channels are designed to improve water level management at the refuge. Hydrologic
alternative to be studied in detail. Conversion of existing irrigation water rights in the Elk Valley Aquifer to municipal use was considered in the DEIS. The feature would provide peak-day water demands for Grand Foand meet shortages for GFTWD. Economic impact analysis in the DEIS showed that the conversion from agricultural to municipal use would create an annual negative ecoof $11.2 million so the feature was eliminated from consideration in the SDEIS.
James River Conveyance Alternative This alternative was proposed during the DEIS public hearings and in a comment letter. The alternative has a number of legal, technical, and environmental problems that eliminated it from further consideration in the SDEIS. The alternative proposed to take water from the McClusky Canal, convey raw water without biota treatment via buried pipeline to the New Rockforand then release the water into the James River. The water would flow into Jamestown Reservoir, where it would be stored and released downstream near Oakes, North Dakota. Project water would be conveyed from Jamestown Reservoir to the Sheyenne River (Lake Ashtabula) byconstructing a buried pipeline, which would include biota treatment before entering the Hudson Bay drainage. A buried pipeline from the James River near Oakes, North Dakota, would convwater east to the Wild Rice River to serve the southern part of the Red River Valley. A bioWTP would be constructed along the pipeline prior to entering the Hudson Bay drainage. The alternative was considered and eliminated in Reclamation’s Phase II study (2000b, pages 5-28). The primary reason for eliminating it was because the alternative would adversely affect the Arrowwood, Tewaukon, and Sand Lake National Wildlife Refuges. Reclamation has completed bypass channels around the lower three pools of Arrowwood National Wildlife Refuge as parta project to mitigate impacts to the refuge from operation of Jamestown Dam and Reservoi
Conversion of Irrigation Water Rights Alone WNot Provide Sufficient Water for MR&I
ould
2 - 57

Red River Valley Water Supply Project FEIS Chapter Two Alternatives
analysis indicated that a bypass around Arrowwood Lake, the uppermost refuge pool, was not needed to mitigate Jamestown Reservoir impacts.
Because there is no bypass around Arrowwood Lake, Project flows would have to pass through the lake. Use of the James River to convey Project flows to the Red River Valley would adversely impact the refuge. This would seriously impair the ability of the refuge to draw down Arrowwood Lake for vegetation management, a common management practice. In addition, use of the existing bypass channels to convey Project flows would reduce management capability in the lower three pools, since water levels in the channels needed for Project flows might differ from those needed for refuge management.
Under the National Wildlife Refuge System Improvement Act, the Service (U.S. Fish and Wildlife Service) cannot permit activities on a refuge that are incompatible with the purpose for which the refuge was established. Use of Arrowwood National Wildlife Refuge to convey Project flows would likely be considered incompatible and thus, would be prohibited.
Sand Lake National Wildlife Refuge would be impacted by increased winter return flows from irrigation in the Oakes area. Increased winter return flows could interrupt periodic winter fish kills, increasing carp impacts. Changes in pool turnover rates, nutrient loading, and pesticide concentrations could affect water quality and growth of desired aquatic vegetation in Sand Lake.
Tewaukon National Wildlife Refuge would be impacted from Wild Rice River increased flows through the refuge. Use of the river to convey Project flows would impact water level management at the refuge. Changes in pool turnover rates, nutrient loading, and pesticide concentrations could affect water quality and growth of desired aquatic vegetation.
Other reasons for eliminating the alternative are as follows: The alternative proposes to route a pipeline from the McClusky Canal to the New
Rockford Canal through the Hudson Bay drainage without a biota treatment plant, which is not acceptable. A second biota WTP, which is In-filter DAF, would have to be constructed at a cost of approximately $110 million. That would increase construction and OM&R costs for the federal government.
The proposed alternative would use the New Rockford Canal, which was eliminated from consideration as a feature in all GDU Missouri River import alternatives. This conveyance feature was eliminated because of the high cost of repair and maintenance of the facilities. While the canal has a capacity of 1,600 cfs, only about 122 cfs of capacity would be needed. However, the full canal would need to be rehabilitated at a cost of $20 million for the facility to be reliably used. An open canal also has much higher OM&R costs, as compared to a buried pipeline. The New Rockford Canal would require an additional $400,000 per year of OM&R costs, which would primarily be funded by the federal government.
The option of using the Wild Rice River as a conveyance feature was eliminated from further consideration due to insufficient channel capacity (Reclamation 2000b).
2 - 58

Red River Valley Water Supply Project FEIS Chapter Two Alternatives
Water losses due to evaporation and seepage in the New Rockford Canal would be eliminated. The loss is estimated at approximately 10 cfs, which would increase the conveyance pipeline cost from the McClusky Canal to the New Rockford Canal from $10 to $20 million.
The DWRA did not include irrigation as a purpose of the Project. The Project can only be constructed to meet MR&I water supply needs, groundwater recharge, and streamflow augmentation (DWRA Section 8(a)(2)).
James River Water Supply This alternative was eliminated, because the James River would not have sufficient flows during a drought to meet the projected shortages in the Red River Valley (Reclamation 1989). Accordingly, this alternative would not meet the purpose and need of the Project.
Lake of the Woods Alternative The Lake of the Woods Alternative was included in the Final Needs and Options Report (Reclamation 2005a) and evaluated in the DEIS. Comments received during the DEIS review process from the State of Minnesota, local Minnesota governments, provinces of Manitoba and Ontario, Canadian federal government, and various environmental groups cited concerns about this alternative. The opposition from the State of Minnesota and the Canadian government is fundamental, because both have regulatory roles in permitting the use of this water source. There are also international entities with regulatory jurisdiction over the Lake of the Woods, including the International Joint Commission and the Lake of the Woods Control Board. Given the numerous concerns raised by regulatory entities with control over permitting water withdrawals from Lake of the Woods, the alternative was eliminated from further consideration in the SDEIS.
Lake of the Woods Alternative Evaluated in the DEIS.
Maple River Dam The Maple River Dam was previously evaluated in Phase II as a potential Red River Valley water supply feature (Reclamation 2000b). Construction of the Maple River Dam by the Cass County Joint Water Resources District began in 2004 on the mainstem of the Maple River downstream of Enderlin. This is a “dry” dam strictly designed to capture flood flows.
Preliminary surface water hydrologic model runs showed approximately 104,000 ac-ft of potential runoff available at the mouth of the Maple River during a 10-year period starting in 1931. The potential storage volume would probably be significantly less at the dam site, since it is approximately 30 miles upstream from the mouth. Furthermore, when evaporation and transpiration losses are considered, the overall water storage potential of the reservoir is very limited. This confirmed the original Phase II hydrology assessment that the reservoir, as a water supply feature, would be technically infeasible.
2 - 59

Red River Valley Water Supply Project FEIS Chapter Two Alternatives
Pipeline from Lake Ashtabula to Fargo In most cases using a pipeline instead of a river to deliver water reduces evaporation and seepage losses. However, hydrologic modeling does not show significant water loss in the Sheyenne River (between Baldhill Dam and the confluence with the Red River); therefore, it would not be feasible to construct a pipeline that provides insignificant additional efficiency. In addition, the pipeline would severely reduce flows in the river below Baldhill Dam for extended periods, causing potential environmental impacts.
Red Lake River The Red Lake River would provide a portion of water needs for Grand Forks and East Grand Forks for all alternatives. However, based upon historic stream flow (Emerson and Dressler 2002), flows in the Red Lake River would not be sufficient without other sources to meet the shortages in the Red River Valley during a drought. Therefore, use of the Red Lake River as a primary water source for meeting shortages was eliminated as an alternative, since it would not meet the purpose and need of the Project.
Ring Dikes Ring dikes to store water were eliminated from further consideration in the EIS as a water supply feature. Ring dikes to store water were originally considered in some alternatives listed in the previous section called “alternatives eliminated after initial DEIS scoping.” Concerns were raised about water quality degradation from holding water in the ring dikes over extended periods of times. Rings dikes require large land purchases which may be difficult. For these and other reasons ring dikes as a water storage feature were eliminated from further consideration in all alternatives in the EIS.
Water Reuse Reuse of treated municipal wastewater for irrigation of parks, golf courses, and recreation fields in Fargo, Grand Forks, and Moorhead was evaluated in the Phase II study (Reclamation 2000b). Projected shortages were reduced by only about 1%. There are features that have more cost effective ways of meeting the purpose and need of the Project, such as ASR.
Alternatives Eliminated in the FEIS
Modify GDU Import to Sheyenne River Alternative With Upper Sheyenne River Release Feature The upper Sheyenne River release feature would facilitate conveyance of Project water into the upper Sheyenne River using water treated as a part of the GDU Import to Sheyenne River Alternative. Two upper Sheyenne River release alternatives (Alternative 7a and 7b) were eliminated from consideration in the DEIS, because the upper Sheyenne River has insufficient channel capacity to accommodate the proposed flow. For the reasons previously cited in the DEIS and the reasons provided below, the water conveyance feature was eliminated from further consideration in the EIS.
The feature proposed would include a pipeline one-mile long from the outlet of the biota treatment plant to the beginning of the unused 15 mile reach of the McClusky Canal from milepost 59 to 75. The one-mile pipeline would bypass the existing two plugs at mileposts 58 and 59, which were installed in the canal to prevent untreated water from leaving the Missouri
2 - 60

Red River Valley Water Supply Project FEIS Chapter Two Alternatives
River Basin and entering the Hudson Bay Basin. The biota treated Missouri River water would travel down the McClusky Canal by gravity and be released into the Sheyenne River.
•
•
•
•
•
•
•
Further reasons for elimination of this water supply feature are as follows: StateMod modeling results show that the GDU Import to Sheyenne River Alternative
would operate each year for some period of time under all climatic conditions. Therefore, the Project would freshen water in the McClusky Canal as a side benefit. A diversion to the upper Sheyenne River would not be required to achieve that.
The upper Sheyenne River through the Lonetree Wildlife Management Area is an intermittent prairie stream with average flows of about 4 cfs and commonly near zero flow. The conveyance of Project flows significantly higher than 4 cfs in the upper Sheyenne River would increase erosion. The altered flow regime would also change the aquatic community. A substantial portion of diverted water down the upper Sheyenne River could be lost.
While monitoring requirements for the biota WTP have not been finalized, the most effective location to monitor water quality would be the clearwell reservoir directly downstream from the biota WTP. Diverting a modest amount of flow down the extremely large prism of the McClusky Canal would result in significant water losses. The only solution to this problem would be to construct an additional 15 miles of pipeline not currently included in the Project costs, which would have to be funded by Project sponsors. A pipeline similar in size to the pipeline running east to Lake Ashtabula would be over $3 million per mile or approximately $50 million.
It is reasonably foreseeable that adverse environmental impacts would result from releasing a volume of water substantially greater than normal flow down an intermittent prairie stream through a wildlife management area.
There would be power savings if water were released down the upper Sheyenne River. However, this cost saving would be minor compared to the cost of producing additional biota treated water to account for the delivery losses associated with conveyance through the McClusky Canal and the upper Sheyenne River down to Lake Ashtabula. Since a peak flow of 122 cfs is the design target, any losses in conveyance would increase the capacity requirement of the biota WTP and the cost of that plant.
Due to the conveyance losses in the 15 miles of the McClusky Canal and the upper Sheyenne River, the biota WTP would be increased in capacity to account for the losses. StateMod modeling results show that the biota WTP would be used on a regular basis even during normal climatic periods, so there is no significant advantage to using the WTP more frequently.
A large diameter pipeline is a much more efficient conveyance method than using the unlined McClusky Canal and the upper Sheyenne River, which could have significant water losses. Increased water losses increase the capacity requirement for initial biota WTP construction and long-term O&M costs.
2 - 61

Red River Valley Water Supply Project FEIS Chapter Two Alternatives
Recharge Painted Woods Aquifer This water supply feature would use groundwater wells in the Painted Woods Aquifer to supply water to the GDU Import to Sheyenne River Alternative. The surface/groundwater interaction between the McClusky Canal and Painted Woods Aquifer would recharge the aquifer which lacks sustainability. The potential advantage of this water supply feature would be in decreasing costs of this alternative by eliminating or minimizing biota water treatment. However, this water supply feature is not practical or feasible from the technical standpoint, as explained below. For these reasons the water supply feature was eliminated from further consideration in the EIS.
Hydrologic modeling shows that this feature would withdraw an annual average of 80,000 ac-ft of water from the Painted Woods Aquifer during a 1930s-type drought. Whether the aquifer could sustain that level of withdrawal is unknown. There is very limited information on the interaction between the McClusky Canal and the Painted Woods Aquifer. Extensive field investigations of the Painted Woods Aquifer and its interaction with the McClusky Canal would be required to address the viability of this alternative water source.
Developing Painted Woods Aquifer as a water supply source was suggested as a method to eliminate biota water treatment, because the aquifer would act as a filter removing invasive species. The Province of Manitoba has provided a list of treatment goals for Missouri River water prior to its transfer into the Hudson Bay drainage (see page 2-19). The goals use a multi-barrier approach that includes chemical/UV disinfection plus filtration. While groundwater might meet the filtration requirement, it would not meet the disinfection requirements, so some type of treatment facility still would be required. Whether filtration by groundwater extraction would meet Manitoba’s filtration goals is unknown. Extensive technical investigations would be needed to determine whether the treatment proposed in the comment would be adequate.
This type of filtration basically would be an ASR feature using untreated water. Numerous studies of passive infiltration have documented plugging problems in such cases. Basically, the delivery of untreated water to an infiltration area would require extensive maintenance, and necessary infiltration rates would likely be untenable over the long term even with regular maintenance.
The Painted Woods area around Old Johns Lake would be the most likely site for such a feature. Based upon geology it appears that the level of water in the aquifer is higher than in the canal. Leakage into the canal has been estimated at less than 10 cfs, even though a head differential of up to 20 feet is possible in some areas. This strongly suggests that the hydraulic connection between the aquifer and the canal currently is insufficient to reverse flows at the rate needed, which is approximately 122 cfs. The aquifer would substantially be dewatered at that rate.
Another substantial problem to overcome in such a feature is water quality. Much of the water quality recorded in the Painted Woods Basin exceeds 1,000 mg/L of TDS (total dissolved solids). This is higher than it would be in the canal when it is operating but would lead to release of water of unacceptable quality into the Sheyenne River and Lake Ashtabula system. Similarly, for this to be a successful filtration feature, a sufficient retention time during flow through the groundwater system would be needed to inactivate unwanted microbial and viral components. It is unlikely that this could be achieved at the groundwater flow rates required for this rapid recharge program.
2 - 62

Red River Valley Water Supply Project FEIS Chapter Two Alternatives
Sheyenne Delta and Spiritwood Aquifers Alternative This alternative would use the Sheyenne Delta and Spiritwood Aquifers as a primary water source to serve the current and future needs of the Red River Valley. For the technical and economic reasons listed below, the alternative was considered and eliminated in the EIS either as a stand alone alternative and/or as a combined water supply feature in an in-basin water supply alternative.
While the Sheyenne Delta and Spiritwood Aquifers hold substantial amounts of groundwater, the data suggest the two aquifers lack adequate natural recharge to meet existing use, future Project use, and a substantial increase in non-Project use. Sole use of the Sheyenne Delta Aquifer to meet the projected water shortages in the service area would substantially surpass the aquifer’s natural recharge of approximately 50,000 ac-ft of water. Reclamation only considered groundwater sources in the EIS that would be sustainable during a 1930s-type drought with no long-term impacts that could meet an identified need.
The State Water Commission has expressed concerns that over-pumping the Spiritwood Aquifer would lead to saline groundwater intrusion. In addition, the quality of water varies greatly over the geographic extent of the aquifers. For instance, some areas have high levels of TDS. Not only would an extraordinarily large wellfield be required to meet the needs of the service area, but the North Dakota State Water Commission has expressed concerns that such a drawdown could increase TDS in the Spiritwood Aquifer. In addition, the network of wells to distribute water demand over the aquifer would be infeasible because of cost.
Furthermore, since the Sheyenne Delta Aquifer is a largely a shallow aquifer with numerous surface expressions of groundwater, this aquifer probably experiences fluctuating groundwater levels during a prolonged drought. Further depletion of the Sheyenne Delta would likely contribute to or cause environmental impacts to the hydrologic system of the Sheyenne National Grasslands. This would adversely affect the threatened western prairie fringed orchid, which is protected by the ESA. The Sheyenne Delta Aquifer is not considered viable because of unknown recharge, water quality problems, remoteness from project demands, and potential adverse effects to a threatened species.
Using these aquifers to supplement flows in the Sheyenne River was also considered and eliminated. Discharge of groundwater directly into the Sheyenne River could affect surface water quality. A surface water augmentation feature likely would have to meet discharge criteria similar to those in the state’s Devils Lake Outlet permit. Sulfate levels would be a problem, because water in areas of the Spiritwood Aquifer exceeds the 450 mg/L threshold set by the North Dakota Department of Health. This problem would be exacerbated under low-flow natural conditions when the Sheyenne River tends to have higher sulfate values.
North Dakota State Water Commission staff have also stated that groundwater augmentation of surface waters would not meet general permitting standards. Losses to evapotranspiration, bank storage, and other concerns with efficiency make this type of feature acceptable only in an emergency. Furthermore, groundwater from aquifers adjacent to a river is a component of streamflow. As such, depleting an adjacent aquifer could lessen natural discharge into a river and lower natural flows. In particular, lowering the water table in the Sheyenne Delta Aquifer
2 - 63

Red River Valley Water Supply Project FEIS Chapter Two Alternatives
adjacent to the Sheyenne River could decrease discharge into the river, perhaps for an extended period of time.
Although these aquifers store a large amount of water, neither could be developed sufficiently to fulfill the need of a viable long-term water supply that fully meets the identified shortages of the service area. Even a combination of the two aquifers would likely exceed sustainable yields when combined with existing withdrawals.
2 - 64

Red River Valley Water Supply Project FEIS Chapter Two Alternatives
Cost of Alternatives
This section describes a number of financial aspects of the proposed alternatives. The cost estimates were originally developed in Final Needs and Options Report in 2005 and updated as the alternatives were revised in the DEIS, SDEIS and FEIS. This FEIS contains the best available current information on the costs of the action alternatives for the purpose of analysis and comparison. The discussion begins with an estimate of the cost of construction, OM&R, and annualized costs of each alternative under consideration in the FEIS. This is followed by a discussion of the estimated costs of infrastructure for each alternative along with the possibility of constructing each alternative in phases. The possibility of applying drought contingency measures to reduce water demands and the associated cost savings is described in Appendix A.1 but is not included in the cost of the proposed alternatives.
The cost estimates in the FEIS should only be used to compare alternatives. All the alternatives used the same assumptions and unit prices, so these are directly comparable from a cost standpoint.
The cost estimates should only be used for comparative purposes when evaluating the differences between alternatives.
Following a ROD, Reclamation would assess the proposed Project from a Project-funding standpoint. At that time Reclamation would develop feasibility-level design and construction cost estimates. It is only these updated and detailed estimates that Reclamation would use to seek appropriations from Congress.
Cost of Construction, OM&R, and Annualized Costs of Alternatives Table 2.19 summarizes estimated construction, OM&R, and annualized costs for each of the alternatives considered. Construction costs cover supplying bulk water service to the Red River Valley service area. Annual OM&R costs include all annual costs for the water supply features.
Table 2.19 – Summary of Alternative Cost Estimates.
Construction Cost Annual OM&R Annualized Total Annualized Alternative
The annualized costs are a method of combining construction costs and annual OM&R costs into one composite value for comparison purposes. The total annualized costs are the annual
(2005 Dollars)* Cost* Construction Cost* Cost*
No Action1 $24,307,000 $1,023,000 $1,368,000 $2,391,000North Dakota In-Basin $457,292,000 $5,604,000 $25,728,000 $31,332,000Red River Basin $415,438,000 $6,676,000 $23,373,000 $30,049,000GDU Import to Sheyenne River $659,833,000 $4,896,000 $37,123,000 $42,019,000GDU Import Pipeline $910,539,000 $9,072,000 $51,229,000 $60,301,000Missouri River Import to Red River Valley $1,064,551,000 $6,635,000 $59,893,000 $66,528,000
* Values are rounded to the nearest $1,000. 1 The costs of No Action would be locally funded.
2 - 65

Red River Valley Water Supply Project FEIS Chapter Two Alternatives
equivalent of a capital cost added to the annual OM&R cost. This analysis assumed a repayment period of 45 years (2005 – 2050) with an interest rate of 5%. For example, annual payments of $25,728,000 would have to be made to pay off the construction costs of the North Dakota In-Basin Alternative at a cost of $457,292,000. The $25,728,000 annual payment plus the annual OM&R cost of $5,604,000 equals the total annualized cost of $31,332,000.
The No Action Alternative has the lowest construction and annual OM&R costs at $24,307,000 and $1,023,000, respectively. But these costs only supply a minor volume of water and do not meet the purpose and need of the Project. From a water supply standpoint, the alternative with the lowest annualized cost is the least expensive over the long term (through 2050), considering both initial construction costs and long-term annual OM&R costs. This does not include infrastructure costs, which are discussed in the next section.
In addition to the estimated costs of water supply previously discussed, another category of water system costs are referred to as infrastructure. These projects, i.e., future water system improvements and their associated costs, would be constructed by service area residents with or without the Project. These infrastructure projects would be common to all alternatives. Appendix A.3 describes the infrastructure activities through 2050, which generally includes rehabilitation or expansion of WTPs, system distribution, and storage.
Estimating infrastructure project costs is important because these could influence the affordability of alternatives. The analysis of water user costs for each alternative is part of the social and economic analysis presented in chapter four.
Table 2.20 shows the infrastructure costs for each of the six alternatives including construction and annual OM&R costs based on 2005 price levels. Annual OM&R costs were not specifically developed for infrastructure projects. However, these costs average approximately 1% of construction costs for the action alternatives, so 1% was used to estimate infrastructure annual OM&R costs.
Table 2.20 – Infrastructure Costs. Infrastructure Annual OM&R Alternatives Construction Cost Costs* (2005 Dollars)*
No Action $728,888,000 $7,289,000 North Dakota In-Basin $753,195,000 $7,532,000 Red River Basin $753,195,000 $7,532,000 GDU Import to Sheyenne River $753,195,000 $7,532,000 GDU Import Pipeline $753,195,000 $7,532,000 Missouri River Import to Red River Valley $753,195,000 $7,532,000 * Values are rounded to the nearest $1,000.
2 - 66

Red River Valley Water Supply Project FEIS Chapter Two Alternatives
Table 2.21 shows the total construction costs for each proposed alternative and associated infrastructure costs, while table 2.22 lists total annual OM&R costs for each alternative. These total construction and OM&R costs disclose the estimated total cost of water system projects in the service area through 2050.
Table 2.21 – Alternative and Infrastructure Construction Costs.Alternative Infrastructure Total
Alternatives Construction Cost
(2005 Dollars)*
Construction Construction Cost Cost
(2005 Dollars)* (2005 Dollars)* No Action $24,307,000 $728,888,000 $753,195,000North Dakota In-Basin $457,292,000 $753,195,000 $1,210,487,000Red River Basin $415,438,000 $753,195,000 $1,168,633,000GDU Import to Sheyenne River $659,833,000 $753,195,000 $1,413,028,000GDU Import Pipeline $910,539,000 $753,195,000 $1,663,734,000Missouri River Import to Red River Valley $1,064,551,000 $753,195,000 $1,817,746,000
* Values are rounded to the nearest $1,000.
Table 2.22 – Alternative and Infrastructure Annual OM&R Costs.
Alternatives Alternative OM&R Cost
(2005 Dollars)*
Total Infrastructure Annual OM&R OM&R Cost Cost (2005 Dollars)* (2005 Dollars)* No Action $1,023,000 $7,289,000 $8,312,000North Dakota In-Basin $5,604,000 $7,532,000 $13,136,000Red River Basin $6,676,000 $7,532,000 $14,208,000GDU Import to Sheyenne River $4,896,000 $7,532,000 $12,428,000GDU Import Pipeline $9,072,000 $7,532,000 $16,604,000Missouri River Import to Red River Valley $6,635,000 $7,532,000 $14,167,000
* Values are rounded to the nearest $1,000.
Phasing Construction of Alternatives The five action alternatives have varying degrees of construction phasing potential, i.e., some features could be built and put into operation before portions of the alternative are completed. The phasing potential of an alternative depends on the number and type of features in that alternative. An alternative with features suitable for phased construction has an advantage over an alternative with limited phasing potential. The primary advantage in phasing construction is that Project features that are not immediately needed could be built and funded later when size of the features would be better understood and increased population and new industry could help finance these features. Table 2.23 lists each of the alternatives, the number of features included in each alternative, and the percent of the total cost of the first phase of construction of the highest cost feature. Regarding the number of features, the more diverse the water source features are in an alternative, the more flexibility water users would have in constructing it. Based upon the number of water supply features, the North Dakota In-Basin and Red River Basin Alternatives with 11 features, followed closely by the GDU Import Pipeline Alternative with 10 features, would have the most construction flexibility.
2 - 67

Red River Valley Water Supply Project FEIS Chapter Two Alternatives
A more accurate indication of construction flexibility is the total cost of the first phase of construction of the highest cost feature, which is generally the main conveyance pipeline. For each import alternative, the cost of the biota WTP is included in the feature pipeline cost, because the pipeline feature could not be used without biota treatment.
The Red River Basin Alternative has the lowest percent of total cost for the most expensive feature of 52%, which is closely followed by the North Dakota In-Basin Alternative at 56%.
Table 2.23 – Number of Water Supply Features in Alternatives and Percent Cost of Initial Construction Phase.
Number of Percent of the Cost in Alternative
These alternatives would have more construction flexibility than the others. The Missouri River Import to Red River Valley Alternative, which has a main alternative feature comprising 94% of the overall alternative cost, has the least construction flexibility. Generally, the Missouri River import alternatives have less flexibility than in-basin alternatives, because the conveyance pipeline with the associated biota WTP are by far the most costly water supply features.
Features the First Phase
North Dakota In-Basin 11 56% Red River Basin 11 52% GDU Import to Sheyenne River 1 8 90% GDU Import Pipeline 1 10 89% Missouri River Import to Red River Valley 1 7 94%
1 Percentage includes the cost of biota WTP.
2 - 68

Red River Valley Water Supply Project FEIS Chapter Two Alternatives
Summary of Environmental Consequences
Chapter four fully discloses the environmental impacts of the proposed alternatives. Table 2.24 summarizes those impacts. Chapter four presents in-depth discussions of direct, indirect, and cumulative effects and quantifies these effects whenever possible. Mitigation measures for substantive impacts are also described in the resource impact sections and are summarized in Appendix L.1.
Table 2.24 summarizes impacts that could be expected to occur as a result of each alternative during construction or during a 1930s-type drought. A 10 year drought is the focus of this summary, because that is when resources typically would be at their most vulnerable, and impacts would be most likely to occur. For the discussion on the potential long-term and cumulative effects, see chapter four.
The action alternatives are compared to the No Action Alternative to estimate the impacts on each resource. This table summarizes the effects to resources for each alternative when compared to the No Action Alternative. These effects are quantified and described in chapter four of the FEIS. The table identifies whether each alternative has a beneficial, adverse, or minimal effect on a resource when compared to the No Action Alternative.
Table 2.24 - Summary of Environmental Impacts That Could Result From Construction of the Action Alternatives and/or a 1930s-Type Drought as Compared to No Action.
Resource List North
Dakota In-Basin
Red River Basin
GDU Import to Sheyenne
River
GDU Import
Pipeline
Missouri River
Import to Red River
Valley B – Beneficial Effect A – Adverse Effect m – Minimal Effect T – Temporary Adverse Effect1 na – Not Applicable
Water Quantity
MR&I Water Supply B B B B B Lake Ashtabula B B B B B Sheyenne River B m B m m Red River m m B m m Missouri River na na m m m
Flooding and Erosion
Sheyenne River m m m m m Red River m m m m m
Water Quality
Lake Ashtabula T m m m m Sheyenne River T m m m m Red River T T T T m Missouri River m m m m m
2 - 69

Red River Valley Water Supply Project FEIS Chapter Two Alternatives
Resource List North
Dakota In-Basin
Red River Basin
GDU Import to Sheyenne
River
Missouri GDU River
Import Import to Pipeline Red River
Valley B – Beneficial Effect A – Adverse Effect m – Minimal Effect T – Temporary Adverse Effect1 na – Not Applicable
Groundwater
North Dakota Aquifers Brightwood, Gwinner, and Milnor Channel A A na A na
Hankinson A A na A na
Horace B B B B B
Page-Galesburg na na na na na Sheyenne Delta m m B m m
Spiritwood A A na A na
Wahpeton Buried Valley B B B B B West Fargo North B B B B B West Fargo South B B B B B
Minnesota Aquifers
Buffalo m m na A na
Moorhead B B B B B Otter Tail Surficial na A na na na Pelican River Sand-Plain na A na na na
Aquatic Communities
Lake Ashtabula B B B B B North Dakota Game and Fish Aquatic Flow Recommendations m m B m m
Sheyenne River Fish B m B m m Sheyenne River Mussels B m B A A
Red River Fish m m B B m
Red River Mussels B B B B B
Missouri River na na m m m
Risk of Transferring Invasive Species m m m m m Natural Resource Lands
Construction Impacts to Wetlands, Woodlands, Native Prairie T T T T T
Riparian Wetlands, Woodlands, Grasslands B m B B B
Wildlife m m m m m Federal and State Protected Species m m m2 m m
Protected Areas B B B m m
2 - 70

Red River Valley Water Supply Project FEIS Chapter Two Alternatives
Resource List North
Dakota In-Basin
Red River Basin
GDU Import to Sheyenne
River
Missouri GDU River
Import Import to Pipeline Red River
Valley B – Beneficial Effect A – Adverse Effect m – Minimal Effect T – Temporary Adverse Effect1 na – Not Applicable
Historic Properties A3 A3 A3 A3 A3
Indian Trust Assets
Trust Lands m m m m m Hunting, Fishing, & Gathering Rights m m m m m Water Rights m m m m m
Social and Economic Issues
Drought B B B B B Construction and OM&R B B B B B Project Repayment m m m m m Red River Valley Recreation B B B B B Missouri River Hydropower na na m m m Missouri River Navigation na na m m m Missouri River Recreation na na m m m
Environmental Justice m m m m m 1 Temporary adverse effects are impacts that can be mitigated. See Appendix L.1 for environmental mitigation by resource. 2 Potential impacts to federal and state protected species could be both beneficial and minimally adverse and were quantified by comparing No Action to the action alternatives under the NEPA. Under the ESA, Reclamation determined that the proposed action may affect but is not likely to adversely affect listed species (see Appendix G.1), because the adverse impacts were found to be insignificant and discountable. The Service has concurred with Reclamation’s determinations in the biological assessment (Appendix G.1). 3Adverse effects to historic properties are anticipated but consultation is in progress and effects have not been determined.
2 - 71

Red River Valley Water Supply Project FEIS Chapter Two Alternatives
•
•
•
•
•
Comparison of Advantages and Disadvantages of the Alternatives
Tables 2.25 through 2.29 summarize the relative advantages and disadvantages of the engineering, environmental, social-economic aspects of each action alternative. The No Action Alternative would not meet the purpose and need of the Project, so the consequences of this alternative are discussed separately.
Although the alternatives have been described in detail in this chapter, there are differences between them that are not readily discernable from all the information presented in the appendixes and supporting documents. Engineering differences noted in the following tables are related to technical, hydrologic, and design aspects of the alternatives. Environmental impacts are summarized from chapter four and table 2.24. None of the minimal effects are incorporated into the comparison in these tables. Only beneficial or adverse effects are noted. Permitting and legislative challenges are summarized from chapters four and five.
Consequences of No Action The No Action Alternative is the future without the Project; however, this does not mean that there would not be environmental consequences if No Action were the selected alternative. The consequences of No Action are based on comparisons to current conditions described in chapter three of the FEIS. The following list of the consequences is summarized from chapter four.
In the event of a 1930s-type drought reoccurring in the Red River Valley, the consequences of No Action would be:
The alternative would have the lowest cost but would not supply the water needs of the service area. Hydrologic modeling estimates a maximum annual shortage of 55,000 ac-ft, which is 41% of the water demand.
The cumulative economic consequence of being unprepared for a 1930s-type drought would be approximately $20.4 billion over a 10-year period.
In the Missouri River Basin under the No Action Alternative, water withdrawals would increase over existing conditions. The annual depletion would be 557,000 ac-ft greater than it is now due to increased MR&I water demands from projected population growth, expanded industrial use, and new water projects.
Lake Ashtabula, which is the main water supply source in the Red River Valley, would be drained below the minimum 28,000 ac-ft Fish and Wildlife Conservation Pool. The lack of water in the reservoir would have adverse consequences on aquatic life, recreation, and other resources dependent on lake levels.
Water users would tap the only other available water supply - local groundwater sources in North Dakota and Minnesota. Currently, these aquifers are almost fully appropriated and
2 - 72

Red River Valley Water Supply Project FEIS Chapter Two Alternatives
extraction of additional groundwater to replace surface water during a severe drought would deplete groundwater.
•
•
•
•
•
The threat of invasive species successfully invading the Hudson Bay Basin through existing pathways would continue. In particular, international shipping in the Great Lakes poses a high risk of new invasive species, although this risk could be reduced through future regulations. International shipping in the Great Lakes has been the pathway through which some of the most damaging invasive aquatic species (e.g., zebra mussels) have become established in North America. Once established in the Great Lakes, numerous pathways are available for dispersal into adjacent basins, including the Hudson Bay Basin.
Extremely low flows in the Sheyenne and Red Rivers would result from increased depletions and lack of releases from Lake Ashtabula. There would be consequences to aquatic communities and riparian wetlands, woodlands, and grasslands.
The western prairie fringed orchid, a threatened species near the Sheyenne River, could decline because of increased use of the river and aquifers, such as the Sheyenne Delta Aquifer.
Under No Action industries in the Wahpeton area would have insufficient water to operate; therefore, return flows would decrease, and water quality would improve. With the exception of total phosphorus, this difference in water quality is gradually diminished farther downstream at the Canadian border.
Given the relatively few acres that would be disturbed, this alternative has the least potential of adversely affecting historic properties.
2 - 73

Red River Valley Water Supply Project FEIS Chapter Two Alternatives
Table 2.25 – North Dakota In-Basin Alternative Comparison of Advantages and Disadvantages.
North Dakota In-Basin Alternative Advantages Disadvantages
• Second lowest cost action alternative. • Does not deliver treated water directly to Grand Forks to address their water quality concerns.
• Water supply features are in the Red River Basin, so the Project is already authorized under the DWRA.
• Could use up to 100% of available stream flows north of Grand Forks, so the risk of water shortages is potentially higher than with the other alternatives, which have more reliable and abundant water sources.
• State of North Dakota has regulatory control of water supply features.
• Augments flows in the Sheyenne River. • Uses all available in-basin North Dakota water supplies, leaving no additional water resources for demands beyond 2050 estimates.
• Stabilizes pool elevations in Lake Ashtabula during non-drought years and maintains the Fish and Wildlife Conservation Pool. • Because the alternative reuses water multiple
times, it potentially increases water quality problems associated with currently unregulated contaminants, such as pharmaceuticals and endocrine disrupters.
• Improves fish and mussel habitat in the Sheyenne River and mussel habitat in the Red River.
• Biota water treatment is not necessary.
• Positively affects riparian areas by augmenting the Sheyenne River during a 1930s-type drought.
• Requires use of ASR, which has yet to be successfully demonstrated in these aquifers. Extensive pilot studies are needed to prove the viability of ASR.
• Includes storage to meet peak water demands, which could be problematic. Water quality problems associated with long-term storage of treated or raw water due to the formation of disinfection byproducts or precursors could result.
• Has the lowest flow of all the action alternatives in the Red River between Grand Forks and Canada during a drought.
• Fully uses groundwater sources in southeastern North Dakota and transfers water resources away from rural North Dakota communities to benefit growth in larger cities.
• Development of Spiritwood, Gwinner, Brightwood, and Milnor Channel Aquifers to meet Project needs would limit future use of these groundwater sources for non-Project water users.
• May adversely affect historic properties.
2 - 74

Red River Valley Water Supply Project FEIS Chapter Two Alternatives
Table 2.26 – Red River Basin Alternative Comparison of Advantages and Disadvantages.
Red River Basin Alternative Advantages Disadvantages
• Lowest cost action alternative. • Does not deliver treated water directly to Grand Forks to address their water quality concerns.
• Water supply features are in the Red River Basin, so the Project is already authorized under the DWRA.
• Use of Minnesota groundwater to serve North Dakota water demands would require a permit from the State of Minnesota and approval from the Minnesota legislature. • Minnesota groundwater has more consistent water
quality than surface water, which is an advantage when treating water. • Minnesota has suggested that the Project’s use of
Minnesota groundwater would be limited to drought periods. The alternative was not modeled with this assumption and would not work if groundwater were available only during drought periods.
• Project water is conveyed directly to the Fargo area providing an instantaneous supplemental supply when needed.
• Lake Ashtabula’s Fish and Wildlife Conservation Pool is maintained.
• Out-of-state diversions are the lowest priority for conflicting water uses in Minnesota, so the water supply may be unreliable if resources become limited. A Minnesota appropriation permit would be subject to amendment or termination at any time.
• Red River mussels would benefit from flows in the Red River.
• Biota water treatment is not necessary. • Minnesota would not allow groundwater sources to
be used by new industrial water users during a drought. The alternative was not modeled based on this limitation, because it would fail to meet the purpose and need for the Project.
• Development of Pelican River, Otter tail Surficial, Brightwood, Milnor Channel, Gwinner and Spiritwood Aquifers to meet Project needs would limit future use of these groundwater sources for non-Project water users.
• Requires use of ASR, which has yet to be successfully proven to work in these aquifers. Extensive pilot studies would be needed to prove the viability of ASR.
• Includes storage to meet peak water demands, which could be problematic. Water quality problems associated with long-term storage of treated or raw water, due to the formation of disinfection byproducts or precursors, could result.
• Fully uses groundwater sources in southeastern North Dakota and transfers water resources away from rural North Dakota and Minnesota communities to benefit growth in larger cities.
• Adverse effects to the Otter Tail Surficial and Pelican River Sand-Plain Aquifers would occur from increased use lowering water tables.
• May adversely affect historic properties.
2 - 75

Red River Valley Water Supply Project FEIS Chapter Two Alternatives
•
Table 2.27 – GDU Import to Sheyenne River Alternative Comparison of Advantages and Disadvantages.
GDU IMPORT TO SHEYENNE RIVER Advantages Disadvantages
Uses the Missouri River system, which is the largest and most reliable source of water in North Dakota.
• Does not deliver treated water directly to Grand Forks to address their water quality concerns.
• Use of Missouri River water requires congressional authorization. • Has pipeline capacity to serve communities and
rural water systems in northeastern North Dakota. • Biota water treatment plant is required.
• Does not use limited groundwater resources of southeastern North Dakota or technically challenging ASR features.
• Has the highest annual diversion from the Missouri River during a 1930s-type drought.
• May adversely affect historic properties. • Lowest cost of the Missouri River import alternatives.
• Augments flows in the Sheyenne and Red Rivers.
• Stabilizes pool elevations in Lake Ashtabula during non-drought years and maintains the Fish and Wildlife Conservation Pool.
• Beneficially affects North Dakota aquifers; groundwater is available to meet other water demands.
• Beneficially affects the Buffalo Aquifer in Minnesota by providing water to Moorhead.
• Meets all of the North Dakota Game and Fish Department recommended aquatic flow targets on the Sheyenne River 100% of the time during a 1930s-type drought and 40% of the time on the Red River below Fargo.
• Benefits fish and mussels in the Red and Sheyenne Rivers with augmented flows.
• Provides beneficial effects to riparian areas from augmented flows in the Sheyenne and Red Rivers.
2 - 76

Red River Valley Water Supply Project FEIS Chapter Two Alternatives
2 - 77
Table 2.28 – GDU Import Pipeline Alternative Comparison of Advantages and Disadvantages.
GDU IMPORT PIPELINE Advantages Disadvantages
• Second highest cost of action alternatives. •
Uses the Missouri River system, which is the largest and most reliable source of water in North Dakota. • Does not deliver treated water directly to Grand
Forks to address their water quality concerns. • Does not use technically challenging ASR features.
• Use of Missouri River water requires congressional authorization. • Water is conveyed directly to the Fargo area as a
secondary supply when natural flow does not meet demand. This is an instantaneous supplemental water supply.
• Biota water treatment plant is required.
• Has the highest average annual diversion from the Missouri River system during the modeling period of record 1931-2001.
• Delivers water treated to SDWA level, which could eliminate the need for new water treatment plants in the Fargo area. • Fully uses groundwater sources in southeastern
North Dakota, which benefits growth in the larger cities rather than rural communities.
• Lake Ashtabula’s Fish and Wildlife Conservation Pool is maintained.
• Development of the Spiritwood, Gwinner, Brightwood, and Milnor Channel Aquifers to meet Project needs would limit future use of these groundwater sources for non-Project water users.
• Two aquifers, one in North Dakota and one in Minnesota, would benefit from decreased use.
• Benefits fish and mussels in the Red River with augmented flows.
• Deceases mussel habitat in the Sheyenne River during a drought. • Beneficially affects riparian areas with improved
flow during a 1930s-type drought at the Lisbon and West Fargo gauges on the Sheyenne River and from Fargo to the Canadian border on the Red River.
• May adversely affect historic properties.

Red River Valley Water Supply Project FEIS Chapter Two Alternatives
•
Table 2.29 – Missouri River Import to Red River Valley Alternative Comparison of Advantages and Disadvantages.
MISSOURI RIVER IMPORT TO RED RIVER VALLEY Advantages Disadvantages
Uses the Missouri River system, which is the largest and most reliable source of water in North Dakota.
• Highest cost action alternative.
• Use of Missouri River water requires congressional authorization.
• Pipes 20 cfs of treated water to Grand Forks to address their water quality concerns. • Biota water treatment plant is required.
• Deceases mussel habitat in the Sheyenne River during a drought.
• Does not use limited groundwater resources in southeastern North Dakota or technically challenging ASR features. • May adversely affect historic properties.
• Missouri River intake structure uses horizontal wells, further reducing the risk of transfer of invasive species.
• Water is conveyed directly to Fargo and Grand Forks delivering an instantaneous supplemental water supply.
• Provides SDWA compliant treated water. This could eliminate the need for new water treatment plant capacity in the service area.
• Beneficially affects riparian areas during a 1930s-type drought with improved flows at the Lisbon and West Fargo gauges on the Sheyenne River and from Grand Forks to the Canadian border on the Red River.
2 - 78

Red River Valley Water Supply Project FEIS Chapter Two Alternatives
Identification of the Preferred Alternative
The No Action Alternative would have negative economic and environmental consequences during a 1930s-type drought in the Red River Valley (see pages 2-61 through 2-63). The economic consequences in the worst year (1936) are estimated at $3.6 billion, with a cumulative 10-year impact during the 1930s-type drought of $20.4 billion (see chapter four, “social and economic issues” section). This is in contrast to the highest cost alternative of approximately $1 billion, construction of which would eliminate the possibility of a $20.4 billion negative economic impact.
Most importantly, the No Action Alternative does not meet the comprehensive water quality and quantity needs of the Red River Valley. Under the No Action Alternative, the water supply shortage during a drought similar to the 1930s would be as high as 55,000 ac-ft or a 41% shortage in the worst year. That magnitude of shortage does not meet the purpose and need for the Project. GDU Import to Sheyenne River Alternative
Tables 2.25 through 2.29 compare the relative differences between the five action alternatives from a perspective of technical, hydrologic, design, water permitting, and environmental considerations. The advantages and disadvantages shown in the tables are grouped into four basic categories – constructability (including costs), reliability of water sources, water permitting issues, and environmental impacts.
Constructability and Cost The costs of the alternatives are relatively easy to compare from a constructability standpoint. All five action alternatives have a benefit/cost ratio over 1.0, which demonstrates the economic feasibility of the alternatives as a group. See Appendix K.2 for the benefit cost analysis results.
Not all the alternatives have equal constructability. While similar water projects have successfully constructed conveyance pipelines in the region for decades, the same cannot be said about all the water supply features considered in the alternatives. The most difficult water supply feature to construct and operate successfully would be the ASR feature. The history of ASR development in the United States, by Reclamation and others, records successes and failures because of the challenging technical issues associated with ASR design and operation.
2 - 79

Red River Valley Water Supply Project FEIS Chapter Two Alternatives
Water quality compatibility problems, poor recovery rates, unknown aquifer conditions, and high operational costs make ASR water supply features difficult to construct and operate successfully. The North Dakota In-Basin and Red River Basin Alternatives would depend on this water supply feature to meet the purpose and need of the Project. Due to limited alternate in-basin water sources, dependence on successful ASR implementation raises concerns with the two in-basin alternatives.
Reliability of Water Sources The second category of alternative advantages and disadvantages addresses the reliability of water sources. At the center of every action alternative is the main water supply feature that would supply most of its water. The North Dakota In-Basin Alternative main feature would capture water from the lower Red River and return it to Lake Ashtabula for release down the Sheyenne River and reuse. The reliability of this alternative depends upon the accuracy of the hydrologic model, particularly during low flow periods that are difficult to measure accurately. All the alternatives depend on accurate modeling results, but the viability of this alternative rests even more on accurate estimates of in-basin river flows during a severe drought. That is because the other four alternatives have primary water sources (Missouri River and Minnesota groundwater) with capacity greater than the Project’s needs, while the North Dakota In-Basin Alternative would use all available water supplies with no reserve capacity.
The reliability of the Red River Basin Alternative depends on accurate knowledge of the Minnesota groundwater supply, particularly during drought periods. The Missouri River import alternatives depend on the viability of Lake Sakakawea or Lake Oahe and the Missouri River system during a 1930s-type drought. The Corps’ analysis of Missouri River effects study (Corps 2007) shows that during the height of a 1930s-type drought the total Missouri River Basin reservoir storage would be no less than approximately 30 million ac-ft, with approximately 26 million ac-ft of water stored in the upper three basin reservoirs. Assuming that this storage is balanced among the six reservoirs, Lake Sakakawea and Lake Oahe would be reliable water sources for the three Missouri River import alternatives.
Permitting and Approval The third category of alternative advantages and disadvantages is permitting and approval issues. All the action alternatives require some type of water permit or legislative authorization to proceed with construction. The North Dakota In-Basin Alternative would require a water permit from the North Dakota State Engineer to withdraw water from the Red River for conveyance back to Lake Ashtabula. The alternative also requires a number of groundwater permits associated with traditional groundwater withdrawals or ASR. The State of North Dakota has never permitted an ASR project of the size and complexity proposed in the two in-basin alternatives. The North Dakota State Engineer has also raised concerns about the volume of groundwater withdrawals required by the in-basin alternatives. Withdrawals of this magnitude would exhaust all remaining viable groundwater sources in the vicinity of the identified water demands.
The Red River Basin Alternative proposes to develop water supplies from the Pelican River and Otter Tail Surficial Aquifers, which will require groundwater permits from the MNDNR. The State of Minnesota has a number of conditions that potentially limits the Project’s ability to develop groundwater. The Minnesota legislature would also have to legislatively approve the
2 - 80

Red River Valley Water Supply Project FEIS Chapter Two Alternatives
groundwater permits, because the volume required exceeds the limit of 2 mgd (30 day average) allowed for out-of-state transfers of water.
The Missouri River import alternatives would require an amendment to the DWRA authorizing the transfer of Missouri River water to the Red River Valley. Opposition by states concerned about Missouri River withdrawals is expected, so it is not known whether an amendment to the DWRA could be obtained.
Environmental Impacts The fourth category is environmental impacts. A review of table 2.24 shows that the five action alternatives have relatively minor differences from an environmental impacts standpoint. Impacts generally would be temporary and associated with construction of the Project or be minimal. All the alternatives would use the Sheyenne and/or Red Rivers to convey water, which is an existing condition that could be expected to continue into the future. Flow analysis shows that none of the alternatives would increase erosion of riverbanks, cause flooding, or adversely affect aquatic resources. In fact, all the action alternatives would have some aquatic benefits. The GDU Import to Sheyenne River Alternative would augment stream flows and would meet most of the aquatic needs targets recommended by the North Dakota Game and Fish Department, which is a beneficial effect.
Three of the five action alternatives propose to import Missouri River water into the Hudson Bay Basin and have the potential of introducing invasive species. Each alternative includes a biota WTP, which reduces the risk of a successful invasion. Table 2.24 shows that all the action alternatives, whether importing Missouri River or not, demonstrate a similar level of risk associated with the potential to transfer invasive species. This is because the biota treatment plants proposed in the Missouri River import alternatives provide reasonable protection from a successful invasive species invasion in the Hudson Bay Basin. Under No Action the threat of invasive species from existing pathways successfully invading the Hudson Bay Basin would continue.
Impacts from Missouri River withdrawals were evaluated in the FEIS, and table 2.24 summarizes the results. The impact analyses show that there are no significant differences between the No Action Alternative and the three Missouri River import alternatives. There are slight impact differences between the action alternatives due to different withdrawal volumes, but these differences are insignificant when compared to the total volume of water in or passing through the Missouri River system.
Preferred Alternative As a result of due consideration and evaluation of the factors described above, Reclamation and North Dakota have identified the GDU Import to Sheyenne River Alternative as the preferred alternative. The Missouri River is a more reliable water source than the Red River (North Dakota In-Basin Alternative) and possibly Minnesota groundwater (Red River Basin Alternative) depending on results of ongoing USGS studies. This alternative has no technical constructability issues and is the least costly of the three Missouri River import alternatives. All the alternatives have water permitting or legislative approval issues, but the Red River Basin Alternative has the added uncertainty of asking Minnesota to approve use of its valuable water sources to benefit another state contrary to the expressed concerns of its citizens. The Missouri River import
2 - 81

Red River Valley Water Supply Project FEIS Chapter Two Alternatives
alternatives, while requiring congressional approval, have the advantage that the North Dakota State Engineer granted a water permit in 1967 to withdraw sufficient water for the Project to precede without the conditions Minnesota has placed on their groundwater sources. Permit number 01416 allows the use of 1.212 million ac-ft annually, which is more than would be needed for this proposed Project. To address concerns raised by the Province of Manitoba, In-filter DAF treatment option or a comparable, cost effective treatment option with filtration (removal), which meets their biota treatment goals was identified for this alternative to reduce the risk of invasive species.
2 - 82

Red River Valley Water Supply Project FEIS Chapter Three Affected Environment
•
•
••••••
••
•
••••
Chapter Three Affected Environment
Introduction
The environment of the area to be affected by the alternatives is described in this chapter. The discussion focuses on the resources that could be affected by the proposed Project. Resources that were analyzed and found to be unaffected are noted in the text, and the results of the analyses are documented in Appendixes B - K. Environmental commitments are listed in Appendix L.1. Common and scientific names of species are in Appendix L.2.
Resources that could be affected by the Project’s proposed alternatives occur throughout the geographic scope of the Project, as defined in chapter one. The geographic scope encompasses portions of two major drainage basins – the Hudson Bay Basin, of which the Red River Valley is part, and the Missouri River Basin, which would serve as a source of water in three of the proposed alternatives.
Western Prairie Fringed Orchid on the Sheyenne National Grasslands
Issues identified in scoping or resources that potentially could be affected by the Project are: Red River Basin surface water
quantity Flooding and erosion on the Sheyenne
and Red Rivers Missouri River System water quantity Surface water quality Groundwater Aquatic communities Risks of invasive species Natural resource lands – wetlands, grasslands, woodlands, and riparian areas
Wildlife Federally protected species and
species of special concern Protected areas, state, and federal
lands Historic properties Indian trust assets Social and economic issues Environmental justice
3 - 1

Red River Valley Water Supply Project FEIS Chapter Three Affected Environment
••••••
General Description of the Ecoregions in the Project Area
The area of potential effect covers six distinct ecoregions (figure 3.1). Ecoregions are areas defined by environmental conditions and natural features. They denote areas of general similarity in ecosystems and in the type, quality, and quantity of environmental resources. These resources include geology, vegetation, climate, soils, land use, wildlife, and hydrology. Ecoregions are relevant in natural resource management and decision-making as each ecoregion’s quality and integrity reflects their specific environmental resources. Ecoregions also reflect biodiversity as defined by the Council on Environmental Quality (1993).
Figure 3.1 – Ecoregions in the Project’s Area of Potential Effects.
The six ecoregions in the Project area are: Northwestern Glaciated Plains, Northern Glaciated Plains, Lake Agassiz Plain, Northern Minnesota Wetlands, Northern Lakes and Forests, and North Central Hardwood Forests.
Ecoregions in the Project Area These ecoregions are from Omernik (1987) and from refinements of Omernik's framework for other projects (EPA 2005a). The regions appear in figure 3.1 and are described from west to east. Omernik’s framework does not extend into Canada, so the Red River in Canada and Lake Winnipeg do not appear in figure 3.1.
Aerial View of the North Central Harwood Forests
3 - 2

Red River Valley Water Supply Project FEIS Chapter Three Affected Environment
The Northwestern Glaciated Plains Ecoregion is a transitional region between the generally more level, moist, and cultivated Northern Glaciated Plains to the east and the generally more irregular, drier, less cultivated Northwestern Great Plains to the west and southwest. The western and southwestern boundary of this ecoregion roughly coincides with the limits of continental glaciation, which occurred about 10,000 years ago. Occurring across this ecoregion is a moderately high concentration of semi-permanent and seasonal wetlands, locally referred to as “prairie potholes.”
••••
•
The Northern Glaciated Plains Ecoregion is characterized by a flat to gently rolling landscape composed of glacial till. The subhumid conditions foster transitional grasslands containing tallgrass and shortgrass prairie. High concentrations of temporary and seasonal wetlands create favorable conditions for waterfowl nesting and migration. Though the till soils are very fertile, agricultural success is subject to annual climatic fluctuations.
Glacial Lake Agassiz was the last in a series of glacial lakes to fill the Red River Valley after the Ice Age. Thick beds of lake sediments on top of glacial till create the extremely flat floor of the Lake Agassiz Plain Ecoregion. The historic tallgrass prairie has been replaced by row crop agriculture.
Much of the Northern Minnesota Wetlands Ecoregion is a vast and nearly level marsh sparsely inhabited by humans and covered by swamp and boreal forest vegetation. Formerly occupied by broad glacial lakes, most of the flat terrain in this ecoregion is still covered by standing water.
The Northern Lakes and Forests Ecoregion consists of nutrient poor glacial soils, coniferous and northern hardwood forests, undulating till plains, moraine hills, broad lacustrine basins, and extensive sandy outwash plains. Soils in this ecoregion are thicker than in those to the north and generally lack the arability of soils in adjacent ecoregions to the south. The numerous lakes that dot the landscape are clearer and less productive than those in ecoregions to the south.
The North Central Hardwood Forests Ecoregion is transitional between the predominantly forested Northern Lakes and Forests to the north and the agricultural ecoregions to the south. Land use and land cover in this ecoregion consist of mosaic forests, wetlands and lakes, agricultural cropland, pasture, and dairy operations.
Within these ecoregions, the area of potential effect of this Project (figure 3.2) includes: Hudson Bay Basin Sheyenne River from Lake Ashtabula to the confluence with the Red River Lake Ashtabula Red River from Wahpeton, North Dakota, to Lake Winnipeg, Manitoba, Canada Land and resources overlying aquifers under consideration as Project water sources
Missouri River Basin Missouri River including Lake Oahe and Lake Sakakawea
3 - 3

Red River Valley Water Supply Project FEIS Chapter Three Affected Environment
•
•
•
Audubon Lake, McClusky Canal, and Chain of Lakes
Missouri River below Lake Sakakawea to its confluence with the Mississippi River
Both Basins Land and resources
crossed by buried pipelines and associated facilities.
Climate
Figure 3.2 – Area of Potential Effect of the Project.
The location of the Red River Basin, near the center of the North American continent, has a great influence on its climate. The Koeppen Modified System of climatic classification, which is based upon seasonal characteristics of temperature and precipitation, classifies the Red River Basin as a humid continental, cool summer climate, characterized by fluctuations in daily, seasonal, and annual temperatures. This is also true for precipitation amounts from one year to the next, with both floods and droughts being relatively common (Meridian Environmental Technology, Inc. 2004).
The Upper Missouri River Basin in North Dakota constitutes roughly 80% of the total streamflow in North Dakota, which is fed predominantly by snowmelt from the Rocky Mountains from northern Wyoming through Montana and into extreme southern Saskatchewan. Adjacent to the western boundary of the Red River Basin, the upper Missouri River Basin becomes progressively drier westward across North Dakota and into central Montana until reaching the foothills of the Montana Rockies. The increase in elevation in the Rocky Mountains causes higher winter precipitation, providing snowmelt that is the principle water source feeding the upper Missouri River system. Otherwise, the limited precipitation across the North Dakota and Montana prairies averages generally below 14 inches of water, or about 40% less than in the Red River Basin (Meridian Environmental Technology, Inc. 2004).
3 - 4

Red River Valley Water Supply Project FEIS Chapter Three Affected Environment
••••
Red River Basin Surface Water Quantity
Introduction What is the existing condition of surface water, in terms of quantity, in the area that
would be affected by the Project?
This section describes the existing condition of water features within the Red River Basin that would be affected by the proposed alternatives. Water features affected within the Red River Basin are: Lake Ashtabula the Sheyenne River below Lake Ashtabula the Red River the Red River from Emerson to Lake Winnipeg, and Lake Winnipeg
Methods A literature search was done to determine and to describe the water quantity of the affected environment of Lake Ashtabula, the Sheyenne River, and the Red River.
Existing Conditions
Lake Ashtabula Construction of Baldhill Dam was authorized by Congress in 1944 to stabilize flows in the Sheyenne River. The dam was put into emergency operation in 1950 and was completed in 1951 by the Corps. Safety rehabilitation of the dam was completed in 1997. The dam, located approximately 16 miles north of Valley City, North Dakota, backs up water from the upper Sheyenne River into a reservoir called Lake Ashtabula (Corps 2003b), which is managed by the Corps.
Baldhill Dam Near Valley City, North Dakota Lake Ashtabula’s purpose is to augment low flow to meet downstream water supply and pollution abatement objectives and to reduce flooding in the Sheyenne River Valley. Recreation, fish, and wildlife enhancement are secondary objectives of the dam operation plan. Figure 3.3 shows the current operating plan for Baldhill Dam with current target elevations for the flood pool, conservation pool, and dead pool.
The current capacity of the reservoir, including flood storage, is 116,500 ac-ft. Estimated sedimentation would reduce the conservation pool of this reservoir from 70,700 ac-ft to 65,700 ac-ft by 2050. Water right apportionments to the conservation pool would be reduced proportionally. Since most sediment would collect below the top of the conservation pool, flood storage capacity would not be affected.
3 - 5

Red River Valley Water Supply Project FEIS Chapter Three Affected Environment
The state of North Dakota has issued water permits for water stored in Lake Ashtabula to Fargo, Grand Forks, Valley City, West Fargo, and Lisbon under the Thompson-Acker Plan (North Dakota State Water Commission 1992 and 2005b). Based on this plan, the cities that contributed funds to construct the dam applied for water use permits from the State Engineer. With 69,000 ac-ft of water available from storage, those entities with permits from the State Engineer and their allocation are in table 3.1.
Figure 3.3 – Lake Ashtabula Pools as Defined in the Corps’ Operating Plan.
Table 3.1 – Water Permits for Storage in Lake Ashtabula.
Lake Ashtabula Water Permits
Entity Permit
Number Approved Acre-Feet
Distribution of Permitted
Reservoir Volume Priority Date
Beneficial Use Date
City of Lisbon 3,588 373 0.6% October 14, 1982 December 1, 2007City of Valley City 1,096 6,686 10.5% July 1, 1963 July 1, 1980City of Fargo 1,091 35,880 56.1% June 27, 1963 December 31, 1972City of West Fargo 921 954 1.5% July 25, 1961 July 1, 2001City of Grand Forks 835A 20,023 31.3% January 23, 1960 July 1, 1967
TOTAL 63,916 100.0% The remaining 5,084 ac-ft unallocated storage water is managed by the State Engineer and is primarily used to offset a minimum 13 cfs release from Baldhill Dam when either inflow to the reservoir or project releases from the reservoir fall below 13 cfs, as described within the Corps’ Operational Plan (Corps 2005a).
3 - 6

Red River Valley Water Supply Project FEIS Chapter Three Affected Environment
Sheyenne River The portion of the Sheyenne River potentially affected by the Project is between Lake Ashtabula and its confluence with the Red River north of Fargo, North Dakota (figure 3.4), a distance of 270 river miles. The Sheyenne River is a major tributary of the Red River that originates in Sheridan County in central North Dakota. It winds its way through south-central North Dakota, ultimately emptying into the Red River north of Fargo. During its course, the Sheyenne River traverses a variety of North Dakota terrains, including flat plains, rolling sand hills, wide bottomland, tallgrass prairie, and hardwood forests. The Sheyenne River crosses the Northwestern Glaciated Plains, Northern Glaciated Plains, and Lake Agassiz Plain Ecoregions.
Figure 3.4 – Sheyenne River Watershed.
Flow patterns for the Sheyenne River are typical of a northern prairie river that receives a majority of its water from snowmelt and spring precipitation. Peak discharge generally occurs during the months of March and April. From its headwaters in Sheridan County to the top of Lake Ashtabula, the river is free flowing with documented periods of zero flow. Flow in the lower reaches of the river is regulated by releases from Baldhill Dam. There are also lowhead dams located on the river below Baldhill Dam near Valley City.
Flows in the Sheyenne River are affected to some degree by an outlet from Devils Lake. The state of North Dakota has constructed a state-funded outlet. Devils Lake is located in a 3,810-square-mile closed basin watershed in northeastern North Dakota. The lake is a hydrologic subbasin of the Sheyenne River, which in turn is a subbasin of the Red River of the North Basin. The outlet was constructed in response to increased lake levels, which have caused flooding throughout the region. Devils Lake has risen approximately 26 feet since 1993 (see Appendix B.1 for more information).
Valley City, Lisbon, West Fargo, and Fargo have surface water permits on the Sheyenne River. The river also supplies water for irrigation and industrial processing. As of 2004, there were 77 municipal, industrial, and irrigation permits on the Sheyenne River allocating 70,215 ac-ft of water annually.
Figure 3.5 – Glacial Lake Agassiz (from Krenz and Leitch 1993)
Red River The Red River is a meandering river that begins where the Otter Tail River and Bois de Sioux River join at
3 - 7
Red River Valley Water Supply Project FEIS Chapter Three Affected Environment
Wahpeton, North Dakota, and Breckenridge, Minnesota. The Red River has 548 river miles of which 394 are in the United States. Parts of South Dakota, North Dakota, and Minnesota are drained by the Red River.
The Red River is unusual for the northern plains because it flows northward through the center of an ancient lakebed, Glacial Lake Agassiz. The remnant lakebed has extremely flat topography, which characterizes the Red River Valley. The valley covers a strip of land about 35 miles wide on either side of the Red River in North Dakota and Minnesota. The Red River Valley is part of the larger Red River Basin, which in turn is part of the Hudson Bay Drainage System (see figure 3.2). The Red River Basin includes the old Lake Agassiz lakebed and about 28,000 additional square miles, for a total of about 45,000 square miles (figure 3.5). Nearly 40,000 square miles of the basin are located in the United States (Krenz and Leitch 1993).
The Red River receives most of its flow from its eastern tributaries because of regional patterns in precipitation, evapotranspiration, soils, and topography. The Red River Valley has a sub-humid climate with an average annual precipitation of about 20 inches.
Major tributaries entering the Red River in the United States include the Sheyenne River, Red Lake River, and Otter Tail River. Most of the annual precipitation and annual evaporation occurs from April through September. As a result, most of the time precipitation is absorbed in the soil and transpired or evaporated back to the atmosphere and very little results in runoff or groundwater recharge. Most runoff is in the early spring when snowmelt and precipitation generally exceed evapotranspiration (Sloan 1972). Maximum flow occurs in the spring, decreases throughout the summer and fall, and is lowest during the winter months.
Currently, there are several lowhead dams along the Red River that pool water for MR&I intakes during times of low flow. A lowhead dam is a dam of low height, usually less than 15 feet that extends from bank to bank across a stream channel. Lowhead dams are located on the river at Wahpeton, Wolverton, Hickson, Fargo, Grand Forks-East Grand Forks, and Drayton. Some of the dams have been modified for safety reasons and to allow fish passage [MNDNR and North Dakota Game and Fish Department 1996].
The Red River is the primary source of water for municipal, industrial, and irrigation purposes in the valley. It is the principal water supply for cities such as Moorhead, Minnesota, and Fargo, Grand Forks, Grafton, and Drayton, North Dakota, among others. Currently, there are 119 municipal, industrial, and irrigation permits on the United States portion of the Red River allocating 254,955 ac-ft of water (unpublished data gathered from the North Dakota State Water Commission, MNDNR, and the South Dakota Division of Water Rights Office).
Red River From Emerson to Lake Winnipeg and Lake Winnipeg The Red River continues north across the U.S./Canadian border near Emerson, Manitoba, to its mouth at Lake Winnipeg, which is approximately 154 river miles north of the border (figure 3.2). The Roseau, Seine, LaSalle, Rat, and Morris Rivers are import tributaries to the Red River in Canada. While the Assiniboine River also flows into the Red River at Winnipeg, it is considered a separate watershed division from the Red River (Environmental Management Division 1980). About 20% of the Red River watershed is in Manitoba.
3 - 8

Red River Valley Water Supply Project FEIS Chapter Three Affected Environment
3 - 9
Lake Winnipeg is in the Hudson Bay Basin. The lake is a remnant of former glacial Lake Agassiz and is located in Manitoba, Canada (figure 3.6). It is the tenth largest freshwater lake in the world and the second largest in Canada. It covers 9,464 square miles and holds 300 MAF. Although large in surface area and volume, the lake has a mean depth of 40 feet and a maximum depth of 118 feet, making it subject to wind-driven turbidity.
The hydrology of the Lake Winnipeg watershed is dominated by four rivers flowing in and out of the lake. On average, the Winnipeg River contributes about 45% of the total inflow of water into Lake Winnipeg. In comparison, the Saskatchewan River and the Red River contribute 26% and about 11%, respectively. Nelson River flows out of Lake Winnipeg to Hudson Bay.
Figure 3.6 – The Red River Flows North into Lake Winnipeg in Manitoba, Canada.

Red River Valley Water Supply Project FEIS Chapter Three Affected Environment
Flooding and Erosion on the Sheyenne and Red Rivers
Introduction What is the current condition of flooding and erosion on the Sheyenne and Red Rivers
within the area of potential effects?
Effects of the alternatives on flooding and erosion on the lower Sheyenne River were of concern to the public, because rivers and streams are not only conduits of water, but also of sediment. As water flows over the channel bed, it mobilizes sediment and transports it downstream, either as bed load, suspended load, or dissolved load. The rate of sediment transport depends on the availability of sediment itself and on the river's discharge. If there are no large changes in flows and available sediment, the channel reaches a condition of balance.
Methods To determine if there would be a change in the natural rate of erosion and deposition of sediments along the Sheyenne River, a representative point at Kindred, North Dakota, was selected for evaluation. The question to be answered in this evaluation was if changes in flow from the alternatives would change bankfull flow in the rivers.
Flow measurements show that the bankfull stage reoccurs every 1.5 years on average in gauged rivers (Dunne and Leopold 1978). This means that in any given year, there is a 67% chance that a river will rise to or overtop the active floodplain. Because bankfull flow equates to approximately a 1.5 year flow, for many rivers the bankfull stage is a benchmark that can be used to measure channel size. This allows for a consistent comparison between sites.
Long-term bed load and flow measurements show it is bankfull flow that transports the greatest amount of material over time (Leopold 1994). While larger flow events transport greater quantities per event and smaller flow events are more frequent, it is the bankfull flow that performs the greatest amount of work in maintaining channel shape. It is also referred to as the “effective discharge” or “channel forming flow.”
Sheyenne River in Valley City
A channel is said to be at bankfull stage when it is just about to flood the active floodplain. Thus, the active floodplain defines the limits of the bankfull channel. The active floodplain is defined as the flat portion of the valley adjacent to the channel that is constructed by the present river in the present climate (Leopold 1994). The phrase “by the present river in the present climate” is especially important, because if the river degrades or incises, the existing floodplain is deserted and becomes a terrace or abandoned floodplain. It is important to be able to distinguish the active floodplain from abandoned terraces when identifying bankfull stage.
3 - 10

Red River Valley Water Supply Project FEIS Chapter Three Affected Environment
Existing Conditions
Sheyenne River The slope of the Sheyenne River is fairly flat and falls about 846 feet over approximately 542 miles for an average slope of 1.6 feet per mile (West Consultants, Inc. 2001). A geomorphology study of the Sheyenne River for the Devils Lake Outlet EIS determined that bankfull flows at Kindred range from 920–1400 cfs (West Consultants, Inc. 2001).
In the upper basin down to Lisbon, the surficial materials are glacial till and outwash. Between Lisbon and Kindred, the Sheyenne River has incised a trench across the Sheyenne Delta, a feature that marks the confluence of the early Sheyenne River with glacial Lake Agassiz. Coarse sands are located at the upstream end of this reach, and become finer downstream. From Kindred to its confluence with the Red River, the Sheyenne River crosses the Red River floodplain that consists mainly of deep clays (West Consultants, Inc. 2001).
Red River Generally, the Red River can handle runoff during a relatively small flood, which occurs fairly frequently. In 1997 floodwaters covered an area up to 25 miles wide, and the peak natural flow was calculated at 164,000 cfs. During the largest flood in the historic record in 1852, the flow was estimated to be 225,000 cfs (International Joint Commission 2000:17).
Stream flow and bankfull capacity of the Red River increases from south to north. Bankfull channel capacities along the Red River are estimated to be 2,400 cfs at Fargo-Moorhead and 15,800 cfs at Emerson. Channel widths range from 200 to 500 feet. When the river is running bankfull, it is 10-30 feet deep. The slope of the main stem of the Red River averages about 0.5 foot per mile, varying from approximately 1.3 feet per mile in the vicinity of Wahpeton to 0.2 foot per mile near the Manitoba border (Miller and Frink 1984).
Flooding on the Red River at Grand Forks in 1997 (photo courtesy of USGS)
Red River From Emerson to Lake Winnipeg and Lake Winnipeg Although the Red River continues into Canada where the bankfull conditions and channel characteristics increase in size, the analysis performed for chapter four, flooding and erosion section, showed no effect on the Red River at Emerson, Manitoba. Thus, this portion of the river was considered to be outside the area of potential effects.
3 - 11

Red River Valley Water Supply Project FEIS Chapter Three Affected Environment
Missouri River System Water Quantity
Introduction What is the current water quantity storage capacity in the Missouri River system, the
existing condition of reservoirs and the GDU Principal Supply Works, and what are the current water depletions from the system?
The Missouri River extends 2,619 miles from its source at Hell Roaring Creek in Montana to its confluence with the Mississippi River in the state of Missouri. The Missouri River is the longest river in the United States, draining one-sixth of the country. It is the main river in the Missouri River Drainage Basin. The Corps operates six dams and reservoirs on the Missouri River that are located in Montana, North Dakota, South Dakota, and Nebraska (figure 3.7). This system of dams and reservoirs has a capacity to store 73.4 MAF of water, which makes it the largest reservoir system in North America (as). The Corps operates the system to serve congressionally authorized project purposes of flood control, navigation, irrigation, hydropower, water supply, water quality, recreation, and fish and wildlife.
Figure 3.7 – Missouri River Drainage Basin and U.S. Army Corps of Engineers’ System Dams.
3 - 12

Red River Valley Water Supply Project FEIS Chapter Three Affected Environment
Figure 3.8 - Map of the Storage Capacity of Corps of Engineers Reservoirs in the U.S. Showing the Missouri River Reservoirs as the Largest in North America.
Flows in the Missouri River from Fort Peck Dam to Lake Sakakawea average about 10,000 cfs but vary over the year. Winter releases are 10,000 to 13,000 cfs when water supply is near normal and 7,000 to 8,000 cfs during drought years.
Flows in the Missouri River between Garrison Dam and Lake Oahe depend on Garrison Dam releases. The average annual discharge from
Missouri River at Bismarck, North Dakota – Average Flow is 22,500 cfs
3 - 13

Red River Valley Water Supply Project FEIS Chapter Three Affected Environment
Garrison Dam for the period of 1968–2001 was 22,500 cfs. The discharge varies during the year depending on a number of factors. Winter flows average 18,000 to 22,000 cfs in December and increase to 22,000 to 30,000 cfs in January and February to accommodate peak power demands. In the spring and the fall releases during non-drought years are 20,000 to 30,000 cfs and in drought years average 10,000 to 15,000 cfs. Summer releases average 19,000 to 26,000 cfs when water supply is near normal and 10,000 to 15,000 cfs during periods of drought.
Methods The Corps ran a base simulation of the current water control plan for the Missouri River for the Project to quantify existing conditions (2002) on the Missouri River. This simulation was completed using the revised present-level Missouri River depletions (2002) shown in table 3.2. These depletions were greater than those used in the Daily Routing Model for the Master Manual EIS. The difference reflects the water use changes that have occurred in the basin since the previous depletion analysis was completed in 1987. The effects of these differences on the Corps’ modeling effort are explained in the Corps (2007) report Red River Valley Water Supply Project Analysis of Missouri River Effect, starting on page 5, which is appended to this EIS as a supporting document.
Table 3.2 – Average Annual Missouri River Depletions by Reach (updated to 2002).
Missouri River Reaches Average Annual Present-Level
Depletions (thousands of ac-ft)
Above Ft. Peck 2,505.940 Ft. Peck to Garrison 4,114.815 Garrison to Oahe 341.936 Oahe to Big Bend 16.869 Big Bend to Ft. Randall 78.759 Ft. Randall to Gavins Point 1,063.121 Gavins Point to Sioux City 362.758 Sioux City to Omaha 399.421 Omaha to Nebraska City 11,063.631 Nebraska City to St. Joseph 249.016 St. Joseph to Kansas City 1,396.911 Kansas City to Boonville 408.066 Booneville to Hermann 190.224 Total 22,191.467
A summary of the current (2002) resource conditions on the Missouri River in response to existing depletions is shown in tables 3.3 and 3.4. Each resource has a different metric to quantitatively describe current conditions. The metric is based on an average annual value computed for each resource that is discussed in the various resource sections in this chapter. These metrics are described in the Corps (2007) report, Red River Valley Water Supply Project, Analysis of Missouri River Effects.
Existing Conditions Two of the Corps’ reservoirs could be directly affected by the Project, Lake Sakakawea, and Lake Oahe, as well as the GDU Principal Supply Works (figure 3.9). Recent persistent drought has affected the Missouri River Basin for the past 7 years. Below-normal snow accumulation and sparse precipitation have lowered reservoirs to record levels and reduced flows in the basin. Even though drought conservation measures through reduced navigation and winter releases have been implemented, record low storage levels have been recorded in either 2005 or 2006 for Fort Peck Lake, Lake Sakakawea, and Lake Oahe.
3 - 14

Red River Valley Water Supply Project FEIS Chapter Three Affected Environment
Table 3.3 – Current Missouri River Conditions Average Annual Benefits During Drought (1930-1941).
Use/Resource (indicator) Resource Average Annual Value
Reservoir/Dam Upper River
Lower River
Flood Control ($ millions) 167.11 0 64.51 102.61Navigation ($ millions) 1.66 NA NA NANavigation Season Length (months) 6.27 NA NA NAHydropower Benefits ($ millions)
557.72
Fort Peck Garrison
Oahe Big Bend
Fort Randall Gavins Point
49.8 104.3 158.2 109.0 99.9 36.4 NA NA
Hydropower Revenues ($ millions) -66.25 NA NA NAHydropower plus Mainstem Thermal Capacity at Risk (megawatts) 363 NA NA NAHydropower plus Mainstem Thermal Energy at Risk (gigawatt-hours) 148 NA NA NAWater Supply ($ millions) 565.3 16.3 95.4 453.6Recreation ($ millions)
72.5Upper 3 Lower 3
20.9 27.9 4.5 19.3
Reservoir Coldwater Fish Habitat (million ac-ft)
4.6
Fort Peck Lake Lake Sakakawea
Lake Oahe
1.66 0.70 2.25 NA NA
Riverine Coldwater Fish Habitat (miles) 149.7
Fort Peck Garrison
115.81 33.85 NA NA
Riverine Warmwater Fish Habitat (miles)
73.1
Fort Peck Garrison
Fort Randall
49.50 6.76
16.82 NA NAReservoir Young Fish Production (index)
1.45
Fort Peck Lake Lake Sakakawea
Lake Oahe Lake Sharpe
Lake Francis Case Lewis & Clark Lake
0.24 0.38 0.24 0.23 0.16 0.22 NA NA
Native River Fish Physical Habitat (index) 81.2 NA 25.46 55.76Riverine Tern and Plover Habitat (acres)
424.2
Fort Peck Garrison
Fort Randall Gavins Point
108.5 285.4 14.7 15.6 NA NA
Wetland Habitat (1000 acres) 110.9 Deltas 34.63 39.24 37.00Riparian Habitat (1000 acres) 144.1 Deltas 14.25 39.09 90.81Historic Properties (index)
6,856
Fort Peck Lake Lake Sakakawea
Lake Oahe Lake Sharpe
192 3,638 2,823
204 NA NA
Lake Sakakawea Garrison Dam is located about 75 river miles northwest of Bismarck, North Dakota, and impounds Lake Sakakawea, which is the largest Corps reservoir on the Missouri River or in the continental United States (figure 3.7). The reservoir is 178 miles long and up to 6 miles wide (figure 3.9) and contains almost one-third of the total storage capacity of the Missouri River mainstem system, nearly 24 MAF (Corps 2004b).
3 - 15

Red River Valley Water Supply Project FEIS Chapter Three Affected Environment
Table 3.4 – Current Missouri River Conditions Average Annual Benefits for the 1930-2002 Period.
Use/Resource Resource Average Annual Value
Reservoir/Dam Upper River
Lower River
Flood Control ($ millions) 425.68 -0.70 91.71 334.67Navigation ($ millions) 8.14 NA NA NANavigation Season Length (months) NA NA NA NAHydropower Benefits ($ millions)
659.5
Fort Peck Garrison
Oahe Big Bend
Fort Randall Gavins Point
63.8 138.6 194.4 113.0 110.0 39.6 NA NA
Hydropower Revenues ($ millions) 86.49 NA NA NAHydropower and Mainstem Thermal Capacity at Risk (megawatts) NA NA NA NAHydropower and Mainstem Thermal Energy at Risk (gigawatt-hours) NA NA NA NAWater Supply ($ millions) 613.0 20.6 96 496.5Recreation ($ millions)
87.9Upper 3 Lower 3
34.8 28.8 4.5 19.7
Reservoir Coldwater Fish Habitat (million ac-ft)
9.85
Fort Peck Lake Lake Sakakawea
Lake Oahe
3.63 2.7
3.52
NA NARiverine Coldwater Fish Habitat (miles)
184.3Fort Peck Garrison
139.39 44.88 NA NA
Riverine Warmwater Fish Habitat (miles)
50.9
Fort Peck Garrison
Fort Randall
31.67 6.1
13.12 NA NAReservoir Young Fish Production (index)
2.11
Lake Sharpe Lake Francis Case Lewis & Clark Lake
0.27 0.24 0.19 NA NA
Native River Fish Physical Habitat (index) 81.2 NA 25.12 56.04Riverine Tern and Plover Habitat (acres)
357.9
Fort Peck Garrison
Fort Randall Gavins Point
58 219.3 39.6 41.0 NA NA
Wetland Habitat (1,000 acres) 149.0 Deltas 33.31 44.81 70.89Riparian Habitat (1,000 acres) 117.3 Deltas 13.06 44.05 60.15Historic Properties (index)
5042
Fort Peck Lake Lake Sakakawea
Lake Oahe Lake Sharpe
144 2676 2018
204 NA NANote: NA means not available or not applicable.
Lake Oahe Oahe Dam is located about 6 miles northwest of Pierre, South Dakota, and forms Lake Oahe, the second largest Corps reservoir (figure 3.7). The reservoir is 231 miles long when full, with just over 23 MAF of storage (Corps 2004b).
Missouri River System Withdrawals The Corps (2004a) identified approximately 1,600 water intakes on the Missouri River along lake and river reaches from Fort Peck Reservoir to St. Louis, including 302 intakes used by American Indian tribes. Intakes on the Missouri River are primarily for municipal, industrial, and individual water supplies, fossil and nuclear-fueled power plant cooling, and irrigation withdrawals. Ninety-four percent of the population served from the Missouri River is located downstream of Gavins Point Dam (figure 3.7) in Nebraska
3 - 16

Red River Valley Water Supply Project FEIS Chapter Three Affected Environment
and South Dakota, which is the furthest downstream dam. In addition, 73% of the generation by thermal power plants using the Missouri River is located below Gavins Point Dam.
On Lake Sakakawea there are 300 water supply intakes and intake facilities. On the Missouri River between Garrison Dam and the top of Lake Oahe, there are 123 water supply intakes On Lake Oahe there are 218 water supply intakes (Corps 2004a).
As part of the Corps’ depletion analysis for this Project, municipal intakes at greatest risk of losing water access during a 1930s-type drought were identified in response to comments on the DEIS and SDEIS. Questions were raised about whether there would be a difference among the alternatives regarding the loss of access on Garrison and Oahe Reservoirs. The Corps report found that one access would be lost under existing conditions during a 1930s-type drought (Corps 2007:25).
A number of Missouri River intakes that serve reservations are losing access to water under current conditions. Under authorities provided through the Reclamation States Drought Emergency Act and GDU Programs, Reclamation is working with the Standing Rock Sioux Tribe and Three Affiliated Tribes to address existing problems with intakes on the Missouri River. Reclamation is currently evaluating all contingency plans for the GDU tribal water systems that use the Missouri River as a water source. Contingency planning for the tribal Missouri River intakes is a high priority for Reclamation, given the Corps’ 2007 forecasted pool elevations in Lake Sakakawea and Lake Oahe. Reclamation will continue to work with the tribes to modify facilities necessary to adapt to drought conditions. Additional funding is needed to construct a long term, reliable intake for the Standing Rock rural water system; however, because this is an existing condition, the adverse effects of low water levels and sedimentation are already occurring without the Project.
Reclamation and the Corps have been investigating options to protect and preserve the tribal MR&I intakes. Currently intakes at Four Bears, White Shield, and Twin Buttes on the Fort Berthold Reservation are being lowered and extended into Lake Sakakawea to resolve these problems. The intake at Mandaree already has been extended into deeper water.
At the Standing Rock Sioux Reservation the Fort Yates intake faces sedimentation problems as long as Lake Oahe is below elevation 1580 msl. Dramatic changes in river flow causing excessive sediment movement could separate the intake from the river. Contingency plans are in place under the GDU program and Reclamation and the Tribe have used them to respond to an intake failure. The Wakpala intake is being relocated into the main channel of the Missouri River, with construction scheduled for 2007 and summer of 2008.
Supplemental appropriations provided through the U.S. Troop Readiness, Veterans’ Care, Katrina Recovery, and Iraq Accountability Appropriations Act, 2007, will be used to complete construction on the three intakes on the Fort Berthold Reservation during the 2007 construction season, and to construct the new Wakpala intake in the Standing Rock Reservation in 2007 and 2008. Supplemental appropriations have also been made available for Reclamation to assist with drought mitigation activities on the Missouri River, as may be requested by the State of North Dakota, the Standing Rock Sioux Tribe, and the Three Affiliated Tribes.
3 - 17

Red River Valley Water Supply Project FEIS Chapter Three Affected Environment
Current Missouri River Depletions Reclamation updated Missouri River monthly depletions from Missouri River reaches for the period of record, 1929-2002, in a report titled, A Study to Determine the History and Present-Level Streamflow Depletions in the Missouri River Basin for the Period 1929 to 2002 (Reclamation 2005b). Reclamation applied these depletions to the historic natural flow record to determine present-level depleted streamflows. Table 3.2 shows average annual present-level depletions (at a 2002 level of Missouri River Basin development) for the period of record (1929-2002) for each reach of the Missouri River.
.
Some of the 22.191 MAF depletions from of the Missouri River listed in table 3.2 do not reach the customer. Comments on the DEIS suggested that the water systems in the Red River Valley need to increase water conservation. However, most of the major cities in the Red River Valley already have unaccounted-for-losses less than 10% even before consideration of the water conservation measures incorporated into the Project. This contrasts to other cities in the Missouri River Basin1
In addition, some depletion of the Missouri River system can be attributed to natural causes, such as evaporation. The Corps (2004b) estimates the total average annual water loss due to evaporation on all Missouri River Reservoirs at 3,055,000 ac-ft. The average annual water loss due to evaporation on Lake Sakakawea is 903,000 ac-ft while the loss in Lake Oahe is 932,000 ac-ft. The average evaporation from each mainstem system reservoir amounts to 3 feet annually (Corps 2004b).
GDU Principal Supply Works The GDU Principal Supply Works includes Snake Creek Pumping Plant, Audubon Lake, McClusky Canal, Chain of Lakes, and the New Rockford Canal (figure 3.9). The GDU was authorized in 1965 and construction began in 1967. The GDU project was designed to divert Missouri River water to central and eastern North Dakota for irrigation, municipal and industrial water supply, fish and wildlife conservation and development, recreation, flood control, and other project purposes.
Located in north-central North Dakota, Audubon Lake, originally known as Snake Creek Reservoir, was created when the Corps constructed the Snake Creek Embankment in 1953. The embankment dividing Lake Sakakawea from Audubon Lake provides a crossing for U.S. Highway 83, the Canadian Pacific Rail System (Soo Line) and utilities. The embankment also provides a means for managing water levels in Audubon Lake for recreation, fish and wildlife resources, and diversion of Missouri River water via the McClusky Canal. At the time of construction, a gated control structure was incorporated into the embankment to allow water
1 For instance, the Kansas City Star in a June 29, 2003, article reported that in Kansas City, Missouri, the most recent year of data had unaccounted-for-losses in their distribution system totaling 30% or approximately 12 billion gallons annually. Of the 12 billion gallons, about 10 billion gallons (30,000 ac-ft) annually were directly related to water distribution leaks. The worst year shortage of water for the whole Red River Valley service area was 55,000 ac-ft.
3 - 18
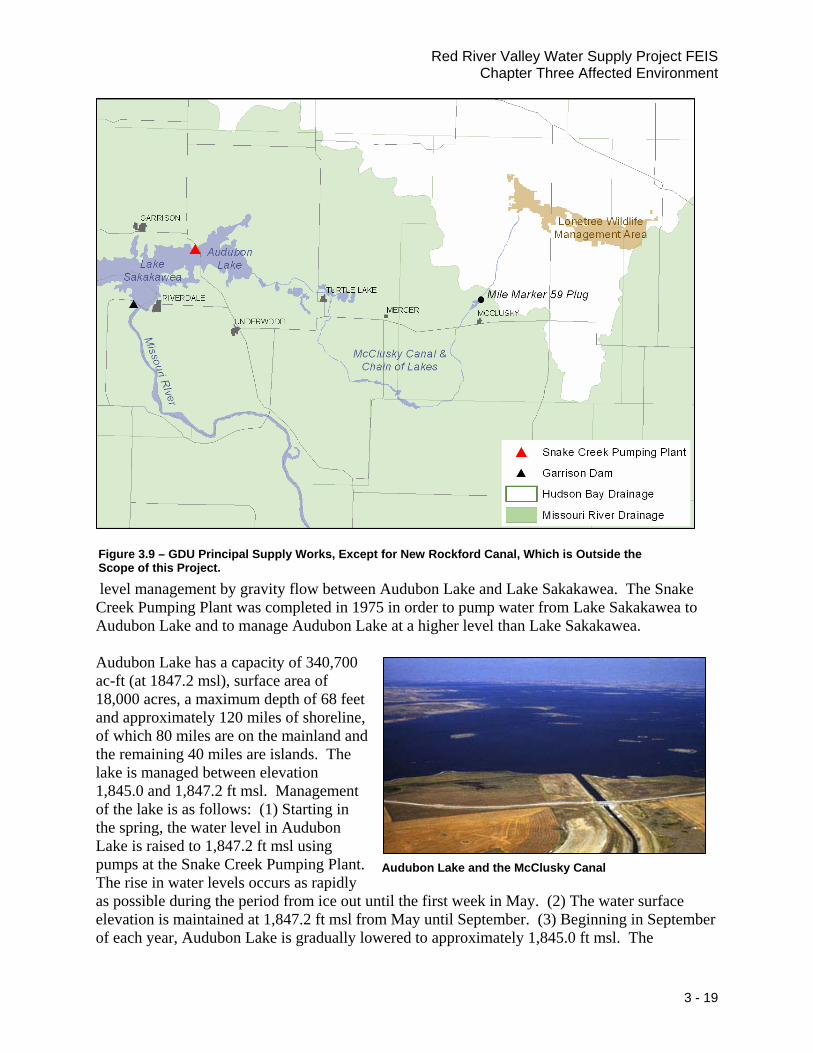
Red River Valley Water Supply Project FEIS Chapter Three Affected Environment
Figure 3.9 – GDU Principal Supply Works, Except for New Rockford Canal, Which is Outside the Scope of this Project.
level management by gravity flow between Audubon Lake and Lake Sakakawea. The Snake Creek Pumping Plant was completed in 1975 in order to pump water from Lake Sakakawea to Audubon Lake and to manage Audubon Lake at a higher level than Lake Sakakawea. Audubon Lake has a capacity of 340,700 ac-ft (at 1847.2 msl), surface area of 18,000 acres, a maximum depth of 68 feet and approximately 120 miles of shoreline, of which 80 miles are on the mainland and the remaining 40 miles are islands. The lake is managed between elevation 1,845.0 and 1,847.2 ft msl. Management of the lake is as follows: (1) Starting in the spring, the water level in Audubon Lake is raised to 1,847.2 ft msl using pumps at the Snake Creek Pumping Plant. The rise in water levels occurs as rapidly as possible during the period from ice out until the first week in May. (2) The water surface elevation is maintained at 1,847.2 ft msl from May until September. (3) Beginning in September of each year, Audubon Lake is gradually lowered to approximately 1,845.0 ft msl. The
Audubon Lake and the McClusky Canal
3 - 19

Red River Valley Water Supply Project FEIS Chapter Three Affected Environment
drawdown is completed prior to freeze-up to minimize negative impacts to fish and wildlife and to maximize potential for removing silt from walleye spawning areas. In November and early December 2006, Lake Audubon was drawn down by the Corps an additional 2 feet to elevation 1,843.0 ft msl to limit the water surface level difference between it and Lake Sakakawea to 36.5 feet as a safety measure for the Snake Creek Embankment.
McClusky Canal is approximately 74 miles long, has a partial to full clay lining in selected areas, a bottom width of 25 feet, an original design operating water depth of 17 feet and an original design capacity of 1,950 cfs with an elevation of 1,850 ft msl on Audubon Lake. Audubon Lake is currently operated at 1,847.2 ft msl which reduces the maximum capacity down the McClusky Canal to 1,350 cfs.
The first 59 miles of the canal in the Missouri River Basin are supplied with water through the canal head-works from Audubon Lake (figure 3.9). The goals of water operations on the canal are: (1) maintain target water elevations within different reaches of the canal, (2) maintain acceptable TDS levels, and (3) meet requests for water use.
McClusky Canal Near Hoffer Lake
The Painted Woods Outlet at mile 36 is the primary outlet used to manage water levels in the canal. Water is released down this outlet when inflows from spring snow melt and runoff exceed the target water elevations and to improve water quality. There are two plugs (earthen barriers) at mile 58 and 59 on the McClusky Canal that prevent the flow of Missouri River water to the last 16 miles of the canal, which are not in operation.
The Chain of Lakes area was formed by construction of the McClusky Canal. It includes these lakes: West Park, East Park, Hecker's, New John's, South McClusky, and North McClusky. Another canal lake, Hoffer Lake, is located just south of the mile 59 plug. The canal also provides water to three lakes adjacent to the canal (Brekken, Holmes, and Lightening) to maintain water levels, manage TDS, and support fisheries. Water is supplied to six Wildlife Development Areas totaling nearly 9,000 acres and to Lake Williams to benefit the federally listed threatened piping plover. In addition to these water quality, fisheries, and wildlife benefits, the canal provides a wide variety of recreational opportunities, livestock watering, and irrigation of approximately 390 acres.
3 - 20

Red River Valley Water Supply Project FEIS Chapter Three Affected Environment
Surface Water Quality
Introduction What is the existing water quality of the
Sheyenne and Red Rivers, Lake Winnipeg, Missouri River System, and GDU Principal Supply Works?
In general, the waters of the Sheyenne, Red, and Missouri Rivers are suitable for most designated uses. At most locations, exceedances of water quality standards are fairly rare, and when they occur, are often naturally caused.
The water quality within lakes, reservoirs, streams and rivers is determined largely by interaction of water with the landscape and human activities. Water moving across and through the landscape is exposed to different minerals within the soils and rocks of distinctly different geomorphic regions, as well as different living and dead plant and animal material within different ecoregions. Human activities that alter the land surface (e.g., conversion to agriculture) or that consume and use water (e.g., for the assimilation of waste from a town) further modify water quality. It is typical to find differences in surface water quality across a large region like the Red River Basin.
Sheyenne River in Valley City, North Dakota
Several local, state, provincial, and federal agencies are responsible for evaluating, describing, and ensuring that the quality of surface waters is sufficient to meet the beneficial uses of society. North Dakota Department of Health, Minnesota Pollution Control Agency, and Province of Manitoba (Water Quality Management Section) generally monitor and assess the condition of surface waters within their borders. Some oversight of state programs is provided by the EPA in the United States. The USGS is also an active participant in assessing water quality within the Red River Basin.
Methods The methodology used for describing the existing surface water conditions are derived from existing regulatory agency evaluations and techniques. Surface waters within North Dakota and Minnesota are categorized according to their anticipated and desired beneficial uses. Beneficial use designations consider the use and value of water for public water supplies, protection and propagation of aquatic life, recreation, agriculture, industry, and other purposes. There may be more than one use designation assigned to a water body.
Not all surface waters can be used for their intended purpose, usually because of poorer than expected water quality, some physical modification of the habitat, or a biological problem. The stressors within the Red River Basin which cause use impairment are most often associated with
3 - 21

Red River Valley Water Supply Project FEIS Chapter Three Affected Environment
the following: ammonia concentrations, materials that consume oxygen (e.g., biochemical oxygen demand), dissolved solids, sedimentation, suspended solids (turbidity), bacteria from mammals, and trace metals like mercury. Ammonia (particularly in the unionized state) is toxic to many aquatic organisms. Dissolved oxygen, a necessity for healthy aquatic plants and animals, declines when there is too much oxygen-consuming material. The oxygen-consuming material comes from both indirect sources like runoff from the land surface (i.e., non-point) and direct sources like pipes conveying storm water runoff and wastewater to the river (i.e., point sources). Excessive sediment load decreases light penetration, and settling of sediments alters aquatic substrates. Excessive bacteria from mammalian waste present a threat to human health under the recreation beneficial use. Mercury contamination of fish is a hazard for human consumption.
There are three types of standards used to establish a regulatory limit that support a designated use in North Dakota. These are: 1) numeric, 2) narrative, and 3) antidegradation.
A numeric standard is the allowable concentration of a specific pollutant in a water body. It represents a “safe” concentration for a particular contaminant intended to protect the designated beneficial uses of a Class I, IA, II, or III stream.
Narrative standards describe desired aesthetic and general pollution-free goals for waters of the state.
The antidegradation standard pertains to waters that currently have water quality better than the applicable numeric standards. The antidegradation standard generally requires that these water bodies should be maintained at that existing high quality and not be allowed to degrade to the level of applicable numeric standards.
The North Dakota Antidegradation Policy governs federally permitted actions under sections 401, 402, and 404 of the CWA, Appendix IV of NDCC 33-16-02. It has a 15% or greater threshold of detrimental change in a water quality analyte.
Secondary Drinking Water Standards are primarily for taste and aesthetics; although some could also be health concerns for certain people. For example, the secondary standard of 250 mg/L is due to the laxative effects of high sulfate water.
IJC Objectives are water quality objectives set at the U.S.-Canadian border and may differ from regulatory standards.
North Dakota Numeric Standards are water quality standards set by North Dakota Administrative Code 33-16-02.1, Appendix IV.
Minnesota Numeric Standards are water quality standards set by Minnesota Rules, Chapter 7050.
In North Dakota and Minnesota, lakes and portions of stream reaches are evaluated according to the “degree” that each beneficial use (e.g., water supply, aquatic life, etc.) is achieved. This is done by placing them in one of three categories: 1) fully supporting, 2) fully supporting but threatened (termed “partially supporting” in Minnesota), or 3) not supporting. Generally, a water body is considered “threatened” or “partially supporting” if water quality and/or watershed trends are expected to continue to degrade the current condition into the future. A threatened use typically means that during a small proportion of time monitoring data shows the numeric water quality standard is exceeded. Not supporting typically means the frequency and severity of the problem is greater than threatened and a documented problem exists (e.g., observed fish kill means not supporting aquatic life).
3 - 22

Red River Valley Water Supply Project FEIS Chapter Three Affected Environment
The determination of whether a surface water body meets its intended uses is often based upon whether a numeric water quality standard is exceeded. A numeric water quality standard is a number that represents the maximum (or minimum in the case of dissolved oxygen) allowable concentration in a surface water. Numeric standards sometimes differ between Minnesota and North Dakota for the same parameter (see Houston Engineering, Inc. 2005, Appendix C). Within the Red River Basin in North Dakota and Minnesota, the percentage of samples collected that have exceeded the numeric water quality standard for some of the more common parameters is less than:
• 3% of the sulfate samples (general indicator of drinking water quality);
• 12% of the fecal coliform bacteria samples collected during the recreation season (indicator of contamination by warm blooded animals);
Water Quality Measurements µg/L is micrograms per liter, which roughly translates to parts per billion.
mg/L is milligrams per liter or roughly parts per million.
µS/cm is a measure of electrical conductivity in microsiemens per centimeter, which is related to the number and type of ions in the water.
• 15% of the TDS samples (general indicator of quality) were based only on Minnesota samples as North Dakota has no TDS standard; and
• 4% of the dissolved oxygen samples (indicator of aquatic biology health).
No water quality standard exists for phosphorus. However, Minnesota recognizes a “recommended maximum level.” The total phosphorus concentration exceeds the recommended levels more than 50% of the time in the Red River.
Water quality protection within the Province of Manitoba differs from that in the U.S. Water quality protection measures are implemented in tiers (Manitoba Water Stewardship 2002). Tier I standards essentially consist of minimum treatment requirements for various types of dischargers. Effluent quality standards are established by the type of discharger. Tier II consists of water quality objectives defined for a limited number of common pollutants routinely controlled through licensing under the Manitoba Environment Act. The objectives established under Tier II form the basis for a water quality approach, similar to the numeric standards established within the U.S. One primary difference is that the objectives are non-binding; i.e., not enforceable through regulation unless incorporated into provincial legislation. The objectives are in part based upon the criteria established by the EPA.
Most waters within Manitoba are afforded a routine level of protection. Under Tier II, waters are categorized according to the desired level of protection: i.e., routine protection of uses, high quality waters, or exceptional value waters. The routine level of protection ensures that all pollutants are reduced or eliminated through the use of standard treatment technologies commonly available to each type of discharger. Additional protection may be afforded based upon the Tier II water quality objectives. This level is intended to provide reasonable protection from unacceptable impacts to all but a small percentage of aquatic species for most of the time.
3 - 23

Red River Valley Water Supply Project FEIS Chapter Three Affected Environment
Tier III water quality guidelines include three types of general guidance. The first guidance type established by Tier III includes numeric standards for a large number of parameters derived by the Canadian Council of Ministers of the Environment for general application across Canada. These standards are intended to be used as a benchmark for trend analysis and interpreting water quality data. The Canadian Council of Ministers of the Environment guidelines pertain to water bodies, lake and river bottom sediments, and residues in fish or the tissue of other aquatic life.
Water Quality Sampling
The second guidance type within Tier III is the tissue residue guidelines derived by Health Canada to protect human consumers of fish or the tissue of other aquatic organisms. This information is intended to be used to assess whether specific uses are being achieved. The third guidance type within Tier III is narrative water quality guidelines. The narrative water quality guidelines establish minimum conditions at all times. They are intended to reasonably ensure that surface and groundwater are free of constituents attributable to sewage, industrial, agricultural and other land-use practices or other man-induced point and non-point sources that impair water quality.
The USGS, in cooperation with Reclamation, evaluated the existing water quality of streams in the U.S. portion in the Red River Basin (Tornes 2005). Data collected between 1970 and 2001 were retrieved from NWISWeb, a USGS internet-based data server. The following discussion is a summary of the report results.
Existing Conditions
Lake Ashtabula Except for nutrients, concentrations of most constituents in Lake Ashtabula are similar to those in the Sheyenne River upstream of the reservoir. Lake Ashtabula acts as a nutrient and sediment trap causing eutrophication that is manifested in excessive growth of algae and submerged vascular plants. As a result, Lake Ashtabula is classified as not supporting the recreation designated use (North Dakota Department of Health 2004).
Sheyenne River The physical and chemical data for the Sheyenne River indicate the water is suitable for most currently designated uses. The values for pH rarely exceed the criterion of 9.0 standard units established by the EPA (2005b) for the protection of aquatic life and generally were less than 8.0 standard units.
The water chemistry of the river is relatively constant. The water contains a mixture of calcium, sodium, bicarbonate, and sulfate ions. At many sites, the sulfate concentrations occasionally exceed the recommended drinking water standard of 250 mg/L.
3 - 24

Red River Valley Water Supply Project FEIS Chapter Three Affected Environment
Chromium, lead, mercury, nickel, and zinc are infrequently detected, and concentrations have decreased over time. This indicates better control of wastewater discharges and/or improved sample collection and processing techniques that reduced unintended sample contamination. Trace elements that are detected more commonly included arsenic, copper, and nickel. Arsenic concentrations have occasionally exceeded the 10-µg/L EPA drinking water standard that took effect in 2006. All constituent concentrations for the Sheyenne River below Baldhill Dam site were generally within established guidelines, standards, and criteria.
Several reaches of the free flowing portions of the Sheyenne River are classified as threatened (North Dakota Department of Health 2004). In all cases, the identified impairment is caused by sedimentation/siltation or total fecal coliform bacteria. Excessive sedimentation is caused by bank erosion or runoff from agricultural fields. The presence of fecal coliform bacteria is an indicator of the potential contamination of surface waters by warm-blooded animals, including contamination from domestic and livestock wastes.
Detailed statistics for select water quality analytes are listed in table 3.5. Two recent reports, Macek-Rowland and Dressler (2002) and Tornes (2005), have more complete analyses of virtually the same datasets of water quality analytes and other water quality indicators.
Table 3.5 – Select Water Quality Analytes for the Red and Sheyenne Rivers. TDS TDS Sulfate Chloride Na Tot-P
River/Gage Measured (mg/L)
Summed (mg/L)
mg/L as SO4
mg/L as Cl
mg/L as Na
mg/L as P
Sheyenne River Below Baldhill Dam Maximum 764.0 741.0 240.0 26.0 120.0 0.340
Minimum 196.0 0.0 48.0 4.7 20.0 0.050 Mean 458.1 136.6 123.7 14.0 64.6 0.184 95th
percentile 699.8 569.8 210.0 22.8 100.0 0.300
75th percentile 524.8 352.0 150.0 17.0 77.0 0.228
50th percentile (Median)
447.5 0.0 120.0 13.0 65.0 0.180
25th percentile 378.3 0.0 93.8 11.0 51.0 0.132
5th percentile 278.8 0.0 69.8 7.9 31.8 0.071
At West Fargo, North Dakota Maximum 820.0 823.0 310.0 57.0 95.0 na
Minimum 222.0 0.0 8.6 7.8 23.0 na Mean 489.7 87.6 138.7 27.1 58.2 na 95th
percentile 673.6 574.0 219.5 48.8 85.9 na
75th percentile 576.8 0.0 170.0 36.0 71.8 na
50th percentile (Median)
504.5 0.0 140.0 27.0 60.5 na
25th percentile 401.5 0.0 104.0 18.3 46.0 na
5th percentile 246.7 0.0 64.3 8.8 25.1 na
3 - 25

Red River Valley Water Supply Project FEIS Chapter Three Affected Environment
TDS TDS Sulfate Chloride Na Tot-P
River/Gage Measured (mg/L)
Summed (mg/L)
mg/L as SO4
mg/L as Cl
mg/L mg/L as Na as P
Red River At Wahpeton, North Dakota Maximum 601.0 563.0 230.0 22.0 33.0 na
Minimum 177.0 0.0 15.0 1.7 4.5 na Mean 305.7 52.7 68.8 10.5 13.3 na 95th
percentile 464.2 328.4 156.0 19.0 22.0 na
75th percentile 344.0 0.0 95.0 13.0 16.0 na
50th percentile (Median)
293.0 0.0 60.0 11.0 13.0 na
25th percentile 252.0 0.0 32.0 7.0 10.0 na
5th percentile 202.6 0.0 15.8 4.0 5.9 na
At Hickson, North Dakota1 Maximum 1180.0 1150.0 340.0 44.0 92.0 1.200
Minimum 168.0 0.0 5.4 1.0 6.8 0.031 Mean 358.0 140.1 79.1 11.1 16.4 0.194 95th
percentile 598.0 417.5 200.0 23.1 26.3 0.390
75th percentile 391.0 298.5 110.8 13.5 19.0 0.229
50th percentile (Median)
329.0 0.0 64.0 10.0 15.0 0.170
25th percentile 287.0 0.0 34.5 7.6 11.0 0.110
5th percentile 244.4 0.0 17.8 4.6 7.6 0.050
At Fargo, North Dakota Maximum 650.0 609.0 267.0 39.0 43.0 2.400
Minimum 134.0 0.0 13.0 0.0 5.2 0.010 Mean 329.1 90.3 74.3 7.1 15.4 0.174 95th
percentile 460.8 386.6 163.1 17.6 26.0 0.649
75th percentile 375.8 240.5 100.8 8.0 19.0 0.148
50th percentile (Median)
317.0 0.0 60.5 6.2 14.0 0.095
25th percentile 278.3 0.0 39.0 4.5 11.0 0.062
5th percentile 219.0 0.0 27.0 1.7 8.3 0.010
At Grand Forks, North Dakota Maximum 570.0 1890.0 200.0 34.0 43.0 0.490
Minimum 158.0 0.0 18.0 0.1 2.9 0.030 Mean 343.5 85.8 75.1 10.0 17.5 0.230 95th
percentile 460.1 381.8 130.0 19.0 30.0 0.490
75th percentile 385.8 214.0 96.0 12.0 20.2 0.325
50th percentile (Median)
336.5 0.0 70.0 9.1 17.0 0.216
3 - 26

Red River Valley Water Supply Project FEIS Chapter Three Affected Environment
TDS TDS Sulfate Chloride Na Tot-P
River/Gage Measured (mg/L)
Summed (mg/L)
mg/L as SO4
mg/L as Cl
mg/L mg/L as Na as P
25th percentile 303.0 0.0 51.6 6.9 13.0 0.135
5th percentile 234.9 0.0 34.0 3.9 8.6 0.030
At Emerson, Manitoba Maximum 1100.0 1060.0 230.0 240.0 190.0 0.880 Minimum 245.0 0.0 6.0 9.8 7.5 0.020
Mean 457.6 342.0 97.6 50.4 44.3 0.218 95th
percentile 729.8 683.4 160.0 147.5 110.0 0.447
75th percentile 503.8 459.8 120.0 61.8 50.0 0.295
50th percentile (Median)
438.0 380.5 93.5 34.5 34.0 0.190
25th percentile 373.5 263.3 69.3 24.3 28.0 0.130
5th percentile 287.5 0.0 44.5 12.3 14.2 0.060
Adapted from Macek-Rowland and Dressler (2002) Both measured and summed values for TDS are included to reflect the differences in values at Grand Forks. na - Either no data were available or insufficient to calculate these statistics. 0.0 - Values are assumed below reportable levels for the measurement technique. 1Hickson was the closest downstream site with ample water quality data to reflect water quality downstream of Wahpeton.
Red River In general, the reported values for water quality are generally weighted more heavily during times of normal to high flows in the river. While some of the data included in Tornes (2005) report includes periods of low flow, there is no comparable record of sustained low-flow events.
Red River at Wahpeton Tornes (2005) used October, 1971 to August, 2000 to show the Red River at Wahpeton has a median TDS concentration of 293 mg/L. A median pH value of 8.1, median sulfate of 60 mg/L, median sodium of 13 mg/L, and 11 mg/L for chloride.
Red River at Fargo Many constituent concentrations for the site below Fargo have exceeded water quality guidelines, standards, and criteria. The maximum sulfate concentration of 330 mg/L was greater than the 250 mg/L EPA (2005b) secondary drinking water standard. Other exceedances, including cadmium, copper, lead, and selenium concentrations, generally occurred during the 1970s or earlier. These exceedances could be attributed to natural occurrences, pollution, or to sample contamination.
Tornes (2005) used available data from July, 1969 to September, 1994 to arrive at median values for TDS, sulfate, chloride, and sodium below Fargo of 356, 69, 11, and 20 mg/L, respectively. A median value of 8.1 was also identified for pH.
Red River at Grand Forks The maximum sulfate concentration of 200 mg/L was less than the 250 mg/L EPA (2005b) secondary drinking water standard. While selenium was reported to exceed EPA drinking water standards, the last reported exceedance was in 1973. Tornes (2005) reported June, 1949 to September, 2000 median values for TDS, sulfate, chloride and sodium
3 - 27

Red River Valley Water Supply Project FEIS Chapter Three Affected Environment
3 - 28
below Fargo of 336, 70, 9.1, and 17 mg/L, respectively. A median value of 7.7 was also identified for pH.
Red River Upstream from Emerson in General The pH criterion of 9.0 standard units established by the EPA (2005b) and Environment Canada (2002) for the protection of aquatic life is rarely exceeded in the Red River. The EPA (1986) minimum dissolved oxygen criterion of 3.0 mg/L was not met during the 1970s when the concentration reached 0.6 mg/L at the Hickson site and 1.4 mg/L at the site below Fargo. On occasion during the same period, the concentration reached 3.0 mg/L as far downstream as Halstad. Since more stringent water quality standards were enacted, dissolved oxygen concentrations in the Red River have improved. However, during July 1993, the criterion was not met at the Halstad site when high flows apparently washed oxygen-demanding substances into the Red River.
Dissolved mercury has been detected at some sites in the Red River, but the source or cause of the mercury is uncertain. The largest concentration (11 µg/L) was measured at the Hickson site. Because no other trace elements or other indicators were evident, the concentrations probably were the result of sample collection, processing, handling, or analysis (Windom et al.1991).
The Red River is classified as not supporting fish consumption designated use due to high methyl-mercury concentrations in fish (North Dakota Department of Health 2004). The sources of methyl-mercury in fish are largely unknown. Several reaches of the Red River upstream of the confluence with the Sheyenne River are classified as threatened due to high fecal coliform bacteria (North Dakota Department of Health 2004).
Red River at Emerson The Red River at Emerson, Manitoba, site provides data on the quality of water that enters Canada. It integrates flow from all of the streams that drain the United States portion of the Red River Basin except for the Roseau River. The Roseau River joins the Red River north of Emerson and annually contributes an additional 10% to the amount of streamflow carried by the Red River at Emerson (Tornes 2005). The Red River at Emerson also assimilates all of the point and non-point inputs to the system in the United States, including industrial and wastewater discharges and agricultural runoff. Because the Red River at Emerson integrates water from many streams, the constituent concentrations at the Emerson site generally are less variable than those at upstream sites.
Overview of the Red River Looking North into Canada
The IJC (International Joint Commission) has established water quality objectives for the Red River at the international border. These objectives are the primary means by which the International Red River Board identifies major water quality issues. The IJC water quality objectives are identified below in table 3.6.

Red River Valley Water Supply Project FEIS Chapter Three Affected Environment
Table 3.6 – IJC Objectives at Emerson, Manitoba, Canada, on the Red River.
Number of Exceedances (Months) Parameter Objective* 1999 2000 2001 2002 Dissolved Oxygen 5 mg/L 0 1 (Jul) 0 0
TDS 500 mg/L
3 (Nov ’98, Dec ’99, Jan ’99)
1 (Apr) 2 (Dec) 1 (Jan)
Chloride 100 mg/L 0 0 0 0 Sulfate 250 mg/L 0 0 0 0 Bacteriological (fecal coliform bacteria) 200 colonies/100 ml 1 (Aug) 1 (Sep) 1 (Nov) 1 (Jul)
*The objectives are not regulatory standards but values jointly established by the U.S. and Canada.
The following discussion is summarized from Tornes (2005). The pH value at the Emerson site ranges from 7.2 to 8.9 standard units, with a median of 8.1 standard units. All values reported by Tornes (2005) were within the range of 6.5 to 9.0 standard units established by the EPA (2005b) and Environment Canada (2002) for the protection of aquatic life. Except for the late summer 1993 period when streamflow in the basin was unusually high, the dissolved oxygen concentration exceeds the EPA (1986) minimum dissolved oxygen criterion of 3.0 mg/L and the Environment Canada (2002) guideline of 5.5 mg/L.
The concentration of TDS at the Emerson site ranges from 245 to 1,100 mg/L, with a median concentration of 438 mg/L. These concentrations are relatively high and probably originate primarily from tributaries in the western part of the Red River Basin. Western tributaries generally have less precipitation and runoff than eastern tributaries, and the salts in the lakes and reservoirs become concentrated as a result of evaporation (Strobel and Haffield 1995). The dissolved solids concentrations in groundwater discharge from aquifers into streams in the western part of the basin also tend to be large (Strobel and Haffield 1995).
Nutrient concentrations for the Red River at Emerson are generally lower than for smaller streams that drain agricultural areas, possibly because of the integrating effect of the stream system at Emerson. Ammonia concentrations have decreased substantially since more stringent water quality standards were enacted in the 1970s. Thus, the aquatic habitat in the Red River has improved. Data collected at the Emerson site as part of the National Water Quality Assessment Program indicate the maximum ammonia concentration for that site during 1993-95 was 0.37 mg/L (Tornes et al. 1997).
Based upon the most recent monitoring information available from the IJC, exceedances of the water quality objectives occur infrequently at the
Overview of the Red River flowing at 380 cfs at Hendrum, Minnesota
3 - 29

Red River Valley Water Supply Project FEIS Chapter Three Affected Environment
Emerson, Manitoba, monitoring location. The chloride and sulfate objectives were not exceeded from 1999 through 2002. A dissolved oxygen concentration lower than the objective occurred once during July of 2000. The TDS objective has been exceeded each year, generally once or twice during the winter months. The bacteriological objective has been exceeded annually, generally during the summer months.
Red River from Emerson to Lake Winnipeg and Lake Winnipeg While Lake Winnipeg has several rivers that flow into it, only the Nelson River flows out of Lake Winnipeg and eventually discharges into Hudson Bay. According to the Bourne et al. (2002) the Red River contributes about 11% of the total inflow to Lake Winnipeg with the Winnipeg and Saskatchewan Rivers providing 45% and 26%, respectively. Direct precipitation contributes about 10.78% of the annual water budget for Lake Winnipeg.
Largely due to the geologic conditions and agricultural practices in the Red River Valley, the Red River is the second largest contributor of nitrogen and the largest source of phosphorus to Lake Winnipeg. The fertile soils of the southern Red River Valley are naturally abundant in phosphorus, but nitrogen is likely the result of human and livestock activity. There are 20 million livestock and 5.5 million people in the Canadian portion of the Lake Winnipeg drainage basin and about 2.6 million livestock and 1.1 million people in the United States portion of the Lake Winnipeg drainage basin (USDA census, 1997 cited on Lake Winnipeg Research Consortium website).
Missouri River System
Lake Sakakawea Water in Lake Sakakawea generally meets North Dakota water quality standards and is suitable for most designated uses including meeting drinking water standards with basic treatment. Algal blooms occur at times when the lake level is low. Decaying organic materials contribute to the biological oxygen demand and sometimes cause reduced dissolved oxygen levels in the deeper portions of the lake (Corps 2004a). Dissolved oxygen and arsenic concentrations at times exceed water quality standards. Reservoir levels have a significant influence on water quality, with higher concentrations of many constituents during droughts when water levels are low (Corps 2004a). Lake Sakakawea is classified as not supporting the fish consumption beneficial use due to high concentrations of methyl-mercury in fish tissue (North Dakota Department of Health 2004). The source of the methyl-mercury is unknown. Additionally, the lake is classified as threatened for the fish and other aquatic biota designated use due to low dissolved oxygen and temperatures too high for the coldwater fishery (North Dakota Department of Health 2004).
Water in Lake Sakakawea Generally Meets North Dakota Water Quality Standards
3 - 30

Red River Valley Water Supply Project FEIS Chapter Three Affected Environment
Missouri River between Garrison Dam and Lake Oahe The Missouri River reach from Garrison Dam to Bismarck is dominated by releases of cold, clear water from Lake Sakakawea. The water quality is suitable for most designated uses, including meeting drinking water standards with basic treatment. TDS (estimated from specific conductance) average about 430 mg/L (see Houston Engineering, Inc. 2005, Appendix C). Concentrations of nitrogen and phosphorus are low (see Houston Engineering, Inc. 2005, Appendix C).
Water quality in Lake Oahe generally meets standards in North Dakota and South Dakota. Constituents of concern in Lake Oahe include arsenic, dissolved oxygen, pH, iron, lead, manganese, and copper (Corps 2004a). At times, dissolved oxygen is depleted during the summer in the deeper portions of the lake, particularly at low water levels (Corps 2004a).
Audubon Lake and Garrison Diversion Unit Principal Supply Works The water chemistry in Audubon Lake is similar to Lake Sakakawea, but concentrations of most constituents are higher. Most of the water in Audubon Lake is supplied from Lake Sakakawea by the Snake Creek Pumping Plant, with relatively little runoff from the contributing drainage. Thus, higher concentrations in Audubon Lake result from evaporation of the water supplied to the lake.
Reclamation operates a freshening program to maintain water quality in Audubon Lake and the McClusky Canal. Up to 100 cfs is released down the McClusky Canal during the open water season and replaced with water from Lake Sakakawea as needed to maintain the target elevation of 1,847.2 ft msl. Additionally, the lake is lowered 2 feet each fall by releasing water to Lake Sakakawea through a conduit in the Snake Creek Embankment. Audubon Lake is then refilled in
the spring with fresher water from Lake Sakakawea. The water released to the canal flows through the Chain of Lakes area and is discharged through the Painted Woods Outlet to Painted Woods Creek Wildlife Development Area and ultimately back to the Missouri River.
Painted Woods Outlet
Analysis by Houston Engineering, Inc. (2005) shows concentrations for most constituents increase downstream from Audubon Lake to the end of the McClusky Canal. The median TDS concentration is 583 mg/L near the entrance to the McClusky Canal (in Audubon Lake) and exceeds 1,100 mg/L near the end of the Canal. The median sulfate concentration is 263 mg/L near the entrance to the McClusky Canal (in Audubon Lake) and exceeds 500 mg/L near the end of the canal. Current flow rates in the canal tend to be low (i.e., less than 100 cfs), which explains the higher concentrations near the lower end of the canal. In particular, there is essentially no flow in the McClusky Canal downstream of New Johns Lake. The efforts of Ryberg (2006a) used a hierarchical agglomerative cluster analysis of existing water quality samples to group existing water quality data from different locations into clusters of similar water quality.
3 - 31

Red River Valley Water Supply Project FEIS Chapter Three Affected Environment
Groundwater Quantity and Quality
Introduction What are the existing conditions of the quantity and quality of groundwater in the
aquifers that could be affected by the Project alternatives?
Water can often be found below the surface of the earth. If water collects and can be retrieved from natural open areas in beds of gravel, sand, silt or clay, and bedrock fractures using a well, this formation can be considered an aquifer. Many of the major aquifers in the Red River Valley were formed from glacial drainage channels and outwash; deltas and beach deposits associated with former Lake Agassiz; and sand and gravel bodies imbedded with till (Krenz and Leitch 1993).
Aquifers in the Red River Valley can be classified as either surficial or buried. Surficial aquifers are commonly unconfined. This means they are in contact with the land surface and provide relatively direct infiltration of precipitation to the water table. These surficial aquifers tend to be susceptible to the effects of land-surface activities, such as the application of agricultural chemicals. They also tend to be hydraulically connected to surface water, such as streams, lakes, and wetlands. Conversely, a buried or confined aquifer is often surrounded by less permeable silt and clays giving rise to the possibility of the aquifer containing water under artesian pressure. Some aquifers in the Red River Valley grade from unconfined to confined across the aquifer and possess attributes of both, depending on the local geology.
Aquifers in figure 3.10 are those potentially affected by one or more features in the Red River Valley Water Supply Project. The Brightwood, Milnor Channel, Gwinner, and Spiritwood Aquifers in North Dakota would be affected if withdrawals are increased. Within Minnesota, the Otter Tail Surficial, Pelican River Sand-Plain, and Buffalo Aquifers also would be affected by increased withdrawals.
ASR would affect the West Fargo North and West Fargo South aquifers in North Dakota and the Moorhead Aquifer in Minnesota. Change in existing use would affect the Horace and Wahpeton Buried Valley Aquifers in North Dakota, while indirect affects could be experienced by the Hankinson and Sheyenne Delta aquifers. Figure 3.10 – Potentially Affected Aquifers.
3 - 32

Red River Valley Water Supply Project FEIS Chapter Three Affected Environment
3 - 33
Figure 3.11 – Groundwater Appropriations and Historic Use from Select Aquifers in North Dakota.
North
est F
argo S
outh
1
10
100
1000
10000
100000
Brightw
ood
Gwinner
Hankin
son
Horace
Milnor
Chann
el
Sheye
nne
Spiritw
ood (
SE)
Wahpe
ton Buri
ed V
alley
West F
argo
W
acre
-ft
gation Average
ral Average
Municipal Appropriated Municipal Average Irrigation Appropriated Irri
Industrial Appropriated Industrial Average Rural Appropriated Ru
Brightwood Aquifer The Brightwood Aquifer is a thick deposit of glacial outwash that lies mostly south and west of the Milnor Channel and Hankinson Aquifers. The thickness of the outwash deposits ranges from 70 to 130 feet, and averages about 100 feet. The aquifer’s surface area is approximately 13 square miles (Baker and Paulson 1967). However, the estimated aquifer area appears to have been ascertained by measuring surface features, not through extensive test drilling.
Methods thods Information in this section was compiled from a literature search and represents the best available data. The following descriptions of the North Dakota aquifers are largely taken from the County Ground Water Studies series of reports available online from the North Dakota State Water Commission at http://www.swc.state.nd.us/index.html
Information in this section was compiled from a literature search and represents the best available data. The following descriptions of the North Dakota aquifers are largely taken from the County Ground Water Studies series of reports available online from the North Dakota State Water Commission at http://www.swc.state.nd.us/index.html. Minnesota groundwater data were collected from USGS and Minnesota Geological Survey reports.
Existing Conditions
North Dakota Aquifers The water quantity and quality of North Dakota aquifers proposed for project use are described in this section. Water quality parameters of the North Dakota aquifers are listed in table 3.7. The table contains data averaged from all chemical analyses and does not represent a statistical sampling of the water in the respective aquifers. Some areas of each aquifer may be over or under represented, but this is the best available information.
The aquifers of interest on the North Dakota side of the Red River Valley have a wide range of development. As shown in figure 3.11, the range of permitted groundwater withdrawals is at a low or zero for the Brightwood Aquifer and exceeds 15,000 ac-ft for the Sheyenne Delta Aquifer. North Dakota requires permits for withdrawals above 12.5 ac-ft per year. Figure 3.11 displays values for both permitted (appropriated) amounts and the historic average use of that permitted volume. It does not display water withdrawn for domestic wells or for livestock.

Red River Valley Water Supply Project FEIS Chapter Three Affected Environment
3 - 34
Table 3.7 – Water Quality of Selected Aquifers in the Red River Valley in North Dakota (Reclamation 2005a).
Aquifer
Water Level Below
Surface (ft)
Conductivity µS pH
Ca mg/L
Mg mg/L
K mg/L
Na mg/L
F mg/L
HCO3 mg/L
SO4 mg/L
Cl mg/L
NO3 mg/L
Fe mg/L
Mn mg/L
TDS mg/L
Hardness mg/L as CaCO3
Brightwood 47.8 1180 7.7 173.1 51.0 8.1 35.5 0.2 430.8 369.3 5.7 0.6 1.15 0.54 868 643
Gwinner** 103.2 2071 7.9 113.5 31.3 15.2 359.1 0.3 565.2 708.8 36.9 2.5 0.10 0.63 1565 412
Hankinson 13.5 1219 7.7 143.2 75.1 9.9 31.9 0.2 421.5 395.8 18.9 0.4 1.87 0.75 897 602
Horace 57.2 1495 7.9 102.8 33.3 7.7 191.9 0.4 371.7 305.6 148 2.2 0.82 0.18 994 394 Milnor Channel 10.7 1026 7.9 109.0 37.3 8.2 77.6 0.2 398.6 239.1 28.2 2.4 0.87 0.55 707 426 Page-Galesburg 21.4 916 7.6 134.1 41.8 8.7 44.1 0.2 379.4 272.0 9.7 5.7 0.8 0.91 718 506 Sheyenne Delta 14.0 1748 7.8 112.4 43.3 14.8 241.7 0.8 478.0 492.7 96.9 3.3 1.22 0.63 1304 455
Spiritwood 18.8 1462 7.5 110.6 32.5 11.8 166.7 0.3 457.2 347.6 36.3 1.8 1.91 0.53 960 409 Wahpeton Buried Valley 43.5 1063 5.7 107.4 41.0 8.3 80.2 0.6 490.6 171.8 26.2 1.6 1.07 0.18 716 444
196
West Fargo North 102.5 1466 8.0 48.7 18.1 8.5 267.4 0.6 406.8 106.9 250.6 2.0 0.32 0.08 918
114.9 0.5
West Fargo South 94.2 841 8.0 43.9 15.6 5.4 309.0 79.0 70.9 1.9 0.19 0.09 502 174
The above data are averaged from all chemical analyses and do not represent a statistical sampling of the water in the respective aquifers. This suggests that some areas of each aquifer may be over or under represented. ** This aquifer has a limited number of samples from which these data are collected. µS – microsiemens, Ca – Calcium, Mg – Magnesium, K – Potassium, Na – Sodium, F – Fluoride, HCO3 – Bicarbonate, SO4 – Sulfate, Cl – Chloride, NO3 – Nitrate, Fe – Iron, Mn – Manganese, TDS – Total Dissolved Solids, CaCO3 – Calcium Carbonate.

Red River Valley Water Supply Project FEIS Chapter Three Affected Environment
Review of subsequent well log data suggests the aquifer or associated deposits extend farther north and west, encompassing features such as Star Lake and Moran Lake. Revised estimates would increase the aquifer’s surface area and its associated sand and gravels to at least 60 square miles. The aquifer matrix consists of generally well-sorted sands and medium gravel. Much of the matrix is covered by glacial till, but the aquifer in general behaves as an unconfined aquifer. Recharge to the Brightwood Aquifer probably comes from direct infiltration of precipitation and ponded water in the numerous shallow depressions. Water moves eastward through the aquifer toward discharge areas, including Willard Lake, Lake Elsie, Grass Lake, and the Milnor Channel Aquifer. No active withdrawal permits have been identified for the Brightwood Aquifer. Water quality in the Brightwood Aquifer is fair to good. TDS range from around 500 mg/L to 1,300 mg/L.
Gwinner Aquifer Armstrong (1982) describes the Gwinner Aquifer as a feature deposited in a depression of glacial till, approximately 22 miles long and 0.4 to 4 miles wide, with an average thickness of about 55 feet, ranging up to 109 feet. While not very large, this aquifer appears to receive recharge through overlying glacial drift; although, the amount of recharge is not understood. Gwinner holds rights for municipal use to 500 ac-ft of water from the northwest portion of the aquifer. There are no other major users of water from this aquifer (North Dakota State Water Commission 2004), and water levels suggest some capacity for further use of the central and southeast portions of the aquifer. However, this aquifer is not large enough to be a major water supply feature, and with TDS levels around 1,565 mg/L, the quality is not ideal. Likely points of natural discharge from the Gwinner Aquifer are to the adjacent tills and other aquifers, including the Spiritwood and Milnor Channel aquifers.
Hankinson Aquifer Baker and Paulson (1967) describe the Hankinson Aquifer as located south of the Sheyenne Delta Aquifer and east of Milnor Channel. Distinctly separated from the Sheyenne Delta Aquifer by an area of till and lake clay, the Hankinson Aquifer forms a northwest to southeast deposit of beach sands and gravels of glacial Lake Agassiz. Aquifer deposits average about 40 feet in thickness, but range from more than 100 feet thick in the northwest portion of the aquifer in Ransom and Sargent Counties to only a few feet in southern Richland County near the South Dakota border. The surface area of the Hankinson Aquifer is about 100 square miles.
Aquifer materials range from poorly sorted sandy gravel to well-sorted fine sand. The coarser deposits are near the south end of Richland County, and the material becomes finer grained toward the north. The aquifer is unconfined, and the water table is generally less than 10 feet below the ground surface. Natural recharge to the aquifer is likely dominated by vertical infiltration of precipitation with natural discharges to springs and evapotranspiration. Chemical analyses of water from the aquifer show the water is hard but otherwise of generally good quality for domestic use. As of 2004, the Hankinson Aquifer supports the city of Hankinson and Southeast Water Users District with 1,035 ac-ft of municipal and rural water permits, four irrigation permits totaling 403.7 ac-ft, and 110 ac-ft of water between two industrial permits. A rough estimate of water in storage within the Hankinson Aquifer is about 330,000 ac-ft of water.
Horace Aquifer Ripley (2000) describes the Horace Aquifer as part of the greater West Fargo Aquifer System. The Horace Aquifer underlies about 26.8 square miles of the Fargo area and
3 - 35

Red River Valley Water Supply Project FEIS Chapter Three Affected Environment
has an average thickness of about 103 feet. Other aquifers adjacent to the Horace include the West Fargo South and West Fargo North Aquifers. It is likely that water is naturally exchanged between these aquifers.
Like the other members of the West Fargo Aquifer System, there is no evidence to suggest this aquifer is currently recharged by precipitation. Water users who rely upon this aquifer are the communities of Horace, Christine, and Oxbow, along with some lesser use by rural water systems, which directly and indirectly withdraw water.
Milnor Channel Baker and Paulson (1967) describe the Milnor Channel Aquifer as an unconfined aquifer composed of terrace deposits, abandoned channel deposits, and surficial outwash in Ransom, Sargent, and Richland Counties. The aquifer formed after the Sheyenne River abandoned its former course and established a new course to the southeast. The Milnor Channel Aquifer ranges from about 1 to 2 miles wide and underlies an area of about 45 square miles (Armstrong 1982). The deposits in the Milnor Channel consist of sand, sandy gravel, and sandy silt. The known range in thickness is from 8-66 feet, with average thickness of about 40 feet.
Recharge to the Milnor Channel Aquifer is from direct precipitation and adjacent areas that drain into it. Water moves through the aquifer from the north to west, and there is inter-aquifer movement from the Brightwood Aquifer. Some groundwater may move into the aquifer from the beach deposits near Hankinson, and small amounts may be contributed by till adjacent to the channel. Water quality in the Milnor Channel is similar to the Hankinson Aquifer (table 3.7). Several small surface water bodies are likely connected to groundwater within the aquifer, including Lake Elsie, Grass Lake, Willard Lake, Swan Lake, Salt Lake, Silver Lake, and Sand Lake. The Lidgerwood Aquifer maintains permits for 595.0 ac-ft of water for municipal use, with another 9,650.3 ac-ft of groundwater designated for 56 irrigation permits located primarily in the northern portion of the aquifer.
gpm (gallons per minute) - The number of gallons that flow per minute used to quantify well yields. For example, a typical municipal well may be able to produce 250 gpm or 0.557 cfs.
Page-Galesburg Aquifer The Page-Galesburg Aquifer has an area of about 400 square miles and is in parts of Cass, Steele, and Traill Counties. The aquifer’s thickness ranges from 40 to 250 feet. Well yields from the aquifer can often be 500 gpm. Currently, Traill Rural Water District and Cass Rural Water Users District are using the aquifer for a water supply. Irrigation development is substantial and has already taken advantage of most areas capable of high-yield wells. Largely confined above by glacial till, this aquifer likely receives recharge through infiltration of precipitation down through the till with discharges to the aquifer resulting from pumping and localized evapotranspiration.
Sheyenne Delta Aquifer Located in Richland, Cass, Ransom, and Sargent Counties of North Dakota, the 750 square mile Sheyenne Delta Aquifer is a deltaic deposit formed when the Sheyenne River discharged into former Lake Agassiz. As Lake Agassiz drained, the Sheyenne Delta remained behind resting on a flat expanse of lakebed clay. Aeolian processes reworked much of the Sheyenne Delta forming sand dunes up to 85 feet high and depressions to a depth of
3 - 36

Red River Valley Water Supply Project FEIS Chapter Three Affected Environment
10 feet. The U.S. Forest Service acquired and designated over 70,000 acres as the Sheyenne National Grasslands, which is the most important feature associated with the Sheyenne Delta.
The typically sandy soils covering the Sheyenne Delta tend to allow rapid infiltration of snow meltwater and precipitation. Only the area immediately adjacent to the Sheyenne River has well developed surface drainage; excess precipitation farther away from the river systems tends to form wetlands in low lying areas. This leaves large areas of the Sheyenne Delta without well developed surface drainage and results in localized ponding of water before infiltration. The sand and silt of the Sheyenne Delta are as much as 200 feet thick. A notable exception to this thickness is near the Sheyenne River, where the stream has incised and reworked the deltaic deposits with finer grained sediment transported from upstream areas.
The Sheyenne Delta Aquifer contains an estimated 4 MAF of groundwater in storage and receives about 50,000 ac-ft of recharge during a year of average precipitation (Baker and Paulson 1967). Recharge to the Sheyenne Delta Aquifer takes place primarily during the spring. Evapotranspiration tends to exceed precipitation during the summer months. Only an occasional large rainfall event is sufficient to overcome soil moisture deficits and recharge groundwater. During the fall, evapotranspiration diminishes and precipitation may exceed the combined evapotranspiration and soil-moisture deficits and allow recharge. Even when recharge does not occur during the fall, soil-moisture deficits generally are reduced, significantly affecting the magnitude of the following spring recharge event (Shaver 1998).
Groundwater is removed from the aquifer by evapotranspiration during the growing season and flow to the Sheyenne River, which is a gaining stream through most of its reach in the Sheyenne Delta (Baker and Paulson 1967). Groundwater is also removed via irrigation and municipal wells tapped into the aquifer. As of 2004, Ransom-Sargent Water Users District and Cass Rural Water Users District were the only two municipal and rural water systems with permits on the aquifer, for a combined 1,300 ac-ft of water. The aquifer also supports 82 irrigation permits for a total of 15,196.3 ac-ft of water and one industrial permit for 4.0 ac-ft of water (North Dakota State Water Commission 2004). The water in the aquifer is somewhat hard (table 3.7) but is usable for most purposes (Baker and Paulson 1967).
Spiritwood Aquifer The Spiritwood Aquifer is a large glacial drift aquifer, which occupies a buried-valley complex that crosses North Dakota from north to south. Approximately 175 square miles of the Spiritwood Aquifer in Sargent County are under investigation for development as a water supply for the Project. The aquifer in this area consists of sand and gravel interbedded with occasional silt and clay layers. The average thickness is 33 feet. The aquifer is buried by a layer of till ranging from about 150 feet thick in the central part of Sargent County to about 25 feet thick in the southeast part of Sargent County. The bedrock underlying the aquifer is Cretaceous in age.
Water moves into the aquifer both downward through the overlying drift and upward through the underlying bedrock formations. Recharge to this aquifer appears limited to leakage from adjacent formations and small amounts of infiltration from overlying till. Although some areas appear to have appreciable vertical recharge, the Spiritwood Aquifer tends to be more characteristic of a confined aquifer. This portion of the aquifer retains approximately 850,000
3 - 37

Red River Valley Water Supply Project FEIS Chapter Three Affected Environment
ac-ft in storage, and wells produce between 500-1,000 gpm. Discharge from the aquifer results from pumping wells and flow to the east and south into adjacent aquifers.
Within the Spiritwood Aquifer segment found in Sargent County, the cities of Rutland and Forman retain municipal water permits totaling 214.5 ac-ft. No industrial permits have been granted within this area of the Spiritwood Aquifer, but 26 irrigation permits for 4,921.3 ac-ft of water in the western part of Sargent County have been granted as of 2004 (North Dakota State Water Commission 2004).
The variation in water chemistry from top to bottom of the aquifer can be quite dramatic with areas of high TDS. However, the water in southeastern Sargent County is of sufficient quality for domestic use (North Dakota State Water Commission 2006) and does not require mixing with water of much lower TDS or treatment by reverse osmosis prior to use as a domestic supply, as may be suggested by data in table 3.7.
Wahpeton Buried Valley Aquifer The Wahpeton Buried Valley Aquifer is one of three separate aquifers comprising the Wahpeton Aquifer System. In order of increasing depth, these three aquifers are the Wahpeton Shallow Sand, the Wahpeton Sand Plain, and the Wahpeton Buried Valley. The Dakota Sandstone is also in the area and can likely be found under portions of the Wahpeton Aquifer System (Froelich 1974), although the presence of any connectivity between the Dakota Sandstone and the Wahpeton Aquifer System would be speculative. In North Dakota, the aquifer generally has a north-south axis on the eastern edge of Richland County then extends under the Red River into Wilkin County, Minnesota. The three aquifers overlay each other, with the Wahpeton Buried Valley being the deepest. The Wahpeton Buried Valley aquifer is fine-grained at the top to very coarse grained at the bottom and covers about 8 square miles. It fills a steep-sided buried valley up to 125 feet thick cut into till and Cretaceous bedrock.
The potential sources of recharge to the Wahpeton aquifers are from the Red River and adjacent confining units. The confining units are glacial Lake Agassiz sediments, till, and Cretaceous bedrock. Recharge from the Red River depends on two conditions: 1) the stage in the river must be higher than the hydraulic head in the aquifers; and (2) the river must be hydraulically connected to the aquifer. Recharge from the Red River to the Wahpeton Aquifers was not estimated. The texture of the riverbed sediments of the Red River, aquifer thicknesses, and their hydraulic properties are not known (Schoenberg 1998).
Current permitted use from the Wahpeton Buried Valley aquifer includes 3,350 ac-ft of water in industrial permits, of which 3,000 ac-ft are held in abeyance for Cargill Incorporated during times of low flow in the Red River and 350 ac-ft for Minn-Dak Farmer’s Cooperative. An additional 710 ac-ft of water are appropriated by Wahpeton for municipal use. TDS average 635 mg/L in the Wahpeton Buried Valley, with the underlying Dakota Sandstone Aquifer and overlying Colfax unit of the Wahpeton Sand Plain being higher at 938 and 1,611 mg/L, respectively (Froelich 1974).
West Fargo North Aquifer The West Fargo North Aquifer is a buried, glacial drift aquifer that is part of a larger complex of aquifers called the West Fargo Aquifer System located in eastern
3 - 38

Red River Valley Water Supply Project FEIS Chapter Three Affected Environment
3 - 39
Cass County. Municipal development within the city of West Fargo overlies a portion of the West Fargo North Aquifer. There are numerous aquifer units of various sizes within the West Fargo Aquifer System. Of these, the West Fargo North Aquifer is one of the larger aquifers underlying approximately 27 square miles with an average thickness of 72 feet (Ripley 2000).
The West Fargo North Aquifer currently serves as the water supply for West Fargo. Due to the confined nature of this aquifer, no direct infiltration of precipitation occurs and existing withdrawals are resulting in declining water tables (Ripley 2000). However, limited inter-aquifer water movement may occur from adjacent units within the West Fargo Aquifer System. Without appreciable recharge from infiltration, and no known connections to the Red River, all existing and proposed withdrawals from the West Fargo Aquifer System deplete the finite amount of water in storage faster than it can be replaced through inter-aquifer transfers.
Permits for 2,693.5 ac-ft of water exist on the aquifer. Municipal use is the largest and account for 1,620 ac-ft of water with 58.5 ac-ft for irrigation, 980 ac-ft for industrial, and 35 ac-ft for rural use. Water quality is variable throughout the aquifer, with the better quality water along its southern edge. Salinity increases in the northern reaches of the aquifer (table 3.7).
West Fargo South Aquifer The West Fargo South Aquifer is similar to the West Fargo North Aquifer. Included in the West Fargo Aquifer System, the aquifer is on the southern edge of the West Fargo North Aquifer and continues southward for about 13 miles. It ranges from about 1-2 miles in width. The land surface over the West Fargo South Aquifer is becoming increasingly developed as the Fargo-West Fargo metro area grows. Water quality for the aquifer is characterized in table 3.7. Cass Rural Water Users District and West Fargo currently rely on this aquifer for a portion of their water supply. There are currently permits for 1,559.2 ac-ft of water on the aquifer. Municipal use is the largest at 850 ac-ft with 34.2 ac-ft of water for irrigation and 675 ac-ft of water for rural use.
Minnesota Aquifers The following aquifers are those that lie within the state of Minnesota in the Red River Basin. Discussion of aquifers of interest on the Minnesota side of the Red River Valley differs from discussion of North Dakota aquifers, because Minnesota does not set a limit for appropriated water. Instead data from 2003 are shown in figure 3.12 to compare the types of uses of groundwater in Minnesota. Available groundwater quality information is listed in table 3.8.
Buffalo Aquifer The Buffalo Aquifer is a narrow sand and gravel deposit located in northern Clay County that extends southward into southern Wilkin County. This aquifer has a surface area of approximately 66 square miles. About 25 square miles of the aquifer are unconfined, with the remainder confined. The aquifer is a deposit of fine- to coarse-grained sand, cobbly gravel, silt, and clay that tends to be coarser at its axis and finer-grained toward the edges. The aquifer has a maximum thickness of 200 feet.

Red River Valley Water Supply Project FEIS Chapter Three Affected Environment
3 - 40
-
Table 3.8 – Water Quality of the Surficial Aquifers of the Red River Basin, Minnesota (adapted from Reppe 2005).
TDS (mg/L)
Specific Conductance
(µS/cm) Ca (mg/L) Mg (mg/L) Fe (mg/L) Na (mg/L) Cl (mg/L)
NO2 & NO3 as N
(mg/L) SO4 (mg/L)
Aquifer Date Max Med Max Med Max Med Max Med Max Med Max Med Max Med Max Med Max Med
Buffalo 1 1957 1,190 490 1,500 789 181 84 83 33 4.6 0.73 159 21 39 3.5 -- -- 545 108
Buffalo 1 1978 1,990 604 2,250 828 260 110 230 40 45 7.4 140 10 54 4.4 10 0 1,100 190
Moorhead* - 660 - 1000 - - - - - - - - - - - - - - Otter Tail Surficial 1
1965-68 655 272 1,020 436 150 50 42 25 0.22 0.22 19 3.3 42 3.9 24 3.8 37 20.5
Otter Tail Surficial 1
1964-68 680 238 570 354 108 47 31 22 5.9 0.07 9.6 2.8 14 2.7 80 19 51 16
17 32 0.02 0.02 5.7 170 2.7
Pelican River Sand-Plain
1965-73 708 298 1,270 542 93 75 28 23 1.7 0.05 140
µS – microsiemens, Ca – Calcium, Mg – Magnesium, Na - Sodium, SO4 – Sulfate, Cl – Chloride, NO2 – Nitrite, NO3 – Nitrate, Fe – Iron, TDS – Total Dissolved Solids. 1 Results are from separate studies of the respective aquifers. * Values for Moorhead are unknown, but estimates were provided by C. McLain of Moorhead Public Service.

Red River Valley Water Supply Project FEIS Chapter Three Affected Environment
1
10
100
1000
10000
100000
Buffalo
Moorhead*
Otter Tail
Pelican River Sand-Plain
acre
-ft
Livestock Aqua-culture ThermoelectricMining Commercial Golf-IrrigationIndustrial Public Supply Agricultural-Irrigation
* Moorhead use is the average from 1998 – 2002.
Figure 3.12– Groundwater Use for the Year 2003 From Select Aquifers in Minnesota.
Recharge of the Buffalo Aquifer occurs from precipitation, streamflow from the Buffalo River and its tributaries, and leakage from the overlying surrounding sediments. Discharges from the aquifer occur primarily through the adjacent glacial sediments and into the Buffalo River and its south branch. Evapotranspiration from the aquifer is probably negligible, since the water table is 5 to 40 feet below the surface. Water quality data are in table 3.8.
Moorhead Aquifer The Moorhead Aquifer is an elongated feature with a north-south axis underlying the city of Moorhead in Clay County, Minnesota. The east-west boundaries of the aquifer tend to be well defined, in contrast to the north-south boundaries. The north-south boundaries grade into thin alternating layers of clay, sandy clay, and sand. At depth, alternating layers of clay, sandy clay, and sand are probably the result of glacial meltwater streams that preceded glacial Lake Agassiz leaving meandering channels and associated deposits. The aquifer is approximately 10 square miles in size. This aquifer receives virtually no vertical recharge, with only modest horizontal recharge from equivalent units. Currently, hydrographs suggest that the aquifer is experiencing a decline in water level, making it a good candidate for ASR. With ASR, this aquifer could store water during the current period of excess surface water, and during a drought, could yield up to 724 ac-ft per year.
No monitoring data were available with respect to the aquifer’s water quality. The only available information is from professional experience of Cliff McLain, Water Division Manager, Moorhead Public Service, Moorhead, Minnesota (table 3.8).
Otter Tail Surficial Aquifer The Otter Tail Surficial Aquifer covers approximately 510 square miles in Becker and Otter Tail Counties and continues with the Pelican River Aquifer in portions of Becker County. The Otter Tail Surficial Aquifer consists primarily of well-sorted sand, with
3 - 41

Red River Valley Water Supply Project FEIS Chapter Three Affected Environment
varying areas of sand and gravel, and lenses of clay in some locations. The deposit is well sorted, and ranges from fine- to coarse-grained sand. The aquifer ranges in thickness from zero to greater than 100 feet and is recharged largely by precipitation and underflow. Most groundwater is lost from the aquifer by evapotranspiration and direct discharge to streams.
Water in the aquifer contains calcium bicarbonate and generally is very hard (table 3.8). It has a low sodium hazard and a medium salinity hazard. Due to the varying use of agricultural chemicals and varying agricultural practices, local nitrate and chloride concentrations may exceed recommended levels. In addition, water hardness and dissolved concentrations of iron and manganese vary by location and may exceed recommended levels. The total volume of groundwater pumped from the aquifer in 2003, excluding water withdrawn for private water supply, was approximately 9,173 Mgals (28,151 ac-ft).
In approximately 17% of the study area, sustained theoretical well yields from the aquifer were estimated to be 200 gpm or more, and in approximately 8% of the area, the theoretical yield was estimated to be 600 gpm. The maximum estimated well yield ranged from 1,200 to 1,500 gpm. Water held in storage within the aquifer is estimated at 450 bgals (1.38 MAF). This aquifer has an estimated 47,887 Mgals (150,000 ac-ft) of annual recharge.
Pelican River Sand-Plain Aquifer The Pelican River Aquifer (Pelican River Sand-Plain Aquifer) is approximately 195 square miles in area and is in portions of Becker, Clay, and Otter Tail Counties. The aquifer is a surficial sand-plain deposit, ranging from fine- to coarse-grained sand. In general, the aquifer averages about 60 feet in saturated thickness. Recharge to the aquifer is from direct infiltration of precipitation and other groundwater discharge. Most of the water in this aquifer is discharged through evapotranspiration. Discharge also occurs into nearby streams, lakes, and wetlands.
Water in the aquifer is very hard and is enriched with dissolved concentrations of calcium, magnesium, and bicarbonate (table 3.8). Water from the aquifer has a low sodium hazard and has a low risk to irrigation. Iron and manganese concentrations in water collected from the aquifer generally may exceed recommended drinking water standards. The elevated iron and manganese levels had no apparent risks to vegetation; however, treating the water for domestic use would be necessary.
In 2003, approximately 1,872 Mgals (5,745 ac-ft) of water were removed from the Pelican River Sand-Plain Aquifer, excluding water withdrawn for private supply. There were no data and no permits for these private wells. Maximum values for well yields from the aquifer ranged from approximately 40 gpm to greater than 1,200 gpm, with a mean well yield of approximately 600 gpm. Under normal aquifer recharge conditions, long-term pumping was estimated to draw down portions of the aquifer water table by 2 to 8 feet. Hydrology models indicated a hydraulic connection between the Pelican River Sand-Plain Aquifer and the local surface water bodies. The aquifer holds about 290 bgals (920,000 ac-ft) of water in storage, with annual recharge estimated at 16,605 Mgals (50,960 ac-ft) of water.
3 - 42

Red River Valley Water Supply Project FEIS Chapter Three Affected Environment
Aquatic Communities
Introduction What aquatic communities in the Project area could be affected by the proposed
alternatives?
This section identifies aquatic communities that may be affected either by changing flows in the Sheyenne and Red Rivers or by the withdrawal of water from the Missouri River. Aquatic communities in the Sheyenne River, Red River, Lake Winnipeg, Missouri River system, and GDU Principal Supply Works could potentially be affected by changes in water quantity or water quality under the various alternatives or by importation of potentially invasive species (see “risks of invasive species” section in chapter three for discussion of the latter issue).
Methods As part of an instream flow assessment, Reclamation (2003a) identified four representative reaches in the Sheyenne River (figure 3.13). The first reach includes that part of the river from Harvey to above Lake Ashtabula. This reach is uncontrolled, with flows primarily the result of surface runoff. Flows are intermittent above Warwick. The estimated bankfull flow at Warwick is about 300 cfs. Although land use undoubtedly affects streamflow in this reach, there are few diversions, and the hydrograph is essentially natural.
Figure 3.13 – Sheyenne River Reaches Investigated by Reclamation (2003a).
3 - 43

Red River Valley Water Supply Project FEIS Chapter Three Affected Environment
Sheyenne River Reach Two, located in the Northern Glaciated Plains Ecoregion, comprises the river from below Lake Ashtabula to the sandhills area near Kindred. Estimated bankfull flow is about 1,000 cfs. Flows are regulated by Baldhill Dam, which alters the magnitude, frequency, and timing of both high flow and low flow events. Because Baldhill Dam often operates as a flow-through system, the annual hydrograph retains much of its natural, pre-dam character.
Reach Three includes the Sheyenne River through the Sandhills area near Kindred. Estimated bankfull flow is about 1,000 cfs. This reach typically gains flow from groundwater discharge to the stream.
Sheyenne River Reach Four extends downstream of the Sandhills to the confluence with the Red River. This reach is in the Lake Agassiz Plain Ecoregion. The estimated bankfull flow is about 1,200 cfs. Because of the flat gradient and fine substrate, habitat diversity in this reach is low.
Reclamation (2003a) identified two main reaches in the Red River. Red River Reach One is the Red River near Fargo, North Dakota, and is representative of the reach from Fargo to the confluence with the Buffalo River near Halstad, Minnesota. Red River Reach Two includes the reach from the confluence with the Buffalo River downstream to Emerson, Manitoba, Canada.
Both reaches of the Red River lie within the Lake Agassiz Plain Ecoregion. Although discharge and channel dimensions increase from upstream to downstream, riverine habitat is quite homogeneous. The gradient is very low and uniform, with runs and bends the primary habitat types. Consequently, aquatic communities are similar in both reaches.
Existing Conditions
Lake Ashtabula Fish Twenty-seven species of fish have been reported in Lake Ashtabula, with 26 of those also occurring in the Sheyenne River above the reservoir (Earth Tech, Inc. 2002). The fishery is dominated by brown bullheads, which are abundant. In addition, the lake provides a fair to good fishery for northern pike, walleye, white bass, and yellow perch.
Sheyenne River Fish The Sheyenne River supports the most diverse fishery of any North Dakota tributary to the Red River, with 56 species having been recorded in surveys between 1962-2000 (Aadland et al. 2005). By contrast, other North Dakota tributaries to the Red River support between 14 to 43 species of fish, and the number of fish species in Minnesota tributaries ranges from 17 to 73 (Aadland et al. 2005). The Sheyenne River provides spawning and nursery habitat for forage fish and some species of game fish. Except for Lake Ashtabula, angling pressure is generally light and concentrated in areas immediately upstream of lowhead dams.
Peterka (1978) reported 31 species of fish in the Sheyenne River above Baldhill Dam (Reach One). Common species include creek chub, common shiner, fathead minnow, white sucker, black bullhead, and brook stickleback (Earth Tech, Inc. 2002).
3 - 44

Red River Valley Water Supply Project FEIS Chapter Three Affected Environment
Fifty-one species of fish have been reported in Reach Two (Earth Tech, Inc. 2002). Common fish species include the common shiner, spotfin shiner, bluntnose minnow, shorthead redhorse, golden redhorse, smallmouth bass, blackside darter, and johnny darter.
Thirty-nine species of fish have been recorded in Reach Three (Earth Tech, Inc. 2002). Common species include spotfin shiner, sand shiner, bigmouth shiner, bluntnose minnow, shorthead redhorse, and white sucker. Several spring-fed tributaries enter the river in this reach. The northern redbelly dace, pumpkinseed sunfish, and Iowa darter are restricted to the spring-fed sites (Peterka 1978).
Thirty-two fish species have been recorded in Reach Four. The lower fish diversity compared to Reaches Two and Three is attributed to low habitat diversity and monotonous substrates (Earth Tech, Inc. 2002).
Mussels Jensen et al. (2001) sampled mussels in the Sheyenne River and the Red River during 1991 and 1992, and compared their results to samples collected in the 1960s and 1970s (Cvancara 1983). Between the two studies, 12 species of mussels have been recorded in the Sheyenne River. Common species include threeridge, fatmucket, Wabash pigtoe, and giant floater. Abundance of some species appears to have declined in the Sheyenne River since the 1970s (Jensen et al. 2001). Sampling Mussels
(photo courtesy of North Dakota Game and Fish Department) Red River
Fish Aadland et al. (2005) reported 57 species of fish in the Red River. Several of the common species such as channel catfish and sauger are characteristic of large rivers. Because of its low gradient, the Red River lacks spawning habitat for riffle spawning species. Many of these species ascend tributaries to find suitable habitat (Aadland et al. 2005). The Red River has been identified as one of the highest quality channel catfish fisheries in the United States. MNDNR, the Service, Red Lake Band of Chippewa, Ontario Ministry of Natural Resources, Manitoba Conservation, White Earth Biology Department, and Rainy River First Nations Indian Band are currently working on lake sturgeon recovery. Lake sturgeon are common in much of the Hudson Bay drainage but were eliminated from the Red River during the last century.
Mussels Ten species of mussels have been recorded in the Red River (Jensen et al. 2001). The most common species are threeridge, pocketbook, mapleleaf, and pink heelsplitter. Overall, species richness showed less variability among sites in the Red River than the Sheyenne River, which may be attributable to more homogeneous substrates and prolonged higher flows in the Red River.
Lake Winnipeg Lake Winnipeg has abundant aquatic life including fish, invertebrates, and plants. Common fish species include walleye (pickerel), goldeye, sauger, yellow perch, troutperch, burbot, freshwater drum, lake cisco, emerald shiner, whitefish, and northern pike. Introduced species are rainbow smelt, common carp, and white bass.
3 - 45

Red River Valley Water Supply Project FEIS Chapter Three Affected Environment
Between 1995 and 2005, Manitoba's commercial fisheries produced an average of over 13 million kilograms of fish annually. In order of production, pickerel (29%), mullet/suckers (27%), whitefish (18%), pike (12%), and sauger (7%) were the important species. Lake Winnipeg is the largest commercial fishery in Manitoba (Manitoba Water Stewardship Fisheries Branch 2006).
Missouri River System The Missouri River is regulated by six dams operated by the Corps. These dams have a profound effect on the river’s fisheries and other aquatic resources. The Corps (2004a) recently completed an EIS on operation of the Missouri River Dams. The following discussion is summarized from that EIS.
Over 156 fish species have been documented in the Missouri River, including many species that have been introduced into the mainstem reservoirs and riverine reaches. The dams created a variety of reservoir habitats that differ greatly from the natural (pre-impoundment) habitats in the river. Operation of the dams has also changed the hydrologic regime, water temperature, sediment transport, substrate, and water chemistry in the free-flowing reaches between dams. Garrison Dam Tailrace
Lake Sakakawea Species in the warmer water portions of Lake Sakakawea include native and non-native species that have adapted to lacustrine conditions. Some of the most common of these species are walleye, sauger, goldeye, carp, channel catfish, river carpsucker, crappie, and emerald shiner. Northern pike and smallmouth bass are also common.
The lake has also been stocked with coldwater game and forage fish species to take advantage of the coldwater habitat that is retained through the summer and fall in the lower depths of the lake. The major coldwater species are Chinook salmon and rainbow smelt.
The Lake Sakakawea fishery is managed primarily for walleye, sauger, and Chinook salmon and, to a lesser extent, northern pike, trout, and smallmouth bass. The Chinook salmon population is entirely dependent upon stocking.
Natural reproduction of the fish populations is limited by the availability of spawning and young-of-year rearing habitat. Except for rainbow smelt, the coldwater species generally lack spawning habitat and, thus, are primarily supported by hatcheries. Most of the warmwater and coolwater species spawn in shallow habitat of the lake margins, in the river above the lake, or in tributary streams. Walleye and, to a lesser degree, sauger require clean rock in moderately shallow water. Northern pike and several other warmwater species spawn in submerged vegetation.
3 - 46

Red River Valley Water Supply Project FEIS Chapter Three Affected Environment
Lake Sakakawea supports one of the foremost trophy-sized walleye fisheries in North America. Most of the natural reproduction of walleyes occurs in the upstream portions of the lake, and, to some extent, in the riverine sections above the lake. During drought periods when water levels are reduced, much of the rocky habitat normally used by walleye for spawning is exposed. During these periods, the walleye fishery relies heavily upon stocking programs to maintain the population at desired levels.
Drawdowns also substantially reduce the volume of coldwater habitat, potentially reducing the survival and production of coldwater forage and game fish. The numerous bays that normally provide shallow water habitat and most of the vegetated habitat in the reservoir are largely drained during drought, eliminating spawning habitat for vegetation-dependent species and rearing and feeding habitat for many coolwater and warmwater fish.
Terrestrial vegetation becomes established on exposed lakebeds during the drought, but becomes submerged when normal or wet climatic condition return. The submerged vegetation provides spawning substrate for northern pike, white crappie, yellow perch, and forage fishes. The delta area in the upper portion of the reservoir also serves as a nursery area for paddlefish, pallid sturgeon, and other river species. Little is known about the specific habitat requirements of these fish or the effects of lake-level changes on their populations.
Missouri River from Garrison Dam to Lake Oahe The Missouri River channel downstream of Garrison Dam has remained in a near-natural state, except for bank stabilization. Backwater and side channel habitat is common, and numerous sand bars and deep pools are present. This reach is dominated by releases of cold, clear water from Garrison Dam. Temperature and turbidity increase downstream of the dam because of local runoff and bank erosion.
Common sport fish in the riverine stretch below Garrison Dam include walleye, white bass, channel catfish, and northern pike. Trout and salmon are also targeted in the tailrace fishery below the dam.
Fishing Downstream of Garrison Dam
The native river fishes, including the catfish, sturgeon, sauger, suckers, and paddlefish, have declined because of migration blockage, loss of habitat, change in habitat, and competition from new species that have taken advantage of changes in habitat and flow regime. The pallid sturgeon has been listed as an endangered species and may occur in this reach. Other common species in the river include carp, shovelnose sturgeon, river carpsucker, shorthead redhorse, goldeye, and several species of shiners.
3 - 47

Red River Valley Water Supply Project FEIS Chapter Three Affected Environment
Audubon Lake, McClusky Canal, and Chain of Lakes The major fish species in Audubon Lake have changed since initial stocking efforts were initiated in 1953. Largemouth bass and walleye were stocked in 1953, followed by northern pike in 1954 and 1955. In 1960, water releases from Lake Sakakawea resulted in the introduction of such species as sauger, yellow perch, goldeye, white sucker, black crappie, white crappie, and carp.
At present, the fish species in Audubon Lake are similar to Lake Sakakawea. However, the shallower, warmer water in Audubon Lake does not support a coldwater fishery. Rainbow smelt, a major forage species in Lake Sakakawea, is uncommon in Audubon Lake. At the current operating levels of Audubon Lake, littoral habitat (the portion of a lake or reservoir that is near the shore) and aquatic vegetation are generally lacking. Littoral habitat and associated aquatic vegetation provide spawning and nursery habitat for many species of fish and increase biomass of aquatic invertebrates.
The McClusky Canal was constructed through a series of wetlands. Although no surveys were conducted prior to construction, presumably some of these wetlands contained fathead minnows and brook stickleback, which are present in many North Dakota wetlands. The wetlands were too shallow to support a sport fishery. The Chain of Lakes area has been managed as a sport fishery.
The major species of fish in the McClusky Canal/Chain of Lakes are similar to the species composition in Audubon Lake. The major species sought by anglers are yellow perch, walleye and largemouth bass. One major difference is that muskellunge have been stocked in New Johns Lake. Muskellunge may exist in other lakes in the Chain of Lakes due to emigration from New Johns Lake, but data are lacking to document this possibility.
Fishing on New Johns Lake
Presently, water releases from Audubon Lake as part of the freshening program provide water for the canal and associated Chain of Lakes. The quantity of water released is less than would be proposed for this Project, but the canal and Chain of Lakes benefit from these releases in two ways. First, releases keep the lakes at optimum elevation for fisheries and recreation. Second, water quality in these areas is maintained. Both the canal and the associated lakes would become highly saline without the freshening program.
3 - 48

Red River Valley Water Supply Project FEIS Chapter Three Affected Environment
Risks of Invasive Species
Introduction What are the potentially invasive species relative to operation of this Project, and what
are the existing pathways through which invasive aquatic species become established and spread?
Invasive Species Most organisms fail to be established when introduced into a new environment. Of those that become established, most have only minor effects on their new ecosystem. But some non-indigenous species become invasive, reproducing and spreading rapidly with significant adverse ecological or economic consequences.
Nonindigenous species -- a species that does not occur naturally in a given area. Invasive species -- a nonindigenous species whose introduction does or is likely to cause economic or environmental harm or harm to human health. Pathways – the means by which species are transported from one location to another.
Nonindigenous species can alter population, community, and ecosystem structure and function (Elton 1958; Mooney and Drake 1986; Vitousek et al. 1996; Drake et al. 1989). Ecosystem-level consequences of invasive nonindigenous species have major ecological and economic consequences, and in some cases, can directly affect human health. Pimentel (2003) estimated that the economic impact of aquatic invasive species in the U.S. is $9 billion annually.
Most species that are considered highly invasive originate in a distant watershed, usually from another continent. This is not coincidental. Multiple potential invasion pathways link most adjoining watersheds. Species with life history characteristics favoring invasiveness usually have a large native distribution and broad physiological tolerance, which is indicative of their ability to disperse into previously unoccupied habitats. In many cases, this dispersal occurred long ago, and the species are not regarded as invasive, but are merely considered common and widespread.
On the other hand, oceans are a formidable barrier to the natural dispersal of many freshwater organisms. Thus, zebra mussels needed a human-assisted pathway (ship ballast water) to disperse to North America from their native range in Eastern Europe. Once established in the Great Lakes, zebra mussels rapidly expanded their range through passive drifting of larvae and hitchhiking of adults and larvae on commercial and recreational boats. The potential for transferring invasive aquatic species through operation of the GDU has been a concern to Canada since the Project was first authorized in 1965. As originally authorized, GDU
Zebra Mussels Hitchhiking on Recreational Boat (www.gov.mb.ca/waterstewardship/ais/index)
3 - 49

Red River Valley Water Supply Project FEIS Chapter Three Affected Environment
would have conveyed untreated Missouri River water through open canals to the Hudson Bay Basin for irrigation and other purposes. All of the alternatives considered in this FEIS that would import Missouri River water include biota treatment and control systems (see chapter four risks of invasive species section). Conveyance of untreated Missouri River water to the Hudson Bay Basin is not included in any of the alternatives analyzed in this FEIS.
Three of the alternatives considered in this FEIS would transfer water from the Upper Missouri River Basin to the Hudson Bay Basin. These alternatives could be a new pathway for introducing invasive aquatic species into the Hudson Bay Basin. Species differ markedly in their likelihood of becoming invasive. Nonetheless, there will always be uncertainty about how a species will react to a new environment. Thus, any species that is in the Missouri River Basin but not in the Hudson Bay Basin is potentially of concern. In addition to known organisms, there may be unknown species (e.g., fish diseases) in the Missouri River Basin whose introduction into the Hudson Bay Basin could cause long-term adverse impacts.
Regulation of Invasive Species Most states, including North Dakota and Minnesota have laws and regulations that prohibit the transportation or introduction of known invasive plants and animals. There are few existing regulations or standards, however, pertaining to microorganisms. Current Coast Guard regulations require ships to exchange ballast water at sea before entering the Great Lakes. The United Nations International Maritime Organization has adopted a treaty that sets ballast water treatment performance standards. Under the treaty, beginning in 2009 ships will be required to treat ballast water so that discharges contain less than 10 viable organisms greater than or equal to 50 micrometers in diameter per cubic meter. As a point of reference, many microorganisms are less than 50 micrometers in diameter, and thus would not be regulated under the standards. To become effective, however, the treaty must be ratified by 30 countries, which could take a decade or more.
Discharge of Ballast Water- a Primary Source of Invasive Species (http://massbay.mit.edu/exoticspecies/ballast/index.html)
Legislation has been introduced in the U.S. Congress (S. 725) to mandate considerably stricter standards for ballast water discharge. Under this proposed legislation, beginning in 2112 ballast water discharge would have to contain less than 1 living organism per 10 cubic meters that is 50 or more micrometers in diameter, and less than 1 living organism per 10 milliliters that is between 10 and 50 micrometers in diameter.
There are no current or proposed standards for treatment of interbasin water transfers to control invasive species. The EPA has published a proposed rule in the Federal Register (71 FR 32887) that would generally exempt interbasin water transfers from regulation under the National
3 - 50

Red River Valley Water Supply Project FEIS Chapter Three Affected Environment
Pollutant Discharge Elimination System permitting program, but the rule has not been finalized and is subject to modification.
Methods Reclamation contracted with the USGS Columbia Environmental Research Center in 2002 to evaluate the risks and consequences of biota transfers potentially associated with diversions of surface water from the Missouri River Basin to the Red River Basin. USGS was contracted for this analysis, because they are considered the scientific arm of the Department of the Interior, have specific expertise in risk analysis, and produce independent, extensively peer-reviewed documents.
USGS produced a detailed, 36-page plan of study for the risk analysis in 2002. The plan of study was distributed to an interagency Technical Team for review (see chapter five for a list of Technical Team participants). In September 2002, USGS attended a meeting of the Technical Team to explain the ecological risk assessment process, walk through the plan of study, and take additional comments. A revised plan of study was produced in November 2002.
In their draft plan of study, the USGS identified potentially invasive species to be evaluated in the risk analysis. The draft list of species was presented to the Technical Team, including representatives from federal agencies, potentially affected states, and Canada. The list of potentially invasive species was modified through input from the Technical Team, and was finalized in late 2002 (tables 3.9 and 3.10).
Table 3.9 – Potentially Invasive Species - Plants, Algae, Microorganisms, and Disease Agents.
Aquatic Plants and Algae Microorganisms and Disease Agents
Blue-green Algae (Cyanobacteria) Vascular Plants Protozoa and Metazoa Bacteria and Viruses
Anabaena flos-aquae* Hydrilla (Hydrilla verticillata)
Myxosoma cerebralis (Myxobolus cerebralis)
Enteric Redmouth
Microcystis aeruginosa* Eurasian Water-milfoil (Myriophyllum spicatum)
Polypodium hydriforme Infectious Hemtopoietic Necrosis Virus
Aphanizomenon flos-aquae* Water Hyacinth (Eichhornia crassipes)
Cryptosporidium parvum* Escherichia coli (various serotypes)*
Purple Loosestrife (Lythrum salicaria)
Giardia lamblia* Legionella spp.*
Saltcedar1 (Tamarix spp.)
Salmonella spp.2
* Indicates the organism is in the Red River Basin but could also be transported via interbasin water transfer. 1 At least eight species of saltcedar have been listed as introduced into the U.S. and Canada. 2 Including, but not limited to S. typhi, S. typhmurium, other Salmonella serotypes and other water-borne infectious diseases
3 - 51

Red River Valley Water Supply Project FEIS Chapter Three Affected Environment
Table 3.10 – Potentially Invasive Species - Aquatic Invertebrates and Aquatic Vertebrates.
Aquatic Vertebrates
Aquatic Invertebrates
Gizzard shad (Dorosoma cepedium)
Mollusks Crustaceans
Rainbow smelt* (Osmerus mordax)
Zebra Mussel (Dreissena polymorpha)
Spiny Water Flea (Bythotrephes cederstroemi)
Bighead carp (Aristichthys nobilis)
Asiatic Clam (Corbicula fluminea)
Paddlefish (Polyodon spathula)
New Zealand Mud Snail (Potamopyrgus antipodarum)
Pallid sturgeon (Scaphirhynchus albus)
Utah chub (Gila atraria)
Zander (Stizostedion lucioperca)
* Indicates the organism is in the Red River Basin but could be transported in water import.
The risk analysis and two supplemental reports (Linder et al. 2005a; Linder et al. 2005b; Linder et al. 2006) are included as supporting documents. Interested readers should review these reports for a better understanding of the risk analysis process, and how risks associated with this proposed Project were evaluated.
Existing Condition
Potentially Invasive Species
Propagule Pressure In the context of invasive species, propagule pressure refers to the number of seeds or offspring produced by an organism, as well as the frequency of introduction and the number of organisms introduced. Species with high propagule pressure are more likely to become invasive.
The potentially invasive species encompass a broad range of taxonomic classification and life history characteristics, and include viruses, bacteria, protozoa and other invertebrates, fish, macrophytic plants, and algae. The primary focus is on potentially invasive species that are in the upper Missouri River Basin but are not in the Hudson Bay Basin. In addition, selected representative species already inhabiting both basins were also evaluated. Although species already residing in both basins are not likely to be problematic with regard to interbasin water transfers, they may represent other as yet unknown aquatic biota in the upper Missouri River Basin. The life history characteristics and potential consequences associated with invasive species that could be transported by the Project or other pathways from the Missouri River Basin to the Hudson Bay Basin are discussed in Appendix F.2.
As part of the initial problem formulation, the potentially invasive species were characterized by their life history attributes likely to influence invasiveness. Each species was assigned a rank score in eight categories: trophic status,
3 - 52

Red River Valley Water Supply Project FEIS Chapter Three Affected Environment
parental investment (fishes and aquatic invertebrates only), maximum adult size (fishes only), and size of native range, physiological tolerance, and distance from nearest native source, prior invasion success, and propagule pressure. An overall rank score was calculated for each species by dividing its total score by the maximum possible score. Thus, the highest possible overall rank score was 1.0, indicating that the species possesses life history characteristics likely to make it highly invasive.
Rank scores ranged from nearly 1.0 (cyanobacteria, purple loosestrife, Eurasian water milfoil, bacterial and protozoan infectious disease agents) to less than 0.6 (Utah chub, paddlefish, pallid sturgeon). The nine highest ranking potentially invasive species were species that are widely distributed, not only in the Missouri and Red River Basins, but throughout North America. Unknown species with similar life history attributes that do not occur in the Hudson Bay Basin would be of concern. It should be noted, however, that the characteristics that make these species potentially invasive are also responsible for their present widespread distribution (e.g., broad physiological tolerance and multiple dispersal pathways). Thus, it is unlikely that these species are endemic and restricted to the Missouri River Basin. Furthermore, if introduced to the Missouri River Basin, these species are likely to spread to the Hudson Bay Basin with or without an interbasin water transfer by this Project.
The species of potentially greatest concern with this Project are those with intermediate rank scores (e.g., zebra mussel, bighead carp, New Zealand mudsnail, and others with similar scores). Whether or not an interbasin water transfer would present a significant new invasion pathway is dependent on treatment and containment effectiveness.
Bighead Carp Is of Concern With This Project(http://nas.er.usgs.gov/queries/FactSheet.asp?speciesID=551)
Species with low rank scores (e.g., pallid sturgeon) have life history characteristics that make them unlikely to become invasive. Furthermore, the low ranked species would be most amenable to removal or inactivation in engineered treatment and control systems.
Diseases and Parasites of Fish Fishes are susceptible to a number of parasites and infectious diseases. Disease-related mortality is best documented for hatcheries and aquaculture facilities, although field observations of disease outbreaks are not uncommon. Among the potentially invasive species for this Project, microorganisms and disease agents present the greatest challenge for control.
In the wild, fish diseases are often undetected unless morbidity or mortality is evident (e.g., acute episodes manifested at “fish kills” or skin lesions indicative of disease). No natural waters with resident fish populations are considered free of disease, and under the right conditions, various diseases can be a source of significant mortality in wild populations (e.g., if water temperatures in a river become unusually high for extended periods). Once established, many diseases may be
3 - 53

Red River Valley Water Supply Project FEIS Chapter Three Affected Environment
difficult to control and virtually impossible to cure. Prevention and control of any disease process under field conditions is challenging. Under cultured conditions, while more manageable, disease control still requires a significant investment of time and resources.
In general, fish diseases in wild fish populations are poorly understood. Fish pathology is an infant science, and previously unknown disease organisms are still being discovered. Some may cause little or no harm to the natural host but may be highly pathogenic for other species not previously exposed to the disease organism. Obviously, unknown organisms possess unknown life history characteristics. Thus, it is not possible to predict the impacts of unknown pathogens or parasites, and the probability that some specific unknown organism would spread through Project or non-Project pathways cannot be estimated.
Channel Catfish Enteric Redmouth, a Disease Agent (http://www.fisheries.org/education/AFS_education_fisheries_techniques_visuals_chap_14_add.htm)
Many stakeholders have identified whirling disease as a significant threat posed by the Project. Whirling disease is a parasitic infection of trout and salmon by the myxosporean protozoan Myxobolus cerebralis that has caused severe impacts on some coldwater fisheries in North America. Heavy infection of young fish can result in high mortalities. When an infected fish dies, many thousands to millions of the parasite spores are released to the water. These spores can withstand freezing and drying and can survive in a stream for 20 to 30 years. Whirling disease occurs throughout Europe (Halliday 1976) where it probably originated. It was accidentally introduced into the U.S. (into Pennsylvania and Nevada) in about 1955 (Hoffman 1990). Whirling disease
Whirling Disease Life Cycle (http://upload.wikimedia.org/wikipedia/en/4/45/LifeCycle%28Myxobolus_cerebralis%29.jpg)
3 - 54

Red River Valley Water Supply Project FEIS Chapter Three Affected Environment
occurs in the upper Missouri River Basin in Montana and Wyoming, but has not been detected in North Dakota or Canada.
Whirling disease presents a two-host life cycle involving a fish and the tubifex worm (Markiw and Wolf 1983; Wolf and Markiw 1984; Wolf et al. 1986), and two separate spore stages occur, one in each host. In brief, the life cycle begins with spores of M. cerebralis released to the aquatic environment when infected fish die and decompose or are consumed by predators or scavengers. The myxosporean-type spores are ingested by tubifex worms in whose gut the next phase of the life cycle continues. In the worm, transformation into the actinosporean, or Triactinomyxon, occurs. Once fully developed, Triactinomyxon spores are released from infected worms into the water for several weeks, where they enter susceptible fish such as rainbow trout through the skin, fins, oral cavity, upper esophagus, or lining of the digestive tract.
The source of the infective agent for fish is usually the water supply or earthen ponds inhabited by aquatic tubificid worms. An outbreak of the disease can occur after stocking with infected fish or transferring fish from facilities where the infection had not yet been detected. Predators and scavengers such as birds (Taylor and Lott 1978) that consume infected fish can release viable spores into the environment and may disseminate the parasite. Because of the multiple invasion pathways, some of which cannot be controlled (e.g., birds), the parasite is likely to continue to spread to currently uninfected watersheds. Salmonid fish have been stocked in some lakes and rivers in the Red River Basin, but susceptible species are generally absent in the Sheyenne and Red Rivers and Lake Winnipeg. Thus, it is highly unlikely that Myxobolus cerebralis could complete its life cycle and cause significant impacts in these waters.
Another fish disease of concern is the Missouri River sturgeon iridovirus. Currently, the Missouri River sturgeon iridovirus has been detected only in captive propagated sturgeon in Service facilities and in wild shovelnose sturgeon collected in the Missouri River below Fort Peck Reservoir. Both shovelnose and pallid sturgeon have been diagnosed with the iridovirus agent. As with many fish pathogens, the iridoviral agent can be associated with mortalities in cultured sturgeon but has not been identified as a mortality factor in the wild. This disease is of concern because of the possibility that it could infect lake sturgeon, which are being propagated and reintroduced in the Red River Basin. It is not known whether the lake sturgeon is susceptible to the Missouri River sturgeon iridovirus. UV disinfection of water is currently used in hatcheries to inactivate the virus. The emergence of iridovirus has increased the costs of producing pallid sturgeon, primarily because of the additional space needed to raise fish at decreased densities, UV treatment, temperature control, and filters (S. Krentz, personal communication 2006).
Aquatic Vascular Plants Invasive aquatic plants are a major problem in many areas. They often form dense, monotypic stands and out-compete more desirable native
Eurasian Watermilfoil (http://aquat1.ifas.ufl.edu/myrspi.html)
3 - 55

Red River Valley Water Supply Project FEIS Chapter Three Affected Environment
vegetation. Once established, eliminating the infestation is nearly impossible, and control is costly. Pimentel (2003) estimated the cost of controlling invasive aquatic plants in the U.S. at $500 million per year. Within the Project area, the major invasive aquatic and riparian plants are Eurasian watermilfoil, purple loosestrife, and tamarisk. Of these, purple loosestrife is in both the Missouri River Basin and the Red River Basin, tamarisk lives in the Missouri River Basin but not the Red River Basin, and Eurasian watermilfoil occurs in the Red River Basin but not the Missouri River Basin in North Dakota.
Aquatic Invertebrates Many species of aquatic invertebrates have been accidentally introduced in North America, and a few have become highly invasive, causing very serious economic and ecological impacts. Pimentel (2003) estimated the damages caused by three of these species (zebra mussel, quagga mussel, and Asian clam) at $2 billion annually.
Zebra mussels are probably the most well known and may be the most damaging invasive aquatic invertebrate in North America. In 1988, an established population of zebra mussels was recorded in the Canadian waters of Lake St. Clair, a small water body connecting Lake Huron and Lake Erie. By 1990, zebra mussels were spread throughout all the Great Lakes, and in 1991, zebra mussels escaped the Great Lakes Basin and found their way into the Illinois and Hudson Rivers. The Illinois River was the key to their introduction into the Mississippi River drainage, which covers over 1.2 million square miles.
At present, zebra mussels have not been recorded in the Missouri River Basin in North Dakota or in the Red River Basin. Although zebra mussels have not been documented in North Dakota, their presence in the Missouri River below Gavins Point Dam in South Dakota suggests that the species may expand its range into North Dakota. Zebra mussels are also found in the Mississippi River Basin in Minnesota. It is likely that, from one direction or the other, zebra mussels will find their way into the Hudson Bay Basin with or without the Project.
The initial introduction of zebra mussels in the Great Lakes was probably a result of ballast water discharge, and its dispersal throughout the Great Lakes and major river systems occurred relatively rapidly due to its ability to attach to boats navigating these lakes and rivers. Its rapid range expansion into interconnected waterways was probably due to barge traffic where attached mussels probably were scraped or fell off during routine navigation. Overland dispersal is also a strong possibility for aiding zebra mussel range expansion (see, e.g., Johnson et al. 2001), and many small lakes in the Great Lakes Basin have been invaded by zebra mussels attached to watercraft moving from infested waters to uninfested waters where populations of zebra mussels have subsequently become established. Inspections throughout North America have found zebra mussels attached to hulls or in motor compartments of watercraft, including a documented observation near Winnipeg, Manitoba.
Zebra Mussel (from Great Lakes Information Network)
3 - 56

Red River Valley Water Supply Project FEIS Chapter Three Affected Environment
Zebra mussels are notorious for fouling infrastructure by colonizing water supply pipes of hydroelectric and nuclear power plants, public water supply plants, and industrial facilities (see, e.g., D’Itri 1997; Nalepa and Schloesser 1993). Population densities for zebra mussels have been recorded as high as 700,000 per square meter at power plants, and pipe diameters have been reduced by two-thirds at water treatment facilities.
Most of the biological impacts of zebra mussels in North America are poorly characterized, especially those indirect effects at higher levels of biological organization and those direct effects that stem from interactions with multiple-species in community settings. However, information from Europe tells us that zebra mussels have the potential to severely impact unionids (native mussels) by interfering with their feeding, growth, locomotion, respiration, and reproduction. Researchers are observing some of these effects as they study interactions between zebra mussels and native unionids in the Great Lakes.
Worker Cleaning Water Intake Pipe Clogged by Zebra Mussels (www.protectyourwaters.net/hitchhikers/mollusks_zebra_mussel.php)
According to early studies, zebra mussels are minimally affecting fish populations in the Great Lakes. It may be too soon to determine some of the long-term effects. However, there has been a striking improvement in water clarity in Lake Erie, sometimes four to six times clearer than before the arrival of zebra mussels. This allows more light to penetrate deeper increasing aquatic plants (Skubinna et al. 1995). Some of these aquatic plant beds have not been seen for many decades due to changing conditions of the lake, mostly due to pollution. The aquatic plant beds that have returned are providing cover and acting as nurseries for some species of fish.
Fishes A total of 138 species of fish have been introduced into the U.S. (Courtenay 1997). Many of the species have been intentionally introduced for sport fishing or to control aquatic vegetation. Others were introduced through aquaculture or aquarium trade, and a few were transported in ship ballast. Grass Carp
(http://nas.er.usgs.gov/queries/FactSheet.asp?speciesID=514)
3 - 57

Red River Valley Water Supply Project FEIS Chapter Three Affected Environment
Of the invasive species of fish in the Missouri River, Asian carp are probably the greatest concern. Asian carp are large fish (39-40 inch; 40-50 lb.) introduced into the U.S. by fish farmers in Southern states in the 1960s and 1970s to control vegetation and algal blooms. Three of these species, the bighead carp (Hypophthalmichthys nobilis), grass carp (Ctenopharyngodon idella), and silver carp (Hypophthalmichthys molitrix) have been released or have escaped to the wild and are reproducing in many rivers and streams of the Mississippi River Basin.
Asian carp spread quickly after introduction, became very abundant, and hurt native fishes either by damaging habitats or by consuming vast amounts of food. Grass carp destroy habitat and reduce water quality for native fishes by uprooting or consuming aquatic vegetation. Bighead and silver carp are large filter-feeders that compete with larval fish, paddlefish, bigmouth buffalo, and freshwater mollusks (clams). In addition, boaters have been injured by silver carp, because they commonly jump out of the water and into or over boats in response to outboard motors.
Grass carp were introduced by government agencies, while bighead and silver carps escaped from aquaculture facilities. Grass carp have spread or have been introduced legally or illegally into nearly every state in the U.S. Bighead and silver carps are spreading rapidly but are found mainly in the Mississippi and Missouri River Basins.
Invasive Species Pathways Although the Project-related risk of invasive species is specifically related to interbasin water transfers, alternate and competing pathways exist. Non-Project pathways must be considered to assess the relative risk of biological invasions due to the proposed import of Missouri River water by the Project. In addition, when multiple pathways exist, uncertainty as to cause and effect is increased. If an invasion occurs, it may be difficult or impossible to determine with any degree of certainty which pathways were used by the invading organism.
Natural pathways for dispersal of invasive organisms include animal transport, wind dispersal, major floods that temporarily link basins, and storms (e.g., tornadoes). In a sense, the native biota of the Hudson Bay Basin are the result of numerous natural “invasions” that have occurred since the retreat of the last continental glaciers.
Human activity also provides pathways for dispersal of aquatic organisms from one basin to another. According to the EPA, human activities have increased the frequency by orders of magnitude by which non-native plants, animals, and pathogens are introduced to new areas. The following common pathways for introduction of invasive species were identified by the EPA (http://www.epa.gov/owow/invasive_species/pathways.html):
• Ballast Water Since 95% of all foreign goods by weight enter the U.S. through its ports, the potential for invasive species impacts on coastal communities is immense.
• Boat Hull, Fishing Boot, and Other Recreational Introduction Boats, fishing boots (felt-soled wading boots transport whirling disease organisms from stream to stream) and equipment, diving gear, and other recreational implements that are transported among several water bodies have been known to spread invasive species problems to new waters. Some zebra mussel and milfoil introductions have occurred in this manner.
3 - 58

Red River Valley Water Supply Project FEIS Chapter Three Affected Environment
• Aquaculture Escape Non-native shrimp, oysters, and Atlantic salmon in the Pacific
Northwest are just a few examples of non-native mariculture species that have generated concern over disease and other impacts that might arise from their escape.
• Intentional Introduction The introduction of nonindigenous species into ecosystems with few controls on reproduction or distribution.
• Aquarium Release Escapes or intentional release of unwanted pets can be a source of new non-native species in all parts of the country. The invasive algae Caulerpa is thought to have been introduced to U.S. waterways after being discarded from aquariums.
• Live Food Industry The import of live, exotic foods and the release of those organisms can result in significant control costs, e.g. the snakehead fish in Maryland. Asian swamp eels are spreading through the Southeast after introduction as a food source.
• Vehicular Transportation Both private and commercial transportation are major factors in the movement and range expansion of non-native species throughout the U.S.
• Escaped Ornamental Plant, Nurseries Sale, or Disposal Many invasive plant problems began as ornamental plantings for sale in nurseries and garden shops. Purple loosestrife, for example, is sold as an ornamental plant but takes over native vegetation in wetlands, and can clog western streams preventing water withdrawal and recreational uses. Only some problem species are currently banned from sale.
• Cross-basin Connection From small channels to major intercoastal waterways, new connections between isolated water bodies have allowed the spread of many invasive species. Great Lakes invasions increased markedly after the opening of the St. Lawrence Seaway in 1959.
Purple Loosestrife (http://www.great-lakes.net/envt/flora-fauna/invasive/loosestf.html)
• Fishing Bait Release Discarding unused bait can introduce species that disrupt their new ecosystems and eliminate competing native species; examples include non-native crayfish, baitfish that overpopulate certain waters, and earthworms that are depleting the organic duff layer in northern forests where no indigenous earthworms existed.
• Illegal Stocking Although prohibited by law, people release fish into new waters and sometimes cause severe impacts. Yellowstone Lake's world-class cutthroat trout fishery is now jeopardized by an illegal release of lake trout.
• Domestic Animals Gone Wild The impact of feral house cats on birds and small mammals in natural areas is well documented; escaped feral pigs from farms have recently begun to do significant damage to soils and plants in the Smokey Mountains.
• Pathogen Spread by Non-native to Vulnerable Native Species Non-native species problems include pathogens carried by resistant non-natives to vulnerable native species. Whirling disease, which has decimated rainbow trout in many western rivers, was originally introduced when European brown trout, tolerant of whirling disease, were imported to U.S. waters and hatcheries.
• Disposal of Solid Waste or Wastewater Seeds, viable roots, or other propagules of invasive plants may be easily spread to receiving waters through wastewater discharge, then spread by water flow to distant areas downstream.
3 - 59

Red River Valley Water Supply Project FEIS Chapter Three Affected Environment
• Science/Laboratory Escape, Disposal, or Introduction Accidental or intentional
release of laboratory animals has introduced some non-native species into U.S. waters. • Seafood Packing and Disposal Much seafood is packed in seaweed prior to
distribution. Because seafood is transported long distances, organisms in packing seaweed may reach new waters as an unintended by-product.
• Biological Control Introduction Ideally, introducing a second non-native species to control an invader should result in diminished numbers of both species after control is accomplished, but some introduced controls have backfired because they attack non-target species. Mongooses introduced in Hawaii to control rats have wiped out many native bird species.
• Past Government Programs The establishment of a new invader is sometimes an unanticipated outcome of a government program; kudzu, for example, was originally introduced through a government-sponsored erosion control program.
• Moving and Depositing Fill in Wetland Seeds and viable parts of invasive plants contained in fill material may rapidly colonize the new area and then compete with native species within the wetlands.
• Land/Water Alteration Many invaders are adept at rapid pioneering where soil has been disturbed or water levels or routes have been changed, leaving a temporary gap in occupation by native flora and fauna.
The relative magnitude of the available pathways (i.e., the probability that an organism will use a particular pathway to successfully invade the Hudson Bay Basin) will differ for each of the potentially invasive species. Thus, the pathways for introduction of cyanobacteria, for example, will be more numerous and more likely to yield successful invasions than the pathways available to pallid sturgeon.
Figure 3.14 shows the expansion of the distribution of New Zealand mudsnails (shown in red) in the western U.S. between 1995 and 2007. The figure illustrates how existing pathways can facilitate the transfer of invasive aquatic species between basins that lack a surface water connection. The first record of New Zealand mudsnails in the U.S. occurred in 1987 in Idaho’s Snake River. It is believed they were accidentally introduced with stocked imported rainbow trout. Since 1995, mudsnails have jumped many basin divides and are now found in 10 western states. The snails have impacted Rocky Mountain trout streams and are apparently being spread by anglers. In 2001, New Zealand mudsnails were recorded in Lake Superior at Thunder Bay, Ontario, and in 2005, they were recorded in Duluth-Superior Harbor. Researchers suspect they arrived in the Great Lakes via ship ballast water.
New Zealand Mudsnail (http://www.esg.montana.edu/aim/taxa/mollusca/pag1043l.jpg)
3 - 60

Red River Valley Water Supply Project FEIS Chapter Three Affected Environment
Figure 3.14 - Distribution of New Zealand Mudsnails in the Western U.S. in 1995 and 2007 (from http://www.esg.montana.edu/aim/mollusca/nzms/status.html).
Existing Interbasin Water Transfers in the United States and Canada Numerous interbasin water transfers have been constructed in the U.S. and Canada. Petch (1985) inventoried interbasin water transfers in the western U.S. He identified 111 conveyances that exported an average of 12 MAF per year from 1972 to 1982. This is equivalent to the average annual flow of the Mississippi River at Prescott, Wisconsin (Petch 1985). While many of the water transfers are between sub-basins, large diversions exist that transfer water between major drainage basins (i.e., across a continental divide). For example, in 1982, 437,222 ac-ft of water was exported from the Upper Colorado River Basin to the Missouri River Basin. To our knowledge, none of this water was treated before crossing the basin divide.
In Canada more streamflows are diverted out of their basin of origin than any other country in the world. For, example, the average rate of inter-basin water transfer flow in Canada is 156,232 cfs, which is more than six times greater than the United States, which has a transfer rate of about 25,179 cfs. There are 62 diversion projects in 9 provinces of Canada. If all the diverted waters in Canada were concentrated in a “hypothetical river,” it would be the third largest river in Canada (Ghassemi et al. 2007).
The North Dakota State Water Commission discusses some major interbasin water transfers in the U.S. and Canada (http://www.swc.state.nd.us/4dlink9/4dcgi /GetContentPDF/PB-499/Biota Transfer_Slideshow.pdf). Figure 3.15 shows the locations of some of the existing major interbasin water transfers. Two of the Canadian projects (Long Lake and Ogoki River) transfer a combined average of about 4.1 MAF of untreated water per year from the Hudson Bay Basin to the Great Lakes Basin.
The Chicago Sanitary and Ship Canal transfers an average of about 2.3 MAF of untreated water from the Great Lakes Basin to the Mississippi River Basin. The Chicago Sanitary and Ship Canal has an electrical barrier designed to prevent movement of fish into the Great Lakes Basin but has no barrier to prevent movement of invasive species from the Great Lakes Basin to the
3 - 61

Red River Valley Water Supply Project FEIS Chapter Three Affected Environment
Mississippi River Basin. Transfer of water between the Great Lakes Basin and other basins poses a high risk of invasive species transfer, because international shipping in the Great Lakes has been the pathway through which some of the most damaging invasive aquatic species (e.g., zebra mussels) have become established in North America.
1 Milk River and St. Mary River Diversions (650 cfs) Purpose: Irrigation Connections: Missouri River Basin and Hudson Bay Basin Biota Transfer Controls: No
2 Ogoki River Diversion (4,275 cfs) and Long Lake Diversion (1,375 cfs) Purpose: Hydroelectric Power Generation Connections: Hudson Bay Basin to Great Lakes Basin Biota Transfer Controls: No
3 Chicago Sanitary and Shipping Canal (3,200 cfs) Purpose: Sewage dilution, navigation, and hydroelectric power generation Connections: Great Lakes Basin to Mississippi River Basin Biota Transfer Controls: Electric barrier, with additional controls proposed.
Figure 3.15 – Map of Major Existing Water Transfers Between the Hudson Bay Basin and the Missouri River, Mississippi River, and Great Lakes Basins.
3 - 62

Red River Valley Water Supply Project FEIS Chapter Three Affected Environment
Natural Resource Lands
Introduction What natural resource lands (wetlands, grasslands (including native prairie), woodlands,
and riparian areas) in the Project area could be affected by the proposed alternatives?
This section identifies natural resource lands that may be affected either by construction of Project features or by changing flows in the Sheyenne and Red Rivers. Natural resource lands are wetlands, grasslands (including native prairie), woodlands, and riparian areas (natural resource lands adjacent to a river). The following discussion centers on habitat types within the six distinct ecoregions in the Project’s area of potential effects in the Red River Basin (see figure 3.1). Along the Missouri River only wetlands and riparian areas would be affected. Detailed discussion of the natural resources inventory is in Appendix E.
Some of these lands are in the Conservation Reserve Program, which is administered by the Farm Service Agency. This program encourages farmers to convert highly erodible cropland or other environmentally sensitive acreage to vegetative cover, such as tame or native grasses, wildlife plantings, trees, filterstrips, or riparian buffers. Farmers receive an annual rental payment for the term of the multi-year contract for protecting these lands.
Methods
Inventory of Construction Corridors and Wellfields To inventory natural resource lands in potential pipeline construction zones and wellfields, GIS (geographic information systems) layers were used. The layers were developed using state and federal agency land use databases. This inventory was done by superimposing alternative features over land use data sets and determining the types of lands that coincide with the proposed location of Project features. These inventories covered pipeline routes, which are corridors 400 feet in width (typically 200 feet either side of the section line), and areas overlying aquifers. A 400-foot-wide corridor represents where the pipeline most likely would be sited along road ROWs (right-of-ways) or section lines. The actual placement of the pipeline within the corridor would be determined during the final engineering phase, if an action alternative is selected. The location of wells and interconnecting pipelines would also be determined at that time, if groundwater features were part of the selected alternative.
Inventory of Riparian Areas Riparian buffers were created to inventory riparian areas adjacent to the Sheyenne River below the point where Project water would be added. The entire length of the Red River in the United States was also analyzed. To calculate the acres of riparian area, a buffer of ¼ mile on each side of the river was delineated as a GIS layer (see Appendix E). This riparian buffer (¼ mile on each side of the river) was chosen because the floodplain for the Sheyenne River is approximately that wide in the sections of the river potentially impacted by the Project, and the maximum influence of groundwater surface interaction extends ¼ mile from the banks of the
3 - 63

Red River Valley Water Supply Project FEIS Chapter Three Affected Environment
Sheyenne River (West Consultants, Inc. 2001). The Red River riparian buffer was also set at ¼ mile on each side of the river to maintain analysis consistency.
To quantify the number of natural resource land acres within the area of potential effects, the National Land Cover Dataset was used. Wetlands, grasslands, and woodlands were further characterized by National Wetlands Inventory data and North Dakota Natural Heritage Inventory data, where available.
Existing Conditions
Wetlands The Service estimates that North Dakota has approximately 2.4 million acres of wetlands remaining with 953,258 acres in counties in the Project area. Some of these are in the Conservation Reserve Program. Minnesota has over 10 million acres of wetlands with 1,417,205 acres in counties in the Project area (Reynolds et al. 1997).
Wetlands Definitions Riverine wetlands are typically narrow, wet areas within a channel. These wetlands, which are common along the Sheyenne River, usually are flowing or at least soaked periodically, because both surface and subsurface water flows toward them.
The distribution of wetlands throughout the Project area correlates with the distribution of various glacial landforms. Because of the various landforms, there are a diversity of wetland types in the Project area (Cowardin et al. 1979), including riverine wetlands (e.g., Missouri River, Sheyenne River, and Red River and associated tributaries), palustrine wetlands (e.g., glaciated outwash and drift plain), and lacustrine wetlands (e.g., Lake Sakakawea, Lake Ashtabula, and Minnesota lakes).
Palustrine wetlands are typically shallow to wet basins usually dominated by vegetation. Prairie potholes and most marshes in North Dakota and Minnesota are palustrine wetlands.
Lacustrine wetlands typically are open water depressions lacking vegetation except around the edges. Minnesota has many lacustrine wetlands.
Table 3.11 lists wetlands that currently within the 400-foot-wide construction corridors. Table 3.12 is an inventory of wetlands overlying aquifers proposed for development by the Project. This is the number of aquifers within the entire wellfield area; the number of acres in table 3.10 exceeds the number of acres that would be impacted by the Project. The groundwater section in chapter four discusses surface/groundwater interaction.
Table 3.11 – Wetlands Currently in 400-foot-wide Project Pipeline Corridors.
Alternative Palustrine (acres)
Lacustrine (acres)
Riverine (acres)
Total Wetlands (acres)
North Dakota In-Basin 102 27 0 129 Red River Basin 98 0 3 101 GDU Import to Sheyenne River 303 0 10 313 GDU Import Pipeline 419 18 17 454 Missouri River Import to Red River Valley 622 44 21 687
3 - 64

Red River Valley Water Supply Project FEIS Chapter Three Affected Environment
Table 3.12 – Wetlands Currently Overlying Aquifers Proposed for Development.
Alternative Palustrine (acres)
Lacustrine (acres)
Riverine (acres)
Total Wetlands
Acres Number of Wetlands
North Dakota In-Basin Total 36,532 9,510 404 46,445 17,650 Buffalo Aquifer (MN) 562 0 53 614 448 Moorhead Aquifer (MN) 87 81 23 191 48 West Fargo North Aquifer 168 0 234 402 80 West Fargo South Aquifer 135 0 0 135 165 Southeast Groundwater 35,580 9,429 94 45,103 16,909
Red River Basin Total 90,525 100,732 1,183 192,439 80,816 Buffalo Aquifer (MN) 562 0 53 614 448 Moorhead Aquifer (MN) 87 81 23 191 48 West Fargo North Aquifer 168 0 234 402 80 West Fargo South Aquifer 135 0 0 135 165 Southeast Groundwater 35,580 9,429 94 45,103 16,909 Pelican River Aquifer (MN) 16,918 20,648 12 37,578 54,143 Otter Tail Surficial Aquifer (MN) 37,075 70,574 767 108,416 9,023
GDU Import to Sheyenne River Total 0 0 0 0 0 GDU Import Pipeline Total 36,142 9,429 147 45,717 17,357
Buffalo Aquifer (MN) 562 0 53 614 448 Southeast Groundwater 35,580 9,429 94 45,103 16,909
Missouri River Import to Red River Valley Total 562 0 53 614 448
Buffalo Aquifer (MN) 562 0 53 614 448
Red River Basin The Sheyenne River and associated wetlands transition from the Northern Glaciated Plains Ecoregion to the Lake Agassiz Plain Ecoregion. These wetlands are classified as riverine, lower perennial, unconsolidated bottom, or intermittently exposed for the upper one-third and riverine; lower perennial, unconsolidated bottom, or permanently flooded for the lower two-thirds of the river’s length. In addition to the river habitat, there are several other types of floodplain wetlands along the Sheyenne River. For the most part, these are characterized as palustrine, emergent, temporarily flooded, or seasonally flooded wetland habitats. In some areas, sedge meadow wetlands are found adjacent or near the Sheyenne River and are maintained by river flows, perched areas, and groundwater tables. The forested banks of the Sheyenne River are occasionally identified as palustrine, forested, or temporarily flooded wetlands. Lake Ashtabula is designated as a lacustrine wetland and is a regulated system.
3 - 65

Red River Valley Water Supply Project FEIS Chapter Three Affected Environment
The Red River lies within the Lake Agassiz Plain Ecoregion and wetlands are characterized as a riverine, lower perennial, unconsolidated bottom, or permanently flooded river. There are occasional exposed river bars, which have been classified as riverine, lower perennial, unconsolidated shore, or temporarily or seasonally flooded. Unlike the Sheyenne River, the Red River floodplain is largely void of palustrine wetlands. Floodplain wetlands, when identified, typically exist in old river scars and oxbows.
Minnesota has more wetland acreage than any other state except Alaska, despite extensive losses due to conversion for agricultural and development uses since the mid-19th century. There are approximately 10.6 million acres of wetlands in the state.
Palustrine Wetland in North Dakota
Glaciated prairie marshes and sedge meadows occur in the Lake Agassiz Plain Ecoregion in Minnesota counties adjacent to the Red River. These wetlands are characterized as palustrine emergent, temporarily, and seasonally flooded wetlands.
Further east of the glaciated prairie is a landscape transitioning from prairie to woods, which is the North Central Hardwood Forests Ecoregion. This area is a mosaic of forests, lakes, and wetlands. Wetlands in this area are lacustrine and palustrine, emergent, temporarily flooded, seasonally flooded, and permanently flooded habitats. In some areas, wetland habitats include sedge meadow wetlands with palustrine scrub-shrub and forested, temporarily flooded wetlands. In Minnesota’s eastern Becker and Otter Tail Counties, lakes or lacustrine habitats are abundant. Calcareous lakes in forested watersheds occur in the northeastern parts of these counties.
Missouri River System The Missouri River is part of the Northwestern Glaciated Plains Ecoregion. The Missouri River is classified as riverine below the dams and as lacustrine on the reservoirs, with some associated palustrine forested, scrub shrub and palustrine emergent, temporarily and seasonally flooded wetlands. These habitats are regulated and dependent on mountain and plains runoff and Missouri River mainstem system operations.
The Northwestern Glaciated Plains Ecoregion transitions easterly to the Northern Glaciated Plains. Wetlands in the Northwestern Glaciated Ecoregion are generally concentrated, semi-permanent, and seasonal. The Northern Glaciated Plains Ecoregion has high concentrations of temporary and seasonal wetlands. From the Northwestern Glaciated Plains Ecoregion and east to the Sheyenne River Basin, wetlands are characterized as the prairie pothole region with palustrine wetlands.
Audubon Lake is a lacustrine wetland, as are some of the Chain of Lakes areas to the south and east. Audubon Lake includes about 18,000 surface acres. Associated with the lacustrine wetlands of Audubon Lake are scattered areas of about 63 acres of palustrine emergent wetlands.
3 - 66

Red River Valley Water Supply Project FEIS Chapter Three Affected Environment
The McClusky Canal is at the southeastern end of Audubon Lake and includes about 546 acres of riverine wetlands. Associated or connected to the McClusky Canal by surface, groundwater, or seepage areas are various lacustrine (5,130 acres) and palustrine (571 acres) wetlands known as the Chain of Lakes. Some of the lacustrine wetlands are structurally connected to the canal, allowing some freshening from the canal flows, while other palustrine wetlands result from canal seepage.
Grasslands The Northwestern Glaciated Plains Ecoregion, located along the Missouri River and its plain is a transitional region from the highly developed agricultural areas to the east and the drier plains to the west. The grasslands in this ecoregion are mixed-grass prairie. In general, the mixed-grass prairie is characterized by the warm-season grasses of the shortgrass prairie to the west (wheat grass and blue gramma) and the cool- and warm-season grasses, which grow much taller, to the east (little blue stem and needlegrass).
The Northern Glaciated Plains Ecoregion is characterized by flat to gently rolling plains. These grasslands are similar to the mixed-prairie grasslands of the Northwestern Glaciated Plains but are more robust because of higher moisture and more fertile soils. These areas include plants such as little bluestem, big bluestem, and side-oats gramma.
The Lake Agassiz Plain Ecoregion, although intensely farmed using row crop practices, is home to remnants of historic tallgrass prairie. Lying within this area is the Sheyenne National Grasslands, a 70,000-acre area managed by the U.S. Forest Service. The Sheyenne National Grasslands contain distinct grassland communities with hummocky sandhills of mixed-grass prairie dominated by little bluestem, prairie sandreed, and side oats gramma and tallgrass prairie dominated by big bluestem, Indian grass, and switch grass. The western prairie fringed orchid is a federally listed species protected under the ESA, which is associated with the grassland-wetland transitions of lowland swales, wetlands, and sedge-willow complexes.
Sheyenne National Grasslands
The Northern Minnesota Wetlands, Northern Lakes and Forests, and North Central Hardwood Forests Ecoregions generally lack grasslands, except in association with edges or transition zones between lakes and forested areas.
Native Prairie Table 3.13 is an inventory of native prairie natural resource lands that currently lie within the Project’s proposed 400-foot-wide pipeline corridors. Table 3.14 lists the acres of native prairie currently overlying the aquifers proposed for development in the various action alternatives. This is the number of acres overlying the entire wellfield area; the number of
3 - 67

Red River Valley Water Supply Project FEIS Chapter Three Affected Environment
acres in table 3.14 exceeds the number of acres that would be impacted by the Project. The groundwater section in chapter four discusses surface/groundwater interaction.
Table 3.13 – Inventory of Native Prairie in the 400 foot-wide Pipeline Corridors in the Missouri River and Red River Basins.
Alternative Native Prairie Acres (from Service 2007)
No Action unknown North Dakota In-Basin 379 Red River Basin 125 GDU Import to Sheyenne River 1,789 GDU Import Pipeline 2,004 Missouri River Import to Red River Valley 2,787
Table 3.14 – Native Prairie Overlying Aquifers Proposed for Project Development in the Red River Basin.
Alternative Native Prairie Acres (from Service 2007)
North Dakota In-Basin Total Southeast Groundwater 26,523
Red River Basin Total Southeast Groundwater 26,523 Otter Tail Surficial and Pelican River Aquifer (MN) 862
GDU Import Pipeline Total Southeast Groundwater 26,523
Woodlands Woodlands in the Northwestern Glaciated Plains and Northern Glaciated Plains Ecoregions usually are associated with rivers and streams. These lowland hardwoods are primarily composed of cottonwood, basswood, American elm, green ash, and box elder. Some scattered areas of oak timber in dry forest sites and some trembling aspen, balsam poplar, and paper birch in moist areas can be found. Shrubby areas associated with these forest types may contain willows, chokecherry, red-stemmed Woodlands in Pembina Gorge, North Dakota
(photo courtesy of North Dakota Tourism) dogwood, hawthorn, June berry, pinchberry, silver berry, American plum, and others. Shelterbelts or planted woodlands are scattered throughout these two ecoregions and usually consist of cottonwood, Russian olive, green ash, American elm, slippery elm, red mulberry, box elder, silver maple, hackberry, Chinese elm, Siberian elm, and occasionally some conifers.
3 - 68
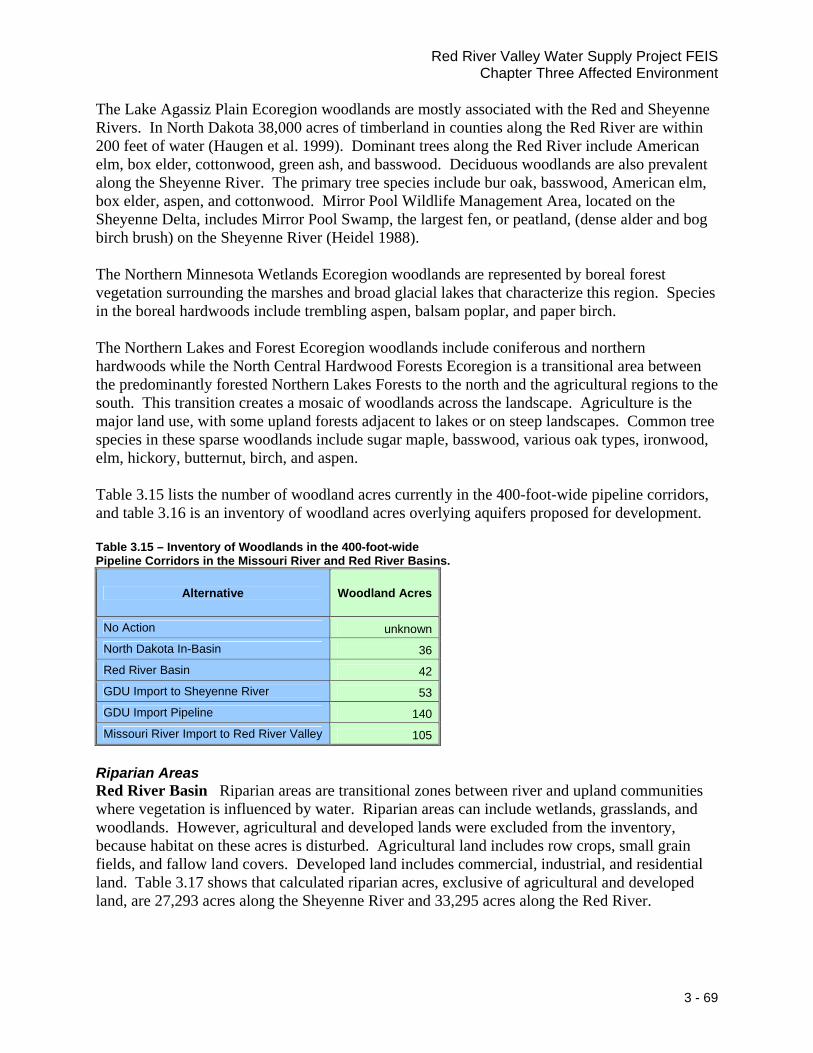
Red River Valley Water Supply Project FEIS Chapter Three Affected Environment
The Lake Agassiz Plain Ecoregion woodlands are mostly associated with the Red and Sheyenne Rivers. In North Dakota 38,000 acres of timberland in counties along the Red River are within 200 feet of water (Haugen et al. 1999). Dominant trees along the Red River include American elm, box elder, cottonwood, green ash, and basswood. Deciduous woodlands are also prevalent along the Sheyenne River. The primary tree species include bur oak, basswood, American elm, box elder, aspen, and cottonwood. Mirror Pool Wildlife Management Area, located on the Sheyenne Delta, includes Mirror Pool Swamp, the largest fen, or peatland, (dense alder and bog birch brush) on the Sheyenne River (Heidel 1988).
The Northern Minnesota Wetlands Ecoregion woodlands are represented by boreal forest vegetation surrounding the marshes and broad glacial lakes that characterize this region. Species in the boreal hardwoods include trembling aspen, balsam poplar, and paper birch.
The Northern Lakes and Forest Ecoregion woodlands include coniferous and northern hardwoods while the North Central Hardwood Forests Ecoregion is a transitional area between the predominantly forested Northern Lakes Forests to the north and the agricultural regions to the south. This transition creates a mosaic of woodlands across the landscape. Agriculture is the major land use, with some upland forests adjacent to lakes or on steep landscapes. Common tree species in these sparse woodlands include sugar maple, basswood, various oak types, ironwood, elm, hickory, butternut, birch, and aspen.
Table 3.15 lists the number of woodland acres currently in the 400-foot-wide pipeline corridors, and table 3.16 is an inventory of woodland acres overlying aquifers proposed for development.
Table 3.15 – Inventory of Woodlands in the 400-foot-wide Pipeline Corridors in the Missouri River and Red River Basins.
Alternative Woodland Acres
No Action unknown North Dakota In-Basin 36 Red River Basin 42 GDU Import to Sheyenne River 53 GDU Import Pipeline 140 Missouri River Import to Red River Valley 105
Riparian Areas Red River Basin Riparian areas are transitional zones between river and upland communities where vegetation is influenced by water. Riparian areas can include wetlands, grasslands, and woodlands. However, agricultural and developed lands were excluded from the inventory, because habitat on these acres is disturbed. Agricultural land includes row crops, small grain fields, and fallow land covers. Developed land includes commercial, industrial, and residential land. Table 3.17 shows that calculated riparian acres, exclusive of agricultural and developed land, are 27,293 acres along the Sheyenne River and 33,295 acres along the Red River.
3 - 69

Red River Valley Water Supply Project FEIS Chapter Three Affected Environment
Table 3.16 - Inventory of Woodlands Overlying Aquifers Proposed for Development in the Red River Basin.
Alternative Woodland Acres
North Dakota In-Basin Total 6,763 Buffalo Aquifer (MN) 439 Moorhead Aquifer (MN) 166 West Fargo North Aquifer 853 West Fargo South Aquifer 7 Southeast Groundwater 5,298 Red River Basin Total 72,610 Buffalo Aquifer (MN) 439 Moorhead Aquifer (MN) 166 West Fargo North Aquifer 853 West Fargo South Aquifer 7 Southeast Groundwater 5,298 Otter Tail Surficial and Pelican River Aquifer (MN) 65,847 GDU Import Pipeline Total 5,737 Buffalo Aquifer (MN) 439 Southeast Groundwater 5,298 Missouri River Import to Red River Valley Total 439 Buffalo Aquifer (MN) 439
Table 3.17 – Riparian Area Acres in the Proposed Project Area in the Red River Basin.
River Total Acres Agricultural Acres
Commercial /Industrial
/Residential Acres
Riparian Acres
Sheyenne River 74,202 44,519 2,390 27,293Red River 106,016 67,870 4,851 33,295
The woodlands of the Sheyenne and Red Rivers are important components of these riparian areas. Riparian areas associated with the Sheyenne and Red Rivers provide not only important habitat for fish and wildlife, but also for flood control, streambank stabilization, and water quality improvement.
Of the riparian acres found on the Sheyenne River, approximately 11,274 acres are delineated as wetlands by the National Wetlands Inventory; there are 14,734 wetland acres in the riparian areas of the Red River (Appendix E). According to inventory data collected by the North Dakota Natural Heritage Inventory (Appendix E), approximately 3,658 acres of woody community types have been identified in the riparian area of Sheyenne River Riparian Area
3 - 70

Red River Valley Water Supply Project FEIS Chapter Three Affected Environment
the Sheyenne River and 3,012 acres of tallgrass prairie community types. More specific North Dakota Natural Heritage Inventory data of riparian areas were not available for the Red River. However, the National Land Cover Dataset produced by USGS in cooperation with EPA is available and includes 19,042 acres of forest but no grasslands within the riparian buffer area. The National Land Cover Dataset also covers the Sheyenne River, but these data are not directly comparable to the North Dakota Natural Heritage Inventory data due to differences in data retrieval techniques. The National Land Cover Dataset includes 14,788 acres of forested land and 3,374 acres of grasslands in the Sheyenne River riparian area (Appendix E). Missouri River System Missouri River System riparian areas represent the range of vegetation that grows in areas along river reaches and the deltas of each reservoir. The riparian communities are characterized by relatively dry, sandy soil, and occasional intermittent flooding. Field and mapping efforts completed for the Corps (2004a) Missouri River Basin Mainstem Reservoir System Master Water Control Manual Review and Update, Final Environmental Impact Statement inventoried approximately 192,500 acres of riparian vegetation in the floodplain of the Missouri River from the Fort Peck Lake delta in Montana to St. Louis. Field mapping efforts focused on the major deltas and riverine reaches where a hydrological connection (surface or subsurface) to the Missouri River could be demonstrated; therefore, not all wetlands and riparian areas were included in the inventory.
3 - 71

Red River Valley Water Supply Project FEIS Chapter Three Affected Environment
Wildlife
Introduction Which mammals and migratory birds currently inhabit areas that could be affected by the
Project alternatives?
The habitat types within the ecoregions (see figure 3.1) define wildlife resources within the Project area. The diversity of habitats across these ecoregions supports an abundant diversity of wildlife. Additional information on wildlife in the Project area and their habitats can be found in the Fish and Wildlife Coordination Act Report for this Project (Service 2007), which is appended to the FEIS as a supporting document. Scientific and common names for species are listed in Appendix L.2.
Methods A literature search was performed to identify mammals and migratory birds currently inhabiting the areas that would be affected by the Project. Lists of mammals were obtained from various North Dakota and Minnesota game and fish websites. The breeding birds of North Dakota are described by habitat type in “Breeding Birds of North Dakota” (Stewart 1975; Johnson, Igl, and Johnson 1997). More specific bird studies of habitat in the Project area are described in these publications for specific areas:
• Pembina Hills (Faanes and Andrew 1983) • Sheyenne River Valley (Faanes 1982) • Jamestown area (Higgins et al. 1992) • Conservation Reserve Program lands (Johnson and Schwartz 1993) • Tallgrass prairie (Johnson 1996; Winter et al. 2001; Kantrud and Higgins 1992; Renken
and Dinsmore 1987) • Waterfowl Production Areas (Duebbert 1981) • Prairie pothole region (Stewart and Kantrud 1974) • Wetlands (Austin 1998; Igl and Johnson 1998) • Stutsman County (Johnson 1931, 1932, and 1934) • Cass County (Monson 1934) • Fargo and Red River Valley (Williams 1926; Stevens 1944; and DeChant 2001)
The breeding birds of Minnesota are described in Henderson (1979) and on the Minnesota Ornithologists’ Union Web site by county (http://www.cbs.umn.edu/~mou/lists.html Version 5, October 2004). More specific bird habitat studies in the project area include tallgrass prairie (Holler 2000) and Conservation Reserve Program lands (Johnson and Schwartz 1993).
Existing Conditions
Mammals Across the plains areas the wildlife habitat is a unique blend of grasslands, including native prairie, tame prairie, and Conservation Reserve Program plantings, prairie wetlands, shelterbelts,
3 - 72

Red River Valley Water Supply Project FEIS Chapter Three Affected Environment
and rolling hills near riparian woodland valleys, all integrated into an agricultural setting. From the plains to the eastern portions of the Project area, there are many lakes and forests. Mammals found in these areas are typical of those in Northern Lakes and Forests Ecoregion environments.
Migratory Birds The Missouri River hardwoods shelter many species of passerine and neotropical migrant birds, while the shorelines and islands of rivers and reservoirs provide habitat for waterfowl, shorebirds, and waterbirds. From the rolling hills to the drift plains and prairie pothole region of the Northern Glaciated Plains Ecoregion, grasslands and wetlands dot the agricultural landscape. Waterfowl, grassland nesting passerines, and raptors are abundant and diverse. Further east on the Lake Agassiz Plain, tallgrass prairie habitats of the lower river valley provide habitat for grassland sparrows and other grassland nesters, like the bobolink and meadowlark. Forested and shrub communities are habitat for hawks, owls, woodpeckers, and warblers.
Blue Winged Teal, Migratory Waterfowl
The northern Minnesota wetlands afford habitat for waterfowl and shorebirds. Surrounding grasslands habitat support birds like LeConte's and Harris sparrows and loggerhead shrikes. Forested areas sustain raptors, woodpeckers, vireo, warbler, and thrasher species. Loon species, waterfowl, and heron species occupy the lakes of the Northern Lakes and Forests Ecoregion, while owl, warbler, waxwing, and vireo species live in forested areas. The North Central Hardwood Forests Ecoregion afford habitat for owl, flycatcher, vireo, and warbler species.
3 - 73

Red River Valley Water Supply Project FEIS Chapter Three Affected Environment
Federally Protected Species and Species of Special Concern
Introduction What federally listed species and species of special concern in the Project area could be
affected by the proposed alternatives?
Information presented in this FEIS was used to prepare a biological assessment under Section 7(c) of the ESA (Endangered Species Act). The assessment’s purpose is to:
1. Assure that compliance with the ESA is incorporated into early planning decisions and alternative selection.
2. Establish and promote interagency cooperation and consultation in project decision making, which may affect listed and candidate species.
3. Develop possible conservation and mitigation measures to avoid or reduce identified impacts.
The Service, as required by the ESA, provided a federal list of endangered, threatened, and candidate species that are or may be present in the project area (Appendix G.1).
Species of special concern are: • Species listed in accordance with Minnesota’s Endangered Species Statute (Minnesota
Statutes, Section 84.0895), as well as associated Rules (Minnesota Rules, Parts 6212.1800 to 6212.2300 and 6134).
• Species listed as Species of Conservation Priority – Level I (North Dakota Game and Fish Department 2004).
• Species listed by Canada’s COSEWIC (Committee on the Status of Endangered Wildlife in Canada) and protected by the Canadian law SARA (Species at Risk Act).
State listed species are in Appendix G.2. However, unlike Minnesota, that has a state endangered species law (Minnesota Rules, Chapter 6134) and subsequent list and regulations (Minnesota Statutes, Section 84.0895, Minnesota Rules, Parts 6212.1800 to 6212.2300); North Dakota does not have a state endangered species law or a specific list of endangered species. Canadian listed species are not covered by the ESA or its Section 7 consultation requirements (see Appendix G.2).
North Dakota recently released a list of Species of Conservation Priority (North Dakota Game and Fish Department 2004). This list recognizes species for one of two reasons. Either they have a high level of conservation priority because of declining status either in North Dakota or across their range; or they have a high rate of occurrence in North Dakota, which constitutes the core of the species’ breeding range, but are at risk range wide. If non-State Wildlife Grant funding is not readily available to them, they are considered Level One species. These species are listed in Appendix G.2.
3 - 74

Red River Valley Water Supply Project FEIS Chapter Three Affected Environment
COSEWIC advises Canadians and their governments regarding the status of wild species that nationally are at risk of extinction or extirpation. Enforcement of the SARA ensures that threatened and endangered species and their critical habitats receive protection. SARA prohibits killing, harming, harassing, capturing, taking, or possessing of species at risk and prohibits destruction of critical habitat.
Methods Federal and state lists and databases were searched for locations of these species within the Project area. A literature search for life history information was made for all species that may occur within the project area. State agencies with responsibilities for listed species, as well as U.S. Fish and Wildlife Service Field offices, were contacted for up to date information on locations, life histories, and current research information for listed species within the Project area.
State or federally listed species most likely to be found within the Project area are discussed below. Species that have been recorded in counties within the Project area but would not be affected by the Project or only occur rarely within the Project area are addressed in Appendixes G.1 and G.2.
Existing Condition
Federal Protected Species Bald Eagle (Threatened) In the Project area, the Missouri River corridor dotted with floodplain forest between Garrison Dam and Lake Oahe provides a natural migration corridor, as well as suitable nesting and wintering habitat for bald eagles. Bald eagles prefer forested habitats near bodies of water. Eagles concentrate near open water in the wintertime.
Bald Eagle (photo courtesy of South Dakota Department of Game, Fish, and Parks)
Wintering bald eagles on the Missouri River in North Dakota fluctuated from a low of 2 eagles to a high of 59 during the winters of 1986-2003. Bald eagle populations are increasing in number throughout the country, and North Dakota is no exception. The first active eagle nest was reported in 1988 along the Missouri River and additional nesting has been documented since then. Along the Missouri River, at least 8 active bald eagle pairs were documented in 1999 and 14 in 2005. The nests on the Missouri River nearest the project area are approximately 1 mile downstream of Garrison Dam. In the Red River Valley, bald eagle nests have been recently identified near Fordville Dam in Walsh County, the west end of Kelly’s Slough National Wildlife Refuge in Grand Forks County, and about 1 mile north of East Grand Forks in Polk county (Service 2007). Migrating eagles are found throughout North Dakota. Other areas most likely to attract expanding numbers of eagles at any season are the forested areas of the Red River and Sheyenne River Valleys, Devils Lake, and the Turtle Mountains. Prior to 1950, there are historic records of bald eagles in these areas (http://www.npwrc.usgs.gov/resource/distr/birds/).
3 - 75
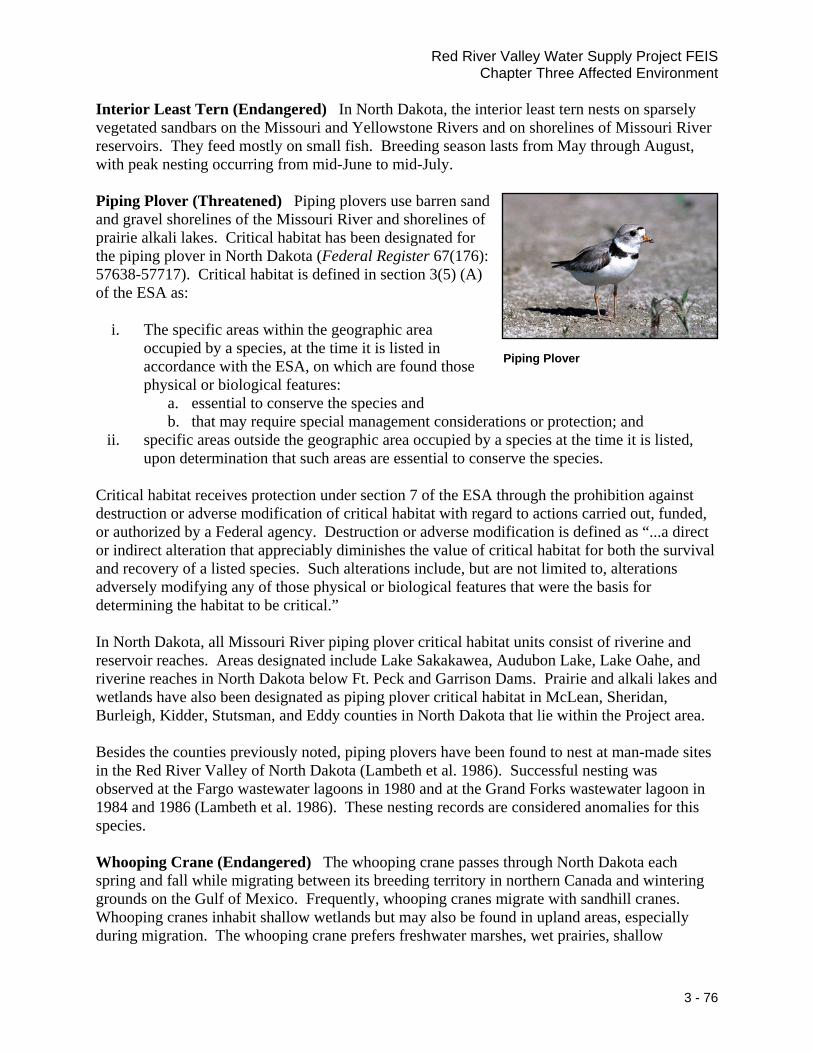
Red River Valley Water Supply Project FEIS Chapter Three Affected Environment
Interior Least Tern (Endangered) In North Dakota, the interior least tern nests on sparsely vegetated sandbars on the Missouri and Yellowstone Rivers and on shorelines of Missouri River reservoirs. They feed mostly on small fish. Breeding season lasts from May through August, with peak nesting occurring from mid-June to mid-July.
Piping Plover (Threatened) Piping plovers use barren sand and gravel shorelines of the Missouri River and shorelines of prairie alkali lakes. Critical habitat has been designated for the piping plover in North Dakota (Federal Register 67(176): 57638-57717). Critical habitat is defined in section 3(5) (A) of the ESA as:
i. The specific areas within the geographic area occupied by a species, at the time it is listed in accordance with the ESA, on which are found those physical or biological features:
Piping Plover
a. essential to conserve the species and b. that may require special management considerations or protection; and
ii. specific areas outside the geographic area occupied by a species at the time it is listed, upon determination that such areas are essential to conserve the species.
Critical habitat receives protection under section 7 of the ESA through the prohibition against destruction or adverse modification of critical habitat with regard to actions carried out, funded, or authorized by a Federal agency. Destruction or adverse modification is defined as “...a direct or indirect alteration that appreciably diminishes the value of critical habitat for both the survival and recovery of a listed species. Such alterations include, but are not limited to, alterations adversely modifying any of those physical or biological features that were the basis for determining the habitat to be critical.”
In North Dakota, all Missouri River piping plover critical habitat units consist of riverine and reservoir reaches. Areas designated include Lake Sakakawea, Audubon Lake, Lake Oahe, and riverine reaches in North Dakota below Ft. Peck and Garrison Dams. Prairie and alkali lakes and wetlands have also been designated as piping plover critical habitat in McLean, Sheridan, Burleigh, Kidder, Stutsman, and Eddy counties in North Dakota that lie within the Project area.
Besides the counties previously noted, piping plovers have been found to nest at man-made sites in the Red River Valley of North Dakota (Lambeth et al. 1986). Successful nesting was observed at the Fargo wastewater lagoons in 1980 and at the Grand Forks wastewater lagoon in 1984 and 1986 (Lambeth et al. 1986). These nesting records are considered anomalies for this species.
Whooping Crane (Endangered) The whooping crane passes through North Dakota each spring and fall while migrating between its breeding territory in northern Canada and wintering grounds on the Gulf of Mexico. Frequently, whooping cranes migrate with sandhill cranes. Whooping cranes inhabit shallow wetlands but may also be found in upland areas, especially during migration. The whooping crane prefers freshwater marshes, wet prairies, shallow
3 - 76

Red River Valley Water Supply Project FEIS Chapter Three Affected Environment
portions of rivers and reservoirs, grain and stubble fields, shallow lakes, and wastewater lagoons for feeding and loafing during migration.
Overnight roosting sites usually have shallow water in which whooping cranes stand. Whooping cranes roost on unvegetated sandbars, wetlands, and stock dams. Fall migration occurs in North Dakota from late September to mid October, while spring migration occurs from late April to mid June. Birds can show up in all parts of North Dakota, although most sightings occur in the western two-thirds of the state. Whooping cranes are usually found in small groups of seven or fewer individuals. They are easily disturbed when roosting or feeding.
Gray wolf (Threatened in Minnesota and Endangered in North Dakota) The gray wolf is an infrequent visitor to North Dakota, occasionally entering the state from Minnesota or from the province of Manitoba, Canada. In 2003, the Service changed the classification of the gray wolf under the ESA. Because of that change, there are three separate ESA listings for the species, which correspond to three geographic areas in the lower 48 states with gray wolf recovery programs. Both the North Dakota and Minnesota wolves are within the Gray Wolf Eastern Distinct Population Segment. In March 2006 the Service proposed to remove the Western Great Lakes Distinct Population Segment of gray wolves from the list of threatened and endangered species. This area includes the states of Minnesota, Wisconsin, and Michigan and parts of North Dakota, South Dakota, Iowa, Illinois, Indiana, and Ohio. In this area the Service proposed to remove federal ESA regulation regarding the gray wolf and to entrust wolf management responsibility to the states and tribes. The Service announced on February 8, 2007, a final rule to change the endangered status of the gray wolf (Federal Register (72) 26: 6052-6103). The gray wolf as of March 12, 2007, is delisted in Minnesota and in the portion of North Dakota north and east of the Missouri River upstream to Lake Sakakawea and east of the centerline of Highway 83 from Lake Sakakawea to the Canadian border but remains endangered in western North Dakota.
Whooping Crane (whoopers.usgs.gov)
Canada Lynx (Threatened) The Canada lynx, the only lynx in North America, is a forest-dwelling cat of northern latitudes. It feeds primarily on snowshoe hares but also will prey on small mammals and birds. Its range extends from Alaska, throughout much of Canada, to the boreal forests in the northeastern United States, the Great Lakes, the Rocky Mountains, and the Cascade Mountains. In Minnesota the majority of lynx occurrence records are from the northeastern portion of the State; however, dispersing lynx have been found throughout Minnesota outside of typical lynx habitat (Service 2000).
3 - 77

Red River Valley Water Supply Project FEIS Chapter Three Affected Environment
Pallid Sturgeon (www.sierraclub.org)
Pallid Sturgeon (Endangered) The pallid sturgeon occupies the Missouri and Yellowstone Rivers in North Dakota. The Service estimates that an isolated remnant population of less than 50 individuals remains in the Garrison reach of the Missouri River. There are no recent records (within the last 20 years) of successful pallid sturgeon reproduction in this reach. The Garrison reach of the Missouri River is outside of the recovery priority areas identified in the Pallid Sturgeon Recovery Plan (Service 1993). Reaches outside the recovery priority areas are not excluded from recovery actions but are designated as lower priority, because these areas have been altered to the extent that major modifications would be needed to restore natural physical and hydrologic characteristics.
Dakota Skipper (Candidate) Dakota skippers are small butterflies found in native prairie containing a high diversity of wildflowers and grasses. Habitat includes two prairie types: 1) low (wet) prairie dominated by bluestem grasses, wood lily, harebell, and smooth camas; and, 2) upland (dry) prairie on ridges and hillsides dominated by bluestem grasses, needlegrass, pale purple and upright coneflowers, and blanket flower.
The Dakota skipper is currently distributed in western Minnesota, the eastern half of North Dakota, and northeastern South Dakota (Service 2002). In North Dakota, there is concern about the population status because the species disappeared from all but two sites in recent years (Service 2002). Most of the locations for the Dakota skipper are on private lands in Minnesota and North Dakota, which are documented in a Service Status Assessment on this species (Service 2002). In North Dakota, Dakota skippers may be found in Ransom, Richland, Sargent, and Stutsman Counties. In Minnesota, they occur in Clay, Kittson, and Norman Counties.
Western Prairie Fringed Orchid (Threatened) The western prairie fringed orchid is a perennial orchid of the North American tallgrass prairie and is found most often on unplowed, calcareous prairies and sedge meadows. In North Dakota, the western prairie fringed orchid most frequently occurs in the sedge meadow community on the glacial Sheyenne Delta and in the moist tallgrass prairie. The Sheyenne National Grasslands, managed by the U.S. Forest Service and adjacent native prairie in southeastern North Dakota contain one of three large populations of the western prairie fringed orchid, two in the United States (Sheyenne Delta, North Dakota and Pembina Trail prairie complex in Minnesota) and one in Canada (Vita Prairies, Manitoba). The Western Prairie Fringed Orchid Recovery Plan (Service 1996) describes the distribution and habitat for this species throughout its range. It also identifies the threats and limiting factors affecting this species and a strategy of recovery and conservation measures.
Western Prairie Fringed Orchid
3 - 78

Red River Valley Water Supply Project FEIS Chapter Three Affected Environment
On the Sheyenne Delta, about 95 percent of the western prairie fringed orchids grow on the Sheyenne National Grasslands and 5 percent on private land. Life history, synecology, and demographics of the western prairie fringed orchid and management guidelines for the Sheyenne National Grasslands are well described in the U.S. Forest Service’s Western Prairie Fringed Orchid Recovery Strategy (U.S. Forest Service 2001) and in several Forest Service western prairie fringed orchid research reports (Wolken et al. 2001; Wolken 1995; Sieg and King 1995; and Sieg and Bjugstad 1994).
The western prairie fringed orchid has been found in several habitat types on the Sheyenne National Grasslands. These habitat types are described by the U.S. Forest Service (2001) as including Hummocky Sandhills and Deltaic Plain habitat associations (Manske 1980), including mesic toe slopes and wetlands of the Lowland Grassland habitat type, and adjacent tallgrass prairie of the Midland Grassland habitat type. The Lowland Grasslands habitat occupies wet-mesic, ephemerally inundated with a shallow water table and is confined to the basins of shallow wetlands, margins of deeper wetlands, and waterway margins (U.S. Forest Service 2001).
The Sheyenne Delta Aquifer is a thin, shallow water table characterized by hummocky land surface topography (Shaver 1998). Depth to the water table below land surface over much of the Sheyenne Delta aquifer is less than 8 feet, and the capillary fringe of water table and root zone are coupled (Shaver 1998). Western prairie fringed orchid habitat on the Sheyenne delta is often characterized as wetlands formed by exposure of the water table. Because prairie vegetation has adapted over time to changing groundwater elevations, Hopkins and Running (2000) suggest that buried soils enhanced prairie vegetation survival on the grasslands. Buried soils exert a strong control on the hydrology of the modern Sheyenne Delta landscape by introducing lateral water flow or contributing to “perched” groundwater. Because western prairie fringed orchids are found in different habitat types associated with hydric conditions, western prairie fringed orchids may depend on these perched wetlands for their survival under changing climatic conditions.
Hydrology research addressing the relationship of local hydrologic regimes and soil characteristics to the survival and growth of the western prairie fringed orchid population is limited. The interactive role of groundwater hydrology and soil characteristics as factors limiting the flowering persistence of orchids is also inadequate. This incomplete understanding complicates impact analysis of activities that could affect local groundwater and grasslands hydrology. However, it is clear from grassland research that orchid density positively correlates with surface soil moisture (Sieg and King 1995), and that moisture is also important to flower initiation. Wolken (et al. 2001) found that soil moisture influences orchid distribution on the grasslands. Wolken (1995) also identified 10 cm as the rooting depth for orchids and that soil moisture below 10 cm was less important.
Species of Special Concern North Dakota’s Species of Conservation Priority – Level I American Bittern This species is found primarily east of the Missouri River. Bitterns are secretive, hiding in wetland cattails and bulrushes. Nests of dead reeds or cattails are built a few inches above water among cattails. Birds will also nest in uplands.
3 - 79

Red River Valley Water Supply Project FEIS Chapter Three Affected Environment
American White Pelican The larger of two pelican species in North America, this species occurs statewide but primarily in the Missouri coteau and drift prairie. Chase Lake National Wildlife Refuge hosts North America’s largest nesting colony.
Baird’s Sparrow This sparrow occupies prairie habitat statewide but is less common in the Red River Valley. This ground-nesting bird prefers native mixed-grass prairie.
American White Pelican
Black-billed Cuckoo This truly unique species occurs statewide, particularly in the Turtle Mountains and along the Sheyenne River. This inconspicuous bird thrives in woodlands, thickets, prairie shrubs, shelterbelts, and wooded urban areas.
Black Tern These terns are located east of the Missouri River and use a variety of wetlands with emergent vegetation. They are commonly found hovering over water and then diving to catch small fish or insects.
Chestnut-Collared Longspur While this chestnut collared bird has a statewide distribution, it is rare in the Red River Valley. Its preferred habitat is grazed or hayed mixed-grass prairie, as well as short-grass prairie.
Ferruginous Hawk This is the largest hawk in North Dakota, and although it can be found throughout the state, it appears to be concentrated on the Missouri Coteau. It prefers predominantly native grasslands and shrubland habitat and often nests on the ground on rocky hillsides.
Franklin’s Gull This gull is found east of the Missouri River, with high densities around the Devils Lake area. As a colonial nester, it builds a nest of dead marsh plants that floats on water or attaches to reeds. It is often observed following tractors cultivating fields and eating meals of worms and insects forced to the surface.
Grasshopper Sparrow This short-tailed, flat-headed sparrow has a statewide distribution. Like most prairie sparrows, it inhabits idle or lightly grazed mixed-grass prairie, meadows and hayfields. It is a ground nester.
Lark Bunting This bird occurs statewide, but is less common in the Red River Valley. Sagebrush or sage prairie is preferred habitat for this species, but it also uses mixed-grass prairie interspersed with shrubs, such as wolfberry and western rose.
Long-Billed Curlew This is the largest shorebird in North America. It resides west of the Missouri River but is most likely limited to extreme southwest counties. It nests in short-grass prairie or in grazed mixed-grass prairie.
3 - 80

Red River Valley Water Supply Project FEIS Chapter Three Affected Environment
Marbled Godwit This bird is found statewide, with high densities in the Missouri Coteau. It uses a variety of wetlands, streams, or lakes. Nesting is generally on native prairie, which is often heavily grazed.
Nelson’s Sharp-Tailed Sparrow This sparrow dwells east of the Missouri River and prefers fens, but also uses shallow marsh zones of wetlands and lakes.
Sprague’s Pipit This sparrow exists statewide, except in the Red River Valley. This extremely secretive bird prefers extensive tracts of ungrazed or lightly grazed prairie.
Swainson’s Hawk Similar in size to the common red-tailed hawk, it occurs statewide. It usually inhabits woodlands building nests in lone prairie trees.
Sprague’s Pipit (Photo courtesy of Greg Bihrle, North Dakota Game and Fish) Upland Sandpiper A medium-sized shorebird that is
commonly seen standing on a wooden fencepost in a pasture. It can be found throughout the state in dry, open, mixed-grass prairie.
Willet This relatively large shorebird lives statewide, with heavy densities in the Missouri coteau and drift prairie. It uses a variety of wetland types and nests in uplands, preferably native prairie away from water.
Wilson’s Phalarope This bird is found statewide and is most often seen feeding in shallow wetlands or mudflats. Nesting is in grass on the margins of wetlands.
Yellow Rail This extremely shy marsh bird is rarely seen, because it runs through marsh vegetation to escape, rather than flying. It resides in habitats east of the Missouri River, preferring fens, or groundwater-fed wetlands that support diverse plant and animal life.
Blue Sucker This long, slender fish that grows up to three feet long is found in both the Missouri and Yellowstone River. They prefer swift current of large, turbid rivers in areas with rocky or gravel bottoms.
Pearl Dace A member of the minnow family this species is recorded in both Missouri and Red River systems. It typically is found in pools and avoids swifter main currents.
Sicklefin Chub This fish prefers large turbid rivers, usually with a sand or gravel bottom. This chub can be found mainly within the main channel of these systems and prefers water with a turbidity of less than 500 NTU. Sicklefin chub can be found at most depths within this habitat, but prefer depths between 2 and 5 meters with summer water temperatures in the range of 20°C to 24°C. Populations occur in the Yellowstone and upper Missouri rivers near the confluence of the two rivers.
3 - 81

Red River Valley Water Supply Project FEIS Chapter Three Affected Environment
Sturgeon Chub This chub prefers slow-moving turbid water in the upper Missouri and lower Yellowstone rivers in North Dakota. It lives primarily in the main channel and prefers water with a turbidity of less than 250 NTU but can be found in water up to 500 NTU. It survives at all depths in this habitat, but prefers depths between 2 and 5 meters with water temperatures in the range of 18°C to 24°C. Populations occur in the Yellowstone and upper Missouri rivers near the confluence of the two rivers.
Canadian Toad This toad occupies the margin of lakes, ponds, and wetlands, particularly permanent water. The species’ range covers all of North Dakota east of the Missouri River. They are considerably more aquatic than most toads; they will swim far into water for refuge.
Plains Spadefoot Toad This toad primarily occupies dry grasslands in the western two-thirds of North Dakota. It breeds in ephemeral wetlands but will tolerate a broad range of habitats even laying eggs in ditches or flooded agricultural fields.
Smooth Green Snake This snake lives throughout the state, except for the extreme southwest. It primarily inhabits grasslands, particularly hilly uplands. This is one of only a handful of snakes that is entirely insectivorous; it feeds on grasshoppers, crickets, and caterpillars.
Western Hognose Snake This hognose snake, featuring an upturned nose for shoveling into loose soil, is found statewide, except in northwestern North Dakota. It typically prefers sandy or gravelly habitats, often by rivers.
Minnesota Listed Species Baird’s Sparrow Baird’s sparrow lives in grasslands (native and tame). It prefers lightly to moderately grazed pastures and weedy fields where it forages on the ground for grass and weed seeds and insects, such as grasshoppers, caterpillars, and moths. The sparrows sometimes use planted cover (e.g., Conservation Reserve Program and dense nesting cover), dry wetland basins, wet meadows, and dense stands of grass within hay land and cropland (Dechant et al. 2003a). Baird’s sparrow nests on drier parts of the prairie in dead grass clumps or under low brush. General habitat requirements include moderately deep litter; vegetation height of >20 cm but <100 cm; moderately high, but patchy, forb coverage; patchy grass and litter cover; and little woody vegetation (Dechant et al. 2003a).
Baird’s Sparrow (www.mbr-pwrc.usgs.gov)
Henslow’s Sparrow Henslow's sparrows use grasslands that have well-developed litter; relatively high cover of standing dead residual vegetation; tall, dense vegetation; and generally low, woody stem densities (Herkert 2003). An abundant uncompressed litter layer and standing tall forbs for song perches (Hanson 1994) also characterize Henslow’s sparrow habitat.
Henslow's sparrows have been observed several times during the breeding season in North Dakota (e.g., Renken and Dinsmore 1982). Historically the species was considered a breeder in the state (e.g., Larson 1928), but there are no records of nests before 2001, when two nests were
3 - 82

Red River Valley Water Supply Project FEIS Chapter Three Affected Environment
found. The nests were on the Sheyenne National Grasslands in Richland County and on Conservation Reserve Program land in Kidder County (Shaffer et al. 2003).
In Minnesota, the species was formerly widespread, but uncommon in the southern half of the state. Most of the recent (post-1960) breeding season records are largely restricted to the southeastern portion of the state (Igl 2002; Hanson 1994). Hanson (1994) found evidence of nesting birds in Winona, Aitkin, Hennepin, Hubbard, Lac Qui Parle, and Washington Counties. Hanson (1994) also reported observations of Henslow’s sparrow in Wilkin and Dakota Counties.
Loggerhead Shrike In Minnesota, shrikes use primarily open agricultural areas interspersed with grasslands for their breeding territories (Brooks 1988). Shrikes nest in trees with very shrubby or bushy growth form, with eastern red cedars being the most common tree used (Brooks 1988).
Several shrike surveys have been conducted in Minnesota during 1986-1987 (Brooks 1988), in 1995 (Etter 1995), and in 1996 (Eliason 1996). The most nests found were in 1986, when 32 nesting pairs were identified in 12 counties. In 1995, nests were located in one additional county. Nesting has been observed as far north as Clay County and south and east as far as Fillmore and Winona counties. Clay County is the only Minnesota County supporting shrikes within the Project area. The highest number of nests found in Clay County is four, found in 1995.
Chestnut-collared Longspur Chestnut-collared Longspur habitat characteristics are described thoroughly by Dechant (et al. 2003c). Chestnut-collared Longspurs use level to rolling mixed-grass and shortgrass uplands, and, in drier habitats, moist lowlands. They prefer open prairie and avoid excessively shrubby areas (Dechant et al. 2003c). However, scattered shrubs and other low elevated perches, such as Canada thistle, often are used for singing (Dechant et al. 2003c).
In Minnesota, persisting populations of chestnut-collared longspurs are centered east and southeast of the Fargo area with the largest population located at Felton Prairie in Clay County (Wyckoff 1985). Wyckoff (1985) estimated the population at Felton Prairie at just over 300 birds.
Chestnut-Collared Longspur (Photo courtesy of Greg Bihrle, North Dakota Game and Fish Department)
Wilson’s Phalarope Wilson's Phalaropes use both fresh and alkali wetlands with open water, emergent vegetation, and open shoreline (DeChant et al. 2003d). Nesting habitat varies widely, including wetlands, wet meadows, upland grasslands, and road rights-of–way (DeChant et al. 2003d).
In Minnesota, this bird prefers shallow prairie sloughs adjacent to wet meadow areas (Minnesota Ornithologists Union 2004). Current threats to their habitats and small numbers of birds found
3 - 83

Red River Valley Water Supply Project FEIS Chapter Three Affected Environment
during county biological survey work indicate that this bird should be listed as threatened in Minnesota (Minnesota Ornithologists Union 2004).
Horned Grebe Horned grebes can be found in lakes and shallow wetlands. Nests are built over water, made from available vegetation, and are anchored to or supported by emergent vegetation. This bird’s breeding range includes northwestern-most counties in Minnesota. The lack of breeding birds in this area, where the species consistently bred in the past, led to its classification as threatened in Minnesota (Minnesota Ornithologists Union 2004). A survey of 76 wetlands in northwestern counties during the nesting season in 1991 found only one grebe on the Roseau River Wildlife Management Area, Roseau County (Boe 1992). No nesting was documented during this study.
Common Tern Common terns nest on sparsely vegetated sand in large lakes in Minnesota. Despite increased level of management for this species, its population in Minnesota remains vulnerable. Quality of habitat is important to terns, including isolation from predators, constant and nearby food supply, and on-site conditions that allow birds to see and hear other birds in the colony (McKerarnan and Cuthbert 1989).
Trumpeter Swan The MNDNR began its Trumpeter Swan Recovery Program in 1982. From 1986 though 1988 it annually collected and incubated 50 Alaskan Trumpeter Swan eggs. By 1994, the project raised and released 215 Trumpeters and estimated a total free flying flock of 250 in western Minnesota and beyond (Matteson et al. 1995). The goal of the recovery program was to establish a minimum nesting population of 15 pairs in the western part of the state. That goal has been achieved, and the project has changed its focus to southern Minnesota.
Trumpeter swans are found in riverine wetlands, lakes, ponds, marshes, or any other variety of wetlands that meet their preferences. Large, shallow wetlands, 1-3 feet deep, with a mix of vegetation and open water offer ideal swan nesting habitat. Nest building begins in mid-April and lasts 1-2 weeks. Trumpeter swans feed on submerged and emergent aquatic vegetation, though they may include a small percentage of invertebrates in their diet (Southwell 2002).
Trumpeter Swan (www.dnr.state.wi.us)
Mucket This mussel species was once important in the pearl button industry but is now limited in its occurrence to a small number of drainages (MNDNR 1995). The mucket has been found in the Ottertail River in Minnesota (Hart 1995).
Assiniboia Skipper Some authors consider the plains skipper and the branded skipper butterflies to be subspecies. This species prefers native shortgrass and mid-grass prairies and aspen parkland. Larval host plants include needlegrass, Junegrass, blue gramma, and possibly sedges. Adults pursue nectar from flowers including asters, goldenrods, and blazing star. Assiniboia skippers are found in North Dakota and in Kittson, Clay, and Roseau Counties in Minnesota.
3 - 84

Red River Valley Water Supply Project FEIS Chapter Three Affected Environment
Garita Skipper The Garita skipper butterfly occupies dry and moist short-to midgrass prairie only where native grasses are present. Occupied areas are usually open areas such as shortgrass prairie knolls, swales, limestone openings, open woodland, mountain meadows. Garita skippers are found in Clay and Kittson Counties. The caterpillars feed on a variety of grasses such as bluegrass and blue gramma grass. This species is found in both North Dakota and western Minnesota.
Uhler’s Arctic The Uhler’s Arctic butterfly occupies slopes and foothills in dry, open bunchgrass habitats, tundra, and openings in pine forest. In North Dakota, it inhabits well-drained prairie slopes statewide, being decidedly more common westward. In Minnesota, it is restricted to Clay County. The larvae feed on grasses and sedges. The adults seldom feed but occasionally eat yellow composites.
Tiger Beetle (Cicindela fulgida westbournei) This insect species has a very restricted range being known only from southern Manitoba and Saskatchewan, northern North Dakota, and northwestern Minnesota. In Minnesota, only two sites are known in Kittson County. The habitat for this species is damp alkali areas dominated by Salicornia rhubra.
Pale Moonwort In Minnesota, reported habitats included maple/basswood forests, red and jack pine forests, a sandy ridge between a bog and an old gravel pit, wetlands, ephemeral ponds, pine needles, oak leaves, a housing development lot with weedy species, open fields, a log landing, a narrow bench beside a small stream, and open tailings ponds (Mulligan 1999 in Chadde and Kudray 2003). Disturbance seems to be a consistent trend (Mulligan 1999 in Chadde and Kudray 2003). There are 26 sites in Minnesota, and most of the Minnesota sites are in the northeastern counties and in Polk County in the northwest (Mulligan 1999 in Chadde and Kudray 2003).
Sterile Sedge Sterile sedge is a characteristic sedge of calcareous fens and other inland fresh meadows supported by stable, calcareous groundwater seepages (Eggers and Reed 1997). It is found in Polk County, Minnesota.
Garber’s Sedge Garber’s sedge occupies moist shores, meadows, and fens on base-rich soils. This wet edge species occurs in Kittson County, Minnesota.
Short-Pointed Umbrella Sedge Grows in wet often sandy shores and damp, disturbed soils and is found in Traverse County, Minnesota. Sterile Sedge
(www.npwrc.usgs.gov/resource/plants/mnplant/caste.htm)
Ram’s-head Lady’s-Slipper In Minnesota, biologists have noticed that this species is found more often in the transition zone between upland forest and lowland conifer (cited in U.S. Forest Service 2000, as Shackleford 2000, personal communication). This species has been found at 62 sites in 17 Minnesota Counties (U.S. Forest Service 2000) including Becker County (http://plants.usda.gov/java/county?state_name= Minnesota&statefips=27&symbol=CYAR5 accessed August 17, 2006).
3 - 85

Red River Valley Water Supply Project FEIS Chapter Three Affected Environment
Beaked Spike Rush This rare spike-rush is restricted to calcareous fens and calcareous shores (Eggers and Reed 1997). It may form dense stands and occurs in Norman County, Minnesota.
Frenchman’s Bluff Moonwort This species is only known from one locality in western Minnesota (Norman County) where it grows with B. campestre and B. simplex. Other records for this species are in Kittson County.
Canadian Federally Listed Species Lake Winnipeg Physa Snail The COSEWIC lists this species as endangered. Populations of this species are limited to Lake Winnipeg, Manitoba, where the species continues to decline in extent of occurrence, area of occupancy, and extent of habitat due to habitat alteration, human disturbance, and quality of habitat. Evidence further suggests that nutrients and contaminants from sewage lagoons, industries, waste storage facilities, and/or landfills are contributing to declines in this species (COSEWIC 2002). Lake Winnipeg Physa
(COSEWIC 2002)
These snails are found on algae-coated rocks at depths less than 1 meter, in exposed, high-energy areas. Very little is known about the biology of this species (COSEWIC 2002). This species was only recently discovered and described in the scientific literature (Pip 2004), although analyses are in the process of being published. Dr. Dwight Taylor, an Oregon State University physid expert who has described many physid species worldwide, says that the Lake Winnipeg Physa snail is a most unusual and unique species. Dr. Taylor and Dr. Eva Pip, University of Winnipeg, are undertaking DNA sequencing studies to determine how these snails are related to other physids (Lake Winnipeg Research Consortium 2005a).
Lake Sturgeon The western population of lake sturgeon was designated by COSEWIC in May 2005 as an endangered species. These recommendations have been forwarded to Environment Canada where a decision will be made on whether to list the species under SARA. The western population includes the Red River and Lake Winnipeg habitats. The western population has experienced an estimated overall decline of 77% due to exploitation and habitat loss and degradation related to dams, impoundments, and changes in patterns of water use.
Silver Chub The silver chub has been designated by COSEWIC as a species to be protected, and this fish is currently protected under SARA. There is a healthy population of silver chub in the Red River, and the Lake Winnipeg population of this species is one of the few, if not the only remaining healthy and abundant population remaining in North America (Lake Winnipeg Research Consortium 2005b). Low dissolved oxygen levels and water temperature fluctuations adversely affect silver chub. The silver chub is a benthic feeder that eats aquatic insect larvae such as caddis flies, mayflies, and amphipods. Adults sometimes surface to feed on emerging insects. Silver chub play an important role in the food web by sustaining the larger game fish, like walleye, sauger, channel catfish, and northern pike.
3 - 86

Red River Valley Water Supply Project FEIS Chapter Three Affected Environment
Bigmouth Buffalo The bigmouth buffalo was designated by COSEWIC as a species to be protected in 1989. This fish must be reassessed against revised criteria before it can be protected under SARA. The Lake Winnipeg Research Consortium reports that this species has a limited and interrupted distribution and occurs in low numbers (Lake Winnipeg Research Consortium 2005b).
The bigmouth buffalo is susceptible to parasitic infections and may be impacted by flood control practices, which limit spring flooding thus reducing spawning opportunities. It has likely already been adversely affected by the common carp (an introduced species), since its spawning habitat is used by the carp for both spawning and feeding. The bigmouth buffalo is a benthic (bottom) and pelagic (open water) feeder with a diet consisting of zooplankton and insect larvae. It uses its gill rakers to filter plankton in midwater and tiny organisms from the sediment when it feeds on the bottom (Lake Winnipeg Research Consortium 2005b).
Shortjaw Cisco This species was first designated by COSEWIC as threatened in 1987. Its status was re-examined and confirmed in 2003. The shortjaw cisco is not protected yet under SARA. Public consultations are still required before the federal cabinet makes this decision. The recognized threats to the shortjaw cisco include intensive fishing, introduction of exotic species, and climate change (Lake Winnipeg Research Consortium 2005b).
Other limiting factors may include habitat loss, environmental degradation, and hybridization with other cisco species. Any population of this fish outside of the Great Lakes may assume a greater importance, as surviving stocks of a declining species. It has become rare in Lakes Michigan and Huron. Shortjaw cisco habitat includes both benthic and pelagic environments in deep water. It has been reported to feed on benthic crustaceans and mollusks and is the prey of burbot (Lake Winnipeg Research Consortium 2005b).
Chestnut Lamprey In 1991 the COSEWIC designated this lamprey as a species to be protected. The reason for the designation was due to its limited distribution and low numbers. The status of this species must be reassessed against revised criteria before the chestnut lamprey can be protected under SARA. Habitat degradation due to siltation and pollution of spawning areas is the primary threat to this species. Deteriorating river environments threaten its food supply. Chemical pollution can cause mortality at all ages, and eutrophication can cause mortality in the young.
Its life cycle can be divided into two phases - larvae and adults. The larvae remain burrowed in the sand-mud substrate for five to seven years filter-feeding on organic debris, algae, and protozoa. Being a first-level consumer is unusual for North American fish. The adult phase lasts about one year. During its adult life, it spawns only once and then dies. To spawn, schools of lamprey construct nests with their oval disks and bury their eggs. Adults are parasitic on other fish, including walleye and sauger, among others. No other family of fish has this feeding role in Manitoba. Unlike the sea lamprey, the chestnut lamprey generally does not kill its host and has no apparent adverse effects on host populations (Lake Winnipeg Research Consortium 2005b).
3 - 87

Red River Valley Water Supply Project FEIS Chapter Three Affected Environment
Protected Areas
Introduction What protected areas (federal and state lands and other natural areas worthy of special
interest) are in the area of potential effects?
The following section describes protected areas in the Project area of potential effects in North Dakota and Minnesota. Protected areas include federal lands, especially Service fee title and easement lands and national wildlife refuges; state lands, like parks and wildlife management areas; and areas recognized as being of special interest under state or private programs because of native habitats or other natural features.
Methods To inventory protected areas in potential pipeline construction zones and wellfields, GIS layers were used. The layers were developed using state and federal agency land use databases. This inventory was done by superimposing Project features over land use data sets and determining the types of lands that coincide with the proposed location of Project features. These inventories covered pipeline routes, which are corridors 400 feet in width (typically 200 feet either side of the section line), and areas overlying aquifers.
Riparian buffers were created to inventory riparian areas adjacent to the Sheyenne River below the point where Project water would be added. The entire length of the Red River in the United States was also analyzed. The details of the inventory process are explained in the natural resource areas section of chapter three.
Existing Condition
Federal Lands U.S. Army Corps of Engineers Lands The Corps land in the area of potential effects in North Dakota is mostly associated with their project facilities and management areas associated with the Missouri River system and Baldhill Dam on the Sheyenne River. Overall, Lake Ashtabula/Baldhill Dam has 2,582 acres of public land and approximately 5,250 acres of water, which provide a variety of recreational opportunities (Corps 2003b).
U.S. Fish and Wildlife Fee Title and Easement Interests in North Dakota The Service administers fee title and easement lands throughout North Dakota, including the counties within the Project area (see Appendix H). Service lands owned in fee title include National Wildlife Refuges, waterfowl production areas, and a National Fish Hatchery. Refuges in the Project area include Audubon National Wildlife Refuge and Kelly’s
Aerial Photo of Lake Ashtabula (www.mvp.usace.army.mil)
3 - 88

Red River Valley Water Supply Project FEIS Chapter Three Affected Environment
Slough National Wildlife Refuge. The Service’s Valley City National Fish Hatchery is also in the Project area on the Sheyenne River north of Valley City.
Waterfowl production areas, purchased by the Service with funds from the sale of Federal Duck Stamps, were established to protect and restore waterfowl habitat. Waterfowl Development Areas are lands purchased by Reclamation as part of North Dakota’s GDU. Reclamation developed these areas for wildlife by restoring drained wetlands and by planting cropland acres to grass. The waterfowl development areas have been transferred to the Service to be managed primarily for the production of migratory birds and for public use.
The Service also administers wetland easement tracts and easement refuges in private ownership that are protected from all drainage, filling, and burning activities. The wetland easements do not affect normal farming practices, such as cropping, haying, grazing, plowing, or working wetlands when dry from natural causes. Grassland easements restrict surface disturbance to prevent the conversion of grassland habitat to agriculture or other uses. The Service also administers all Farmers Home Administration easements, which may include protection of any combination of grasslands, wetlands, or forested vegetation. Easements are in the Audubon, Arrowwood, Chase Lake, Devils Lake, Long Lake, Tewaukon, and Valley City Wetland Management Districts.
Audubon National Wildlife Refuge Established as Snake Creek National Wildlife Refuge in 1955, the refuge provides habitat for a wide variety of wildlife in North Dakota. Developed to compensate for habitat lost when Garrison Dam flooded Missouri River bottom lands, the refuge was renamed in 1967 in honor of John James Audubon. Encompassing 14,735 acres, much of the refuge - 10,421 acres - includes Audubon Lake itself. Nevertheless, 3,020 grassland acres offer habitat for upland wildlife of all sizes including Baird's and Le Conte's sparrows in addition to sharp-tailed grouse, foxes, coyotes and white-tailed deer. The 370 wetland acres offer habitat for shorebirds, gulls, terns, rails, and cranes. In 2003, Audubon Lake was designated as piping plover critical habitat. Almost 100 islands dot Audubon Lake - enough for 450 acres of giant Canada goose and duck nesting habitat. The refuge serves as an important feeding and resting area for waterfowl migrating in the Central Flyway. Cropland and several large tree plantings can also be found on the refuge.
Nesting Island Stabilized by Reclamation in Audubon Lake
Audubon National Wildlife Refuge is primarily managed for waterfowl production and as a rest area for migratory birds. The most important refuge habitats for meeting the refuge’s principal objectives are the waterfowl nesting islands and brood marshes adjacent to the lake. The islands range in size from a fraction of an acre to over 70 acres. The islands are highly valued waterfowl nesting habitat. Studies conducted on the refuge islands indicate that the nest success ranges between 60-90% on the islands compared to 10-20% on the adjacent uplands. Wetlands adjacent to the lake provide essential pair habitat for waterfowl during the spring and brood rearing habitat during the summer.
3 - 89

Red River Valley Water Supply Project FEIS Chapter Three Affected Environment
Audubon Wildlife Management Area As a major subimpoundment of Lake Sakakawea, Audubon Lake and 26,020 acres of adjacent uplands were made available to the Service in North Dakota for management as part of the National Wildlife Refuge system. This agreement came from the Corps’ 1955 General Plan for Lake Sakakawea. Management was signed over to the Service in May 1956. By October 1956 a cooperative agreement signed by the Service and the North Dakota Game and Fish Department provided for State management of the northern portion of Audubon Lake. This 11,285-acre area is known as the Audubon Wildlife Management Area.
Tewaukon National Wildlife Refuge The Tewaukon National Wildlife Refuge is located in Sargent County in the southeast corner of North Dakota and is 8,363 acres in size. The refuge lies on the gently rolling glacial till plain of the Northern Glaciated Plains Ecoregion and the Lake Agassiz Plain Ecoregion. Its flat to rolling topography is interspersed with wetlands of various sizes and depths. The refuge is composed of the Tewaukon and Sprague Lake Units. The refuge overlies the Spiritwood, Gwinner, Milnor Channel, and Brightwood Aquifers.
The refuge was established in 1945 by Executive Order 6910, which provided for acquisition of easements for flowage and refuge purposes and filing of water rights. The easement refuges where water rights were applied for included Lake Tewaukon, Hepi Lake, Lake Elsie, Storm Lake, and Wild Rice Refuges. Easements were purchased on Lake Elsie, Wild Rice, and Storm Lake Refuges in 1934 as water and wildlife conservation projects. The Service divested Lake Elsie in 1998. The real property interest, which the Service purchased in Wild Rice and Storm Lake Easement Refuges, is limited and is similar to the interest that was purchased on some of the tracts around Lake Tewaukon in the 1930s. On these three refuges, the Service purchased refuge easements, which reserved the right to impound water, maintain no hunting areas for migratory birds, and serve as wildlife conservation demonstration areas.
The refuge has four key habitats that provide food, water, shelter, and space for hundreds of wildlife species. Wetlands provide important migration and breeding habitat for waterfowl and shorebirds and are home to leopard frogs, painted turtles, mink, muskrats, and a variety of aquatic invertebrates. Tallgrass prairie remnants are some of the last remaining habitat for nesting and migrating grassland birds, rare butterflies, and other prairie wildlife. Other grassland habitats furnish winter cover for resident wildlife and cover for ground nesting birds and other grassland species. The Wild Rice River flows through the Tewaukon Refuge.
Valley City National Fish Hatchery The Valley City National Fish Hatchery is one of two federal fish hatcheries in North Dakota. This facility consists of the main hatchery at Valley City and a smaller subunit at Baldhill Dam. Production at the Valley City hatchery began in 1940 and at the Baldhill subunit in 1952. There are 13 fish rearing ponds totaling 25.8 acres at the Valley City hatchery and 20 rearing ponds, totaling 12.6 acres at the Baldhill subunit. This facility was originally
Aerial View of Valley City National Fish Hatchery (http://valleycity.fws.gov/index.htm)
3 - 90

Red River Valley Water Supply Project FEIS Chapter Three Affected Environment
built for bass and bluegill production. Presently it rears northern pike, walleye, yellow perch, tiger muskie, smallmouth bass, largemouth bass, and bluegill. These fish are stocked into Missouri River reservoir projects, National Wildlife Refuges, Indian waters, and are used to assist North Dakota state programs. A building was constructed in 1981 for rearing and diet testing of warm and cool water species.
Sheyenne National Grasslands With Red Flags Marking Orchids U.S. Fish and Wildlife Fee Title and
Easement Interests in Minnesota The Service also administers fee title and easement lands throughout Minnesota, including the counties within the Project area (Appendix H). Service lands owned in fee title include many waterfowl production areas. There are Service easements in the Audubon, Detroit Lakes, and Fergus Falls Wetland Management Districts.
U.S. Forest Service Lands The Sheyenne National Grasslands encompasses 70,300 acres of National Forest Service lands in southeastern North Dakota. It is one of the largest public land holdings of tallgrass prairie. Most of the grasslands drain north into the Sheyenne River. The Wild Rice River drains the Hankinson Unit.
Distinguishing landforms include the Sheyenne River terrace, choppy sandhills, hummocky sandhills, and deltaic plains. Each landform has distinct plant communities. The choppy sandhills have oak savanna interspersed with mixed-grass and oak woodlands. The hummocky sandhills have three distinct plant communities based on topography - mixed grass prairie dominated by little bluestem, prairie sandreed, and side oats gramma; tall-grass prairie dominated by big bluestem, Indian grass, and porcupine grass; and wetlands frequently dominated by wooly sedge and northern reed grass. The deltaic plain primarily supports tallgrass prairie types dominated by big bluestem, Indian grass, and switch grass. The river terrace is eastern hardwood deciduous forest dominated by American elm and basswood. It is also within the river terrace that rare fens occur.
The Sheyenne National Grasslands supports many unique attributes including: • Many sensitive plants including the threatened western prairie fringed orchid. • Habitat for one of the last populations of greater prairie chicken in North Dakota. • Largest block of tallgrass prairie and oak savanna in public ownership in North Dakota. • North Country National Scenic Trail, and • Complex of rare plants and unique riparian habitats – the Sheyenne River Corridor.
State Lands North Dakota State Parks There are five state parks in North Dakota that may be affected by the Project. Four are near the Missouri River, including Fort Stevenson State Park, Lake Sakakawea State Park, Cross Ranch State Park, and Fort Abraham Lincoln State Park. One park, Fort Ransom State Park, is located on the Sheyenne River.
3 - 91

Red River Valley Water Supply Project FEIS Chapter Three Affected Environment
Minnesota State Parks There are four state parks located in Minnesota that may be affected by the Project. Three of the parks, including the Buffalo River, Maplewood, and Glendalough State Parks, are in the vicinity of proposed groundwater sources for the Red River Basin Alternative. The remaining park, Red River State Recreation Area, is on the Red River.
North Dakota Nature Preserves In North Dakota, state owned and managed nature preserves are open to the public for passive recreation, such as bird watching, hiking, and wildflower viewing. These areas were established by the North Dakota Parks and Recreation Department under the Nature Preserves Act.
H.R. Morgan Nature Preserve This preserve is in Richland and Ransom Counties, North Dakota. The North Unit of H.R. Morgan lies north of the Sheyenne River, straddling the Ransom-Richland County line. The South Unit is south of the Sheyenne River, approximately 24 miles east-northeast of the town of Lisbon.
The North Unit spans over a mile of the Sheyenne River and extends from the Sheyenne sandhill uplands down to the floodplain forest lowlands. Mirror Pool, located in the North Unit, is named for the mirror-like quality of the central oxbow pool. The preserve contains an array of significant natural features: an undisturbed mature forest, a concentration of rare fern species, and relatively extensive wetland habitat. It is tied to riverine oxbows; short, spring-fed tributaries dammed by beavers; and bands of alder thicket along the spring-fed wetland margins. The mature forest represents an excellent Sheyenne River stand, which, in turn, represents some of the best eastern deciduous forest in North Dakota. All of the primary features are in the valley bottom or are associated with groundwater seepage and springs near the base of the valley wall.
The South Unit is perched below the Sheyenne River in a former oxbow of the river. It is bordered on three sides by steep wooded slopes, which grade into sandhill deposits of the Sheyenne River delta. Fed by constant groundwater seepage, the site is underlain by a localized peat deposit. Shrub-dominated communities cover the site.
Head of the Mountain Nature Preserve This 100-acre nature preserve, about nine miles southeast of Rutland in Sargent County, North Dakota, sits at the edge of a steep escarpment, providing an overlook of the surrounding landscape. The land to the west and south is hilly, which contrasts with the flat-lying topography to the north and east. The eastern border of the preserve is a manmade lake created by Frenier Dam. This impoundment is shallow, bordered by cattails and other aquatic vegetation.
The most abundant cover is approximately 60 acres of dry, mesic tallgrass prairie. This prairie contains a variety of plants, including native grasses such as porcupine grass, sideoats grama, big and little bluestem and forbs such as purple coneflower, lead plant, and pasque flower. The other 40 acres consists of a bur oak woodland covering a generous portion of the southern border and is comprised mainly of American elm, green ash, and bur oak. The eastern border of the preserve is a small reservoir created by Frenier Dam. The reservoir is shallow, bordered by cattails. The native prairie, wooded draw, and adjacent reservoir combine to provide good habitat for a variety of wildlife.
3 - 92

Red River Valley Water Supply Project FEIS Chapter Three Affected Environment
Minnesota Scientific and Natural Areas The State Natural Areas program preserves natural features and rare resources of exceptional scientific and educational value. State Natural Areas are open to the public for nature observation and education but are not intended to support intensive recreational activities. The State Natural Areas Program's goal is to ensure that no single rare feature is lost from any region of the state. This requires protection and management of each feature in sufficient quantity and distribution across the landscape.
North Dakota State Wildlife Management Areas There are 85 state wildlife management areas scattered throughout all of the North Dakota counties within the Project area, except Traill County, which has no state wildlife management areas (Appendix H). Only one could be directly affected by the project, Audubon Lake Wildlife Management Area. The North Dakota Game and Fish Department also has cooperative partnerships with private landowners through its Private Land Open to Sportsman program. These lands are located throughout the state.
Minnesota State Wildlife Management Areas There are scattered tracts of land designated as State Wildlife Management Areas in Minnesota that provide recreation for hundreds of thousands of upland, waterfowl, and deer hunters each year on 1.1 million acres of habitat for most of Minnesota's game and nongame wildlife species. Wildlife management areas are managed for wildlife production and are open to public hunting and wildlife watching.
Other North Dakota Public Lands The state of North Dakota owns scattered tracts of land throughout the Project area. The North Dakota State Land Department leases and manages surface acres held in trust for various schools and institutions. Grassland leasing is the most widely recognized function of the Land Department with 97% of the land in pasture and 3% in crop or hay.
Other Protected Areas North Dakota Natural Areas Registry In order to increase protection of natural areas on private lands, the Nature Preserves Program operated by the North Dakota Parks and Recreation Department established the Natural Areas Registry in a joint venture with the Nature Conservancy. This program notifies landowners of important natural features on their land and requests voluntary protection by the landowner. The landowner may enroll in the program and receives recognition and management advice from program staff. Over 50 sites have been successfully registered to date.
North Dakota Natural Heritage Inventory Managed by the North Dakota Parks and Recreation Department, the main purpose of the inventory is to identify North Dakota’s natural features and establish priorities for their protection. Since the inventory’s inception in 1981, over 4,000 records of important species and habitats have been identified and catalogued.
Information from the Natural Heritage Inventory has been used to identify high quality natural areas and potential nature preserves. Two dedicated preserves, which are listed below as natural preserves, occur in the Project area. These preserves have covenants on the land that protect the important natural features.
3 - 93

Red River Valley Water Supply Project FEIS Chapter Three Affected Environment
Nature Conservancy The Nature Conservancy works to protect critical natural lands in North Dakota targeting prairies and woodlands endangered by development and threatened species, such as piping plovers and the western prairie fringed orchid. Within the Project area, the Nature Conservancy owns Pigeon Point Reserve and Brown Ranch.
Pigeon Point Preserve This preserve, 8 miles southeast of Sheldon, in Ransom County, North Dakota, has a high diversity of wetland habitats and plant life including at least 15 rare plants in fen and wetland thicket habitats. The preserve also has one of the best developed, spring-fed streams in the Sheyenne River Valley. It also has upland sandhill habitat, native tallgrass prairie, and riparian and wetland forests. The Nature Conservancy owns 572 acres at Pigeon Point.
Brown Ranch Brown Ranch is located on the southern edge of the Sheyenne Delta in North Dakota. Tallgrass prairie vegetation dominates the upland areas, with wetlands or wet prairies filling the lower-lying swales. It is one of the few large blocks of grassland left in the tallgrass prairie region. Brown Ranch is located in Ransom County about 8 miles northeast of Milnor, and its 1,531 acres are managed by the U.S. Forest Service.
3 - 94

Red River Valley Water Supply Project FEIS Chapter Three Affected Environment
Historic Properties
Introduction What types of historic properties (significant cultural resources) have been previously
recorded in the area of potential effects?
This section presents an inventory of cultural resources in the area that could be affected by Project alternatives (figure 3.16). Cultural resources are the physical remains of a site, building, structure, object, district, or property of traditional religious and cultural importance to Native Americans. Historic properties are significant cultural resources that are either included on or have been determined eligible for listing on the National Register of Historic Places. Because most of the cultural resources have not been evaluated to determine if they are eligible for listing, the more generic term “cultural resources” is used in this discussion. The terms used in this section are defined in the blue box to the right.
Cultural Resource Terms
Archaeological Site – is physical evidence or remains of past human activity at a specific location. Prehistoric archaeological sites predate written records and historic archaeological sites generally are associated with European exploration and settlement of the area.
Architectural Site – is a building, which is a structure created to shelter any form of human activity (such as a house, barn, church, or hotel) or a structure, which is a work composed of interdependent and interrelated parts in a definite patter or organization (such as bridges, tunnels, canals, or fences).
Cultural Resource – The physical remains of a site, building, structure, object, district, or property of traditional religious and cultural importance to Native Americans.
Historic Property – Any prehistoric or historic site, building, structure, object, district, or property of traditional religious and cultural importance to Native Americans that is included on or has been determined eligible for listing on the National Register of Historic Places. Only historic properties are protected under the National Historic Preservation Act.
Isolated Find – is a location with fewer than five artifacts, which shows little potential for additional finds. Finds are generally not considered to qualify as historic properties.
National Register of Historic Places – A registry maintained by the Secretary of the Interior of sites, buildings, structures, objects, or districts or properties of traditional religious and cultural importance to Native Americans that have local, state, regional, or national historic or prehistoric significance.
Because the proposed Project is a federal action, it must comply with federal legislation concerning historic properties, specifically Section 106 of the National Historic Preservation Act of 1966, as amended. To comply with Section 106 for activities in North Dakota, this Project will be administered either in accordance with an existing programmatic agreement executed by Reclamation, the Advisory Council on Historic Preservation,
Site Lead – is a site that was insufficiently recorded or reported by the public but not professionally verified. Site leads are generally not considered to qualify as historic properties without verification.
State Historic Preservation Officer – The individual appointed or designated in accordance with the National Historic Preservation Act, who is the official representative of a state for the purposes of complying with Section 106 of the Act.
Tribal Historic Preservation Officer – The individual appointed or designated in accordance with the National Historic Preservation Act, who is the official representative of an Indian tribe for the purposes of complying with Section 106 of the Act.
3 - 95

Red River Valley Water Supply Project FEIS Chapter Three Affected Environment
and the North Dakota SHPO (State Historic Preservation Officer) or in accordance with a Project-specific programmatic agreement currently under discussion (see Appendix I). For activities in Minnesota, compliance will be addressed in consultation with the Minnesota SHPO, if an alternative is selected that would affect historic properties in Minnesota. In addition, tribes with an historic or traditional interest in the Project’s areas of potential effects will be consulted.
The first steps in compliance with the National Historic Preservation Act and the programmatic agreements are to initiate consultation with SHPOs, Tribal Historic Preservation Offices, and tribes and to complete a Class I inventory. The purpose of the Class I inventory is to identify whether any historic properties are known that may be affected by the Project and to determine the potential for encountering previous unknown historic properties. Only historic properties are protected under the National Historic Preservation Act. Consultation has been initiated and Class I inventory has been completed for all action alternatives (Jackson et al. 2006). In addition, because of a change in alignment for the preferred alternative and a small change in the GDU Import Pipeline, the Class I was updated for both of these alternatives (Jackson 2007). This section summarizes the results of those inventories, which are appended as a supporting document to this FEIS. Letters initiating consultation with SHPOs and Tribal Historic Preservation Officers and their responses are in Appendix I. The Project-specific programmatic agreement is also in that appendix.
Figure 3.16 – Overview Map of the Project Area of Potential Effects (Jackson et al. 2006: figure 1.1).
3 - 96

Red River Valley Water Supply Project FEIS Chapter Three Affected Environment
Methods To inventory cultural resources in the area of potential effects (figure 3.16), which includes potential pipeline construction zones and wellfields, GIS layers were developed using SHPO databases and pertinent reports. This inventory superimposed alternative features over the recorded locations of cultural resources to identify those that coincide with the proposed Project features. The inventory covered pipeline routes and areas overlying aquifers. The method was similar to the inventory of natural resource lands (see discussion earlier in this chapter).
Unlike the natural resource lands inventory that used a 400-foot-wide corridor to inventory pipeline corridors, a 2-mile-wide corridor was used for the cultural resource inventory because of a paucity of information. This corridor represents where the pipeline most likely would be sited along road ROWs (right-of-ways) or section lines, although the area to be disturbed would be much less (see chapter four “historic properties” section). The actual placement of the pipeline within the corridor would be determined during the final engineering phase, if an action alternative is selected. The location of wells and interconnecting pipelines would also be determined at that time, if groundwater features are part of the selected alternative.
The inventory was conducted by the University of North Dakota and involved searching the files and databases of the SHPOs in North Dakota and Minnesota for records of cultural resources. Files for 14 North Dakota and 4 Minnesota counties were searched (figure 3.16). Because analysis of the Sheyenne River geomorphology concluded that operational flows in the river by any of the alternatives would not increase the potential for erosion, river corridors were not included in the area of potential effects (see “flooding and erosion on the Sheyenne and Rivers” section discussed previously in this chapter).
Previous cultural resource investigations - surveys, evaluation, and mitigation projects - in the areas of potential effects were also identified and reviewed. The examination revealed that none of the Project areas of potential effects have been systematically surveyed. Although parts of the Sheyenne River Valley have been surveyed systematically, the proposed alternatives would affect this valley in few locations. Except for the systematic surveys associated with recent flood control activities around Grand Forks and East Grand Forks, survey coverage in the Red River Valley is similarly scant.
In addition to the Class I inventory of all the alternatives, a Class II reconnaissance inventory was completed of the preferred alternative. For the Class II survey, archeologists drove the pipeline corridor route, as closely as possible and examined the landscape to be impacted by construction of the proposed pipeline. When the pipeline corridor could not be directly followed, every effort was made to reach locations crossed by the corridor route. Aerial photographs and 7.5’ USGS quadrangle maps were also relied on in these locations, as well as throughout the larger project area. Based upon the Class II survey, Jackson (2007) recommended areas to be examined by pedestrian survey.
A cultural resource inventory for the Missouri River system was discussed in the Missouri River Basin Mainstem Reservoir System Master Water Control Manual Review and Update, Final Environmental Impact Statement (Corps 2004a). The Corps’ inventory addressed historic properties located within the lakes and immediately adjacent zones that are subject to the effects
3 - 97

Red River Valley Water Supply Project FEIS Chapter Three Affected Environment
of impounded water, as described in their historic properties technical report. Although most Corps’ lands around these reservoirs have been intensively inventoried for cultural resources, the study did not identify nor differentiate among the different types of cultural resources that would be affected. There are 6,856 sites in the Corps’ historic properties index (see table 3.3). Of these, 192 are at Fort Peck Lake, 3,638 at Lake Sakakawea, 2,823 at Lake Oahe, and 204 at Lake Sharpe.
Existing Condition
Types of Cultural Resources Table 3.18 lists the results of the types of cultural resources previously recorded in the areas of potential effects of each alternative. Figure 3.17 shows the number of sites per type by alternative. The results of the inventory of site types are discussed below by alternative.
Table 3.18 – Summary of Cultural Resource Site Type Classes Within the Area of Potential Effect for Each Alternative.
Site Type
Alternative State
Preh
isto
ric
Arc
haeo
logy
Si
te
Preh
isto
ric S
ite
Lead
Preh
isto
ric
Isol
ated
Fin
d
His
toric
A
rcha
eolo
gica
l Si
te
His
toric
A
rchi
tect
ural
Si
te
His
toric
Site
Le
ad
His
toric
Is
olat
ed F
ind
Total
North Dakota In-Basin ND 19 7 9 2 52 43 3 135North Dakota In-Basin MN 5 10 1 1 2 1 0 20
Total
24 17 10 3 54 44 3 155Red River Basin ND 15 3 6 3 32 32 3 94Red River Basin MN 147 36 15 2 92 5 0 297
Total 162 39 21 5 124 37 3 391GDU Import to Sheyenne ND 17 5 4 4 23 23 1 77GDU Import to Sheyenne MN 0 0 0 0 0 0 0 0
Total 17 5 4 4 23 23 1 77GDU Import Pipeline ND 11 6 8 5 53 44 2 129GDU Import Pipeline MN 0 0 0 0 1 0 0 1
Total
11 6 8 5 54 44 2 130Missouri River Import to Red River Valley ND 12 6 7 6 39 45 1 116Missouri River Import to Red River Valley MN 0 0 0 0 1 0 0 1
Total 12 6 7 6 40 45 1 117 Note: Site totals exclude urban survey blocks.
No Action Alternative Because the locations of most of the No Action projects are unknown, the types of cultural resources in the areas of potential effects are unknown.
North Dakota In-Basin Alternative Of the 155 resources associated with this alternative, 135 of the resources (87%) are in North Dakota. Because this alternative encompasses 13 cities, historic architectural structures (35%) and historic site leads (28%) are the most common resource types. Four resources are listed in and another eight are considered eligible for inclusion in the National Register of Historic Places.
3 - 98

Red River Valley Water Supply Project FEIS Chapter Three Affected Environment
Of the prehistoric archaeological sites, 19 are in North Dakota and 5 are in Minnesota. The North Dakota sites include 17 cultural material (artifact) scatters, 1 mound site, and 1 rock feature site. All the sites in Minnesota are artifact scatters. Seven prehistoric site leads are in North Dakota and 10 in Minnesota. The former includes three mound locations. The latter all are portions of the historic Red River oxcart trails in Clay County. Nine of the 10 prehistoric isolated finds are in North Dakota.
Archaeological and Architectural Sites per Alternative
0
50
100
150
200
250
300
350
400
450
North Dakota in-Basin
Red River Basin GDU Import toSheyenne River
GDU ImportPipeline
Missouri RiverImport to RedRiver Valley
Prehistoric Archaeological Historic Archaeological Historic Architectural
Figure 3.17 - Number of Cultural Resources by Type per Alternative.
Two historic archaeological sites, a foundation, and a cultural material scatter have been recorded in North Dakota and a structural ruin in Minnesota. All but 2 of the 54 historic architectural sites are in North Dakota and include 17 churches or other religious structures, 3 farms or farm buildings, 2 houses, a bank, 19 bridges, 9 railroad segments, and 1 cemetery or grave.
Forty-three of the 44 historic site leads are in North Dakota and include 13 post offices, 9 town sites, 8 railroad stations, 7 schools, 2 houses, 1 loading station, 1 railroad junction, 1 trail segment, and 1 military outpost. The single Minnesota site lead refers to a trading post. The three historic isolated finds are all located in North Dakota.
Red River Basin Alternative Of the 391 cultural resources, roughly three-quarters of the resources are in Minnesota (76%). The 162 prehistoric archaeological sites are the most common resource type followed by 124 historic architectural structures. Eleven resources are listed and thirteen are considered eligible for inclusion on the National Register of Historic Places.
Of the prehistoric archaeological sites, 147 (91%) are in Minnesota and include 89 artifact scatters, 47 earthworks or burial mounds, 7 cemeteries, and 4 other sites. The 15 sites in North
3 - 99

Red River Valley Water Supply Project FEIS Chapter Three Affected Environment
Dakota consist of 14 cultural material (artifact) scatters and 1 rock feature site. Most of the 39 prehistoric site leads are in Minnesota (36) and include 13 trail sites, 9 artifact scatters, 8 earthworks, 4 sites noted in historic documents (contact period trading post, etc.), and 2 cemeteries. The three leads in North Dakota refer to mound sites. Fifteen of the prehistoric isolated finds are in Minnesota and six in North Dakota. There are three historic archaeological sites in North Dakota and two in Minnesota. The former consists of one artifact scatter, one foundation, and one trail, while the latter are both structural ruins.
Thirty-two of the historic architectural structures are in North Dakota and 92 in Minnesota. The structures in North Dakota comprise 13 bridges, 7 churches, 2 farms or farm buildings, 9 railroad segments, and 1 cemetery. The Minnesota structures include 13 seasonal residences, 12 cabins, 11 churches, 9 township halls, 8 farmsteads, 5 bridges, 5 residences, and 5 outbuildings.
Thirty-two historic site leads have been recorded in North Dakota and five in Minnesota. The North Dakota leads consist of 10 post offices, 6 railroad stations, 6 town sites, 5 schools, a loading station, a trail, a railroad junction, a military outpost, and an occupied mobile home. The Minnesota site leads consist of sites documented in historic records (ghost towns, trading posts, homes, etc.) and one mill. Three historic isolated finds have been recorded, all in North Dakota.
GDU Import to Sheyenne River Alternative Of the 77 cultural resources in this alternative’s area of potential effects, all are in North Dakota (100%). The 23 architectural and 23 historic site leads are most common resource group, followed by the 17 prehistoric archaeological sites, 5 prehistoric site leads, 4 prehistoric isolated finds or 4 historic archaeological sites, and the single historic isolated find is the least common. Only 6 sites have been recommended eligible for inclusion in the National Register of Historic Places.
Seventeen of the prehistoric archaeological sites are located in North Dakota. The North Dakota sites include 14 cultural material (artifact) scatters, 1 hearth, 1 rock feature, and 1 stone circle site. The North Dakota site lead is a possible rock cairn and there are 4 isolated finds. The historic archaeological sites include 2 cultural material scatters, a depression, 1 “other,” and 23 historic architectural structures are in North Dakota. The latter consists of 14 buildings and 9 bridges. There are 23 historic site leads and a single historic isolated find.
GDU Import Pipeline Alternative Of the 130 cultural resources recorded in the area of potential effects of this alternative, only one is in Minnesota (.7%). It is a township hall. The 54 historic architectural structures are the most common resource group, followed by the 44 historic site leads, and 11 prehistoric archaeological sites. There are 6 prehistoric site leads, 8 prehistoric isolated finds, 5 historic archaeological sites, and 2 historic site leads in the area of potential effects. Two sites are listed in and another seven are considered eligible for inclusion in the National Register of Historic Places. All of the National Register sites are in North Dakota.
All of the prehistoric archaeological sites are in North Dakota (11), which include 8 cultural material (artifact) scatters, 2 sites with rock features, and 1 site with a hearth. Six prehistoric site leads and 8 prehistoric isolated finds have been recorded in North Dakota. The site leads reference 3 mound sites, 2 sites, and 1 rock cairn site. The 5 historic archaeological sites include 2 foundation sites, 1 dumpsite, 1 cultural material scatter, and 1 town site/railroad station.
3 - 100

Red River Valley Water Supply Project FEIS Chapter Three Affected Environment
The 53 historic architectural structures are in North Dakota and include 19 bridges and 25 buildings. There are 44 historic site leads and two historic isolated finds in North Dakota.
Missouri River Import to Red River Valley Alternative Of the 117 resources associated with this alternative, all but one architectural site are in North Dakota. The 45 historic site leads represent the most common resource group, followed by 40 historic structures. Two resources are listed in and another nine are considered eligible for listing in the National Register of Historic Places.
The twelve prehistoric archaeological sites are cultural material (artifact) scatters. The prehistoric site leads include three cultural material scatters, two mound sites, and an unclassified site. The six historic archaeological sites are three foundations, two cultural material scatters, and a town site.
The 40 historic architectural structures include 17 churches, 11 bridges, five farms and one farm district, two houses, one school, one bank, one cemetery and, in Minnesota, a township hall. The 45 historic site leads include 16 schools, ten town sites, ten railroad stations and sidings, three post offices, three houses, two military campsites or battlefields, and one mansion.
3 - 101

Red River Valley Water Supply Project FEIS Chapter Three Affected Environment
Indian Trust Assets
Introduction What are the Indian trust assets that could be affected by the Project alternatives?
This section addresses the current condition of Indian trust assets (ITAs) that may be affected either by construction of Project features or by changing flows in the Sheyenne and Red Rivers. The United States has a “trust responsibility” to protect and maintain rights and property reserved by or granted to federally recognized American Indian tribes or to Indian individuals by treaties, statutes, and executive orders. This trust responsibility derives from the historical government-to-government relationship between the federal government and Indian tribes as expressed in treaties and federal Indian law. This responsibility requires that all federal agencies, including Reclamation, take all actions reasonably necessary to protect ITAs.
ITAs are defined as legal interests in property held in trust by the United States for federally recognized Indian tribes or individuals. Examples of things that may be trust assets include “lands, minerals, hunting and fishing rights, and water rights” (Reclamation 1993). These three ITAs are addressed in this section: 1) trust lands; 2) hunting, fishing, and gathering rights; and 3) water rights.
Trust lands are the most commonly encountered ITA. Trust lands are property set aside for Indians with “…the United States holding naked legal title and the Indians enjoying the beneficial interest” (Canby 1991). Trust lands are most often encountered within or near Indian reservations.
According to Reclamation’s (1993) ITA policy, hunting, fishing, and gathering rights, as specifically retained or relinquished in treaties, may qualify as ITAs. This is because the right to continue hunting, fishing, and gathering was often retained in many treaties. Although the courts have not ruled on whether these activities constitute ITAs, they are treated as such here because of Reclamation’s (1993) ITA policy.
Another ITA that potentially could be affected by the Project is Indian water rights, both surface and groundwater of the tribes in the Missouri River Basin and the Red River Basin in North Dakota. Such water rights in the basin are a matter of federal law. The basis for this stems from the U.S. Supreme Court’s decision in Winters v. United States (1908), which enunciated the Winters Doctrine. According to the doctrine, the establishment of an Indian reservation implied that sufficient water was reserved (or set aside) to fulfill purposes for which the reservation was created, with the priority date being the date the reservation was established. As such, Indian water rights, when quantified, constitute an ITA. In Arizona v. California (1963) the U.S. Supreme Court held that water allocated should be sufficient to meet both present and future needs of the reservation to assure the viability of the reservation as a homeland. Case law also supports the premise that Indian reserved water rights are not lost through non-use.
3 - 102

Red River Valley Water Supply Project FEIS Chapter Three Affected Environment
For the Red River Basin in Minnesota, water allocations are based on the common law doctrine of riparian water rights coupled with the concept of reasonable use. Under riparian water rights all landowners whose property is adjacent to a body of water or overlying a groundwater source have the right to make reasonable use of it, subject to the rights of the other riparian landowners. If there is not enough water to satisfy all users, allotments are generally proportional to the landowner’s frontage on or over the water source. The issue of Indian water rights has not been addressed under the riparian water rights precept; consequently, there is nothing analogous to the Winters Doctrine.
Methods The method of analysis employed for this study was first to identify the federally recognized tribes that currently reside in the Red River and Missouri River Basins or that have historic ties to the basins through treaties (see Appendix J). The purpose was to identify those tribes that might have ITAs that could be affected by the project and, therefore, needed to be consulted. Royce (1899) was the source for identifying those tribes that have historic ties to the basin through treaties. In addition, the Bureau of Indian Affairs land database was reviewed to determine whether any trust lands were within the areas of potential effect for the Project alternatives.
Because the five North Dakota tribes - Turtle Mountain Band of Chippewa, Spirit Lake Sioux, Three Affiliated Tribes, Standing Rock Sioux, and Sisseton-Wahpeton Oyate – were in closest proximity to the Project area, Reclamation initiated consultation with them first. Consultation began with a letter that invited their participation in scoping meetings and included the “Notice of Intent to Prepare an EIS.” As Project alternatives were refined, Reclamation determined other tribes needed to be consulted and developed a plan to address consultation with them.
Four tribes in the Red River Basin, 25 tribes in the Missouri River Basin, and 1 tribe that spans both basins were identified for consultation. Thirteen of the Missouri River Basin tribes are located directly on the Missouri River, while others are scattered throughout the rest of the basin. The tribes are listed in Appendix J, table J.1 and their locations depicted in figures 3.2 and 3.18. Letters were sent to these tribes, followed up by telephone calls. Tribes were included in the distribution of the DEIS (see chapter five) and an additional letter was sent in July 2006 requesting information on ITAs and offering to meet to discuss the Project. Reclamation requested that tribes identify ITAs that could be affected by the proposed alternatives. The tribes were also extended an invitation to meet with Reclamation to discuss possible impacts to potentially affected ITAs. A detailed discussion of government-to-government consultation is in Appendix J.
Existing Condition Given the definition of ITAs following consultations with the tribes, three types of ITAs were identified that could potentially be affected by the Project: trust lands; hunting, fishing and gathering rights; and water rights.
Red River Basin Tribes Trust Assets Trust Lands No trust lands were identified within or adjacent to any of the Project areas of potential effect. All Project alternatives are outside of Indian reservations or any trust lands.
3 - 103

Red River Valley Water Supply Project FEIS Chapter Three Affected Environment
Figure 3.18 – Map of Missouri River Basin Indian Tribes.
Hunting, Fishing and Gathering Rights The treaties with tribes in the Red River Basin provided for continued hunting, fishing, and gathering on ceded lands (lands reverted to the United States through treaties). The rights of the Minnesota Chippewa/Ojibwe to hunt, fish, and gather on their ceded lands were affirmed by the U.S. Supreme Court in the Minnesota v. Mille Lacs (1999) decision. The possible impacts of the proposed alternatives were evaluated with respect to their potential for impacting the Chippewa/Ojibwe right to fish. The impact analysis was based upon the analysis of aquatic resources discussed in chapter four. If future federal court decisions affirm the fishing rights of other tribes, those rights should be given similar consideration.
Water Rights The Sisseton-Wahpeton Oyate Reservation overlies or is adjacent to the Hankinson, Brightwood, Senora, and Milner Aquifers. Should any of these aquifers serve as a water source in the preferred alternative, whether the Sisseton-Wahpeton Oyate are withdrawing
3 - 104

Red River Valley Water Supply Project FEIS Chapter Three Affected Environment
water will have to be considered and their rights with respect to the proposed withdrawals will have to be determined.
Missouri River Basin Tribes Trust Assets Trust Lands No trust lands were identified within or adjacent to any of the Project areas of potential effect. All Project alternatives are outside of Indian reservations or any trust lands.
Hunting, Fishing, and Gathering Rights Many of the treaties with the tribes in the Missouri River Basin provided for continued hunting, fishing, and gathering on ceded lands (lands tribes gave up to the United States through treaties).
Water Rights Twenty-eight tribes located in the Missouri River Basin were identified as having reservations within the Project Area, 13 of which have reservations located directly on the Missouri River. Several of these tribes are in various stages of quantifying their water rights. Currently, the only tribal reserved water rights that have been quantified or are being quantified are:
• State of Wyoming settlement with tribes of the Wind River Reservation (adjudicated under the McCarran Amendment)
• Compact between the state of Montana and the tribes of the Fort Peck Reservation (awaiting congressional approval)
• Compact between the state of Montana and the tribes of the Fort Belknap Reservation (ratified by the state legislature)
• Compact between the state of Montana and the Crow tribe (ratified by the state legislature)
• Compact between the state of Montana and the tribes of the Rocky Boys Reservation (awaiting congressional approval)
• Compact between the State of Montana and the Northern Cheyenne Tribe (The Northern Cheyenne Reserved Water Rights Settlement Act [Public Law 102-374])
The Corps is the federal agency responsible for operations of the Missouri River. The Corps has recognized that certain Missouri River Basin tribes are entitled to water rights in streams running through and along their reservations under the Winters Doctrine. The Corps’ operational decisions concerning the Missouri River Mainstem Reservoir System are based on the water that is in the system and demands placed upon it. The Corps recognizes tribal water rights to the mainstem irrespective of whether those rights have been quantified. In doing so, the Corps has recognized that future quantification of these rights could affect operations. With respect to Indian Water Rights, the Manual states:
“When a Tribe exercises its water rights, these consumptive uses will then be incorporated as an existing depletion. Unless specifically provided for by law, these rights do not entail an allocation of storage. Accordingly, water must actually be diverted to have an impact on the operation of the System. Further modifications to System operation, in accordance with pertinent legal requirements, will be considered as Tribal water rights are exercised in accordance with applicable law” (Corps 2004b).
3 - 105

Red River Valley Water Supply Project FEIS Chapter Three Affected Environment
Social and Economic Conditions
Introduction What is the current social and economic condition in the area of potential affect?
This section describes the current condition of regional economic indicators in the Red River Valley and Missouri River Basin. Indicators of the social and economic condition within the Red River Valley include population, education, income, the value of agricultural and non-agricultural production, recreation, and employment. Within the Missouri River Basin the current social and economic indicators include hydropower, navigation, and recreation. Each of these indicators and the reasons for their selection are discussed in detail in chapter four. To put these indicators in context to measure magnitude of impacts, this section describes the current demographic, economic, agricultural, and recreation aspects of the regional economy.
The region considered in this analysis includes counties in North Dakota and Minnesota. North Dakota counties include Barnes, Burleigh, Cass, Cavalier, Eddy, Foster, Grand Forks, Griggs, Kidder, McLean, Nelson, Pembina, Ransom, Richland, Sargent, Sheridan, Steele, Stutsman, Traill, Walsh, and Wells. Minnesota counties include Becker, Clay, Otter Tail, Polk, and Wilkin. The region evaluated in this social and economic analysis extends beyond the water user area to include counties where construction impacts could occur.
Some of the larger cities in the study area are Breckenridge, East Grand Forks, and Moorhead, Minnesota; and Fargo, Grand Forks, West Fargo, Grafton, Valley City, and Wahpeton, North Dakota. Fargo is in Cass County and is an important economic center. The largest sectors in the economy are retail trade, accommodation and food service, manufacturing, and wholesale trade.
Some of the alternatives propose to withdraw water from the Missouri River, so the current conditions of social and economic indicators in the Missouri River system are also discussed in this section and the impact analyzed in chapter four.
Methods Each social or economic indicator discussed uses data from various governmental sources, including studies conducted for the Project. These data sources are identified in the discussion.
Existing Condition The current condition of the following economic indicators in the Project area are described in this section: population; education; median household and per capita income, poverty rates, and home ownership; earnings; agricultural acreage and value of production; labor force and unemployment, other measures of economic activity, small area and municipality economies, and recreation.
Population The Bureau of the Census estimated a 2000 population of 446,235 for the entire economic impact area. The population estimate for the impact area for 2003 remained essentially
3 - 106

Red River Valley Water Supply Project FEIS Chapter Three Affected Environment
Table 3.19 – Population of the Regional Counties andDominant Urban Areas.
unchanged. The region includes three dominant urban areas (Fargo-Moorhead, Grand Forks, and West Fargo), which combined to account for about 42% of the region’s population in 2003. The rest of the regional population is rural. All of the counties in the region experienced a population loss from 1990 to 2003, except for Cass, Pembina, Clay, and Otter Tail Counties.
County 1990 Census
2000 2003 Census EstimatePopulation estimates for the entire
region, counties, and major urban areas from 1990 to 2003 are in table 3.19. The number of people in urban areas is projected to grow substantially over the next 40 years, while the decline in rural population is projected to continue (Reclamation 2003b; North Dakota State Data Center 2005).
North Dakota Counties 11,083Barnes County 11,775 12,545
Valley City 6,4206,826 7,163 71,693Burleigh County 69,416 60,131
Bismarck 56,34455,532 49,256 127,138Cass County 123,138 102,874 91,484 Fargo 90,599
West Fargo 74,111
16,43114,940 12,287 4,484Cavalier County 4,831 6,064 2,598Eddy County 2,757 2,951
Foster County Grand Forks County Grand Forks Griggs County Kidder County McLean County Nelson County Pembina County Ransom County Richland County Wahpeton Sargent County Sheridan County Steele County Stutsman County Traill County Walsh County Grafton Wells County
Minnesota Counties
Becker County Clay County Moorhead Kittson County Lake of the Woods Otter Tail County Polk County Roseau County Wilkin County Breckenridge
Study Region Total
3,983 70,683 49,425
3,303 3,332
10,457 4,410 9,238 5,921
18,148 8,751 4,549 2,148 2,420
22,241 8,752
13,840 4,840 5,864
27,881 50,473 32,295
5,741 4,076
50,724 32,562 15,026
7,520 3,708
567,857
3,759 66,109 49,321
2,754 2,753 9,311 3,715 8,585 5,890
17,998 8,586 4,366 1,710 2,258
21,908 8,477
12,389 4,516 5,102
30,000 51,313 32,177
5,263 4,522
57,222 31,352 16,338
7,133 3,559
592,144
3,49564,73648,618
2,5782,5778,9353,4548,2015,838
17,5988,4434,2251,5402,081
21,2558,278
11,7204,2994,702
31,17451,98332,786
4,9684,384
58,84730,90516,318
6,9453,453
593,733
Education Education is one indicator of the skill level of the labor force and is a measure of the attractiveness of the area to businesses and industries that are considering expanding or locating there. The percentage of the population 25 years of age or older that is at least a high school graduate in each county ranges from 72.0% to 90.9%, and the average for the region is approximately 86%. The percentage of the population that has a Bachelor’s degree or higher level of education ranges from 9.7% to 31.3%; the average for the region is approximately 23%. In comparison, the percentage of the population 25 years of age or older that is a high school graduate or higher is 87.9% in Minnesota, 83.9% in North Dakota, and 80.4% for the entire U. S. The percentage with a Bachelor’s degree or higher level of education is 27.4% in Minnesota, 22.0% in North Dakota, and 24.4% for the entire U.S.
The average percentage of high school graduates for the counties in the region is greater than the North Dakota state average and the national average but less than the Minnesota average. The percentage of the population in the region with at least a Bachelor’s degree is higher than for all of North Dakota, but lower than for Minnesota and marginally lower than for the entire U.S.
3 - 107

Red River Valley Water Supply Project FEIS Chapter Three Affected Environment
However, the overall high educational attainment rates indicate the availability of a highly skilled workforce in the region and the potential for well paying jobs in the future.
Median Household and Per Capita Income, Poverty Rates, and Home Ownership The Red River Valley area as a whole has a relatively high income rate and a low poverty rate compared to the rest of North Dakota. The home ownership rate in the area is very similar to all of North Dakota. The income levels for the region are, however, lower than Minnesota. There is a large variation in income and poverty. Table 3.20 presents median household income, per capita income, poverty rate, and home ownership rates for the Red River Valley counties in North Dakota and Minnesota.
Table 3.20 – Income, Poverty Rate, and Home Ownership Rate for States and Counties.
County or State Median
Household Income
Per capita Income
Persons Home- below ownership
Poverty Rate North Dakota Counties
Barnes 10.8% $31,166 71.2% $16,566 Burleigh 7.8% $41,309 68.0% $20,436
Cass 10.1% $38,147 54.3% $20,889 Cavalier 11.5% $31,868 81.5% $15,817
Eddy 9.7% $28,642 75.4% $15,941 Foster 9.3% $32,019 74.4% $17,928
Grand Forks 12.3% $35,785 53.9% $17,868 Griggs 10.1% $29,572 78.3% $16,131 Kidder 19.8% $25,389 81.7% $14,240
McLean 13.5% $32,337 82.2% $16,220 Nelson 10.3% $28,892 80.2% $16,320
Pembina 9.2% $36,430 78.4% $18,692 Ransom 8.8% $37,672 75.3% $18,219 Richland 10.4% $36,098 69.6% $16,339 Sargent 8.2% $37,213 79.8% $18,689
Sheridan 21.0% $24,450 84.5% $13,283 Steele 7.1% $35,757 77.2% $17,601
Stutsman 10.4% $33,848 67.2% $17,706 Traill 9.2% $37,445 72.6% $18,014
Walsh 10.9% $33,845 76.8% $16,496 Wells 13.5% $31,894 76.5% $17,932
Minnesota Counties Becker 12.2% $34,797 80.5% $17,085
Clay 13.2% $37,889 71.6% $17,557 Kittson 10.2% $32,515 82.8% $16,525
Lake of the Woods 9.8% $32,861 85.3% $16,976 Otter Tail 10.1% $35,395 80.0% $18,014
Polk 10.9% $35,105 74.1% $17,279 Roseau 6.6% $39,852 83.8% $17,053
Wilkin 8.1% $38,093 80.8% $16,873
MN Statewide Averages 7.9% $47,111 74.6% $23,198$17,769ND Statewide Averages 11.9% $34,604 66.6%
3 - 108

Red River Valley Water Supply Project FEIS Chapter Three Affected Environment
Earnings In terms of total earnings, the major industry groups (defined here as sectors that account for 5% or more of total earnings) include construction; manufacturing; wholesale trade; retail trade; finance and insurance; professional, scientific, and technical services; and health care and social assistance services. These earning patterns indicate the Red River Valley economy is diverse and has a wide range of skills and education.
Agricultural Acreage and Value of Production
Table 3.21 – Agricultural Acres and Products Value in the Red River Valley North Dakota Counties (Census of Agriculture 2002).
Agriculture represents an important aspect of the regional economy, both in terms of direct income and employment effects on other support and processing industries. Table 3.21 shows the amount of agricultural land and production in the Red River Valley. Over 40% of the total value of North Dakota farm products is produced in the Red River Valley and the value of farm products produced per farm is very high.
Labor Force and Unemployment Based upon data from 2000, the counties that represent the largest percentage of the total regional labor force (Burleigh, Cass, Grand Forks, Otter Tail, and Clay Counties) have unemployment rates that range from 1.6% (Cass County) to 3.6% (Clay County) compared to a state average of 3.0% in North Dakota and 2.9% in Minnesota. The overall unemployment rate of the construction impact and water user area is slightly lower than the state averages.
Three sectors consistently provide a large percentage of employment in the Red River Valley: the retail trade sector, the health care and social assistance sector, and the accommodation and food services sector. Manufacturing of durable and non-durable goods also provides a significant percentage of employment in several counties.
Other Measures of Regional Economic Activity Manufacturing and retail sales are two important measures of the strength in a regional economy. Manufacturing represents a primary economic activity that is likely to bring in spending from outside the region, creating new wealth within the region. Retail sales are a measure of overall spending activity, much of which is by the regional population. Therefore, retail sales tend to be a measure of the economic well-being of local households.
The value of manufacturing shipments is very high in Cass County and economically linked to Otter Tail County in Minnesota. Grand Forks, Richland, Clay, and Polk Counties are also important manufacturing sales counties. Burleigh, Cass, Grand Forks, and Pembina Counties all
Area
Agricultural Land in Farms
(1,000's of acres)
Value of Farm Value of FarmProducts Products ($1,000's) per Farm
Barnes 870 $79,968 $103,585Cass 1,068 $169,041 $183,940Cavalier 875 $72,240 $105,924Grand Forks 775 $129,611 $168,764Griggs 390 $28,120 $78,768Nelson 535 $36,662 $77,839Pembina 633 $127,506 $207,327Ransom 515 $61,387 $126,571Richland 809 $165,985 $189,914Sargent 477 $64,534 $143,728Steele 413 $46,718 $161,097Traill 494 $84,519 $179,446Walsh 718 $122,394 $162,111
North Dakota 39,359 $2,869,322 $94,064
3 - 109

Red River Valley Water Supply Project FEIS Chapter Three Affected Environment
have higher than average retail sales per capita, indicating a high level of household economic activity in these counties. As would be expected, retail sales are a very important part of the regional economy.
Small Area and Municipality Economies Regional economic and employment data are available for smaller areas within the Red River Valley region from small area labor market studies. These studies are used by counties and municipalities to help develop plans and prepare for the future.
A Fargo-Moorhead Metropolitan area labor market study (North Dakota State Data Center 2000) indicated 95% of household members in Cass and Clay Counties were employed as of Spring 2000 and approximately 87.2% of those who were employed worked full-time. Nearly 9% of employed persons are temporary workers. Based on the survey, about 35% of the available labor force is between 18 and 35 years of age.
A Wahpeton labor supply study prepared by the LMI Center of Job Service North Dakota indicated that the area is likely to continue to support a large manufacturing base. The current labor supply and availability of skills is likely to be sufficient for future growth.
Additional information on the percentage of total employment represented by different industry groups was obtained from Job Service North Dakota (2004) community profiles. These profiles support the conclusions from the county data. The larger urban areas provide a diverse and skilled labor force from which the economy could be expected to continue to grow in the future.
Red River Valley Recreation
Boys Fishing in a North Dakota Reservoir
Recreation represents an important part of the North Dakota economy. According to the National Association of State Park Directors, there were more than one million visitors to North Dakota State Parks in 1999, generating almost $1 million in state revenue. A survey of fishing and hunting in North Dakota estimated total fishing expenditures of about $22.7 million, hunting expenditures of $29.5 million, and wildlife watching expenditures of $7.0 million in 2001 (Service 2003). These expenditures generate notable economic benefits throughout the state.
Several recreation areas are located in the areas potentially affected by the Project. The Report on Red River Valley Water Supply Project Needs and Options, Recreation Needs Assessment, Final Report (Reclamation 2003c) identified several important recreation areas. These areas include Lake Ashtabula/Baldhill Dam (table 3.22), Lonetree Wildlife Management Area, Fort Ransom State Park, H.R. Morgan State Nature Preserve, Sheyenne National Grasslands, and Red River State Recreation Area in East Grand Forks, Minnesota. These recreation areas are described in more detail below. The Missouri River, a proposed water source for three of the
3 - 110

Red River Valley Water Supply Project FEIS Chapter Three Affected Environment
action alternatives, also offers recreation as an important benefit. This recreational resource is described generally below and more fully in the Missouri River Basin Mainstem Reservoir System Master Water Control Manual Review and Update, Final Environmental Impact Statement (Corps 2004a).
Lake Ashtabula/Baldhill Dam Lake Ashtabula is the most visited recreation facility in the Red River Valley area. The lake itself covers approximately 5,430 acres and has approximately 78 shoreline miles. The area includes 3,053 acres of land, of which 243 acres are forested. The facilities include four campgrounds (141 camping sites), four swimming areas, seven boat ramps, picnic facilities (62 picnic sites), nine boat ramps, two fishing docks, three marinas with 50 marina slips, and seven playgrounds.
In 1999 there were an estimated 165,200 individual visits to Lake Ashtabula (Corps 2000). Many of these visits included multiple activities. The percentage of total participation by the type of activity is shown in table 3.22.
Table 3.22 – Lake Ashtabula Recreation. Recreation
Activity Percent of
Total Activity Picnicking Camping Swimming Water Skiing Boating Sightseeing Fishing Hunting Other
10.8 1.2 7.0 1.9 16.8 3.3 25.8 8.0 25.3
The data presented in table 3.22 clearly show the importance of direct water contact activities and lake conditions on visitation to the area. The Corps estimates that there was $2.84 million in total visitor spending within 30 miles of the lake and that approximately 60% of these expenditures remained in the local economy. This represents an important aspect of the regional economy.
Lonetree Wildlife Management Area The Lonetree Wildlife Management Area is a 33,162 acre area located at the headwaters of the Sheyenne River. The primary uses of the area are related to nature tourism activities such as auto touring, wildlife viewing, hiking, and ecological education. Other recreational activities include biking, boating, camping, fishing, horseback riding, hunting, picnicking, and viewing cultural sites. Although visitation estimates are not available, the area is envisioned as a large regional destination for nature tourism. A recent tourism plan for the area (Fermata, Inc. 2001) identified the area as having good potential for nature tourism. The plan also identified the need to develop food, lodging, and information services to attract visitors to the area. The North Country National Scenic Trail, which spans from the Missouri River in North Dakota to New York’s Adirondack Mountains, crosses Lonetree Wildlife Management Area.
Camping Is an Important Recreation Activity in North Dakota
Fort Ransom State Park Fort Ransom State Park is located northwest of Lisbon. The park covers about 890 acres and includes 30 camping sites. Activities in and near the park include camping, picnicking, fishing, canoeing and kayaking, hiking, horseback riding, mountain biking,
3 - 111

Red River Valley Water Supply Project FEIS Chapter Three Affected Environment
and winter activities. This is a popular destination for regional residents, second only to Lake Ashtabula as a regional recreation destination.
H.R. Morgan State Nature Preserve The H.R. Morgan State Nature Preserve is located northeast of Lisbon. It attracts nature recreation, such as bird watching, hiking, and wildflower viewing. Several different types of rare plants and animals are located in the area. This preserve has primitive camping and developed trails for hiking and horseback riding. Visitation to the preserve is fairly limited compared to other recreation areas in the region, as are the economic impacts of recreation-based expenditures.
Sheyenne National Grasslands The Sheyenne National Grasslands is also located in the southeastern part of North Dakota near Lisbon. The grasslands include about 70,000 acres and are mixed with private land. Recreational opportunities include hunting, horseback riding, nature studies, canoeing, and fishing. Camping is allowed on the grasslands, although there are no established campgrounds. The North Country National Scenic Trail winds through the area, in addition to several other hiking trails.
Red River State Recreation Area The Red River State Recreation area is located in East Grand Forks, Minnesota, and features campsites, trails, and boating access to the Red River. It has about 1,200 acres of open space and was created in 2000 as a direct result of the 1997 flood. Major uses of the area include camping, hiking, bicycling, picnicking, birding, fishing, and boating. Visitation to the area could increase in the future due to the proximity of the recreation area to large population centers.
GDU Principal Supply Works Audubon Lake is well known for its hunting, fishing, and wildlife viewing opportunities. Audubon Wildlife Management Area, located on the northern portion of the lake, is open to public hunting, fishing, and trapping. It offers several boat ramps and landings, a fish cleaning station, a fishing pier, and information kiosks. Audubon National Wildlife Refuge, which includes the remainder of the lake, emphasizes interpretation and wildlife observation with a visitor center, interpretive auto tour, hiking trail, and wildlife viewing blind. Deer and upland bird hunting and ice fishing are permitted on the refuge according to special regulations but watercraft are not allowed.
McClusky Canal provides both water and land based recreation. The right-of-way, or strip of land bordering the canal, totals 6,080 acres. In addition to the right-of-way there are approximately 10,000 acres of public land adjacent to the canal between Audubon Lake and Hoffer Lake, including New Johns Lake. Boating, fishing, waterskiing, hunting, picnicking, wildlife viewing, camping, and hiking the North Country National Scenic Trail which crosses the canal lands are all popular activities. The Brekken-Holmes and Hoffer Lake Recreation Areas offer fully developed camping and
Fishing and Boating on New Johns Lake
3 - 112

Red River Valley Water Supply Project FEIS Chapter Three Affected Environment
recreation facilities, yet many of the lands associated with the canal are relatively undeveloped. The Chain of Lakes area provides designated primitive campsites and boat ramps. The stable water levels provided by releases from Audubon Lake and the open, uncrowded nature of the canal make it an increasingly popular recreation area.
Missouri River System Hydropower Hydroelectric power on the Missouri River plays an important role in meeting the electricity demands of the upper Midwest in the U.S. The six mainstem dams on the Missouri River support 36 hydropower units with a combined plant capacity of 2,501 megawatts of potential power generation. These units provide an average of 10 million MWh (megawatt-hours) of energy per year. Power generation at the six mainstem dams generally follows the seasonal pattern of water movement through the Missouri River system; however, adjustments are made, when possible, to provide maximum power production during summer and winter when demand is high.
The Corps constructed these hydroelectric facilities as part of a larger effort to develop multipurpose water projects that have functions other than power generation, including flood control, irrigation, navigation, and recreation. These projects must be operated in a way that balances their authorized purposes; and in many instances, power is not the primary use. Nearly all of the water that flows into the Missouri River passes through hydropower turbines.
Missouri River System Navigation The Missouri River Bank Stabilization and Navigation Project was authorized by Congress in the Rivers and Harbors Act of 1945, and provides for a 9-foot-deep channel a minimum of 300 feet wide from Sioux City to the mouth of the river near St. Louis, a distance of 735 miles. Navigation on the Missouri River is limited to the normal ice-free season, with a full-length flow support season of eight months.
Major commodities transported on the Missouri River include agricultural products (farm and food products), chemicals including fertilizers, petroleum products including asphalt, manufactured goods including building products such as cement, and materials such as sand and gravel used to maintain the Missouri River system. During 1994 the total transported via Missouri River navigation was 8.5 million tons, which was a record high, and commercial shipping was 1.8 million tons. Commercial tonnage on the Missouri River has declined since 2000 due to drought. Drought has reduced navigation with shallower draft and shorter seasons. Navigation is less economically feasible during extended drought periods. As a result, the estimated commercial tonnage dropped from the 8.5 million ton high in 1994 to an estimated 0.3 million tons in 2006.
Reducing the length of the navigation season in extended drought periods is done in accordance with the Missouri River Mainstem Master Water Control Manual Missouri River Basin (Corps 2004b). A shortened navigation season occurred in 1981, 1988 to 1992, and 2003-2006. The level of navigation service is determined by the amount of water in storage on March 15 and July 1 of each year. High flows can also disrupt navigation. The river is generally closed to navigation when stages become so high that towboat propeller wash and waves from the tow can damage the levees.
3 - 113

Red River Valley Water Supply Project FEIS Chapter Three Affected Environment
Environmental Justice
Introduction What are the current conditions affecting environmental justice within the area of
potential affect?
This section addresses the current conditions affecting environmental justice concerns in the Red River Valley. An evaluation of environmental justice impacts is mandated by Executive Order 12898 on Environmental Justice (February 11, 1994). Environmental justice addresses the fair treatment of people of all races and incomes with respect to federal actions that affect the environment. Fair treatment implies that no group of people living in the United States and its territories and possessions, the District of Columbia, the Commonwealth of Puerto Rico, and the Commonwealth of the Mariana Islands should bear a disproportionate share of negative impacts from an action. The impacts of an action can be considered disproportionately distributed if the percentage of total impacts imposed on a specific group is greater than the percentage of the total population represented by that group. A group can be defined by race, ethnicity, income, community, or some other parameters.
Methods The analysis of environmental justice impacts relies on demographic data from sources, such as the U.S. Bureau of the Census, individual counties and municipalities, and local school districts to determine the location of different groups of people. The current conditions used to evaluate potential environmental justice concerns were generally gathered from the U.S. Bureau of the Census.
Existing Condition Evaluating potential environmental justice concerns requires an understanding of where the Project impacts are likely to occur and where potentially affected groups are located. Identifying the location of specific groups can be difficult when nonpermanent residents, such as migrant workers, are temporarily in the affected area. Demographic data are limited for these groups of people. Census data do not account for all nonpermanent residents, because some cannot be contacted or some may not want to be counted. In addition, the Census tends to undercount the number of people in rural areas, due to difficulties encountered with contacting residents in sparsely populated regions. However, Census data are typically the most complete and comparable demographic and economic data available for individuals and households.
Income data are presented in the description of the regional economy in the previous section. The data indicate the median household income was much lower in Barnes, Cavalier, Griggs, Nelson, Kittson, Norman, and Traverse Counties than the median household income for the entire study area. Per capita income is lower than average for the same counties as the low median household income counties, with the addition of Richland and Walsh Counties. Poverty rates show a different pattern, with relatively high income counties (Cass, Grand Forks, and Clay) having comparatively high poverty rates. This is due primarily to low incomes of college students rather than chronic poverty in these counties. Overall, poverty rates are fairly low
3 - 114

Red River Valley Water Supply Project FEIS Chapter Three Affected Environment
throughout the study area. Alternatives that have a disproportionate adverse effect on those counties listed as having low incomes could potentially have environmental justice issues. U.S. Bureau of the Census data are also available for race and Hispanic origin. Table 3.23 presents these data, which indicate the distribution of population by race is very similar for each of the study area counties. There could be a very slight potential for some disproportionate impacts in Walsh and Polk Counties if Hispanic individuals were adversely and disproportionately affected. However, these impacts would need to be imposed on a very small population. The potential for adverse environmental justice impacts is higher for low income areas than for areas based on race and ethnic origin. Chapter four describes any potential inter-related socioeconomic impacts to both the total affected population and to the low-income and/or minority communities.
Table 3.23 – Race and Ethnic Origin of Red River Valley Counties.
County, Region, or State % White % African American
% American % Hispanic Indian or Latino
North Dakota Counties Barnes 97.9 0.5 0.8 0.5
Cass 95.1 0.8 1.1 1.2 Cavalier 98.1 0.1 0.5 0.6
Grand Forks 93.0 1.4 2.3 2.1 Griggs 99.3 0.0 0.2 0.4 Nelson 98.6 0.1 0.3 0.2
Pembina 95.5 0.2 1.4 3.1 Ransom 97.9 0.2 0.3 0.8 Richland 96.8 0.3 1.7 0.7 Sargent 98.2 0.0 0.5 0.7
Steele 98.3 0.0 0.6 0.2 Traill 97.3 0.1 0.9 2.2
Walsh 94.9 0.3 1.0 5.7
Minnesota Counties Clay 94.0 0.5 1.4 3.7
Kittson 98.1 0.2 0.3 1.3 Marshall 97.2 0.1 0.3 2.9 Norman 95.3 0.1 1.7 3.1
Otter Tail 97.1 0.3 0.5 1.7 Polk 94.2 0.3 1.3 4.8
Traverse 96.4 0.0 2.8 1.2 Wilkin 97.8 0.2 0.4 1.5
Study Area Counties 95.4 0.6 1.2 2.1 Minnesota 89.4 3.5 1.1 2.9
North Dakota 92.4 0.6 4.9 1.2
3 - 115

Red River Valley Water Supply Project FEIS Chapter Three Affected Environment
3 - 116

Red River Valley Water Supply Project FEIS Chapter Four Environmental Impacts
Chapter Four Environmental Impacts
Introduction
This chapter describes the predicted impacts of the alternatives, including the consequences of the No Action Alternative, on the relevant environmental resources described in chapter three. It evaluates direct, indirect, and cumulative effects and quantifies these effects whenever possible. Measures and commitments intended to mitigate adverse environmental impacts are also described. The net impact on the relevant resources is analyzed by comparing the impacts of the action alternatives to the No Action Alternative.
Construction of a Water Supply Project in South Dakota
The resources described in chapter three and analyzed in this chapter are: • Red River Basin surface water
quantity • Flooding and erosion on the Sheyenne
and Red Rivers • Missouri River System water quantity • Surface water quality • Groundwater • Aquatic communities • Risks of invasive species • Natural resource lands – wetlands,
grasslands, woodlands, and riparian areas
• Wildlife • Federally protected species and
species of special concern • Protected areas, state, and federal
lands • Historic properties • Indian trust assets • Social and economic issues • Environmental justice
The analyses recognize that there are links between resources. For example, if an alternative affects streamflows, it may also in turn affect aquatic communities and riparian areas. Changes in these resources could, over time, impact wildlife and cultural resources. Throughout these impact assessments, linkages are discussed where appropriate and are quantified when possible.
4 - 1

Red River Valley Water Supply Project FEIS Chapter Four Environmental Impacts
Resources that were analyzed and found to be unaffected are noted in the text, and the results of the analyses are documented in Appendixes B-K. Environmental mitigation commitments are listed after each resource section in this chapter and are compiled in Appendix L.1 by resource. Common and scientific names of species are consolidated in Appendix L.2, but also appear where appropriate in sections of this chapter.
Adaptive Management
What Is Adaptive Management? Managers in many fields adjust their strategies as new information accumulates and as new practices are developed. Adaptive management is a strategy for addressing a changing and uncertain environment that relies on common sense and learning. Adaptive management looks for ways to understand the behavior of ecosystems and draws upon theories from ecology, economics and social sciences, engineering, and other disciplines. Adaptive management incorporates and integrates concepts such as social learning, operations research, economic values, and political differences with ecosystem monitoring, modeling, and science (National Research Council 2004).
The goal of adaptive management is to enhance scientific knowledge and reduce uncertainties. The uncertainties that are part of any system can come from a number of sources. Parma et al. (1998) and Regan et al. (2002) describe causes of uncertainty in natural systems. Sources of uncertainty include natural variability, incomplete data, and social and economic changes and events, all of which may affect natural resources systems. Adaptive management works to create policies that help organizations, managers, and other stakeholders respond to and even take advantage of unanticipated events (Holling 1978; Walters 1986; National Research Council 2004).
Application of adaptive management is intended to support actions when the scientific knowledge of their effects on ecosystems is limited (Holling 1978). This does not mean that actions are delayed or postponed until there is agreement that we have learned a sufficient amount about an ecosystem. Rather, adaptive management provides a means to adjust management actions when new information becomes available.
Adaptive management consists of a set of principles used to guide the implementation of management actions (National Research Council 2004). The fundamental principles of adaptive management, while useful for evaluating problems and adjusting strategies, are not designed to be a strict roadmap to a specific endpoint (National Research Council 2004). Rather, the principles set forth a mechanism that will assist in recognizing when changes occur and management should be adjusted. The principles are based on several important aspects of systems.
First, as we learn more about the interactions between humans, their environments, and potential impacts of human activities, there may be a need to develop new courses of action. Second, the environment in which we live is highly variable and is always changing, and these factors can impact operations of projects. Finally, the objectives that society has for a specific project and the outcomes from that project may change, resulting in a need to change how the project is operated (National Research Council 2004).
4 - 2

Red River Valley Water Supply Project FEIS Chapter Four Environmental Impacts
The basic theme of adaptive management is to continually evaluate project operations and develop courses of actions that can respond to change. This means that project managers must revisit objectives and develop a range of choices for how they will manage a project if changes occur. Managers must also use the information gained through evaluation and apply it to future decisions. A key to successful implementation of any adaptive management strategy is to involve stakeholders in the learning and evaluation processes.
Where Has Adaptive Management Been Used? Adaptive management has been used on water resource projects in many areas of the United States. For example, the U.S. Department of the Interior used an adaptive management approach to restoring riparian habitat in the Grand Canyon by releasing large quantities of water from Glen Canyon Dam. A number of projects have incorporated adaptive management to address recovery of threatened or endangered species, or in ecosystem restoration programs. For example, the Corps incorporated adaptive management into restoration efforts in the Florida everglades.
Recently, Reclamation has used adaptive management strategies in the development of water projects in North Dakota. As projects are undergoing final design and construction, Reclamation has established teams of stakeholders to review projects for environmental compliance. These teams evaluate specific project features as they are being designed and built and monitor environmental compliance. This program allows construction to proceed despite changes (e.g. unanticipated discovery of cultural resources), respond to the changes, (re-route the pipe to avoid the site), and “adapt” to conditions in the field.
How Will Adaptive Management Be Used on the Project? For the purposes of this Project, Reclamation and the State of North Dakota will focus on two specific areas. First, the process will be used to monitor the effectiveness of the North Dakota Game and Fish Department’s flow recommendations and their impacts (positive or negative) on aquatic communities. Second, if a Missouri River import alternative is selected in the Record of Decision, an adaptive management strategy will be developed to assess the effectiveness of the water treatment systems in reducing risks of transfer of non-native species. Adaptive management is based on input from a number of scientific, engineering, and social disciplines. As such, the use of adaptive management is not limited strictly to issues related to human impacts on the environment.
Because a key factor in successful implementation of adaptive management is stakeholder involvement, Reclamation and the State of North Dakota will establish the Impact Mitigation Team to implement adaptive management practices. This team, which will be comprised of federal, state, tribal, and local entities, will develop the specific adaptive management programs and provide input to Reclamation and the State of North Dakota.
Climate Change Climate change could affect the Project in several ways. If the average temperature increases in the Red River Valley, seasonal runoff and annual streamflow in the Red River and its tributaries could be reduced, thus affecting the amount of water available to meet future MR&I demands. Likewise, increased temperatures, particularly in the winter, could reduce mountain snowpack and affect runoff volumes and patterns in the Missouri River. Additionally, climate change
4 - 3

Red River Valley Water Supply Project FEIS Chapter Four Environmental Impacts
could affect the water demand both for this Project and for other uses that would not be supplied by this project (e.g., irrigation).
Predictions of future climate variability employ scenario-driven simulations using general circulation models that describe movements and heat transfer in the atmosphere and in the ocean that are based on the fundamental laws of physics. The most widely used models were developed in Canada by the Canadian Center for Climate Modeling and in the United Kingdom by the Hadley Center for Climate Prediction and Research. These models are used by researchers around the world to predict future climate.
Global climate change assessments are released periodically by the IPCC (Intergovernmental Panel on Climate Change), which was established in 1988 by the World Meteorological Organization and the United Nations Environment Programme. The IPCC reports give a comprehensive scientific assessment of information relevant to understanding the risk of human-induced climate change, its potential impacts, and options for adaptation and mitigation. The IPCC bases its assessments mainly on peer- reviewed and published scientific/technical literature. The IPCC reports are written by teams of technical experts from around the world and must pass through a rigorous two-stage scientific and technical review process before publication.
According to the most recent report issued by the IPCC, virtually all climate model simulations agree that average annual temperatures in central North America, which includes the Project area, will continue to increase during this century, with a median projected increase of 3.5oC for years 2080 – 2099 as compared to 1980 – 1999 (Christensen et al. 2007). On a global scale, warming is projected to reduce precipitation in the subtropics and increase precipitation at higher latitudes (Arnell et al. 2001; Solomon et al. 2007). However, the location of “boundaries” between areas projected to receive more or less precipitation is uncertain. This uncertainty is reflected in considerable disagreement among model outputs for precipitation change at middle latitudes. For example, the median projected change in annual precipitation for central North America is a 3% increase, but model projections range from a decrease of 16% to an increase of 15% (Christensen et al. 2007).
Even if average annual precipitation increases, increased evaporation from rising air temperatures may outweigh the increase in precipitation, thereby reducing soil moisture and increasing the chance of drought (Jacobs et al. 2001). Likewise, increased evaporation could lower reservoir levels and/or necessitate changes in reservoir management.
Variability in streamflow over time is strongly influenced by variability in precipitation over seasonal, annual, and decadal time scales. Thus, changes in precipitation could alter the frequency, magnitude, and duration of future hydrologic droughts. However, many uncertainties remain that limit the ability to project changes in precipitation over regional or sub-regional scales. Modeled changes in average annual precipitation occur more slowly than changes in temperature, and thus, may be more difficult to detect given the large amount of natural variability in precipitation over annual and decadal time scales (Cohen et al. 2001; Christensen et al. 2007).
4 - 4

Red River Valley Water Supply Project FEIS Chapter Four Environmental Impacts
Drought occurrence in the United States is strongly influenced by periodic variations in sea surface temperature, including the Pacific Decadal Oscillation and the Atlantic Multidecadal Oscillation (McCabe et al. 2004). How these oscillations in ocean temperature will respond to climate change is still poorly understood (Solomon et al. 2007).
Figure 4.1 shows projected changes in the Palmer Drought Severity Index over the next century for the central United States from two widely used global climate models. Positive values indicate a decreased chance of drought, and negative values indicate an increased chance. Projections using the Canadian model suggest that extreme drought will be a common occurrence over the Great Plains by the end of the century, while the Hadley model projects much less change in drought conditions. Regardless, both scenarios denote future periods where drought conditions on the Great Plains appear likely (Jacobs et al. 2001).
Hadley Model Canadian Model > 10 8 6 4 2 0 - 2 - 4 - 6 - 8 - 10
Figure 4.1. Projected Change in The Palmer Drought Severity Index Over The 21st Century, Based On Two Widely Used Climate Models (modified from Jacobs et al. 2001).
Increased temperatures are expected to change the seasonal pattern of runoff and streamflow (Jacobs et al. 2001). In particular, projections show that warmer winters will result in more winter precipitation falling as rain and less as snow. As a result, snowpack will decrease, winter streamflows increase, and spring runoff occur earlier (Christensen et al. 2007). Changes in seasonal precipitation could also cause lower summer flows (Christensen et al. 2007). Because the Red River is essentially unregulated, changes in seasonal runoff could significantly affect availability of water for MR&I uses during the summer when water demand is highest. Flows in the Missouri River are regulated by releases from the mainstem reservoirs, so changes in seasonal runoff would affect MR&I water supplies less. Such changes could, however, have a greater effect on aquatic resources. For example, increased water temperature and changes in ice cover are likely to cause a northward movement in the distribution of many aquatic species (Gleik 2000).
Wolcock and McCabe (1999) compared projected mean annual runoff for major U.S. river basins using the Canadian and Hadley climate models. For most basins, there was little agreement between the model projections. Table 4.1 shows projected changes for the Souris-Rainy-Red River Basin and the Missouri River Basin. Both models suggest that changes in
4 - 5

Red River Valley Water Supply Project FEIS Chapter Four Environmental Impacts
runoff will occur more slowly than changes in temperature, but the ultimate direction and magnitude of the changes, if any, are uncertain.
Table 4.1. Projected Changes in Mean Annual Runoff From Two Climate Models ( Wolcock and McCabe 1999).
Souris-Rainy-Red River Basins Projected Change in Mean Annual Runoff
Missouri River Basin Projected Change in Mean Annual Runoff
Time Period 1990-2030 1990-2090 Time Period 1990-2030 1990-2090 Hadley Model -18% +79% Hadley Model +18% +45% Canadian Model -24% -80% Canadian Model -25% +48%
Bruce et al. (2003) evaluated potential climate change impacts on U.S.- Canadian transboundary waters. They noted that flows in the Red River have increased substantially over the 1970-2000 period. In contrast, flows in two adjacent watersheds (Souris River and Lake of the Woods) have decreased during the same period. Given the proximity of these watersheds, it is difficult to ascribe these changes in runoff to changes in global or regional climate. Significant warming in summer and fall would likely reverse the upward trend in the Red River, and low flows in the latter part of the year such as those experienced in the 1930s could occur (Bruce et al. 2003).
Johnson et al. (2005) evaluated potential impacts of climate change on northern prairie wetlands. Their modeled projections were highly sensitive to assumed annual rainfall, but indicated that a substantial increase in precipitation would be required to counterbalance the effects of a warmer climate.
In summary, air temperatures are very likely to rise this century in the Project area. Changes in precipitation, streamflow, and drought frequency and intensity are uncertain. Because of these uncertainties, changes in water demand, surface water hydrology, and groundwater attributable to climate change cannot be accurately estimated at this time, and have not been quantified in this FEIS.
4 - 6

Red River Valley Water Supply Project FEIS Chapter Four Environmental Impacts
Red River Basin Surface Water Quantity
Introduction How would the alternatives affect the volume of water in Lake Ashtabula and flows at
key points in the river system? What effect would changes in water volume have on the MR&I systems that use surface
water?
There are many interrelated aspects to water quantity, including effects to aquatic communities, water quality, endangered species, flooding and erosion, and historic properties, to name a few. This analysis focuses primarily on how water quantity from each of the alternatives would affect the volume of water in the surface water system, the ability of the system to meet MR&I water demands in the Red River Valley, and the volume of water that would enter Canada via the Red River. Other water quantity related aspects are discussed in resource sections of the FEIS.
A key component of this Project was to determine how much water would be available in the Sheyenne and Red Rivers with the No Action Alternative under different flow conditions. The No Action Alternative was the basis for developing action alternatives that would meet identified shortages (see chapter two, water shortage section). It also was used to assess changes in water supply and river flows in the Red River Valley that would occur without implementation of an action alternative.
Gaging Sites Discussed:Sheyenne River from Lake Ashtabula to the confluence with the Red River
• USGS Gage 05059000 near Kindred, North Dakota
Red River from Wahpeton to the Canadian border
• USGS Gage 05054000 at Fargo, North Dakota
• USGS Gage 05102500 near Emerson, Manitoba
Changes in flow and volume from the alternatives would be due to increased withdrawals and use of reservoir storage and rivers to convey water to points of demand. All USGS gages and some non-gaged points in the valley were modeled and are discussed in Appendixes B.1 and B.2. Due to the immense amount of information and gaging data available from modeling, the focus of this analysis in this section is on Lake Ashtabula and three selected gaging sites. Figure 4.2 shows the location of Lake Ashtabula (Baldhill Dam) and the three key gaging sites.
Methods To assess changes in water quantity, surface water modeling was performed for present (2005) conditions and for each of the alternatives using projected 2050 demands. The present condition modeling applied 2005 water demands to historic flows. This established a baseline to assess future changes in flow and volume. The alternatives were then modeled using 2050 projected water demands during a 10-year drought, from 1931-1940, and over the 71-year period of record. This information was used to compare alternatives to each other and to document changes from the 2005 baseline.
4 - 7

Red River Valley Water Supply Project FEIS Chapter Four Environmental Impacts
The output data from modeling was further analyzed where flows at four USGS gaging sites on the Sheyenne and Red Rivers were classified into five categories (see Appendix B.2). These categories are:
• Extreme Low Flow – flow equal to or less than the 10th percentile (≤ 10%).
• Low Flow – flow between the 11th and 24th percentile (11-24%).
• Average Flow – flow between 25th and 75th percentile (25-75%).
• High Flow – flow between the 76th and 89th percentile (76-89%).
• Extreme High Flow – flow equal to or greater than the 90th percentile (≥ 90%). Figure 4.2 – Location of Key Gages Analyzed
Along the Sheyenne and Red Rivers.
Data for other gages on tributaries to the Sheyenne and Red Rivers were reviewed but showed no flow or volume differences. This is because there would be no operational changes to these river reaches by the No Action Alternative or by the action alternatives. Thus, no further analyses of these gages were conducted.
Results Analysis of key gages covers a short-term period, representing a 1930s-type drought, and the period of record. Two periods were modeled: 1) 10 years of historic records (1931-1940) and 2) 71 years of historic records (1931-2001). Discussion of short-term effects focuses on a year similar to 1934. This year was selected because it had the lowest annual volume of flow in the historic record of the Red River Valley. In-depth discussion of flows and volumes used in analysis is in appendixes B.1 and B.2.
Short-term Changes During a Drought 1931-1940 The Red River Valley is susceptible to water shortages during drought events similar to the 1930s. The alternatives were formulated to supplement water supplies in the service area by delivering water to MR&I systems with shortages. Analysis of the 10-year drought shows how the alternatives would affect storage in Lake Ashtabula and flows in the Sheyenne and Red Rivers when the rivers would be used to deliver water.
Lake Ashtabula Lake Ashtabula would be operated to augment low flows to meet downstream water supply demands, as well as pollution abatement objectives, and to reduce flooding in the Sheyenne River Valley. Recreation, fish, and wildlife enhancements are secondary objectives of the Baldhill Dam operating plan. Cities holding reservoir water storage permits in Lake Ashtabula are Fargo, Grand Forks, Valley City, West Fargo, and Lisbon. See chapter two for operational considerations used in modeling and chapter three for details on Lake Ashtabula’s storage capacity and history.
4 - 8

Red River Valley Water Supply Project FEIS Chapter Four Environmental Impacts
In addition to the comparison of the No Action Alternative to the action alternatives, figures 4.3 and 4.4 include three items: 1) the top of Conservation Pool, 2) 28,000 ac-ft Fish and Wildlife Conservation Pool, and 3) 2005 conditions. The first is the maximum volume of permitted storage in the reservoir. The second is a target in the Corps’ operating plan for limiting or stopping withdrawals from permitted storage. The third is current water demands. This is further discussed in chapter three, surface water quantity and Appendix B.1.
Table 4.2 compares present average monthly volumes in Lake Ashtabula (2005) to the No Action Alternative. Table 4.3 compares all of the Project
alternatives to each other.
Table 4.2 – Comparison of Present 2005 Conditions to the No Action Alternative for Lake Ashtabula Volumes.
Present 2005
Demands No Action (2050
Demands) Year
(during a 1930s
type drought)
Average Volume (ac-ft)
Average Volume (ac-ft)
Change from
Present 2005
Condition1931 59,554 50,422 -15%1932 58,957 42,680 -28%1933 57,674 33,777 -41%1934 51,515 19,572 -62%1935 55,812 23,192 -58%1936 54,657 21,899 -60%1937 47,146 19,568 -58%1938 47,122 19,484 -59%1939 43,178 18,521 -57%1940 39,022 17,565 -55%
Average 51,464 26,668 -48%
No Action Alternative This alternative would have a total of 86 months below the top of the Fish and Wildlife Conservation Pool, with the lowest elevation reached being around 1,250 ft msl (approximately 14,400 ac-ft) for 4 months. This alternative would be worse than the present 2005 condition, which would have slightly more than half of the average volume over a 10-year period, causing many MR&I systems to experience water shortages.
The water remaining in the reservoir is useable down to the dead pool of 1,240 ac-ft. However, this volume of water is held in abeyance by the State of North Dakota for Grand Forks under a senior permit.
North Dakota In-Basin Alternative Having the largest average 10-year volume during a 1930s-type drought, this alternative would not drop below the top of the Fish and Wildlife Conservation Pool. It would improve water storage, compared to the No Action Alternative. All MR&I systems in the service area would be supplied peak-day demands without experiencing a shortage.
Red River Basin Alternative This alternative would not drop below the top of the Fish and Wildlife Conservation Pool and would improve water storage, compared to the No Action Alternative. Of the action alternatives, it would have the second lowest average volume during a 1930s-type drought. All MR&I systems in the service area would be supplied peak-day demands without experiencing a shortage.
GDU Import to Sheyenne River Alternative Having the lowest average 10-year volume during a 1930s-type drought, this alternative would not drop below the top of the Fish and Wildlife Conservation Pool and would improve water storage, compared to the No Action Alternative. This would be primarily due to the releases from the reservoir to satisfy aquatic flows specific to this alternative, as described in Appendix B.1. All MR&I systems in the service area would be supplied peak-day demands without experiencing a shortage.
4 - 9

Red River Valley Water Supply Project FEIS Chapter Four Environmental Impacts
Figure 4.4 - Lake Ashtabula Monthly Volumes During 1934.
Figure 4.3 - Lake Ashtabula Average Monthly Volumes During a Drought 1931-1940.
4 - 10

Red River Valley Water Supply Project FEIS Chapter Four Environmental Impacts
Table 4.3 – Comparison of the No Action Alternative to Action Alternatives for Lake Ashtabula Volumes.
No Action
North Dakota
In-Basin
Red River Basin
GDU Import to Sheyenne
River
GDU Import
Pipeline
Missouri River Import to Red River
Valley
Year
Average Volume (ac-ft)
Average Volume (ac-ft)
Average Volume (ac-ft)
Average Volume (ac-ft)
Average Volume (ac-ft)
Average Volume (ac-ft)
1931 50,422 57,805 58,587 56,829 58,912 58,422 1932 42,680 53,998 57,003 57,678 58,727 57,567 1933 33,777 50,723 55,344 54,222 56,687 55,506 1934 19,572 44,781 46,650 39,742 47,693 45,260 1935 23,192 53,793 50,913 45,915 53,050 50,740 1936 21,899 49,467 52,728 50,065 53,700 53,350 1937 19,568 41,017 47,207 42,718 51,020 52,006 1938 19,484 54,415 46,343 42,175 48,541 49,546 1939 18,521 59,695 40,975 39,564 42,375 42,719 1940 17,565 57,399 35,416 34,889 35,931 36,051
Average 26,668 52,309 49,117 46,379 50,664 50,117
GDU Import Pipeline Alternative Having the second highest average volume during a 1930s-type drought, this alternative would not drop below the top of the Fish and Wildlife Conservation Pool and improves water storage compared to the No Action Alternative. All MR&I systems in the service area would be supplied peak-day demands without experiencing a shortage.
Missouri River Import to Red River Valley Alternative With the largest average volume during a 1930s-type drought, this alternative would not drop below the top of the Fish and Wildlife Conservation Pool and would improve water storage compared to the No Action Alternative. All MR&I systems within the service area would be supplied peak-day demands experiencing a shortage.
Sheyenne River Natural flows in the Sheyenne River would be used to serve water users along the Sheyenne River and downstream of its confluence with the Red River. The river also would be used as a conveyance feature for water stored under permits in Lake Ashtabula. Results displayed are for the USGS gage 05059000 near Kindred, North Dakota.
During a 1930s-type drought, flows in the Sheyenne River would be either increased or decreased by Project alternatives, depending on the time of year and operational considerations for other water supply features. Those alternatives that rely heavily on storage in Lake Ashtabula tend to have higher flows in the river, while those that rely on other water source features have lower flows. As shown in figures 4.5 and 4.6, none of the flows analyzed for the drought period exceeded the estimated bankfull of 1,000 cfs. Potential changes in erosion are discussed in the flooding and erosion section of this chapter.
4 - 11

Red River Valley Water Supply Project FEIS Chapter Four Environmental Impacts
Figure 4.5 - Average Monthly Flows Near Kindred, North Dakota During a Drought 1931-1940.
Figure 4.6 - Average Monthly Flows Near Kindred, North Dakota, During 1934.
4 - 12

Red River Valley Water Supply Project FEIS Chapter Four Environmental Impacts
Table 4.4 compares current (2005) average monthly flows in the Sheyenne River near Kindred, North Dakota, with No Action flows. Table 4.5 goes on to compare all the Project alternatives to each other and denotes the average annual flows that are reduced in the No Action Alternative. Table 4.4 – Comparison of Present 2005 Conditions and the No Action Alternative Flows on the Sheyenne River Near Kindred, North Dakota.
Present 2005 Demands No Action (2050 Demands) Year
(during a 1930s
type drought)
Average Flow
Volume (ac-ft)
Average Flow
Volume (cfs)
Average Flow
Volume (ac-ft)
Average Flow
Volume (cfs)
Change from
Present 2005
Conditions 1931 32,623 45 56,305 78 73%1932 71,071 98 77,697 107 9%1933 64,085 89 68,850 95 7%1934 23,680 33 23,088 32 -3%1935 27,649 38 41,545 57 50%1936 44,194 61 36,790 51 -17%1937 25,409 35 25,870 36 2%1938 22,936 32 22,690 31 -1%1939 29,749 41 29,720 41 0%1940 24,589 34 23,221 32 -6%
Average 36,599 51 40,578 56 11%
No Action Alternative Comparing the No Action Alternative to the present 2005 condition shows approximately a 10% increase in flows in the drought period. However, along with increased flows there would also be more instances of extreme low flow. This would occur because Lake Ashtabula would be called on as a water supply more frequently under the No Action Alternative than under present 2005 conditions, causing flows to be higher in some months. Subsequently, the flow would be lower in other months and years as available water supplies in the reservoir are depleted, leading to a reduction in releases from storage and causing shortages for downstream water users. The results of the analysis showed shortages in the service area under both the present 2005 conditions and the No Action Alternative.
North Dakota In-Basin Alternative Compared to the No Action Alternative, this alternative would meet all MR&I water demands in the service area. It also shows a decrease in the occurrence of extreme low flow during a drought. Decreases in extreme low flow correspond to increases in average flow. The alternative would have the second highest average annual flows for the Project alternatives during the drought period. During a drought, flows would increase, as compared to the No Action Alternative, because releases from Lake Ashtabula would be increased to meet shortages for cities holding reservoir water storage permits. The volume in the reservoir would be replenished with water piped into the reservoir from the Red River downstream from Grand Forks.
4 - 13

Red River Valley Water Supply Project FEIS Chapter Four Environmental Impacts
Table 4.5 – Comparison of the No Action Alternative Flows to Action Alternative Flows on the Sheyenne River Near Kindred, North Dakota.
No Action
North Dakota
In-Basin
Red River Basin
GDU Import to Sheyenne
River
GDU Import
Pipeline
Missouri River
Import to Red River
Valley
Year
Average Flow
Volume (ac-ft)
Average Flow
Volume (cfs)
Average Flow
Volume (cfs)
Average Flow
Volume (cfs)
Average Flow
Volume (cfs)
Average Flow
Volume (cfs)
Average Flow
Volume (cfs)
1931 56,305 78 69 47 133 48 45 1932 77,697 107 124 99 159 99 95 1933 68,850 95 106 87 160 93 92 1934 23,088 32 63 33 136 35 33 1935 41,545 57 58 36 122 35 33 1936 36,790 51 92 57 135 58 58 1937 25,870 36 53 28 129 30 28 1938 22,690 31 53 32 118 35 33 1939 29,720 41 58 41 130 41 40 1940 23,221 32 64 34 123 35 35
Average 40,578 56 74 49 135 51 49
Represents average flow volumes less than those for No Action
Red River Basin Alternative This alternative would meet all MR&I water demands in the service area, but it was not designed to follow the recommendations of the MNDNR (see alternative description in chapter two). It would reduce the number of months in the extreme high flow and high flow categories in the Sheyenne River, while increasing average flow months. This would tend to stabilize flows in the river, because there are no features supplying supplemental water to Lake Ashtabula. The alternative would rely on water from the reservoir only to optimize the size of the import feature from Minnesota groundwater. Similar to the Missouri River Import to Red River Valley Alternative, this alternative would have the lowest average flows for a 1930s-type drought.
GDU Import to Sheyenne River Alternative This alternative would use the Sheyenne River to deliver imported Missouri River water to the Red River Valley. It is also the only alternative to incorporate the North Dakota Game and Fish Department’s recommendations for minimum stream flow in the Sheyenne and Red Rivers, as explained in the modeling the action alternatives section in chapter two. As a result, extreme low flows during a drought would be greatly reduced in some reaches and eliminated in others. All MR&I water demands in the service area would be met. This alternative would have the highest averaged flow during a 1930s-type drought and would be the only alternative capable of meeting the recommended minimum flow in the Sheyenne River to meet aquatic needs.
GDU Import Pipeline Alternative Similar in results to the Red River Basin Alternative, this alternative would stabilize flows in the Sheyenne River by decreasing the occurrence of extreme
4 - 14

Red River Valley Water Supply Project FEIS Chapter Four Environmental Impacts
high and low flows, when compared to the No Action Alternative. This corresponds to an increase in the number of low and average flow months. Average flows would be slightly higher than those for the Red River Basin and Missouri River Import to Red River Valley Alternatives. All MR&I water demands in the service area would be met.
Missouri River Import to Red River Valley Alternative This alternative mirrors the Red River Basin Alternative in that it would stabilize flows in the Sheyenne River. This would be accomplished because it relies on water stored in Lake Ashtabula to decrease the size of the Missouri River import feature. It shares the distinction of having the lowest average flows during a 1930s-type drought, while meeting all MR&I water demands in the service area. This is in part due to a feature unique to this alternative that would supply a constant 20 cfs to Grand Forks via pipeline. The import to Grand Forks decreases the city’s reliance on its storage in Lake Ashtabula, thereby reducing flows in the river.
Red River Natural flows in the Red River would be used to serve the water demands of users along its shores. Project water would also be conveyed by the Red River downstream of its confluence with the Sheyenne River.
Two sites along the Red River were analyzed. The first site is the USGS gage 05054000 located at Fargo. The second is the USGS gage 05102500 at Emerson, Manitoba, which measures flows entering Canada via the Red River.
During a 1930s-type drought, flows in the Red River are both increased and decreased by Project alternatives, depending on the time of year and operating considerations for the other water supply features in each alternative. Those alternatives importing water directly to the Fargo area tend to maintain higher flows in the river at Fargo during drought periods. For most Project alternatives, flows are also increased on the Red River at Emerson during drought periods.
Red River in Fargo at the Northern Pacific Bridge During a Drought in November 1910 (Institute for Regional Studies, North Dakota State University Libraries, 328-2-20)
Figures 4.7 and 4.8, representing the gage at Fargo, and figures 4.9 and 4.10, representing the gage at Emerson, show that flows during a drought never exceed the estimated bankfull conditions of 2,400 cfs and 15,800 cfs, respectively. Bankfull and erosion caused by flooding is discussed in the flooding and erosion section of this chapter.
Table 4.6 compares average monthly flows in the Red River at Fargo, North Dakota, under present 2005 conditions with the No Action Alternative. Table 4.8 shows the same information for the Emerson Gage. Tables 4.7 and 4.9 compare Project alternatives to each other and denote when average annual flows for the alternatives are reduced from those in the No Action Alternative for each of the respective gaged sites.
4 - 15

Red River Valley Water Supply Project FEIS Chapter Four Environmental Impacts
Figure 4.7 - Average Monthly Flows at Fargo, North Dakota, During a Short-term Drought 1931-1940.
Figure 4.8 – Average Monthly Flows at Fargo, North Dakota, During 1934.
4 - 16

Red River Valley Water Supply Project FEIS Chapter Four Environmental Impacts
Figure 4.9 - Average Monthly Flows at Emerson, Manitoba, During a Drought 1931-1940.
Figure 4.10 – Average Monthly Flows at Emerson, Manitoba, in 1934.
4 - 17

Red River Valley Water Supply Project FEIS Chapter Four Environmental Impacts
Table 4.6 – Comparison of Present 2005 Conditions With No Action Alternative Flows on the Red River at Fargo, North Dakota.
Present 2005 Demands No Action (2050 Demands)
Year (during a 1930s-
type drought)
Average Flow
Volume (ac-ft)
Average Flow
Volume (cfs)
Average Flow
Volume (ac-ft)
Average Flow
Volume (cfs)
Change from
Present 2005
Conditions 1931 8,976 12 741 1 -92% 1932 16,842 23 8,724 12 -48% 1933 14,287 20 6,073 8 -57% 1934 6,563 9 710 1 -89% 1935 34,807 48 19,521 27 -44% 1936 33,331 46 24,893 34 -25% 1937 40,847 56 25,159 35 -38% 1938 54,868 76 35,186 49 -36% 1939 100,715 139 80,569 111 -20%
1940 44,223 61 27,770 38 -37%
Average 35,546 49 22,935 32 -35% Table 4.7 – Comparison of No Action Alternative to Action Alternative Flows on the Red
River at Fargo, North Dakota.
No Action
North Dakota
In-Basin
Red River Basin
GDU Import to Sheyenne
River
GDU Import
Pipeline
Missouri River
Import to Red River
Valley
Year
Average Flow
Volume (ac-ft)
Average Flow
Volume (cfs)
Average Flow
Volume (cfs)
Average Flow
Volume (cfs)
Average Flow
Volume (cfs)
Average Flow
Volume (cfs)
Average Flow
Volume (cfs)
1931 741 1 2 2 67 16 11932 8,724 12 17 17 58 29 131933 6,073 8 11 11 42 20 91934 710 1 3 3 22 13 11935 19,521 27 31 31 68 45 271936 24,893 34 37 37 53 46 341937 25,159 35 42 42 83 59 361938 35,186 49 62 62 100 78 511939 80,569 111 121 121 157 143 1131940 27,770 38 49 49 79 61 39
Average 22,935 32 38 37 73 51 33
4 - 18

Red River Valley Water Supply Project FEIS Chapter Four Environmental Impacts
Table 4.8 – Comparison of Present 2005 Conditions With No Action Alternative Flows on the Red River at Emerson, Manitoba.
Present 2005 Demands No Action (2050 Demands)
Year (during a 1930s
type drought)
Average Flow
Volume (ac-ft)
Average Flow
Volume (cfs)
Average Flow
Volume (ac-ft)
Average Flow
Volume (cfs)
Change from
Present 2005
Conditions 1931 326,963 452 318,080 439 -3% 1932 677,757 936 651,189 899 -4% 1933 527,401 728 508,654 703 -4% 1934 190,898 264 196,836 272 3% 1935 363,355 502 357,611 494 -2% 1936 570,899 789 563,813 779 -1% 1937 495,365 684 486,885 672 -2% 1938 641,850 887 632,488 874 -1% 1939 404,199 558 389,714 538 -4% 1940 541,652 748 536,179 741 -1%
Average 474,034 655 464,145 641 -2%
Table 4.9 – Comparison of No Action Alternative to Action Alternative Flows on the Red River at Emerson, Manitoba.
No Action
North Dakota
In-Basin
Red River Basin
GDU Import to Sheyenne
River
GDU Import
Pipeline
Missouri River
Import to Red River
Valley
Year
Average Flow
Volume (ac-ft)
Average Flow
Volume (cfs)
Average Flow
Volume (cfs)
Average Flow
Volume (cfs)
Average Flow
Volume (cfs)
Average Flow
Volume (cfs)
Average Flow
Volume (cfs)
1931 318,080 439 446 472 523 498 4891932 651,189 899 937 957 974 980 9691933 508,654 703 717 750 761 776 7711934 196,836 272 251 287 314 309 3041935 357,611 494 474 516 553 542 5321936 563,813 779 794 802 818 824 8221937 486,885 672 649 692 745 720 7071938 632,488 874 859 903 942 933 9131939 389,714 538 535 570 610 604 5811940 536,179 741 735 767 805 793 779
Average 464,145 641 640 672 704 698 687
Represents average flow volumes less than those for No Action
4 - 19

Red River Valley Water Supply Project FEIS Chapter Four Environmental Impacts
No Action Alternative On the Red River, the present 2005 condition has flows similar to the No Action Alternative. Once flows drop into the extreme low flow and low flow categories, there is very little water available for supply. However, the increased water demand reflected in the No Action Alternative reduces the average volume of water flowing past Fargo by over 50% from the present 2005 condition during a 1930s-type drought. This effect is greatly dampened by the time the river reaches Canada, where tributaries entering the Red River leave the system with a 2% reduction in average flows. There are MR&I users along the Red River that are short of water under both the present 2005 conditions and No Action.
North Dakota In-Basin Alternative While flows in the Fargo area would increase compared to the No Action Alternative, this alternative shows almost no flow changes at the Emerson Gage. Although all MR&I water demands in the service area would be met, this alternative would have the lowest average flows entering Canada.
Red River Basin Alternative Similar to the North Dakota In-Basin Alternative, this alternative would increase flow in the Fargo area during a 1930s-type drought; however, it would have higher average flows when compared to the No Action or North Dakota In-Basin Alternatives at the Emerson, Manitoba, Gage. All MR&I water demands in the service area would be met.
GDU Import to Sheyenne River Alternative This alternative shows a decrease in the extreme low flow category at the Fargo Gage, with a corresponding increase in the low flow category months. With the highest averaged flow during a 1930s-type drought of all the alternatives, its reduction in extreme low flow is primarily due to the 68 cfs recommended North Dakota Game and Fish Department aquatic flow.
In this alternative, when flows in the Red River decrease to 68 cfs at Fargo, all junior water permit holders would be prohibited from withdrawing water from the Red River upstream from Fargo. At this point, industrial water users at Wahpeton would be cut off and water would be supplied by buried pipeline. This would reduce the occurrence of extreme low flow at the Fargo Gage. There is only a slight decrease in the number of months of extreme low flow at the Emerson Gage when compared to the No Action Alternative; however, the average flow would be the highest of all the alternatives.
GDU Import Pipeline Alternative Serving all of the MR&I water demands in the service area, this alternative would have the second highest flows at the Fargo and Emerson Gages. There would be a decrease in extreme low flow at Fargo, with a corresponding increase in low flow, and a slight increase in average flow at this gage. The decrease in extreme low flow occurs because there would be an operational difference for this alternative as compared to the others. Operationally, this alternative supplies water from the buried pipeline to West Fargo and Fargo prior to surface water shortages occurring, preserving some of the flow in the Red River when compared to the No Action Alternative.
Missouri River Import to Red River Valley Alternative This alternative shows almost no change in flows when compared to the No Action Alternative at the Fargo Gage. While meeting all the MR&I water demand, this alternative would have the third highest flow at the Emerson Gage.
4 - 20

Red River Valley Water Supply Project FEIS Chapter Four Environmental Impacts
This is caused in large part by the feature specific to this alternative that supplies a constant flow of 20 cfs to Grand Forks via the import pipeline from the Missouri River.
Red River From Emerson to Lake Winnipeg and Lake Winnipeg Water users along the Red River would withdraw water to meet their needs under all of the alternatives, but two Project alternatives (North Dakota In-Basin and GDU Import to Sheyenne River) would add water to Lake Ashtabula to meet MR&I needs in the service area. Analysis of Project effects by hydrologic modeling relies upon USGS gages. The northernmost USGS gage on the Red River is 05102500 located at Emerson, Manitoba, so this is the only gage that measures effects in Canada. The minor changes in flows appear in tables 4.8 and 4.9. However, Project-influenced changes in flow north of this gage would be muted by contributions from tributaries in Canada.
Average flows from the Red River comprise 11% of inflow to Lake Winnipeg. The modeled net change in flow by Project alternatives during a 1930s-type drought ranges from -2% for the No Action Alternative to +7% for one of the action alternatives at Emerson, Manitoba. Assuming no change to the inflow from the watersheds in Canada, the net change in total inflow to Lake Winnipeg from the Red River during a 1930s-type drought would range from 0% to an increase of 0.7%.
No Action Alternative On the Red River, the present 2005 condition shows flows similar to the No Action Alternative in modeling. At the U.S./Canada border the system would have a 2% reduction in flow. The inflow to Lake Winnipeg from the Red River during a 1930s-type drought could be reduced by 0.2%.
North Dakota In-Basin Alternative This alternative shows almost no flow changes at the Emerson Gage. The alternative would have the lowest average flows entering Canada. The inflow to Lake Winnipeg would be nearly identical to No Action.
Red River Basin Alternative This alternative shows an increase in flow of 5% over the No Action Alternative at the Emerson Gage during a 1930s-type drought. The inflow to Lake Winnipeg could increase by 0.5%.
GDU Import to Sheyenne River Alternative This alternative shows a flow increase of 9% over the No Action Alternative at the Emerson Gage during a 1930s-type drought. With the highest averaged flow of all the alternatives, its reduction in extreme low flow is due primarily to the 68 cfs aquatic flow specific to this alternative. The inflow to Lake Winnipeg could increase by 0.9%.
GDU Import Pipeline Alternative This alternative shows an increase in flow of 8% over the No Action Alternative at the Emerson Gage during a 1930s-type drought. The inflow to Lake Winnipeg could increase by 0.8%.
Missouri River Import to Red River Valley Alternative This alternative shows an increase in flow of 7% over the No Action Alternative at the Emerson Gage during a 1930s-type drought. Inflow to Lake Winnipeg could increase by 0.7%.
4 - 21

Red River Valley Water Supply Project FEIS Chapter Four Environmental Impacts
Long-term Changes to Water Quantity - 1931-2001 Long-term changes to water quantity were evaluated to determine if changes to water quantity during years of normal or high flows would cause long-term permanent changes to flows in the rivers. River flows were analyzed for present 2005 conditions and the 71-year period of record by applying the 2050 projected water demands and operations of each alternative to the historic record from 1931 to 2001. The No Action Alternative was compared to the present 2005 condition and each action alternative was compared to the No Action Alternative.
Lake Ashtabula Stored water in Lake Ashtabula would augment low flows to meet downstream water supply demands and pollution abatement objectives and reduce flooding in the Sheyenne River Valley. Recreation and fish and wildlife enhancements are secondary objectives of the dam operation plan. Cities holding reservoir water storage permits are Fargo, Grand Forks, Valley City, West Fargo, and Lisbon. See chapter two for operational considerations made for modeling purposes and chapter three for details on Lake Ashtabula’s storage capacity and history.
Figure 4.11 shows the average monthly volumes for Lake Ashtabula over the 71-year period of record. Multiple drought periods can be seen, including the most recent one of the late 1980s. Tables 4.10 and 4.11 show the average volume for the reservoir for each of the Project alternatives.
0
10,000
20,000
30,000
40,000
50,000
60,000
70,000
Jan-
31
Jan-
34
Jan-
37
Jan-
40
Jan-
43
Jan-
46
Jan-
49
Jan-
52
Jan-
55
Jan-
58
Jan-
61
Jan-
64
Jan-
67
Jan-
70
Jan-
73
Jan-
76
Jan-
79
Jan-
82
Jan-
85
Jan-
88
Jan-
91
Jan-
94
Jan-
97
Jan-
00
Date
Volu
me
(acr
e-fe
et)
No Action North Dakota In-Basin Red River Basin
GDU Import to Sheyenne River GDU Import Pipeline Missouri River Import to Red River Valley
Top of Conservation Pool 28,000 a.f. Fish and Wildlife Conservation Pool Present 2005 Condition
Figure 4.11 – Comparison of Average Monthly Volumes in Lake Ashtabula (1931-2001).
4 - 22

Red River Valley Water Supply Project FEIS Chapter Four Environmental Impacts
Table 4.10 – Comparison of the Present 2005 Condition to No Action Alternative for Averaged Volumes 1931-2001.
Present 2005 Demands No Action (2050 Demands)
Location Average Volume
(ac-ft) Average Volume
(ac-ft)
Change from
Present 2005
Condition
Lake Ashtabula 60,074 56,230 -6%
Table 4.11 – Comparison of the No Action Alternative to Action Alternatives for Averaged Volumes 1931-2001.
No Action
North Dakota
In-Basin
Red River Basin
GDU Import to
Sheyenne River
GDU Import
Pipeline
Missouri River Import to Red River
Valley
Average Volume (ac-ft)
Average Volume (ac-ft)
Average Volume (ac-ft)
Average Volume (ac-ft)
Average Volume (ac-ft)
Average Volume (ac-ft)
Lake Ashtabula 56,230 61,000 59,686 60,032 59,891 59,821
No Action Alternative For the period of record, this alternative would have 86 months below the top of the 28,000 ac-ft Fish and Wildlife Conservation Pool with the lowest elevation reached being just above 1250 ft msl for four months. This alternative shows a 6% lower average volume than the present 2005 condition, because the water demands in the system would be higher.
North Dakota In-Basin Alternative This alternative would not reduce the volume of Lake Ashtabula below the top of the Fish and Wildlife Conservation Pool and would have a higher average volume than the No Action Alternative. Being one of the two alternatives that import water to the reservoir, it would maintain the highest average reservoir volume of all the alternatives.
Red River Basin Alternative This alternative would not reduce the volume of Lake Ashtabula below the top of the 28,000 ac-ft Fish and Wildlife Conservation Pool and would have a higher average reservoir volume than the No Action Alternative. It ranks the lowest for average volume among the action alternatives.
GDU Import to Sheyenne River Alternative This alternative would not reduce the volume of Lake Ashtabula below the top of the 28,000 ac-ft Fish and Wildlife Conservation Pool and would have a higher average volume compared to the No Action Alternative, leaving it ranked second among the action alternatives. This higher average volume would be caused by the import of Missouri River water directly to the reservoir. Its average volume would be less than that for the
4 - 23

Red River Valley Water Supply Project FEIS Chapter Four Environmental Impacts
North Dakota In-Basin Alternative, because it would release more water from the reservoir to maintain the recommended North Dakota Game and Fish Department aquatic flow specific to this alternative.
GDU Import Pipeline Alternative This alternative would not reduce the volume of Lake Ashtabula below the top of the 28,000 ac-ft Fish and Wildlife Conservation Pool and would have a higher average volume than the No Action Alternative. It is comparable in volume to the Red River Basin and Missouri River Import to Red River Valley Alternatives.
Missouri River Import to Red River Valley Alternative This alternative would not drop below the top of the 28,000 ac-ft Fish and Wildlife Conservation Pool and would have a higher average volume than the No Action Alternative. It is comparable in volume to the Red River Basin and GDU Import Pipeline Alternatives.
Sheyenne River Natural flows in the Sheyenne River are used to serve the water demands of users along both the Sheyenne River and those located downstream of its confluence with the Red River. The river is also used as a conveyance feature for the water stored through permit in Lake Ashtabula. Results displayed here are for the USGS gage 05059000 near Kindred, North Dakota.
During the 71-year period, flows in the Sheyenne River are both increased and decreased by Project alternatives depending on the time of year and operational considerations made for each alternative’s other water supply features. During low flow, water demands on the system would tend to call for an increase in releases from Lake Ashtabula, leading to higher flows in the Sheyenne River. During extended drought periods when natural flows are at their lowest and demand is high, Project flows would be at their greatest.
This is shown in figure 4.11 as Project releases draw down the volume in Lake Ashtabula. These higher Project flows combined with natural flows are far less than the bankfull condition of 1,000 cfs at Kindred, North Dakota, shown in figure 4.12 when compared for the same time period. Thus, there are no Project releases from any alternatives when the river is at or above bankfull. Bankfull and erosion caused by flooding is discussed in the flooding and erosion section of this chapter. Table 4.13 compares present condition (2005) with the No Action Alternative at the Kindred Gage.
No Action Alternative Along the Sheyenne River, the No Action Alternative would have an averaged annual flow similar to the present 2005 condition during the 71-year period of record (table 4.12). There are water demand shortages within the service area both during the 1930s-type drought period and sporadically throughout the entire 71-year period.
North Dakota In-Basin Alternative During times of water shortages, releases from Lake Ashtabula would serve downstream water needs and decrease the occurrence of extreme low flow along the Sheyenne River slightly when compared to the No Action Alternative. This small change corresponds with an increase in average flows placing this alternative the second highest in average annual flow. The occurrence of extreme low flow is similar to that of the No Action
4 - 24

Red River Valley Water Supply Project FEIS Chapter Four Environmental Impacts
Alternative, and little change in flows is seen over the 71-year period of record. All MR&I water demands in the service area are met for the entire 71-year period.
0
500
1,000
1,500
2,000
2,500
3,000
3,500
4,000
4,500
5,000Ja
n-31
Jan-
34
Jan-
37
Jan-
40
Jan-
43
Jan-
46
Jan-
49
Jan-
52
Jan-
55
Jan-
58
Jan-
61
Jan-
64
Jan-
67
Jan-
70
Jan-
73
Jan-
76
Jan-
79
Jan-
82
Jan-
85
Jan-
88
Jan-
91
Jan-
94
Jan-
97
Jan-
00
Date
Flow
(cfs
)
No Action North Dakota In-Basin Red River Basin
GDU Import to Sheyenne River GDU Import Pipeline Missouri River Import to Red River Valley
Present 2005 Condition Bankfull
Figure 4.12 – Comparison of Average Monthly Flows on the Sheyenne River Near Kindred for the Project Alternatives 1931-2001.
Table 4.12 – Comparison of Present 2005 Conditions to the No Action Alternative on the Sheyenne River at Kindred, 1931-2001.
Present 2005 Demands No Action (2050 Demands)
Location
Average Annual Flow
Volume (ac-ft)
Average Annual Flow
Volume (cfs)
Average Annual Flow
Volume (ac-ft)
Average Annual Flow
Volume (cfs)
Change from
Present 2005
Condition Kindred 153,419 212 153,371 212 0%
4 - 25

Red River Valley Water Supply Project FEIS Chapter Four Environmental Impacts
Table 4.13 – Comparison of Project Alternative on the Sheyenne River at Kindred, 1931-2001.
No Action
North Dakota
In-Basin
Red River Basin
GDU Import to
Sheyenne River
GDU Import
Pipeline
Missouri River Import to Red River
Valley
Location
Average Annual Flow
Volume (ac-ft)
Average Annual Flow
Volume (cfs)
Average Annual Flow
Volume (cfs)
Average Annual Flow
Volume (cfs)
Average Annual Flow
Volume (cfs)
Average Annual Flow
Volume (cfs)
Average Annual Flow
Volume (cfs)
Kindred 153,371 212 220 211 237 211 211
GDU Import to Sheyenne River Alternative This alternative shows higher average monthly and annual flows when compared to the No Action Alternative. Few months would be in the extreme low flow category at the Kindred Gage. Decreases in extreme low flow correlate mainly with increases in the average flow. In addition, the high flow category shows some increases over the 71-year period of record. However, no Project releases from Lake Ashtabula would be required by this alternative when natural flows are at or above bankfull. All MR&I water demands in the service area are met for the entire 71-year period.
GDU Import Pipeline Alternative This alternative shows very little change in flow along the Sheyenne River when compared to the No Action Alternative, because there is no addition of water to the system. Also, operations of Lake Ashtabula would be similar to operations under the No Action Alternative. All MR&I water demands in the service area would be met for the entire 71-year period.
Missouri River Import to Red River Valley Alternative This alternative would deliver imported water via pipeline from the Missouri River to the Red River Valley. There would be slight changes to the number of months in each category when compared to the No Action Alternative, but the changes would be slight and would not change the general trend of flow along the Sheyenne River over the 71-year period of record. All MR&I water demands in the service area would be met for the entire 71-year period.
Red River Natural flows in the Red River are used to service the water demands of users along its shores. Project water is also conveyed by the Red River after its confluence with the Sheyenne River. The results discussed here are for two sites along the Red River. The first is the USGS gage 05054000 located at Fargo which will represent the majority of the Red River. The second is the USGS gage 05102500 located at Emerson, Manitoba, which represents the flows entering Canada via the Red River.
During a 1930s-type drought the flows in the Red River are both increased and decreased by Project alternatives depending on the time of year and operational considerations made for each alternative’s other water supply features. Those alternatives importing water directly to the Fargo area tend to maintain higher flows in the river at that gage location during drought periods. For most of the Project alternatives, the flows would be increased on the Red River at Emerson during drought periods.
4 - 26

Red River Valley Water Supply Project FEIS Chapter Four Environmental Impacts
Figure 4.13, representing the gage at Fargo, and figure 4.14, representing the gage at Emerson show that flows during a drought never exceed the estimated bankfull conditions of 2,400 cfs and 15,800 cfs, respectively. Bankfull and erosion caused by flooding is discussed in the flooding and erosion section of this chapter.
0
5,000
10,000
15,000
20,000
25,000
Jan-
31
Jan-
34
Jan-
37
Jan-
40
Jan-
43
Jan-
46
Jan-
49
Jan-
52
Jan-
55
Jan-
58
Jan-
61
Jan-
64
Jan-
67
Jan-
70
Jan-
73
Jan-
76
Jan-
79
Jan-
82
Jan-
85
Jan-
88
Jan-
91
Jan-
94
Jan-
97
Jan-
00
Date
Flow
(cfs
)
No Action North Dakota In-Basin Red River Basin
GDU Import to Sheyenne River GDU Import Pipeline Missouri River Import to Red River Valley
Present 2005 Condition Bankfull
Figure 4.13 – Comparison of Average Monthly Flows on the Red River at Fargo for All Project Alternatives 1931-2001.
Table 4.14 compares average monthly flows in the Red River at Fargo, North Dakota, for present 2005 conditions and the No Action Alternative. Table 4.15 shows the comparison of the No Action Alternative and the action alternatives for both gaged sites.
No Action Alternative Along the Red River, the No Action Alternative would have flow similar to the present 2005 condition during the 71-year period of record. Average annual flows for No Action would be 9% less than those for the present 2005 condition at Fargo and 1% less at Emerson, Manitoba. Water demand shortages would be encountered in multiple years by MR&I users within the service area throughout the 71-year period of record.
4 - 27

Red River Valley Water Supply Project FEIS Chapter Four Environmental Impacts
0
10,000
20,000
30,000
40,000
50,000
60,000
70,000
80,000
Jan-
31
Jan-
34
Jan-
37
Jan-
40
Jan-
43
Jan-
46
Jan-
49
Jan-
52
Jan-
55
Jan-
58
Jan-
61
Jan-
64
Jan-
67
Jan-
70
Jan-
73
Jan-
76
Jan-
79
Jan-
82
Jan-
85
Jan-
88
Jan-
91
Jan-
94
Jan-
97
Jan-
00
Date
Flow
(cfs
)
No Action North Dakota In-Basin Red River Basin
GDU Import to Sheyenne River GDU Import Pipeline Missouri River Import to Red River Valley
Present 2005 Condition Bankfull
Figure 4.14 – Comparison of Average Monthly Flows on the Red River at Emerson, Manitoba, for All Project Alternatives, 1931-2001.
Table 4.14 – Comparison of Present 2005 Conditions to the No Action Alternative on the Red River, 1931-2001.
Present 2005 Demands No Action (2050 Demands)
Location
Average Annual Flow
Volume (ac-ft)
Average Annual Flow
Volume (cfs)
Average Annual Flow
Volume (ac-ft)
Average Annual Flow
Volume (cfs)
Change from
Present 2005
Condition Fargo 527,048 728 480,993 664 -9%
Emerson 2,991,860 4,132 2,953,507 4,079 -1%
4 - 28

Red River Valley Water Supply Project FEIS Chapter Four Environmental Impacts
Table 4.15 – Comparison of Project Alternatives on the Red River, 1931-2001.
No Action
North Dakota
In-Basin
Red River Basin
GDU Import to Sheyenne
River
GDU Import
Pipeline
Missouri River Import to Red River
Valley
Location
Average Annual Flow
Volume (ac-ft)
Average Annual Flow
Volume (cfs)
Average Annual Flow
Volume (cfs)
Average Annual Flow
Volume (cfs)
Average Annual Flow
Volume (cfs)
Average Annual Flow
Volume (cfs)
Average Annual Flow
Volume (cfs)
Fargo 480,993 664 693 693 702 730 670 Emerson 2,953,507 4,079 4,119 4,126 4,116 4,175 4,123
North Dakota In-Basin Alternative Average annual flows at both the Fargo and Emerson Gages would increase when compared to the No Action Alternative. However, while these flows rank among the lowest of the action alternatives, they are only 1% lower than the highest values. There would be no MR&I shortages in the service area during the 71-year period of record.
Red River Basin Alternative Average annual flows at both the Fargo and Emerson Gages would increase when compared to the No Action Alternative. There would be no MR&I shortages in the service area during the 71-year period of record. . GDU Import to Sheyenne River Alternative Average annual flows at both the Fargo and Emerson Gages would increase when compared to the No Action Alternative. The recommended aquatic flow added at the request of the North Dakota Game and Fish Department would be implemented triggering water withdrawals at Fargo and Moorhead from the Sheyenne River when Red River drops to 68 cfs at the Fargo Gage. This tends to maintain slightly higher average annual flows at that Fargo Gage. There would be no MR&I shortages in the service area during the 71-year period of record.
GDU Import Pipeline Alternative Average annual flows at both the Fargo and Emerson Gages would increase when compared to the No Action Alternative. Under this alternative, Fargo would use the import pipeline as a primary source of water allowing for slightly higher flows to be maintained at the Fargo Gage and resulting in higher flows at the Emerson Gage. There would be no MR&I shortages in the service area during the 71-year period of record.
Missouri River Import to Red River Valley Alternative Average annual flows at both the Fargo and Emerson Gages would increase when compared to the No Action Alternative. There would be no MR&I shortages encountered in the service area during the 71-year period of record.
Red River From Emerson to Lake Winnipeg and Lake Winnipeg Natural flows in the Red River would be used by water users along the river to meet demands under all alternatives. Two Project alternatives also would augment flows (North Dakota In-Basin and GDU to Sheyenne River Alternative) to meet MR&I water demands in the service area. USGS gage 05102500 located at Emerson, Manitoba, measures flow at the border and best evaluates the Project’s influence on Canadian waters, as shown in tables 4.14 and 4.15. Any changes in flow caused by the Project would be muted beyond this point by inflow from tributaries in Canada.
4 - 29

Red River Valley Water Supply Project FEIS Chapter Four Environmental Impacts
On the average the Red River contributes 11% of water flowing into Lake Winnipeg. The net change in flow over the 71-year period of record by Project alternatives would range from -1% to +1% at Emerson, Manitoba, according to hydrologic modeling. Assuming no change in inflow from tributaries in Canada, the net change in total inflow to Lake Winnipeg during the 71-year period of record would range from a decrease of -0.1% to an increase of 0.1%.
No Action Alternative On the Red River flows under No Action would be similar to existing conditions (2005). At the U.S./Canada border there would be a 1% reduction in flow. Inflow to Lake Winnipeg from the Red River over the long-term (71-year period of record) could be reduced by 0.1%.
North Dakota In-Basin Alternative Modeling shows a 1% increase in flow entering Canada over the long-term with this alternative. Inflow to Lake Winnipeg could be increased by 0.1%.
Red River Basin Alternative Modeling shows a 1% increase in flow entering Canada over the long-term with this alternative. Inflow to Lake Winnipeg could be increased by 0.1%.
GDU Import to Sheyenne River Alternative Modeling shows a 1% increase in flow entering Canada over the long-term with this alternative. Inflow to Lake Winnipeg could be increased by 0.1%.
GDU Import Pipeline Alternative Modeling shows a 2% increase in flow entering Canada over the long-term with this alternative. Inflow to Lake Winnipeg could be increased by 0.2%.
Missouri River Import to Red River Valley Alternative Modeling shows a 1% increase in flow entering Canada over the long term with this alternative. Inflow to Lake Winnipeg could be increased by 0.1%.
Cumulative Effects The Devils Lake Outlet was the only other project identified that could cumulatively affect the quantity of water in the Sheyenne and Red Rivers. The cumulative effects in the Sheyenne River would be minor, because the Project would deliver water 8 miles above Lake Ashtabula. The short distance between the point of delivery for the GDU Import to Sheyenne River Alternative or the North Dakota In-Basin Alternative to the Sheyenne River would be the only area cumulatively affected. The volume of water released from the reservoir to meet needs downstream in the service area would be the same, regardless of the source of water. This means that there would be no combined effect of this Project with the Devils Lake Outlet below Baldhill Dam.
Summary In general, increased future water demands in the Red River Valley would affect the volume of water stored in Lake Ashtabula and flows in the Sheyenne and Red Rivers. Although there would be shortages during a 1930s-type drought in the Red River Valley under existing conditions, the No Action Alternative with increased future demands would have much greater shortages.
4 - 30
Red River Valley Water Supply Project FEIS Chapter Four Environmental Impacts
Short-term Changes During a Drought 1931-1940 Lake Ashtabula Short-term effects on Lake Ashtabula in the No Action Alternative would include extended drops in reservoir volume below the 28,000 ac-ft Fish and Wildlife Conservation Pool during a drought and water supply shortages in the service area. The No Action Alternative would reduce average volume in the reservoir by 48% over existing conditions. While this is true for the No Action Alternative, the action alternatives would maintain a volume above the 28,000 ac-ft Fish and Wildlife Conservation Pool at all times during a 1930s-type drought, and there would be no MR&I shortages in the service area.
Sheyenne River The short-term effects on the Sheyenne River, between the present 2005 condition and the No Action Alternative, are small when compared to the effects on Lake Ashtabula. Average annual flows would be increased by 11%, even with the higher demands associated with the No Action Alternative. This is because flows in the Sheyenne River would increase as water stored in Lake Ashtabula decreases.
The alternatives that do not use the Sheyenne River to convey additional water into the Red River Valley show the least amount of difference when compared to the No Action Alternative. These alternatives are the Red River Basin Alternative, the GDU Import Pipeline Alternative, and the Missouri River Import to Red River Valley Alternative. This is to be expected, because the only factors that influence flow along the Sheyenne River for these alternatives are permit holders calling on Lake Ashtabula storage to supply water. Since the water stored in the reservoir is allocated by permit, the occasions when water is called upon would be similar to the No Action Alternative, making flows similar as well.
The GDU Import to Sheyenne River Alternative would affect Sheyenne and Red River flows more than the other alternatives. This is because of the aquatic flow targets recommended by the North Dakota Game and Fish Department. These flow targets were not used to size any other alternative. For details on the North Dakota Game and Fish Department aquatic flow recommendations, see chapter one aquatic needs section and Appendix B.1.
The GDU Import Pipeline Alternative has operational requirements that differ from the other import alternatives. MR&I demands would be served by a buried pipeline before the surface water supply is depleted. This preserves flow in the Red River at Fargo and results in fewer instances of extreme low flow during a 1930s-type drought.
None of the action alternatives would increase flows in the Sheyenne River to the point of bankfull when flooding begins. All action alternatives meet the MR&I water demand shortages in the service area during a 1930s-type drought.
Red River The effects on the Red River, between the present 2005 condition and the No Action Alternative would be noticeable, as the increased water demand reduces flows at Fargo by 35%. The effects would be less noticeable at Emerson, Manitoba, because tributaries downstream from Fargo would add enough water to minimize the percentage of flow change to -2%.
Again, while both the present 2005 condition and the No Action Alternative would experience shortages, all action alternatives would meet the MR&I water demand in the service area during a 1930s-type drought.
4 - 31

Red River Valley Water Supply Project FEIS Chapter Four Environmental Impacts
Red River From Emerson to Lake Winnipeg and Lake Winnipeg The effects flows in the Red River would be a reduction of 2% under No Action, as compared to present flows (2005). This reduction may equate to 0.2% less inflow to Lake Winnipeg. All action alternatives either maintain or increase flow in the Red River in Canada over the No Action Alternative during a 1930s-type drought.
Long-term Changes 1931-2001 In general, the No Action Alternative resembles present conditions (2005) along the Red River during a drought and during the 71-year period of record. On the Sheyenne River, there would be small differences in the amount of water flowing in the river, because in the No Action Alternative, Lake Ashtabula would be used as a water supply more frequently than under the existing conditions. MR&I water supply users under existing conditions would experience shortages, but under the No Action Alternative, the shortage would be much greater.
Lake Ashtabula, Sheyenne River, Red River, and Lake Winnipeg Long-term effects on Lake Ashtabula with the No Action Alternative would be much less noticeable, because the reservoir would not drop below the 28,000 ac-ft Fish and Wildlife Conservation Pool, other than during the 1930s. This is over the 71-year analysis period. Likewise, flows in both the Sheyenne and Red Rivers would remain fairly constant, with few noticeable differences in average monthly or average annual flows. However, the No Action Alternative would have water demand shortages during both the 1930s and throughout the 71-year period of record. The action alternatives would meet the water demands of the users in the service area during the entire 71-year period.
The effect the alternatives would have on flows is inversely proportional to the bankfull capacity of the river at the analyzed gage sites. The larger the bankfull capacity, compared to the amount of water the Project delivers, the less noticeable the change in flows becomes when compared to the No Action Alternative. This is apparent at the Emerson Gage on the Red River.
One conclusion that can be drawn from these analyses, including those in Appendix B.2, is that operations of the alternatives would not affect isolated sections of the rivers. When operations change flow at one location, there is often a ripple effect in other sections of the river. For example, in the GDU Import to Sheyenne River Alternative, a minimum streamflow of 23 cfs is an aquatic flow target at the West Fargo Gage on the Sheyenne River. In order to meet this target, releases from Baldhill Dam must be increased, which increases flow from below Baldhill Dam through the Kindred Gage, resulting in very few instances of extreme low flow and more instances of average flow for both the 71-year record and a 10-year drought. The effect this change in flow would have on a resource depends on the specific resource.
By the time Project flows reach Emerson, there would be very few differences among action alternatives, when compared to the No Action Alternative. The differences apparent at the Fargo Gage in the GDU Import to Sheyenne River Alternative and the GDU Import Pipeline Alternative would diminish at the international border at Emerson. The bankfull capacity at Emerson is estimated to be 15,800 cfs—six times larger than the bankfull capacity at Fargo. The amount of water added to the Red River Valley from the alternatives is a small percentage of the river capacity at Emerson. The Project likely would not affect flows at Emerson, further downstream on the Red River in Canada, or inflows into Lake Winnipeg.
4 - 32

Red River Valley Water Supply Project FEIS Chapter Four Environmental Impacts
Environmental Mitigation Only one environmental commitment has been identified to offset or mitigate effects, because none of the action alternatives would have an effect on water quantity.
• Project operations would be scheduled or performed in such a manner as to avoid impacting flood control constraints on Lake Ashtabula.
4 - 33
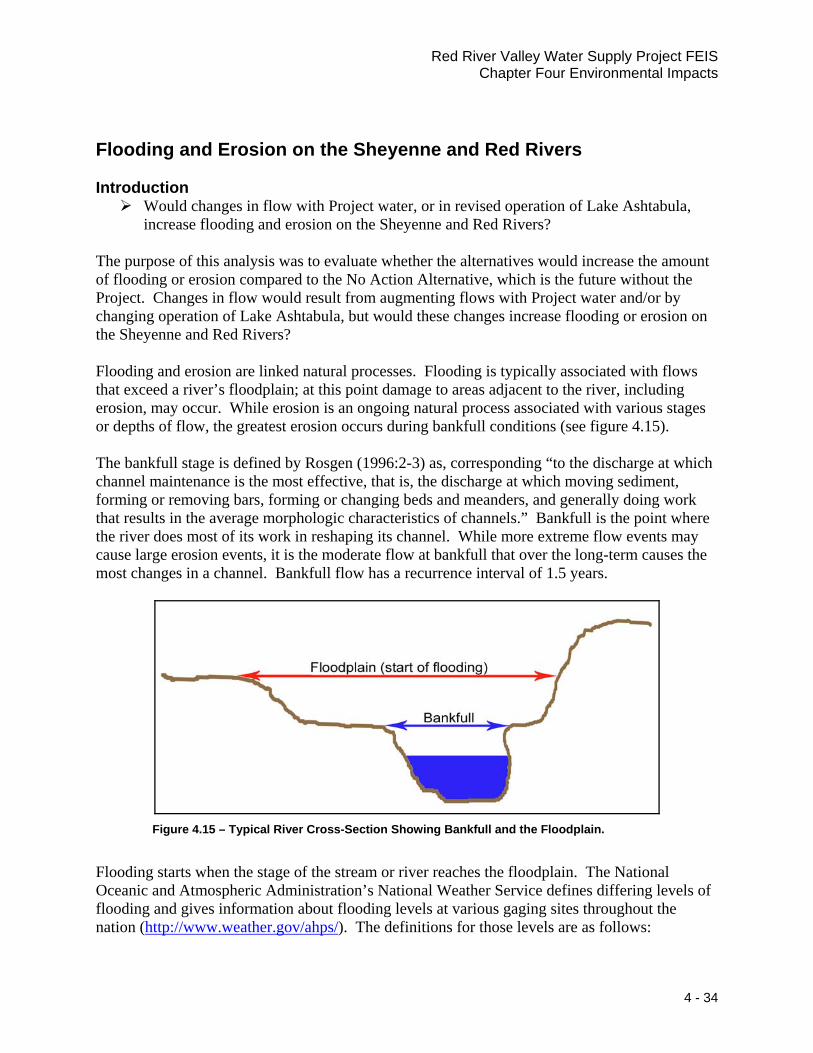
Red River Valley Water Supply Project FEIS Chapter Four Environmental Impacts
Flooding and Erosion on the Sheyenne and Red Rivers
Introduction Would changes in flow with Project water, or in revised operation of Lake Ashtabula,
increase flooding and erosion on the Sheyenne and Red Rivers?
The purpose of this analysis was to evaluate whether the alternatives would increase the amount of flooding or erosion compared to the No Action Alternative, which is the future without the Project. Changes in flow would result from augmenting flows with Project water and/or by changing operation of Lake Ashtabula, but would these changes increase flooding or erosion on the Sheyenne and Red Rivers?
Flooding and erosion are linked natural processes. Flooding is typically associated with flows that exceed a river’s floodplain; at this point damage to areas adjacent to the river, including erosion, may occur. While erosion is an ongoing natural process associated with various stages or depths of flow, the greatest erosion occurs during bankfull conditions (see figure 4.15).
The bankfull stage is defined by Rosgen (1996:2-3) as, corresponding “to the discharge at which channel maintenance is the most effective, that is, the discharge at which moving sediment, forming or removing bars, forming or changing beds and meanders, and generally doing work that results in the average morphologic characteristics of channels.” Bankfull is the point where the river does most of its work in reshaping its channel. While more extreme flow events may cause large erosion events, it is the moderate flow at bankfull that over the long-term causes the most changes in a channel. Bankfull flow has a recurrence interval of 1.5 years.
Figure 4.15 – Typical River Cross-Section Showing Bankfull and the Floodplain.
Flooding starts when the stage of the stream or river reaches the floodplain. The National Oceanic and Atmospheric Administration’s National Weather Service defines differing levels of flooding and gives information about flooding levels at various gaging sites throughout the nation (http://www.weather.gov/ahps/). The definitions for those levels are as follows:
4 - 34

Red River Valley Water Supply Project FEIS Chapter Four Environmental Impacts
• Minor Flooding (Flood Stage) - minimal or no property damage, but possibly some public threat or inconvenience.
• Moderate Flooding - some inundation of structures and roads near streams. Some evacuation of people and/or transfer of property to higher elevations are necessary.
• Major Flooding - extensive inundation of structures and roads. Considerable evacuation of people and/or transfer of property to higher elevations.
Table 4.16 lists the depth and flow in cfs of flood stages at gages on the Sheyenne and Red Rivers. The water depths and flows progressively increase downstream on both rivers under current conditions.
Table 4.16 - Flood Stage Elevations and Flow in cfs at Gages on the Sheyenne and Red Rivers. Gage Location Estimated
Bankfull cfs
Flood Stage
depth (ft) cfs
Moderate Flood Stage
depth (ft) cfs
Major Flood Stage
depth (ft) cfs Kindred, Sheyenne River 1,000 16 2,360 20 4,450 22 ?Fargo, Red River 2,400 18 3,890 25 8,100 30 11,100Emerson, Red River 15,800 421 36,0001 471 58,0001 521 100,0001
1 The data are from the nearby Pembina Gage, because data were unavailable for the Emerson Gage.
Methods To begin the bankfull flow analysis, a representative point on the Sheyenne River and two representative points on the Red River were chosen for comparison purposes. The site on the Sheyenne River, USGS gage 05059000 near Kindred, North Dakota, was chosen for two reasons: 1) it is downstream from the location where Project water would be added to the system, and 2) flows at this site already have been influenced by operational changes at Baldhill Dam.
The sites on the Red River include the USGS gage 05054000 at Fargo, North Dakota, and the USGS gage 0505125000 near Emerson, Manitoba. These sites were chosen because the Fargo Gage is on the Red River upstream from the confluence with the Sheyenne River where the highest system demands are, and the Emerson Gage is on the Red River just across the international border with Canada.
Flood information for the two gaging sites used for bankfull analysis was gathered from the National Weather Service (table 4.16). Flood data for the USGS gaging site near Emerson, Manitoba, were not readily available. Therefore data from a nearby site, Pembina, North Dakota, were used instead.
Sheyenne River Historic daily flow records were analyzed and used to create a hydrograph for the period February 1, 1950, through December 31, 2001. This is a different period of record than was used for other analyses that relied upon monthly, rather than daily data. There were 18,962 daily records used in the daily flow analysis. The trend from this hydrograph was compared to the modeled flows for each alternative.
4 - 35

Red River Valley Water Supply Project FEIS Chapter Four Environmental Impacts
Post-processing was completed by plotting hydrographs of historic flows and superimposing the hydrograph trend over the simulated monthly flows from the StateMod hydrologic model for each of the alternatives. Each historic daily value was assigned a percentage of flow for its corresponding month and year. This percentage was then applied directly to monthly values from simulation of its corresponding year.
For example, figure 4.16 shows the hydrograph created for August 1975 and hydrographs of the proposed alternatives when the same trend was applied to their respective modeling results. The purpose of this approach was to simulate historic pulses in flow caused by snowmelt and rainstorm events that were not directly modeled in monthly StateMod data. Using historic data, current bankfull flow was calculated so current bankfull conditions (existing conditions), the No Action Alternative, and the action alternatives could be compared.
0
50
100
150
200
250
300
350
8/2/19
75
8/3/19
75
8/4/19
75
8/5/19
75
8/6/19
75
8/7/19
75
8/8/19
75
8/9/19
75
8/10/1
975
8/11/1
975
8/12/1
975
8/13/1
975
8/14/1
975
8/15/1
975
8/16/1
975
8/17/1
975
8/18/1
975
8/19/1
975
8/20/1
975
8/21/1
975
8/22/1
975
8/23/1
975
8/24/1
975
8/25/1
975
8/26/1
975
8/27/1
975
8/28/1
975
8/29/1
975
8/30/1
975
8/31/1
975
Day
Flow
(cfs
)
Historic Flows
GDU Import to SheyenneRiver
No Action and ActionAlternatives
Figure 4.16 – An Example of How the Historic Hydrograph Was Used to Extract Daily Flow Data From Modeled Data for USGS Gage 5059000 on the Sheyenne River Near Kindred, North Dakota.
Red River The capacity of the Red River is greater than the Sheyenne River (table 4.16); therefore, the effects of the Project by percentage of flow are much less. A similar analysis of the daily flows at the two gages was done to estimate the bankfull condition for each site.
4 - 36

Red River Valley Water Supply Project FEIS Chapter Four Environmental Impacts
Results Impacts to Sheyenne River Geomorphology Analysis of historic data showed the current bankfull flow at the Kindred Gage to be 997 cfs. This calculated bankfull flow is supported by previous studies for the Devils Lake Outlet EIS that determined the estimated bankfull flow at this location to be between 920 and 1,400 cfs (West Consultants, Inc. 2001).
With the current bankfull flow approximating 1,000 cfs, it is important to know how often flows reach this volume with or without the alternatives. A range from 900 to 1,100 cfs (+/-10% of calculated bankfull flow) was used, because flow velocity increases as bankfull is approached and slightly exceeded. Flow velocity is a major factor in erosion. Flows above 110% of bankfull would have less of an effect on erosion, because flow velocity is reduced when water spills out onto the floodplain. Of the 18,962 daily flows analyzed, there were 233 days where flows ranged from 900 to 1,100 cfs (table 4.17).
Flows greater than 900 cfs were also reviewed. These occurred 1,152 days out of 18,962 (table 4.17). Further review of calculated daily data shows that the occurrence of bankfull increases slightly for each of the alternatives (table 4.18). Generally, increases of 10 additional bankfull flow days in one season may alter the natural scouring affects of a stream. The maximum increase of additional days near bankfull with the Project is 5 nonconsecutive days out of 18,962 days. This occurs in the North Dakota In-Basin Alternative (table 4.17).
Table 4.17 – Recurrence Intervals of Bankfull Conditions Near Kindred on the Sheyenne River (18,962 days analyzed).
AlternativeNumber of Days at
Bankfull +/- 10% (900cfs to 1100cfs)
Number of Days above Bankfull (all flows > 900
cfs)Historic Record 233 1,152
Additional Additional No Action 241 days 1,132 daysNorth Dakota In-Basin 246 5 1,145 13Red River Basin 243 2 1,148 16GDU Import to Sheyenne River 241 0 1,130 -2GDU Import Pipeline 241 0 1,136 4Missouri River Import to RRV 241 0 1,136 4
Review of all flows above 900 cfs or 90% of bankfull flow shows a maximum increase of 16 nonconsecutive days in the Red River Basin Alternative, when compared to No Action (table 4.17). However, the total number of days that would have flow above 900 cfs for each alternative is fewer than the historic record.
For the next part of the analysis, a new recurrence interval analysis was calculated for each of the alternatives to determine if the bankfull volume could be altered over time as a result of these new flows. Results showed that, with the exception of the No Action Alternative, all of the bankfull flow volumes would be reduced when the alternatives were modeled over a period of 18,962 days (table 4.18).
4 - 37

Red River Valley Water Supply Project FEIS Chapter Four Environmental Impacts
The new lower bankfull flows for each of the action alternatives in table 4.18 can be explained by the change of operational parameters of Baldhill Dam. For each of the alternatives to function properly, operation of the reservoir, which often acts as a pass-through system, has been changed to catch the peak flows to store for later use. This has a stabilizing effect on the reservoir and its outflow, which in turn has a long-term effect on Sheyenne River flow by flattening its hydrograph and reducing the calculated bankfull flows.
These new bankfull flows could create a terrace within the confines of the main channel and below the existing floodplain. However, this is unlikely, because the reduction in bankfull flow between the current condition and any of the alternatives is less than 12%, which is considered a relatively small difference. A decrease in bankfull flow would not increase erosion of river banks along the Sheyenne River.
Although this analysis focuses on a single representative point on the Sheyenne River, the river crosses different geologic formations between Lake Ashtabula and the confluence with the Red River (West Consultants, Inc. 2001). The physical properties of these formations influence the erosion rate in each reach, so some reaches erode faster than others during bankfull flow conditions. Bankfull flow, which typically has a recurrence interval of 1.5 years, is the dominate factor in erosion. No change to bankfull flow means that there would be no change from existing erosion rates, unless the physical prism of the river is altered.
Calculated Alternative Bankfull
Flow (cfs)Current Condition 997
No Action 1030North Dakota In-Basin 890Red River Basin 890GDU Import to Sheyenne River 908GDU Import Pipeline 886Missouri River Import to RRV 886
Table 4.18 – New Bankfull Flows Near Kindred on the Sheyenne River for All Alternatives (18,962 days analyzed).
No Action Alternative The calculated bankfull flow would increase slightly under the No Action Alternative, when compared to current conditions. However, it is likely that this slight change, less than 3.5% increase, would not change erosion along the Sheyenne River near Kindred, North Dakota.
North Dakota In-Basin Alternative This alternative shows a decrease in calculated bankfull flow, when compared to the No Action Alternative; erosion would be unaffected along the Sheyenne River at Kindred, North Dakota.
Red River Basin Alternative This alternative shows a decrease in calculated bankfull flow, when compared to the No Action Alternative, and would not affect erosion along the Sheyenne River at Kindred, North Dakota.
GDU Import to Sheyenne River Alternative This alternative shows a decrease in the calculated bankfull flow, when compared to the No Action Alternative; it would not effect erosion along the Sheyenne River at Kindred, North Dakota.
4 - 38

Red River Valley Water Supply Project FEIS Chapter Four Environmental Impacts
GDU Import Pipeline Alternative This alternative shows a decrease in the calculated bankfull flow, when compared to the No Action Alternative, and would not affect erosion along the Sheyenne River at Kindred, North Dakota.
Missouri River Import to Red River Valley Alternative This alternative shows a decrease in the calculated bankfull flow, when compared to the No Action Alternative, and would not affect erosion along the Sheyenne River at Kindred, North Dakota.
Impacts to Red River Geomorphology Historic daily peak flow data were gathered from the USGS. These data were reviewed, and a recurrence interval analysis was performed. With a recurrence interval of 1.5 years, the bankfull at Fargo was estimated to be 2,400 cfs, and the bankfull at Emerson was estimated to be 15,800 cfs. The maximum possible peak-day demand flows from the entire service area would be 324 cfs, which is 13.5% and 2% of the bankfull conditions, respectively, at Fargo and Emerson. The maximum peak-day Project demand for the entire service area is 324 cfs, as shown in table 2.11.1 of the Final Needs and Options Report (Reclamation 2005a).
Unless natural flows would fall below 324 cfs, Project water would not be needed to supplement flows. If Project water is needed downstream on the Red River, higher flows would be released down the Sheyenne River. Since analysis shows negligible effects on the Sheyenne River during the highest of Project flows, there would be even fewer effects on the Red River because of its larger prism and substantially greater bankfull condition.
No Action Alternative There would be no change in erosion on the Red River from the No Action Alternative, as compared to current conditions.
North Dakota In-Basin Alternative This alternative shows no change in erosion, when compared to the No Action Alternative.
Red River Basin Alternative This alternative shows no change in erosion, when compared to the No Action Alternative.
GDU Import to Sheyenne River Alternative This alternative shows no change in erosion, when compared to the No Action Alternative.
GDU Import Pipeline Alternative This alternative shows no change in erosion, when compared to the No Action Alternative.
Missouri River Import to Red River Valley Alternative This alternative shows no change in erosion, when compared to the No Action Alternative.
Impacts of Flooding on Sheyenne and Red Rivers By comparison, the bankfull capacity of the Sheyenne River at Kindred is about 1,000 cfs, and flood stage corresponds to a flow of about 2,400 cfs. Thus, if the entire demand was met with releases from Baldhill Dam, the Project flow would be only 32% of bankfull capacity and 14% of the flow indicative of minor flooding. Any flows in the Sheyenne River above 324 cfs would occur naturally and be unaffected by Project operations.
4 - 39

Red River Valley Water Supply Project FEIS Chapter Four Environmental Impacts
By comparison, the bankfull capacities of the Red River at Fargo and Emerson are about 2,400 cfs and 15,800 cfs. Flood stages correspond to flows of about 3,890 cfs and 36,000 cfs, respectively. Assuming that the maximum 324 cfs project flows were to enter the system at Fargo without any users withdrawing water, this would be 8% of the flow at which minor flooding begins. At Emerson, this is reduced to less than 1%. Any flows in the Red River above 324 cfs would occur naturally and be unaffected by Project operations. At Emerson, Manitoba, the river channel is large enough that the volume added by Project flows would be difficult to measure.
No Action Alternative This alternative shows no change in natural flooding on the Red River, when compared to the current conditions.
North Dakota In-Basin Alternative This alternative shows no change in flooding, when compared to the No Action Alternative.
Red River Basin Alternative This alternative shows no change in flooding, when compared to the No Action Alternative.
GDU Import to Sheyenne River Alternative This alternative shows no change in flooding, when compared to the No Action Alternative.
GDU Import Pipeline Alternative This alternative shows no change in flooding, when compared to the No Action Alternative.
Missouri River Import to Red River Valley Alternative This alternative shows no change in flooding, when compared to the No Action Alternative.
Cumulative Effects The Devils Lake Outlet was the only other project identified that could cumulatively affect flows in the Sheyenne River. The cumulative effect of the Project with Devils Lake Outlet releases would be minor. The Project alternatives would deliver water almost directly to Lake Ashtabula, with only 8 miles of upper Sheyenne River shared by both projects. Project releases from Baldhill Dam would not depend on the volume or the source of the water in storage. The magnitude of Project releases from the reservoir would remain the same; regardless of which project fills the reservoir. This means that there would be no combined effect of this Project with the Devils Lake Outlet below Baldhill Dam.
Summary Operational flows of the Sheyenne River from any of the Project alternatives would not increase the potential for erosion. These alternatives could stabilize erosion, as the recurrence of flows above bankfull would be reduced from flows in the historic period analyzed (1950-2001).
Analysis of erosion on both the Sheyenne and Red Rivers showed that the Project alternatives would reduce the number of days at or above bankfull. Since, flooding begins considerably above bankfull, additional days of flooding would be indicated by an increase in the number of days at or above bankfull. Therefore, the Project would not increase flooding.
4 - 40

Red River Valley Water Supply Project FEIS Chapter Four Environmental Impacts
Environmental Mitigation No environmental commitments have been identified to offset or mitigate effects, because none of the action alternatives would have an adverse effect on flooding.
4 - 41

Red River Valley Water Supply Project FEIS Chapter Four Environmental Impacts
Missouri River System Water Quantity
Introduction What would the effect of the proposed Project be on the Missouri River System?
Missouri River System – This term generally describes the Missouri River from the headwaters in Montana to its confluence with the Mississippi River. The system includes six mainstem dams, but the area most affected would be at Garrison Dam (Lake Sakakawea) and Oahe Dam (Lake Oahe), located in North and South Dakota.
Three of the alternatives considered in the FEIS would withdraw water from the Missouri River system. These withdrawals could impact resources on the Missouri River system, including basin storage, flood control, and water supply. These water quantity resources impacts are discussed in this section. All other Missouri River uses and resources impacted by alternatives are discussed in the other resource sections in this chapter. For instance, navigation and hydropower impacts are addressed in the “social and economics issues” section.
Project water depletions from the Missouri River would affect the amount of water in the Missouri River system. To address this issue, a study was initiated with the Northwestern Division of the Corps to analyze impacts from a proposed transfer of water from the Missouri River to the Project service area. This study, the Red River Valley Water Supply Project Effects of Alternatives Depleting Water from the Missouri River on Missouri River Uses and Resources (Corps 2005b), assessed the effects of Project depletions on Missouri River uses and resources for the DEIS. Due to changes in the alternatives in the SDEIS and an increase in the Missouri River basin depletions to account for additional population and industrial growth in the basin, the Corps updated its analysis of Missouri River resources in Red River Valley Water Supply Project Analysis of Missouri River Effects (Corps 2006).
Subsequent to the SDEIS modeling, the Corps conducted an analysis for the Western Area Power Administration for which it added another element to Missouri River simulations - sedimentation. In response to this new information Reclamation and North Dakota requested that future sediment accumulation in the Mainstem Reservoir System reservoirs be incorporated into the Corps modeling for this Project. Several additional analyses using various modeling techniques were also updated in the FEIS to address special concerns by interests in the Missouri River Basin. The results are in Corps (2007) Red River Valley Water Supply Project Analysis of Missouri River Effects. This report is attached as a supporting document to the FEIS.
The Master Water Control Manual (Corps 2004a) guides the Corps’ operation of the Missouri River system. This water control plan consists of water control criteria for management of the Missouri River system. It covers the full spectrum of anticipated runoff conditions expected to occur including an extended drought. Serving all Missouri River system purposes during an extended drought like that of the 1930s was part of the original objective of the system. In fact, this Missouri River system is the largest reservoir system in the United States and was designed to use water stored in the upper three reservoirs during extended drought to meet a diminished level of service to all congressionally authorized project purposes, except flood control. The
4 - 42

Red River Valley Water Supply Project FEIS Chapter Four Environmental Impacts
total gross storage capacity of the upper three reservoirs is about 65.6 MAF (million ac-ft), with all six reservoirs having a storage capacity of 73.3 MAF.
Methods The Corps (2005b) study evaluated a range of Project depletions at two withdrawal locations on the Missouri River system, Lake Sakakawea and Lake Oahe. Modeling assumed an existing Missouri River Basin annual average depletion of 22.1 MAF under the “current” or existing condition and an additional 155,300 ac-ft under the No Action Alternative. The 155,300 ac-ft depletion accounted for new water project water withdrawals through 2050 from the Missouri River in the DEIS.
Daily Routing Model – This term generally describes the hydrologic model developed and used by the Corps to simulate future hydrologic, hydropower, and navigation data for the Missouri River. As with previous modeling studies, the Daily Routing Model output data were used in the economic and environmental impacts models developed for the previous Corps Missouri River Master Water Control and Update Study (Master Manual Study) and now for the EIS for the Red River Valley Water Supply Project.
The modeling conducted by the Corps (2005b) analysis relied on models developed for the Master Manual FEIS (Missouri River Basin Mainstem Reservoir System Master Water Control Manual Review and Update, Final Environmental Impact Statement) completed by the Corps (2004a). The Corps’ models included the Daily Routing Model (hydrologic, hydropower, and navigation outputs) and the many economic use and environmental resource models developed for the Master Manual EIS. The Corps’ models were used as the best available information and were a proven technique in their analysis for the Master Manual EIS.
The modeling techniques used in the Corps reports (2005b, 2006, and 2007) were developed to measure the effects of the Project’s proposed Missouri River Import alternatives and not to forecast the future. Models have limitations. Many factors that could influence future economic and environmental performance were not modeled and could not be modeled. However, the information was useful for comparing alternatives. Furthermore, the Corps’ modeling of the full period of record assumed diversion of the full amount of water to the Red River Valley in all years of the modeling period. In reality, a smaller amount of this water would be diverted during non-drought periods in the Red River Valley. The Corps (2005b) report further describes these models.
During the DEIS comment period, two substantive questions were raised that were not completely answered by the Corps (2005b) study. These were: 1) what would the impacts be if the depletion factored population and industrial growth into the forecast for the No Action Alternative; and 2) what would the impacts be of Project depletions during a 1930s-type drought? Some comments suggested the 155,300 ac-ft depletion calculated by Reclamation and used by the Corps’ DEIS analysis was too small and did not consider other future depletions, such as increases in water system demands due to increased population and new industries.
As explained in Appendix C, Reclamation re-evaluated the No Action depletions and projected Missouri River Basin annual water demand for public water systems and future industries through 2050. The forecasted growth through 2050 would use an additional 402,200 ac-ft. This
4 - 43

Red River Valley Water Supply Project FEIS Chapter Four Environmental Impacts
demand was added to the 155,300 ac-ft that accounted for future water projects in the Missouri River Basin, for a grand total depletion of 557,500 ac-ft for the No Action Alternative. Table 4.19 - Future Missouri River Depletions for Water Supply and Irrigation Projects in Planning Documents.
River Reach Municipal Supply
(ac-ft/yr) Irrigation (ac-ft/yr)
Total (ac-ft/yr)
Above Ft. Peck 11,000 81,000 92,000 Ft. Peck to Garrison 5,000 26,000 31,000 Garrison to Oahe 5,000 0 5,000 Oahe to Big Bend 4,000 0 4,000 Big Bend to Ft. Randall 0 1,000 1,000 Ft. Randall to Gavins Point 7,000 0 7,000 Gavins Point to Sioux City 2,000 0 2,000 Sioux City to Omaha 1,000 0 1,000 Omaha to Nebraska City 0 0 0 Nebraska City to St. Joseph 300 0 300 St. Joseph to Kansas City 12,000 0 12,000 Kansas City to Boonville 0 0 0
Total 47,300 108,000 155,300
Tables 4.19 - 4.21 list demands by Missouri River reach, as well as the grand total used by the Corps for its second modeling effort for the Project. The assumptions used in estimating these demands and methods are discussed in detail in Appendix C. This study, the Red River Valley Water Supply Project Analysis of Missouri River Effects (Corps 2006),
addressed the two substantive questions raised in comments on the DEIS. The report evaluated the effects of the proposed Project depletions on Missouri River resources using the revised No Action depletion forecast and focused on impacts during a 1930s-type drought. Table 4.22 shows the proposed withdrawals by the three Missouri River Impact alternatives – GDU Import to Sheyenne River, GDU Import Pipeline, and Missouri River Import to Red River Valley Alternatives.
Table 4.20 - Combined Missouri River Basin Public Water Systemand Industrial Demand Projections - 2000 to 2050.
River Reach Water System and Industrial Annual Demand Projections (ac-ft)
Above Ft. Peck 26,600 Ft. Peck to Garrison 0 Garrison to Oahe -2,600 Oahe to Big Bend 5,000 Big Bend to Ft. Randall 5,000 Ft. Randall to Gavins Point 5,000 Gavins Point to Sioux City 5,000 Sioux City to Omaha 42,300 Omaha to Nebraska City 172,500 Nebraska City to St. Joseph 0 St. Joseph to Kansas City 74,600 Kansas City to Boonville 34,400 Boonville to Hermann 34,400 Total 402,200
The Corps (2006) analysis followed the same basic process used in the initial analysis (Corps 2005b) in that the Corps’ Daily Routing Model was used to develop hydrologic, hydropower, and navigation data for use in economic and environmental impacts models. Several additional analyses using various modeling techniques were also completed to address special concerns by interests in the Missouri River Basin identified by the Corps. The period of record analysis, which is based on the full historic record, was the same as the first study (1930 - 2002); however, major emphasis was placed on analyzing the effects of the water withdrawals during a drought like that of the 1930s (1930-1941).
4 - 44

Red River Valley Water Supply Project FEIS Chapter Four Environmental Impacts
Table 4.21 - Total Annual Depletions Forecasted to 2050.
Depletions Type Annual Depletions Forecasted for Missouri River Basin (ac-ft)
Known water supply and irrigation projects with planning documents. 155,300 Projected water system and industrial demands through 2050 402,200 Total 557,500
Table 4.22 – 1930s Average Monthly Depletions From the Missouri River for Import Alternatives.
Alternative GDU Import to
Sheyenne River (ac-ft) GDU
Import Pipeline (ac-ft) Missouri River Import to Red River Valley (ac-ft)
Jan 7,113 4,421 5,082 Feb 5,578 4,001 4,778 Mar 6,514 4,410 3,213 Apr 5,069 4,914 1,817 May 5,370 5,166 3,738 Jun 6,891 5,292 5,744 Jul 7,468 5,712 7,130 Aug 7,490 5,607 7,382 Sep 7,248 5,240 6,689 Oct 7,319 4,788 4,988 Nov 7,035 5,019 5,702 Dec 7,145 5,208 6,363 Total 80,239 59,777 62,622
Subsequent to completing its analysis for the SDEIS, the Corps completed a study for the Western Area Power Administration in February 2007. This study analyzed the effects of forecasted depletions and sedimentation on the Missouri River mainstem reservoir system, particularly related to hydropower production. This study used Reclamation depletion data (Reclamation 2005b). The difference between this study and the Corps’ (2006) analysis for the Project was that this study accounted for future sedimentation. Sedimentation rates for the Corps’ Master Manual EIS and the Project DEIS and SDEIS modeling analyses were held constant.
As sediments accumulate in each reservoir, the amount of storage available at a given surface elevation diminishes. Depending on the rates of sediment deposition and increased depletions, the reservoir levels could be higher or lower during the modeling period. Generally, as sedimentation increases, the water surface elevations in the reservoirs increase relative to declines in the Missouri River mainstem reservoir system storage. For the FEIS, the Corps (2007) evaluated the Project during a drought with the new sedimentation data.
Results
Water Storage Effects Figure 4.17 shows the change in overall Missouri River Basin storage during a 1930s-type drought on the Missouri River (1930 – 1941) plus a two-year recovery period at the end of the drought. The figure compares existing conditions, No Action, and the three Missouri River import alternatives. The No Action and three import alternatives are similar in figure 4.17, because the change in depletions differ no more than 80,000 ac-ft per year. The difference between current conditions and the FEIS alternatives is noticeable because of the 557,500 ac-ft
4 - 45

Red River Valley Water Supply Project FEIS Chapter Four Environmental Impacts
per year, which is the cumulative amount that depletions would be expected to increase through 2050 without the Project.
20
25
30
35
40
45
50
55
60
65Ja
n-30
Jan-
31
Jan-
32
Jan-
33
Jan-
34
Jan-
35
Jan-
36
Jan-
37
Jan-
38
Jan-
39
Jan-
40
Jan-
41
Jan-
42
Jan-
43
Jan-
44
Sys
tem
Sto
rage
(MAF)
Current No Action GDUIP MRRRIP GDUISR
Figure 4.17 – Missouri River Basin Storage Comparison (1930-1944) (taken from Corps 2007: figure 2).
Figures 4.17 – 4.21 Corps Acronyms:Current – Model runs using current (2002) Missouri River depletions No Action – No Action Alternative GDUIP – GDU Import Pipeline Alternative MRRRIP – Missouri River Import to Red River Valley Alternative GDUISR –GDU Import to Sheyenne River Alternative
Figure 4.18 shows the net change in the overall Missouri River Basin storage during a 1930s-type drought for the three Missouri River import alternatives, when compared to storage values for No Action. During the worst year of a 1930s-type drought, storage in the Missouri River system mainstem reservoirs would be approximately 30 MAF. The volume of Missouri River water that would be withdrawn by the preferred alternative would average about 80,000 ac-ft per year, which is 0.27% of the storage of the upper Missouri River system mainstem reservoirs.
The total change in storage varied from about 400,000 ac-ft for the GDU Import Pipeline Alternative to just over 500,000 ac-ft for the GDU Import to Sheyenne River Alternative. By the end of 1941 the former alternative would use about 60,000 ac-ft per year and the latter would use about 80,000 ac-ft per year. The cumulative effects on the reservoir storage are less for all the alternatives than the accumulated depletions, which would range from 720,000 ac-ft to 1 million ac-ft over 12 years. This is because navigation seasons were shortened during some years in the 1930s, which made up for the difference between depletions and storage changes from No Action.
4 - 46

Red River Valley Water Supply Project FEIS Chapter Four Environmental Impacts
-0.6
-0.5
-0.4
-0.3
-0.2
-0.1
0
Jan-3
0
Jan-3
1
Jan-3
2
Jan-3
3
Jan-3
4
Jan-3
5
Jan-3
6
Jan-3
7
Jan-3
8
Jan-3
9
Jan-4
0
Jan-4
1
Syst
em S
tora
ge C
hang
e (M
AF)
GDUIP MRRRIP GDUISR
Figure 4.18 – Missouri River Basin Storage Comparison Between Import Alternatives (1930-1944) (taken from Corps 2007: figure 3).
To put this volume of water in perspective, the future 557,500 ac-ft total annual depletion for No Action plus 80,239 ac-ft per year for the largest of the Missouri River import alternatives is only about 3.8% of the 16.9 MAF of average yearly inflow into Lake Sakakawea from 1967 - 2004. The largest of the Missouri River import alternatives is the preferred alternative, and 80,239 ac-ft is its annual depletion.
Since 1898, annual inflows into the Missouri River mainstem reservoir system have averaged 25.2 MAF, ranging from a low of 10.7 MAF (in 1931) to 49.0 MAF (in 1997). This means the proposed action depletions would be 0.31% of average annual inflows. Looking at the 80,000 ac-ft annual depletion in another way, the combined storage capacity of all six reservoirs is 73.4 MAF. The annual depletion by the proposed action is only 0.11% of total system storage. The combined storage capacity of all six reservoirs is 73.4 MAF, which is about three times the annual runoff. This high storage-to-runoff ratio lends an unusual degree of flexibility to the operation of the multipurpose reservoir system. If the amount of storage in the system used for exclusive flood control is excluded, the storage is 68.7 MAF, which gives the Corps substantial flexibility to operate the system.
4 - 47

Red River Valley Water Supply Project FEIS Chapter Four Environmental Impacts
The cumulative depletion of 637,739 ac-ft per year is about 3.5% of the average annual storage in Lake Sakakawea, which is about 18.2 MAF for 1967-2004. The cumulative depletion includes the preferred alternative plus No Action. Furthermore, considering that the upper reservoirs were designed to store extra water needed to meet all of the system’s congressionally authorized project purposes during low water years, then the 637,739 ac-ft per year is about 1.7% of the “carryover multiple use” storage, or 0.97% of the “gross storage” in these reservoirs (figure 4.19).
Figure 4.19 – Mainstem Project Storage (from the Reservoir Control Center, Northwestern Division, Corps of Engineers).
Flood Control Effects
160.0
161.0
162.0
163.0
164.0
165.0
166.0
167.0
168.0
Current No Action GDUIP MRRRIP GDUISR
$ m
illio
ns
Figure 4.20. – Average Annual Total Flood Control Benefits, 1930s-Type Drought (taken from Corps 2007: figure 4).
Effects on Missouri River system reservoir flood control is one of the impacts the Corps (2007) evaluated in the Missouri River effects study. As would be expected, removing small amounts
of water, as compared to overall storage in the system, would have minor impacts on flood control (figure 4.20). Modeling results estimate that there would be a difference of $0.19 million during the 1930s-type drought years and $3.0 million for the period of record between current conditions and No Action, which is equivalent
to a percentage change of 0% and -1%, respectively.
The differences between No Action and the Missouri River import alternatives for 1930s-type drought are all $0.01 million, which is essentially equivalent to a 0% change. The differences
4 - 48

Red River Valley Water Supply Project FEIS Chapter Four Environmental Impacts
between No Action and the Missouri River import alternatives for the full period of analysis from 1930 to 2002 are a little greater in magnitude and mixed, from -$0.23 million to +$0.62 million. These dollar values also represent a percentage change of essentially 0%. Figure 4.20 shows that all of the alternatives would have minor positive changes in flood control benefits, when compared to the current conditions.
Water Supply Effects Existing water users, who depend on the Missouri River system for their water supply, are concerned about the availability of water when other withdrawals are proposed, as would be the case with this Project. Economic benefits accrue to the use of water for thermal power plants, agriculture, public and private drinking water, and other industrial uses of water not served by public systems. In addition, most Missouri River thermal power generating facilities rely on adequate water for cooling.
400420440460480500520540560580
Current No Action GDUIP MRRRIP GDUISR
$ m
illio
ns
Figure 4.21– Average Annual Water Supply Benefits, 1930s-Type Drought (taken from Corps 2007 figure 19).
The Corps’ Missouri River effects study (2007) estimated the average annual water supply benefits to the Missouri River Basin and effects during a 1930s-type drought (1930-1941) (figure 4.21). The Missouri River mainstem system was designed to use stored water during extended drought periods to meet a diminished level of service for all congressionally authorized project purposes, except flood control. However, typically costs increase during an extended drought when the reservoir levels drop and river
flows fall. Costs are associated with ensuring that water intakes function, including intake extensions, or power plant modifications on the lower river to meet discharge requirements for waste heat.
Under current conditions 22.1 MAF of water is withdrawn annually from the Missouri River system, which the Corps estimates has a benefit in the Missouri River Basin ranging from $565.3 million during a 1930s-type drought to $613.0 million for the period of record. The benefits during drought are lower under current conditions, because there is less water in the system to provide a beneficial use. The No Action Alternative would increase the withdrawal of water in 2050 by 557,500 ac-ft annually, which would result in an annual decrease of water supply benefits ranging from $8.3 million during a 1930s-type drought to $1.5 million for the period of record (Corps 2007). Figure 4.21 shows the decrease in benefits from current conditions to No Action. The analysis shows little change from No Action to the three import alternatives.
While this analysis addresses water supply benefits, the Corps (2007) also conducted a special analysis to identify the municipal intakes at greatest risk of losing access to water, and if there
4 - 49

Red River Valley Water Supply Project FEIS Chapter Four Environmental Impacts
would be a difference among the alternatives if this access were lost on Lake Oahe or Lake Sakakawea. The issue of dropping reservoir levels and potential intake access issues was identified during the comment period on the DEIS and SDEIS. The Corps’ analysis found that only one intake would lose access, and this access was already compromised under current conditions, as well as all of the 2050 Missouri River import alternatives. The intake is for Parshall, North Dakota, in Lake Sakakawea. This intake would have to be extended to function fully at water levels as low as 1,797 feet msl. Because this impact would occur under current conditions, there would be no additional impact from the Project. Additional discussion of intakes is in chapter three, “Missouri River system water quantity” section, “existing conditions” subsection.
The Corps water supply benefits analysis only considered benefits in the Missouri Basin system. Water supply benefits of the Project alternatives in the Red River Valley are discussed in the “social and economic issues” section in chapter four.
No Action For the full period of record, which includes intervals with more plentiful water, there is a minor change in water supply benefits, when No Action is compared to current conditions (0%). However, during a 1930s-type drought, modeling shows a 1% decrease in water supply benefits for No Action, as compared to current conditions.
North Dakota In-Basin This alternative would not use Missouri River water, so the Missouri River system would not be affected.
Red River Basin This alternative would not use Missouri River water, so the Missouri River system would not be affected.
GDU Import to Sheyenne River There is no difference in annual water supply benefits, in comparison with No Action during a 1930s-type drought and the period of record (table C.19, Appendix C). Therefore, no water supply effects would occur.
GDU Import Pipeline There is no difference in annual water supply benefits, in comparison with No Action during a 1930s-type drought and the period of record (table C.19, Appendix C). Therefore, no water supply effects would occur.
Missouri River Import to Red River Valley There is no difference in annual water supply benefits, in comparison with No Action during a 1930s-type drought and the period of record (table C.19, Appendix C). Therefore, no water supply effects would occur.
Cumulative Effects Appendix C incorporates reasonably foreseeable depletions in a cumulative effects analysis of water depletions from the Missouri River system. The Project would have relatively no cumulative effects on Missouri River water supply or flood control. The project would not affect water supply and flood control in the Missouri River system, because the proposed depletion, which would range from 60,000 ac-ft to 80,000 ac-ft annually, is small (0.3% - 0.4%) compared to the current annual depletion from the system of 22.1 MAF.
4 - 50

Red River Valley Water Supply Project FEIS Chapter Four Environmental Impacts
Summary
Water Storage Effects The difference between current conditions and the FEIS Missouri River import alternatives is noticeable. This is because without the Project 557,500 ac-ft per year would be depleted by water users. This is the cumulative increase of depletions that would be expected to occur through 2050 under the No Action Alternative. The three import alternatives are similar (GDU Import to Sheyenne River, GDU Import Pipeline, and Missouri River Import to Red River Valley), because the change in depletions from No Action differs no more than 80,000 ac-ft per year (figure 4.17).
During a 1930s-type drought, the cumulative effect on reservoir storage is less for any of the three import alternatives than the accumulated depletions, which would range from 720,000 ac-ft to 1,000,000 ac-ft over 12 years. This is because under the Missouri River Basin Mainstem Reservoir System Master Water Control Manual navigation seasons would be shortened during some years in a 1930s-type drought. This makes up for the difference between depletions and the storage change from No Action.
To clarify reservoir-related impacts, the maximum approximated 500,000 ac-ft difference from the No Action Alternative equates to a stage difference of around 1 foot in the upper three reservoirs on March 1, when mainstem reservoir system storage is balanced among these reservoirs during a drought.
Flood Control Effects No Action and the three import alternatives would have relatively minor negative changes (-1%) in flood control benefits, when compared to current conditions during the period of record (1930-2002). Changes in flood control benefits between No Action and the three Missouri River import alternatives are essentially 0% during a 1930s-type drought (1930-1941).
Water Supply Benefits Under the No Action Alternative depletions would increase from the Missouri River system by 557,500 ac-ft annually, which would result in an annual decrease of water supply benefits ranging from $8.3 million during a 1930s-type drought to $1.5 million for the period of record (Corps 2007). There is a minor difference in water supply benefits between No Action and the three import alternatives (GDU Import to Sheyenne River, GDU Pipeline Alternative, and Missouri River Import to Red River Valley), as shown in figure 4.21, for the 1930s-type drought period. There is essentially no difference between No Action and each of the import alternatives for the full 73-year period of record (1930-2002).
Of the water intakes on Lake Sakakawea and Lake Oahe, only one intake would lose its access with the import alternatives, but this access would be lost under current conditions. The North Dakota In-Basin and Red River Basin Alternatives would not use Missouri River water, so these alternatives would not affect Missouri River resources.
Environmental Mitigation No environmental commitments have been identified to offset or mitigate effects, because none of the action alternatives would adversely affect Missouri River resources.
4 - 51

Red River Valley Water Supply Project FEIS Chapter Four Environmental Impacts
Surface Water Quality
Introduction How would the alternatives affect surface water quality of the Sheyenne, Red, and
Missouri Rivers, and the GDU Principal Supply Works?
Given the relatively small scale of the Project, as compared to the immense size and complexity of the Red River Basin, modeling surface water quality was challenging. Because of the complex questions regarding how the Project would affect water quality, several independent efforts have been undertaken to assimilate existing water quality information into new water quality modeling studies. The ultimate goal was to evaluate impacts to water quality from the proposed alternatives. The best available information about the existing condition of water quality was summarized in chapter three. In this chapter the results of several studies designed to improve our understanding of how the Project could affect water quality are presented.
Methods The underlying purpose behind surface water quality studies and modeling was to have a relative basis for comparing the effects on surface water quality between the No Action and action alternatives. Reclamation and North Dakota did not intend for these comparative analyses to produce precise temporal and spatial values for exact concentrations of the specific substances being simulated (analytes). Modeling was also not intended to set appropriate water quality standards in the Red River Basin through Total Maximum Daily Loads or other numeric criteria, as this remains a state responsibility.
While the goal of the Project is to provide a bulk water supply to the Red River Valley service area, substantive comments on water quality led Reclamation and North Dakota to describe existing water quality and evaluate if there is a relationship between water quality and flow. Along with this came a need to initiate water quality modeling to compare proposed Project alternatives. Since the Corps already had developed a functional water quality model, HEC5-Q, to evaluate the Devils Lake Outlet, Reclamation and North Dakota decided to adopt this existing model and modify it as necessary for the DEIS studies. Cooperating Agency Team meetings and Technical Team meetings served as forums for gathering input from interested parties about the original steady-flow water quality model. These discussions are noted in FEIS chapter five and in the Needs and Options Report (Reclamation 2005a).
Nustad and Bales’s (2005) steady-flow water quality model did not reveal substantive water quality concerns with any of the eight alternatives in the DEIS. However, DEIS comments suggested that a steady-flow model was inadequate and that an unsteady-flow model would be needed to adequately understand the potential effect of each alternative on water quality. To this end, focused workshops were held to discuss the scope of the water quality modeling effort. Workshops, conference calls, and attendees are shown in table 4.23. During the workshop key analytes were selected for analysis (TDS, sulfate, chloride, sodium, and total phosphorus), and it was decided that USGS should use EPA’s WASP modeling software for unsteady-flow modeling of the proposed alternatives. These analytes cover a range and are indicative of water quality.
4 - 52

Red River Valley Water Supply Project FEIS Chapter Four Environmental Impacts
Table 4.23 - Water Quality Meetings: Workshops, Conference Calls, and Participants.
Meeting Attendees Date Location
Water Quality Modeling Workshop
Reclamation, USGS, Garrison Diversion, North Dakota Department of Health November 17, 2005 Bismarck,
North Dakota Water Quality Modeling Workshop
Reclamation, USGS, Garrison Diversion, North Dakota Department of Health December 7, 2005 Bismarck,
North Dakota
Water Quality Modeling Workshop
Reclamation, Grand Forks, Fargo, Environment Canada, Lake Agassiz Water Authority, USGS, EPA, Garrison Diversion, Minnesota Pollution Control Agency, Minnesota Department of Health, MNDNR, North Dakota Department of Health, North Dakota State Water Commission
January 31 and
February 1, 2006
Moorhead, Minnesota
Water Quality Modeling Conference Call Reclamation, USGS, Garrison Diversion, EPA March 9, 2006 Conference
Call Water Quality Modeling Conference Call Reclamation, USGS, Garrison Diversion, EPA May 31, 2006 Conference
Call Water Quality Modeling Conference Call Reclamation, USGS, Garrison Diversion, EPA August 22, 2006 Conference
Call Water Quality Modeling Conference Call Reclamation, USGS, Garrison Diversion, EPA August 29, 2006 Conference
Call Water Quality Modeling Conference Call Reclamation, USGS, Garrison Diversion, EPA September 5, 2006 Conference
Call Water Quality Modeling Conference Call Reclamation, USGS, Garrison Diversion September 7, 2006 Conference
Call Water Quality Modeling Conference Call Reclamation, USGS, Garrison Diversion, EPA September 12, 2006 Conference
Call
The three workshops primarily set the scope and determined the general methods for setting up the unsteady-flow water quality model to evaluate the alternatives in the SDEIS. Subsequent conference calls dealt with gathering data, formatting data, setting boundary conditions, and resolving technical issues.
The numerous reports on water quality are included on the FEIS CD as supporting documents, but knowing the chronology of these reports is important to understanding the context of the alternatives when these were evaluated. The following sections briefly discuss the utility of the water quality reports prepared for the Project.
Efforts to Document Existing Surface Water Quality in the Red River Basin Many of the previous water quality studies on the Sheyenne and Red River watersheds were simply descriptive efforts using existing data or were written with a narrowly defined purpose and scope. For this reason, the USGS in cooperation with Reclamation compiled existing data to describe what is known about Sheyenne and Red River water quality. This compilation was included in Water Quality of Streams in the Red River of the North Basin, Minnesota, North Dakota, and South Dakota, 1970-2001 (Tornes 2005) and complements Statistical Summaries of Water-Quality Data for Selected Streamflow-Gaging Stations in the Red River of the North Basin, North Dakota, Minnesota, and South Dakota (Macek-Rowland and Dressler 2002). These reports were further supported in Existing Water Quality Conditions, Impact Assessment Methods and Environmental Consequences (Houston Engineering, Inc. 2005). A query-enabled database of existing water quality information was compiled by Houston Engineering. The purpose of the database was to retrieve data for specific locations from a single database that
4 - 53

Red River Valley Water Supply Project FEIS Chapter Four Environmental Impacts
incorporated and assimilated datasets from multiple sources to use in modeling. Both reports describe the different surface waters in the affected environment. These two reports are the most comprehensive overview of existing conditions.
Efforts to identify relationships between flow and water quality were also undertaken by the USGS in cooperation with Reclamation. The first report is Regression Equations for Estimating Concentrations of Selected Water-Quality Constituents for Selected Gaging Stations in the Red River of the North Basin, North Dakota, Minnesota, and South Dakota (Williams-Sether 2004). This work clearly shows the relationship between streamflow and analyte concentrations is not simply linear.
A subsequent report is Continuous Water-Quality Monitoring and Regression Analysis to Estimate Constituent Concentrations and Loads in the Red River of the North, Fargo, North Dakota, 2003-05 (Ryberg 2006b). It took into account streamflow, other water quality indicators, and other analytes that could be combined to determine a better predictive equation for a single analytes’ concentration. While this method is a more robust technique for predicting concentrations of selected analytes, it is limited to natural conditions. The equations do not accommodate the effects of different alternatives.
Efforts to Document Surface Water Quality of the Missouri River, Audubon Lake, and Chain of Lakes in North Dakota Houston Engineering, Inc. (2005) briefly reviewed the existing conditions and effects of the alternatives on the Missouri River. No substantial degradation of the water quality from Missouri River import alternatives to either the Missouri River from losses or to Audubon Lake and the Chain of Lakes from pass-through flow was revealed.
A report titled Cluster Analysis of Water-Quality Data for Lake Sakakawea, Audubon Lake, and McClusky Canal, Central North Dakota, 1990-2003, by Ryberg (2006a) used hierarchical cluster analysis to group samples and sampling sites by similar water quality. This work documents how water quality changes along the existing pathway of water from Lake Sakakawea, through Audubon Lake, Chain of Lakes, and ultimately the McClusky Canal.
Efforts to Evaluate Water Quality Effects of the Alternatives In general, a well accepted technique to evaluate effects of a project on surface water is by numerical modeling of the system. Models are the best available tools for comparative analysis but have a level of uncertainty when attempting to forecast actual values. The following discussions of the efforts to model the water quality of the alternatives are independent from each other, and as such, their results would expectedly vary according to the variables used in each the model. However, these models all compare the alternatives. The original reports, which are appended as supporting documents, describe detailed information on model input and results.
Steady-Flow Water Quality Models for DEIS Houston Engineering, Inc. (2005) discusses the first modeling study, which evaluated the relative effects of the different alternatives on water quality in Lake Ashtabula using boundary conditions that did not vary with time. This Corps model, BATHTUB, compared the alternatives for a lengthy period of time. In the model input
4 - 54

Red River Valley Water Supply Project FEIS Chapter Four Environmental Impacts
from individual tributaries, Project additions to surface water and water quality are held constant and allowed to reach equilibrium for a single concentration of an analyte at a specific location. The use of this model for evaluating water quality effects to Lake Ashtabula by the alternatives proposed in the DEIS did not reveal any significant change in the eutrophication status of Lake Ashtabula.
At the same time, the Corps’ HEC-5Q water quality model was modified by incorporating Reclamation’s surface water hydrology modeling output for the Sheyenne and Red Rivers from the Final Needs and Options Report (Reclamation 2005a). The results pertinent to alternatives evaluated in the FEIS are discussed later in this chapter. However, for an in-depth discussion of the results see Houston Engineering, Inc. (2005) along with Simulation of Conservative-Constituent Transport in the Red River of the North Basin, North Dakota and Minnesota, 2003-04, by Nustad and Bales (2005).
Unsteady-Flow Water Quality Model for the SDEIS In response to questions and comments on the DEIS, Reclamation contracted with USGS to simulate the SDEIS alternatives using an unsteady-flow model for water quality. Lacking sufficient data for the numerous boundary conditions and inputs to the model prevents accurate determination of precise temporal and spatial distribution of water quality. Instead, the utility of this unsteady-flow model for water quality comes from its inherent ability to allow tributary flows, water quality, and Project additions to surface water to change over time. This approach simulates a dynamic river system with respect to flows and water quality and provides insight into the relative differences between the alternatives. The results for this type of model are reported using the median value and other descriptive statistics (Appendix F.1) over the period of time that the model simulates.
At the water quality workshop in Moorhead, Minnesota, USGS, North Dakota, and Reclamation originally proposed to use WASP, an EPA modeling software package, as the platform for modeling water quality with unsteady flow. However, WASP had to be replaced by the EPA’s software package EDP-RIV1H and EPD-RIV1Q because of technical problems associated with getting WASP to perform necessary surface water withdrawals and additions. This change in modeling software was done after modification of the WASP software by the EPA, but it became apparent that further modification of the software would require more time than was available. The choice to use EPD-RIV1H and EPD-RIV1Q was made as a result of discussions between the EPA’s water quality software developers and members of the water quality modeling team. The choice to change models was documented and water quality workshop attendees received status updates via email.
Median Value: A statistical result where one half of the reported results are greater than the median value, and one half of the results are less than this value. It is considered the statistic least affected by extreme values.
After completing the unsteady-flow water quality modeling, results were compiled and presented in Simulation of Constituent Transport in the Red River of the North Basin During Unsteady-Flow Conditions, 1977 and 2003-04 by Nustad and Bales (2006). This work used the alternatives as formulated in the SDEIS and FEIS and is presented below in the results discussion.
4 - 55

Red River Valley Water Supply Project FEIS Chapter Four Environmental Impacts
To identify impacts to the quality of water at major water user intakes, the locations for reporting the simulated results for the unsteady-flow model are slightly different than those of the steady-flow model, figure 4.22.
Figure 4.22 – Site Locations Discussed in Water Quality Modeling Results.
Assumptions The assessment of consequences to water quality required making several assumptions. These assumptions include:
• Existing water quality described by descriptive statistics would adequately characterize the near-term future absent a Project, but long-term conditions would be best represented by modeling efforts that take into account future demands on the water sources (No Action Alternative).
• Water quality in the McClusky Canal would become similar to Audubon Lake water quality with Project operation.
• The water quality concentrations, which were determined using different analytical methods for the same parameter, can be combined without loss of information or biasing data interpretation.
• The potential effects of individual return flows can be physically represented in aggregate at select locations along a river or stream.
• Potential impacts at key locations can be described by characterizing conditions at the point of diversion.
4 - 56

Red River Valley Water Supply Project FEIS Chapter Four Environmental Impacts
Results Water quality under the action alternatives is compared to water quality under the No Action Alternative as a means to compare the effects of the alternatives. The median concentrations for the alternative simulations under unsteady low-flow conditions are also compared to applicable water quality numeric standards, objectives, or guidelines. An assessment is made relative to the change in median concentrations for a given water quality parameter and not to existing conditions because existing conditions do not represent extended periods of low streamflow. A detrimental change between the No Action and an action alternative of 15% or more in the median simulated concentrations may reach the North Dakota definition of significant effect, as defined in North Dakota Administrative Code 33-16-02.1, Appendix IV.
There are three types of standards used to establish a regulatory limit that support a designated beneficial use. These are: 1) numeric, 2) narrative, and 3) antidegradation. A numeric standard is the allowable concentration of a specific pollutant in a water body. It represents a “safe” concentration for a particular contaminant intended to protect the designated beneficial uses of a Class I, IA, II, or III stream. The applicable numeric standards and objectives for North Dakota, Minnesota, and the IJC are in table 4.24.
Table 4.24 - Applicable Water Quality Numeric Standards and Objectives. North Dakota Minnesota International Joint
Commission Objective Analyte Sheyenne Red River Red River Emerson, Manitoba
TDS Na Na 500 a,c 500 d
Sulfate 450 a 250 a 250 a,c 250 d
Chloride 250 a 100 a 100 a,c 100 d
Sodium 60 b 50 b 60 b,c na
Total Phosphorus 0.1e 0.1e na na na - Not Applicable. a - Numeric standard measured in milligrams per liter. b - Numeric standard expressed as a percentage of total cations as measured in milliequivalents per liter. c - The Red River has several classifications and applicable numeric standard. This is the most stringent applicable standard to the Red River under Minnesota Rule. d - These IJC objectives are not regulatory but are agreed-upon objectives. e - This is an interim guideline for a numeric standard in milligrams per liter.
Narrative standards describe the desired aesthetic and general pollution-free goals for waters of the State. Narrative standards are capable of being assessed by various measures of trophic condition (e.g., amount of chlorophyll-a or clarity of the water). These form the basis for assessing the effects of the alternatives for reservoirs, like Lake Ashtabula. The antidegradation standard pertains to waters that currently have water quality better than the applicable numeric standards. The antidegradation standard generally requires that these water bodies be maintained at the existing quality, and not degrade to the level of applicable numeric standards. The North Dakota Antidegradation Policy governs federally permitted actions under sections 401, 402, and 404 of the Clean Water Act, Appendix IV of North Dakota Century Code 33-16-02.
4 - 57

Red River Valley Water Supply Project FEIS Chapter Four Environmental Impacts
Steady-Flow Water Quality Modeling Sheyenne River Above Lake Ashtabula None of the alternatives have project features any considerable distance upstream from Lake Ashtabula. Therefore, no adverse or beneficial impacts are anticipated.
Lake Ashtabula None of the action alternatives would be expected to alter the current trophic state of Lake Ashtabula compared to the No Action alternative. Computer modeling (i.e., steady-state using the Corps of Engineer’s BATHTUB model) suggests that a small increase in total nitrogen concentration could occur during dry years if the North Dakota In-Basin Alternative were constructed, presumably because of the return of water from the Red River at Grand Forks to Lake Ashtabula via a pipeline. The total phosphorus concentration would decrease slightly under the GDU Import to Sheyenne River Alternative and remain relatively unchanged for the remaining alternatives in Lake Ashtabula, as compared to the No Action Alternative.
The model predicted essentially no change in the chlorophyll-a concentration (an indicator of algal biomass) or Secchi disk visibility (an indicator of water clarity) from the small changes in nutrient concentrations for alternatives that deliver water to Lake Ashtabula. The remaining alternatives showed no nutrient change in Lake Ashtabula compared to the No Action Alternative. Because nutrient concentrations in Lake Ashtabula showed little change, no change in the number of numeric standard exceedances or the beneficial uses of the lake would be expected for the Action Alternatives (Houston Engineering, Inc. 2005).
Below Lake Ashtabula Water-quality model simulations were done for both September 2003 and reduced flow hydrologic conditions similar to those expected during operational conditions. The results were similar for the two flow conditions. Therefore, only results for the September 2003 simulations are presented.
Simulated TDS, sulfate, and chloride concentrations in the Sheyenne River below Lake Ashtabula are shown in figures 4.23 – 4.25. The simulated values for TDS for all the alternatives exceeded the SDWS (Secondary Drinking Water Standard) of 500 mg/L at Lisbon, Kindred, and Horace. The No Action Alternative concentrations for TDS at Lisbon, Kindred, and Horace were 59%, 32%, and 30% greater than the SDWS. The results for
Sheyenne River Above Lake Ashtabula
Sheyenne River Below Lake Ashtabula
4 - 58

Red River Valley Water Supply Project FEIS Chapter Four Environmental Impacts
North Dakota In-Basin and GDU Import to Sheyenne River, the two alternatives that deliver water to the Sheyenne River, showed a decrease in TDS in the lower Sheyenne River relative to No Action of 24% and 16%, respectively, at Lisbon (figure 4.23). Results farther downstream at Kindred and Horace showed to a lesser degree similar effects. None of the action alternatives had a greater simulated concentration for TDS than the No Action Alternative at any of the three sites.
Only the North Dakota In-Basin and Missouri River Import to Red River Valley Alternatives exhibited simulated sulfate concentrations below the SDWS of 250 mg/L at all three sites (figure 4.24). At the Lisbon site, simulated sulfate for the No Action Alternative was 307.2 mg/L, or 23% greater than the SDWS. Only the North Dakota In-Basin Alternative differed from the No Action Alternative by more than -15%. The lowering of the sulfate is viewed as beneficial rather than adverse. The greatest influence on sulfate in the simulated alternatives is that sulfate concentrations within the Missouri River system and Audubon Lake tend to be higher than within the upper portion of the Sheyenne River. Therefore, the GDU Import to Sheyenne River Alternative is the only alternative at Horace which still exceeds the SDWS (and was 14% greater than the No Action Alternative). All alternatives exceeded the SDWS for TDS at each of the three locations (figure 4.23).
0.0
100.0
200.0
300.0
400.0
500.0
600.0
700.0
800.0
900.0
Sim
ulat
ed T
DS
(mg/
l)
No Action 794.4 658.3 652.4ND In-Basin 602.1 561.6 574.0Red River Basin 794.4 658.3 647.9GDU Import to Sheyenne River 669.4 646.2 648.7GDU Import Pipeline 794.4 658.3 643.7Missouri River Import to Red RiverValley
581.6 555.0 554.1
Lisbon Kindred Horace
Secondary Drinking Water Standard (500 mg/L)
Figure 4.23 – Simulated TDS Concentrations for Steady Flow on the Sheyenne River.
Simulated chloride for the No Action Alternative was highest at Lisbon at 40.4 mg/L and decreased to 29.5 mg/L at Horace (figure 4.25). None of the other alternatives showed concentrations that exceeded those for No Action Alternative, although several were consistently less than the No Action Alternative at the respective gages. None of the action alternatives concentrations exceeded the concentration for the No Action Alternative by more than 15%.
4 - 59

Red River Valley Water Supply Project FEIS Chapter Four Environmental Impacts
0.0
50.0
100.0
150.0
200.0
250.0
300.0
350.0
400.0
450.0
500.0
Sim
ulat
ed S
ulfa
te (m
g/l)
No Action 307.2 227.0 221.7ND In-Basin 207.0 179.5 180.7Red River Basin 307.2 227.0 220.6GDU Import to Sheyenne River 269.7 252.0 251.9GDU Import Pipeline 307.2 227.0 219.6Missouri River Import to Red RiverValley
226.9 201.5 199.3
Lisbon Kindred Horace
Secondary Drinking Water Standard (250 mg/L)
North Dakota Class IA Numeric Standard (450 mg/L)
Figure 4.24 - Simulated Sulfate Concentrations for Steady Flow on the Sheyenne River.
0.0
50.0
100.0
150.0
200.0
250.0
Sim
ulat
ed C
hlor
ide
(mg/
l)
No Action 40.4 29.7 29.5ND In-Basin 27.2 23.4 24.0Red River Basin 40.4 29.7 29.3GDU Import to Sheyenne River 22.7 21.7 21.8GDU Import Pipeline 40.4 29.7 29.1Missouri River Import to Red RiverValley
22.1 20.3 20.3
Lisbon Kindred Horace
Secondary Drinking Water Standard (250 mg/L)
Figure 4.25 – Simulated Chloride Concentrations for Steady Flow on the Sheyenne River.
4 - 60
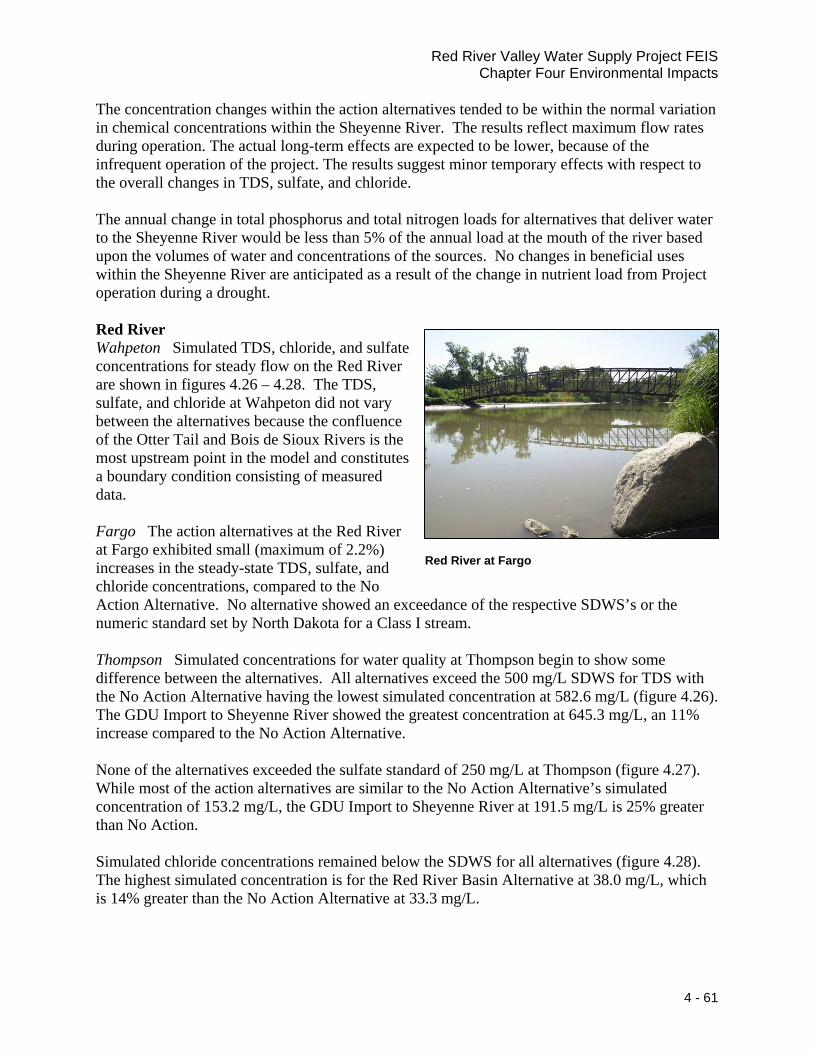
Red River Valley Water Supply Project FEIS Chapter Four Environmental Impacts
The concentration changes within the action alternatives tended to be within the normal variation in chemical concentrations within the Sheyenne River. The results reflect maximum flow rates during operation. The actual long-term effects are expected to be lower, because of the infrequent operation of the project. The results suggest minor temporary effects with respect to the overall changes in TDS, sulfate, and chloride.
The annual change in total phosphorus and total nitrogen loads for alternatives that deliver water to the Sheyenne River would be less than 5% of the annual load at the mouth of the river based upon the volumes of water and concentrations of the sources. No changes in beneficial uses within the Sheyenne River are anticipated as a result of the change in nutrient load from Project operation during a drought.
Red River Wahpeton Simulated TDS, chloride, and sulfate concentrations for steady flow on the Red River are shown in figures 4.26 – 4.28. The TDS, sulfate, and chloride at Wahpeton did not vary between the alternatives because the confluence of the Otter Tail and Bois de Sioux Rivers is the most upstream point in the model and constitutes a boundary condition consisting of measured data.
Red River at Fargo
Fargo The action alternatives at the Red River at Fargo exhibited small (maximum of 2.2%) increases in the steady-state TDS, sulfate, and chloride concentrations, compared to the No Action Alternative. No alternative showed an exceedance of the respective SDWS’s or the numeric standard set by North Dakota for a Class I stream.
Thompson Simulated concentrations for water quality at Thompson begin to show some difference between the alternatives. All alternatives exceed the 500 mg/L SDWS for TDS with the No Action Alternative having the lowest simulated concentration at 582.6 mg/L (figure 4.26). The GDU Import to Sheyenne River showed the greatest concentration at 645.3 mg/L, an 11% increase compared to the No Action Alternative.
None of the alternatives exceeded the sulfate standard of 250 mg/L at Thompson (figure 4.27). While most of the action alternatives are similar to the No Action Alternative’s simulated concentration of 153.2 mg/L, the GDU Import to Sheyenne River at 191.5 mg/L is 25% greater than No Action.
Simulated chloride concentrations remained below the SDWS for all alternatives (figure 4.28). The highest simulated concentration is for the Red River Basin Alternative at 38.0 mg/L, which is 14% greater than the No Action Alternative at 33.3 mg/L.
4 - 61

Red River Valley Water Supply Project FEIS Chapter Four Environmental Impacts
0.0
100.0
200.0
300.0
400.0
500.0
600.0
700.0
800.0
900.0
Sim
ulat
ed T
DS
(mg/
l)
No Action 267.1 371.5 582.6 511.3 698.9ND In-Basin 267.1 375.6 635.0 558.3 778.8Red River Basin 267.1 375.6 627.2 550.9 718.9GDU Import to Sheyenne River 267.1 375.6 645.3 586.5 733.5GDU Import Pipeline 267.1 363.4 586.1 522.9 645.9Missouri River Import to Red RiverValley
267.1 375.6 598.1 535.7 688.1
Wahpeton Fargo Thompson Grand Forks Emerson
IJC Objective at Emerson (500 mg/L)
Secondary Drinking Water Standard (500 mg/L)
0.0
50.0
100.0
150.0
200.0
250.0
300.0
350.0
400.0
450.0
500.0
Sim
ulat
ed S
ulfa
te (m
g/l)
Secondary Drinking Water Standard and North Dakota Numeric Standard for Class I Stream (250 mg/L) IJC Objective at Emerson (250 mg/L)
No Action 31.4 51.2 153.2 127.8 170.3ND In-Basin 31.4 51.8 149.5 126.5 177.4Red River Basin 31.4 51.8 152.5 128.5 165.5GDU Import to Sheyenne River 31.4 51.8 191.5 167.8 200.5GDU Import Pipeline 31.4 50.1 156.1 133.9 159.8Missouri River Import to Red RiverValley
31.4 51.8 152.8 131.7 165.3
Wahpeton Fargo Thompson Grand Forks Emerson
Figure 4.26 – Simulated TDS for Steady Flow on the Red River.
Figure 4.27 – Simulated Sulfate Concentrations for Steady Flow on the Red River.
4 - 62

Red River Valley Water Supply Project FEIS Chapter Four Environmental Impacts
0.0
50.0
100.0
150.0
200.0
250.0
Sim
ulat
ed C
hlor
ide
(mg/
l)
No Action 10.6 32.0 33.3 27.8 102.4ND In-Basin 10.6 32.4 37.7 31.4 111.3Red River Basin 10.6 32.4 38.0 32.0 99.9GDU Import to Sheyenne River 10.6 32.4 33.5 29.6 85.5GDU Import 10.6 31.3 34.9 30.0 85.4Missouri River Import to Red RiverValley
10.6 32.4 35.9 30.9 92.1
Wahpeton Fargo Thompson Grand Forks Emerson
Secondary Drinking Water Standard (250 mg/L)
IJC Objective at Emerson (100 mg/L)
Figure 4.28 – Simulated Chloride Concentrations for Steady Flow on the Red River.
Grand Forks Water quality improved at Grand Forks compared to Thompson, although TDS remained above the SDWS (figure 4.26). The concentrations of sulfate and chloride are below applicable standards. The No Action Alternative exhibited the lowest estimated TDS concentration (511.3 mg/L) and the GDU Import to Sheyenne River Alternative. The greatest (586.5 mg/L), nearly 15% greater than the No Action Alternative. Chloride remained below the SDWS for all alternatives, with the No Action Alternative having the lowest concentration (27.8 mg/L) and the Red River Basin Alternative the greatest (32.0 mg/L), a 15% increase above the No Action alternative (figure 4.28). The concentration of sulfate varied little between the action alternatives and the No Action Alternative (figure 4.27). The exception is the GDU Import to Sheyenne River Alternative, which had a concentration of 167.8 mg/L, a 31% increase greater than the No Action Alternative.
Emerson The modeled TDS at Emerson increased compared to Grand Forks and exceeded the IJC Objective of 500 mg/L (figure 4.26) even for the No Action Alternative (698.9 mg/L). The North Dakota In-Basin Alternative showed the largest concentration at 778.8 mg/L, an 11% increase compared to the No Action Alternative. The GDU Import Pipeline Alternative showed the lowest concentration (645.9 mg/L), a decrease of 8% compared to the No Action Alternative.
Simulated sulfate concentrations at Emerson were below the IJC Objective of 250 mg/L for all the alternatives (figure 4.27). The GDU Import to Sheyenne River exhibited the largest concentration at 200.5 mg/L, 18% greater than the No Action Alternative. The Missouri River Import to Red River Valley Alternative at 165.3 mg/L showed the lowest simulated concentration.
4 - 63

Red River Valley Water Supply Project FEIS Chapter Four Environmental Impacts
Chloride at Emerson showed a considerable increase for all of the alternatives when compared to Grand Forks, likely due to tributaries downstream from Grand Forks (e.g., Turtle, Forest, and Park Rivers), which contribute groundwater with high TDS (figure 4.26). Both the No Action Alternative and the North Dakota In-Basin Alternative exceeded the 100 mg/L IJC Objective. The GDU Import Pipeline alternative showed a concentration of 85.4 mg/L, which was lowest at 17% less than the No Action Alternative.
Unsteady-Flow Water Quality Modeling Sheyenne River Above Lake Ashtabula None of the alternatives have Project features any considerable distance upstream from Lake Ashtabula. Therefore, no adverse or beneficial impacts are anticipated.
Lake Ashtabula The steady-state modeling using the Corps model remains the best available information on the effects of the alternatives on Lake Ashtabula with respect to the different alternatives. This analysis shows no deterioration or improvement of this aquatic resource. Therefore, Lake Ashtabula is excluded from the unsteady modeling analysis.
Below Lake Ashtabula The most upstream location on the Sheyenne River used to assess impacts is the gage immediately below Baldhill Dam, which creates Lake Ashtabula. One method to describe the affect of the alternatives on water quality is to characterize the change in median concentrations between the No Action and the action alternatives, and among the action alternatives. The median concentrations for all of the alternatives exceeded the secondary drinking water standard of 500 mg/L for TDS at the Below Baldhill Dam Gage. Only the North Dakota In-Basin Alternative median concentration exceeded the median concentration for the No Action Alternative by an estimated 28% (figure 4.29). Changes in the simulated median concentrations between the gage just below Baldhill Dam and the West Fargo Gage are primarily due to natural processes, including contributions from groundwater and surface water runoff. While the median concentration of TDS was above the secondary drinking water standard for all alternatives, only the North Dakota In-Basin Alternative exceeds both the SDWS and the 15% antidegradation standard of North Dakota (figure 4.29).
None of the alternatives had median simulated concentrations for sulfate that exceeded the Secondary Drinking Water Standard of 250 mg/L. The No Action Alternative median concentration at 153 mg/L is lower than the standard below Baldhill Dam (figure 4.30). The GDU Import to Sheyenne River Alternative showed the greatest median concentration at 204 mg/L. The GDU Import to Sheyenne River Alternative median concentration is 33% greater than the No Action Alternative.
The modeling results suggest a decrease in sulfate under the North Dakota In-Basin Alternative, when compared to No Action, even though TDS increases (figure 4.30). One possible explanation for this is due to increased bicarbonate concentrations. While bicarbonate was not incorporated into the model for simulations, the TDS results are somewhat consistent with the earlier water quality modeling done under steady-flow conditions.
The water quality, as expressed by the median sulfate concentration at both reported gages, is expected to be similar for some of the action alternatives and the No Action alternative, with the
4 - 64

Red River Valley Water Supply Project FEIS Chapter Four Environmental Impacts
exceptions being the North Dakota In-Basin and the GDU Import to the Sheyenne River Alternatives. The North Dakota In-Basin and the GDU Import to the Sheyenne River Alternatives, show generally lower and greater concentrations, respectively, than the other alternatives.
Simulated results for chloride in figure 4.31 and sodium in figure 4.32 show little difference among the No Action and action alternatives with the exception of the GDU Import to Sheyenne River Alternative. The GDU Import to the Sheyenne River had an almost 28% increase in sodium when compared to the No Action Alternative at the Below Baldhill Dam Gage. However, chloride remained far below the 250 mg/L secondary drinking water standard and the numeric standard for a Class IA stream in North Dakota for all alternatives and sodium does not have a numeric standard for concentration. The standard for sodium on the Sheyenne River is that of a Class IA stream where sodium should be less than 60% of the total cations in solution.
0
100
200
300
400
500
600
700
Sim
ulat
ed T
DS
(mg/
L)
No Action 508 577North Dakota In-Basin 648 633Red River Basin 508 571GDU Import to Sheyenne River 544 566GDU Import Pipeline 508 573Missouri River Import to Red RiverValley
508 570
Below Baldhill Dam West Fargo
Secondary Drinking Water Standard (500 mg/L)
Figure 4.29 – Simulated TDS Concentrations for Unsteady Flow on the Sheyenne River.
The GDU Import to the Sheyenne River Alternative exhibits nearly a 42% decrease in the median total phosphorus concentrations compared to the No Action Alternative at the Below Baldhill Dam Gage, while the North Dakota In-Basin Alternative showed a 43% increase (figure 4.33). The remaining alternatives showed median total phosphorus concentrations similar to the No Action Alternative (~ 0.230 mg/L). All alternatives had median concentrations of total phosphorus above North Dakota’s interim guideline for a Class IA stream.
4 - 65

Red River Valley Water Supply Project FEIS Chapter Four Environmental Impacts
0
50
100
150
200
250
300
350
400
450
Sim
ulat
ed S
ulfa
te (m
g/L)
No Action 153 195North Dakota In-Basin 96 178Red River Basin 153 195GDU Import to Sheyenne River 204 211GDU Import Pipeline 153 199Missouri River Import to Red RiverValley
153 197
Baldhill Dam West Fargo
Secondary DrinkingWater Standard (250 mg/L)
North Dakota Class IA Numeric Standard (450 mg/L)
Figure 4.30 – Simulated Sulfate Concentrations for Unsteady Flow on the Sheyenne River.
0
50
100
150
200
250
Sim
ulat
ed C
hlor
ide
(mg/
L)
No Action 15 33North Dakota In-Basin 16 35Red River Basin 15 34GDU Import to Sheyenne River 15 22GDU Import Pipeline 15 34Missouri River Import to Red RiverValley
15 34
Baldhill Dam West Fargo
Secondary Drinking Water Standard (250 mg/L)
North Dakota Numeric Standard for a Class IA Stream (175 mg/L)
Figure 4.31 – Simulated Chloride Concentrations for Unsteady Flow on the Sheyenne River.
4 - 66

Red River Valley Water Supply Project FEIS Chapter Four Environmental Impacts
0
10
20
30
40
50
60
70
80
90
100
Sim
ulat
ed S
odiu
m (m
g/L)
No Action 67 69North Dakota In-Basin 71 68Red River Basin 67 67GDU Import to Sheyenne River 86 83GDU Import Pipeline 67 68Missouri River Import to Red RiverValley
67 67
Baldhill Dam West Fargo
Figure 4.32 – Simulated Sodium Concentrations for Unsteady Flow on the Sheyenne River.
0.000
0.500
1.000
1.500
2.000
2.500
3.000
Sim
ulat
ed T
otal
Pho
spho
rus
(mg/
L)
No Action 0.230 0.077North Dakota In-Basin 0.330 0.087Red River Basin 0.230 0.071GDU Import to Sheyenne River 0.134 0.077GDU Import Pipeline 0.230 0.067Missouri River Import to Red RiverValley
0.230 0.069
Baldhill Dam West Fargo
North Dakota Interim Guideline for Numeric Standard of a Class IA Stream (0.1 mg/L)
Figure 4.33 – Simulated Total Phosphorus Concentrations for Unsteady Flow on the Sheyenne River.
4 - 67

Red River Valley Water Supply Project FEIS Chapter Four Environmental Impacts
Red River Below Wahpeton Simulated results for the median TDS of the Red River below Wahpeton were clearly better (lower) under the No Action Alternative at 357 mg/L, which is considerably less than any of the action alternatives. All of the action alternatives are similar with respect to median TDS concentrations, having simulated results between 603 mg/L and 670 mg/L, or 69% to 88% greater than the No Action Alternative (figure 4.34).
0
100
200
300
400
500
600
700Si
mul
ated
TD
S (m
g/L)
No Action 357 406 369 477North Dakota In-Basin 670 621 360 458Red River Basin 670 622 369 462GDU Import to Sheyenne River 693 654 450 530GDU Import Pipeline 618 587 432 516Missouri River Import to Red RiverValley
603 572 419 485
Wahpeton Fargo Grand Forks Emerson, Manitoba
IJC Objective at Emerson (500 mg/L)
Secondary Drinking Water Standard and Minnesota Numeric Standard forthe Red River (500 mg/L)
Figure 4.34 – Median TDS Concentrations for Unsteady Flow on the Red River.
The reason for this result lies in the assumptions and input for the model. Under the No Action Alternative, it was assumed that junior water appropriators, such as an agricultural processing facility in the Wahpeton area, would be short about 75% of their annual water demand due to insufficient surface water. Some of the water in the Red River at Wahpeton would pass by the junior permit holder in order to serve more senior water permits downstream. Insufficient water for a large agricultural processing plant corresponds to a 75% decrease in return flows. Agricultural processing facilities typically have return flows with greatly increased TDS. This assumption is crucial to understanding the modeling results at Wahpeton and its lingering effects farther downstream. The action alternatives that would supply water to future industries in Wahpeton have dramatically different results than No Action. This is because of existing industrial return flows and the ability to serve a junior water appropriator in Wahpeton if downstream needs were met with a different water source.
No alternative had simulated median sulfate concentrations at Wahpeton that exceeded any standard, objective, or guideline (figure 4.35). The median concentrations for the action
4 - 68

Red River Valley Water Supply Project FEIS Chapter Four Environmental Impacts
alternatives ranged from 105 mg/L to 174 mg/L, or 59% to 164% greater than the No Action Alternative (66 mg/L).
The median of simulated chloride concentration for the No Action Alternative at 12 mg/L is considerably less than all other alternatives and the applicable standards (figure 4.36). The action alternative median concentrations ranged from 62 mg/L to 115 mg/L, or 417% to 858% greater than the No Action alternative. Only the GDU Import Pipeline Alternative at 115 mg/L exceeds the North Dakota numeric standard of 100 mg/L for a Class I stream.
Sodium shows a large percentage change for the No Action Alternative compared to the other action alternatives because changes of a few milligrams per liter are large when compared to the overall generally low concentrations simulated. However, sodium concentrations at Wahpeton are not anticipated to be a concern, since the simulated median concentration for all alternatives is 20 mg/L or less (figure 4.37).
0
50
100
150
200
250
300
350
400
450
Sim
ulat
ed S
ulfa
te (m
g/L)
No Action 66 95 118 193North Dakota In-Basin 132 136 79 144Red River Basin 132 137 102 164GDU Import to Sheyenne River 174 186 194 262GDU Import Pipeline 105 139 187 283Missouri River Import to Red RiverValley
138 147 166 228
Wahpeton Fargo Grand Forks Emerson, Manitoba
Secondary Drinking Water Standard, Minnesota Numeric Standard for the Red Riverand North Dakota Numeric Standard for Class I Stream (250 mg/L) IJC Objective at Emerson (250 mg/L)
Figure 4.35 – Median Sulfate Concentrations for Unsteady Flow on the Red River.
Figure 4.38 shows the results for total phosphorus where all alternatives had results greater than the interim guideline for a numeric standard set by the state of North Dakota. The No Action Alternative showed the lowest median simulated concentration of total phosphorus between all alternatives at 0.266 mg/L. The action alternatives ranged from 0.623 mg/L to 1.450 mg/L, or an increase of 134% to 445% over No Action.
4 - 69

Red River Valley Water Supply Project FEIS Chapter Four Environmental Impacts
0
50
100
150
200
250
Sim
ulat
ed C
hlor
ide
(mg/
L)
No Action 12 33 15 43North Dakota In-Basin 94 91 20 46Red River Basin 94 91 17 43GDU Import to Sheyenne River 98 89 25 47GDU Import Pipeline 115 96 25 46Missouri River Import to Red RiverValley
62 66 20 39
Wahpeton Fargo Grand Forks Emerson, Manitoba
Secondary Drinking Water Standard (250 mg/L)
IJC Objective at Emerson (100 mg/L)
Minnesota Numeric Standard for the Red River and North Dakota Numeric Standard for a Class I Stream (100 mg/L)
Figure 4.36 – Median Chloride Concentrations for Unsteady Flow on the Red River.
0
10
20
30
40
50
60
70
80
90
100
Sim
ulat
ed S
odiu
m (m
g/L)
No Action 14 34 32 50North Dakota In-Basin 16 35 35 49Red River Basin 16 35 30 45GDU Import to Sheyenne River 20 42 56 71GDU Import Pipeline 14 39 56 75Missouri River Import to Red RiverValley
17 38 44 58
Wahpeton Fargo Grand Forks Emerson, Manitoba
Figure 4.37 – Median Sodium Concentrations for Unsteady Flow on the Red River.
4 - 70

Red River Valley Water Supply Project FEIS Chapter Four Environmental Impacts
Fargo The model included a location or “node” to simulate water quality upstream from the Fargo intake structure on the Red River. The trends were generally similar to those observed upstream at Wahpeton where the median concentrations for the action alternatives were greater than the No Action Alternative.
The median TDS at Fargo was lower for the No Action Alternative, although it had increased compared to Wahpeton (figure 4.34). The increased TDS compared to Wahpeton is likely from natural processes and inflows from tributaries between Wahpeton and Fargo. The median concentration of 406 mg/L for the No Action Alternative is considerably lower than for the action alternatives. The median concentrations for the action alternatives ranged between 572 mg/L and 654 mg/L for an increase over No Action of 41% to 61%. These median values for TDS were above the SDWS for TDS.
The median sulfate concentration for the No Action Alternative at Fargo of 95 mg/L is below the SDWS of 250 mg/L (figure 4.35). Again, the No Action Alternative result at Fargo is because of inadequate surface water to satisfy demand for Wahpeton industry (a 75% shortage) and therefore less return flow of poorer quality water. The median concentrations for the action alternatives ranged from 136 mg/L to 186 mg/L, an increase of 43% to 96% compared to the No Action alternative. The median concentrations for the action alternatives remained substantially below the SDWS.
0.000
0.500
1.000
1.500
2.000
2.500
3.000
Sim
ulat
ed T
otal
Pho
spho
rus
(mg/
L)
No Action 0.266 0.282 0.653 2.394North Dakota In-Basin 1.303 1.019 0.280 1.500Red River Basin 1.303 1.023 0.554 1.688GDU Import to Sheyenne River 0.623 0.588 0.582 1.008GDU Import Pipeline 1.450 1.177 0.428 0.881Missouri River Import to Red RiverValley
0.611 0.580 0.720 0.968
Wahpeton Fargo Grand Forks Emerson, Manitoba
North Dakota Interim Guidelinefor Numeric Standard of a Class I Stream (0.1 mg/L)
Figure 4.38 – Median Total Phosphorus Concentrations for Unsteady Flow on the Red River.
The No Action Alternative at Fargo showed simulated median concentration for chloride of 33 mg/L (figure 4.36), compared to the action alternatives which ranged from 66 mg/L to 91 mg/L
4 - 71

Red River Valley Water Supply Project FEIS Chapter Four Environmental Impacts
(100% to 178% greater) than the No Action alternative. The median concentrations for the action alternatives were still below the 250 mg/L SDWS, as well as below the 100 mg/L numeric standard for a Class I stream in North Dakota.
The No Action Alternative also had the lowest median sodium values at Fargo at 34 mg/L (figure 4.37). While there is no numeric standard for sodium, the results for the action alternatives ranged from 35 mg/L to 42 mg/L, an increase of 3% to 24%.
Total phosphorus for the No Action Alternative showed a median concentration of 0.282 mg/L, which was almost three times greater than the North Dakota interim guideline for a numeric standard (figure 4.38). The action alternative median concentrations of 0.580 mg/L and 1.177 mg/L are 106% to 317% greater than the No Action Alternative.
Grand Forks The location used to assess the potential impacts at Grand Forks is just below the confluence of the Red Lake and Red Rivers, but upstream of the Grand Forks water supply intake. Those alternatives importing water from the Missouri River system show greater median TDS concentrations than those relying on water from within the basin. The reason is that TDS concentrations on average are generally greater within the Missouri River system than the Red River system surface waters, and there is less return flow from upstream sources for the No Action Alternative. During the low flow conditions simulated, tributary inflows (which are available for dilution) are naturally lower, and the result is a Red River that begins to take on water quality characteristics more similar to upstream wastewater discharges. Water is bypassed upstream to satisfy senior water rights for the No Action Alternative. Although the No Action alternative shows generally lower concentrations than the Missouri River system import alternatives, essentially very little flow is supplied to the Red River by this alternative.
Unlike the other upstream locations where the No Action Alternative showed the lowest median TDS concentration, the North Dakota In-Basin Alternative had the lowest median TDS concentration of 360 mg/L. The No Action and Red River Basin Alternatives had similar median concentrations of 369 mg/L (figure 4.34). While the median simulated TDS concentrations for the alternatives tended to be more similar at Grand Forks than upstream, a 22% difference between the alternative with the highest median TDS (the GDU Import to Sheyenne River with 450 mg/L) and the lowest TDS (the No Action Alternative at 369 mg/L) existed. The trend of declining TDS from Fargo to Grand Forks is believed due to dilution, likely from tributaries on the Minnesota side of the Red River Valley. The primary tributary contributing the largest volume for dilution is the Red Lake River, which typically contributes water to the Red River even during a drought.
The median simulated sulfate concentration for the North Dakota In-Basin Alternative at Grand Fork was also the lowest of all the alternatives with a value of 79 mg/L (figure 4.35). The No Action Alternative showed a simulated median concentration of 118 mg/L and the GDU Import to the Sheyenne River (the greatest) at 194 mg/L (or about 64% greater than the No Action Alternative). The median concentrations for the alternatives do not exceed the 250 mg/L SDWS and North Dakota Numeric Standard for a Class I stream.
4 - 72

Red River Valley Water Supply Project FEIS Chapter Four Environmental Impacts
Those alternatives importing water from the Missouri River system showed greater median sulfate concentrations, than those relying on water from within the basin and No Action. The reason is that sulfate concentrations on average, are generally greater within the Missouri River system, than the Red River system surface waters. During the low flow conditions simulated, tributary inflows (which are available for dilution) are naturally lower, and the result is an effluent-dominated Red River.
For chloride, the No Action Alternative has a simulated median value of 15 mg/L and the GDU Import to Sheyenne River and GDU Import Pipeline Alternatives the highest at 25 mg/L (figure 4.36). Even though the highest alternative at 25 mg/L was almost 67% greater than the No Action Alternative, all the alternatives were far below the applicable standards.
The Red River Basin Alternative showed the lowest result for sodium of all alternatives at 30 mg/L (figure 4.37). However this is only slightly lower than the 32 mg/L result for the No Action Alternative. The alternatives that would import Missouri River water tend to be higher at 56, 56, and 44 mg/L respectively. However, while this is up to 82% greater than the No Action Alternative, this type of increase alone should not be a major concern.
Total phosphorus results showed that the Missouri River Import to Red River Valley Alternative had the highest total phosphorus at 0.720 mg/L, which was about 10% greater than the No Action Alternative at 0.653 mg/L (figure 4.38). The lowest result was for the North Dakota In-Basin Alternative at 0.280 mg/L, which was a 57% decrease in total phosphorus from No Action. Again, all alternatives exceeded the 0.1 mg/L interim guideline for a numeric standard set by the state of North Dakota.
Emerson The location used to assess the potential impacts at the most downstream location on the Red River is Emerson, Manitoba. Those alternatives importing water from the Missouri River system show greater median TDS and sulfate concentrations, than those relying on water from within the basin. The reason is that TDS and sulfate concentrations on average are generally greater within the Missouri River system, than the Red River system surface waters. This becomes more evident and exacerbated at Emerson during a drought, where water from the Red River has already been withdrawn for use, treated and returned to the river only to be withdrawn again, treated and returned to the river. This process tends to increase the concentrations of all substances, including TDS.
The North Dakota In-Basin Alternative had the lowest TDS at Emerson with a median of 458 mg/L, but this result is closely followed by the Red River Basin, No Action, and Missouri River Import to Red River Valley Alternatives at 462, 477, and 485 mg/L (figure 4.34). The GDU Import to the Sheyenne and GDU Import Pipeline Alternatives were the highest at 530 and 516 mg/L, respectively. While none of the action alternatives were greater than 11% different from the No Action Alternative, only the two GDU alternatives have a simulated median concentration greater than the 500 mg/L SDWS and IJC Objective at Emerson. The results suggest that farther downstream on the Red River Project effects on TDS become less discernable, even during times of very low flow on the Red River.
4 - 73

Red River Valley Water Supply Project FEIS Chapter Four Environmental Impacts
The North Dakota In-Basin Alternative also had the lowest median value for sulfate at Emerson, with 144 mg/L, and the Red River Basin Alternative had the second lowest value at 164 mg/L (figure 4.35). The No Action Alternative had the third lowest result at 193 mg/L and is considerably below the 250 mg/L IJC Objective. Both the GDU Import to Sheyenne River and the GDU Import Pipeline Alternatives exceeded the IJC Objective with 262 and 283 mg/L, respectively. The GDU Import Pipeline Alternative was 47% greater than the No Action Alternative.
The chloride results for Emerson showed little change between the alternatives with the No Action Alternative at 43 mg/L representing neither the high nor low extreme value (figure 4.36). Rather, the high value (47 mg/L) for the GDU Import to Sheyenne River and the low value (39 mg/L) for the Missouri River Import to Red River Valley Alternatives did not differ from No Action by more than 10%, and no alternative approached either the IJC Objective (100 mg/L) or the SDWS (250 mg/L).
Sodium at Emerson was highest for the three alternatives that import Missouri River water at 71, 75, and 58 mg/L for the GDU Import to Sheyenne River, GDU Import Pipeline, and Missouri River Import to Red River Valley, respectively (figure 4.37). Conversely, the North Dakota In-Basin and Red River Basin Alternatives were the lowest at 49 and 45 mg/L. Only the alternatives that import Missouri River water exceeded a 15% difference from the 50 mg/L result of the No Action Alternative.
The No Action Alternative result at Emerson was the highest reported value at 2.394 mg/L for total phosphorus (figure 4.38). This exceeded the total phosphorus interim guideline for a numeric standard (0.1 mg/L) for a North Dakota Class I stream. The second highest value for total phosphorus was 1.688 mg/L under the Red River Basin Alternative. The lowest reported value was for the GDU Import Pipeline Alternative with a simulated median concentration of 0.881 mg/L for total phosphorus, still in excess of the interim guideline set by North Dakota, but only 37% of the No Action Alternative.
While no inference should be made about loading of total phosphorus from these results, it is clear that the action alternatives all reduce the median concentration of total phosphorus in the Red River at Emerson during extended periods of very low streamflow. Total phosphorus at Emerson appears to be very sensitive to the ratio of source water to Grand Forks and the effluent water from Grand Forks. The model incorporates a ratio for predicting water quality constituents in the return flows from the major municipalities and industries. This ratio for Grand Forks was much larger than other municipalities and is likely the result of industrial processes within the community, not the population. However, the existing ratio for return flow constituents was used in the model with the estimated return flow for future population. The carrying forward of a ratio that is likely heavily influenced by industrial processes may lead to simulated results for total phosphorus in the future that are higher than what may occur with population growth independent of a particular industry.
Unsteady-Flow Modeling Comparison of Alternatives No Action Alternative The No Action Alternative had a simulated TDS median at two Sheyenne River gages that would exceed the SDWS. While the median value for simulated TDS on the
4 - 74

Red River Valley Water Supply Project FEIS Chapter Four Environmental Impacts
Red River did not exceed any applicable standard, there was a noticeable trend in increased TDS from the upper Red River to Emerson, Manitoba. There were no exceedances of median values for simulated sulfate, chloride, or sodium on either the Sheyenne or Red Rivers. However, total phosphorus had a simulated concentration above the applicable numeric standard for all but the West Fargo Gage and tended to show a concentrating effect the farther downstream it was measured. These adverse effects predicted by the unsteady-flow water quality model would be temporary changes limited to drought conditions.
Normally the No Action Alternative water quality results would be compared to existing conditions, but in this case data were inadequate for the Red River and its tributaries under low flow to form a basis for comparison and remove uncertainty in temporal and spatial predictions. Instead, the unsteady-flow modeling is an appropriate technique to compare the alternatives to No Action, given a similar set of boundary conditions modified to accommodate the different alternatives.
When comparing the alternatives to No Action, there is no clear definition of what constitutes “improved” or “poorer” water quality. For purposes of comparison here, the metrics for measuring water quality effects are:
1. Does the simulated median concentration of an analyte within an alternative exceed a stated standard or objective during the simulation period?
2. Does an alternative "substantially" change (increase or decrease) the concentration of an analyte throughout the Sheyenne and Red River systems or just a portion of the system? If only a portion of the system is changed, then the assessment is based upon the farthest downstream gage (Emerson for the Red River). In general terms, an increase in the modeled analytes constitutes “poorer” water quality, whereas a decrease would be considered “improved” water quality.
3. The perceived “importance” of the analyte. For the purpose of this analysis TDS was assumed most important, followed by sulfate, then total-phosphorus, sodium, and finally chloride. The hierarchy was based on the presence of numeric water quality standards or objectives. TDS has a secondary drinking water standard for drinking water, Minnesota numeric standard, and an IJC objective. Sulfate also has secondary drinking water standard implications, Minnesota, North Dakota, and IJC numeric standards and objectives, but it was a problem at fewer gages than TDS. Total Phosphorus has a standard primarily intended to protect aquatic life, not human health. The sodium standard protects the irrigation component of beneficial use, a nominal human health component, and is a limited problem. The chloride standard is an aquatic life concern, but is of concern only at Wahpeton and Fargo under some alternatives. The human health component of SDWS for chloride is not approached under any alternative at any location.
Using the above metrics, the alternatives were compared to No Action. Importantly, none of the alternatives have long-term or permanent adverse consequences when compared to the No Action Alternative. All the consequences would immediately begin to lessen under normal hydrologic conditions in the Red River Basin.
4 - 75

Red River Valley Water Supply Project FEIS Chapter Four Environmental Impacts
North Dakota In-Basin Alternative The North Dakota In-Basin Alternative had the highest simulated median concentrations for TDS at both gages on the Sheyenne River. These high median concentrations for TDS also exceeded the SDWS. This alternative also had the highest median concentration for total phosphorus at both gages on the Sheyenne River, with median concentrations that exceeded the North Dakota interim guideline for a standard at the Below Baldhill Dam Gage and all gages on the Red River. On the Red River, simulated median concentrations for TDS exceeded the applicable standards at Wahpeton and Fargo before being diluted by fresher water at the Grand Forks and Emerson Gages. There were no examples of median values for sulfate, chloride, or sodium on either the Sheyenne or Red Rivers that exceeded applicable standards under this alternative. These adverse effects predicted by the unsteady-flow water quality model would be temporary changes limited to drought conditions.
Red River Basin Alternative Because there was no import of Red Lake River or Missouri River water to the Sheyenne under this alternative, there were no substantial changes in TDS, sulfate, chloride, sodium, or total phosphorus to the Sheyenne River. However, supplying water to industries at Wahpeton increased the simulated median concentration for TDS at the Wahpeton and Fargo gages to levels above the applicable standards. However, this increased TDS noticeably dropped below the standards at the Grand Forks gage due to dilution with surface water from the Red Lake River that had lower TDS. There would not appear to be concerns with sulfate and sodium concentrations at any gage on the Red River. Simulated median results for chloride under this alternative were near the applicable standards at the Wahpeton and Fargo Gages, but simulated chloride results decreased to levels less than half of the standards at the Grand Forks and Emerson, Manitoba, Gages. Simulated median concentrations for total phosphorus under this alternative exceeded the North Dakota interim guideline at every gage on the Red River. These adverse effects predicted by the unsteady-flow water quality model would be temporary changes limited to drought conditions.
GDU Import to Sheyenne River Alternative This alternative exceeded the SDWS for TDS at both gages on the Sheyenne River. While this alternative had the highest simulated median for sulfate concentrations on the Sheyenne River, the median concentrations did not exceed any numeric standard. Simulated median concentrations for chloride did not approach any applicable standard on the Sheyenne River. Similarly, while this alternative had the highest median result for sodium at both gages, this would not be a concern under the applicable sodium standard for a Class IA stream in North Dakota. Total phosphorus at the Below Baldhill Dam Gage was the lowest of all alternatives, but remained above the North Dakota interim guideline for a numeric standard.
This alternative had the highest simulated median for TDS at all gages on the Red River except at the Grand Forks Gage. This alternative had the highest median concentration for sulfate at the Wahpeton, Fargo, and Grand Forks Gages, but exceeded an applicable standard only at Emerson, Manitoba. The median simulated concentration for sodium steadily increased from Wahpeton to the Emerson, Manitoba, Gages. However, it is not believed that this increase would in itself be cause for concern. None of the gages on the Red River had median values for chloride that exceed the applicable standards. Again, the median value for total phosphorus concentrations exceeded the North Dakota interim guideline for a numeric standard at all gages. These adverse
4 - 76

Red River Valley Water Supply Project FEIS Chapter Four Environmental Impacts
effects predicted by the unsteady-flow water quality model would be temporary changes limited to drought conditions.
GDU Import Pipeline Alternative Because there was no import of Red River or Missouri River water to the Sheyenne under this alternative, there were no substantial changes in TDS, sulfate, chloride, sodium, or total phosphorus to the Sheyenne River. The median value for simulated TDS exceeded the applicable standard or objective at Wahpeton, Fargo, and Emerson. Only Grand Forks had a median TDS concentration below the standard, and this was likely due to dilution with the much fresher surface water of the Red Lake River. The median value for simulated sulfate does not exceed any standard until Emerson, Manitoba, where it was also the highest result of any alternative. This alternative showed a steady increase from Wahpeton to Emerson, Manitoba, with respect to the median simulated result for sodium. The median value for simulated chloride exceeded the applicable standards at Wahpeton, but then decreased downstream due to dilution and was less than 50% of the IJC Objective at Emerson, Manitoba. This alternative again exceeded the interim guideline for a numeric standard for total phosphorus at all gages on the Red River. However, it did have the lowest median concentration for simulated total phosphorus at the Emerson, Manitoba Gage. These adverse effects predicted by the unsteady-flow water quality model would be temporary changes limited to drought conditions.
Missouri River Import to Red River Valley Alternative This alternative would not release Missouri River water to the Sheyenne River. Thus, there were no substantial changes in TDS, sulfate, chloride, sodium, or total phosphorus to the Sheyenne River. Although the median value for simulated TDS exceeded applicable standards at Wahpeton and Fargo, this alternative had the lowest TDS of all action alternatives at these two gages and had the lowest TDS of the Missouri River import alternatives at all Red River gages. The median value for simulated sulfate did not exceed an applicable standard at any gage on the Red River. The median value for simulated sodium was the lowest at the Fargo, Grand Forks, and Emerson, Manitoba, Gages. These adverse effects predicted by the unsteady-flow water quality model would be temporary changes limited to drought conditions.
Beneficial Use Analysis and Antidegradation Policy The North Dakota Department of Health applies the North Dakota Antidegradation Policy primarily to the point of discharge of any project (personal communication, Mike Sauer, North Dakota Department of Health, November 30, 2006). Only the North Dakota In-Basin and the Missouri River to the Sheyenne River Alternatives would discharge water directly to natural waters. Therefore, these are the most likely to be reviewed under the North Dakota Antidegradation Policy.
The Below Baldhill Dam Gage is the closest downstream reporting site for water quality below the point of insertion of any imported waters into Lake Ashtabula. Therefore, the Below Baldhill Dam Gage is the primary site that would be evaluated under the Antidegradation Policy. The other changes reflected in water quality modeling on the Red River, such as changes in water quality from return flows of future industries near Wahpeton, would most likely be independently permitted and reviewed in a discharge permit application. Changes in existing wastewater discharge permits and conditions for future industries that would use Project water would be evaluated outside of this Project.
4 - 77

Red River Valley Water Supply Project FEIS Chapter Four Environmental Impacts
Water quality modeling suggests that there is a potential for the median concentration of select water quality parameters to change by more than 15% during low flow conditions at select locations along the Sheyenne and Red Rivers (see figures 4.26 through 4.38 and Appendix F.1). This percent change in concentration is based on comparing median simulated concentrations for the action alternatives to the No Action Alternative.
The definition of significant effect, as defined in North Dakota Administrative Code 33-16-02.1, Appendix IV, uses a threshold value of 15% in concentration to trigger a Category 1 antidegradation review. The Code, however, is not explicit with regard to the nature of the 15% change in concentration. It is unclear as to whether it applies to a long-term average concentration, an annual average concentration, an average concentration during short-term low flow periods, or some other statistical representation of concentrations.
Realizing that the modeled simulated results represent possible water quality conditions under one of the action alternatives during low flow is important. The long-term change in water quality, expressed as a percent change in concentration, would depend upon how often the Project would operate and the quantity of water that would be delivered during operation. The results discussed in the SDEIS and FEIS represent an upper limit in a probable change in concentration.
Some alternatives would improve water quality, at least with regard to nutrient concentrations. Increased nutrient concentrations are undesirable, because this could lead to an increase in the amount of unwanted plant material in aquatic systems. Some alternatives would reduce nutrient concentrations during low flow conditions. Completing antidegradation review for those select parameters that would improve water quality condition seems unwarranted.
An antidegradation review is required when an action represents a new or expanded discharge to an “outstanding state resource water.” None of the proposed action alternatives would discharge to an outstanding state resource water. Should the North Dakota Department of Health conclude that the increase in concentrations for select substances, like TDS or sulfate, triggers the 15% threshold value, several steps must be completed as a part of the antidegradation review. These steps are intended to determine whether a change in the existing beneficial uses could be expected.
The intent of the antidegradation review is to determine whether reasonable and less degrading alternatives to the option being considered are available. The antidegradation review for Class 1 waters, like the Sheyenne and Red Rivers, applies only to regulated activities (i.e., those requiring a North Dakota Pollutant Discharge Elimination System permit). The review does not apply if there is no permanent effect on water quality and beneficial uses or if the effects are appropriately minimized and temporary. Further consideration of whether the affects are temporary seems likely, given the frequency of planned operation.
Should an antidegradation review be needed, the process for completing the review consists of: • Assessing whether state-required water quality controls are being implemented; • Demonstrating that there are no reasonable alternatives to the planned project, through
the completion of an adequate alternatives analysis;
4 - 78

Red River Valley Water Supply Project FEIS Chapter Four Environmental Impacts
• Demonstrating that the activity will provide important socioeconomic development
within the area where the waters are affected; and • Determining that the existing beneficial uses will be maintained.
The FEIS analyses reasonable alternatives and presents an evaluation of the socio-economic importance of the Project to the Red River Valley. The FEIS also concludes that no long-term impairment of the beneficial uses is expected from the proposed Project; therefore, compliance with the antidegradation provision is expected.
The most likely aspect of water quality related to a Project alternative that may require an antidegradation review is the simulated 33% increase in sulfate at the Below Baldhill Dam Gage within the GDU Import to the Sheyenne River Alternative. This simulated 33% increase in sulfate, or degradation of water quality, did not exceed the beneficial use limit. Thus, the beneficial use classification of the Sheyenne River would not change. The North Dakota In-Basin Alternative lowered sulfate by 37%. While this would present a change in the sulfate concentration, generally it is considered an improvement in water quality and would not affect beneficial use, nor be considered reason to prompt an antidegradation review.
When compared to the No Action Alternative, chloride at the Below Baldhill Dam Gage was not only relatively low, but it did not change by more than 15% for either the North Dakota In-Basin or Missouri River Import to Sheyenne River Alternatives. Nor does modeling suggest that chloride would exceed the North Dakota Standard for a Class IA stream of 175 mg/L of chloride. Therefore, the modeling suggests no change in beneficial use at the Below Baldhill Dam Gage.
The Class IA sodium standard of 60% of the total cations, as measured in milliequivalents, is unlikely to be exceeded. Historical water quality records available from the USGS at its website (http://nwis.waterdata.usgs.gov) show that sodium in the Red River from Fargo to Emerson is often between 10% - 35%. The Missouri River at Bismarck can be as high as 54% sodium of the total cations, but is more commonly in the 30% - 40% range. Sodium in the Sheyenne River from the Below Baldhill Dam Gage tends to be in the 30% - 40% range. Exceeding the 60% standard through the mixing of any of these waters is highly unlikely because none of the possible source waters have historically been high enough to create a problem. Therefore, no change in beneficial use is expected at the Below Baldhill Dam Gage from a change in sodium concentration.
TDS has no set concentration for either a Class I or Class IA stream in North Dakota. Although the simulated TDS concentration at the Below Baldhill Dam Gage increased by 28% in the North Dakota In-Basin Alternative when compared to the No Action Alternative, this did not affect the classification of the Sheyenne as a Class IA stream. It is not anticipated that this 28% increase in TDS would be considered detrimental under the North Dakota Antidegradation Policy.
While there is no numeric standard for total phosphorus, the simulated results for every alternative exceeded the interim guideline for a numeric standard of 0.1 mg/L of total phosphorus. In the absence of a numeric standard difference between Class I and Class IA streams, there would be no change in the beneficial use compared to the No Action Alternative. The Antidegradation Policy for North Dakota would consider the simulated results for total
4 - 79

Red River Valley Water Supply Project FEIS Chapter Four Environmental Impacts
phosphorus at the Below Baldhill Dam Gage of up to a 43% increase significant with the North Dakota In-Basin Alternative. However, since the simulated results showed the total phosphorus to be naturally attenuated by the West Fargo Gage below the interim numeric guideline of 0.1 mg/L, this likely would not be a problem under the North Dakota Antidegradation Policy.
Red River From Emerson to Lake Winnipeg and Lake Winnipeg The annual total nitrate and total phosphate loads for the action alternatives were compared to the annual loads for existing conditions at Fargo and Grand Forks, North Dakota (Houston Engineering 2005). These locations were selected because of a good, long-term record of discharge and chemistry data. The comparison evaluated the potential for nutrient enrichment and increased eutrophication. Nutrient enrichment could cause excessive plant growth within aquatic ecosystems and degrade water quality.
Because the Red River reach between Emerson, Manitoba, and Lake Winnipeg was not covered in the unsteady-flow water quality modeling, the modeling results do not explicitly evaluate the effects of an import alternative on water quality north of the United States - Canadian border. The model shows median values that differ among the alternatives at Emerson, Manitoba. A reasonable assumption is that in-basin contributions of total phosphorus to the load at Emerson, Manitoba, would be independent of an import of Missouri River water, because groundwater typically has very low concentrations of phosphorus when compared to surface water. Thus, the change in load of total phosphorus at Emerson would result from the importation of Missouri River water.
The difference in average concentrations; however, are more complex and are largely the result of differing volumes of flow at Emerson. At that location the action alternatives with the lower flows tend to have higher average concentrations. Of all the alternatives, the No Action Alternative has the lowest total phosphorus concentration, because major water users receive and discharge only a fraction of their annual water demand.
Therefore, it is possible to calculate the additional total phosphorus load to the Red River Basin by the GDU Import to Sheyenne River, the GDU Import Pipeline, and Missouri River Import to Red River Valley Alternatives based upon the amount of water that would be imported to the Red River Valley from the Missouri River. The additional estimated load of total phosphorus from Missouri River water can be calculated by multiplying the average concentration of total phosphorus, as measured at Garrison Dam, by the volume of water that would be imported by the alternatives into Lake Ashtabula.
Houston Engineering, Inc. (2005) calculated a mean concentration for total phosphorus of 0.017 mg/L on the Missouri River at Garrison. Table 2.2 in chapter two of the FEIS shows the average volume of water that would be delivered by the main conveyance feature by alternative, including an extra 5% for loss. Subtracting 5% from these yearly averages reveals the total amount of water that would be delivered to the Red River Valley by the main conveyance feature of the alternatives.
Using the period of record values as an example, the GDU Import to Sheyenne River and GDU Import Pipeline Alternatives would deliver 30,102 ac-ft and 55,222 ac-ft, respectively.
4 - 80

Red River Valley Water Supply Project FEIS Chapter Four Environmental Impacts
Therefore, on the average, the GDU Import to Sheyenne River Alternative would import 0.631 tons of phosphorus annually, and the GDU Import Pipeline Alternative would import 1.158 tons to the Red River Valley. In comparison, table 4.25 lists estimates of historical loads for total phosphorus during both dry (1981) and wet (1997) years.
Table 4.25 - Estimated Annual Loads of Selected Water Quality Constituents in the Red River at Emerson Comparing Dry and Wet Years (Adopted From Nustad and Bales (2006)).
1981 Annual Load (tons) (Dry Year with 1.1 million ac-ft)
1997 Annual Load (tons) (Wet Year with 9.5 million ac-ft)
Constituent Annual Load
Lower Limit 95%
Confidence Interval
Upper Limit 95%
Confidence Interval
Annual Load
Lower Limit 95%
Confidence Interval
Upper Limit 95%
Confidence Interval
TDS 519,000 494,000 544,000 5,070,000 4,490,000 5,720,000Sulfate 109,000 97,800 122,000 1,570,000 1,210,000 2,000,000Chloride 61,500 54,000 69,800 276,000 211,000 354,000Sodium 51,200 47,500 57,000 327,000 266,000 398,000Total Phosphorus 265 224 312 6,330 3,510 10,500
As shown in table 4.25, 1.1 million ac-ft of water pass by the Emerson, Manitoba, Gage during a relatively dry year. The estimated load of total phosphorus in a dry year under existing conditions is 265 tons. This shows that in a relatively dry year, the GDU Import to Sheyenne River Alternative would raise the total estimated load from 265 tons to 265.631 tons, or an increase of about 0.2%. The Missouri River Import to Red River Valley Alternative would increase the total estimated load from 265 tons to 266.158 tons, or an increase of about 0.4%. Since a year of high flow in the Red River carries an estimated load of 6,330 of total phosphorus tons without the Project. This strongly suggests that effects to Lake Winnipeg from a Project load in the range of 0.631 - 1.158 tons of total phosphorus would be indistinguishable from existing sources.
Missouri River System The GDU Import to Sheyenne River, GDU Import Pipeline, and Missouri River Import to the Red River Valley Alternatives would remove water from the Missouri River system, thereby changing nutrient loads. Based upon the amount of nutrient load removed from the Missouri River, the probable change in water quality is expected to be immeasurable. The reduction in annual nutrient load leaving the Missouri River system was less than 0.5% (Houston Engineering, Inc. 2005). No changes in State of North Dakota beneficial uses of the Missouri River would be expected.
The Corps (2007) report on the analysis of Missouri River effects evaluated the hydropower thermal capacity and energy impacts comparing current (2002), No Action, and the three Missouri River import alternatives. The additional depletions under No Action through 2050 and the three import alternatives would affect operations of coal-fired generation plants that use Missouri River water for cooling. However, these plants are prohibited from exceeding a Missouri River water temperature of 90 ºF, so no impacts above that temperature would be expected under No Action or the three import alternatives. The social and economic issues section of chapter four further discusses hydropower thermal capacity and energy impacts from the Project.
4 - 81

Red River Valley Water Supply Project FEIS Chapter Four Environmental Impacts
Audubon Lake and the Garrison Diversion Unit Principal Supply Works The GDU Import to Sheyenne River and GDU Import Pipeline Alternatives would use a portion of the existing GDU infrastructure to deliver water either to the Sheyenne River (Lake Ashtabula) or directly to users within the Red River Valley via a pipeline distribution system.
Discharge at the headworks of the McClusky Canal is expected to range from 7 - 207 cfs of water for the various alternatives and differing hydrologic and climatic conditions. Water quality in the McClusky Canal and Chain of Lakes would improve under any alternative that uses the GDU Principal Supply Works. The concentrations of analytes in the canal would approach those in Audubon Lake as the duration of operation increased.
Snake Creek Pumping Plant Would Pump Water From Lake Sakakawea Into Audubon Lake
Under current operations, there is essentially no flow in the McClusky Canal beyond New John’s Lake. As a result, concentrations of most constituents markedly increase downstream of New John’s Lake due to evaporative concentration. To avoid potential temporary water quality impacts in the Sheyenne River resulting from initial project operation, releases from the canal would be initially small until the poorer quality water downstream of New John’s Lake is mixed. Although Reclamation operates a freshening program for Audubon Lake and the McClusky Canal downstream to New John’s Lake, water downstream from New Johns Lake is of poorer quality than upstream. It would remain so under No Action. Simulated concentrations in Audubon Lake were generally similar to No Action. The reason for similar concentrations in Audubon Lake among the alternatives was its relatively large volume relative to Project inflows, along with the effects of runoff from adjacent land. No changes in beneficial uses in Audubon Lake or in New John’s Lake are expected.
Water Use and Treatability Water users have expressed interest in the treatability of the water delivered by the various action alternatives. Issues associated with treatability generally concern elevated concentrations of substances like TDS, sulfate, or other constituents that would increase the need for chemical treatment or require additional or alternative treatment process for removal. The amount of TDS in water intended for potable use provides a general indication of treatability.
The water quality models were used to compare water quality between the alternatives. While uncertainty remains if the analyzed boundary conditions will be applicable during a future drought, more detailed statistics for the simulated results and historic water quality are in Appendix F.1. Simulated results can be compared to historic water quality with the information in the appendix.
It appears that the observed and simulated changes in water quality would not be large enough to change the beneficial use categories, including human consumption, of either the Sheyenne or
4 - 82

Red River Valley Water Supply Project FEIS Chapter Four Environmental Impacts
Red Rivers with Project alternatives. The relative differences between the alternatives were small enough to realistically expect that readily available treatment technologies would be sufficient to treat water that would be delivered by any of the proposed alternatives.
Cumulative Effects No cumulative water quality impacts are anticipated. Operation of the Devils Lake Outlet is the most likely reasonably foreseeable activity with potential cumulative impacts. Operation of the Devils Lake Outlet is restricted by a National Pollutant Discharge Elimination System Permit. Appendix B.1 lists specific permit criteria for the Devils Lake Outlet and explains that the likelihood of concurrent operation of the action alternates and the Devils Lake Outlet is small. Should concurrent operation occur, no cumulative impacts are anticipated.
Summary
Summary of Water Quality Steady-Flow Modeling Results The steady-flow simulations were based upon data collected on streamflow and water quality samples during September 2003, a period of relatively low, but not historically low flow. During Project operation no measurable changes for the conservative substances (TDS, sulfate, sodium, and chloride) is anticipated for any alternative. This suggests that beneficial uses would largely remain unchanged with implementation of any action alternatives.
As natural streamflow decreases during future drought conditions, the quality of water in the Red River is expected to be influenced by return flows and become increasingly reflective of the water quality characteristics of the return flows. Although simulated concentrations of some constituents are higher under action alternatives than under No Action, return flow quality water for the action alternatives may be preferable to little or no water at all under No Action.
Based upon the most recent monitoring information available from the IJC, exceedances of the water quality objectives at the border would occur infrequently (Houston Engineering, Inc. 2005). While the simulated results for the alternatives suggest an increased frequency of exceedances for some alternatives in relation to the No Action Alternative, the real utility of simulating water quality with computer models is to understand the tendency of an alternative to alter the system’s water quality in a particular direction for specific analytes.
Summary of Water Quality Unsteady-Flow Modeling Results All the unsteady-flow simulated results and stochastically selected water quality data represent the period of September 1, 1976, through August 31, 1977. This time period had the highest frequency of 7Q10 at several gages and essentially represents a 365-day period for the Red River Basin with sufficient water quality data coupled with low streamflow. This method used stochastic mixing of historical water quality data and streamflow for smaller tributaries to arrive at simulated values for water quality in the larger streams where good streamflow data and some water quality data exist for calibration. Although the model produced values for each day during the simulated period, what it actually did was produce 365 stochastically generated solutions for water quality for the already arrived at streamflow of the major rivers. The simulated median concentrations are believed to represent the best statistical
7Q10 is a seven-day low-flow event with a recurrence interval of 10 years.
4 - 83

Red River Valley Water Supply Project FEIS Chapter Four Environmental Impacts
understanding of the results under the flow conditions simulated, assumed future water quality concentrations of the tributaries, and assuming no changes in future return flow characteristics.
Although one might expect lower water quality throughout the Red River under the No Action Alternative due to the stream becoming effluent dominated, this was not supported by the simulated concentrations presented in figures 4.23 - 4.38. Under the No Action Alternative simulation, water of relatively natural quality was often passed through the Wahpeton area for use by senior water appropriators downstream. Because major agricultural processing facilities ran out of water at Wahpeton, industrial wastewater return flows to the Red River were reduced.
Similarly, the available data for return flow water quality at Grand Forks may have unduly influenced the results downstream from Grand Forks. Ratios of return-flow water quality to water quality of source water were used to estimate future return-flow water quality. The return flow ratios of effluent water quality to water treatment plant influent were considered reflective of future population growth. The ratio for total phosphorus at Grand Forks was higher than those at other locations and is likely related to existing industrial processes. This may not be indicative of future return-flow water quality where growth in return flow volume may depend more on population growth.
Another result of the unsteady-flow water quality modeling was the tendency for alternatives that import Missouri River water to increase TDS and sulfate, as compared to the in-basin alternatives. However, these same Missouri River import alternatives tend to be the lowest in total phosphorus. As shown in table 4.26, the alternatives only have minimal and temporary adverse effects.
Table 4.26 - Effects of Alternatives When Compared to No Action.
Resource North
Dakota In-Basin
Red River Basin
GDU Import to Sheyenne
River
GDU Import
Pipeline
Missouri River
Import to Red River
Valley B – Beneficial Effect A – Adverse Effect m – Minimal Effect T – Temporary Adverse Effect1 na – Not Applicable
Water Quality
Lake Ashtabula T m m m m Sheyenne River T m m m m Red River T T T T m Missouri River m m m m m
The simulation data suggest that there may be examples of change in a given water quality parameter of more than 15%, and this may reach the North Dakota definition of significant effect, as defined within North Dakota Administrative Code 33-16-02.1, Appendix IV.
The results presented are for flow conditions that are lower than those typically used (e.g., 7Q10) to establish regulatory permit conditions under the National Pollutant Discharge Elimination System program. The unsteady-flow water quality model results, although incorporating a 7-day
4 - 84

Red River Valley Water Supply Project FEIS Chapter Four Environmental Impacts
and 30-day low flow period, are not directly transferable to establishing regulatory permit limits. The unsteady modeling results presented reflect these low flow conditions, rather than the long-term condition, and therefore, should not be interpreted as representing future long-term water quality.
Environmental Mitigation While neither modeling study revealed substantial changes to water quality that would affect the identified beneficial uses of that water, expectations are that some water quality monitoring may be requested during initial operation of the project to better understand and confirm the results presented in this FEIS. This may or may not be a condition of a regulatory requirement (i.e., permit).
Water quality modeling suggests there is a potential to alter a given water quality parameter by more than 15%. This could reach the North Dakota definition of significant effect, as defined in North Dakota Administrative Code 33-16-02.1, Appendix IV. Therefore, an appropriate water quality monitoring program would be implemented.
• Reclamation and North Dakota will evaluate the need, location, and extent of water quality monitoring in an adaptive management plan. The plan will be developed in accordance with the Department of the Interior Policy guidance (Order 3270) and the report Adaptive Management, The U.S. Department of Interior Technical Guide (Williams et al. 2007).
• A water quality monitoring program will be established to provide data for optimizing operation of the biota water treatment plant.
4 - 85

Red River Valley Water Supply Project FEIS Chapter Four Environmental Impacts
Groundwater
Introduction How would the alternatives affect the quality and quantity of groundwater?
Groundwater resources would be affected by every alternative. Effects to aquifers would differ depending on the type of use or change in use, as proposed in chapter three of the Final Needs and Options Report (Reclamation 2005a). The use of groundwater as a source for Project water could affect source aquifers, surface water features associated with these aquifers, and current water users who rely upon these aquifers. Both beneficial and adverse effects are possible under most alternatives. The following sections discuss predicted long-term and short-term effects on groundwater and existing water users but not the temporary impacts of construction or socio-economic effects. Temporary construction impacts in aquifer wellfields are quantified in the “natural resource lands” section and Appendix E, and social and economic impacts are discussed in the “social and economics issues” section.
Aerial Overview of the Otter Tail Surficial Aquifer
The size and proposed groundwater features have changed since the DEIS, because there is no longer a Scenario One and Scenario Two water demand, as discussed in chapter two.
Methods For a given groundwater system, the long-term water budget is described mathematically as follows:
Total Recharge = Evapotranspiration + Natural Discharges + Human Use +/- Change in Storage
Where: • Total Recharge is the long-term average quantity of water flowing into the aquifer from
infiltrating precipitation and from rivers or groundwater flowing into the aquifer from other water-bearing units. In reality, the total recharge fluctuates from year to year. However, a long-term average is better for practical application, because the change in annual recharge depends upon several difficult to predict variables. Timing of precipitation, vegetative needs for moisture, and saturation conditions all remain exceedingly difficult to predict and produce a non-linear relationship between annual rainfall and recharge.
• Evapotranspiration is the loss of water from the aquifer back to the atmosphere. Evapotranspiration includes evaporative loss from shallow depressions that intersect the
4 - 86
Red River Valley Water Supply Project FEIS Chapter Four Environmental Impacts
water table (e.g. groundwater fed wetlands) and transpiration of water from plants that use water from the aquifer.
• Natural Discharge includes loss of water from the aquifer to wetlands, lakes, streams, as well as flow into other aquifers.
• Human use includes MR&I, irrigation, domestic, and livestock wells.
• Change in Storage within a balanced aquifer system is zero. However, lengthy periods of above average precipitation raise a water table within an aquifer and drought or excessive withdrawals lower the water table.
All aquifers conform to this equation when total recharge is represented as a long term average. Terms on the right side of the equation are adjusted to describe changes in use of the aquifer. ASR techniques could support increases in aquifer withdrawals for human use without negatively affecting evapotranspiration, natural discharge, or water in storage.
Most predicted impacts to an aquifer feature relate to rebalancing variables on the right side of the equation. To a certain degree some effects are more foreseeable than others. All are exceedingly difficult to quantify and are addressed qualitatively in this section. To assess impacts, data were collected and analyzed to determine existing and potential use for each aquifer under existing conditions.
Irrigation is the dominant use of groundwater throughout much of the Red River Valley, and its annual use fluctuates according to economic considerations and climate conditions. Thus, it is exceedingly difficult to accurately predict future interest and use of groundwater so long as irrigation remains the dominant use. However, pending applications under North Dakota’s water permitting process indicates future interest in groundwater on the North Dakota side of the Red River Valley.
Unfortunately, there is no corresponding way to predict future interest in groundwater in the Minnesota Red River Valley. This led Reclamation and North Dakota to initiate a study with the USGS in Mounds View, Minnesota, to address the lack of data on cumulative effects on groundwater in Minnesota (Winterstein 2007). In addition, chapter three of the Needs and Options Report (Reclamation 2005a) documents the best available information on individual aquifers with respect to existing use, expected Project and other future use, and the type of Project-related development that would allow long-term sustainable use of the aquifers.
Results Chapter two identifies the groundwater features proposed for use in the action alternatives. The locations of these aquifers are shown in figure 3.10, chapter three. Chapter three, groundwater, describes the existing conditions of each of these aquifers (see figures 3.11 and 3.12).
Although cumulative effects on North Dakota aquifers are predictable because of pending permits, the non-Project use of most Minnesota aquifers is more difficult to foresee. Winterstein (2007) evaluated this issue, but without defined plans, a great deal of uncertainty remains at this
4 - 87

Red River Valley Water Supply Project FEIS Chapter Four Environmental Impacts
point. Only the Moorhead aquifer in Minnesota, where Moorhead is the only existing user, can reasonably be assumed to remain restricted to Project use. Non-Project use of Minnesota groundwater is expected to increase.
When reviewing the figures depicting the proposed wellfields, it is important to remember that the final engineering design and permitting phase of any alternative would specify well placement. These figures were developed for appraisal-level planning and cost estimating and only illustrate the general magnitude of proposed wellfields. The well locations are conceptual and do not show actual well placement.
North Dakota Aquifers No Action Alternative Considering the substantive water shortage predicted for the No Action Alternative, it is likely that groundwater use would increase in the valley by 2050 without implementation of the Project. Currently many North Dakota aquifers in the valley are considered at or near a sustainable rate of human use (North Dakota State Water Commission 1995 and 2005a). While there are other aquifers that could provide some increased MR&I water, use of these is not feasible either because of the paucity of water or the cost of transportation. Smaller water systems would face logistical problems in constructing long pipelines to obtain relatively modest amounts of water.
In the No Action Alternative, the Red River Valley water users would increase dependence upon groundwater resources during a drought when surface water is unavailable. It is reasonably foreseeable that under the No Action Alternative groundwater resources near Fargo, Grand Forks, and Wahpeton could serve short-term needs.
Brightwood, Gwinner, and Milnor Channel Aquifers The Brightwood, Gwinner, and Milnor Channel Aquifers are too far from cities to be reasonable water sources to target under the No Action Alternative. Future local use of these aquifers would be developed independently.
Hankinson Aquifer The Hankinson Aquifer likely would not be affected under the No Action Alternative, either directly or indirectly. Farm Near Milnor, North Dakota
Horace Aquifer Existing use of this aquifer would continue, and at a minimum, increased pressure is likely from existing users maximizing use of current permits. Secondary effects to this aquifer would result from increased use of neighboring portions of the West Fargo Aquifer System. Continued use of the Horace Aquifer would draw down water levels, because no direct recharge to the aquifer from precipitation is likely.
Page-Galesburg Aquifer This aquifer’s proximity to the Fargo-West Fargo area suggests that it would be a likely candidate for increased use under the No Action Alternative. Existing data
4 - 88

Red River Valley Water Supply Project FEIS Chapter Four Environmental Impacts
suggest that some areas of the aquifer would be available for increased use, but the small amount of water available precluded consideration in the action alternatives. It is possible that localized over-development would occur without a Project.
Sheyenne Delta Aquifer Given the proximity of this aquifer to the Fargo-West Fargo area, the Sheyenne Delta Aquifer would attract use by Fargo and West Fargo. Even without an identified plan for use (see Appendix A.2), it reasonable to consider this aquifer a likely candidate for localized development absent a Project.
Spiritwood Aquifer Under No Action, this aquifer is too far from the identified shortages in the Red River Valley communities to meet future water needs. Therefore, it is unlikely that this aquifer would be affected by the No Action Alternative.
Wahpeton Buried Valley Aquifer The Wahpeton Buried Valley Aquifer would be affected adversely because a conditional water permit by an agricultural processing plant is triggered by low flows in the Red River. During droughts that severely reduce surface water flows at Wahpeton, this aquifer would be expected to produce water in excess of its safe yield capacity. This could cause a substantial short-term drop in the water table.
West Fargo North and West Fargo South Aquifers Both of these aquifers are part of the greater West Fargo Aquifer System, along with the Horace Aquifer. These two distinctly separate units of the West Fargo Aquifer System would expectedly see continued, if not greater, use under No Action. Continued use of these aquifers without a Project would persistently decline water levels in wellfields that eventually could lead to abandonment.
Action Alternatives Under action alternatives the effects to North Dakota aquifers would vary greatly between the respective aquifers and the proposed type of development or change in management. In general, the effects of the action alternatives would tend to be shorter term and less damaging than those of that are reasonably foreseeable under No Action.
Brightwood, Gwinner, and Milnor Channel Aquifers The Brightwood, Gwinner, and Milnor Channel Aquifers would be used in combination with the Spiritwood Aquifer to serve future industries in southeastern North Dakota (figure 4.39). These aquifers are water sources in the North Dakota In-Basin, Red River Basin, and GDU Import Pipeline
Figure 4.39 – Proposed Brightwood, Gwinner, Spiritwood, and Milnor Channel Wellfield.
4 - 89

Red River Valley Water Supply Project FEIS Chapter Four Environmental Impacts
Alternatives. Five new wells would be drilled into the Milnor Channel Aquifer, with eight new wells in the Brightwood and three in the Gwinner Aquifers. Each well would have to produce up to 285 ac-ft of water per year during the driest years of a 1930s-type drought.
Currently, the Brightwood Aquifer has very little development (see figure 3.11). Some undocumented use for domestic and livestock consumption is expected, but these withdrawals would be too minor to require a permit. There is currently nominal use of the Brightwood Aquifer.
Natural discharge and evapotranspiration are the balancing forces in this aquifer. It currently has little to no change in long-term storage. Natural discharges are primarily to wetlands and small lakes. Thus, any increased use of groundwater from the Brightwood Aquifer would correspondingly decrease the amount of water available to support evaporation from wetlands and lakes and would decrease transpiration from vegetation. This suggests that minor wetlands could shrink with a corresponding change in vegetation due to Project withdrawals.
Similarly, North Dakota State Water Commission hydrologists suggest that several small lakes in the area were sustained during the 1930s-type drought by groundwater inflow. If groundwater inflow were diverted to serve Project water demands, these small lakes could dry up during another severe drought. However, existing data are insufficient to model groundwater-surface water interaction.
Another natural discharge that could be affected is the inter-aquifer flow suggested by the proximity of the northeast portion of the Brightwood Aquifer to the Milnor Channel Aquifer. Water table elevations in the Brightwood Aquifer are typically greater than those within Milnor Channel. This suggests that some water flows from the Brightwood Aquifer to the Milnor Channel Aquifer.
Existing use of the Gwinner Aquifer is primarily limited to municipal use by the town of Gwinner and perhaps a few undocumented domestic and livestock wells. Increased use of the Gwinner Aquifer could lower the water table around the immediate wellfield by an undetermined amount and eventually decrease natural discharge of the aquifer into the nearby Spiritwood and Milnor Channel Aquifers. It is also possible that the typical method of installing domestic and livestock wells merely to a depth sufficient to extract small amounts of water would adversely affect these wells, if high yielding Project wells were installed nearby.
Increased use of the Milnor Channel Aquifer is more complex than either the Gwinner or Brightwood Aquifers because of existing water allocations of 10,245.3 ac-ft. These water permits are senior and must be preserved under North Dakota law. Of these allocations, about half have been used historically. The vast majority have been for irrigation. However, much of the allocated water in the Milnor Channel is located north and west of the proposed wellfield. This suggests that there should be little to no overlap in the zones of influence between existing wells and proposed Project wells. The Milnor Channel Aquifer is also connected to small lakes in the area, which may experience decreases in flow to these lakes. The degree of connectivity between surface water and groundwater is unknown and difficult to predict with existing data.
4 - 90

Red River Valley Water Supply Project FEIS Chapter Four Environmental Impacts
Because the demands on these aquifers would be increased during drought conditions, some of the water would be withdrawn from aquifer storage. It is anticipated that this would be a short to mid-term effect, which would decrease as the drought subsides. These aquifers would have time to naturally recharge back to a normal or near-normal state in the years following a drought when aquifer use would again decrease. Each aquifer would return to a near normal state at different times, depending upon a variety of factors. Although there currently are no pending permit applications for these aquifers, non-Project users may apply at some point. The quantity and timing of depletions cannot be predicted.
Hankinson Aquifer The Hankinson Aquifer is adjacent to the Milnor Channel and has a lower water table (figure 4.39). With the lower water table in the Hankinson Aquifer, it is likely that groundwater flow from the Milnor Channel into the Hankinson Aquifer would decrease with increased use of the Milnor Channel Aquifer. How much water this entails is unknown, but it is likely to be a smaller contribution than direct recharge from precipitation and should not be significant. No direct withdrawals from the Hankinson Aquifer are planned under any alternative.
Horace Aquifer The Horace Aquifer, and other smaller units of the West Fargo Aquifer System, may indirectly benefit from ASR features proposed for the West Fargo North and West Fargo South Aquifers. Leakage between the individual units of the West Fargo Aquifer system has been documented (Ripley 2000). It is likely that implementation of ASR into either the West Fargo North or West Fargo South Aquifer would at least mitigate leakage from the Horace Aquifer into either of these units. There is also a chance that ASR could inadvertently create a recharge mechanism that sends water into the Horace Aquifer. However, no withdrawal from or direct recharge to the Horace Aquifer are planned. Any effect on the Horace Aquifer would be indirect.
Sheyenne Delta Aquifer There are two Project features that could affect the Sheyenne Delta Aquifer indirectly, although no direct withdrawals are proposed (figure 4.39). The two features that indirectly could affect the Sheyenne Delta Aquifer are use of the Sheyenne River as a conveyance feature and use of the Milnor Channel Aquifer to meet industrial water demands.
Alternatives that propose to use the Sheyenne River as a conveyance feature would increase the frequency of average flows near Kindred and could increase localized inflow to this aquifer. These are the North Dakota In-Basin and GDU Import to Sheyenne River Alternatives. The effect of higher river flows on groundwater levels was investigated by Barr Engineering Company for the Devils Lake Outlet EIS (Barr Engineering Company 1999; Barr Engineering Company 2002). They determined that higher river flows would not influence the water table more than ¼ mile from the banks of the Sheyenne River through the Sheyenne Delta Aquifer, but groundwater levels would be slightly elevated within that zone.
The other possible effect that could occur is the loss of water from the Sheyenne Delta through increased leakage to neighboring aquifers. The Milnor Channel Aquifer is the most likely candidate to experience drawdown, which could increase leakage from the Sheyenne Delta Aquifer. However, while this may be possible, there is likely to be a very nominal effect on the south and southwest portion of the Sheyenne Delta Aquifer from those action alternatives that
4 - 91

Red River Valley Water Supply Project FEIS Chapter Four Environmental Impacts
propose to develop groundwater to serve industrial needs (North Dakota In-Basin, Red River Basin, and GDU Import Pipeline Alternatives.)
Spiritwood Aquifer The Spiritwood Aquifer, along with the Brightwood, Milnor Channel, and Gwinner Aquifers, are proposed as a Project feature of the North Dakota In-Basin, Red River Basin, and GDU Import Pipeline Alternatives to serve industrial demand in southeastern North Dakota (see figure 4.39). Unlike the other aquifers in this feature, the Spiritwood Aquifer is less likely to be recharged directly by precipitation, although that may occur in some areas. The 14 proposed wells would be expected to withdraw up to about 4,000 ac-ft of water during the worst year of a 1930s-type drought. If wells are placed in a portion of the aquifer that does not naturally recharge, then the aquifer would experience a persistent decline in the water table until the end of the drought. The aquifer would be expected to rebound in the long term.
Most of the existing 5,135.8 ac-ft of groundwater from the area of interest in the Spiritwood Aquifer is used for irrigation. Only 214.5 ac-ft of that water is for municipal use. There is no estimate available for increased use of this aquifer by non-Project users; there are no pending permits.
Wahpeton Buried Valley Aquifer The Wahpeton Buried Valley Aquifer currently provides water to the cities of Wahpeton, North Dakota, and Breckenridge, Minnesota, as well as to Minn-Dak Farmers Cooperative. These entities would continue to depend upon this water source; however, the Project would serve future industrial demands in the area, including the existing Cargill permit currently held in abeyance. This would benefit the aquifer and help ensure the long-term viability of the Wahpeton Buried Valley Aquifer for existing users without additional withdrawals for the Project.
Figure 4.40 – Approximate Locations of Proposed ASR Well Sites in the West Fargo North Aquifer.
West Fargo North and West Fargo South Aquifers The West Fargo North and West Fargo South Aquifers are proposed as ASR sites in the North Dakota In-Basin and Red River Basin Alternatives (figures 4.40 and 4.41). Most of the existing demands on these aquifers would move to surface water supplies or to imported water under all of the action alternatives. Transfer of existing demands to surface water would alleviate a historically persistent decline in water levels. ASR would store water to meet peak demands for Fargo and West Fargo or for use during future droughts. Implementation of ASR could reverse water decreases in some portions of the aquifers.
4 - 92

Red River Valley Water Supply Project FEIS Chapter Four Environmental Impacts
Water quality and compatibility between the recharge water, native groundwater, and geologic minerals that comprise the aquifers must be carefully considered and monitored. An improperly designed and maintained ASR system could produce undesirable water quality in the recovered water, along with plugging, loss of transmissivity, and decreased storage within the aquifer itself. While some of these effects are virtually inevitable, a properly designed and maintained ASR system limits these effects to acceptable levels.
Higher TDS characterizes the northern portion of the West Fargo North Aquifer. Implementing ASR on the southern portion of the West Fargo North Aquifer would tend to slow or prevent migration of higher TDS water from the north to the wellfield in the south. This would improve water quality in the aquifer.
Figure 4.41 – Approximate Locations of Proposed ASR Wells in the West Fargo South Aquifer.
A total of 15 wells would be needed in the West Fargo North Aquifer to meet water demands (figure 4.40). Some existing municipal wells could be incorporated into the ASR plan for this aquifer. The West Fargo South Aquifer would have 36 wells to meet the water demand (figure 4.41). Eighteen of these wells would be dual-use wells capable of recharge and production. A pilot project would be needed to ascertain optimum operating conditions and to identify the quality of water suitable for recharge.
Minnesota Aquifers No Action Alternative The only community in the Project service area that would have access to Minnesota groundwater resources is Moorhead, Minnesota. Impacts to Minnesota groundwater resources from North Dakota communities are not reasonably foreseeable under No Action.
Buffalo Aquifer Moorhead retains a substantial permit of 2,240 ac-ft of water on the Buffalo Aquifer. Moorhead likely would seek to use this aquifer as a supplemental water supply under the No Action Alternative in a fashion similar to several of the action alternatives. The likely difference between the development of this aquifer in No Action, as compared to the action alternatives, is that Moorhead would probably phase development over a longer period of time.
4 - 93

Red River Valley Water Supply Project FEIS Chapter Four Environmental Impacts
Moorhead Aquifer Moorhead likely would continue to use the Moorhead Aquifer similar to recent historical use. Because the Moorhead Aquifer does not appear to naturally recharge through direct infiltration, the water levels in the wellfield likely would persistently decline.
Otter Tail Surficial Aquifer It is unlikely that this aquifer would be considered under the No Action Alternative as a water supply for the communities in the Red River Valley. Moorhead could obtain its water from the more geographically favorable Buffalo Aquifer, and North Dakota communities would turn to North Dakota water sources. This would leave future development of the aquifer to non-Project, local needs.
Pelican River Sand-Plain Aquifer It is unlikely that this aquifer would be considered under the No Action Alternative as a water supply for the communities of the Red River Valley. Moorhead could obtain its water from the closer Buffalo Aquifer, and North Dakota communities would likely seek out supplies within North Dakota. This would leave future development of the aquifer to non-Project related needs.
Action Alternatives In general, the greatest effects to Minnesota aquifers would be under the Red River Basin Alternative. While the effects of No Action and some of the action alternatives are similar with respect to the Moorhead and Buffalo Aquifers, only the Red River Basin Alternative would use the Pelican River Sand-Plain and Otter Tail Surficial Aquifers.
Buffalo Aquifer Currently Moorhead has not used all of its permitted 2,240 ac-ft of water from the Buffalo Aquifer (figure 4.42). Reppe (2005) suggests that the Buffalo Aquifer is capable of increased development. The North Dakota In-Basin, Red River Basin, and the GDU Import Pipeline Alternatives propose to extract 114 ac-ft per month to partially supply water to Moorhead.
The effects on existing irrigation and other uses must be considered when proposing to increase withdrawals from the aquifer. The proposed increase in municipal use would essentially double the 1,252 ac-ft of water withdrawn for all uses that occurred in 2003, including irrigation. While localized drawdown of the water table is to be expected, this should not be a major concern with respect to the overall health of the aquifer. Monitoring would avoid undue impacts to any domestic wells in the aquifer.
Figure 4.42 – Buffalo Aquifer, Existing Wells, Proposed Wells, and Surrounding Features.
4 - 94

Red River Valley Water Supply Project FEIS Chapter Four Environmental Impacts
Given the limited increased use of the Buffalo Aquifer, it likely would reach a new equilibrium in response to increased use. A part of this equilibrium would be a lower water table near the new wellfield and correspondingly smaller natural discharge in the long-term. One uncertainty is the effect increased withdrawals would have on an existing contaminant plume in the Buffalo Aquifer near Moorhead. This concern must be considered during any increased withdrawal from the system. Winterstein (2007) discussed the potential for future water use of the Buffalo Aquifer. Winterstein estimated the future of the Buffalo Aquifer to be one of full use by 2050, largely through increased municipal and industrial demand. This evaluation reaffirms the restriction of groundwater use from this aquifer to local entities, as envisioned in the North Dakota In-Basin, Red River Basin, and GDU Import Pipeline Alternatives.
Moorhead Aquifer The proposed Moorhead ASR feature would improve a historically declining water table that is affecting the wellfield. This is a proposed feature in the North Dakota In-Basin, Red River Basin, and the GDU Import Pipeline Alternatives (figure 4.43). Water quality and compatibility between the recharge water, native groundwater, and geologic minerals that comprise the aquifers must be carefully considered and monitored. An improperly designed and maintained ASR system could affect water quality in the recovered water, along with plugging, loss of transmissivity, and decreased storage in the aquifer. Other than Moorhead, there are no other major users that would be affected by this feature. The maximum annual withdrawal from the Moorhead Aquifer during a 1930s-type drought would be about 389 ac-ft of water.
Otter Tail Surficial Aquifer Increased use of the Otter Tail Surficial Aquifer is a primary feature of the Red River Basin Alternative. Numerous wetlands, streams including the Otter Tail River, and lakes are known or suspected to actively exchange water with portions of the Otter Tail Surficial Aquifer. Interception of shallow groundwater before it reaches these surface features could have an unquantifiable effect on these water features. In order to minimize the effects of groundwater withdrawals, withdrawal sites must be properly spaced to protect important wetlands, lakes, and other current users of groundwater. Lakes regulated through surface water inlets and outlets would be relatively unaffected. Lakes without surface water control features could experience lower lake levels. However, it would be very difficult to separate natural drought impacts from the effects of increased groundwater withdrawals.
Figure 4.43 – Moorhead Aquifer and Associated Features.
4 - 95

Red River Valley Water Supply Project FEIS Chapter Four Environmental Impacts
Although the Otter Tail Surficial Aquifer is one of the largest in the region, it is likely that water would be removed temporarily from storage by the Project. One of the easiest ways to minimize impacts on surface waters would be to drill wells into the deepest water-bearing formation within the designated area. These deeper wells would have a better chance of being more isolated from surface waters. Deeper wells would lessen potential impact to surface water from groundwater-surface water interconnectivity. Approximately 60 wells would be installed in the Otter Tail Surficial Aquifer (figure 4.44) with a maximum average of 310 ac-ft per year, averaging 250 gpm per well. Winterstein (2007) projected a large increase in future use of the Otter Tail Surficial Aquifer by irrigation and municipal demands from population increases. While this expected increase puts a larger demand on the groundwater system, it could reasonably accommodate Project withdrawals as outlined in Reclamation (2005a) and in this FEIS.
Pelican River Sand-Plain Aquifer Impacts to the Pelican River Sand-Plain Aquifer by the Red River Basin Alternative are similar to impacts to the Otter Tail Aquifer. Likely effects would include decreased natural discharge and a drop in the water table as water is removed from storage. The extent that the water table would be lowered is difficult to predict and would need to be monitored. With proper spacing between new Project wells and existing wells, it is unlikely that capture problems would arise. Monitoring could be done to determine if water table drawdown is affecting other users.
Figure 4.44 – Proposed Wellfield for Pelican River Sand-Plain and Otter Tail Surficial Aquifers.
Twenty-one wells are proposed in the Pelican River Sand-Plain Aquifer, with an estimated minimum yield of 250 gpm (figure 4.44). The wells would have a maximum average of 310 ac-ft of groundwater per year per well. One of the greatest challenges in predicting impacts to this and the Otter Tail Surficial Aquifer are uncertainties associated with predicting future cumulative use of the aquifer. Winterstein (2007) discusses the existing and future use of the Pelican Sand-Plain Aquifer as being close to the full potential of the aquifer. However, without documented plans for expansion, the cumulative effects of future water users are difficult to ascertain.
Summary Not every aquifer would be used by every alternative, nor would every aquifer be impacted by only one alternative. Table 4.27 lists the aquifers that could be affected by the Project, the alternatives, and whether the effects would be beneficial or adverse. In this table a green “B” identifies a beneficial change, a red “A” predicts a long-term adverse effect, a blue “m” indicates a temporary or minor impact, and a black “na” denotes no effect or not applicable.
4 - 96

Red River Valley Water Supply Project FEIS Chapter Four Environmental Impacts
When evaluating the consequence of an alternative, the metrics for comparing the alternative to the No Action Alternative in order of importance are:
1. Would the alternative negatively impact existing users? 2. Would implementation of the alternative improve the prospect of long-term sustainable use of the aquifer? 3. Would implementation of the alternative degrade future use of the aquifer by non- Project water users? 4. Are there ecological concerns with use of the aquifer?
Table 4.27 - Summary of Consequences of No Action and Environmental Impacts That Could Result From Construction of the Action Alternatives and a 1930s-Type Drought.
As is evident from table 4.27, the No Action Alternative would increase withdrawals from a substantial number of aquifers. Some of these withdrawals would be from existing users to accommodate growth, whereas other water users would target aquifers in close proximity to
Resource List No Action North
Dakota In-
Basin
Red River Basin
GDU Import to Sheyenne
River
GDU Import
Pipeline
Missouri River
Import to Red River
Valley North Dakota Aquifers
Brightwood, Gwinner and Milnor Channel na A A na A na
Hankinson na A A na A na
Horace Withdrawals
would increase
B B B B B
Sheyenne Delta Withdrawals
would increase
m m B m m
Spiritwood na A A na A na
Wahpeton Buried Valley Withdrawals
would increase
B B B B B
West Fargo North Withdrawals
would increase
B B B B B
West Fargo South Withdrawals
would increase
B B B B B
Minnesota Aquifers
Buffalo Withdrawals
would increase
m m na A na
Moorhead Withdrawals
would increase
B B B B B
Otter Tail Surficial na na A na na na
Pelican River Sand-Plain na na A na na na
B - Beneficial Effect
A – Adverse Effect m – Minimal
Effect na – Not
Applicable
4 - 97

Red River Valley Water Supply Project FEIS Chapter Four Environmental Impacts
growth areas. Because different alternatives would use the same groundwater feature, and different features could affect a particular aquifer or a different region, the environmental impacts of alternatives are impossible to rank. The comparative effects are discussed below.
No Action Alternative As is apparent in table 4.27, there is no alternative with overall greater adverse consequences to groundwater and groundwater dependent ecosystems than the No Action Alternative. Under the No Action Alternative, Horace, Page-Galesburg, Sheyenne Delta, Wahpeton Buried Valley, West Fargo North, West Fargo South, Buffalo, and Moorhead Aquifers would have increased withdrawals and lower water levels. Some of these aquifers would be impacted by new or increased permitted withdrawals, while existing users would more fully use current permits.
North Dakota In-Basin Alternative Implementation would result in temporary adverse effects to the Brightwood, Milnor Channel, Gwinner, and Spiritwood Aquifers directly from increased withdrawals during a drought. Temporary adverse effects could also occur in the Hankinson and Sheyenne Delta Aquifers where withdrawals from the Milnor Channel could slightly lower water. A long-term adverse effect would be expected to the Buffalo Aquifer, but it would be minimal in comparison to No Action. The only difference would be construction of infrastructure for an increased withdrawal rate of 1 cfs to meet a peak-day demand greater than would be expected under No Action.
In contrast, Project releases from Baldhill Dam would stabilize the Sheyenne River and lessen water loss from the Sheyenne Delta Aquifer along the Sheyenne River. Other aquifers would benefit, including the Horace, Wahpeton Buried Valley, West Fargo North, West Fargo South, and Moorhead Aquifers, from either decreased use or from recharge by a Project ASR feature.
Red River Basin Alternative Effects to the Brightwood, Gwinner, Milnor Channel, Hankinson, Horace, Spiritwood, Wahpeton Buried Valley, West Fargo North, West Fargo South, Buffalo, and Moorhead Aquifers are the same under this alternative as under the North Dakota In-Basin Alternative. The adverse effect to the Sheyenne Delta would be the same as under the North Dakota In-Basin Alternative, but there would be less of a beneficial effect, because flows in the Sheyenne River would not be augmented by imported Missouri River water. Adverse effects would impact the Otter Tail Surficial and Pelican River Sand-Plain Aquifers from increased use that would lower water tables and potentially preclude increased irrigation development, as discussed in Winterstein (2007).
GDU Import to Sheyenne River Alternative With this alternative, the beneficial effects described for the North Dakota In-Basin Alternative would be expected for the Horace, Sheyenne Delta, Wahpeton Buried Valley, West Fargo North, and West Fargo South Aquifers.
GDU Import Pipeline Alternative The Wahpeton Buried Valley would receive less use, resulting in a beneficial effect to the aquifer from this alternative compared to No Action. Implementation would cause temporary adverse effects to the Brightwood, Milnor Channel, Gwinner, Hankinson, and Spiritwood Aquifers. A portion of the Sheyenne Delta Aquifer would be minimally affected. The addition
4 - 98

Red River Valley Water Supply Project FEIS Chapter Four Environmental Impacts
of ASR for the Moorhead Aquifer would benefit the long-term viability of this water source. The Buffalo Aquifer likely would be negatively affected when Moorhead fully develops its permit on the Buffalo Aquifer with a new wellfield.
Missouri River Import to Red River Valley Alternative This alternative supplements existing water supplies with a pipeline and as such it has no adverse effects when compared to the No-Action Alternative. There are some beneficial effects that could be realized through operational considerations by less dependence on aquifers, including the West Fargo North, West Fargo South, Horace, Wahpeton Buried Valley, and Moorhead Aquifers.
Cumulative Effects Table 4.27 takes into account the cumulative effects of potential future non-Project and Project use of the aquifers. Reclamation and North Dakota took a hard look at North Dakota and Minnesota aquifer data. The best available information was used, including pending permits in North Dakota and USGS investigations in Minnesota.
The single largest concern with Project use of groundwater is that increased withdrawals would preclude future development of the groundwater for non-Project use. Winterstein (2007) suggests that the Buffalo Aquifer in Minnesota would be used to capacity by 2050, largely by Moorhead. Moorhead would also use this aquifer as a Project participant. The Pelican River Sand-Plain Aquifer would also be at or near capacity by 2050. In such a case the Project could increase dependence on the Otter Tail Surficial Aquifer. However, the Otter Tail Surficial Aquifer could adequately accommodate Project and non-Project demands but Project wells could face localized competition with future irrigation.
Groundwater is a feasible option, but it would be technically challenging. All aquifer withdrawals would be done in compliance with state and federal permit regulations. The permitting process would adequately address potential interference of Project wells with existing wells and surface waters.
Environmental Mitigation The activities proposed under the action alternatives would incorporate appropriate environmental commitments based upon the type of proposed feature. Where and when necessary, these environmental commitments would dictate design and operational considerations. The different action alternative features propose three changes to aquifers including: 1) ASR, 2) change in use, or 3) increased development.
The ASR Project features would affect the Moorhead, West Fargo North, and West Fargo South Aquifers. ASR features are some of the most challenging of the proposed project features because of uncertainty associated with the effectiveness of long-term ASR in these aquifers.
• Prior to construction of any ASR feature, a pilot study will determine the water quality and physical characteristics of the selected aquifers in order to design an effective ASR system and to answer questions that would arise during permitting.
4 - 99

Red River Valley Water Supply Project FEIS Chapter Four Environmental Impacts
• If an alternative is implemented that includes groundwater features, the Project will comply
with conditions stipulated in all permits issued by regulatory agencies.
• The best available construction techniques will be used to minimize environmental impacts during wellfield construction for all selected groundwater features.
• If the selected alternative uses groundwater features in the ROD, Reclamation and North Dakota will evaluate the need for water quality and water level monitoring in an adaptive management plan. The plan will be developed in accordance with the Department of the Interior Policy guidance (Order 3270) and the report Adaptive Management, The U.S. Department of Interior Technical Guide (Williams et al. 2007).
4 - 100

Red River Valley Water Supply Project FEIS Chapter Four Environmental Impacts
Aquatic Communities
Introduction How would the alternatives affect aquatic communities in the Project area?
Flows in the Sheyenne River and the Red River would be affected by all Project alternatives, particularly during a 1930s-type drought when water demand would be highest relative to available natural flows. Other water bodies (e.g., Lake Sakakawea) would be affected by some alternatives and not by others. This section describes how changes in water quantity, and to a lesser extent water quality, would affect aquatic resources.
Interbasin transfer of potentially invasive species could also adversely affect aquatic communities. Risks associated with transfer of potentially invasive species are discussed in the “risks of invasive species” section. With adequate treatment, the risk would be very low for the three Missouri River import alternatives.
Sheyenne River at Valley City
Methods Reclamation completed an instream flow assessment in 2003 to assess aquatic impacts in the Sheyenne and Red Rivers (Reclamation 2003a). Two objectives of that study were to:
• Quantify the seasonal habitat available for aquatic life at various flows at representative sites on the Sheyenne River and Red River.
• Develop an optimized flow regime for each representative site that would maintain a diverse aquatic community.
A habitat-preference guild approach was used. Guild representatives (species and life stages) were selected for pool and riffle areas to quantify the amounts of different habitat types available at different flows (table 4.28).
Several of the species selected as guild representatives came from both slow and fast riffle guilds. Use of riffle guild species to evaluate instream flow needs is typically considered protective for species using other types of habitat. Riffle areas are generally the first areas to be dewatered as stream depth declines, and species representing riffle guilds are most sensitive to changes in flow (both increases and decreases). Longnose dace adults served as a surrogate species for macroinvertebrates, because they occupy similar habitats, as recommended by Aadland (MNDNR, personal communication, September 30, 2002).
4 - 101

Red River Valley Water Supply Project FEIS Chapter Four Environmental Impacts
Table 4.28 – Habitat-Preference Guild Representatives Modeled for the Sheyenne River and Red River by Season.
Habitat Preference
Season Shallow
Pool Medium
Pool Deep Pool Raceway Slow Riffle Fast Riffle Riffle Spawning
Apr 1–May 15
Logperch (S)Walleye (S)
Longnose dace (S)
Sand shiner (S)
Shorthead redhorse (S)
Longnose dace (A)
Pool Spawning
May 16–Jun 30 Hornyhead chub (S)
Orangespotted sunfish (S) Smallmouth
bass (S)
Longnose dace (A)
Maintenance
July 1–Mar 31
Sand shiner (A)
Longnose dace (Y)
Walleye (Y+J) Channel
catfish (J) White sucker
(A)
Walleye (A) Channel
catfish (A)
Smallmouth bass (A)
Shorthead redhorse
(J+A) Channel
catfish (Y)
White sucker (J)
Smallmouth bass (J)
Sand shiner (Y)
Longnose dace (A)
S = spawning, Y = young, J = juvenile, A = adult
Reference sites were established at the following locations (See figure 3.13 in chapter three): • Sheyenne River near Warwick (upper Sheyenne River site) • Sheyenne River near Lisbon (below Lake Ashtabula) • Sheyenne River at Pigeon Point (near the Sheyenne National Grasslands) • Sheyenne River near Norman (near Kindred, North Dakota) • Red River of the North near Moorhead, Minnesota • Red River of the North at Frog Point (near Grand Forks, North Dakota)
The Warwick site was not used in the impact analysis because it is located outside the area of influence from any alternative.
The PHABSIM (Physical Habitat Simulation System) was used to develop habitat versus discharge relationships for the various habitat guild representatives listed in table 4.28 at each study site in the Sheyenne and Red Rivers. PHABSIM links hydraulic parameters such as depth and velocities to habitat suitability criteria for each guild to generate habitat units, or WUA (weighted usable area), expressed as feet2 of habitat per 1000 feet of stream length.
An optimization technique described by Bovee (1982) was used to develop a seasonal (monthly) instream flow regime. Optimization techniques were used to determine combinations of conditions that yielded the best mix of benefits, or which minimized negative impacts (Bovee 1982). The flow that maximizes habitat for the guild representative with the least amount of habitat among all guilds was defined, as the aquatic needs flow for that time step and river location.
This operationally defined aquatic needs flow regime would not likely be ideal for all guild representatives, but is intended to provide a diversity of habitat conditions suitable to balance the needs of the entire riverine community. Any sustained deviation from this flow regime (e.g., prolonged increase in flow) would likely benefit some life stages and harm others, depending on
4 - 102

Red River Valley Water Supply Project FEIS Chapter Four Environmental Impacts
location and timing. The aquatic needs flow provides some perspective on the “value” of the No Action Alternative.
Limitations to developing flows for aquatic need that are not considered by this approach include:
• Water year types • Water quality • Resource management goals (i.e., prioritization of species) • Channel maintenance and riparian flows
Results of the PHABSIM analysis are in Appendix D.1. Habitat was derived from the moderate flow (50th percentile) and low flow (10th percentile) for each alternative by converting flows to habitat units (WUA). Lake sturgeon in the Red River and six mussels species were analyzed separately from the fish guilds (table 4.28) using the same methods described below. These are also included in these appendix tables.
PHABSIM studies generate large amounts of technical data. To reduce the amount of information that must be reviewed, while retaining the essence of that information, the impact analysis compares habitat for all guild representatives for each action alternative to No Action.
Fish habitat on the Sheyenne River – Pool habitat in the foreground and riffle habitat in the background.
Percentage changes in habitat units were calculated by comparing each action alternative to No Action at the 50th and 10th percentile monthly flow levels. Relative impacts of these changes were assigned the following magnitudes of positive and negative gains and losses in habitat units:
• minor loss (-10.1 – 15%) = - • moderate loss (-15.1 – 20%) = --
Weights: + = 1 - = -1
++ = 2 -- = -2 +++ = 3 --- = -3
• major loss (>-20%) = --- • minor gain (10.1 – 15%) = + • moderate gain (15.1 – 20%) = ++ • major gain (>20%) = +++ • no change (-10 – 10%) = 0
Once impact levels were assigned, the number of occurrences of positive, negative, and no change values were tallied for all time steps and guild representatives at 50th and 10th percentile flow levels, respectively. Each alternative was “scored” by summing the number of weighted gains and losses (see text box).
The intent of “scoring” each alternative was to have a tool for assessing relative impacts of each alternative on aquatic resources compared to No Action. Summaries of alternative scores at each
4 - 103

Red River Valley Water Supply Project FEIS Chapter Four Environmental Impacts
site are presented in this FEIS. Positive scores indicate an improvement in habitat over No Action, while negative scores indicate adverse effects. Data used to develop these summaries are in Appendix D.1. A similar analysis was conducted for the six mussel species and lake sturgeon.
In addition to tabular analysis, graphics were used to illustrate impacts. Figure 4.45, taken from Appendix D.3 (figure D.3.35), shows a graphical representation of tabular results from Appendix D.2.
Figure 4.46 overlays habitat units linked to corresponding flows by time steps at low flows (10th percentile level) to compare No Action flows with aquatic needs. In this example, No Action habitat is generally lower than aquatic needs habitat. Interested readers should refer to Appendix D.1 and the Instream Flow report (Reclamation 2003a) to review the data summarized in this FEIS.
Longnose Dace Spawning
0
100
200
300
400
500
600
0 50 100 150 200 250 300
Flow (cfs)
Wei
ghte
d Us
able
Are
a (s
q ft)
Figure 4.45 – Relationship between Flow and Habitat for Longnose Dace Spawning at the Lisbon Site on the Sheyenne River.
Lisbon Site - No Action and Aquatic Needs 10 percentile flows and habitat
0
200
400
600
800
1000
1200
Jan Feb Mar April May 1-15
May16-31
June July Aug Sept Oct Nov Dec
Time Step
Wei
ghte
d Us
able
Are
a
(sq
ft)
0
20
40
60
80
100
120
140
160
Disc
harg
e (c
fs)
No Action HabitatAquatic Needs HabitatAquatic Needs Flow sNaturalized Flow sNo Action Flow s
Habitat guild representatives w ith minimum habitat:April-May 15 - Longnose dace spaw ningMay 16-June - Smallmouth bass spaw ningJuly-March - Walleye young
Figure 4.46 – 10th Percentile Flow and Habitat for Representative Fish Species with Minimal Habitat from the Aquatic Needs Analysis.
4 - 104

Red River Valley Water Supply Project FEIS Chapter Four Environmental Impacts
Flows beneficial to some species may be detrimental to others, or as Bovee (1982) noted, more water does not necessarily mean more habitat. This is illustrated in figure 4.45, which shows the habitat versus flow relationship for longnose dace spawning (April-May 15) at the Lisbon Site. Examination of this graph shows that maximum habitat occurs at a relatively low flow of 70 cfs. Higher or lower flows would reduce habitat for this life stage.
Since aquatic needs for all six mussel species were not determined, graphic impacts were analyzed using only the creeper (squawfoot) mussel, because it generally had the least amount of habitat of the mussel species. Aquatic needs for lake sturgeon in the Red River were also not determined, and this sensitive species was analyzed separately using this graphic impact method.
Results
Lake Ashtabula Fisheries Table 4.29 shows the total number of months in the period of record (1931-2001) that the reservoir would be at target, low, very low, or extremely low. Table 4.30 shows this same information for a 1930s-type drought, 1931-1940. These levels are defined as (1) target is within 1 foot of target elevation, (2) low is 2-5 feet below target elevation, (3) very low is 5 feet below target elevation to the top of the Fish and Wildlife Conservation Pool, and (4) extremely low is below the top of the Fish and Wildlife Conservation Pool. The targets, as illustrated on figure 3.3 in chapter three, are the top of the Conservation Pool (elevation 1266 msl) and the top of the Desired Fish and Wildlife Conservation Pool (1257 msl; 28,000 ac-ft), depending upon the season. The Fish and Wildlife Conservation Pool is a level established by the Corps on Lake Ashtabula to serve fish and wildlife purposes. Lake levels that fall below the Fish and Wildlife Conservation Pool elevation established at 1257 msl would affect aquatic communities.
Table 4.29 – Water levels in Lake Ashtabula in the Period of Record from 1931 – 2001. Number of Months During 71-Year Period of Record
Alternative At Target1 Low2 Very Low3 Extremely Low4 No Action 607 141 14 90 North Dakota In-Basin 692 146 13 0 Red River Basin 634 199 17 0 GDU Import to Sheyenne River 675 136 37 0 GDU Import Pipeline 635 196 19 0 Missouri River Import to Red River Valley 643 194 13 0 1 Within 1.0 feet of monthly target elevation 2 1.0 to 5.0 feet below target elevation 3 More than 5.0 feet below target elevation to top of Fish and Wildlife Conservation Pool 4 Below top of Fish and Wildlife Conservation Pool
Table 4.30 – Water levels in Lake Ashtabula During a Drought From 1931 – 1940. Number of Months During Drought, 1931-1940
Alternative At Target1 Low2 Very Low3 Extremely Low4
No Action 7 12 14 87 North Dakota In-Basin 45 61 13 0 Red River Basin 20 84 16 0 GDU Import to Sheyenne River 17 65 36 0 GDU Import Pipeline 21 81 18 0 Missouri River Import to Red River Valley 30 79 12 0
1 Within 1.0 feet of monthly target elevation 2 1.0 to 5.0 feet below target elevation 3 More than 5.0 feet below target elevation to top of Fish and Wildlife Conservation Pool 4 Below top of Fish and Wildlife Conservation Pool
4 - 105

Red River Valley Water Supply Project FEIS Chapter Four Environmental Impacts
No Action Alternative Aquatic communities in Lake Ashtabula could be affected by changes in water quantity or water quality. Modeling indicates that water quality would not differ significantly from No Action under any of the action alternatives (see the water quality section). Therefore, impacts to the aquatic community were evaluated based on simulated reservoir water levels from StateMod model runs for each alternative.
Under No Action, simulated reservoir elevations dropped below the Fish and Wildlife Conservation Pool for 90 months during the 71-year period of record. Almost all of these instances occurred between 1931 and 1941. Because Lake Ashtabula is shallow and eutrophic, the extremely low water levels during a 1930s-type drought would severely impact the aquatic community. In particular, there would be a high probability of a fish kill caused by low dissolved oxygen levels. Additionally, low water levels would favor warm water species, such as bullheads, over cool water species, such as walleye. Outside of a 1930s-type drought, the reservoir would typically maintain target elevation. Occasional instances of low water levels (1-5 feet below target) would probably not significantly affect aquatic resources.
All of the action alternatives showed fewer instances of extremely low reservoir levels than No Action. Thus, the likelihood of significant adverse impacts to the reservoir’s fishery or other aquatic resources would be reduced under all action alternatives. Occasional low or very low reservoir levels below target would probably not appreciably affect aquatic resources. In fact, fluctuating water levels can benefit reservoir fisheries. Terrestrial vegetation that becomes established at low water levels and is subsequently flooded provides habitat for forage fish, as well as spawning and nursery habitat for game fish. Alternatives that supplement the reservoir would increase flexibility for fisheries managers by providing a reliable water source to refill the reservoir after a drawdown to enhance aquatic habitat. However, during nondrought periods, natural inflow usually would be adequate to refill the reservoir after a drawdown. Conversely, during a 1930s-type drought periods, water level manipulations for fishery enhancement would be unlikely, as management for downstream water supply would take precedence.
North Dakota In-Basin Alternative Under this alternative, Lake Ashtabula would be very low for 13 months and never below the Fish and Wildlife Conservation Pool during the 71-year period of record or during a 1930s-type drought.
Red River Basin Alternative This alternative would maintain reservoir elevations above the Fish and Wildlife Conservation Pool throughout the period of record, but the reservoir level would be very low 17 months out of the 71-year period of record and 16 months during a 1930s-type drought.
GDU Import to Sheyenne River Alternative Lake Ashtabula would be very low for 37 months during the period of record and 36 of these months would be during a 1930s-type drought. It would maintain the reservoir elevations above the Fish and Wildlife Conservation Pool throughout the period of record and during a 1930s-type drought.
GDU Import Pipeline Alternative This alternative would maintain reservoir elevations above the Fish and Wildlife Conservation Pool throughout the period of record and during a 1930s-type
4 - 106

Red River Valley Water Supply Project FEIS Chapter Four Environmental Impacts
drought. Lake Ashtabula would be very low for 19 months during the period of record with 18 of these occurring during a 1930s-type drought.
Missouri River Import to Red River Valley Alternative Lake Ashtabula would be very low for 13 months during the period of record, and 12 of these months would be during a 1930s-type drought. Reservoir elevations would remain above the Fish and Wildlife Conservation Pool throughout the period of record and during a 1930s-type drought.
Sheyenne River Fisheries No Action Alternative No Action fish habitat is less than aquatic needs habitat at all sites most of the time in the Sheyenne River. This suggests that No Action does not provide the highest diversity of habitat conditions in the Sheyenne River. Low summer, fall, and winter 10th percentile flows under No Action would likely have a very negative affect on the fish community.
North Dakota In-Basin Alternative Habitat scores show mostly increased fish habitat with North Dakota In-Basin Alternative compared to No Action, with greatest increases occurring at the 10th percentile flow level at all Sheyenne River sites (tables 4.31 - 4.33). The improved habitat is attributable to higher releases from Baldhill Dam during a 1930s-type drought to meet downstream demands. The only decrease in habitat occurs at the 50th percentile flow at Norman (table 4.33).
Red River Basin Alternative This alternative shows habitat loss compared to No Action at the 50th percentile flow level and slight gains at the 10th percentile level at all Sheyenne River sites (tables 4.31 - 4.33).
GDU Import to Sheyenne River Alternative Overall, this alternative shows increased fish habitat compared to No Action, particularly at the 10th percentile flow level (tables 4.31 - 4.33). In fact, this alternative shows the greatest improvement in habitat among all alternatives at all Sheyenne River sites (tables 4.31 - 4.33). This is the result of increased flows in the lower Sheyenne River to meet downstream demands during normally low flow periods (e.g., late summer) and North Dakota Game and Fish Department aquatic needs flow recommendations.
GDU Import Pipeline Alternative This alternative when compared to No Action would have minimal seasonal effects on Sheyenne River fish habitat. Fish habitat scores show losses occurring at the 50th percentile flow and moderate gains at the 10th percentile flow at all Sheyenne River sites (tables 4.31 - 4.33).
Missouri River Import to Red River Valley Alternative Habitat scores under this alternative show moderate improvement in fish habitat at the 10th percentile level and habitat losses at the 50th percentile level compared to No Action at all Sheyenne River sites (tables 4.31 - 4.33).
4 - 107

Red River Valley Water Supply Project FEIS Chapter Four Environmental Impacts
Mussels No Action Alternative Creeper habitat is generally positively correlated with flow at all Sheyenne River sites at both the 10th and 50th percentile flows. Under No Action low summer, fall, and winter 10th percentile flows would likely have a very negative effect on mussel habitat.
Table 4.31 – Summary of Action Alternative Fish Habitat Scores at Lisbon on the Sheyenne River Compared to No Action.
Lisbon Site Summary of Scores1
Alternative 50th Percentile Flow
Moderate Flow 10th Percentile Flow
Low Flow
North Dakota In-Basin 60 146
Red River Basin -17 76
GDU Import to Sheyenne River 105 343
GDU Import Pipeline -9 72
Missouri River Import to Red River Valley -11 49 1. A positive score represents improvement in habitat and a negative score indicates an adverse effect.
Table 4.32 – Summary of Action Alternative Fish Habitat Scores at Pigeon Point on the Sheyenne River Compared to No Action.
Pigeon Point Site Summary of Scores1
Alternative 50th percentile flow
Moderate Flow 10th percentile flow
Low Flow
North Dakota In-Basin 21 262
Red River Basin -8 87
GDU Import to Sheyenne River 164 402
GDU Import Pipeline -21 45
Missouri River Import to Red River Valley -34 42 1. A positive score represents improvement in habitat and a negative score indicates an adverse effect.
Table 4.33 – Summary of Action Alternative Fish Habitat Scores at Norman on the Sheyenne River Compared to No Action.
Norman Site Summary of Scores1
Alternative 50th percentile flow
Moderate Flow 10th percentile flow
Low Flow
North Dakota In-Basin -3 139
Red River Basin -5 41
GDU Import to Sheyenne River 109 252
GDU Import Pipeline -3 24
Missouri River Import to Red River Valley -3 22 1. A positive score represents improvement in habitat and a negative score indicates an adverse effect.
North Dakota In-Basin Alternative This alternative would generally increase mussel habitat compared to No Action, particularly at the 10th percentile flow level.
4 - 108

Red River Valley Water Supply Project FEIS Chapter Four Environmental Impacts
Red River Basin Alternative Compared to No Action, mussel habitat would be moderately decreased at the 50th percentile flow level and slightly to moderately increased at the 10th percentile level at all sites (tables 4.34 - 4.36).
Table 4.34 – Summary of Action Alternative Mussel Habitat Scores at Lisbon on the Sheyenne River Compared to No Action.
Lisbon Site Summary of Scores1
Alternative 50th percentile flow
Moderate Flow 10th percentile flow
Low Flow
North Dakota In-Basin 88 96
Red River Basin -21 3
GDU Import to Sheyenne River 141 226
GDU Import Pipeline -23 -10
Missouri River Import to Red River Valley -25 -10 1. A positive score represents improvement in habitat and a negative score indicates an adverse effect.
Table 4.35 – Summary of Action Alternative Mussel Habitat Scores at Pigeon Point on the Sheyenne River Compared to No Action.
Norman Site Summary of Scores1
Alternative 50th percentile flow
Moderate Flow 10th percentile flow
Low Flow
North Dakota In-Basin 66 144
Red River Basin -38 23
GDU Import to Sheyenne River 139 234
GDU Import Pipeline -41 0
Missouri River Import to Red River Valley -44 1 1. A positive score represents improvement in habitat and a negative score indicates an adverse effect.
Table 4.36 – Summary of Action Alternative Mussel Habitat Scores at Norman on the Sheyenne River Compared to No Action.
Norman Summary of Scores1
Alternative 50th percentile flow
Moderate Flow 10th percentile flow
Low Flow
North Dakota In-Basin 52 137
Red River Basin -31 26
GDU Import to Sheyenne River 124 231
GDU Import Pipeline -32 0
Missouri River Import to Red River Valley -36 1 1. A positive score represents improvement in habitat and a negative score indicates an adverse effect.
GDU Import to Sheyenne River Alternative There would be major improvement in mussel habitat, particularly at the 10th percentile flow level. Habitat scores show overall increased mussel habitat with this alternative compared to No Action (tables 4.34 - 4.36). This alternative shows the greatest improvement in habitat among alternatives at all Sheyenne River sites. As
4 - 109

Red River Valley Water Supply Project FEIS Chapter Four Environmental Impacts
stated previously, mussel habitat in the Sheyenne River is positively correlated with flow, and the GDU Import to Sheyenne River Alternative generally increases flows in the Sheyenne River.
GDU Import Pipeline Alternative Compared to No Action, habitat scores show mostly decreased mussel habitat, except for no change at the 10th percentile flow level at Pigeon Point and Norman (tables 4.34 - 4.36).
Missouri River Import to Red River Valley Alternative Habitat scores under this alternative generally show overall decreased habitat conditions for mussels at all sites and flow levels except minimal improvement at the 10th percentile flow at Pigeon Point and Norman (tables 4.34 - 4.36).
Red River Fisheries No Action Alternative Habitat for No Action was compared to aquatic needs flows to determine how well the No Action Alternative balances the needs of the entire riverine community, as defined by aquatic needs flows and habitat. In general, No Action fish habitat for displayed guild representatives is less than aquatic needs habitat in the Red River. This suggests that the No Action alternative does not provide the highest diversity of habitat conditions in the Red River. Extremely low summer, fall, and winter 10th percentile flows under No Action would likely have a very negative effect on the fish community, particularly at the Moorhead Site.
North Dakota In-Basin Alternative Habitat conditions for all fish species would improve at Moorhead under this alternative, particularly at the 50th percentile flow (table 4.37). Negative habitat scores at Frog Point are the result of habitat loss during the April-May spawning season (table 4.38). Lake sturgeon habitat increases slightly at all flow levels except a minor decrease at the 50th percentile flow at Frog Point due to habitat loss during the spawning season (May-June) (tables 4.37 and 4.40).
Red River Basin Alternative Since flows at Moorhead for this alternative are the same as the North Dakota In-Basin Alternative, impacts on fish habitat are the same (table 4.37). Positive habitat conditions for all fish species occur at Moorhead, particularly at the 50th percentile flow (table 4.37). The negative habitat score at Frog Point (table 4.38) is the result of habitat loss during the April-May spawning season. Lake sturgeon habitat increases slightly at all flow levels except a minor decrease at the 50th percentile flow at Frog Point due to habitat loss during the spawning season (May-June) (tables 4.39 and 4.40).
Lake Sturgeon (Photo courtesy of U.S. Fish and Wildlife Service Digital Library System).
4 - 110

Red River Valley Water Supply Project FEIS Chapter Four Environmental Impacts
4.37 – Summary of Action Alternative Fish Habitat Scores at Moorhead on the Red River Compared to No Action.
Moorhead Site Summary of Scores1
Alternative 50th percentile flow
Moderate Flow 10th percentile flow
Low Flow
North Dakota In-Basin 43 2
Red River Basin 43 2
GDU Import to Sheyenne River 43 378
GDU Import Pipeline 128 273
Missouri River Import to Red River Valley 0 -2 1. A positive score represents improvement in habitat and a negative score indicates an adverse effect.
Table 4.38 – Summary of Action Alternative Fish Habitat Scores at Frog Point on the Red River Compared to No Action.
Frog Point Site Summary of Scores1
Alternative 50th percentile flow
Moderate Flow 10th percentile flow
Low Flow
North Dakota In-Basin -2 -10
Red River Basin -8 6
GDU Import to Sheyenne River 6 150
GDU Import Pipeline 69 72
Missouri River Import to Red River Valley -6 20 1. A positive score represents improvement in habitat and a negative score indicates an adverse effect.
Table 4.39 – Summary of Action Alternative Lake Sturgeon Habitat Scores at Moorhead on the Red River Compared to No Action.
Moorhead Site Summary of Scores1
Alternative 50th percentile flow
Moderate Flow 10th percentile flow
Low Flow
North Dakota In-Basin 4 8
Red River Basin 4 8
GDU Import to Sheyenne River 4 30
GDU Import Pipeline 17 27
Missouri River Import to Red River Valley -1 -1 1. A positive score represents improvement in habitat and a negative score indicates an adverse effect.
GDU Import to Sheyenne River Alternative Since flows at Moorhead for this alternative are the same as the North Dakota In-Basin alternative at the 50th percentile flow, impacts on fish habitat are the same (table 4.37). Positive habitat conditions for all fish species occur at Moorhead and Frog Point, particularly at the 10th percentile flow where this alternative shows the most habitat improvement among alternatives (tables 4.37 and 4.38). Lake sturgeon show similar effects with most habitat improvement at the 10th percentile flow level at both locations (tables 4.39 and 4.40).
4 - 111

Red River Valley Water Supply Project FEIS Chapter Four Environmental Impacts
Table 4.40 – Summary of Action Alternative Lake Sturgeon Habitat Scores at Frog Point on the Red River Compared to No Action.
Frog Point Site Summary of Scores1
Alternative 50th percentile flow
Moderate Flow 10th percentile flow
Low Flow
North Dakota In-Basin -4 2
Red River Basin -4 1
GDU Import to Sheyenne River 1 20
GDU Import Pipeline 5 8
Missouri River Import to Red River Valley 0 1 1. A positive score represents improvement in habitat and a negative score indicates an adverse effect.
GDU Import Pipeline Alternative Fish habitat is better with this alternative compared to No Action. Habitat scores show greatest improvement in fish habitat with this alternative among other alternatives compared to No Action at the 50-percentile flow at Moorhead and Frog Point (tables 4.37 and 4.38). Lake sturgeon habitat also increases, with most improvement occurring at Moorhead (tables 4.39 and 4.40).
Missouri River Import to Red River Valley Alternative This alternative would have little impact on fish habitat in the Red River. Habitat scores show mostly no effect on habitat for fish, including lake sturgeon except moderate improvement in fish habitat at the 10th percentile flow at Frog Point (tables 4.37 - 4.40).
Mussels No Action Alternative Creeper habitat is generally positively correlated with flow at the Moorhead Site at the 10th and 50th percentile flows and at Frog Point at the 10th percentile flow, but higher flows (50th percentile) at Frog Point show a negative correlation with habitat (tables 4.39 and 4.40). Extremely low summer, fall, and winter 10th percentile flows under No Action would likely have a very negative effect on mussels, particularly at the Moorhead Site.
Creeper Mussel (Photo from: The National Park Service – Mississippi National River and Recreation Area).
North Dakota In-Basin Alternative Since North Dakota In-Basin flows are generally higher than No Action flows, habitat conditions for mussels would also be higher (tables 4.41 and 4.42).
Red River Basin Alternative Impacts at Moorhead would be the same as the North Dakota In-Basin Alternative because flows are the same. Overall habitat is improved for mussels with the Red River Basin Alternative compared to No Action (tables 4.41 and 4.42).
The Three Missouri River Import Alternatives Seasonal mussel habitat in the Red River would be improved over No Action under of the GDU Import to Sheyenne River, GDU Import Pipeline, and Missouri River Import to Red River Valley Alternatives (tables 4.41 and 4.42). These alternatives would generally decrease withdrawals from the Red River, leaving more of
4 - 112

Red River Valley Water Supply Project FEIS Chapter Four Environmental Impacts
the natural flow. Greatest improvements would occur with the GDU Import to Sheyenne River and GDU Import Pipeline Alternatives.
Table 4.41 – Summary of Action Alternative Mussel Habitat Scores at Moorhead on the Red River Compared to No Action.
Moorhead Site Summary of Scores1
Alternative 50th percentile flow
Moderate Flow 10th percentile flow
Low Flow
North Dakota In-Basin 106 51
Red River Basin 106 51
GDU Import to Sheyenne River 106 195
GDU Import Pipeline 124 126
Missouri River Import to Red River Valley 0 6 1. A positive score represents improvement in habitat and a negative score indicates an adverse effect.
Table 4.42 – Summary of Action Alternative Mussel Habitat Scores at Frog Point on the Red River Compared to No Action.
Frog Point Site Summary of Scores1
Alternative 50th percentile flow
Moderate Flow 10th percentile flow
Low Flow
North Dakota In-Basin 41 119
Red River Basin 31 164
GDU Import to Sheyenne River 15 203
GDU Import Pipeline 94 194
Missouri River Import to Red River Valley 4 158 1. A positive score represents improvement in habitat and a negative score indicates an adverse effect.
Missouri River Basin Fisheries The Corps analysis of the effects of the proposed Project on Missouri River Basin resources evaluated five fisheries categories (Corps 2007). Table 4.43 shows the five categories organized by reservoirs or river reaches.
Table 4.43 – Fisheries Analyzed in Corps Missouri River Depletion Effects Study (Corps 2007).
Fishery Categories Reservoirs or Reaches of Missouri River Analyzed
Reservoir Coldwater Fish Habitat Fort Peck Lake, Lake Sakakawea, Lake Oahe Riverine Coldwater Fish Habitat Downstream from: Fort Peck Dam, Garrison Dam Riverine Warmwater Fish Habitat Downstream from: Fort Peck Dam, Garrison Dam, Fort Randall Dam
Young Fish Production Fort Peck Lake, Lake Sakakawea, Lake Oahe, Lake Sharpe, Lake Francis Case, Lewis and Clark Lake
Native River Fish Physical Habitat Upper River (Mainstem Reservoir System) Lower River
Table 4.44 compares fisheries effects from the three Missouri River import alternatives to the No Action Alternative during the critical drought period of 1930-1941. The existing condition is also shown as a comparison to No Action. The units in these categories vary depending on the type of economic use and environmental resources. Table 4.45 shows a similar comparison, except the results are from a longer period 1930-2002.
4 - 113

Red River Valley Water Supply Project FEIS Chapter Four Environmental Impacts
Table 4.44 – Comparison of Three Missouri River Import Alternatives to the No Action Alternative (1930-1941) During a 1930s-type Drought.
Use/Resource Current
Condition No
Action GDU Import to
Sheyenne River
GDU Import
Pipeline
Missouri River Import to Red River Valley
Reservoir Coldwater Fish Habitat (average annual habitat in MAF) 4.60 5.25 5.07 5.12 5.10
Riverine Coldwater Fish Habitat (average annual habitat in miles) 149.65 152.04 151.36 151.49 151.29
Riverine Warmwater Fish Habitat (average annual habitat in miles) 73.07 71.20 73.21 71.84 72.34
Reservoir Young Fish Production (average annual production as an index)
1.45 1.51 1.51 1.51 1.51
Native River Fish Physical Habitat (average habitat as an index)
81.22 81.01 81.00 81.01 81.00
Table 4.45 – Comparison of Three Missouri River Import Alternatives to the No Action Alternative (1930-2002).
Use/Resource Current
Condition No
Action
GDU Import to Sheyenne
River
GDU Import
Pipeline
Missouri River Import to Red River Valley
Reservoir Coldwater Fish Habitat (average annual habitat in MAF)
9.85 10.27 10.21 10.23 10.22
Riverine Coldwater Fish Habitat (average annual habitat in miles) 184.27 185.81 185.19 185.99 185.74
Riverine Warmwater Fish Habitat (average annual habitat in miles)
50.89 49.77 50.80 49.58 49.96
Reservoir Young Fish Production (average annual production as an index)
2.11 2.14 2.14 2.14 2.14
Native River Fish Physical Habitat (average habitat as an index)
81.16 81.28 81.30 81.29 81.28
Tables 4.44 (for 1930-1941) and 4.45 (for 1930-2002) compare the three Missouri River import alternatives to the No Action Alternative using the percentage change from No Action as a metric. The Corps analysis found that, in general, most of the effects of water withdrawals from the Project were relatively small, because the projected volume of water withdrawn was small.
Tables 4.46 (for 1930-1941) and 4.47 (for 1930-2002) compare the Missouri River import alternatives to No Action. The tables show the No Action average annual value plus the percentage change compared to No Action for each Missouri River import alternative.
4 - 114

Red River Valley Water Supply Project FEIS Chapter Four Environmental Impacts
Table 4.46 – Comparison of Three Missouri River Import Alternatives to the No Action Alternative (1930- 1941).
No Action
GDU Import
Pipeline
GDU Import to Sheyenne
River
Missouri River Import to Red River Valley
Missouri River Water Uses & Resources
Average Annual Value1
Percent Change from No Action Value
Reservoir Coldwater Fish Habitat 5.25 -2 -3 -3 Riverine Coldwater Fish Habitat 152.0 0 0 0 Riverine Warmwater Fish Habitat 71.2 1 3 2 Young Fish Production 1.51 0 0 0 Native River Fish Physical Habitat 81.0 0 0 0 1 Units vary among the various economic use and environmental resource categories. Table reproduced from table 22 from the Red River Valley Water Supply Project, Analysis of Missouri River Effects, Corps 2007
Table 4.47 – Comparison of Three Missouri River Import Alternatives to the No Action Alternative (1930-2002).
No Action
GDU Import
Pipeline
GDU Import to Sheyenne
River
Missouri River Import to Red River Valley
Missouri River Water Uses & Resources
Average Annual Value1
Percent Change from No Action Value
Reservoir Coldwater Fish Habitat 10.3 0 -1 0
Riverine Coldwater Fish Habitat 185.8 0 0 0
Riverine Warmwater Fish Habitat 49.8 0 2 0
Young Fish Production 2.14 0 0 0
Native River Fish Physical Habitat 81.3 0 0 0 1 Units vary among the various economic use and environmental resource categories. Table reproduced from table 24 from the Red River Valley Water Supply Project, Analysis of Missouri River Effects, Corps 2007
No Action Alternative Tables 4.44 and 4.45 show differences between the resource values for the five current and No Action fisheries categories under both modeling periods: 1930-1941 and 1930-2002. The comparison of current conditions to No Action as a percentage is in tables 23 (1930-1941) and 25 (1930-2002) of the Corps report (2007). Modeling results show a positive 14% change during a 1930s-type drought and a positive 4% change during the period of record for reservoir coldwater fisheries. A positive increase (2 - 4 % respectively) during drought and the period of record (1 - 2% respectively) is expected in riverine coldwater fish habitat and young fish production. A minor decline in riverine warmwater fish habitat during a 1930s-type drought and the period of record (-3% to -2% respectively) is anticipated. Minor changes in native river fish physical habitat of less than 1% during drought and the period of record are predicted.
North Dakota In-Basin Alternative This alternative would not withdraw water from the Missouri River, so these would not impact Missouri River Basin fisheries.
Red River Basin Alternative This alternative would not withdraw water from the Missouri River, so these would not impact Missouri River Basin fisheries.
4 - 115

Red River Valley Water Supply Project FEIS Chapter Four Environmental Impacts
GDU Import to Sheyenne River Alternative The alternative would minimally impact Missouri River Basin fisheries. Comparison between No Action and the alternative shows only slight impacts of 3% or less as shown in tables 4.46 and 4.47. This alternative includes both modeling periods of 1930-1941 and 1930-2002.
McClusky Canal Would Be Similar to Audubon Lake in Water Quality with Operation of the Import Alternatives
GDU Import Pipeline Alternative The alternative would minimally impact Missouri River Basin fisheries. Comparison between No Action and the alternative shows only slight impacts of 2% or less as shown in tables 4.46 and 4.47. This includes both modeling periods of 1930-1941 and 1930-2002.
Missouri River Import to Red River Valley Alternative The alternative would minimally impact Missouri River Basin fisheries. Comparison between No Action and the alternative shows only slight impacts of 3% or less as shown in tables 4.46 and 4.47. This includes both modeling periods of 1930-1941 and 1930-2002.
Audubon Lake, McClusky Canal, and Chain of Lakes No Action Under No Action, there would be no change in operations of the GDU Principal Supply Works. Reclamation would maintain the freshening program for Audubon Lake and the McClusky Canal downstream to New Johns Lake. Downstream from New Johns Lake water is essentially stagnant and would remain so under No Action. Aquatic habitat would be similar in the future to current conditions.
North Dakota In-Basin Alternative This alternative would not affect the GDU Principal Supply Works. Factors that affect the aquatic community, including physical habitat and water quality, would be the same as No Action.
Red River Basin Alternative This alternative would not affect the GDU Principal Supply Works. Factors that affect the aquatic community, including physical habitat and water quality, would be the same as No Action.
GDU Import to Sheyenne River Alternative Missouri River import alternatives that would use the GDU Principal Supply Works would alter flows and water quality through the system. Water levels and physical habitat would not change. In Audubon Lake, changes in water quality would be minor and would have little effect on the lake’s productivity. Additional water from Lake Sakakawea could slightly decrease water temperature, particularly near the Snake Creek Pumping Plant. Overall, the aquatic community in Audubon Lake would be similar to No Action under all the GDU import alternatives. With Project operation, water quality in the McClusky Canal and Chain of Lakes would approach that in Audubon Lake. Decreased concentrations of conservative and nonconservative substances (see “water quality” section)
4 - 116

Red River Valley Water Supply Project FEIS Chapter Four Environmental Impacts
could change productivity and shift the community to favor organisms that prefer fresher water. These changes would be most noticeable downstream of New Johns Lake, where the water essentially is stagnant.
GDU Import Pipeline Alternative Missouri River import alternatives that would use the GDU Principal Supply Works would alter flows and water quality through the system. Water levels and physical habitat would not change. In Audubon Lake, changes in water quality would be minor and would have little effect on the lake’s productivity. Additional water from Lake Sakakawea could slightly decrease water temperature, particularly near the Snake Creek Pumping Plant. Overall, the aquatic community in Audubon Lake would be similar to No Action under all the GDU import alternatives. With Project operation, water quality in the McClusky Canal and Chain of Lakes would approach that in Audubon Lake. Decreased concentrations of conservative and nonconservative substances (see water quality section) could change the productivity and shift the community to favor organisms that prefer fresher water. These changes would be most noticeable downstream of New Johns Lake, where the water essentially is stagnant.
Missouri River Import to the Red River Valley Alternative This alternative would not affect the GDU Principal Supply Works, and thus, would have the same impacts as No Action.
Analysis of the State of North Dakota’s Aquatic Flow Recommendations The aquatic environment needs section of chapter one discusses the need to maintain reservoir levels and river flows in the Sheyenne and Red Rivers. Opportunities to meet basic aquatic needs were incorporated into alternatives during hydrologic modeling, including a minimum fish and wildlife conservation pool of 28,000 acre-feet in Lake Ashtabula and maintaining a minimum release of 13 cfs from Baldhill Dam.
With the exception of the No Action Alternative, all alternatives maintain this basic aquatic need all of the time. However, results from modeling the No Action Alternative during a 1930s-type drought show that both the minimum 13 cfs release from Baldhill Dam and the maintaining 28,000 ac-ft in Lake Ashtabula were compromised. The 13 cfs release is only met 51% of the time during a 1930s-type drought and 67% of the time over the 71-year period of record modeled. The 28,000 ac-ft fish and wildlife conservation pool was only maintained 31% of the time during a 1930s-type drought and 90% of the time over the 71-year period of record modeled.
During the DEIS comment period the North Dakota Game and Fish Department reiterated specific recommendations for aquatic needs based on instream flows. The recommended targets are discussed in chapters one and three, “aquatic needs” section, and are listed in tables 4.48 and 4.49.
Channel Catfish (photograph courtesy of the Service)
4 - 117

Red River Valley Water Supply Project FEIS Chapter Four Environmental Impacts
Table 4.48 – Amount of Time Alternatives Met the North Dakota Game and Fish Department Aquatic Needs Recommendations Through 1931 to 2001.
Recommendation One
Recommendation Two
Recommendation Three
Recommendation Four
Recommendation Five
Months % Months % Months % Months % Months % No Action 501 59 47 66 47 66 631 74 708 83 North Dakota In-Basin
591 69 50 70 52 73 664 78 731 86
Red River Basin 491 58 50 70 50 70 664 78 745 87
GDU Import to Sheyenne River
852 100 71 100 71 100 749 88 852 100
GDU Import Pipeline
489 57 50 70 50 70 715 84 774 91
Missouri River Import to Red River Valley
485 57 50 70 50 70 641 75 771 90
#1 – Minimum release 23 cfs from Baldhill Dam year round. #2 – Minimum spring flush 215 cfs for a period of 48-72 hours from April 6-10. #3 – April flows average minimum 69 cfs below Baldhill Dam. #4 – Year-round instream flows 68 cfs at Fargo on Red River. #5 – Year-round instream flows 23 cfs below Fargo intake on Sheyenne River.
Table 4.49 – Meeting the North Dakota Game and Fish Aquatic Needs Recommendations During 1930s-Type Drought.
Recommendation One
Recommendation Two
Recommendation Three
Recommendation Four
Recommendation Five
Months % Months % Months % Months % Months % No Action 46 38 0 0 0 0 15 13 46 38 North Dakota In-Basin
91 76 2 20 2 20 16 13 48 40
Red River Basin 38 32 2 20 2 20 16 13 59 49
GDU Import to Sheyenne River
120 100 10 100 10 100 40 33 120 100
GDU Import Pipeline
37 31 2 20 2 20 20 17 75 63
Missouri River Import to Red River Valley
20 17 2 20 2 20 15 13 71 59
#1 – Minimum release 23 cfs from Baldhill Dam year round. #2 – Minimum spring flush 215 cfs for a period of 48-72 hours from April 6-10. #3 – April flows average minimum 69 cfs below Baldhill Dam. #4 – Year-round instream flows 68 cfs at Fargo on Red River. #5 – Year-round instream flows 23 cfs below Fargo intake on Sheyenne River.
Recommendations one, two, three, and five were incorporated into the GDU Import to the Sheyenne River Alternative (see table 4.48). However, since there were no features planned to supplement flows on the Red River, recommendation four was modified to be a minimum target.
4 - 118

Red River Valley Water Supply Project FEIS Chapter Four Environmental Impacts
All permits drawing water from the Red River upstream from Fargo’s intake were turned off in the model and forced to use secondary water supplies when the flow at the intake fell below 68 cfs.
An analysis was performed to determine how many times each of the alternatives was able to meet the recommendations presented by the North Dakota Game and Fish Department. The results for the entire period of record, 1931 through 2001, appear in table 4.48, and the results for the period similar to the 1930s-type drought are shown in table 4.49.
No Action Alternative The North Dakota Game and Fish Department recommendation one is met 59% of the time and recommendations two and three are met 66% of the time under the No Action for the period of record (table 4.48). Recommendations four and five are met 74% and 83% of the time for the period of record (table 4.48). During a 1930s-type drought (table 4.49), the No Action Alternative never meets minimum spring flows or high spring release recommendations. Recommendations one and five are met 38% of the time during a 1930s-type drought, while the Red River flows are met 13% of the time.
North Dakota In-Basin Alternative North Dakota Game and Fish Department recommendations two and three are met 70% and 73% of the time during the period of record and 20% of the time during a 1930s-type drought. Minimum flow recommendations on the Sheyenne River below Baldhill Dam are met 69% of the time during the period of record and 76% of the time during a 1930s-type drought. Minimum flow recommendations on the Sheyenne River below the Fargo intake are met 87% of the time during the period of record and 49% of the time during a 1930s-type drought. Flow recommendations on the Red River are met 78% of the time during the period of record and 13% during a 1930s-type drought.
Red River Basin Alternative Spring flow recommendations are met 70% of the time during the period of record and 20% of the time during a 1930s-type drought. Minimum flow recommendations on the Sheyenne below Baldhill Dam are met 58% of the time during the period of record and 32% of the time during a 1930s-type drought. Minimum flow recommendations on the Sheyenne River below the Fargo intake are met 86% of the time during the period of record and 40% of the time during a 1930s-type drought. Flow recommendations on the Red River are met 78% of the time during the period of record and 13% during a 1930s-type drought.
GDU Import to the Sheyenne River Alternative This alternative meets 100% of the North Dakota Game and Fish Department recommendations except on the Red River. However, it meets the Red River
Mussels (photograph courtesy of the Service)
4 - 119

Red River Valley Water Supply Project FEIS Chapter Four Environmental Impacts
recommendations 88% of the time during the period of record and 33% of the time during a 1930s-type drought. Of all of the alternatives, this is the most successful in meeting the aquatic needs recommendations.
GDU Import Pipeline Alternative Spring flow recommendations are met 70% of the time during the period of record and 20% of the time during a 1930s-type drought. Minimum flow recommendations on the Sheyenne below Baldhill Dam are met 57% of the time during the period of record and 31% of the time during a 1930s-type drought. Minimum flow recommendations on the Sheyenne River below the Fargo intake are met 91% of the time during the period of record and 63% of the time during a 1930s-type drought. Flow recommendations on the Red River are met 84% of the time during the period of record and 17% during a 1930s-type drought. This alternative ranks second in meeting North Dakota Game and Fish Department’s recommendations.
Missouri River Import to the Red River Valley Alternative Spring flow recommendations are met 70% of the time during the period of record and 20% of the time during a 1930s-type drought. Minimum flow recommendations on the Sheyenne below Baldhill Dam are met 57% of the time during the period of record and 17% of the time during a 1930s-style drought. Minimum flow recommendations on the Sheyenne River below the Fargo intake are met 90% of the time during the period of record and 59% of the time during 1930s-style drought. Flow recommendations on the Red River are met 75% of the time during the period of record and 13% during 1930s-style drought.
Summary
No Action Alternative Lake Ashtabula elevations dropped below the Fish and Wildlife Conservation Pool for 90 months during the 71-year period of record. Almost all of these instances occurred during a 1930s-type drought. These extremely low water levels during a 1930s-type drought would severely impact the aquatic community and there would be a high probability of a fish kill caused by low dissolved oxygen levels.
The No Action Alternative does not meet the aquatic needs habitat for fish or mussels on the Sheyenne and Red Rivers. Extremely low and low flows during summer, fall, and winter would adversely affect aquatic communities on both rivers, especially during a 1930s-type drought.
For the Missouri River differences between the resource values for the five current and No Action fisheries categories are apparent for both modeling periods: 1930 - 1941 and 1930 - 2002. Changes to reservoir coldwater fisheries would be positive during a 1930s-type drought and the period of record. This also would be true for riverine coldwater fish habitat and young fish production during a drought and the period of record. A small decline in riverine warmwater fish habitat is expected during a 1930s-type drought and the period of record.
Under No Action, there would be no change in operations of the GDU Principal Supply Works. Reclamation would maintain the freshening program for Audubon Lake and the McClusky Canal downstream to New Johns Lake. Water is stagnant downstream from New Johns Lake
4 - 120

Red River Valley Water Supply Project FEIS Chapter Four Environmental Impacts
and would remain so under No Action. Aquatic habitat in the future would be similar to current conditions.
All North Dakota Game and Fish aquatic needs recommendations are met more than 50% of the time during the period of record. However, during a 1930s-type drought, the No Action Alternative never meets minimum spring flows or high spring release recommendations. Other recommendations are minimally met 13-38% of the time during a 1930s-type drought.
North Dakota In-Basin Alternative Lake Ashtabula would be very low for 13 months and never below the Fish and Wildlife Conservation Pool during the 71-year period of record or during a 1930s-type drought.
Habitat scores for the Sheyenne River show mostly increased fish and mussel habitat with this alternative compared to No Action, particularly at the 10th percentile flow level. Overall, this alternative showed moderate gains and losses for fish and mussel habitats in the Red River. The Lake sturgeon habitat slightly increases at all flow levels except at 50th percentile flows at Frog Point where habitat losses are experienced during the spawning season
This alternative would not withdraw water from the Missouri River, so it would not impact Missouri River Basin fisheries. This alternative would meet the North Dakota Game and Fish aquatic needs recommendations about the same as No Action, Red River Basin, GDU Import Pipeline, and Missouri River Import to Red River alternatives for the Sheyenne and Red Rivers during the period of record. However, during a 1930s-type drought, the North Dakota In-Basin Alternative minimally meets recommendations, 20% of time on the Sheyenne and 13%-40% of the time on the Red River with the exception of year-round minimum releases from Baldhill Dam that are met 76% of the time.
Red River Basin Alternative Elevations of Lake Ashtabula would be above the Fish and Wildlife Conservation Pool throughout the period of record, but the reservoir level would be very low 16 months out of the 71-year period of record.
This alternative shows fish habitat loss compared to No Action at the 50th percentile flow level and slight gains at the 10th percentile level at all Sheyenne River sites. Compared to No Action, Sheyenne River mussel habitat would be moderately decreased at the 50th percentile flow level and slightly to moderately increased at the 10th percentile level at all sites.
Overall, the Red River Basin Alternative is similar to the North Dakota In-Basin Alternative with moderate gains and losses for fish and mussel habitats in the Red River. The Lake sturgeon habitat is also the same with slight increases at all flow levels except at 50th percentile flows at Frog Point where habitat losses are experienced during the spawning season.
This alternative would not withdraw water from the Missouri River, so it would not impact Missouri River Basin fisheries. This alternative would meet the North Dakota Game and Fish aquatic needs recommendations about the same as the No Action, North Dakota In-Basin, GDU Import Pipeline, and Missouri River Import to Red River Alternatives for the Sheyenne and Red
4 - 121

Red River Valley Water Supply Project FEIS Chapter Four Environmental Impacts
Rivers during the period of record. However, during a 1930s-type drought, the Red River Basin Alternative minimally meets recommendations 20-32% of time on the Sheyenne and 13-49% of the time on the Red River.
GDU Import to the Sheyenne River Alternative Lake Ashtabula would be very low for 37 months during the period of record and 36 of these months would be during a 1930s-type drought. Reservoir elevations would remain above the Fish and Wildlife Conservation Pool throughout the period of record and during a 1930s-type drought. Overall, this alternative shows increased fish and mussel habitat compared to No Action, particularly at the 10th percentile flow level and shows the greatest improvement in fish and mussel habitat among all alternatives at all Sheyenne River sites.
On the Red River, flows at Moorhead for this alternative are the same as the North Dakota In-Basin alternative at the 50th percentile flow. Therefore, impacts on fish habitat are the same. Positive habitat conditions for all fish species occur at Moorhead and Frog Point, particularly at the 10th percentile flow where this alternative shows the most habitat improvement among alternatives. Lake sturgeon show similar effects with most habitat improvement at the 10th percentile flow level at both locations. Seasonal mussel habitat in the Red River would be improved over No Action under this alternative.
There would be minimal impact to Missouri River Basin fisheries for this alternative. Comparison between No Action and this alternative shows only slightly positive and negative impacts of 3% or less. This includes both modeling periods of 1930-1941 and 1930-2002. Minimal changes to aquatic communities are expected at Audubon Lake, McClusky Canal, and Chain of Lakes.
This alternative meets all but one of the North Dakota Game and Fish Department’s aquatic need recommendations 100% of the time during the 1930s type drought and period of record. The exception is the year round instream flow goals at Fargo on the Red River that are met 33% of the time during a 1930s-type drought and 88% of the time during the period of record.
GDU Import Pipeline Alternative Lake Ashtabula would maintain elevations above the Fish and Wildlife Conservation Pool throughout the period of record and during a 1930s-type drought. Lake Ashtabula would be very low for 19 months during the period of record with 18 of these occurring during a 1930s-type drought.
When compared to No Action, this alternative would have minimal seasonal effects on Sheyenne River fish habitat. Fish habitat scores show losses occurring at the 50th percentile flow and moderate gains at the 10th percentile flow at all Sheyenne River sites. Compared to No Action, Sheyenne River habitat scores show mostly decreased mussel habitat, except for no change at the 10th percentile flow level at Pigeon Point and Norman.
On the Red River, fish habitat is better with this alternative compared to No Action. Habitat scores show greatest improvement in fish habitat with this alternative among other alternatives compared to No Action at the 50-percentile flow at Moorhead and Frog Point. Lake sturgeon
4 - 122

Red River Valley Water Supply Project FEIS Chapter Four Environmental Impacts
habitat also increases, with most improvement occurring at Moorhead. Seasonal mussel habitat in the Red River would be improved over No Action under GDU Import Pipeline.
There would be minimal impact to Missouri River Basin fisheries for this alternative. Comparison between No Action and this alternative shows only slightly positive and negative impacts of 2% or less. This includes both modeling periods of 1930-1941 and 1930-2002. Minimal changes to aquatic communities are expected at Audubon Lake, McClusky Canal, and Chain of Lakes.
This alternative would meet the North Dakota Game and Fish aquatic needs recommendations about the same as the No Action, both In-Basin, GDU Import Pipeline, and Missouri River Import to Red River Alternatives for the Sheyenne and Red Rivers during the period of record. However, during a 1930s-type drought, the GDU Pipeline Alternative minimally meets recommendations, 20-31% of the time on the Sheyenne and 17-63% of the time on the Red River.
Missouri River Import to the Red River Valley Alternative Lake Ashtabula would be very low for 13 months during the period of record, and 12 of these months would be during a 1930s-type drought. Reservoir elevations would remain above the Fish and Wildlife Conservation Pool throughout the period of record and during a 1930s-type drought
Habitat scores under this alternative show moderate improvement in fish habitat at the 10th percentile level and habitat losses at the 50th percentile level compared to No Action at all Sheyenne River sites. Habitat scores on the Sheyenne River under this alternative generally show overall decreased habitat conditions for mussels at all sites and flow levels except minimal improvement at the 10th percentile flow at Pigeon Point and Norman.
This alternative would have little impact on fish habitat in the Red River with habitat scores showing mostly no effect on habitat for fish, including lake sturgeon except moderate improvement in fish habitat at the 10th percentile flow at Frog Point. Seasonal mussel habitat in the Red River would be improved over No Action under the Missouri River Import to Red River Valley Alternative.
This alternative is the same as the GDU Import to Sheyenne River Alternative and would minimally impact Missouri River Basin fisheries and aquatic communities at Audubon Lake, McClusky Canal, and Chain of Lakes.
This alternative would meet the North Dakota Game and Fish aquatic needs recommendations about the same as the No Action, both In-Basin, and GDU Import Pipeline Alternatives for the Sheyenne and Red Rivers during the period of record. However, during a 1930s-type drought, the Missouri River Import to the Red River Valley Alternative minimally meets recommendations, 17-20% of the time on the Sheyenne, and 13-59% of the time on the Red River.
4 - 123

Red River Valley Water Supply Project FEIS Chapter Four Environmental Impacts
Cumulative Effects Impacts to aquatic communities from the action alternatives would be relatively minor or beneficial. There are no known present or reasonably foreseeable non-Project future actions that would elevate these minor impacts to changes of greater magnitude. Cumulative impacts would be reflected in the flows, because all depletions and operations of Baldhill Dam were included in the Red River Basin surface water quantity analysis described earlier in chapter four.
Environmental Mitigation The flow recommendations from the North Dakota Game and Fish Department were incorporated into the aquatic needs recommendations of the GDU Import to the Sheyenne River Alternative. These recommendations are a means to benefit biodiversity management goals for the Sheyenne River and Red Rivers. There is uncertainty and limited predictive capability when dealing effectively with complex river ecosystems and recommendations to benefit those ecosystems. Monitoring or researching ecosystem response to a change in driving variables like aquatic needs flows is important.
• The Impact Mitigation Team will use adaptive management principles or other methods to monitor the effectiveness of the North Dakota Game and Fish Department’s recommended targets for the aquatic environment. An adaptive management plan will be developed in accordance with the Department of the Interior Policy guidance (Order 3270) and the report Adaptive Management, The U.S. Department of Interior Technical Guide (Williams et al. 2007).
4 - 124

Red River Valley Water Supply Project FEIS Chapter Four Environmental Impacts
Risks of Invasive Species
Introduction How would the alternatives affect the risk of biological invasions from the Missouri
River Basin to the Hudson Bay Basin?
Invasive Species Nonindigenous species - a species that does not occur naturally in a given area. Invasive species - a nonindigenous species whose introduction does or is likely to cause economic or environmental harm or harm to human health. Pathway – the means by which species are transported from one location to another.
Three of the alternatives considered in this FEIS would transfer water from the Missouri River Basin to the Hudson Bay Basin. An interbasin water transfer could provide an additional pathway for introducing invasive aquatic species to the Hudson Bay Basin.
The pathways responsible for initial introduction of invasive species are usually different from the pathways through which invasive species spread once they become established. Because most invasive species in North America had their origin on another continent, prevention of new invasions must focus on pathways that potentially link these distant watersheds. For example, many invasive species in the Great Lakes were initially transferred via ship ballast water. After species such as zebra mussels became established in the Great Lakes, numerous pathways (both natural and human mediated) were responsible for their subsequent spread throughout the Great Lakes and into adjacent basins.
Regulation of Invasive Species There are currently no treatment standards for ballast water or interbasin water transfers to reduce the risk of biological invasions. International ballast water treatment standards have been proposed, and even more stringent standards are envisioned in a bill currently introduced in the U.S. Congress (see chapter three). Because ballast water is such an important pathway for initial introductions of invasive species, enactment of strict ballast water treatment standards would greatly reduce the risk of spreading invasive species through many other pathways, including interbasin water transfers. In other words, invasive species cannot spread in North America if their arrival can be prevented. On the other hand, many invasive species are impossible to eradicate, and nearly impossible to contain once established, because numerous pathways usually link adjacent watersheds.
All of the Missouri River import alternatives evaluated in this FEIS would use pretreatment, media or membrane filtration, and UV disinfection, which is a much higher level of treatment than the strictest standards proposed for ballast water. Thus, ship ballast water and other pathways related to international commerce
“Every Day, Large Quantities of Ballast Water from All Over the World are Discharged into United States Waters” U.S. Department of Homeland Security (http://www.uscg.mil/hq/g-m/mso/ans).
4 - 125

Red River Valley Water Supply Project FEIS Chapter Four Environmental Impacts
will continue to pose a much higher risk of biological invasions than existing or proposed interbasin water transfers.
Methods
Risk Analysis Reclamation contracted with USGS Biological Resources Division to evaluate the risks and consequences associated with the unintentional transfer of invasive species that could occur as a result of Project operations. USGS produced a detailed, 36-page plan of study for the risk analysis in 2002. The plan of study was distributed to an interagency Technical Team for review (see chapter five). In September 2002, USGS attended a meeting of the interagency Technical Team to explain the risk analysis process, walk through the plan of study, and take additional comments. A revised plan of study was produced in November 2002.
The risk analysis was completed in 2005. Subsequently, two supplemental reports have been completed. Each of these reports was peer-reviewed by experts both within and outside of USGS who had no stake in the outcome of the review.
The risk analysis and supplemental reports are included as supporting documents to this FEIS. Interested readers should review the reports for a better understanding of the risk analysis process and how risks associated with this proposed Project were evaluated.
USGS, with input from Reclamation and other stakeholders, identified potentially invasive species that were evaluated in the risk analysis (tables 3.9 and 3.10). While it is not possible to evaluate or even identify all potentially invasive species in the Missouri River Basin, the species evaluated presented a wide range of life history attributes, and may be representative of unknown species (either presently occurring or yet to be introduced) with similar life history characteristics.
The risk analysis followed a series of steps that incorporated problem formulation, identification of potential pathways for movement of organisms between the two basins, analysis and data synthesis, and risk characterization, including analysis of uncertainties associated with risk estimates. Three analytical tools were used:
• Categorical analysis that ranked potentially invasive species based on life history characteristics
• Simple probability analysis that characterized risks as outcomes of a multiple-step flow of events required for an invasion to occur
• Spatial analysis that characterized the potential future distribution of invasive species
For some species, the available data were not sufficient to complete an analysis with each of these three tools, but a narrative analysis of risks was completed for each potentially invasive species.
For a successful invasion to occur, these three steps must take place in the following order: 1) Transfer of invasive species successfully completed. 2) Invasive species establishes a reproductive population.
4 - 126

Red River Valley Water Supply Project FEIS Chapter Four Environmental Impacts
3) Reproductive population of the invasive species attains sustainable numbers and causes impacts in receiving system.
Each of these steps can be further divided if sufficient data are available. The simple probability analysis used a computer simulation to estimate the probability of occurrence for each step in the invasion process. The probability of a successful invasion is simply the product of the probabilities for each step in the process.
For the initial characterization of risk, three general scenarios were considered: • Open water conveyance with no treatment • Piped conveyance with no treatment • Piped conveyance with treatment
These three scenarios do not directly correspond to the alternatives evaluated in the FEIS. For example, two of the three scenarios do not incorporate treatment, even though all Missouri River import alternatives include multiple treatment processes, including filtration and disinfection, to reduce the risk of transferring invasive species. However, the three scenarios bracket the range of alternatives in the FEIS, and give a perspective on how the risk of biological invasions is affected by water treatment and means of conveyance.
Failure Analysis Each of the interbasin transfer alternatives includes a control system to reduce the risk of transferring invasive species. These control systems, which include water intake, treatment, and conveyance features, are described in chapter two. The potential for control system failure was considered in the risk characterizations presented in the risk analysis (USGS 2005a; USGS 2005b) and summarized in the DEIS. However, several comments on the DEIS noted that the risk analysis (USGS 2005a; USGS 2005b) did not adequately address the risks associated with control system failure (i.e., what happens if a treatment plant fails to meet design criteria or a pipeline breaks). As a result, USGS completed a supplemental evaluation of risks associated with infrastructure failures in interbasin transfer alternatives. The primary focus of this analysis was failure in pipes, pumps, valves, motors, and other components of the water treatment and transmission system that could result in transfers of invasive species. The failure analysis relied on existing failure rate data from a variety of sources, including historical data about the device or system under consideration, government and commercial failure rate data, handbooks of failure rate data for various components, and field and laboratory testing.
System failure rates change with time, and can often be depicted by a “bathtub curve” (figure 4.47). Most systems are initially characterized by a relatively high, but rapidly decreasing failure rate. For example, failures occurring immediately following start up may reflect malfunctions associated with manufacturing defects.
Following the “early failure period,” the failure rate levels off and remains relatively constant throughout “useful life of the system.” During this period, the failure rate will be low. Systems generally function most of their lifetimes in this flat portion of the bathtub curve, but if the system is not repairable and remains in use long enough, failure rates will increase as materials
4 - 127

Red River Valley Water Supply Project FEIS Chapter Four Environmental Impacts
wear out. System failures that occur years after start up may reflect failures in pipes associated with age-related corrosion.
Figure 4.47 – A “Bathtub Curve” Represents the Lifetime Distribution of Failures for Many Engineered Systems (original figure modified from National Institute of Standards and Technology).
Consequence Analysis The consequence analysis used two economic approaches to illustrate the potential significance of the invasive species risk. One economic approach used in this analysis, HEA (habitat equivalency analysis), borrows from the established field of natural resource damage assessment. A key assumption of the HEA method is that appropriate restoration measures are feasible and available. With HEA, the impacts are quantified as the size or cost of the required restoration project. That is, the size of the restoration project must be sufficient to offset the economic value of lost services. For example, replacement services could include the monitoring and removal of existing invasive species that are not related to the Project. Those replacement services would improve habitat and represent real economic value. One advantage of HEA is that it focuses on environmental restoration measures rather than on the estimation of economic values. In natural resource damage assessments, restoration is more easily understood by a wider audience than the more theoretic valuation approaches. Initially, HEA was used to quantify potential consequences for the Red River and Lake Winnipeg. Subsequently, analyses were also performed on the Red Lake River, Red Lake, and the Sheyenne River (including Lake Ashtabula). The habitat equivalency model used in this analysis is essentially the same as that used in natural resource damage assessments, with one significant difference. Damage assessments are conducted after the occurrence of an ecological injury. Therefore, that analysis is of a certain
4 - 128

Red River Valley Water Supply Project FEIS Chapter Four Environmental Impacts
4 - 129
event. Risk assessments, on the other hand, address uncertain events in the future. To accommodate this uncertainty, the probability of successful biological invasion was introduced into the HEA model development. This probability was applied to the future ecological losses that would occur given a successful invasion. Thus, the consequences of risk are presented as the certain level of restoration that would be required to address these uncertain losses. This quantification of risk consequences is termed “offsetting restoration.” Recognizing the possibility that appropriate restoration measures may not be feasible or available, a second economic approach - regional economic impact analysis - was used to describe potential consequences for Lake Winnipeg in terms of impacts on the economy (sales revenue and employment). Regional economic impact analysis does not assume the feasibility or availability of appropriate restoration measures. Results Risk Analysis The simple probability risk estimates range from “practically 1.0” to “practically 0.” In other words, given the three scenarios evaluated (open water conveyance with no treatment, piped conveyance with no treatment, piped conveyance with treatment), the risk of biological invasion ranges from “highly likely” to “highly unlikely.” Overall, risks of biological invasions varied greatly among the species evaluated, and ranked as follows, from lowest to highest risk:
Interbasin transfers of fishes through the project would be least likely to occur, while waterborne disease agents and cyanobacteria would present a higher risk. Of the three scenarios evaluated, open water conveyance without treatment would present the highest risk. The risk would be only slightly reduced with conveyance of untreated water through a pipeline. By adding treatment, however, the risks would be greatly reduced. With the proposed control systems meeting SDWA disinfection standards, the risk of biological invasion would be very low for all of the potentially invasive species that were evaluated. In particular, with both disinfection and filtration, the risk of transferring macroscopic organisms (visible to the naked eye) would be essentially zero for all of the alternatives evaluated in the FEIS. Tables 4.50 – 4.52 summarize the risks under the three general scenarios evaluated in the risk analysis (open conveyance without treatment, piped conveyance without treatment, piped conveyance with treatment). For each species, the risks were assigned to one of five categories: very low, low, moderate, high, very high. The risk assignments were made after considering the results from all three analytical tools that were used (categorical analysis, simple probability analysis, and spatial analysis). As can be seen in tables 4.50 and 4.51, many species would pose a moderate to high risk of invasion if the water was not adequately treated prior to transfer. The effects of adequate treatment are evident in table 4.52, where all species evaluated are assigned to the very low risk category.
Fishes << Aquatic invertebrates < Aquatic and terrestrial-wetland plants < Waterborne disease agents < Cyanobacteria

Red River Valley Water Supply Project FEIS Chapter Four Environmental Impacts
Table 4.50 – Risk of Successful Invasion for Open Water Conveyance Without Treatment (from USGS 2005a).
Risk ranking Very Low Low Moderate High Very High
Risk estimate less than 1.00E-09 1.00E-06 1.00E-03 1.00E-02 1.00E+00 Microorganisms and Disease Agents:
Protozoa and Metazoa
Myxosoma cerebralis (Myxobolus cerebralis) x Polypodium hydriforme x
Cryptosporidium parvum * x Giardia lamblia* x
Bacteria and viruses Enteric redmouth x
Infectious hemtopoietic necrosis virus (IHNV) x Escherichia coli (various serotypes)* x
Salmonella spp. * x Legionella spp. x
Aquatic plants and cyanobacteria:
Cyanobacteria Anabaena flos-aquae* x
Microcystis aeruginosa* x Aphanizomenon flos-aquae* x
Vascular plants Hydrilla (Hydrilla verticillata) x
Eurasian water-milfoil (Myriophyllum spicatum) x Water hyacinth (Eichhornia crassipes) x
Purple loosestrife (Lythrum salicaria) x Salt cedar (Tamarix spp.) x
Aquatic invertebrates:
Mollusks Zebra mussel (Dreissena polymorpha) x
Asian clam (Corbicula fluminea) x New Zealand mudsnail (Potamopyrgus antipodarum) x
Crustaceans Spiny water flea (Bythotrephes cederstroemi) x
Aquatic vertebrates: Fishes
Gizzard shad (Dorosoma cepedium) x Rainbow smelt (Osmerus mordax) x Bighead carp (Aristichthys nobilis) x
Paddlefish (Polyodon spathula) x Pallid sturgeon (Scaphirhynchus albus) x
Utah chub (Gila atraria) x Zander (Stizostedion lucioperca) x
Invasive species associated with sludge disposal and indirect pathways associated with interbasin water transfers
x
Potential plant and disease organisms (plant, wildlife, and human)
x
Potential genetically manipulated organisms x
Asterisk (*) indicates the organisms are not invasive, but may be transported via interbasin water transfer and have adverse impacts on fish and wildlife or human health, or cause adverse ecological effects.
4 - 130

Red River Valley Water Supply Project FEIS Chapter Four Environmental Impacts
Table 4.51 – Risk of Successful Invasion for Piped Conveyance Without Treatment (from USGS 2005a).
Risk ranking Very Low Low Moderate High Very High
Risk estimate less than 1.00E-09 1.00E-06 1.00E-03 1.00E-02 1.00E+00 Microorganisms and Disease Agents:
Protozoa and Metazoa Myxosoma cerebralis (Myxobolus cerebralis) x
Polypodium hydriforme x Cryptosporidium parvum * x
Giardia lamblia* x Bacteria and viruses
Enteric redmouth x Infectious hemtopoietic necrosis virus (IHNV)
x Escherichia coli (various serotypes)* x
Salmonella spp. * x Legionella spp. x
Aquatic plants and cyanobacteria: Cyanobacteria
Anabaena flos-aquae* x Microcystis aeruginosa* x
Aphanizomenon flos-aquae* x Vascular plants
Hydrilla (Hydrilla verticillata) x Eurasian water-milfoil (Myriophyllum spicatum)
x Water hyacinth (Eichhornia crassipes) x
Purple loosestrife (Lythrum salicaria) x Salt cedar (Tamarix spp.) x
Aquatic invertebrates: Mollusks
Zebra mussel (Dreissena polymorpha) x Asian clam (Corbicula fluminea) x
New Zealand mudsnail (Potamopyrgus antipodarum) x Crustaceans
Spiny water flea (Bythotrephes cederstroemi) x Aquatic vertebrates:
Fishes Gizzard shad (Dorosoma cepedium) x
Rainbow smelt (Osmerus mordax) x Bighead carp (Aristichthys nobilis) x
Paddlefish (Polyodon spathula) x Pallid sturgeon (Scaphirhynchus albus) x
Utah chub (Gila atraria) x Zander (Stizostedion lucioperca) x
Invasive species associated with sludge disposal and indirect pathways associated with interbasin water transfers
x
Potential plant and disease organisms (plant, wildlife, and human)
x
Potential genetically manipulated organisms x
Asterisk (*) indicates the organisms are not invasive, but may be transported via interbasin water transfer and have adverse impacts on fish and wildlife or human health or cause adverse ecological effects.
4 - 131

Red River Valley Water Supply Project FEIS Chapter Four Environmental Impacts
Table 4.52 – Risk of Successful Invasion for Piped Conveyance With Treatment (from USGS 2005a).
Risk ranking Very Low Low Moderate High Very High
Risk estimate less than 1.00E-09 1.00E-06 1.00E-03 1.00E-02 1.00E+00 Microorganisms and Disease Agents:
Protozoa and Metazoa Myxosoma cerebralis (Myxobolus cerebralis) x
Polypodium hydriforme x Cryptosporidium parvum * x
Giardia lamblia* x Bacteria and viruses
Enteric redmouth x
Infectious hemtopoietic necrosis virus (IHNV) x Escherichia coli (various serotypes)* x
Salmonella spp. * x Legionella spp. x
Aquatic plants and cyanobacteria: Cyanobacteria
Anabaena flos-aquae* x Microcystis aeruginosa* x
Aphanizomenon flos-aquae* x Vascular plants
Hydrilla (Hydrilla verticillata) x Eurasian water-milfoil (Myriophyllum spicatum) x
Water hyacinth (Eichhornia crassipes) x Purple loosestrife (Lythrum salicaria) x
Salt cedar (Tamarix spp.) x Aquatic invertebrates:
Mollusks Zebra mussel (Dreissena polymorpha) x
Asian clam (Corbicula fluminea) x New Zealand mudsnail (Potamopyrgus antipodarum) x
Crustaceans
Spiny water flea (Bythotrephes cederstroemi) x Aquatic vertebrates:
Fishes Gizzard shad (Dorosoma cepedium) x
Rainbow smelt (Osmerus mordax) x Bighead carp (Aristichthys nobilis) x
Paddlefish (Polyodon spathula) x Pallid sturgeon (Scaphirhynchus albus) x
Utah chub (Gila atraria) x Zander (Stizostedion lucioperca) x
Invasive species associated with sludge disposal and indirect pathways associated with interbasin water transfers x Potential plant and disease organisms (plant, wildlife, and human) x Potential genetically manipulated organisms x
Asterisk (*) indicates the organisms are not invasive, but may be transported via interbasin water transfer and have adverse impacts on fish and wildlife or human health, or cause adverse ecological effects.
4 - 132

Red River Valley Water Supply Project FEIS Chapter Four Environmental Impacts
4 - 133
The GDU Import Pipeline and Missouri River Import to Red River Valley Alternatives are examples of the “piped and treated” category, and would have very low risk for all species evaluated provided treatment plants meet disinfection standards required under the SDWA.
.
The GDU Import to Sheyenne River Alternative includes treatment and a combination of piped and open water conveyance. The analysis shows that treatment is more important than the means of conveyance in terms of risk reduction. Thus, this alternative should present risks similar to the “piped and treated” category.
Failure Analysis Probability of Control System Failure Control system failure was simulated using statistical models to estimate failure probabilities for interbasin transfer alternatives (see USGS 2006 for an explanation of analytical methods). Figure 4.48 shows the results of a simulation of failures over time for a generalized water treatment and transmission system applicable to any of the interbasin transfer alternatives. The analysis simulates a 10,000-day (approximately 27-year) period that includes an early failure period, a period of useful life (characterized by constant failure rate), and late life (characterized by increasing failure rate). The simulation follows a typical bathtub curve.
Failures during the “start up” period are conservatively assumed to always increase the risk of transferring invasive species. In reality, failures in water withdrawal, water treatment, and conveyance features could also reduce risks of biological invasions, if those failures resulted in an interruption of water transfer.
Following the start-up period, the intrinsic failure period (day 361 through day 7,500) assumes that the system is designed to meet SDWA disinfection standards, including LT2ESWTR, yet still has the potential to fail. During the intrinsic failure period, the system could fail to meet performance criteria for a variety of reasons. For example, undetected leaks could release enough microorganisms into the environment over time to establish a population in the receiving waters.
Age-related failures become dominant factors in evaluating system performance beyond the intrinsic failure period, with an increasing failure rate as the system ages.
The analysis showed that system failures that result in a biological invasion would be very unlikely. This is not surprising, as the treatment processes proposed in the FEIS are commonly used for drinking water and have a long history of safe and reliable operation. Given the conceptual designs presented in the FEIS, the simulation illustrated in figure 4.48 yielded the following risk estimates for system failure that results in a biological invasion:
• Risk of system failure during early failure period (initial year of operation) is conservatively estimated at 1 out of 10,000.
• Risk of system failure during intrinsic failure period (bounded between 1-year and up to 20-years service life) is conservatively estimated at 1 out of 100,000.
• Risk of system failure during wear out failure period (beyond 20 years service life) is conservatively estimated at 1 out of 1000.

Red River Valley Water Supply Project FEIS Chapter Four Environmental Impacts
4 - 134
Figure 4.48 – 10,000-day Simulation of the Life-Time Distribution of Control System Failure.

Red River Valley Water Supply Project FEIS Chapter Four Environmental Impacts
Regardless of when system failure occurs, these conservative estimates assume that a single system failure would transfer an invasive species, and a sustainable population would be established as a result of that system breach. As noted in USGS (2006), this fails-once assumption may be possible, but is not likely, and depends on when and where the failure occurs.
The failure analysis demonstrates the need for regular maintenance and replacement of system components to reduce risks due to system aging. In fact, replacement of worn parts with new ones that are technologically superior may not only extend the useful life of the system, but may reduce risks of biological invasions due to system failure.
Integrating System Failure into the Risk Analysis As noted previously, the simple probability analysis included simulations both with and without effective treatment. As a result, the probability of successful invasion ranged from very low to very high. However, all of the Missouri River import alternatives evaluated in this FEIS include treatment plants that include both disinfection and filtration, thus greatly reducing the risk of biological invasions through project pathways. USGS (2006) estimated the intrinsic failure rate for proposed control systems at 1 out of 100,000 (denoted 10-5 or 1E-5 in scientific notation). Figure 4.49 compares the outcomes from the simple probability analysis with and without effective treatment. Both the intrinsic failure rate (10-5) and the wear out failure rate (10-3) are shown. Note that the wear out failure rate assumes that critical components fail before they are replaced, or are non-repairable. This would be very atypical for water treatment plants.
As can be seen in figure 4.49, incorporation of treatment causes a substantial shift in the distribution of simulation outcomes toward lower probabilities. With treatment, all of the outcomes showed a risk of invasion of 1 in 1 million or less. Note that the distributions are very similar whether a failure rate of 10-3 or 10-5 is chosen as the cutoff between “effective” and “ineffective” treatment. This similarity exists because, as pointed out in the EIS and the risk analysis, successful invasions involve multiple steps, including transfer of invasive organisms, establishment of a reproducing population, and contact with an ecological receptor (e.g., host organism) in the receiving basin.
Consequence Analysis Habitat Equivalency Analysis Critical factors in this analysis include the risk of successful invasion, as well as the method and rate of the dispersal of biological invaders. The risk of successful invasion of the Red River and Lake Winnipeg was estimated using a simple probability analysis, and is summarized in table 4.53. Two potential dispersal methods were considered: progressive and jump.
The progressive dispersal method assumes that a biological invasion progresses incrementally at a constant rate. The rates of advancement of a biological invasion were assumed to range between 2.5 and 25 kilometers, or between 1.55 and 15.5 miles, per year. Jump dispersal was represented in this analysis by an instantaneous introduction of a biological invader into Lake Winnipeg.
4 - 135

20 19 18
~ 17 ::J (j) 16 c 0 15 "iir 14 :i E 13 m 12
g 11
:£ 10
§ 9 () 8 :5 7 0 '0 6
'$ 5
~ 4 CL 3
2
1E+O iE-3 1E-6 1E-9 iE- 12 1E-15 iE-18 iE-21 iE-24 iE-27 iE-3:1 iE-33 1E- 3S iE- 39 iE-42
1- TreatiT16!lt Failure < = 1E- 5 - Treatrrent Failure > 1E- 5
1E+O 1E-3 1E-6 iE-9 iE- 12 iE- 15 iE- 18 1E-21 1E-24 iE-27 iE-3:1 iE-33 1E- 3S iE- 39 1E-42
1- TreatiT16!lt Failure < = 1E-5 - Treatrrent Failure > 1E-5
Red River Valley Water Supply Project FEIS Chapter Four Environmental Impacts
Figure 4.49 - Comparison of Invasion Probabilities With and Without Effective Treatment. Top graph Based on Control System Failure Rate Identified for Wear Out Period (10-3). Bottom Graph Based on Intrinsic Failure Rate (10-5).
4 - 136

Red River Valley Water Supply Project FEIS Chapter Four Environmental Impacts
Table 4.53 – Offsetting Restoration for a Single Representative Invasive Organism (Red River and Lake Winnipeg) (from USGS 2005a).
Red River from Fargo to Lake Winnipeg - Progressive Dispersal
----Offsetting Restoration----
Risk Category Probability of
Successful Invasion
Percent Outcomes*
Slow Invasion (River-Miles)
Fast Invasion (River-Miles)
Very Low 1.00E-09 87.0% 0.0000000805 0.000000470 Low 1.00E-06 7.6% 0.0000805 0.000470 Moderate 1.00E-03 3.7% 0.0805 0.470 High 1.00E-02 1.7% 0.805 4.70 Very High 1.00E+00 0.0% 80.5 470 Weighted Average 0.02 0.10
Lake Winnipeg - Jump Dispersal
----Offsetting Restoration----
Risk Category Probability of
Successful Invasion
Percent Outcomes
Slow Invasion (Acres)
Fast Invasion (Acres)
Very Low 1.00E-09 87.0% 0.00173 0.00708 Low 1.00E-06 7.6% 1.73 7.08 Moderate 1.00E-03 3.7% 1,730 7,080 High 1.00E-02 1.7% 17,300 70,800 Very High 1.00E+00 0.0% 1,730,000 7,080,000 Weighted Average 358.24 1,466.10
Lake Winnipeg - Progressive Dispersal
----Offsetting Restoration----
Risk Category Probability of
Successful Invasion
Percent Outcomes
Slow Invasion (Acres)
Fast Invasion (Acres)
Very Low 1.00E-09 87.0% 0.000000291 0.00301 Low 1.00E-06 7.6% 0.000291 3.01 Moderate 1.00E-03 3.7% 0.291 3,010 High 1.00E-02 1.7% 2.91 30,100 Very High 1.00E+00 0.0% 291 3,010,000 Weighted Average
0.06 623.30
* The same probabilistic outcomes determined by USGS (2005a) were used in this analysis.
In this scenario, a progressive invasion of Lake Winnipeg or Red Lake was assumed to begin at the same time that a progressive invasion of the Red River began at Fargo. Thus, jump dispersal could represent a human-aided pathway (e.g., recreational boats) or very rapid natural dispersal (e.g., movement of an infected fish downstream from Fargo to Lake Winnipeg).
Offsetting restoration provides certain levels of ecological services to replace uncertain losses of similar services. Offsetting restoration was quantified in the same terms that were used to quantify habitat losses - river-miles for the Red River and Red Lake River, and acres for Lake Winnipeg and Red Lake.
Because the offsetting restoration is weighted by the probability of invasion, it is not a measure of the potential consequences but is rather a measure of the expected consequences. Thus, the
4 - 137

Red River Valley Water Supply Project FEIS Chapter Four Environmental Impacts
HEA should be viewed as another way to interpret the risk of invasion through Project-related pathways, not the consequences that would occur in the very unlikely event that those risks were realized.
Table 4.54 – Offsetting Restoration For a Single Representative Invasive Organism (Red Lake River and Red Lake) (from USGS 2005b).
Red Lake River - Progressive Dispersal
----Offsetting Restoration----
Risk Category
Probability of Successful
Invasion Percent
Outcomes* Slow Invasion (River-Miles)
Fast Invasion (River-Miles)
Very Low 1.00E-09 87.0% 0.00000000398 0.000000186 Low 1.00E-06 7.6% 0.00000398 0.000186 Moderate 1.00E-03 3.7% 0.00398 0.186 High 1.00E-02 1.7% 0.0398 1.86 Very High 1.00E+00 0.0% 3.98 186 Weighted Average 0.00 0.04
Lower and Upper Red Lakes - Jump Dispersal
----Offsetting Restoration----
Risk Category
Probability of Successful
Invasion Percent
Outcomes* Slow Invasion
(Acres) Fast Invasion
(Acres) Very Low 1.00E-09 87.0% 0.000327 0.000393 Low 1.00E-06 7.6% 0.327 0.393 Moderate 1.00E-03 3.7% 327 393 High 1.00E-02 1.7% 3,270 3,930 Very High 1.00E+00 0.0% 327,000 393,000 Weighted Average
67.71 81.38
Lower and Upper Red Lakes - Progressive Dispersal
----Offsetting Restoration----
Risk Category
Probability of Successful
Invasion Percent
Outcomes* Slow Invasion
(Acres) Fast Invasion
(Acres) Very Low 1.00E-09 87.0% 0.000000423 0.000205 Low 1.00E-06 7.6% 0.000423 0.205 Moderate 1.00E-03 3.7% 0.423 205 High 1.00E-02 1.7% 4.23 2,050 Very High 1.00E+00 0.0% 423 205,000 Weighted Average 0.09 42.45
*The same probabilistic outcomes determined by USGS (2005a) were used in this analysis.
The HEA was calculated for a single representative invasive organism given the two dispersal methods and the two dispersal rates described above for the five different risk categories considered (very low, low, moderate, high, and very high risk). The results of those HEA calculations are presented in tables 4.53 and 4.54.
4 - 138

Red River Valley Water Supply Project FEIS Chapter Four Environmental Impacts
Three dispersal scenarios were assumed in order to estimate a range of potential consequences for the 31 potentially invasive species considered collectively:
• 0 jump dispersal events and 31 progressive dispersal events • 1 jump dispersal event and 30 progressive dispersal events • 10 jump dispersal events and 21 progressive dispersal events
HEA calculations for the 31 potentially invasive species collectively are presented in tables 4.55 and 4.56. The results presented in tables 4.55 and 4.56 show that if treatment is not effective, there is a potential for significant consequences at Lake Winnipeg, and generally much lower consequences for the Red River, Red Lake River, and Red Lake. Again, it should be noted that these results are very sensitive to assumptions concerning invasion speed and the percentage outcomes in each risk category. These results suggest that the majority of the potential consequences from risks of biological invasion would likely occur in Lake Winnipeg.
Table 4.55 – Offsetting Restoration for 31 Potentially Invasive Species (Red River and Lake Winnipeg) (from USGS 2005a).
------Offsetting Restoration*------ Red River Lake Winnipeg
Dispersal Scenario (River-Miles) (Acres)
Slow Invasion
0 Jump - 31 Progressive 0.6 1.9 1 Jump - 30 Progressive 0.6 360.0 10 Jump - 21 Progressive 0.6 3,583.7
Fast Invasion
0 Jump - 31 Progressive 3.1 19,322.3 1 Jump - 30 Progressive 3.1 20,165.1 10 Jump - 21 Progressive 3.1 27,750.3 *Multiples of the weighted averages of the respective offsetting restoration levels for a single representative invasive organism (table 4.53), combined according to the dispersal scenarios.
Table 4.56 – Offsetting Restoration for 31 Potentially Invasive Species (Red Lake River and Red Lake) (from USGS 2005b).
------Offsetting Restoration*------
Red Lake River Lower and Upper
Red Lakes Dispersal Scenario (River-Miles) (Acres)
Slow Invasion
0 Jump - 31 Progressive 0.0 2.8 1 Jump - 30 Progressive 0.0 70.4 10 Jump - 21 Progressive 0.0 679.0
Fast Invasion
0 Jump - 31 Progressive 1.2 1,316.0 1 Jump - 30 Progressive 1.2 1,354.9 10 Jump - 21 Progressive 1.2 1,705.3 *Multiples of the weighted averages of the respective offsetting restoration levels for a single representative invasive organism (table 4.54), combined according to the dispersal scenarios.
4 - 139

Red River Valley Water Supply Project FEIS Chapter Four Environmental Impacts
Regional Economic Impact Analysis Recognizing the possibility that appropriate restoration measures may not be feasible or available, a second economic approach, regional economic impact analysis, was used to describe potential consequences for Lake Winnipeg commercial fishing in terms of the impacts of risk on the economy (output or sales revenue and employment). Regional economic impact analysis does not assume the feasibility or availability of appropriate restoration measures. That analysis is described next.
Lake Winnipeg supports the largest commercial fishery in Manitoba, contributing 41% of total production and 58% of total landed value in the province (Manitoba Conservation 2003). From 1992 through 2002, the average landed value from the lake was $14,838,754 per year (Canadian 2003 dollars) and an average of 1,013 fishermen were employed in the fishery. Commercial fishing is permitted at Lake Winnipeg only during specific seasons of the year (summer open water, fall open water, and winter).
The regional economic benefits of this fishery include both direct and indirect sources. The direct sources are the initial sales of the commercial fishing industry (an average of $14,838,754 per year). The indirect sources arise as these initial sales reverberate through the economy from the purchase of necessary inputs from other industries (e.g., labor, fuel, and tackle). While the direct benefits occur within Manitoba, the indirect impacts can occur throughout the entire Canadian economy. Therefore, this analysis calculates the direct and indirect benefits of the Lake Winnipeg commercial fishery for all Canadian provinces.
The direct and indirect impacts estimated in this analysis are for sales revenue (also called output) and employment. These impacts were calculated using data purchased from Statistics Canada specifically for this analysis. These data, called multipliers, were determined by Statistics Canada through economic modeling and relate the output and employment impacts to the initial sales of the commercial fishing industry. Statistics Canada did not have multipliers available specifically for the commercial fishing industry in Manitoba, but did have multipliers for the broader “fishing, hunting, and trapping” industry for that province. Therefore, this analysis relies on the fishing, hunting, and trapping multipliers provided by Statistics Canada.
Once an invasion of Lake Winnipeg by any of the 31 potentially invasive species began, it was assumed to displace all commercial fishing at a constant rate. For example, a fast invasion was assumed to displace the entire commercial fishery in 17 years. This conservative approach assumes that a single invasive organism could displace the entire fishery, and thereby sets an upper bound on the estimate of consequences for any invasion scenario considered. While this is possible, it should be noted that there are no known organisms in the Missouri River Basin whose introduction into Lake Winnipeg would be likely to eliminate the commercial fishery.
Finally, since a potential displacement of the Lake Winnipeg commercial fishery would occur over a number of years, impacts occurring in the future are discounted to the present time so these can be added up in a meaningful way. For consistency, the same discount rate used in the HEA (3% per year) was used in the regional economic impact analysis as well.
The potential direct and indirect output (sales revenue) impacts for all Canadian provinces given a jump dispersal event are reported in table 4.57. The table shows the weighted average cost of a
4 - 140

Red River Valley Water Supply Project FEIS Chapter Four Environmental Impacts
one-event successful invasion under the slow and fast dispersal scenarios. A jump dispersal would produce larger economic impacts than a progressive dispersal, since the impacts are assumed to begin immediately. These impacts were first calculated separately for each risk category (very low, low, moderate, high, and very high), then weighted by their respective percentage outcomes.
Table 4.57 – Expected Direct and Indirect Output Impacts for All Canadian Provinces Given a Jump Dispersal Event (from USGS 2005a).
Total Expected Present Value of Direct and
Indirect Output Impacts -------(Canadian 2003 $)-------
Risk Category Probability of Successful Invasion Percent Outcomes Slow Invasion Fast Invasion Very Low 1.00E-09 87.0% $0.160 $0.655 Low 1.00E-06 7.6% $160 $655 Moderate 1.00E-03 3.7% $160,000 $655,000 High 1.00E-02 1.7% $1,600,000 $6,550,000 Very High 1.00E+00 0.0% $160,000,000 $655,000,000 Weighted Average $33,000 $136,000
Given a jump dispersal event, the average total expected present value of the direct and indirect output impacts for all Canadian provinces ranges between $33,000 and $136,000, depending on whether the biological invasion would be slow or fast. It is important to note that these impacts are expected values that reflect a strong weighting toward the very low-risk category, since that category accounts for 87% of all outcomes from the simple probability analysis.
Incorporating Control System Failure into the Consequence Analysis The percentage of outcomes in each risk category were derived from the simple probability analysis, which considered a range of control system failure rates, including scenarios with no treatment of source water. However, all of the Missouri River import alternatives evaluated in this FEIS include treatment plants with both disinfection and filtration, thus greatly reducing the risk of biological invasions through Project pathways.
USGS (2006) estimated the intrinsic failure rate for proposed control systems at 1 out of 100,000 (denoted 10-5 or 1E-5 in scientific notation). When only simulations with effective treatment (failure rate < 10-5) are considered, the outcomes are shifted substantially toward the lower risk categories, thus reducing the calculated impacts. Tables 4.58 and 4.59 summarize the HEA for Lake Winnipeg for the GDU Import to Sheyenne River Alternative, using only simulations where the probability of control system failure is less than 10-5. As with the simulation outcomes shown in figure 4.49, the results would be similar if the wear out period failure rate (10-5) were used in the analysis.
4 - 141

Red River Valley Water Supply Project FEIS Chapter Four Environmental Impacts
Table 4.58 – Offsetting Restoration for a Single Representative Invasive Species in Lake Winnipeg With Effective Treatment (Probability of Control System Failure Less Than 10-5).
Lake Winnipeg - Jump Dispersal
Probability of ---Offsetting Restoration for One Organism---
Risk Successful Percent Slow Invasion Fast Invasion Category Invasion Outcomes (Acres) (Acres)
Very Low 1.00E-09 94.90% 0.00000612 0.00416 Low 1.00E-06 4.91% 0.00612 4.16 Moderate 1.00E-03 0.19% 6.12 4,160 High 1.00E-02 0.00% 61.2 41,600 Very High 1.00E+00 0.00% 6,120 4,160,000 Weighted Average
0.01 8.11 Lake Winnipeg - Progressive Dispersal
Probability of ---Offsetting Restoration for One Organism---
Risk Successful Percent Slow Invasion Fast Invasion Category Invasion Outcomes (Acres) (Acres)
Very Low 1.00E-09 94.90% 0.00000000103 0.00177 Low 1.00E-06 4.91% 0.00000103 1.77 Moderate 1.00E-03 0.19% 0.00103 1,770 High 1.00E-02 0.00% 0.0103 17,700 Very High 1.00E+00 0.00% 1.03 1,770,000 Weighted Average 0.00000 3.45
Table 4.59 – Offsetting Restoration for 31 Potentially Invasive Species in Lake Winnipeg With Effective Treatment (Probability of Control System Failure Less Than 10-5). a
Dispersal Scenario Offsetting Restoration (Acres)
Slow Invasion
0 Jump - 31 Progressive 0.0 1 Jump - 30 Progressive 0.0 10 Jump - 21 Progressive 0.1
Fast Invasion 0 Jump - 31 Progressive 107.0 1 Jump - 30 Progressive 111.7 10 Jump - 21 Progressive 155.1
a HEA results from Table 4.58 were adjusted for the time assumed for biological invasions to reach Lake Winnipeg from the point where Missouri River water would be discharged into the Sheyenne River.
Lake Winnipeg was used for this example because the initial HEA indicated that the potential consequences of a biological invasion are much greater for Lake Winnipeg than for the other water bodies considered. The greatest consequences for Lake Winnipeg (155 acres of offsetting restoration) occur for the fast invasion speed and the 10 jump - 21 progressive dispersal scenario. This represents a 180-fold decrease from the 27,750 acres shown in table 4.55, where a range of control system failure rates (including no treatment) was considered. These results indicate that
4 - 142

Red River Valley Water Supply Project FEIS Chapter Four Environmental Impacts
the proposed control systems would be very effective tools for reducing the Project-related risks of biological invasions.
Comparison of Alternatives Risk Reduction in Interbasin Transfer Alternatives The risk analysis (USGS 2005a) and the failure analysis (USGS 2006) demonstrated that, with effective treatment, the risk of transferring invasive species through the Project would be very low for any of the Missouri River import alternatives. Within this very low risk category, however, there are some differences in risk among the alternatives due to differences in intake, treatment, and conveyance features.
Appendix A.5 provides updated rankings of alternative treatment and conveyance risk reductions. The failure analysis (USGS 2006), which was extensively peer-reviewed by technical experts both within and outside of USGS, included a similar categorical-rank analysis to compare alternatives and treatment regimes. Each combination of treatment and alternative was ranked in four categories: method of source water withdrawal, treatment efficacy, conveyance failure risk, and treatment failure risk. The ranks were then summed to calculate an overall risk reduction score. For this FEIS, the rankings presented in USGS (2006) have been updated to reflect changes in proposed treatment and conveyance features that were made after completion of the failure analysis.
Table 4.60 summarizes the combined treatment and conveyance risk reduction for each combination of alternative and treatment process. One additional feature that influences the overall risk reduction is the use of a horizontal well collection system as the intake structure for the Missouri River Import to Red River Valley Alternative. The horizontal well collection system would remove water from the sand and gravel materials under the Missouri River. This would act as a filtering system as the water is collected underground and pumped to the treatment plant. This type of intake provides an additional barrier to the transfer of invasive species.
In characterizing the effectiveness of a treatment process for removal or inactivation of microorganisms, log-inactivation/removal credits are assigned based on efficacy of each treatment process for treating Giardia, viruses, and Cryptosporidium, which are organisms regulated for human health in drinking water. A higher number of credits reflects greater risk reduction (i.e., lower risk). Each water treatment option was assigned a numeric risk reduction value based on the credits it received. For example, pre-treatment, UV, and chlorination received 13 total removal credits, which is the lowest score among treatment options. It was, therefore, given a risk reduction ranking of “one.” Microfiltration, UV, and chlorination received 20 total credits, or the highest score among treatment options, and therefore, received a risk reduction value of “three.” In-filter DAF with UV and chlorination received a risk reduction ranking of “two.”
4 - 143

Red River Valley Water Supply Project FEIS Chapter Four Environmental Impacts
Table 4.60 – Combined Treatment and Conveyance Risk Reduction.
* Proposed treatment method
Alternative Source Water
Withdrawal Risk Reduction Rank 1
Treatment Risk Reduction
Rank
ConveyanceFailure Risk
Rank
Treatment Failure Risk
Reduction Rank
Total Risk Reduction
Score
GDU Import to Sheyenne River Pre-Treatment with UV & Chlorination 0 1 0 1 2
In-Filter DAF with UV & Chlorination*
0 2 0 2 4
Microfiltration with UV & Chlorination 0 3 0 3 6
GDU Import Pipeline Pre-Treatment with UV & Chlorination 0 1 2 1 4
In-Filter DAF with UV & Chlorination 0 2 2 2 6
Microfiltration with UV & Chlorination * 0 3 2 3 8
Missouri River Import to Red River Valley Pre-Treatment with UV & Chlorination 1 1 1 1 4
In-Filter DAF with UV & Chlorination 1 2 1 2 6
Microfiltration with UV & Chlorination * 1 3 1 3 8
1 Source water withdrawal via horizontal well system provides an additional barrier.
As elaborated in USGS (2006) and Appendix A.5, the risk of conveyance failure is related to pipeline material, diameter, and length. The GDU Import to Sheyenne River Alternative was assigned a conveyance risk reduction score of zero. Although this alternative has the lowest risk of conveyance failure from an engineering standpoint, the open water feature of this alternative means that any organism that survived the treatment process and was viable at the end of the pipeline would be released into the environment.
The proposed treatment regimes all include multiple processes. To compare risk reduction related to treatment failure, proposed treatment regimes were ranked based on the number of processes (barriers) and expected failure rates (from peer-reviewed technical literature and industry-compiled data). The addition of the filtration process in the In-filter DAF and Microfiltration options provides an additional barrier that the pre-treatment with UV and chlorination option does not provide. The Microfiltration option has the highest failure risk reduction score, because it has the most redundancy in its treatment regime and is less likely to fail, or to allow a transfer of invasive organisms.
The overall total risk reduction associated with each alternative and treatment option combination is shown in column 6 of table 4.60. As the total risk reduction score increases, the amount of risk (chance of transferring invasive species) associated with that alternative decreases.
4 - 144
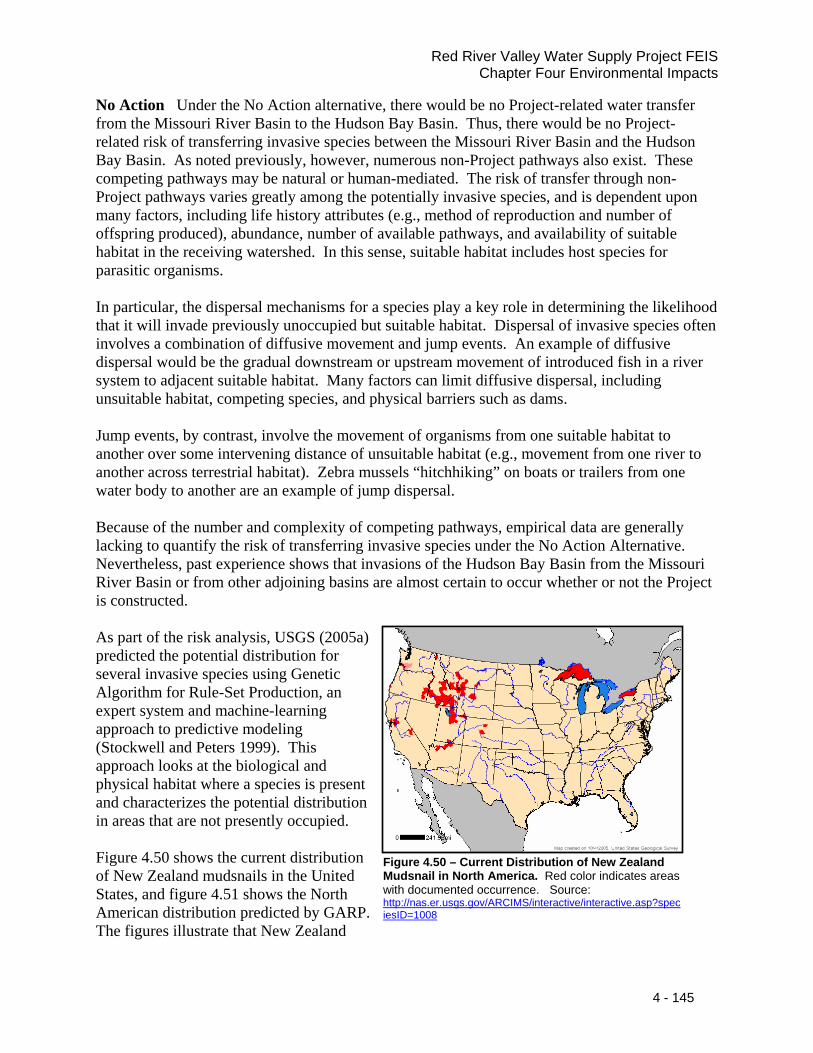
Red River Valley Water Supply Project FEIS Chapter Four Environmental Impacts
No Action Under the No Action alternative, there would be no Project-related water transfer from the Missouri River Basin to the Hudson Bay Basin. Thus, there would be no Project-related risk of transferring invasive species between the Missouri River Basin and the Hudson Bay Basin. As noted previously, however, numerous non-Project pathways also exist. These competing pathways may be natural or human-mediated. The risk of transfer through non-Project pathways varies greatly among the potentially invasive species, and is dependent upon many factors, including life history attributes (e.g., method of reproduction and number of offspring produced), abundance, number of available pathways, and availability of suitable habitat in the receiving watershed. In this sense, suitable habitat includes host species for parasitic organisms.
In particular, the dispersal mechanisms for a species play a key role in determining the likelihood that it will invade previously unoccupied but suitable habitat. Dispersal of invasive species often involves a combination of diffusive movement and jump events. An example of diffusive dispersal would be the gradual downstream or upstream movement of introduced fish in a river system to adjacent suitable habitat. Many factors can limit diffusive dispersal, including unsuitable habitat, competing species, and physical barriers such as dams.
Jump events, by contrast, involve the movement of organisms from one suitable habitat to another over some intervening distance of unsuitable habitat (e.g., movement from one river to another across terrestrial habitat). Zebra mussels “hitchhiking” on boats or trailers from one water body to another are an example of jump dispersal.
Because of the number and complexity of competing pathways, empirical data are generally lacking to quantify the risk of transferring invasive species under the No Action Alternative. Nevertheless, past experience shows that invasions of the Hudson Bay Basin from the Missouri River Basin or from other adjoining basins are almost certain to occur whether or not the Project is constructed.
As part of the risk analysis, USGS (2005a) predicted the potential distribution for several invasive species using Genetic Algorithm for Rule-Set Production, an expert system and machine-learning approach to predictive modeling (Stockwell and Peters 1999). This approach looks at the biological and physical habitat where a species is present and characterizes the potential distributionin areas that are not presently occupied.
d Figure 4.50 shows the current distribution of New Zealand mudsnails in the UniteStates, and figure 4.51 shows the North American distribution predicted by GARP. The figures illustrate that New Zealand
Figure 4.50 – Current Distribution of New Zealand Mudsnail in North America. Red color indicates areas with documented occurrence. Source: http://nas.er.usgs.gov/ARCIMS/interactive/interactive.asp?speciesID=1008
4 - 145

Red River Valley Water Supply Project FEIS Chapter Four Environmental Impacts
mudsnails are likely to become established in the Red River Basin, even in the absence of an interbasin water transfer. These projections are consistent with data on the spread of New Zealand mudsnail in the western United States since it was first recorded in the mid-1990s.
In summary, the Project-related risk of transferring invasive species from the Missouri River Basin to the Hudson Bay Basin is zero under the No Action Alternative. Overall, the risk of transferring invasive species through non-Project pathways would be high, but the risk would vary substantially from species to species, depending on life history attributes and the number and magnitude of potential invasion pathways.
North Dakota In-Basin Alternative The risk of transferring invasive species from the Missouri River Basin to the Hudson Bay Basin would be essentially the same as under the No Action Alternative. It is possible that this alternative, or other in-basin alternatives, could alter existing habitats in the Red River Basin, resulting in completed pathways that enable transfer from the Missouri River Basin to the Hudson Bay Basin. For example, altered flow regimes in the Sheyenne River could create suitable habitat for a species where it did not previously exist. However, the risk that such changes would result in biological invasions appears to be small.
Figure 4.51– Predicted Distribution of New Zealand Mudsnail in North America. Red Color Indicates Areas Included in 75% to 100% of Model Predictions (from USGS 2005a).
A pipeline from Grand Forks to Lake Ashtabula would provide a new pathway for movement of organisms from the Red River to the upper Sheyenne River. Thus, invasive species that reach the Red River through non-Project pathways (e.g., recreational boating) could spread to the upper Sheyenne River through the Grand Forks to Lake Ashtabula Pipeline. At present, no potentially invasive species have been identified in the Red River near Grand Forks that do not also occur in the upper Sheyenne River. In the Red River Basin downstream of Grand Forks, little, if any, effect would be expected.
Red River Basin Alternative The risk of transferring invasive species from the Missouri River Basin to the Hudson Bay Basin would be essentially the same as under the No Action Alternative and would be almost entirely related to non-Project pathways. Additionally, the use of Minnesota groundwater to supplement water supplies in the Red River Valley would pose little risk of transferring unwanted species from the Upper Mississippi River Basin to the Hudson Bay Basin.
GDU Import to Sheyenne River Alternative Due to the open water conveyance, this alternative had a lower risk reduction score than other Missouri River import alternatives (table
4 - 146

Red River Valley Water Supply Project FEIS Chapter Four Environmental Impacts
4.60). However, the risk characterization presented in tables 4.50 through 4.52 suggests that treatment efficacy may be more critical than means of conveyance in determining risk. The In-filter DAF or similarly cost effective biota treatment process was identified for this alternative. The treatment process includes DAF pre-treatment, filtration, UV disinfection, and chlorination.
With this level of treatment, storage in Lake Ashtabula and conveyance down the Sheyenne River would present similar risks of transferring invasive species as other import alternatives that are fully contained in pipe. In particular, with filtration the risk of transferring macroscopic organisms such as fish or aquatic invertebrates would be essentially zero. The proposed treatment would meet SDWA disinfection standards, which would ensure that the risk of transferring microorganisms would be very low. Overall, the risk of a biological invasion occurring through non-Project pathways would be similar to No Action and would be much greater than the risk due to Project pathways for most potentially invasive species.
GDU Import Pipeline Alternative This alternative, along with the Missouri River Import to Red River Valley Alternative, had the highest risk reduction score (table 4.60). The biota treatment process identified for this alternative would be the In-filter DAF option or similarly cost effective treatment. The In-filter DAF process was suggested by Manitoba which includes In-filter DAF, UV disinfection, chlorination and chloramines. With In-filter DAF, the risk of transferring macroscopic organisms would be essentially zero. The proposed treatment would meet SDWA disinfection standards, which would ensure that the risk of transferring microorganisms would be very low. The water would be contained in pipe conveyed directly to treatment and distribution systems within the Red River Valley. Overall, the risk of a biological invasion occurring through non-Project pathways would be similar to No Action, and would be much greater than the risk due to Project pathways for most potentially invasive species.
Missouri River Import to Red River Valley Alternative This alternative, along with the GDU Import Pipeline Alternative, had the highest risk reduction score (table 4.60). The biota treatment process identified for this alternative would be the In-filter DAF option or similarly cost effective treatment. The In-filter DAF process was suggested by Manitoba which includes In-filter DAF, UV disinfection, chlorination and chloramines. The horizontal well intake at the Missouri River would act as a sand filter, which would provide an additional barrier to movement of invasive species. Overall, the risk of a biological invasion occurring through non-Project pathways would be similar to No Action and would be much greater than the risk due to Project pathways for most potentially invasive species.
Cumulative Effects Biological invasions of the Hudson Bay Basin have occurred in the past and will likely occur in the future with or without this Project. With the control systems proposed for interbasin transfer alternatives, the additional risk posed by the Project is negligible, both in terms of the occurrence and timing of future biological invasions. Therefore, no cumulative effects are anticipated.
Summary and Conclusions With the multiple barriers included in all Missouri River import alternatives, the risk of biological invasions through Project pathways would be very low for all potentially invasive species identified. Therefore, no Project-related impacts are anticipated under any of the alternatives evaluated in this FEIS. Even then, however, when all pathways are considered the
4 - 147

Red River Valley Water Supply Project FEIS Chapter Four Environmental Impacts
risk of invasion will never be zero. Competing non-Project pathways will probably lead to establishment of some invasive species in the near future, following the trend that has lead to species invasions of the Red River Basin in the past, even in the absence of imported water from the Missouri River Basin.
Risks exist in a changing landscape of time and space, and the risks associated with invasive species illustrate such an observation. In 1977, the IJC listed pallid sturgeon as a “trash fish” that could be transferred to the Hudson Bay Basin through GDU. Today, the U.S. spends millions of dollars in an effort to recover the pallid sturgeon from the brink of extinction. For some potentially invasive species, however, the IJC’s findings of unacceptable risks of biological invasions resulting from water diversions envisioned in the mid-1970s and early 1980s (see IJC 1977, Section 1) were justified given the control systems proposed at that time. With the control technologies developed in the intervening 30 years and proposed in this FEIS, along with the differences in purpose and scope between this Project and the GDU as envisioned in the 1970s, those findings are not applicable to the Project.
A primary goal of the risk analysis and this FEIS is the identification of risk reduction tools to minimize unintentional introductions of invasive species to the Red River Basin. Elimination of all risks of species invasion may be a management goal, but attaining zero risks is highly unlikely within the context of competing pathways.
On the other hand, the Project-related risk would be negligible with any of the control systems proposed in this FEIS. Although some people may consider elimination of interbasin water transfers a viable risk avoidance option, there are multiple non-Project pathways through which invasive species may be transferred. Hence, this default risk strategy would probably fail within the larger picture, since competing pathways are likely to yield successful species invasions (USGS 2005a). Regardless of whether future Red River Valley water supplies are attained from in-basin or out-of-basin sources, biological invasions of the Hudson Bay Basin may be inevitable given the number of trials recorded through time and across the spatial extent of the Hudson Bay Basin and adjoining basins.
To minimize risks of biological invasions associated with failures in the water treatment, transmission, and distribution systems, a framework for evaluating the condition of water system components and developing long-term monitoring programs must be part of the operation and maintenance of the Project.
Environmental Mitigation
Design Criteria for Project The pipeline design will incorporate adequate coatings, linings, and active cathodic
protection to reduce corrosion.
The pipeline will be placed below the normal frost depth and overlain with sufficient fill to minimize the possibility of freezing.
A computerized supervisory control and data acquisition system will be designed to monitor the entire operation of the biota treatment plant.
4 - 148

Red River Valley Water Supply Project FEIS Chapter Four Environmental Impacts
Standby power units will be located at the biota treatment plant to ensure continuous monitoring in case of a temporary or total power outage.
All waste streams from the biota treatment plant will be retained and disposed of at an approved disposal site within the Missouri River Basin.
Water quality monitoring of raw water sources will be implemented prior to final design to determine how seasonal changes in water quality may affect biota treatment plant design.
A long-term monitoring plan for the biota treatment plant will be developed to assess treatment efficacy.
An emergency response plan will be developed for the biota treatment plant, with special emphasis on preventing potential transfer of invasive species in the event of a plant malfunction.
Reclamation will assume ultimate responsibility for the OM&R of the biota treatment plant.
Reclamation will consult with EPA and other stakeholders as appropriate to develop an adaptive management plan to assess control system efficacy and make modifications to the control system if the risk changes significantly. The plan will be developed in accordance with the Department of the Interior Policy guidance (Order 3270) and the report Adaptive Management, The U.S. Department of Interior Technical Guide (Williams et. al. 2007).
4 - 149

Red River Valley Water Supply Project FEIS Chapter Four Environmental Impacts
Natural Resource Lands
Introduction How would the Project affect wetlands,
grasslands (including native prairie), woodlands, and riparian areas in the area of potential effects?
This section addresses natural resource lands that may be affected either by construction of Project features or by changing flows in the Sheyenne and Red Rivers. Natural resource lands are wetlands, grasslands (including native prairie), woodlands, and riparian areas.
Construction may impact natural resource lands on either a temporary or permanent basis. Temporary impacts generally are short-term and associated with buried pipeline construction, after which land reverts to its previous use, although structures could not be built over the buried pipeline. Permanent impacts are long-term impacts associated with construction of above-ground permanent facilities, such as biota treatment plants, pumping stations, reservoirs, and groundwater well sites. The natural resource lands impacts analysis, detailed in Appendix E and summarized below, shows that over 90% of natural resource land impacts would be temporary or short-term and would result from construction of buried pipelines. A small percentage of permanent impacts could result in the irretrievable commitment of resources. This means that some of the natural resources discussed would be lost due to conversion of land to permanent facilities.
Aerial View of North Dakota Drift Prairie. Pipelines Would Cross Similar Areas (photo courtesy of USGS).
The second way natural resource areas may be impacted is by the Project changing flows in the Sheyenne and Red Rivers. For example, decreased flows during a drought may affect short-term uses but increasing flows during a drought may enhance long-term productivity of river resources. This could affect natural resource lands adjacent to the rivers, called riparian areas. Impacts to riparian areas discussed below are qualitative and were based on the surface water quantity analysis in Appendix B.2.
Methods To analyze the impacts of the proposed Project in the Red River Basin, land use databases developed by various state and federal agencies were used to inventory land cover types within the area of potential effects using GIS. The methods used to compile the inventory are explained in the chapter three “natural resource lands” section and in Appendix E.
4 - 150

Red River Valley Water Supply Project FEIS Chapter Four Environmental Impacts
To compare alternatives, the natural resource lands were narrowed in scope by using estimated construction ROW corridors for features that were sized to meet water demands. Inventories discussed in chapter three were based upon a 400-foot corridor, but impacts in this chapter were assessed on the size of the potential construction area. For instance, the diameter of the pipe to be installed determines the size of the area to be disturbed. Excavation to install a 48-inch-diameter pipe under normal conditions would disturb about 190 feet or less than half the width of the inventoried corridor discussed in chapter three. The potential construction area of a 400-foot-wide corridor one mile in length is 48.5 acres. However, the actual disturbed area to install 1 mile of 48-inch-diameter pipe is 23.0 acres, assuming a 190 foot disturbed width. This means that in one hypothetical mile, 47.5% of the original construction corridor would be impacted to install a 48-inch-diameter pipe.
North Dakota Wetland (http://www.epa.gov/owow/wetlands/bawwg/case/nd.html)
Relative percentages of natural resource land types developed from inventories were then applied to construction ROWs, as explained in Appendix E. This method over-estimated the area of lands that would actually be impacted but gave a relative value to use when comparing alternatives.
To evaluate the impacts of the Project on the Missouri River system, the effects of rising and falling water levels on riparian areas at approximately 40 sites from Fort Peck Lake to the mouth of the Missouri River were evaluated by the Corps through modeling (see Corps 2007:48–49). The Classification of Wetlands and Deepwater
Habitats of the United States (Cowardin et.al.; FWS/OBS 79/31; December 1979) was used for defining and identifying wetlands for this Project.
Palustrine Wetlands contain trees, shrubs, and herbaceous vegetation, and wetlands without woody or herbaceous emergents. These small wetlands are less than 6.6 ft deep at low water and less than 20 acres in size. Palustrine wetlands may be larger than 20 acres if supporting woody or persistent emergent vegetation. An example in the Project area would be prairie potholes.
Lacustrine Wetlands are natural depressional wetlands and deepwater habitats, as well as artificial excavations or impoundments that are more than 6.6 ft deep, regardless of size, or that lack woody or persistent emergent vegetation and are larger than 20 acres. An example in the Project area would be a lake.
Riverine Wetlands are confined within a channel and lack persistent emergent or woody vegetation. An example in the Project area would be a stream.
Results Wetlands Red River Basin No permanent facilities would be built in wetlands (see commitments to environmental mitigation in Appendix L.1 and below), and buried pipeline construction would avoid wetlands where practical. Therefore, there would be no irretrievable commitment of wetland resources and no long-term loss of productivity. When wetlands could not be avoided, buried pipeline construction would result in temporary or short-term disturbance of wetland areas. Table 4.61 shows the potential number of impacted wetland acres for all alternatives by
4 - 151

Red River Valley Water Supply Project FEIS Chapter Four Environmental Impacts
wetland type. All temporary impacts to wetlands would be minimized or mitigated (see environmental mitigation). If impacts to wetlands due to dredge and fill activities could not be avoided during final design of an authorized alternative and these wetlands are within the jurisdiction of the Corps, a 404 permit (Section 404 of the Clean Water Act) would be required. Table 4.61 – Consequences of No Action and Estimated Impacts of Proposed Buried Pipelines on Wetlands.
Alternative Pipeline Feature (Miles)
Palustrine (acres)
Lacustrine (acres)
Riverine (acres)
Total Wetlands
(acres) Wetlands Crossed
No Action * No Action 2 0 0 2 7
North Dakota In-Basin
Grand Forks to Lake Ashtabula Pipeline
(79) 45.9 12.0 0 57.9 156
Red River Basin Minnesota
Groundwater and Pipeline
(37)
37.3 0 1.1 38.4 126
GDU Import to Sheyenne River
McClusky Canal to Lake Ashtabula
Pipeline (123)
158.5 0.0 5.2 163.7 598
GDU Import Pipeline
McClusky Canal to Fargo and Grand
Forks Pipeline (217)
213.3 9.0 8.7 231.0 735
Missouri River Import to Red River Valley
Bismarck to Fargo Pipeline
(284) 290.7 20.5 9.6 320.8 732
* The No Action Alternative data are from Appendix A.2. Wetlands were calculated using ArcGIS and the National Wetlands Inventory.
Wetlands are complex ecosystems in which groundwater and surface water may interact, but because groundwater cannot be directly observed, its role in hydrology of wetlands is often difficult to assess. Groundwater impacts are discussed earlier in this chapter. Table 4.62 quantifies how much land overlying aquifers is composed of different types of wetlands. Table 4.63 estimates the impact area for each aquifer, although the actual impact to wetlands would likely be less.
Table 4.62 – Percent of Aquifer Covered by Wetlands.
1 Partial and full development is the same.
Groundwater Feature Total Aquifer Area (acres)
Palustrine (%)
Lacustrine (%)
Riverine (%)
Total Wetlands (%)
Moorhead Aquifer 5,419 1.6 1.5 0.4 3.5Buffalo Aquifer1 35,459 1.6 0.0 0.1 1.7Otter Tail Surficial Aquifer and Pelican River 453,238 11.9 20.1 0.2 32.2
West Fargo North 17,118 1.0 0.0 1.4 2.3West Fargo South 8,009 1.7 0.0 0.0 1.7Brightwood, Gwinner, Milnor Channel, Spiritwood 229,748 15.5 4.1 0.0 19.6
4 - 152

Red River Valley Water Supply Project FEIS Chapter Four Environmental Impacts
Table 4.63 – Estimated Impact Area of Aquifer Features.
Groundwater Feature
Total ROW Area
(acres)
Palustrine (acres)
Lacustrine (acres)
Riverine (acres)
Total Wetlands
(acres) Wetlands Crossed 3
Stream Crossings
4
Moorhead ASR1 25 0.4 0.4 0.1 0.9 13 1Buffalo Aquifer 2 121 1.9 0.0 0.2 2.1 32 2Buffalo Aquifer - Full Development 254 4.0 0.0 0.4 4.4 272 18
Otter Tail Surficial Aquifer + Pelican River Sand Plain Aquifer Development
2,088 248.7 420.2 3.6 672.4 516 34
West Fargo North ASR 253 2.5 0.0 3.5 5.9 47 3
West Fargo South ASR 499 8.4 0.0 0.0 8.4 76 5
Brightwood, Gwinner, Milnor Channel, Spiritwood Aquifer
1,531 237.1 62.8 0.6 300.6 145 9
1 No ROW was estimated for the Moorhead ASR feature, so 25 acres or 4 miles of buried pipeline is assumed 2 No ROW was estimated in the Buffalo Aquifer, so 10 miles at 100' width was estimated, totaling 121 acres 3 Wetland crossings are based on a Project average of 3.18 crossings per mile of buried pipeline 4 Stream crossings are based on the Project average of 15.2 wetland crossings for each stream crossing Note: Assumptions are based on averages
Table 4.64 summarizes and ranks all temporary consequences or impacts to wetlands from Project alternatives. The details for the methods used to estimate these are in Appendix E.
Table 4.64 – No Action Consequences and Estimated Temporary Impacts to Wetlands by Proposed Buried Pipelines.
Alternative Total
Wetlands (acres)
Wetlands Crossed
Stream Crossings
Total Impacts to Wetlands
Index 1 Ranking
No Action 2 7 0 9 1North Dakota In-Basin 376 468 51 895 3Red River Basin 1,029 954 87 2,070 6
GDU Import to Sheyenne River 164 598 16 778 2
GDU Import Pipeline 537 1165 67 1,769 5
Missouri River Import to Red River Valley 639 1044 57 1,740 4
1 The wetland index is a wetlands impact indicator that equals the sum of total wetland acres plus, the number of wetlands crossed, plus the number of streams crossed. This index is used for a relative comparison of alternatives.
No Action Alternative This alternative probably would have the smallest consequence to wetlands, because of the few acres disturbed and the small number of wetlands crossed. The index of total impacts to wetlands was nine.
4 - 153

Red River Valley Water Supply Project FEIS Chapter Four Environmental Impacts
North Dakota In-Basin Alternative Of all the action alternatives, this one ranks third best in temporary impacts to wetlands, with a total wetlands impact index of 895. No permanent impacts to wetlands are anticipated, as wetland areas would be avoided by construction of above-ground facilities (see commitments in “environmental mitigation”).
Red River Basin Alternative This alternative would have the most temporary impacts to wetlands with the total wetlands impacts index of 2,070. No permanent impacts to wetlands are anticipated because wetland areas would be avoided by construction of above-ground permanent facilities (see commitments in “environmental mitigation”).
GDU Import to Sheyenne River Alternative This alternative would have the second fewest temporary impacts to wetlands, with a wetlands impact index of 778. No permanent impacts to wetlands are anticipated; since wetlands would be avoided when constructing permanent above-ground facilities (see commitments in “environmental mitigation”).
GDU Import Pipeline Alternative This alternative ranks fifth best in temporary impacts to wetlands for the action alternatives. The index of total impacts to wetlands was calculated to be 1,769. No permanent impacts to wetlands are anticipated, as wetlands would be avoided when constructing permanent above-ground facilities (see commitments in “environmental mitigation”).
Missouri River Import to the Red River Alternative This alternative ranks fourth best in temporary impacts to wetlands for all action alternatives. The index of total impacts to wetlands was calculated to be 1,740. No permanent impacts to wetlands are anticipated, as wetlands would be avoided when constructing permanent above-ground facilities (see commitments in “environmental mitigation”).
Wetlands Missouri River System No Action Alternative Based on the Corps’ (2007) model, comparison of this alternative to current conditions shows a 1% increase in wetland habitat during the period of record and no change during a 1930s-type drought.
North Dakota In-Basin, and Red River Basin Alternative These alternatives would not affect Missouri River wetlands, because there would be no withdrawals from the Missouri River.
GDU Import to Sheyenne River Alternative, GDU Import Pipeline Alternative, and Missouri River Import to Red River Valley Alternative Based on the Corps’ (2007) model, these alternatives, which propose to withdrawal water from the Missouri River system, would not change Missouri River wetlands during a drought, according to the 1930s period of analysis. Modeling of the period of record estimates that the GDU Import to Sheyenne River and Missouri River Import to Red River Valley Alternatives would increase wetland acres by about 1%, while the GDU Import Pipeline Alternative would not affect wetland acres. This is due to reservoirs dropping and intra-system regulation.
4 - 154

Red River Valley Water Supply Project FEIS Chapter Four Environmental Impacts
Grasslands – Native Prairie There would be a potential to temporarily impact native prairie habitat during construction of the buried pipeline. Native prairie habitats are a limited grassland resource in the Northern Great Plains. Therefore, the analysis evaluated the potential impacts to this natural resource. Table 4.65 summarizes and ranks the estimated number of native prairie habitat acres that could be impacted by construction of alternative features within the estimated ROW for each alternative, as well as the native prairie acres that could be permanently impacted by the construction of above-ground permanent facilities, such as water treatment plants, pumping station, reservoirs and groundwater well sites. Data in table 4.65 shows maximum potential losses of native prairie habitat. These habitats would be avoided where practical. (see the environmental mitigation section).
If native prairie habitat could not be avoided during the construction of buried pipeline, the acreage disturbed by construction of an above-ground facility would be reseeded to native prairie. If the actual footprint of permanent above-ground facilities construction could not avoid native prairie habitats there would be an irretrievable commitment of this resource. The effects of temporary and permanent impacts would be mitigated with environmental commitments (see the environmental mitigation section).
Table 4.65 – Consequences of No Action and Estimated Temporary and Permanent Impacts to Native Prairie (acres).
Alternative Temporary (acres)
Permanent (acres)
Total (acres)
Ranking
No Action Not available; expected to be minimal 0 0 1
North Dakota In-Basin 347 35 382 3Red River Basin 228 36 264 2
GDU Import to Sheyenne River 936 10 946 4
GDU Import Pipeline 1,020 22 1042 5Missouri River Import to Red River Valley 1,303 67 1370 6
No Action Alternative There are no anticipated consequences or impacts to native prairie habitat associated with these alternatives.
North Dakota In-Basin Alternative This alternative ranks third best among the action alternatives for total native prairie impacts. An estimated 382 acres may be impacted but 347 of these acres would be short-term or temporary impacts.
Red River Basin Alternative This alternative could impact 264 acres of native prairie, which ranks second best among the proposed alternatives, but 228 of these acres would only be temporarily impacted. However, potential permanent impacts to native prairie habitat are higher than permanent impacts for the GDU Import to the Sheyenne River Pipeline and the GDU Import Pipeline and half of the permanent impacts for the Missouri River Import to Red River Valley Alternatives.
4 - 155

Red River Valley Water Supply Project FEIS Chapter Four Environmental Impacts
GDU Import to Sheyenne River Alternative This alternative ranks fourth among the alternatives for total impacts to native prairie, but it would have the fewest permanently impacted acres among the proposed alternatives. Of the 946 acres of native prairie habitat that could be impacted, 936 acres would have short-term or temporary impacts.
GDU Import Pipeline Alternative An estimated 1,042 acres of native prairie may be impacted by this alternative. Of these potential impacts, 1,020 acres would be temporarily impacted. This alternative ranks fifth in total native prairie impacts but second in permanent impacts among the action alternatives.
Missouri River Import to the Red River Alternative This alternative ranks last among the alternatives with 1,370 acres of total native prairie impacts of which 1,303 acres are short-term or temporary impacts. This alternative would permanently impact the greatest number of acres of native prairie.
Woodlands Woodlands could be temporarily impacted by buried pipeline installation. Table 4.66 summarizes and ranks the estimated acres of forested or woodland areas that could be impacted by construction of alternative features within the estimated ROW for each alternative, and woodlands that could be permanently impacted by the construction of above-ground permanent facilities, such as water treatment plants, pumping station, reservoirs and groundwater well sites. Methods used to estimate these acreages are explained in Appendix E. The actual disturbed area with an above-ground facility would be much less and much of the land would revert to its previous use. The effects of temporary and permanent impacts would be mitigated with environmental commitments (see environmental mitigation section).
Woodlands Along the Sheyenne River
Table 4.66 – Estimated Temporary and Permanent Impacts to Woodlands.
Alternative Temporary (acres)Permanent
(acres) Total
(acres) Ranking
No Action 1 0.5 1.5 1 North Dakota In-Basin 65 7 72 3 Red River Basin 368 58 426 6
GDU Import to Sheyenne River 28 0.3 28 2
GDU Import Pipeline 103 2 105 4
Missouri River Import to Red River Valley 111 6 117 5
4 - 156

Red River Valley Water Supply Project FEIS Chapter Four Environmental Impacts
Woodlands or forested areas may also be impacted by groundwater withdrawals. These impacts would be short-term. Table 4.66 estimates potential forested acres associated with aquifers proposed as Project features. See the groundwater section of this chapter for more information on these aquifers.
No Action Alternative This alternative would have minimal consequences to woodlands with an estimated 1.5 acres of woodlands impacted.
North Dakota In-Basin Alternative This alternative could impact an estimated 72 acres of woodlands, noting that most of these impacts would be short-term or temporary. Seven acres would result in a possible irretrievable commitment of woodland resources. In comparison to the other action alternatives this ranks second best in terms of impacts to woodland acres.
Red River Basin Alternative This alternative has the greatest potential to impact woodland acres due to the fact that it proposes Project features in a forested area of Minnesota. There are an estimated 426 acres of woodland impacts, but again more than 80% of these potential impacts are short-term or temporary. Permanent or irretrievable impacts could occur on 58 acres of woodlands.
GDU Import to Sheyenne River Alternative This alternative ranked best among the action alternatives with potential impacts estimated to be 28 acres, with almost all of the impacts being temporary. Less than one acre of woodlands could be subject to an irretrievable commitment of this resource if these could not be avoided.
GDU Import Pipeline Alternative This alternative ranked third best among all action alternatives with the estimated impacts to woodlands being 105 acres, of which 103 acres would be temporarily impacted. The remaining two acres could be permanently impacted, resulting in an irretrievable commitment of this resource.
Missouri River Import to the Red River Alternative This alternative ranked fourth among the action alternatives with an estimated 117 acres of woodland impacts, of which more than 90% are temporary impacts. Six acres of woodlands could be subject to an irretrievable commitment of this resource if these could not be avoided
Riparian Areas Red River Basin Short-term impacts to riparian areas would occur due to construction of buried pipelines where rivers would be crossed. Table 4.67 lists rivers to be crossed by buried pipelines under each alternative.
Riparian areas may also be affected by alternatives that would use the Sheyenne and Red Rivers to convey Project water to the service area. These flow impacts to riparian areas could be short-term or long-term. Riparian areas can include wetlands, grasslands, and woodlands, but exclude agricultural land, such as row crops, small grains, and fallow lands and developed land, such as commercial, industrial, and residential land cover, as shown in table 4.68.
4 - 157

Red River Valley Water Supply Project FEIS Chapter Four Environmental Impacts
Table 4.67 – Rivers and Streams Crossed by Buried Pipeline Construction.
Alternative Feature Number of Crossings Rivers Crossed
No Action* NA NA NA
North Dakota In-Basin
Grand Forks to Lake Ashtabula
Pipeline 30
Antelope Creek, Buffalo Coulee, Cole Creek, Elm Coulee, Fresh Water Coulee, Goose River, Maple River, Red Lake River, Red River, Salt Water Coulee, Sheyenne River, Wild Rice River
Red River Basin
Minnesota Groundwater and
Pipeline 33
Antelope Creek, Buffalo River, Fresh Water Coulee, Hay Creek, Otter Tail River, Pelican River, Red Lake River, Red River, Salt Water Coulee, Sheyenne River, Wild Rice River
GDU Import to Sheyenne River
McClusky Canal to Lake Ashtabula
Pipeline 16
Antelope Creek, Baldhill Creek, Fresh Water Coulee, Pitcaim Creek, Red Lake River, Red River, Salt Water Coulee, Sheyenne River, Wild Rice River
GDU Import Pipeline
McClusky Canal to Fargo and Grand
Forks Pipeline 39
Baldhill Creek, Buffalo Coulee, Cole Creek, Elm Coulee, Elm River, Fresh Water Coulee, Goose River, Maple River, Pipestem Creek, Red River, Rush River, Salt Water Coulee, Sheyenne River, Wild Rice River
Missouri River Import to Red River Valley
Bismarck to Fargo Pipeline 36
Apple Creek, Buffalo Coulee, Buffalo Creek, Cole Creek, Elm Coulee, Elm River, Fresh Water Coulee, Goose River, James River, Maple River, Ransom Creek, Red Lake River, Red River, Rush River, Salt Water Coulee, Sheyenne River, Swan Creek
* - The No Action Alternative has no proposed buried pipelines, so no river crossings are estimated. River crossings were determined using ArcGIS and the USGS National Hydrography Dataset (1999).
Table 4.68 – Riparian, Agricultural, and Developed Acres Within 0.25 Miles of Rivers in the Areas of Potential Effects.
River Total Acres Agricultural Acres Commercial, Industrial, and Residential Riparian Acres
Sheyenne River 74,202 44,661 2,398 27,143
Red River 105,778 69,093 4,983 31,702
The riparian area influenced by water was estimated by to be ¼ mile on either side of rivers. Tables 4.69 and 4.70 show the estimated wetlands, grasslands, and forested areas within the riparian influence area along the Sheyenne and Red Rivers. See Appendix E and figure E.1 for an illustration and explanation of the riparian influence area.
Table 4.69 – Potentially Impacted Wetlands Within the Riparian Influence Area along the Sheyenne and Red Rivers.
River Palustrine Lacustrine Riverine Total Wetland BasinsSheyenne
River 3,028 5,118 3,129 11,274 1,874
Red River 2,721 399 11,615 14,734 974
4 - 158

Red River Valley Water Supply Project FEIS Chapter Four Environmental Impacts
Table 4.70 – Potentially Impacted Forests and Grasslands in Riparian Areas Along the Sheyenne and Red Rivers.
River Forest (Acres) Grasslands (Acres)Sheyenne River 14,788 3,374
Red River 19,042 0
Natural resource lands within the riparian zone of the Sheyenne and Red Rivers would be affected by changes in flow in the rivers. The surface water quantity analysis in this chapter provides information about how flows in the Sheyenne and Red Rivers would change as a result of each alternative. In the analysis of surface water quantity, flows were divided into five categories ranging from extreme low flow to extreme high flow. Extreme low flow events could negatively impact riparian natural resource lands, especially during a 1930s-type drought.
Impacts to riparian natural resource lands were assessed by noting the change in the number of months in the extreme low flow category for each alternative. Using these data, impacts and consequences were assessed by determining if the number of months of extreme low flow decreased creating a beneficial effect, increased causing an adverse effect, or essentially remained the same to minimally affect riparian natural resource lands. Table 4.71 shows the number of months in the extreme low flow category during a 1930s-type drought, and table 4.72 shows the effects each alternative would have on riparian natural resource lands during a 1930s-type drought by comparing the number of extreme low flow months for each action alternative to the No Action Alternative. To assess the consequences the No Action Alternative, it was compared to the 2005 condition. See the water quantity impacts section for details on the 2005 condition.
Table 4.71 – The Number of Months in the Extreme Low Flow Category During a 1930s-Type Drought (120 Months). Extreme Low Flows Are Flows That Could Negatively Affect Riparian Areas.
Location 2005 Condition No Action
North Dakota
In-Basin
Red River Basin
GDU Import to Sheyenne
River
GDU Import
Pipeline
Missouri River Import to Red River
Valley Sheyenne River
Below Baldhill Dam
63 61 23 60 0 68 64
Lisbon 25 47 9 30 0 35 34 Kindred 48 59 15 51 0 59 60 West Fargo 64 92 80 61 61 46 51
Red River
Wahpeton 91 92 92 92 60 96 92 Fargo 90 110 108 107 26 71 110 Grand Forks 87 83 86 78 66 70 72
Emerson 81 78 82 75 64 68 68
4 - 159

Red River Valley Water Supply Project FEIS Chapter Four Environmental Impacts
Table 4.72 – Consequences of No Action and Summary of Effects to Riparian Areas by Alternative During a 1930s-Type Drought (1931 -1940).
Location No Action*
North Dakota
In-Basin
Red River Basin
GDU Import to Sheyenne
River
GDU Import
Pipeline
Missouri River Import to Red River Valley
Sheyenne River
Below Baldhill Dam m B m B A m Lisbon A B B B B B Kindred A B B B m m West Fargo A B B B B B
Red River Wahpeton m m m B m m Fargo A m m B B m Grand Forks m m m B B B Emerson m m m B B B
* To assess the consequences of the No Action Alternative, data were compared to the 2005 current condition. All action Alternatives were compared to the No Action Alternative. B Beneficial Effect (at least 10% fewer months in the Extreme Low Flow category) A Adverse Effect (at least 10% more months in the Extreme Low Flow Category) m Minimal Effect (less than +/-10% change in the number of months in the Extreme Low Flow Category)
Table 4.73 shows the number of months in the extreme low flow category during the 71-year period of record, and table 4.74 shows the effects each alternative would have on riparian natural resource lands over the long-term by comparing the number of extreme low flow months for each action alternative to the No Action Alternative. To evaluate the consequences of the No Action Alternative, flows under No Action were compared to flows under the 2005 condition. See the “Red River Basin surface water quantity” section earlier in chapter four for details on the 2005 condition.
Table 4.73 – The Number of Months in the Extreme Low Flow Category During the 71-year Period of Record (852 months).
Note: Extreme low flows could negatively affect riparian areas.
Location 2005 Condition
No Action
North Dakota
In-Basin
Red River Basin
GDU Import to Sheyenne
River
GDU Import
Pipeline
Missouri River Import to Red River Valley
Sheyenne River Below Baldhill Dam
302 286 197 287 0 268 262
Lisbon 118 136 78 120 1 129 129 Kindred 98 105 45 101 2 110 111 West Fargo 97 164 127 101 44 72 76
Red River
Wahpeton 98 99 99 99 66 99 105 Fargo 97 165 134 133 34 81 155 Grand Forks 96 101 98 89 74 75 81
Emerson 96 97 98 89 75 76 82
4 - 160

Red River Valley Water Supply Project FEIS Chapter Four Environmental Impacts
Table 4.74 – Consequences of No Action and Summary of Effects to Riparian Natural Resource Lands Areas during a 71-year Period of Record.
Location No Action*
North Dakota In-Basin
Red River Basin
GDU Import to
Sheyenne River
GDU Import
Missouri River Import to Red River
Valley Sheyenne River
Below Baldhill Dam m B m B m m Lisbon B B B B m m Kindred m B m B m m West Fargo B B B B B B
Red River B Wahpeton m M m B m m Fargo B B B B B m Grand Forks m M B B B B Emerson m M m B B B
* To assess the consequences of No Action, data were compared to the 2005 Current Condition. All Action Alternatives were compared to the No Action Alternative. B Positive Effect (at least 10% fewer months in the extreme low flow category) A Adverse Effect (at least 10% more months in the extreme low flow Category) m Minimal Effect (less than +/-10% change in the number of months in the extreme low flow Category)
No Action Alternative Along the Sheyenne River, there would be adverse consequences to riparian natural resource lands during a 1930s-type drought. Over the 71-year period of record, two gages show benefits, and two gages show minimal changes in the riparian zone. Along the Red River, riparian natural resource lands would change minimally during both the 1930s-type drought and the 71-year period of record.
North Dakota In-Basin Alternative When compared to the No Action Alternative, this alternative would benefit natural resource lands at four gages located in the riparian zone along the Sheyenne River, both during a 1930s-type drought and over the 71-year period of record. Along the Red River, natural resource lands located in the riparian zone would be minimally affected during either the 1930s-type drought or the 71-year period of record, except at the Fargo gage during a 1930s-type drought where there would be beneficial effects.
Red River Basin Alternative When compared to the No Action Alternative, natural resource lands within the riparian zone along the Sheyenne River would generally benefit from this alternative during a 1930s-type drought and over the 71-year period of record. During a 1930s-type drought three gages show benefits while the Below Baldhill Dam gage shows minimal effects. For the period of record Lisbon and West Fargo gages show a beneficial effect, and the Below Baldhill Dam and Kindred gages show a minimal effect to the riparian zone.
Along the Red River, changes to flow would minimally affect riparian natural resource lands along all gages during a 1930s-type drought. Over the 71-year period of record, Fargo and Grand Forks gages show a beneficial effect, and Wahpeton and Emerson gages show a minimal effect to the riparian zone.
GDU Import to Sheyenne River Alternative When compared to No Action, this alternative benefits natural resource lands located near all gages in the riparian areas adjacent to the Sheyenne and Red Rivers during both the 71-period of record and a 1930s-type drought.
4 - 161

Red River Valley Water Supply Project FEIS Chapter Four Environmental Impacts
GDU Import Pipeline Alternative Along the Sheyenne River, this alternative would adversely impact riparian natural resource lands near the Below Baldhill Dam gage during a 1930s-type drought with beneficial effects for the Lisbon and West Fargo gages. Riparian natural resource lands near the Kindred gage would be minimally impacted. For the 71-year period of record the Grand Forks and Emerson gages show beneficial effects to riparian natural resource lands while the Wahpeton and Fargo gages show minimal effects to these lands.
For natural resource lands in the riparian zone along the Red River, this alternative shows beneficial effects at all gages except the Wahpeton gage. The Wahpeton gage shows minimal effects during both a 1930s-type drought and the 71-year period of record.
Missouri River Import to Red River Valley Alternative Along the Sheyenne River, there would be a minimal effect to riparian natural resource lands during a 1930s-type drought at the Below Baldhill Dam and Kindred gages while the Lisbon and West Fargo gages show beneficial effects. Over the 71-year period of record, all gages except the West Fargo gage show minimal effects. Riparian natural resource lands would benefit from flows during the 71-year period of record near the West Fargo gage.
Along the Red River, there would be minimal effect on riparian natural resource lands in the Upper Red River (at Wahpeton and Fargo), and a beneficial effect to these lands in the Lower Red River (at Grand Forks and Emerson), during both a 1930s-type drought and the 71-year period of record.
Riparian Areas Missouri River System No Action Alternative Based on the Corps’ (2007) model, when comparing this alternative to current conditions, there would be no change in riparian habitat during the period of record but a 1% increase in riparian areas is expected during a 1930s-type drought
North Dakota In-Basin, and Red River Basin Alternative The No Action Alternative would have no consequences associated with riparian areas in the Missouri River system. The proposed in-basin alternatives would also have no impacts to this resource area because these do not involve withdrawals from the Missouri River.
GDU Import to Sheyenne River Alternative, GDU Import Pipeline Alternative, and Missouri River Import to Red River Valley Alternative Based on the Corps’ (2007) model, the withdrawal of water from the Missouri River system as designed by these import alternatives would have a negligible effect on Missouri River riparian habitats. The data show that the riparian habitat initially decreases for each of the alternatives and then increases gradually during the remainder of the 1930s-type drought. This would be expected with drier conditions in the reservoir and river reaches.
Cumulative Effects With implementation of environmental mitigation, the action alternatives would minimally impact natural resource lands. These include no permanent impacts to wetlands and minimal disturbance to grasslands and woodlands. Additionally, there are no known projects present or
4 - 162

Red River Valley Water Supply Project FEIS Chapter Four Environmental Impacts
future that would make these resources especially vulnerable to incremental effects beyond current agricultural practices. Therefore, cumulative impacts to these resources in the Red River Basin would be minimal.
Cumulative impact assessment for Sheyenne and Red River riparian areas is difficult. Drought, particularly extended drought, can detrimentally impact riparian areas (Kingery 1997). Some of the alternatives evaluated worsened drought impacts, while other alternatives augmented stream flows and benefited riparian areas during drought.
A geomorphology analysis on flooding and erosion on the Sheyenne River is discussed previously in this chapter. The analysis evaluated whether the proposed alternatives would increase flooding and erosion in comparison to the No Action Alternative. The conclusion was that operational flows along the Sheyenne River from the alternatives would not increase erosion. Impacts to riparian areas from erosion are not anticipated for any of the alternatives.
Summary No Action The No Action Alternative would have the fewest consequences to natural resource lands from construction with a wetlands impact index of 9, no impacts to native prairie, and 1.5 acres of impacts to woodlands. However, there would be adverse consequences to many of the Red River Valley area wetlands and riparian areas, because communities would tap all potential surface water and groundwater sources to meet their water needs, particularly during a 1930s-type drought. Along the Sheyenne River, there would be adverse consequences to riparian natural resource lands during a 1930s-type drought, with mixed benefits and minimal effects in the riparian areas over the 71-year period of record. Along the Red River, riparian natural resource lands would change minimally during both the 1930s-type drought and the 71-year period of record.
North Dakota In-Basin When comparing all natural resource land impacts among the action alternatives, this alternative would have relatively low impacts with a wetlands impact index of 895, including an estimated 382 acres of impacts to native prairie and 72 acres of impacts to woodlands. The majority of impacts would be short-term or temporary. This alternative would benefit natural resource lands at four gages located in the riparian zone along the Sheyenne River, both during a 1930s-type drought and over the 71-year period of record. Along the Red River natural resource lands located in the riparian zone would be minimally affected during either the 1930s-type drought or the 71-year period of record except at the Fargo gage during a 1930s-type drought where there would be beneficial effects. Overall, this alternative ranks second among the action alternatives in terms of potential impacts to natural resource lands.
Red River Basin Alternative This alternative would have the greatest impacts to natural resource lands, with a wetlands impacts index of 2,070, including 264 acres of impacts to native prairie and 426 acres of impacts to woodlands. The majority of impacts would be short-term or temporary. Natural resource lands within the riparian zone along the Sheyenne River would generally benefit from this alternative during a 1930s-type drought and over the 71-year period of record. During a 1930s-type drought three gages show benefits while the Below Baldhill Dam gage shows minimal
4 - 163

Red River Valley Water Supply Project FEIS Chapter Four Environmental Impacts
effects. For the period of record, Lisbon and West Fargo gages show a beneficial effect, and Baldhill Dam and Kindred gages show a minimal effect to the riparian zone. Changes to flows on the Red River would minimally affect riparian natural resource lands along all gages during a 1930s-type drought. Over the 71-year period of record, Fargo and Grand Forks gages show a beneficial effect, and Wahpeton and Emerson gages show a minimal effect to the riparian zone.
GDU Import to Sheyenne River Alternative This alternative has relatively low estimated impacts to natural resource lands when compared to the other action alternatives. It is estimated to rank among the best alternatives for fewest impacts to natural resources. Analysis estimated a total wetlands impact index of 778,946 acres of impacts to native prairie, and 28 acres of impacts to woodlands. The majority of impacts would be short-term or temporary. This alternative benefits natural resource lands located near all gages in the riparian areas adjacent to the Sheyenne and Red Rivers during both the 71-period of record and a 1930s-type drought.
GDU Import Pipeline Alternative This alternatives ranks similar to the Red River Basin Alternative for natural resource lands impacts, including a wetlands impacts index of 1,769, estimated native prairie impacts of 1,370 acres, and potentially 105 acres of impacts to woodlands. The majority of impacts would be short-term or temporary. Along the Sheyenne River, this alternative would adversely impact riparian natural resource lands near the Below Baldhill Dam gage during a 1930s-type drought with beneficial effects for the Lisbon and West Fargo gages. Riparian natural resource lands near the Kindred gage would be minimally impacted. For the 71-year period of record the Grand Forks and Emerson gages show beneficial effects to riparian natural resource lands while the Wahpeton and Fargo gages show minimal effects to these lands. Natural resource lands in the riparian zone along the Red River show beneficial effects at all but the Wahpeton gages, which show minimal effects during both a 1930s-type drought and the 71-year period of record.
Missouri River Import to Red River Valley Alternative This alternatives ranks in the middle of all the action alternatives when estimating the natural resource lands impacts with a wetlands impact index of 1,740, including an estimated 1,370 acres of impact to native prairie and an estimated 117 acres of impacts to woodlands. The majority of impacts would be short-term or temporary. Along the Sheyenne River, there would be a minimal effect to riparian natural resource lands during a 1930s-type drought at the Below Baldhill Dam and Kindred gages while the Lisbon and West Fargo gages show beneficial effects. Over the 71-year period of record, all gages except the West Fargo gage show minimal effects. Riparian natural resource lands would benefit from flows during the 71-year period of record near the West Fargo gage. Along the Red River, there would be minimal effect on riparian natural resource lands in the upper Red River and beneficial effects to these lands in the lower Red River during both a 1930s-type drought and the 71-year period of record.
Environmental Mitigation General
• Reclamation and North Dakota recognize that there is uncertainty in addressing natural resource issues. To manage this uncertainty Reclamation and North Dakota will develop an adaptive management plan. The plan will be developed in accordance with the Department of the Interior Policy guidance (Order 3270) and the report Adaptive
4 - 164

Red River Valley Water Supply Project FEIS Chapter Four Environmental Impacts
Management, The U.S. Department of Interior Technical Guide (Williams et al. 2007). The Impact Mitigation Team will play a role in the adaptive management plan for natural resources.
• Mitigation for fish and wildlife losses incurred because of construction of the Project shall be on an acre-for-acre basis, based on ecological equivalency, concurrent with Project construction, as required by DWRA.
• Before every construction season, the co-leads will meet with the Service and the appropriate state wildlife agencies to determine a procedure to minimize impacts to natural resource lands. A reconnaissance survey of construction easements will be conducted to identify and verify wetlands, grasslands, woodlands, and riparian areas subject to disturbance and/or destruction in the Project area during construction activities. In addition, surveys will be completed for rare natural communities prior to any surface disturbance in areas containing potential habitat. The Impact Mitigation Team will be consulted, as necessary, to determine appropriate avoidance and/or protection measures. If adverse impacts cannot be avoided, appropriate procedures and requirements for mitigation will be discussed with the Impact Mitigation Team.
Impact Mitigation Team – A group of representatives, such as federal, state, and tribal agencies and other entities, established to advise Reclamation and Garrison Diversion on Project mitigation. The purpose of this team is to ensure that Project activities are completed concurrently and in full compliance with all environmental commitments in NEPA documents, such as the Final EIS and Record of Decision. This team will also address other relevant state and federal environmental rules and regulations, such as the Endangered Species Act and the National Historic Preservation Act.
• Disturbance of vegetation will be minimized through construction site management (e.g., utilizing previously disturbed areas, using existing easements when feasible, and designating limited equipment/materials storage yards and staging areas).
• Buried pipelines will be constructed adjacent to or within existing highway ROWs and roadways where practical.
• Strip and respread topsoil on buried pipeline corridors, pump station sites, and all ROWs, except when the buried pipeline is installed by a trencher or a plow. Where topsoil depths exceed 12 inches, the top 12 inches will be salvaged. Sufficient topsoil to facilitate revegetation should be segregated from subsoil during trenching operations and returned after backfilling. Gravel may be placed around the edge of pump station and storage reservoirs to control weeds.
Pipelines Will Be Constructed Adjacent to Highways and Roads Where Practical.
4 - 165

Red River Valley Water Supply Project FEIS Chapter Four Environmental Impacts
• Appropriate measures will be taken in compacted areas and areas with large rocks to develop a good seedbed.
• Ensure compaction of trench backfill to prevent settlement for mainline segments. Inspect the line after one year to check for subsidence and correct subsidence problems and reseed, if necessary, where these occur.
• Mound soil over the trench of small diameter pipelines (approximately 6 inches or less); allow a year for settlement, and then grade trench to match existing topography.
• Place all excavated material from streams or wetlands above the high water mark, when water is present, where possible. Where not possible, minimize the placement of soil materials in streams or wetlands.
• Employ erosion control measures where necessary to reduce wind and water erosion. Erosion and sediment controls will be monitored daily during construction for effectiveness, particularly after storm events, and only the most effective techniques will be used.
Wetlands Would Be Avoided by Pipeline Construction Where Practical and by Above-Ground Facility Construction.
• Identify buried pipeline segments requiring special reclamation efforts using soils maps and field survey data during final engineering design.
• To avoid erosion and minimize hydrologic function impacts, construction methods that temporarily block natural flows would be limited in duration. If temporary blocks are necessary, flexible water barriers or similar technique will be used.
• Place no permanent or temporary structures in any floodplain, riparian area, wetland or stream that would interfere with floodwater movement.
• Groundwater well sites will be properly spaced and placed at a suitable depth to avoid and/or minimize impacts on nearby wetlands and rivers.
Wetlands • Avoid buried pipeline construction and associated activities in all wetlands where
practical. If construction is necessary in or near wetlands, timing of construction will be deferred to late summer or fall to avoid high water conditions and to decrease disruption of waterfowl or other wildlife during the nesting season, where practical.
4 - 166

Red River Valley Water Supply Project FEIS Chapter Four Environmental Impacts
• Avoid construction of all above-ground permanent facilities in wetlands.
• When large wetlands are along road ROW, the buried pipeline will be placed in the ROW where possible to reduce impacts.
• Prior to beginning construction through Conservation Reserve Program lands or program wetlands, the Natural Resource Conservation Service, Consolidated Farm Services Agency, and respective landowners will be consulted to ensure that landowner eligibility in farm subsidy programs (if applicable) will not be jeopardized and that Swampbuster requirements will not be violated by construction.
• Backfill trenches to restore an impermeable layer in wetlands, where function depends on the impermeable layer.
Post-Construction Overview of MR&I Pipeline
• Use diaphragms or cutoff collars where soils and engineering evaluations indicate these are needed to prevent draining wetlands. The Impact Mitigation Team in consultation with agencies with jurisdiction will review engineering construction specifications for wetland crossings. The Impact Mitigation Team can recommend changes in specifications or routing to minimize impacts where necessary.
• Avoid placing trench spoil material within wetland boundaries.
• Where existing North Dakota wetlands cannot be reconstructed in their current location, create or restore wetlands on an acre per acre basis as defined by the GDU Mitigation Ledger.
• Whenever possible, Minnesota wetlands impacted during Project construction will be restored to pre-Project conditions. Where existing Minnesota wetlands cannot be reconstructed in their current location, consultation with the state of Minnesota will be initiated, as necessary, to determine appropriate avoidance and/or protection measures. If adverse impacts cannot be avoided, state of Minnesota wetland mitigation procedures will be followed.
• Discharges of fill material associated with unavoidable crossings of wetlands or intermittent streams will be carried out in compliance with provisions of Section 404 of the Clean Water Act and the nationwide and/or Project-specific permit requirements of the Corps. The Natural Resource Conservation Service may evaluate isolated, non-navigable wetlands outside the jurisdiction of the Corps for jurisdiction and impacts.
4 - 167

Red River Valley Water Supply Project FEIS Chapter Four Environmental Impacts
• The best available information will be used to assess potential impacts to local wetlands that may be impacted by well placement and aquifer withdrawals.
Stream Crossings • Initiate construction when streams are dry whenever practical. Construction will
directional bore under perennial streams, where practical. At flowing intermittent streams, directional borings perpendicular to flows will be used whenever practical. Where it is not practical to bore, construction will open cut through intermittent streams. The Impact Mitigation Team will review engineering specifications for intermittent stream crossings in consultation with agencies with jurisdiction to ensure compliance with state regulations. The Impact Mitigation Team can recommend specification changes to minimize impacts where necessary. Use standard reclamation practices to reclaim vegetation and minimize erosion.
• Place silt barriers, fabric mats, or other effective means on slopes or other eroding areas where necessary to reduce sediments into stream channels and wetlands until vegetation is re-established. This will be accomplished as soon as practical after disturbance activities.
• Pipelines will be installed at depths of 6 feet or more below channel beds at waterway crossings.
• Avoid discharge of fill material at unavoidable stream crossings, as specified under provisions of Section 404 of the CWA.
• Prevent contamination of water at construction sites from spills of fuel, lubricants, and chemicals, by following safe storage and handling procedures in accordance with state laws and regulations.
Grasslands • Avoid buried pipeline and permanent facilities
construction and associated activities in all native prairie areas where practical.
• Whenever possible, native prairie affected during Project construction will be restored. Where existing North Dakota native prairie cannot be re-seeded in its current location, then mitigation procedures will be reviewed by the Impact Mitigation Team and will follow GDU Mitigation Ledger procedures.
Tallgrass Prairie (Photo Courtesy J. T. Lokemoen, USGS http://biology.usgs.gov/s+t/SNT/noframe/gr139f03.htm)
• Where existing Minnesota native prairie cannot be re-seeded in its current location, then mitigation will be ecologically equivalent and acre for acre, with review by the Impact Mitigation Team.
4 - 168

Red River Valley Water Supply Project FEIS Chapter Four Environmental Impacts
• Reseed disturbed native grassland with native species; seed mix to be determined during the final design and reviewed by the Impact Mitigation Team. Reseed planted grassland with a seed mixture appropriate for the site and water, if necessary, during establishment.
• Areas requiring re-vegetation will be seeded during the first appropriate season after redistribution of topsoil. If reseeding cannot be accomplished within 10 days of topsoil replacement, erosion control measures will be implemented to limit soil loss. Local native grass species should be used (mixture to be reviewed by the Impact Mitigation Team).
• Grassland and highway ROW reseeding will be completed prior to May 15, where feasible. If spring reseeding is not feasible, fall reseeding will be performed between August 15 and October 15 (prior to ground freezing).
• To reduce erosion, water bars will be installed at specified intervals, depending upon soil type, grade, and terrain on disturbed slopes with grades of 6% or greater. Water bars would not be used in areas of row cropping.
• Vegetation and soil removal will be accomplished in a manner that will prevent erosion and sedimentation.
• Control noxious weeds, as specified under state law, within the pipeline corridors during and following construction. Apply herbicides only in accordance with labeled instructions and state, federal, and local regulations.
• Work with landowners to defer grazing on newly seeded areas for a minimum of two years.
• Monitor grass-seeding plantings for three years. Where seeding does not adequately succeed, reseed with appropriate species.
Woodlands and Riparian Areas • Avoid woodland and riparian areas where practical when
constructing buried pipeline and above-ground permanent facilities.
• Whenever possible, woodland and riparian areas impacted by the Project will be restored. Where existing North Dakota woodland and riparian areas cannot be restored in original locations, then mitigation will be reviewed by the Impact Mitigation Team and will follow GDU Mitigation Ledger procedures. Where existing Minnesota woodland and riparian areas cannot be
Woodland and Riparian Areas Would be Avoided by Project Construction.
4 - 169

Red River Valley Water Supply Project FEIS Chapter Four Environmental Impacts
restored in original locations, then mitigation will be in ecological equivalents, acre for acre, and be reviewed by the Impact Mitigation Team.
• Replace and replant trees of similar species off site at a ratio of two trees planted for each tree removed, when shelterbelts, riparian woodlands, or woodland vegetation cannot be avoided.
• Control weed growth in tree plantings and monitor tree plantings for three years. Where plantings do not adequately succeed, replant with appropriate species.
4 - 170

Red River Valley Water Supply Project FEIS Chapter Four Environmental Impacts
Wildlife
Introduction How would the Project affect wildlife as reflected by impacts to wildlife habitat including
wetlands, grasslands (including native prairie), woodlands, and riparian areas in the area of potential effects?
This section addresses the effects of alternatives on terrestrial wildlife other than special status species (federally protected species and species of special concern). Most wildlife concerns can be addressed by considering the effects of the Project on wildlife habitat, as represented by natural resource lands discussed previously and protected areas managed at least in part for wildlife, as discussed in the next section.
Many species use woody plants directly as nest sites or cover (e.g. raptors and squirrels) and others use some woody plants as food. Other species, such as waterfowl, nest in emergent marsh plants and other suitable sites. Riparian vegetation and native prairie are cover for mammals and birds. Protected public areas also support habitat for wildlife.
Whitetail Deer
Methods The analysis of impacts on wildlife species considered changes in wildlife habitat represented by wetlands, woodlands, riparian areas, and native prairie areas. Impacts to wildlife essentially are limited to short-term or temporary disturbances and loss of habitat from construction of buried pipelines and other features, such as pumping plants, storage, intakes, treatment facilities, power lines, groundwater wellfields, and ASR fields. Additional impacts to riparian vegetation by Sheyenne and Red River flow changes are also considered. The method for developing potential impact data for buried pipeline and other construction activities was discussed in the natural resource lands section.
Table 4.75 quantifies potential impacts to wildlife habitat on wetlands, woodlands and native prairie areas by alternative. Tables 4.71 and 4.72 in the Natural Resource Lands section quantify impacts to riparian areas, which is the basis for evaluating impacts to wildlife habitat discussed in this section. Although protected public areas also support habitat for wildlife, protected lands are not specifically addressed as wildlife habitat in this section. This was because protected lands are managed for more than just wildlife, impacts to protected lands would be minimal, and wildlife habitat on protected lands is covered by environmental mitigation in this and the protected lands section.
4 - 171

Red River Valley Water Supply Project FEIS Chapter Four Environmental Impacts
Most wildlife populations are resilient and able to adapt to cycles of habitat abundance. Impacts to the two groups most likely impacted, mammals and migratory birds, are discussed. However, a few species with small populations could experience impacts from temporary disturbances and loss of habitat. These species are evaluated in the federally listed species and species of special concern section.
Results No Action Alternative Mammals Direct consequences to wildlife could include direct mortality or temporary displacement of mammals caused by construction activities (denning, nesting, and burrowing species). However, most changes likely would be temporary in nature, allowing mammals to return. Given the highest concentration of wildlife is likely in wetlands, wooded areas, riparian areas, and native prairie areas, construction activities in these areas would have the greatest consequences to wildlife. This alternative has the least consequences when compared to the action alternatives. This alternative does not include new buried pipelines and only an estimated 52 acres of disturbance, including 2 acres of wetlands, 2 acres of woodlands, and a very small amount of native prairie grassland. During a 1930s-type drought, consequences would likely worsen, as natural resource conditions already would be stressed. For example, the decrease in flows during a 1930s-type drought would adversely impact riparian areas (see table 4.71 and 4.72), thus adversely impacting wildlife habitat in these areas.
Table 4.75 – Acres of Potential Wildlife Habitat Impacted by the Action Alternatives Compared to the Consequences of No Action.
Action Alternatives
Wetlands (acres)
Woodlands (acres)
Native Prairie (acres)
Total Wildlife Habitat (acres)
Ranking
No Action 2 2 0 4 1 North Dakota In-Basin 376 72 382 830 2 Red River Basin 1,029 426 264 1,719 5 GDU Import to Sheyenne River 164 28 946 1,138 3 GDU Import Pipeline 537 105 1,042 1,684 4 Missouri River Import to Red River Valley 639 117 1,370 2,126 6
Migratory Birds Direct impacts to migratory birds from action alternatives could include direct and indirect mortality or temporary displacement of birds caused by construction activities (nest destruction and nesting disturbance). Most impacts would be short-term or temporary in nature, allowing birds to return after the habitat is restored. Given the highest concentration of birds is likely in natural resource areas and protected areas, construction activities in these areas would be expected to have the greatest impact on migratory birds.
Western Meadowlark, a Migratory Bird
4 - 172

Red River Valley Water Supply Project FEIS Chapter Four Environmental Impacts
The No Action Alternative consequences to migratory birds differ in context from consequences to mammals. Both are measured by acres of habitat; therefore an adverse consequence to riparian areas would also be an adverse consequence to migratory bird habitat.
Action Alternatives The description of direct and indirect impacts of action alternatives to mammals and migratory birds would be similar to that described for the consequences of the No Action Alternative. Therefore, mammals and migratory bird impacts are called wildlife impacts for the remaining discussion on action alternatives. While direct and indirect impacts are similar in context to the No Action Alternative i.e., including direct and indirect mortality or temporary displacement of wildlife, they are not similar in scope. Action alternative impacts are larger in scope because of the extent of construction activities relative to each alternative. The natural resource lands section describes the scope or extent of those impacts. Wildlife habitat impacts are estimated in acres. Table 4.75 shows the acres of disturbed habitats mammals and migratory birds are likely to inhabit. Commitments to environmental mitigation specific to mammals and migratory birds mitigate impacts (see below).
North Dakota In-Basin Alternative This alternative would affect 830 acres of wildlife habitat, which ranks this alternative second best among all alternative and first among the action alternatives. The majority of impacts would be short-term or temporary. During a 1930s-type drought, riparian areas would likely experience beneficial effects to wildlife habitat along the Sheyenne River while riparian areas along the Red River would minimally affect wildlife habitat (see tables 4.71 and 4.72).
Red River Basin Alternative This alternative ranks last among all alternatives because it would affect 1,719 acres of wildlife habitat. The majority of impacts would be short-term or temporary. During a 1930s-type drought, riparian areas would likely experience beneficial effects to wildlife habitat along the Sheyenne River except below Baldhill Dam where impacts are minimal. Riparian areas along the Red River would minimally affect wildlife habitat (see tables 4.71 and 4.72).
GDU Import to the Sheyenne River Alternative This alternative would affect 1,138 acres of wildlife habitat, which ranks this alternative second best in comparison to the other action alternatives. The majority of impacts would be short-term or temporary. During a 1930s-type drought, riparian areas would likely experience beneficial effects to wildlife habitat along both the Sheyenne and Red Rivers (tables 4.71 and 4.72).
GDU Import Pipeline Alternative This alternative would impact 1,684 acres of wildlife habitat, which is twice the impact of the North Dakota In-Basin Alternative. The majority of impacts would be short-term or temporary. During a 1930s-type drought, wildlife habitat in riparian areas would benefit from improved Sheyenne River flows near the Lisbon and West Fargo gages, while the Kindred gage area indicates minimal impacts and adverse effects just below Baldhill Dam. Wildlife habitat in riparian areas would likely benefit near most gages along the Red River, with the exception of minimal impacts near the Wahpeton gage (tables 4.71 and 4.72
4 - 173

Red River Valley Water Supply Project FEIS Chapter Four Environmental Impacts
Missouri River Import to the Red River Valley Alternative This alternative would affect 2,126 acres of wildlife habitat, which is greater than all of the other action alternatives. The majority of impacts would be short-term or temporary. During a 1930s-type drought, riparian areas would experience beneficial effects to wildlife habitat along the Sheyenne River near the Lisbon and West Fargo gages, while the Below Baldhill Dam and Kindred gages would experience minimal impacts. Wildlife habitat impacts at riparian areas would be beneficial at the Grand Forks and Emerson gages along the Red River with minimal impacts near the Wahpeton and Fargo gages (see tables 4.71 and 4.72).
Cumulative Effects Impacts to wildlife from the action alternatives would be relatively minor and temporary. There are no known or reasonably foreseeable actions that would elevate these minor Project impacts to be of greater magnitude. Cumulative impacts to natural resource lands are discussed in the previous section and are representative of cumulative impacts to wildlife habitat.
Summary With mitigation the impacts to wildlife, including mammals and migratory birds, would be minor and temporary for all alternatives. The No Action Alternative would cause the least consequence to wildlife habitats, as reflected by 52 acres of construction impacts. The Missouri River Import to the Red River Valley Alternative would affect the most wildlife habitat (1,808 acres). The North Dakota In-Basin Alternative would affect the fewest habitat acres of all of the action alternatives (830 acres) followed by the GDU Import to the Sheyenne River Alternative (1,138). Although these two alternatives are close in comparison, riparian habitats showed greater benefits for the GDU Import to the Sheyenne River Alternative than the North Dakota In-Basin Alternative. The GDU Import Pipeline Alternative would affect 1,682 acres of wildlife habitat followed closely by the Red River Basin Alternative with 1,719 acres of wildlife habitat impacts.
Environmental Mitigation Mammals
• Areas potentially hazardous to wildlife will be adequately protected (e.g., fenced, netted) to prevent access to wildlife.
• To protect wildlife and their habitat, Project-related travel will be restricted to existing roads and Project easements; no off-road travel will be allowed, except when approved through the Impact Mitigation Team and in accordance with an adaptive management plan.
• Wildlife-proof fencing will be used on reclaimed areas, if it is determined that wildlife species and/or livestock are impeding successful vegetation establishment.
Migratory Birds • Before every construction season, the co-leads will meet with the Service and the
appropriate state wildlife agencies to determine a procedure to minimize impacts to migratory birds. This will be done in accordance with an adaptive management plan. Construction activities that would occur between January 1 and July 31 will be discussed.
4 - 174

Red River Valley Water Supply Project FEIS Chapter Four Environmental Impacts
• In areas with migratory bird crossing concerns, all permanent and temporary power or communication lines associated with the Project will be buried, where practical. If burial is not practical, the lines will be designed and located to avoid raptor collisions and/or electrocutions pursuant to Avian Power Line Interaction Committee protocol (1994, 1996, 2005, and 2006). Expanded protection for above-ground power lines will include a number of measures. There will be a provision of greater than 90-inch spacing between conductors or grounding features. Exposed conducting features will be appropriately insulated. Anti-perching devices will be used, as appropriate. Steel pole use will be avoided, where practical. Line aviation markers will be used where power lines are adjacent to significant habitat areas, e.g. adjacent to wetlands or where wetlands are crossed, native prairie, and feeding areas.
Great Blue Heron, a Migratory Bird
4 - 175

Red River Valley Water Supply Project FEIS Chapter Four Environmental Impacts
Federally Protected Species and Species of Special Concern
Introduction How would the Project affect federally protected species and species of special concern
in the area of potential effects?
Under NEPA, the effects of the alternatives on federally protected species and species of special concern in the Project area are measured against the No Action Alternative. The No Action Alternative is a projection of environmental conditions in 2050 without the Project; it is not “current conditions.” Therefore, the analysis in this section evaluates the effects of the action alternatives in comparison to the No Action Alternative, in compliance with the NEPA.
Assessing impacts under the ESA is different than under the NEPA. Section 7 of the ESA implementing regulations (50 CFR 402) states that the effects of a proposed action are added to the environmental baseline to determine if the species likely would be jeopardized by a proposed action. The environmental baseline includes the past and present impacts of all federal, state, or private actions, and other human activities in the action area. It also includes anticipated impacts of all proposed federal actions in the action area that have already undergone formal or early section 7 consultation and the impact of state and private actions that are contemporaneous with the consultation in process (50 CFR 402.02). The environmental baseline is a “snapshot” of a species health at a specified point in time. Usually, this is the current condition.
Appendix G.1 includes a biological assessment, which is an ESA analysis of the proposed action (the GDU Import to the Sheyenne River Alternative) compared to current conditions. The ESA requires consultation with the Service on discretionary federal actions that may affect federally listed threatened and endangered species or designated critical habitat. In the interest of streamlining and integrating the NEPA and ESA processes, Reclamation prepared a biological assessment for the preferred alternative. This is allowed, as described in the Section 7 consultation regulations (50 CFR 402). The Service concurred with Reclamation’s determination in the biological assessment, that the action is not likely to adversely affect any listed species or critical habitat.
State listed and Canadian species are evaluated as species of concern. More details of this analysis are in Appendix G.2.
Assessing Potential Impacts of the Federal Preferred Alternative Following the publication of the SDEIS Reclamation further explored the nature and extent of any potential adverse impacts to interior least terns and piping plovers for the Missouri River import alternatives, including the preferred alternative. Specifically, Reclamation worked with the Service and the Corps on this issue.
Reclamation has evaluated the potential impacts, including cumulative, of the Corps’ operation of the Missouri River system on river uses and resources with the Project in place. Water supply projects like this one were addressed in the Service’s (2000) biological opinion as interrelated
4 - 176

Red River Valley Water Supply Project FEIS Chapter Four Environmental Impacts
and interdependent, so long as these projects do not cause the Corps to change operation of the Missouri River system. Furthermore, effects to federally listed species, specifically the interior least tern and piping plover, from the Corps’ operation of the Missouri River have been described already by the Corps. The descriptions are in the biological assessments of their operations, the Service’s biological opinions, and the Corps’ subsequent implementation of those opinions.
In general, most of the effects of the proposed water import to the Red River Valley for the Project would be relatively small, because the volume of water to be withdrawn from the Missouri River would be small. Therefore, no changes to the Corps’ present Missouri River system operations under the 2004 Master Manual are anticipated.
Comments were received on the SDEIS from tribes, state and federal organizations, and interested and potentially affected members of the public. During Reclamation’s review of comments and in consultation with the Service and the Corps, new information became available. Additional analyses relevant to federally listed species were conducted in response to these comments and consultations. Reclamation worked with the Corps to update their previous analysis of Missouri River Effects (Corps 2006). The difference between the Corps 2006 study and the Corps 2007 analysis for the Project was that the 2007 study accounted for increasing sedimentation rates over time. Sedimentation rates for the Corps Master Manual EIS and the Project’s DEIS and SDEIS modeling studies were held constant.
Sedimentation rates were found to affect the amount of storage space in the reservoirs. As sediments accumulate in each reservoir, the amount of storage available at a given surface elevation diminishes. Depending on the rates of sediment depositions and increased depletions, the reservoir levels could be higher or lower during the modeling period. Generally, as sedimentation accumulates, the water surface elevations in the reservoirs rise relative to declines in the Missouri River mainstem system storage. This new and refined Corps analysis (2007) represents the best available scientific and commercial information available to evaluate the effects of the proposed Project on Missouri River resources.
Methods Analysis of potential impacts used the resource information described in the affected environment in FEIS chapter three to establish current conditions, which was compared to No Action to identify the consequences of No Action. No Action is defined in Appendix A.2. Conditions under the No Action Alternative, described in the various resources section in chapter four, were compared to the effects of the action alternatives.
Analyses of impacts to resources (water quantity, water quality, groundwater, aquatic communities, natural resource lands, and protected lands) were used to analyze potential impacts to federally protected species and species of special concern. The resource analyses took into account applicable environmental commitments (see Appendix L.1). Additionally, federal and state lists and databases were searched to determine the distribution and occurrence of these species within the Project area. Potential impacts to species in the Project area were accessed. Federally threatened and endangered species potentially in the Project area are listed in table 4.76 and species of special concern in Appendix G.2.
4 - 177

Red River Valley Water Supply Project FEIS Chapter Four Environmental Impacts
Table 4.76 – Federally Listed Species That May Be Present in the Project’s Areas of Potential Effects.
Crit
ical
Hab
itat
Fede
ral S
tatu
s1
Nor
th D
akot
a In
-B
asin
Red
Riv
er B
asin
GD
U Im
port
to
Shey
enne
Riv
er
GD
U Im
port
Pi
pelin
e M
isso
uri R
iver
Im
port
to R
ed
Riv
er V
alle
y
Bald Eagle T3 X X X X X Interior Least Tern E X X X Piping Plover X T X X X Whooping Crane E X X X Pallid Sturgeon
E X X X Canada Lynx T X
Gray Wolf E/D2 X X X X X
Dakota Skipper C X X X X X Western Prairie-fringed Orchid T X X X X X 1 T = threatened, E = endangered, C = candidate. Federally listed species information is from a Service memorandum dated January 5, 2005. 2 The gray wolf is delisted in MN and in the portion of North Dakota north and east of the Missouri River upstream to Lake Sakakawea and east of the centerline of Highway 83 from Lake Sakakawea to the Canadian border and remains endangered in western ND. On February 8, 2007, the Service announced that the final rule to remove the endangered status of the gray wolf and the wolf would no longer be protected under the ESA after March 12, 2007 (Federal Register (72) 26: 6052-6103). 3 As of August 8, 2007, under the authority of the Endangered Species Act of 1973, as amended (Act), the U.S. Fish and Wildlife Service removed the bald eagle from the Federal List of Endangered and Threatened Wildlife.
Life histories were also reviewed for all species. Life history information was evaluated against potential habitat in the Project area. Much of this habitat information was obtained during analysis of natural resource lands, aquatic communities, and in the next section on protected lands.
Evaluation of Missouri River species impacts are described in a Corps (2007) report, Red River Valley Water Supply Project Analysis of Missouri River Effects which is attached as a supporting document and is summarized in Appendix C. This report was used to assess potential impacts. In this report, the Corps used a modeling technique developed for their Missouri River Master Water Control Manual EIS (Missouri River Basin Mainstem Reservoir System Master Water Control Manual Review and Update, Final Environmental Impact Statement). These modeling studies used the best available information and were widely reviewed (Corps 2004a). Some of these models addressed potential impacts to Missouri River species, including the bald eagle, interior least tern, piping plover, and pallid sturgeon. The models were developed to compare relative differences among the alternatives, rather than to predict absolute terms. EISs generally focus on expressing impacts in relative terms, when absolute terms are not available or cannot be reasonably obtained.
4 - 178

Red River Valley Water Supply Project FEIS Chapter Four Environmental Impacts
This is how the Corps explained modeling issues in their Missouri River Master Manual EIS (section 6.5.6, pages 6.11-12):
For some of the environmental resource models, quantification of the specific resource of concern was not possible. A related resource was, instead, modeled to try to understand the effect of changes in system operations on the specific resource of concern. For example, a model could not be developed to identify changes in the populations or the fledge ratios of the least tern and piping plover, two endangered or threatened bird species that nest on islands and sandbars in the river or along the shores of the mainstem lakes. A model could be developed, however, that addressed changes in clear sand habitat for the river reaches, which are the primary locations that nesting had occurred since the lakes were all first filled in 1967. During the development of the model, it became apparent that not all of the processes affecting the creation, maintenance, and loss of this habitat could be quantified and incorporated into the model. No relationship has been quantified for the geomorphic aspects of sandbar formation and destruction. This required the acceptance of a basic assumption. The factor that most significantly affects the geomorphic processes was essentially the same among the alternatives (i.e., relatively high flows for an extended period). These high flows of adequate duration occur consistently among all of the alternatives modeled as they generally occur in the higher runoff years in the upper basin. The model, therefore, can provide some insight as to the relative differences among the many alternatives because it is responsive to the river flows that vary among the alternatives, and it is representative of the relative effects of the alternatives on the two bird species.
Effects
Is Not Likely to Adversely Effect – the appropriate conclusion when effects to listed species are expected to be discountable or insignificant or completely beneficial. Discountable Effects – are those extremely unlikely to occur. Insignificant Effects – relate to the size of the impact and should never reach the scale where take occurs. Take – includes to harass, harm, hunt, shoot, wound, kill, trap, capture, or collect, or attempt to engage in any such conduct.
The modeling techniques used in the Corps’ reports (2005b; Corps 2006; Corps 2007) were developed to compare the effects of the proposed Missouri River import alternatives and not to forecast the future. Models have limitations. Many factors that influence future economic and environmental performance were not modeled and could not be modeled. However, the studies were based on the best available scientific information and supplied the information necessary for a reasoned choice of alternatives, as required by NEPA. The models used by the Corps for this Project furnished representative values useful for comparing the alternatives; these were not absolute numbers.
Direct impacts to federally listed species and species of special concern could include direct and indirect mortality or temporary displacement of species caused by construction activities (habitat destruction and habitat disturbance). For Missouri River import alternatives this would be habitat losses associated with Missouri River depletions in combination with Missouri River system operation. Most potential impacts would likely be temporary in nature, allowing species to return after habitat is restored. Given that the highest concentration of species is likely to occur in natural and protected areas, construction activities in these areas would be expected to have the greatest potential for impacts (see impacts to natural resource lands). More information is in appendixes G.1 and G.2.
4 - 179
Red River Valley Water Supply Project FEIS Chapter Four Environmental Impacts
Results Federal Species No impacts were identified for any of the alternatives’ construction or operation activities for the federally listed whooping crane, Canada lynx, gray wolf, and Dakota skipper. Environmental commitments (chapter four and Appendix L.1) will be incorporated into all the action alternatives to avoid potential adverse effects; e.g., conducting pre-construction surveys and avoiding these species’ habitats. Therefore, because environmental commitments would be incorporated to avoid potential adverse impacts, and any potential adverse impacts would not result in take and are extremely unlikely to occur, no adverse impacts are anticipated for the whooping crane Canada lynx, gray wolf, and Dakota skipper. Additional information on these species is in Appendix G.1 of the SDEIS. Although the SDEIS evaluated all of the alternatives in this appendix, the FEIS has substantially revised Appendix G.1 to evaluate only the proposed action (the preferred alternative) under the ESA.
Construction activities associated with all action alternatives could potentially affect the bald eagle. These potential impacts could be caused by construction activities within ¼ mile of active nesting or winter roost sites and construction of new electrical lines. Project features such as intakes and permanent structures would be located away from known nesting and roosting sites. Electric transmission lines and pole configuration would be designed to avoid raptor electrocution. These measures are included as commitments to avoid and minimize adverse impacts to bald eagles from construction and related activities. These commitments will be incorporated into construction specifications to avoid potential adverse effects to bald eagles that might nest in areas of potential effects in the future.
Potential impacts that could occur to other federally listed species, including the interior least tern, piping plover, pallid sturgeon, western prairie fringed orchid, and the bald eagle are discussed below for each alternative.
Species of Special Concern Species of special concern are:
• Species listed as species of conservation priority – level I (North Dakota Game and Fish Department 2004).
• Species listed in accordance with Minnesota’s Endangered Species Statute (Minnesota Statutes, Section 84.0895), as well as associated Rules (Minnesota Rules, Parts 6212.1800 to 6212.2300 and 6134).
• Species listed by Canada’s COSEWIC and protected by the Canadian law SARA.
North Dakota’s Species of Conservation Priority – Level I State Species No impacts were identified for any of the alternatives’ construction activities for North Dakota Species of Conservation Priority. These species are listed in table G.2.2 of Appendix G.2. Environmental commitments would be incorporated in any action alternative to avoid potential adverse effects (see chapter four resource sections and Appendix L.1). Pre-construction surveys would be conducted to avoid these species’ habitats. Therefore, because environmental commitments would be incorporated to avoid potential adverse impacts, and any potential adverse impacts would not result in take and are extremely unlikely to occur, minimal impacts are anticipated to
4 - 180

Red River Valley Water Supply Project FEIS Chapter Four Environmental Impacts
any of these species from any action alternative. Additional information and analysis are in Appendix G.2.
Minnesota Listed Species No impacts were identified for any of the alternatives’ construction activities for Minnesota’s state listed species in the Project area. These species are listed in table G.2.2 of Appendix G.2. Environmental commitments would be incorporated in any action alternative to avoid potential adverse effects by conducting pre-construction surveys and avoiding these species’ sites (see chapter four resource sections and Appendix L.1.) Therefore, because environmental commitments would be incorporated to avoid potential adverse impacts, and any potential adverse impacts would not result in take and are extremely unlikely to occur, minimal impacts are anticipated for these species from any action alternative. Additional analysis and information is in Appendix G.2.
Canadian Federally Listed Species No impacts were identified for any of the alternatives for Canadian-listed species that could occur in the Project area. These Canadian-listed species are listed in table G.2.2 of Appendix G.2 All the action alternatives that would use Missouri River water include treatment and control systems that would minimize the risk of transfer of invasive species. Furthermore, water quality impacts were found to be minimal or temporary for all action alternatives. Therefore, Reclamation has determined that the action alternatives would not likely adversely affect (insignificant or discountable impacts) Canada’s species as identified and analyzed in Appendix G.2. Additional information on these species is in Appendix G.2.
Consequences of No Action and Impacts of Action Alternatives No Action Alternative Under this alternative, consequences to federally listed and species of special concern could include direct or indirect mortality or temporary displacement of some species caused by non-federal construction activities (habitat destruction and habitat disturbance). However, most impacts are anticipated to be temporary in nature allowing species to return after habitat is restored.
Given that the highest concentration of these species is likely in natural areas; including wetlands, wooded areas, riparian areas, native prairie, and protected areas; construction activities in these areas would be expected to have the greatest impacts (see impacts to natural resource lands). As noted in the natural resource lands discussion in this chapter, impacts to these areas for the No Action Alternative are anticipated to be about 52 acres. This is based on the projects identified in chapter two and in Appendix A.2, No Action Alternative. However, there is insufficient information to determine the exact locations or all actions that might take place to meet future water needs without the Project. Therefore, the exact extent of potential consequences for federally listed and species of special concern under the No Action Alternative cannot be quantified with existing information.
Some impacts could be expected to species located near the Sheyenne River, especially the western prairie fringed orchid. This would be due to increased use of the river and aquifers during a 1930s-type drought. Significant water withdrawals in these areas, particularly from the Sheyenne Delta Aquifer, have potential to affect the western prairie fringed orchid.
An evaluation of current conditions and the No Action Alternative identified potential consequences to the western prairie fringed orchid. Considering the substantial current water
4 - 181

Red River Valley Water Supply Project FEIS Chapter Four Environmental Impacts
shortage and predictions of future shortages, it is likely that groundwater use would increase in the Red River Valley by 2050 without implementation of this Project. Many North Dakota aquifers in the Red River Valley are at or near a sustainable rate of human use (North Dakota State Water Commission 1995; North Dakota State Water Commission 2005a).
It is difficult to predict where groundwater would be obtained, but the Sheyenne Delta Aquifer could be impacted by sustained or increased withdrawals. In general, withdrawing more water from an aquifer lowers the water table in and adjacent to the new wellfield. A continuous high rate of pumping from an aquifer reduces natural discharge, evapotranspiration, storage, or other human use associated with aquifers and groundwater use. Intermittent or short-term use of an aquifer may allow recharge to a pre-use state. Whatever future water use occurs, there are likely to be consequences to western prairie fringed orchids.
Increasing populations and additional federal projects on the Missouri River could increase withdrawals of water from the Missouri River by the year 2050. Appendix C describes an analysis that predicts an additional depletion of about 557,500 acre-feet over current conditions by 2050. The Corps (2007) models identified potential consequences of the No Action Alternative, as compared to current conditions, for these species:
• Bald eagle – riparian habitat, riverine warm water fish habitat, and physical habitat for native river fish that provide forage for the bald eagle.
• Interior least tern and piping plover – riverine least tern and piping plover habitat, riverine warm water fish habitat, and physical habitat for native river fish that provide forage for least terns.
• Pallid sturgeon – riverine warmwater fish habitat and physical habitat for native river fish, which provide forage for pallid sturgeon.
The Corps (2007) analysis when comparing the No Action Alternative to current conditions shows very small positive and negative results for the bald eagle (<3%) during a 1930s-type drought and the period of record (1930-2002)). There would be very small positive changes in riparian habitat (1%), small negative changes in riverine warm water fish habitat (3%), and no change in physical habitat for native river fish during a 1930s-type drought, when compared to current conditions. During the period of record there would be no changes in riparian habitat and physical habitat for native fish and small decreases in riverine warm water fish habitat (3%). For the No Action Alternative, any potential consequences would not result in take and would be extremely unlikely to occur. No consequences are anticipated for the bald eagle, when the No Action Alternative is compared to current conditions.
The Corps (2007) analysis, when comparing the No Action Alternative to current conditions, shows small negative changes and no changes for the pallid sturgeon (<3%) during a 1930s-type drought and the period of record (1930-2002). There would be no change in physical habitat for native river fish and very small decreases in riverine warmwater fish habitat (3%) during a 1930s-type drought when compared to current conditions. During the period of record there would be no changes in physical habitat for native fish and small decreases in riverine warm water fish habitat (2%). For the No Action Alternative, any potential consequences would not result in take and would be extremely unlikely to occur. No consequences are anticipated for the pallid sturgeon, when the No Action Alternative is compared to current conditions.
4 - 182

Red River Valley Water Supply Project FEIS Chapter Four Environmental Impacts
The Corps (2007) analysis shows changes for the interior least tern and piping plover, when comparing the No Action Alternative to current conditions. There were decreases of 18% in riverine tern and plover habitat during a 1930s-type drought. There were also small decreases in riverine warm water fish habitat and no change in physical habitat for native river fish during a 1930s-type drought. Fish habitat changes could potentially affect small fish that are prey species for the interior least tern. However, the changes were small (warmwater fish habitat) or did not occur (native fish physical habitat).
During the period of record there would be no changes in physical habitat for native fish and small decreases in riverine warm water fish habitat. During the period of record there would be small decrease in tern and plover habitat (3%).
For the No Action Alternative, any potential consequences would not result in take and may or may not occur depending on the realization of future projects in the basin. Future federal projects or new intakes would likely undergo future project specific NEPA analysis and section 7 consultations. Consequences for the interior least tern and piping plover are uncertain, when the No Action Alternative is compared to current conditions.
Minnesota’s state listed aquatic species and North Dakota’s "aquatic species of conservation priority" likely would not be impacted, because water quantity and quality conditions on the Red River would be similar to existing conditions. This would also be true for Canada’s aquatic listed species. Further discussion of these species is in Appendix G.2.
North Dakota In-Basin Alternative This alternative would not impact listed species associated with the Missouri River, including the interior least tern, piping plover, bald eagle, and pallid sturgeon. Direct construction impacts to other federal and state listed species would be avoided or minimized, because environmental commitments would avoid potential adverse impacts. Any potential adverse impacts would not result in take of federal and state listed species and would be extremely unlikely to occur. Compared to the No Action Alternative, this in-basin alternative may benefit the western prairie fringed orchid, because aquifers underlying the orchid habitat (such as the Sheyenne Delta Aquifer) would not be depleted.
Other aspects of this alternative could indirectly impact the Sheyenne Delta Aquifer and thus, could indirectly impact the western prairie fringed orchid. This alternative would use the Sheyenne River for conveyance and the Milnor Channel Aquifer for industrial water demands. Alternatives that propose to use the Sheyenne River as a conveyance feature would increase average flows in the river at Kindred during a 1930s-type drought. This could increase localized inflow to this aquifer, potentially benefiting the western prairie fringed orchid.
Barr Engineering Company investigated the effect of higher flows in the Sheyenne River on groundwater levels for the Devils Lake Outlet EIS (Barr Engineering Company 1999; Barr Engineering Company 2002). They determined that higher river flows would not influence the water table more than ¼ mile from the banks of the Sheyenne River through the Sheyenne Delta Aquifer. Inflows to groundwater would increase in the zone near the river. There are no known western prairie fringed orchids located in the area of influence. Therefore, western prairie
4 - 183

Red River Valley Water Supply Project FEIS Chapter Four Environmental Impacts
fringed orchids likely would not be adversely impacted by use of the Sheyenne River as a conveyance feature.
The other possible indirect effect that potentially could affect the western prairie fringed orchid is the loss of water from the Sheyenne Delta Aquifer through increased leakage to adjacent aquifers. The Milnor Channel Aquifer is the most likely candidate to experience drawdown in its water table. That could increase seepage from the Sheyenne Delta Aquifer. While this may be possible, drawdown associated with alternatives that propose to develop groundwater from the Brightwood, Milnor Channel, Gwinner, and Spiritwood Aquifers to serve industrial needs is unlikely to do more than minimally affect the southern and southwestern portion of the Sheyenne Delta Aquifer. Environmental commitments for increased development of the Milnor Channel Aquifer would incorporate monitoring groundwater levels to determine acceptable withdrawal rates to minimize effects to existing uses and resources. Therefore, indirect impacts to western prairie fringed orchids would be minimal or possibly beneficial.
Impacts to Minnesota’s state listed aquatic species, North Dakota’s aquatic species of conservation, and Canada’s listed aquatic species are not expected. The aquatic communities and water quality sections of this chapter have further information on these subjects. Environmental commitments to monitor water quality and water quantity would assist in protecting these resources. There would be no additional risk of importing potentially invasive species beyond that which occurs naturally or with the in-basin alternatives, thus avoiding impacts to aquatic species. During times of drought, particularly a 1930s-type drought, these aquatic species may benefit from improved Red River flows and water quality, when compared to the No Action Alternative.
Red River Basin Alternative This alternative, like the North Dakota In-Basin Alternative, would not affect listed species associated with the Missouri River. When compared to the No Action Alternative, this alternative is not expected to adversely impact and possibly benefit the western prairie fringed orchid, because aquifers underlying orchid habitat (such as the Sheyenne Delta Aquifer) are not expected to be depleted.
The use of the Milnor Channel Aquifer for industrial water demands would have similar indirect impacts, as described for the North Dakota In-Basin Alternative. Environmental commitments would avoid or minimize potential impacts to federally listed species and species of special concern from construction.
Potential affects to Minnesota’s state listed aquatic species, North Dakota’s aquatic species of conservation, and Canada’s listed aquatic species are expected to be the same as those identified for the North Dakota In-Basin Alternative.
GDU Import to Sheyenne River Alternative One feature of this alternative could indirectly impact the Sheyenne Delta Aquifer and could indirectly impact the western prairie fringed orchid. This alternative proposes to use the Sheyenne River to convey water to the service area. Alternatives that propose to use the Sheyenne River as a conveyance feature would increase average flows in the river during a 1930s-type drought at the Kindred gage and could increase localized inflow or recharge to this aquifer. As described for the North Dakota In-Basin Alternative, this is not expected to adversely impact and possibly would benefit the western
4 - 184

Red River Valley Water Supply Project FEIS Chapter Four Environmental Impacts
prairie fringed orchid. Additionally, compared to the No Action Alternative, the western prairie fringed orchid generally may benefit from the import alternatives, because aquifers underlying orchid habitat (such as the Sheyenne Delta Aquifer) would not be directly depleted. Environmental commitments would avoid or minimize potential impacts to federally listed species and species of special concern from construction.
Potential impacts to Minnesota’s state listed aquatic species, North Dakota’s aquatic species of conservation, and Canadian-listed aquatic species due to changes in flow or water quality in the Red River are not anticipated to result from any of the Missouri River import alternatives. Implementation of environmental commitments to monitor water quality and quantity would assist in protecting these resources. Furthermore, during an extended 1930s-type drought, these listed aquatic species might benefit from augmented Red River flows, when compared to diminished flows under No Action. There would be very low additional risk of importing potentially invasive species with this alternative, when compared to No Action and in-basin alternatives. Reducing the risk of importing invasive species is discussed earlier in this chapter.
Missouri River Basin Resource Impacts Missouri River import alternatives would increase withdrawals to the Missouri River in addition to those that would occur in the No Action Alternative (Appendix C). However, based on the Corps’ impact models (2007), Project depletions could have small beneficial effects on bald eagles and pallid sturgeon . However, the Corps’ impact models show there could be potential impacts to piping plover and interior least tern habitat. These impacts are briefly described below and in the Corps (2007) report, which is attached as a supporting document. The Corps modeled the following habitats to assess the potential impacts to these species:
• Bald eagle – riparian habitat, riverine warm water fish habitat and physical habitat for native river fish, which provide forage for the bald eagle.
• Interior least tern and piping plover – riverine least tern and piping plover habitat, riverine warm water fish habitat and physical habitat for native river fish that provide forage for least terns.
• Pallid sturgeon – riverine warmwater fish habitat and physical habitat for native river fish, which provide forage for pallid sturgeon.
The potential impacts of this alternative on bald eagles and pallid sturgeon with environmental commitments in place, does not result in incidental take, and there would be some potential positive benefits to these species.
Regarding the bald eagle, the Corps (2007) analysis when comparing the GDU Import to the Sheyenne River Alternative to the No Action Alternative during a 1930s-type drought and the period of record (1930-2002) shows small positive effects (3% and 2% respectively) and no change. There would be no change in riparian habitat and physical habitat for native river fish and small positive changes in riverine warm water fish habitat (3%) during a 1930s-type drought. During the period of record there would be no changes in riparian habitat and physical habitat for native fish and small increases in riverine warm water fish habitat (2%).
Regarding the pallid sturgeon for the GDU Import to the Sheyenne River Alternative, no take of pallid sturgeon is likely to occur and small benefits in habitat could occur. The Corps (2007)
4 - 185
Red River Valley Water Supply Project FEIS Chapter Four Environmental Impacts
analysis when comparing the GDU Import to the Sheyenne River Alternative to the No Action Alternative shows during a 1930s-type drought there is no change in physical habitat for native river fish and small positive changes in riverine warmwater fish habitat (3%) for the pallid sturgeon. For the period of record (1930-2002) there are small positive changes in riverine warmwater fish habitat and no changes in physical habitat for native river fish, such as the pallid sturgeon.
The modeling results for potential impacts of the preferred alternative on piping plovers and interior least terns were slightly negative when comparing the GDU Import to the Sheyenne River Alternative to the No Action Alternative. For interior least tern forage fish, during a 1930s-type drought, there would be no change in physical habitat for native river fish or riverine warmwater fish habitat. During the period of record, there would be a small increase in riverine warmwater fish habitat (2%) and no change in physical habitat for native river fish.
When assessing the potential impacts to interior least tern and piping plover riverine habitat, comparing the GDU Import to Sheyenne River Alternative to the No Action Alternative indicates no change in riverine habitat. This is based on modeling of a 1930s-type drought. There was a 1% decrease in interior least tern and piping plover riverine habitat when modeling the period of record (1930 – 2002). The Corps’ modeling results suggest this alternative when compared to No Action would have very minor impacts to habitat for interior least terns and designated critical habitat for piping plovers and provide some benefit to least tern forage fish. These impacts are insignificant and discountable (see definitions in the blue box on page 4-179). With environmental commitments in place, no incidental take would occur,
This alternative was also evaluated for potential impacts in accordance with the ESA in a biological assessment that is found in Appendix G.1. In the biological assessment, the proposed action (the preferred alternative) was compared to current conditions to determine effects.
GDU Import Pipeline Alternative Potential impacts to federally listed species associated with this alternative’s use of the Milnor Channel Aquifer to meet industrial water demands are expected to be the same as the North Dakota In-Basin Alternative. When comparing this alternative and the other import alternatives to the No Action Alternative, the western prairie fringed orchid would not be expected to be adversely impacted but generally may benefit, because aquifers underlying western prairie fringed orchid habitat (such as the Sheyenne Delta Aquifer) would not be directly depleted.
With the implementation of environmental commitments, construction impacts to most federally listed and species of special concern would be minimal. No take of species is expected.
Impacts to Minnesota’s state listed aquatic species, North Dakota’s aquatic species of conservation, and Canada’s listed aquatic species would be the same as the GDU Import to Sheyenne River Alternative. There would be very low additional risk of importing potentially invasive species with this import alternative, as compared to the No Action and in-basin alternatives. Risk reduction and the probability of risk are discussed earlier in the chapter (see risks of invasive species section).
4 - 186

Red River Valley Water Supply Project FEIS Chapter Four Environmental Impacts
Missouri River Basin Resource Impacts Missouri River import alternatives, including this one, would withdraw Missouri River water in addition to depletions quantified under the No Action Alternative (Appendix C). However, based on the Corps’ impact models (2007), Project depletions could minimally affect bald eagles and pallid sturgeons associated with the Missouri River. However, there could be minor potential impacts to piping plover and interior least tern habitat. Potential impacts associated with this alternative would be similar to the other Missouri River import alternatives. The exception would be the percent change in the different habitat models used when comparing the No Action Alternative to this alternative
The potential impacts of this alternative on bald eagles and pallid sturgeon with environmental commitments in place, would not result in incidental take, and there are some potential positive benefits to these species. When compared to the No Action Alternative during 1930s-type drought there was no change projected for physical habitat for native river fish and a small increase in riverine warmwater fish habitat (1%). For the period of record there was no change projected in physical habitat for native river fish and riverine warmwater fish. For riparian habitat, there would be no change for both modeling periods when this alternative is compared to the No Action Alternative.
The modeling results for the potential impacts of this alternative on piping plovers and interior least terns were both positive and negative. When considering interior least tern forage fish for this alternative compared to No Action, there was no change in physical habitat for native river fish for both modeling periods. During a 1930s-type drought, there was a projected increase of 1% in riverine warmwater fish habitat, while during the period of record, there was no change. However, when compared to the No Action Alternative, this alternative would have 1% less interior least tern and piping plover riverine habitat based on modeling results for the period of record and no change during a 1930s-type drought. Modeling results suggest this alternative potentially could have very small adverse impacts on habitat for interior least terns and designated critical habitat for piping plovers and provide some benefit to least tern forage fish. These impacts are insignificant and discountable (see definitions in the blue box above). With environmental commitments in place, no incidental take would occur,
Missouri River Import to Red River Valley Alternative When comparing this alternative and the other import alternatives to the No Action Alternative, the western prairie fringed orchid would not be expected to be adversely impacted but generally may benefit, because aquifers underlying western prairie fringed orchid habitat (such as the Sheyenne Delta Aquifer) would not be directly depleted.
Impacts to Minnesota’s state listed aquatic species, North Dakota’s aquatic species of conservation, and Canada’s listed aquatic species are expected to be the same as the GDU Import to Sheyenne River Alternative. There would be very low additional risk of importing potentially invasive species with this import alternative, when compared to the No Action Alternative. Risk reduction and the probability of risk are discussed earlier in the chapter (see aquatic communities section).
4 - 187

Red River Valley Water Supply Project FEIS Chapter Four Environmental Impacts
With the implementation of environmental commitments, construction impacts to most federally listed and species of special concern are projected to be minimal. No take of species is expected and impacts are extremely unlikely to occur.
Missouri River Basin Resource Impacts Missouri River import alternatives, including this one, would result in additional depletions to the Missouri River, in addition to those that would occur as part of the No Action Alternative (Appendix C). Based on the Corps’ (2007) impact models, Project depletions would minimally affect bald eagles and pallid sturgeons associated with the Missouri River. However, there could be potential impacts to piping plover and interior least tern habitat. Potential impacts associated with this alternative would be similar to the other Missouri River alternatives. The exception would be the percent change in the different habitat models used when comparing the No Action Alternative to the Missouri River Import to Red River Valley Alternative.
The potential impacts of this alternative on bald eagles and pallid sturgeon, do not result in incidental take, and are not likely to occur with environmental commitments in place. When compared to the No Action Alternative during 1930s-type drought and the period of record, there was no change projected for physical habitat for native river fish. During a 1930s-type drought, there was an increase of 1% in riverine warmwater fish habitat and no change for the period of record. For riparian habitat, there would be no change for both modeling periods when this alternative is compared to the No Action Alternative.
The modeling results showed no potential adverse impacts of this alternative on piping plovers and interior least terns. When considering interior least tern forage fish for this alternative compared to No Action, there was no change in physical habitat for native river fish for both modeling periods. During a 1930s-type drought, there was a projected increase of 2% in riverine warmwater fish habitat, while during the period of record, the change was no change. However, when compared to the No Action Alternative, this alternative would have no change in interior least tern and piping plover riverine habitat, based on modeling results of a 1930s-type drought also during the period of 1930 - 2002. Modeling results suggest this alternative would have no adverse impacts on habitat for interior least terns and designated critical habitat for piping plovers and may benefit least tern forage fish. With environmental commitments in place, no incidental take would occur,
Cumulative Effects The regulations implementing the NEPA and the ESA require analysis of cumulative effects. The regulations implementing the NEPA direct federal agencies to consider the incremental impact of the proposed action when added to other past, present, and reasonably foreseeable future actions, regardless of the agency (federal or non-federal) or person undertaking the action.
The regulations implementing the ESA require an evaluation of the effects of future state or private activities. Federal activities that are reasonably certain to occur within the action area or affect species in the action area of the federal action that is the subject of ESA consultation are not included in the cumulative effects analysis. The regulations on interagency cooperation at 50 CFR 402 do not require including federal actions in the cumulative effects analysis. This is because federal actions that have already completed consultation become part of the
4 - 188

Red River Valley Water Supply Project FEIS Chapter Four Environmental Impacts
environmental baseline. Those that have not will require some level of consideration and/or consultation in the future. To comply with the NEPA, Reclamation assessed the potential impacts on federally listed species, designated critical habitat and species of special concern resulting from the proposed action and alternatives.
Often, proposed federal actions may adversely affect listed species, and/or their habitat. For NEPA compliance, the analysis of cumulative effects focuses on cumulative effects to the species and/or their habitat that is expected to result from both the federal action and other ongoing and reasonably foreseeable federal and non-federal actions that may affect these species.
For this Project, there are benefits and insignificant and discountable impacts to federally listed species or species of special concern. The cumulative effects analysis for depletions and flows is included in the potential impacts analysis for the Missouri River because it considered reasonably foreseeable depletions throughout the Missouri River that also impact federally listed Missouri River species. The Corps (2007) Red River Valley Water Supply Project Analysis of Missouri River Effects report examines the effects of Project depletions and cumulative depletions on the uses and resources of the Missouri River. Details on the depletion analysis can be found in the Corps (2007) Red River Valley Water Supply Project Analysis of Missouri River Effects report and in Appendixes C and G.1.
Summary None of the action alternatives as proposed with the noted environmental commitments would be expected to adversely impact the bald eagle, whooping crane, gray wolf, Canada lynx, pallid sturgeon, Dakota skipper and the western prairie fringed orchid. The Corps’ modeling results suggest the Missouri River import alternatives, when compared to No Action, would not adversely impact habitat for interior least terns and designated critical habitat for piping plovers and would provide some benefit to least tern forage fish. With environmental commitments in place, no incidental take would occur. Reclamation explored the nature and extent of the potential impacts to interior least terns and piping plovers and critical habitat for all alternatives under NEPA as discussed above and under ESA for the preferred alternative in Appendix G.1. All impacts to Missouri River species were considered insignificant and discountable. The No Action Alternative could have adverse consequences to the western-prairie fringed orchid.
Environmental Mitigation Depending upon the alternative selected in the ROD, the following commitments will be implemented to avoid adverse impacts to resources. Some of these commitments are not applicable to every alternative. The ROD will list the environmental commitments applicable to the selected alternative.
General • For the alternative selected, a pre-construction survey will be conducted by a qualified
biologist(s) to ensure no federally or state listed species are present in or use the construction area. If any species were found, then consultation with the Service and state natural resource agencies would be initiated, as necessary, to determine appropriate avoidance and/or protection measures. Construction activities will be delayed until there is concurrence on which activities may be implemented to avoid adverse impacts to
4 - 189

Red River Valley Water Supply Project FEIS Chapter Four Environmental Impacts
federal and state listed species. If adverse impacts cannot be avoided, formal Section 7 consultation will be initiated with the Service.
• If any federally or state listed species are encountered during construction, all ground disturbing activities in the immediate area would be stopped immediately until consultation with the Service and appropriate state agencies can be completed to determine appropriate steps to avoid any effects to these species, including cessation of construction in the area.
• Reclamation will continue to participate in the Missouri River species recovery by serving on the Missouri River Basin Interagency Roundtable and Missouri River Recovery Implementation Committee.
Species Specific Commitments Bald Eagle
• All surface-disturbing and construction activities will be seasonally restricted from January 15 to August 1 within 0.25 mile of any active bald eagle nest or winter roosts identified as essential bald eagle wintering roosts as described in the Northern States Bald Eagle Recovery Plan (Service 1983).
• In areas with migratory bird crossing concerns, all permanent and temporary power or communication lines
associated with the Project would be buried where practical. If burial were not possible, the lines will be designed and located to avoid raptor collisions and/or electrocutions pursuant to Avian Power Line Interaction Committee protocol (1994, 1996, and 2005). Expanded protection measures for above ground power lines would also include: provision of greater than 90-inch spacing between conductors or grounding features; appropriate insulation of exposed conducting features; use of anti-perching devices as appropriate; avoidance of steel pole use where practical; and appropriate use of line aviation markers where power lines may occur adjacent to significant habitat areas e.g. adjacent to or across wetlands, native prairie, and feeding areas.
Bald Eagle Landing on Nest (http://images.fws.gov/)
Piping Plover and Interior Least Tern • All surface-disturbing and construction activities will
be seasonally restricted from May 15 to August 15 within 0.25 mile of any active piping plover and interior least tern nest.
• Reclamation will continue recovery and conservation efforts for Missouri River species as participants on the Missouri River Basin Interagency Roundtable and Missouri River Recovery Implementation Committee. Piping Plover (Photo by C. Perez, Service,
http://www.fws.gov/plover/)
4 - 190

Red River Valley Water Supply Project FEIS Chapter Four Environmental Impacts
Tiger Beetle • The MNDNR will be contacted prior to any proposed construction activities to review
their Natural Heritage Program Inventory for all known tiger beetle sites. This information will be sent to the Impact Mitigation Team, who would review the results and determine the need for additional surveys. If beetles are found, consultation with the Impact Mitigation Team and MNDNR would be initiated and measures implemented to insure no take of tiger beetles.
Ram’s-Head Lady’s Slipper • Habitat surveys will be conducted in the buried pipeline and wellfield areas of Becker
County, Minnesota. If habitats for the ram’s-head lady’s slipper are identified, the Natural Heritage Program Inventory will be re-checked to ensure there are no known sites for this species in the buried pipeline ROW and wellfield areas. However, if potential habitat for this species is found, botanical surveys will be conducted to ensure this species will not be taken. Survey data will be sent to the Mitigation Impact Team, who will review the results. If the ram’s-head lady’s slipper is found, consultation with the Impact Mitigation Team and MNDNR will be initiated and measures implemented to insure no take of the ram’s-head lady’s slipper.
4 - 191

Red River Valley Water Supply Project FEIS Chapter Four Environmental Impacts
Protected Areas
Introduction How would the Project affect protected areas in North Dakota and Minnesota?
This section addresses the effects of alternatives on protected areas in the area of potential effects. Protected areas include federal lands, especially Service fee title and easement lands and national wildlife refuges; state lands, like parks and wildlife management areas; and areas of special interest under state or private programs because of native habitats or other natural features. To see an inventory of protected areas, see chapter three “protected areas” section and Appendix H. Recreation in protected areas is explained in chapter three in the “social and economic issues” section and impacts are described in the corresponding section in this chapter.
Project impacts to protected areas would be temporary, direct, or indirect. Temporary impacts would be caused by construction of buried pipelines, power lines, groundwater wellfields and ASR fields. Indirect impacts include changes in riparian areas caused by altered flow in the Sheyenne and Red Rivers or changes in recreational use. Direct impacts to protected areas would occur from construction of biota water treatment plants pumping plants, pipeline outfall structures, and water storage facilities. Commitments for environmental mitigation for all action alternatives avoid construction of most permanent facilities on protected areas except for buried pipelines placed in the ROW and biota treatment plant and horizontal well system collector facilities associated with the Missouri River Import to Red River Valley Alternative (see the “environmental mitigation” section below). With commitments to environmental mitigation, adverse impacts would be temporary and minor or in other situations the impacts would be beneficial.
This assessment of impacts to protected areas primarily compares alternatives using hydrologic modeling results presented in the “Red River Basin surface water quantity” section of this chapter. Water quality data analysis is also used for this assessment. Socioeconomic impacts to recreation in the protected areas are addressed in the “social and economic issues” section.
Methods The methods and data used to evaluate impacts to protected areas are the same as were used to assess impacts to natural resource lands, water quantity, and water quality, as previously described in this chapter.
Results Federal Lands Impacts U.S. Forest Service Lands Impacts How changes in flows on the Sheyenne River could potentially affect the Sheyenne National Grasslands are summarized in tables 4.77 and 4.78. Action alternative impacts to groundwater and possible associated impacts to riparian areas are discussed in the groundwater and natural resource lands sections.
4 - 192

Red River Valley Water Supply Project FEIS Chapter Four Environmental Impacts
Table 4.77 – Number of Months of Extreme Low Flow at the Lisbon Gage on the Sheyenne River and Assessment of Impacts of Action Alternatives to Protected Areas Near This Gage.
Alternative Extreme Low Flow
During a 1930s-type Drought
(# months)
Potential Impacts During a 1930s-
type Drought
Extreme Low Flow During the 71 Year Period of Record
(# months)
Potential Impacts During the 71 Year Period of Record
2005 Condition 25 na 118 na
No Action* 47 na 136 na North Dakota In-Basin 9 B 78 B
Red River Basin 30 B 120 B
GDU Import to Sheyenne River 0 B 1 B
GDU Import Pipeline 35 B 129 B
Missouri River Import to Red River Valley
34 B 129 B
* The No Action Alternative was compared to the 2005 Current Condition to evaluate the potential consequences. All Action alternatives were compared to the No Action Alternative. B Beneficial Effect is noted when there was a decrease of 5 or more months when compared to No Action A Adverse Effect is noted when there is an increase of 5 or more months when compared to No Action. m Minimal Effect is noted when there is a change of less than +/- 5 months when compared to No Action. na Not applicable or not affected
Table 4.78 – Number of Months of Extreme Low Flow at the Kindred Gage on the Sheyenne River and Assessment of Impacts to Protected Areas Near This Gage.
Alternative Number of Months of
Extreme Low Flow During a 1930s-type Drought
Potential Impacts
Number of Months of Extreme Low flow During the
71 year Period of Record Potential Impacts
2005 Condition 48 na 98 na No Action* 59 na 105 na North Dakota In-Basin 15 B 45 B
Red River Basin 51 B 101 m GDU Import to Sheyenne River 0 B 2 B
GDU Import Pipeline 59 m 110 na
Missouri River Import to Red River Valley
60 m 111 na
* The No Action Alternative was compared to the 2005 Current Condition to evaluate the potential consequences. All Action alternatives were compared to the No Action Alternative. B Beneficial Effect is noted when there was a decrease of 5 or more months when compared to No Action A Adverse Effect is noted when there is an increase of 5 or more months when compared to No Action. m Minimal Effect is noted when there is a change of less than +/- 5 months when compared to No Action. na Not applicable or not affected
4 - 193

Red River Valley Water Supply Project FEIS Chapter Four Environmental Impacts
No Action Alternative The Sheyenne National Grasslands may incur the consequences of the No Action Alternative as continued MR&I withdrawals from the Sheyenne River and the Sheyenne Delta Aquifer draw down key moist area communities that support rare plants, like the western prairie fringed orchid. Although the orchid has survived periodic droughts, it is uncertain how this species would react to extended periods of extreme low flows in Sheyenne River combined with non-Project withdrawals from the Sheyenne Delta Aquifer.
North Dakota In-Basin Alternative For the Sheyenne National Grasslands, the North Dakota In-Basin Alternative would benefit grasslands with less frequent episodes of extreme low flow during a 1930s-type drought near the Lisbon and Kindred gages (tables 4.77 and 4.78). The changes would be the same as impacts to Fort Ransom State Park and the H.R. Morgan Preserve (see State Land Impact section below).
Red River Basin Alternative This alternative would benefit the Sheyenne National Grasslands near the Lisbon and Kindred gages during a 1930s-type drought, but impacts would be the same as the No Action Alternative near the Kindred gage over the 71-year period of record.
GDU Import to Sheyenne River Alternative This alternative could improve conditions at the Sheyenne National Grasslands by reducing the occurrence of extreme low flows during a 1930s-type drought at the Lisbon gage (table 4.77). It also could improve conditions at the Sheyenne National Grasslands near the Kindred gage (table 4.78).
GDU Import Pipeline Alternative This alternative could improve conditions at the Sheyenne National Grasslands by reducing the occurrence of extreme low flows during a 1930s-type drought at the Lisbon gage (table 4.77). Flows near the Kindred gage (table 4.78) would have a minimal effect during a 1930s-type drought and could have an adverse effect over the 71-year period of record when compared to the No Action Alternative.
Missouri River Import to Red River Valley Alternative This alternative could improve conditions at the Sheyenne National Grasslands by reducing the occurrence of extreme low flows during a 1930s-type drought at the Lisbon gage (table 4.77). Flows near the Kindred gage (table 4.78) would have a minimal effect during a 1930s-type drought and could have an adverse effect over the 71-year period of record when compared to the No Action Alternative.
U.S. Army Corps of Engineers Lands Impacts The Corps lands in the Project area include Corps project facilities and management areas associated with the Missouri River system and Baldhill Dam/Lake Ashtabula on the Sheyenne River. Recreational impacts to these areas are discussed in the “social and economic issues” section of this chapter.
Project impacts to Corps land areas would be temporary or direct. Temporary impacts would be caused by construction of buried pipelines and power lines. Direct impacts include construction of biota water treatment plant pumping plants, and outfall structures.
No Action Alternative, Red River Basin Alternative, and GDU Import Pipeline Alternative No impacts to Corps lands are expected with any of these alternatives.
4 - 194

Red River Valley Water Supply Project FEIS Chapter Four Environmental Impacts
North Dakota In-Basin Alternative Impacts to Corps lands could occur from construction of outfall structures associated with the Grand Forks to Lake Ashtabula pipeline feature. Although the exact location for this structure is unknown, it would be constructed on Corps land surrounding Lake Ashtabula. The footprint for this construction would be about one acre. Temporary impacts could be caused by construction of the buried pipeline and power lines. However, with the environmental commitments impacts would be minimized.
GDU Import to Sheyenne River Alternative Because the Sheyenne River release structure would be built north of Corps of Engineers property, there would be no impacts to Corps lands.
Missouri River Import to Red River Valley Alternative Impacts to Corps lands adjacent to the Missouri River would occur from construction of the biota water treatment plant and associated horizontal well collector system facilities. Although the exact location for this structure is unknown, it could be on Corps land adjacent to the Missouri River. The footprint for this construction would be about 25 acres. Temporary impacts could be caused by construction of buried pipelines and power lines. However, with the environmental commitments impacts would be minimal
U.S. Fish and Wildlife Service Fee Title and Easement Interests Impacts The Service administers Waterfowl Production Area fee title lands as well as wetland, grassland, and refuge easements on private lands throughout Minnesota and North Dakota. Review by the Service (2007) of the proposed routes for buried pipelines indicates that Service easements and fee title property could be affected (table 4.79). The Service identified their property interests within groundwater wellfield areas (Personal Communication, Terri Thorn). These areas are also identified in table 4.79.
Project impacts to Service parcels would be temporary or indirect. Temporary impacts would be caused by construction of buried pipelines placed in the ROW (see the “environmental mitigation” section below). Wellfields would avoid Service easement and fee title lands. Therefore, impacts would be temporary and minor. Impacts discussed below identify the potential number of parcels that would be affected by each alternative.
The Service also operates Tewaukon and Audubon National Wildlife Refuges and the Valley City National Fish Hatchery within the Project area. Potential impacts to Audubon Lake on the Audubon National Wildlife Refuge include changes in flows across the lake that may impact water quality and subsequently productivity. The Valley City National Fish Hatchery, which is adjacent to the Sheyenne River and is used for hatchery operations, could be impacted by changes in river flows. A minimum of 13 cfs and a maximum of 2,800 cfs are required for hatchery operations. The Tewaukon Refuge overlies the Spiritwood, Gwinner, Milnor Channel and Brightwood Aquifers. Tewaukon Refuge wetlands could be impacted by the use of these aquifers.
Productivity is the process of energy flow and transitions that support the food chain within the lake.
4 - 195

Red River Valley Water Supply Project FEIS Chapter Four Environmental Impacts
Table 4.79 – Number of Individual Service Easements and Fee Title Property Areas, as Identified by the Service (2007), Potentially Crossed by Pipelines or in Aquifer Development Areas.
Service Administered Easement
Wetlands FmHA Grasslands
Fee Title1
National Wildlife Waterfowl Refuge Production Area
Alternative
ND MN ND MN ND MN ND MN ND MN
North Dakota In-Basin 10 0 0 0 0 0 5
(7,963 acres)
0 29
(6,666 acres)
0
Red River Basin 3 4 0 0 0 0 5
(7,963 acres)
0 29
(6,666 acres)
31 (3,168acres)1 (5.0 acres)
GDU Import to Sheyenne River 45 0 1 0 1 0 0 0 0 0
GDU Import Pipeline 47 1 0 0 0 5
(7,963 acres)
0 29
(6,666 acres)
0
Missouri River Import to Red River Valley 58
1 0 1 0 0 0 4
(31.3 acres)
0
1 Bold font identifies aquifer development areas. FmHA is Farmers Home Administration.
No Action Alternative As southeastern communities may have to increase their withdrawals from Spiritwood, Gwinner, and Milnor Channel Aquifers during a 1930s-type drought, Tewaukon National Wildlife Refuge may suffer the consequences of this additional aquifer development. During a 1930s-type drought the decrease in the amount of water available to support evaporation from wetlands and lakes and would decrease transpiration from vegetation. This suggests that minor wetlands could shrink with a corresponding change in vegetation due to additional aquifer development Tewaukon has water rights for flowage and refuge purposes, but it is uncertain whether continued reliance on aquifers could affect these water rights and the refuge.
Consequences of a drought at Audubon National Wildlife Refuge would be temporary and minimal. Assessment of water quality, as discussed in the water quality section of this chapter, found that there would be no changes in beneficial uses in Audubon Lake. Therefore, consequences to water quality and productivity on the refuge would be minimal. Other Service properties and interests would experience the consequences of drought conditions as previously noted for natural resource lands.
The Valley City National Fish Hatchery would have limited operations during a 1930s-type drought as the data from the water quantity section shows that flows would fall below 13 cfs necessary for hatchery operations. Flows are not expected to exceed the 2,800 cfs maximum flows.
No Service parcels were identified for features identified for this alternative. Therefore, no consequences are expected.
North Dakota In-Basin Alternative The impacts to the Spiritwood, Gwinner, and Milnor Channel Aquifers are explained in the groundwater section of this chapter. Because the demands
4 - 196

Red River Valley Water Supply Project FEIS Chapter Four Environmental Impacts
on these aquifers would be increased during 1930s-type drought conditions, some of the water would be withdrawn from aquifer storage. It is anticipated that this would be a short to mid-term effect, which would decrease as the drought subsides. These aquifers would have time to naturally recharge back to a normal or near-normal state in the years following a drought when aquifer use would again decrease. Each aquifer would return to a near normal state at different times, depending upon a variety of factors. Therefore, impacts to Tewaukon National Wildlife Refuge are expected to be temporary and minimal.
Water quality impacts at Audubon Lake on Audubon National Wildlife Refuge are discussed in the “surface water quality” section of this chapter. Analysis found that there would be no changes in beneficial uses in Audubon Lake. Modeled concentrations in Audubon Lake are generally similar to the No Action Alternative. The reason for similar concentrations in Audubon Lake among the alternatives is its relatively large volume relative to Project inflows, along with the effects of runoff from adjacent land. Therefore, impacts to water quality and productivity on the refuge would not be expected. No changes in beneficial uses in Audubon Lake are expected.
As noted in the “Red River Basin water quantity” section of this chapter, compared to the No Action Alternative, this alternative would decrease the occurrence of extreme low flow at the four gages along the Sheyenne River during a 1930s-type drought. Hatchery operations would benefit from this decrease in extreme low flow conditions. Sheyenne River flow conditions would also not exceed 2,800cfs. Therefore, Valley City National Fish Hatchery operations would not be impacted.
This alternative could potentially affect 10 Service parcels with a buried pipeline, as noted in table 4.79. Project impacts to Service parcels would be temporary or indirect. Temporary impacts would be caused by construction of buried pipelines placed in the ROW (see the “environmental mitigation” section below). Potential impacts to fee title lands identified in table 4.79 would be similar to those discussed for Tewaukon National Wildlife Refuge. Therefore, impacts would be temporary and minor.
Red River Basin Alternative The impacts to Tewaukon National Wildlife Refuge, Audubon National Wildlife Refuge and the Valley City National Fish Hatchery are the same as the North Dakota In-Basin Alternative
This alternative could affect seven Service properties with buried pipelines, as noted in table 4.79. Project impacts to Service parcels would be temporary or indirect. Temporary impacts would be caused by construction of buried pipelines placed in the ROW (see the “environmental mitigation” section below). Therefore, impacts would be temporary and minor. Potential impacts to fee title lands identified in table 4.79 would be similar to those by the North Dakota In-Basin Alternative, with the exception of Minnesota lands. Thirty-one waterfowl production areas overlie the Minnesota aquifers proposed for development. Environmental mitigation would avoid most impacts. Waterfowl production areas include wetlands and grasslands; these impacts have been previously discussed, as have groundwater impacts.
GDU Import to Sheyenne River Alternative No impacts to Tewaukon National Wildlife Refuge are expected, since the underlying aquifers are not being used with this alternative. The
4 - 197

Red River Valley Water Supply Project FEIS Chapter Four Environmental Impacts
assessment of water quality impacts at Audubon National Wildlife Refuge are discussed for Audubon Lake in the “surface water quality” section of this chapter. These results show there would be no changes in beneficial uses in Audubon Lake. Houston Engineering, Inc. (2005) reviewed existing conditions and effects of the alternatives on the Missouri River. The results of this analysis did not indicate substantial degradation of the water quality from Missouri River import alternatives to Audubon Lake from losses. Modeled concentrations in Audubon Lake are generally similar to the No Action Alternative. The reason for similar concentrations in Audubon Lake among the alternatives is the lake’s relatively large volume relative to Project inflows, along with the effects of runoff from adjacent land. Therefore, impacts to water quality and productivity on the refuge would not be expected.
During a 1930s-type drought this alternative would use the Sheyenne River as a means to deliver imported Missouri River water to the Red River Valley and incorporates minimum stream flow requirements (see “Red River Basin surface water quantity” section). As a result, extreme low flows during a drought would be eliminated from Below Baldhill Dam through Kindred gages. Sheyenne River flow conditions would also not exceed 2,800 cfs. Therefore, Valley City National Fish Hatchery operations would not be impacted.
Buried pipeline for this alternative could potentially affect 47 Service properties. Project impacts to Service parcels would be temporary or indirect. Temporary impacts would be caused by construction of buried pipelines placed in the ROW (see the “environmental mitigation” section below). Therefore, impacts would be temporary and minor.
GDU Import Pipeline Alternative The impacts to Tewaukon National Wildlife Refuge would be the same as reported for the North Dakota In-Basin Alternative. The impacts to Audubon National Wildlife Refuge would be the same as reported for the GDU Import to Sheyenne River Alternative.
During a 1930s-type drought this alternative shows a decrease in the number of months of extreme high flow from the Below Baldhill Dam through the Kindred gages, when compared to the No Action Alternative (see “Red River Basin surface water quantity” section). Sheyenne River flow conditions would also not exceed 2,800 cfs; therefore, Valley City National Fish Hatchery operations would not be impacted by this change. However, this change corresponds with an increase in the number of months in the low flow category for these gages and the extreme low flow category at some gages. This alternative has more months in the extreme low flow category at the Below Baldhill Dam gage than all other alternatives, including the No Action Alternative. Therefore, there is a greater opportunity for this alternative to impact the Valley City National Fish Hatchery operations during a 1930s-type drought when compared to the No Action Alternative.
Buried pipelines for this alternative could potentially affect 48 Service parcels. Project impacts to Service parcels would be temporary or indirect. Temporary impacts would be caused by construction of buried pipelines placed in the ROW (see the environmental mitigation section below). Therefore, impacts would be temporary and minor. Potential impacts to fee title lands in aquifer development areas, as identified in table 4.79, would be similar to those identified for the North Dakota In-Basin Alternative.
4 - 198

Red River Valley Water Supply Project FEIS Chapter Four Environmental Impacts
Missouri River Import to the Red River Valley Alternative No impacts to Tewaukon National Wildlife Refuge are expected, because the underlying aquifers are not being used with this alternative. This is the same as the GDU Import to Sheyenne River Alternative. Impacts to Audubon National Wildlife Refuge would also be the same as reported for the GDU Import to Sheyenne and GDU Import Pipeline Alternatives.
This alternative shows a decrease in the number of months in the extreme high flow category from the Below Baldhill Dam gage through Kindred gage when compared to the No Action Alternative (see “Red River Basin surface water quantity” section). Sheyenne River flow conditions would also not exceed 2,800 cfs; therefore the Valley City National Fish Hatchery operations would not be impacted. However, this change corresponds with an increase in the number of months in the low flow category for these gages and the extreme low flow category at some gages. This alternative has a greater number of months in the extreme low flow category at the Below Baldhill Dam gage than the No Action Alternative. Therefore, there is a greater opportunity for this alternative to impact Valley City National Fish Hatchery operations during a 1930s-type drought when compared to the No Action Alternative. This alternative affects flow in a similar manner to the GDU Import Pipeline Alternative.
Buried pipelines for this alternative could affect 64 Service parcels, with the impacts being temporary or indirect. Temporary impacts would be caused by construction of buried pipelines placed in the ROW (see the environmental mitigation section below). Therefore, impacts would be temporary and minor.
State Land Impacts North Dakota and Minnesota Parks Impacts Within the affected environment, only two state parks were identified that could be temporarily or indirectly impacted by changes in river flows as MR&I systems and irrigators withdraw water from the Sheyenne and Red Rivers or adjacent groundwater sources. These are the Fort Ransom State Park located near Lisbon, North Dakota, on the Sheyenne River and the Red River State Recreation Area located in East Grand Forks, Minnesota, on the Red River. Withdrawals from surface and groundwater sources near these parks could change the recreational use of the park by providing fewer opportunities to participate in water-dependent activities and could affect the vegetation in the park. These impacts would be temporary, lasting only as long as the 1930s-type drought.
To assess the potential for indirect and temporary impacts to these state parks, changes in the number of months in the extreme low flow category (presented in the water quantity impacts section of this chapter) near the state parks were assessed to determine if the alternatives would have a beneficial effect, negative effect, or minimal effect to water-dependent recreation and vegetation in the parks. Tables 4.77 and 4.80 show flow changes that would result from each alternative at the Lisbon gage near Fort Ransom State Park and at the Grand Forks gage near the Red River State Recreation Area.
4 - 199

Red River Valley Water Supply Project FEIS Chapter Four Environmental Impacts
Table 4.80 – Number of Months of Extreme Low Flow at the Grand Forks Gage on the Red River and Assessment of Consequences of No Action and Impacts of Action Alternatives to Protected Areas.
Alternative 1930s-Type Drought
Potential Impacts
Period of Record
Potential Impacts
2005 Condition 87 na 96 na
No Action* 83 m 101 na
North Dakota In-Basin 86 m 98 m
Red River Basin 78 B 89 B
GDU Import to Sheyenne River 66 B 74 B
GDU Import Pipeline 70 B 75 B
Missouri River Import to Red River Valley 72 B 81 B
* The No Action Alternative was compared to the 2005 Current Condition to evaluate potential consequences. All Action alternatives were compared to the No Action Alternative to evaluate impacts. B Beneficial Effect - a decrease of 5 or more months when compared to No Action A Adverse Effect - an increase of 5 or more months when compared to No Action. m Minimal Effect - a change of less than +/- 5 months when compared to No Action. na Not applicable or not affected
No Action Alternative It is difficult to predict the consequences of this alternative because of the lack of specific information about locations of the No Action Alternative projects. The small number of acres that would be disturbed would likely avoid state parks. Therefore, construction impacts are not considered for this alternative beyond that discussed for natural resource lands. Tables 4.78 and 4.80 show reflect the increase in number of months of extreme low flow at gages near parks as compared to the number of months under the 2005 conditions (see water quantity impacts discussion earlier in this chapter). Water-dependent recreation at Fort Ransom State Park and Red River State Recreation Area would decrease and vegetation in the parks would reflect a 1930s-type drought condition.
When No Action is compared to current conditions recreation benefits at the two state parks located on the upper reservoirs of the Missouri River (Fort Stevenson and Lake Sakakawea) actually increase by 3% during the period of record (1930-2002) when compared to current conditions while the two state parks along the riverine portions of the Missouri River (Cross Ranch and Fort Abraham Lincoln) show no change during the same period (Corps 2007). During the 1930s type drought, the upper reservoirs of the Missouri River (Fort Stevenson and Lake Sakakawea) actually increase recreation benefits by 16% when compared to current conditions, while the two state parks along the riverine portions of the Missouri River (Cross Ranch and Fort Abraham Lincoln) show no change during the same period (Corps 2007).
North Dakota In-Basin Alternative This alternative could have a beneficial effect on water-dependent recreation and the vegetation at Fort Ransom State Park and a minimal effect on the Red River State Recreation Area when compared to the No Action Alternative.
Red River Basin Alternative This alternative could benefit water-dependent recreation and vegetation at Fort Ransom State Park and at the Red River State Recreation Area when compared to the No Action Alternative.
4 - 200

Red River Valley Water Supply Project FEIS Chapter Four Environmental Impacts
The area of potential effects of this alterative has three state parks in Minnesota near the Otter Tail Surficial and Pelican River Aquifers, the Buffalo River, Maplewood, and Glendalough State Parks. The impacts on resources and recreation at those parks that might result from this alternative are identified in the natural resource lands and groundwater sections of the chapter.
GDU Import to Sheyenne River Alternative and GDU Import Pipeline Alternative These alternatives could benefit water-dependent recreation and vegetation at Fort Ransom State Park and Red River State Recreation Area as compared to the No Action Alternative. Corps (2007) modeling showed no changes in recreation at the four state parks on the Missouri River (Fort Stevenson, Lake Sakakawea, Cross Ranch and Fort Abraham Lincoln) during the period of record (1930-2002) when compared to No Action. However, modeling drought conditions revealed small changes (1-2%) in recreation on the upper three Missouri River reservoirs including Ft. Stevenson and Lake Sakakawea State Parks (Corps 2007). Recreation at Cross Ranch and Ft. Abraham Lincoln State Parks would not be impacted by water levels during the 1930s-type drought, in comparison to No Action.
Missouri River Import to Red River Valley Alternative These alternatives could benefit water- dependent recreation and vegetation at Fort Ransom State Park and Red River State Recreation Area when compared to the No Action Alternative. Corps (2007) modeling of the period of record projects no changes in recreation benefits at the four state parks located on the Missouri River (Fort Stevenson, Lake Sakakawea, Cross Ranch and Fort Abraham Lincoln), when compared to No Action. However, modeling indicated small changes (2%) in recreation on the upper three reservoirs of the Missouri River at Ft. Stevenson and Lake Sakakawea State Parks during a drought. Recreation at Cross Ranch and Ft. Abraham Lincoln State Parks would not be as impacted by water levels during the 1930s-type drought when compared to No Action. . Nature Preserve Impacts Use of aquifers in southeastern North Dakota could impact the Head of the Mountain Nature Preserve; however, this is not likely. This 100-acre nature preserve, about 9 miles southeast of Rutland in Sargent County, North Dakota, sits at the edge of a steep escarpment. Therefore, it is not connected to the local Spiritwood Aquifer. Furthermore, the potential wellfield is not near this preserve.
Flow changes along the Sheyenne could affect the H.R. Morgan Preserve near Kindred, North Dakota. Table 4.78 shows how alternatives would affect flows near the H.R. Morgan Preserve at the Kindred gage on the Sheyenne River.
Riparian areas are an ecologically important component of these preserves. Impacts to riparian areas are discussed in natural resource lands and in Appendix E. Action alternative impacts to groundwater, which may be linked to surface water in some areas, could affect riparian areas. Aquifers are discussed in the groundwater section. Commitments for environmental mitigation will insure that buried pipeline and other permanent construction facilities would not adversely affect these areas for all action alternatives (see environmental mitigation below and Appendix L.1).
No Action Alternative The increase in the number of months in the extreme low flow category at the Kindred gage near the H.R. Morgan Preserve could have consequences to riparian areas
4 - 201

Red River Valley Water Supply Project FEIS Chapter Four Environmental Impacts
within the preserve. The No Action Alternative was compared to the 2005 condition. The natural community in the preserve would respond to the 1930s-type drought condition, but this would be temporary and be limited to the duration of the drought. There would be no adverse consequences to the Head of the Mountain Nature Preserve as a result of aquifer use in southeastern North Dakota during a 1930s-type drought.
North Dakota In-Basin Alternative This alternative would reduce the occurrence of extreme low flows during a 1930s-type drought at Pigeon Point Preserve and H.R. Morgan Preserve. This could benefit riparian areas, natural resources, and aquatic resources at these preserves. Drawdowns associated with alternatives that propose to develop groundwater from the Brightwood, Milnor Channel, Gwinner, and Spiritwood Aquifers to serve industrial needs would not impact the Head of the Mountain Nature Preserve.
Red River Basin Alternative and GDU Import to Sheyenne River Alternative Flows in the Sheyenne River would improve during a 1930s-type drought near Lisbon and Kindred gages enhancing natural resources at Pigeon Point, Brown Ranch and H.R. Morgan Preserves when compared to the No Action Alternative. The use of the Milnor Channel Aquifer for industrial water demands would not impact the Head of the Mountain Nature Preserve.
GDU Import Pipeline Alternative and Missouri River Import to Red River Valley Alternative Near the Pigeon Point Preserve and Brown Ranch, there are beneficial effects to flow from these alternatives when compared to the No Action Alternative. Flows near the H.R. Morgan Nature Preserve at the Kindred gage (table 4.78) would minimally affect protected areas during a 1930s-type drought, potentially adversely, over the 71-year period of record when compared to the No Action Alternative.
State Wildlife Management Areas and Other Public Lands Impacts No Action Alternative Fort Ransom State Wildlife Management Area adjoins Fort Ransom State Park, and Mirror Pool State Wildlife Management Area is the North Unit of the H.R. Morgan Preserve. Therefore, state wildlife management areas at Fort Ransom and Mirror Pool would respond to the No Action alternative in the same manner as Fort Ransom State Park and H.R. Morgan Preserve (tables 4.77 and 4.78). The State also manages Audubon Wildlife Management Area within the Project area. Potential impacts to Audubon Lake on the Audubon Wildlife Management Area include changes in flows across the lake that may impact water quality and subsequently productivity. Consequences of a drought at Audubon Wildlife Management Area would be temporary and minimal. Assessment of water quality, as discussed in the water quality section of this chapter, found that there would be no changes in beneficial uses in Audubon Lake. Therefore, consequences to water quality and productivity on the area would be minimal.
Action Alternatives For all action alternatives, Fort Ransom State Wildlife Management Areas and Mirror Pool would be affected by import alternatives in the same way as the Fort Ransom State Park and H.R. Morgan Preserve. For all action alternatives, the Audubon Wildlife Management Area would be affected by action alternatives in the same way as the Audubon National Wildlife Refuge previously identified in the discussion on Service lands.
4 - 202

Red River Valley Water Supply Project FEIS Chapter Four Environmental Impacts
Other Protected Areas Impacts Natural Areas Registry and Natural Heritage Inventory Flow changes along the Sheyenne could affect the Pigeon Point Preserve and Brown Ranch near Lisbon, North Dakota. Table 4.77 shows how alternative would affect flows near the Pigeon Point Preserve and Brown Ranch at the Lisbon gage on the Sheyenne River.
The Pigeon Point Preserve and Brown Ranch would be affected in the same way as Fort Ransom State Park (see table 4.77 and No Action consequences for State Parks). At Pigeon Point Preserve and the Brown Ranch continued reliance on the Sheyenne River and the Sheyenne Delta Aquifers to meet future water supply under No Action could draw down key moist area communities that support rare plants, like the western prairie fringed orchid. Although this orchid survived the drought of the 1930s, it is uncertain how this species would react to extended extreme low flows in the Sheyenne River and depletion of the Sheyenne Delta Aquifer.
Cumulative Effects Impacts to protected lands from the action alternatives would be relatively minor. There are no known present or reasonably foreseeable non-Project future actions that would elevate these minor impacts to changes of greater magnitude.
Summary Table 4.81 summarizes the consequences of the No Action Alternative and the estimated impacts on protected lands when action alternatives are compared to the No Action Alternative.
Table 4.81 – Summary of Consequences of No Action and Estimated Impacts on Protected Lands.
Alternatives
Nat
iona
l G
rass
land
s
Cor
ps L
ands
Tew
auko
n N
atio
nal
Wild
life
Ref
uge
Aud
ubon
N
atio
nal
Wild
life
Ref
uge
Valle
y C
ity
Nat
iona
l Fis
h H
atch
ery
Serv
ice
Land
Pa
rcel
s
Stat
e Pa
rks
Nat
ure
Pres
erve
s
Stat
e W
ildlif
e M
anag
emen
t A
reas
Oth
er L
ands
No Action* m na A m A na m/B A A A North Dakota In-Basin
B m m na na m B/m B B B
Red River Basin
B na m na na m B/m B B/m B/m
GDU Import to Sheyenne River
B m na na B m B B B B
GDU Import Pipeline
B na m na A m B B B B
Missouri River Import to Red River Valley
B A na na A m B B B B
* The No Action Alternative was compared to the 2005 Current Condition to evaluate potential consequences. All Action alternatives were compared to the No Action Alternative. B Beneficial Effect, A Adverse Effect, m Minimal Effect, na not affected
No Action Alternative No consequences were found for Corps and Service lands. Adverse consequences are noted for Tewaukon National Wildlife Refuge, Valley City National Fish Hatchery, State Nature Preserves and Wildlife Management Areas and Other lands. The
4 - 203

Red River Valley Water Supply Project FEIS Chapter Four Environmental Impacts
National Grassland areas, Audubon National Wildlife Refuge and some State Parks incurred minimal consequences and beneficial consequences.
North Dakota In-Basin Alternative No impacts were found for Audubon National Wildlife Refuge, and Valley City National Fish Hatchery. Corps lands, Tewaukon National Wildlife Refuge, and Service land parcels showed minimal impacts when compared to No Action. Beneficial effects were found for the National grasslands, State nature preserves and wildlife management areas, and other lands. Beneficial and minimal impacts were found at State parks.
Red River Basin Alternative No impacts were found for Corps lands, Audubon National Wildlife Refuge, and Valley City National Fish Hatchery. National grasslands and State nature preserves showed beneficial effects when compared to No Action. Beneficial and minimal impacts were found at State parks, state wildlife management areas and other lands. Minimal effects were found for the Tewaukon National Wildlife Refuge.
GDU to Sheyenne River Alternative No impacts were found for Tewaukon and Audubon National Wildlife Refuges. National grasslands, Valley City National Fish Hatchery, State parks, nature preserves, wildlife management areas, and other lands showed beneficial effects when compared to No Action. Minimal impacts to Service parcels could occur.
GDU Import Pipeline Alternative No impacts were found for Tewaukon and Audubon National Wildlife Refuges. National grasslands, State parks, nature preserves, wildlife management areas, and other lands showed beneficial effects when compared to No Action. Minimal impacts were found on Corps lands and Service parcels. Adverse impacts were found at Valley City National Fish Hatchery, as months of extreme low flows were higher than No Action.
Missouri River Import to Red River Valley Alternative No impacts were found for Tewaukon and Audubon National Wildlife Refuges. National grasslands, State parks, nature preserves, wildlife management areas, and other lands showed beneficial effects when compared to No Action. Minimal impacts were found for Service parcels. Adverse impacts were found at Valley City National Fish Hatchery, as months of extreme low flows were higher than No Action. Adverse impacts were also found on Corps lands because of the construction of the biota water treatment plant and horizontal well collector system.
Environmental Mitigation • If Service properties (including fee and easement) cannot be avoided, local Service
managers will be contacted in order to implement appropriate procedures. Ensure that Service Refuge and Wetland Management District staff have accurate buried pipeline route maps to coordinate routing through Service wetland and grassland easements. Establish local coordination procedures to ensure timely evaluation and appropriate procedures for implementing review and compliance with the National Wildlife Refuge System Improvement Act of 1997.
• Buried pipeline construction and associated activities will avoid protected areas where practical. When impacts cannot be avoided, avoid construction activities
4 - 204

Red River Valley Water Supply Project FEIS Chapter Four Environmental Impacts
during primary seasonal recreational use or during nesting and place buried pipelines in road ROWs where possible to reduce impacts. Restore vegetation in construction areas.
• Avoid construction of all permanent facilities, excluding buried pipeline construction, in protected areas. If construction cannot be avoided on protected land, agreements will be negotiated with appropriate agencies through the Impact Mitigation Team to minimize impacts to protected lands. The GDU Mitigation Ledger will be reviewed for potential exchange for impacted protected lands.
4 - 205

Red River Valley Water Supply Project FEIS Chapter Four Environmental Consequences
Historic Properties
Introduction Would the Project affect historic properties (significant cultural resources)?
Section 106 of the National Historic Preservation Act requires that federal agencies consider the effects of federal undertakings on historic properties. Historic properties are significant cultural resources; including sites, buildings, structures, objects, or districts, or properties of traditional religious and cultural importance to Native Americans; that are either included in or have been determined eligible for inclusion in the National Register of Historic Places. Because most of the cultural resources previously recorded in the area of potential effects of the Project have not been evaluated to determine their eligibility for listing, the more generic term “cultural resources” is used in this discussion. Cultural resource terms are defined in the “historic properties” section in chapter three.
To evaluate the effects of a proposed undertaking on historic properties, federal agencies are required to consult with the appropriate SHPO, any tribe, or Tribal Historic Preservation Officer with a historic interest in the Project undertaking area of potential effects, and the interested public. Environmental documents prepared in compliance with the NEPA can be used to examine and address these effects and as the basis for consultation.
Methods Until final engineering plans are developed (if an action alternative is selected), an intensive cultural resource survey completed, cultural resources evaluated, and consultation concluded, the actual effects of the Project are undetermined. The discussion in this section is based upon the best available information that compares alternatives to each other and to the No Action Alternative.
To compare the potential direct effects of alternatives, the Class I literature survey for the Project by the University of North Dakota was used (Jackson et al. 2006). Because the corridor for the preferred alternative was revised, the Class I literature survey was updated (Jackson 2007). To collect data for this survey, the University of North Dakota searched files of the Minnesota and North Dakota SHPOs. They looked for cultural resources recorded in the 14 North Dakota and 4 Minnesota counties within the area of potential effects (Jackson et al. 2006). Because analysis of the Sheyenne River geomorphology concluded that operational flows in the river from any of the alternatives would not increase the potential for erosion, the river corridors were not included in the area of potential effects (see “flooding and erosion on the Sheyenne and Red Rivers” section in chapter four). In addition, a reconnaissance survey (Class II) was completed for the preferred alternative (see Appendix I). Analysis of the indirect effects of the Project on cultural resources along the Missouri River is based upon modeling conducted by the Corps (2007).
To estimate direct effects, locations of the cultural resources on file at the North Dakota and Minnesota SHPOs were plotted on a GIS layer, which were overlain with impact corridors. Two-mile wide corridors were used for pipeline impact analysis. Contiguous blocks of land
4 - 206

Red River Valley Water Supply Project FEIS Chapter Four Environmental Consequences
encompassing the limits of proposed development areas were used to analyze the impacts of well field construction.
The areas that actually would be disturbed by construction of Project features would be much smaller than the areas analyzed in the impact corridors. Disturbance by the larger pipelines would be limited to a 200 foot-wide corridor, while installation of smaller distribution pipelines would excavate narrower corridors (see Appendix E and table E.6). All pipelines would be buried. Each well site would disturb approximately ¼ acre and wells would be interconnected by 8” pipes. Construction of a biota WTP would impact about 25 acres. Using oversized impact zones for this analysis compensated for the lack of survey data but probably overestimated resource impacts. Regardless, impacts to cultural resources in construction areas would be permanent.
Assessment of the potential indirect effects of the Missouri River import alternatives on cultural resources along the Missouri River is based on an analysis conducted by the Corps (2007), which is attached as a supporting document. The Corps modeled the effects of the three Project alternatives that would import Missouri River Water on reservoir levels in the upper three Missouri River reservoirs and Lake Sharpe during drought periods. The Missouri River import alternatives are GDU Import Pipeline, GDU Import to the Sheyenne River, and Missouri River Import to Red River Valley.
The model projected the impacts of withdrawals for the three alternatives over the short-term, during the period from 1930-1941, and over the long-term, from 1930-2002. The study attempted to model the effects of fluctuating reservoir levels on a variety of resources, including recorded cultural resources along their shorelines. Effects were evaluated against the erosion potential of the shoreline.
An erosion rating index was developed for the cultural resources. A positive percent change in the index number meant that erosion potential would be less than No Action and a negative change indicated an increase in erosion. The study focused on evaluating present levels and projected levels for the period of 1930-1941 and the indirect effects on recorded cultural resources.
Results
Density of Cultural Resources The numbers of cultural resources are compared by alternative in figure 4.52. Historic properties frequencies are compared by alternative in table 4.82. The values in these tables represent the number of cultural resources and historic properties recorded a 2-mile wide corridor, although the actual ROW width would be approximately 200 feet. The historic properties consist of various kinds of prehistoric archaeological sites, historic archaeological sites, and historic architectural sites (see chapter three “historic properties” section). Excluding urban block surveys, the historic architectural sites are comprised mainly of rural churches and bridges.
4 - 207

Red River Valley Water Supply Project FEIS Chapter Four Environmental Consequences
Number of Sites per Alternative
0
50
100
150
200
250
300
350
400
450
Red River Basin ND In-Basin GDU ImportPipeline
Missouri River toRRV
GDU Import toSheyenne River
ND MN
Figure 4.52 – Bar Chart Comparing the Number of Cultural Resources Recorded in the Area of Potential Effects of the Alternatives.
Table 4.82 – Number of Historic Properties Recorded in Project Area of Potential Effects in North Dakota and Minnesota.
Alternative
National Register of Historic Places Status State
Nor
th D
akot
a
In-B
asin
Red
Riv
er
Bas
in
GD
U Im
port
to
She
yenn
e R
iver
GD
U Im
port
Pi
pelin
e
Mis
sour
i R
iver
Impo
rt
to R
ed R
iver
Va
lley
Listed ND 3 1 0 2 2 MN 1 10 0 0 0
Sub-Total 4 11 0 2 2 Eligible for listing1 ND 8 5 6 7 9
MN 0 8 0 0 0 Sub-Total
8 13 6 7 9 Not eligible2 ND 45 25 30 36 32
MN 0 1 0 0 0 Sub-Total 45 26 30 36 32 Unevaluated ND 79 63 41 84 72
MN 0 0 0 0 0 Sub-Total 79 63 41 84 72 Unknown ND 0 0 0 0 1
MN 19 278 0 1 1 Sub-Total 19 278 0 1 2 Total 155 391 77 130 117 1 Eligible for listing includes those sites determined eligible by the SHPO in consultation with the federal agency or by the National Park Service and those sites recommended as eligible by the researcher. 2 Not eligible includes those sites determined ineligible by the SHPO in consultation with the federal agency and those sites recommended as ineligible by the researcher.
4 - 208

Red River Valley Water Supply Project FEIS Chapter Four Environmental Consequences
Because the areas of potential effect have not been intensively inventoried nor all the resources evaluated with respect to their eligibility for inclusion in the National Register of Historic Places, figure 4.52 and table 4.82 reflect a preliminary inventory. Given these factors, comparisons of the alternatives are considered provisional. However, historic properties would be identified and be avoided or mitigated whenever possible (see environmental mitigation and Appendix L.1).
The density of the cultural resources by square mile in the area of potential effects of each alternative is compared in figure 4.53. Of all of the action alternatives, the Red River Basin Alternative corridors contain the most recorded archaeological and architectural sites, more than twice that of any other alternative (table 4.82). Figure 4.53 suggests that the differences in the number of recorded sites between alternatives may partially reflect site densities, since the site density for the Red River Basin Alternative is also the highest. It has a density 1.6 times greater than the alternatives with the next highest density.
-
0.02
0.04
0.06
0.08
0.10
0.12
0.14
0.16
0.18
Red River Basin
GDU Import Pipeline
ND In-Basin GDU Import To Sheyenne River
Missouri RiverImport to RRV
Figure 4.53 - Bar Chart Comparing the Density by Action Alternatives of Recorded Cultural Resources per Square Mile.
The higher site density of the Red River Basin Alternative shown in figure 4.53 may reflect that this alternative includes two large aquifer well fields, one of which covers large portions of Otter Tail and Becker Counties in Minnesota. These well fields are dotted with numerous lakes, and most of the recorded cultural resources are located near these bodies of water. The larger number of prehistoric sites could also reflect the proximity of the Red River. Generally, the density of prehistoric sites increases towards permanent sources of water. Other possible factors could be the higher number of historic archaeological and architectural sites in the larger urban
4 - 209

Red River Valley Water Supply Project FEIS Chapter Four Environmental Consequences
areas in the valley. Finally, the larger number and higher density could also reflect, at least in part, that surveys in Minnesota have been more numerous and extensive.
In comparison, the other four action alternatives, restricted for the most part to eastern North Dakota, exhibit similar site densities. Outside the Red River Basin, only the Sheyenne River has been inventoried; however, and these identification efforts have been minimal at best. The lower site densities probably reflect the absence of water sources equivalent to the Red River and the well fields and larger urban areas. These factors suggest that the Red River Basin Alternative of all of the action alternatives would have the highest potential to impact cultural resources and historic properties.
Direct Effects No Action It is difficult to predict the site-specific consequences of this alternative because of the lack of site-specific locations for the reasonably foreseeable future projects considered under this alternative (see Appendix A.1). It is estimated that approximately 52 acres would be disturbed by the No Action Alternative (Appendix E, table E.3), as compared to as many as 13,767 acres by the Missouri River Import to Red River Valley Alternative (Appendix E, table E.6). Given the relatively few acres that would be disturbed, the consequences undoubtedly would be much less than for any of the action alternatives. Therefore, this alternative is 1st in rank as having the least potential to impact cultural resources.
North Dakota In-Basin The 155 resources associated with this alternative represents the second highest number of recorded cultural resources among the alternatives. Four resources are listed in and another 8 are considered eligible for inclusion in the National Register of Historic Places (table 4.82). With a density of 0.10 sites per square mile, impacts from this alternative are similar to the GDU Import to the Sheyenne River and the GDU Import Alternatives (figure 4.53). This alternative is 5th in rank of all of the alternatives.
Red River Basin The 391 cultural resources in the impact corridors represent the highest number of resources among the alternatives and indicate that cultural resource impacts may be greater from this alternative than any of the others (figure 4.52). Eleven resources are listed, and 13 are considered eligible for inclusion on the National Register of Historic Places (table 4.82). It has the highest density of sites per square mile of 0.16 (figure 4.53). This alternative has the lowest rank; 6th of all the alternatives.
GDU Import to Sheyenne River The 77 cultural resources in the corridors for this alternative contain the fewest number of recorded cultural resources of all the action alternatives (figure 4.52). None of the resources are listed and 6 have been recommended eligible for inclusion in the National Register of Historic Places (table 4.82). With a density of 0.10 sites per square mile, site density is the same as the North Dakota In-Basin and the GDU Import Alternatives (figure 4.53). This alternative is 2nd in rank of all the alternatives.
GDU Import Pipeline The 130 cultural resources in the impact corridors are the third highest count among the alternatives (figure 4.52). Two sites are listed in and seven are considered eligible for inclusion in the National Register of Historic Places (table 4.82). With a density of 0.10 sites per square mile, site density is the same as the North Dakota In-Basin and the GDU
4 - 210

Red River Valley Water Supply Project FEIS Chapter Four Environmental Consequences
Import to Sheyenne River Alternatives (figure 4.53). This alternative is 4th in rank of all the alternatives.
Missouri River Import to Red River Valley The 117 resources associated with this alternative represents the third lowest number of sites among the alternatives (figure 4.52). Two resources are listed in and another nine are considered eligible for listing in the National Register of Historic Places (table 4.82). This alternative has the lowest site density of the alternatives, 0.08 sites per square mile (figure 4.53). This alternative is 3rd in rank of all the alternatives.
Indirect Impacts (Missouri River System) No Action Alternative The import of Missouri River water to the Red River Valley without the Project is not reasonably foreseeable (see chapter two No Action Alternative description); however, an increase in the withdrawal of water from the Missouri River is reasonably foreseeable. The Corps (2007) study suggests a 3% decrease in historic properties when comparing No Action to current conditions over the period of record (1930-2002) and a 2% decrease during a 1930s-type drought.
North Dakota In-Basin Alternative This alternative was not evaluated in the Corps (2007) study, because this alternative would use only in-basin water supplies. The North Dakota In-Basin Alternative would not affect cultural resources in the Missouri River System.
Red River Basin Alternative This alternative was not evaluated in the Corps (2007) study, because this alternative would use only in-basin water supplies. The Red River Basin Alternative would not affect cultural resources in the Missouri River System.
GDU Import to Sheyenne River The Corps (2007) study shows no change (0%) when compared to the No Action Alternative.
GDU Import Pipeline The Corps (2007) study shows no change (0%) when compared to the No Action Alternative.
Missouri River Import to Red River Valley The Corps (2007) study shows no change (0%) when compared to the No Action Alternative.
Cumulative Effects No other projects along the Project impact corridors have been identified. Because erosion along the rivers is not expected to increase from implementation of any of the Project alternatives, and no cumulative impacts with the Devils Lake Outlet are anticipated.
Summary Before an action alternative is constructed, the objective will be to identify and evaluate any historic properties that could be affected by the undertaking and either avoid the properties or mitigate any adverse effects to these properties. These activities will be done in consultation with SHPOs, Tribal Historic Preservation Offices, and tribes, under the terms of a programmatic agreement (see Appendix I). Adverse direct effects to some historic properties are likely from Project construction. Avoidance is the preferred method of mitigating any adverse effects, as it would preserve the historic property. However, should avoidance not be possible, mitigation
4 - 211

Red River Valley Water Supply Project FEIS Chapter Four Environmental Consequences
measures developed in consultation with the appropriate SHPO and, if applicable, tribes and Tribal Historic Preservation Officers, would be implemented. These mitigation measures also would preserve the data represented by and contained within the property, thereby minimizing any direct effects.
Because of the overall paucity of cultural resource data, it is difficult to evaluate with any accuracy the number of cultural resources and historic properties likely to be affected by the alternatives. It is estimated that approximately 52 acres would be disturbed by the No Action Alternative, as compared to as many as 13,767 acres by the Missouri River Import to Red River Valley Alternative (Appendix E, table E.6). Given the relatively few acres that would be disturbed, the consequences undoubtedly would be much less for No Action than for any of the action alternatives.
The University of North Dakota inventory (Jackson et al. 2006; Jackson 2007) indicates that the Project, regardless of alternative, would likely encounter cultural resources and historic properties. A comparison site densities of archaeological and historic sites and architectural structures (figure 4.53) indicates that the Red River basin alternative overall has the highest likelihood of adversely affecting historic properties. In evaluating figure 4.53 and the higher density of resources associated with the Red River basin Alternative, it must be considered that this alternative comprises large urban areas and a large percentage of the resources are historic sites and architectural sites.
Conversely, the GDU Import to the Sheyenne River has the lowest number of recorded resources of the action alternatives (figure 4.52). The reasons for this are unclear, considering that the site density is similar to the GDU Import Pipeline and the North Dakota In-basin Alternatives. One possible reason is that this alternative would involve the least amount of ground disturbance. The comparability in site densities suggests that this is the most likely explanation.
The ranking of the alternatives based upon number of recorded cultural resources (figure 4.52), number of historic properties (table 4.82), and density of cultural resources per mile in the impact corridors (figure 4.53). The ranking of alternatives is as follows:
1) No Action (fewest acres to be disturbed) 2) GDU Import to Sheyenne River (77 cultural resources, 6 historic properties, .10 site
density) 3) Missouri River Import to Red River Valley (117 cultural resources, 11 historic properties,
.08 site density) 4) GDU Import Pipeline (130 cultural resources, 9 historic properties, .10 site density) 5) North Dakota In-Basin (155 cultural resources, 12 historic properties, .10 site density) 6) Red River Basin (391 cultural resources, 24 historic properties, .16 site density)
The data indicate that whatever alternative is the selected alternative, the Project could adversely affect cultural resources and historic properties. Not all of the cultural resources in the area of potential effects would be directly affected. Whether the Project will have an effect will depend upon the Project design and the locations of resources and properties with respect to the areas of potential disturbance.
4 - 212

Red River Valley Water Supply Project FEIS Chapter Four Environmental Consequences
Environmental Mitigation Reclamation is presently consulting with the Advisory Council on Historic Preservation, North Dakota SHPO, and the Standing Rock Sioux Tribe and Three Affiliated Tribes Tribal Historic Preservation Officers to develop a programmatic agreement under Section 106 of the National Historic Preservation Act (Appendix I). This agreement will address how Reclamation will comply with the National Historic Preservation Act and other related laws and regulations, such as the Native American Graves Protection and Repatriation Act. This agreement will be for the life of the project and will outline the consultation process to determine inventory needs and identify the standards to be used for resource evaluations and mitigation. In addition, Reclamation will continue consultation with other interested tribes.
Reclamation anticipates that previously unidentified cultural resources that would qualify as historic properties may be present in unsurveyed areas of pipeline alignments or other impact zones. These historic properties could be affected by the Project, but the following environmental commitments will minimize adverse effects to historic properties:
• Reclamation will continue consultation to develop a programmatic agreement under Section 106 of the National Historic Preservation Act (Appendix I) for the Project. This agreement will address how Reclamation will comply with the National Historic Preservation Act and other related laws and regulations, such as the Native American Graves Protection and Repatriation Act. This agreement will outline the consultation process to determine inventory needs and identify standards to be used for resource evaluation and mitigation. In addition, Reclamation will continue consultation with interested tribes.
• Avoidance will be the preferred method for treating historic properties. However, should that not be possible, the programmatic agreement will identify the standards to be used in developing mitigation plans.
• Once a preferred alternative has been selected and Congress has authorized construction, Reclamation will implement the programmatic agreement and will comply with the terms of this programmatic agreement for the life of the project.
• Reclamation will consult under Section 106 of the National Historic Preservation Act with appropriate Indian tribes regarding the locations of and potential impacts to properties of traditional religious and cultural importance. If any such properties cannot be avoided and must be mitigated, Reclamation will invite the appropriate tribes to participate in development of an appropriate treatment plan.
• All gravel, fill, and rock materials will be obtained from a source approved by Reclamation to ensure compliance with Section 106 of the National Historic Preservation Act.
4 - 213

Red River Valley Water Supply Project FEIS Chapter Four Environmental Consequences
Indian Trust Assets
Introduction What would the effect of the alternatives be on Indian trust assets?
This section discusses the effects of the project alternatives and the consequences of the No Action Alternative on ITAs. As documented in chapter three, three categories of ITAs were identified that could potentially be affected by the Project. These three categories are:
• trust lands; • hunting, fishing, and gathering rights; and • Indian water rights.
Methods Reclamation consulted with individual tribes to identify ITA concerns and to assess potential impacts. To identify potential impacts to trust lands, the areas of potential effects for the Project alternatives were compared to the Bureau of Indian Affairs land database for the distribution of trust lands. To identify and hunting, gathering, and fishing rights, Royce (1899) was used to determine the geographical boundaries of different treaties. The terms of those treaties and pertinent Supreme Court decisions relative to treaty rights, such as Winters v. United States (1908) and Minnesota v. Mille Lacs (1999) were considered.
Results
Red River Basin Trust Assets No Action Alternative This alternative would not have consequences to any trust lands, hunting, gathering rights, or water rights. Lake Ashtabula, which is the main water supply source in the Red River Valley, would be drained to dead pool. Extremely low flows in the Sheyenne and Red Rivers would result from increased depletions and lack of releases from Lake Ashtabula. There would be consequences to aquatic communities.
North Dakota In-Basin This alternative would not affect any trust lands; hunting, fishing, and gathering rights; or water rights over the long-term. The short-term beneficial effect of this alternative during a 1930s-type drought would be to reduce the number of months of extreme low flow in the Sheyenne and Red Rivers. The reduction in extreme low flows over the short-term would benefit fisheries in these streams (see “aquatic communities” section).
Red River Basin This alternative would not affect trust lands or any hunting and gathering rights over the long term. The Sisseton-Wahpeton Oyate of the Lake Traverse Reservation overlies or is adjacent to the Hankinson, Brightwood, Spiritwood, and Milnor Channel Aquifers. Should any of these aquifers serve as a water source in the preferred alternative, consideration would be given as to whether the Sisseton-Wahpeton Oyate are withdrawing water and what their rights are with respect to the proposed withdrawals.
4 - 214

Red River Valley Water Supply Project FEIS Chapter Four Environmental Consequences
The short-term beneficial effect of this alternative during a 1930s-type drought would be to reduce the number of month of extreme low flow in the Sheyenne and Red Rivers. The reduction in extreme low flows over the short-term would benefit fisheries in these streams (see “aquatic communities” section).
GDU Import to Sheyenne River This alternative would not affect trust lands, water rights, or any hunting and gathering rights over the long-term. The alternative could potentially affect the fishing rights of the Minnesota Chippewa/Ojibwe affirmed by the U.S. Supreme Court in the Minnesota v. Mille Lacs (1999) decision, although the potential impacts appear to be indirect. The indirect effect would relate to the possible introduction of potential invasive species that would adversely affect the endemic species over the long-term. However, as discussed in the “risks of invasive species” section earlier in this chapter, the proposed biota WTPs and other control systems would minimize the potential for the introduction of potential invasive species into the Red River Basin. Exact determination would have to await design plans should this alternative be selected. Consultation with the Minnesota Chippewa/Ojibwe to determine the legal relationship of their fishing rights with respect to the Project would be needed.
The short-term beneficial effect of this alternative during a 1930s-type drought would be to reduce the number of months of extreme low flow in the Sheyenne and Red Rivers. The reduction in extreme low flows over the short-term would benefit fisheries in these streams (see “aquatic communities” section).
GDU Import Pipeline This alternative would not affect trust lands, water rights, or any hunting and gathering rights over the long-term. The alternative could potentially affect the fishing rights of the Minnesota Chippewa/Ojibwe affirmed by the U. S. Supreme Court in the Minnesota v. Mille Lacs (1999) decision. The only potential impacts appear to be indirect, through the possible introduction of potential invasive species that would adversely affect the endemic species over the long-term. However, as discussed in the “risks of invasive species” section earlier in this chapter, the proposed biota WTPs and other control systems would minimize the potential for the introduction of potential invasive species into the Red River Basin. Exact determination would have to await design plans should this alternative be selected. Subsequent consultation with the Minnesota Chippewa/Ojibwe to determine the legal relationship of their fishing rights with respect to the Project would be needed.
The short-term beneficial effect of this alternative during a 1930s-type drought would be to reduce the number of month of extreme low flow in the Sheyenne and Red Rivers. The reduction in extreme low flows over the short-term would benefit fisheries in these streams (see aquatic communities section).
Missouri River Import to Red River Valley This alternative would not affect trust lands, water rights, or any hunting and gathering rights over the long-term. The alternative could potentially affect the fishing rights of the Minnesota Chippewa/Ojibwe affirmed by the U. S. Supreme Court in the Minnesota v. Mille Lacs (1999) decision. The only potential impacts appear to be indirect, through the possible introduction of potential invasive species that would adversely affect the endemic species over the long-term. However, as discussed in the risks of invasive species section earlier in this chapter, the proposed biota WTPs and other control
4 - 215

Red River Valley Water Supply Project FEIS Chapter Four Environmental Consequences
systems would minimize the potential for the introduction of potential invasive species into the Red River Basin. Exact determination would have to await design plans if this alternative is selected. Consultation with the Minnesota Chippewa/Ojibwe to determine the legal relationship of their fishing rights with respect to the Project would be needed.
The short-term beneficial effect of this alternative during a 1930s-type drought would be to reduce the number of month of extreme low flow in the Sheyenne and Red Rivers. The reduction in extreme low flows over the short-term would benefit fisheries in these streams (see aquatic communities section).
Missouri River System Trust Assets No Action This alternative would not affect any trust lands; hunting, fishing, and gathering rights; or water rights.
North Dakota In-Basin This alternative would not affect trust lands; hunting, fishing, and gathering rights; or water rights.
Red River Basin This alternative would not affect trust lands; hunting, fishing, and gathering rights; or water rights.
GDU Import to Sheyenne River This alternative would not affect trust lands or hunting, fishing, and gathering rights. With respect to water rights, if tribes quantify their reserved water rights and put the water to beneficial use, the volume of water available for other users in the basin may be affected. The Corps (2004a) has stated, “[u]ntil such time as the Tribes quantify their water rights and consumptively withdraw their water from the Mainstem Reservoir System, the water is in the system.” The Corps intends to operate the Missouri River using the water currently in the system.
In its depletion analysis, Reclamation included all future tribal depletions documented in written plans, such as MR&I needs assessments. The data are in Appendix C. Some of these depletions are from water rights settlements, while others are not. The largest proposed Missouri River depletion of 80,239 ac-ft/year by the GDU Import to Sheyenne River Alternative should not affect reserved tribal water rights settlements. Any future tribal water rights settlements may require additional analysis of potential impacts on the Missouri Reservoir System.
GDU Import Pipeline This alternative would not affect trust lands or hunting, fishing, and gathering rights. With respect to water rights, if tribes quantify their reserved water rights and put the water to beneficial use, the volume of water available for other users in the basin may be affected. The Corps (2004a) has stated, “[u]ntil such time as the Tribes quantify their water rights and consumptively withdraw their water from the Mainstem Reservoir system, the water is in the system.” The Corps intends to operate the Missouri River using the water currently in the system.
In its depletion analysis, Reclamation included all future tribal depletions documented in written plans, such as MR&I needs assessments. The data are in Appendix C. Some of these depletions are from water rights settlements, while others are not. The largest proposed Missouri River depletion of 80,239 ac-ft/year by the GDU Import to Sheyenne River Alternative should not
4 - 216
Red River Valley Water Supply Project FEIS Chapter Four Environmental Consequences
affect reserved tribal water rights settlements. Any future tribal water rights settlements may require additional analysis of potential impacts on the Missouri Reservoir system.
Missouri River Import to Red River Valley This alternative would not affect trust lands or hunting, fishing, and gathering rights. With respect to water rights, if tribes quantify their reserved water rights and put the water to beneficial use, the volume of water available for other users in the basin may be affected.
Cumulative Effects The Project would not have any cumulative effects on trust lands or hunting and gathering rights. With respect to potential Indian water rights to the Missouri River, cumulative effects concern the amount of water that potentially would be available for other projects if tribes quantified their reserved rights. Quantification would not only affect those Project alternatives dependant upon Missouri River water but also other users of Missouri River water with permits junior to Indian water rights.
If tribes quantify their reserved water rights and put the water to use, the volume of water available for other users in the basin may be affected (see Appendix J). This EIS, however, does not attempt to determine, regulate, or quantify ITAs or any currently unquantified rights that tribes are, or may be, entitled to by treaty or law (nor would it be appropriate for an EIS for the stated purpose and need pursuant to DWRA to attempt to do so).
Reclamation recognizes and acknowledges that if and when tribal water rights are adjudicated and put to use, these could negatively affect the amount of water available to other projects and interests that rely on withdrawals from the Missouri River. Any such established and quantified Tribal water right would be applied consistent with federal law, including any established priority date for the water right. The Corps (2004a) has stated, “Until such time as the tribes quantify their water rights and consumptively withdraw their water from the Mainstem Reservoir System, the water is in the system.” The Corps intends to operate the Missouri River using the water currently in the system.
In its depletion analysis, Reclamation included all future tribal depletions documented in written plans, such as MR&I needs assessments. The data are in Appendix C. Some of these depletions are from water rights settlements, while others are not. The largest proposed Missouri River depletion of 80,239 ac-ft/year by the GDU Import to Sheyenne River Alternative should not affect reserved tribal water rights settlements. Any future tribal water rights settlements may require additional analysis of potential impacts on the Missouri Reservoir System.
If an in-basin alternative using water from the Hankinson, Brightwood, Spiritwood, and Milnor Channel Aquifers is selected, this could affect the amount of water available to the Sisseton-Wahpeton Oyate. In this case, Reclamation would have to determine whether the Sisseton-Wahpeton Oyate is withdrawing water from an affected aquifer and if any quantified water right would be affected.
Depending upon the alternative selected and the identified impacts, it may be necessary to determine the legal relationship between tribal fishing rights and the Project. Cumulative effects
4 - 217

Red River Valley Water Supply Project FEIS Chapter Four Environmental Consequences
appear to be minimal. The only effects would be associated with the risk of importing potential invasive species from the Missouri River water into the Red River Basin, which is already occurring without the Project by other pathways (see risks of invasive species section). Irrespective of the selected alternative, the Project control systems would minimize the risks of introducing biota that could affect fisheries. Further, the potential would be indirect, through the possible introduction of potential invasive species that could affect endemic species. However, the proposed control systems are designed to minimize the risk to be very low.
The short-term beneficial effect of the action alternatives during a 1930s-type drought would reduce the number of month of extreme low flow in the Sheyenne and Red Rivers. The reduction in extreme low flows over the short-term would benefit fisheries in these streams (see “aquatic communities” section).
Summary Table 4.83 summarizes the consequences of No Action and impacts of the action alternatives on ITAs. Details of the analysis are described in Appendix J.
Table 4.83 – Summary of the Consequences of No Action and Potential Impacts to ITAs by Action Alternatives.
Indian Trust Assets No Action Alternative Action Alternatives
Trust Lands No consequences No effect
Hunting, Fishing and Gathering Rights - Chippewa/Ojibwe fishing rights
Extremely low flows in the Sheyenne and Red Rivers would result from increased depletions and lack of releases from Lake Ashtabula. The extreme low flows in the Red River could affect lake sturgeon restoration efforts of the White Earth Band of Chippewa.
No effect; all action alternatives would improve fisheries in the Red River Basin to varying degrees.
Indian Water Rights – surface water No consequences
Undetermined - Most tribes have not quantified these rights in the Missouri River Basin.
Indian Water Rights - groundwater No consequences
If it is determined that the Sisseton-Wahpeton Oyate have a right to groundwater and that right is quantified, it may affect the amount of water available for an alternative that uses water from the Hankinson, Brightwood, Spiritwood, and Milnor Channel Aquifers.
The Supreme Court has affirmed that the Minnesota Chippewa/Ojibwe tribe has fishing rights. The Project alternatives were evaluated for their effects to tribal fisheries. Potential long-term productivity impacts would be limited to the Red River Basin and would be associated only with those alternatives involving the importation of Missouri River water. Further, the potential would be indirect, through the possible introduction of potential invasive species that could affect endemic species. However, the proposed control systems are designed to minimize the risk to be very low. The short-term beneficial effect of the action alternatives during a 1930s-type drought would be to reduce the number of months of extreme low flow in the Sheyenne and Red Rivers. The reduction in extreme low flows over the short-term would benefit fisheries in these streams (see aquatic communities section).
4 - 218

Red River Valley Water Supply Project FEIS Chapter Four Environmental Consequences
Indian water rights could potentially affect the Project. Quantification of those rights on the Missouri River could affect the amount of water available, not only to the Project but to other users as well. The other aspect of Indian water rights involves the use of groundwater. Trust lands of the Sisseton-Wahpeton Oyate and its members within the Lake Traverse reservation overlie or are adjacent to the Hankinson, Brightwood, Spiritwood, and Milnor Channel Aquifers. The states of North Dakota or South Dakota have not issued any permits for groundwater withdraws within the Lake Traverse Reservation. The Sisseton/Wahpeton Oyate does not issue permits for groundwater withdraws within the reservation (Alba Quinn, personal communication, December 12, 2006). The implementation of any alternative that uses this water source would have to consider whether the Sisseton/Wahpeton Oyate Tribe has a water right with respect to the proposed withdrawals. If it is determined that they have a right and that right is quantified, it may affect the amount of water available for an alternative that uses these aquifers.
Environmental Mitigation • Reclamation will continue to consult with potentially affected tribes through the final design
of a selected alternative and implementation stages. Reclamation will consult with potentially affected tribes to determine whether any ITAs may be directly affected by Project plans and specifications. If any ITAs are identified that may be affected by the Project, Reclamation will consult with the affected tribe(s) to determine the most appropriate avoidance or mitigation measures.
4 - 219

Red River Valley Water Supply Project FEIS Chapter Four Environmental Consequences
Social and Economic Issues
Introduction
What would the effect of the Project be on social and economic issues?
This section of the FEIS examines the potential effects of the Project on social and economic issues. This includes impacts to the economy due to construction and OM&R spending, increased water service rates, and drought effects in the Red River Valley and Missouri River Basin due to depletions. The scope of the analysis is generally the Red River Valley in North Dakota and Minnesota but also includes the Missouri River system because of the potential effects of depletions. The main indicator used to measure impacts is dollars.
The Project is considering several alternatives that would have a variety of potential impacts on the regional economy. Each of the action alternatives would reduce the probability of MR&I water shortages. Reducing the probability of a water shortage during periods of drought can affect the regional economy in several ways. Some economic activities that require water as an input may need to be significantly curtailed during periods of drought. Drought could also adversely affect recreation visitation and related recreation expenditures. It is also possible that the potential for insufficient water supplies during drought conditions could discourage some commercial enterprises from locating in the Red River Valley. Each action alternative that reduces the potential for water shortages would have positive regional economic impacts as compared to No Action. In addition, alternatives that would transfer water from the Missouri River could impact economic activities in the Missouri River Basin by increased water withdrawal from the system.
Commercial and industrial impacts from a municipal water shortage can be very large, depending on the magnitude and length of the shortage. These impacts can be from unexpected or anticipated shortages. Unexpected shortages generally cause greater impacts than anticipated shortages because fewer measures are available in the short-term to reduce drought impacts. The availability of water supplies for commercial users can influence the level of output, production costs, location of activities, and types of future businesses.
Each of the alternatives includes capital construction and annual OM&R expenditures that would generate regional economic impacts. This analysis describes the potential regional economic impacts associated with each of the alternatives, the methods used to estimate these impacts, and quantification of the impacts to the extent possible. The regional economic impacts from Project-related expenditures depend on the magnitude of the expenditures, the source of payments, and the extent to which the services are accessible within the region. Payments made by households to repay Project costs would reduce purchases of non-Project goods and services. These payments are included in the regional economic analysis. The financial analysis of alternatives presents the cost of each alternative on a per household and per 1,000 gallon basis.
4 - 220

Red River Valley Water Supply Project FEIS Chapter Four Environmental Consequences
The regional economic impacts from construction and operation of facilities associated with each alternative stem from capital, labor, energy, and other material expenditures within the region. These expenditures generally would lead to an increase in regional output and employment. These impacts are measured in terms of income, employment, and the value of goods and services produced in the region.
Methods The study area for environmental impacts typically covers the area of direct effects from construction or changes in operations. From an economic perspective, these direct impacts could extend well outside the direct impact areas to cover indirect affects and to account for flow of goods, services, and payments to major trade centers. Therefore, a regional economic impact analysis generally extends beyond an analysis of other resource impacts. Impacts to the Missouri River system due to depletions were analyzed using techniques developed by the Corps (2007).
Red River Valley Economic Impact Area There are three major impact categories for the Red River Valley:
1) One-time impacts from initial construction expenditures, 2) Recurring impacts from annual operation activities, and 3) Shortage impacts during drought years that affect production of goods and services that
require water and/or payments that would affect water users.
Construction impacts would occur wherever there is Project construction activity. Water shortage and repayment economic impacts are limited to the service area. For this economic analysis the construction impact area is much larger than the service area and includes all of the water user counties. For purposes of consistency, the construction impact region was used to evaluate all categories of regional impacts. The counties in the economic impact region are listed in table 4.84 and shown in figure 4.54.
Table 4.84 – Economic Impact Region.
Social and Economic Impact Analysis Counties
North Dakota Barnes, Burleigh, Cass, Cavalier, Foster, Grand Forks, Griggs, Kidder, Nelson, Pembina, Ransom, Richland, Sargent, Sheridan, Steele, Stutsman, Traill, Walsh, Wells
Minnesota Becker, Clay, Norman, Otter Tail, Polk, Traverse, Wilkin
The following indicators measure impacts of each alternative on the regional economy: • Change in value of regional output produced • Change in regional income • Change in regional employment • Change in the value of lost power generation
Regional impacts from changes in recreation expenditures, construction costs, and OM&R expenditures were analyzed using the IMPLAN (impact analysis for planning) Model. The IMPLAN Model uses the Department of Commerce national input-output model to estimate flows of commodities used by industries and commodities produced by industries. Social accounts are included in the IMPLAN model database for each region under consideration.
4 - 221

Red River Valley Water Supply Project FEIS Chapter Four Environmental Consequences
Social accounts represent the flow of commodities to industry from producers and consumers, as well as consumption of the factors of production from outside the region. Social accounts are converted into input/output accounts and the multipliers for each industry within the region, which account for the multiple effects of changes in spending associated with land retirement. The IMPLAN model also accounts for the percentage of expenditures in each category that would remain within the region and the percentage of expenditures that would flow outside the region.
In order to estimate regional economic impacts associated with each action alternative, estimates of changes in expenditures for goods and services, as compared to No Action, were input into the IMPLAN model. Estimating impacts from water shortages to businesses requires estimates of change in the value of production from shortages to various industries. Estimating the impacts of construction and operation, maintenance, and repair activities requires estimates of these expenditures by expenditure category.
Figure 4.54 – Economic Impact Region of the Proposed Project.
Recreation impacts are based primarily on changes in lake volume at Lake Ashtabula. For the purposes of this analysis a proportional relationship was assumed for lake recreation. The change in visitation was then applied to estimates of trip related recreation expenditures and analyzed using the IMPLAN model. Recreation impacts at other potentially affected sites were not quantified, but are likely to be minor compared to impacts at Lake Ashtabula.
The impacts of each alternative within the Red River Valley impact area are based on changes in the value of total industry output, employee compensation, and employment. The value of industry output is a measure of the total value of purchases by intermediate and final consumers associated with product demand. Industry output is directly comparable to the Gross Regional Product. Therefore, changes in the value of total industry output for each alternative is a measure of the impact each alternative would have on the value of all goods and service produced in the study region. Employee compensation represents wages and benefits paid to employees and employment is the number of part-time and full-time employees.
4 - 222

Red River Valley Water Supply Project FEIS Chapter Four Environmental Consequences
Missouri River System Economic Impact Area Missouri River system impacts are based on the results of the Red River Valley Water Supply Project Analysis of Missouri River of Effects report (Corps 2007). The methods used in the analysis are summarized in Appendix C. The report uses the modeling tools developed as part of the Missouri River Master Manual operations process. The report compares the current condition to the No Action Alternative and the No Action Alternative to the action alternatives. The economic or social indicators on the Missouri River system evaluated included hydropower production, navigation benefits and recreation. Hydropower production is separated into two categories in the FEIS. One category includes benefits and marketing revenues which are measured in dollars. The second category of hydropower production includes hydropower and thermal generation capacity at risk, which is measured in megawatts and gigawatt-hours, respectively.
Economic Impacts from Water Shortages In order to properly evaluate the economic effects of alternatives designed to reduce future water shortages, the economic impacts of various levels of water shortages need to be quantified. The impact of a water shortage on economic activities depends on the importance of water as an input to various commercial activities, the magnitude of the shortage, and the duration of the shortage.
A commercial water user’s production decision becomes a problem of profit maximization during times of a water shortage. This means that a producer would combine production inputs and determine its level of output based on the availability of the input in short supply, which in this case is water. In addition, under drought conditions the production decision is by the following factors:
Red River in 1910 During a Drought
• The degree to which water supply constraints are binding production. • Uncertainty about the adequacy of future supplies. • Future plans of a business to expand and increase output. • The extent to which water conservation methods have already been adopted and could be
adopted further. • The cost of conservation. • The extent to which a strategy could be chosen that would lower the risk of interrupted
production due to a water shortage.
A study completed for the California Urban Water Agencies (Spectrum Economics Inc. 1991) discussed the decisions that business managers need to make to minimize production costs during periods of drought. Examples of these decisions include minimizing the costs of obtaining water from alternate water sources, reducing water use per unit of good or service produced, or reducing the level of production. The preferred method of dealing with a water shortage would be to implement relatively inexpensive drought contingency measures while maintaining output. This typically occurs when a drought is not severe and is of short duration.
4 - 223

Red River Valley Water Supply Project FEIS Chapter Four Environmental Consequences
However, when a drought becomes severe and the inexpensive conservation methods are in use, then a reduction in output will most likely occur. The study provides estimates of the reduction in output that could occur from water supply shortages of various magnitudes.
The 1991 study included a survey of commercial/industrial water users. The survey asked for information regarding water use and the implementation of conservation methods under different water supply scenarios. The data gathered from the survey were used to estimate output elasticities for water. An output elasticity for water measures the percentage change in output for a business or industry that would occur as a result of a percentage change in the water input. For example, if a 1% reduction in available water results in a 0.5% reduction in output, then the output elasticity for water is 0.5. An elasticity greater than 1 indicates water is a very important input and the change in output is greater than a change in available water supplies. An elasticity less than 1 indicates other inputs can be substituted for water and output changes less than the change in water supplies.
Elasticities are calculated by industry in the study for shortages between 0% and 15% and between 15% to 30% of a full water supply. Three industries showed essentially no relationship between industrial output and water supply shortages, meat packing, production of communication equipment, and motor vehicle production. This means that water is not a critical enough input to significant impact output decisions or that there are inputs or technology that substitute for water input. These three industries can be extrapolated to similar industries, such as the general meat processing, production of electronic based equipment, manufacturing of machinery, and some medical related manufacturing. The aircraft industry and electronic component sectors also showed a weak relationship between water supplies and commercial production. All of the non-zero industries showed an increasing sensitivity of production to reduced water supplies as the amount of shortage increases. Some industries show little reaction to a 15% shortage but a much greater reaction to a 30% shortage. The effect of water supplies on production is summarized qualitatively in table 4.85.
Table 4.85 – Impact of Water Shortages on Output.
Highest Moderately High Small But Important Zero
Bakery products Beverages Paint & allied products
Preserved Fruits & Vegetables Miscellaneous Food and related products. Soap, cleansers, and related Petroleum refining
Industrial chemicals Concrete, gypsum, & plaster products Fabricated metal production Computer and office equipment Drugs (15% - 30%)
Meat Packing Drugs (0% - 15%) Communication Motor Vehicles Aerospace
In another recent study of drought impacts, Goddard and Fiske (2005) estimated the impacts and degree of hardship that water shortages impose on municipal water systems. The study was conducted for Santa Cruz, California, and evaluated the potential impacts from water supply shortages of 10% to 60% compared to a full supply. The survey included about 1,900 commercial business accounts and 45 industrial accounts. The study indicated a wide variation in production impacts associated with various water supply shortages. The study was jointly written by the Santa Cruz Water Department and an engineering consultant to better understand the impacts of future water shortages on water users in Santa Cruz.
4 - 224

Red River Valley Water Supply Project FEIS Chapter Four Environmental Consequences
The study indicated that the production impacts from a 15% reduction in water supplies varied considerably from business to business. Initial water use reductions are relatively easy to accomplish because the least productive water uses will initially be eliminated and revenue losses will be fairly small. Important exceptions indicated in the study included the semiconductor industry, greenhouse and landscaping industries, and restaurants.
The Goddard and Fiske study also indicated that a 25% reduction in water deliveries to business and industrial water users would lead to significant cutbacks in output, averaging about 20% across all sectors. Retailers and restaurants would be particularly hard hit. More affected sectors would include smaller hotels and motels, large semiconductor design firms, and potentially community facilities. Semiconductor manufacturers would also suffer. The surveys also indicated 60% of the respondents said non-economic hardships were considerable or extreme. Small businesses would be adversely affected.
A 35% shortage in water supplies to businesses and industry would result in an average revenue loss across all businesses in excess of 30%, an approximately proportional change in output resulting from a water shortage relative to a full water supply. The losses would be greater for restaurants and retailers. The surveys indicated 50% of non-economic hardships were characterized as “extreme.” A summary of shortage impacts is presented in table 4.86.
Table 4.86 – Impact of Various Shortages on Given the information from the two California studies, the impact of a water shortage on commercial output can be estimated. The results of studies completed during drought conditions in California indicate that, on an average, it is likely that a shortage of 7.5% would translate into reduced water supplies of about 5.0%. The average output impact of a 5% water supply reduction indicated by the California studies is essentially zero.
Production. Hardship Shortage
Percentage Business Impacta
BUSINESS SHORTAGE Mild 4%
13% 22% 27% 33% 48%
5%
Moderate Serious Severe Critical Extreme INDUSTRIAL SHORTAGE
15% Mild Moderate Serious Severe Critical Extreme
25% 30% 35% 50%
1 2 4
4-5 6 6
2 3 5 5 6 6
Note: 1=Little or no impact (0% reduced revenue) 2=Some impact (5% reduced revenue) 3=Intermediate impact (15% reduced revenue) 4=Considerable impact (25% reduced revenue) 5=Major impact (33% reduced revenue) 6=Catastrophic impact (100% reduced revenue)
A water shortage of 15% is estimated to translate into an 11.7% to 12.1% reduction in water demands. This represents a significantly greater potential impact on economic activity. A 12% reduction in available supplies is a marginal area where negative production output effects can start to occur, depending on the type of industry affected and the length of time drought contingencies are imposed. The overall average effect would be about a 5% reduction in commercial revenues.
4 - 225

Red River Valley Water Supply Project FEIS Chapter Four Environmental Consequences
A shortage of 25% is estimated to translate into a 21.9% to 22.3% reduction in water demands. The California studies indicate that a mandatory actual reduction in water use of approximately 22% is likely to translate into a nearly proportional decrease in business revenues on average over all businesses. This represents a potentially large regional economic impact from a water shortage. A shortage of 35% would translate into a 32.3% to 32.7% reduction in water demands. This level of reduction would translate into very substantial impacts, ranging from 30% to 50% or more depending on the sector affected.
Analysis of Water Shortage Economic Impacts The economic impacts associated with water supply shortages under No Action use estimates of the value of output by sector for each municipality and rural area provided in the 2002 Economic Census (U.S. Census Bureau 2006) combined with estimates of the impacts of water shortages on commercial production. The impact of water shortages on commercial production are based primarily on the results of the two California studies summarized above. Output values attributable to each sector are combined with the estimated effect of drought on each sector to determine the impact of a drought on the value of goods and services produced in the region.
Water shortages that would occur under the No Action Alternative were determined by surface water modeling for each MR&I water system (see chapter two and Appendix B.1 of the FEIS). The No Action shortages were compared to the full water demand to determine a shortage percentage. The shortage percentages were then translated into an output percentage loss based on the information from the two previously described California studies. These final demand output losses were input into IMPLAN and the resulting impacts are presented in table 4.87. For this analysis, it is assumed that each of the action alternatives will meet water demands. The impacts presented in table 4.87 represent negative impacts associated with No Action.
Table 4.87 – Range of Annual Water Shortage Regional Impacts – No Action Alternative.
Extent of Shortage Total
Output Losses
Employee Compensation
Losses
Annual Employment
Losses
Worst Year of 1930s-type Drought Low estimate High estimate
Smallest Shortage Year of 1930s-type Drought Low estimate High estimate
Average Shortage Year of 1930s-type Drought Low estimate High estimate
(billions)
$3.69 $3.81
$0.22 $0.81
$2.09 $2.31
(billions)
$1.10 $1.14
$0.07 $0.25
$0.70 $0.62
(total)
50,200 52,100
3,000 11,300
28,700 31,700
A range of estimates is presented in 4.87 based on two different assumptions on how water shortages translate into changes in commercial output. One set of production impacts are based on the assumption that there are thresholds that must be reached before output impacts occur and thresholds beyond which impacts are greater than the shortage percentage. The potential existence of thresholds is supported in a study completed for the California Urban Water Agencies (Spectrum Economics, Inc. 1991) and a study by Goddard and Fiske (2005). Another
4 - 226

Red River Valley Water Supply Project FEIS Chapter Four Environmental Consequences
set of impacts is based on the assumption that shortage impacts are proportional to the shortage as a percentage of a full supply.
The magnitude of potential water shortage impacts can be illustrated by comparing the estimated shortage impacts shown in table 4.87 with the value of total output and employment for all of North Dakota. The 2002 Economic Census (U.S. Census Bureau 2006) estimated the total annual value of all sales, shipments, receipts, and revenue from goods and services produced in North Dakota to be about $34.6 billion and total employment to be about 250,200 employees. The impact study area in this analysis accounts for roughly two-thirds of total state economic activity.
If drought contingency measures, as discussed in Appendix A.1, were implemented as part of each action alternative, this could have a similar effect as a drought on economic activity, commercial output, employment, and income, with some important differences. As water supply restrictions are imposed to reduce demand in response to water shortages, commercial activities would be expected to be adversely affected. However, drought contingency measures could conceptually be implemented to minimize economic impacts of water shortages.
These measures may allow flexibility in delivering water to sectors that rely heavily on water as a production input and could warn of coming shortages, which would allow businesses, industry, and residents to better prepare for shortages. Therefore, the economic impacts from water supply reductions associated with drought contingencies may be less than the impacts associated with an unprepared water supply system. It should also be noted that the impacts would vary considerably depending on the length of time drought contingency plans are implemented. The geographic scope of this analysis is the Project service area.
The general economic related effects of water supply shortages include: • Loss to industries directly dependent on agricultural production (e.g., machinery and
fertilizer manufacturers, food processors, dairies, etc.). • Unemployment from drought-related declines in production. • Strain on financial institutions (foreclosures, credit risk, capital shortfalls). • A reduced tax base for federal, state, and local governments. • Loss to manufacturers and sellers of various types of equipment. • Losses related to recreation activities - hunting and fishing, bird watching, etc. • Revenue shortfalls to water suppliers.
Based on the results of the Spectrum Economics study and the Goddard and Fiske study, it is likely that a drought contingency goal of 7.5% will have a very small economic impact on the regional economy. A drought contingency goal of 7.5% is estimated to translate into a 5.0% to 5.1% water demand reduction. The average output impact of a 5% water supply reduction indicated by the California studies is essentially zero.
Based on the current level of economic activity in the counties included in the Red River Valley region and the estimated impacts discussed above, the impacts of imposing drought contingency goals and water supply reductions can be estimated. It should be stressed that there could be a great deal of variation in potential impacts depending on how the reductions are imposed on
4 - 227

Red River Valley Water Supply Project FEIS Chapter Four Environmental Consequences
different sectors. Annual impact estimates from drought contingency goals are shown in table 4.88. These represent negative impacts. It should be noted that the overall economic impact percentages shown in table 4.86 assume an overall drought contingency goal for the entire service area that imposes varying percentage reductions on different users rather than imposing uniform percentage reduction goals on all municipalities and industries.
Table 4.88 – Approximate Annual Impacts From Imposing Drought Contingency Goals.
Drought Contingency Goal Associated Percentage Decline in Overall Economic Activity
Approximate Annual Regional Impacts
7.5% 15% 25% 35%
1.5% 10.8% 26.6% 37.3%
$0.12 billion $0.86 billion $2.12 billion $2.96 billion
The economic impact values shown in table 4.88 only represent implementation of drought contingency measures for a single year. The Final Needs and Options Report (Reclamation 2005a) identified the 1930s-type drought as the critical hydrologic event for which all Project alternatives were designed. The 1930s-type drought was a 10-year event that would require significant water use reduction measures if no Project were constructed.
Table 4.89 shows the estimated water demand shortages for each year during a 1930s-type drought. Using the same methods discussed above to estimate the regional impacts summarized in tables 4.87 and 4.88, the impacts from implementation of drought contingency measures in each year of a 1930s-type drought were estimated. The last column of table 4.89 shows the estimated economic impact from implementation of drought contingency measures in that year. The total estimated regional impacts over the 10-year 1930s-type drought would be about $20.4 billion. If an alternative could be implemented that would avoid these shortages, the regional costs presented in table 4.89 could be avoided during a drought.
Table 4.89 – Estimated Regional Economic Impacts During 1930s-Type Drought.
Year Water Demand
Shortage (ac-ft)
Water Demand Shortage1
(%) Estimated Regional Impacts (millions $)
1931 12,275 9.5% $224.8 1932 14,312 11.1% $344.0 1933 23,492 18.2% $1,305.7 1934 55,080 42.6% $3,602.4 1935 26,647 20.6%
$1,653.3 1936 50,838 39.3% $3,323.5 1937 39,674 30.7% $2,596.4 1938 37,415 29.0% $2,452.1 1939 30,841 23.9% $2,021.2 1940 43,989 34.0% $2,875.3
Total $20,398.7 1 Percentage based on 134,746 ac-ft annual water demand.
There could be a great deal of variability in these impact cost estimates. The cumulative affect from consecutive years of drought are not accounted for in the analysis. For example, an industry may have moderate reduction in output (lost revenue) during one-year due to reduced
4 - 228

Red River Valley Water Supply Project FEIS Chapter Four Environmental Consequences
water availability; however, if that situation persisted for multiple years, the industry may eventually go out of business so the economic impact could be a 100% loss for that industry. Other industries may have some water use flexibility and be better able to adapt to less water availability reducing the, which may reduce or eliminate any economic impact on their business.
Based on this analysis it is estimated that little economic impact would result from implementing drought contingency goals at a level of 7.5% or less. Water demand reductions above 7.5% start to create negative economic impacts, although these impacts may remain quite small up to shortages of about 11%. Balancing the desire to reduce construction costs while limiting potential economic impacts associated with the implementation of drought contingency measures is a difficult challenge for water managers. This analysis shows that from an economic impact standpoint, implementation of drought contingency goals above 11% could have significant economic costs.
Finally, the drought contingency and water shortage impact analysis presented above assumes that even under extreme drought conditions alternative inputs, alternative technologies, and alternative arrangements such as water lease agreements from willing sellers to high valued commercial activities or recycling would not occur. It is possible that the estimated impacts presented above during the most severe years could be reduced considerably if a transfer occurred from a relatively low valued use to a high valued use. If drought related impacts translating into roughly 50,000 jobs during a severe drought year actually occurred, then some type of action to try to provide commercial users with water in the short term to help mitigate these impacts would be expected.
Results
Impacts of Drought in the Red River Valley No Action Alternative The water shortage estimated under the No Action Alternative would result in a cumulative negative economic impact of $20.4 billion dollars through the 10 years of a 1930s-type drought (table 4.89).
North Dakota In-Basin Alternative This alternative would alleviate future water shortages, so it would negate a cumulative negative economic impact of $20.4 billion dollars through the 10 years of 1930s-type drought (table 4.89).
Red River Basin Alternative This alternative would alleviate future water shortages, so it would negate a cumulative negative economic impact of $20.4 billion dollars through the 10 years of 1930s-type drought (table 4.89).
GDU Import to Sheyenne River Alternative This alternative would alleviate future water shortages, so it would negate a cumulative negative economic impact of $20.4 billion dollars through the 10 years of 1930s-type drought (table 4.89).
GDU Import Pipeline Alternative This alternative would alleviate future water shortages, so it would negate a cumulative negative economic impact of $20.4 billion dollars through the 10 years of 1930s-type drought (table 4.89).
4 - 229

Red River Valley Water Supply Project FEIS Chapter Four Environmental Consequences
Missouri River Import to Red River Valley Alternative This alternative would alleviate future water shortages, so it would negate a cumulative negative economic impact of $20.4 billion dollars through the 10 years of 1930s-type drought (table 4.89).
Economic Impacts from Project and Non-Project Expenditures The expenditure of funds to construction and maintain water system projects generally has a positive economic impact depending on the source of the funding. If most of the funding is from local sources the economic benefits are less. If most of the funding is from outside the regional area the economic benefits are greater.
Project Construction and OM&R Costs Table 4.90 summarizes estimated construction, OM&R, and annualized costs for each of the alternatives considered in this FEIS. Construction costs cover supplying bulk water service to the Red River Valley service area. Annual OM&R costs include all annual costs required to OM&R the water supply features. Annual OM&R costs equaling 1% of construction costs were used to estimate the No Action annual OM&R costs in table 4.90. This is based on the average OM&R annual cost for the action alternatives, which was determined to be 1% of construction costs. See chapter two for description of how costs are calculated.
Table 4.90 – Summary of Alternative Cost Estimates.
Alternative Construction Cost (2005 Dollars) * Annual OM&R Cost*
No Action $24,307,000 $1,023,000 North Dakota In-Basin $457,292,000 $5,604,000 Red River Basin $415,438,000 $6,676,000 GDU Import to Sheyenne River $659,833,000 $4,896,000 GDU Import Pipeline $910,539,000 $9,072,000 Missouri River Import to Red River Valley $1,064,551,000 $6,635,000 * Values are rounded to the nearest $1,000.
The No Action Alternative has the lowest construction and annual OM&R costs at $24,307,000 and $1,023,000, respectively, but these costs would only supply a minor volume of water and would not meet the purpose and need of the Project. From a water supply standpoint, the alternative with the lowest annualized cost is the least expensive over the long term (through 2050), considering both initial construction costs and long-term annual OM&R costs. This does not include infrastructure costs, which are discussed in the next section.
Infrastructure Costs In addition to the estimated costs of water supply previously discussed, another category of water system costs were identified that are referred to as infrastructure. These projects, i.e., future water system improvements and their associated cost, would be constructed by service area residents with or without the Project. These infrastructure projects would be common to all alternatives. Appendix A.3 describes the infrastructure activities through 2050, which generally include rehabilitation or expansion of water treatment plants, system distribution, and storage.
4 - 230

Red River Valley Water Supply Project FEIS Chapter Four Environmental Consequences
Estimating infrastructure project costs is important because these could influence the affordability of alternatives. The analysis of water user costs for each alternative is part of the environmental justice analysis presented.
Table 4.91 shows the infrastructure costs for each of the six alternatives. It includes construction and annual OM&R costs based on 2005 price levels. Annual OM&R costs were not specifically developed for infrastructure projects. However, these costs average approximately 1% of construction costs for the action alternatives, so 1% was used to estimate infrastructure annual OM&R costs.
Table 4.91 – Infrastructure Costs. Alternative Construction Cost
(2005 Dollars)* Annual OM&R Costs*
No Action $728,888,000 $7,289,000 North Dakota In-Basin $753,195,000 $7,532,000 Red River Basin $753,195,000 $7,532,000 GDU Import to Sheyenne River $753,195,000 $7,532,000 GDU Import Pipeline $753,195,000 $7,532,000 Missouri River Import to Red River Valley $753,195,000 $7,532,000 * Values are rounded to the nearest $1,000.
Table 4.92 shows the total construction costs for each proposed alternative and associated infrastructure costs and table 4.93 lists total annual OM&R costs for each alternative. These total construction and OM&R costs disclose the estimated total cost of water system projects in the service area through 2050. The No Action Alternative has the lowest infrastructure construction and annual OM&R costs at about $728.9 million and $7.29 million, respectively, but this is because this alternative only delivers a small portion of the anticipated water demand.
Other Costs There are additional costs associated with each of the action alternatives that should be noted even though they are not quantified in this analysis due to the difficulty in calculating them. As mentioned previously, it is possible that the alternatives that reduce the likelihood of a water shortage during a drought would have some impact on commercial and industrial location decisions. This may benefit the Red River Valley through an increase in commercial activity, but may have a negative impact on other competing areas. The shift in commercial activity may result in lost income and employment elsewhere, perhaps in other parts of North Dakota and Minnesota. These potential distributional impacts are not quantified in this analysis.
Any alternative that includes construction features could potentially have some irreversible effects on the environment. Irreversible costs are unusual in that once a decision is made that impacts a resource, that cost would always be imposed on society. Therefore, from an economic and social perspective we need to be fairly certain that an irreversible cost is necessary to meet the needs of society. Potential irreversible environmental costs are discussed in various affected environment sections of this report, but economic costs related to irreversibility are not quantified.
4 - 231
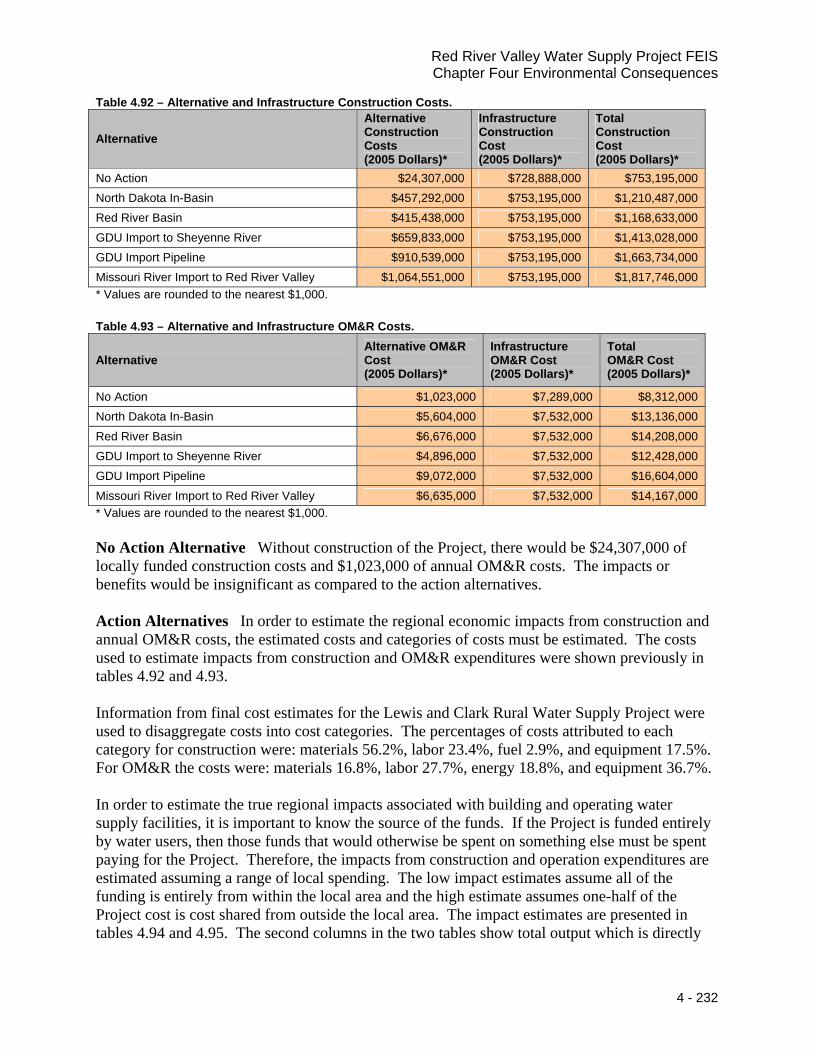
Red River Valley Water Supply Project FEIS Chapter Four Environmental Consequences
Table 4.92 – Alternative and Infrastructure Construction Costs.
Alternative Alternative Construction Costs (2005 Dollars)*
Infrastructure Construction Cost (2005 Dollars)*
Total Construction Cost (2005 Dollars)*
No Action $24,307,000 $728,888,000 $753,195,000 North Dakota In-Basin $457,292,000 $753,195,000 $1,210,487,000 Red River Basin $415,438,000 $753,195,000 $1,168,633,000 GDU Import to Sheyenne River $659,833,000 $753,195,000 $1,413,028,000 GDU Import Pipeline $910,539,000 $753,195,000 $1,663,734,000 Missouri River Import to Red River Valley $1,064,551,000 $753,195,000 $1,817,746,000 * Values are rounded to the nearest $1,000.
Table 4.93 – Alternative and Infrastructure OM&R Costs.
Alternative Alternative OM&R Cost (2005 Dollars)*
Infrastructure OM&R Cost (2005 Dollars)*
Total OM&R Cost (2005 Dollars)*
No Action $1,023,000 $7,289,000 $8,312,000 North Dakota In-Basin $5,604,000 $7,532,000 $13,136,000 Red River Basin $6,676,000 $7,532,000 $14,208,000 GDU Import to Sheyenne River $4,896,000 $7,532,000 $12,428,000 GDU Import Pipeline $9,072,000 $7,532,000 $16,604,000 Missouri River Import to Red River Valley $6,635,000 $7,532,000 $14,167,000 * Values are rounded to the nearest $1,000.
No Action Alternative Without construction of the Project, there would be $24,307,000 of locally funded construction costs and $1,023,000 of annual OM&R costs. The impacts or benefits would be insignificant as compared to the action alternatives.
Action Alternatives In order to estimate the regional economic impacts from construction and annual OM&R costs, the estimated costs and categories of costs must be estimated. The costs used to estimate impacts from construction and OM&R expenditures were shown previously in tables 4.92 and 4.93.
Information from final cost estimates for the Lewis and Clark Rural Water Supply Project were used to disaggregate costs into cost categories. The percentages of costs attributed to each category for construction were: materials 56.2%, labor 23.4%, fuel 2.9%, and equipment 17.5%. For OM&R the costs were: materials 16.8%, labor 27.7%, energy 18.8%, and equipment 36.7%.
In order to estimate the true regional impacts associated with building and operating water supply facilities, it is important to know the source of the funds. If the Project is funded entirely by water users, then those funds that would otherwise be spent on something else must be spent paying for the Project. Therefore, the impacts from construction and operation expenditures are estimated assuming a range of local spending. The low impact estimates assume all of the funding is entirely from within the local area and the high estimate assumes one-half of the Project cost is cost shared from outside the local area. The impact estimates are presented in tables 4.94 and 4.95. The second columns in the two tables show total output which is directly
4 - 232

Red River Valley Water Supply Project FEIS Chapter Four Environmental Consequences
comparable to the Gross Regional Product. The last column in the tables rank the alternatives based on total output with 1 being the best and 5 being the worst.
Table 4.94 – One-Time Total Construction Impacts.
Alternative/Scenario Total Output (million $)
Employee Compensation
(million $) Employment
(jobs) Rank
North Dakota In-Basin 50.8 – 308.3 0.72 – 4.36 30 – 185 4
Red River Basin 46.1 – 280.1 0.65 – 3.96 25 – 165 5
GDU Import to Sheyenne River 70.6 – 428.5 1.00 – 6.06 40 – 255 3
GDU Import Pipeline 101.0 – 613.8 1.43 – 8.69 60 – 365 2
Missouri River Import to Red River Valley 118.2 – 717.9 1.67 – 10.15 70 – 425 1
Table 4.95 – Annual OM&R Related Impacts.
Alternative/Scenario Total Output (million $)
Employee Compensation
(million $) Employment
(jobs) Rank
North Dakota In-Basin 1.66 – 4.24 0.29 – 0.73 13 – 34 3
Red River Basin 2.04 – 5.23 0.35 – 0.90 16 – 42 2
GDU Import to Sheyenne River 1.40 – 3.59 0.24 – 0.62 12 – 29 5
GDU Import Pipeline 2.27 – 5.81 0.39 – 1.00 18 – 47 1
Missouri River Import to Red River Valley 1.61 – 4.11 0.28 – 0.71 13 – 33 4
Construction of a water supply project generates positive regional economic impacts as measured by output, employment, and income because each action alternative requires purchases of large quantities of goods and services to build a water supply system. These expenditures lead to spin-off effects that increase the demand for goods and services in the region. Other examples of construction that lead to an increase in regional economic activity are the construction of sports facilities, large highway projects, and airport construction.
North Dakota In-Basin Alternative The alternative would have a one-time economic impact benefit ranging from $51 million to $309 million (ranked 4th among the alternatives) plus an annual economic benefit ranging from $1.7 million to $4.2 million (ranked 3rd among the alternatives) due to ongoing OM&R activities.
Red River Basin Alternative The alternative would have a one-time economic impact benefit ranging from $46 million to $280 million (ranked 5th among the alternatives) plus an annual economic benefit ranging from $2.0 million to $5.2 million (ranked 2nd among the alternatives) due to ongoing OM&R activities.
GDU Import to Sheyenne River Alternative The alternative would have a one-time economic impact benefit ranging from $71 million to $429 million (ranked 3rd among the alternatives) plus an annual economic benefit ranging from $1.4 million to $3.6 million (ranked 5th among the alternatives) due to ongoing OM&R activities.
4 - 233

Red River Valley Water Supply Project FEIS Chapter Four Environmental Consequences
GDU Import Pipeline Alternative The alternative would have a one-time economic impact benefit ranging from $101 million to $614 million (ranked 2nd among the alternatives) plus an annual economic benefit ranging from $2.3 million to $5.8 million (ranked 1st among the alternatives) due to ongoing OM&R activities.
Missouri River Import to Red River Valley Alternative The alternative would have a one-time economic impact benefit ranging from $118 million to $718 million (ranked 1st among the alternatives) plus an annual economic benefit ranging from $1.6 million to $4.1 million (ranked 4th among the alternatives) due to ongoing OM&R activities.
Economic Impacts from Project Repayment The increase cost of water service in the Red River Valley caused by Project repayment costs could have economic impacts. Appendix K.1 describes the financial analysis of the five action alternatives. The analysis estimates per household and per 1,000 gallon monthly costs to Project recipients as well as federal costs, if an alternative would be constructed.
In the process of conducting this analysis, a number of key assumptions were made. A term of 40 years to finance the Project was used in the analysis, which was based on the assumption that repayment of financial obligations would begin in 2010 and end by 2050. The financing of alternatives could be accomplished in a number of ways. This analysis assumed the Project would be funded in accordance with DWRA, as summarized below:
• The cost of construction of biota water treatment plants is a federal expense (federal grant), which would be non-reimbursable. This is based on the premise that compliance with the Boundary Waters Treaty of 1909 is a federal responsibility.
• Non-biota water treatment construction costs would be financed by an equal split of three funding sources; reimbursable federal loans (see below), State of North Dakota grants, and municipal bonds (see below).
• DWRA authorized up to $200 million in federal loans for Project construction. The interest rate applied for use of GDU facilities for MR&I water supplies is 3.225%, which was the rate in 1965 when the Project was authorized. Since the 2000 enactment of DWRA, the indexed cost of the original $200 million is $250 million.
• Any Project costs above the biota water treatment plant and $250 million of federal loans would be financed by water users using municipal bonds. The interest rate used for non-federal cost share is 5%, which approximates the bonding rate for Fargo, North Dakota.
• Biota water treatment plant OM&R costs would be funded by the federal government and considered non-reimbursable. All other OM&R costs are reimbursable by Project recipients.
• DWRA requires that the repayment of costs for existing GDU Principal Supply Work’s features is to be based only on the proportion of capacity of each feature used by the Project. DWRA also requires that assigned costs of GDU supply facilities (construction and OM&R) be repaid at 3.225%. Although some alternatives provide improved flow rates for fish, wildlife, recreation, and/or water quality, no construction costs were allocated to these purposes.
The above financing assumptions are included in the “EIS Option” analysis shown in Appendix K.1. The EIS Option was developed based on preliminary information provided by North
4 - 234

Red River Valley Water Supply Project FEIS Chapter Four Environmental Consequences
Dakota and Project sponsors. The financing option assumes federal government funding of the construction and OM&R costs of the biota WTP, which are non-reimbursable costs. All remaining costs would be funded one-third by municipal bonding, one-third by a state (grant) contribution, and one-third reimbursable federal financing. This option is the most likely method of financing the Project. The appendix also shows two other financing options referred to as “Option Two” and “Option Three”. These financing options are provided for additional information, but are not used in the FEIS analysis.
During construction of any alternative, interest costs would be incurred and accounted for in a financial analysis. These costs factor in the value of money between the start of construction when funds are borrowed and the completion of various construction contracts. This analysis assumed that interest during construction would equal 7% of construction costs for federal financing and 10.85% for non-federal financing.
Table 4.96 shows the estimated per household and per 1,000 gallon repayment costs for each alternative. The household repayment rate ranges from $5.21 to $8.87 per month. These are the amounts a typical household would pay in addition to their present monthly water bill. The table also provides estimated repayment rates based on 1,000 gallon increments. The 1,000 gallon incremental cost was calculated using per household costs and dividing by 6, assuming a typical household uses about 6,000 gallons per month. The last column in the table rank the alternatives based on monthly costs with 1 being the lowest (best) and 5 being the highest (worst).
Table 4.96 – Per Month Household and Per 1,000 Gallon Repayment Rates.
Alternative Dollars/Month $ per 1,000 Gallons Rank
North Dakota In-Basin $5.33 $0.89 2 Red River Basin $5.21 $0.87 1 GDU Import to Sheyenne River $5.26 $0.88 3 GDU Import Pipeline $8.25 $1.37 4 Missouri River Import to Red River Valley $8.87 $1.48 5
Table 4.97 shows alternative repayment rates based on costs per acre-foot of water use. These rates could be used to assess costs for large water users such as industries. Depending on the alternative the cost per ac-ft ranges from $282 to $482. If an industry required 2,000 ac-ft of water per year their repayment costs could range from $566,000 to $963,000 per year. The ranking of the alternatives based on per ac-ft costs is the same as per household costs in table 4.96.
Results shown in tables 4.96 and 4.97 would change if some of the assumptions used in the analysis were modified. These modified assumptions include increasing the level of federal or state grant funding, using a tiered rate structure, or using other repayment terms or interest rates.
4 - 235
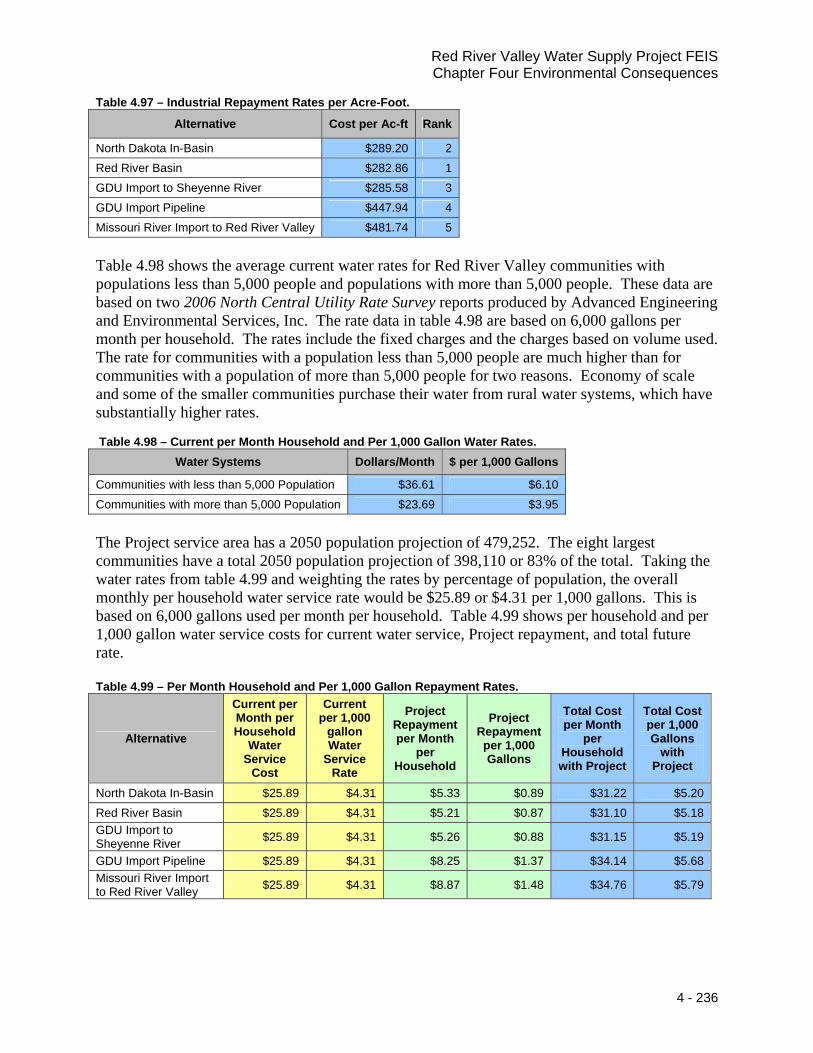
Red River Valley Water Supply Project FEIS Chapter Four Environmental Consequences
Table 4.97 – Industrial Repayment Rates per Acre-Foot. Alternative Cost per Ac-ft Rank
North Dakota In-Basin $289.20 2 Red River Basin $282.86 1 GDU Import to Sheyenne River $285.58 3 GDU Import Pipeline $447.94 4 Missouri River Import to Red River Valley $481.74 5
Table 4.98 shows the average current water rates for Red River Valley communities with populations less than 5,000 people and populations with more than 5,000 people. These data are based on two 2006 North Central Utility Rate Survey reports produced by Advanced Engineering and Environmental Services, Inc. The rate data in table 4.98 are based on 6,000 gallons per month per household. The rates include the fixed charges and the charges based on volume used. The rate for communities with a population less than 5,000 people are much higher than for communities with a population of more than 5,000 people for two reasons. Economy of scale and some of the smaller communities purchase their water from rural water systems, which have substantially higher rates.
Table 4.98 – Current per Month Household and Per 1,000 Gallon Water Rates. Water Systems Dollars/Month $ per 1,000 Gallons
Communities with less than 5,000 Population $36.61 $6.10 Communities with more than 5,000 Population $23.69 $3.95
The Project service area has a 2050 population projection of 479,252. The eight largest communities have a total 2050 population projection of 398,110 or 83% of the total. Taking the water rates from table 4.99 and weighting the rates by percentage of population, the overall monthly per household water service rate would be $25.89 or $4.31 per 1,000 gallons. This is based on 6,000 gallons used per month per household. Table 4.99 shows per household and per 1,000 gallon water service costs for current water service, Project repayment, and total future rate.
Table 4.99 – Per Month Household and Per 1,000 Gallon Repayment Rates.
Alternative
Current per Month per Household
Water Service
Cost
Current per 1,000
gallon Water
Service Rate
Project Repayment per Month
per Household
Project Repayment per 1,000 Gallons
Total Cost per Month
per Household with Project
Total Cost per 1,000 Gallons
with Project
North Dakota In-Basin $25.89 $4.31 $5.33 $0.89 $31.22 $5.20 Red River Basin $25.89 $4.31 $5.21 $0.87 $31.10 $5.18 GDU Import to Sheyenne River $25.89 $4.31 $5.26 $0.88 $31.15 $5.19
GDU Import Pipeline $25.89 $4.31 $8.25 $1.37 $34.14 $5.68 Missouri River Import to Red River Valley $25.89 $4.31 $8.87 $1.48 $34.76 $5.79
4 - 236

Red River Valley Water Supply Project FEIS Chapter Four Environmental Consequences
No Action Alternative The current average monthly water service cost is $25.89 per household in the Project service area.
North Dakota In-Basin Alternative The alternative would result in a water service cost increase of $5.33 per month per household (ranked 2nd among the alternatives), with a new monthly water service cost of $31.22. This is a 21% increase above the No Action or current monthly water service rate of $25.89.
Red River Basin Alternative The alternative would result in a water service cost increase of $5.21 per month per household (ranked 1st among the alternatives), with a new monthly water service cost of $31.10. This is a 20% increase above the No Action or current monthly water service rate of $25.89.
GDU Import to Sheyenne River Alternative The alternative would result in a water service cost increase of $5.74 per month per household (ranked 3rd among the alternatives), with a new monthly water service cost of $31.15. This is a 20% increase above the No Action or current monthly water service rate of $25.89.
GDU Import Pipeline Alternative The alternative would result in a water service cost increase of $8.25 per month per household (ranked 4th among the alternatives), with a new monthly water service cost of $34.14. This is a 32% increase above the No Action or current monthly water service rate of $25.89.
Missouri River Import to Red River Valley Alternative The alternative would result in a water service cost increase of $8.87 per month per household (ranked 5th among the alternatives), with a new monthly water service cost of $34.76. This is a 34% increase above the No Action or current monthly water service rate of $25.89.
Red River Valley Recreation Impacts Chapter three describes the recreation areas in the Red River Valley of North Dakota that could be affected by the proposed alternatives. The most frequently used of these recreation areas is Lake Ashtabula on the Sheyenne River. Recreation impacts associated with each alternative for Lake Ashtabula appear below. Some impacts could also occur at the other recreation sites discussed previously. However, impacts were not estimated for these areas, because the economic effects of each alternative are likely to be fairly small, primarily due to minor changes in streamflows adjacent to the recreation areas.
Recreation Impacts at Lake Ashtabula Lake Ashtabula volume modeling results were used to estimate potential negative impacts associated with drought conditions and reservoir levels affected by the alternatives. The first step was to estimate recreation visitation that directly depends on lake conditions. Total visitation at Lake
Fishing Is an Important Water Dependent Recreation Activity
4 - 237

Red River Valley Water Supply Project FEIS Chapter Four Environmental Consequences
Ashtabula in 1999 was estimated to be 165,200 visitors. Assuming that the activities listed as swimming, water skiing, boating, fishing, and other activities (table 4.100) would most likely be affected by changes in water levels, an estimated 126,700 visits would potentially be affected by changes in water levels. This is the base from which changes in Lake Ashtabula water conditions are measured.
The average end of month lake volume and water levels are quite variable over any given year. Therefore, minor drought conditions are likely to have minimal impacts. As a result, Lake Ashtabula recreation impacts associated with each action alternative are essentially zero for most years. However, during severe drought years negative recreational impacts are likely. The negative impacts presented in this analysis reflect the average annual impacts during a 1930s-type drought. It should be noted that under no condition would recreation at Lake Ashtabula fall to zero, because some activities (picnicking, camping, sightseeing, and hunting) do not directly depend on good lake conditions. These activities are not included in the affected recreation base.
The Lake Ashtabula modeling results for end of month volume showed an average variation from about 52,000 ac-ft to 66,000 ac-ft. If the end of month volume in the modeling results for each alternative was less than the average end of month variation, then that year was identified as a potential year of negative recreation impacts. Potential impact years were limited to the years 1931 to 1942 for each alternative.
The proportion of shortage during a drought year was used as the basis for estimating reduced recreation during a drought. This is a fairly simplistic model of recreation impacts, since there are many factors that potentially affect recreation. However, the amount of water in a lake would have a significant impact on many lake characteristics that influence the attractiveness of a lake.
Recreation activities generate regional economic impacts through recreation-related spending. These expenditures include items such as gasoline, lodging, and food purchases. In order for these expenditures to have an impact on the Red River Valley area, these must occur within the area. In addition, the extent to which expenditures would affect the regional economy depends on where the recreational visitor comes from. For example, if a visitor comes from outside the region to recreate at Lake Ashtabula, then those expenditures represent an injection of funds into the region; this generates positive regional impacts. However, if the recreational visitor comes from inside the region, for example Fargo, then those expenditures would generate regional economic impacts only to the extent to which those expenditures are above what would have been spent on other activities rather than recreation at Lake Ashtabula.
For this analysis it is assumed that Lake Ashtabula represents an important regional attraction that is not easily substitutable. Therefore, all of the estimated expenditures associated with changes in Lake Ashtabula recreation are assumed to generate regional economic impacts. To estimate the recreational impacts from potential water shortages during drought periods, recreation expenditures were obtained from a survey of fishing, hunting, and wildlife-associated recreation (Service 2003). These expenditures are shown in table 4.100.
4 - 238

Red River Valley Water Supply Project FEIS Chapter Four Environmental Consequences
Table 4.100 – Fishing and Water Related Activity Expenditures (Service 2003.)
Expenditure per Trip Expenditure Category Fishing Other Activities
Food Lodging Gas and Oil Automobile maintenance Tires Privilege and other fees Boating costs Bait Ice Heating and cooking fuel Other
$11.02 $2.56 $6.97 $4.02 $1.77 $0.55 $2.76 $2.53 $0.38 $0.36
-
$9.00 $8.56 $4.48 $2.59 $1.14
- - - - -
$0.99
Using the methods discussed above, changes in Lake Ashtabula recreation visitation compared to average conditions were estimated for each alternative. Changes in visitation were estimated for an average 1930s drought year. Average expenditures for each spending category were then multiplied by the estimated change in visitation.
The regional impacts from changes in recreation expenditures were then analyzed using IMPLAN, as was done for the municipal water shortage impacts using the estimated change in expenditures. The regional impacts of a drought for each alternative compared to an average year are presented in tables 4.101 and 4.102. These expenditures represent reduced regional economic activity as a result of a drought. Table 4.101 shows the results for all alternatives, while table 4.102 shows the results as compared to No Action. The No Action Alternative had the greatest negative regional impacts during a drought year showing a loss of 43,650 visitor days lost as compared to the annual average visitor days of 126,700. Table 4.101 shows the corresponding economic impacts associated with decreases in visitation.
Table 4.101 – Average Drought Year Negative Recreation Based Regional Impacts at Lake Ashtabula, as Compared to Total Visitation in 1999.
Regional Economic Impacts Alternative
Lost Visitation
(days) Compensation Employment (jobs)
Value of Output
No Action -43,650 -$596,800 -40 -$1,902,000
North Dakota In-Basin -14,900 -$203,500 -14 -$648,500
Red River Basin -23,900 -$327,200 -21 -$1,043,000
GDU Import to Sheyenne River -25,700 -$365,000 -24 -$1,163,500
GDU Import Pipeline -26,500 -$361,300 -24 -$1,151,400
Missouri River Import to Red River Valley -28,200 -$385,900 -25 -$1,229,800
Table 4.102 compares the action alternatives to No Action. For example, the North Dakota In-Basin Alternative has the fewest lost visitation days at 14,900 (table 4.101), which is 28,700 (table 4.102) less lost days as compared to No Action with 43,650 (table 4.101). Table 4.102 also ranks the action alternatives based on value of output with the highest dollar value getting a rank of 1. The North Dakota In-Basin Alternative has the highest positive change of $1,253,500, as compared to No Action so it is ranked as 1. Table 4.101 shows that there would be a
4 - 239

Red River Valley Water Supply Project FEIS Chapter Four Environmental Consequences
$1,902,000 annual economic loss under the No Action Alternative. The loss would only be $648,500 under the North Dakota In-Basin Alternation, a positive difference of $1,253,500, as shown in table 4.102.
Table 4.102 – Recreation Based Regional Impacts at Lake Ashtabula Compared to No Action. Regional Economic Impacts
Alternative Change in Visitation
(days) Compensation Employment (jobs)
Value of Output
Rank
North Dakota In-Basin +28,700 $393,300 26 $1,253,500 1
Red River Basin +19,700 $269,600 18 $859,000 2
GDU Import to Sheyenne River +18,000 $231,800 15 $738,500 4
GDU Import Pipeline +17,200 $235,600 15 $750,600 3
Missouri River Import to Red River Valley +15,400 $210,900 14 $672,200 5
Lake Ashtabula is an important water-based recreational area in this region of North Dakota. If reservoir water levels drop during drought, this would reduce visitation. This would force local residents to seek similar recreational experiences further away at higher costs. For those residents still using the lake, it would be more congested due to limited usable reservoir area, which would reduce enjoyment of the facilities.
An additional impact that could occur at Lake Ashtabula under No Action or potentially the in-basin alternatives would be the cost of re-establishing a fishery after a drought event. The North Dakota Game and Fish Department estimated the cost of re-establishing the fishery at nearly $2 million (North Dakota Game and Fish Department memorandum, February 1999). This would be an additional economic cost of a potential water shortage. The other recreation areas (Lonetree Wildlife Management Area, Fort Ransom State Park, H.R. Morgan State Nature Preserve, Sheyenne National Grasslands, and Red River State Recreation area) could also experience impacts from the alternatives. However, many of the activities in these areas are not directly impacted by river flows. In addition, these other areas are much more likely to be visited by local residents, which would have limited regional economic impacts. These impacts are most likely to be small compared to the impacts at Lake Ashtabula.
No Action Alternative The average drought year loss in Red River Basin recreation would equal 43,650 visits, leading to a loss in regional output of $1.9 million.
North Dakota In-Basin Alternative The average annual drought year loss in recreation visitation would be 14,900 visitor days, which is 28,700 less than the 43,650 estimated for No Action. The alternative would result in annual regional economic losses due to drought of $648,500, which is $1,253,500 less than the No Action economic loss of $1,902,000. While all of the alternatives would lose visitation during a drought, this alternative is the best at limiting those losses, ranking 1st as compared to the other action alternatives.
Red River Basin Alternative The average annual drought year loss in recreation visitation would be 23,900, which would be 19,700 less than the No Action visitation losses of 43,650. The alternative would result in annual regional economic losses due to drought of $1,043,000, which
4 - 240

Red River Valley Water Supply Project FEIS Chapter Four Environmental Consequences
is $859,000 less than the No Action economic loss of $1,902,000. The alternative has a rank of 2nd, as compared to the other action alternatives.
GDU Import to Sheyenne River Alternative The average annual drought year loss in recreation visitation would be 25,700, which would be 18,000 less than for No Action visitation losses of 43,650. The alternative would result in annual regional economic losses due to drought of $1,163,500, which is $738,500 less than the No Action economic loss of $1,902,000. The alternative has a rank of 4th, as compared to the other action alternatives.
GDU Import Pipeline Alternative The average annual drought year loss in recreation visitation in would be 26,500 which would be 17,200 less than the No Action visitation losses of 43,650. The alternative would result in annual regional economic losses due to drought of $1,151,400, which is $750,600 less than the No Action economic loss of $1,902,000. The alternative has a rank of 3rd, as compared to the other action alternatives.
Missouri River Import to Red River Valley Alternative The average annual drought year loss in recreation visitation in would be 28,200, which would be 15,400 less than the No Action visitation losses of 43,650. The alternative would result in annual regional economic losses due to drought of $1,229,899, which is $672,200 less than the No Action economic loss of $1,902,000. The alternative has a rank of 5th, as compared to the other action alternatives.
Economic Impacts From unrealized Irrigation Development in the Red River Valley Some comments on the DEIS raised the concern that development of unallocated groundwater for Project purposes would forgo the use of that water for other purposes, including irrigation. This concern was specifically raised about the development of southeastern North Dakota groundwater sources for industrial use in some of the Project alternatives. This lost opportunity to expand irrigation could create a negative economic impact that the comments suggested should be quantified and considered in the SDEIS.
A similar concern was raised about potential impacts to Minnesota groundwater. The USGS report Projected Groundwater Use in the Becker, Clay, Douglas, Grant, Otter Tail and Wilkin Counties, Minnesota, to 2030 and 2050 (2006) projected a significant increase in irrigation development in the Pelican River Sand-Plain Aquifer that could compete with the Project’s plans to use this same water source for the Red River Basin Alternative. However, the increased irrigation developed cited in the report was projected and did not include any actual planned expansion of irrigation.
Because in both North Dakota and Minnesota, there is little to no planning for expansion of irrigation, so it is difficult to show that the concerns expressed in comments would reasonably occur. Therefore, no economic impacts from unrealized irrigation development are reasonably foreseeable for the North Dakota southeastern groundwater and Minnesota Pelican River Sand-Plain Aquifer water sources.
Missouri River System Impacts on Hydropower, Navigation, and Recreation Missouri River system impacts are based on the results of the Corps (2007) modeling analysis summarized in Appendix C. The economic or social impacts on the Missouri River system evaluated in the Corps report included hydropower production, navigation benefits and
4 - 241

Red River Valley Water Supply Project FEIS Chapter Four Environmental Consequences
recreation. Hydropower production is separated into two categories. One category included benefits and marketing revenues, and the second category included thermal capacity and energy impacts.
Impacts to Missouri River Hydropower Benefits and Revenues The Corps report (2007) evaluated two types of hydropower impacts, which provided economic impact results in dollars. This includes impacts on benefits and marketing revenues. The Corps report also evaluated thermal capacity and energy hydropower impacts discussed later. Hydroelectric power on the Missouri River plays an important role in meeting the electricity demands of the upper Midwest in the U.S. The six mainstem dams on the Missouri River support 36 hydropower units with a combined plant capacity of 2,501 megawatts of potential power generation. Hydropower benefits are computed for the capacity provided and the energy generated by the hydropower units at the six Missouri River dams. The benefits represent cost savings from generating electricity at the dams verses building additional generating facilities in the basin. These additional facilities would be a mix of base load and peaking power plants, and the cost for the power from them would be more costly than the hydropower.
Hydropower impacts were estimated using the Daily Routing Model, a hydrologic model, and the hydropower analysis estimates developed by the Corps (2004a). The Daily Routing Model (Corps 2005b) estimated lake surface elevation and river flow at 23 reaches using the current Missouri River Master Manual operation strategies and the historic runoff levels between 1898 and 2002 (Reclamation 2005b). Next, the Project alternatives were modeled adding the corresponding depletions to base runs (2002 current conditions and 2050 conditions) to examine hydrologic and, ultimately, economic use and environmental resource differences. These results were originally documented in the Corps Red River Valley Water Supply Project Analysis of Missouri River Effects report (2006), which was updated to include sedimentation (Corps 2007).
It is important to recognize that the estimated hydropower benefits and revenues are for comparison purposes only and may not represent actual economic returns under the different alternatives. All of the models developed by the Corps were designed expressly to compare the effects of alternatives, not to forecast the future. The results of the Corps (2007) analysis showed very small differences in hydropower resources when alternatives were compared with the No Action Alternative. These results are summarized in Appendix C, tables C.19 and C.20.
The results of the hydropower analysis are summarized in tables 4.103 and 4.104 for the three import alternatives. The hydropower benefits and revenues presented in tables 4.101 and 4.102 represent changes compared to No Action for the simulation periods 1930-1941 and 1930-2002, as shown in the analysis of Missouri River effects report (Corps 2007).
Hydropower benefits represent the net effect of changes in power generation to the nation as a whole, while hydropower revenues represent a change in receipts for sale of hydropower and are a measure of regional impact. The values shown in the table represent the change from No Action. For example, in table 4.103 for the 1930-1941 modeling period the GDU Import to Sheyenne River has hydropower benefits $2.0 million lower than No Action, where No Action has a value of $557.0 million and the alternative has a value of $555.0 million, a difference of $2.0 million (table C.17, Appendix C).
4 - 242

Red River Valley Water Supply Project FEIS Chapter Four Environmental Consequences
Table 4.103 – Impacts on Hydropower Benefits Compared to No Action.
Alternative Hydropower
Benefits (1930 – 1941)
Hydropower Benefits
(1930 – 2002) Rank
North Dakota In-Basin $0 $0 1 Red River Basin $0 $0 1 GDU Import to Sheyenne River -$2.0 million -$1.4 million 5 GDU Import Pipeline -$1.5 million -$1.0 million 4 Missouri River Import to Red River Valley -$1.4 million -$1.0 million 3
Table 4.104 – Impacts on Hydropower Revenues Compared to No Action.
Alternative Hydropower
Revenues (1930 – 1941)
Hydropower Revenues
(1930 – 2002) Rank
North Dakota In-Basin $0 $0 1 Red River Basin $0 $0 1 GDU Import to Sheyenne River -$1.8 million -$2.4 million 5 GDU Import Pipeline -$1.4 million -$1.9 million 4 Missouri River Import to Red River Valley -$1.0 million -$1.2 million 3
Each table ranks the alternatives based on modeling results for the period of 1930-1941 and 1930-2002. The best rank of 1st has the smallest decrease in benefits/revenues as compared to No Action. Hydropower benefits (table 4.103) and revenues (table 4.104) decrease from $1.0 to $2.4 million for all alternatives and modeling periods when compared to No Action.
No Action Alternative The No Action Alternative has a $0.7 million decrease in annual hydropower benefits in the modeling period of 1930-1941 and $0.6 million decrease in annual hydropower benefits for 1930-2002, as compared to the current condition (Corps 2007). This represents no net change for the two modeling periods. The No Action Alternative resulted in a $10.89 million decrease in annual hydropower revenues in the modeling period of 1930-1941 and $2.24 million decrease in annual hydropower revenues for 1930-2002, as compared to the current condition (Corps 2007). This represents a net negative change of 16% and 3%, respectively, for the two modeling periods.
North Dakota In-Basin Alternative There would be no negative hydropower impacts under this alternative, so it has a rank of 1st among the alternatives.
Red River Basin Alternative There would be no negative hydropower impacts under this alternative, so it has a rank of 1st among the alternatives.
GDU Import to Sheyenne River Alternative The change in hydropower benefits would be less than 1% for both modeling periods of 1930-1941 and 1930-2002, as compared to No Action. Hydropower revenues would decrease by 2% for the modeling period of 1930-1941 and decrease 3% for the period of 1930-2002, as compared to No Action. The alternative is ranked 5th among the alternatives.
GDU Import Pipeline Alternative The change in hydropower benefits would be less than 1% for both modeling periods of 1930-1941 and 1930-2002, as compared to No Action. Hydropower
4 - 243

Red River Valley Water Supply Project FEIS Chapter Four Environmental Consequences
revenues would decrease by 2% for the modeling period of 1930-1941 and decrease 2% for the period of 1930-2002 as compared to No Action. The alternative is ranked 4th among the alternatives.
Missouri River Import to Red River Valley Alternative The change in hydropower benefits would be less than 1% for both modeling periods of 1930-1941 and 1930-2002 as compared to No Action. Hydropower revenues would decrease by 1% for the modeling period of 1930-1941 and decrease 1% for the period of 1930-2002 as compared to No Action. The alternative is ranked 3rd among the alternatives.
Impacts to Missouri River Hydropower Thermal Capacity and Energy The Corps (2007) report evaluated hydropower thermal capacity and energy impacts for the current (2002), No Action, and three Missouri River import alternatives. Only the period of 1930-1941 was evaluated in the Corps report (2007). These impacts were not quantified economically as a cost but rather as an impact to power generating capacity in megawatts and energy production in gigawatt-hours. The Corps analysis is summarized in tables C.17 and C.19 in Appendix C.
No Action Alternative The results of the Corps (2007) analysis shows a change in hydropower capacity at risk from current conditions (2002) compared to No Action. The total mainstem capacity at risk increases from 363 megawatts to 478 megawatts, a change of 31% for the drought period of 1930-1941. The hydropower energy at risk increases 156 gigawatt-hours from a current estimate of 148 gigawatt-hours to the No Action estimate of 304 gigawatt-hours or a change of 105% for the period of drought.
North Dakota In-Basin Alternative There would be no Missouri River hydropower thermal capacity and energy impacts under this alternative.
Red River Basin Alternative There would be no Missouri River hydropower thermal capacity and energy impacts under this alternative.
GDU Import to Sheyenne River Alternative The hydropower capacity at risk increases from 478 megawatts to 485 megawatts, or a change of 2%. The hydropower energy at risk increases from 304 gigawatt-hours to 309 gigawatt-hours, or a change of 2%.
GDU Import Pipeline Alternative The hydropower capacity at risk increases from 478 megawatts to 483 megawatts, or a change of 1%. The hydropower energy at risk improves from 304 gigawatt-hours to 308 gigawatt-hours, or a positive change of 2%.
Missouri River Import to Red River Valley Alternative The hydropower capacity at risk increases from 478 megawatts to 484 megawatts, or a change of 1%. The hydropower energy at risk improves from 304 gigawatt-hours to 306 gigawatt-hours, or a change of 1%.
Impacts to Missouri River Navigation The results of the Corps (2007) analysis showed very small differences in navigation benefits when comparing No Action, and three Missouri River import alternatives as shown in table 4.105. The alternatives were not ranked, because these are basically equal when considering impacts to navigation.
4 - 244

Red River Valley Water Supply Project FEIS Chapter Four Environmental Consequences
Table 4.105 – Impacts on Navigation Benefits Compared to No Action.
Alternative Navigation
Benefits (1930 - 1941)
Navigation Benefits
(1930 - 2002)
GDU Import to Sheyenne River -$0.02 million -$0.01 million
GDU Import Pipeline -$0.01 million $0.00 million
Missouri River Import to Red River Valley -$0.01 million -$0.01 million
Missouri River navigation benefits represent the cost savings provided by navigation on the Missouri River from Sioux City, Iowa to the mouth versus movement of those commodities by the next least costly mode of transportation. Generally, this least costly transportation is rail or truck transport to St. Louis where Mississippi River navigation is used to transport the commodity to the ultimate destination for downstream movements and vice versa for upstream movements.
The navigation impacts were estimated using the Daily Routing Model, a hydrologic model, and the navigation benefits analysis estimates developed by the Corps (2004a). The Daily Routing Model (Corps 2005b) estimated lake surface elevation and river flow at 23 reaches using the current Missouri River Master Manual operation strategies and the historic runoff levels between 1898 and 2002 (Reclamation 2005b). Next, the alternatives were modeled adding the corresponding depletions to base runs (2002 conditions and 2050 conditions) to examine hydrologic and, ultimately economic use and environmental resource differences.
It is important to recognize that the estimated navigation benefits are used for comparative purposes only and may not represent actual economic returns under the different alternatives. All of the models developed by the Corps were designed expressly for comparing the effects of alternatives, not to forecast the future.
The Corps (2007) report also estimated the impacts on Missouri River system navigation season lengths during the modeling period of 1930-1941. The net effect of the additional depletions due to the three Missouri River import alternatives is 3 to 5 days of lost navigation over the 12-year period, with 2 to 3 of these days occurring in 1939.
No Action Alternative The results of the Corps (2007) navigation resources analysis are mixed when current conditions (2002) are compared to No Action (2050 Missouri River depletion conditions). There is a $0.05 million increase in navigation benefits from the current (2002) to No Action (2050) condition for the modeling period 1930-1941, while there is a decrease of $1.69 million for the modeling period 1930-2002.
North Dakota In-Basin Alternative There would be no impacts to navigation, because this alternative would not withdraw water from the Missouri River.
Red River Basin Alternative There would be no impacts to navigation, because this alternative would not withdraw water from the Missouri River.
4 - 245

Red River Valley Water Supply Project FEIS Chapter Four Environmental Consequences
GDU Import to Sheyenne River Alternative There is a decrease of $0.02 million in navigation benefits, compared to No Action in the 1930-1941 modeling period, and a $0.01 million decrease in the 1930-2002 modeling period or a 0 to 1% decrease for both modeling periods. Therefore, the impacts to navigation would be minor for this alternative.
GDU Import Pipeline Alternative There is a decrease of $0.01 million or 1% in navigation benefits, compared to No Action in the 1930-1941 modeling period. There is no change in navigation benefits in the 1930-2002 modeling period Therefore, the impacts to navigation would be minor for this alternative.
Missouri River Import to Red River Valley Alternative There is a decrease in navigation benefits of $0.01 million or 0 to 1% when compared to No Action in both modeling periods of 1930-1941 and 1930-2002. Therefore, the impacts to navigation would be minor for this alternative.
Impacts to Missouri River Recreation The effects of the alternatives on Missouri River recreation were evaluated based on the economic benefits, measured in millions of dollars. The economic benefits were estimated using the Daily Routing Model, a hydrologic model, and the Economic Impacts Model (Corps 2004a). The Daily Routing Model (Corps 2005b) estimated lake surface elevation and river flow at 23 reaches using the current Master Manual operation strategies and the historic runoff levels between 1898 and 2002. Next, the alternatives were modeled adding the corresponding depletions for No Action and the three Missouri River import alternatives to examine hydrologic and, ultimately economic use and environmental resource differences. These results were documented in the Corps (2007) report.
The Economic Impact Model uses the output from the Daily Routing Model and economic value functions for recreation benefits from Corps (2004a) to estimate the economic benefit. The economic value functions for recreation benefits are computed by identifying changes in potential visitation, multiplying this visitation times composite values per visitation (one or more activities are usually associated with a visit), and subtracting any capital costs that may be incurred for facilities in each reach. Visitation computations are based on visitation surveys completed in the early 1990s (to determine changes in visitation based on lake-level and river-flow changes) and measured visitation in 1993. Capital costs are those that are incurred when facilities reach the end of their useful life and require replacement. Also included with the capital costs are the costs for boat ramp repairs and extensions required when lake levels drop. Finally, the resulting benefits were inflated by 12% to account for changes in visitation and costs since the early 1990s when the methodology was developed.
Recreation benefits presented in the Corps (2004a) Missouri River Basin Mainstem Reservoir System Master Water Control Manual Review and Update, Final Environmental Impact Statement are National Economic Development benefits that reflect users’ willingness to pay and include only entry and use fees. Consequently, the resulting values are somewhat less than if the values were Regional Economic Development benefits, which include the National Economic Development benefits plus other expenditures that are associated with recreation activities, such as boat and equipment purchases, motel expenses, restaurant costs, etc. It is important to recognize that the estimated economic benefits are used for comparative purposes only and may not represent actual economic returns under the Project alternatives. All of the models
4 - 246

Red River Valley Water Supply Project FEIS Chapter Four Environmental Consequences
developed by the Corps were designed expressly for comparing the effects of alternatives, not to forecast the future.
The results of the Corps (2007) analysis showed relatively small differences in recreational resources when alternatives were compared to No Action and the three Missouri River import alternatives. Table 4.106 shows the results for recreation benefits.
Table 4.106 – Annual Recreation Impacts Compared to No Action.
Alternative Recreation Benefits (1930 - 1941)
Recreation Benefits (1930 - 2002)
GDU Import to Sheyenne River -$0.7 million -$0.2 million GDU Import Pipeline -$0.5 million -$0.1 million Missouri River Import to Red River Valley -$1.8 million -$0.3 million
No Action Alternative The results of the Corps (2007) analysis shows an increase in recreation benefits when current conditions (2002) are compared to No Action. Changes in operation of the Missouri River System under their current Master Manual for 2002 conditions result in an increase of 1 to 5% increase in recreation benefits under No Action (2050) depletions.
North Dakota In-Basin Alternative There would be no Missouri River recreation impacts under this alternative.
Red River Basin Alternative There would be no Missouri River recreation impacts under this alternative.
GDU Import to Sheyenne River Alternative The percent decrease in recreation benefits compared to No Action in 2050 with the Project depletion proposed for this alternative is estimated to be between 0% and 1% or $0.2 to $0.7 million. Therefore, the impacts to recreation would be minor for this alternative.
GDU Import Pipeline Alternative The percent decrease in recreation benefits compared to No Action in 2050 with the Project depletion proposed for this alternative is estimated to be between 0% and 1% or $0.1 to $0.5 million. Therefore, the impacts to recreation would be minor for this alternative.
Missouri River Import to Red River Valley Alternative The percent decrease in recreation benefits in 2050 compared to No Action with the Project depletion proposed for this alternative is estimated to be from 0% to 2% or $0.3 to $1.8 million. Therefore, the impacts to recreation would be minor for this alternative.
Other Missouri River Impacts Other potential Missouri River impacts were evaluated in the Corps Missouri River effects study (2007) along with Mississippi River navigation and recreation. The other Missouri River impacts evaluated in the analysis that have a direct economic component include flood control and water supply which are discussed in the water quantity impacts section. The impacts of each alternative compared to No Action were negligible for Mississippi River navigation, flood control, and water supply (Corps 2007).
4 - 247
Red River Valley Water Supply Project FEIS Chapter Four Environmental Consequences
Cumulative Effects There are no cumulative effects associated with economic and social impacts for any of the alternatives considered in the FEIS.
Summary A number of economic and social issues were identified in the FEIS. This included Red River Valley economic impacts associated with water shortages, Project and non-Project expenditures, Project repayment, and recreation. The Missouri River system impacts include hydropower benefits/revenues, hydropower thermal capacity/energy, navigation and recreation.
The most noticeable economic impact result was in the water shortage analysis where the No Action Alternative showed a worst year negative economic impact of $3.6 billion and a 10-year impact of $20.4 billion during a 1930s-type drought. This is in contrast to the action alternatives which would have no negative impacts due to a water shortage, because these are designed to meet this water shortage. The No Action Alternative also has a negative impact on recreation in the Red River Valley associated with the loss of visitor days at Lake Ashtabula. None of the action alternatives would have significant negative impacts.
All of the action alternatives had positive economic impacts related to Project and non-Project expenditures. The actual benefits would depend on how the Project is funded. The more the Project is funded by sources outside the region, the greater the economic benefits. The Missouri River system economic impact analysis showed minor positive or negative impacts for all of the alternatives.
Environmental Mitigation Since there would be no negative economic and social impact results based on these analyses, there are no environmental commitments associated with economic and social issues.
4 - 248

Red River Valley Water Supply Project FEIS Chapter Four Environmental Consequences
Environmental Justice
Introduction
What would the effect of the Project be on environmental justice issues?
This section of the FEIS addresses the effect of the Project on environmental justice issues. If the impacts of an action disproportionately affect a specific group, then there may be an environmental justice issue. This section evaluates Project repayment costs to determine whether these would create environmental justice issues.
Methods The results of Project financial analysis (Appendix K.1), analysis of current regional water service rates, and per capita income were used in the analysis. Water service cost guidelines provided by the EPA were a basis of comparison to identify potential impacts.
Results
Potential Impacts Associated with Implementation of Alternatives The impacts of an action are disproportionately distributed if the percentage of total impacts imposed on a specific group is greater than the percentage of the total population represented by that group. For example, if 10% of the total negative impacts are imposed on a defined population that constitutes 1% of the impact area population, then that would be considered to be a disproportionate impact.
As discussed in chapter three, a group is defined by race, ethnicity, income, or some other grouping. Based on the 2000 Census data there was a small difference in the percentage of county population by race and ethnic origin within the study area (U.S. Census Bureau 2000). In 2000 there was a somewhat higher Hispanic population in Walsh County in North Dakota and Polk County in Minnesota.
Although potential shortage impacts are impossible to pinpoint, it is most likely that these impacts would occur in the major urban centers. The major urban areas were not identified as areas with potential environmental justice concerns. Construction impacts are likely to occur over an area much larger than the shortage impacts. Therefore, construction related impacts cannot be pinpointed to specific areas, except they are likely to occur in counties with a large commercial/industrial base. The larger commercial/industrial areas were not identified as areas with potential environmental justice concerns.
Potential Impacts Related to Repayment of Project Costs Appendix K.1 describes the financial analysis of the five action alternatives. The analysis estimates per household and per 1,000 gallon monthly costs to Project recipients as well as federal costs, if an alternative would be constructed. The results of this analysis were discussed previously in this chapter.
4 - 249

Red River Valley Water Supply Project FEIS Chapter Four Environmental Consequences
There may be potential environmental justice impacts associated with the repayment of Project costs. Table 4.107 shows the current annual water service rate, Project repayment rates, and total future annual water service rates for each alternative. The annual current water rate is based on the service area wide composite monthly per household rate of $25.89 ($310.68 annual per household rate). A financial analysis of repayment rates associated with each Project alternative was completed by Reclamation. The repayment rates were presented as amounts per month. Income data presented previously in chapter three showed that median household income was much lower than the study area average in Barnes, Cavalier, Griggs, and Nelson Counties in North Dakota and Norman and Traverse Counties in Minnesota. The estimated annual repayment rates associated with Project costs, current water costs, and median household income data can be used to evaluate the potential financial burden of each alternative.
Table 4.107 – Annual Household Repayment Rates in the Service Area.Total Future
Water Service Rate
Current Water Service Rate
Project Repayment Rate Alternative
Representative water bill data for municipalities in the Red River Valley area were obtained from 2006 North Central Utility Rate Surveys (Advanced Engineering and Environmental Services, Inc. 2006). Representative rates were based on household water use of 7,500 gallons per month. The estimated Project cost per gallon for each alternative was used to estimate a monthly water cost per month assuming use of 7,500 gallons. The Project cost divided by current representative water bills were calculated to estimate the increase in a typical water bill that would be expected for each alternative. Table 4.108 presents the percentage increase in water costs.
One measure that can be used to evaluate municipal water supply affordability is the cost of water per household compared to median household income. This measure of affordability shows the percentage of income that would no longer be available to people as disposable income after project costs are repaid. The EPA uses 2.5% of household income as a threshold of affordability when determining the burden created by regulations under consideration for implementation (EPA 1998; Federal Register 2006). The costs associated with each alternative by municipality are presented in table 4.109.
The percentage of water supply costs in Northwood (shaded) exceeds the EPA threshold for each alternative (see table 4.109). However, the threshold for affordability is not exceeded for any other municipality for any alternative. The GDU Import Pipeline and Missouri River Import to Red River Valley alternatives are very close to the threshold for Mayville, Larimore, and Thompson, North Dakota.
Dollars Per Year Dollars Per Year Dollars Per Year NA NA No Action $310.68
$63.90 $374.58 North Dakota In-Basin $310.68 $310.68 $62.50 Red River Basin $373.18
GDU Import to Sheyenne River $310.68 $68.87 $379.55 GDU Import Pipeline $310.68 $98.98 $409.66 Missouri River Import to Red River Valley $310.68 $106.45 $417.13
4 - 250

Red River Valley Water Supply Project FEIS Chapter Four Environmental Consequences
Table 4.108 – Repayment Costs of each Alternative as a Percentage of a Typical Water Bill.
City County Typical Bill in $
(7500 gal)
North Dakota
In-Basin (%)
Red River Basin
(%)
GDU Import to Sheyenne
River (%)
GDU Import
Pipeline (%)
Missouri River
Import to RRV (%)
Cavalier Pembina 36.40 18.30 17.88 19.73 28.32 31.26 East Grand Forks Polk MN 42.63 15.62 15.27 16.84 24.18 26.70 Fargo Cass 29.25 22.77 22.26 24.55 35.25 38.91 Grafton Walsh 27.50 24.22 23.67 26.11 37.49 41.38 Grand Forks
G. Forks 25.58 26.04 25.45 28.07 40.31 44.49
Hankinson Richland 24.00 27.75 27.13 29.92 42.96 47.42 Hillsboro Traill 20.92 31.84 31.12 34.32 49.28 54.40 Langdon Cavalier 40.38 16.49 16.12 17.78 25.53 28.18 Larimore G. Forks 58.75 11.34 11.08 12.22 17.55 19.37 Lisbon Ransom 27.58 24.15 23.60 26.03 37.38 41.26 Mayville Traill 63.58 10.47 10.24 11.29 16.22 17.90 Moorhead Clay MN 29.96 22.23 21.73 23.96 34.41 37.98 Northwood G. Forks 76.75 8.68 8.48 9.35 13.43 14.83 Park River Walsh 51.03 13.05 12.76 14.07 20.20 22.30 Thompson G. Forks 59.75 11.15 10.90 12.02 17.26 19.05 Valley City Barnes 28.47 23.39 22.87 25.22 36.21 39.97 Wahpeton Richland 27.28 24.41 23.86 26.32 37.79 41.72 Walhalla Pembina 53.25 12.51 12.23 13.48 19.36 21.37 West Fargo Cass 26.25 25.37 24.80 27.35 39.28 43.35
Table 4.109 – Typical Monthly Residential Water Bills as a Percentage of Median Household Income.
City County No Action
(%)
North Dakota
In-Basin (%)
Red River Basin
(%)
GDU Import to Sheyenne
River (%)
GDU Import
Pipeline (%)
Missouri River
Import to RRV (%)
Cavalier Pembina 1.20 1.42 1.41 1.44 1.54 1.57 East Grand Forks
Polk MN 1.46 1.62 1.62 1.64 1.74 1.78
Fargo Cass 0.92 1.18 1.18 1.20 1.30 1.34 Grafton Walsh 0.98 1.13 1.12 1.14 1.25 1.28 Grand Forks
G. Forks 0.86 1.06 1.06 1.08 1.18 1.22
Hankinson Richland 0.80 1.01 1.01 1.03 1.13 1.17 Hillsboro Traill 0.67 0.91 0.90 0.93 1.03 1.06 Langdon Cavalier 1.52 1.55 1.54 1.57 1.67 1.71 Larimore G. Forks 1.97 2.16 2.15 2.17 2.28 2.31 Lisbon Ransom 0.88 1.13 1.12 1.15 1.25 1.28 Mayville Traill 2.04 2.31 2.31 2.33 2.43 2.47 Moorhead Clay MN 0.95 1.21 1.20 1.22 1.33 1.36 Northwood G. Forks 2.57 2.75 2.74 2.77 2.87 2.90 Park River Walsh 1.81 1.90 1.90 1.92 2.02 2.06 Thompson G. Forks 2.00 2.19 2.18 2.20 2.31 2.34 Valley City Barnes 1.10 1.16 1.15 1.17 1.28 1.31 Wahpeton Richland 0.91 1.12 1.11 1.14 1.24 1.27 Walhalla Pembina 1.75 1.97 1.97 1.99 2.09 2.13 West Fargo Cass 0.83 1.08 1.08 1.10 1.20 1.24
4 - 251

Red River Valley Water Supply Project FEIS Chapter Four Environmental Consequences
When looking at the results presented in tables 4.108, it should be recognized that the average annual impact as a percentage of total income is fairly small. Some potential issues related to low income could occur in a few municipalities. In addition, the overall income data indicate that there could be repayment burden issues in Griggs and Nelson Counties, but these impacts in terms of percentage of income appear to be very small. It should also be noted that this comparison assumes repayment is imposed equally among all users. If repayment were not equal among all users, the distribution of repayment impacts could be very different. However, it appears there would be minor environmental justice impacts associated with repayment of Project costs.
Results No Action Alternative The current average annual water service cost is $310.68 per household in the Red River Valley.
North Dakota In-Basin Alternative None of the communities evaluated in table 4.109 showed an increase in annual water service costs that exceeded 2.5%. Therefore, this alternative would not create any environmental justice concerns.
Red River Basin Alternative None of the communities evaluated in table 4.109 showed an increase in annual water service costs that exceeded 2.5%. Therefore, this alternative would not create any environmental justice concerns.
GDU Import to Sheyenne River Alternative None of the communities evaluated in table 4.109 showed an increase in annual water service costs that exceeded 2.5%. Therefore, this alternative would not create any environmental justice concerns.
GDU Import Pipeline Alternative None of the communities evaluated in table 4.109 showed an increase in annual water service costs that exceeded 2.5%. Therefore, this alternative would not create any environmental justice concerns.
Missouri River Import to Red River Valley Alternative Only Northwood at 2.9% (table 4.109) showed an increase in annual water service costs that exceeded 2.5%. Since only one of the 19 communities exceeded the limit of 2.5%, this alternative would not create any environmental justice concerns.
Potential Impacts to Funding of North Dakota MR&I Water Supply Projects Outside the Red River Valley There are other areas in need of MR&I water supply improvements outside of the Red River Valley area. Some of these areas include Indian Reservations and low income rural populations. It is unknown what level of future funding at the state and federal level would be available for MR&I water supply projects. Future legislation and funding cannot be controlled or predicted at this time.
Potential Impacts Related to Future Development outside of the Red River Valley and Impacts on Missouri River Basin Households Alternatives that transfer water from one area to another could have a potential impact on future growth opportunities in the area from which the water is being transferred. It is not known what
4 - 252

Red River Valley Water Supply Project FEIS Chapter Four Environmental Consequences
future commercial development and population growth could occur in lower income rural areas of North Dakota and if transferring water would have any impact on these areas. However, what is known is that the population of rural North Dakota counties has consistently decreased over the past few decades and commercial activity has generally declined as well. Therefore, environmental justice issues related to lost development opportunities in lower income counties would appear to be very limited.
The Corps of Engineers modeling (Corps 2006) has shown very limited impacts on Missouri River Basin resources and households. Identifying the exact location of any possible impacts in terms of an affected minority or low income population would be very difficult due to the diffuse impacts any Red River Valley Project alternative would have on the Missouri River Basin. The combination of limited and diffuse impacts does not indicate the potential for environmental justice issues in the Missouri River Basin.
Cumulative Effects There are no cumulative effects associated with environmental justice issues for any of the alternatives considered in the FEIS.
Summary If the Project is constructed the residents of the Red River Valley would have increased water service rates to repay the costs of the Project. This increase in cost could be an environmental justice issue if it would disproportionately impact select groups of valley residents. The analysis of water service rate increases shows that no low income or minority groups would be adversely affected by the Project.
Environmental Mitigation Since there are no environmental justice issues of concern, there are no environmental commitments associated with environmental justice.
4 - 253

Red River Valley Water Supply Project FEIS Chapter Four Environmental Consequences
4 - 254

Red River Valley Water Supply Project FEIS Chapter Five Consultation and Coordination
Chapter Five Consultation and Coordination This chapter describes public involvement activities, agency consultation and coordination, and acknowledges the people who have been involved with this NEPA process.
DEIS Public Hearing in Bismarck, North Dakota Public Involvement Program
In 2002 Reclamation and North Dakota began a public involvement program to provide the public, organizations, and government agencies a variety of methods to learn about and participate in the Project. For this NEPA process the program included a scoping notice, public scoping meetings, a website, newsletters, public hearings, and a comment period on the DEIS.
Scoping Notice A scoping notice was prepared to provide the public with information on the Project and an opportunity for people to express their thoughts and comments. The notice announced the intent to prepare an EIS and was published in the October 8, 2002, Federal Register Volume 67, Number 195:62813. Maps showing locations of the Project area and alternative features were made available for inspection. Dates and locations of public scoping meetings were identified in advance. Materials for the scoping notice were mailed on October 18, 2002, to approximately 1,000 individuals, agencies, and organizations. The scoping notice was used to solicit initial comments on the Project.
Public Scoping Meetings The intent of the public scoping meetings was to inform people about the Project and to collectively identify key issues. The Federal Register notice and news releases to local media announced a series of public meetings. The locations and dates for these meetings were:
• Fargo, North Dakota October 28, 2002 • Valley City, North Dakota October 29, 2002
5 - 1

Red River Valley Water Supply Project FEIS Chapter Five Consultation and Coordination
• Grand Forks, North Dakota October 30, 2002 • Pembina, North Dakota November 6, 2002 • Wahpeton, North Dakota November 7, 2002 • Bismarck, North Dakota November 8, 2002
Reclamation and North Dakota determined that a second set of scoping meetings was needed to inform interested people about substantive changes in the range of alternatives under consideration. Additional scoping meetings were conducted at the following locations and corresponding dates:
• Grand Forks, North Dakota June 23, 2003 • Breckenridge, Minnesota June 24, 2003 • Fargo, North Dakota June 25, 2003 • Valley City, North Dakota June 26, 2003
A total of 32 written comments were received in response to the initial public scoping effort. Several additional public comments were received during the remainder of the DEIS process. All comments have been reviewed and compiled in two summary documents, Summary of Public Scoping and Summary of June 2003 Public Meetings, which are included as supporting documents. These documents capture the disposition of the comments and responses to those comments.
Public Hearings In December 2005, Reclamation and North Dakota released the DEIS for public review and comment. A notice of availability for the DEIS was published on December 30, 2005, in the Federal Register Volume 70, Number 250:77425-77427. The public review period of the DEIS began with the publication of this notice. The public was encouraged to provide written comment or participate in the public hearings hosted by Reclamation and North Dakota throughout North Dakota and eastern Minnesota. Public hearings on the DEIS were held at the following locations and corresponding dates:
• Bismarck, North Dakota February 2, 2006 • Grand Forks, North Dakota February 7, 2006 • Warroad, Minnesota February 8, 2006 • Valley City, North Dakota February 9, 2006 • Fargo, North Dakota February 15, 2006 • Perham, Minnesota February 16, 2006 • Red Lake, Minnesota March 6, 2006 • Fort Yates, North Dakota March 9, 2006 • New Town, North Dakota March 20, 2006
The DEIS formal comment period remained open during preparation of the SDEIS. Extension of the comment period on the DEIS through March 30, 2006, was printed in the Federal Register 71 FR 34, 8873–8874 and an extension through April 14, 2006 was published in 71 FR 68, 18116. The announcement that the formal comment period on the DEIS would remain open while the SDEIS was being prepared and notice of intent to prepare the SDEIS was announced in a Federal Register notice published on July 21, 2006, (71 FR 140, 41468-41469). Reclamation
5 - 2
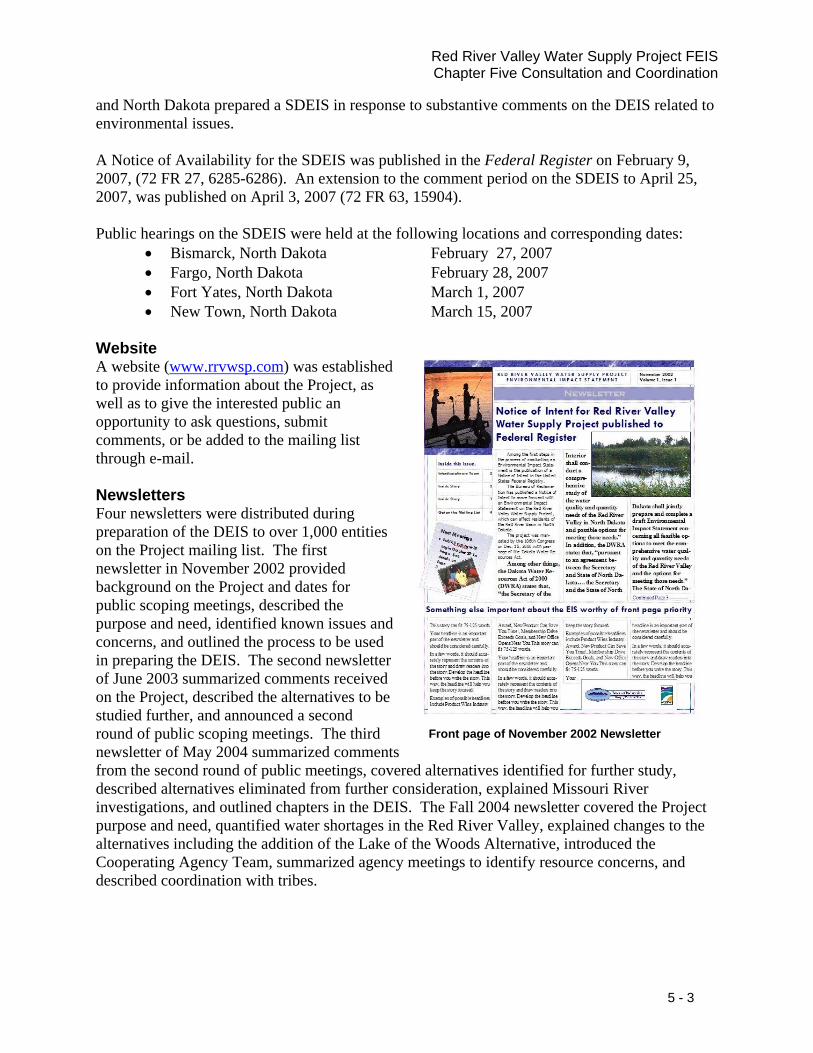
Red River Valley Water Supply Project FEIS Chapter Five Consultation and Coordination
and North Dakota prepared a SDEIS in response to substantive comments on the DEIS related to environmental issues.
A Notice of Availability for the SDEIS was published in the Federal Register on February 9, 2007, (72 FR 27, 6285-6286). An extension to the comment period on the SDEIS to April 25, 2007, was published on April 3, 2007 (72 FR 63, 15904).
Public hearings on the SDEIS were held at the following locations and corresponding dates: • Bismarck, North Dakota February 27, 2007 • Fargo, North Dakota February 28, 2007 • Fort Yates, North Dakota March 1, 2007 • New Town, North Dakota March 15, 2007
Website A website (www.rrvwsp.com) was established to provide information about the Project, as well as to give the interested public an opportunity to ask questions, submit comments, or be added to the mailing list through e-mail.
Newsletters Four newsletters were distributed during preparation of the DEIS to over 1,000 entities on the Project mailing list. The first newsletter in November 2002 provided background on the Project and dates for public scoping meetings, described the purpose and need, identified known issues and concerns, and outlined the process to be used in preparing the DEIS. The second newsletter of June 2003 summarized comments received on the Project, described the alternatives to be studied further, and announced a second round of public scoping meetings. The third newsletter of May 2004 summarized comments from the second round of public meetings, covered alternatives identified for further study, described alternatives eliminated from further consideration, explained Missouri River investigations, and outlined chapters in the DEIS. The Fall 2004 newsletter covered the Project purpose and need, quantified water shortages in the Red River Valley, explained changes to the alternatives including the addition of the Lake of the Woods Alternative, introduced the Cooperating Agency Team, summarized agency meetings to identify resource concerns, and described coordination with tribes.
Front page of November 2002 Newsletter
5 - 3

Red River Valley Water Supply Project FEIS Chapter Five Consultation and Coordination
Cooperating Agency Team
The joint leads established a Cooperating Agency Team to facilitate transfer of information among agencies and between the agencies and joint leads through meetings and frequent communication at key steps of the process. Cooperating agencies provided information on their special expertise or jurisdiction related to the Project, assisted with analyses, and reviewed draft DEIS and SDEIS chapters and analyses. The following organizations participated as cooperating agencies:
• Fargo, North Dakota • Grand Forks, North Dakota • Lake Agassiz Water Authority • Moorhead, Minnesota • Minnesota Department of Natural
Resources • North Dakota State Historic
Preservation Office • Three Affiliated Tribes
• U.S. Army Corps of Engineers • U.S. Environmental Protection
Agency • U.S. Fish and Wildlife Service • U.S. Forest Service • U.S. Geological Survey • West Fargo, North Dakota
Cooperating Agency Team meetings were held on the following dates and at the following locations:
• January 21-24, 2003 Various locations and conference calls (met with state and federal agencies to form the team)
• March 26, 2003 Fargo, North Dakota • May 15, 2003 Fargo, North Dakota • August 21, 2003 Fargo, North Dakota • December 18, 2003 Moorhead, Minnesota • August 24, 2004 Moorhead, Minnesota • February 22, 2005 Moorhead, Minnesota • August 10-11, 2005 Fargo, North Dakota • May 17, 2006 Fargo, North Dakota • February 27, 2007 Moorhead, Minnesota
Technical Team
A Technical Team was formed to assist Reclamation in developing plans of study, provide technical evaluations, review draft products, and prepare portions of the Needs and Options Report (Reclamation 2005a). Information gathered by the team was used in preparing the EIS.
The following agencies and organizations participated in the Technical Team meetings: • Advanced Engineering and
Environmental Services, Inc. • American Fisheries Society,
Minnesota Chapter
5 - 4

Red River Valley Water Supply Project FEIS Chapter Five Consultation and Coordination
• American Fisheries Society, North Central Division
• Bartlett and West Engineering • Canadian Consulate, Government of
Canada • Cargill, Inc. • Corps of Engineers • Department of Environment and
Natural Resources, State of South Dakota
• Department of Health, State of Minnesota
• Department of Natural Resources, State of Missouri
• Department of Natural Resources, State of Nebraska
• Department of Health, State of North Dakota
• Eastern Dakota Water Users Association
• East Grand Forks, Minnesota • Energy and Environmental Research
Center, University of North Dakota • Environment Canada, Government
of Canada • Fargo, North Dakota • Fisheries and Oceans Canada,
Government of Canada • Garrison Diversion Conservancy
District • Manitoba Water Stewardship,
Province of Manitoba • Minnesota Geological Survey
• Minnesota Pollution Control Agency • North Dakota Game and Fish
Department • North Dakota Geological Survey • Grafton, North Dakota • Grand Forks, North Dakota • Houston Engineering • Lake Agassiz Water Authority • Meridian Environmental
Technology, Inc. • Minnesota Department of Natural
Resources • Moorhead, Minnesota • National Audubon Society • National Wildlife Federation • North Dakota Wildlife Federation • Montgomery Watson Harza • North Dakota State University • North Dakota State Water
Commission • North Dakota Wildlife Society • Red Lake Band of Chippewa • Red River Basin Commission • Sierra Club • U.S. Environmental Protection
Agency • U. S. Fish and Wildlife Service • U.S. Geological Survey • U.S. National Park Service • Valley City, North Dakota • West Fargo, North Dakota
Fifteen Technical Team meetings were held on the following dates at the following locations:
• March 1, 2001 Bismarck, North Dakota • April 4, 2001 Fargo, North Dakota • May 2, 2001 Bismarck, North Dakota • July 12, 2001 Bismarck, North Dakota • September 13-14, 2001 Fargo, North Dakota • September 9, 2002 Fargo, North Dakota • November 18, 2002 Fargo, North Dakota • March 27, 2003 Fargo, North Dakota • May 29, 2003 Fargo, North Dakota • August 20, 2003 Conference call
5 - 5

Red River Valley Water Supply Project FEIS Chapter Five Consultation and Coordination
• September 11, 2003 Fargo, North Dakota • October 28, 2003 Fargo, North Dakota • June 29-30, 2004 Fargo, North Dakota • July 19, 2004 Conference call • November 3, 2004 Bismarck, North Dakota • July 5-6, 2005 Fargo, North Dakota
Resource Meetings
The joint leads engaged in several meetings with one or more agencies to gather information on resources, discuss potential impacts on the environment, or to clarify procedures for compliance with laws, regulations, and policies. The subject of these meetings, the agencies involved, meeting dates, and locations are listed below in table 5.1. Informal ESA Section 7 meetings with the Service are in table 5.2.
Table 5.1 – Resource Meeting Topic, Attendees, Dates and Locations.
Topic Attendees Date Location or Method
Missouri River and Indian Trust Assets Mni Sose and Reclamation January 21, 2003 Rapid City,
South Dakota
Missouri River Depletion
Garrison Diversion; Reclamation; and Northwest Division, Missouri River Basin Water Management Division - Corps September 17, 2003 Conference
call
Lake Ashtabula Reclamation and St. Paul District – Corps February 9, 2004 St. Paul, Minnesota
Groundwater Resources
Red River Basin Commission, North Dakota State Water Commission, North Dakota Geological Survey, MNDNR, University of Minnesota-Minnesota Geological Survey, USGS, and Reclamation
February 17, 2004 Moorhead, Minnesota
Aquatic Resources
North Dakota State Department of Health, North Dakota Game and Fish Department, MNDNR, Minnesota Pollution Control Agency, Service, Garrison Diversion, and Reclamation
May 10, 2004 Conference call
Biological Impact Analysis
State of North Dakota Game and Fish Department, North Dakota Parks and Recreation, Service, Garrison Diversion, and Reclamation
May 14, 2004 Bismarck, North Dakota
Western Prairie Fringed Orchid
Service, U.S. Forest Service, Garrison Diversion, and Reclamation
June 16, 2004 Bismarck, North Dakota
Minnesota Groundwater and Natural Resources
MNDNR, Minnesota Department of Health, Service, Garrison Diversion, and Reclamation
June 29, 2004 Fargo, North Dakota
Western Prairie Fringed Orchid U.S. Forest Service and Reclamation July 20, 2004 Lisbon, North
Dakota Fish and Wildlife Coordination Act Service, Garrison Diversion, and Reclamation July 27, 2004 Bismarck,
North Dakota EPA Roles and Responsibilities EPA and Reclamation August 25, 2004 Denver,
Colorado Regulation of Lake of the Woods Corps and Reclamation October 28, 2004 Conference
call
5 - 6

Red River Valley Water Supply Project FEIS Chapter Five Consultation and Coordination
Location or Topic Attendees Date Method
Minnesota Environmental Policy Act
State of MNDNR, Minnesota Pollution Control Agency, Minnesota Department of Health, Minnesota Geological Survey, Garrison Diversion, and Reclamation
June 6, 2005 Minneapolis, Minnesota
EPA Roles, Responsibilities, and Comments on Analysis
EPA and Reclamation July 28, 2005 Conference call
Indian Trust Assets Reclamation and Red Lake Band of Chippewa August 9, 2005 Red Lake, Minnesota
Clean Water Act Permitting Corps, Garrison Diversion, and Reclamation August 22, 2005
September 18, 2006 Bismarck, North Dakota
Fish and Wildlife Coordination Act Service, Garrison Diversion, and Reclamation September 22, 2005 Bismarck,
North Dakota Water Quality Modeling Workshop
Reclamation, USGS, Garrison Diversion, and North Dakota Department of Health November 17, 2005 Bismarck,
North Dakota Water Quality Modeling Workshop
Reclamation, USGS, Garrison Diversion, and North Dakota Department of Health December 7, 2005 Bismarck,
North Dakota
Water Quality Modeling Workshop
Reclamation, Grand Forks, Fargo, Environment Canada, Lake Agassiz Water Authority, USGS, EPA, Garrison Diversion, Minnesota Pollution Control Agency, Minnesota Department of Health, MNDNR, North Dakota Department of Health, and North Dakota State Water Commission
Jan 31-Feb 1, 2006 Moorhead, Minnesota
Aquatic Resources MNDNR and Reclamation February 2006 Electronic mail and telephone calls
EPA Comments on Draft EIS
Reclamation, EPA, Garrison Diversion, and North Dakota State Water Commission February – September
2006
Meetings in Denver, North Dakota and Conference calls
Water Quality Modeling
Reclamation, USGS, Garrison Diversion, and EPA
March 9, 2006 May 31, 2006 August 22, 2006 August 29, 2006 September 5, 2006 September 12, 2006
Conference call
Indian Trust Assets Reclamation and Three Affiliated Tribes March 20, 2006 New Town, North Dakota
Endangered Species Act
Service - North Dakota Field Office and Reclamation May 2006
Electronic mail, calls and, meeting Bismarck, North Dakota
Missouri River Depletions
Garrison Diversion, Reclamation, and Northwest Division and Missouri River Basin Water Management Division - Corps
July 18, 2006 Conference call
Missouri River Depletions
Garrison Diversion, Reclamation, and Northwest Division, Missouri River Basin Water Management Division - Corps
July-September, 2006
Electronic mail and coordination calls
5 - 7

Red River Valley Water Supply Project FEIS Chapter Five Consultation and Coordination
Location or Topic Attendees Date Method
EPA Comments on DEIS
Reclamation, Garrison Diversion, EPA, and North Dakota State Water Commission July 26-27, 2006 Denver,
Colorado
Fish and Wildlife Coordination Act Report
Service and Reclamation
August – September 2006
Electronic mail and coordination calls
EPA Comments on DEIS Reclamation, Garrison Diversion, and EPA August 28, 2006 Denver,
Colorado
Water Quality Modeling Reclamation, USGS, and Garrison Diversion September 7, 2006 Conference
call
Water Quality Reclamation, Garrison Diversion, USGS, and North Dakota Department of Health November 30, 2006 Bismarck,
North Dakota
EPA comments on DEIS
EPA, Reclamation, Garrison Diversion, and North Dakota State Water Commission December 19, 2006 Denver,
Colorado
Environmental Protection Agency Consultation
The EPA has several important roles and responsibilities in the development of an EIS. One of their roles is to provide guidance to federal agencies on filing EISs, including draft, final, and supplemental EISs and as required by NEPA and CEQ regulations. EPA also performs substantive reviews of EISs pursuant to NEPA and Section 309 of the Clean Air Act. The Project DEIS, SDEIS, and FEIS have been filed with EPA. Since the release of the DEIS, Reclamation and North Dakota have participated in numerous meetings and conference calls with representatives from EPA to address their comments. This consultation continued through the preparation of the FEIS.
Endangered Species Act Consultation
Federal agencies are required to consult with the Service under Section 7 of the ESA when federally listed species may be affected by an agency action. Table 5.2 lists the dates and places of informal Section 7 consultation meetings between Reclamation and the Service.
To start the process Reclamation obtained a list of species from the Service that may be found in the Project area and potentially affected. The DEIS provided an analysis of impacts from the Project on the identified species. The SDEIS incorporated new information on potential impacts to threatened and endangered species.
No changes in operation of the Missouri River system by the Corps under the 2004 Master Manual are anticipated as a result of this Project. NEPA and ESA evaluations revealed that most of the effects of the water withdrawals to the Red River Valley for the Project would be relatively small.
5 - 8

Red River Valley Water Supply Project FEIS Chapter Five Consultation and Coordination
Table 5-2 – Informal ESA Section 7 Consultation Meetings.
Topic Attendees Date Location or Method
Biological Impact Analysis
North Dakota Game and Fish Department, North Dakota Parks and Recreation, Service, Garrison Diversion, and Reclamation
May 14, 2004 Bismarck, North Dakota
Western Prairie Fringed Orchid
Service, U.S. Forest Service, Garrison Diversion, and Reclamation
June 16, 2004
Bismarck, North Dakota
Western Prairie Fringed Orchid U.S. Forest Service and Reclamation July 20, 2004 Lisbon, North Dakota
Fish and Wildlife Coordination Act
Service, Garrison Diversion, and Reclamation July 27, 2004 Bismarck, North Dakota
Fish and Wildlife Coordination Act
Service, Garrison Diversion, and Reclamation
September 22, 2005 Bismarck, North Dakota
ESA Service - North Dakota Field Office and Reclamation May 2006
Electronic mail, calls, and meetings in Bismarck, North Dakota
ESA (Western Prairie Fringed Orchid)
Service – Twin Cities Field Office and Reclamation August 2006 Electronic mail and
coordination calls
Fish and Wildlife Coordination Act Report
Service and Reclamation August – September 2006
Electronic mail and coordination calls
ESA (Piping Plover and Interior Least Tern)
Service – North Dakota Field Office and Reclamation
October and November 2006
Electronic mail and meetings
ESA (Piping Plover and Interior Least Tern)
Reclamation and Service – North Dakota Field Office
October 5, 2006 Bismarck, North Dakota
ESA (Piping Plover and Interior Least Tern)
Reclamation, Service, Corps, and Garrison Diversion
November 7, 2006 Conference call
Biological Assessment
Reclamation and Service – North Dakota Field Office
February 2007- May 2007
Coordination calls and meetings. Review of draft biological assessment.
The actual operation of the Missouri River system is the responsibility of the Corps. Reclamation does not have control over the operation of the Missouri River system, and thus does not determine how the Corps operates for all project purposes. The environmental impacts of the Corps’ operation were evaluated in a series of biological assessments (1998 and 2003), and in the Service’s 2000 and 2003 biological opinions on the operations of the Missouri River.
Reclamation has evaluated the impacts of the Project’s alternatives on Missouri River uses and resources. The impacts to federally listed species, specifically the interior least tern and piping plover, have already been described by the Corps’ biological assessments on their Missouri River system operation, the Service’s biological opinions, and the Corps’ subsequent implementation of those opinions.
Reclamation completed a biological assessment on the preferred alternative in compliance with regulations found at 50 CFR Part 402 Interagency Cooperation – Endangered Species Act of 1973, as Amended; Final Rule. The biological assessment finds that the proposed action, the GDU Import to the Sheyenne River Alternative, is not likely to adversely affect any federally
5 - 9

Red River Valley Water Supply Project FEIS Chapter Five Consultation and Coordination
listed species, including the least tern and piping plover (see Appendix G.1). The Service has concurred with these determinations.
Native American Consultation
In accordance with NEPA and related laws, regulations, and policies, Reclamation developed a Tribal Consultation Action Plan aimed at gathering and considering tribal issues and concerns about the proposed Project. The plan identified 30 tribes within the Red River Basin and Missouri River Basin that could be impacted by the Project. Table J.1 in Appendix J provides a list of the tribes located within the area of potential effect. Comments from tribes were solicited during the scoping process. Reclamation requested that the tribes identify any ITAs that could be affected by the Project alternatives and invited them to meet and consult on impacts to any potentially affected ITAs. Three tribes responded to this request for continuing direct consultations. Other tribes requested to be kept informed as the process moved forward and some did not respond. The Mni Sose Water Rights Coalition, representing Missouri River Basin tribes, requested information about the Project, so Reclamation staff and managers met with them to discuss consultation with tribes in the basin. Reclamation has continued to provide periodic updates to the members of the Mni Sose Water Rights Coalition, as requested. For specific information on the consultation activities refer to Appendix J.
As alternatives were developed for the Project, Reclamation continued consultation with the Three Affiliated Tribes, Standing Rock Sioux Tribe, and the Red Lake Band of Chippewa. Tribal water rights settlements, treaty rights, and ITAs form the core of collective tribal issues and concerns. Each of these tribes, along with the others identified in the Tribal Consultation Action Plan, were sent a copy of the DEIS during the public comment period.
During the preparation of the SDEIS, Reclamation sent a letter to each of the 30 tribes notifying them that Reclamation and North Dakota were preparing a SDEIS and invited them to consult on ITAs and other concerns with respect to the SDEIS. The Standing Rock Sioux Tribe and Red Lake Band of Chippewa responded with a request for a meeting. In addition, the Oglala Sioux Tribe expressed concerns about the Project in SDEIS public hearing testimony and in a comment letter (see Appendix M.2). Reclamation is continuing government-to-government consultation with the tribes.
Cultural Resources Consultation
As a part of the identification of cultural properties under Section 106 of the National Historic Preservation Act, consultation was initiated with State Historic Preservation Officers for the states of North Dakota and Minnesota, and with the Tribal Historic Preservation Officers or tribal archaeologists for the Sisseton Wahpeton Oyate, White Earth Band of Minnesota Chippewa, Red Lake Band of the Chippewa, Standing Rock Sioux Tribe, and Three Affiliated Tribes.
5 - 10

Red River Valley Water Supply Project FEIS Chapter Five Consultation and Coordination
Coordination and Compliance with Other Applicable Laws, Regulations, and Policies
Analysis and implementation of the Project requires consistency, coordination and compliance with multiple federal and state laws, regulations, executive orders, and policies. The following have known application to the Project.
Archaeological Resource Protection Act of 1979 This Act protects archaeological resources on federal and tribal lands and requires a permit to remove archaeological resources from these lands. Permits may be issued to educational or scientific institutions only if the removal would increase knowledge about archaeological resources. Project level compliance with this law would be accomplished through specific environmental commitments for all of the action alternatives.
Boundary Waters Treaty of 1909 The DWRA specifically mandates compliance with the Boundary Waters Treaty of 1909. The Treaty sets forth an agreement that “boundary waters and waters flowing across the boundary shall not be polluted on either side to the injury of health or property on the other.” The Treaty provides principles and mechanisms to avoid and resolve disputes regarding water resources along the boundary between the U.S. and Canada. The IJC was created to respond to proposals for use, obstruction, or diversion of boundary waters if the proposal could affect natural water levels or flows. The IJC can investigate specific issues or monitor situations when requested by either government. Implementation of IJC recommendations are at the discretion of the two governments. Reclamation has formed a work group of U.S. agencies that includes the Department of the Interior, EPA, and Department of State to ensure compliance with the provisions of DWRA specific to the Boundary Waters Treaty.
Clean Water Act of 1977 (as amended) The Clean Water Act is the principal law governing pollution control and water quality of navigable waterways of the United States. Section 402 of the Act establishes a NPDES (National Pollution Discharge Elimination System) permitting program to regulate the point source discharge of pollutants into waters of the United States. Both North Dakota and Minnesota administer state-level NPDES programs pursuant to authority delegated by the EPA. It is noteworthy that EPA issued agency guidance in April 2006, advising of its position that NPDES permits were not necessary for transbasin diversions of water. On June 7, 2006, EPA published a proposed rule entitled "NPDES Water Transfers Proposed Rule" in the Federal Register, which clarifies that NPDES permits are not necessary for transbasin diversions of water.
Section 404, administered by the Corps with oversight from EPA, is another permitting program that regulates activities of the placement of dredged or fill materials into waters of the United States. The Corps issues nationwide permits on a state, regional, or nationwide basis for similar activities that cause only minimal adverse environmental effects both individually and cumulatively. Individual permits may also be issued for specific activities on specific water bodies under Section 404. If the Corps determines that an individual Section 404 permit is
5 - 11

Red River Valley Water Supply Project FEIS Chapter Five Consultation and Coordination
required, a North Dakota State Water Quality Certification Permit (Section 401) would also be required.
Farmland Protection Policy Act of 1995 The purpose of this Act is to ensure that impacts to prime or unique farmlands are considered in federal projects. It requires federal agencies to consider alternative actions that could lessen impacts and to ensure that their actions are compatible with state, local government, and private programs to protect prime and unique farmland. The Natural Resources Conservation Service is responsible for administering this Act. Farmlands were considered in the Project analysis using the key indicators of changes in farm acreage and production. Prime and unique farmlands would be protected to the extent possible during implementation of the Project consistent with the Act.
Fish and Wildlife Coordination Act of 1958 (as amended) The Act provides a procedural framework for the orderly consideration of fish and wildlife conservation measures to be incorporated into federal projects and federally permitted or licensed water resource development projects. Agencies that construct, permit, or license projects impacting a water body must consult with the Service and the state agency having jurisdiction over fish and wildlife resources (North Dakota Game and Fish Department and MNDNR). Full consideration must be given to the recommendations made through this consultation process. Section 2 states that fish and wildlife conservation shall receive equal consideration with other project purposes and will be coordinated with other features of water resource development projects. Reclamation has complied to the Act through consultation with the Service, providing the opportunities for state wildlife agencies to comment and by developing Project environmental commitments for fish and wildlife. The Final Fish and Wildlife Coordination Act Report is included in the FEIS.
Fish and Wildlife Conservation Measures are Incorporated into Project Design to Protect Wildlife
Migratory Bird Treaty Act and Executive Order 13186 (January 2001)
Blue Winged Teal - A Protected Migratory Bird
Under the provisions of this Act it is unlawful “by any means or manner to pursue, hunt, take, capture [or] kill” any migratory birds except as permitted by regulations issued by the Service. Migratory birds include all native birds in the United States with the exception of non-migratory species managed by states. The Service has defined “take” to mean “pursue, hunt, shoot, wound, kill, trap, capture, or collect, or attempt to pursue, hunt, shoot, wound, kill,
5 - 12

Red River Valley Water Supply Project FEIS Chapter Five Consultation and Coordination
trap, capture or collect” any migratory bird or any part, nest, or egg of any migratory bird (50 Code of Federal Regulations Section 10.12).
Native American Graves Protection and Repatriation Act (Public Law 101-601) This Act establishes federal policy with respect to Native American burials and graves located on federal or tribal lands. Federal agencies are required to consult with and obtain the concurrence of the appropriate tribes with respect to activities that may result in the disturbance and/or removal of burials and graves from federal lands or lands held in trust for a tribe. To ensure compliance with the Act, Reclamation would consult with the tribes if any unanticipated discoveries are made during the implementation phase of the Project.
National Historic Preservation Act of 1966 (as amended) The Act establishes protection of historic properties as federal policy in cooperation with states, tribes, local governments, and the public. Historic properties are those buildings, structures, sites, objects, and districts, or properties of traditional religious and cultural importance to Native Americans, determined to be eligible for inclusion in the National Register of Historic Places. Section 106 of the Act requires federal agencies to consider the effects of proposed actions on historic properties and gives the Advisory Council on Historic Preservation an opportunity to comment. The lead federal agency is responsible for consultation with the SHPO and/or Tribal Historic Preservation Offices, tribes, applicants, interested parties, and local governments regarding federal undertakings. When previously unidentified cultural resources are encountered, the Project includes environmental commitments to comply with the Act.
National Invasive Species Act of 1996 The purpose of the Act is fivefold: (1) to prevent unintentional introduction and dispersal of non-indigenous species into the waters of the United States through ballast water management and other requirements; (2) to coordinate federally funded or authorized research, prevention control, information dissemination, and other activities regarding the zebra mussel and other aquatic nuisance species; (3) to develop and carry out environmentally sound control methods to prevent, monitor, and control unintentional introductions of non-indigenous species from pathways other than ballast water exchange; (4) to understand and minimize economic and ecological impacts of non-indigenous aquatic nuisance species that become established, including the zebra mussel; and (5) to establish a program of research and technology development and assistance to states in the management and removal of zebra mussels. To comply with the Act, the Project incorporates design features to minimize invasion of non-indigenous biota and monitor the distribution network for effective prevention of spread.
National Wildlife Refuge System Administration Act of 1966 Amended in 1997 by the National Wildlife Refuge System Improvement Act, this Act ensures that the National Wildlife Refuge System is managed as a national system of related lands, waters, and interests for conservation, management, and restoration of fish,
Grasslands are Protected by Refuges (http://www.fws.gov/arrowwood/valleycity_wmd/grasslands.html)
5 - 13

Red River Valley Water Supply Project FEIS Chapter Five Consultation and Coordination
wildlife, and plant resources. It includes management and administration of refuges, wildlife management areas, waterfowl production areas, and other areas. The Secretary of the Interior may permit uses of these areas if such uses are compatible with the major purpose for which the areas were established and are consistent with public safety. To comply with the Act, the Project would establish local coordination procedures to avoid and minimize potential impacts to natural resources of refuge system.
Rivers and Harbors Appropriation Act of 1899 Under Section 10 of the Act, the construction of any structure in or over any navigable water of the United States, the excavating from or depositing of material in such waters, or the accomplishment of any other work affecting the course, location, condition, or capacity of such waters is unlawful unless the work has been recommended by the Chief of Engineers and authorized by the Secretary of the Army. All of the Project alternatives would be implemented with design measures deemed compatible with the Act. However, Project design features requiring recommendation and approval would be submitted to the Corps for permitting consideration in compliance with the Act.
Safe Drinking Water Act of 1974 (as amended) This Act gave EPA the authority to set standards for drinking water quality in water delivered by public water suppliers. Reclamation’s Regulatory Overview of the Safe Drinking Water Act (Reclamation 2003d) provides a summary of present and foreseeable future water quality requirements established by state and federal laws and regulations. It predicts the most likely future water quality standards that will be promulgated for public water systems by 2050. Analysis of water quality in the DEIS indicates that there would be minor to no measurable changes from the existing conditions for the action alternatives.
Executive Order 13112 for Invasive Species In 1999, an executive order was issued to prevent the introduction of invasive species and to provide for their control. It directs federal agencies to identify applicable actions and to use programs and authorities to minimize the economic, ecological, and human health impacts caused by invasive species. To meet the intent of this order, the Project includes environmental commitments to prevent and control the spread of invasive species.
Executive Order 12114 for Environmental Effects Outside of the United States This order, established in 1979, addresses the issue of how the environmental review process should be implemented for major federal actions having significant effects outside the borders of the United States. Section 1 of the Executive Order provides that it is the United States government’s “exclusive and complete determination of the procedural and other actions to be taken by Federal agencies to further the purpose of the National Environmental Policy Act, with respect to the environment outside the United States, its territories and possessions.” Because of the potential effects on Canada from the Project, compliance with this order is being coordinated through the U.S. State Department’s consultation with Canada.
5 - 14

Red River Valley Water Supply Project FEIS Chapter Five Consultation and Coordination
Other Executive Orders Executive Order 11988 (Floodplain Management) requires federal agencies to avoid developments on floodplains whenever possible or to minimize potential harm to the floodplains. Executive Order 11990 (Protection of Wetlands) directs federal agencies to avoid destruction, loss, or degradation of wetlands. Executive Order 13007 (Indian Sacred Sites) orders federal agencies to accommodate Indian tribes’ requirements for access to and ceremonial use of sacred sites on public lands and to avoid damaging the physical integrity of such sites. Executive Order 12898 (Environmental Justice) directs federal agencies to identify and address disproportionately high and adverse human health or environmental effects on minority populations and low-income populations. These orders were applied in the development of the EIS.
Corps of Engineers Lake Ashtabula Water Control Manual The Water Control Manual for Lake Ashtabula contains the operating criteria used to guide reservoir storage and Baldhill Dam releases. The reservoir is operated within the range of storage and release rates established in the operating criteria. Operational proposals that are inconsistent with operating criteria may require the Corps to consider revising the manual. Flood control operations would not change.
North Dakota State Burial Law If human remains or burial goods are discovered during Project construction, any human remains or burial goods would be dealt with in accordance with the Native American Graves Protection and Repatriation Act and/or state law. North Dakota Century Code 23-06-27 - Protection of Human Burial Sites, Human Remains, and Burial Goods - protects human burial sites and burial goods on private lands and on state and political subdivision lands in North Dakota.
State Water Rights The appropriation of water in the state of North Dakota, both surface and groundwater, is the responsibility of the State Engineer and follows western water law. A permit may only be issued for an actual diversion. Water permit seniority is established by the date a permit application is approved. Western water law is grounded on the premise of “first in time, first in right.”
Water law in Minnesota is governed by riparian rights. Riparian water rights, or eastern water law, state that the owner of land containing a natural stream or abutting a stream is entitled to receive the natural flow of the stream limited only by the equal rights of the other riparian owners. The riparian owner is protected against the diversion of water except for domestic purposes upstream from his or her property and from the diversion of excess flood flows toward his or her property. Riparian water rights also apply to groundwater.
In order to obtain an appropriation permit for water from Minnesota, the applicant must either have a viable contingency plan in case of drought or must agree to withstand the result of not being allowed to obtain water. If the Commissioner of the MNDNR ultimately issues a water appropriation permit for an out-of-state diversion, Minnesota legislative approval of the permit would be required. Minnesota law recognizes priorities in the event of competing uses of water. Out-of-state diversions are generally discouraged and are the lowest priority. Finally, any MNDNR appropriation permit is subject to modification or termination at any time in the event of shortage or priority redetermination.
5 - 15

Red River Valley Water Supply Project FEIS Chapter Five Consultation and Coordination
The EIS recognizes that the DWRA poses complexities when state laws and regulations are applied to the various sources of water used for each of the site-specific Project alternatives. The joint lead agencies will continue to work with the states of North Dakota and Minnesota to ensure that the final design of the Project, if an action alternative is selected, is mutually consistent with their respective laws and regulations.
Minnesota’s Endangered Species Statute and Associated Rules Minnesota’s Endangered Species Statute (Minnesota Statutes, Section 84.0895) and associated Rules (Minnesota Rules, Parts 6212.1800 to 6212.2300 and 6134) impose a variety of restrictions, a permit program, and several exemptions pertaining to species designated as endangered or threatened. The law and rules prohibit taking, importing, transporting, or selling endangered or threatened plants or animals without a permit. The EIS included potential effects on Minnesota species and provides species specific commitments to ensure consistency with the state’s regulations.
Minnesota Environmental Policy Act This Act directs all departments and agencies of the state to promote efforts that will prevent or eliminate damage to the environment, and to improve and coordinate state plans, functions, programs, and resources to carry out this policy. This law and its implementing policies are similar in nature to NEPA, and in fact, a state-level environmental impact statement would be required for this level of water diversion. Under the Minnesota Environmental Review Program, certain proposed projects are required to undergo special review procedures prior to obtaining approvals and permits otherwise needed. The joint leads for the Project will continue to work cooperatively with Minnesota to maintain consistency with the state’s environmental policies.
Minnesota Statute 307.8 (Private Cemeteries) This state law protects all human burials and human skeletal remains found on all public or private lands or waters in Minnesota. It establishes a process for authenticating, identifying, marking, and rescuing burial grounds, as well as penalties for disturbing such locations. The Project includes environmental commitments to comply with the statute should any discovery occur during the implementation phase of the Project.
Minnesota Wetland Conservation Act of 1991 (as amended) This law was established to achieve no net loss of Minnesota's existing wetlands; to increase Minnesota's wetlands by restoring or enhancing diminished or drained wetlands; to avoid direct or indirect impacts from activities that destroy or diminish wetlands; and to replace wetland values where avoidance of activity is not feasible and prudent. Draining, filling, and in some cases, excavating in wetlands is prohibited unless (a) the drain, fill, or excavation activity is exempt; or (b) wetlands are replaced by restoring or creating wetland areas of at least equal public value. The EIS includes analysis of potential impacts on wetlands and provides environmental commitments for the protection of wetlands. Where impacts cannot be avoided, Reclamation and North Dakota will consult with the State of Minnesota.
Minnesota Invasive Species Laws Minnesota has several state laws to minimize the introduction and spread of invasive species in the state. The Minnesota statutes and rules regulate an invasive species management program to
5 - 16

Red River Valley Water Supply Project FEIS Chapter Five Consultation and Coordination
prevent the introduction of non-native aquatic plants and wild animals, but exclude pathogens from statutory coverage (see http://www.dnr.state.mn.us/ecological_services/invasives/laws.html).
Missouri River Water Rights Summary No private individual or state “owns” the flow of the Missouri River. Each basin state can claim an equitable share by Supreme Court decree, interstate compact or Congressional action (National Research Council 2002). The DWRA only authorizes the construction of features that meet water supply requirements, including MR&I water supply needs, groundwater recharge, and streamflow augmentation [Section 8(a)(2)]. If the Secretary of the Interior selects an alternative that includes the delivery of Missouri River water, additional Congressional approval is required prior to commencing construction of such an alternative [Section 8(a)(3)(B)]. The National Research Council (2002) provides a summary of water rights in the Missouri River. Water rights in the Missouri River basin differ by state and Tribes and in some cases by action. The following presents water rights information from the National Research Council (2002).
Colorado, Montana, North Dakota, South Dakota, and Wyoming follow prior appropriation and allow an individual to perfect a right based on diversion and application to beneficial use. Riparian rights exist by virtue of ownership of land adjacent to a stream and do not depend on actual use. Nebraska is a dual state and recognizes both riparian and appropriation rights. Each riparian state is entitled to an equitable share of the river, but the right must be based on prior or reasonably anticipated use. The rights can be affirmed by Supreme Court decree, interstate compact or congressional apportionment. The states have explored these options, but none have been implemented. The federal government can mandate flows for environmental protection purposes. These flows generally supersede state-created water rights.
Indian tribes may claim group rights that have both riparian and appropriative characteristics. Based on the Winters Doctrine of 1908, federal reserved water rights arise by virtue of the creation of a reservation. These rights date from the date of the creation of the reservation and do not depend on the application of water to beneficial use.
In regard to navigation, the National Research Council (2002) notes that no individual may assert a property right to the flow of a navigable stream below the stream’s high water mark. The assumption has long been that the government may enhance or destroy the navigable capacity of a stream. In 1988, the Supreme Court gave the Corps of Engineers great discretion to make decisions about Missouri River flow management (ESTI Pipeline Project v. Missouri 848 U.S. 495, 1988). However, the status of navigation is complicated by the O’Mahoney-Millikin compromise, which the upper basin states argue subordinates navigation to irrigation and precludes the recognition of any vested rights for a navigation channel depth.
5 - 17

Red River Valley Water Supply Project FEIS Chapter Five Consultation and Coordination
List of Preparers
These people were directly responsible for preparation of the FEIS.
Kimball Banks, Financial Assistance Officer, Reclamation Contribution: Indian trust assets and cultural resources sections of chapters three and four and Appendix L Education: B.A., Anthropology, University of California – San Diego; M.A. and PhD, Anthropology, Southern Methodist University Experience: 19 years as an archaeologist and Native American Affairs Specialist with Reclamation; archaeologist with the Bureau of Indian Affairs prior to this; worked with Native Americans throughout his professional career
Darrin Goetzfried, P.E., Hydraulic Engineer, Reclamation Contribution: Surface water modeling and co-author of the surface water quantity sections of chapters three and four and Appendix B.1 Education: B.S., Civil Engineering, North Dakota State University Experience: Reclamation for 15 years, first as an engineer and then as the lead hydraulic engineer for the Dakotas Area Office
Greg Hiemenz, Environmental Specialist, Reclamation Contribution: Invasive species environmental consequences and assisted in water quantity modeling Education: B.S., Biology, St. John’s University; M.S., Zoology, North Dakota State University Experience: 20 years of experience with Reclamation
Patience Hurley, Public Involvement Specialist, Reclamation Contribution: Design, layout, and publication of the FEIS executive summary Education: B.S., Social and Behavioral Science in Secondary Education, Dickinson State University Experience: Three years of experience with Reclamation
David Johnson, P.E., District Engineer, Garrison Diversion Contribution: Interdisciplinary Team member with expertise in engineering, Garrison Diversion operations, and coordination of state interests Education: B.S., Mechanical Engineering, North Dakota State University, Registered Professional Engineer since 1989 Experience: 15 years as the city engineer and administrator for Watford City, North Dakota; District Engineer for Garrison Diversion since 2003
Dean Karsky, P.E., Civil Engineer, Reclamation Contribution: Primary author of chapter two, contributed to chapter one, and prepared Appendix A and contributed to many other appendixes
5 - 18

Red River Valley Water Supply Project FEIS Chapter Five Consultation and Coordination
Education: B.S., Civil Engineering, North Dakota State University, Registered Professional Engineer since 1986 Experience: 25 years of experience with Reclamation
Richard McCabe, Environmental Consultant, Garrison Diversion Contribution: Represented Garrison Diversion as an environmental specialist on the Interdisciplinary Team Education: B.S., Zoology, North Dakota State University Experience: Biologist for the U.S. Soil Conservation Service for six years, wildlife biologist and environmental specialist with Reclamation for 22 years, and a private consultant for 10 years
Elizabeth Nell McPhillips, Natural Resource Specialist, Reclamation Contribution: Wrote the Missouri River, wildlife, threatened and endangered species, natural resource lands, protected areas, and contributed to Indian trust assets sections of chapters three and four and the associated appendixes Education: B.S., Fish and Wildlife Sciences, West Virginia University; M.S., Fish and Wildlife Management, South Dakota State University Experience: 19 years of experience with the U.S. Fish and Wildlife Service, and four years with Reclamation
Merri Mooridian, Communications Director, Garrison Diversion Contribution: Assisted in editing, reviewing, and proofreading the SDEIS, and in publication of the FEIS executive summary Education: B.S, Business Administration and Computer Information Systems, Valley City State University; M.B.A., University of Mary Experience: 3 years of experience with Garrison Diversion
Steven Piper, Economist, Reclamation Contribution: Prepared the socio-economics and environmental justice sections of chapters three and four and Appendix K Education: B.A. and M.A., Colorado State University; PhD, Resource Economics, Colorado School of Mines Experience: 15 years of experience with Reclamation
Alison Schlag, Environmental Specialist, Reclamation Contribution: Conducted the GIS analysis of natural resources, wrote the surface water quantity sections, primary author of the executive summary, compiled chapters three and four and Appendix L, and assisted in editing Education: B.S., Geology, University of Wisconsin – River Falls; M.S., Geology, University of North Dakota Experience: Conducted environmental studies on air quality for the U.S. Air Force prior to beginning work for Reclamation in 2003
Allen Schlag, Hydrologist, Reclamation Contribution: Served as the groundwater hydrologist, water quality coordinator, and was the primary author of the groundwater sections in chapters three and four
5 - 19

Red River Valley Water Supply Project FEIS Chapter Five Consultation and Coordination
Education: B.S., Environmental Geology and Technology, and M.S., Geology, University of North Dakota Experience: University of North Dakota Water Resources Research Lab manager and researcher, and lecturer, prior to beginning work for Reclamation in 2003
Signe Snortland, Environmental Specialist, Reclamation Contribution: Project team leader, editor of the FEIS, contributed to the cultural resources sections of chapters three and four, compiled chapter one, and contributed to chapter five Education: B.A., Anthropology, University of North Dakota; M.A., Anthropology, University of Manitoba Experience: For 16 years, she was employed by the North Dakota State Historic Preservation Office as the Research Archaeologist, Review and Compliance Coordinator, and then the Chief Archaeologist; from 1991 until 2000, she served as the Area Archaeologist for Reclamation until becoming the Red River Project team leader.
Ron Sutton, Fisheries Biologist, Reclamation Contribution: Contributed to the aquatic resources sections of chapters three and four and prepared Appendixes D.1, D.2, and D.3 Education: B.S., Fishery Biology, Colorado State University; M.A., Zoology, Southern Illinois University Experience: 11 years of experience as a fisheries biologist with Reclamation
Alicia Waters, Program Analyst, Reclamation Contribution: Assisted in editing, review, and proofreading the FEIS Education: B.S., Math and Natural Sciences, University of Mary Experience: 11 years natural resource experience with Reclamation
Distribution List
Agencies and Contact Person The entities listed below received a printed copy of the DEIS and/or SDEIS and/or FEIS or an Executive Summary with a compact disc of the DEIS/SDEIS/FEIS. A copy of the Final Needs and Options Report was included with the compact disc version of the DEIS/SDEIS/FEIS. The complete mailing list for the FEIS is in Appendix N.
U.S. Federal Agencies and Officials Army Corps of Engineers Ralph J. Augustin Tim Bertschi Daniel Cimarosti Craig Evans Gary W. House Larry Janis Roy McAllister Tom Raster
Daniel Reinartz Chuck Sptizack
Bureau of Indian Affairs Bill Benjamin Darin Larson Terrance Virden
Bureau of Land Management Lonny Bagley
5 - 20

Red River Valley Water Supply Project FEIS Chapter Five Consultation and Coordination
Department of Justice Donna Fitzgerald
Department of State Nancy Nelson Terry Breese
Environmental Protection Agency Al Fenedick John Geidt Toney Ott Cliff Rader Gene Reetz Robert E. Roberts Larry Svoboda
Federal Highway Administration Michael Bowen
Fish and Wildlife Service Terry Ellsworth Jeffrey Towner
Forest Service Bryan Stotts
Geological Survey Doug Emerson Greg Linder Ed Little Tom Reppe Jim Stark Jeff Stoner Kevin Vining
Minnesota Congressional Delegation Honorable Norm Coleman – Senator Honorable Amy Klobuchar – Senator Honorable Collin Peterson – Representative
National Park Service Heather Goeddecke Bruce Peacock
National Weather Service Doug Kluck
Natural Resources Conservation Service Tom Jewett Doug Van Daalen J. R. Flores Roel Vining
North Dakota Congressional Delegation Honorable Kent Conrad – Senator Honorable Byron Dorgan – Senator Honorable Earl Pomeroy – Representative State Representative – Office of Senator Kent Conrad, Grand Forks Office
Rural Utilities Service Rod Beck
State Agencies and Officials Iowa Mike McGhee –Department of Natural
Resources Kevin Szcodronski – Governor’s Designee Honorable Tom Vilsack – Governor
Kansas Honorable Kathleen Sebelius – Governor
Minnesota Nina Archabal – Minnesota SHPO Jim Berg – MNDNR Don Buckhout – MN Department of Natural
Resources Steven Colvin – MNDNR Jerome Deal – Chairman, Board of Water
and Soil Resources Dennis Gimmestad – Government Programs
& Compliance Officer – MN Historical Society
Jeff Grugel - Department of Health Will Haapala – Pollution Control Agency John Jaschke – Executive Director, Board of
Water and Soil Resources John N. Holck - Minnesota Pollution
Control Agency Mark Holsten – MN Department of Natural
Resources Honorable Morris Lanning – Representative Honorable Cal Larson - Senator
5 - 21

Red River Valley Water Supply Project FEIS Chapter Five Consultation and Coordination
Honorable Tim Pawlenty – Governor Honorable Dean Simpson - Representative Mike Howe – Department of Health Larry Kramka – MNDNR Ann Kuitunen – MNDNR Kent Lokkesmoe - Director, Division of
Waters, MNDNR Molly MacGregor – Pollution Control
Agency Robert Markhouse - Department of Health John Linc Stine - Department of Health Paul Stolen – MNDNR Harvey Thorleifson – Minnesota Geological
Survey, University of Minnesota Paul Swenson – MN Department of Natural
Resources
Missouri Joseph P. Bindbeutel – Agriculture and
Environment Division – Office of the Attorney General of Missouri
Doyle Childers - Director, Missouri Department of Natural Resources
Joe Engeln –Department of Natural Resources
Adam Gresham – Department of Natural Resources
Honorable Matt Blunt – Governor Jeremiah Nixon - Attorney General
Nebraska Steve Gaul – Department of Natural
Resources L Suzanne Gucciardo – Lewis & Clark
National Historic Trail Honorable Dave Heineman – Governor North Dakota Fred Anderson – Geological Survey Lisa Botnen – Energy and Environmental
Research Center, University of North Dakota
Kenneth Brist – Department of Transportation
David Bruschwein – Department of Health Steve Dyke – Game and Fish Department Elmer Hillesland – State Water Commission
Dennis Fewless – Department of Health Pat Fridgen – State Water Commission Dale Frink – State Engineer, State Water
Commission Lance Gaebe – Governor’s Office Troy Gilbertson –Department of
Transportation David Glatt – Department of Health Honorable Ole Aarsvold – Representative Honorable Bill Amerman – Representative Honorable Arden Anderson – Senator Honorable Jonella Bakke – Senator Honorable Arthur H. Behm – Senator Honorable Wesley R. Belter -
Representative Honorable Rick Berg – Representative Honorable Randy Boehning - Representative Honorable Merle Boucher – Representative Honorable Alan Carlson - Representative Honorable Donald L. Clark – Representative Honorable Stacey A. Dahl - Representative Honorable Chuck Damschen –
Representative Honorable Lois Delmore – Representative Honorable Donald D. Dietrich –
Representative Honorable Mary Ekstrom – Representative Honorable Thomas D. Fiebiger – Senator Honorable Tim Flakoll - Senator Honorable John Hoeven – Governor Honorable Tom Fischer – Senator Honorable Eliot Glassheim – Representative Honorable Bette B. Grande – Representative Honorable Chris Griffin - Representative Honorable Tony Grindberg – Senator Honorable Edmund A. Gruchalla -
Representative Honorable Pam Gulleson - Representative Honorable C. B. Haas – Representative Honorable Nicholas P. Hacker – Senator Honorable Kathy Hawken – Representative Honorable Joan A. Heckaman – Senator Honorable Joel C. Heitkamp – Senator Honorable Gil Herbel – Representative Honorable Ray Holmberg – Senator Honorable Lee Kaldor - Representative
5 - 22

Red River Valley Water Supply Project FEIS Chapter Five Consultation and Coordination
Honorable Jim Kasper – Representative Honorable Scot Kelsh – Representative Honorable Joyce Kingsbury –
Representative Honorable Kim Kippelman - Representative Honorable Gary Lee – Senator Honorable Judith Lee – Senator Honorable Elroy N. Lindaas - Senator Honorable Stanley Lyson - Senator Honorable Tim Mathern - Senator Honorable Ralph Metcalf – Representative Honorable David Monson – Representative Honorable Phillip Mueller – Representative Honorable Lee E. Myxter – Senator Honorable Carolyn Nelson – Senator Honorable Curtis Olafson – Senator Honorable Mark S. Owens – Senator Honorable LaVonne A. Pietsch –
Representative Honorable James R. Pomeroy – Senator Honorable Louise Potter – Representative Honorable Larry L. Robinson – Senator Honorable Jasper Schneider - Representative Honorable Margaret Sitte – Representative Honorable Ken Svedjan - Representative Honorable John Syverson – Senator Honorable Harvey Tallackson – Senator Honorable Blair Thoreson – Representative Honorable Tom Trenbeath – Senator Honorable John Traynor – Senator Honorable Gerald Uglem – Representative Honorable Benjamin A. Vig –
Representative Honorable Don Vigesaa – Representative Honorable John Wall – Representative Honorable Alon Wieland – Representative Honorable Clark Williams – Representative Honorable Steve Zaiser - Representative Wayne Kern – Department of Health Scott F. Korom – Geology and Geological
Engineering, University of North Dakota
Bruce Kreft – Game and Fish Department Cheryl Kulas – Indian Affairs Commission Doug Leier – Game and Fish Department Jack Long – Department of Health
Jeffrey Mattern – State Water Commission Michael G. McKenna – Game and Fish
Department Edward Murphy – North Dakota Geological
Survey Mike Noone – State Water Commission Honorable Darrell Nottestad –
Representative Merlan E Paaverud – State Historic
Preservation Officer, State Historical Society of North Dakota
Douglas Prchal – Director, Parks and Recreation Department
Steve Pusc – State Water Commission Susan Quinnell – State Historical Society of
North Dakota Bob Shaver – State Water Commission Michael Sauer – Department of Health Robert Shaver – State Water Commission Daniel Stepan – Energy and Environmental
Research Center University of North Dakota
Bob Walton –Department of Transportation Linda Weispfenning – State Water
Commission Bob White – State Water Commission Rachel White – State Historical Society of
North Dakota Francis Ziegler – Department of
Transportation
South Dakota Garland Erbele – Department of
Environmental and Natural Resources Honorable Mike Rounds – Governor Steven Pirner – Secretary, Department of
Environmental and Natural Resources Gale E. Selken – Department of
Environment and Natural Resources
Local Agencies and Officials Minnesota Edward Arnesen – Commissioner, Lake of
the Woods County Dan Boyce – Water and Light Department,
East Grand Forks
5 - 23

Red River Valley Water Supply Project FEIS Chapter Five Consultation and Coordination
Kim Bredeson – Commissioner, Lake of the Woods County
Jerry Dahl – Commissioner, Mahnomen County
Don Dreyer - Otter Tail Township Board of Supervisors
Charles Erickson - Otter Tail County Farm Bureau
Julie Doggett - Fargo Moorhead Chamber of Commerce
Glenys Ehlert - Clerk/Treasurer, Pelican Rapids
Honorable Davis Blakeway – Mayor of Hawley
Honorable Lloyd Hams – Mayor of Shelly John Kimple – Supervisor – Kead Lake
Township Honorable Curtis Miller – Mayor of
Humboldt Honorable Raymond Mounts – Mayor of
Ottertail Honorable Richard Nelson – Mayor of
Warren Nancy Otto – Moorhead City Council Honorable Kevin Keil – Mayor of Perham Honorable Neil Siats – Mayor of Roosevelt Honorable Lynn Stauss – Mayor of East
Grand Forks Honorable Mark Voxland – Mayor of
Moorhead John W. Hoschied – Commissioner, Lake of
the Woods County Lyle Hovland – Commissioner, Wilkin
County Gary Hultberg – Water and Light, East
Grand Forks Gordon A. Hydukovich - Community
Development Director, City of Fergus Falls
Mr. Chuck Johnson - EDA Director, Perham Jan Kaspari – Marshall County Water and
Land Office Larry Krohn - Otter Tail County
Coordinator Rick Kvien – Recorder, Roseau County Hank Ludtke - Frazee City Council
David Martin - President, Fargo Moorhead Chamber of Commerce
Craig Mattson – City Administrator/Clerk/ Treasurer, East Grand Forks
Clifford McLain – Moorhead Public Service, Moorhead
Chuck Meyer - Red Lake Department of Natural Resources
Jodi Neil – City Clerk/Treasurer of Shelly Lee Pfannmuller – MN Department of
Natural Resources Kelli Poehls - Public Affairs Coordinator,
Fargo Moorhead Chamber of Commerce, Lake Agassiz Water Authority
John Schmalenberg – Coordinator, Polk County
William Schwandt – Moorhead Public Service, Moorhead
Daniel C. Stenseng – Auditor, Clearwater County
Josh Stromlund - Land & Water Planning Director, Lake of the Woods County
Joe Vene – Commissioner, Beltrami County North Dakota Karen Anderson – Commissioner, Sargent
County Vern Bennett - Chairman, Cass County
Board of Commissioners Keith Berndt – Engineer, Cass County Mark Bittner – City of Fargo Doris Bring – County Auditor, Grand Forks
County Tod Dahle, Fargo Police Department John Drees – Grand Forks-Traill Water
District, Lake Agassiz Water Authority
Ronnie Edland – Commissioner, Griggs County
Mylo Einarson – City Administrator, Grafton
Dwayne Erickson – Commissioner, Foster County
Bryant Flaa – Commissioner, Richland County
5 - 24

Red River Valley Water Supply Project FEIS Chapter Five Consultation and Coordination
Hazel Fetters Sletten - Water Treatment Superintendent, Grand Forks Water Treatment Plant
Allen Grasser – City Engineer, Grand Forks William Gorder – Recorder, Walsh County Bruce Grubb – Enterprise Director, Fargo Tina Gustafson – City Auditor, Langdon Marvin Hansen – Commissioner, Dickey
County Ron Hendricksen – Water Superintendent,
Fargo Water Treatment Plan Honorable Mike Brown – Mayor of Grand
Forks Honorable Kenneth Frownfelter – Mayor of
Pettibone Honorable Don Frye - Mayor of Carrington Honorable Bruce Furness – Mayor of Fargo Honorable Timothy Gebeke – Mayor of
Hunter Honorable Eric Grindberg – Mayor of
Mapleton Honorable Robert Haensel – Mayor of
Surrey Honorable Clarence Harter – Mayor of
Napoleon Honorable Kyle Tschosik – Mayor of Wilton Honorable Ward Koeser - Mayor of
Williston Honorable Clarice Liechty – Mayor of
Jamestown Honorable Rich Mattern – Mayor of West
Fargo Honorable Edward McConnell – Mayor of
Casselton Kim Moen – Auditor – City of Harvey Honorable Ardis Olson – Mayor of Drayton Honorable Bonnie Olson – Mayor of
Langdon Honorable Allen Roll – Mayor of Duncan
Center Honorable Riley Rogers – Mayor of Valley
City Honorable Duane Schmitz – Mayor of
Wapheton
Honorable John Seghers – Mayor of Hansboro
Honorable Tom Seifert – Mayor of Christine Joel Halvorson, Traill County Water
Resource Board Marlan Hvinden – Auditor, Mclean County Beth Innis – Auditor, Williams County Barry D. Johnson – West Fargo Shawn Kessel - City Administrator,
Wahpeton Kerwin Kostad – City Auditor, Valley City Arvin Kvasager – Commissioner, Grand
Forks County Rodney Lindstrom - Chairman, Eddy
County Commission Patricia Martin – City Auditor, Hunter Edward McGough –Auditor, Barnes County Gary Nilsson – Commissioner, Pembina
County Donald J. Olafson – Valley City Water
Treatment Plant/Lake Agassiz Water Authority
Leroy Neubauer - Public Works/Water Plant - Valley City
Ed Riplinger – Commissioner, Benson County
Ray Rollness – Commissioner, Cavalier County
John Schmisek – City Auditor, Grand Forks Greg Sund - City Administrator, Dickinson Steve Thorenson - Traill County Water
Resource District Constance Triplett – Commissioner, Grand
Forks County Ben Varnson – Nelson County Water
Resource District Honorable Dennis Walaker – Mayor – City
of Fargo Ralph Walker - MR&I Coordinator,
Standing Rock Water Resource Department
South Dakota Eddie Madsen – Commissioner, Roberts
County
5 - 25

Red River Valley Water Supply Project FEIS Chapter Five Consultation and Coordination
Tribal and First Nation Agencies and Officials
Glenda Baker - Embry, Public Relations, Mandan, Hidatsa, & Arikara Nation
Kathryn Beaulieu - Native American Graves Protection Representative, Red Lake Band of Chippewa
Honorable Rodney M. Bordeaux – Rosebud Sioux Tribe
Honorable Richard Brannan – Chairman – Northern Arapaho Business Council
LaDonna Brave Bull Allard – Tribal Tourism Offic – Standing Rock Sioux Tribe
Honorable Joe Brings Plenty Sr. – Tribal Chairman – Cheyenne River Sioux Tribe
Jeff Cadotte, Sr – Vice Chairman Wakpala District – Standing Rock Reservation
Michael Catches Enemy – Natural Resources Regulatory Agency – Oglala Sioux Tribe
Heidi Cook - Southern Grand Chiefs Organization, Inc.
Elgin Crows Breast – Tribal Historic Preservation Officer, Cultural Preservation Office, Three Affiliated Tribes
Tom David – Water Resources – Turtle Mountain Band of Chippewa
Tyler Godin - Invasive Species Coordinator, Leech Lake Band of Ojibwe
Chris Henderson - Southern Grand Chief, Southern Chiefs Organization
Honorable Joshua Weston - President, Flandreau Santee Sioux Tribe Honorable Robert Cournoyer - Chairman, Yankton Sioux Tribe Honorable Carle Venne – Chairman, Crow
Creek Sioux Tribe Honorable Mathew Pilcher - Chairman,
Winnebago Tribe of Omaha Honorable Steve Cadue - Chairman,
Kickapoo Tribe Honorable Mitchell Parker - Chairman, Omaha Tribe
Honorable Rodney Bordeaux - President, Rosebud Sioux Tribe
Honorable Robert Cournoyer - Chairman, Yankton Sioux Tribe
Honorable Jim Crawford – Chairman, Sisseton-Wahpeton Oyate
Honorable Ken Davis – Chairman, Turtle Mountain Band of Chippewa
Honorable Louis DeRoin - Chairman, Iowa Tribe of Kansas
Honorable Norman Deschampe – President, Minnesota Chippewa Tribe Honorable Julia Doney – President, Fort
Belknap Indian Community (Assiniboine and Gros Ventre)
Honorable John Morales, Jr. – Chairman, Assiniboine & Sioux Tribes of Fort Peck, MT
Glenda Baker Embrey – Public Relations – Mandan-Hidatsa-Arikara Nation
Honorable Joseph Brings Plenty – Chairman, Cheyenne River Sioux Tribe
Martin Gipp – Standing Rock Sioux Tribal Offices
Honorable Marcus D. Wells, Jr. - Chairman, Three Affiliated Tribes
Honorable Ron His Horse Is Thunder – Chairman, Standing Rock Sioux Tribe
Honorable John Houle – Chairman, Chippewa-Cree Tribe
Honorable Richard Brannan - Chairman, Northern Arapaho Business Council
Everett J. Iron Eyes Sr. – Water Administrator – Standing Rock Sioux Tribe
Honorable Michael Jandreau – Chairman, Lower Brule Sioux Tribe
Honorable Floyd Jourdain, Jr. – Chairman, Red Lake Band of Chippewa
Honorable Sandra Keo - Chairwoman, Sac and Fox Nation of Missouri
Gene Laducer – Water Resources- Turtle Mountain Band of Chippewa
Honorable Eugene Little Coyote – President, Northern Cheyenne Tribe
5 - 26

Red River Valley Water Supply Project FEIS Chapter Five Consultation and Coordination
H Texx Lone Bear – MNI Sose Delegate – Fort Berthold Rural Water Director – Three Affiliated Tribes
Honorable John Morales - Chairman, Fort Peck Tribes
Bryon Olson – Tribal Archaeologist – Standing Rock Sioux Tribe
Honorable Zach Pahmahmie - Chairman, Prairie Band of the Potawatami Nation
Honorable Mitchell Parker- Tribal Chairman – Omaha Tribe of Nebraska
Honorable Myra Pearson – Chairwoman, Spirit Lake Dakotah Nation
Honorable Larry Wright, Jr. - Chairman, Ponca Tribe Honorable Ivan Posey - Chairman, Eastern Shoshone Business Council Honorable Matthew Pilcher – Tribal
Chairman – Winnebago Tribe of Omaha
Robert Quiver, Jr. – Water Administrator – Natural Resources Regulatory Agency – Oglala Sioux Tribe
Adrienne Swallow – Environmental Protection Specialist – Standing Rock Sioux Tribe
Janet Thomas – Executive Director – Standing Rock Sioux Tribe
Honorable Patrick Thomas - Chairman, Blackfeet Tribal Business Council
Honorable Lester Thompson, Jr. – Tribal Chairman – Crow Creek Sioux Tribe
Honorable Roger Trudell - Chairman, Santee Sioux Honorable Carl Venne - Tribal Council Chairman, Crow Tribe Honorable Erma Vizenor – Chairwoman,
White Earth Band of Minnesota Chippewa
Honorable John Yellow Bird Steele - President, Oglala Sioux Tribe
Honorable Alvin Windy Boy - Chairman, Rocky Boy Reservation
Franky Jackson – Tribal Historic Preservation Officer, Sisseton Wahpeton Oyate
Jeff Kelly – Game Warden – Standing Rock Sioux Tribe
Steve Kelly - Three Affiliated Tribes Tom McCauley – Tribal Historic
Preservation Officer, White Earth Band of Minnesota Chippewa
Tim Mentz - Tribal Historic Preservation Officer, Standing Rock Sioux Tribe
Chuck Meyer – Department of Natural Resources, Water Resources Program, Red Lake Band of Chippewa
Dawnette Owens – Project Coordinator, Mni Sose Intertribal Water Rights Coalition, SD
Joseph Smith - Department of Water Resources, Standing Rock Sioux Tribe
William Weddell – Delegate/EDA Director, Yankton Sioux Tribe
Honorable Marcus D. Wells Jr. – Chairman – Mandan-Hidatsa-Arikara Nation
Joshua Weston – Tribal Chairman – Flandreau Santee Sioux Tribe
Honorable Larry Wright, Jr. – Tribal Chairman – Ponca Tribe of Nebraska
Roger Yankton, Jr. – Water Resources – Spirit Lake Nation
John Yellow Bird Steele – President – Oglala Sioux Tribe
Organizations and Firms Kelli Ackerland - Wells Fargo Bank LaVonne Althoff - Board Director,
Southeast Water Users District James Anderson - President,
PONDfiltration, Inc. Rachel Asleson – Red River Basin
Commission Don Baasch - President, North Dakota
Wildlife Federation Robert Backman - Executive Director,
Riverkeepers Marvin Baker - Minot Daily News Philip Baker - Shenk, Holland & Knight
LLP
5 - 27

Red River Valley Water Supply Project FEIS Chapter Five Consultation and Coordination
Theodora Bird Bear - New Town Newspaper
John Beckstrand – Chairman, Benson County Water Resources District
Gordon Blixt - Board Director, Cass Rural Water District
Brian Borkholder – Minnesota Chapter, American Fisheries Society
Gene Boyle - President, Riverkeepers Steve Burian - Advanced Engineering and
Environmental Services, Inc. Judel Buls – Lake Agassiz Water Authority Ray Christensen - Southwest Water
Authority Mr. Clark F. Cronquist - President, Agassiz
Water Users District David Conrad – National Wildlife
Federation Edwin T. Cryer – Montgomery Watson Rich Day – National Wildlife Federation Damon Devillers – Interstate Engineering Shawn McKenna – North Dakota Wildlife
Federation Mike Dwyer – North Dakota Water Users
Association Brenda Elmer – Lake Agassiz Water
Authority Yvonne Erickson - President, Minnesota
Agri-Women Thomas Fischer - Chairman, Southeast Cass
Water Resource District Bradley Forester – American Ductile Iron
Pipe Company Dr. William G. Franzin – North Central
Division, American Fisheries Society Donald Flynn - President, North Dakota
Rural Water Systems Association Richard Fugleberg – Chairman & Director,
Garrison Diversion Conservancy District
Rick St. Germain - Houston Engineering, ND
Thomas P. Graves - Executive Director, Mid-West Electric Consumers Association
Eldon Greenberg – Garvey Schubert Barer
Norman Haak – Director, Garrison Diversion Conservancy District
John Hallberg - Institute for Regional Studies, NDSU Libraries
Lee W. Hanson - Gray, Plant, Mooty Law Sandy Hansen - Editor, Valley City Times-
Record Stan Hanson – Bonestroo, Williamson, &
Kotsmith Mike Hirst - Lake of the Woods Soil &
Water Conservation District William Hardy – Chairman, Cavalier
County Water Resources District Jane Butler-Hoaglund - Home Instead
Senior Care Mike Holper - Vice President, KLN
Enterprises John Jaschke – Executive Director – MN
Board of Water and Soil Resources David C. Johnson - HDR Engineering, Inc. David Johnson – Director – Garrison
Diversion Conservancy District Mark Johnson - Vice Chairman, Cass Rural
Water District Roger Johnson - Director, Garrison
Diversion Conservancy District Richard Josephs – Geology & Geological
Engineering – University of North Dakota
Morris Kay – Mo-Ark Christopher Kinn – Terranext Bobby Koepplin - Chairperson, Sheyenne
River Valley National Scenic Byway Dave Koland – Director – Garrison
Diversion Conservancy District Melody Kruckenberg – North Dakota Rural
Water Systems Association Anthony Lambert - Sister Rosalind Gefre
Wellness Steve Langlie - Chairperson, Dead Lake
Township Bruce Langness – Ulteig Engineers Inc. John Leininger, Garrison Diversion
Conservancy District Matthew Leiseth - Hornbacher’s Foods
5 - 28

Red River Valley Water Supply Project FEIS Chapter Five Consultation and Coordination
Jim Linnertz – North Dakota Wildlife Federation
Betsy Loyless – Executive VP for Public Policy - Audubon
Gerald H. Maertens - Issues Chairman, Mississippi Headwaters Audubon Society
Clark Markell - Geoscience Department, Minot State University
Shawn McKenna - North Dakota Wildlife Foundation
Steve Metzger – Director, Garrison Diversion Conservancy District, ND
Ken Midkiff – Chair - Missouri Chapter Sierra Club
Art Mielke – North Dakota Wildlife Federation
Debi Moltzan - Clerk, Hobart Township Board
Bruce Morrison – Great Rivers Environmental Law Center
Loren Myran - Chairman, Southwest Water Authority
The Nature Conservancy Lloyd Nelson - Clerk, Pelican Township Mark Nerland – River Keepers Darren Newville - District Manager, East
Otter Tail Soil & Water Conservation District
Tami Norgard - Vogel Law Firm Lee H. Odell - PE, Client Service Manager,
Drinking Water Service Team Dave Olson – Fargo Forum Maurice Orn - Director, Garrison Diversion
Conservancy District Leon Osborne – Meridian Environmental
Technology, Inc. Thelma Paulson – Peterson Coulee Outlet
Association Gary Pearson – National Wildlife
Federation, ND Scott Peterson – North Dakota Chapter,
Wildlife Society Mike Polovitz - Director, Garrison
Diversion Conservancy District
Henry Robertson – Great River Environmental Law Center
Ken Royse – Bartlett & West Engineers Karl Rosvold – Cargill, Inc. Jeffrey Ruch - Executive Director, Public
Employees for Environmental Responsibility
Norman Rudel – Director – Garrison Diversion Conservancy District
Allyn J. Sapa - President-elect, North Dakota Chapter Wildlife Society
Sierra Club Tom Scherer – NDSU Extension Services Dave Schulenberg – Systems Manager
Ewald Consulting Todd Sellers - Executive Director, Lake of
the Woods Water Sustainability Foundation
Warren Seykora – Wild Rice Watershed District
Haden B. Shipman - Owner, Antonsen Well Drilling, Inc.
Connie Sprynczynatyk - North Dakota League of Cities
Robin Stahl - Microsoft Roger Still - Audubon Missouri Deon Stockert, P.E. – AE2S Charlie Sullivan – Price Brothers Company Paul Suomala – The International Coalition Diane Tate - Program Manager, CDR
Associates Klaus Thiessen - President & CEO, Grand
Forks Region Economic Development Corporation
Genevieve Thompson – Executive Director, Audubon Dakota Chapter
Kari Tomperi - Wadena Soil & Water Conservation District
Anton Treuer - Ojibwe Language Program, Bemidji State University
Bill Van Derveer – MWH Americas Inc Henry VanOffelen - Minnesota Center for
Environmental Advocacy Ben Varnson - Nelson County Water
Resource District
5 - 29

Red River Valley Water Supply Project FEIS Chapter Five Consultation and Coordination
Ken Vein - Director, Garrison Diversion Conservancy District
Henry David Venema, PhD - Director, Sustainable Natural Resource Management
Jeffrey Volk – Moore Engineering, Inc. Fred Wagner – Beveridge & Diamond PC Jean Walton - Executive Director, North
Dakota Water Coalition Nate Weisenburger – Advanced Engineering
and Environmental Services, Inc. Nicholas J. West – Kadrmas Lee & Jackson
Inc Dale Wetzel - The Associated Press Mike Whittington – National Wildlife
Federation Thomas Wilmoth - Fennemore Craig Gerry Wilson - Executive Director, Lake of
the Woods District Property Owners Association
Lance Yohe – Program Manager, Red River Basin Commission
Individuals David E. Antonsen Jeanette Bailey B. Bartling Arthur W. Baron Joletta Bird Bear Arne Berg Richard Betting Mark and Luann Brodshaug George & Lorraine Bultema Joletta Bird Bear Steve Clark A. Comstock Cheryl Kennedy Courcelles Steve Davies Robert Deutschman Calvin & Nancy Dockter Michele Doyle Blaine and Carla Engelstad Helma Cloud Erle Ed Finger Carl Fischer Tom Fischer Patrick Fish
Glenda G. Gausen David George Dave Gera Leland Grim Jake Gust Honorable William L. Guy Tessa Haagenson David Hagen Eileen A. Hannig Dean Hildebrand Allen Holtberg Charles W. Huver, PhD James H. Jacobson Paul Janke Jolee Johnson Bernice Juarez Kevin Keil Adam Kennedy Amy Klobuchar Jame Kloeckner Brad Koetz Ron Kucera Jim Lee Trish Lewis Clarice Liechty Margaret Lowe Herbert Lubitz Carroll Lunos Alan Maki Robert V. Marthaller Arden Mathison Treva Mayfield Arthur Maynard Marianne Mazzola Richard McCabe Jim Merchant Jeff McElwain Yvonne McHam James McLaughlin Wayne & Donna Milota Penny Mio Ted Molkenbur Mike Morris Greg Murphy Miles & Patricia Nelson Gene Nygaard
5 - 30

Red River Valley Water Supply Project FEIS Chapter Five Consultation and Coordination
Robert V. Oleson Annie Olson Harold J. One Feather Garry Opp Russ Palubicki Dale Peppel Maynard Pick Terry Przycilla Rick Quirk Gene Rau John J. Riemer Leslie Rogne Kevin Roller Arnold & Jean Rosen Vicki Voldal Rosenau Marianne Rude Milton Sauer Vance & Arlene Sherman Robert Shimek Judy Smith Donald Sondrol William Spychalla Neil Stessman Uel Stevenson Lois Stoutenburg Timothy & Terryll Sullivan Gary Thompson Robert Thompson Kyle Tschosik Myrna Tveter James D. Vaughn Vicki Voldal Rosenau Patrick G. Welle, PhD Jodie White Loren White Horace Whitman Jeff Wiebe Grant L. Wilson Doug Yoder W. F. Yungbauer
Canadian Agencies, Officials, Organizations, Individuals, and Libraries Peter M. Boehm - Assistant Deputy
Minister, Department of Foreign Affairs
Doug Bogaski - Water & Waste Department, City of Winnipeg
Gregg Campbell - Environment Canada Brian Charles Conservation and Environmental Library,
Winnipeg Lindy Clubb Wayne Dybvig – Executive Director,
Transboundary Waters Unit, Environment Canada
Gaile Whelan Enns - Director, Manitoba Wildlands
Paul Goossen – Canadian Wildlife Service Fred Hall – Kenora District Manager,
Ontario Ministry of Natural Resources Robert Halliday – R. Halliday and
Associates Melissa Hotain – Environmental Policy
Analyst, Assembly of Manitoba Chiefs Susan Howatt – Water Campaigner, Council
of Canadians Kenora Branch Library, Kenora Glen Koroluk - Coordinator, Water Caucus,
Manitoba Eco-Network Herm Martins – Reeve, Rural Municipality
of Morris, Manitoba Robert Matthews, Manitoba Water
Stewardship Rachel Melzer - Policy and Decision
Analyst, Environmental Commissioner of Ontario
Millennium Library, Winnipeg Sarah Miller - Water Policy Researcher,
Canadian Environmental Law Association
Don Norquay – Assistant Deputy Minister of Transportation, Manitoba
Tobias Nussbaum – Director - Foreign Affairs and International Trade Canada
Bill Paulishyn – Councilor, Rural Municipality of Springfield, Manitoba
5 - 31

Red River Valley Water Supply Project FEIS Chapter Five Consultation and Coordination
Robert Pengelly - Consulate General of Canada, Minneapolis
Alexandra Paul - Reporter, Winnepeg Free Press
Jim Petsnik Frank Quinn - Policy Advisor, Canadian
Government Sam Schellenberg David Schindler - Department of Biological
Sciences, University of Alberta Adam Scott – Rainy River Watershed
Program Mike Shkolny – Manager of Engineering,
Winnipeg, Manitoba Muriel Smith – Director, Manitoba
Provincial, Red River Basin Commission
Jim Smithson – Water Branch, Manitoba Water Stewardship
Rick Walden – Executive Engineer, Lake of the Woods Control Board
Larry Whitney Joel Wessman - Political & Economic
Affairs Officer, Consulate General of Canada
Dwight Williamson – Director, Water Science and Management Branch, Manitoba Water Stewardship
Kevin J. Wilson - Assistant Deputy Minister, Ministry of Natural Resources, Canada
Dennis Wright – Department of Fisheries and Oceans, Winnipeg, Manitoba
Libraries Iowa Des Moines Public Library, Des Moines
Kansas Topeka and Shawnee County Public
Library, Topeka
Minnesota Breckenridge Public Library, Breckenridge East Grand Forks Public Library, East
Grand Forks Moorhead Public Library, Moorhead Perham Area Public Library, Perham Red Lake Band of Chippewa Indians
St. Paul Public Library, St. Paul Warroad City Library, Warroad
White Earth Reservation
Missouri Kansas City Public Library, Kansas City Missouri River Regional Library, Jefferson
City
Montana Bureau of Reclamation, Great Plain
Regional Office, Billings, Montana
Nebraska Lincoln City Libraries, Lincoln
North Dakota Alfred Dickey Public Library, Jamestown Bureau of Indian Affairs, Turtle Mountain
Agency, Bellecourt, North Dakota Bureau of Indian Affairs, Fort Berthold
Agency, New Town, North Dakota Bureau of Indian Affairs, Fort Totten
Agency, Fort Totten, North Dakota Bureau of Reclamation, Dakotas Area
Office, Bismarck, North Dakota Fargo Public Library, Fargo Garrison Diversion Conservancy District,
Carrington, North Dakota Grand Forks Public Library, Grand Forks Leach Public Library, Wahpeton North Dakota State Library, Bismarck North Dakota State University Library,
Fargo Standing Rock Administrative Service
Center, Fort Yates, North Dakota West Fargo Public Library, West Fargo
South Dakota Bureau of Indian Affairs, Sisseton and
Agency, South Dakota South Dakota State Library, Pierre
5 - 32

Red River Valley Water Supply Project FEIS Chapter Five Consultation and Coordination
Province of Manitoba MillenniumLibrary, Winnipeg, Manitoba, Canada Province of Ontario Kenora Branch Library, Kenora, Ontario, Canada
5 - 33

Red River Valley Water Supply Project SDEIS
Literature Cited Aadland, L.P., T.M. Koel, W.G. Franzin, K. W. Stewart, and P. Nelson. In Press. “Changes in Fish Assemblage Structure of the Red River of the North.” In, Historical Changes in Large River Fish Assemblages of the Americas. American Fisheries Society, Bethesda, Maryland.
Advanced Engineering and Environmental Service, Inc. 2005a. Fargo Moorhead Water Supply and Treatment Integration Concept Plan. Grand Forks, North Dakota.
Advanced Engineering and Environmental Service, Inc. 2005b. Greater Grand Forks Water Supply and Treatment Concepts. Grand Forks, North Dakota.
Advanced Engineering and Environmental Service, Inc. 2006. 2006 North Central Utility Rate Survey. Grand Forks, North Dakota.
Agresti, A. 2002. Categorical Analysis, Second Edition. John Wiley & Sons, Inc., New York.
Agthe, Donald E. and R. Bruce Billings. 1980. “Dynamic Models of Residential Water Demand,” Water Resources Research, Volume 16(3).
Agthe, Donald E., R. Bruce Billings, John L. Dobra, Kambiz Raffiee. 1986. “A Simultaneous Equation Demand Model for Block Rates,” Water Resources Research, Volume 22(1).
Aiken, S.G., P.R. Newroth and I. Wile. 1979. “The Biology of Canadian Weeds Myriophyllum spicatum L.” Canadian Journal of Plant Science 59:201-215.
Amend, D. F., W. T. Yasutake, and R.W. Mead. 1969. “A Hematopoietic Virus Disease of Rainbow Trout and Sockeye Salmon.” Transactions of the American Fisheries Society 98:796804.
American Water Works Service Company, Inc. 2002. Deteriorating buried infrastructure management challenges and strategies. Prepared for EPA by American Water Works Service Co., Inc. Denver, Colorado.
American Water Works Association. 2004. 2004 Water and Wastewater Rate Survey. Denver, CO.
Anderson, B. W., A. Higgins, and R. D. Ohmart. 1977. Avian Use of Saltcedar Communities in the Lower Colorado River Valley.’ USDA-Forest Service, General Technical Report RM43:128-136.
Anderson, R. O. 1992. “A Case for Zander: Fish for the Future?” 1992. In, The In-Fisherman Walleye Guide. Brainerd, Minnesota.
Anonymous. 1987. “Zander Program Setback.” Dakota Country, July 1987.
LC - 1

Red River Valley Water Supply Project SDEIS
APLIC (The Edison Electric Institute’s Avian Power Line Interaction Committee). 1994. Mitigating Bird Collisions With Power Lines: The State of the Art in 1994. Edison Electric Institute. Online: http://www.aplic.org/
APLIC. 1996. Suggested Practices for Raptor Protection on Power Lines: The State of the Art in 1996. Edison Electric Institute. Online: http://www.aplic.org/
APLIC. 2005. Avian Protection Plan Guidelines. Edison Electric Institute. Online: http://www.aplic.org/
APLIC. 2006. Avian Protection Plan Guidelines. PIER Final Project Report CEC-50020060022. Edison Electric Institute. Online: http://www.aplic.org/
Armstrong, Clarence Allen. 1982. “Ground-Water Resources of Ransom and Sargent Counties, North Dakota.” North Dakota State Water Conservation Commission County Ground-Water Studies 31 – Part III. North Dakota Geological Survey Bulletin 69(3). Prepared by the U.S. Geological Survey in cooperation with the North Dakota State Water Commission, North Dakota Geological Survey, Ransom County Water Management District, and Sargent County Water Management District. North Dakota Geological Survey, Bismarck.
Ashton, P.J. and D.S. Mitchell. 1989. “Aquatic plants: Patterns and Modes of Invasion, Attributes of Invading Species and Assessment of Control Programmes.” In: Drake, J.A., H.A. Mooney, F. diCastri, R.H. Groves, F.J. Kruger, M. Rejmánek, and M. Williamson, editors. Biological Invasions: A Global Perspective. John Wiley & Sons, Ltd., New York.
Associated Press. 2005. “ND: Devils Lake Outlet May Shut Down Rest of Year.” Grand Forks Herald. September 14.
Auble, Gregor T., J. M. Friedman, and M. L. Scott. 1994. Relating Riparian Vegetation to Present and Future Streamflows. Ecological Applications 4(3):544-554.
Austin, Jane E. 1998. Highlight Box: “Waterfowl in the Prairie Pothole Region.” In: M. J. Mac, P. A. Opler, C. E. Puckett Haecker, and P. D. Doran, editors. Status and Trends of the Nation's Biological Resources, Vol. 2. Jamestown, North Dakota. Northern Prairie Wildlife Research Center Online. Online: http://www.npwrc.usgs.gov/resource/2000/grlands/grlands.htm (Version 21Jan00).
Bain, M. B. 1993. “Assessing Impacts of Introduced Aquatic Species: Grass Carp in Large Systems.” Environmental Management 17(2):211-224.
Baker, Claud H, Jr. and Q. F. Paulson. 1967. “Geology and Ground Water Resources, Richland County, North Dakota.” North Dakota Geological Survey Bulletin 46. North Dakota State Water Commission County Ground Water Studies 7. Prepared by the U.S. Geological Survey in cooperation with the North Dakota Geological Survey, North Dakota State Water Commission, and Richland County Board of Commissioners. North Dakota Geological Survey and North Dakota State Water Commission, Bismarck.
LC - 2

Red River Valley Water Supply Project SDEIS
Bangsund, D.A., and F. L. Leistritz. 2004. Industrial Water Needs Assessment for the Red River Valley Water Supply Project. Final Contract Report. Prepared for Garrison Diversion Conservancy District, Carrington, North Dakota. Department of Agribusiness and Applied Economics, North Dakota State University, Fargo.
Baron, J.S., N. L. Poff, P. L. Angermeier, C. N. Dahm, P. H. Gleick, N. G. Hairston, R. B. Jackson, C. A. Johnston, B. D. Richter and A. D. Steinman. 2002. Meeting Ecological and Societal Needs for Freshwater. Ecological Applications 12(5):1247-1260.
Barr Engineering Company. 1999. Devils Lake Outlet/Baldhill Pool Raise – Independent Analysis of Effects of the Planned Operation of the Devils Lake Outlet and Baldhill Pool Raise Projects on Groundwater Levels in the Sheyenne Delta. U.S. Army Corps of Engineers, St. Paul District, St. Paul, Minnesota.
Barr Engineering Company. 2002. Devils Lake Outlet – Analysis of Effects of the Planned Operation of the Devils Lake Outlet on Groundwater Levels Along the Sheyenne River (Draft Report). U.S. Army Corps of Engineers, St. Paul District, St. Paul, Minnesota.
Baxter, G. T., and J. R. Simon. 1970. Wyoming Fishes. Wyoming Game and Fish Department Bulletin 4, Cheyenne, Wyoming.
Becker, G. C. 1983. Fishes of Wisconsin. University of Wisconsin Press, Madison, Wisconsin.
Belanger, S.E., J.L. Farris, D.S. Cherry, and J. Cairns, Jr. 1985. “Sediment Preference of the Freshwater Asiatic Clam, Corbicula fluminea.” The Nautilus 99(2-3):66-73.
Belosevic, M., S. A. Craik, J. L. Stafford, N. F. Neumann, J. Kruithof, and D. W. Smith. 2001. “Studies on the Resistance/Reactivation of Giardia Muris Cysts and Cryptosporidium Parvum Oocysts Exposed to Medium-Pressure Ultraviolet Radiation.” FEMS Microbiology Letters 204 (1):197. Online: http://www.blackwell-synergy.com/doi/abs/10.1111/ j.15746968.2001.tb10885.x?prevSearch=allfield%3A%28Studies+on+the+resistance%2Freactivation+of+Giardia% 29
Billings, R. B. and W. Mark Day. 1989. “Demand Management Factors in Residential Water Use: The Southern Arizona Experience,” Journal of the American Water Works Association, Vol. 81, No. 3.
Blalock, H.N., and J.J. Herod. 1999. “A Comparative Study of Stream Habitat and Substrate Utilized by Corbicula fluminea in the New River, Florida.” Florida Scientist 62:145-151.
Boe, J. 1992. A Survey for Breeding Horned Grebes in Minnesota. Final Report submitted to the Nongame Wildlife Program of the Minnesota Department of Natural Resources.
Bootland, L.M. and J.C. Leong. 1999. “Infectious Haematopoietic Necrosos Virus.” In: Fish Diseases and Disorders, Viral, Bacterial, and Fungal Infections Vol 3. P.T.K Woo and D.W. Bruno, editors. CABI Publishing, Oxfordshire, United Kingdom.
LC - 3

Red River Valley Water Supply Project SDEIS
Bouc, K. 1987. “The Fish Book.” Nebraskaland Magazine 65(1):1-130.
Bourne, Alexandra, Nicole Armstrong, and Geoff Jones. 2002. A Preliminary Estimate of Total Nitrogen and Total Phosphorus Loading to Streams in Manitoba, Canada. Manitoba Conservation Report No. 2002-04.
Bovee, K.D. 1982. A Guide to Sstream Habitat Analysis Using the Instream Flow Incremental Methodology. Instream Flow Information Paper No. 12. U.S. Fish and Wildlife Service. FWS/OBS-82/26. 248 pp.
Bukhari, Z., T. M. Hargy, J. R. Bolton, B. Dussert, J. L. Clancy. 1999. “Medium-Pressure UV for Oocyst Inactivation.” Journal of the American Water Works Association 91(3):86-94. Online: http://bases.bireme.br/cgi-bin/wxislind.exe/iah/online/ ?IsisScript=iah/iah.xis&nextAction=lnk&base=REPIDISCA&lang=p&format=detailed.pft&indexSearch =ID&exprSearch=77901 (Accessed: 11Aug06
Braker, N. 1985. Felton Prairie. Report Submitted to the Nature Conservancy and the Minnesota Department of Natural Resources, Natural Heritage Program.
Bratager, M., W. Crowell, S. Enger., G. Montz, D. Perleberg, W.J. Rendell, L. Skinner, C.H. Welling, and D. Wright. 1996. “Harmful Exotic Species of Aquatic Plants and Wild Animals in Minnesota.” Annual Report. Minnesota Department of Natural Resources, St. Paul, Minnesota.
Brooks, B. 1988. “The Breeding Distribution, Population dynamics, and Habitat Availability andSuitability of an Upper Midwest Loggerhead Shrike Population.” Master of Science Thesis, University of Wisconsin.
Brotherson, J.D. and V. Winkel. 1986. “Habitat Relationships of Saltcedar (Tamarix ramosissima) in Central Utah.” Great Basin Naturalist 46:535-541.
Bullock, G. L., H. M. Stuckey, and E. B. Shotts, Jr. 1977. “Early records of North American and Australian Outbreaks of Enteric Redmouth Disease.” Fish Health News 6(2):96-97.
Bur, M.T., D.M. Klarer, and K.A. Krieger. 1986. “First records of a European cladoceran, Bythotrephes cederstroemi, in Lakes Erie and Huron.” Journal of Great Lakes Research 12:144146.
Burch, B.L. 1978. “Asian clam, Corbicula threatens Hawaii.” The Nautilus 92(1):54-55.
Burns, J. W. 1966. “Threadfin Shad”. In: Inland Fisheries Management:481-488. A. Calhoun, editor. California Department of Fish and Game.
Burr, B. M., and R. L. Mayden. 1980. “Dispersal of Rainbow Smelt, Osmerus mordax, into the Upper Mississippi River (Pisces:Osmeridae).” American Midland Naturalist 104(1):198-201.
LC - 4

Red River Valley Water Supply Project SDEIS
Busch, R. A. 1983. Enteric Redmouth Disease (Yersiniaruckeri). In: Antigens of Fish Pathogens:201-222, D. P. Anderson, M. Dorson, and Ph. Dubourget, editors. Collection Fondation Marcel Merieux, Lyon, France.
Busch, R. A., and A. J. Lingg. 1975. “Establishment of an Asymptomatic Carrier State Infection of Enteric Redmouth Disease in Rainbow Trout (Salmo gairdneri).” Journal of Fish. Resources Board 32:2429-2433.
California Urban Water Agencies. 1991. “Cost of Industrial Water Shortages,” prepared by Spectrum Economics, Inc., San Francisco, California.
Campbell, F, and P. Kreisch. 2003. Invasive Species Pathway Team: Final Report. National Invasive Species Council, Washington, D.C.
Campbell, K.B., A.J. Derksen, R.A. Remnant, and K.W. Stewart. 1991. “First Specimens of the Rainbow Smelt, Osmerus mordax, from Lake Winnipeg, Manitoba.” Canadian Field-Naturalist 105:568-570.
Canby, William C., Jr. 1991. American Indian Law In A Nutshell. West Publishing Company, St. Paul. Minnesota.
Cantwell, R., R.C. Andrews, R. Hofmann, M. VanderMarque. 2005. “UV Disinfection of Indigenous Coliforms and Aerobic Spores in Unfiltered Surface Water.” Department of Civil Engineering, University of Toronto. http://www.civ.toronto.edu/water/Research/abstracts/Ray%20Cantwell%20WQTC%20abstracts.pdf (Last accessed: 21Aug06)
Carman, J. G. and J. D. Brotherson. 1982. “Comparisons of Sites Infested and Not Infested With Saltcedar (Tamarix ramosissima) and Russian Olive (Eleagnus angustifolia).” Weed Science 30:360-364.
Carter V. 2005. “Wetland Hydrology, Water Quality, and Associated Functions.” Online: http://water.usgs.gov/nwsum/WSP2425/hydrology.html (Last Accessed 4Aug05).
Census of Agriculture. 2002. United States Department of Agriculture – National Agriculture Statistics Service. Online: http://www.nass.usda.gov/Census_of_Agriculture/index.asp (Last Accessed Dec005).
Chadde, S. and G. Kudray. 2003. Conservation Assessment for Pale Moonwort (Botrychium pallidum). USDA, Forest Service, Reg. 9. 43-54A7-0-0036.
Chilton, E. W., and M. I. Muoneke. 1992. Biology and Management of Grass Carp (Ctenopharyngodon idella, Cyprinidae) for Vegetation Control: a North American Perspective. Reviews in Fish Biology and Fisheries 2:283-320.
Chiou, P.P.. 1996. “A Molecular Study of Viral Proteins in the Pathogenesis of IHNV.” (PhD dissertation), Department of Microbiology, Oregon State University, Corvallis, Oregon.
LC - 5

Red River Valley Water Supply Project SDEIS
Christie, W. J. 1974. “Changes in the Fish Species Composition of the Great Lakes.” Journal of the Fisheries Research Board of Canada 31:827-854.
Christensen, J. and Linden, K. G. 2003. “How Particles Affect UV Light in the UV Disinfection of Unfiltered Drinking Water.” Journal of the American Water Works Association 95(4):179189. Online: http://bases.bireme.br/cgi-bin/wxislind.exe/iah/online/ ?IsisScript=iah/iah.xis&nextAction=lnk&base=REPIDISCA&lang=p&format=detailed.pft&indexSearch =ID&exprSearch=142996 (Last Accessed 9Aug06)
Church, M. 2002. Geomorphic Thresholds in Riverine Landscapes. Freshwater Biology 47:541-557.
Clancy, J. L., T. M. Hargy, M. M. Marshall, and J. Dyksen. 1998. “Inactivation of Oöcysts of Cryptosporidium Parvum in Water Using Ultraviolet Light.” Journal of American Water Works Association 90:92-102.
Clancy. J. L., Z. Bukhari, T. M. Hargy, J. R. Bolton, B. W. Dussert, and M. M. Marshall. 2000. Using UV to Inactivate Cryptosporidium. Journal of American Water Works Association 92:97-104.
Clench, W.J. 1970. “Corbicula manilensis (Philippi) in Lower Florida”. Nautilus 84(1):36-37.
Coffin, B. and L. A. Pfannmuller, editors. 1988. Minnesota’s Endangered Flora and Fauna. University of Minnesota Press, Minneapolis.
Conn, D. B., and D. A. Conn. 1993. “Parasitism, Predation, and Other Associations Between Dreissenid Mussels and Other Native Animals in the St. Lawrence River.” Proceedings: Third International Zebra Mussels Conference, 1993. Electric Power Research Institute:2-25 - 2-34.
COSEWIC (Committee on the Status of Endangered Wildlife in Canada). 2002. COSEWIC Assessment and Status Report on the Lake Winnipeg Physa, Physa sp. in Canada. Committee on the Status of Endangered Wildlife in Canada, Ottawa.
Corps. 1982. General Reevaluation and Environmental Impact Statement for Flood Control and Related Purposes on the Sheyenne River, North Dakota. U.S. Army Corps of Engineers, St. Paul District.
Corps. 1997. Lake Ashtabula, Baldhill Dam Master Plan. U.S. Army Corps of Engineers, St. Paul District.
Corps. 2000. Fast Facts Data Based on 1999 Recreation Year Collected in 2000. U.S. Army Corps of Engineers. Value to the Nation Website. Online: www.CorpsResults.us.
Corps. 2003a. Final Integrated Planning Report/Environmental Impact Statement. Devils Lake, North Dakota Study. U.S. Army Corps of Engineers, St. Paul District.
LC - 6

Red River Valley Water Supply Project SDEIS
Corps. 2003b. “Ashtabula Lake / Baldhill Dam”. U.S. Army Corps of Engineers, St. Paul District. http://www.mvp.usace.army.mil/docs/rec/ashtabula.pdf (Last Accessed 22Jan07)
Corps. 2004a. Missouri River Basin Mainstem Reservoir System Master Water Control Manual Review and Update, Final Environmental Impact Statement. U.S. Army Corps of Engineers, Reservoir Control Center, Northwest Division-Missouri River Basin. Omaha, Nebraska.
Corps. 2004b. Missouri River Basin Mainstem Reservoir System Master Water Control Manual. U.S. Army Corps of Engineers, Reservoir Control Center, Northwest Division-Missouri River Basin, Omaha, Nebraska.
Corps. 2005a. “Draft Revised Water Control Manual, Baldhill Dam and Lake Ashtabula, Sheyenne River - Water Supply and Flood Control.” U.S. Army Corps of Engineers, St. Paul District St. Paul, Minnesota.
Corps. 2005b. “Red River Valley Water Supply Project Effects of Alternatives Depleting Water from the Missouri River on Missouri River Uses and Resources.” U.S. Army Corps of Engineers, Missouri River Water Management Division, Northwest Division.Omaha, Nebraska.
Corps. 2006. “Red River Valley Water Supply Project Analysis of Missouri River Effects.” U.S. Army Corps of Engineers, Missouri River Water Management Division, Northwest Division, Omaha, Nebraska.
Couch, R., and E. Nelson. 1985. “Myriophyllum spicatum in North America.” In: Proceedings of First International Symposium Watermilfoil and Related Haloragaceae Species:8-18, L.W.J. Anderson, editor. Aquatic Plant Management Society, Vicksburg, Mississippi.
Council on Environmental Quality. 1993. Incorporating Biodiversity Considerations Into Environmental Impact Analysis Under the National Environmental Policy Act. Council on Environmental Quality, Washington, D.C.
Counts, C. L., III. 1986. The Zoogeography and History of the Invasion of the United States by Corbicula fluminea (Bivalvia: Corbiculidae). American Malacological Bulletin, Special Edition No. 2:7-39.
Courtenay, W.R. Jr., D.A. Hensley, J.N. Taylor and J.A. McCann. 1984. Distribution of Exotic Fishes in the Continental United States. In: Distribution, biology and Management of Exotic Fishes, W.R. Courtenay, Jr. and J.R. Stauffer, Jr., editors.. Johns Hopkins University Press, Baltimore, Maryland.
Courtenay, W.R. 1997. “Nonindigenous Fishes.” In, Strangers in Paradise, Simberloff, D., Schmitz, D.C., Brown, T.C., editors. Island Press, Washington, D.C.
Cowardin, L.M., V. Carter, F.C. Golet, and E. T. LaRoe. 1979. Classification of Wetlands and Deepwater Habitats of the United States. U.S. Fish and Wildlife Service. FWS/OBS-79/31. Washington, D.C.
LC - 7

Red River Valley Water Supply Project SDEIS
Craik, S.A., K. Amoah, D.W. Smith, and M. Belosevic. 2002. “The Impact of Turbidity on Cryptosporidium and Giardia Inactivation by Ultraviolet Light.” Proceedings of the American Water Works Association Water Quality Technology Conference, November 10-14, 2002, Seattle.
Cross, F. B., R. L. Mayden, and J. D. Stewart. 1986. “Fishes in the Western Mississippi Drainage.” In: The Zoogeography of North American Freshwater Fishes, C. H. Hocutt, and E. O. Wiley, editors. John Wiley and Sons, New York, New York.
Cvancara, A.M. 1983. “Aquatic Mussels of North Dakota.” North Dakota Geological Survey Report Number 78.
Cvancara, A.M. and P.G. Freeman. 1975. “Species Diversity and Distribution of Mussels (Bivalvia:Unionacea) in Lake Ashtabula, Southeastern North Dakota.” North Dakota Academy of Science Abstracts 29:5.
Deb, A.K., Y.J. Hasit, and F.M. Grablutz. 1995. Distribution System Performance Evaluation. American Water Works Association Research Foundation. AWWA Research Foundation and AWWA, Denver, Colorado.
Dechant, J. A. 2001. Range Expansion of the Pileated Woodpecker in North Dakota. Prairie Naturalist 33(3):163-182. Northern Prairie Wildlife Research Center, Jamestown, North Dakota: Online: http://www.npwrc.usgs.gov/resource/birds/pwprange/pwprange.htm (Version 12Aug04).
Dechant, J. A., L. D. Igl, and F. Vanhove. In Preparation. First Nest Records of Henslow's Sparrow in North Dakota. Prairie Naturalist.
Dechant, J. A., M. L. Sondreal, D. H. Johnson, L. D. Igl, C. M. Goldade, M. P. Nenneman, and B. R. Euliss. 2003a. Effects of Management Practices on Grassland Birds: Baird's Sparrow. Northern Prairie Wildlife Research Center, Jamestown, North Dakota. Northern Prairie Wildlife Research Center. Online: http://www.npwrc.usgs.gov/resource/literatr/grasbird/bais/bais.htm (Version 12Aug04).
Dechant, J. A., M. L. Sondreal, D. H. Johnson, L. D. Igl, C. M. Goldade, M. P. Nenneman, and B. R. Euliss. 2003b. Effects of Management Practices on Grassland Birds: Sprague's Pipit. Northern Prairie Wildlife Research Center, Jamestown, North Dakota. Northern Prairie Wildlife Research Center. Online: http://www.npwrc.usgs.gov/resource/literatr/grasbird/sppi/sppi.htm (Version 28May04).
Dechant, J. A., M. L. Sondreal, D. H. Johnson, L. D. Igl, C. M. Goldade, M. P. Nenneman, and B. R. Euliss. 2003c. “Effects of Management Practices on Grassland Birds: Chestnut-Collared Longspur.” Northern Prairie Wildlife Research Center, Jamestown, North Dakota. Online: http://www.npwrc.usgs.gov/resource/literatr/grasbird/cclo/cclo.htm (Version 28May04).
LC - 8
Red River Valley Water Supply Project SDEIS
Dechant, J. A., D. H. Johnson, L. D. Igl, C. M. Goldade, A. L. Zimmerman, and B. R. Euliss. 2003d. Effects of management practices on grassland birds: “Wilson's Phalarope.” Northern Prairie Wildlife Research Center, Jamestown, North Dakota. Online: http://www.npwrc.usgs.gov/resource/literatr/grasbird/wiph/wiph.htm (Version 12DDec03).
Dechant, J. A., M. L. Sondreal, D. H. Johnson, L. D. Igl, C. M. Goldade, P. A. Rabie, and B. R. Euliss. 2003e. Effects of Management Practices on Grassland Birds: “Burrowing Owl.” Northern Prairie Wildlife Research Center, Jamestown, North Dakota. Online: http://www.npwrc.usgs.gov/resource/literatr/grasbird/buow/buow.htm (Version 12Aug04).
Deubbert, H.F. 1981. “Breeding Birds on Waterfowl Production Areas in Northeastern North Dakota.” Prairie Naturalist 13(1):19-22.
Devick, W. S. 1991. “Patterns of Introductions of Aquatic Organisms to Hawaiian Freshwater Habitats”. In, New Directions in Research, Management and Conservation of Hawaiian Freshwater Stream Ecosystem. Proceedings, Freshwater Stream Biology and Fisheries Management Symposium:189-213. Department of Land and Natural Resources, Division of Aquatic Resources, Honolulu, Hawaii.
Dill, W. A., and A. J. Cordone. 1997. “History and Status of Introduced Fishes in California, 1871-1996.” Fish Bulletin of the California Department of Fish and Game 178.
D’Itri, F.M. (editor). 1997. Zebra Mussels and Aquatic Nuisance Species. Lewis Publishers, Boca Raton, Florida.
Dokken, B. 2004. “Angler's Catch Likely a Rare Aander.” Grand Forks Herald, July 13, 2004. Grand Forks, North Dkoata
Drake, J. A., H. A. Mooney, F. Di Castri, R. H. Groves, F. J. Kruger, M. Rejmanek, and M. Williamson (editors). 1989. Biological Invasions: a Global Perspective. John Wiley & Sons, New York.
Dunne, T. and L.B. Leopold. 1978. Water in Environmental Planning. W.H. Freeman, New York, 818p.
Earth Tech, Inc. 2002. “Devils Lake Study Final Aquatic Impact Analysis Report.” Available at http://www.swc.state.nd.us/projects/newdevilslake/DLSnR/USACE/47Aquatic_Impact_Final.pdf (last accessed 15Dec05).
Earth Tech, Inc. and A. Delorme. 2002. “Draft Macroinvertebrate Sampling Report Devils Lake Study.” http://www.swc.state.nd.us/projects/newdevilslake/DLSnR/USACE/Invertebrate_Study/Report.pdf Last accessed 15Dec05.
Eggers, S. D., and D. M. Reed. 1997. “Wetland Plants and Communities of Minnesota and Wisconsin.” U.S. Army Corps of Engineers, St. Paul District. Northern Prairie Wildlife Research Center Jamestown, North Dakota: Online: http://www.npwrc.usgs.gov/resource/plants/mnplant/mnplant.htm (Version 03Sep98).
LC - 9

Red River Valley Water Supply Project SDEIS
Eliason, B. 1996. “Statewide Survey and Habitat Protection for the Loggerhead Shrike in Minnesota.” Final Report by the Natural Heritage and Nongame Research Program, Minnesota Department of Natural Resources.
Ellis, L. M. 1995. “Bird Use of Saltcedar and Cottonwood Vegetation in the Middle Rio Grande Valley of New Mexico.” U.S.A. Journal of Arid Environments 30:339-349.
Elson, K.G. R. 1969. Whirling Disease in Trout. Nature 223:968.
Elton, C.S. 1958. The Ecology of Invasions by Plants and Animals. University of Chicago Press, Chicago, Illinois.
Emerson, D.G., and V.M. Dressler. 2002. “Historic and Unregulated Monthly Streamflow for Selected Sites in the Red River of the North Basin in North Dakota, Minnesota, and South Dakota, 1931-1999.” U. S. Geological Survey Water-Resources Investigations Report 02-4095.
Emery, L. 1985. “Review of Fish Introduced into the Great Lakes, 1819-1974.” Great Lakes Fishery Commission Technical Report, Volume 45.
Engel, S. 1995. “Eurasian Watermilfoil as a Fishery Management Tool.” Fisheries 20(3):2027.
Engel-Wilson, R. W. and R. D. Ohmart. 1978. “Floral and Attendant Faunal Changes on the Lower Rio Grande Between Fort Quitman and Presidio, Texas.” Proceedings of the National Symposium for Protection and Management of Floodplain Wetlands:139- 147.
Environment Canada. 2002. Canadian Environmental Quality Guidelines. Online: http://www.ec.gc.ca/CEQG-RCQE/English/default.cfm, (last accessed 15Dec05).
Environmental Management Division. 1980. “Proposed Classification of Manitoba’s Surface Water:” Red River Principal Watershed Division, Environmental Management Division, Department of Consumer and Corporate Affairs and Environment,Winnipeg, Manitoba.
EPA. 1986. Quality Criteria for Water 1986. U.S. Environmental Protection Agency Report Number 440/5-86-001.
EPA. 1998. Information for States on Developing Affordability Criteria for Drinking Water. Office of Water, EPA-816-R-98-002.
EPA. 2003. “Draft UV Disinfection Guidance Manual, Appendix G.” EPA
EPA. 2005a. “The Ecoregion Mapping Products and Ecoregion Descriptions Were Completed in Collaboration With the U.S. EPA Regional Offices, State Resource Management Agencies, and With Other Federal Agencies.” Online: http://www.epa.gov/wed/pages/ecoregions/level_iii.htm (Version 16June05).
LC - 10

Red River Valley Water Supply Project SDEIS
EPA. 2005b. “Water Quality Standards.” Online: http://www.epa.gov/OST/standards, (last accessed 2Mar05.
Erb, J. and S. Benson. 2005. “Distribution and abundance of wolves in Minnesota, 2003-04. MNDNR.” Online: http://files.dnr.state.mn.us/natural_resources/animals/mammals/wolves/2004_wolfsurvey_report.pdf (Version 12Sept2005).
Espey, M.J., J. Espey, and W.D. Shaw. 1997: “Price Elasticity of Residential Demand for Water: A Meta Analysis.” Water Resources Research, Vol. 33(6).
Etter, M.A. 1995. “1995 Minnesota Loggerhead Shrike Survey.” Report Submitted to the Nongame Wildlife Program, MNDNR, St. Paul, Minnesota.
Euliss, B.R. 2003. “Effects of Management Practices on Grassland Birds: Burrowing Owl.” Northern Prairie Wildlife Research Center, Jamestown, North Dakota. Northern Prairie Wildlife Research Center. Online: http://www.npwrc.usgs.gov/resource/literatr/grasbird/buow/buow.htm (Version 12Aug04).
Everitt, B. L. 1980. Ecology of Saltcedar – a Plea for Research. Environmental Geology 3:7784.
Faanes, Craig A. 1982. Avian Use of Sheyenne Lake and Associated Habitats in Central North Dakota. Fish And Wildlife Service, U.S. Department of the Interior, Washington, D.C. Resource Publication 144. Northern Prairie Wildlife Research Center, Jamestown, North Dakota: Online: http://www.npwrc.usgs.gov/resource/1998/sheylake/sheylake.htm (Version 01May98).
Faanes, Craig A. and Jonathan M. Andrew. 1983. Avian Use of Forest Habitats in the Pembina Hills of Northeastern North Dakota. Fish and Wildlife Service, U.S. Department of the Interior, Washington, D.C. Resource Publication 151. Northern Prairie Wildlife Research Center Jamestown, North Dakota: Online: http://www.npwrc.usgs.gov/resource/1998/pemhill/pemhill.htm (Version 01Sep98).
Federal Register. 2006. “Small Drinking Water Systems Variances – Revision of Existing National Level Affordability Methodology and Methodology to Identify Variance Technologies That Are Protective of Public Health.” Federal Register 71, March 2, 2006.
Fermeta, Inc. 2001. “Nature Tourism Plan for North Dakota and Lonetree Wildlife Management Area.” Fermata, Inc., Austin, Texas.
Forest Experiment Station, St. Paul. Jamestown, North Dakota: Northern Prairie Wildlife Research Center Online: http://www.npwrc.usgs.gov/resource/2000/neobird/neobird.htm (Version 17Nov00).
Foster, Henry S. and Bruce R. Beattie. 1979. “Urban Residential Demand for Water in the United States.” Land Economics, Volume 55(1).
LC - 11

Red River Valley Water Supply Project SDEIS
Fox, R. O. 1969. “The Corbicula Story: a Progress Report.” Second Annual Meeting, Western Society of Malacologists.
Freeman, A.M. 1993. The Measurement of Environmental and Resource Values: Theory and Methods. Resources for the Future. Washington, DC.
Froelich, Larry L. 1974. Geohydrology of the Wahpeton Area, Richland County, North Dakota. North Dakota Ground-Water Studies (76). State Water Commission Project (1518). North Dakota State Water Commission, Bismarck, North Dakota.
Gagliardi, M.G. and L.J. Liberatore. 2000. Water Systems Piping. In: Piping Handbook: C1C52, M.L. Nayyar, editor. Seventh Edition. McGraw-Hill, New York.
Gilliam, Jacinth. 2004. E-Mail Correspondence from Northern Region, Ontario Ministry of the Environment to Wade Klingsporn, Reclamation, Dakotas Area Office, Bismarck, December 01, 2004.
Goddard, Toby and Fiske, Gary. 2005: Impacts of Municipal Water Shortages. Online: United Lot Owners of Cambria website, http://www.unloc.org/archives.html (Accessed 15Dec05).
Goss, G. 2006 E-Mail from Greg Goss of Minnesota Pollution Control Agency to Allen Schlag, Reclamation. Subject: Minnesota Rule Based Numeric Standards for the Red River. December 4, 2006.
Gottfried, P.K., and J.A. Osborne. 1982. Distribution, Abundance and Size of Corbicula manilensis (Philippi) in a Spring-Fed Central Florida Stream. Florida Scientist 45(3):178- 188.
Gottlieb, Manual. 1963: “Urban Domestic Demand For Water: A Kansas Case Study,” Land Economics 39(2).
Grand Forks Herald. 2006. “North Dakota Marks Year as One of 10th Driest,” by James McPherson, Grand Forks Herald, Tuesday, December 26, 2006.
Grant, R. A. 1965. The Burrowing Owl in Minnesota. Loon 37:2-17.
Halliday, M. M. 1976. “The Biology of Myxosoma cerebralis: the Causative Organism of Whirling Disease of Salmonids.” Journal of Fish Biology 9:339-357.
Hanson, L. G. 1994. “The Henslow's Sparrow (Ammodramus henslowii) of Minnesota: Population Status And Breeding Habitat Analysis.” M.S. Thesis, Central Michigan University, Mount Pleasant, Michigan.
Hart, R. A. 1995. “Mussel (Bivalvia: Unionidae) Habitat Suitability Criteria for the Otter Tail River, Minnesota.” M.S. Thesis. North Dakota State University.
LC - 12

Red River Valley Water Supply Project SDEIS
Hartel, K. E. 1992. “Non-Native Fishes Known From Massachusetts Freshwaters.” In: Occasional Reports of the Museum of Comparative Zoology:1-9. Harvard University, Fish Department, Cambridge, Massacusetts. September.
Haugen, D., Piva, R., Kingsley, N., and R. Harsel. 1999. North Dakota’s Forest Resources, 1994. USDA Forest Service. North Central Research Station, RP NC-336.
Havey, K. A. 1973. “Effects of a Smelt Introduction on Growth of Landlocked Salmon at Schoodic Lake, Maine.” Transactions of the American Fisheries Society 102(2):392-397.
Hebert, P. D. N., C. C. Wilson, M. H. Murdoch, and R. Lazar. 1991. “Demography and Ecological Impacts Of The Invading Mollusk Dreissena polymorpha.” Canadian Journal of Zoology 69:405- 409.
Hedrick, R.P., T.S. McDowell, G.D. Marty, K. Mukkatira, D.B. Antonio, K.B. Andree, Z. Bukhari, T. Clancy. 2002. “Ultraviolet irradiation inactivates the waterborne infective stages of Myxobolus cerebralis: a treatment for hatchery water supplies.” Diseases of Aquatic Organisms 42: 53-59.
Heidel, B. 1988. Natural areas of North Dakota. Umber, Harold, ed. North Dakota Outdoors 50(8):2-25. Northern Prairie Wildlife Research Center. Jamestown, North Dakota. Online: http://www.npwrc.usgs.gov/resource/othrdata/natareas/natareas.htm (Version 16Feb99).
Hellquist, C. B. 2003. Nymphaea leibergii Morong, Pygmy Water-lily, Conservation and Research Plan for New England.
Henderson, C. 1979. Breeding Birds in Minnesota, 1975 - 1979: Abundance, Distribution, and Diversity. Report by MNDNR, St. Paul, Minnesota.
Herkert, J. R. 2003. Effects of management practices on grassland birds: Henslow's Sparrow. Northern Prairie Wildlife Research Center, Jamestown, North Dakota. Online. http://www.npwrc.usgs.gov/resource/literatr/grasbird/hesp/hesp.htm (Version 12Dec03).
Hewitt, G. C., and R. W. Little. 1972. “Whirling Disease in New Zealand Trout Caused by Myxosoma cerebralis (Hofer, 1903) (Protozoa: Myxosporidia).” New Zealand Journal of Marine and Freshwater Research 6:1-10.
Hickley, P. 1986. “Invasion by Zander and the Management of Fish Stocks.” Philosophical Transactions Royal Society of London Bulletin 314:571-582.
Higgins, Kenneth F., Leo M. Kirsch, Albert T. Klett, and Harvey W. Miller. 1992. “Waterfowl Production on the Woodworth Station in South-Central North Dakota, 1965-1981”. U.S. Fish and Wildlife Service, Resource Publication 180. Northern Prairie Wildlife Research Center Jamestown, North Dakota: Online. http://www.npwrc.usgs.gov/resource/1999/wpwood/wpwood.htm (Version 02Sep99).
LC - 13

Red River Valley Water Supply Project SDEIS
Hoddenbach, G. 1990. Iin: Tamarisk Control in Southwestern United States. Proceedings of Tamarisk Conference, University of Arizona, Tucson, AZ, September 23-3, 1987:116-125, M. R. Kunzmann, R. R. Johnson and P. S. Bennett, editors. Special Report No. 9. National Park Service, Cooperative National Park Resources Studies Unit, School of Renewable Natural Resources, University of Arizona, Tucson, AZ.
Hofer, B. 1903. “Über de Drehkrankheit dr Regenbogenforelle.“ llgemeine Fischerei-Zeitung 28(1)7-8.
Hoffman, G. L. 1974. “Disinfection of Contaminated Water by Ultraviolet Irradiation, With Emphasis on Whirling Disease (Myxosoma Cerebralis) and Its Effect on Fish.” Transactions of the American Fisheries Society 103:541-550. Online: http://afs.allenpress.com/perlserv/?request=get-abstract&doi=10.1577%2F15488659(1974)103%3C541%3ADOCWBU%3E2.0.CO%3B2 (Accessed: 07Aug06)
Hoffman, G. L. 1975. Whirling Disease (Myxosoma Cerebralis) Control With Ultraviolet Irradiation and Effect on Fish. Journal of Wildlife Diseases 11:505-507.
Hoffman, G. L. 1990. Myxobolus cerebralis, a Worldwide Cause of Salmonid Whirling Disease. Journal of Aquatic Animal Health 2:30-37.
Holden, P. B. 1991. “Impacts of Green River Poisoning on Management of Native Fishes.” In: Battle Against Extinction: Native Fish Management in the American West:43-55, W. L. Minckley and J. E. Deacon, editors. University of Arizona Press, Tucson, Arizona.
Holden, P. B., and C. B. Stalnaker. 1975. “Distribution and Abundance of Mainstream Fishes of the Middle and Upper Colorado River Basins, 1967-1973.” Transactions of the American Fisheries Society 104(2):217-231.
Holler, J.I. 2000. “Avian Diversity, Abundance and Conservation on a Large Prairie Landscape Reserve in Northwestern Minnesota.” M.S. Thesis, University of Minnesota.
Holling, C.S., editor. 1978. Adaptive Environmental Assessment and Management. John Wiley and Sons, New York, New York:
Holton, G. D. 1990. A Field Guide to Montana Fishes. Montana Department of Fish, Wildlife and Parks, Helena, Montana.
Honnell, D., J.D. Madsen, and R.M. Smart. 1992. “Effects of Aquatic Plants on Water Quality in Pond Ecosystems.” Proceedings: 26th Annual Meeting, Aquatic Plant Control Research Program. Report A-92-2. U.S. Army Corps of Engineers Waterways Experiment Station, Vicksburg, Mississippi.
Hopkins, D. G. and G.L. Running. 2000. “Chapter 3: Soils, Dunes, and Prairie Vegetation: Lessons From the Sandhills of North Dakota.” In: Changing Prairie Landscapes:39-57. T.A. Radenbaugh and P. Douaud, editors..
LC - 14

Red River Valley Water Supply Project SDEIS
Horton, J. S., F. C. Mounts, and J. M. Kraft. 1960. “Seed Germination and Seedling Establishment of Phreatophytic Species.” Research Paper RM-48. On file, USDA-Forest Service, Rocky Mountain Forest and Range Experiment Station, Ft. Collins, Colorado.
Horton, J. S. and C. J. Campbell. 1974. Management of Phreatophytic and Riparian Vegetation for Maximum Multiple Use Values. Research Paper RM-117. On file, USDA-Forest Service, Rocky Mountain Forest and Range Experiment Station, Ft. Collins, Colorado.
Houston Engineering, Inc. 1997. “Instream Flow Needed for Aquatic Life.” White Paper Prepared for the Garrison Diversion Conservancy District, Houston Engineering, Inc., Fargo, North Dakota and Minneapolis, Minnesota.
Houston Engineering, Inc. 2003. City of Fargo Drought Management Plan. Fargo, North Dakota.
Houston Engineering, Inc. 2005. Existing Water Quality Conditions, Impact Assessment Methods and Environmental Consequences. Revised Final Technical Memorandum, Project No’s. 3750-059, 3750-061 & 3750-062, Prepared for the Garrison Diversion Conservancy District. Houston Engineering, Inc., Fargo, North Dakota, and Minneapolis, Minnesota.
Howe, Charles W. and F.P. Linaweaver, Jr. 1967. “The Impact of Price on Residential Water Demand and It’s Relation to System Design and Price Structure.” Water Resources Research 3(1).
Howe, W. H. and F. L. Knopf. 1991. On the Imminent Decline of Rio Grande Cottonwoods in Central New Mexico. Southwestern Naturalist 36: 218-224.
Hrabik, T. R., J. J. Magnson, and A. S. Mclain. 1998. “Predicting the Effects of Rainbow Smelt on Native Fishes in Small Lakes: Evidence From Long-Term Research on Two Lakes.” Canadian Journal of Fisheries and Aquatic Sciences 55:1364-1371.
Hubert, W. 1994. “Exotic fish.” In: Exotic Species Manual:158-174, T. L. Parrish, and S. H. Anderson, editors. Wyoming Game and Fish Department, Laramie, Wyoming.
Hubbs, C. L., R. R. Miller, and L. C. Hubbs. 1974. “Hydrographic History and Relict Fishes of the North-Central Great Basin.” Memoirs of the California Academy of Sciences 7:1-259.
Hudson, E. B., and A. Holliman. 1985. “Salmonid Fish Farming in England and Wales; the Major Diseases of Fish--Trends in Incidence and Methods of Control.” State Veterinary Journal 39:91-109.
Hunter, R. D., and J. F. Bailey. 1992. Dreissena polymorpha(zebra mussel): Colonization of Soft Substrata and Some Effects on Unionid Bivalves. The Nautilus 106(2):60-67.
Hunter, V. A., M. D. Knittel, and J. L. Fryer. 1980. “Stress-Induced Transmission Of Yersiniaruckeri Infection From Carriers To Recipient Steelhead Trout (Salmo gairdneri Richardson).” Journal of Fish Disease 3:467-472.
LC - 15

Red River Valley Water Supply Project SDEIS
Hutson, S.S., Barber, N.L., Kenny, J.F., Linsey, K.S., Lumia, D.S., and Maupin, M.A. 2004. “Estimated Use of Water in the United States in 2000.” Reston, VA., U.S. Geological Survey Circular 1268.
IESO. 2005. Hydro Power Market Summaries for Ontario. Online: http://www.ieso.ca/imoweb/marketdata/marketSummary.asp
Igl, Lawrence D. 2002. Records of the Henslow's Sparrow in Day and McPherson Counties and the First Nest Record for the Species in South Dakota. South Dakota Bird Notes 54(1):5-13. Northern Prairie Wildlife Research Center. Jamestown, North Dakota: Online: http://www.npwrc.usgs.gov/resource/2002/hsparsd/hsparsd.htm (Version 30Dec02).
Igl, Lawrence D., and Douglas H. Johnson. 1998. Highlight Box: “Wetland Birds in the Northern Great Plains.” In: Status and Trends of the Nation's Biological Resources 2:454-455, M. J. Mac, P. A. Opler, C. E. Puckett Haecker, and P. D. Doran, editors. Northern Prairie Wildlife Research Center Jamestown, North Dakota. Online: http://www.npwrc.usgs.gov/resource/2000/grlands/grlands.htm (Version 21Jan00).
International Joint Commission. 1977. Transboundary Implications of the Garrison Diversion Unit. International Joint Commission Report to the Governments of Canada and the United States. International Joint Commission, Washington, D.C., Ottawa, Ontario, and Detroit, Michigan.
International Joint Commission. 2000. The Next Flood: Getting Prepared. Final Report of the International Red River Basin Task Force to the International Joint Commission. International Joint Commission, Washington, D.C., Ottawa, Ontario, and Detroit, Michigan.
Isom, B.G. 1986. “Historical Review of Asiatic Clam (Corbicula) Invasion and Biofouling of Waters and Industries in the Americas.” American Malacological Bulletin, Special Edition No. 2:1-5.
Isom, B. G., C. F. Bowman, J. T. Johnson, E. B. Rodgers. 1986. “Controlling Corbicula (Asiatic Clams) in Complex Power Plant and Industrial Water Systems.” American Malacological Bulletin, Special Edition 2:95-98.
Jackson, Michael A., Dennis L. Toom, and Cynthia Kordecki. 2006. “Red River Valley Water Supply Project Class I Cultural Resources Inventory and Assessment, Eastern North Dakota and Northwestern Minnesota.” Anthropology Research, Department of Anthropology, Contribution No. 391, Grand Forks, North Dakota.
Jenkinson, J.J. 1979. “The Occurrence And Spread of Corbicula manilensisin East-Central Alabama.” Nautilus 94(4):149-153.
Jensen, Ray E. No Date. “Climate of North Dakota.” National Weather Service, North Dakota State University, Fargo, North Dakota. Northern Prairie Wildlife Research Center, Jamestown, North Dakota. Online: http://www.npwrc.usgs.gov/resource/othrdata/climate/climate.htm (Version 02Apr98).
LC - 16

Red River Valley Water Supply Project SDEIS
Jensen, W.F., R.L. Kreil, S.R. Dyke, J.D. Schumacher, and M.G. McKenna. 2001. “Distribution, Relative Abundance, and Species Diversity of Freshwater Mussels in the Sheyenne and Red Rivers of Eastern North Dakota.” North Dakota Fisheries Investigations Report Number 42. North Dakota Game and Fish Department.
Job Service North Dakota. 2005. Community Profiles. Online: http://www.jobsnd.com/data/warehouse_census.html (last accessed 15Dec05).
Johnson, A. 1931. “Notes from Stutsman County, North Dakota.” Auk: Vol. 48(2).
Johnson, A. 1932. “Some Nesting Records from Stutsman County, North Dakota.” Auk: Vol. 49(1).
Johnson, A. 1934. “Notes from Stutsman County, North Dakota.” Auk: Vol. 51(1).
Johnson, D. H. 1996. “Management of Northern Prairies and Wetlands for the Conservation of Neotropical Migratory Birds.” In: Management of Midwestern Landscapes for the Conservation of Neotropical Migratory Birds, F.R. Thompson, III, editor. U.S. Department of Agriculture, Forest Service, General Technical Report NC-187:53-67.
Johnson, D. H. and M. D. Schwartz. 1993. “The Conservation Reserve Program and Grassland birds.” Conservation Biology 7(4):934-937. Northern Prairie Wildlife Research Center, Jamestown, North Dakota: Online: http://www.npwrc.usgs.gov/resource/2003/crpgbird/crpgbird.htm (Version 12May03).
Johnson, D. H., L. D. Igl and C. J. Johnson. 1997. “North Dakota Bird Life: Tracking Changes over a Quarter Century.” North Dakota Outdoors 59(10)10-15. Northern Prairie Wildlife Research Center, Jamestown, North Dakota. Online: http://www.npwrc.usgs.gov/resource/othrdata/birdlife/birdlife.htm (Version 31Jul97).
Johnson, G. E. et. al. 1974. Environmental Impact Assessment of Baldhill Dam and Lake Ashtabula, North Dakota. Institute for Ecological Studies, University of North Dakota. Research Report No. 8.
Johnson, L.E., A. Ricciardi, and J.T. Carlton. 2001. “Overland Dispersal of Aquatic Invasive Species: A Risk Assessment of Transient Recreational Boating.” Ecological Applications 11:1789-1799.
Johnson, S. 1986. “Alien Plants Drain Western Waters.” Nature Conservancy News. September-October.
Jones, C. Vaughan and John R. Morris. 1984. “Instrumental Price Estimates and Residential Water Demand,” Water Resources Research, Vol. 20(2).
Jordan, D. S. 1882. “Report on the Fishes of Ohio.” Report of the Geological Survey of Ohio 4(1):735-1002.
LC - 17
Red River Valley Water Supply Project SDEIS
Kantrud, H. A. and K. F. Higgins. 1992. “Nest and Nest Site Characteristics of Some Ground-nesting, Non-passerine Birds of Northern Grasslands.” Prairie Naturalist 24(2):67-84.
Kasprzyk, M. J. and G. L. Bryant. 1989. “Results of Biological Investigations From the Lower Virgin River Vegetation Management Study.” Manuscript on File, Bureau of Reclamation, Boulder City, Nevada.
Keast, A. 1984. “The Introduced Aquatic Macrophyte, Myriophyllum Spicatum, as Habitat for Fish and Their Macroinvertebrate Prey.” Canadian Journal of Zoology 62:1289-1303.
Kenel, P.P. and J.C. Schlaman. 2005. “Preserving Sustainable Water Supplies for Future Generations.” Journal of American Water Works Association 97(7):78 – 92.
Kingery, L. 1997. “Bioengineering Used to Stabilize Streambank Site on Turtle River”, Quality Water: Newsletter of the North Dakota Nonpoint Source Pollution Task Force 8(2).
Koel, T. M. 1997. “Distribution of Fishes in the Red River of the North Basin on Multivariate Environmental Gradients.” Ph.D. thesis, North Dakota State University, Fargo North Dakota. Online: http://www.npwrc.usgs.gov/resource/fish/norbasin/norbasin.htm (Accessed 15Dec05).
Kolar, C.S. and D. M. Lodge. 2002. “Ecological Predictions and Risk Assessment for Alien Fishes in North America.” Science 298:1233-1236.
Kopechanski, Roma. 2005. E-Mail from Roma Kopechanski, Ontario Power Generation to Wade Klingsporn, Reclamation, Dakotas Area Office, Bismarck, on January 21, 2005.
Krenz, G., and J. Leitch. 1993. A River Runs North, Managing an International River. Red River Water Resources Council.
Krentz, Steven. 2006. E-Mail from Steven Krentz, U.S. Fish and Wildlife Service to Greg Hiemenz, Reclamation, Dakotas Area Office, Bismarck, on September 29, 2006.
Lachner, E.A., C.R. Robins, and W.R. Courtenay, Jr. 1970. “Exotic Fishes and Other Aquatic Organisms Introduced into North America.” Smithsonian Contributions to Zoology 59.
Laird, C. A., and L. M. Page. 1996. Non-Native Fishes Inhabiting the Streams and Lakes of Illinois. Illinois Natural History Survey Bulletin 35(1):1-51.
Lake Winnipeg Research Consortium. 2005a. “Lake Winnipeg Physa Snail.” Online: http://www.lakewinnipegresearch.org/lwrc%20pages/featuredspecies.htm (Accessed 15 Dec, 2005).
Lake Winnipeg Research Consortium. 2005b. “Fish at Risk.” Online: http://www.lakewinnipegresearch.org/lwrc%20pages/aboutthelakefishrisk.htm 15 Dec, 2005.
Lambeth, David O., Bergan, Mary Alice, and Nellermoe, Ron L. 1986. “Nesting Records for Piping Plover in the Red River Valley of North Dakota.” Prairie Naturalist 18(3):142.
LC - 18

Red River Valley Water Supply Project SDEIS
LaPatra S. E., K. A. Lauda, G. R. Jones, S. C. Walker, W. D. Shewmaker. 1994. Development of Passive Immunotherapy for Control of Infectious Hematopoietic Necrosis. Diseases of Aquatic Organisms 20:1-6.
Larson, A. 1928. “Birds of Eastern McKenzie County, North Dakota.” Wilson Bulletin 40:3948;100-110.
Lee, D. S., C. R. Gilbert, C. H. Hocutt, R. E. Jenkins, D. E. McAllister, and J. R. Stauffer, Jr., editors. 1980. Atlas of North American Freshwater Fishes. North Carolina State Museum of Natural History, Raleigh, North Carolina.
Lehman, J.T. 1991. “Causes and Consequences of Cladoceran Dynamics in Lake Michigan: Implications of Species Invasion by Bythotrephes.” Journal of Great Lakes Research 17: 437– 445.
Leopold, Luna. 1994. A View of the River. Harvard University Press, Cambridge, Massachusetts.
Leventer, H. 1987. The contribution of Silver Carp Hypophthalmichthys Molitrix to the Biological Control of Reservoirs. Mikoroth Water Company, Israel.
Lillie, R.A., and J. Budd. 1992. “Habitat Architecture of Myriophyllum Spicatum L. as an Index to Habitat Quality for Fish and Macroinvertebrates.” Journal of Freshwater Ecology 7(2):113125.
Linden, K. G., G. Shin, G. Faubert, W. Cairns, and M. D. Sobsey. 2002. “UV Disinfection of Giardia Lamblia Cysts in Water.” Environmental Science and Technology 36 (11):2519-2522. http://pubs.acs.org/cgi-bin/abstract.cgi/esthag/ 2002/36/i11/abs/es0113403.html (Accessed: 21Aug06)
Linder, G., E. Little, L. Johnson, C. Vishy, B. Peacock, and H. Goeddeke. 2005a. Risk and Consequence Analysis Focused on Biological Invasions Potentially Associated with Surface Water Transfers between the Missouri River and Red River Basins. U.S. Geological Survey, Biological Resources Division, and National Park Service, Environmental Quality Division.
Linder, G., E. Little, B. Peacock, and H. Goeddeke. 2005b. Risk and Consequence Analysis Focused on Biota Transfers Potentially Associated with Surface Water Diversions Between the Missouri River and Red River Basins. Supplemental Report: Risk Reduction Captured by Water Supply Alternatives and Preliminary Analysis of Economic Consequences Associated with Biota Transfers Potentially Realized from Interbasin Water Diversion. U.S. Geological Survey, Biological Resources Division, and National Park Service, Environmental Quality Division.
Linder, G., S. James, L. Johnson, C. Vishy, B. Peacock, and H. Goeddeke. 2006. Preliminary Analysis of Infrastructural Failures and their Associated Risks and Consequences Related to Biota Transfers Potentially Realized from Interbasin Water Diversion. U.S. Geological Survey, Biological Resources Division, and National Park Service, Environmental Quality Division.
LC - 19

Red River Valley Water Supply Project SDEIS
Liu, G. 2005. “An Investigation of UV Disinfection Performance Under the Influence of Turbidity & Particulates for Drinking Water Applications.” Thesis, University of Waterloo, Department of Civil Engineering. Waterloo, Ontario, Canada. Online: http://etd.uwaterloo.ca/ etd/g9liu2005.pdf (Accessed: 19Aug06)
Lohman, J. 1989. “Biologists Introduce Zander into North America.” The Fargo Forum, Fargo, ND, Saturday, July 22, 1989.
Macek-Rowland, K. M. and V. M. Dressler. 2002. Statistical Summaries of Water-Quality Data for Selected Streeamflow-Gaging Stations in the Red River of the North Basin, North Dakota, Minnesota, and South Dakota. USGS Open-File Report 02-390.
Madsen, J.D. 1994. Invasions and Declines of Submersed Macrophytes in Lake George and Other Adirondack Lakes. Lake and Reservoir Management 10(1):19-23.
Madsen, J.D., J.W. Sutherland, J.A. Bloomfield, L.W. Eichler, and C.W. Boylen. 1991. The Decline of Native Vegetation Under Dense Eurasian Watermilfoil Canopies. Journal of Aquatic Plant Management 29:94-99.
Manitoba Conservation. 2003. A profile of Manitoba's commercial fishery. Fisheries Branch, Manitoba Conservation, Winnipeg, Manitoba.
Manitoba Water Stewardship. 2000. Development of a nutrient Management Strategy for Surface Water in Southern Manitoba, April 20, 2000. (http://www.gov.mb.ca/waterstewardship/water_quality/nutrmgt.pdf).
Manitoba Water Stewardship. 2002. Final draft, Manitoba water quality standards, objectives, and guidelines. Manitoba Conservation Report 2002-11. Available at: http://www.gov.mb.ca/waterstewardship/water_quality/quality/mwqsog_2002.pdf Last accessed 15 Dec, 2005.
Manitoba Water Stewardship. 2006. A Profile of Manitoba’s Commercial Fishery. http://www.gov.mb.ca/conservation/fish/images/history.pdf Last accessed 8 Jan, 2007.
Manitoba Water Stewardship. 2006. Water Science and Management Branch, Letter, June 30, 2006, From Dwight Williamson, Director, to Red River Valley Water Supply Project, Reclamation; Subject: Review and Comment: Draft Environmental Impact Statement, Red River Valley Water Supply Project, December 30, 2005.
Manske, L.L. 1980. Habitat, phenology, and growth of selected Sandhills range plants. Ph.D. dissertation. North Dakota State University, Fargo. 154 pp.
Mara, D., and N. Horan. 2003. The handbook of water and wastewater microbiology. Academic Press, An imprint of Elsevier. San Diego, California. 819pp.
LC - 20

Red River Valley Water Supply Project SDEIS
Marchetti,M.P., P.B. Moyle, and R. Levine. 2004. Alien Fishes in California Watersheds: Characteristics of Successful and Failed Invaders. Ecological Applications 14(2):587–596.
Martell, M. S., J. Schladweiler, and F. Cuthbert. 2001. Status and attempted reintroduction of burrowing owls in Minnesota. Journal of Raptor Research 35:331-336.
Martin, Randolph C. and Ronald P. Wilder. “Residential Demand for Water and the Pricing of Municipal Water Services,” Public Finance Quarterly, Vol. 20, No. 1. 1992.
Markiw, M. E. 1992a. Experimentally induced whirling disease. I. Dose response of fry and adults of rainbow trout to the triactinomyxon stage of Myxobolus cerebralis. Journal of Aquatic Animal Health 4(1):40-43.
Markiw, M. E. 1992b. Experimentally induced whirling disease. II. Determination of longevity of the infective triactinomyxon stage of Myxobolus cerebralis by vital staining. Journal of Aquatic Animal Health 4(1):44-47.
Markiw, M. E. 1991. Whirling disease: earliest susceptible age of rainbow trout to the triactinomyxon of Myxobolus cerebralis. Aquaculture 92:1-6.
Markiw, M. E. 1986. Salmonid whirling disease: dynamics of experimental production of the infective stage-the triactinomyxon spore. Canadian Journal of Fisheries and Aquatic Sciences 43:521-526.
Markiw, M. E., and K. Wolf. 1983. Myxosoma cerebralis (Myxozoa: Myxosporea) etiologic agent of salmonid whirling disease requires tubificid worm (Annelida: Oligochaeta) in its life cycle. Journal of Protozoology 30:561-564.
Marshall, M.M., S. Hayes, J. Moffett, C.R. Sterling, and W.L. Nicholson. 2003. Comparison of UV Inactivation of spores of three Encephalitozoon species with that of spores of two DNA repair-deficient Bacillus subtilis biodosimetry strains. Applied and Environmental Microbiology 69:683-685. posted online January 2003.
Martell, M.S., J. Schladweiler, and F. Cuthbert. 2001. Status and attempted reintroduction of burrowing owls in Minnesota, USA. Journal of Raptor Research 35:331-336. Matteson, Sumner, Scott Craven, and Donna Compton. 1995. The Trumpeter Swan. Madison, WI: Wisconsin Cooperative Extension
Mayden, R. L., F. B. Cross, and W. T. Gorman. 1987. Distributional history of the rainbow smelt, Osmerus mordax (Salmoniformes: Osmeridae), in the Mississippi River Basin. Copeia 1987(4):1051-1054.
McKearnan, J.E. and F. J. Cuthbert. 1989. Status and breeding success of Common Terns in Minnesota. Colonial Waterbirds 12:185-190.
LC - 21

Red River Valley Water Supply Project SDEIS
McKearnan, J.E. and S.J. Maxson. 1994. Reproductive success and nest attentiveness of common terns at Pine and Curry Island, Minnesota in 1993. Final report submitted to the Nongame Wildife Program, Minnesota Department of Natural Resources. 23 pp.
Meridian Environmental Technology, Inc. 2004. Red River Valley Climate Study on Drought Frequency Investigations of the Red River of the North Basin. Presented to the Bureau of Reclamation, Dakotas Area Office, Bismarck, North Dakota.
Miller, J.E., and D. L. Frink. 1984. Changes in Flood Response of the Red River of the North Basin, North Dakota-Minnesota. U.S. Geological Survey Water-Supply Paper 2243.
MNDNR. 1995. Statement of Need and Reasonableness in the Matter of Proposed Amendment of Minnesota Rules, Chapter 6134: Endangered and Threatened Species. Division of Fish and Wildlife. 336pp.
MNDNR. 2001. Letter from Larry Kramka, Regional Hydrologist, MNDNR, on December 17, 2001, to Signe Snortland, Reclamation: Subject: Red River Valley Water Needs Assessment.
MNDNR. 2005a. Lynx Sightings. http://www.dnr.state.mn.us/ecological_services/nhnrp/research/lynx_sightings.html (last accessed 15 Dec, 2005).
MNDNR. 2005b. Minnesota Natural Heritage Program Inventory Database (March 2005). Natural Heritage and Nongame Research Program of the Division of Ecological Services, Minnesota Department of Natural Resources.
MNDNR and North Dakota Fish and Game Department. 1996. Red River Angler’s Guide. http://www.state.nd.us/gnf//fishing/redbro.html last accessed December, 15, 2005.
Minnesota Ornithologists Union. 2004. http://www.cbs.umn.edu/~mou/concern.html (Version 10 October 2004)
Minnesota Pollution Control Agency. 2001. Rainy River Basin Information Document. Minnesota Pollution Control Agency, St. Paul. http://www.pca.state.mn.us/water/basins/rainy/ Last accessed 15 Dec, 2005.
Minnesota Pollution Control Agency. 2004. Lake of the Woods water quality summary information. Available online at: http://www.pca.state.mn.us/water/clmp/lkwqReadFull.cfm?lakeid=39-0002-01 last accessed December, 15, 2005.
Missouri Basin States Association. 1983. Missouri River Basin Hydrology Study Final Report.
Mofidi, A. A., P. A. Rochelle, C. I. Chou, H. M. Mehta, K. G. Linden, and J. P. Malley. 2002. “Bacterial Survival After Ultraviolet Light Disinfection: Resistance, Regrowth and Repair.” Proceedings of the American Water Works Association Water Quality Technology Conference; November 10-14, 2002 Seattle.
LC - 22

Red River Valley Water Supply Project SDEIS
Mofidi, A. 2003. Metropolitan Water District of Southern California. “Pathogen Reactivation in the Distribution System.” Presented at American Water Works Association Research Foundation Technology Transfer Workshop, Costa Mesa, California.
Monson, G. W. 1934. The Birds of Berlin and Harwood Townships, Cass County, North Dakota. Wilson Bulletin: Vol. 46, No. 1.
Mooney, H.A., and J.A. Drake (editors). 1986. Ecology of the biological invasions of North America and Hawaii. Springer-Verlag, New York.
Moser, A.P. 2001. Buried pipe design, second edition. McGraw-Hill Professional Engineering, McGraw-Hill, New York, 607pp.
Moyle, P. B. 1976. Inland fishes of California. University of California Press, Berkeley, CA.
Mulcahy, D., R.J. Pascho, and C.K. Jenes. 1983. Mortality due to infectious hematopoietic necrosis of sockeye salmon (Oncorhynchus nerka) fry in streamside egg incubation boxes. Canadian Journal of Fisheries and Aquatic Sciences 40:1511-1516.
Nalepa, T. F. 1994. Decline of native unionid bivalves in Lake St. Clair after infestation by the zebra mussel, Dreissena polymorpha. Can. J. Fish. Aquat. Sci. 51:2227-2233.
Nalepa, T.F., and D.W. Schloesser (editors). 1993. Zebra mussels: Biology, impacts, and control. Lewis Publishers, Boca Raton, Florida, 810pp.
National Invasive Species Council (NISC). 2001. Meeting the Invasive Species Challenge: National Invasive Species Management Plan.
National Research Council (NRC). 2004. Indicators of waterborne pathogens. The National Academies Press. Washington, D.C., 315pp.
Natural Resources of Canada. n.d. The Atlas of Canada. Lake of the Woods NM-15. http://atlas.gc.ca/site/english/maps/archives/imw/westerncanada/nm15 last accessed 15 Dec, 2005.
Natural Resources Conservation Service. 2004. The PLANTS Database, Version 3.5 http://plants.usda.gov. National Plant Data Center, Baton Rouge, LA 70874-4490 USA.
Nichols, S. A. 1994. Evaluation of invasions and declines of submersed macrophytes for the Upper Great Lakes Region. Lake and Reservoir Management 10(1):29-33.
Nieswiadomy, Michael L. and David J. Molina. “Comparing Residential Water Demand Estimates under Decreasing and Increasing Block Rates using Household Data,” Land Economics, Vol. 65, No. 3. 1989.
Nieswiadomy, Michael L. “Estimating Urban Residential Water Demand: Effects of Price Structure, Conservation, and Education.” Water Resources Research, Vol. 28, No. 3. 1992.
LC - 23

Red River Valley Water Supply Project SDEIS
Nieswiadomy, Michael and Steven L. Cobb. “Impact of Pricing Structure Selectivity on Urban Water Demand,” Contemporary Policy Issues, Vol. 11, 1993.
NIST/SEMATECH, 2004. e-Handbook of Statistical Methods, available through the world-wide web at http://www.itl.nist.gov/div898/handbook last accessed 15 Dec, 2005.
North Dakota Attorney General. 2004. Letter Opinion 1004-L-56, August 31, 2004.
North Dakota Department of Health. 2004. North Dakota 2004 Integrated Section 305(b) Water Quality Assessment Report and Section 303(d) List of Waters Needing Total Maximum Daily Loads. Bismarck, North Dakota.
North Dakota Game and Fish Department. 1999. North Dakota Game and Fish Office Memo, February 2, From Terry Steinwand, Chief of Fisheries Division to Bureau of Reclamation; Subject: Costs of De-Watering Lake Ashtabula.
North Dakota Game and Fish Department. 2004. North Dakota Outdoors. July Issue. http://www.state.nd.us/gnf/ndoutdoors/issues/2004/jul/index.html.
North Dakota Game and Fish Department. 2005. Letter of September 28, 2005, From Michael G. McKenna, Chief, Conservation & Communication Division to Dennis Breitzman, Reclamation; Subject: Red River Valley Water Needs and Options Comments.
North Dakota State Data Center. Population Projections. Fargo, ND. http://www.ndsu.edu/sdc/data/projections/allprofiles.pdf. Last accessed 15 Dec, 2005.
North Dakota State Data Center. 2000. Fargo-Moorhead Metropolitan Area Labor Market Study. North Dakota State University, Department of Agricultural Economics, Fargo, ND.
North Dakota State University. 2004. Red River Valley Industrial Water Needs Assessment, Department of Agribusiness and Applied Economics, Fargo, North Dakota.
North Dakota State Water Commission. 1992. North Dakota State Water Commission Office Memo, November 27, from Craig Odenbach, Water Resource Engineer; to Milton Lindvig, Director Hydrology Division; subject: Lake Ashtabula Allocations.
North Dakota State Water Commission. 1995. North Dakota State Water Commission Office, May 10, from Milton O. Lindvig, Water Appropriation Division Director; to Roger Burnett, Bureau of Reclamation; Subject: Appraisals of Major Aquifers in the Red River Valley.
North Dakota State Water Commission. 2004. The Data Resources pages http://www.swc.state.nd.us/dataresources.html on the NDSWC website provide a search interface to provisional data on the following data types: contstruction permits, retention structure, drains, precipitation, water permits, private contractor logs, ground/surface water, digital maps, government surveys, and software utilities. This link is for ground/surface water data: http://www.swc.state.nd.us/4DLink2/4dcgi/WellSearchForm
LC - 24

Red River Valley Water Supply Project SDEIS
North Dakota State Water Commission. 2005a. Memo, January 27, from Dave Ripley, Director, Water Appropriation Division; to Allen Schlag, Bureau of Reclamation; Subject: Appraisals of Selected Aquifers in the Red River Valley of North Dakota.
North Dakota State Water Commission. 2005b. Office of the North Dakota State Engineer, memo, March 17, 2005, from Robert B. White, Water Resource Engineer; to Dave Ripley, Director, Water Appropriation Division; Subject: Baldhill Dam Review.
North Dakota State Water Commission. 2006. Office of the North Dakota State Engineer, Letter, June 21, 2006, From Dale Frink, State Engineer, to Dennis Breitzman, Area Manager, Reclamation; Subject: Water Rights Behind Baldhill Dam.
Northwest Economic Associates. 2003. Population Projections for Red River Valley Counties and Municipalities, 2000 through 2050. Presented to the Bureau of Reclamation, Dakotas Area Office, Bismarck, North Dakota. Northwest Economic Associates, Vancouver, Washington.
NRC (National Research Council) 2004. Adaptive Management for Water Resources Project Planning. Panel on Adaptive Management for Resource Stewardship, Committee to Assess the U.S. Army Corps of Engineers Methods of Analysis and Peer Review for Water Resources Project Planning. Washington, DC. National Academy Press.
Nustad, R.A., and Bales, J.D. 2005. Simulation of Conservative-Constituent Transport in the Red River of the North Basin, North Dakota, and Minnesota, 2003-04. U.S. Geological Survey, Scientific Investigation Report 2005-5273.
Nustad, R.A. and Bales, J.D. 2006. Simulation of Constituent Transport in the Red River of North Dakota, North Dakota and Minnesota, During Unsteady-Flow Conditions, 1977 and 200304. Scientific Investigations Report 2006-5296.
O'Brien, D. J. 1976. Some aspects of diseases of freshwater fish in Ireland. Irish Veterinary Journal 30:97-100.
O'Grodnick, J. J. 1979. Susceptibility of various salmonids to whirling disease (Myxosoma cerebralis). Transactions of the American Fisheries Society 108:187-190.
O'Leary, J., and D. G. Smith. 1987. Occurrence of the first migration of the gizzard shad, (Dorosoma cepedianum), in the Connecticut River, Massachussetts. U.S. National Marine Service Fishery Bulletin 85(2):380-383.
Omernik, J. M. 1987. Ecoregions of the conterminous United States. Annals of the Association of American Geographers. 77:118-125.
Page, L. M., and B. M. Burr. 1991. A field guide to freshwater fishes of North America north of Mexico. The Peterson Field Guide Series, volume 42. Houghton Mifflin Company, Boston, MA.
LC - 25

Red River Valley Water Supply Project SDEIS
Palmer, T. 2002. Blight in the waters: whirling disease in Montana. Montana: the Magazine of Western History. Summer 2002. Online: http://www.findarticles.com/p/articles/mi_qa3951/is_200207/ai_n9146540 (Accessed 26Sept06).
Parma, A.M. and NCEAS Working Group on Population Management. 1998. What can adaptive management do for our fish, forests, food, and biodiversity? Integrative Biology 1:1626.
Petch, H.E. 1985. Inventory of Interbasin transfers of water in the western conterminous United States. USGS Open-File Report 85-166.
Peterka, J. J. 1978. Fishes and fisheries of the Sheyenne River, North Dakota. Annual Proceedings, North Dakota Academy of Science 32: 29-44.
Pflieger, W. L. 1997. The fishes of Missouri. Missouri Department of Conservation, Jefferson City, MO. 372 pp.
Pflieger, W. L. 1975. The fishes of Missouri. Missouri Department of Conservation, Jefferson City, MO. 343 pp.
Pimentel, D., 2003. Economic and Ecological Costs Associated with Aquatic Invasive Species. Proceedings of the Aquatic Invaders of the Delaware Estuary Symposium, Malvern, Pennsylvania, May 20, 2003. Available online at http://sgnis.org/publicat/proceed/aide/pime2003.htm last accessed November 15, 2006.
Pip, E. 2004. A New Species of Physella (GASTROPODA:PHYSIDAE) Endemic to Lake Winnipeg, Canada. Visaya 1:2:42-48.
Piper, Steven. “Impact of Water Quality on Municipal Water Price and Residential Water Demand and Implications for Water Supply Benefits.” Water Resources Research, Vol. 39, No. 5. 2003.
Prokopovich, N. P. and D. J. Hebert. 1965. Sedimentation in the Delta-Mendota Canal. Journal of the American Water Works Association 57:375-382.
Reclamation. 1989. James River Comprehensive Report, Garrison Diversion Unit. Dakotas Area Office, Bismarck, North Dakota.
Reclamation. 1993. Bureau of Reclamation Indian Trust Asset Policy. Washington, D.C.
Reclamation. 1998. Red River Valley Water Needs Assessment, Phase I Part A; MR&I Appraisal Report. United States Department of the Interior.
Reclamation. 1999a. Draft Environmental Assessment. Ransom-Sargent Water Users Municipal, Rural, and Industrial Water Project Core Water Supply System. Dakotas Area Office, Bismarck, North Dakota.
LC - 26

Red River Valley Water Supply Project SDEIS
Reclamation. 1999b. Red River Valley Water Needs Assessment, Final Appraisal Report, Phase I Part B, Instream Flow Needs Assessment. United States Department of the Interior.
Reclamation. 2000a. National Environmental Policy Act Handbook, Public Review Draft. U.S. Department of the Interior, Bureau of Reclamation.
Reclamation. 2000b. Red River Valley Water Needs Assessment Phase II; Appraisal of Alternatives to Meet Projected Shortages. Dakotas Area Office, Bismarck, North Dakota.
Reclamation. 2003a. Report on Red River Valley Water Supply Project Needs and Options, Aquatic Needs Assessment, Instream Flows for Aquatic Life and Riparian Maintenance, Final Report. Dakotas Area Office, Bismarck, North Dakota.
Reclamation. 2003b. Report on Red River Valley Water Supply Project Needs and Options, Current and Future Population of the Red River Valley Region 2000 through 2050, Final Report. Dakotas Area Office, Bismarck, North Dakota.
Reclamation. 2003c. Report on Red River Valley Water Supply Project Needs and Options, Recreation Needs Assessment, Final Report. Dakotas Area Office, Bismarck, North Dakota.
Reclamation. 2003d. Report on Red River Valley Water Supply Project Needs and Options, Water Quality Needs, Regulatory Overview of the Safe Drinking Water Act, Final Report. Dakotas Area Office, Bismarck, North Dakota.
Reclamation. 2004a. Report on Red River Valley Water Needs and Options, Industrial Needs Assessment Projections of Future Industrial Activity in the Red River Valley, Final Report. Dakotas Area Office, Bureau of Reclamation.
Reclamation. 2004b. Report on Red River Valley Water Needs and Options, Water Conservation Potential Assessment, Final Report. Dakotas Area Office, Bureau of Reclamation.
Reclamation. 2004c. Report on Red River Valley Water Needs and Options, Water System Assessment Executive Summary, Final Report. Dakotas Area Office, Bureau of Reclamation.
Reclamation. 2005a. Report on Red River Valley Water Needs and Options, Final Report. Dakotas Area Office, Bureau of Reclamation.
Reclamation. 2005b. A Study to Determine the History and Present-Level Streamflow Depletions in the Missouri River Basin for the Period 1929 to 2002. Bureau of Reclamation, Great Plains Regional Office, Billings, Montana.
Reclamation. 2005c. Water Treatment Plant for Biota Removal and Inactiviation Preliminary Design & Cost Estimates. Bureau of Reclamation, Technical Services Center, Denver, Colorado.
LC - 27

Red River Valley Water Supply Project SDEIS
Reclamation. 2005d. Update of Garrison Diversion Unit Principal Supply Works Costs. Dakotas Area Office, Bureau of Reclamation.
Reclamation 2006. Methodology to Determine Future Historic Depletions in the Missouri River Basin. Bureau of Reclamation, Great Plains Regional Office, Billings, Montana.
Reclamation and Garrison Diversion Conservancy District. 2003a. Red River Valley Water Supply Project Environmental Impact Statement, Summary of June 2003 Public Meetings, Final Report. Dakotas Area Office, Bismarck, North Dakota.
Reclamation and Garrison Diversion Conservancy District. 2003b. Red River Valley Water Supply Project Environmental Impact Statement, Summary of Public Scoping, Final Report. Dakotas Area Office, Bismarck, North Dakota.
Regan, H.M., M. Colyvan, and M.A. Burgman. 2002. A taxonomy and treatment of uncertainty for ecology and conservation biology. Ecological Applications 12:618-628.
Rejmánek, M. 2000. Invasive plants: Approaches and Predictions. Austral Ecology 25:497506.
Rejmánek, M. and D. D. Richardson. 1996. What Attributes Make Some Plant Species More Invasive? Ecology 77(6):1655-1660.
Renken, R. B., and J. J. Dinsmore. 1982. A Henslow's Sparrow in North Dakota. Prairie Naturalist. 14:98.
Renken, R. B., and J.J. Dinsmore. 1987. Nongame bird communities on managed grasslands in North Dakota. Canadian Field-Naturalist 101(4):551-557.
Renwick, Mary, Richard Green, and Chester McCorkle. “Measuring the Price Responsiveness of Residential Water Demand in California’s Urban Areas.” A report prepared for the California Department of Water Resources, Sacramento, CA. May 1998.
Renwick, Mary E. and Sandra O. Archibald. “Demand Side Management Policies for Residential Water Use: Who Bears the Conservation Burden?” Land Economics, Vol. 74, No. 3. 1998.
Reppe, Thomas H. C. 2005. Ground-Water Availability from Surficial Aquifers in the Red River of the North Basin, Minnesota. United State Geologic Survey Scientific Investigations Report 2005-5204. Online at http://pubs.water.usgs.gov/sir2005-5204/. Last accessed 15 Dec, 2005.
Reynolds, Ronald E., D. R. Cohan, and C. R. Loesch. 1997. Wetlands of North and South Dakota. Jamestown, ND: Northern Prairie Wildlife Research Center Online. http://www.npwrc.usgs.gov/resource/wetlands/wetstats/wetstats.htm (Version 01OCT1997).
LC - 28

Red River Valley Water Supply Project SDEIS
Ricciardi, A., F. G. Whoriskey, and J. B. Rasmussen. 1995. Predicting the intensity and impact of Dreissena infestation on native unionid bivalves from Dreissena field density. Can. J. Fish. Aquat. Sci. 52:1449-1461.
Richter, Brian D., J. V. Baumgartner, R. Wigington, and D. Braun. 1997. How Much Water Does a River Need? Freshwater Biology 37: 231-249.
Richter, Brian D. and H. E. Richter. 2000. Prescribing flood regimes to sustain riparian ecosystems along meandering rivers. Conservation Biology 14(5):1467-1478.
Richter, Brian D., R. Mathews, D. L. Harrison, and R. Wigington. 2003. Ecologically sustainable water management: managing river flows for ecological integrity. Ecological Applications 13(1): 206-224.
Ripley, David P. 2000. Water Resource Characteristics of the West Fargo Aquifer System, Cass and Richland Counties, North Dakota. Prepared in cooperation with the Southeast Cass Water Resource District. North Dakota Ground-Water Studies no. 106 Part II. North Dakota State Water Commission, Bismarck.
Roberts, T.S. 1932. The Birds of Minnesota. University of Minnesota Press, Minneapolis, MN. Pp. 149-152.
Robinson, T. W. 1965. Introduction, spread and areal extent of saltcedar (Tamarix) in the Western States. Geological Survey Professional Paper 491-A. U. S. Geological Survey, Reston, VA.
Rosgen, Dave. 1996. Applied River Morphology, Second Edition. Published and copyright by Wildland Hydrology.
Royce, Charles C. (compiler). 1899. Indian land cessions in the United States. Eighteenth annual report of the Bureau of American Ethnology to the Secretary of the Smithsonian Institution, 1896-97, by J. W. Powell, Director. Part 2. Smithsonian Institution, Washington D.C.
Rucker, R. R. 1966. Redmouth disease of rainbow trout (Salmo gairdneri). Bull. Off. Int. Epizoot. 65:825-830.
Ryberg, Karen R. 2006a. Cluster Analysis of Water-Quality Data for Lake Sakakawea, Audubon Lake, and McClusky Canal, Central North Dakota, 1990-2003. U. S. Geological Survey Scientific Investigations Report 2006-5202.
Ryberg, K.A. 2006b. Continuous Water-Quality Monitoring and Regression Analysis to Estimate Constituent Concentrations and Loads in the Red River of the North, Fargo, North Dakota, 2003-05. U. S. Geological Survey Scientific Investigations Report 2006-5241.
LC - 29

Red River Valley Water Supply Project SDEIS
Sauer, M. 2006. Personal communication between Mike Sauer of NDDH and Reclamation on Project Alternatives and the North Dakota Antidegradation Procedure and Beneficial Use. November 30, 2006.
Schloesser, D. W., and T. F. Nalepa. 1994. Dramatic decline of native unionid bivalves in offshore waters of western Lake Erie after infestation by the zebra mussel, Dreissena polymorpha. Can. J. Fish. Aquat. Sci. 51:2234-2242.
Schloesser, D. W. and W. Kovalak. 1991. Infestation of unionids by Dreissena polymorpha in a power plant canal in Lake Erie. J. Shellfish Res. 10(2): 355-359.
Schmoller, D. 2001. Fact Sheet: Wolf’s Spike-rush (Eleocharis wolfii). Prepared for the Minnesota Nature Conservancy.
Schneider, Michael L. and E. Earl Whitlach. “User-Specific Water Demand Elasticities.” Journal of Water Resources Planning and Management. Vol. 117, No. 1. 1991.
Schoenberg, Michael E. 1998. Hydrogeology and Sources of Recharge to the Buffalo and Wahpeton Aquifers in the Southern Part of the Red River of the North Drainage Basin, West-Central Minnesota and Southeastern North Dakota. Prepared in cooperation with the Minnesota Department of Natural Resources and Moorhead [Minnesota] Public Service. Water-Resources Investigations Report 97-4084. U.S. Geological Survey, Mounds View, Minnesota.
Service. 1983. Northern States Bald Eagle Recovery Plan. U.S. Fish and Wildlife Service, Ft. Snelling, Minnesota. 76pp.
Service. 1983. Northern States Bald Eagle Recovery Plan. U.S. Fish and Wildlife Service, Ft Snelling, Minnesota. 76pp.
Service. 1993. Pallid Sturgeon Recovery Plan. U.S. Fish and Wildlife Service, Bismarck, North Dakota.
Service. 1995. North Dakota's Federally Listed Endangered, Threatened, And Candidate Species - 1995. U.S. Fish and Wildlife Service, Bismarck, ND. Jamestown, ND: Northern Prairie Wildlife Research Center Online: http://www.npwrc.usgs.gov/resource/wildlife/nddanger/nddanger.htm (Version 16JUL97).
Service. 1996. Western Prairie Fringed Orchid (Platanthera praeclara) Recovery Plan. U.S. Fish and Wildlife Service, Ft. Snelling, Minnesota,
Service. 2000. Endangered and Threatened Wildlife and Plants; Determination of Threatened Status for the Contiguous U.S. Distinct Population Segment of the Canada Lynx and Related Rule; Final Rule. 50 CFR Part 17. Federal Register 65:(58)16052-16086.
Service. 2003. National Survey of Fishing, Hunting, and Wildlife-Associated Recreation: North Dakota. Report FHW/01-ND-Rev. Revised March 2003.
LC - 30

Red River Valley Water Supply Project SDEIS
Service. 2002. Status Assessment and Conservation Guidelines, Dakota Skipper (Hesperia dacotae), Iowa, Minnesota North Dakota, South Dakota, Manitoba, and Saskatchewan. Twin Cities Field Office.
Service. 2004. Executive Order for Protection of Migratory Birds, Questions and Answers. http://migratorybirds.fws.gov/EO/Q&A%27s.html
Service. 2005. Draft Fish and Wildlife Coordination Act Report for the Red River Valley Water Supply Project. North Dakota Field Office, Division of Ecological Services. Bismarck, North Dakota.
Shaffer, J. A., Igl, L. D., and Van Hove, F. 2003. Historical and recent records and first nest records of Henslow's Sparrow in North Dakota. Prairie Naturalist 35:81-94.
Shaver, Robert B. 1998. [Hydrologist, North Dakota State Water Commission, Bismarck]. Memorandum on Conditional Water Permit Application #5188 [Ransom-Sargent Water Users], June 9, to David Sprnczynatyk, State Engineer, through Milton O. Lindvig, Director, State Water Appropriation Division, NDSWC.
Shin, G., K. G. Linden, M. J. Arrowood, and M. D. Sobsey. 2001. “Low-Pressure UV Inactivation and DNA Repair Potential of Cryptosporidium Parvum Oocysts.” Applied and Environmental Microbiology 67(7):3029-3032, http://aem.asm.org/cgi/content/full/67/7/3029 Accessed: 8/11/06
Shireman, J. V., and C. R. Smith. 1983. Synopsis of biological data on the grass carp Ctenopharyngodon idella (Cuvier and Valenciennes, 1844). FAO Fisheries Synopsis No. 135. Food and Agriculture Organization of the United Nations (FAO), Rome, Italy. 86 pp.
Sickel, J. B. 1986. Corbicula population mortalities: factors influencing population control. American Malacological Bulletin, Special Edition 2:89-94.
Sieg, C.H. and A.J. Bjugstad. 1994. Five Years of Following the Western Prairie Fringed Orchid (Platanthera Praeclara) on The Sheyenne National Grassland. In,: Proc. 13th North American Prairie Conference, 6-9 Aug. 1992, Windsor, Ontario, Canada.
Sieg, C.H. and R. M. King. 1995. Influence of environmental factors and Preliminary demographic analyses of a threatened orchid, Platanthera praeclara. American Midl. Naturalist. 134:307-323.
Sigler, W. F., and J. W. Sigler. 1987. Fishes of the Great Basin: A Natural History. University of Nevada Press, Reno, NV. 425 pp.
Sigler, W. F., and R. R. Miller. 1963. Fishes of Utah. Utah Department of Fish and Game, Salt Lake City, UT. 203 pp.
Simpson, J., and R. Wallace. 1978. Fishes of Idaho. University of Idaho Press, Moscow, ID. Sinclair, R.M. 1971a. Corbicula variation and Dreissena parallels. The Biologist 53(3):153-159.
LC - 31

Red River Valley Water Supply Project SDEIS
Sinclair, R.M. 1971b. Annotated bibliography on the exotic bivalve Corbiculain North America, 1900-1971. Sterkiana No. 43:11-18.
Skubinna, J.P., T.G. Coon, and T.R. Batterson. 1995. Increased abundance and depth of submersed macrophytes in response to decreased turbidity in Saginaw Bay, Michigan. Journal of Great Lakes Research 21(4): 476-488.
Sloan, Charles, E. 1972. Ground-Water Hydrology of Prairie Potholes in North Dakota. U.S. Geological Survey Professional Paper 585-C.
Smith, A. L., A. Mula, J. P. Farkas and D. O. Bassett. 1979. Clams - a growing threat to inplant water systems. Plant Engineering 1979:165-167.
Smith, C.G., and J.W. Barko. 1990. Ecology of Eurasian Watermilfoil. Journal of Aquatic Plant Management 28:55-64.
Smith, C. L. 1985. The inland fishes of New York State. New York State Department of Environmental Conservation, Albany, NY. 522 pp.
Smith, P. W. 1979. The fishes of Illinois. University of Illinois Press, Urbana, IL.
Soil Conservation Service, U.S. Department of Agriculture. St. Paul, Minnesota. 1966. Hydrology Guide for Minnesota. 8.1 – 8.15.
Southwell, D.K. 2002 Conservation Assessment for Trumpeter Swan (Cygnus buccinator). USDA Forest Service, Eastern Region. Threatened and Endangered Species Program Milwaukee, Wisconsin 22 pages.
Spectrum Economics, Inc. 1991. Cost of Industrial Water Shortages. Prepared California Urban Water Agencies. San Francisco, California.
Stevens, O.A. 1944. Fifteen Years Banding At Fargo, North Dakota. Bird Banding 15:139-144.
Stevens, L. E. 1990. Pp. 99-105 in: M. R. Kunzmann, R. R. Johnson and P. S. Bennett (eds.) Tamarisk control in southwestern United States. Proceedings of Tamarisk Conference, University of Arizona, Tucson, AZ, September 23-3, 1987. Special Report No. 9. National Park Service, Cooperative National Park Resources Studies Unit, School of Renewable Natural Resources, University of Arizona, Tucson, AZ.
Stewart, Robert E. 1975. Breeding Birds of North Dakota. Tri-College Center for Environmental Studies, Fargo, ND. Jamestown, ND: Northern Prairie Wildlife Research Center Online: http://www.npwrc.usgs.gov/resource/distr/birds/bb_of_nd/bb_of_nd.htm (Version 06Jul00).
Stewart, R.E. and Kantrud, H.A. 1974. Breeding Waterfowl Populations in the Prairie Pothole Region of North Dakota. Condor 76:70-79.
LC - 32

Red River Valley Water Supply Project SDEIS
Stites, D.L., A.C. Benke, and D.M. Gillespie. 1995. Population dynamics, growth, and production of the Asiatic clam, Corbicula fluminea, in a blackwater river. Canadian Journal of Fisheries and Aquatic Sciences 52:425-437.
Stockwell, D.R.B, and D. Peters. 1999. The GARP modeling system: problems and solutions to automated spatial prediction. International Journal of Geographic Information Science 13:143158.
Stoner, J. D., Lorenz, D. L., Wiche, G. J., and Goldstein, R. M. Red River of the North Basin, Minnesota, North Dakota, and South Dakota. 1993. Water Resources Bulletin (August): 29-4.
Strobel, M.L., and N.D. Haffield. 1995. Salinity in surface water in the Red River of the North Basin, northeastern North Dakota. U.S. Geological Survey Water-Resources Investigations Report 95-4082.
Stromberg, J. C., R. Tiller, and B. Richter. 1996. Effects of groundwater decline on riparian vegetation of semiarid regions: The San Pedro, Arizona. Ecological Applications 6(1):113-131.
Taylor, J. N., W. R. Courtenay, Jr., and J. A. McCann. 1984. Known impact of exotic fishes in the continental United States. Pages 322-373 in W. R. Courtenay, Jr., and J. R. Stauffer, editors. Distribution, biology, and management of exotic fish. Johns Hopkins Press, Baltimore, MD.
Taylor, R. L., and M. Lott. 1978. Transmission of salmonid whirling disease by birds fed trout infected with Myxosoma cerebralis. Journal of Protozoology 25:105-106.
Teuscher, D., and C. Luecke. 1996. Competition between kokanees and Utah chub in Flaming Gorge Reservoir, Utah-Wyoming. Transactions of the American Fisheries Society 125(4):505511.
Todd, T. N. 1986. Artificial propagation of coregonines in the management of the Laurentian Great Lakes. Arch. Hydrobiol. Beih./Ergebn. Limnol. 22:31-50.
Toom, D.H. 1994. Bridge Replacements, Archeological Sites, and Archeological Site Surveys in North Dakota. Contribution No. 292. Department of Anthropology, University of North Dakota, Grand Forks. Submitted to the State Historical Society of North Dakota, Bismarck.
Tornes, L.H. 2005. Water Quality of Streams in the Red River of the North Basin, Minnesota, North Dakota, and South Dakota. U.S.Geological Survey Scientific Investigations Report 20055095.
Tornes, L.H., M.E. Brigham, and D.L. Lorenz. 1997. Nutrients, suspended sediment, and pesticides in streams in the Red River of the North Basin, Minnesota, North Dakota, and South Dakota, 1993-1995. U.S. Geological Survey Water Resources Investigations Report 97-4053.
LC - 33

Red River Valley Water Supply Project SDEIS
Underhill, J.C. 1989. The Distribution of Minnesota fishes and Late Pleistocene Glaciation. Journal of the Minnesota Academy of Science 38: 32-37.
U.S. Census Bureau, Department of Commerce. 2000. Statistical Abstract of the United States. Washington, D.C.
U.S. Census Bureau, Department of Commerce. 2006. 2002 Economic Census. Washington, D.C.
U.S. Forest Service. 2001. Land and Resource Management Plan for the Dakota Prairie Grasslands, Northern Region. USDA-USFS, Chadron, Nebraska.
U.S. Forest Service. 2000. Conservation Assessment for Ram’s Head Lady Slipper (Cypripedium arietinum). Chequamegon-Nicolet National Forest, USDA Forest Service, Eastern Region. 22pp.
USGS n.d. water- resources data reports, published annually and available online at http://water.usgs.gov/pubs/
USGS and U.S. Environmental Protection Agency. 1999. National Hydrography Dataset (NHD). http://nhd.usgs.gov/ last Accessed 15 Dec, 2005.
U.S. Global Change Research Program. 2000. U.S. National Assessment of the Potential Consequences of Climate Variability and Change, Sector: Water Resources, http://www.usgcrp.gov/usgcrp/Library/nationalassessment/16WA.pdf.
U.S. Water Resources Council. Economic and Environmental Principles and Guidelines for Water and Related Land Resources Implementation Studies. Washington, D.C. 1983.
Uspenskaya, A. V. 1955. Biology, distribution and economic importance of Myxosoma cerebralis, the causative agent of twist disease in trout. Lectures of the Academy of Science, USSR, 105: 1132-1135.
Van Oosten, J. 1937. The dispersal of smelt, Osmerus mordax (Mitchill), in the Great Lakes region. Transactions of the American Fisheries Society 66:16-171.
Vitousek, P.M., C. M. D’Antonio, L. L. Loope, and R. Westbrooks. 1996. Biological invasions as global change. American Scientist 84:468-478.
Wagner, E. J. 2002. “Whirling Disease Prevention, Control, and Management: A Review.” AFS Chapter Abstracts: 217-225. Whirling Disease: Reviews and Current Topics. American Fisheries Society Symposium 29. http://www.fisheries.org/html/ publications/catbooks/wd.shtml Accessed: 8/9/06
Walters, C.J. 1986. Adaptive Management of Renewable Resources. New York, NY: Macmillan.
LC - 34

Red River Valley Water Supply Project SDEIS
Weber, Jack A. “Forecasting Demand and Measuring Price Elasticity,” Journal of the American Water Works Association, Vol. 81, No. 5. 1989.
West Consultants, Inc. 2001. Sheyenne River Geomorphology Study. Prepared for U. S. Army Corps of Engineers, St. Paul District, Contract DACW57-00-D-0001, Task Order No. 0005.
Wiche, G. J., A. V. Vecchia, L. Osborne, C. M. Wood, and J. T. Fay. 2000. Climatology, Hydrology, and Simulation of an Emergency Outlet, Devils Lake Basin, North Dakota. USGS Water-Resources Investigations Report 00-4174 http://nd.water.usgs.gov/pubs/wri/wri004174/ last accessed 15 Dec, 2005.
Wiersema, J. H. 1996. Nymphaea tetragona and Nymphaea leibergii (Nymphaeaceae): two species of diminutive water- lilies in North America. Brittonia 48(4): 520-531.
Williams, C. J. and R. F. McMahon. 1986. Power station entrainment of Corbicula fluminea (Müller) in relation to population dynamics, reproductive cycle and biotic and abiotic variables. American Malacological Bulletin, Special Edition 2:99-111.
Williams, H. V. 1926. Birds of the Red River Valley of Northeastern North Dakota. Wilson Bull. 38:17-33, 91-110.
Williams, Martin. “Estimating Urban Residential Demand for Water Under Alternative Price Measures,” Journal of Urban Economics, Vol. 18. 1985.
Williams, Martin and Byung Suh. “The Demand for Urban Water by Customer Class,” Applied Economics, Vol. 18. 1986.
Williams-Sether, T. 2004. Regression Equations for Estimating Concentrations of Selected Water-Quality Constituents for Selected Gaging Stations in the Red River of the North Basin, North Dakota, Minnesota, and South Dakota. Water-Resources Investigations Report 03-4291
Williamson, Dwight. 2006. Water Science and Management Branch, Manitoba Water Stewardship, Letter, June 30, 2006, From Dwight Williamson, Director, to Red River Valley Water Supply Project, Reclamation; Subject: Review and Comment: Draft Environmental Impact Statement, Red River Valley Water Supply Project, December 30, 2005.
Windom, H., J.T. Byrd, R.G. Smith, and F. Huan. 1991. Inadequacy of NASQANDdata for Assessing Metal Trends in the Nation’s Rivers. Environmental Science and Technology 25: 1137-1142.
Winter, Maiken, Douglas H. Johnson, Jill A. Dechant, Therese M. Donovan, and W. Daniel Svedarsky. 2001. Evaluation of the Bird Conservation Area Concept in the Northern Tallgrass Prairie. Annual report: 2001. Northern Prairie Wildlife Research Center, U.S. Geological Survey, Jamestown, North Dakota: Northern Prairie Wildlife Research Center Online. http://www.npwrc.usgs.gov/resource/2002/bca2001/bca2001.htm (Version 04Mar2002).
LC - 35

Red River Valley Water Supply Project SDEIS
Winterstein, T.A. 2007. Projected Ground-Water Use in Becker, Clay, Douglas, Grant, Otter Tail, and Wilkins Counties, Minnesota, to 2030 and 2050. Scientific Investigations Report 2006-XXXX, U.S. Department of the Interior, U.S. Geological Survey.
Wires, L.R. and R.J. Baker. 1994. Distribution of the spotted skunk (Spilogale putorius) in Minnesota. Final report submitted to the Minnesota Department of Natural Resources. 14 pp.
Wobma, P. C., W. D. Bellamy, J. P. Malley and D. A. Rockhow. 2005. “UV Disinfection and Disinfection By-Product Characteristics on an Unfiltered Water Supply.” American Water Works Association Research Foundation and City of Winnipeg, Manitoba. No. 2747. IWA Publishing, Alliance House. London, UK.
Wolf, K. 1988. Fish viruses and fish viral diseases. Comstock Publishing Associates, A division of Cornell University Press, Ithaca, New York. 476pp.
Wong, S.T. “A Model on Municipal Water Demand: A Case Study of Northeastern Illinois.” Land Economics, Vol. 48, No. 1. 1972.
Wolf, K., M. E. Markiw, and J. K. Hiltunen. 1986. Salmonid whirling disease: Tubifex tubifex (Müller) identified as the essential oligochaete in the protozoan life cycle. Journal of Fish Diseases 9:83-85.
Wolf, K., and M. E. Markiw. 1984. Biology contravenes taxonomy in the Myxozoa: new discoveries show alternation of invertebrate and vertebrate hosts. Science 225:1449-1452.
Wolken, P.M. 1995. Habitat and Life History of the Western Prairie Fringed Orchid (Platanthera praeclara). M.S. Thesis. Univ. Wyoming, Laramie. 93pp.
Wolken, P.M., C.H. Sieg, and S.E. Williams. 2001. Quantifying Suitable Habitat of the Threatened Western Prairie Fringed Orchid. Journal of Range Management. 54:611-616.
Woodhouse, Connie A. and Jonathan T. Overpeck. 1998. 2000 Years of Drought Variability in the Central United States. Bulletin of the American Meteorological Society. 79(12):2693-2714.
Wright, D. 1992. Zander hot line. Newsletter of the Introduced Fish Section, American Fisheries Society 11(3):2.
Wyckoff, A. 1985. Population assessment Calcarius ornatus (chestnut-collared longspurs), Felton prairie, Minnesota. Final report submitted to the Natural Heritage and Nongame Research Program, Department of Natural Resources. 33 pp
Young, Robert A. “Price Elasticity of Demand for Municipal Water: A Case Study of Tucson, Arizona,” Water Resources Research, Vol. 9, No. 4. 1973.
Zavaleta, E. 2000. The economic value of controlling an invasive shrub. Ambio 29(8): 462-467.
LC - 36

Red River Valley Water Supply Project FEIS
COMMON ACRONYMS
ASR BWT CAT Corps COSEWIC
CRWUD CWA DAF DEB DEIS DWRA EA EIS EPA ESA FEIS Garrison
Diversion GDU GIS GFTWD HEA HEP HUC IDC IJC IMPLAN ITA LRWD MNDNR
MR&I Needs and
Options Report
NED NEPA NTU OM&R
Aquifer Storage and Recovery Boundary Waters Treaty Cooperating Agency Team U.S. Army Corps of Engineers Committee on the Status of Endangered Wildlife In Canada Cass Rural Water Users District Clean Water Act Dissolved Air Flotation Doug Emerson Basin Draft Environmental Impact Statement Dakota Water Resources Act Environmental Assessment Environmental Impact Statement U.S. Environmental Protection Agency Endangered Species Act Final Environmental Impact Statement Garrison Diversion ConservancyDistrict Garrison Diversion Unit Geographical Information System Grand Forks-Traill Water District Habitat Equivalency Analysis Habitat Evaluation Procedures Hydrologic Unit Codes Interest During Construction International Joint Commission IMpact Analysis for PLANing Indian Trust Assets Landon Rural Water District Minnesota Department of Natural
Resources Municipal, Rural, and Industrial Report on Red River Valley WaterNeeds and Options
National Economic Development National Environmental Policy Act Nephelometric Turbidity Unit Operation, Maintenance & Replacement
PHABSIM Physical Habitat Simulation System Project Red River Valley Water Supply Project Reclamation Bureau of Reclamation ROD Record of Decision ROW Right-of-Way SARA Species at Risk Act SDEIS Supplemental Draft Environmental
Impact Statement SDWA Safe Drinking Water Act Service U.S. Fish and Wildlife Service SHPO State Historic Preservation Office USGS U.S. Geological Survey UV Ultraviolet disinfection WTP Water Treatment Plant
TECHNICAL ACRONYMS
ac-ft acre feet bgals billion gallons cfs cubic feet per second cm centimeter ft msl feet above mean sea level gpcd gallons per capita per day gpm gallons per minute km kilometer KWh kilowatt-hours mg/L milligrams per liter mgd million gallons/day Mgal million gallons ml milliliter msl mean sea level MW megawatts MWh megawatt-hours SO4 Sulfate TDS total dissolved solids µg/L microgram per liter µS/cm microsiemens per centimeter