Biphasic Mechanisms of Amphetamine Action at the Dopamine Terminal
Upload
independentCategory
view
0download
0
Hearing Research 259 (2010) 75–85
Contents lists available at ScienceDirect
Hearing Research
journal homepage: www.elsevier .com/ locate /heares
Research paper
Recording of electrically evoked auditory brainstem responses after electricalstimulation with biphasic, triphasic and precision triphasic pulses
Andreas Bahmer a,*, Marek Polak b, Uwe Baumann a
a University of Frankfurt Main, Clinic for Otolaryngology, Audiological Acoustics, 60590 Frankfurt, Germanyb MED-EL, Fürstenweg 77a, 6020 Innsbruck, Austria
a r t i c l e i n f o
Article history:Received 5 February 2009Received in revised form 25 September 2009Accepted 13 October 2009Available online 20 October 2009
Keywords:BiphasicTriphasicPrecision triphasicE-ABRCochlear implantArtifactStimulation protocol
0378-5955/$ - see front matter � 2009 Elsevier B.V. Adoi:10.1016/j.heares.2009.10.003
Abbreviations: IPG, inter-phase gap; E-ABR, electstem response; CI, cochlear implant; MCL, most counits; EAS, (combined) electrical acoustical stimulatJewett wave III; eV, electrically evoked Jewett wave V
* Corresponding author.E-mail addresses: [email protected] (A. Ba
com (M. Polak), [email protected] (U. Baumann)
a b s t r a c t
Biphasic electrical pulses are the standard stimulation pulses in current cochlear implants. In auditorybrainstem recordings biphasic pulses generate a significant artifact that disrupts brainstem responses,which are magnitudes smaller. Triphasic pulses may minimize artifacts by restoring the neural mem-brane to its resting potential faster than biphasic pulses and make auditory brainstem responses detec-tion easier. We compared biphasic pulses with triphasic and precision triphasic pulses to evokebrainstem responses in human subjects. For this purpose, electrically evoked brainstem response audi-ometry was performed in 10 (11 ears) cochlear implant patients. Artifacts and brainstem responsesevoked by bi- and triphasic stimulation were analyzed. Artifact amplitude and decay time were relatedto pulse pattern shape, but application of averaging and alternation reduced the deterioration of electri-cally evoked brainstem responses independent of pulse pattern shape. Contrary to our expectations,biphasic pulses showed a higher detectability in comparison to triphasic pulse stimulation at the samestimulation amplitude.
� 2009 Elsevier B.V. All rights reserved.
1. Introduction
1.1. Electrical stimulation in cochlear implants with biphasic andtriphasic pulses
The majority of current cochlear stimulators generate biphasiccurrent pulses consisting of two opposing polarities that followeach other in time (Fig. 1, left). Both polarities can depolarize thenerve fibers and generate an action potential (Wieringen et al.,2008). Because the cell membrane is polarity sensitive for generat-ing an action potential, the polarity of the phase plays an importantrole. However, the effectiveness of polarity is still under discussion(e.g., Wieringen et al., 2008). Auditory nerve fiber responses in ani-mals to monophasic cathodic pulses show lower thresholds than toanodic responses (Miller et al., 1998, 1999). In cat single-fiber re-sponses to sinusoidal stimuli, the most effective phase is the catho-dic phase (Hartmann et al., 1984). It is discussed whether thosefindings are applicable to human cochlear implant patients be-
ll rights reserved.
rically evoked auditory brainmfortable level; CU, clinicalion; eIII, electrically evoked
hmer), marek.polak@medel..
cause electrode positioning differs (Macherey et al., 2008). In co-chlear implant (CI) listeners, the anodic phase is more effectivethan the cathodic phase (Wieringen et al., 2008; Macherey et al.,2008). The polarity effect was applied by introducing inter-phasegaps (IPGs) or asymmetric pulses (e.g., pseudomonophasic or tri-phasic pulses, explanation below) to decrease the threshold foreliciting action potentials (Shepherd and Javel, 1999; Rubinsteinet al., 2001). In a behavioral study with CI users (Carlyon et al.,2005) and a physiological study (Prado-Guitierrez et al., 2006),the duration of the IPG correlates with a decrease in threshold.An alternative to the biphasic pulse pattern is the charge-balancedasymmetric triphasic pulse pattern. This pulse pattern is three con-secutive phases alternating in polarity. Triphasic pulses may min-imize artifacts by restoring the neural membrane to its restingpotential faster than biphasic pulses (Eddington et al., 2004). A po-tential application of this stimulus is the compensation of channelinteraction and a reduction of artifacts induced by electrical stim-ulation in brainstem responses recordings. In the latter case, largeartifacts can hamper the recordings (e.g., van den Honert and Sty-pulkowski, 1986). Thresholds for triphasic pulses are higher thanfor biphasic pulses in animals (Coste and Pfingst, 1996; Shepherdand Javel, 1999) possibly because there are two phase reversalsof the triphasic pulses instead of one, potentially reducing thestimulating effect of each phase (Wieringen et al., 2008). Triphasicpulses were also tested in a speech processing strategy (Bonnet

Fig. 1. Pulse patterns as implemented in the Pulsar/Sonata stimulator (MED-EL, Innsbruck). Left: biphasic rectangular pulses, pulse duration T, amplitude A. Middle: triphasicpulses with phase duration T/2 (phase 1 and 3) and T (phase 2), equal amplitude A. Right: precision triphasic pulses, phases with equal duration but amplitudes set to achievecharge balance (A1 for phase 1, A2 for phase 2, A2–A1 for phase 3). A more effective charge draining results (see Fig. 2).
76 A. Bahmer et al. / Hearing Research 259 (2010) 75–85
et al., 2004) with significant speech perception improvements insome conditions. The improvements may be related to the higherpulse rates that were used for triphasic pulses (Wieringen et al.,2008).
1.2. Characterization of biphasic, triphasic, and precision triphasicpulses
Triphasic and precision triphasic pulse patterns are implementedin current Pulsar and Sonata CI stimulators (MED-EL GmbH, Inns-bruck, Austria). Although triphasic pulses are not available in theclinical application of speech processors, they may be used inresearch as alternatives to standard biphasic stimulation and mayimprove the detectability of neural responses elicited by electricalstimulation. The standard triphasic pulse consists of two portionswith the same polarity and one with an opposite polarity (Fig. 1, mid-dle). To ensure equal charge, the duration of each of the two portionsis half the duration of the pulse with the opposite polarity. Parame-ters that can be set are phase duration and amplitude.
Precision triphasic pulses are more complex (Fig. 1, right). Theduration of all phases is held constant. However, to balance totalcharge the sum of the amplitudes of the two portions with thesame polarity equal the amplitude of the part of the pulse withopposite polarity. For the precision triphasic pulses, the ratio be-tween the two pulse parts with the same polarity can be set. Forinstance, if the first part is set to 80% of the maximum amplitude,the third pulse phase (same polarity) is 20% of the maximumamplitude. The amplitude of the third phase was calculated andwas set in the stimulator software. In the following, triphasicpulses are indicated as triphasic, precision triphasic pulses witheither 20%, 50% or 80% of the maximum current amplitude in thefirst part as triphasic 20, triphasic 50 or triphasic 80, respectively.
Precision triphasic pulses allow pulse phase adjustments so thatthe artifacts can be minimized (Fig. 2). Standard biphasic pulsestimulation results in a small resting artifact after the second pulsephase (Fig. 2, left). The amplitude of the third phase of the preci-sion triphasic pulse can be adjusted so that the small resting
Fig. 2. Artifact generation and time course depending on stimulus pulse patterns. Biphaspulses show immediate artifact cancellation by the third pulse phase (right).
artifact is cancelled (Fig. 2, right). The voltage after the third pulsephase is close to zero.
1.3. Electrically evoked auditory brainstem response (E-ABR)
Electrically evoked auditory brainstem response (E-ABR) audi-ometry is an objective measurement analogous to acousticallyevoked brainstem response audiometry (Brown et al., 1994). Elec-trical pulses are delivered by an intra-cochlear electrode array andstimulate subsequent physiological structures. Neuronal responsesoccurring 1–10 ms after stimulation reflect auditory nerve, co-chlear nucleus, lemnicsus lateralis, and inferior colliculus stimula-tion. The response has five prominent peaks (Fig. 3), classified intime as Jewett waves I to V (Jewett and Williston, 1971). To extractthe small responses from the EEG signal, which is 100 times great-er in magnitude, the response is averaged over many measure-ments (Burkard and Secor, 1994). During averaging the EEGsignal is aligned in time to the stimulus. The electrical stimulus it-self causes an artifact that is several magnitudes greater than arti-facts observed with acoustical stimulation. Artifacts cause severalrecording difficulties. First, the biosignal preamplifier is driven intosaturation for several ms because of input overload generated bythe electrical stimulation artifact. Therefore, the recording is dis-rupted depending on the amplifier release time. This time periodmay be accompanied by oscillations at the operating point of theamplifier. The small biosignal is mixed with the signal within thesedamped oscillations. In order to reduce the effects of amplifieroverdrive and saturation, several algorithms have been proposed(Brown et al., 1994; von Specht, 1988).
Jewett peaks appear earlier with electrical stimulation thanwith acoustical stimulation. A time shift of approximately 1 ms iscaused by bypassing outer and middle ear and directly stimulatingthe auditory nerve (e.g., Guiraud et al., 2007). E-ABR Jewett wavesare called eIII and eV (e.g., Guiraud et al., 2007) to distinguish themfrom acoustic waves.
Because of the increasing number of CI patients worldwide, it isimportant to develop reliable and sensitive measurement methods
ic pulses (left) generate a longer lasting residual artifact, whereas precision triphasic

Fig. 3. Schematic summary of the anatomical location of the neural generators ofthe auditory brain response (ABR) after acoustical stimulation. The numbers I–Vindicate the Jewett waves (Jewett and Williston, 1971). Picture reprinted fromMøller (2006) with permission of the author and Springer Science + Business Media.
A. Bahmer et al. / Hearing Research 259 (2010) 75–85 77
in E-ABR diagnostics. At present, the E-ABR recording is difficult toachieve and requires a high level of expert knowledge due to thetechnical problems outlined above. The purpose of the presentstudy is to quantify artifact generation and brainstem responsedetectability as a function of several pulse patterns. In comparisonwith standard biphasic pulses, triphasic pulses are expected to re-duce the amplitude of the artifact, and, therefore, its impact onauditory brainstem response detectability.
2. Materials and methods
2.1. Subjects
One bilaterally and nine unilaterally implanted CI patients (11ears, all MED-EL recipients) aged 24–75 years consented to partic-ipate as paid volunteers. CI experience ranged from 6 to 110
Table 1Demographic data of cochlear implant subjects. EAS: subjects combined electric-acousticpatient, cu = clinical units, Implant type: S = Sonata, P = Pulsar, Map MCL: Most comfortab
Subjects Etiology Age at test Duration of profouhearing loss (y)
S1 Inherited (progressive) 75 3S2 EAS Infection (progressive) 29 13S3 Unknown (sudden) 30 10S4 Inherited (progressive) 50 23S5 bi. Infection (progressive) 53 51S6 bi. Infection (progressive) 53 51S7 Congenital (progressive) 24 24S8 EAS Unknown (progressive) 70 4S9EAS Unknown (progressive) 27 25S10 Unknown (progressive) 70 11S11 Infection mumps (progressive) 47 41
months (subject demographics are presented in Table 1). Threesubjects using combined electric and acoustic stimulation (EAS)participated (Ilberg et al., 1999). The EAS subjects had residualhearing in the lower frequencies and used an acoustic hearingaid in combination with their CI. Except for S1, all subjects usedthe Pulsar stimulator. The difference between the Pulsar and Sona-ta stimulators is the reference electrode location. The Pulsar refer-ence electrode is located on a flexible lead that is placed under thetemporalis muscle, and the Sonata reference electrode is located onthe implant stimulator body. In general, the most apical electrode(#1) was used for stimulation. S3 had a deactivated electrode #1 soelectrode #2 was used. The study was approved by the local ethicalreview board (University of Frankfurt, 168/07).
2.2. Stimulation and recording setup
Because triphasic pulse stimulation is not available in the clin-ical fitting software, a customized setup using Matlab 7.6.0.324R2008a (The MathWorks Inc., Natick, Massachusetts) software tocontrol the implant stimulator and to record the EEG response(Bahmer et al., 2008) was developed. The E-ABR setup consists ofa standard personal computer, a digital input–output card (PCI-6533, National Instruments, Austin, Texas), an external soundcard(RME Fireface 400, Audio AG, Haimhausen, Germany) for dataaquisition, a biosignal amplifier, and a Research Interface Box 2(RIB2, Department of Ion Physics and Applied Physics at the Uni-versity of Innsbruck, Innsbruck, Austria). The RIB2 provides electri-cal isolation and a physical connection for the cochlear implant.The coil is connected to the RIB2. The National Instruments cardgenerates digital output, which is sent to the RIB2. Information istransferred to the implant in a digital data stream. The implantgenerates stimulation pulses according to the commands in thedata stream. The parameters for each stimulation pulse are definedin a complex data word. The software includes dynamic link library(DLL) functions that can be integrated in custom software systems.The RIB2 software consists of two main parts. The first part readsthe ASCII text files containing lists of stimulation pulses from thePC’s hard disc, checks them for errors, and stores them in the PCmemory, formatted for fast access during stimulation. All implantfeatures can be controlled with a temporal precision of less than1 ls, and 7-bit amplitude resolution in several amplitude ranges.The most important parameters are pulse shape (two or three suc-cessive pulse phases with alternating polarity), polarity of the firstpulse phase, duration and amplitude of each phase, and distancebetween successive pulses. The second part of the RIB2 softwareassembles the data previously loaded into memory to form thedata stream for the implant, and outputs it to the RIB2 isolationbox via the digital input–output card. There are functions to startand stop stimulation, concatenate stimulation data streams, and
stimulation and shallower insertion/shorter electrode array, bi: bilaterally implantedle level value set in the clinical fitting software.
nd Impedance (kX) Map MCL (cu) CI experience (y) CI type
5,7 810 0.6 S5,8 1053 0.5 P6,6 589 9.2 P3,9 1131 0.6 P6,9 480 0.6 P6,0 758 3.0 P7,1 629 0.6 P4,3 1020 1.3 P3 378 0.5 P11,4 435 0.6 P6,3 472 1.1 P
threshold MCL bi MCL tri MCL tri−bi
100
200
300
400
500
600
ampl
itude
[cu]
*
n = 9 9 6 6
*
*
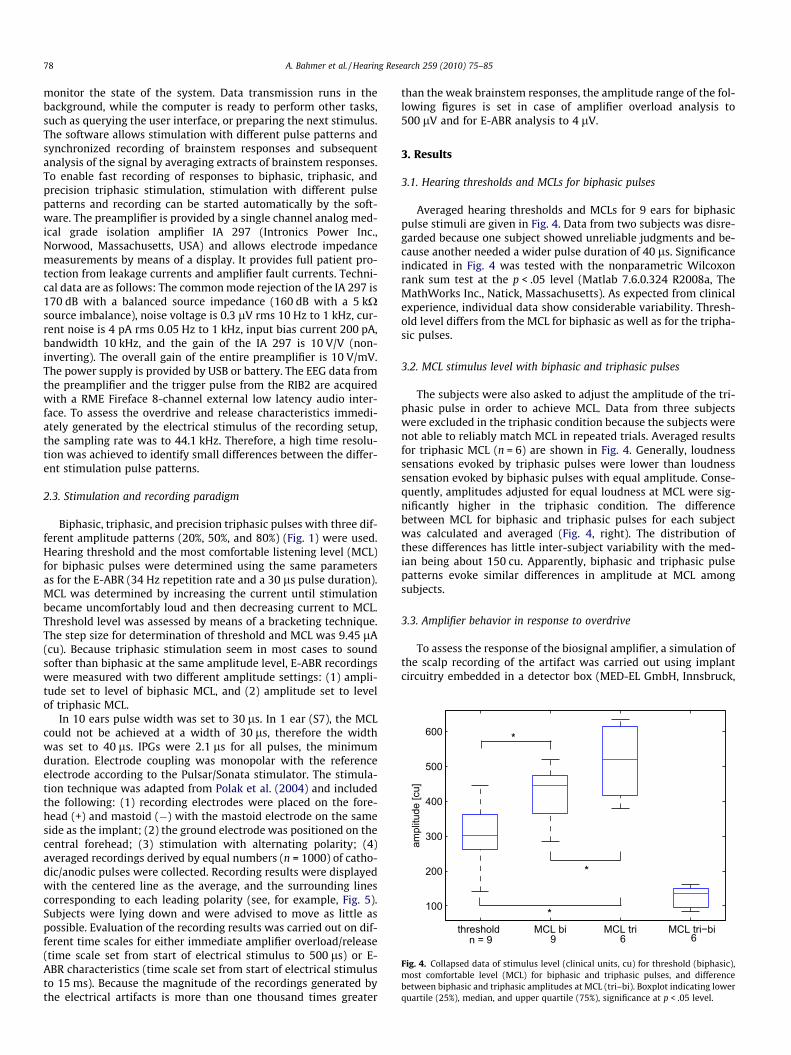
Fig. 4. Collapsed data of stimulus level (clinical units, cu) for threshold (biphasic),most comfortable level (MCL) for biphasic and triphasic pulses, and differencebetween biphasic and triphasic amplitudes at MCL (tri–bi). Boxplot indicating lowerquartile (25%), median, and upper quartile (75%), significance at p < .05 level.
78 A. Bahmer et al. / Hearing Research 259 (2010) 75–85
monitor the state of the system. Data transmission runs in thebackground, while the computer is ready to perform other tasks,such as querying the user interface, or preparing the next stimulus.The software allows stimulation with different pulse patterns andsynchronized recording of brainstem responses and subsequentanalysis of the signal by averaging extracts of brainstem responses.To enable fast recording of responses to biphasic, triphasic, andprecision triphasic stimulation, stimulation with different pulsepatterns and recording can be started automatically by the soft-ware. The preamplifier is provided by a single channel analog med-ical grade isolation amplifier IA 297 (Intronics Power Inc.,Norwood, Massachusetts, USA) and allows electrode impedancemeasurements by means of a display. It provides full patient pro-tection from leakage currents and amplifier fault currents. Techni-cal data are as follows: The common mode rejection of the IA 297 is170 dB with a balanced source impedance (160 dB with a 5 kXsource imbalance), noise voltage is 0.3 lV rms 10 Hz to 1 kHz, cur-rent noise is 4 pA rms 0.05 Hz to 1 kHz, input bias current 200 pA,bandwidth 10 kHz, and the gain of the IA 297 is 10 V/V (non-inverting). The overall gain of the entire preamplifier is 10 V/mV.The power supply is provided by USB or battery. The EEG data fromthe preamplifier and the trigger pulse from the RIB2 are acquiredwith a RME Fireface 8-channel external low latency audio inter-face. To assess the overdrive and release characteristics immedi-ately generated by the electrical stimulus of the recording setup,the sampling rate was to 44.1 kHz. Therefore, a high time resolu-tion was achieved to identify small differences between the differ-ent stimulation pulse patterns.
2.3. Stimulation and recording paradigm
Biphasic, triphasic, and precision triphasic pulses with three dif-ferent amplitude patterns (20%, 50%, and 80%) (Fig. 1) were used.Hearing threshold and the most comfortable listening level (MCL)for biphasic pulses were determined using the same parametersas for the E-ABR (34 Hz repetition rate and a 30 ls pulse duration).MCL was determined by increasing the current until stimulationbecame uncomfortably loud and then decreasing current to MCL.Threshold level was assessed by means of a bracketing technique.The step size for determination of threshold and MCL was 9.45 lA(cu). Because triphasic stimulation seem in most cases to soundsofter than biphasic at the same amplitude level, E-ABR recordingswere measured with two different amplitude settings: (1) ampli-tude set to level of biphasic MCL, and (2) amplitude set to levelof triphasic MCL.
In 10 ears pulse width was set to 30 ls. In 1 ear (S7), the MCLcould not be achieved at a width of 30 ls, therefore the widthwas set to 40 ls. IPGs were 2.1 ls for all pulses, the minimumduration. Electrode coupling was monopolar with the referenceelectrode according to the Pulsar/Sonata stimulator. The stimula-tion technique was adapted from Polak et al. (2004) and includedthe following: (1) recording electrodes were placed on the fore-head (+) and mastoid (�) with the mastoid electrode on the sameside as the implant; (2) the ground electrode was positioned on thecentral forehead; (3) stimulation with alternating polarity; (4)averaged recordings derived by equal numbers (n = 1000) of catho-dic/anodic pulses were collected. Recording results were displayedwith the centered line as the average, and the surrounding linescorresponding to each leading polarity (see, for example, Fig. 5).Subjects were lying down and were advised to move as little aspossible. Evaluation of the recording results was carried out on dif-ferent time scales for either immediate amplifier overload/release(time scale set from start of electrical stimulus to 500 ls) or E-ABR characteristics (time scale set from start of electrical stimulusto 15 ms). Because the magnitude of the recordings generated bythe electrical artifacts is more than one thousand times greater
than the weak brainstem responses, the amplitude range of the fol-lowing figures is set in case of amplifier overload analysis to500 lV and for E-ABR analysis to 4 lV.
3. Results
3.1. Hearing thresholds and MCLs for biphasic pulses
Averaged hearing thresholds and MCLs for 9 ears for biphasicpulse stimuli are given in Fig. 4. Data from two subjects was disre-garded because one subject showed unreliable judgments and be-cause another needed a wider pulse duration of 40 ls. Significanceindicated in Fig. 4 was tested with the nonparametric Wilcoxonrank sum test at the p < .05 level (Matlab 7.6.0.324 R2008a, TheMathWorks Inc., Natick, Massachusetts). As expected from clinicalexperience, individual data show considerable variability. Thresh-old level differs from the MCL for biphasic as well as for the tripha-sic pulses.
3.2. MCL stimulus level with biphasic and triphasic pulses
The subjects were also asked to adjust the amplitude of the tri-phasic pulse in order to achieve MCL. Data from three subjectswere excluded in the triphasic condition because the subjects werenot able to reliably match MCL in repeated trials. Averaged resultsfor triphasic MCL (n = 6) are shown in Fig. 4. Generally, loudnesssensations evoked by triphasic pulses were lower than loudnesssensation evoked by biphasic pulses with equal amplitude. Conse-quently, amplitudes adjusted for equal loudness at MCL were sig-nificantly higher in the triphasic condition. The differencebetween MCL for biphasic and triphasic pulses for each subjectwas calculated and averaged (Fig. 4, right). The distribution ofthese differences has little inter-subject variability with the med-ian being about 150 cu. Apparently, biphasic and triphasic pulsepatterns evoke similar differences in amplitude at MCL amongsubjects.
3.3. Amplifier behavior in response to overdrive
To assess the response of the biosignal amplifier, a simulation ofthe scalp recording of the artifact was carried out using implantcircuitry embedded in a detector box (MED-EL GmbH, Innsbruck,

A. Bahmer et al. / Hearing Research 259 (2010) 75–85 79
Austria). The MED-EL detector box mimics the behavior of an im-planted stimulator, which allows to monitor the output of eachelectrode (e.g., with an oscilloscope). The stimulation amplitudewas 425 cu, which is the same as that used in the human subjectsand allows a comparison of the results. The detector box outputwas attenuated by 40 dB to achieve a signal level comparable tohuman subject recordings and was sent to the preamplifier.Fig. 5 depicts the preamplifier behavior/characteristics in responseto the different pulse patterns. The upper and lower curves indicateaverages for each polarity of the stimulating pulses. The artifactconfiguration for different polarities is of interest because the re-sponse of the amplifier to overdrive is nonlinear for different polar-ities and amplitudes; only if both polarities match inversely, cancancellation be assured, resulting in a flat mean curve.
The measurements show a systematic relation to stimulationpulse patterns. Biphasic pulses show the largest maximum ampli-tude, triphasic pulses the smallest maximum amplitude. A changeof polarity of the artifact in the different pulse conditions can beidentified except in the triphasic 80 pulse condition. Apparentlyparts of the artifact fuse. The measurements reflect, to some extent,the characteristics of the preamplifier circuitry with its capacityand saturation behavior. In other preamplifiers, the response char-acteristic might differ, but a generally similar response pattern canbe expected.
3.4. Analysis of the electrical artifact in measurements with subjects
The amplifier response pattern (Fig. 5) is partly visible inrecordings of CI subjects (Fig. 6). For the implant simulation andfor the human subject measurements stimulation amplitude was425 cu. Neural responses are not apparent in Fig. 6 because ofthe scaling of the y-axis (100 times larger than for neural responsessee Fig. 11). Because the time scale ranges from 0 to 0.5 ms, anal-ysis of the E-ABR is precluded. In general, as expected, standard tri-phasic pulses generate less artifacts at the same level ofstimulation than biphasic pulses. This is also true in most measure-
0 0.1 0.2 0.3 0.4 0.5−500
−400
−300
−200
−100
0
100
200
300
400
500
time in ms
volta
ge [µ
V]
0 0.1 0.2−500
−400
−300
−200
−100
0
100
200
300
400
500
time i
volta
ge [µ
V]
0 0.1 0.2 0.3 0.4 0.5−500
−400
−300
−200
−100
0
100
200
300
400
500
time in ms
volta
ge [µ
V]
0 0.1 0.2−500
−400
−300
−200
−100
0
100
200
300
400
500
time i
volta
ge [µ
V]
Fig. 5. Biosignal amplifier response using input generated by an implant simulator (MEDPulse pattern from top to bottom and from left to right: biphasic, triphasic, precision traverages for each polarity of the stimulating pulses, the curve in between is the mean o
ments with precision triphasic pulses. Inter-subject differences areapparent (Fig. 7).
In order to compare individual response patterns, normalizedamplitudes of the artifacts for each subject are depicted in Fig. 8.Normalized amplitudes were calculated by dividing the set of arti-fact amplitudes for the different stimulus patterns for a subject bythe maximum artifact amplitude found in a subject. The amplitudewas determined by the difference from baseline to peak for the re-sponse with anodic (positive) phase first.
For example for S1, the maximum artifact that was found was214 lV (biphasic condition) so all artifacts in the measurementof S1 were divided by this value. This procedure was repeated forall subjects. Fig. 8 left depicts averaged normalized amplitudesfor each pulse condition. On average, the greatest artifact ampli-tudes were generated in the biphasic and the smallest in the tri-phasic pulse condition. Statistical analyses (non-overlappingnotches of boxplots in Fig. 8: different medians at 5% significancelevel) showed that the median of the averaged normalized ampli-tudes differ statistically for all pulse conditions except in the tri-phasic 20 and triphasic 50 conditions, which seem to generateequal artifact amplitude. To quantify the decay time of the stimu-lus artifact amplitude, the average time from time zero for a decayof 90% of the artifact amplitude is given in Fig. 8, right. Comparingthe different pulse conditions, the decay in the triphasic 80 condi-tion is the fastest and the triphasic 20 condition is the slowest. Theanalyses of the decay times show statistical differences betweenseveral triphasic conditions (triphasic to triphasic 20 and 50, tri-phasic 20 to 50, triphasic 50 to 80, triphasic 20 to 80) with no sta-tistical difference between triphasic and triphasic 80. The biphasicpulse statistically differs from precision triphasic 20 condition.Therefore, different pulse conditions induce significant differencesin decay time.
3.5. Artifacts generated by triphasic pulses at matched loudness
The previously determined triphasic pulse amplitude for indi-vidual MCL was used in the next set of measurements. Because
0.3 0.4 0.5n ms
0.3 0.4 0.5n ms
0 0.1 0.2 0.3 0.4 0.5−500
−400
−300
−200
−100
0
100
200
300
400
500
time in ms
volta
ge [µ
V]
-EL detector box) with the level comparable to human subject stimulation (425 cu).iphasic 20, precision triphasic 50, precision triphasic 80. The outer curves indicatef these two polarities.

0 0.1 0.2 0.3 0.4 0.5−500
−400
−300
−200
−100
0
100
200
300
400
500
time in ms
volta
ge [µ
V]
0 0.1 0.2 0.3 0.4 0.5−500
−400
−300
−200
−100
0
100
200
300
400
500
time in ms
volta
ge [µ
V]
0 0.1 0.2 0.3 0.4 0.5−500
−400
−300
−200
−100
0
100
200
300
400
500
time in ms
volta
ge [µ
V]
0 0.1 0.2 0.3 0.4 0.5−500
−400
−300
−200
−100
0
100
200
300
400
500
time in ms
volta
ge [µ
V]
0 0.1 0.2 0.3 0.4 0.5−500
−400
−300
−200
−100
0
100
200
300
400
500
time in ms
volta
ge [µ
V]
Fig. 6. Stimulation artifact recorded with the same amplifier as in Fig. 5) from a scalp measurement (subject S11). Pulse pattern from top to bottom and from left to right:Biphasic, triphasic, precision triphasic 20, precision triphasic 50, precision triphasic 80 (see Fig. 5 for further details).
0 0.1 0.2 0.3 0.4 0.5−500
−400
−300
−200
−100
0
100
200
300
400
500
time in ms
volta
ge [µ
V]
0 0.1 0.2 0.3 0.4 0.5−500
−400
−300
−200
−100
0
100
200
300
400
500
time in ms
volta
ge [µ
V]
Fig. 7. Artifacts variability in two subjects for precision triphasic 50 pulses (left: subject S10, right: subject S7, see Fig. 5 for further details).
biphasic triphasic triphasic 20 triphasic 50 triphasic 80
0.2
0.3
0.4
0.5
0.6
0.7
0.8
0.9
1
norm
aliz
ed m
axim
um a
mpl
tidue
[a.u
.]
n = 11
biphasic triphasic triphasic 20 triphasic 50 triphasic 80
0.1
0.15
0.2
0.25
0.3
0.35
0.4
0.45
0.5
0.55
time
of 9
0% a
mpl
itude
dec
ay [m
s]
n = 11
** *
* * *
Fig. 8. Normalized amplitudes (left, a.u.: arbitrary units), and decay times (right) of artifacts generated by different pulse patterns. Medians of artifact amplitude differstatistically (p < .05) for all pulses except for triphasic 20 and triphasic 50. Statistical indication for decay times is on the graph. X: results obtained with implant simulator(detector box). Outliers that are outside 1.5 times the interquartile range from the end of the box are displayed with a + sign.
80 A. Bahmer et al. / Hearing Research 259 (2010) 75–85
A. Bahmer et al. / Hearing Research 259 (2010) 75–85 81
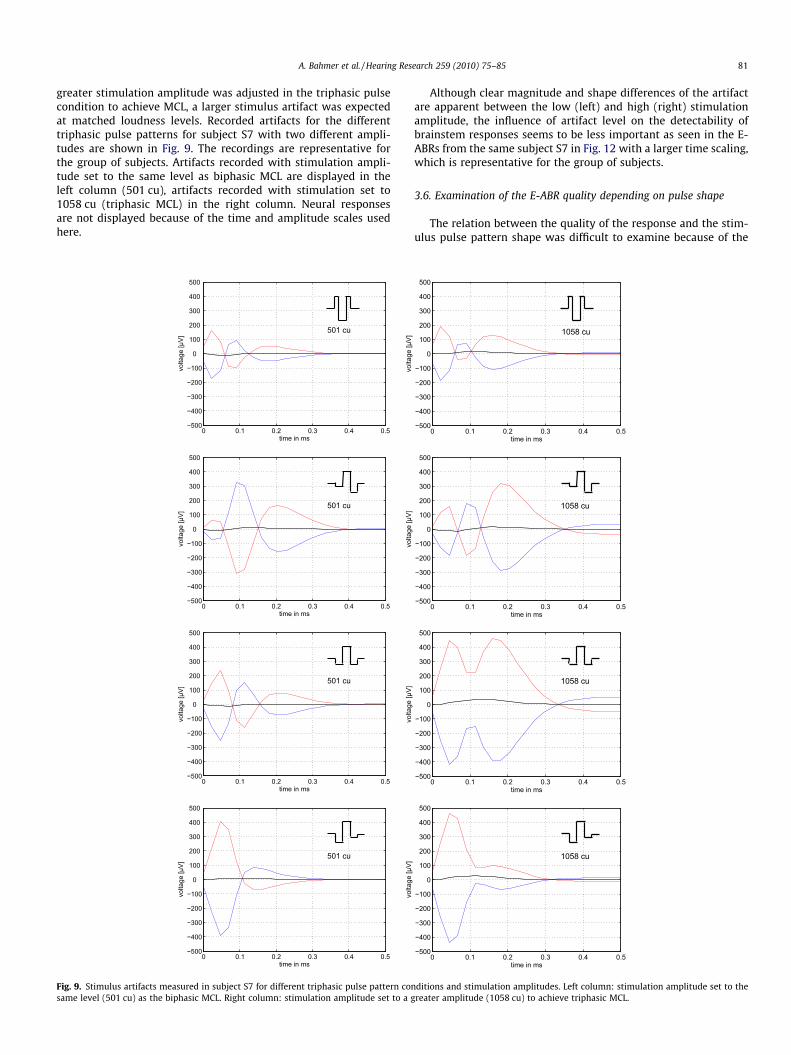
greater stimulation amplitude was adjusted in the triphasic pulsecondition to achieve MCL, a larger stimulus artifact was expectedat matched loudness levels. Recorded artifacts for the differenttriphasic pulse patterns for subject S7 with two different ampli-tudes are shown in Fig. 9. The recordings are representative forthe group of subjects. Artifacts recorded with stimulation ampli-tude set to the same level as biphasic MCL are displayed in theleft column (501 cu), artifacts recorded with stimulation set to1058 cu (triphasic MCL) in the right column. Neural responsesare not displayed because of the time and amplitude scales usedhere.
0 0.1 0.2 0.3 0.4 0.5−500
−400
−300
−200
−100
0
100
200
300
400
500
time in ms
volta
ge [µ
V]
501 cu
volta
ge [µ
V]
0 0.1 0.2 0.3 0.4 0.5−500
−400
−300
−200
−100
0
100
200
300
400
500
time in ms
volta
ge [µ
V]
501 cu
volta
ge [µ
V]
0 0.1 0.2 0.3 0.4 0.5−500
−400
−300
−200
−100
0
100
200
300
400
500
time in ms
volta
ge [µ
V]
501 cu
volta
ge [µ
V]
0 0.1 0.2 0.3 0.4 0.5−500
−400
−300
−200
−100
0
100
200
300
400
500
time in ms
volta
ge [µ
V]
501 cu
volta
ge [µ
V]
Fig. 9. Stimulus artifacts measured in subject S7 for different triphasic pulse pattern consame level (501 cu) as the biphasic MCL. Right column: stimulation amplitude set to a g
Although clear magnitude and shape differences of the artifactare apparent between the low (left) and high (right) stimulationamplitude, the influence of artifact level on the detectability ofbrainstem responses seems to be less important as seen in the E-ABRs from the same subject S7 in Fig. 12 with a larger time scaling,which is representative for the group of subjects.
3.6. Examination of the E-ABR quality depending on pulse shape
The relation between the quality of the response and the stim-ulus pulse pattern shape was difficult to examine because of the
0 0.1 0.2 0.3 0.4 0.5−500
−400
−300
−200
−100
0
100
200
300
400
500
time in ms
1058 cu
0 0.1 0.2 0.3 0.4 0.5−500
−400
−300
−200
−100
0
100
200
300
400
500
time in ms
1058 cu
0 0.1 0.2 0.3 0.4 0.5−500
−400
−300
−200
−100
0
100
200
300
400
500
time in ms
1058 cu
0 0.1 0.2 0.3 0.4 0.5−500
−400
−300
−200
−100
0
100
200
300
400
500
time in ms
1058 cu
ditions and stimulation amplitudes. Left column: stimulation amplitude set to thereater amplitude (1058 cu) to achieve triphasic MCL.

Table 2Response quality of waves eIII and eV for different pulse pattern conditions asevaluated by an experienced ABR examiner. No detectable response: ‘�’, weakresponse: ‘+’, normal response: ‘++’, clear response: ‘+++’, numbers III and V indicateparticularly the corresponding quality of waves eIII and eV, one number means onlythe corresponding wave could be evaluated.
Biphasic Triphasic Triphasic 20 Triphasic 50 Triphasic 80
S1 � � � � �S2 ++ ++ � � +S3 ++ ++ � V+ III+S4 ++ ++ + III+ ++S5 +++ ++ +++ +++ +++S6 +++ +++ +++ +++ +++S7 +++ + ++ + ++S8 ++ + ++ + +S9 +++ � + III+ ++S10 +++ V+ +++ +++ +++S11 III+V+++ � � � �
82 A. Bahmer et al. / Hearing Research 259 (2010) 75–85
large variation in the impact of the electrical stimulus artifact andthe brainstem response itself between subjects. Some recordingsshowed clearly identifiable response patterns and others did not.To determine a correlation between neural response and pulseshape an examination was carried out two ways: (1) calculationof response amplitude and latency, (2) subjective classificationby an experienced ABR examiner of visual response salience. Forboth ways, triphasic stimulus amplitude was set to the sameamplitude for biphasic pulse MCL. Quantitative evaluations of re-sponse amplitude at brainstem responses eIII and eV are given inFig. 10. The latencies after stimulation for different pulse patternsshow no significant differences. In addition, to quantify the sal-ience of eIII and eV, the differences between peak response ampli-tude and amplitude 0.5 ms before peak were calculated andgrouped by pulse pattern (Fig. 10, bottom). Averaged results donot show significant differences because of the large variability be-tween subjects. Comparing averages between biphasic and tripha-sic conditions, a trend towards lower average response amplitudein triphasic conditions is visible. This observation agrees with theless loud perception in the triphasic condition with stimulusamplitude set to biphasic MCL.
Table 2 shows the quality of the brainstem response in terms ofthe detectability of eIII and eV as rated by an experienced ABRexaminer. Symbols (+/�) indicate results for both quality of eIIIand eV, in case of a sole appearance of roman numbers III/V, onlythe Jewett wave eIII or eV could be evaluated. ‘‘Weak response”
biphasic triphasic tri20 tri50 tri801
1.5
2
2.5
3
3.5
4
4.5
5
late
ncy
[ms]
n = 10 8 8 6 9
eIII
eV
biphasic triphasic tri20 tri50 tri800
0.1
0.2
0.3
0.4
0.5
ampl
itude
diff
eren
ce [µ
V]
eIII
Fig. 10. Top: Averaged latencies of waves eIII and eV. Stimulation parameters are pulse paand at 0.5 ms before the peak of eIII and eV. 10 subjects with detectable responses (ratedOutliers that are outside 1.5 times the interquartile range from the end of the box are d
is defined as a lower response amplitude than expected from anABR from normal hearing subject, ‘‘normal response” is similar re-sponse amplitude, ‘‘clear response” is higher response amplitude.Although the judgments are somewhat arbitrary they give a roughqualitative overview in addition to the quantitative evaluation out-lined above. According to this classification, no clearly favourablepulse pattern condition emerges for evoking clear responses.
biphasic triphasic tri20 tri50 tri800
0.1
0.2
0.3
0.4
0.5
ampl
itdue
diff
eren
ce [µ
V]
eV
ttern conditions. Bottom: response amplitude differences between the value at peakby an experienced ABR examiner) are considered (see Table 2 for a quality analysis).isplayed with a + sign.

A. Bahmer et al. / Hearing Research 259 (2010) 75–85 83
The effect of stimulus amplitude on brainstem response can beobserved in the recordings of S7 obtained in different pulse condi-tions (Fig. 11 triphasic stimulation with same level of stimulationas in the biphasic condition, Fig. 12 triphasic stimuli with ampli-tude set to MCL). Interestingly, precision triphasic stimuli at MCLwith higher stimulation level (Fig. 12, lower row) showed clear re-sponses also for eIII. Nevertheless, no clear correlation of the dis-tinctiveness of wave eIII with increase of the first pulse part ofthe precision triphasic pulses (from 20, 50, to 80) can be seen. Tri-phasic pulse show, in comparison to precision triphasic pulses, atrend of a lower detectability for stimulation at equal current levels
0 5 10 15−4
−3
−2
−1
0
1
2
3
4
time [ms]
volta
ge [µ
V]
0 5−4
−3
−2
−1
0
1
2
3
4
time
volta
ge [µ
V]
0 5 10 15−4
−3
−2
−1
0
1
2
3
4
time [ms]
volta
ge [µ
V]
0 5−4
−3
−2
−1
0
1
2
3
4
time
volta
ge [µ
V]
Fig. 11. Recording of neural responses of subject S7 in different pulse conditions, butoriginated by the switch-on of the implant radio frequency in order to power-up supply
0 5 10 15−4
−3
−2
−1
0
1
2
3
4
time [ms]
volta
ge [µ
V]
0 5−4
−3
−2
−1
0
1
2
3
4
time [
volta
ge [µ
V]
0 5 10 15−4
−3
−2
−1
0
1
2
3
4
time [ms]
volta
ge [µ
V]
0 5−4
−3
−2
−1
0
1
2
3
4
time [
volta
ge [µ
V]
Fig. 12. Recording of neural responses of subject S7 in different pulse conditions at bip(1058 cu).
(Fig. 10, bottom). Despite the dependence of brainstem responseson the stimulus amplitude in this case, a general relation of theamplitude of the most comfortable level (MCL) listed in Table 1with the detectability of eIII and eV is not apparent.
4. Discussion
The results of the present study concerning artifact generationand brainstem responses depending on pulse shape and the corre-lation of brainstem responses to psychophysics are discussed inthe following sections.
10 15[ms]
10 15 [ms]
0 5 10 15−4
−3
−2
−1
0
1
2
3
4
time [ms]
volta
ge [µ
V]
equal current amplitude (= MCL for biphasic). Peak visible at 12 ms is an artifactvoltage.
10 15ms]
10 15ms]
0 5 10 15−4
−3
−2
−1
0
1
2
3
4
time [ms]
volta
ge [µ
V]
hasic MCL for the biphasic pulse (501 cu) and triphasic MCL for all triphasic pulses

Fig. 13. Mean threshold difference (dB) between triphasic and biphasic pulsesmeasured in cats (Shepherd and Javel, 1999). The x-axis indicates the transforma-tion from biphasic to triphasic pulse patterns, leading phase cathodic, non-excitatory. Bars indicate ±1 standard error of mean (reproduced with permissionfrom the publisher).
84 A. Bahmer et al. / Hearing Research 259 (2010) 75–85
4.1. Artifact generation depending on pulse pattern
The stimulus artifact measurements depicted in Fig. 5 show differ-ent patterns in response to biphasic, triphasic and precision triphasicpulse conditions. The shape of the stimulation pulse pattern is re-flected in the measurement. Although the exact response patternare specific to the characteristics of the biosignal amplifier, the gen-eral response differences to the different pulse patterns will be thesame. In the measurement of responses derived from CI subjects,therecording electrodes setup, the active stimulation electrode and indif-ferent electrode positions within the cochlea, the tissue impedance,and other factors may influence artifact stimulation characteristics.For example, inter-individual differences are apparent in the mea-surements in Fig. 7. To estimate the impact of stimulation amplitudeon the artifact with different triphasic pulse patterns, supplementaryrecordings at stimulation amplitudes set for equal loudness were per-formed. The corresponding artifacts were comparable in their shapeacross the two levels for each pulse type and did not generally reflectthe higher stimulation amplitude in a linear increase of the artifactamplitude (Fig. 9). The distinctiveness of wave eIII and eV seems notto be strongly influenced by characteristics of the artifacts (compareFigs. 9 and 12). The difference in artifact height (Fig. 8, left), mightbe important for analysis of wave eI, which is hidden under the over-drive release artifact of the preamplifier.
The analysis of the artifact amplitude at the same stimulationamplitude showed (1) that triphasic pulse patterns show smallerartifacts than precision triphasic pulse patterns and (2) biphasicpulse patterns show the highest artifact amplitude (Fig. 8, left).
In addition to artifact level, the decay time of stimulation in-duced overdrive of the biosignal amplifier is important. The resultsdepicted in Fig. 8, right demonstrate the fastest decay time for tri-phasic 80 pulse patterns compared to all other conditions. This is inline with the theoretical consideration that triphasic pulses areable to cancel out small rests of charge (see introduction). Thedetectability and identification of auditory brainstem responsesis affected only slightly by the level of the electrically induced arti-fact emitted by the implant under the following conditions:
(1) alternating stimulus pulses are applied;(2) biosignal amplifier behavior is symmetric at cathodic or ano-
dic overdrive;(3) decay time of the amplifier is fast enough to preserve linear-
ity; and(4) stable conditions in terms of recording electrode configuration,
vigilance of the subject, amplifier (thermal drift) are given.
That the location of the indifferent electrode in Pulsar and Sona-ta implants is different might have an impact on the stimulus arti-fact pattern. Because only one subject with a Sonata implant withthe indifferent electrode located on the stimulator participated, noconclusions can be drawn.
Alternating stimulus polarity and averaging algorithms wereapplied to release E-ABRs from electrical artifacts. Sophisticatedmethods such as a ‘‘scaled template” paradigm or novel methodsfor alternating stimulation (Alvarez et al., 2007), could potentiallyreduce stimulus artifacts more effectively.
4.2. Psychoacoustics – electrophysiologic measurements (E-ABR)
The present results show a lower loudness perception of triphasicpulses compared to biphasic pulses when amplitude charge is heldconstant at biphasic MCL. To adjust for triphasic MCL more currentwas needed than for biphasic MCL. In electrophysiologic recordings(Fig. 13) (Shepherd and Javel, 1999) a difference in threshold for tri-
phasic and biphasic pulses was observed. In those recordings, datafrom seven neurons of auditory nerve fibers from adult cats were col-lected. The stimulus pattern was successively changed from a bipha-sic pulse to a triphasic pulse (Fig. 13, x-axis). The pulses had the samecurrent load but differed in time course. Threshold increase washighest for triphasic pulse consisting of symmetric cathodic phases(similar to triphasic pulses in the present study). Although electro-physiologic recordings and psychophysical data cannot be directlycompared, the trend toward lower impact of triphasic pulses in com-parison with biphasic pulses is obvious in both experiments.
The present data showed a remarkable difference between bi-phasic and all triphasic pulse pattern (amplitude median greaterthan 150 cu at MCL), which is comparable to the range betweenthreshold and MCL (Fig. 4). The relation of loudness perceptionand physiologic response is reflected in Fig. 12. In this subject, sim-ilar response amplitudes of eIII and eV for biphasic and precisiontriphasic pulses are apparent when amplitude was adjusted toequal loudness. In order to assess the feature of the response pat-tern of biphasic, triphasic and precision triphasic pulses an equalamplitude approach was applied. Analysis of brainstem responsequality (Table 2) displays no clear benefit from triphasic pulse pat-terns. Concerning the response quality, biphasic pulses perform inmost cases better than triphasic pulses. Nevertheless, applicationof precision triphasic pulses may be advantageous to obtain clearlydetectable brainstem responses in some cases because of variabil-ity in subjects’ physiological and anatomical peculiarities and inthe recording setup. Therefore, triphasic pulse shapes seem to bea valuable option to find an individually optimized pulse stimula-tion paradigm for E-ABR.
5. Conclusions
� At the same current amplitude, biphasic pulses evoke the sensa-tion of higher loudness and higher level of artifact than triphasicpulses.
� Triphasic pulse patterns do not necessarily result in betterdetectability of brainstem waves eIII or eV.
� Precision triphasic pulses show clearer E-ABR responses thanpure triphasic pulses.
� To compensate for the variability in recording setups and theirpotential distortion of brainstem recordings, triphasic pulse pat-terns should be available for E-ABR.

A. Bahmer et al. / Hearing Research 259 (2010) 75–85 85
Acknowledgements
The authors would like to thank Otto Peter from the Universityof Innsbruck for providing the interface (RIB2) for the MED-EL co-chlear implants. We also would like to thank two anonymousreviewers for their valuable advice and Dr. Jane M. Opie for gram-mar review. The recordings were performed under the authoriza-tion of the Ethic committee of the University of Frankfurt. Thework was supported by the grant from the Deutsche Forschungs-gemeinschaft (BA 2085/3-1).
References
Alvarez, I., Torre, A., Sainz, M., Roldan, C., Schoesser, H., Spitzer, P., 2007. Generalizedalternating stimulation: a novel method to reduce stimulus artifact inelectrically evoked compound action potentials. J. Neurosci. Meth. 165, 95–103.
Bahmer, A., Peter, O., Baumann, U., 2008. Recording of electrically evoked auditorybrainstem responses (E-ABR) with an integrated stimulus generator in Matlab. J.Neurosci. Meth. 173, 306–314.
Bonnet, R.M., Frijns, J.H., Peeters, S., Briaire, J.J., 2004. Speech recognition with acochlear implant using triphasic charge-balanced pulses. Acta Otolaryngol. 124,371–375.
Brown, C.J., Abbas, P.J., Fryauf-Bertschy, H., Kelsay, D., Gantz, J., Bruce, J., 1994.Intraoperative and postoperative electrically evoked auditory brain stemresponses in nucleus cochlear implant users: implications for the fittingprocess. Ear Hear. 15, 168–176.
Burkard, R.F., Secor, C., 1994. Handbook of Clinical Audiology. Lippincott Williamsand Wilkins (Chapter: Overview of Auditory Evoked Potentials).
Carlyon, R.P., van Wieringen, A., Deeks, J.M., Long, C.J., Lyzenga, J., Wouters, J., 2005.Effect of inter-phase gap on the sensitivity of cochlear implant users toelectrical stimulation. Hear. Res. 205, 210–224.
Coste, R.L., Pfingst, B.E., 1996. Stimulus features affecting psychophysical detectionthresholds for electrical stimulation of the cochlea. III. Pulse polarity. J. Acoust.Soc. Am. 99, 3099–3108.
Eddington, D.K., Tierney, J., Noel, V., Hermann, B., Whearty, M., Finley, C.C., 2004.Speech processors for auditory prostheses. In: Ninth Quarterly Progress Report.NIH Contract N01-DC-2-1001.
Guiraud, J., Gallego, S., Arnold, L., Boyle, P., Truy, E., Collet, L., 2007. Effects ofauditory pathway anatomy and deafness characteristics? (1): on electricallyevoked auditory brainstem responses. Hear. Res. 223, 48–60.
Hartmann, R., Topp, G., Klinke, R., 1984. Discharge patterns of cat primary auditoryfibers with electrical stimulation of the cochlea. Hear. Res. 13, 47–62.
Ilberg, C., Kiefer, J., Pfenningdorff, J.T.T., Hartmann, R., Stuerzebecher, E., Klinke, R.,1999. Electric-acoustic stimulation of the auditory system – new technology forsevere hearing loss. J. Oto Rhino Laryngol. 61, 334–340.
Jewett, D.L., Williston, J.S., 1971. Auditory-evoked far fields averaged from the scalpof humans. Brain 94, 681–696.
Macherey, O., Carlyon, R.P., van Wieringen, A., Deeks, J.M., Wouters, J., 2008. Highersensitivity of human auditory nerve fibers to positive electrical currents. J.Assoc. Res. Otolaryngol. 9, 241–251.
Miller, A.C., Abbas, P.J., Robinson, B.K., Rubinstein, J.T., Matsuoka, A.J., 1999.Electrically evoked single-fiber action potentials from cat: responses tomonopolar, monophasic stimulation. Hear. Res. 130, 197–218.
Miller, C.A., Abbas, P.J., Rubinstein, J.T., Robinson, B.K., Matsuoka, A.J., Woodworth,G., 1998. Electrically evoked compound action potentials of guinea pig and cat:responses to monopolar, monophasic stimulation. Hear. Res. 119, 142–154.
Møller, A., 2006. Intraoperative Neurophysiologic Monitoring. Springer, Berlin,Heidelberg, New York.
Polak, M., Eshraghi, A., Nehme, O., Ahsan, S., Guzman, J., Delgado, R., He, J., Telischi,F., Balkany, T., Water, T.V.D., 2004. An efficient method for evaluating hearingand auditory nerve function by combining ABR, DPOAE and EABR tests into asingle recording session. J. Neurosci. Met. 134, 141–149.
Prado-Guitierrez, P., Fewster, L.M., Heasman, J.M., McKay, C.M., Shepherd, R.K., 2006.Effect of interphase gap and pulse duration on electrically evoked potentials iscorrelated with auditory nerve survival. J. Neurophysiol. 215, 47–55.
Rubinstein, J.T., Miller, C.A., Mino, H., Abbas, P.J., 2001. Analysis of monophasic andbiphasic electrical stimulation of nerve. IEEE Trans. Biomed. Eng. 48, 1065–1070.
Shepherd, R.K., Javel, R.K., 1999. Electrical stimulation of the auditory nerve. II.Effect of stimulus waveshape on single fibre response properties. Hear. Res. 130,171–188.
van den Honert, C., Stypulkowski, P.H., 1986. Characterization of the electricallyevoked auditory brainstem response (ABR) in cats and humans. Hear. Res. 21,109–126.
von Specht, H., 1988. Progress in Computer-Assisted Function Analysis. NorthHolland, Amsterdam (Chapter: Improvement of Averaging Method forRegistration of Auditory Evoked Potential).
Wieringen, A., Macherey, O., Carlyon, R.P., Deeks, J.M., Wouters, J., 2008. Alternativepulse shapes in electrical hearing. Hear. Res. 242, 154–163.
Copyright © 2022 FDOKUMEN