Nasopalatine duct cyst – diagnosis, treatment and ... - SciELO
Upload
univ-bordeauxCategory
view
0download
0
ARTICLE IN PRESS
0277-3791/$ - se
doi:10.1016/j.qu
�Correspond987-3635.
E-mail addr
Quaternary Science Reviews 24 (2005) 897–924
Reconstruction of sea-surface conditions at middle to high latitudesof the Northern Hemisphere during the Last Glacial Maximum
(LGM) based on dinoflagellate cyst assemblages
A. de Vernala,�, F. Eynaudb, M. Henrya, C. Hillaire-Marcela, L. Londeixb, S. Manginb,J. Matthiessenc, F. Marretd, T. Radia, A. Rochone, S. Solignaca, J.-L. Turonb
aGEOTOP, Universite du Quebec a Montreal, P.O. Box 8888, Montreal, Que., Canada H3C 3P8bDepartement de Geologie et Oceanographie, UMR 5805 CNRS, Universite Bordeaux I, Avenue des Facultes, 33405 Talence Cedex, France
cAlfred Wegener Institute for Polar and Marine Research, P.O. Box 120161, D27515 Bremerhaven, GermanydSchool of Ocean Sciences, University of Wales Bangor, Menai Bridge LL59 5EY, UK
eInstitut des Sciences de la mer de Rimouski (ISMER), Universite du Quebec a Rimouski, 310, allee des Ursulines, Rimouski, Que., Canada G5L 3A1
Received 21 November 2003; accepted 30 June 2004
Abstract
A new calibration database of census counts of organic-walled dinoflagellate cyst (dinocyst) assemblages has been developed from
the analyses of surface sediment samples collected at middle to high latitudes of the Northern Hemisphere after standardisation of
taxonomy and laboratory procedures. The database comprises 940 reference data points from the North Atlantic, Arctic and North
Pacific oceans and their adjacent seas, including the Mediterranean Sea, as well as epicontinental environments such as the Estuary
and Gulf of St. Lawrence, the Bering Sea and the Hudson Bay. The relative abundance of taxa was analysed to describe the
distribution of assemblages. The best analogue technique was used for the reconstruction of Last Glacial Maximum (LGM) sea-
surface temperature and salinity during summer and winter, in addition to sea-ice cover extent, at sites from the North Atlantic
(n=63), Mediterranean Sea (n=1) and eastern North Pacific (n=1). Three of the North Atlantic cores, from the continental margin
of eastern Canada, revealed a barren LGM interval, probably because of quasi-permanent sea ice. Six other cores from the
Greenland and Norwegian seas were excluded from the compilation because of too sparse assemblages and poor analogue situation.
At the remaining sites (n= 54), relatively close modern analogues were found for most LGM samples, which allowed
reconstructions. The new LGM results are consistent with previous reconstructions based on dinocyst data, which show much
cooler conditions than at present along the continental margins of Canada and Europe, but sharp gradients of increasing
temperature offshore. The results also suggest low salinity and larger than present contrasts in seasonal temperatures with colder
winters and more extensive sea-ice cover, whereas relatively warm conditions may have prevailed offshore in summer. From these
data, we hypothesise low thermal inertia in a shallow and low-density surface water layer.
r 2004 Elsevier Ltd. All rights reserved.
1. Introduction
The earliest reconstructions of the Last GlacialMaximum (LGM) ocean published by CLIMAP(1981) constituted a major breakthrough in paleoceano-graphy and paleoclimatology. These reconstructions of
e front matter r 2004 Elsevier Ltd. All rights reserved.
ascirev.2004.06.014
ing author. Tel.: +1-514-987-3000x8599; fax: +1-514-
ess: [email protected] (A. de Vernal).
summer and winter sea-surface temperatures (SSTs)were principally established from transfer functionsbased on multiple regression techniques and planktonicforaminifer data (Imbrie and Kipp, 1971). Since thispioneer work, many methodological approaches havebeen developed for the reconstruction of past climaticparameters based on an array of biological indicators,notably pollen grains, diatoms, dinoflagellate cysts,radiolarians, planktonic foraminifera, ostracods, andcoccoliths. Various data treatment techniques were also

ARTICLE IN PRESS
Fig. 1. Location of surface sediment samples used to establish the
updated ‘‘n=940’’ reference dinocyst database, which was developed
after the ‘‘n=371’’ database (de Vernal et al., 1997; Rochon et al.,
1999) and the ‘‘n=677’’ database (de Vernal et al., 2001), and includes
the regional data sets from the northeastern North Pacific (Radi and de
Vernal, 2004) and the Mediterranean Sea (Mangin, 2002), notably. The
isobaths correspond to 1000 and 200m of water depth.
A. de Vernal et al. / Quaternary Science Reviews 24 (2005) 897–924898
developed or adapted to the analyses of the diversemicropaleontological populations. They mainly includetechniques using the degree of similarity between fossiland modern assemblages (e.g., Guiot, 1990; Pflaumannet al., 1996; Waelbroeck et al., 1998), and the artificialneural network techniques (e.g., Malmgren and Nor-dlund, 1997; Weinelt et al., 2003). In addition to theabove-mentioned approaches based on the analyses ofmicrofossil populations, biogeochemical analyses oforganic compounds, such as alkenones produced bycoccolithophorids, or the measurement of trace ele-ments, such as Mg/Ca or Sr/Ca in biogenic calcite,yielded insights into past temperatures in the watercolumn (e.g., Rosell-Mele, 1998; Lea et al., 1999;Nurnberg et al., 2000).Many of these recently developed methods have been
applied to re-evaluate the sea-surface conditions whichprevailed during the LGM. In addition to the CLIMAP(1981) scenario, there are now many LGM data setsavailable on regional scales. For example, at the scale ofthe northern North Atlantic, there are data sets based onplanktonic foraminifera (Weinelt et al., 1996; Pflaumannet al., 2003; Sarnthein et al., 2003), dinoflagellate cysts (deVernal et al., 2000, 2002), and alkenone biomarkers(Rosell-Mele, 1997; Rosell-Mele and Comes, 1999; Rosell-Mele et al., 2004). Comparison of the paleoceanographi-cal data sets has revealed significant discrepancies, notablyin terms of paleotemperature estimates.With the aim to compare and eventually to reconcile
paleoceanographical reconstructions based on differentproxies, an intercalibration exercise has been under-taken within the frame of the Multiproxy Approach forthe Reconstruction of the Glacial Ocean (MARGO)Project. The first step was to adopt a commonhydrography for the calibration of the temperature vs.proxy relationships, in order to avoid any bias that canbe related to initial oceanographical data inputs. The‘‘standardised’’ hydrography that has been selected forthe present MARGO exercise is the 1998 version of theWorld Ocean Atlas produced by the National Oceano-graphic Data Center (NODC). In the present paper, weare thus reporting on (i) the updated modern databaseof dinoflagellate cyst assemblages, (ii) the results fromcalibration exercises with the standardised hydrography(summer and winter SSTs) and other key parameterssuch as salinity and sea-ice cover, (iii) the sea-surfacecondition reconstructions for the LGM interval definedby Environmental Processes of the Ice age: Land,Oceans, and Glaciers (EPILOG) criteria as the intervalof maximum continental ice volume during the lastglaciation, which spanned from ca. 23 to 19 kyr beforepresent (Schneider et al., 2000; Mix et al., 2001).Data presented here are representative of middle to
high latitudes of the Northern Hemisphere. The referencedinocyst database for the hemisphere includes 940 sitesfrom the North Atlantic, North Pacific and Arctic oceans,
and their adjacent seas (see Fig. 1). This databaseconstitutes an update of the ‘‘n=371’’ (cf. Rochon etal., 1999) and ‘‘n=677’’ (cf. de Vernal et al., 2001)databases. The update notably includes additional sitesfrom the North Atlantic (Marret and Scourse, 2003;Marret et al., 2004), the Mediterranean Sea (Mangin,2002), and the North Pacific (Radi and de Vernal, 2004).This database was used here to produce an update ofLGM reconstructions of SST, salinity and sea-ice cover,which were published previously for a number of sitesfrom the northern North Atlantic (cf. de Vernal et al.,2000). Four additional LGM sites are included in thepresent compilation. Two are from the northern NorthAtlantic, one from the Mediterranean Sea, and one fromthe Gulf of Alaska in the northeastern Pacific.
2. Methodology for sea-surface reconstructions
2.1. Dinoflagellate cyst data
2.1.1. The ecology of dinoflagellates and their cysts
Dinoflagellates occur in most aquatic environmentsand constitute one of the main primary producers in

ARTICLE IN PRESSA. de Vernal et al. / Quaternary Science Reviews 24 (2005) 897–924 899
marine environments, together with diatoms and cocco-lithophorids. Living dinoflagellates are not fossilisable.However, during their life cycle, after the fusion of thegametes for sexual reproduction, some taxa producehighly resistant organic-walled cysts protecting thediploid cells for a dormancy period of variable length(e.g., Wall and Dale, 1968; Dale, 1983). The organic-walled cysts of dinoflagellates (or dinocysts) thusrepresent only a fragmentary picture of the originaldinoflagellate populations (e.g., Dale, 1976; Head,1996). Amongst dinoflagellates producing cysts cur-rently recovered in geological samples, there are mainlyspecies belonging to the orders of Gonyaulacales,Peridiniales and Gymnodiniales. Gonyaulacales areautotrophic whereas Peridiniales and Gymnodinialesmay have heterotrophic or mixotrophic behaviour (e.g.,Gaines and Elbracher, 1987; Taylor and Pollingher,1987). These taxa that belong to phytoplankton ormicrozooplankton develop and bloom in surface waters.They are usually recovered together, from planktonsamples collected on a routine basis in the upper 50m(e.g., Dodge and Harland, 1991) or 100m (e.g., Raine etal., 2002) of the water column. Their living depth isrelatively shallow since the autotrophic taxa aredependant upon light penetration, and because thehabitat of the heterotrophic species appears to be closelycoupled to diatoms on which they feed and/or to themaximum chlorophyll zone (e.g., Gaines and Elbracher,1987). Moreover, despite their ability to move verticallywith their flagella, dinoflagellates generally inhabit arelatively thin and shallow surface layer, especially instratified marine environments, because they cannotmigrate across the pycnocline that constitutes animportant physical barrier (cf. Levandowsky andKaneta, 1987).Planktonic dinoflagellates in the North Atlantic show
distribution patterns of species in surface water closelyrelated to salinity and temperature, which are controlledby current patterns (e.g., Dodge and Harland, 1991;Dodge, 1994; Raine et al., 2002). Nearshore assemblagescan also be distinguished from oceanic assemblages,with regard to the species diversity and taxa dominance.The biogeographical distributions of cyst-forming dino-flagellates in surface waters and that of dinocysts insediments are generally consistent with each other,notably with respect to their onshore–offshore patternsand latitudinal gradients (Dodge and Harland, 1991;Dodge, 1994). However, the correspondence betweenobservations of motile and cyst assemblages is notperfect, probably due to the fact that the motiledinoflagellates in the plankton assemblages correspondto an instantaneous time interval, whereas the cysts insurface sediments may represent several years or decadesof sedimentary fluxes.The distribution of dinocysts in sediments has been
relatively well documented and has contributed to our
understanding of the average sea-surface conditions thatdetermine the distribution pattern and abundances ofthe taxa. Since the early works of Wall et al. (1977),Harland (1983), and Turon (1984), the relative abun-dance of dinocyst taxa is known to follow distributionpatterns closely related to the temperature gradients andto show distinct neritic, outer neritic and oceanicassemblages. During the last two decades, many studieshave contributed to the description of the dinocystdistribution on the sea floor. These illustrate qualita-tively or quantitatively the relationships between dino-cyst assemblages and sea-surface parameters includingtemperature and salinity, sea-ice cover, productivity,upwelling and eutrophication (for reviews, see e.g.,Dale, 1996; Mudie et al., 2001; Marret and Zonneveld,2003).
2.1.2. The establishment of the modern dinocyst database
To develop the reference database, we have analysedsurface sediment samples that were mostly collectedfrom box cores or gravity cores. Although samples weretaken from the uppermost 1 or 2 cm in the sedimentarycolumn, they may represent the last 101–103 yearsdepending upon sediment accumulation rates, andbiological mixing intensity and depth in sediment. Moreinformation on sampling or subsampling, laboratoryprocedures, the nature of palynological assemblages ingeneral, and the abundance, preservation, and speciesdiversity of dinocyst assemblages can be found inoriginal publications of the regional data sets availablefor the northern Baffin Bay (Hamel et al., 2002), theCanadian Arctic (Mudie and Rochon, 2001), theRussian Arctic, including the Laptev Sea (Kunz-Pirrung, 1998, 2001) and the Barents Sea (Voronina etal., 2001), the Arctic Ocean as a whole (de Vernal et al.,2001), the Labrador Sea (Rochon and de Vernal, 1994)and northwest North Atlantic (de Vernal et al., 1994),the northeast North Atlantic (Rochon et al., 1999), theNorwegian and Greenland Seas (Matthiessen, 1995), theCeltic Sea (Marret and Scourse, 2003), the NorwegianCoast (Grøsfjeld and Harland, 2001), the Icelandic Sea(Marret et al., 2004), the Estuary and Gulf of St.Lawrence in eastern Canada (de Vernal and Giroux,1991), the Bering Sea (Radi et al., 2001), the north-eastern North Pacific (Radi and de Vernal, 2004), andthe Mediterranean Sea (Mangin, 2002).Although it is derived from a number of regional data
sets, the n=940 database is internally consistent withrespect to laboratory procedures and taxonomy. Thisdatabase actually results from a collective endeavourthat started about 15 years ago.With regard to sample preparation, the standardised
protocol consists of repeated HCl and HF treatments ofthe410 mm fraction (for details, see de Vernal et al.,1999; Rochon et al., 1999). This protocol avoidstreatment with oxidant agents because the organic cyst

ARTICLE IN PRESS
Table 1
List of dinocyst taxa in the n=940 database
Taxa name Code Notes
Cyst of cf. Scrippsiella trifida Alex
Achomosphaera spp. Acho
Ataxiodinium choane Atax
Bitectatodinium tepikiense Btep
Impagidinium aculeatum Iacu
Impagidinium pallidum Ipal
Impagidinium paradoxum Ipar
Impagidinium patulum Ipat
Impagidinium sphaericum Isph
Impagidinium strialatum Istr
Impagidinium plicatum Ipli
Impagidinium velorum Ivel
Impagidinium japonicum Ijap
Impagidinium spp. Ispp
Lingulodinium machaerophorum Lmac
Nematosphaeropsis labyrinthus Nlab
Operculodinium centrocarpum sensu Wall & Dale 1966 Ocen
O. centrocarpum sensu Wall & Dale 1966—short processes Ocss Grouped with O. centrocarpum sensu Wall & Dale 1966
Operculodinium centrocarpum—Arctic morphotype Oarc Grouped with O. centrocarpum sensu Wall & Dale 1966
Operculodinium israelianum Oisr
Operculodinium cf. janduchenei Ojan
Operculodinium centrocarpum—morphotype cezare Ocez Grouped with O. centrocarpum sensu Wall & Dale 1966
Polysphaeridium zoharyi Pzoh
Pyxidinopsis reticulata Pret
Spiniferites septentrionalis Ssep Grouped with Achomosphaera spp.
Spiniferites alaskum Sala
Spiniferites membranaceus Smem
Spiniferites delicatus Sdel
Spiniferites elongatus Selo
Spiniferites ramosus Sram
Spiniferites belerius Sbel Grouped with S. membranaceus
Spiniferites bentorii Sben
Spiniferites bulloideus Sbul Grouped with S. ramosus
Spiniferites frigidus Sfri Grouped with S. elongatus
Spiniferites lazus Slaz
Spiniferites mirabilis-hyperacanthus Smir
Spiniferites ramosus type granosus Sgra
Spiniferites pachydermus Spac
Spiniferites spp. Sspp
Tectatodinium pellitum Tpel
Cyst of Pentapharsodinium dalei Pdal
Islandinium minutum Imin
Islandinium? cesare Imic
Echinidinium cf. karaense Espp
Brigantedinium spp. Bspp
Brigantedinium cariacoense Bcar Grouped with Brigantedinium spp.
Brigantedinium simplex Bsim Grouped with Brigantedinium spp.
Dubridinium spp. Dubr
Protoperidinioids Peri
Lejeunecysta sabrina Lsab
Lejeunecysta oliva Loli
Lejeunecysta spp. Lspp
Selenopemphix nephroides Snep
Xandarodinium xanthum Xand
Selenopemphix quanta Squa
Cyst of Protoperidinium nudum Pnud
Protoperidinium stellatum Pste
Trinovantedinium applanatum Tapp
Trinovantedinium variabile Tvar
Votadinium calvum Vcal
Votadinium spinosum Vspi
Cyst of Protoperidinium americanum Pame
A. de Vernal et al. / Quaternary Science Reviews 24 (2005) 897–924900

ARTICLE IN PRESS
Table 1 (continued )
Taxa name Code Notes
Quinquecuspis concreta Qcon
Cyst of Polykrikos schwartzii Psch
Cyst of Polykrikos spp.—Arctic morphotype Parc
Cyst of Polykrikos kofoidii Pkof
Cyst of Polykrikos spp.—quadrangular morphotype Pqua Grouped with cyst of Polykrikos spp. Arctic morphotype
Echinidinium granulatum Egra
Gymnodinium catenatum Gcat
Gymnodinium nolleri Gnol
A. de Vernal et al. / Quaternary Science Reviews 24 (2005) 897–924 901
wall of some taxa can be altered by oxidation (cf.Marret, 1993). With the exception of a few studiessuggesting in situ oxidation of the organic wall ofprotoperidinian cysts in sediment (cf. Zonneveld et al.,2001), dinoflagellate cysts are usually considered to beextremely resistant since they are composed of refrac-tory organic matter called dinosporin (wax-like hydro-carbon; Kokinos et al., 1998). Their preservation is notaffected by dissolution processes that result in alterationof siliceous or calcareous microfossils.The taxonomy of dinoflagellates in the water column
and that of their cysts preserved in sediment are mostlyindependent, because they reflect distinct stages in thedinoflagellate life cycle, i.e., a vegetative stage and a cyststage following the sexual reproduction. The taxonomyof organic-walled dinoflagellate cysts is based on themorphology of the fossil remains. The taxonomy we areusing for routine identification was developed afterseveral workshops to ensure standardisation within thedatabase. The nomenclature of dinocyst taxa used hereconforms to Head (1996), Rochon et al. (1999), Headet al. (2001, 2005), Radi et al. (2001), de Vernal et al.(2001), Mangin (2002), and Radi and de Vernal (2004).A complete list of taxa used for statistical treatment andthe application of the best analogue technique appearsin Table 1. Counts of taxa in the 940 spectra of thereference database are reported following this taxa list(see GEOTOP site, www.geotop.uqam.ca/; see alsoMARGO data on the PANGAEA site, www.pan-gaea.de).
2.1.3. The dinocyst distribution in the calibration
database
The overall dinocyst database, including 940 spectraand 60 taxa, has been submitted to multivariateanalyses. Canonical correspondence analyses wereperformed using the CANOCO software of Ter Braakand Smilauer (1998) after logarithmic transformation(ln) of the relative frequency of taxa. Such a transfor-mation is important to discriminate dinocyst assem-blages in relation with environmental parametersbecause the dominant taxa are often opportunistic andubiquitous, whereas accompanying taxa often showaffinities for a narrow range of given hydrographical
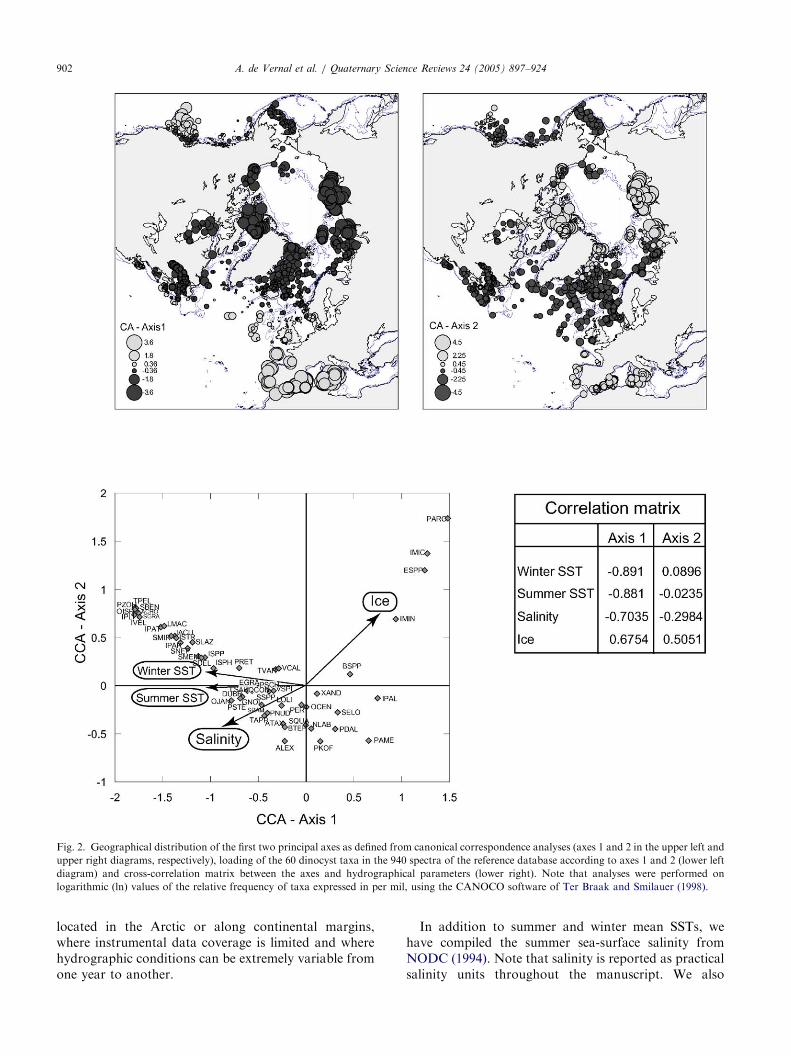
parameters, such as salinity or temperature. The firstand second axes, respectively, account for 14.9% and12.2% of the total variance. Their geographical dis-tribution and the weighting of the 60 taxa according tothe two axes are shown in Fig. 2b. The spatialdistribution of the values for the first axis reveals alatitudinal pattern, whereas the scores of the second axisshow a nearshore to oceanic trend. Canonical corre-spondence analysis and cross-correlations of the axeswith environmental parameters indicate that the assem-blage distribution is predominantly controlled by SSTand sea-ice cover extent, and that salinity also exerts adeterminant role. The correspondence analysis resultsare consistent with those obtained from principalcomponent analyses of samples from the North Atlanticand Arctic oceans (Rochon et al., 1999; de Vernal et al.,2001), which also demonstrated the dominant effect ofthe temperature and salinity on the dinocystdistribution. However, at regional scales, parametersother than temperature and salinity may determinedinocyst assemblages. Such is the case of the northeastPacific margins, where productivity as estimated fromsatellite imagery (Antoine et al., 1996) seems to be theparameter that is most closely related to the spatialdistribution of dinocysts in this area (cf. Radi and deVernal, 2004).
2.2. Hydrographic data
Following the MARGO recommendation for hydro-graphical data standardisation, we have used theseasonal means of surface temperature at 10m of waterdepth compiled from the 1998 version of the WorldOcean Atlas (cf. National Oceanographic Data Center(NODC), 1994). However, at many stations, these datawere not available. In such cases, we used seasonalmeans extracted from regional data sets, when possible.Alternatively, we have used the extrapolated fields ofdata available from the 1994 version of the World OceanAtlas (cf. NODC, 1994), as developed for the n=677database (cf. de Vernal et al., 2001). Fig. 3 illustrates thelocation of sites with available NODC (1998) data, andthe location of the sites where we had to use othersources of hydrographic data. These sites are principally
ARTICLE IN PRESS
Fig. 2. Geographical distribution of the first two principal axes as defined from canonical correspondence analyses (axes 1 and 2 in the upper left and
upper right diagrams, respectively), loading of the 60 dinocyst taxa in the 940 spectra of the reference database according to axes 1 and 2 (lower left
diagram) and cross-correlation matrix between the axes and hydrographical parameters (lower right). Note that analyses were performed on
logarithmic (ln) values of the relative frequency of taxa expressed in per mil, using the CANOCO software of Ter Braak and Smilauer (1998).
A. de Vernal et al. / Quaternary Science Reviews 24 (2005) 897–924902
located in the Arctic or along continental margins,where instrumental data coverage is limited and wherehydrographic conditions can be extremely variable fromone year to another.
In addition to summer and winter mean SSTs, wehave compiled the summer sea-surface salinity fromNODC (1994). Note that salinity is reported as practicalsalinity units throughout the manuscript. We also

ARTICLE IN PRESS
Fig. 3. Map showing the location of the 940 surface sediment samples
in the calibration database. Different symbols illustrate the source of
SST data. The black circles correspond to sites where hydrographic
data from NODC (1998) following the standard defined for MARGO
are available. The open triangles correspond to sites where NODC
(1998) data were not available, and where compilations were made
from the regional databases or from extrapolated values provided by
NODC (1994). Details on the sources of these other data can be found
in de Vernal et al. (2001). The minimum (grey zone) and maximum
(grey line) limits of sea-ice cover are defined from a compilation of
several sources.
Fig. 4. Graph showing the relationships of summer temperature vs.
winter temperature, sea-ice cover, and summer salinity in the n=940
database. As in Fig. 3, the black circles correspond to sites where
seasonal temperature data from NODC (1998) are available, and the
open triangles correspond to sites where other sources of data had to
be used.
A. de Vernal et al. / Quaternary Science Reviews 24 (2005) 897–924 903
compiled the seasonal duration of sea-ice cover withconcentration greater than 50%, as expressed in numberof months per year after the 1953–1990 data setprovided by the National Climate Data Centre inBoulder. We have limited the database to areas withsalinity higher than 17 because instrumental data aresparse and show very large dispersal of values atnearshore and estuarine sites of lower salinities. Thesummer and winter SSTs, the summer salinity and thesea-ice cover extent at each station of the n=940database, which we use for the application of the bestanalogue technique, are archived on the websites ofGEOTOP and PANGAEA.The relationships between the summer and winter
SSTs, the summer salinity and the sea-ice cover extent inthe n=940 database are illustrated in Fig. 4. They showthe combinations of summer temperature vs. wintertemperature, or sea-ice cover or salinity, and illustratethe range of hydrographical conditions we may thusreconstruct from dinocyst assemblages. It is of note thatthe range of salinity covered by the dinocyst database is
much larger than those of other micropaleontologicaltracers, notably planktonic foraminifera, which aremuch more stenohaline and representative of marineenvironments with salinity usually higher than 33 (Beand Tolderlund, 1971). Diatoms that form assemblagescharacterised by large species diversity in a wide rangeof salinities and include sea-ice taxa would have beenvery useful as complementary indicators of sea-surfaceconditions. However, to date no attempt was made toset transfer functions for quantitative reconstruction ofsalinity and sea ice in the North Atlantic. Moreover, in

ARTICLE IN PRESSA. de Vernal et al. / Quaternary Science Reviews 24 (2005) 897–924904
the sediments of the last glacial episode, diatoms are notabundant and their assemblages suffer from poorpreservation of the opal silica (Koc- et al., 1993;Lapointe, 2000).The hydrographical parameters we have used for
reconstructions based on dinocysts are considered to bethe most important determinants of the distribution ofassemblages. In temperate marine environments, dino-flagellates generally develop during the warmest part ofthe year, following the diatom bloom, and theirmaximum growth rate occurs when close to optimaltemperature establishes (Taylor and Pollingher, 1987).The summer SST or the maximum SST is thus theparameter exerting the most influential role on thedistribution of dinoflagellate population in the upperwater column, as reflected by the cyst populations insediment traps (cf. Godhe et al., 2001) or in sediments(see Fig. 2). Salinity is also a very important parametercontrolling the distribution of assemblages since therange of salinity tolerance varies among species, witheuryhaline taxa being abundant in nearshore andestuarine environments as seen in living populations(Taylor and Pollingher, 1987) and cyst assemblages insediments (e.g., de Vernal and Giroux, 1991). Inaddition to temperature and salinity, the annual cycleof temperature or seasonality most probably exerts adeterminant control on the life cycle of dinoflagellates,notably on the respective duration of vegetative vs.encysted stages. The seasonality can be expressed as thedifference between the warmest and the coolest tem-peratures. It can also be expressed as the length of theseason during which autotrophic or heterotrophicmetabolic activities are interrupted, because of limitedlight due to sea-ice cover or to reduced primaryproduction. This would explain how the seasonalduration of sea-ice cover is one of the parameters thatcan be reconstructed using dinoflagellate cyst assem-blages.
2.3. The approach for quantitative reconstructions
Different approaches for estimating past sea-surfaceconditions based on dinocyst assemblages have beentested, including canonical regressions, several variantsof the best analogue technique (de Vernal et al., 1994,1997, 2001; Rochon et al., 1999), and the artificial neuralnetwork technique (Peyron and de Vernal, 2001).Validation tests revealed that the best analogue andthe artificial neural network techniques may yieldsimilarly accurate results (cf. Peyron and de Vernal,2001). Nevertheless, we have decided to use here the bestanalogue technique because it requires the least manip-ulation and transformation of data. The database,which covers three oceans, several epicontinental seas,and includes 60 taxa, implies distinct strategies ofpreparation depending upon the technique to be
applied. In the case of the best analogue technique, wecan use the entire database, without any discriminationof taxa and sites. In the case of the artificial neuralnetwork technique, however, the definition of regionalcalibration data sets with a reduced number of taxawould be a requirement. This is a step which mayeventually help to constrain the accuracy of estimates,but which also relies on subjective decisions regardingthe ultimate list of taxa and the geographical limits ofthe regional databases. Thus, we made the choice to beconservative by applying the best analogue technique,following the procedure adapted from the software ofGuiot and Goeury (1996), which can be summarised asfollows:Prior to data analyses for the search of analogues, a
few transformations are made. The abundance of taxarelative to the sum of dinocysts is calculated in perthousand instead of percentages in order to deal withwhole numbers and to avoid decimals for further ln-transformation. One (1) is added to the frequency ofeach taxon in order to deal with values greater thanzero. Another minor transformation consists of adjust-ing the frequency data ranging between 2 and 5 to thevalue of 5 in order to make a better discriminationbetween absence (=1) and presence (45). Thistransformation is further justified because of the countlimit, which is as low as 100 or 200 specimens in someinstances. The zero elements are thus replaced by a valuelower than the precision with which data were produced(cf. Kucera and Malmgren, 1998). After these transfor-mations, a distance (d) between the spectrum to beanalysed (t) and the spectra in the reference database (i)is calculated based on the difference in relativefrequency (f) for each taxon (j=1–60) as follows:
d ¼Xn
j¼1
½ln f ij � ln f tj�2:
For estimating hydrographical conditions, we haveused the five best analogues, which are the five modernsamples with the lowest ‘‘d’’ values. The estimate for the‘‘most probable’’ hydrographical values is obtained bycalculating an average of the values for the five bestanalogues, weighted inversely by the distance. This mostprobable estimate is included within an interval corre-sponding to lower and upper limits, which are definedfrom the variances of the values below and above themost probable estimates, respectively. This techniqueleads to the calculation of a confidence interval that isnot necessarily symmetric around the most probableestimate.
2.4. Validation of the approach
The degree of accuracy of reconstructions can beevaluated based on the estimations of the modern winter

ARTICLE IN PRESSA. de Vernal et al. / Quaternary Science Reviews 24 (2005) 897–924 905
and summer temperatures, sea-ice cover and summersea-surface salinity, which were made based on thecalibration data excluding the spectrum to analyse(leaving-one-out technique; see Fig. 5). The linearity ofthe relationship with a slope close to one, and thecoefficients of correlation between estimates and ob-servations provide a first indication of the reliability ofthe approach. The degree of accuracy of the reconstruc-tion is constrained by the standard deviation of thedifference between estimates and observations. Valuesof71.2 and71.7 1C have been calculated for the winterand summer SSTs, respectively, 71.7 for the salinity,
Fig. 5. Results of the validation test for the reconstruction of SST, salinity an
instrumental observations, and y-axis shows estimates from the dinocyst data
(r) and the standard deviation (s) of the difference between reconstruction a
Prediction) provide the degree of accuracy of estimates. These accuracy indica
error clearly depends upon the geographical domain considered.
and 71.3 months/year for the sea-ice cover. On thewhole, the degree of accuracy of estimates is of the samemagnitude as the standard deviations around the meanfor modern SST, salinity or sea-ice cover valuescollected instrumentally during the last decades (seealso Rochon et al., 1999; de Vernal and Hillaire-Marcel,2000). The degree of accuracy is better in open oceanicregions characterised by salinity higher than 33, andshows a larger spread of data in continental marginareas, estuaries, and ice marginal zones that are markedby highly variable hydrographical conditions on annual,decadal to centennial time scales. In the case of the
d sea-ice cover. The x-axis shows hydrographic averages resulting from
after the procedure described in the text. The coefficients of correlation
nd observation (i.e., the equivalent of the Root Mean Square Error of
tors were calculated for all data points (n=940) although the prediction

ARTICLE IN PRESSA. de Vernal et al. / Quaternary Science Reviews 24 (2005) 897–924906
Canadian and Russian Arctic, there is a particularlylarge error for salinity, and to a lesser extent fortemperature, which can be explained by the highvariability of these parameters and by the lack ofaccuracy of instrumental data (e.g., Mudie and Rochon,2001). We estimate that about half of the spread ofestimated vs. observed values could be attributed toinaccurate hydrographical measurements.
2.5. Definition of reliability indices
All methods developed for quantitative reconstruc-tions of hydrographic parameters based on microfossilassemblages have intrinsic uncertainties due to theaccuracy of the calibration databases themselves. An-other source of uncertainty derives from the assumptionthat the present relationships between hydrographicalparameters and microfossil assemblages were identicalin the past. When dealing with past intervals such as theLGM, this assumption is debatable because conditionsof biological production were different than at present.Therefore, the reliability of reconstructions is a questionthat has to be addressed.In order to define a reliability index, we have used the
degree of similarity between microssil spectra fromLGM and modern based on the distance ‘‘d’’ asdescribed above. From the calibration database, athreshold value of acceptable distance has been set onprobabilistic grounds (i.e., a Monte-Carlo approach) foridentification of a non-analogue or poor-analoguesituation. In the case of the Northern Hemispheren=940 database, the distance between pairs randomlytaken in the database averages 130.87 with a standarddeviation of 56.46. The average minus standard devia-tion gives a threshold distance (here, 74.39) below whichwe consider the similarity to be significant. On thesegrounds, we defined a reliability index according to threecategories (cf. Fig. 8):
(1)
Good analogue situation when the distance isbetween 0 (perfect analogue) and half of the thresh-old value (37).(2)
Acceptable analogue situation when the distance isbetween half of the threshold value and the thresh-old (37–74).(3)
Poor analogue situation when the distance of theclosest analogue is higher than the calculatedthreshold (474).The reliability index should be further constrained bythe concentration of dinocysts, which depends onproductivity and cyst fluxes, and sediment accumulationrates. When productivity and fluxes are low, reworkingwill have an increased influence on the assemblages and,therefore, on the reconstructed sea-surface conditions.Here, we have used a threshold value of 100 cysts/cm3 to
define critically low concentration. Taking into accountsedimentation rates of 10 cm/kyr, this concentrationvalue corresponds to a flux of the order of 1 cyst/cm2/year. For comparison, such a flux is lower than that ofthe modern Labrador Sea by one order of magnitude(Hillaire-Marcel et al., 1994), but is similar to the onepresently recorded in the Baffin Bay basin (Rochon andde Vernal, 1994). In Table 2 and Fig. 8, ‘‘X’’ signsindicate which sites are characterised by criticallylow concentrations, below the threshold value of 100cysts/cm3.
3. The LGM sea-surface conditions based on dinocyst
data
3.1. The coring sites
A total of 65 cores have been analysed for theirpalynological content (see Fig. 6, Table 2) in order toreconstruct LGM conditions. Most of the cores are fromthe northern North Atlantic and adjacent subpolar seas:Labrador Sea and Baffin Bay, Irminger Basin, Norwe-gian and Greenland seas. One core from the Gulf ofAlaska in northeastern North Pacific and one core fromthe western Mediterranean were also analysed.The LGM time slice (�23,000–19,000 cal. years BP)
has been defined following the recommendation made atthe first EPILOG Workshop (cf. Schneider et al., 2000;Mix et al., 2001). In most of the cores, the LGM isdefined with a good level of accuracy. It is based onradiocarbon dates, lithostratigraphical boundaries pro-vided by the Heinrich layers H1 and H2, magneticsusceptibility or paleointensity correlations, and/or d18Ostratigraphies. References about the stratigraphy ofmost cores we refer to can be found in de Vernal et al.(2000) or on the GEOTOP and PANGAEA websites.Additional information about the stratigraphy of theMediterranean Sea core ODP161-976c is provided byvon Grafenstein et al. (1999) and Combourieu-Neboutet al. (2002) and the stratigraphy of northeastern Pacificcore PAR87-A10 can be found in de Vernal andPedersen (1997). Stratigraphical data about the NorthAtlantic cores MD95-2002, MD95-2009 and MD95-2010 can be found in Zaragosi et al. (2001) and Eynaudet al. (2002), and about core MD99-2254 in Solignacet al. (2004).
3.2. The LGM dinocyst assemblages and their modern
analogues
In many cores, the sediments of the LGM containsparse palynological assemblages, with very low dino-cyst concentrations. A few cores from Baffin Bay, andfrom the margins of Labrador and Greenland haverevealed barren samples, with cyst concentration lower

ARTIC
LEIN
PRES
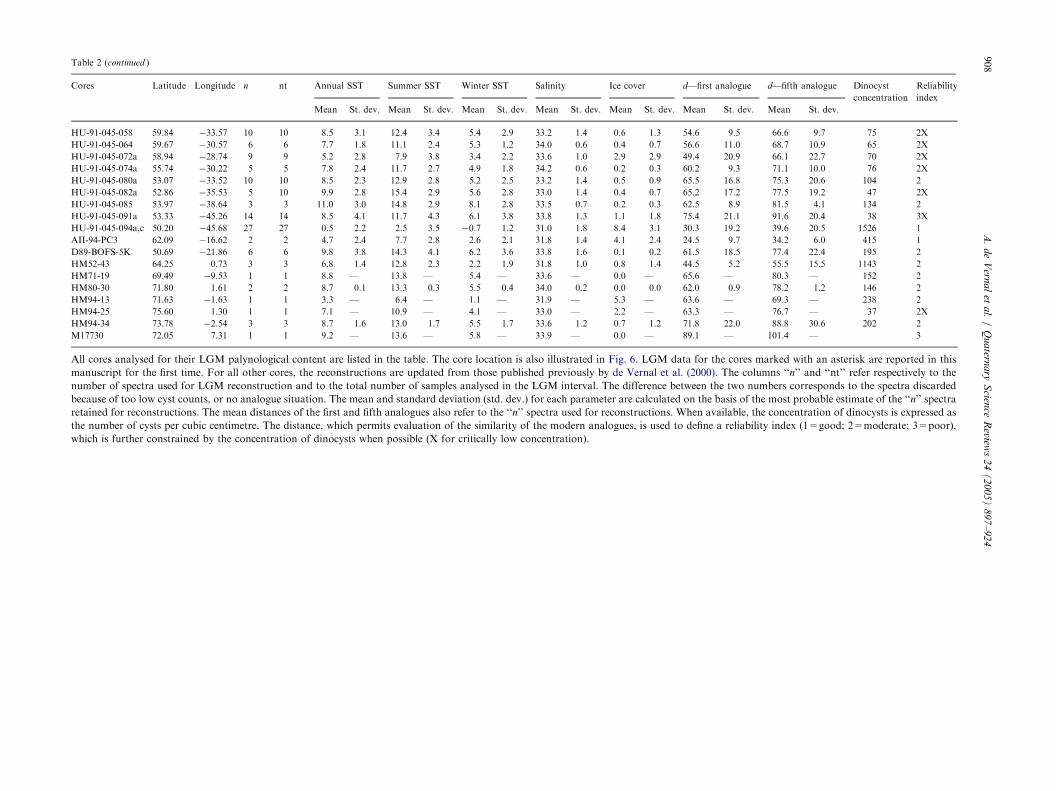
STable 2
Summarised information about the cores analysed and the sea-surface conditions—estimates based on dinocyst data
Cores Latitude Longitude n nt Annual SST Summer SST Winter SST Salinity Ice cover d—first analogue d—fifth analogue Dinocyst
concentration
Reliability
index
Mean St. dev. Mean St. dev. Mean St. dev. Mean St. dev. Mean St. dev. Mean St. dev. Mean St. dev.
HU-76-029-033 71.33 �64.27 2 5 �0.2 0.1 1.9 0.2 �1.9 0.1 29.7 3.6 9.3 0.9 27.0 31.9 34.0 22.2 28 1X
M17045 52.43 �16.39 2 2 7.1 1.1 10.7 0.8 4.5 1.0 34.2 0.1 0.2 0.3 40.3 1.8 51.9 3.5 1361 2
M17724 76.00 8.33 4 6 6.7 2.4 12.4 3.3 1.7 1.9 31.1 0.5 1.5 2.7 47.8 14.9 59.1 16.8 72 2X
M23041 68.68 0.23 0 1 — — — — — — — — — — — — — — 21
M23071 67.08 2.90 4 4 7.9 1.4 13.3 0.4 4.1 2.1 33.0 1.0 0.4 0.5 52.6 11.1 65.1 10.4 155 2
M23074 66.66 4.91 5 5 4.5 4.1 9.7 4.6 0.2 1.6 31.5 0.7 3.7 3.3 35.4 10.6 44.9 13.8 354 1
M23259 72.03 9.27 11 11 6.8 1.5 13.0 1.1 1.8 1.7 31.5 0.7 1.3 1.1 35.5 12.6 43.4 14.1 270 1
M23294 72.36 �10.36 2 3 8.2 0.9 11.8 1.9 5.5 0.5 34.2 0.1 0.0 0.0 55.0 13.0 72.2 17.3 38 2X
M23519 64.83 �29.56 2 4 6.9 0.2 10.2 0.5 4.7 0.1 33.9 0.7 1.5 1.3 20.5 11.2 37.1 3.1 66 1X
*MD95-2002 47.45 �8.53 8 19 7.5 1.2 12.9 1.3 3.5 1.9 32.4 1.2 0.2 0.4 36.0 10.1 41.5 11.5 11068 1
MD95-2009 62.74 �4.00 5 8 6.7 3.0 12.4 4.1 1.5 2.9 31.4 1.4 1.3 2.5 33.8 8.2 41.8 9.0 162 1
MD95-2010 66.68 4.57 25 35 4.3 1.7 9.9 3.1 �0.2 0.8 31.6 0.7 3.0 1.9 27.1 9.5 34.8 10.6 1483 1
POS0006 69.20 �16.81 0 2 — — — — — — — — — — — — — — 26
POS0020 67.98 �18.53 7 7 8.4 1.4 13.0 1.4 5.0 2.0 33.2 1.1 0.4 0.8 42.6 12.7 50.8 13.0 334 2
PS1842-6a 69.45 �16.52 8 11 7.4 1.5 12.9 1.0 3.3 2.2 31.7 1.3 1.0 0.9 49.0 22.9 58.0 21.3 142 2
PS1919-2 74.98 �11.92 0 10 — — — — — — — — — — — — — — 56
PS1927-2 72.48 �17.12 0 7 — — — — — — — — — — — — — — 38
PS1951-1 68.83 �20.81 0 7 — — — — — — — — — — — — — — 26
SU8118 37.78 �10.19 9 13 10.7 7.3 13.0 8.5 8.9 6.2 34.6 1.8 2.8 4.8 86.7 20.7 110.9 23.7 3
SU9016 58.22 �45.16 7 7 4.4 3.2 7.7 4.6 2.2 2.6 33.2 1.4 3.0 3.9 55.5 30.7 66.2 27.5 169 2
SU9019 59.53 �39.47 7 8 6.7 1.0 9.5 1.0 4.6 1.0 34.3 0.6 0.7 1.0 48.5 24.6 61.8 28.4 92 2X
SU9024 62.67 �37.38 4 7 6.7 1.0 10.1 1.0 4.3 1.1 34.0 1.2 0.3 0.4 51.6 27.1 64.0 30.6 65 2X
SU9032 61.79 �22.43 7 7 6.0 1.2 10.2 1.9 3.1 1.5 33.3 1.3 1.0 1.0 41.3 19.0 50.8 22.8 140 2
SU9033 60.57 �22.08 5 5 7.0 1.6 11.9 2.3 3.6 2.1 33.0 1.8 0.9 1.0 32.0 13.6 44.5 12.6 230 1
SU9044 50.02 �17.10 2 2 8.8 1.1 11.7 1.7 6.6 0.6 34.7 0.6 0.0 0.0 60.2 0.1 71.9 7.5 1021 2
MD95-2033 44.66 �55.62 22 22 7.1 1.7 13.1 1.4 2.3 1.7 31.4 0.5 0.7 1.0 23.0 4.6 30.1 4.9 7092 1
NA87-22 55.51 �14.71 6 6 6.0 1.2 8.9 2.1 3.7 0.8 34.3 0.7 1.7 1.6 40.9 9.9 57.5 4.9 1527 2
PS1730-2 70.12 �17.70 Barren Barren Barren Barren Barren Barren Barren Barren Barren Barren Barren Barren Barren Barren Barren Barren o10
SU8147 44.90 �3.31 17 17 7.6 1.5 13.3 1.5 3.2 2.1 32.2 1.0 0.6 0.9 48.0 11.1 57.7 10.0 10555 2
SU9039 52.57 �21.94 1 1 6.0 — 8.8 — 4.0 — 35.0 — 0.0 — 68.6 — 80.7 — 2
*MD99-2254 56.80 �30.66 5 5 6.7 1.0 9.6 1.2 4.6 0.8 34.6 0.6 0.6 1.0 37.2 13.6 53.1 9.1 43 2
*PAR87-A10 54.36 �148.47 3 3 3.3 3.1 9.6 1.2 4.6 0.8 32.2 2.1 0.6 1.0 37.2 13.6 53.1 9.1 162 2
*ODP161-976c 36.21 �4.31 7 7 11.3 2.6 16.4 3.1 7.1 2.6 33.1 1.0 0.1 0.3 73.9 7.6 82.6 8.3 7041 2
HU-77-027-013 68.45 �63.53 Barren Barren Barren Barren Barren Barren Barren Barren Barren Barren Barren Barren Barren Barren Barren Barren o10
HU-84-030-003 53.32 �45.26 0 3 — — — — — — — — — — — — — — 37
HU-84-030-021 58.37 �57.50 13 13 �0.3 1.7 1.2 2.6 �1.2 1.0 31.1 1.7 9.1 2.9 25.6 17.8 33.2 19.1 241 1
HU-85-027-016 70.51 �64.52 Barren Barren Barren Barren Barren Barren Barren Barren Barren Barren Barren Barren Barren Barren Barren Barren o10
HU-86-034-040 42.63 �63.10 5 5 6.4 1.1 12.6 0.5 1.7 1.7 31.6 0.7 1.7 0.6 20.5 7.2 27.2 5.8 2580 1
HU-87-033-007 65.40 �57.42 2 9 �0.7 1.1 0.1 1.3 �1.2 0.9 30.9 1.0 10.5 0.5 35.4 4.3 51.7 5.0 19 1X
HU-87-033-008 62.64 �53.88 7 7 0.0 2.4 1.6 4.1 �1.5 0.5 31.5 0.6 9.3 3.1 25.6 9.2 36.0 10.6 492 1
HU-87-033-009 62.51 �59.44 6 8 0.1 1.2 1.4 1.6 �0.8 0.6 31.1 0.7 9.6 1.1 25.7 16.3 41.5 20.7 85 2X
HU-90-013-012 58.92 �47.12 2 11 9.8 0.3 14.4 1.4 5.9 1.6 32.8 0.4 0.2 0.2 44.2 9.7 68.0 6.5 117 2
HU-90-013-013 58.21 �48.37 8 8 7.1 2.8 11.5 3.2 3.7 3.1 32.8 1.7 1.0 1.7 38.1 17.9 49.7 19.9 189 2
HU-90-015-017 42.78 �61.65 7 7 5.4 2.5 10.7 3.5 1.4 1.9 31.5 0.6 2.6 2.0 31.7 8.9 38.1 12.1 2277 1
HU-91-020-013 41.83 �62.33 6 6 5.9 3.7 10.9 5.2 1.4 2.4 30.1 1.5 2.5 3.7 25.8 5.4 35.0 9.1 1314 1
HU-91-045-025 55.03 �52.13 0 8 — — — — — — — — — — — — — — o10
HU-91-045-044 59.36 �43.45 4 5 �1.5 0.1 �0.8 0.1 �1.7 0.2 31.4 0.4 11.2 0.1 34.4 4.1 56.5 9.9 34 1X
HU-91-045-052 59.49 �39.30 7 9 6.3 2.2 10.2 2.5 3.6 2.5 33.0 2.0 1.7 2.5 49.2 9.6 60.1 5.3 55 2X
A.
de
Vern
al
eta
l./
Qu
atern
ary
Scien
ceR
eviews
24
(2
00
5)
89
7–
92
4907
ARTIC
LEIN
PRES
STable 2 (continued )
Cores Latitude Longitude n nt Annual SST Summer SST Winter SST Salinity Ice cover d—first analogue d—fifth analogue Dinocyst
concentration
Reliability
index
Mean St. dev. Mean St. dev. Mean St. dev. Mean St. dev. Mean St. dev. Mean St. dev. Mean St. dev.
HU-91-045-058 59.84 �33.57 10 10 8.5 3.1 12.4 3.4 5.4 2.9 33.2 1.4 0.6 1.3 54.6 9.5 66.6 9.7 75 2X
HU-91-045-064 59.67 �30.57 6 6 7.7 1.8 11.1 2.4 5.3 1.2 34.0 0.6 0.4 0.7 56.6 11.0 68.7 10.9 65 2X
HU-91-045-072a 58.94 �28.74 9 9 5.2 2.8 7.9 3.8 3.4 2.2 33.6 1.0 2.9 2.9 49.4 20.9 66.1 22.7 70 2X
HU-91-045-074a 55.74 �30.22 5 5 7.8 2.4 11.7 2.7 4.9 1.8 34.2 0.6 0.2 0.3 60.2 9.3 71.1 10.0 76 2X
HU-91-045-080a 53.07 �33.52 10 10 8.5 2.3 12.9 2.8 5.2 2.5 33.2 1.4 0.5 0.9 65.5 16.8 75.3 20.6 104 2
HU-91-045-082a 52.86 �35.53 5 10 9.9 2.8 15.4 2.9 5.6 2.8 33.0 1.4 0.4 0.7 65.2 17.2 77.5 19.2 47 2X
HU-91-045-085 53.97 �38.64 3 3 11.0 3.0 14.8 2.9 8.1 2.8 33.5 0.7 0.2 0.3 62.5 8.9 81.5 4.1 134 2
HU-91-045-091a 53.33 �45.26 14 14 8.5 4.1 11.7 4.3 6.1 3.8 33.8 1.3 1.1 1.8 75.4 21.1 91.6 20.4 38 3X
HU-91-045-094a,c 50.20 �45.68 27 27 0.5 2.2 2.5 3.5 �0.7 1.2 31.0 1.8 8.4 3.1 30.3 19.2 39.6 20.5 1526 1
AII-94-PC3 62.09 �16.62 2 2 4.7 2.4 7.7 2.8 2.6 2.1 31.8 1.4 4.1 2.4 24.5 9.7 34.2 6.0 415 1
D89-BOFS-5K 50.69 �21.86 6 6 9.8 3.8 14.3 4.1 6.2 3.6 33.8 1.6 0.1 0.2 61.5 18.5 77.4 22.4 195 2
HM52-43 64.25 0.73 3 3 6.8 1.4 12.8 2.3 2.2 1.9 31.8 1.0 0.8 1.4 44.5 5.2 55.5 15.5 1143 2
HM71-19 69.49 �9.53 1 1 8.8 — 13.8 — 5.4 — 33.6 — 0.0 — 65.6 — 80.3 — 152 2
HM80-30 71.80 1.61 2 2 8.7 0.1 13.3 0.3 5.5 0.4 34.0 0.2 0.0 0.0 62.0 0.9 78.2 1.2 146 2
HM94-13 71.63 �1.63 1 1 3.3 — 6.4 — 1.1 — 31.9 — 5.3 — 63.6 — 69.3 — 238 2
HM94-25 75.60 1.30 1 1 7.1 — 10.9 — 4.1 — 33.0 — 2.2 — 63.3 — 76.7 — 37 2X
HM94-34 73.78 �2.54 3 3 8.7 1.6 13.0 1.7 5.5 1.7 33.6 1.2 0.7 1.2 71.8 22.0 88.8 30.6 202 2
M17730 72.05 7.31 1 1 9.2 — 13.6 — 5.8 — 33.9 — 0.0 — 89.1 — 101.4 — 3
All cores analysed for their LGM palynological content are listed in the table. The core location is also illustrated in Fig. 6. LGM data for the cores marked with an asterisk are reported in this
manuscript for the first time. For all other cores, the reconstructions are updated from those published previously by de Vernal et al. (2000). The columns ‘‘n’’ and ‘‘nt’’ refer respectively to the
number of spectra used for LGM reconstruction and to the total number of samples analysed in the LGM interval. The difference between the two numbers corresponds to the spectra discarded
because of too low cyst counts, or no analogue situation. The mean and standard deviation (std. dev.) for each parameter are calculated on the basis of the most probable estimate of the ‘‘n’’ spectra
retained for reconstructions. The mean distances of the first and fifth analogues also refer to the ‘‘n’’ spectra used for reconstructions. When available, the concentration of dinocysts is expressed as
the number of cysts per cubic centimetre. The distance, which permits evaluation of the similarity of the modern analogues, is used to define a reliability index (1=good; 2=moderate; 3=poor),
which is further constrained by the concentration of dinocysts when possible (X for critically low concentration).
A.
de
Vern
al
eta
l./
Qu
atern
ary
Scien
ceR
eviews
24
(2
00
5)
89
7–
92
4908

ARTICLE IN PRESS
Fig. 6. Location map of the cores used to reconstruct sea-surface conditions during the LGM based on transfer functions using dinocyst assemblages
(see Table 1 for core coordinates).
A. de Vernal et al. / Quaternary Science Reviews 24 (2005) 897–924 909

ARTICLE IN PRESSA. de Vernal et al. / Quaternary Science Reviews 24 (2005) 897–924910
than 10 cysts/cm3 (see Table 2), which we haveinterpreted as the result of limited biogenic productionbecause of permanent or quasi-permanent sea-ice cover(see also de Vernal et al., 2000). In other cores, somesamples within the LGM interval yielded low dinocystconcentrations (o40 cysts/cm3), and their spectra werediscarded (see Table 2 and Fig. 8; detailed counts andraw data tables are archived in the PANGAEA databaseand at GEOTOP).As a general feature, the LGM samples from the
northern North Atlantic contain dinocyst assemblagescharacterised by low concentrations, generally rangingbetween 101 and 103 cysts/cm3, with higher valuesrecorded along the margins of southeastern Canadaand off western Europe and Scandinavia (Table 2). Inthe calibration database established from surface sedi-ment samples (Rochon et al., 1999), the abundance ofdinocysts is also at a maximum along the margins offsoutheastern Canada, Western Europe and Scandinavia.However, the concentrations are higher by one order ofmagnitude than those of the LGM samples. The lowdinocysts concentrations in the LGM sediment samplesindicate low productivity, due to low nutrient input and/or harsh conditions. Beyond these broad features, thedinocyst assemblages show some peculiarities in com-parison with the modern ones:
(1)
The assemblages recovered along the continentalmargins of northeastern Canada and Scandinaviashow a major southward shift of taxa usuallyassociated with sea-ice cover, notably Islandiniumminutum (Fig. 7a). Such assemblages have closemodern analogues, and reveal more extensiveseasonal sea ice, and much colder than presentconditions especially in winter.
(2)
The offshore assemblages of the northern NorthAtlantic and adjacent subpolar seas are all char-acterised by high percentages of Bitectatodiniumtepikiense (Fig. 7b), as already documented frommany studies (e.g., Turon, 1984; Duane and Har-land, 1990; Graham et al., 1990; Eynaud et al.,2002). In surface sediment samples, this taxon iscommon but rarely exceeds 10% of the assemblages.Its modern occurrence has been associated with thecool temperate domain (Turon, 1984) and with thesubpolar–temperate boundary in the northern NorthAtlantic (Dale, 1996). High percentages (410%) ofB. tepikiense have been reported at middle latitudes,in the North Sea and along the margins of southeastern Canada (Rochon et al., 1999), with max-imum abundances (up to 60–80%) in bays of Maineand Nova Scotia (Wall et al., 1977; Mudie, 1992).The modern distribution of B. tepikiense indicates atolerance to a wide range of salinities and tempera-tures in winter, and a preference for summertemperatures greater than 10 1C. Its maximum
occurrence in coastal bays of southern Nova Scotia(Mudie, 1992) suggests special affinities for stratifiedsurface waters characterised by large seasonalamplitudes of temperature from winter to summer(up to 15 1C) and low salinity (30–32%). Therefore,the LGM dinocyst assemblages recovered offshorein the northern North Atlantic demonstrate verydifferent conditions than at present. They show arelatively high degree of dissimilarity when comparedto modern spectra, and the closest modern analoguesfor these assemblages are located in nearshoreenvironments of the cool temperate domain.
3.3. The reliability of sea-surface condition estimates for
the LGM
Beyond intrinsic limitations of any approaches basedon the use of microfossil assemblages for quantitativepaleoceanographical reconstructions, we have tried toclarify the reliability of estimates from dinocyst datausing the indices defined in Section 2.5 (see Fig. 8 andTable 2). The reliability index based on the distancereveals good analogue situations for most sites locatedalong the continental margins of eastern Canada andScandinavia, in addition to a few offshore sites from theIceland Basin, Irminger Sea, Baffin Bay, and LabradorSea in the northern North Atlantic, and the Gulf ofAlaska in the North Pacific (Fig. 8). At these sites, theLGM dinocyst concentrations are moderately high, withthe exception of sites from the Irminger Basin and BaffinBay. Therefore, despite some limitations, the reliabilityof LGM sea-surface condition estimates for the south-eastern Canadian margins, Labrador Sea, Iceland Basinand eastern Norwegian Sea is reasonably high, withinthe range of accuracy defined by the validation exercise(Section 2.4).The reliability index based on the distance shows
acceptable but weak analogue situations in many coresof the northern North Atlantic, and the Greenland andIrminger seas. The weak analogue situation is notablydue to the high frequency of B. tepikiense in LGMassemblages, which have no close equivalent in offshoreareas of the modern database. At the sites from theGreenland and Irminger seas, the situation is particu-larly critical in view of the low dinocyst concentrations.In these areas, the confidence level of reconstructions istherefore lower.
3.4. Results
3.4.1. Sea-surface temperatures
The SST estimates based on dinocyst assemblagesreveal LGM conditions that differ significantly from themodern situation with regard to the geographicaldistribution pattern of temperatures (Fig. 9). While

ARTICLE IN PRESS
Fig. 7. Geographical distribution patterns of two characteristic dinocyst taxa in the modern (left diagrams) and LGM (right diagrams) databases.
(a) Percentages of I. minutum; and (b) percentages of B. tepikiense.
A. de Vernal et al. / Quaternary Science Reviews 24 (2005) 897–924 911
ARTICLE IN PRESS
Fig. 8. Schematic illustration of the reliability of estimated sea-surface
conditions for the LGM based on dinocyst data: the mean distance of
the closest modern analogues permits the definition of a reliability
index that is further constrained from the dinocyst concentrations
(Table 2). Pale circles represent sites of relatively reliable LGM
estimates and dark circles marked with ‘‘X’’ correspond to sites of less
reliable LGM estimates (see text, Section 3.3).
A. de Vernal et al. / Quaternary Science Reviews 24 (2005) 897–924912
some regions show negative anomalies (i.e., LGM minuspresent) as large as 10 1C, others are characterised byinsignificant difference or even positive anomalies (Fig.9; Table 3).In the northwest North Atlantic, off the eastern
margin of Canada, very cold conditions are recorded,both in summer and winter. Offshore, a sharp gradientof increasing temperatures is reconstructed, especiallyfor the summer (Fig. 9). Over mid-latitudes, summerSSTs ranging up to 19 1C reveal relatively mild condi-tions, but still significantly cooler than the modern onesat most sites. In the subpolar basins of the Irminger,Greenland and Norwegian seas, however, LGM recon-structed summer SSTs are warmer than present (Fig. 9).The estimated SSTs in winter are less extreme, showingcolder to cooler conditions than at present at mostlocations. The only exception concerns the GreenlandSea where warmer than present conditions are recon-structed. This is a peculiar, but apparently consistentfeature.On the whole, the anomalies in SSTs are more
negative in winter than in summer (Fig. 9). Therefore,
the reconstructed LGM seasonal contrast of tempera-ture in surface waters is larger than at present.
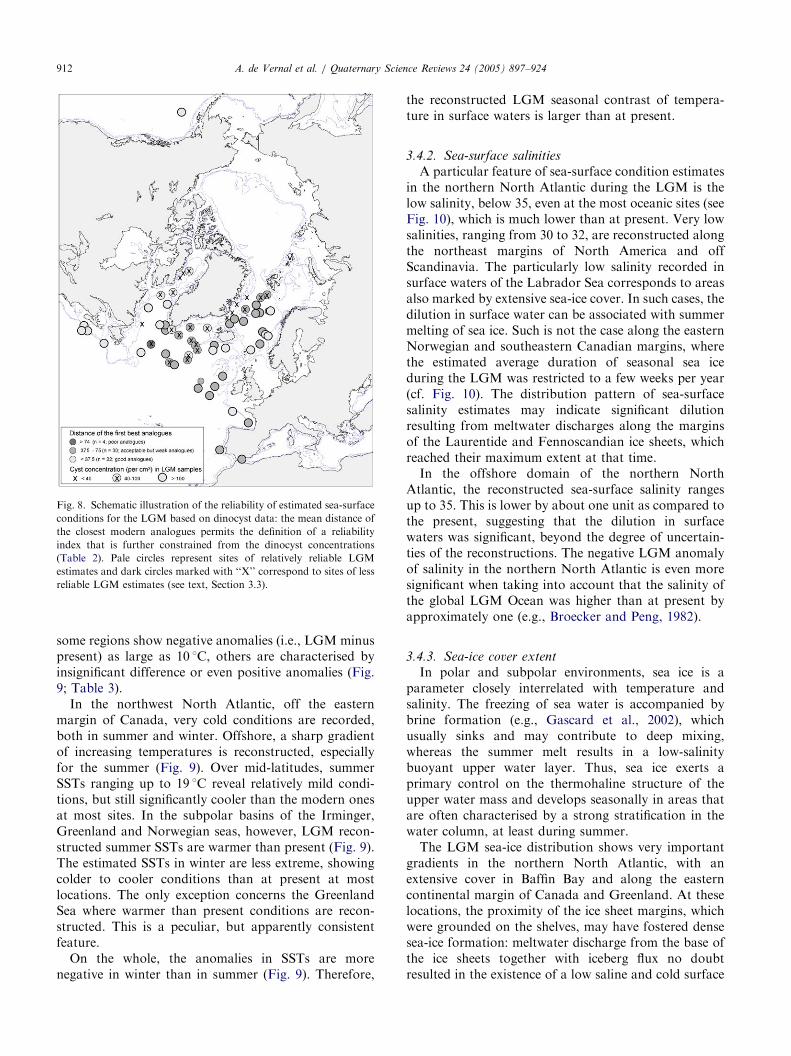
3.4.2. Sea-surface salinities
A particular feature of sea-surface condition estimatesin the northern North Atlantic during the LGM is thelow salinity, below 35, even at the most oceanic sites (seeFig. 10), which is much lower than at present. Very lowsalinities, ranging from 30 to 32, are reconstructed alongthe northeast margins of North America and offScandinavia. The particularly low salinity recorded insurface waters of the Labrador Sea corresponds to areasalso marked by extensive sea-ice cover. In such cases, thedilution in surface water can be associated with summermelting of sea ice. Such is not the case along the easternNorwegian and southeastern Canadian margins, wherethe estimated average duration of seasonal sea iceduring the LGM was restricted to a few weeks per year(cf. Fig. 10). The distribution pattern of sea-surfacesalinity estimates may indicate significant dilutionresulting from meltwater discharges along the marginsof the Laurentide and Fennoscandian ice sheets, whichreached their maximum extent at that time.In the offshore domain of the northern North
Atlantic, the reconstructed sea-surface salinity rangesup to 35. This is lower by about one unit as compared tothe present, suggesting that the dilution in surfacewaters was significant, beyond the degree of uncertain-ties of the reconstructions. The negative LGM anomalyof salinity in the northern North Atlantic is even moresignificant when taking into account that the salinity ofthe global LGM Ocean was higher than at present byapproximately one (e.g., Broecker and Peng, 1982).
3.4.3. Sea-ice cover extent
In polar and subpolar environments, sea ice is aparameter closely interrelated with temperature andsalinity. The freezing of sea water is accompanied bybrine formation (e.g., Gascard et al., 2002), whichusually sinks and may contribute to deep mixing,whereas the summer melt results in a low-salinitybuoyant upper water layer. Thus, sea ice exerts aprimary control on the thermohaline structure of theupper water mass and develops seasonally in areas thatare often characterised by a strong stratification in thewater column, at least during summer.The LGM sea-ice distribution shows very important
gradients in the northern North Atlantic, with anextensive cover in Baffin Bay and along the easterncontinental margin of Canada and Greenland. At theselocations, the proximity of the ice sheet margins, whichwere grounded on the shelves, may have fostered densesea-ice formation: meltwater discharge from the base ofthe ice sheets together with iceberg flux no doubtresulted in the existence of a low saline and cold surface

ARTICLE IN PRESS
Fig. 9. Maps showing LGM SST estimates in summer (upper left diagram) and winter (bottom left diagram) and the LGM vs. modern SST
anomalies in summer (upper right diagram) and winter (bottom right diagram). Note that anomalies within the 71.5 1C range are not considered to
be significant taking into account the accuracy of reconstruction and that of modern hydrographical averages (see text, Section 3.4). The continental
ice limits are delimited after Peltier (1994).
A. de Vernal et al. / Quaternary Science Reviews 24 (2005) 897–924 913
water layer leading to seasonal freezing and pack icedevelopment as in modern circum-Antarctic seas.In some of the cores, the palynological analyses reveal
barren or close to barren assemblages, which weassociate to a close to nil productivity due to permanentor quasi-permanent multiyear sea ice, as it is the case inareas of the Arctic Ocean with permanent pack ice (cf.Rochon et al., 1999). Close to barren assemblages arerecorded in Baffin Bay, on the slope off Labrador, andalong the eastern Greenland margins (see Fig. 8).Analyses of nearby sequences (from Baffin Bay, andLabrador Sea, notably) support an interpretation ofquasi-perennial sea ice, with extensive cover of morethan 9 months/year. On these grounds, we maytentatively draw the probable limit of quasi-permanentsea ice during the LGM (see dashed gray line in Fig. 10,upper left), which seems to have been close to the limit ofthe continental shelf off eastern Canada and Greenland.LGM data also indicate that the North Atlantic was
characterised by a zone with dense sea-ice cover that wasrelatively narrow and confined to the eastern continentalmargins. Offshore, in subpolar seas, seasonal sea icespanning up to a few weeks or a few months per year isreconstructed. The heterogeneity in estimates from onesite to another in the Irminger Basin or the Greenland-Norwegian seas can be attributed to the extremevariability of the sea-ice parameter both in time andspace (Comiso, 2002). In the eastern sector of the NorthAtlantic south of about 501N (see the dashed pink line in
Fig. 10, upper left), however, the data are not equivocaland show that ice-free conditions prevailed throughoutthe year on an average basis.
3.5. Comparison with previous LGM estimates based on
dinocysts
As mentioned before, this manuscript presents anupdate of the LGM reconstructions published by deVernal et al. in 2000. Most primary data are the same,with the exception of a few additional sites or additionalspectra for some cores (Table 2). However, there aresome differences in the databases used for reconstruc-tions, as summarised below.
(1)
Here, we used seasonal averages of SSTs at 10mdepth from NODC (1998) as prescribed for theMARGO intercomparison exercise, instead ofmonthly averages compiled at 0m depth, mainlyon the basis of the data comprised in the 1994version of the NODC Atlas. The differences fromthe temperatures compiled as described above arerelatively low on the average but show a rather largedispersal as illustrated in Fig. 11. The August SSTsat 0m in the NODC-1994 data set are slightly higherthan the summer SSTs at 10m in the NODC-1998data set, with an average difference of 1.071.1 1C.Inversely, the February SSTs at 0m in the NODC-1994 data set are slightly lower than the winter
ARTICLE IN PRESS
Table 3
Anomalies of sea-surface conditions between the LGM and the modern
Cores Longitude Latitude Annual SSTs Winter SSTs Summer SSTs Salinity Sea ice (months/year)
LGM Modern D LGM Modern D LGM Modern D LGM Modern D LGM Modern D
HU-76-029-033 �64.27 71.33 �0.2 �0.2 0.0 �1.9 �1.6 �0.3 1.9 2.0 �0.2 29.7 29.0 0.6 9.3 9.3 0.0
M17045 �16.39 52.43 7.1 12.5 �5.4 4.5 10.6 �6.2 10.7 15.0 �4.4 34.3 35.5 �1.2 0.2 0 0.2
M17724 8.33 76 6.7 3.1 3.6 1.7 1.7 0.0 12.4 5.5 6.9 31.1 34.9 �3.8 1.5 0 1.5
M23071 2.9 67.08 7.9 7.9 0.0 4.1 6.2 �2.1 13.3 10.5 2.8 33.0 35.1 �2.1 0.4 0 0.4
M23074 4.91 66.66 4.5 8.2 �3.7 0.2 6.6 �6.5 9.7 10.9 �1.2 31.5 34.9 �3.4 3.7 0 3.7
M23259 9.27 72.03 6.8 5.6 1.1 1.8 4.2 �2.4 13.0 8.0 5.0 31.5 35.1 �3.7 1.3 0 1.3
M23294 �10.36 72.36 8.2 0.4 7.8 5.5 �0.9 6.3 11.8 3.1 8.8 34.2 32.1 2.1 0.0 4.5 �4.5
M23519 �29.56 64.83 6.9 5.7 1.2 4.7 4.7 0.0 10.2 7.2 3.0 33.9 35.1 �1.2 1.5 0 1.5
MD95-2002 �8.53 47.45 6.3 13.9 �7.5 2.1 11.4 �9.3 11.8 17.2 �5.4 32.5 35.5 �3.1 1.5 0 1.5
MD95-2009 �4 62.74 6.3 7.9 �1.6 0.9 6.1 �5.2 12.5 10.3 2.2 31.4 35.1 �3.8 1.5 0 1.5
MD95-2010 4.57 66.68 4.6 8.2 �3.6 0.0 6.6 �6.6 10.3 10.8 �0.5 31.6 35.1 �3.5 2.7 0 2.7
POS0020 �18.53 67.98 8.4 2.1 6.3 5.0 0.7 4.3 13.0 4.4 8.6 33.2 33.6 �0.4 0.4 0.8 �0.4
PS1842-6a �16.52 69.45 7.4 1.1 6.4 3.3 0.0 3.3 12.9 3.3 9.6 31.7 33.7 �2.0 1.0 4.4 �3.4
SU8118 �10.19 37.78 10.7 17.7 �6.9 8.9 15.4 �6.5 13.0 20.0 �7.0 34.6 36.1 �1.5 2.8 0 2.8
SU9016 �45.16 58.22 4.4 4.8 �0.4 2.2 3.4 �1.2 7.7 7.2 0.5 33.2 34.6 �1.4 3.0 0 3.0
SU9019 �39.47 59.53 6.7 5.8 0.9 4.6 4.3 0.4 9.5 8.0 1.4 34.3 34.8 �0.5 0.7 0 0.7
SU9024 �37.38 62.67 6.7 5.6 1.1 4.3 4.4 �0.1 10.1 7.9 2.3 34.0 34.9 �0.9 0.3 0 0.3
SU9032 �22.43 61.79 6.0 9.1 �3.1 3.1 7.5 �4.4 10.2 11.3 �1.1 33.3 35.2 �1.9 1.0 0 1.0
SU9033 �22.08 60.57 7.0 9.4 �2.4 3.6 7.9 �4.4 11.9 11.5 0.5 33.0 35.1 �2.2 0.9 0 0.9
SU9044 �17.1 50.02 8.9 13.3 �4.5 6.6 11.2 �4.6 11.7 16.0 �4.4 34.7 35.5 �0.8 0.0 0 0.0
MD95-2033 �55.62 44.66 7.1 �1.4 8.6 2.3 �1.0 3.3 13.1 �1.5 14.6 31.4 32.1 �0.7 0.7 0 0.7
NA87-22 �14.71 55.51 6.0 11.4 �5.4 3.7 9.8 �6.1 8.9 13.8 �4.9 34.3 35.4 �1.1 1.7 0 1.7
SU8147 �3.31 44.9 7.6 15.2 �7.6 3.2 11.8 �8.5 13.3 19.4 �6.1 32.2 35.0 �2.9 0.6 0 0.6
SU9039 �21.94 52.57 6.0 12.0 �6.0 4.0 10.2 �6.2 8.8 14.5 �5.7 35.0 35.3 �0.4 0.0 0 0.0
MD99-2254 �30.66 56.8 6.7 8.6 �1.9 4.6 6.8 �2.2 9.6 10.9 �1.3 34.6 35.1 �0.5 0.6 0 0.6
PAR87-A10 �148.47 54.36 3.3 7.1 �3.8 4.6 4.2 0.5 9.6 11.3 �1.7 32.2 32.7 �0.4 0.6 0 0.6
ODP161-976 �4.31 36.21 11.3 18.0 �6.7 7.1 15.3 �8.3 16.4 21.4 �5.0 33.1 36.5 �3.4 0.1 0 0.14
HU-84-030-021 �57.5 58.37 �0.3 3.4 �3.7 �1.2 2.4 �3.6 1.2 6.2 �5.0 31.1 34.4 �3.3 9.1 0 9.1
HU-86-034-040 �63.1 42.63 6.4 10.5 �4.1 1.7 5.1 �3.4 12.7 17.0 �4.4 31.6 31.7 �0.1 1.7 0 1.7
HU-87-033-007 �57.42 65.4 �0.7 1.1 �1.8 �1.2 �0.1 �1.0 0.1 3.6 �3.5 30.9 32.6 �1.7 10.5 4 6.5
HU-87-033-008 �53.88 62.64 0.0 2.5 �2.6 �1.5 1.2 �2.7 1.6 5.2 �3.6 31.5 33.7 �2.2 9.3 0.5 8.8
HU-87-033-009 �59.44 62.51 0.1 2.1 �2.0 �0.8 1.7 �2.5 1.4 4.9 �3.5 31.1 33.8 �2.6 9.6 2.9 6.7
HU-90-013-012 �47.12 58.92 9.8 4.4 5.4 5.9 3.0 2.9 14.4 6.7 7.7 32.8 34.7 �1.8 0.2 0 0.2
HU-90-013-013 �48.37 58.21 7.1 4.7 2.4 3.7 3.2 0.6 11.5 7.3 4.2 32.9 34.6 �1.7 1.0 0 1.0
HU-90-015-017 �61.65 42.78 5.4 11.1 �5.7 1.4 5.8 �4.4 10.7 17.8 �7.1 31.5 32.0 �0.5 2.6 0 2.6
HU-91-020-013 �62.33 41.83 5.9 13.7 �7.8 1.4 8.8 �7.4 10.9 19.7 �8.8 30.1 33.7 �3.6 2.5 0 2.5
HU-91-045-044 �43.45 59.36 �1.5 4.9 �6.4 �1.7 3.4 �5.1 �0.8 6.9 �7.6 31.4 32.8 �1.4 11.2 2.5 8.7
HU-91-045-052 �39.3 59.49 6.4 5.9 0.5 3.6 4.3 �0.7 10.2 8.1 2.1 33.0 34.7 �1.7 1.7 0 1.7
HU-91-045-058 �33.57 59.84 8.5 7.3 1.2 5.4 5.7 �0.3 12.4 9.7 2.7 33.2 34.9 �1.7 0.7 0 0.7
HU-91-045-064 �30.57 59.67 7.8 8.0 �0.3 5.3 6.5 �1.2 11.1 10.2 0.9 34.0 35.0 �1.0 0.4 0 0.4
HU-91-045-072a �28.74 58.94 5.2 8.6 �3.4 3.4 7.1 �3.7 7.9 10.6 �2.8 33.6 35.0 �1.4 2.9 0 2.9
HU-91-045-074a �30.22 55.74 7.8 9.0 �1.2 4.9 7.2 �2.3 11.7 11.4 0.3 34.2 35.0 �0.8 0.2 0 0.2
HU-91-045-080a �33.52 53.07 8.5 9.2 �0.6 5.2 7.0 �1.8 13.0 12.1 0.9 33.2 34.7 �1.5 0.5 0 0.5
HU-91-045-082a �35.53 52.86 9.9 8.8 1.2 5.6 6.5 �0.9 15.4 11.7 3.7 33.0 34.6 �1.7 0.4 0 0.4
HU-91-045-085 �38.64 53.97 11.0 7.6 3.4 8.1 5.3 2.8 14.8 10.5 4.4 33.5 34.7 �1.1 0.2 0 0.2
HU-91-045-091a �45.26 53.33 8.5 7.6 0.9 6.2 5.5 0.7 11.7 10.6 1.1 33.8 34.6 �0.8 1.1 0 1.1
HU-91-045-094a,c �45.68 50.2 0.5 7.9 �7.5 �0.7 5.3 �6.0 2.5 11.5 �9.1 31.0 33.8 �2.9 8.4 0 8.4
AII-94-PC3 �16.62 62.09 4.7 9.3 �4.6 2.6 7.8 �5.2 7.7 11.3 �3.7 31.8 35.2 �3.4 4.1 0 4.1
D89-BOFS-5K �21.86 50.69 9.8 12.8 �3.0 6.2 10.9 �4.7 14.4 15.4 �1.0 33.8 35.4 �1.6 0.1 0 0.1
HM52-43 0.73 64.25 6.8 8.2 �1.4 2.2 6.3 �4.1 12.9 11.0 1.9 31.8 35.2 �3.4 0.8 0 0.8
HM71-19 �9.53 69.49 8.8 2.5 6.3 5.4 0.7 4.7 13.8 5.6 8.2 33.6 34.7 �1.1 0.0 0 0.0
HM80-30 1.61 71.8 8.7 3.9 4.8 5.5 2.1 3.5 13.3 6.9 6.4 34.0 35.0 �1.1 0.0 0 0.0
HM94-13 �1.63 71.63 3.3 3.2 0.1 1.1 1.4 �0.3 6.5 6.4 0.1 31.9 34.7 �2.8 5.3 0 5.3
HM94-25 1.3 75.6 7.1 0.8 6.4 4.1 �1.0 5.1 10.9 3.9 6.9 33.0 34.4 �1.3 2.2 0.9 1.3
HM94-34 �2.54 73.78 8.7 0.6 8.0 5.5 �1.3 6.8 13.0 4.1 8.9 33.6 33.8 �0.2 0.7 2.1 �1.4
M17730 7.31 72.05 9.2 5.2 4.1 5.8 3.6 2.2 13.6 7.7 5.9 33.9 35.1 �1.2 0.0 0 0.0
A. de Vernal et al. / Quaternary Science Reviews 24 (2005) 897–924914
ARTICLE IN PRESS
Fig. 10. Maps showing LGM sea-surface salinity estimates in summer (bottom left diagram), the seasonal extent in months per year of sea-ice cover
with concentration greater than 50% (upper left diagram), the LGM vs. modern sea-surface salinity anomalies in summer (bottom right diagram)
and the LGM vs. modern sea-ice cover extent (upper right diagram). The continental ice limits are delimited after Peltier (1994). In the upper left
diagram, the dashed gray and pink lines would correspond to the southern limits of quasi-permanent pack-ice and extreme winter sea-ice cover,
respectively.
A. de Vernal et al. / Quaternary Science Reviews 24 (2005) 897–924 915
SSTs at 10m in the NODC-1998 data set, by �0.270.9 1C. The largest differences concern the Arcticwhere there is limited information, and where theaccuracy of hydrographic data is low.
(2)
The reference dinocyst database includes 940 sta-tions from three oceans (Arctic, Pacific, Atlantic)and 60 taxa, instead of 371 stations from one ocean(Atlantic) and 25 taxa (cf. Rochon et al., 1999). Theupdated database is representative of a wider rangeof environmental and hydrographic conditions, inboth the Arctic and temperate domains.(3)
In addition to these differences with respect todatabases used for the reconstructions, the proce-dures of data treatment were not exactly the same. Inthe case of the 2000 compilation, we have used thesoftware provided by Guiot (1990) and we madeestimates based on a set of 10 analogues, whereas weare now using the software 3PBase of Guiot andGoeury (1996) and we calculate them based on a setof five analogues. Tests of reproducibility haveshown, however, that the two procedures yieldalmost identical results.The LGM reconstructions of SSTs presented here(Table 2) are very similar to the ones which werepublished by de Vernal et al. in 2000 (see Table 4). On
average, for the 50 sites used in both LGM compila-tions, the difference between summer and August SSTreconstruction is 0.6172.15 1C and the average differ-ence between winter and February SSTs was0.6471.1 1C. Such discrepancies are not significantgiven the differences in the two temperature databasesand the calculated error of prediction. Similarly, theaverage differences in estimated salinity and sea ice are�0.2370.66 and �0.0771.14 months/year, respec-tively. Such differences are not significant either, giventhe range of accuracy of estimates. We are thus led toconclude that both sets of reconstruction are consistentand that the expansion of the reference database, from371 to 940 stations, has a limited effect on estimatingsea-surface conditions of the LGM in the northernNorth Atlantic.
4. Discussion
4.1. Uncertainties
4.1.1. Significance of anomalies
The reconstruction of hydrographical parametersbased on microfossil assemblages implies a number ofassumptions. One concerns the correspondence between

ARTICLE IN PRESS
Fig. 11. Graphs showing the differences of SSTs in the two
hydrographic databases (World Ocean Atlas versions of 1998 and
1994), which were used to estimate LGM sea-surface conditions in the
present compilation and in the one published previously by de Vernal
et al. (2000).
A. de Vernal et al. / Quaternary Science Reviews 24 (2005) 897–924916
the ‘‘modern’’ assemblages recovered in surface sedi-ment samples and the reference hydrographical data,which we assume to be contemporaneous. The intervalrepresented by the microfossil assemblages may rangefrom 10 to 1000 years, whereas mean value ofhydrographic data collected over the last decadesprovide an average that is not necessarily accurate orrepresentative of maximum productivity years. This is aproblem especially when dealing with nearshore andcircum-Arctic environments, where measurements arerare and where salinity, sea ice or temperature can beextremely variable in space and time. The degree ofuncertainty or the inaccuracy of hydrographicalaverages can be illustrated by the comparison of salinityand temperature fields produced by NODC (1994) andBedford Institute of Oceanography (BIO) (2003) follow-ing the method of analyses of Tang and Wang (1996).The comparison shows that there is a basic agreement in
open ocean, whereas significant differences are beingrecorded for the shelf and coastal ocean. As an example,the sharp front along the shelf edge of eastern Canada(Labrador Shelf and Grand Banks) clearly depicted inthe gridded data from BIO (2003) is absent in theNODC Atlas. This is particularly critical in the case ofthe dinocyst database, which includes an importantproportion of data points from epicontinental andnearshore areas. An illustration of the uncertaintyconcerning the hydrographical averages can also befound in the mapping of the standard deviations (onesigma) around the temperature average. The sigmavalue revealed to be very large, up to 4 1C, alongtransitional zones such as those marked by sea-ice limitsor the polar front in the North Atlantic (cf. e.g., Isemerand Hasse, 1985). Actually, the standard deviationaround the average for instrumental data is comparableto the accuracy of reconstruction defined by validationexercises.
4.1.2. Weaknesses of the actualistic approach
Beyond the accuracy of reconstructions, an importantsource of uncertainty relies on the fact that therelationships between microfossil assemblages and SSTsare not unequivocal and may have changed throughtime, because of changes in the structure of water massesor productivity (cf. e.g., Fairbanks and Wiebe, 1980;Faul et al., 2000; de Vernal et al., 2002). In the case ofdinocyst assemblages, there are clear relationships withthe distribution of seasonal temperature, salinity and seaice. However, the dinocyst distribution is also dependentupon other parameters, such as the trophic structure ofplanktonic populations (e.g., Devillers and de Vernal,2000; Radi and de Vernal, 2004). During the LGM,lower dinocyst fluxes than at present characterised thenorthern North Atlantic. This suggests that nutrientdistribution and productivity were different, which mayintroduce a bias when making quantitative reconstruc-tions of SST or salinity.Another source of uncertainty lies in the fact that the
reconstructed LGM sea-surface conditions are not wellrepresented in the modern hydrographic database. Thedinocyst database is representative of a particularly widerange of sea-surface conditions as compared to otherbiogenic tracers, such as foraminifera, coccoliths oralkenones, which show relationships with temperature,but within a narrow salinity spectra and almostexclusively in ice-free areas. The LGM sea-surfaceconditions in most of the northern North Atlanticapparently belong to a domain characterised byseasonal sea-ice cover and relatively low salinity. Insuch a context, dinocysts appear to be much moresensitive indicators than many other microfossils thatare rather representative of open ocean conditions.Therefore, dinocysts are likely to provide more adequateestimates than stenohaline micro-organisms. However,

ARTIC
LEIN
PRES
STable 4
Difference between estimates of LGM sea-surface conditions presented here (black, normal characters) and those published in 2000 by de Vernal et al. (italic characters)
Cores Latitude Longitude n n AnnualSSTs
AnnualSSTs
D-mean
SummerSSTs
AugustSSTs
D-mean
WinterSSTs
FebruarySTTs
D-mean
Salinity Salinitymean
D-mean
Seaice
Seaice
D-mean
Distanceminmean
Mean St.dev.
Mean Mean St.dev.
Mean St.dev.
Mean St.dev.
Mean St.dev
Mean St.dev
Mean St.dev
Mean St.dev
Mean St.dev
M17045 52.43 �16.39 2 2 7.1 1.1 6.2 0.9 10.7 0.8 9.2 0.3 1.5 4.5 1.0 3.2 0.8 1.3 34.2 0.1 34.8 0.1 �0.6 0.2 0.3 0.0 0.0 0.2 40.3M17724 76.00 8.33 4 5 6.7 2.4 7.4 �0.7 12.4 3.3 13.3 3.1 �0.9 1.7 1.9 1.5 1.0 0.2 31.1 0.5 32.3 0.8 �1.2 1.5 2.7 1.1 1.9 0.4 47.8M23071 67.08 2.90 4 4 7.9 1.4 7.6 0.3 13.3 0.4 13.7 1.3 �0.4 4.1 2.1 1.4 2.1 2.7 33.0 1.0 32.1 1.3 0.9 0.4 0.5 0.8 0.6 �0.4 52.6M23074 66.66 4.91 5 4 6.9 0.3 6.7 0.2 9.7 4.6 13.8 1.9 �4.1 0.2 1.6 �0.5 0.2 0.7 31.5 0.7 30.8 0.1 0.7 3.7 3.3 1.8 1.1 1.9 35.4M23259 72.03 9.27 11 13 6.8 1.5 7.5 �0.7 13.0 1.1 13.8 2.8 �0.8 1.8 1.7 1.2 1.4 0.6 31.5 0.7 31.6 0.7 �0.1 1.3 1.1 1.6 1.8 �0.3 35.5M23294 72.36 �10.36 2 3 8.2 0.9 6.6 1.6 11.8 1.9 9.3 1.3 2.5 5.5 0.5 3.8 0.6 1.7 34.2 0.1 34.0 0.7 0.2 0.0 0.0 2.2 2.0 �2.2 55.0M23519 64.83 �29.56 2 4 6.9 0.2 8.2 �1.3 10.2 0.5 13.1 1.8 �2.9 4.7 0.1 3.3 3.0 1.4 33.9 0.7 33.3 1.8 0.6 1.5 1.3 0.7 1.1 0.8 20.5MD95-2009 62.74 �4.00 5 7 6.7 3.0 8.3 �1.6 12.4 4.1 15.4 1.0 �3.0 1.5 2.9 1.1 2.0 0.4 31.4 1.4 31.3 0.8 0.1 1.3 2.5 2.0 0.9 �0.7 33.8MD95-2010 66.68 4.57 25 4.3 1.7 6.2 �1.9 9.9 3.1 13.4 3.4 �3.5 �0.2 0.8 �1.0 0.2 0.8 31.6 0.7 31.1 0.6 0.5 3.0 1.9 2.5 1.6 0.5 27.1POS0020 67.98 �18.53 7 7 8.4 1.4 8.9 �0.5 13.0 1.4 14.2 1.4 �1.2 5.0 2.0 3.6 2.4 1.4 33.2 1.1 32.9 1.1 0.3 0.4 0.8 0.7 0.8 �0.3 42.6PS1842-6a 69.45 �16.52 8 12 7.4 1.5 8.9 �1.5 12.9 1.0 14.1 1.9 �1.2 3.3 2.2 3.7 2.6 �0.4 31.7 1.3 33.1 1.5 �1.4 1.0 0.9 0.8 0.6 0.2 49.0SU8118 37.78 �10.19 3 4 14.3 1.6 16.5 �2.2 17.1 2.5 18.8 1.0 �1.7 12.1 0.7 14.2 1.2 �2.1 35.5 0.8 36.1 0.2 �0.6 0.2 0.3 0.1 0.1 0.1 101.5SU9016 58.22 �45.16 7 16 4.4 3.2 5.2 �0.7 7.7 4.6 8.6 4.7 �0.9 2.2 2.6 1.7 2.0 0.5 33.2 1.4 33.2 1.7 0.0 3.0 3.9 2.8 3.3 0.2 55.5SU9019 59.53 �39.47 7 7 6.7 1.0 8.2 �1.5 9.5 1.0 11.3 1.6 �1.8 4.6 1.0 5.0 1.5 �0.4 34.3 0.6 34.3 0.6 0.0 0.7 1.0 1.1 1.4 �0.4 48.5SU9024 62.67 �37.38 4 7 6.7 1.0 5.9 0.9 10.1 1.0 9.0 1.4 1.1 4.3 1.1 2.7 1.1 1.6 34.0 1.2 33.7 0.8 0.3 0.3 0.4 1.6 1.5 �1.3 51.6SU9032 61.79 �22.43 7 7 6.0 1.2 7.4 �1.4 10.2 1.9 12.2 1.8 �2.0 3.1 1.5 2.6 1.9 0.5 33.3 1.3 33.2 1.3 0.1 1.0 1.0 1.0 0.6 0.0 41.3SU9033 60.57 �22.08 5 5 7.0 1.6 8.7 �1.7 11.9 2.3 14.0 0.9 �2.1 3.6 2.1 3.4 1.8 0.2 33.0 1.8 32.9 0.6 0.1 0.9 1.0 0.9 0.6 0.0 32.0SU9044 50.02 �17.10 2 2 8.8 1.1 7.7 1.2 11.7 1.7 10.4 0.0 1.3 6.6 0.6 4.9 0.1 1.7 34.7 0.6 35.0 0.1 �0.3 0.0 0.0 0.1 �0.1 60.2MD95-2033 44.66 �55.62 22 21 7.1 1.7 8.7 �1.6 13.1 1.4 15.8 0.6 �2.7 2.3 1.7 1.6 1.4 0.7 31.4 0.5 31.4 0.4 0.0 0.7 1.0 0.8 0.4 �0.1 23.0NA87-22 55.51 �14.71 6 6 6.0 1.2 6.1 �0.1 8.9 2.1 9.3 0.4 �0.4 3.7 0.8 2.9 0.4 0.8 34.3 0.7 34.8 0.4 �0.5 1.7 1.6 1.2 1.5 0.5 40.9SU8147 44.90 �3.31 17 8 7.6 1.5 7.8 �0.2 13.3 1.5 14.5 1.5 �1.2 3.2 2.1 1.0 0.6 2.2 32.2 1.0 32.0 0.8 0.2 0.6 0.9 0.2 0.1 0.4 48.0SU9039 52.57 �21.94 1 1 6.0 — 8.3 �2.3 8.8 — 11.5 — �2.7 4.0 — 5.1 — �1.1 35.0 — 35.1 — �0.1 0.0 — 0.0 — 0.0 68.6HU-84-030-021 58.37 �57.50 13 14 �0.3 1.7 0.1 �0.4 1.2 2.6 1.5 2.0 �0.3 �1.2 1.0 �1.3 0.5 0.1 31.1 1.7 31.3 0.9 �0.2 9.1 2.9 9.2 2.1 �0.1 25.6HU-86-034-040 42.63 �63.10 5 5 6.4 1.1 8.4 �2.0 12.6 0.5 15.7 0.8 �3.1 1.7 1.7 1.0 1.6 0.7 31.6 0.7 31.4 0.7 0.2 1.7 0.6 1.0 0.6 0.7 20.5HU-87-033-007 65.40 �57.42 2 11 �0.7 1.1 0.4 �1.1 0.1 1.3 1.6 1.0 �1.5 �1.2 0.9 �0.8 0.5 �0.4 30.9 1.0 31.8 0.3 �0.9 10.5 0.5 9.3 1.2 1.2 35.4HU-87-033-008 62.64 �53.88 7 8 0.0 2.4 �1.3 1.3 1.6 4.1 �0.9 0.1 2.5 �1.5 0.5 �1.7 0.0 0.2 31.5 0.6 30.6 0.1 0.9 9.3 3.1 11.5 0.3 �2.2 25.6HU�87-033-009 62.51 �59.44 6 10 0.1 1.2 �1.3 1.4 1.4 1.6 �0.8 0.2 2.2 �0.8 0.6 �1.7 0.0 0.9 31.1 0.7 30.7 0.2 0.4 9.6 1.1 11.2 0.1 �1.6 25.7HU-90-013-012 58.92 �47.12 2 11 9.8 0.3 8.6 1.2 14.4 1.4 11.6 3.3 2.8 5.9 1.6 5.5 2.0 0.4 32.8 0.4 33.8 1.0 �1.0 0.2 0.2 1.8 1.9 �1.6 44.2HU-90-013-013 58.21 �48.37 8 9 7.1 2.8 4.7 2.4 11.5 3.2 8.4 1.2 3.1 3.7 3.1 0.9 1.2 2.8 32.8 1.7 32.6 0.9 0.2 1.0 1.7 2.9 1.3 �1.9 38.1HU-90-015-017 42.78 �61.65 7 7 5.4 2.5 8.3 �2.9 10.7 3.5 14.7 2.3 �4.0 1.4 1.9 1.9 0.7 �0.5 31.5 0.6 31.7 0.6 �0.2 2.6 2.0 2.0 1.2 0.6 31.7HU-91-020-013 41.83 �62.33 6 8 5.9 3.7 6.8 �0.9 10.9 5.2 13.7 2.7 �2.8 1.4 2.4 �0.1 0.8 1.5 30.1 1.5 31.0 0.4 �0.9 2.5 3.7 2.3 1.5 0.2 25.8HU-91-045-044 59.36 �43.45 4 4 �1.5 0.1 �0.6 �0.9 �0.8 0.1 0.2 1.1 �1.0 �1.7 0.2 �1.4 0.4 �0.3 31.4 0.4 30.5 0.9 0.9 11.2 0.1 9.7 1.1 1.5 34.4HU-91-045-052 59.49 �39.30 7 8 6.3 2.2 8.3 �1.9 10.2 2.5 12.7 1.1 �2.5 3.6 2.5 3.8 1.2 �0.2 33.0 2.0 33.7 0.8 �0.7 1.7 2.5 0.6 0.3 1.1 49.2HU-91-045-058 59.84 �33.57 10 9 8.5 3.1 9.5 �1.0 12.4 3.4 13.3 2.0 �0.9 5.4 2.9 5.7 1.5 �0.3 33.2 1.4 34.2 0.6 �1.0 0.6 1.3 0.3 0.2 0.3 54.6HU-91-045-064 59.67 �30.57 6 7 7.7 1.8 8.3 �0.5 11.1 2.4 11.2 1.0 �0.1 5.3 1.2 5.3 1.2 0.0 34.0 0.6 34.5 0.6 �0.5 0.4 0.7 0.6 1.5 �0.2 56.6HU-91-045-072a 58.94 �28.74 9 5 5.2 2.8 7.6 �2.4 7.9 3.8 10.7 1.6 �2.8 3.4 2.2 4.5 1.0 �1.1 33.6 1.0 34.5 0.5 �0.9 2.9 2.9 1.8 1.2 1.1 49.4HU-91-045-074a 55.74 �30.22 5 4 7.8 2.4 8.5 �0.7 11.7 2.7 12.7 1.6 �1.0 4.9 1.8 4.2 0.2 0.7 34.2 0.6 33.7 0.5 0.5 0.2 0.3 0.5 0.2 �0.3 60.2HU-91-045-080a 53.07 �33.52 10 10 8.5 2.3 9.3 �0.8 12.9 2.8 13.8 1.1 �0.9 5.2 2.5 4.8 1.8 0.4 33.2 1.4 33.6 0.7 �0.4 0.5 0.9 0.5 0.1 0.0 65.5HU-91-045-082a 52.86 �35.53 5 5 9.9 2.8 8.5 1.4 15.4 2.9 13.1 2.0 2.3 5.6 2.8 3.9 1.5 1.7 33.0 1.4 33.3 1.1 �0.3 0.4 0.7 1.3 1.5 �0.9 65.2HU-91-045-085 53.97 �38.64 3 3 11.0 3.0 8.1 2.9 14.8 2.9 11.7 3.0 3.1 8.1 2.8 4.5 3.0 3.6 33.5 0.7 33.8 1.1 �0.3 0.2 0.3 1.6 2.0 �1.4 62.5HU-91-045-094a,c 50.20 �45.68 27 20 0.5 2.2 0.4 0.1 2.5 3.5 2.0 2.5 0.5 �0.7 1.2 �1.2 0.8 0.5 31.0 1.8 31.2 0.8 �0.2 8.4 3.1 9.6 1.7 �1.2 30.3AII-94-PC3 62.09 �16.62 2 3 4.7 2.4 7.9 �3.2 7.7 2.8 12.8 1.3 �5.1 2.6 2.1 3.0 0.7 �0.4 31.8 1.4 32.8 0.3 �1.0 4.1 2.4 0.7 0.5 3.4 24.5D89-BOFS-5K 50.69 �21.86 6 6 9.8 3.8 9.6 0.2 14.3 4.1 13.5 2.6 0.8 6.2 3.6 5.7 2.3 0.5 33.8 1.6 34.1 0.9 �0.3 0.1 0.2 0.1 0.3 0.0 61.5HM52-43 64.25 0.73 3 3 6.8 1.4 7.8 �1.0 12.8 2.3 15.3 0.2 �2.5 2.2 1.9 0.3 0.5 1.9 31.8 1.0 31.1 0.1 0.7 0.8 1.4 0.4 0.5 0.4 44.5HM71-19 69.49 �9.53 1 1 8.8 � 10.4 �1.6 13.8 — 14.4 — �0.6 5.4 — 6.4 — �1.0 33.6 — 34.9 — �1.3 0.0 — 0.0 — 0.0 65.6HM80-30 71.80 1.61 2 2 8.7 0.1 9.7 �1.0 13.3 0.3 13.4 0.2 �0.1 5.5 0.4 6.0 0.1 �0.5 34.0 0.2 35.1 0.0 �1.1 0.0 0.0 0.0 0.0 0.0 62.0HM94-13 71.63 �1.63 1 1 3.3 — 1.9 1.4 6.4 — 4.2 — 2.2 1.1 — �0.5 — 1.6 31.9 — 31.4 — 0.5 5.3 — 8.5 — �3.2 63.6HM94-25 75.60 1.30 1 1 7.1 — 5.6 1.6 10.9 — 8.9 — 2.0 4.1 — 2.2 — 1.9 33.0 — 34.9 — �1.9 2.2 — 0.0 — 2.2 63.3HM94-34 73.78 �2.54 3 3 8.7 1.6 8.9 �0.2 13.0 1.7 12.1 0.8 0.9 5.5 1.7 5.8 0.9 �0.3 33.6 1.2 34.6 0.5 �1.0 0.7 1.2 1.5 1.3 �0.8 71.8M17730 72.05 7.31 1 1 9.2 — 6.9 2.3 13.6 — 9.9 — 3.7 5.8 — 3.8 — 2.0 33.9 — 34.7 — �0.8 0.0 — 0.0 — 0.0 89.1
The differences are shown by bold characters.
A.
de
Vern
al
eta
l./
Qu
atern
ary
Scien
ceR
eviews
24
(2
00
5)
89
7–
92
4917

ARTICLE IN PRESSA. de Vernal et al. / Quaternary Science Reviews 24 (2005) 897–924918
the sea-surface reconstructions based on dinocysts arecomprised in a domain of the reference database that ischaracterised by a low density of data points,with respect to summer SSTs vs. winter SSTs or salinity(Fig. 12). The dinocyst-based reconstructions of theLGM in the northern North Atlantic have noperfect analogue known from the modern hydrographyof the high northern latitudes. Nevertheless, theLGM data points occur in a central area of thehydrographic domains represented by the moderndatabase and likely occur within the range ofvalues we may reconstruct based on dinocystassemblages. In other words, the degree of accuracy ofLGM reconstructions and estimated values may bediscussed, but the hydrographical domains involved areprobably correct.
4.2. The most salient features of the LGM based on
dinocyst data
In spite of the uncertainties examined above, there areconsistent features in the reconstructions of LGM sea-surface conditions based on dinocyst assemblages thatappear as robust as possible given the context of weakanalogue situation. These features are summarisedbelow.
(1)
Sea-ice cover was much more extensive than atpresent, notably along the eastern Canadian margin.Offshore, in the subarctic basins of the NorthAtlantic, i.e., the Labrador Sea, the Irminger Basin,the Greenland and Norwegian seas, seasonal sea icedeveloped for a few weeks to a few months per year,whereas in the northeastern part of the NorthAtlantic, ice-free conditions prevailed throughoutthe year.(2)
Fig. 12. Graph showing the hydrographical domains of the n=940
calibration database and that of the LGM reconstructions. The light
gray circles illustrate the distribution of summer temperature vs. winter
temperature, sea-ice cover, and summer salinity for the 940 modern
samples (same as Fig. 4) and the open circles illustrate the same
distribution for the LGM cores. Note that the LGM reconstructions
are included in domains characterised by a low density of modern data
points.
Relatively low sea-surface salinity during the LGMcharacterised the northern North Atlantic andadjacent basins (Fig. 13). In areas marked byextensive sea-ice cover, low sea-surface salinitiesmay have been related to the summer melting of seaice. However, the particularly low salinities recordedalong the southern Canadian and Scandinavianmargins (31–32) likely reflect mixing with largemeltwater supplies from surrounding ice sheets,which resulted in the dilution of surface watersoffshore. In the central part of the North Atlantic, anegative salinity anomaly of about one unit isrecorded as compared with the modern situation.During the LGM, the buoyancy of the low-densitysurface water layer over the northern North Atlanticwas responsible for reduced vertical convection fromthe surface and the absence of deep or intermediatewater formation at the corresponding latitudes (cf.Hillaire-Marcel et al., 2001a, b; de Vernal et al.,2002).
(3)
On the whole, winter conditions colder than atpresent and relatively mild summers resulted insignificantly larger seasonal gradients of temperaturein surface water masses (Fig. 13). The low thermalinertia of the shallow and buoyant upper water layercan be evoked to explain high energy uptake duringthe summer seasons, then characterised by aninsolation roughly the same as at present, followedby rapid cooling during winters.
ARTICLE IN PRESS
Fig. 13. Summary of the hydrographical anomalies between the LGM
and the present.
A. de Vernal et al. / Quaternary Science Reviews 24 (2005) 897–924 919
(4)
Reconstruction of the mean annual temperatureshows values colder, cooler or equivalent to presentconditions on an average basis during the LGM,with some exceptions, notably in the Greenland andNorwegian seas (Fig. 13; Table 3). LGM data fromthe Greenland Sea are not very robust because oflow dinocyst concentrations and weak analoguesituations (Fig. 8), but data from the Norwegian Seaappear reliable and suggest the existence of mildconditions at least episodically.4.3. The northern North Atlantic LGM SST: contrasting
pictures depending on the choice of proxies?
4.3.1. Contribution of dinocyst data
In the northern North Atlantic, the LGM paleocea-nographic data from dinocysts are complementary tothose from planktonic foraminifer assemblages (Weineltet al., 1996; Pflaumann et al., 2003) and alkenones(Rosell-Mele and Comes, 1999; Rosell-Mele et al.,2004). First, they improve the geographical coverageof LGM reconstructions along the margins of southeastern Canada, the Labrador Sea and Baffin Bay,where other data are very rare. Second, they help toconstrain the limits of sea ice and also providequantitative information on the seasonal extent of theice coverage (Fig. 10). Third, dinocysts permit theestimation of sea-surface salinity, which is an importanthydrographic parameter of the North Atlantic Oceanwith respect to thermohaline circulation. Finally, the
calibration database of dinocysts includes large numbersof samples from the Arctic seas and subarctic basins,unlike other proxies. Therefore, dinocyst assemblagesshould permit identification of analogues from Arcticand subarctic environments for the LGM interval. Oneof the important findings from this study is the lack ofperfect modern analogues for LGM North AtlanticOcean, even in the Arctic and subarctic seas.
4.3.2. Consistent features and discrepancies from the
comparison with other proxies
Despite discrepancies, there are converging features inthe LGM reconstructions based on the different proxies.One of these features concerns sea ice. All proxiessuggest seasonally ice-free conditions in the northernNorth Atlantic and the Nordic seas, and the maximumextent of LGM sea-ice cover shows similar limits in thecentral North Atlantic estimated from dinocysts (pinkdashed line in upper left diagram of Fig. 10) andindirectly estimated from planktonic foraminifera (cf.Pflaumann et al., 2003). Another convergent featurebetween dinocyst and planktonic foraminifer data is thegradient of LGM-modern SST that shows similarpatterns, although the absolute values differ signifi-cantly.The reconstructions of LGM SSTs based on dinocysts
are not in contradiction with temperatures derived fromalkenone data (Rosell-Mele and Comes, 1999; Rosell-Mele et al., 2004), but they show discrepancies with datafrom planktonic foraminifera well beyond the degrees ofuncertainty of the respective approaches. On the whole,dinocyst data yield much warmer estimates thanplanktonic foraminifera, whatever the type of transferfunction used (cf. CLIMAP, 1981; Pflaumann et al.,1996, 2003; Weinelt et al., 1996, 2003; Waelbroeck et al.,1998), but are compatible with those obtained fromalkenones (cf. Rosell-Mele and Comes, 1999) orcoccoliths (de Vernal et al., 2000). Therefore, we aretempted to distinguish two types of tracers. The firstcategory includes dinocysts as well as coccoliths andtheir alkenones. Worth of mention here is the fact thatthe LGM coccolith assemblages of the northern NorthAtlantic are mostly dominated by Emiliania huxleyi (cf.de Vernal et al., 2000), one of the rare euryhaline taxaamongst coccolithophorids (e.g., Winter et al., 1994)that is also responsible for alkenone production. Thesecond category of tracers consists of planktic forami-niferal assemblages that barely tolerate salinity below 32or 33 (cf. Be and Tolderlund, 1971). In the first case, i.e.,that of coccoliths, alkenones and autotrophic dinocysts,the tracers relate to primary production in the photiczone of the upper surface water layer, whereas in thesecond case, they relate to heterotrophic production andcharacterise various depth habitats from the epipelagicto the mesopelagic domains. The two categories oftracers can thus be distinguished based on two patterns:

ARTICLE IN PRESSA. de Vernal et al. / Quaternary Science Reviews 24 (2005) 897–924920
(1) their depth habitat and/or (2) their relative toleranceto low salinity. The discrepancy of temperature esti-mates obtained from the different types of proxies couldthus simply reflect specificities in the vertical or temporalstructure of the upper water masses.Therefore, most LGM data from the various proxies,
including microfossil assemblages, isotopic content offoraminifera or biomarkers, can be reconciled throughan interpretation invoking either strong temperature-salinity gradients in the upper water column, withpossible variations in the seasonal gradients of tempera-tures, or alternation of episodes of warm and dilutesurface water with episodes of higher salinity but coldconditions. The existence of a sharp halo-thermoclineseparating a shallow and low saline mixed layer from acold and dense mesopelagic water mass, could explainthe co-occurrence of temperate autotrophic producersand polar zooplanktonic populations. As a matter offact, sharp density gradients can be reconstructed for theLGM by combining information from dinocyst dataand d18O in planktonic foraminifera (Globigerina
bulloides and Neogloboquadrina pachyderma left coiled)recovered from different size fractions (Hillaire-Marcelet al., 2001a, b; de Vernal et al., 2002). The isotopiccompositions of N. pachyderma shells of increasing sizeand density, which can be associated with gradationaldepths along the pycnocline, have been used todocument the density gradient in the upper watercolumn in the Labrador Sea (Hillaire-Marcel et al.,2001a) and the Arctic Ocean (Hillaire-Marcel et al.,2004). Using these data, together with d18O values in theepipelagic foraminifer G. bulloides, and estimated SSTsand salinities from dinocysts, it has been possible topropose the existence of vertical density gradientsranging from 1.5 to 3 density units (sy) in the upperwater masses of the northwestern North Atlantic duringthe LGM (de Vernal et al., 2002). However, it is notexcluded that such gradients represent conditionsoccurring during distinct episodes.
4.3.3. The problem of the Nordic seas
Although the sea-surface conditions of the LGMreconstructed on the basis of dinocyst assemblages canbe reconciled with other paleoceanographical data asoutlined above, the case of the Nordic seas, andespecially that of the Greenland Sea, remains proble-matic. The strongly positive LGM anomalies oftemperatures obtained in the Greenland Sea based ondinocysts (de Vernal et al., 2000; this study) oralkenones (Rosell-Mele and Comes, 1999) are somewhatdifficult to explain.In the eastern part of the Nordic seas, along the
Norwegian margins, the dinocyst assemblages arecharacterised by relatively high concentrations and largespecies diversity. The number of analysed samples, andthe overall reliability of reconstructions based on
dinocysts (Fig. 8 and Table 2) in the eastern NorwegianSea suggest that relatively warm conditions existed inthe Nordic seas during the LGM, at least episodicallyand or seasonally. The dinocyst assemblages and otherpaleoceanographical tracers show large-amplitudechanges in oceanographical conditions which can belinked with the high-frequency climate oscillationsduring the last ice age as recorded in the isotopic recordof Greenland ice cores (e.g., Rasmussen et al., 1996).The reconstructions from the central and western
parts of the Nordic seas, however should be consideredwith caution. In general, this area is characterised bylow biogenic productivity and low sedimentation rates(cf. Sarnthein et al., 1995; Hebbeln et al., 1998). As aconsequence, the sedimentary interval representative ofthe LGM is relatively thin. Moreover, the interpretationof the sparse micropaleontological assemblages isequivocal also because of possible reworking andbiological mixing.Two hypothesis, not exclusive to each other, are
tentatively proposed to explain the overall records of theNordic seas:
Hypothesis 1. The sparse assemblages that are observedin the LGM interval of the central and western Nordicseas might reflect highly variable conditions, fromgenerally cold and quasi-perennial sea-ice cover (nilproductivity) to episodically mild conditions (with someproductivity), e.g., when large anticyclonic gyre devel-oped and sea ice broke due to strong storms. At present,sharp fronts and extremely high interannual–interdeca-dal variability in sea-surface conditions and sea-icecover are recorded in the central part of the Nordic seas,and we may hypothesise that a similar variability existedduring the LGM. The existence of fronts controllingpressure gradient and storm tracks may have played animportant role in the moisture supply to feed thenorthern ice sheet.
Hypothesis 2. The assemblages might reflect nil regionalproductivity due to quasi-permanent sea ice in theeastern and northern parts of the Nordic seas. In such acase, the very sparse assemblages of the Greenland Seamight be due to lateral advection of fine material(dinocysts, alkenone, coccoliths) through a subsurfacecurrent flowing from the south and penetrating into thecentral Nordic seas by subduction. A modern equivalentfor such a situation could be found in the northernBarents Sea where the North Atlantic Drift surfacewater mass is subducting below the low saline Arcticwaters.
5. Conclusions
The dinocyst database that has been developed fromthe analyses of surface sediment samples collected in
ARTICLE IN PRESSA. de Vernal et al. / Quaternary Science Reviews 24 (2005) 897–924 921
middle- to high-latitude marine environments of theNorthern Hemisphere covers a wide range of hydro-graphical conditions notably in the domain charac-terised by the presence of seasonal sea-ice cover. Thisdatabase was used to reconstruct quantitatively the sea-surface conditions that prevailed during the LGM. Itprovides some clues about the paleoceanographicalregime which prevailed over the northern NorthAtlantic when continental ice sheets reached theirmaximum extent over surrounding lands and continen-tal shelves. The LGM reconstructions illustrate exten-sive sea-ice cover along the eastern Canadian margin,and some spreading of sea ice during winter, in subpolarbasins and Nordic seas, whereas the northeast Atlanticsouth of 501N remained free of sea ice. As a response tomeltwater discharges from the surrounding ice sheetsgrounded on the shelves, relatively low salinity char-acterised surface waters, especially along the easternCanadian and Scandinavian margins. A possible ex-planation would be the development of a buoyant andprobably shallow mixed layer resulting in a low thermalinertia in the surface waters. This would explain thereconstructed large seasonal contrasts of temperatureswith the cold winter and relatively mild summer. In thisscenario, the sea-surface conditions reconstructed at thescale of the northern North Atlantic indicate strongstratification, unfavourable for vertical convection, andlead us to make a comparison with a large fjord-likesystem making the transition between the continentalice sheets and the ocean. In such a context, mostbioindicators of ‘‘open ocean’’ conditions would have alimited sensitivity, which may explain the discrepanciesbetween the different sets of LGM reconstructions basedon different proxies. Another explanation would invokealternation of episodes of low salinity and high summerSSTs in surface waters with episodes of higher salinityand lower temperature accounting for the reconstructedcold conditions based on foraminifera.
Acknowledgements
This study is a contribution to the Climate System,History and Dynamics (CSHD) project, supported bythe National Science and Engineering Research Council(NSERC) of Canada, and to the international IMAGESprogram. Complementary support by the Fonds quebe-
cois de Recherche sur la Nature et les Technologies andby the Canadian Foundation for Climate and Atmo-spheric Sciences (project no. GR-240) is acknowledged.We are extremely grateful to many institutions for theirmost precious help in providing surface sedimentsamples, notably the Oregon State University, LamontDoherty Earth Observatory, the Bedford Institute ofOceanography, the University of Kiel, GEOMAR, andthe Alfred Wegener Institute. We also thank Karin
Zonneveld, Barrie Dale and Michal Kucera for theircritical and constructive review of the manuscript.
References
Antoine, D., Andre, J.M., Morel, A., 1996. Oceanic primary
production. 2. Estimation at global scale from satellite (costal
zone colour scanner) chlorophyll. Global Biogeochemical Cycles
10, 57–69.
Be, A.W.H., Tolderlund, D.S., 1971. Distribution and ecology of living
planktonic foraminifera in surface waters of the Atlantic and
Indian oceans. In: Funnel, B.M., Riedel, W.R. (Eds.), The
Micropaleontology of Oceans. Cambridge University Press, Cam-
bridge, pp. 105–149.
Bedford Institute of Oceanography (BIO), 2003. A monthly gridded set
of temperature and salinity for the northwest North Atlantic
Ocean, CD-Rom data set.
Broecker, W.S., Peng, T.-H., 1982. Tracers in the Sea. Lamont–
Doherty Geological Observatory. Columbia University, New
York.
CLIMAP Project Members, 1981. Seasonal reconstructions of the
earth’s surface at the last glacial maximum. Geological Society of
America Map and Chart Series MC-56.
Combourieu-Nebout, N., Turon, J.L., Zahn, R., Capotondi, L.,
Londeix, L., Pahnke, K., 2002. Enhanced aridity and atmospheric
high-pressure stability over the western Mediterranean during the
North Atlantic cold events of the past 50 kyrs. Geology 30,
863–866.
Comiso, J.C., 2002. Correlation and trend studies of the sea-ice cover
and surface temperatures in the Arctic. Annals of Glaciology 34,
420–428.
Dale, B., 1976. Cyst formation, sedimentation, and preservation:
factors affecting dinoflagellate assemblages in recent sediments
from Trondheimsfjord, Norway. Review of Palaeobotany and
Palynology 22, 39–60.
Dale, B., 1983. Dinoflagellate resting cysts: benthic plankton. In:
Fryxell, G.A. (Ed.), Survival Strategies of Algae. Cambridge
University Press, Cambridge, pp. 69–136.
Dale, B., 1996. Dinoflagellate cyst ecology: modeling and geological
applications. In: Jansonius, J., McGregor, D.C. (Eds.), Palynology:
Principles and Applications, vol. 3. American Association of
Stratigraphic Palynologists Foundation, Dallas, TX, pp.
1249–1275.
de Vernal, A., Giroux, L., 1991. Distribution of organic-walled
microfossils in recent sediments from the Estuary and Gulf of St.
Lawrence: some aspects of the organic matter fluxes. Canadian
Journal of Fisheries and Aquatic Sciences 113, 189–199.
de Vernal, A., Hillaire-Marcel, C., 2000. Sea-ice cover, sea-surface
salinity and halo-thermocline structure of the northwest North
Atlantic: modern versus full glacial conditions. Quaternary Science
Reviews 19, 65–85.
de Vernal, A., Pedersen, T., 1997. Micropaleontology and palynology
of core PAR 87 A-10: a 30,000 years record of paleoenvironmental
changes in the Gulf of Alaska, northeast North Pacific. Paleocea-
nography 12, 821–830.
de Vernal, A., Turon, J.-L., Guiot, J., 1994. Dinoflagellate cyst
distribution in high latitude environments and quantitative
reconstruction of sea-surface temperature, salinity and seasonality.
Canadian Journal of Earth Sciences 31, 48–62.
de Vernal, A., Henry, M., Bilodeau, G., 1999. Technique de
preparation et d’analyse en micropaleontologie. Les Cahiers du
GEOTOP, Universite du Quebec a Montreal, 3, Unpublished
report.
de Vernal, A., Hillaire-Marcel, C., Turon, J.-L., Matthiessen, J., 2000.
Reconstruction of sea-surface temperature, salinity, and sea-ice

ARTICLE IN PRESSA. de Vernal et al. / Quaternary Science Reviews 24 (2005) 897–924922
cover in the northern North Atlantic during the last glacial
maximum based on dinocyst assemblages. Canadian Journal of
Earth Sciences 37, 725–750.
de Vernal, A., Rochon, A., Turon, J.-L., Matthiessen, J., 1997.
Organic-walled dinoflagellate cysts: palynological tracers of sea-
surface conditions in middle to high latitude marine environments.
GEOBIOS 30, 905–920.
de Vernal, A., Hillaire-Marcel, C., Peltier, W.R., Weaver, A.J., 2002.
The structure of the upper water column in the northwest North
Atlantic: modern vs. Last Glacial Maximum conditions. Paleocean-
ography 17, 1050.
de Vernal, A., Henry, M., Matthiessen, J., Mudie, P.j., Rochon, A.,
Boessenkool, K., Eynaud, F., Grøsfjeld, K., Guiot, J., Hamel, D.,
Harland, R., Head, M.j., Kunz-pirrung, M., Levac, E., Loucheur,
V., Peyron, O., Pospelova, V., Radi, T., Turon, J.-L., Voronina, E.,
2001. dinoflagellate cyst assemblages as tracers of sea-surface
conditions in the northern North Atlantic, Arctic and sub-arctic
seas: the new ‘‘n=677’’ database and application for quantitative
paleoceanographical reconstruction. Journal of Quaternary Science
16, 681–699.
Devillers, R., de Vernal, A., 2000. Distribution of dinocysts in surface
sediments of the northern North Atlantic in relation with nutrients
and productivity in surface waters. Marine Geology 166, 103–124.
Dodge, J.D., 1994. Biogeography of marine armoured dinoflagellates
and dinocysts in the NE Atlantic and North Sea. Review of
Palaeobotany and Palynology 84, 169–180.
Duane, A., Harland, R., 1990. Late Quaternary dinoflagellate cyst
biostratigraphy for sediments of the Porcupine Basin, offshore
western Ireland. Review of Palaeobotany and Palynology 63, 1–11.
Dodge, J.D., Harland, R., 1991. The distribution of planktonic
dinoflagellates and their cysts in the eastern and northeastern
Atlantic Ocean. New Phytologist 118, 593–603.
Eynaud, F., Turon, J.-L., Matthiessen, J., Kissel, C., Peypouquet, J.-
P., de Vernal, A., Henry, M., 2002. Norwegian Sea surface
palaeoenvironments of the Marine Isotopic Stage 3: the paradox-
ical response of dinoflagellate cysts. Journal of Quaternary Science
17, 349–359.
Fairbanks, R.G., Wiebe, P.H., 1980. Foraminifera and chlorophyll
maximum: vertical distribution, seasonal succession, and paleocea-
nographic significance. Science 209, 1524–1526.
Faul, K., Ravelo, A.C., Delanay, M.L., 2000. Reconstructions of
upwelling, productivity, and photic zone depth in the eastern
equatorial Pacific ocean using planktonic foraminiferal stable
isotopes and abundances. Journal of Foraminiferal Research 30,
110–125.
Gaines, G., Elbracher, M., 1987. Heterotrophic nutrition. In: Taylor,
F.J.R. (Ed.), The Biology of Dinoflagellates, Botanical Monograph
21. Blackwell Scientific, Oxford, pp. 224–281.
Gascard, J.-C., Watson, A.J., Messias, M.-J., Olsson, K.A., Johan-
nessen, T., Simonsen, K., 2002. Long-lived vortices as a mode of
deep ventilation in the Greenland Sea. Nature 416, 525–527.
Godhe, A., Noren, F., Kuylenstierna, M., Ekberg, C., Karlson, B.,
2001. Relationship between planktonic dinoflagellate abundance,
cysts recovered in sediment traps and environmental factors in the
Gullmar Fjord, Sweden. Journal of Plankton Research 23,
923–938.
Graham, D.K., Harland, R., Gregory, D.M., Long, D., Morton, A.C.,
1990. The biostratigraphy and chronostratigraphy of BGS
Borehole 78/4, North Minch. Scottish Journal of Geology 26,
65–75.
Grøsfjeld, K., Harland, R., 2001. Distribution of modern dinoflagel-
late cysts from inshore areas along the coast of southern Norway.
Journal of Quaternary Science 16, 651–660.
Guiot, J., 1990. Methods and programs of statistics for paleoclimatol-
ogy and paleoecology. In: Guiot, J., Labeyrie, L. (Eds.),
Quantification des changements climatiques: methode et pro-
grammes. Institut National des Sciences de l’Univers (INSU-
France), Monographie No 1, Paris.
Guiot, J., Goeury, C., 1996. PPPbase, a software for statistical analysis
of paleoecological data. Dendrochronologia 14, 295–300.
Hamel, D., de Vernal, A., Gosselin, M., Hillaire-Marcel, C., 2002.
Organic-walled microfossils and geochemical tracers: sedimentary
indicators of productivity changes in the North Water and
northern Baffin Bay (High Arctic) during the last centuries.
Deep-Sea Research II 49, 5277–5295.
Harland, R., 1983. Distribution maps of recent dinoflagellate cysts in
bottom sediments from the North Atlantic Ocean and adjacent
seas. Palaeontology 26, 321–387.
Head, M.J., 1996. Modern dinoflagellate cysts and their biological
affinities. In: Jansonius, J., McGregor, D.C. (Eds.), Palynology:
Principles and Applications, vol. 3. American Association of
Stratigraphic Palynologists Foundation, Dallas, TX, pp. 1197–1248.
Head, M.J., Harland, R., Matthiessen, J., 2001. Cold marine
indicators of the late Quaternary: the new dinoflagellate cyst genus
Islandinium and related morphotypes. Journal of Quaternary
Science 16, 621–636.
Head, M.J., Lewis, J., de Vernal, A., The cyst of the calcareous
dinoflagellate Scrippsiella trifida, and the fossil record of its organic
wall. Journal of Palaeontology, in press.
Hebbeln, D., Henrich, R., Baumann, K.-H., 1998. Paleoceanography
of the last Interglacial/Glacial cycle in the polar North Atlantic.
Quaternary Science Reviews 17, 125–153.
Hillaire-Marcel, C., de Vernal, A., Lucotte, M., Mucci, A., Bilodeau,
G., Rochon, A., Vallieres, S., Wu, G., 1994. Productivite et flux de
carbone dans la mer du labrador au cours des derniers 40.000 ans.
Canadian Journal of Earth Sciences 31, 139–158.
Hillaire-Marcel, C., de Vernal, A., Candon, L., Bilodeau, G., Stoner,
J., 2001a. Changes of potential density gradients in the north-
western North Atlantic during the last climatic cycle based on a
multiproxy approach. In: Seidov, D., Maslin, M., Haupt, B. (Eds.),
The Oceans and Rapid Climate Changes: Past, Present and Future.
Geophysical Monograph Series, vol. 126. American Geophysical
Union, Washington, DC, pp. 83–100.
Hillaire-Marcel, C., de Vernal, A., Bilodeau, G., Weaver, A., 2001b.
Absence of deep water formation in the Labrador Sea during the
last interglacial. Nature 410, 1073–1077.
Hillaire-Marcel, C., de Vernal, A., Polyak, L., Darby, D., 2004. Size
dependent isotopic composition of planktic foraminifers from
Chukchi Sea vs. NW Atlantic sediments—implications for the
Holocene paleoceanography of the western Arctic. Quaternary
Science Reviews 23, 245–260.
Imbrie, J., Kipp, N.G., 1971. A new micropaleontological method for
quantitative paleoclimatology: application to a late Pleistocene
Caribbean core. In: Turekian, K.K. (Ed.), The Late Cenozoic
Glacial Ages. Yale University Press, New Haven, Conn.,
pp. 71–181.
Isemer, H.-J., Hasse, L., 1985. The Bunker Climate Atlas of the North
Atlantic Ocean, vol. 1: Observations. Springer, Berlin, pp. 57–61.
Koc- , N., Jansen, E., Haflidason, H., 1993. Paleoceanographic
reconstruction of surface ocean conditions in the Greenland,
Iceland, and Norwegian seas through the last 14,000 years based on
diatoms. Quaternary Science Reviews 12, 115–140.
Kokinos, J.P., Eglinton, T.I., Goni, M.A., Boon, J.J., Martoglio, P.A.,
Anderson, D.M., 1998. Characterisation of a highly resistant
biomacromolecular material in the cell wall of a marine dino-
flagellate resting cyst. Organic Geochemistry 28, 265–288.
Kucera, M., Malmgren, B.A., 1998. Logratio transformation of
compositional data—a resolution of the constant sum constraint.
Marine Micropaleontology 34, 117–120.
Kunz-Pirrung, M., 1998. Rekonstruktion der Oberflachenwassermas-
sen der ostlichen Laptevsee im Holozan anhand von aquatischen
Palynomorphen. Berichte zur Polarforschung 281, 117.

ARTICLE IN PRESSA. de Vernal et al. / Quaternary Science Reviews 24 (2005) 897–924 923
Kunz-Pirrung, M., 2001. Dinoflagellate cyst assemblages in recent
sediments of the Laptev Sea (Arctic Ocean) and their relation to
hydrographic conditions. Journal of Quaternary Science 16,
637–650.
Lapointe, M., 2000. Late Quaternary paleohydrology of the Gulf of St.
Lawrence (Quebec, Canada) based on diatom analysis. Palaeogeo-
graphy, Palaeoclimatology, and Palaeoecology 156, 261–276.
Lea, D.W., Mashiotta, T.A., Spero, H.J., 1999. Controls on
magnesium and strontium uptake in planktonic foraminifera
determined by live culturing. Geochimica et Cosmochimica Acta
63, 2369–2379.
Levandowsky, M., Kaneta, P., 1987. Behaviour in dinoflagellates. In:
Taylor, F.J.R. (Ed.), The Biology of Dinoflagellates. Botanical
Monograph 21. Blackwell Scientific, Oxford, pp. 360–397.
Malmgren, B., Nordlund, U., 1997. Application of artificial neural
network to paleoceanographic data. Palaeogeography, Palaeo-
climatology, and Palaeoecology 136, 359–373.
Mangin, S., 2002. Distribution actuelle des kystes de dinoflagelles en
Mediterranee occidentale et application aux fonctions de transfert,
vol. 1. Memoir of DEA, University of Bordeaux, 34pp.
Marret, F., 1993. Les effets de l’acetolyse sur les assemblages de kystes
de dinoflagelles. Palynosciences 2, 267–272.
Marret, F., Scourse, J., 2003. Control of modern dinoflagellate cyst
distribution in the Irish and Celtic Seas by seasonal stratification
dynamics. Marine Micropaleontology 47, 101–116.
Marret, F., Zonneveld, K., 2003. Atlas of modern organic-walled
dinoflagellate cyst distribution. Review of Palaeobotany and
Palynology 125, 1–200.
Marret, F., Eiriksson, J., Knudsen, K.-L., Turon, J.-L., Scourse, J.,
2004. Distribution of dinoflagellate cyst assemblages in surface
sediments from the northern and western shelf of Iceland. Review
of Palaeobotany and Palynology 128, 35–53.
Matthiessen, J., 1995. Distribution patterns of dinoflagellate cysts and
other organic-walled microfossils in recent Norwegian–Greenland
Sea sediments. Marine Micropaleontology 24, 307–334.
Mix, A.E., Bard, E., Schneider, R., 2001. Environmental processes of
the ice age: land, ocean, glaciers (EPILOG). Quaternary Science
Reviews 20, 627–657.
Mudie, P.J., 1992. Circum-arctic Quaternary and Neogene marine
palynofloras: paleoecology and statistical analysis. In: Head, M.J.,
Wrenn, J.H. (Eds.), Neogene and Quaternary Dinoflagellate Cysts
and Acritarchs. American Association of Stratigraphic Palynolo-
gists Foundation, College Station, TX, pp. 347–390.
Mudie, P.J., Rochon, A., 2001. Distribution of dinoflagellate cysts in
the Canadian Arctic marine region. Journal of Quaternary Sciences
16, 603–620.
Mudie, P.J., Harland, R., Matthiessen, J., de Vernal, A., 2001.
Dinoflagellate cysts and high latitude Quaternary paleoenviron-
mental reconstructions: an introduction. Journal of Quaternary
Science 16, 595–602.
National Oceanographic Data Center (NODC), 1994. World Ocean
Atlas. National Oceanic and Atmospheric Administration, CD-
Rom data sets.
National Oceanographic Data Center (NODC), 1998. World Ocean
Atlas. National Oceanic and Atmospheric Administration, http://
www.nodc.noaa.gov/OC5/pr_woaf.html.
Nurnberg, D., Muller, A., Schneider, R.R., 2000. Paleo-sea surface
temperature calculations in the equatorial east Atlantic from Mg/
Ca ratios in planktic foraminifera: A comparison to sea surface
temperature estimates from U37K0
, oxygen isotopes, and foraminif-
eral transfer function. Paleoceanography 15, 124–134.
Peltier, W.R., 1994. Ice age paleotopography. Science 265, 195–201.
Peyron, O., de Vernal, A., 2001. Application of Artifical Neural
Network (ANN) to high latitude dinocyst assemblages for the
reconstruction of past sea-surface conditions in Arctic and sub-
arctic seas. Journal of Quaternary Science 16, 699–711.
Pflaumann, U., Duprat, J., Pujol, C., Labeyrie, L., 1996. SIMMAX: a
modern analog technique to deduce Atlantic sea surface tempera-
tures from planktonic foraminifera in deep-sea sediments. Paleo-
ceanography 11, 15–35.
Pflaumann, U., Sarnthein, M., Chapman, M., d’Abreu, L., Funnell,
B., Huels, M., Kiefer, T., Maslin, M., Schulz, H., Swallow, J., van
Kreveld, S., Vautravers, M., Vogelsang, E., Weinelt, M., 2003.
Glacial North Atlantic: sea-surface conditions reconstructed by
GLAMAP 2000. Paleoceanography 18, 1065.
Radi, T., de Vernal, A., 2004. Dinocyst distribution in surface
sediments from the northeastern Pacific margin (40–601N) in
relation to hydrographic conditions, productivity and upwelling.
Review of Paleobotany and Palynology 128, 169–193.
Radi, T., de Vernal, A., Peyron, O., 2001. Relationships between
dinocyst assemblages in surface sediment and hydrographic
conditions in the Bering and Chukchi seas. Journal of Quaternary
Science 16, 667–680.
Raine, R., White, M., Dodge, J.D., 2002. The summer distribution of
net plankton dinoflagellates and their relation to water movements
in the NE Atlantic Ocean, west of Ireland. Journal of Plankton
Research 24, 1131–1147.
Rasmussen, T.L., Thomsen, E., van Weering, T.C.E., Labeyrie, L.,
1996. Rapid changes in surface and deep water conditions at the
Faeroe Margin during the last 58,000 years. Paleoceanography 11,
757–771.
Rochon, A., de Vernal, A., 1994. Palynomorph distribution in recent
sediments from the Labrador Sea. Canadian Journal of Earth
Sciences 31, 115–127.
Rochon, A., de Vernal, A., Turon, J.-L., Matthiessen, J., Head, M.J.,
1999. Distribution of dinoflagellate cyst assemblages in surface
sediments from the North Atlantic Ocean and adjacent basins and
quantitative reconstruction of sea-surface parameters. Special
Contribution Series of the American Association of Stratigraphic
Palynologists 35.
Rosell-Mele, A., 1997. Appraisal of CLIMAP temperature
reconstruction in the NE Atlantic using alkenone proxies. Eos 78
(46), F28.
Rosell-Mele, A., 1998. Interhemispheric appraisal of the value of
alkenone indices as temperature and salinity proxies in high
latitude locations. Paleoceanography 13, 694–703.
Rosell-Mele, A., Comes, P., 1999. Evidence for a warm last glacial
maximum in the Nordic Seas, or an example of shorthcomings in
U37K0
and U37K to estimate low sea surface temperature? Paleoceano-
graphy 13, 694–703.
Rosell-Mele, A., Bard, E., Emeis, K.C., Grieger, B., Hewitt, C.,
Muller, P.J., Schneider, R., 2004. Sea surface temperature
anomalies in the oceans at the LGM estimated from the
alkenone-U37K0
index: comparison with GCMs. Geophysical Re-
search Letters 31, L03208.
Sarnthein, M., Gersonde, R., Niebler, S., Pflaumann, U., Spielhagen,
R., Thiede, J., Wefer, G., Weinelt, M., 2003. Overview of Glacial
Atlantic Ocean Mapping (GLAMAP 2000). Paleoceanography 18,
1071.
Sarnthein, M., Jansen, E., Weinelt, M., Arnold, M., Duplessy, J.C.,
Erlenkeuser, H., Flatøy, A., Johannessen, G., Johannessen, T.,
Jung, S., Koc, N., Labeyrie, L., Maslin, M., Pflaumann, U., Schulz,
H., 1995. Variations in Atlantic surface ocean paleoceanography,
501–801N: A time-slice record of the last 30,000 years. Paleoceano-
graphy 10, 1063–1094.
Schneider, R., Bard, E., Mix, A., 2000. Last Ice Age global ocean and
land surface temperature: the EPILOG initiative. PAGES News-
letter 8, 19–21.
Solignac, S., de Vernal, A., Hillaire-Marcel, C., 2004. Holocene sea-
surface conditions in the North Atlantic—contrasted trends and
regimes between the eastern and western sectors (Labrador Sea vs.
Iceland Basin). Quaternary Science Reviews 23, 319–334.

ARTICLE IN PRESSA. de Vernal et al. / Quaternary Science Reviews 24 (2005) 897–924924
Tang, C.L., Wang, C.K., 1996. A gridded data set of temperature and
salinity for the northwest Atlantic Ocean. Canadian Data Report
of Hydrography and Ocean Sciences no. 148, 45pp.
Taylor, F.J.R., Pollingher, U., 1987. Ecology of Dinoflagellates. In:
Taylor, F.J.R. (Ed.), The Biology of Dinoflagellates. Botanical
Monograph 21. Blackwell Scientific, Oxford, pp. 399–529.
Ter Braak, C.J.F., Smilauer, P., 1998. CANOCO reference manual and
user’s guide to CANOCO for Windows software for canonical
community ordination (Version 4). Centre for Biometry, Wagenin-
gen, 351pp.
Turon, J.-L., 1984. Le palynoplancton dans l’environnement actuel de
l’Atlantique nord-oriental. Evolution climatique et hydrologique
depuis le dernier maximum glaciaire. Memoire de L’Institut
Geologique du Bassin d’Aquitaine 17, 1–313.
von Grafenstein, R., Zahn, R., Tiedemann, R., Murat, A., 1999.
Planktonic 18O records at Sites 976 and 977, Alboran Sea:
Stratigraphy, forcing, and paleoceanographic implications. In:
Zahn, R., et al. (Eds.), Proceedings of the Ocean Drilling Program,
Scientific Results, vol. 161. Ocean Drilling Program, College
Station, TX, pp. 469–479.
Voronina, E., Polyak, L., de Vernal, A., Peyron, O., 2001. Holocene
variations of sea-surface conditions in the southeastern Barents Sea
based on palynological data. Journal of Quaternary Science 16,
717–727.
Waelbroeck, C., Labeyrie, L., Duplessy, J.-C., Guiot, J., Labracherie,
M., Leclaire, H., Duprat, J., 1998. Improving paleo-SST estimates
based on planktonic fossil faunas. Paleoceanography 12, 272–283.
Wall, D., Dale, B., 1968. Modern dinoflagellate cysts and the evolution
of the Peridiniales. Micropaleontology 14, 265–304.
Wall, D., Dale, B., Lohman, G.P., Smith, W.K., 1977. The
environmental and climatic distribution of dinoflagellate cysts in
the North and South Atlantic Oceans and adjacent seas. Marine
Micropaleontology 2, 121–200.
Weinelt, M., Sarnthein, M., Pflaumann, U., Schulz, H., Jung, S.,
Erlenkeuser, H., 1996. Ice-free Nordic seas during the last glacial
maximum? Potential sites of deep water formation. Paleoclimates
1, 283–309.
Weinelt, M., Vogelsang, E., Kucera, M., Pflaumann, U., Sarnthein,
M., Voelker, A., Erlenkeuser, H., Malmgren, B.A., 2003.
Variability of North Atlantic heat transfer during MIS 2.
Paleoceanography, 18, 1071-10.
Winter, A., Jordan, R.W., Roth, P.H., 1994. Biogeography of living
coccolithophores in ocean waters. In: Winter, A., Siesser, W.G.
(Eds.), Coccolithophores. Cambridge University Press, Cambridge,
pp. 161–177.
Zaragosi, S., Eynaud, F., Pujol, C., Auffret, G.A., Turon, J-L.,
Garlan, T., 2001. Initiation of the European deglaciation as
recorded in the northwestern Bay of Biscay slope environments
(Meriadzek Terrace and Trevelyan Escarpment): a multi-proxy
approach. Earth and Planetary Science Letters 188, 493–507.
Zonneveld, K.A., Versteegh, G.H., de Lange, G.J., 2001. Paleopro-
ductivity and postdepositional aerobic organic matter decay
reflected by dinoflagellate cyst assemblages in Eastern Mediterra-
nean S1 Sapropel. Marine Geology 172, 181–195.
Copyright © 2022 FDOKUMEN