Mapping of water frost and ice at low latitudes on Mars
15
Mapping of water frost and ice at low latitudes on Mars F.G. Carrozzo a, * , G. Bellucci a , F. Altieri a , E. D’Aversa a , J.-P. Bibring b a Istituto Nazionale di Astrofisica – Istituto Fisica Spazio Interplanetario (IFSI), Via del Fosso del Cavaliere 100, 00133 Rome, Italy b Institut d’Astrophysique Spatiale (IAS), Bâtiment 121, Université Paris Sud, 91405 Orsay Cedex, France article info Article history: Received 12 January 2009 Revised 4 May 2009 Accepted 23 May 2009 Available online 6 June 2009 Keywords: Mars Mineralogy Ices Frost Spectroscopy abstract This paper reports on mapping of water frost and ice on Mars, in the range of latitudes between 30°S and 30°N. The study has been carried out by analysing 2485 orbits acquired during almost one martian year by the Mars Express/OMEGA imaging spectrometer. Water frost/ice is identified by the presence of 1.5 lm, 2 lm and 3.0 lm absorptions. Although the orbits analysed in this study cover all seasons, water frost/ice is observed only near the aphelion seasons, at Ls = 19° and at Ls = 98–150°. Water frost/ice is detected mainly on the southern hemisphere between 15°S and 30°S latitude while it has not been identified within 15°S–15°N. In the northern hemisphere, the water frost/ice detection is complicated by the presence of clouds. Usually, water frost/ice is found in shadowed areas, while in few cases it is exposed to the sunlight. This indicates a clear relationship with the local illumination conditions on the slopes which favour the water frost/ice deposition on the surface when the temperatures are very low. OMEGA observations span from 10 to 17 LT and the frost/ice is detected mainly between 15 and 16 LT, with practically no detection before 13 LT. We think this is due to the fact that the 10–12 LT obser- vations occur at large distances and it is not a local time effect. A thermal model is used to determine the deposition conditions on the sloped surfaces where water frost/ice has been found. There, daily atmo- spheric saturation does not occur on pole facing 10–25° slopes with current water vapour abundances but only by assuming values greater than 40 pr lm. Moreover, the water frost/ice is not detected during the northern winter, even if the thermal model foresees daily saturation on 25° slopes. Ó 2009 Elsevier Inc. All rights reserved. 1. Introduction Water vapour is one of the minor constituents of the martian atmosphere still playing a key role in the planet’s climate, together with the carbon dioxide and the dust (e.g. Smith, 2002). Under the current martian climatic conditions, H 2 O can only exist in a solid or gas phase, since the general conditions of pressure and tempera- ture do not permit the existence of the liquid phase, although it could exist in few regions (Haberle et al., 2001). The key factors for the deposition of water frost/ice on the surface are the temper- ature and the relative humidity in the atmosphere, the more it in- creases, the higher the possibility that water vapour condenses onto the surface. On Mars, assuming an average partial pressure of water vapour of 0.06 Pa on the surface, the frost point tempera- ture is 193 K; this value changes with the local conditions which have a geographic dependence, but in the southern hemisphere the frost point temperature does not exceed 196 K (Farmer and Doms, 1979; Schorghofer and Edgett, 2006). In other regions where the partial pressure is lower, the values do not vary too much. For example, at 0.01 Pa the water vapour saturates at 183 K (Scho- rghofer and Edgett, 2006). Several clues for the presence of water ice on Mars, in the atmo- sphere, on the surface and in the sub-surface have been reported. It is known that water ice is present in the North and South Polar Cap deposits (e.g. Titus et al., 2003; Bibring et al., 2004a; Langevin et al., 2005), inside clouds in the form of water ice crystals (e.g. Curran et al., 1973), at high latitudes in the form of frost and ice (e.g. Jones et al., 1979; Wall, 1981; Svitek and Murray, 1990), and recently at the Opportunity rover landing sites (Landis, 2007). The identification of the regions on Mars where ice can be stable has been the main goal of several scientific works. Early theoretical modelling suggested that ground ice is stable only at high latitudes (Leighton and Murray, 1966). The authors proposed that water va- pour can penetrate into the soil to a depth of few meters and con- densate in the regions poleward of latitudes 40–50°, but they do not exclude that ice that can be present in equatorial regions. Farmer and Doms (1979) came also to a similar conclusion by using the Viking observations of the seasonal variation of the dis- tribution of water vapour. Their results are consistent with a per- manent reservoir of ice buried at a depth of 10 cm to 1 m at latitudes poleward of 40°. Clifford and Hillel (1983), on the basis of the physical properties of the martian regolith, concluded that the necessary conditions for a long-term survival of ground ice may exist in isolated regions within the equatorial regolith. In fol- lowing works surface thermal properties have been also consid- 0019-1035/$ - see front matter Ó 2009 Elsevier Inc. All rights reserved. doi:10.1016/j.icarus.2009.05.020 * Corresponding author. Fax: +39 06 4992 4074. E-mail address: [email protected] (F.G. Carrozzo). Icarus 203 (2009) 406–420 Contents lists available at ScienceDirect Icarus journal homepage: www.elsevier.com/locate/icarus
-
Upload
independent -
Category
Documents
-
view
4 -
download
0
Transcript of Mapping of water frost and ice at low latitudes on Mars
Icarus 203 (2009) 406–420
Contents lists available at ScienceDirect
Icarus
journal homepage: www.elsevier .com/ locate/ icarus
Mapping of water frost and ice at low latitudes on Mars
F.G. Carrozzo a,*, G. Bellucci a, F. Altieri a, E. D’Aversa a, J.-P. Bibring b
a Istituto Nazionale di Astrofisica – Istituto Fisica Spazio Interplanetario (IFSI), Via del Fosso del Cavaliere 100, 00133 Rome, Italyb Institut d’Astrophysique Spatiale (IAS), Bâtiment 121, Université Paris Sud, 91405 Orsay Cedex, France
a r t i c l e i n f o a b s t r a c t
Article history:Received 12 January 2009Revised 4 May 2009Accepted 23 May 2009Available online 6 June 2009
Keywords:MarsMineralogyIcesFrostSpectroscopy
0019-1035/$ - see front matter � 2009 Elsevier Inc. Adoi:10.1016/j.icarus.2009.05.020
* Corresponding author. Fax: +39 06 4992 4074.E-mail address: [email protected]
This paper reports on mapping of water frost and ice on Mars, in the range of latitudes between 30�S and30�N. The study has been carried out by analysing 2485 orbits acquired during almost one martian yearby the Mars Express/OMEGA imaging spectrometer. Water frost/ice is identified by the presence of�1.5 lm, �2 lm and �3.0 lm absorptions. Although the orbits analysed in this study cover all seasons,water frost/ice is observed only near the aphelion seasons, at Ls = 19� and at Ls = 98–150�. Water frost/iceis detected mainly on the southern hemisphere between 15�S and 30�S latitude while it has not beenidentified within 15�S–15�N. In the northern hemisphere, the water frost/ice detection is complicatedby the presence of clouds. Usually, water frost/ice is found in shadowed areas, while in few cases it isexposed to the sunlight. This indicates a clear relationship with the local illumination conditions onthe slopes which favour the water frost/ice deposition on the surface when the temperatures are verylow. OMEGA observations span from 10 to 17 LT and the frost/ice is detected mainly between 15 and16 LT, with practically no detection before 13 LT. We think this is due to the fact that the 10–12 LT obser-vations occur at large distances and it is not a local time effect. A thermal model is used to determine thedeposition conditions on the sloped surfaces where water frost/ice has been found. There, daily atmo-spheric saturation does not occur on pole facing 10–25� slopes with current water vapour abundancesbut only by assuming values greater than 40 pr lm. Moreover, the water frost/ice is not detected duringthe northern winter, even if the thermal model foresees daily saturation on 25� slopes.
� 2009 Elsevier Inc. All rights reserved.
1. Introduction
Water vapour is one of the minor constituents of the martianatmosphere still playing a key role in the planet’s climate, togetherwith the carbon dioxide and the dust (e.g. Smith, 2002). Under thecurrent martian climatic conditions, H2O can only exist in a solid orgas phase, since the general conditions of pressure and tempera-ture do not permit the existence of the liquid phase, although itcould exist in few regions (Haberle et al., 2001). The key factorsfor the deposition of water frost/ice on the surface are the temper-ature and the relative humidity in the atmosphere, the more it in-creases, the higher the possibility that water vapour condensesonto the surface. On Mars, assuming an average partial pressureof water vapour of 0.06 Pa on the surface, the frost point tempera-ture is �193 K; this value changes with the local conditions whichhave a geographic dependence, but in the southern hemisphere thefrost point temperature does not exceed 196 K (Farmer and Doms,1979; Schorghofer and Edgett, 2006). In other regions where thepartial pressure is lower, the values do not vary too much. Forexample, at 0.01 Pa the water vapour saturates at �183 K (Scho-rghofer and Edgett, 2006).
ll rights reserved.
(F.G. Carrozzo).
Several clues for the presence of water ice on Mars, in the atmo-sphere, on the surface and in the sub-surface have been reported. Itis known that water ice is present in the North and South Polar Capdeposits (e.g. Titus et al., 2003; Bibring et al., 2004a; Langevin et al.,2005), inside clouds in the form of water ice crystals (e.g. Curranet al., 1973), at high latitudes in the form of frost and ice (e.g. Joneset al., 1979; Wall, 1981; Svitek and Murray, 1990), and recently atthe Opportunity rover landing sites (Landis, 2007).
The identification of the regions on Mars where ice can be stablehas been the main goal of several scientific works. Early theoreticalmodelling suggested that ground ice is stable only at high latitudes(Leighton and Murray, 1966). The authors proposed that water va-pour can penetrate into the soil to a depth of few meters and con-densate in the regions poleward of latitudes 40–50�, but they donot exclude that ice that can be present in equatorial regions.Farmer and Doms (1979) came also to a similar conclusion byusing the Viking observations of the seasonal variation of the dis-tribution of water vapour. Their results are consistent with a per-manent reservoir of ice buried at a depth of 10 cm to 1 m atlatitudes poleward of 40�. Clifford and Hillel (1983), on the basisof the physical properties of the martian regolith, concluded thatthe necessary conditions for a long-term survival of ground icemay exist in isolated regions within the equatorial regolith. In fol-lowing works surface thermal properties have been also consid-
F.G. Carrozzo et al. / Icarus 203 (2009) 406–420 407
ered. For example, Mellon and Jakosky (1993, 1995) investigatedthe stability of ground ice with thermal and diffusive models ofthe martian regolith and they produced the first map showingthe ice at global level. Apart some regions in the northern hemi-sphere where the boundary of ice stability is near 30� latitude, ingeneral it falls at about 45–50� range on both hemispheres, con-firming results of previous studies. Indirect measurements of thesurface/subsurface ice distribution have been carried out by theGRS instrument, on board the Mars Odyssey 2001 (Feldmanet al., 2002; Boynton et al., 2002). These measurements havepointed out abundant reservoirs of hydrogen (interpreted as anindication of water) in a superficial layer of 1 m (the depth towhich this technique is sensitive) on planetary scale, with a gen-eral trend which continually increases from the equator to thepoles. From these data it has been estimated a water reservoirresiding at low and mid latitudes with mass water abundance be-tween 2% and 10% (Feldman et al., 2005).
Although the observations were not spectroscopic, Schorghoferand Edgett (2006) have documented the occurrence of likely patchwater frost al low mid-latitudes and even 24�S. Their thermal mod-el (see also Aharonson and Schorghofer, 2006) has shown that sur-face ice can be stable to latitudes of about 25� when the effects oftopographic slopes are included.
In fact, as we will show in Section 3, slopes play an importantrole in the formation and stability of frost/ice on the surface. A ten-tative detection of water frost at low latitude has been also re-ported by Bellucci et al. (2007).
The water ice at low latitudes could be an important target forfuture exploration missions searching for habitats suitable for har-bouring life (e.g. ESA/ExoMars), or for resources utilization in viewof human colonization of the red planet.
This paper reports on the spectroscopic identification and map-ping of water frost and surface ice at low latitudes on Mars. Thestudy, carried out with the OMEGA (Observatoire pour la Minéral-ogie, l’Eau, les Glaces et l’Activité, Bibring et al., 2004b) instrumenton board the Mars Express orbiter, covers the range of latitudes be-tween 30�S and 30�N and it includes the analysis of 2485 datacubes. The data acquisition occurred during all seasons, but waterfrost/ice has been identified during the winter and fall of the south-ern hemisphere, between �30�S and �15�S, and during the sum-mer of northern hemisphere, between �15�N and �30�N. Waterfrost/ice has been detected by the simultaneous occurrence ofthree absorption bands in the 1.0–2.5 lm spectral range. Theyare the overtone of the O–H stretches which occur at �1.5 lm,the combinations of the H–O–H bend with the O–H stretches at�2.0 lm, and the spectral slope between 2.2 and 2.5 lm which isthe wing of the 3 lm absorption (stretches of O–H).
The correlation with the geomorphology, the absence of theFresnel reflectance peak at 3.1 lm and radiative modelling ofatmospheric effects, suggest that H2O is present as frost or ice onthe surface and not in the clouds.
In Section 2 we describe the data set used in this study and themethodology applied for the identification of the water frost/ice onthe surface. In Section 3 we report the spatial distribution of frost/ice on both hemispheres and we compare the results with the pre-dictions done by thermal modelling. The results are summarized inSection 4.
Table 1Number of cubes object of the study for each season and latitude range.
Summer Spring Fall Winter
15–30�N 315 126 89 690–15�N 321 148 94 6015–0�S 46 155 137 29130–15�S 77 139 126 292
2. Data set and analysis procedures
The OMEGA instrument has been designed for mineralogicaland atmospheric investigation of Mars. It is an imaging spectrom-eter covering the 0.35–5.1 lm (visible and near infrared) wave-length range with the instantaneous field of view (IFOV) of1.2 mrad. This instrument, in order to cover this spectral range,
uses three spectral channels: VNIR (0.35–1.05 lm), IR C channel(0.92–2.7 lm), IR L channel (2.7–5.1 lm). In this study we makeuse of the IR C channel data for frost/ice detection. VNIR imagesat 0.4 lm have been also used for clouds identification. The studyis limited to the range of latitudes from 30�S to 30�N and we haveanalysed 2485 orbits, acquired from January 2004 until September2005. The range of latitudes has been divided in four regions: 30–15�S, 15–0�S, 0–15�N, 15–30�N. The distribution of the orbits withseasons is shown in Table 1. Several million spectra are used in thisanalysis.
Although the strongest water ice bands are centred at �1.5,�2.0 and �3.0 lm, we have limited our analysis only to the IR Cchannel. This in order to simplify the data analysis of this huge dataset, because the C and L channels are not co-registered. The L chan-nel is used only to discriminate between surface and atmosphericice.
To quantify the water frost/ice absorption features, we have cal-culated the band depth at 1.5 and 2.0 lm. They are computed byusing the following formula:
Bd ¼ 1� Ra
Rc
where Ra is the radiance factor (Hapke, 1993) at the absorption ofinterest ka and Rc is the continuum computed at ka. Each Rc wasevaluated by linear interpolation of two continuum level for eachabsorption (1.41–1.81 lm, 1.83–2.25 lm) taken outside the atmo-spheric bands. Moreover, the 2.25/2.43 lm spectral ratio has beentaken as a measure of the 3.0 lm absorption strength. Then, wehave used the spectral range between 3.0 and 4.0 lm to discrimi-nate between icy clouds and water frost/ice on the surface. Sincethe CO2 atmospheric absorption at �2 lm interferes with one ofthe water ice absorptions, a first order atmospheric correction hasbeen applied following the method described in Langevin et al.(2005), i.e. each spectrum has been divided by a ratio of spectraof homogeneous terrains from the bottom and the top of OlympusMons collected by OMEGA and scaled to the same CO2 column den-sity. Moreover, an estimation of the surface temperature has beenderived by measuring the radiance at 5.0 lm, as discussed in Sec-tion 3.
As already mentioned before, the identification of water frost/ice has been done by the simultaneous occurrence of three absorp-tions, the detection levels being: BDk=1.5lm P 0.02, BDk=2.0lm P0.02, 2.25/2.43 lm ratio P0.026. These limits have been deter-mined on the basis of an empirical analysis of a large amount ofspectra. Once water frost/ice is identified, we have used the0.4 lm image to verify that water ice clouds are not present. Then,as a first approximation we consider the 1.5 lm band depth as ameasure of water frost/ice amount in the observed footprint. Wehave used two lower limits for the 1.5 lm band depth: 0.02 and0.04. The former is fixed at the confidence level of the linearity re-gime of OMEGA at such wavelength. The latter has been taken as aconservative identification of the water frost/ice spectra. Althoughthe spectra with 0.02 6 BDk=1.5lm < 0.04 show a big spectral vari-ability of the band shape, they are usually located around pixelswith deeper band depths and the spatial distribution correlateswith geomorphological units such as crater rims, scarps and feetof hills. As it will be shown later, by applying the 0.04 lower limit,

408 F.G. Carrozzo et al. / Icarus 203 (2009) 406–420
we lose about 40% of the water frost/ice spectra but the spatial dis-tribution and the seasonal behaviour does not change substan-tially. Water frost/ice is found in 74 tracks in the southernhemisphere (2 during fall and 72 during winter), and in 11 tracksin the northern hemisphere (all in summer). In order to discrimi-nate between the ice on the surface and that in the atmosphere,we have considered both the geomorphologic context and thespectral shape between 3.0 and 4.0 lm.
From the geomorphologic point of view, when water clouds arepresent, they are usually distributed over a large portion of theOMEGA image, without any correlation with surface features. Onthe other hand, few isolated spectra located far from the clouds,over scarps of valleys or walls of craters exhibit typical waterfrost/ice features (Fig. 1). For comparison, in Fig. 2A we report a casein which no clouds have been detected and frost/ice spectral fea-tures have been found only on the sloped terrains in shadow. Pixelsshowing frost/ice absorptions are reported with different colour onthe basis of the 1.5 lm absorption band depth. A big spectral vari-ability is also observed; some examples water frost/ice spectra arereported in Fig. 2B. The frost/ice is located in shadow areas alongwalls of craters and scarps where the insolation conditions usuallyallow the temperature dropping below the frost point.
Fig. 1. OMEGA image (orb1186_4) showing pixels with frost/ice. The colours showthe values of the 1.5 lm band depth. The uniform presence of ice in the bottom ofimage indicates the presence of clouds. The frost/ice on the surface is incircumscribed areas as craters and flank of a hill.
As far as the spectral shape between 3.0 and 4.0 lm is con-cerned, spectra of water ice clouds with deep absorptions at1.5 lm show a different behaviour with respect to the ones relativeto frost/ice deposited on the surface. In fact, icy cloud spectra maypresent a peak at 3.1 lm (the so-called Fresnel reflectance peak), ahigh increase of the reflectivity after 3.3 (Langevin et al., 2007),reflectance peak around 3.6 and decreasing reflectivity towardlonger wavelengths, when the optical depth is large. Although thisspectral behaviour and the Fresnel reflectance peak, generally, arenot univocal indicators for the presence of clouds, they are neverobserved when the water ice spectra are located in isolated shad-owed areas.
Fig. 3A shows the scatter plot of the Fresnel reflectance peak,computed as the ratio between the radiance factor at 3.09 lmand the continuum taken between 2.94 and 3.23 lm, versus the3.71/4.06 lm spectral ratio. Data are taken from cube 1186_4 (greyand cyan points) where water ice clouds and surface frost/ice areboth present (see Fig. 1) and from cube 1221_4 (black and redpoints) where only frost/ice on the surface is present (see Fig. 2).Green crosses indicate water ice spectra from cube 1186_4 witha BDk=1.5lm P 0.02. The red crosses indicate water ice spectra fromcube 1221_4 with BDk=1.5lm P 0.02. In these orbits we have distin-guished frost/ice on the surface from the water ice clouds spectraby considering the spatial distribution of these spectra with re-spect to the geomorphology, assuming that they are due to surfacewater frost/ice when they are located in very restricted areas.
The cyan points on both scatter plots indicate the spectra of thewater ice cloud visible at the bottom of Fig. 1. Soil spectra of the twoorbits (grey and black points) group together on the left part of thescatter plots, where red and green points are also located. Usingonly the spectral ratio between 3.71 and 4.06 lm, the red and greenpoints are separated from the ice clouds spectral class and they fallin the region of soil spectra. On the other hand, by considering thescatter plot of the 1.5 lm band depth versus the Fresnel reflectancepeak (Fig. 3B), the surface frost/ice spectra are grouped together in aregion of the scatter plot that is clearly different from the cloud(cyan points) and from the ice free terrains (bottom left corner).
In summary, Fig. 3 shows that 3.0–4.0 lm spectral behaviourcannot be used alone to distinguish surface ice from atmosphericone when the cloud optical depth is low (corresponding to low1.5 lm band depth). In fact, the Fresnel reflectance peak is tooweak to be detected when each pixel is completely filled by opti-cally thin clouds. Moreover, it may be present but not detectablein soil spectra if water ice partially fills the pixel footprint, due toa high dust contamination (intimate mixing or spatial mixing). Inthese ambiguous cases, morphological considerations were usedto discern between atmospheric and surface ice. Nevertheless, forOMEGA spectra with the 1.5 lm band depth higher than �0.05,spectroscopic considerations alone can allow to discriminate be-tween atmospheric and surface water ice.
In the southern hemisphere we found that, when frost/ice ispresent on the scarps of valleys and craters, the correspondingspectra are clustered as shown in Fig. 3B. In the northern hemi-sphere, due to the presence of the aphelion cloud belt, these twoicy spectral classes are more confused (see also Section 3.2).
In the following, in Fig. 4, we discuss the cloudy ice spectra ofcube 1186_4 together other spectra where frost/ice has been de-tected on the surface. An ice spectrum is reported in cyan colourwhere HiRISE (High Resolution Imaging Science Experiment), onboard Mars Reconnaissance Orbiter, has identified water frostalong the walls of a crater (Fig. 4C, see http://hiroc.lpl.arizona.edu//HiROC/images/TRA/, observation ID TRA_000878_1410). Atthe latitudes of this HiRISE image the temperature is not low en-ough for carbon dioxide condensation. The crater is indicated bythe arrow at the bottom of the OMEGA image and is located at38.9�S latitude, out of the latitude range subject of this study. How-

Fig. 2. (A) OMEGA orbit 1221_4, Ls = 136�. The pixels with water frost/ice are coloured according to the 1.5 lm band depth. (B) Examples of spectra with water iceabsorptions taken on the scarp with 1.5 lm band depth at 0.020 (blue), 0.040 (cyan), 0.075 (orange) and 0.109 (red). Where an artefact of atmospheric correction are present,part of spectrum has been eliminated.
F.G. Carrozzo et al. / Icarus 203 (2009) 406–420 409
ever, water frost/ice has been found also at lower latitudes, forexample inside the crater indicated by the arrow in the upper ofFig. 4A. In Fig. 4B we compared the spectra from these two craters(cyan and blue curves) together with the spectra from the cloud ofFig. 1 (black curve) and a spectrum observed in the North Pole (redcurves). The four spectra show very similar 1.5 lm band depth. Theblack spectrum is modelled as an icy cloud (grey dotted curve)with two different effective radii r1,eff = 1 lm and r1,eff = 3 andr2,eff = 5 lm withr2,eff = 4 for the ice particles with optical depthsice = 5.5 at 1 lm. Moreover, in order to fit the spectrum, the atmo-spheric dust with an exponential profile must be included. The bestfit is found with a dust opacity sdust = 1.2 at 1 lm and r3,eff = 1.0 lmand r3eff = 7. The synthetic spectrum has been computed by meansof a radiative transfer code (Ignatiev et al., 2005), by assuming asurface albedo similar to the soil outside the cloud, from the sameorbit. The temperature profile used to fit the OMEGA spectra hasbeen retrieved by measurements acquired on the same orbit bythe PFS instrument (Formisano et al., 2005; Grassi et al., 2005),the Planetary Fourier Spectrometer on board Mars Express. Forthe ice we have used the optical constants from Hansen andMcCord (1997). The optical constants of the dust have been takenby Hansen (2003). As we can see from Fig. 4B, all the OMEGA spec-tra have a similar shape between 1.0 and 2.5 lm apart from the al-bedo. Between 3.0 and 4.0 lm the craters spectra and the NorthPole spectrum are still similar, while the cloud one shows the Fres-nel reflectance peak and a steeper behaviour between 3.0 and 3.7and 3.71/4.06 lm spectral ratio <1, which are reproduced by thesynthetic spectrum as well.
3. Spatial distribution
3.1. Southern hemisphere
We have studied the range of latitudes between 0�S and 30�S.Water frost/ice is observed only poleward of 15�S. In Fig. 5A, the
data corresponding to latitudes between 15�S and 30�S are reportedas a function of Ls. The colours indicate the Sun elevation angleswhile black points indicate the frost/ice occurrences. The frost/icehas been identified at Ls = 19� (fall) and Ls = 99–150� (winter).
It is generally found in shadowed areas located on the slopes,along walls of numerous craters, scarps and feet of hills. This indi-cates a relationship with the local illumination conditions, whichfavour the deposition of water frost/ice on the surface when thetemperatures are very low. In Fig. 5B we show the brightness tem-perature as a function of Ls in the 15–30�S latitude range. The darkpoints indicate pixels exhibiting the frost/ice absorptions. Thebrightness temperature has been derived from the radiance mea-sured at k = 5 lm by assuming a soil emissivity ek=5lm = 1 and anatmospheric transmittance Ak=5lm = 1. This assumption is quitereasonable for a clear atmosphere (dust opacity �0.05) since thereare not important surface/atmospheric absorptions at this wave-length. To verify the validity of the adopted assumptions, we havecompared the behaviour of the brightness temperatures derived byOMEGA with the TES daily temperatures (Schorghofer and Edgett,2006). Although the TES temperatures are taken at fixed local time(2:00 p.m.) while OMEGA data are acquired in different momentsof the day, we found a good agreement in the seasonal behaviourbetween the two data sets.
At the beginning of the winter, the formation of frost/ice is fa-voured by low Sun elevation angles and low temperatures(Fig. 5A and B). The frost/ice detection is biased by the distanceof the spacecraft from Mars. In fact, the footprint of a single OME-GA pixel increases with increasing Mars-spacecraft distance. In thisway, the percentage of non-icy material with respect to waterfrost/ice increases as well. Therefore, we expect to detect frost/ice spectral signatures only when the spacecraft is close to the pla-net. We have noticed that water frost/ice is detected when theMars-probe distance is below about 1700 km and thus when thespatial resolution is below about 2 km/pixel (Fig. 5C).
In the following, we will focus our discussion on the winter sea-son, when the water frost/ice has been clearly identified. On the
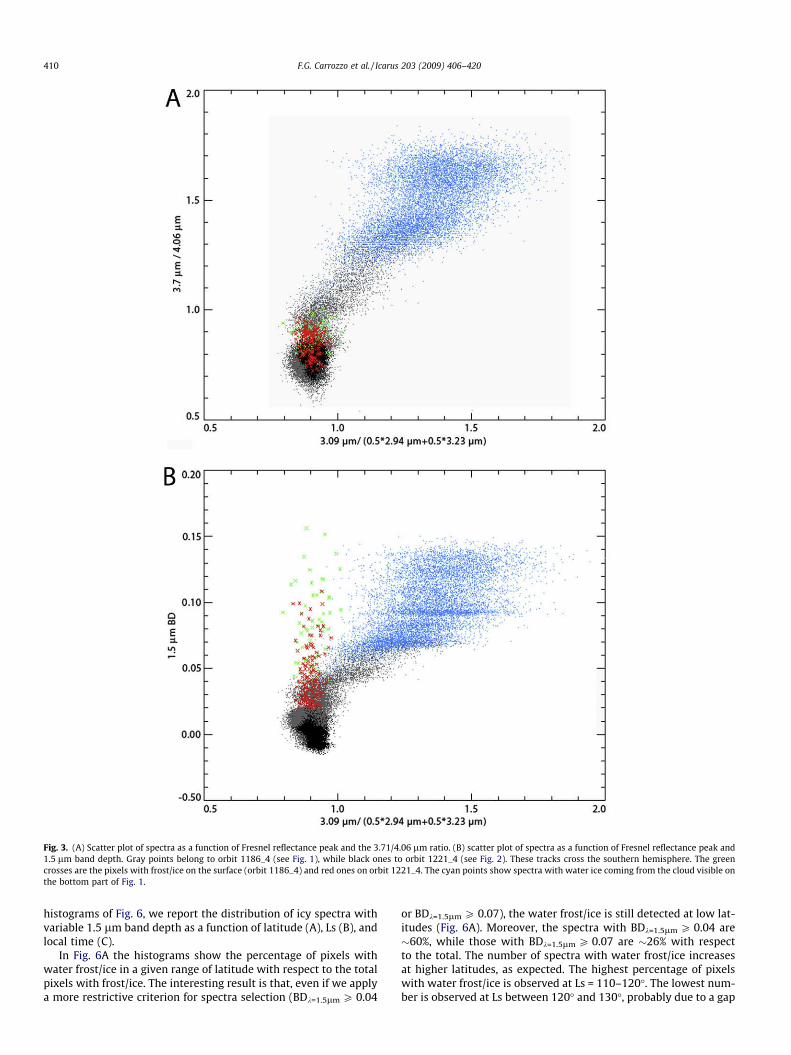
Fig. 3. (A) Scatter plot of spectra as a function of Fresnel reflectance peak and the 3.71/4.06 lm ratio. (B) scatter plot of spectra as a function of Fresnel reflectance peak and1.5 lm band depth. Gray points belong to orbit 1186_4 (see Fig. 1), while black ones to orbit 1221_4 (see Fig. 2). These tracks cross the southern hemisphere. The greencrosses are the pixels with frost/ice on the surface (orbit 1186_4) and red ones on orbit 1221_4. The cyan points show spectra with water ice coming from the cloud visible onthe bottom part of Fig. 1.
410 F.G. Carrozzo et al. / Icarus 203 (2009) 406–420
histograms of Fig. 6, we report the distribution of icy spectra withvariable 1.5 lm band depth as a function of latitude (A), Ls (B), andlocal time (C).
In Fig. 6A the histograms show the percentage of pixels withwater frost/ice in a given range of latitude with respect to the totalpixels with frost/ice. The interesting result is that, even if we applya more restrictive criterion for spectra selection (BDk=1.5lm P 0.04
or BDk=1.5lm P 0.07), the water frost/ice is still detected at low lat-itudes (Fig. 6A). Moreover, the spectra with BDk=1.5lm P 0.04 are�60%, while those with BDk=1.5lm P 0.07 are �26% with respectto the total. The number of spectra with water frost/ice increasesat higher latitudes, as expected. The highest percentage of pixelswith water frost/ice is observed at Ls = 110–120�. The lowest num-ber is observed at Ls between 120� and 130�, probably due to a gap
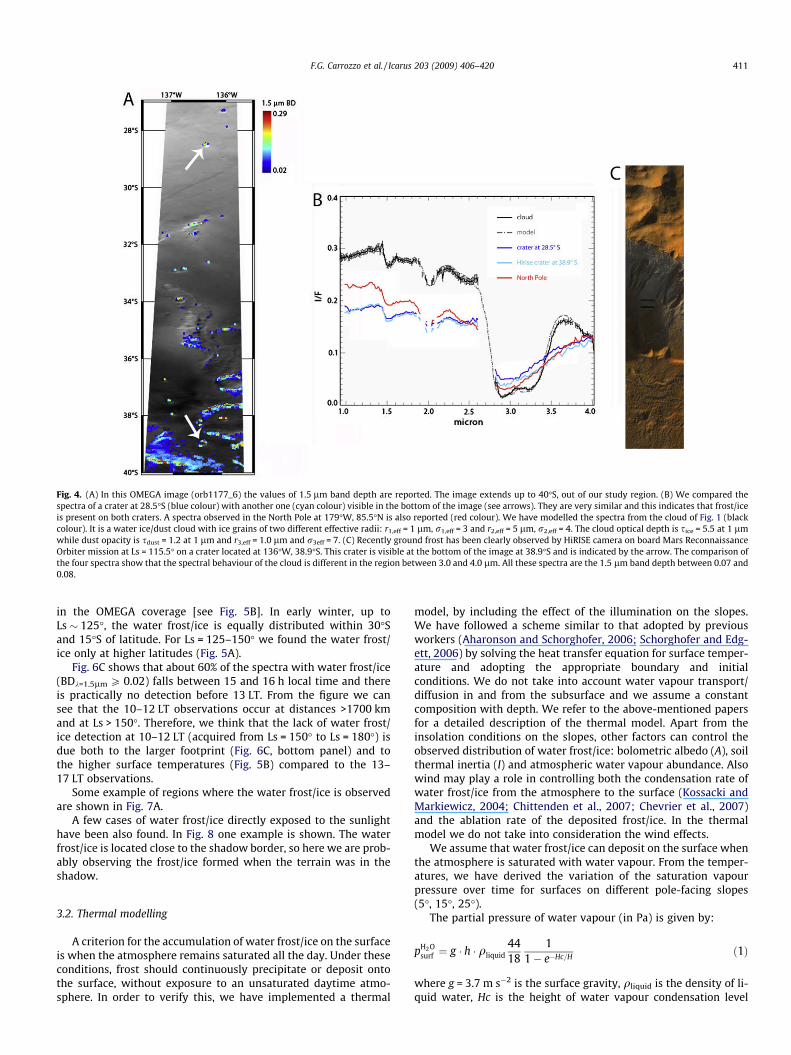
Fig. 4. (A) In this OMEGA image (orb1177_6) the values of 1.5 lm band depth are reported. The image extends up to 40�S, out of our study region. (B) We compared thespectra of a crater at 28.5�S (blue colour) with another one (cyan colour) visible in the bottom of the image (see arrows). They are very similar and this indicates that frost/iceis present on both craters. A spectra observed in the North Pole at 179�W, 85.5�N is also reported (red colour). We have modelled the spectra from the cloud of Fig. 1 (blackcolour). It is a water ice/dust cloud with ice grains of two different effective radii: r1,eff = 1 lm, r1,eff = 3 and r2,eff = 5 lm, r2,eff = 4. The cloud optical depth is sice = 5.5 at 1 lmwhile dust opacity is sdust = 1.2 at 1 lm and r3,eff = 1.0 lm and r3eff = 7. (C) Recently ground frost has been clearly observed by HiRISE camera on board Mars ReconnaissanceOrbiter mission at Ls = 115.5� on a crater located at 136�W, 38.9�S. This crater is visible at the bottom of the image at 38.9�S and is indicated by the arrow. The comparison ofthe four spectra show that the spectral behaviour of the cloud is different in the region between 3.0 and 4.0 lm. All these spectra are the 1.5 lm band depth between 0.07 and0.08.
F.G. Carrozzo et al. / Icarus 203 (2009) 406–420 411
in the OMEGA coverage [see Fig. 5B]. In early winter, up toLs � 125�, the water frost/ice is equally distributed within 30�Sand 15�S of latitude. For Ls = 125–150� we found the water frost/ice only at higher latitudes (Fig. 5A).
Fig. 6C shows that about 60% of the spectra with water frost/ice(BDk=1.5lm P 0.02) falls between 15 and 16 h local time and thereis practically no detection before 13 LT. From the figure we cansee that the 10–12 LT observations occur at distances >1700 kmand at Ls > 150�. Therefore, we think that the lack of water frost/ice detection at 10–12 LT (acquired from Ls = 150� to Ls = 180�) isdue both to the larger footprint (Fig. 6C, bottom panel) and tothe higher surface temperatures (Fig. 5B) compared to the 13–17 LT observations.
Some example of regions where the water frost/ice is observedare shown in Fig. 7A.
A few cases of water frost/ice directly exposed to the sunlighthave been also found. In Fig. 8 one example is shown. The waterfrost/ice is located close to the shadow border, so here we are prob-ably observing the frost/ice formed when the terrain was in theshadow.
3.2. Thermal modelling
A criterion for the accumulation of water frost/ice on the surfaceis when the atmosphere remains saturated all the day. Under theseconditions, frost should continuously precipitate or deposit ontothe surface, without exposure to an unsaturated daytime atmo-sphere. In order to verify this, we have implemented a thermal
model, by including the effect of the illumination on the slopes.We have followed a scheme similar to that adopted by previousworkers (Aharonson and Schorghofer, 2006; Schorghofer and Edg-ett, 2006) by solving the heat transfer equation for surface temper-ature and adopting the appropriate boundary and initialconditions. We do not take into account water vapour transport/diffusion in and from the subsurface and we assume a constantcomposition with depth. We refer to the above-mentioned papersfor a detailed description of the thermal model. Apart from theinsolation conditions on the slopes, other factors can control theobserved distribution of water frost/ice: bolometric albedo (A), soilthermal inertia (I) and atmospheric water vapour abundance. Alsowind may play a role in controlling both the condensation rate ofwater frost/ice from the atmosphere to the surface (Kossacki andMarkiewicz, 2004; Chittenden et al., 2007; Chevrier et al., 2007)and the ablation rate of the deposited frost/ice. In the thermalmodel we do not take into consideration the wind effects.
We assume that water frost/ice can deposit on the surface whenthe atmosphere is saturated with water vapour. From the temper-atures, we have derived the variation of the saturation vapourpressure over time for surfaces on different pole-facing slopes(5�, 15�, 25�).
The partial pressure of water vapour (in Pa) is given by:
pH2Osurf ¼ g � h � qliquid
4418
11� e�Hc=H
ð1Þ
where g = 3.7 m s�2 is the surface gravity, qliquid is the density of li-quid water, Hc is the height of water vapour condensation level
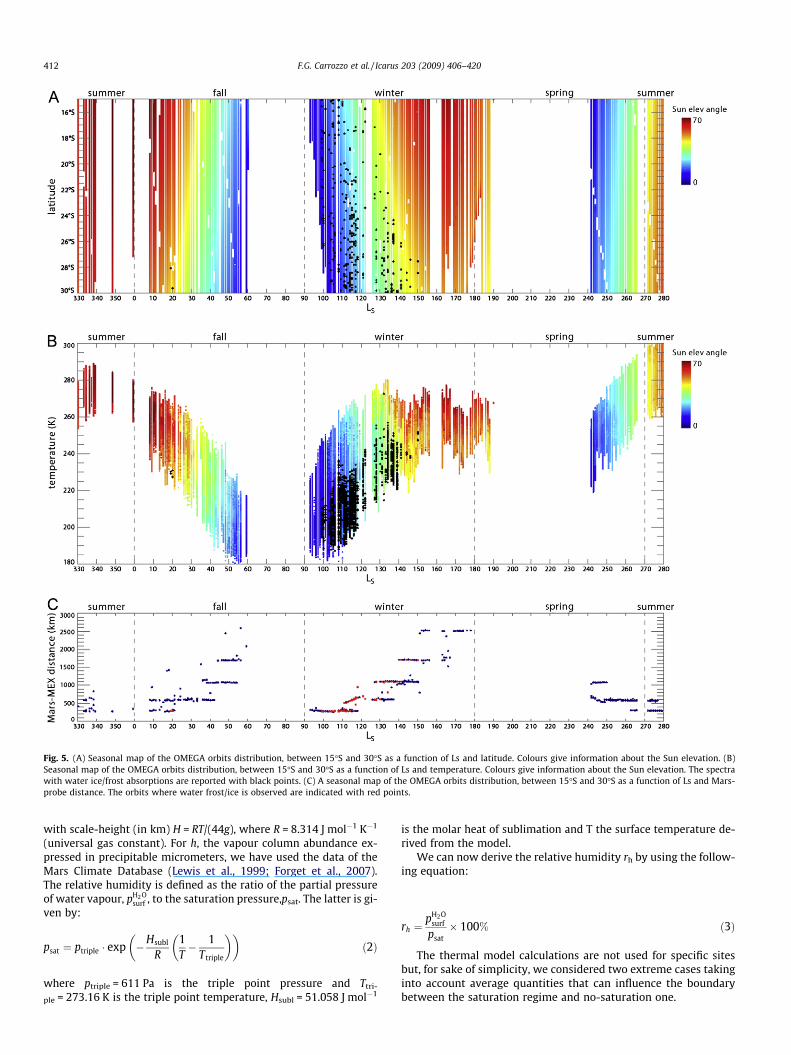
Fig. 5. (A) Seasonal map of the OMEGA orbits distribution, between 15�S and 30�S as a function of Ls and latitude. Colours give information about the Sun elevation. (B)Seasonal map of the OMEGA orbits distribution, between 15�S and 30�S as a function of Ls and temperature. Colours give information about the Sun elevation. The spectrawith water ice/frost absorptions are reported with black points. (C) A seasonal map of the OMEGA orbits distribution, between 15�S and 30�S as a function of Ls and Mars-probe distance. The orbits where water frost/ice is observed are indicated with red points.
412 F.G. Carrozzo et al. / Icarus 203 (2009) 406–420
with scale-height (in km) H = RT/(44g), where R = 8.314 J mol�1 K�1
(universal gas constant). For h, the vapour column abundance ex-pressed in precipitable micrometers, we have used the data of theMars Climate Database (Lewis et al., 1999; Forget et al., 2007).The relative humidity is defined as the ratio of the partial pressureof water vapour, pH2O
surf , to the saturation pressure,psat. The latter is gi-ven by:
psat ¼ ptriple � exp �Hsubl
R1T� 1
Ttriple
� �� �ð2Þ
where ptriple = 611 Pa is the triple point pressure and Ttri-
ple = 273.16 K is the triple point temperature, Hsubl = 51.058 J mol�1
is the molar heat of sublimation and T the surface temperature de-rived from the model.
We can now derive the relative humidity rh by using the follow-ing equation:
rh ¼pH2O
surf
psat� 100% ð3Þ
The thermal model calculations are not used for specific sitesbut, for sake of simplicity, we considered two extreme cases takinginto account average quantities that can influence the boundarybetween the saturation regime and no-saturation one.

Fig. 6. Distribution of the pixels (in southern winter) showing water frost/icefeatures between 15�S and 30�S as a function of (A) latitude, (B) Ls and (C) localtime. The ratio between the number of pixels with 1.5 lm band depth, P0.02(black), P0.04 (grey), P0.07 (light grey) in the range versus the total of pixels with
1.5 lm band depth P0.02 is reported. It is computed as following: NiceðDlat;BDPkÞNice ðBDP0:02Þ (for
A); Nice ðDLs;BDPkÞNice ðBDP0:02Þ (for B); Nice ðDLT;BDPkÞ
Nice ðBDP0:02Þ (for C). The black curve shows the percentage of
pixels with water frost/ice in a given range of latitude with respect to the total
observed pixels. It is computed as following: Nice ðDlat;BDP0:02ÞNðDlatÞ (for A); Nice ðDLs;BDP0:02Þ
NðDLsÞ (for
B); Nice ðDLT;BDP0:02ÞNðDLTÞ (for C) where Nice is the number of pixels with water frost/ice, N is
the number of pixels, Dlat is the range of latitude, DLs is the range of solarlongitude, DLT is the range of local time, BD is the 1.5 lm band depth, k is the limitof the 1.5 lm band depth and it can be 0.02 or 0.04 or 0.07.
Fig. 7. Some regions are the water frost/ice is found. The colours give informationabout the 1.5 lm band depth. The image are centred on (A) �17�S; (B) �27�S; (C)�24�S; and (D) 28�S.
F.G. Carrozzo et al. / Icarus 203 (2009) 406–420 413
Fig. 9A (case 1A) and B (case 1B) shows the results of thermalmodelling for different slopes at two latitudes (the limits insidewhich we have found frost/ice): 15�S and 30�S.
The mean thermal inertia in this range of latitudes is�244 J m�2 K�1 s�1/2 (Putzig et al., 2005). We fix two values forthe bolometric albedo because at these latitudes there are two typeof terrains with different albedo, the first with low-medium albedo(�0.14) and the second with medium-high one (�0.24) (Christen-sen et al., 2001). We plot only the results for two extreme cases:the less favourable for water frost/ice deposition, case 1A (lati-tude = 15�S, A = 0.14, I = 244 J m�2 K�1 s�1/2, Fig. 9A), and the mostfavourable one, case 1B (latitude = 30�S, A = 0.24,I = 244 J m�2 K�1 s�1/2, Fig. 9B). As far as the water vapour abun-dance is concerned, the mean along all the longitude at 15�S and30�S are taken, respectively. The grey region on each plot indicates,for different slopes, the saturation regime, while the white regionindicates the no-saturation regime. Black points are the OMEGAobservations, while the red ones are the OMEGA observationswhere the frost/ice has been detected. The blue curve indicates

Fig. 8. (A) An area directly exposed to the sunlight showing water ice absorptions (orbit 1034_7). (B) A spectrum of the previous area. The diagnostic water ice absorptions areclearly visible. Where the remainder of atmospheric correction is present, part of spectrum has been eliminated.
414 F.G. Carrozzo et al. / Icarus 203 (2009) 406–420
the water vapour abundance, while the red ones are the mean an-nual evolution of minimum and maximum temperature.
In case 1A the saturation occurs during the night and earlymorning. In case 1B, the atmosphere becomes saturated the wholeday as soon as the slope is increased during the end of the fall andbeginning of the winter.
During fall only two orbits show the water frost/ice spectral sig-natures. In this season the values of temperatures, Sun elevationangles and Mars-probe distance are similar to the winter ones. Fur-ther, in the range of latitudes considered, the mean water vapourabundance in the atmosphere derived by MCD during the fall issimilar of that during the winter. Nevertheless, the water frost/ice is detected only on two orbits, even if the model predicts its for-mation partially during fall for slope values P25�.
It is interesting to note that for water frost/ice formation on theground, the variation of water vapour in the atmosphere is negligi-ble compared to the variation of temperatures. This is proved inFig. 9, cyan curve: the water frost/ice (red points) is found duringthe fall and the winter, where the abundance of water vapour evenreaches the annual minimum values.
During the spring a wide gap in the OMEGA coverage exists. Atthe end of the spring the Sun elevation angle and the Mars-probedistance are comparable to those of the first half of winter, butthe temperatures are higher and no water frost/ice is found.
As the winter proceeds, water frost/ice is less frequently ob-served, likely due to the increase of both Sun elevation angle andMars-probe distance (Fig. 5). Water frost/ice is not detected afterLs � 150�.
As shown in Fig. 9, some OMEGA observations where the waterfrost/ice is found (red points) are in a no-saturation regime. Thiscould be due to the fact that, at a fixed Mars hour, the model hasno memory of what has occurred during the previous hours or pre-vious Ls and therefore it does not take into account the possible in-crease of thermal inertia due to the formation and accumulation ofwater frost/ice. As shown in Fig. 6C, the water frost/ice accumula-tion cannot be excluded since our data cover a limited range of lo-cal times and span different Mars-probe distances. Moreover, thesoil thermal inertia does not change significantly due to waterfrost/ice deposition. In fact we have used some Mars Odyssey Ther-
mal Emission Imaging System, THEMIS (Christensen et al., 2004),nighttime images to derive thermal inertia of regions where waterfrost/ice has been detected during the same period. The thermalinertia values derived by the thermal model are never greater than300 J m�2 K�1 s�1/2. On the other hand, even if nighttime saturationoccurs, the amount of precipitated water may form only a tiny frostveneer which would not change the soil thermal inertiasubstantially.
The water frost/ice could deposit and accumulate due to the in-crease of humidity near the surface. Here, change of amount ofwater vapour can occur on short time scale and on small spatialscale. In contrast to the amount of water vapour derived by MCD,we have increased its content in the atmosphere up to 40 pr lmfor the case 1B. The results of thermal modelling are shown inFig. 9C. They show that, even for the same slopes, the saturation re-gime occurs in a wider range of Ls, during the colder seasons.Therefore, more observations with water frost/ice fall inside thesaturation region.
3.3. Northern hemisphere
In the northern hemisphere the analysis has been carried out be-tween 0� and 30�N latitude, and water frost/ice has been detected atLs = 94–135� (summer) from 15�N to 30�N (Fig. 10). In this hemi-sphere it is more difficult to discriminate between the ice in theatmosphere from that on the surface due to the presence of the aph-elion cloud belt at low latitudes (Clancy et al., 1996; Smith, 2002,2004). To this purpose we have used the same methodology usedfor the southern hemisphere and we have found 11 orbits showingthe occurrence of water frost/ice absorption signatures.
We have checked the corresponding spectra by means of a Fres-nel reflectance peak versus 1.5 lm BD scatter plot. As we can seefrom Fig. 11B, the BDk=1.5lm is less then 0.04, and the water iceclass (grey points) is confused with the ice-free terrains one (blackpoints). Moreover, there is a systematic increase of the BDk=1.5lm
along the shadow areas of the scarps, graben and craters walls.We think this behaviour could be attributable to the presence ofclouds which are frequently observed during this season at theselatitudes.

Fig. 9. Results of thermal modelling, indicating the condition of atmospheric saturation during a martian day (the grey shadowed area) on slopes with different inclinationsas a function of Ls. Slopes are south oriented. For different figures we assumed (A) latitude = 15�S, A = 0.14, I = 244 J m�2 K�1 s�1/2; (B and C) latitude = 30�S, A = 0.24,I = 244 J m�2 K�1 s�1/2. The mean water vapour abundance (cyan curve), taken by the Mars Climate Database, is given in pr lm. In C the water vapour abundance (cyan curve)is constant and equal at 40 pr lm. We can observe that in figure A and B the orbits with water frost/ice fall when the vapour abundance is low. The red curves are theevolution of minimum and maximum temperatures. The grey regions indicate where the saturation occurs, while white regions show where the humidity is below 100%.
F.G. Carrozzo et al. / Icarus 203 (2009) 406–420 415
If we compare the observation conditions on both hemisphereswhen the water frost/ice is detected (Figs. 5 and 10) we note thefollowing:
(1) During northern fall/winter, around the northern winter sol-stice the observation conditions are similar to those of thesouthern winter. Also the mean water vapour abundancein the atmosphere derived by means of MCD is similar, nev-ertheless water frost/ice is not found. In some cases the ther-mal model predicts the deposition of water frost/ice. Thelack of its detection during the northern winter could bedue to the low spatial coverage compared to the southernhemisphere (�4% of the surface between 15�N and 30�N lat-itude compared to �67% between 15�S and 30�S).
(2) At the beginning of the northern summer, water frost/ice isdetected but, as we already pointed out, the presence of thecloud belt does not allow us to distinguish whether it is inthe clouds or on the surface;
(3) In both hemispheres water frost/ice is not observed duringthe spring season.
In the northern hemisphere, in the range of latitudes between15�N and 30�N, about 90% of the terrains have a medium-highbolometric albedo (>0.2). In the thermal model we have takenthe average value 0.26 (Christensen et al., 2001). As far as thermalinertia is concerned, there are two types of terrains: one with meanthermal inertia of �81 J m�2 K�1 s�1/2 and the other with264 J m�2 K�1 s�1/2 (Putzig et al., 2005). In Fig. 12 we show the re-sults of thermal model for the most favourable case (lati-tude = 30�N, A = 0.26, I = 264 J m�2 K�1 s�1/2) and for differentpole-facing slopes (5�, 15�, 25�). It can be seen that the waterfrost/ice detections (red points) fall in the no-saturation region.On the contrary, when daily saturation occurs, as during the winteron 25� slopes, water frost/ice is not detected.
Search for ground water frost/ice at low latitudes on the north-ern hemisphere is more complex to treat due to the occurrence of

Fig. 10. (A) Seasonal map of the OMEGA orbits distribution, between 15�N and 30�N as a function of Ls and latitude. Colours indicate the Sun elevation. (B) Seasonal map ofthe OMEGA orbits distribution, between 15�N and 30�N as a function of Ls and temperature. Colours indicate the Sun elevation. The water ice/frost spectra are reported withblack points. (C) Seasonal map of the OMEGA orbit distribution, between 15�N and 30�N as a function of Ls and Mars-probe distance. The orbits with water frost are reportedwith red points.
416 F.G. Carrozzo et al. / Icarus 203 (2009) 406–420
the equatorial cloud belt during this season. This makes difficult toestablish whether the ice observed by OMEGA is on the surface ornot.
Some observations fall in the saturation regime also for lowerslopes, but no spectra with water frost/ice are detected in theseseasons (end of northern fall and the beginning of northernwinter).
In some of the regions where the water frost/ice is likely found,the MOC and HRSC images show also some albedo features whichare interpreted as dust avalanches (Sullivan et al., 2001; Schorgho-fer et al., 2002; Baratoux et al., 2006). Recent studies suggest thatthe formation of these avalanches involves a phase transition ofwater (Schorghofer et al., 2002). We do not exclude that water
frost/ice may have a role in the origin of these dust avalanches,the sublimation of the ice making the soil unstable and leadingto collapse.
4. Summary
Water frost/ice on the surface is spectroscopically detected forthe first time at tropical latitudes between 15�S and 30�S atLs = 19� and at Ls = 99–150�. During the same period, it has beenobserved also between 15�N and 30�N even if the presence of theequatorial cloud belt could invalidate the detection. Moreover, ithas not been detected in the 15�S–15�N latitude range. Generallyit is found in shadow regions, along scarps and crater walls. Clearly,
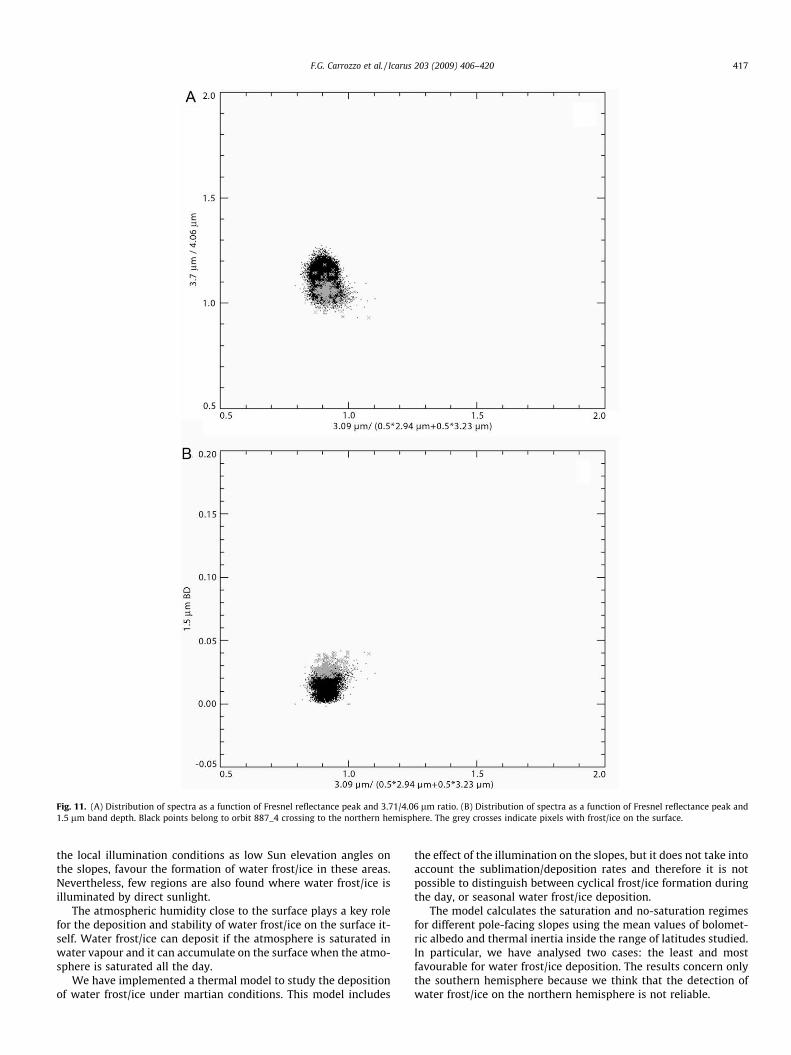
Fig. 11. (A) Distribution of spectra as a function of Fresnel reflectance peak and 3.71/4.06 lm ratio. (B) Distribution of spectra as a function of Fresnel reflectance peak and1.5 lm band depth. Black points belong to orbit 887_4 crossing to the northern hemisphere. The grey crosses indicate pixels with frost/ice on the surface.
F.G. Carrozzo et al. / Icarus 203 (2009) 406–420 417
the local illumination conditions as low Sun elevation angles onthe slopes, favour the formation of water frost/ice in these areas.Nevertheless, few regions are also found where water frost/ice isilluminated by direct sunlight.
The atmospheric humidity close to the surface plays a key rolefor the deposition and stability of water frost/ice on the surface it-self. Water frost/ice can deposit if the atmosphere is saturated inwater vapour and it can accumulate on the surface when the atmo-sphere is saturated all the day.
We have implemented a thermal model to study the depositionof water frost/ice under martian conditions. This model includes
the effect of the illumination on the slopes, but it does not take intoaccount the sublimation/deposition rates and therefore it is notpossible to distinguish between cyclical frost/ice formation duringthe day, or seasonal water frost/ice deposition.
The model calculates the saturation and no-saturation regimesfor different pole-facing slopes using the mean values of bolomet-ric albedo and thermal inertia inside the range of latitudes studied.In particular, we have analysed two cases: the least and mostfavourable for water frost/ice deposition. The results concern onlythe southern hemisphere because we think that the detection ofwater frost/ice on the northern hemisphere is not reliable.
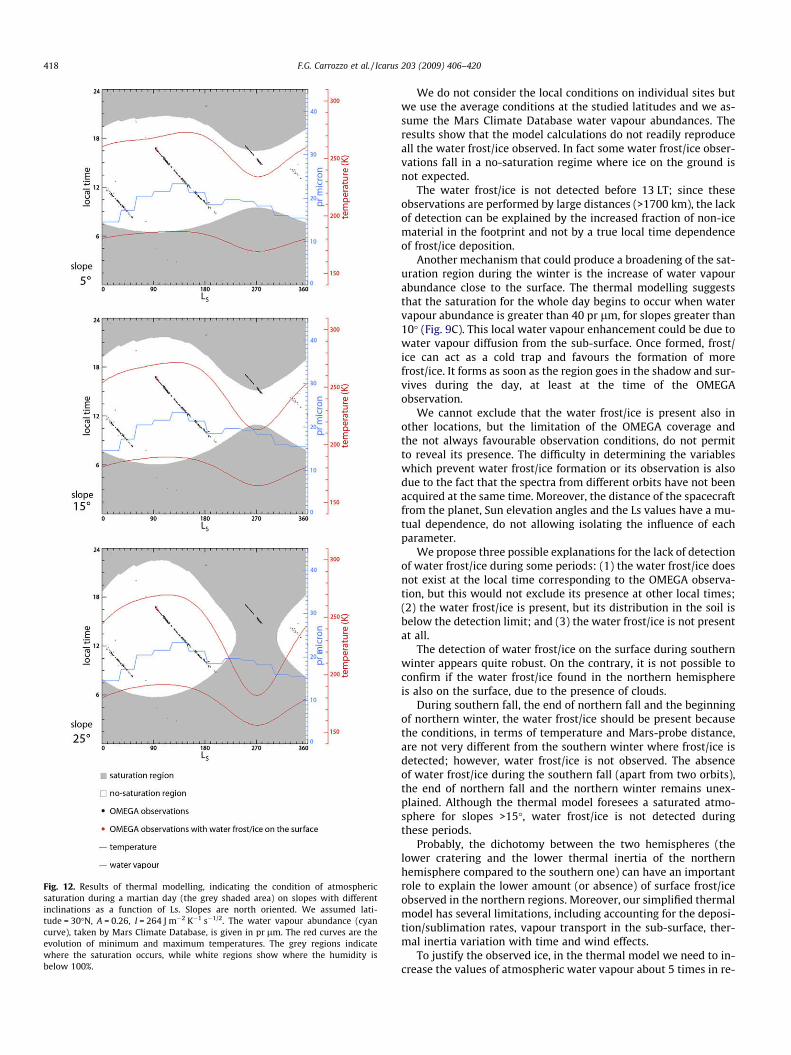
Fig. 12. Results of thermal modelling, indicating the condition of atmosphericsaturation during a martian day (the grey shaded area) on slopes with differentinclinations as a function of Ls. Slopes are north oriented. We assumed lati-tude = 30�N, A = 0.26, I = 264 J m�2 K�1 s�1/2. The water vapour abundance (cyancurve), taken by Mars Climate Database, is given in pr lm. The red curves are theevolution of minimum and maximum temperatures. The grey regions indicatewhere the saturation occurs, while white regions show where the humidity isbelow 100%.
418 F.G. Carrozzo et al. / Icarus 203 (2009) 406–420
We do not consider the local conditions on individual sites butwe use the average conditions at the studied latitudes and we as-sume the Mars Climate Database water vapour abundances. Theresults show that the model calculations do not readily reproduceall the water frost/ice observed. In fact some water frost/ice obser-vations fall in a no-saturation regime where ice on the ground isnot expected.
The water frost/ice is not detected before 13 LT; since theseobservations are performed by large distances (>1700 km), the lackof detection can be explained by the increased fraction of non-icematerial in the footprint and not by a true local time dependenceof frost/ice deposition.
Another mechanism that could produce a broadening of the sat-uration region during the winter is the increase of water vapourabundance close to the surface. The thermal modelling suggeststhat the saturation for the whole day begins to occur when watervapour abundance is greater than 40 pr lm, for slopes greater than10� (Fig. 9C). This local water vapour enhancement could be due towater vapour diffusion from the sub-surface. Once formed, frost/ice can act as a cold trap and favours the formation of morefrost/ice. It forms as soon as the region goes in the shadow and sur-vives during the day, at least at the time of the OMEGAobservation.
We cannot exclude that the water frost/ice is present also inother locations, but the limitation of the OMEGA coverage andthe not always favourable observation conditions, do not permitto reveal its presence. The difficulty in determining the variableswhich prevent water frost/ice formation or its observation is alsodue to the fact that the spectra from different orbits have not beenacquired at the same time. Moreover, the distance of the spacecraftfrom the planet, Sun elevation angles and the Ls values have a mu-tual dependence, do not allowing isolating the influence of eachparameter.
We propose three possible explanations for the lack of detectionof water frost/ice during some periods: (1) the water frost/ice doesnot exist at the local time corresponding to the OMEGA observa-tion, but this would not exclude its presence at other local times;(2) the water frost/ice is present, but its distribution in the soil isbelow the detection limit; and (3) the water frost/ice is not presentat all.
The detection of water frost/ice on the surface during southernwinter appears quite robust. On the contrary, it is not possible toconfirm if the water frost/ice found in the northern hemisphereis also on the surface, due to the presence of clouds.
During southern fall, the end of northern fall and the beginningof northern winter, the water frost/ice should be present becausethe conditions, in terms of temperature and Mars-probe distance,are not very different from the southern winter where frost/ice isdetected; however, water frost/ice is not observed. The absenceof water frost/ice during the southern fall (apart from two orbits),the end of northern fall and the northern winter remains unex-plained. Although the thermal model foresees a saturated atmo-sphere for slopes >15�, water frost/ice is not detected duringthese periods.
Probably, the dichotomy between the two hemispheres (thelower cratering and the lower thermal inertia of the northernhemisphere compared to the southern one) can have an importantrole to explain the lower amount (or absence) of surface frost/iceobserved in the northern regions. Moreover, our simplified thermalmodel has several limitations, including accounting for the deposi-tion/sublimation rates, vapour transport in the sub-surface, ther-mal inertia variation with time and wind effects.
To justify the observed ice, in the thermal model we need to in-crease the values of atmospheric water vapour about 5 times in re-

F.G. Carrozzo et al. / Icarus 203 (2009) 406–420 419
spect to the seasonal average values provide by the MCD. Particularlocal conditions such as an increase of atmospheric water vapournear the shadowed areas can likely occur. Only a mesoscale atmo-spheric model (i.e. Spiga and Forget, 2009) can investigate them.
Alternately, the presence of an ice table surviving in the shallowsubsurface may explain an increase of water vapour near the sur-face. This is supported also by GRS measurements that have iden-tified large concentrations of hydrogen suggesting the presence ofa layer of ice in the subsurface (Feldman et al., 2002; Boynton et al.,2002). This ice table can survive also at low latitudes due to theslope effects (Schorghofer and Aharonson, 2005). When these areasare not in shadow the ice can sublimate and the water vapourcould diffuse into the regolith. This can condense on the surfaceas frost or ice when the thermal conditions change due to the sha-dow. Anyway, our study does not allow discriminating betweenthese two hypothesis.
Determining the distribution of water frost/ice on the surface atlow latitudes is a primary objective for the future missions to Mars.In these places, the ice could melt under particular conditions andthe liquid phase could occur. It can filter through the pores of theground and being isolated from the external environment it can fa-vour the presence of life. The areas with water frost/ice at low lat-itudes could be a possible choice for a landing site of the futuremissions on Mars.
Acknowledgments
We acknowledge the OMEGA technical and scientific teamwhich made this work possible. This work was supported by ASI,Agenzia Spaziale Italiana. We thank the two anonymous reviewersfor their helpful comments and suggestions.
References
Aharonson, O., Schorghofer, N., 2006. Subsurface ice on Mars with roughtopography. J. Geophys. Res. 111. doi:10.1029/2005JE002636. E11007.
Baratoux, D., Mangold, N., Forget, F., Cord, A., Pinet, P., Daydou, Y., Jehl, A., Masson,P., Neukum, G.the HRSC Co-Investigator Team, 2006. The role of the wind-transported dust in slope streaks activity: Evidence from the HRSC data. Icarus183, 30–45.
Bellucci, G., Helbert, J., Altieri, F., Reiss, D., Bibring, J.-P., van Gasselt, S., Hoffmann, H.,Langevin, Y., Neukum, G., Poulet, F., 2007. Evidence for enhanced hydration onthe northern flank of Olympus Mons, Mars. Icarus 192, 361–377.
Bibring, J.-P., Langevin, Y., Poulet, F., Gendrin, A., Gondet, B., Berthé, M., Soufflot, A.,Drossart, P., Combes, M., Bellucci, G., Moroz, V., Mongold, N., Schmitt, B.OMEGAteam, 2004a. Perennial water frost identified in the south polar cap of Mars.Nature 428, 627–630.
Bibring, J.-P., Soufflot, A., Berthé, M., 2004b. OMEGA: Observatoire pour laMinéralogie, l’Eau, les Glaces et l’Activité. In: Wilson, A. (Ed.), Mars Express:The Scientific Payload, European Space Agency, Publication WSA-SP 1240, pp.37–49.
Boynton, W.V., Feldman, W.C., Squyres, S.W., Prettyman, T.H., Brückner, J., Evans,L.G., Reedy, R.C., Starr, R., Arnold, J.R., Drake, D.M., Englert, P.A.J., Metzger, A.E.,Mitrofanov, I., Trombka, J.I., d’Uston, C., Wänke, H., Gasnault, O., Hamara, D.K.,Janes, D.M., Marcialis, R.L., Maurice, S., Mikheeva, I., Taylor, G.J., Tokar, R.,Shinohara, C., 2002. Distribution of hydrogen in the near surface of Mars:Evidence for subsurface ice deposits. Science 297, 81–85.
Chevrier, V., Chittenden, J.D., Bryson, K., Roe, L.A., Sears, D.W., Pilgrim, R., 2007.Experimental study of the effect of wind on the stability of water ice on Mars,American Astronomical Society, DPS meeting #39, #17.06.
Chittenden, J.D., Sears, D.W.G., Chevrier, V., 2007. Effect of wind on the stability ofwater ice under martian conditions. Lunar Planet. Sci. XXXVIII, 1253.
Christensen, P.R., Bandfield, J.L., Hamilton, V.E., Ruff, S.W., Kieffer, H.H., Titus, T.N.,Malin, M.C., Morris, R.V., Lane, M.D., Clark, R.L., Jakosky, B.M., Mellon, M.T., Pearl,J.C., Conrath, B.J., Smith, M.D., Clancy, R.T., Kuzmin, R.O., Roush, T., Mehall, G.L.,Gorelick, N., Bender, K., Murray, K., Dason, S., Greene, E., Silverman, S.,Greenfield, M., 2001. Mars Global Surveyor Thermal Emission Spectrometerexperiment: Investigation description and surface science results. J. Geophys.Res. 106, 23823–23872.
Christensen, P.R., Jakosky, B.M., Kieffer, H.H., Malin, M.C., McSween Jr., H.Y., Nealson,K., Mehall, G.L., Silverman, S.H., Ferry, S., Caplinger, M., Ravine, M., 2004. TheThermal Emission Imaging System (THEMIS) for the Mars 2001 OdysseyMission. Space Sci. Rev. 110, 85–130.
Clancy, R.T., Grossman, A.W., Wolff, M.J., James, P.B., Rudy, D.J., Billawala, Y.N.,Sandor, B.J., Lee, S.W., Muhleman, D.O., 1996. Water vapor saturation at lowaltitudes around Mars aphelion: A key to Mars climate? Icarus 122, 36–62.
Clifford, S.M., Hillel, D., 1983. The stability of ground ice in the equatorial region ofMars. J. Geophys. Res. 88, 2456–2474.
Curran, R.J., Conrath, B.J., Hanel, R.A., Kunde, V.G., Pearl, J.C., 1973. Mars: Mariner 9spectroscopic evidence for H2O ice clouds. Science 182, 381–383.
Farmer, C.B., Doms, P.E., 1979. Global seasonal variation of water vapor on Mars andthe implications for permafrost. J. Geophys. Res. 84 (B6), 2881–2888.
Feldman, W.C., Boynton, W.V., Tokar, R.L., Prettyman, T.H., Gasnault, O., Squyres,S.W., Elphic, R.C., Lawrence, D.J., Lawson, S.L., Maurice, S., McKinney, G.W.,Moore, K.R., Reedy, R.C., 2002. Global distribution of neutrons from Mars:Results from Mars Odyssey. Science 297, 75–78.
Feldman, W.C., Prettyman, T.H., Maurice, S., Elphic, R.C., Funsten, H.O., Gasnault, O.,Lawrence, D.J., Murphy, J.R., Nelli, S.M., Tokar, R.L., Vaniman, D.T., 2005.Topographic control of hydrogen deposits at mid to low latitudes of Mars. J.Geophys. Res. 110 (E11). doi:10.1029/2005JE002452.
Forget, F., Millour, E., González-Galindo, F., Spiga, A., Lewis, S.R., Montabone, L.,Read, P.L., López-Valverde, M.A., Gilli, G., Desjean, M.C., Huot, J.-P., McD/GcmDevelopment Team, 2007. The New (Version 4.2) Mars Climate Database. In:Seventh International Conference on Mars, abstract 1353.
Formisano, V., Angrilli, F., Arnold, G., Atreya, S., Bianchini, G., Biondi, D., Blanco, A.,Blecka, M.I., Coradini, A., Colangeli, L., 2005. The Planetary Fourier Spectrometer(PFS) onboard the European Mars Express mission. Planet. Space Sci. 53, 963–974.
Grassi, D., Ignatiev, N.I., Zasova, L.V., Maturilli, A., Formisano, V., Bianchini, G.A.,Giuranna, M., 2005. Methods for the analysis of data from the Planetary Fourier,Spectrometer on the Mars Express Mission, Planetary and Space. Science 53,1017–1034.
Haberle, R.M., McKay, C.P., Schaeffer, J., Cabrol, N.A., Grin, E.A., Zent, A.P., Quinn, R.,2001. On the possibility of liquid water on present-day Mars. J. Geophys. Res.106 (E10), 23317–23326.
Hansen, G.B., 2003. Infrared optical constants of martian dust derived from martianspectra. In: Sixth International Conference on Mars, Abstract No. 3194.
Hansen, G.B., McCord, T.B., 1997. Optical properties of water frost below 200 K.Lunar Planet. Sci. XXVIII, 505.
Hapke, B., 1993. Theory of Reflectance and Emittance Spectroscopy. CambridgeUniversity Press, New York.
Ignatiev, N.I., Grassi, D., Zasova, L.V., 2005. Planetary Fourier spectrometer dataanalysis: Fast radiative transfer models. Planetary and Space Science 53 (10),1035–1042.
Jones, K.L., Arvidson, R.E., Guinness, E.A., Bragg, S.L., Wall, S.D., Carlston, C.E., Pidek,D.G., 1979. One Mars year – Viking lander imaging observations. Science 204,799–806.
Kossacki, K.J., Markiewicz, W.J., 2004. Seasonal melting of surface water frostcondensing in martian gullies. Icarus 171, 272–283.
Landis, G.A.and Mer Athena Science Team, 2007. Observation of frost at the equatorof Mars by the opportunity rover. Lunar Planet. Sci. XXXVIII, 2423.
Langevin, Y., Poulet, F., Bibring, J.-P., Gondet, B., 2005. Sulfates in the North PolarRegion of Mars detected by OMEGA/Mars Express. Science 307, 1584–1586.
Langevin, Y., Bibring, J.-P., Montmessin, F., Forget, F., Vincendon, M., Douté, S.,Poulet, F., Gondet, B., 2007. Observations of the south seasonal cap of Marsduring recession in 2004–2006 by the OMEGA visible/near-infrared imagingspectrometer on board Mars Express. J. Geophys. Res. 112. doi:10.1029/2006JE002841. E08S12.
Leighton, R.R., Murray, B.C., 1966. Behaviour of carbon dioxide and other volatileson Mars. Science 153, 136–144.
Lewis, S.R., Collins, M., Read, P., Forget, F., Hourdin, F., Fournier, R., Hourdin, C.,Talagrand, O., Huot, J.-P., 1999. A climate database for Mars. J. Geophys. Res. 104(E10), 24177–24194.
Mellon, M.T., Jakosky, B.M., 1993. Geographic variations in the thermal and diffusivestability of ground ice on Mars. J. Geophys. Res. 98 (E2), 3345–3364.
Mellon, M.T., Jakosky, B.M., 1995. The distribution and behaviour of martianground ice during past and present epochs. J. Geophys. Res. 100 (E6), 11781–11799.
Putzig, N.E., Mellon, M.T., Kretke, K.A., Arvidson, R.E., 2005. Global thermal inertiaand surface properties of Mars from the MGS mapping mission. Icarus 173,325–341.
Schorghofer, N., Aharonson, O., 2005. Stability and exchange of subsurface ice onMars. J. Geophys. Res. 110. doi:10.1029/2004JE002350. E05003.
Schorghofer, N., Edgett, K.S., 2006. Seasonal surface frost at low latitudes on Mars.Icarus 180, 321–334.
Schorghofer, N., Aharonson, O., Khatiwala, S., 2002. Slope streaks on Mars:Correlations with surface properties and the potential role of water. Geophys.Res. Lett. 29. doi:10.1029/2002GL015889.
Smith, M.D., 2002. The annual cycle of water vapor on Mars as observed by theThermal Emission Spectrometer. J. Geophys. Res. 107 (E11). doi:10.1029/2001JE001522.
Smith, M.D., 2004. Interannual variability in TES atmospheric observations of Marsduring 1999–2003. Icarus 167, 148–165.
Spiga, A., Forget, F., 2009. A new model to simulate the martian mesoscale andmicroscale atmospheric circulation: Validation and first results. J. Geophys. Res.114 (E2). doi:10.1029/2008JE003242.

420 F.G. Carrozzo et al. / Icarus 203 (2009) 406–420
Sullivan, R., Thomas, P., Veverka, J., Malin, M., Edgett, K., 2001. Mass movementslope streaks imaged by the Mars Orbiter Camera. J. Geophys. Res. 106 (E10),23607–23633.
Svitek, T., Murray, B., 1990. Winter frost at Viking lander 2 site. J. Geophys. Res. 95(B2), 1495–1510.
Titus, T.N., Kieffer, H.H., Christensen, P.R., 2003. Exposed water frost discovered nearthe South Pole of Mars. Science 299, 1048–1051.
Wall, S.D., 1981. Analysis of condensates formed at the Viking 2 lander site – Thefirst winter. Icarus 47, 173–183.