Will recommenders kill search?: recommender systems - an industry perspective
Upload
khangminh22Category
view
0download
0
Tilburg University
Recommender systems for social bookmarking
Bogers, A.M.
Publication date:2009
Document VersionPublisher's PDF, also known as Version of record
Link to publication in Tilburg University Research Portal
Citation for published version (APA):Bogers, A. M. (2009). Recommender systems for social bookmarking. TICC Dissertation Series 10.
General rightsCopyright and moral rights for the publications made accessible in the public portal are retained by the authors and/or other copyright ownersand it is a condition of accessing publications that users recognise and abide by the legal requirements associated with these rights.
• Users may download and print one copy of any publication from the public portal for the purpose of private study or research. • You may not further distribute the material or use it for any profit-making activity or commercial gain • You may freely distribute the URL identifying the publication in the public portal
Take down policyIf you believe that this document breaches copyright please contact us providing details, and we will remove access to the work immediatelyand investigate your claim.
Download date: 20. Apr. 2022

Recommender Systems for
Social Bookmarking
PROEFSCHRIFT
ter verkrijging van de graad van doctoraan de Universiteit van Tilburg,
op gezag van de rector magnificus,prof. dr. Ph. Eijlander,
in het openbaar te verdedigen ten overstaan van eendoor het college voor promoties aangewezen commissie
in de aula van de Universiteitop dinsdag 8 december 2009 om 14.15 uur
door
Antonius Marinus Bogers,geboren op 21 september 1979 te Roosendaal en Nispen

Promotor:
Prof. dr. A.P.J. van den Bosch
Beoordelingscommissie:
Prof. dr. H.J. van den Herik
Prof. dr. M. de Rijke
Prof. dr. L. Boves
Dr. B. Larsen
Dr. J.J. Paijmans
The research reported in this thesis has been funded by SenterNovem / the Dutch Ministry
of Economic Affairs as part of the IOP-MMI À Propos project.
SIKS Dissertation Series No. 2009-42
The research reported in this thesis has been carried out under the auspices of SIKS, the
Dutch Research School for Information and Knowledge Systems.
TiCC Dissertation Series No. 10
ISBN 978-90-8559-582-3
Copyright c© 2009, A.M. Bogers
All rights reserved. No part of this publication may be reproduced, stored in a retrieval sys-
tem, or transmitted, in any form or by any means, electronically, mechanically, photocopying,
recording or otherwise, without prior permission of the author.

“ The Web, they say, is leaving the era of search and entering one of discovery.
What’s the difference? Search is what you do when you’re looking for some-
thing. Discovery is when something wonderful that you didn’t know existed,
or didn’t know how to ask for, finds you. ”Jeffrey M. O’Brien

iii

PREFACE
First and foremost I would like to thank my supervisor and promotor Antal van den Bosch,who guided me in my first steps as a researcher, both for my Master’s thesis and my Ph.D.research. Antal always gave me free reign in investigating many different research prob-lems, while at the same time managing to steer me in the right direction when the timecalled for it. Antal was always able to make time for me or any of the other Ph.D. students,and read and comment on paper or presentation drafts.
In addition to turning me into a better researcher, Antal was also instrumental in improvingmy Guitar Hero skills. Our thesis meetings during your sabbatical doubled as a kind of Rock’n Roll Fantasy Camp, where we could both unwind from discussing yet another batch ofexperiments I had run or was planning to run. Rock on! Antal also shares my passion forice hockey. This resulted in us attending Tilburg Trappers games in Stappegoor as well asour regular discussions of the latest hockey news. Thanks for inviting me to come see theNHL All Star games in Breda. Hopefully we will meet again in spirit come May 2010 whenthe Canucks beat the Penguins in the Stanley Cup finals!
The research presented in this thesis was performed in the context of the À Propos project.I would like to acknowledge SenterNovem and the Dutch Ministry of Economic Affairs forfunding this project as part of the IOP-MMI program. The À Propos project was started byLou Boves, Antal, and Frank Hofstede. I would like to thank Lou and Frank in particular.Frank was always able to look at my research problems from a different and more practicalangle, and as a result our discussions were always very stimulating. I would also like to MariCarmen Puerta-Melguizo, Anita Deshpande, and Els den Os, as well as the other membersand attendees of the project meetings for the pleasant cooperation and helpful commentsand suggestions.
I wish to thank the members of my committee for taking time out of their busy schedules toread my dissertation and attending my defense: Jaap van den Herik, Maarten de Rijke, LouBoves, Birger Larsen, and Hans Paijmans. Special thanks go to Jaap for his willingness to gothrough my thesis with a fine-grained comb. The readability of the final text has benefitedgreatly from his meticulous attention to detail and quality. Any errors remaining in thethesis are my own. I would also like to thank Birger for his comments, which helped to dotthe i’s and cross the t’s of the final product. Finally, I would like to thank Hans Paijmans,who contributed considerably to my knowledge of IR.
iv

Preface v
My Ph.D. years would not have been as enjoyable and successful without my colleagues atTilburg University, especially those at the ILK group. It is not everywhere that the bondbetween colleagues is as strong as it was in ILK and I will not soon forget the coffee breakswith the Sulawesi Boys, the BBQs and Guitar Hero parties, lunch runs, after-work drinks,and the friendly and supportive atmosphere on the 3rd floor of Dante. I do not have enoughroom to thank everyone personally here, you know who you are. In your own way, you allcontributed to this thesis.
Over the course of my Ph.D. I have spent many Fridays at the Science Park in Amsterdam,working with members of the ILPS group headed by Maarten de Rijke. I would like tothank Erik Tjong Kim Sang for setting this up and Maarten for allowing me to become aguest researcher at his group. Much of what I know about doing IR research, I learnedfrom these visits. From small things like visualizing research results and LaTeX layout to IRresearch methodology and a focus on empirical, task-driven research. I hope that some ofwhat I have learned shows in the thesis. I would like to thank all of the ILPS members, butespecially Krisztian, Katja, and Maarten for collaborating with me on expert search, whichhas proven to be a very fruitful collaboration so far.
I have also had the pleasure of working at the Royal School of Library and InformationScience in Copenhagen. I am most grateful to Birger Larsen and Peter Ingwersen, for helpingto arrange my visit and guiding me around. Thanks are also due to Mette, Haakon, Charles,Jette, and the other members of the IIIA group for welcoming me and making me feel athome. Jeg glæder mig til at arbejde sammen med jer snart.
Thanks are due to Sunil Patel for designing part of the stylesheet of this thesis and toJonathan Feinberg of http://www.wordle.net/ for the word cloud on the front of thisthesis. I owe Maarten Clements a debt of gratitude for helping me to more efficiently im-plement his random walk algorithm. And of course thanks to BibSonomy, CiteULike, andDelicious for making the research described in this thesis possible.
Finally, I would like to thank the three most important groups of people in my life. Myfriends, for always supporting me and taking my mind off my work. Thanks for all the din-ners, late-night movies, pool games, talks, vacations and trips we have had so far! Thanksto my parents for always supporting me and believing in me; without you I would not havebeen where I am today. Kirstine, thanks for putting up with me while I was distracted bymy work, and thanks for patiently reading and commenting on my Ph.D. thesis. Og tusindtak fordi du bringer så meget glæde, latter og kærlighed ind i mit liv. Det her er til Timmyog Oinky!

CONTENTS
Preface iv
1 Introduction 11.1 Social Bookmarking . . . . . . . . . . . . . . . . . . . . . . . . . . . . . . . . . . . . 21.2 Scope of the Thesis . . . . . . . . . . . . . . . . . . . . . . . . . . . . . . . . . . . . 31.3 Problem Statement and Research Questions . . . . . . . . . . . . . . . . . . . . . 31.4 Research Methodology . . . . . . . . . . . . . . . . . . . . . . . . . . . . . . . . . . 51.5 Organization of the Thesis . . . . . . . . . . . . . . . . . . . . . . . . . . . . . . . . 61.6 Origins of the Material . . . . . . . . . . . . . . . . . . . . . . . . . . . . . . . . . . 7
2 Related Work 92.1 Recommender Systems . . . . . . . . . . . . . . . . . . . . . . . . . . . . . . . . . . 9
2.1.1 Collaborative Filtering . . . . . . . . . . . . . . . . . . . . . . . . . . . . . 102.1.2 Content-based Filtering . . . . . . . . . . . . . . . . . . . . . . . . . . . . . 132.1.3 Knowledge-based Recommendation . . . . . . . . . . . . . . . . . . . . . 142.1.4 Recommending Bookmarks & References . . . . . . . . . . . . . . . . . . 152.1.5 Recommendation in Context . . . . . . . . . . . . . . . . . . . . . . . . . . 17
2.2 Social Tagging . . . . . . . . . . . . . . . . . . . . . . . . . . . . . . . . . . . . . . . 212.2.1 Indexing vs. Tagging . . . . . . . . . . . . . . . . . . . . . . . . . . . . . . 222.2.2 Broad vs. Narrow Folksonomies . . . . . . . . . . . . . . . . . . . . . . . . 242.2.3 The Social Graph . . . . . . . . . . . . . . . . . . . . . . . . . . . . . . . . . 25
2.3 Social Bookmarking . . . . . . . . . . . . . . . . . . . . . . . . . . . . . . . . . . . . 262.3.1 Domains . . . . . . . . . . . . . . . . . . . . . . . . . . . . . . . . . . . . . . 272.3.2 Interacting with Social Bookmarking Websites . . . . . . . . . . . . . . . 282.3.3 Research tasks . . . . . . . . . . . . . . . . . . . . . . . . . . . . . . . . . . 29
I Recommending Bookmarks
3 Building Blocks for the Experiments 353.1 Recommender Tasks . . . . . . . . . . . . . . . . . . . . . . . . . . . . . . . . . . . 353.2 Data Sets . . . . . . . . . . . . . . . . . . . . . . . . . . . . . . . . . . . . . . . . . . 37
3.2.1 CiteULike . . . . . . . . . . . . . . . . . . . . . . . . . . . . . . . . . . . . . 413.2.2 BibSonomy . . . . . . . . . . . . . . . . . . . . . . . . . . . . . . . . . . . . 42
vi

Contents vii
3.2.3 Delicious . . . . . . . . . . . . . . . . . . . . . . . . . . . . . . . . . . . . . . 443.3 Data Representation . . . . . . . . . . . . . . . . . . . . . . . . . . . . . . . . . . . 463.4 Experimental Setup . . . . . . . . . . . . . . . . . . . . . . . . . . . . . . . . . . . . 47
3.4.1 Filtering . . . . . . . . . . . . . . . . . . . . . . . . . . . . . . . . . . . . . . 483.4.2 Evaluation . . . . . . . . . . . . . . . . . . . . . . . . . . . . . . . . . . . . . 503.4.3 Discussion . . . . . . . . . . . . . . . . . . . . . . . . . . . . . . . . . . . . . 52
4 Folksonomic Recommendation 554.1 Preliminaries . . . . . . . . . . . . . . . . . . . . . . . . . . . . . . . . . . . . . . . . 564.2 Popularity-based Recommendation . . . . . . . . . . . . . . . . . . . . . . . . . . 584.3 Collaborative Filtering . . . . . . . . . . . . . . . . . . . . . . . . . . . . . . . . . . 60
4.3.1 Algorithm . . . . . . . . . . . . . . . . . . . . . . . . . . . . . . . . . . . . . 604.3.2 Results . . . . . . . . . . . . . . . . . . . . . . . . . . . . . . . . . . . . . . . 644.3.3 Discussion . . . . . . . . . . . . . . . . . . . . . . . . . . . . . . . . . . . . . 64
4.4 Tag-based Collaborative Filtering . . . . . . . . . . . . . . . . . . . . . . . . . . . 664.4.1 Tag Overlap Similarity . . . . . . . . . . . . . . . . . . . . . . . . . . . . . 664.4.2 Tagging Intensity Similarity . . . . . . . . . . . . . . . . . . . . . . . . . . 684.4.3 Similarity Fusion . . . . . . . . . . . . . . . . . . . . . . . . . . . . . . . . . 684.4.4 Results . . . . . . . . . . . . . . . . . . . . . . . . . . . . . . . . . . . . . . . 704.4.5 Discussion . . . . . . . . . . . . . . . . . . . . . . . . . . . . . . . . . . . . . 72
4.5 Related work . . . . . . . . . . . . . . . . . . . . . . . . . . . . . . . . . . . . . . . . 744.6 Comparison to Related Work . . . . . . . . . . . . . . . . . . . . . . . . . . . . . . 76
4.6.1 Tag-aware Fusion of Collaborative Filtering Algorithms . . . . . . . . . 774.6.2 A Random Walk on the Social Graph . . . . . . . . . . . . . . . . . . . . . 784.6.3 Results . . . . . . . . . . . . . . . . . . . . . . . . . . . . . . . . . . . . . . . 804.6.4 Discussion . . . . . . . . . . . . . . . . . . . . . . . . . . . . . . . . . . . . . 81
4.7 Chapter Conclusions and Answer to RQ 1 . . . . . . . . . . . . . . . . . . . . . . 82
5 Exploiting Metadata for Recommendation 855.1 Contextual Metadata in Social Bookmarking . . . . . . . . . . . . . . . . . . . . 865.2 Exploiting Metadata for Item Recommendation . . . . . . . . . . . . . . . . . . . 88
5.2.1 Content-based Filtering . . . . . . . . . . . . . . . . . . . . . . . . . . . . . 885.2.2 Hybrid Filtering . . . . . . . . . . . . . . . . . . . . . . . . . . . . . . . . . 915.2.3 Similarity Matching . . . . . . . . . . . . . . . . . . . . . . . . . . . . . . . 935.2.4 Selecting Metadata Fields for Recommendation Runs . . . . . . . . . . 94
5.3 Results . . . . . . . . . . . . . . . . . . . . . . . . . . . . . . . . . . . . . . . . . . . . 955.3.1 Content-based Filtering . . . . . . . . . . . . . . . . . . . . . . . . . . . . . 955.3.2 Hybrid Filtering . . . . . . . . . . . . . . . . . . . . . . . . . . . . . . . . . 975.3.3 Comparison to Folksonomic Recommendation . . . . . . . . . . . . . . . 98
5.4 Related Work . . . . . . . . . . . . . . . . . . . . . . . . . . . . . . . . . . . . . . . . 995.4.1 Content-based Filtering . . . . . . . . . . . . . . . . . . . . . . . . . . . . . 995.4.2 Hybrid Filtering . . . . . . . . . . . . . . . . . . . . . . . . . . . . . . . . . 101
5.5 Discussion . . . . . . . . . . . . . . . . . . . . . . . . . . . . . . . . . . . . . . . . . 1025.6 Chapter Conclusions and Answer to RQ 2 . . . . . . . . . . . . . . . . . . . . . . 105
6 Combining Recommendations 1076.1 Related Work . . . . . . . . . . . . . . . . . . . . . . . . . . . . . . . . . . . . . . . . 108
6.1.1 Fusing Recommendations . . . . . . . . . . . . . . . . . . . . . . . . . . . 108

Contents viii
6.1.2 Data Fusion in Machine Learning and IR . . . . . . . . . . . . . . . . . . 1106.1.3 Why Does Fusion Work? . . . . . . . . . . . . . . . . . . . . . . . . . . . . 111
6.2 Fusing Recommendations . . . . . . . . . . . . . . . . . . . . . . . . . . . . . . . . 1126.3 Selecting Runs for Fusion . . . . . . . . . . . . . . . . . . . . . . . . . . . . . . . . 1146.4 Results . . . . . . . . . . . . . . . . . . . . . . . . . . . . . . . . . . . . . . . . . . . . 115
6.4.1 Fusion Analysis . . . . . . . . . . . . . . . . . . . . . . . . . . . . . . . . . . 1176.4.2 Comparing All Fusion Methods . . . . . . . . . . . . . . . . . . . . . . . . 119
6.5 Discussion & Conclusions . . . . . . . . . . . . . . . . . . . . . . . . . . . . . . . . 1206.6 Chapter Conclusions and Answer to RQ 3 . . . . . . . . . . . . . . . . . . . . . . 121
II Growing Pains: Real-world Issues in Social Bookmarking
7 Spam 1257.1 Related Work . . . . . . . . . . . . . . . . . . . . . . . . . . . . . . . . . . . . . . . . 1267.2 Methodology . . . . . . . . . . . . . . . . . . . . . . . . . . . . . . . . . . . . . . . . 128
7.2.1 Data Collection . . . . . . . . . . . . . . . . . . . . . . . . . . . . . . . . . . 1297.2.2 Data Representation . . . . . . . . . . . . . . . . . . . . . . . . . . . . . . . 1307.2.3 Evaluation . . . . . . . . . . . . . . . . . . . . . . . . . . . . . . . . . . . . . 132
7.3 Spam Detection for Social Bookmarking . . . . . . . . . . . . . . . . . . . . . . . 1327.3.1 Language Models for Spam Detection . . . . . . . . . . . . . . . . . . . . 1337.3.2 Spam Classification . . . . . . . . . . . . . . . . . . . . . . . . . . . . . . . 1357.3.3 Results . . . . . . . . . . . . . . . . . . . . . . . . . . . . . . . . . . . . . . . 1367.3.4 Discussion and Conclusions . . . . . . . . . . . . . . . . . . . . . . . . . . 138
7.4 The Influence of Spam on Recommendation . . . . . . . . . . . . . . . . . . . . . 1407.4.1 Related Work . . . . . . . . . . . . . . . . . . . . . . . . . . . . . . . . . . . 1407.4.2 Experimental Setup . . . . . . . . . . . . . . . . . . . . . . . . . . . . . . . 1417.4.3 Results and Analysis . . . . . . . . . . . . . . . . . . . . . . . . . . . . . . . 142
7.5 Chapter Conclusions and Answer to RQ 4 . . . . . . . . . . . . . . . . . . . . . . 145
8 Duplicates 1478.1 Duplicates in CiteULike . . . . . . . . . . . . . . . . . . . . . . . . . . . . . . . . . 1488.2 Related Work . . . . . . . . . . . . . . . . . . . . . . . . . . . . . . . . . . . . . . . . 1498.3 Duplicate Detection . . . . . . . . . . . . . . . . . . . . . . . . . . . . . . . . . . . . 151
8.3.1 Creating a Training Set . . . . . . . . . . . . . . . . . . . . . . . . . . . . . 1518.3.2 Constructing a Duplicate Item Classifier . . . . . . . . . . . . . . . . . . . 1538.3.3 Results and Analysis . . . . . . . . . . . . . . . . . . . . . . . . . . . . . . . 157
8.4 The Influence of Duplicates on Recommendation . . . . . . . . . . . . . . . . . . 1608.4.1 Experimental Setup . . . . . . . . . . . . . . . . . . . . . . . . . . . . . . . 1608.4.2 Results and Analysis . . . . . . . . . . . . . . . . . . . . . . . . . . . . . . . 162
8.5 Chapter Conclusions and Answer to RQ 5 . . . . . . . . . . . . . . . . . . . . . . 164
III Conclusion
9 Discussion and Conclusions 1699.1 Answers to Research Questions . . . . . . . . . . . . . . . . . . . . . . . . . . . . . 1699.2 Recommendations for Recommendation . . . . . . . . . . . . . . . . . . . . . . . 172

Contents ix
9.3 Summary of Contributions . . . . . . . . . . . . . . . . . . . . . . . . . . . . . . . 1739.4 Future Directions . . . . . . . . . . . . . . . . . . . . . . . . . . . . . . . . . . . . . 174
References 177
Appendices
A Collecting the CiteULike Data Set 191A.1 Extending the Public Data Dump . . . . . . . . . . . . . . . . . . . . . . . . . . . . 191A.2 Spam Annotation . . . . . . . . . . . . . . . . . . . . . . . . . . . . . . . . . . . . . 193
B Glossary of Recommendation Runs 195
C Optimal Fusion Weights 197
D Duplicate Annotation in CiteULike 203
List of Figures 205
List of Tables 207
List of Abbreviations 209
Summary 211
Samenvatting 215
Curriculum Vitae 219
Publications 221
SIKS Dissertation Series 223
TiCC Dissertation Series 229

CH
AP
TE
R 1INTRODUCTION
For the past two decades, the World Wide Web has expanded at enormous rate. The firstgeneration of the World Wide Web (WWW) enabled users to have instantaneous accessto a large diversity of knowledge items. The second generation of the WWW is usuallydenoted by Web 2.0. It signifies a fundamental change in the way people interact with andthrough the World Wide Web. Web 2.0 is also referred to as the participatory Web. It can becharacterized as a paradigm that facilitates communication, interoperability, user-centereddesign, and information sharing and collaboration on the Web (O’Reilly, 2005; Sharma,2008). Moreover, in the transition to Web 2.0 we see a paradigm shift from local andsolitary to global and collaborative. Also, this shift coincides with a shift from accessing andcreating information to understanding information and understanding the people who dealwith this information. Instead of creating, storing, managing, and accessing informationon only one specific computer or browser, information management and access has beenmoving to many distributed places on the Web. Collaboratively created websites such asWikipedia are edited and accessed by anyone, and users can document and share any aspectof their lives online using blogs, social networking sites, and video and photo sharing sites.
This thesis deals with recommender systems, social tagging, and social bookmarking. Whatare the relations between these three elements, and can we build recommender systems thatprofit from the presence of the other two elements? Assuming that we can, what are thethreats from the outside or inside of this new part of the WWW? In the thesis we deal withspam as the outside threat, and duplicates as the inside threat. The aim of the thesis is tounderstand the symbiosis of recommender systems, social tagging, and social bookmarking,and to design mechanisms that successfully counter the threats from the outside and fromthe inside.
The course of this chapter is as follows. We introduce social bookmarking in Section 1.1. It isfollowed by a description of the scope of the thesis. The problem statement and five researchquestions are formulated in Section 1.3. Section 1.4 describes the research methodology.The structure of the thesis is provided in Section 1.5. Finally, Section 1.6 points to theorigins of the material.
1

Chapter 1. Introduction 2
1.1 Social Bookmarking
Social bookmarking is a rather new phenomenon: instead of keeping a local copy of point-ers to favorite URLs, users can instead store and access their bookmarks online througha Web interface. The underlying application then makes all stored information shareableamong users. Closely related to social bookmarking websites are the so-called social refer-ence managers, which follow the same principle, but with a focus on the online managementand access of scientific articles and papers. Social bookmarking websites have seen a rapidgrowth in popularity and a high degree of activity by their users. For instance, Delicious1
is one of the most popular social bookmarking services. It received an average of 140,000posts per day in 2008 according to the independently sampled data collected by PhilippKeller2. In addition to the aforementioned functionality, most social ‘storage’ services alsooffer the user the opportunity to describe by keywords the content they added to their per-sonal profile. These keywords are commonly referred to as tags. They are an addition toe.g., the title and summary metadata commonly used to annotate content, and to improvethe access and retrievability of a user’s own bookmarked Web pages. These tags are thenmade available to all users, many of whom have annotated many of the same Web pageswith possibly overlapping tags. This results in a rich network of users, bookmarks, and tags,commonly referred to as a folksonomy. This social tagging phenomenon and the resultingfolksonomies have become a staple of many Web 2.0 websites and services (Golder andHuberman, 2006).
The emerging folksonomy on a social bookmarking website can be used to enhance a varietyof tasks, such as searching for specific content. It can also enable the active discovery of newcontent by allowing users to browse through the richly connected network. A user couldselect one of his3 tags to explore all bookmarks annotated with that tag by the other users inthe network, or locate like-minded users by examining a list of all other users who added aparticular bookmark, possibly resulting in serendipitously discovered content (Marlow et al.,2006). Both browsing and searching the system, however, require active user participationto locate new and interesting content. As the system increases in popularity and more usersas well as content enter the system, the access methods become less effective at finding allthe interesting content present in the system. The information overload problem causedby this growing influx of users and content means that search and browsing, which requireactive participation, are not always the most practical or preferable ways of locating newand interesting content. Typically, users only have a limited amount of time to go throughthe search results. Assuming users know about the existence of the relevant content andknow how to formulate the appropriate queries they may arrive in time at the preferredplaces. But what happens when the search and browse process becomes less effective? Andwhat if the user does not know about all relevant content available in the system? Ourinterest, and the focus of this thesis, lies in using recommender systems to help the user withthis information overload problem, and automatically find interesting content for the user.A recommender system is a type of personalized information filtering technology used toidentify sets of items that are likely to be of interest to a certain user, using a variety of
1http://www.delicious.com/2Available at http://deli.ckoma.net/stats; last visited January 2009.3In this thesis, we use ‘his’ and ’he’ to refer to both genders.
Chapter 1. Introduction 3
information sources related to both the user and the content items (Resnick and Varian,1997).
1.2 Scope of the Thesis
In this thesis, we investigate how recommender systems can be applied to the domain ofsocial bookmarking. More specifically, we want to investigate the task of item recommenda-tion. For this purpose, interesting and relevant items—bookmarks or scientific articles—areretrieved and recommended to the user. Recommendations can be based on a variety ofinformation sources about the user and the items. It is a difficult task as we are trying topredict which items out of a very large pool would be relevant given a user’s interests, asrepresented by the items which the user has added in the past. In our experiments we dis-tinguish between two types of information sources. The first one is usage data contained inthe folksonomy, which represents the past selections and transactions of all users, i.e., whoadded which items, and with what tags. The second information source is the metadatadescribing the bookmarks or articles on a social bookmarking website, such as title, de-scription, authorship, tags, and temporal and publication-related metadata. We are amongthe first to investigate this content-based aspect of recommendation for social bookmark-ing websites. We compare and combine the content-based aspect with the more commonusage-based approaches.
Because of the novelty of applying recommender systems to social bookmarking websites,there is not a large body of related work, results, and design principles to build on. Wetherefore take a system-based approach for the evaluation our work. We try to simulate, asrealistically as possible, the reaction of the user to different variants of the recommenda-tion algorithms in a controlled laboratory setting. We focus on two specific domains: (1)recommending bookmarks of Web pages and (2) recommending bookmarked references toscientific articles. It is important to remark, however, that a system-based evaluation canonly provide us with a provisional estimate of how well our algorithms are doing. User sat-isfaction is influenced by more than just recommendation accuracy (Herlocker et al., 2004)and it would be essential to follow up our work with an evaluation on real users in realisticsituations. However, this is not the focus of the thesis, nor will we focus on tasks such as tagrecommendation or finding like-minded users. We focus strictly on recommending items.
1.3 Problem Statement and Research Questions
As stated above, the rich information contained in social bookmarking websites can be usedto support a variety of tasks. We consider three important ones: browsing, search, andrecommendation. From these three, we focus on (item) recommendation in this thesis. Inthis context we may identify two types of key characteristics of social bookmarking websitesthat can be used in the recommendation process. We remark that the information sourcesrepresented by these characteristics are not always simultaneously available in every rec-ommendation scenario. The resulting recommendations are produced by (1) collaborative

Chapter 1. Introduction 4
filtering algorithms and (2) content-based filtering algorithms. We briefly discuss both typesof algorithms and the associated characteristics below.
Collaborative filtering algorithms Much of the research in recommender systems has fo-cused on exploiting sets of usage patterns that represent user preferences and transac-tions. The class of algorithms that operate on this source of information are called Col-laborative Filtering (CF) algorithms. They automate the process of “word-of-mouth”recommendation: items are recommended to a user based on how like-minded usersrated those items (Goldberg et al., 1992; Shardanand and Maes, 1995). In the so-cial bookmarking domain, we have an extra layer of usage data at our disposal inthe folksonomy in the form of tags. This extra layer of collaboratively generated tagsbinds the users and items of a system together in yet another way, opening up manypossibilities for new algorithms that can take advantage of this data.
Content-based filtering algorithms Social bookmarking services and especially social ref-erence managers are also characterized by the rich metadata describing the contentadded by their users. Recommendation on the basis of textual information is com-monly referred to as content-based filtering (Goldberg et al., 1992) and matches theitem metadata against a representation of the user’s interest to produce new recom-mendations. The metadata available on social bookmarking services describe manydifferent aspects of the items posted to the website. It may comprise both personalinformation, such as reviews and descriptions, as well as general metadata that isthe same for all users. While the availability of metadata is not unique to socialbookmarking—movie recommenders, for instance, also have a rich set of metadata attheir disposal (Paulson and Tzanavari, 2003)—it might be an important informationsource for generating item recommendations.
Having distinguished the two types of characteristics of social bookmarking websites, weare now able to formulate our problem statement (PS).
PS How can the characteristics of social bookmarking websites be exploited toproduce the best possible item recommendations for users?
To address this problem statement, we formulate five research questions. The first tworesearch questions belong together. They read as follows.
RQ 1 How can we use the information represented by the folksonomy to sup-port and improve the recommendation performance?
RQ 2 How can we use the item metadata available in social bookmarking sys-tems to provide accurate recommendations to users?
After answering the first two questions, we know how to exploit in the best manner the twotypes of information sources—the folksonomy and item metadata—to produce accuraterecommendations. This leads us to our third research question.

Chapter 1. Introduction 5
RQ 3 Can we improve performance by combining the recommendations gen-erated by different algorithms?
These are the three main research questions. As mentioned earlier, we evaluate our answersto these questions by simulating the user’s interaction with our proposed recommendationalgorithms in a laboratory setting. However, such an idealized perspective does not takeinto account the dynamic growth issues caused by the increasing popularity of social book-marking websites. Therefore, we focus on two of these growing pains. There is one painattacking social bookmarking websites from the outside, spam. The other one, duplicatecontent, attacks a social bookmarking website from the inside. They lead to our final tworesearch questions.
RQ 4 How big a problem is spam for social bookmarking services?
RQ 5 How big a problem is the entry of duplicate content for social bookmark-ing services?
Wherever it is applicable and aids our investigation, we will break down these questionsinto separate and even more specific research questions.
1.4 Research Methodology
The research methodology followed in the thesis comprises five parts: (1) reviewing theliterature, (2) analyzing the findings, (3) designing the recommendation algorithms, (4)evaluating the algorithms, and (5) designing protection mechanisms for two growing pains.First, we conduct a literature review to identify the main techniques, characteristics, andissues in the fields of recommender systems, social tagging, and social bookmarking, andin the intersection of the three fields. In addition, Chapters 4 through 8 each contain shortliterature reviews specifically related to the work described in the respective chapters.
Second, we analyze the findings from the literature. We use these in the third part of ourmethodology to guide us in the development of recommendation algorithms specificallysuited for item recommendation on social bookmarking websites.
Fourth, we evaluate our recommendation algorithms in a quantitative manner. The build-ing blocks of our quantitative evaluation are described in more detail in Chapter 3. Ourquantitative evaluation is based on a so-called backtesting approach to evaluation that iscommon in recommender systems literature (Breese et al., 1998; Herlocker et al., 2004;Baluja et al., 2008). In backtesting, we evaluate on a per-user basis. We withhold ran-domly selected items from each user profile, and generate recommendations by using theremaining data as training material. If a user’s withheld items are predicted at the top of theranked list of recommendations, then the algorithm is considered to perform well for thatuser. The performance of a recommendation algorithm is averaged over the performancefor all individual users. In our evaluation we employ cross-validation, which can provide a

Chapter 1. Introduction 6
reliable estimate of the true generalization error of our recommendation algorithms (Weissand Kulikowski, 1991). Our experimental setup is described in more detail in Section 3.4.
The fifth and final part of our research methodology involves designing protection for socialbookmarking websites and our proposed recommendation algorithms against two growingpains: spam and duplicate content. For both pains we analyze how extensive the problem isfor one of our data sets. We then design algorithms to automatically detect this problematiccontent. Finally, we perform a robustness analysis of the recommendation algorithms weproposed in Part I against spam and duplicates.
1.5 Organization of the Thesis
The thesis consists of two main parts. The first part is ‘Recommending Bookmarks’, whichranges from Chapter 3 to Chapter 6, both inclusive. The second main part is ‘GrowingPains’, which covers Chapters 7 and 8. The two Parts are preceded by two introductorychapters. Chapter 1 contains an introduction of the thesis as well as the formulation ofa problem statement and five research questions. Moreover, the research methodology isgiven. Chapter 2 contains a literature review. Below we provide a brief overview of thecontents of Parts I and II.
Part I The core of our recommendation experiments is contained in Part I. It starts in Chap-ter 3 with an overview of the building blocks of our quantitative evaluation. We startby formally defining the recommendation task we are trying to solve: recommendinginteresting items to users based on their preferences. We then introduce our data setsand describe how they were collected. We discuss our experimental setup, from datapre-processing and filtering to our choice of evaluation metrics.
Then, in Chapter 4 we investigate the first of two important characteristics of socialbookmarking systems: the presence of the folksonomy. We propose and comparedifferent options for using the folksonomy in item recommendation for social book-marking (RQ 1).
In Chapter 5, we investigate the usefulness of item metadata in the recommendationprocess, the other characteristic of social bookmarking websites, and examine howwe can use this metadata to improve recommendation performance (RQ 2).
Chapter 6 concludes Part I by examining different options for combining these twocharacteristics to see if we can improve upon our best-performing algorithms fromChapters 4 and 5 by combining the output of the different algorithms into a new listof recommendations (RQ 3).
Part II In Part II, we dive into the periphery of recommendation, and zoom in on two spe-cific growing pains that social bookmarking services encounter as they become morepopular: spam and duplicate content. In Chapter 7 we take a look at the problemof spam in social bookmarking websites to attempt to quantify the problem. We pro-pose a spam detection algorithm based on a combination of language models and the

Chapter 1. Introduction 7
nearest-neighbor algorithm. We also investigate the influence spam can have on rec-ommending items for social bookmarking websites in a case study on one of our datasets (RQ 4).
In Chapter 8 we take a similar approach to the problem of duplicate content. We startby quantifying the problem and then construct a classifier that can automatically iden-tify duplicate item pairs in one of our data sets. Finally, we investigate the influenceof duplicates on recommendation performance in a case study on one of our data sets.
Part III concludes the thesis. We revisit our research questions and the answers we found.Then we answer the problem statement and formulate our conclusions. We also list futureresearch directions, drawing on the work described in this thesis.
Additional information that would interrupt the narrative is placed in Appendices A, D, andC, and referred to in the text where applicable. We also list some mark-up conventions here.Tags feature prominently in our thesis; for clarity we print them with a sans-serif font, e.g.,as information-retrieval or toread. We print metadata fields with a fixed-width font, e.g.,as TITLE or ABSTRACT. We experiment with many different combinations of algorithms andsimilarity metrics, each resulting in a set of recommendations for a group of test users. Wewill refer to such output as a recommendation run which is made up of a list of recom-mendations. Different variants of an algorithm are marked up as RUNNAME1 or RUNNAME2where it helps to clarify the discussion.
1.6 Origins of the Material
This thesis is partly based on papers that have already been published or have been submit-ted. Early versions of the experiments with the CiteULike data set in Part I were describedin Bogers and Van den Bosch (2008a), and later expanded to include more algorithms andmore data sets in Bogers and Van den Bosch (2009b). In an earlier stage, the foundations ofthe work on content-based recommendation were laid in Bogers and Van den Bosch (2007).Finally, the work on spam detection described in Part II was published first in Bogers andVan den Bosch (2008b) and in expanded form in Bogers and Van den Bosch (2009a).


CH
AP
TE
R 2RELATED WORK
The work presented in this thesis is novel in (1) its application of recommendation algo-rithms to social bookmarking websites, and (2) its incorporation of the information rep-resented by the folksonomy and the metadata on those websites. This chapter serves asan introduction into general related work covering some subareas of our work. All relatedwork specifically relevant to the work described in each of the following chapters will bediscussed in those respective chapters.
We start this chapter in Section 2.1 by introducing recommender systems: first, a brief his-tory of the field will be given, followed by the most popular algorithms and applications, aswell as the most common problems that the recommender systems are suffering. Then, wetake a more detailed look at related work on recommending Web bookmarks and referencesto scientific articles. We briefly discuss the role of the user and context in recommendation.In Section 2.2 we closely consider the phenomenon of social tagging which has become abig part of the Web 2.0 paradigm. We compare it to the traditional view on indexing byinformation specialists and we discuss two different types of social tagging. We establishthat social bookmarking services are a class of social websites that lean heavily on socialtagging for managing their content. Section 2.3 discusses the rise of social bookmarkingservices and their characteristics, as well as research into the different user tasks performedon social bookmarking websites.
2.1 Recommender Systems
The explosive growth of the World Wide Web in the 1990s resulted in a commensurategrowth of the amount of information available online, outgrowing the capacity of individ-ual users to process all this information. This prompted a strong interest in the specificresearch fields and technology that could help manage this information overload. The mostcharacteristic fields are information retrieval and information filtering. As a research field, in-formation retrieval (IR) originated in the 1950s and is concerned with automatically match-ing a user’s information need against a collection of documents. The 1990s saw a change
9

Chapter 2. Related Work 10
in focus from small document collections to the larger collections of realistic size needed tocope with the ever-growing amount of information on the Web. Information filtering (IF)systems aim to help the users make optimal use of their limited reading time by filtering outunwanted information in order to expose only the relevant information from a large flow ofinformation, such as news articles (Hanani et al., 2001). Typically, such systems construct amodel of a user’s interests and match that against the incoming information objects. WhileIR and IF are considered separate research fields, they share many characteristics, such as afocus on analyzing textual content (Belkin and Croft, 1992).
A third type of technology designed to combat information overload are recommender sys-tems, which have their origin in the field of information filtering (Hanani et al., 2001). Arecommender system is used to identify sets of items that are likely to be of interest to acertain user, exploiting a variety of information sources related to both the user and thecontent items. In contrast to information filtering, recommender systems actively predictwhich items the user might be interested in and add them to the information flowing to theuser, whereas information filtering technology is aimed at removing items from the infor-mation stream (Hanani et al., 2001). Over the past two decades many different recommen-dation algorithms have been proposed for many different domains. In Subsections 2.1.1through 2.1.3, we discuss the three most common classes of algorithms: collaborative fil-tering, content-based filtering, and knowledge-based recommendation. We explain how thealgorithms work, and discuss the most important advantages and problems of each algo-rithm. Then, in Subsection 2.1.4, we discuss related work on recommendation Web pagesand scientific articles. We conclude this section by briefly discussing the role of the user andcontext in the recommendation process in Subsection 2.1.5.
Finally, we would like to remark that recommender systems technology has also been ap-plied to a variety of different domains, such as online stores (Linden et al., 2003), movies(Herlocker et al., 1999), music (Celma, 2008), Web pages (Joachims et al., 1997), e-mail(Goldberg et al., 1992), books (Mooney and Roy, 2000), news articles (Das et al., 2007),scientific articles (Budzik and Hammond, 1999), and even jokes (Goldberg et al., 2001). InOctober 2006, it also spawned a million dollar competition in the form of the Netflix Prize1,aimed at designing a recommender system that significantly outperforms Netflix’s own Cin-eMatch system. We refer the reader to Montaner et al. (2003) for a more comprehensiveoverview of recommender systems and domains.
2.1.1 Collaborative Filtering
Arguably the most popular class of recommendation algorithms, collaborative filtering (CF),descend from work in the area of information filtering. CF algorithms try to automate theprocess of “word-of-mouth” recommendation: items are recommended to a user based onhow like-minded users rated those items (Shardanand and Maes, 1995). The term ‘collabo-rative filtering’ was first used by Goldberg et al. (1992), to describe their Tapestry filteringsystem, which allowed users to annotate documents and e-mail messages. Other users couldthen request documents annotated by certain people, but identifying these people was left
1http://www.netflixprize.com/

Chapter 2. Related Work 11
to the user. Subsequent CF approaches automated this process of locating the nearest neigh-bors of the active user. Important early work was done by Resnick et al. (1994) on theirGROUPLENS system for recommending Usenet articles, and by Shardanand and Maes (1995)on their RINGO music recommender system. They were the first to correlate the rating be-havior between users in order to (1) determine the most similar neighbors and (2) use themto predict interest in new items. This work was expanded upon by Breese et al. (1998) andHerlocker et al. (1999), who performed the first large-scale evaluation and optimization ofcollaborative filtering algorithms. Herlocker et al. (2004) also published important work onevaluating recommender systems, which we adhere to in our experimental setup describedin Chapter 3.
CF algorithms exploit set of usage patterns that represent user preferences and transac-tions to match them with those of people who share the same tastes or information needs.After locating a possible match, the algorithm then generate the recommendations. Thepreference patterns can be directly elicited from the user. A telling example is the Amazonwebsite2 where customers are asked to rate an item on a scale from 1 to 5 stars. The pat-terns can also be inferred implicitly from user actions, such as purchases, reading time, ordownloads. After gathering the user opinions, either explicitly or implicitly, they are com-monly represented in a user-item ratings matrix, such as the ones shown in Figure 2.1. Themajority of the cells in these matrix are empty, because it is usually impossible for a user toselect, rate, or purchase all items in the system. CF algorithms operate on such a user-itemmatrix to predict values for the empty entries in the matrix.
u1
1
1 1
1
1 1
1
1
1
1
1
1
11
1
1
1 1 11
3 3
2
4 1
4
4
4
3
2
5
53
5
2
5 5 31
users
u6
itemsi i81itemsi i8
Explicitra+ngs Implicitra+ngs
Figure 2.1: Two examples of user-item matrices for a toy data set of six users and eightitems. Values in the matrix can be ratings in the case of explicit user opinions (left), orunary in the case of implicit user activity (right).
CF algorithms are commonly divided into two types, memory-based algorithms and model-based algorithms, analogous to the way machine learning algorithms can be categorized intotwo classes.
2http://www.amazon.com/

Chapter 2. Related Work 12
Memory-based Collaborative Filtering Memory-based algorithms are also known as lazyrecommendation algorithms, because they defer the actual computational effort of predict-ing a user’s interest in an item to the moment a user requests a set of recommendations. Thetraining phase of a memory-based algorithm consists of simply storing all the user ratingsinto memory. There are two variants of memory-based recommendation and both are basedon the k-Nearest Neighbor algorithm from the field of machine learning (Aha et al., 1991):user-based filtering and item-based filtering.
In user-based filtering, the active user is matched against the ratings matrix to find theneighboring users with which the active user has a history of agreeing. This is typicallydone using metrics such as Pearson’s correlation coefficient or the cosine similarity. Oncethis neighborhood has been identified, all items in the neighbors’ profiles unknown to theactive user are considered as possible recommendations and sorted by their frequency inthat neighborhood. A weighted aggregate of these frequencies is used to generate the rec-ommendations (Herlocker et al., 1999). Item-based filtering was proposed by Sarwar et al.(2001) and is the algorithm of choice of the online store Amazon (Linden et al., 2003). Itfocuses on finding the most similar items instead of the most similar users. As in user-basedfiltering, similarities between item pairs are calculated using Pearson’s correlation coeffi-cient or the cosine similarity (Breese et al., 1998). Items are considered to be similar whenthe same set of users has purchased them or rated them highly. For each item of an activeuser, the neighborhood of most similar items is identified. Each of the top k neighbors isplaced on a candidate list along with its similarity to the active user’s item. Similarity scoresof items occurring multiple times in the candidate list are added. The candidate list is sortedon these aggregated similarity scores and the top N recommendations are then presentedto the user (Sarwar et al., 2001; Karypis, 2001). We explain both algorithms in more detailin Section 4.3.
Model-based Collaborative Filtering Also known as eager recommendation algorithms,model-based CF algorithms do most of the hard work in the training phase, where theyconstruct a predictive model of the recommendation problem. Generating the recommen-dations is then a quick and straightforward matter of applying the derived model3. Manydifferent machine learning algorithms have been applied in recommender systems, such asNaive Bayes (Breese et al., 1998) and rule induction (Basu et al., 1998), with more em-phasis on latent factor models in the past decade. Latent factor models try to reduce thedimensionality of the space of user-item ratings by mapping users and items to the same la-tent factor space (Koren, 2008). The users and items are then related to each other throughthese latent factors. The factors can range in ease of interpretation from intuitive, suchas movie genres or ‘amount of plot twists’, to less well defined dimensions, such as ‘quirkycharacters’, or even completely uninterpretable dimensions of the user-item relation (Koren,2008). Examples of latent factor techniques applied to recommendation include SingularValue Decomposition (SVD) by Sarwar et al. (2002), factor analysis by Canny (2002), Prob-abilistic Latent Semantic Analysis (PLSA) by Hofmann (2004), and non-negative matrixfactorization by Koren (2008).
3Note that when the similarity computations are pre-computed in, for instance, a nightly cycle, the user-based and item-based filtering algorithms both turn into eager recommendation algorithms.

Chapter 2. Related Work 13
Advantages and Problems of Collaborative Filtering CF algorithms have several advan-tages, such as being able to take the quality of an item—or any lack thereof—into accountwhen recommending items, especially in the case of explicit user ratings. For instance, a lo-cal band might fall in the same musical genre as an internationally renowned rock band, butthis does not guarantee that they are of the same quality. This shows that recognizing thequality of items is clear advantage of CF. By taking actual user preferences into account, CFalgorithms can prevent poor recommendations. A second advantage is that CF algorithmsare especially useful in domains where content analysis is difficult or costly, such as movieand music recommendation, without requiring any domain knowledge (Burke, 2002).
While the quality of CF algorithms tends to improve over time, the biggest problem is thestartup phase of the recommender system, when there are already many items in the sys-tem, but few users and no ratings. This is commonly referred to as the cold-start problemand means the recommender system cannot generate any recommendations (Schein et al.,2002). Solutions to this problem include using other data sets to seed the system, and us-ing different recommendation algorithms in this startup phase that do not suffer from thisproblem. Even after acquiring more ratings from the users, sparsity of the user-item matrixcan still be a problem for CF. A second problem is what is referred to as the ‘gray sheep’problem according to Claypool et al. (1999), which describes the difficulty of recommend-ing for people who are not part of a clear group. Collaborative recommenders work best foruser who fit into a specific niche with many similar neighbors (Burke, 1999).
2.1.2 Content-based Filtering
Content-based recommendation algorithms, also known as content-based filtering, form thesecond popular class of algorithms. They can be seen as an extension of the work doneon information filtering (Hanani et al., 2001). Typically, content-based filtering approachesfocus on building some kind of representation of the content in a system and then learning aprofile of a user’s interests. The content representations are then matched against the user’sprofile to find the items that are most relevant to that user. As with CF, the representationsof the user profiles are long-term models, and updated as more preference informationbecomes available (Burke, 2002). Usually, content-based filtering for recommendation isapproached as either an IR problem, where document representations have to be matchedto user representations on textual similarity; or as a machine learning problem, where thetextual content of the representations are incorporated as feature vectors, which are used totrain a prediction algorithm. Examples of the IR approach include Whitman and Lawrence(2002) and Bogers and Van den Bosch (2007); examples of the machine learning point ofview include Lang (1995) and Mooney and Roy (2000). In Chapter 5 we propose differentcontent-based recommendation algorithms to incorporate the metadata present in socialbookmarking systems, so we refer to Section 5.4 for a more extensive discussion of relatedwork in content-based filtering.
Advantages and Problems of Content-based Filtering A clear advantage of content-based filtering algorithms is that they do not require domain knowledge, and that it is suffi-cient to collect implicit feedback from the users about their item preferences. This can make

Chapter 2. Related Work 14
content-based filtering the preferred algorithm in domains where eliciting explicit ratingsfrom users is difficult or cumbersome, and where domain knowledge is hard to come by. Asecond advantage is that content-based filtering algorithms are better at finding topicallysimilar items than CF algorithms because of their explicit focus on textual similarity. How-ever, this can be a disadvantage in domains where content analysis is difficult or impracticalto do in large numbers, such as movies and music. Content-based filtering algorithms alsotend to get stuck in a ‘well of similarity’ (Rashid et al., 2002), where they can only recom-mend items from a narrow topic range; serendipitous recommendations can therefore behard to achieve.
2.1.3 Knowledge-based Recommendation
All personalized recommendation algorithms attempt to infer which items a user mightlike. Collaborative filtering algorithms do this based on the behavior of the user and otherlike-minded users, whereas content-based filtering approaches do this based on the textualrepresentations of the user’s interests and the available items. A third class of recommenda-tion algorithms is formed by knowledge-based algorithms. They use rules and patterns, andrecommend items based on functional knowledge of how a specific item meets a particularuser need (Burke, 2002). Such techniques allow the algorithm to reason about the relation-ship between a user and the available items. This can prevent a recommender system fromgenerating useless recommendations. An example of such a useless recommendation wouldbe recommending milk to a supermarket shopper: the odds of buying milk are so high thatmilk will always be correlated with everything else in a user’s shopping basket, and thusalways recommended to the user. Because a knowledge-based recommender system knowswhat foods ought to go together, it can screen out such useless suggestions (Burke, 1999).
Knowledge-based recommender systems often borrow techniques from the field of case-based reasoning (CBR), which is useful for solving constraint-based problems such as the‘milk’ problem. In CBR, users can specify content-based attributes which limit the returnedrecommendation set. Old problem-solving cases are stored by the CBR system, and newsituations are then compared against these old cases with the most similar cases beingused for solving the new problem (Burke, 1999; McNee, 2006). Recommender systemsusing such techniques support rating items on multiple dimensions. An example is theENTREE restaurant recommender system developed by Burke et al. (1997). ENTREE allowsrestaurants to be rated on price, food quality, atmosphere, service, and other dimensions.
Advantages and Problems of Knowledge-based Recommendation Rating content onmultiple dimensions allows the user to provide a rich specification of his recommendationneed, which in turn results in more satisfying recommendations. An second advantage ofknowledge-based recommendation is that it does not suffer from the cold start problem,and that it allows for intuitive explanations of why a certain item, such as a restaurant,was recommended. In addition to the ENTREE recommender system, other examples ofknowledge-based recommender systems are given by Schmitt and Bergmann (1999), Towleand Quinn (2000), and Van Setten et al. (2004). The biggest problem of knowledge-basedalgorithms is the need for an explicit knowledge acquisition phase (Burke, 2002), which is

Chapter 2. Related Work 15
difficult in domains without a rich set of attributes. As a result, knowledge-based recom-mendation is not as popular as the other two classes of algorithms. We do not considerknowledge-based algorithms for our recommendation experiments because we would runinto this knowledge acquisition bottleneck when porting our algorithms from one domain toanother. Instead, we take a data-driven approach and restrict ourselves to CF and content-based filtering in Chapters 4 and 5 because they match the two characteristic informationsources available on social bookmarking services: the folksonomy and metadata.
2.1.4 Recommending Bookmarks & References
In this thesis, we focus on recommendation for social bookmarking websites covering twodifferent domains: Web pages and scientific articles. While there is little related workon item recommendation for social bookmarking, there have been plenty of stand-aloneapproaches to recommending Web pages and scientific articles. Most of these are focusedaround the concept of an Information Management Assistant (or IMA), that locates andrecommends relevant information for the user by inferring a model of the user’s interests(Budzik and Hammond, 1999). One of the earliest examples of such a personal informationagent was the Memex system envisioned by Vannevar Bush, which was a “device in whichan individual stores all his books, records, and communications” and offered the possibilityof associative links between information, although it lacked automatic suggestion of relatedinformation (Bush, 1945).
The first real IMAs started appearing in the 1990s and mostly focused on tracking the user’sbrowsing behavior to automatically recommend interesting, new Web pages. LETIZIA wasamong the first of such pro-active IMAs (Lieberman, 1995), and used a breadth-first searchstrategy to follow, evaluate, and recommend outgoing links from pages in which the userpreviously showed an interest. In an IMA scenario, strong user interest in a page is typicallyinferred using heuristics such as a long dwell time on the page, revisiting it several times, orsaving or printing the page. Many other IMAs for recommending Web pages have been pro-posed since then, among which the SYSKILL & WEBERT agent by Pazzani et al. (1996), whichallowed users to rate Web pages they visited. It extracted the key terms from those favoriteWeb pages, and used those to generate queries to be sent to search engines. The searchresults were then presented to the user as recommendations. Other examples of IMAs thatsupport Web browsing include LIRA by Balabanovic (1998), WEBWATCHER by Joachims et al.(1997), WEBMATE by Chen and Sycara (1998), and the work by Chirita et al. (2006). TheGIVEALINK system by Stoilova et al. (2005) is also worth mentioning because of its similarityto social bookmarking: GIVEALINK4 is a website that asks users to donate their bookmarksfiles, effectively creating a social bookmarking website. There are some differences withsocial bookmarking as we describe it in Section 2.3 though: a user’s bookmark profile inGIVEALINK is static; a user can only update their bookmarks by re-uploading the entirebookmarks file. Also, GIVEALINK does not support tagging of bookmarks. The bookmarksdonated by users are used in tasks such as (personalized) search and recommendation.
4http://www.givealink.org/

Chapter 2. Related Work 16
In addition to Web browsing, IMAs have also been used to support other information-relatedactivities such as writing research papers. Budzik and Hammond (1999) designed an IMAcalled WATSON that observed user interaction with a small range of everyday applications(e.g., Netscape Navigator, Microsoft Internet Explorer, and Microsoft Word). They con-structed queries based on keywords extracted from the documents or Web pages beingviewed or edited by the user and sent those queries to the search engines. They report thata user study showed that 80% of the participants received at least one relevant recommen-dation. The STUFF I’VE SEEN system designed by Dumais et al. (2003) performed a similarfunction, but was specifically geared towards re-finding documents or Web pages the userhad seen before. Certain IMAs focus particularly on acting as a writing assistant that lo-cates relevant references, such as the REMEMBRANCE AGENT by Rhodes and Maes (2000), thePIRA system by Gruzd and Twidale (2006), and the À PROPOS project by Puerta Melguizoet al. (2008). Finally, the well-known CITESEER5 system originally also offered personalizedreference recommendations by tracking the user’s interests using both content-based andcitation-based features (Bollacker et al., 2000).
Significant work on recommending references for research papers has also been done byMcNee (2006), who approached it as a separate recommendation task, and compared dif-ferent classes of recommendation algorithms both through system-based evaluation anduser studies. In McNee et al. (2002), five different CF algorithms were compared on thetask of recommending research papers, with the citation graph between papers serving asthe matrix of ratings commonly used for CF. Here, the citation lists were taken from eachpaper and the cited papers were represented as the ‘items’ for the citing paper. The citingpaper itself was represented as the ‘user’ in the matrix6. Citing papers could also be in-cluded as items if they are cited themselves. McNee et al. (2002) compared two user-basedand item-based filtering algorithms with a Naive Bayes classifier and two graph-based al-gorithms. The first graph-based algorithm ranked items on the number of co-citations withthe citations referenced by a ‘user’ paper; the other considered all papers two steps awayin the citation graph and ranked them on tf·idf-weighted term overlap between the papertitles. They used 10-fold cross-validation to evaluate their algorithms using a rank-basedmetric and found that user-based and item-based filtering performed best. In a subsequentuser study, these algorithms were also the best performers because they generated the mostnovel and most relevant recommendations. A similar, smaller approach to using the citationgraph was done by Strohman et al. (2007), who only performed a system-based evaluation.In later work, McNee et al. (2006) compared user-based filtering, a standard content-basedfiltering using tf·idf-weighting, and Naive Bayes with a Probabilistic Latent Semantic Anal-ysis algorithm. They defined four different reference recommendation subtasks: (1) fillingout reference lists, (2) maintaining awareness of a research field, (3) exploring a researchinterest, and (4) finding a starting point for research (McNee et al., 2006). They evaluatedthe performance of their algorithms on these four tasks and found that user-based filteringperformed best, with the content-based filtering a close second. In addition, they found thatcertain algorithms are better suited for different tasks.
5http://citeseer.ist.psu.edu/6By using the citation web in this way, and not representing real users as the the users in the ratings matrix
they were able to circumvent the cold start problem. This problem is much less pronounced when recommend-ing for social bookmarking websites because users have already implicitly rated many items by adding them totheir personal profiles.

Chapter 2. Related Work 17
Routing and Assigning Paper for Reviewing A task related to recommending referencesis routing and assigning papers to program committee members for review. Papers are nor-mally assigned manually to reviewers based on expertise area keywords that they enteredor knowledge of their expertise of other committee members. Dumais and Nielsen (1992)were among the first to investigate an automatic solution to this problem of paper assign-ment. They acquired textual representations of the submitted papers in the form of titlesand abstracts, and used Latent Semantic Indexing, a dimensionality reduction technique, tomatch these against representations of the reviewers’ expertise as supplied by the reviewersin the form of past paper abstracts. With their work, Dumais and Nielsen (1992) showedit was possible to automate the task acceptably. Later approaches include Yarowsky andFlorian (1999), Basu et al. (2001), Ferilli et al. (2006), and Biswas and Hasan (2007). Allof them use the sets of papers written by the individual reviewers as content-based expertiseevidence for those reviewers to match them to submitted papers using a variety of differ-ent algorithms. The most extensive work was done by Yarowsky and Florian (1999), whoperformed their experiments on the papers submitted to the ACL ’99 conference. They com-pared both content-based and citation-based evidence for allocating reviewers and foundthat combining both types resulted in the best performance. However, most of the workdone in this subfield is characterized by the small size of their data sets; we refer the readerto the references given for more information.
2.1.5 Recommendation in Context
Historically, researchers have focused on building ‘more accurate’ recommender systems,and have equated this with ‘better liked’ and ‘more useful’ without involving the users inthis process (McNee, 2006). Indeed, the majority of the related work described so far has fo-cused on experimental validation in a laboratory setting, with only a handful of small-scaleuser studies. We stated in the previous chapter that we also take a system-based approachto evaluation, and we will describe our reasons in more detail in Subsection 3.4.3. In thecurrent section, we give a short overview of the most important work on how to involvethe user in the recommendation process. It is important to establish that user satisfactionis influenced by more than just recommendation accuracy. This was signaled by, amongothers, Herlocker et al. (2004) and Adomavicius and Tuzhilin (2005). For instance, while agood recommendation algorithm can produce personalized recommendations for each user,the type of personalization applied by an algorithm is exactly the same across all users. Thisis not beneficial to user satisfaction because not every user request for recommendations ismade in the same context. Different contexts can call for different types of personalizationand recommendation. Depending on the situation, a user might want to fulfill quite differ-ent tasks using a recommender system, and some established algorithms have been shownto be more appropriate for certain tasks than others (McNee et al., 2006). For instance, inresearch paper recommendation filling out a reference list is rather different from the desireto maintain awareness of a research field, requiring different recommendation algorithms.In addition, the user’s interaction with the system and satisfaction with the results dependon a variety of contextual factors such as the user’s intentions, his emotional state, and theuser’ confidence in the system (McNee, 2006).

Chapter 2. Related Work 18
Context in Information Seeking and Retrieval The observation is also valid in the fieldsof information seeking and retrieval, where the search process is similarly influenced bythe context of the user. The relevance of the same set of returned results for two identicalqueries can easily differ between search sessions because of this. In the field of informationseeking, a number of frameworks for understanding user needs and their context have beendeveloped. Many different theories have been proposed over the years, such as the fourstages of information need by Taylor (1968), the theory of sense-making by Dervin (1992),the information foraging theory by Pirolli and Card (1995), and the cognitive theory ofinformation seeking and retrieval by Ingwersen and Järvelin (2005). Common to all ofthese theories is the importance of understanding the user’s information context to increasethe relevance of the results (McNee, 2006). In this section, we zoom in on the cognitivetheory of information seeking and retrieval (IS&R) by Ingwersen and Järvelin (2005), anddescribe it in the context of recommender systems. In this theory, the context of an IS&Rprocess is represented as a nested model of seven different contextual layers, as visualizedin Figure 2.2.
(3)sessioncontext
signs
(1)intra‐objectcontext
(2)inter‐objectcontext
(7)historiccontexts
(6)techno‐economicandsocietalcontexts
(4)individual
(4‐5)social,systemic,conceptual,emoBonalcontexts
(5)collecBve
Figure 2.2: A nested model of seven contextual layers for information seeking and retrieval(Ingwersen and Järvelin, 2005). Revised version adopted from Ingwersen (2006).
This model allows us to classify different aspects of the recommendation process into dif-ferent types of context. All of these seven contextual layers affect users in their interactionwith recommender systems. Below we list the seven relevant contextual layers and givepractical examples of how they could be quantified for use in experiments.
(1) Intra-object context For recommendation, the intra-object context is the item itselfand its intrinsic properties. It can cover a wide range of metadata, depending on thetype of item, such as title, author, publication venue, musical genre, director, cast, etc.In case of items with textual content, such as research papers or Web pages, it couldalso include the structures within the text. However, the structure of multimedia itemssuch as movies or music is more difficult to quantify.

Chapter 2. Related Work 19
(2) Inter-object context includes the relations between items, such as citations or linksbetween authors and documents in case of research papers. External metadata suchas movie keywords, assigned index terms, and tags can also link documents together,as well as playlist structures that group together a set of songs.
(3) Session context involves the user-recommender interaction process and would involvereal user tests or simulations of interactions. Observing system usage patterns, such asprinting or reading time, would also be context in the case of recommending throughIMAs.
(4) Individual social, systemic, conceptual, and emotional contexts If items are linkedvia a folksonomy, then this could serve as a possible source of social, conceptual, andeven emotional context to the different documents. Rating behavior, combined withtemporal information can also serve to predict, for instance, emotional context.
(5) Collective social, systemic, conceptual, and emotional contexts An important con-textual social aspect of recommending items is finding groups of like-minded usersand similar items that have historically shown the same behavior to generate newrecommendations. Again, the folksonomy could provide aggregated social, concep-tual, and even emotional context to the different documents.
(6) Techno-economic and societal contexts This more global form of context influencesall other lower tiers, but is hard to capture and quantify, as it is for IS&R.
(7) Historical contexts Across the other contextual layers there operates a historical con-text that influences the recommendations. Activity logs of recommender systemswould be a appropriate way of capturing such context, possibly allowing for replayingpast recommender interaction.
Human-Recommender Interaction Neither the cognitive theory of IS&R nor the otherthree theories of information seeking we mentioned earlier in this section were originallydeveloped for recommender systems. This means these theories are therefore not fully ap-plicable to the field of recommender systems. McNee (2006) was the first to recognize thislack of a user-centered, cognitive framework for recommendation and proposed a descrip-tive theory of Human-Recommender Interaction (HRI). This singular focus on recommendersystems is a major advantage of HRI theory, although it has only been applied and verifiedexperimentally on one occasion.
HRI theory is meant as a common language for all stakeholders involved in the recom-mendation process—users, designers, store owners, marketeers—to use for describing theimportant elements of interaction with recommender systems (McNee, 2006). These ele-ments are grouped into three main pillars of HRI: (1) the recommendation dialogue, (2) therecommendation personality, and (3) the end user’s information seeking tasks. Each of thesethree pillars is divided up into so-called aspects, which refer to the individual elements ofHRI. In its current form as defined by McNee (2006), HRI theory contains a total of 21aspects. Figure 2.3 shows these 21 of HRI aspects and the three pillars they are groupedunder.

Chapter 2. Related Work 20
Recommenda)onDialogue
Correctness
Transparancy
Saliency
Serendipity
Quan3ty
Usefulness
Spread
Usability
Recommenda)onPersonality
Personaliza3on
Boldness
Adaptability
Risktaking/aversion
Affirma3on
Pigeonholing
FreshnessTrust/Firstimpressions
EndUser'sInforma)onSeekingTask
Expecta3onsofrecommenderusefulness
Recommenderimportanceinmee3ngneed
Recommenderappropriateness
Concretenessoftask
Taskcompromising
Figure 2.3: A visualization of the theory of Human-Recommender Interaction by McNee(2006). HRI theory consists of 21 interaction aspects, organized into three pillars. Figuretaken from McNee (2006).
The aspects can be seen as the ‘words’ of the shared language that the stakeholders can useto communicate about interaction with recommender system. HRI theory states that eachaspect can have both a system-centered and a user-centered perspective. This means that formost aspects it is possible to devise a metric that allows the system designer to measure theobjective performance of the system on that interaction aspect. The user’s perception of howwell the recommender system performs on this aspect does not necessarily have to matchthe outcome of these metrics however. Both perspectives are seen as equally important inHRI theory.
We will briefly describe each of the three pillars and give a few examples of aspects belongto those pillars. We refer to McNee (2006) for a more detailed description of all aspectsand the three pillars. The first pillar, recommendation dialogue, deals with the immediateinteraction between the user and the recommendation algorithm, which is cyclical in nature.An example aspect here is transparency, which means that the user should understand (at ahigh level) where a recommendation is coming from, for instance, in terms of how an itemis similar to items that the user has rated before. Greater transparency has been shown tolead to higher acceptance of a recommender system (Herlocker et al., 2000; Tintarev andMasthoff, 2006).
The second pillar of HRI is the recommendation personality, which covers the overall im-pression that a user constructs of a recommender system over time. Recommender systemsare meant to ‘get to know the user’, which means users can start attributing personalitycharacteristics to the system. An negative example of a personality-related aspect is pigeon-holing, where a user receives a large number of similar recommendations in a short time,which could change the user’s perception for the worse. The item-based CF algorithm,for instance, has shown an aptitude for getting stuck in ‘similarity wells’ of similar items(Rashid et al., 2002). Trust is another important aspect, and is related to the “Don’t lookstupid” principle formulated by McNee et al. (2006). It states that even a single nonsenserecommendation can cause the user to lose confidence in the recommender system, even ifthe other recommendations are relevant.
The last HRI pillar focuses on the end user’s information seeking task and the match withthe recommendation algorithm. An example is recommender appropriateness: not every

Chapter 2. Related Work 21
recommendation algorithm is suited to each information seeking task, as we argued before.Music recommendation depends largely on the user’s personal taste, but more complicatedtasks could require more complicated external criteria which might be better served bydifferent algorithms (McNee, 2006).
2.2 Social Tagging
Under the Web 2.0 label, the past decade has seen a proliferation of social websites focusingon facilitating communication, user-centered design, information sharing and collaboration.Examples of successful and popular social websites include wikis, social networking services,blogs, and websites that support content sharing, such as social bookmarking. An importantcomponent of many of these services is social tagging; giving the users the power to describeand categorize content for their own purposes using tags. Tags are keywords that describecharacteristics of the object they are applied to, and can be made up of one or more words.Tags are not imposed upon users in a top-down fashion by making users choose only from apre-determined set of terms; instead, users are free to apply any type and any number of tagsto an object, resulting in true bottom-up classification. Users cannot make wrong choiceswhen deciding to apply certain tags, since their main motivation is to tag for their ownbenefit: making it easier to manage their content and re-find specific items in the future.Many other names have been proposed for social tagging, including collaborative tagging,folk classification, ethno-classification, distributed classification, social classification, opentagging, and free tagging (Mathes, 2004; Hammond et al., 2005). We use the term socialtagging because it is common in the literature, and because it involves the activity of labelingobjects on social websites. We do see a difference between collaborative tagging and socialtagging, and explain this in more detail in Subsection 2.2.2. Although there is no inherentgrouping or hierarchy in the tags assigned by users, some researchers have classified tagsinto different categories. A popular classification is that by Golder and Huberman (2006),who divide tags into seven categories based on the function they perform. Table 2.1 lists theseven categories. The first four categories are extrinsic to the tagger and describe the actualitem they annotate with significant overlap between individual users. The bottom threecategories are user-intrinsic: the information they provide is relative to the user (Golderand Huberman, 2006).
The foundations for social tagging can be said to have been laid by Goldberg et al. (1992)in their TAPESTRY system, which allowed users to annotate documents and e-mail messages.These annotations could range from short keywords to longer textual descriptions, andcould be shared among users. The use of social tagging as we know it now was pioneeredby Joshua Schachter when he created the social bookmarking site Delicious in Septem-ber 2003 (Mathes, 2004). Other social websites, such as the photo sharing website Flickr,adopted social tagging soon afterwards7. Nowadays, most social content sharing websitessupport tagging in one way or another. Social tagging has been applied to many differ-ent domains, such as bookmarks (http://www.delicious.com), photos (http://www.
7Although Delicious were the first to popularize the use of social tagging to describe content, there are earlierexamples of websites that allowed user-generated annotation of content. See Section 2.3 for some examples.

Chapter 2. Related Work 22
Table 2.1: A tag categorization scheme according tag function, taken directly from Golderand Huberman (2006). The first four categories are extrinsic to the tagger; the bottomthree categories are user-intrinsic.
Function Description
Aboutness Aboutness tags identify the topic of an item, and often includecommon and proper nouns. An example could be the tags crisisand bailout for an article about the current economic crisis.
Resource type This type of tag identifies what kind of object an item is. Exam-ples include recipe, book, and blog.
Ownership Ownership tags identify who owns or created the item. An ex-ample would be the tags golder or huberman for the article byGolder and Huberman (2006).
Refining categories Golder and Huberman (2006) argue that some tags do not standalone, but refine existing categories. Examples include yearsand numbers such as 2009 or 25.
Qualities/characteristics Certain tags represent characteristics of the bookmarked items,such as funny, inspirational, or boring.
Self-reference Self-referential tags identify content in terms of its relation tothe tagger, such as myown or mycomments.
Task organizing Items can also be tagged according to tasks they are related to.Popular examples are toread and jobsearch.
flickr.com), videos (http://www.youtube.com), books (http://www.librarything.com), scientific articles (http://www.citeulike.org), movies (http://www.movielens.org), music (http://www.last.fm/), slides (http://www.slideshare.net/), news arti-cles (http://slashdot.org/), museum collections (http://www.steve.museum/), activ-ities (http://www.43things.com), people (http://www.consumating.com), blogs (http://www.technorati.com), and in enterprise settings (Farrell and Lau, 2006).
Early research into social tagging focused on comparing tagging to the traditional methodsof cataloguing by library and information science professionals. We discuss these compar-isons in Subsection 2.2.1, and describe under what conditions social tagging and other cat-aloging methods are the best choice. Then, in Subsection 2.2.2, we distinguish two types ofsocial tagging that result from the way social tagging is typically implemented on websites.These choices can have an influence on the network structure of users, items, and tags thatemerges, and thereby on recommendation algorithms. We complete the current section inSubsection 2.2.3 by providing some insight into the use of a social graph for representingsocial tagging.
2.2.1 Indexing vs. Tagging
Early academic work on social tagging focused mostly on the contrast between social tag-ging and other subject indexing schemes, i.e., describing a resource by index terms to in-dicate what the resource is about. Mathes (2004) distinguishes between three differentgroups that can be involved in this process: intermediaries, creators, and users. Intermedi-ary indexing by professionals has been an integral part of the field of library and informationscience since its inception. It is aimed at classifying and indexing resources by using the-sauri or hierarchical classification systems. By using such controlled vocabularies—sets of

Chapter 2. Related Work 23
pre-determined, allowed descriptive terms—indexers can first control for ambiguity by se-lecting which terms are the preferred ones and are appropriate to the context of the intendeduser, and then link synonyms to their favored variants (cf. Kipp (2006)). According to Lan-caster (2003), indexing typically involves two steps: conceptual analysis and translation.The conceptual analysis stage is concerned with determining the topic of a resource andwhich parts are relevant to the intended users. In the translation phase, the results of theconceptual analysis are then translated into selecting the appropriate index terms, whichcan be difficult to do consistently, even between professional indexers (Lancaster, 2003;Voß, 2007). Another problem of intermediary indexing is scalability: the explosive growthof content means it is intractable for the relatively small group of professional indexers todescribe all content.
Index terms and keywords can also be assigned by the creators of a resource. This is com-mon practice in the world of scientific publishing, and popular initiatives, such as the DublinCore Metadata Initiative8, have also been used with some success (Mathes, 2004). In gen-eral, however, creator indexing has not received much attention (Kipp, 2006). By shiftingthe annotation burden away from professional indexers to the resource creators themselves,scalability problems can be reduced, but the lack of communication between creators of dif-ferent resources makes it more difficult to select consistent index terms. A second problemis that the amount and quality of creator-supplied keywords is highly dependent on the do-main. For instance, Web pages have been shown to lack useful metadata on many occasions(Hawking and Zobel, 2007) in the context of supporting retrieval. With social tagging theresponsibility of describing resources is placed on the shoulders of the users. This increasesscalability even further over creator indexing, as each user is made responsible for describ-ing his own resources. It also ensures that the keywords assigned to resources by a user aredirectly relevant to that user.
One of the key differences between the three different indexing schemes is the level of co-ordination between the people doing the indexing, i.e., what terms are allowed for describ-ing resources. Intermediary indexing requires the highest degree of coordination, whereassocial tagging requires no explicit coordination between users. The level of coordinationrequired for creator indexing lies somewhere in between. These differences in coordinationwere confirmed by Kipp (2006), who investigated the distribution of index terms and tagsfor the three different indexing methods. For a small collection of scientific articles, Kipp(2006) compared tags, author-assigned keywords, and index terms assigned by professionalindexers. She showed that the distribution of terms of the latter two indexing approacheswas different from the tag distribution, which showed a considerably longer tail of tags thatwere assigned only once. The larger variety of tags is a direct results of the lower level of co-ordination. Her findings hinted at the presence of a power law in the tag distribution, whichwas later confirmed by, among others, Shen and Wu (2005) and Catutto et al. (2007).
It is important to remark that, despite its growing popularity, social tagging is not neces-sarily the most appropriate method of describing resources in every situation. In certainsituations, indexing by intermediaries is still the preferred approach according to Shirky(2005). Such situations are characterized by a small, stable collection of objects with clear,
8http://dublincore.org/

Chapter 2. Related Work 24
formal categories. The cataloguers themselves have to be experts on the subject matter, butusers have to be experts in using the classification system as well. Examples of such collec-tions include library collections or the periodic table of elements. In contrast, social taggingworks best for large, dynamic, heterogeneous corpora where users cannot be expected togain expertise in a coordinated classification scheme (Shirky, 2005). The World Wide Webis a good example of such a scenario with billions of Web pages that vary wildly in topic andquality.
2.2.2 Broad vs. Narrow Folksonomies
The aggregation of the tagging efforts of all users is commonly referred to as a folksonomy,a portmanteau of ‘folk’ and ‘taxonomy’, implying a classification scheme made by a groupof users. Like the hierarchical classification schemes designed by professional indexers toorganize knowledge, a folksonomy allows any user to navigate freely between items, tags,and other users. The term was coined by Vander Wal (2005b), who defines a folksonomyas the result of “personal free tagging of information and objects (anything with a URL) forone’s own retrieval”. Different variations on this definition have been proposed in the past.In some definitions, only tags that are assigned by a user for his own benefit as consideredto be a part of the folksonomy. Consequently, tagging for the benefit of others is excludedfrom the folksonomy according to this definition (Lawley, 2006). We refer the reader toChopin (2007) for an extensive overview and discussion of the different definitions. Forthe recommendation experiments described in this thesis, we do not take into account thedifferent motivations that users might have when tagging items. We define a folksonomyas “an aggregated network of users, items, and tags from a single system supporting socialtagging”. Vander Wal (2005a) distinguishes between two types of folksonomies, depend-ing on how social tagging is implemented on the website: broad folksonomies and narrowfolksonomies. Figure 2.4 illustrates these two types of folksonomies.
The essential difference between a broad and a narrow folksonomy is who is allowed totag a resource: every user interested in the resource, or only the creator of the resource.This dichotomy is caused by the nature of the resources being tagged in the system. Broadfolksonomies emerge in social tagging scenarios where the resources being tagged are pub-licly available, and were not necessarily created by the people who tagged and added them.A good example are Web page bookmarks: any user can bookmark a Web page and manypages will be useful to more than one user. More often than not, the bookmarked Webpages were not created by the user who added them to his profile. This means that inter-ested users will add their own version of the bookmarked URL with their own metadataand tags. Figure 2.4(a) illustrates this case for a single example resource. The ‘initiator’,the first user to add the resource to the system, has tagged the resource with tags A and Cwhen he added it to the system. Users in group 1 added the post with tags A and B, group 2with tags A and C, and group 3 with tags C and D. Notice that tags B and D were not addedby the original creator, although it is possible that the initiator later retrieves the resourcewith tag D. The two users in group 4 never add the resource, but find it using tags B andD later. Figure 2.4(a) illustrates the collaborative nature of tagging the resource: a tag can

Chapter 2. Related Work 25
TAGS
RESOURCE
INITIATOR
A
B
D
1
2
3
4
C
(a) Broad folksonomy
TAGS
RESOURCE
CREATOR
A
B
C
1
2
3
4
(b) Narrow folksonomy
Figure 2.4: Two types of folksonomies: broad and narrow. The figure is slightly adaptedfrom Vander Wal (2005a). The four user groups on the right side of each figure denotegroups of users that share the same vocabulary. An arrow pointing from a user (group)to a tag means that the tag was added by that user (group). An arrow pointing from atag to a user (group) means that the tag is part of the vocabulary of that user (group) forretrieving the resource. The creator/initiator is the user who was the first to create or addthe resource to the system.
be applied multiple times to the same resource. This is why we refer to this scenario ascollaborative tagging.
In contrast, a narrow folksonomy, as illustrated in Figure 2.4(b), emerges when only thecreator of a resource can tag the item. For example, in the case of the video sharing websiteYouTube, a user can create a video and upload it to the website. This user is the originalcreator of the video and adds tags A, B, and C to the video to describe it after uploading. Asa consequence, each tag is applied only once to a specific resource in a narrow folksonomy.We therefore refer to this scenario as individual tagging. All other users are dependent onthe creator’s vocabulary in a narrow folksonomy: users in group 1 can use tag A to locatethe resource, users in group 2 may use tags A and B, and group 4 users may use tag C. User3, however, cannot find the resource because his vocabulary does not overlap with that ofthe creator. In this thesis we look at recommendation of bookmarks and scientific articles.These items are typically added and tagged by many different users, and result in broadfolksonomies. We do not focus on recommendation for individual tagging systems, only forcollaborative tagging.
2.2.3 The Social Graph
Figure 2.4 illustrates the concept of a folksonomy for a single item, but this mini-scenariooccurs for many different items on websites that support social tagging. With its myriad ofconnections between users, items, and tags, a folksonomy is most commonly representedas a undirected tripartite graph. Mika (2005) and Lambiotte and Ausloos (2006) were thefirst to do so. Figure 2.5 illustrates such a social graph.

Chapter 2. Related Work 26
ITEM
USER
TAG
Figure 2.5: Visualization of the social graph as an undirected tripartite graph of users,items, and tags.
We take the tripartite graph as the basis for our experiments in Chapter 4. It is importantto note, however, that the three different types of nodes in the graph—users, items, andtags—do not all have the same roles. Users are active participants in the graph: they additems and label them with tags. Items and tags are passive nodes and can be seen as contentbearers. A fitting metaphor here is that of the user as a predator, snaring items as his preyusing tags. This implies that is possible to represent the folksonomy in a different type ofgraph representation with directed edges, although we do not consider this in the thesis dueto temporal restrictions.
2.3 Social Bookmarking
As mentioned earlier, the Web 2.0 phenomenon caused a shift in information access andcreation from local and solitary, to global and collaborative. Social bookmarking websitesare a prime example of this: instead of keeping a local copy of pointers to favorite Webpages, users can instead store and access their bookmarks online through a Web interfaceon a remote Web server, accessible from anywhere. The underlying application then makesall stored information shareable among users. In addition to this functionality, most socialbookmarking services also enable social tagging for their users, in addition to standardmetadata such as the title and a brief description of the bookmarked Web page.
The current generation of social bookmarking websites is not the first. One of the originalonline bookmarking services was the now defunct itList, which was originally created inApril 1996 (De Nie, 1999). It allowed users to store and organize their bookmarks onlineand, if they chose to do so, share them with other users. itList also enabled users to sort theirbookmarks using a variety of categories, although it did not allow for free categorization. Inthe years that followed, several competing services were launched, such as Backflip, Blink,ClickMarks, and HotLink, each attempting to offer unique features to attract users (Lawlor,

Chapter 2. Related Work 27
2000). For instance, ClickMarks offered automatic categorization to sort bookmarks intofolders. None of these services survived the bursting of the ‘dot-com’ bubble. The sec-ond wave of social bookmarking services started in September 2003 with the creation ofDelicious by Joshua Schachter (Mathes, 2004). The instant popularity of Delicious led tothe launch of many other Web 2.0-style social bookmarking services, such as Diigo, Simpy,Ma.gnolia and Mister Wong9. The main differences between the two waves of social book-marking services are a stronger emphasis on sharing one’s bookmarks with other users. andthe addition of social tagging, as pioneered by Delicious. Some social bookmarking services,however, only allow users to share bookmarks without any support for social tagging, suchas the GiveALink service (Stoilova et al., 2005) and StumbleUpon10.
Below we describe domains fit for social bookmarking (Subsection 2.3.1), and how userscommonly interact with a social bookmarking system (Subsection 2.3.2). We conclude thesection and this chapter in Subsection 2.3.3 by giving an overview of the three researchtasks that have received the majority of the attention in the related work.
2.3.1 Domains
So far we have defined social bookmarking services as websites that focus on the book-marking of Web pages. In addition to Web bookmarks, there are three other domains forsocial ‘storage’ services that are worth mentioning. We already mentioned that some so-cial bookmarking websites operate in the domain of scientific articles and research papers.These services are known as social reference managers or social citation managers. They al-low users to store, organize, describe, and manage their collection of scientific references.Although more general-purpose websites like Delicious could conceivably be used for thisas well, social reference managers offer specialized features, such as article-specific meta-data, creating reading lists, reading priorities, and export facilities for different formatssuch as BibTeX, RIS, and EndNote. Examples of social reference managers include CiteUlike(http://www.citeulike.org/), Connotea (http://www.connotea.org/), BibSonomy(http://www.bibsonomy.org), and refbase (http://www.refbase.org/), the first threeof which all support collaborative tagging.
Next to the domains mentioned above, a fourth third domain for social information storageand management is books. Social cataloging services allow users to store, describe, andmanage books that they own or have read. Typically, social cataloging services allow usersto rate books, and to tag and review them for their own benefit and the benefit of otherusers. They typically also use identifiers such as ISBN or ISSN numbers to automaticallyretrieve the book metadata from centralized repositories such as the Library of Congressor Amazon. Examples include LibraryThing (http://www.librarything.com/), Shelfari(http://www.shelfari.com/), aNobii (http://www.anobii.com/), GoodReads (http://www.goodreads.com/), and WeRead (http://weread.com/). The first three supportcollaborative tagging.
9We refer the reader to http://en.wikipedia.org/wiki/List_of_social_bookmarking_websites foran up-to-date list of social bookmarking services.
10http://www.stumbleupon.com/

Chapter 2. Related Work 28
The fourth example of collaborative information sharing services are formed by the so-calledsocial news websites, that allow users to share and discover any kind of online content, butwith an emphasis on online news articles. After a link or news story has been submitted, allwebsite users get to vote and comment on the submissions, and stories are ranked on thesereactions. Only stories with the most votes appear on the front page. The most popularsocial news websites are Digg (http://www.digg.com/), Reddit (http://www.reddit.com/), Fark (http://www.fark.com/), and Mixx (http://www.mixx.com/).
2.3.2 Interacting with Social Bookmarking Websites
How can users typically interact with a social bookmarking website? Because of the public,shared nature of Web pages, social bookmarking websites allow for collaborative tagging.The broad folksonomy that emerges from this results in a rich network of connections be-tween users, items, and tags, which is reflected in the navigational structure. Figure 2.6shows the typical navigating and browsing structure of a social bookmarking website; wetake the popular service Delicious as our example.
The personal profile page is the starting point for every user (top left in Figure 2.6). It liststhe assigned tags and metadata for every bookmark that a user has added. In addition,each item and tag on the page is linked to a separate page that chronologically show theactivity of those tags and items. For a selected tag, clicking on it leads the user to a page thatshows all other items in the system that have been annotated with that tag (bottom left).The popularity of the bookmarked item on Delicious is shown for each post. When a userclicks on this, they are forwarded to the item’s history page (bottom right), which show allother users who have added the selected item. For each post of that item, it also lists whattags and metadata were assigned to it by which other user. Another typical feature of socialbookmarking—and websites supporting social tagging in general—is a visual representationof all of a user’s tags, known as a tag cloud (top right). In a tag cloud, tags are sortedalphabetically and the popularity of a tag (or rather usage intensity) is denoted by varyingthe markup of the link: larger font sizes and/or darker font colors tend to denote morepopular tags.
Some social bookmarking websites offer extra features on top of this: Diigo11, for instance,also allows its users to highlight the Web pages they bookmark and add notes to them,which are stored in the system and overlaid on the bookmarked Web pages when the userrevisits them. Faves12 is unique in being the only social bookmarking website to allow itsusers to explicitly rate the items they have added on a five-point scale. Social catalogingapplications like LibraryThing and Shelfari also allow explicit ratings. It is interesting tonote, however, that some users find a way around the absence of such features. On Delicious,for example, tags such as *, ***, or ***** are used by several people to represent the qualityof a bookmarked Web page.
11http://www.diigo.com/12http://www.faves.com/

Chapter 2. Related Work 29
TAGCLOUDNAVIGATION
ITEMHISTORY
TAGHISTORY
Figure 2.6: Navigation on a social bookmarking website. The starting point for every useris their profile page which lists the bookmarks they added to their profile (top left). Fromthere, users can browse to tag pages (bottom left) which show which other bookmarkshave been tagged with the selected tag; and to item history pages (bottom right), whichshow all other users who have added the selected item, and what tags and metadata theyassigned to it. Users can also get an overview of the tags they have used from their tagcloud view (top right), which marks up the more popular tags with a darker font color anda larger font size.
2.3.3 Research tasks
We mentioned earlier that there is not a large body of related work on the task of itemrecommendation on social bookmarking websites. In this section we briefly discuss the tasksand problems that have seen more attention: browsing, search, and tag recommendation13.
Browsing One of the strengths of social tagging as a way of categorizing and describingresources is that users are free to tag without any considerations of relationships between
13These are not the only possible tasks that can be supported on social bookmarking websites; we refer thereader to Clements (2007) for an insightful overview.

Chapter 2. Related Work 30
tags. However, it is obvious that certain tags will be more related to each other than others,because they are synonyms, hyponyms, or because there is another kind of conceptual rela-tionship between them. Several researchers have proposed techniques that could improvethe browsing experience. One example is automatically deducing a tag hierarchy for im-proved browsing as proposed by Heymann and Garcia-Molina (2006) and Li et al. (2007).A second way of improving the browsing experience is by clustering related bookmarks to-gether, as proposed by Capocci and Caldarelli (2007) and Clements et al. (2008b). Tagclouds do not take such implicit relationships into account and just visualize tags in an al-phabetical list, highlighted according to popularity. Garama and De Man (2008) performedan extensive user study to investigate the usefulness of tag clouds for image search. Theycompared tag clouds as a browsing mechanism to a standard search engine for a known-item retrieval task, and found that, although performance as measured by success rate ishigher when using a search engine, users are more satisfied when browsing by using thetag cloud than when using a search engine. This shows the value of a simple representationsuch as the tag cloud.
Search A second popular research problem in social bookmarking is whether tags can beused to improve (1) retrieval of items on a social bookmarking website and (2) Web searchin general. Since tags are condensed descriptions of content, it is possible that they canreplace or augment standard retrieval algorithms; this possibility was already hypothesizedearly on by, for instance, Mathes (2004). Heymann et al. (2008a) tried to answer the ques-tion Can social bookmarking help Web search? by analyzing various properties of Delicious14.Heymann et al. (2008a) found that Web pages posted to Delicious tend to be quite dynamicand updated frequently. An analysis of the tags showed that they were overwhelminglyrelevant and objective. However, compared to the Web, Delicious still only produces smallamounts of data, limiting its possible impact on improving Web search. The tags themselveswere found to occur in over half of the pages they annotate, and in 80% of the cases theyoccurred in either the page text, the bookmark title or the Web page URL. Heymann et al.(2008a) therefore concluded that it is unlikely that tags will be more useful than a full textsearch emphasizing page titles, and that Web search engine performance is therefore un-likely to be impacted. Bischoff et al. (2008) repeated the work of Heymann et al. (2008a)for two more social bookmarking systems, Flickr and Last.fm, and were more positive aboutthe potential for tags. They report a higher percentage of uniqueness of tags compared toanchor and page text, especially in the music domain, where content analysis is more diffi-cult. They conclude that for certain domains tags can have a large impact on search engineperformance. Morrison (2007) directly compared the performance of social bookmarkingwebsites with Web search engines and Web directories. He found that there was only asmall overlap in the results of each type of retrieval ‘tool’, with 90% of the results beingunique to the system that retrieved them. The largest of the social bookmarking websitesperformed significantly better than the Web directories. Social bookmarking websites werealso better than search engines on dynamic queries such as current events, which confirmsthe findings of Heymann et al. (2008a).
14A year earlier, Yanbe et al. (2007) performed the same kind of analysis on Japanese social bookmarkingwebsites and came to similar conclusions.

Chapter 2. Related Work 31
Several approaches have been proposed for how tags can be incorporated into retrieval al-gorithms. Bao et al. (2007) proposed an algorithm based on PageRank (Page et al., 1998)called SocialPageRank to measure the static ranking of a Web page based on the tags as-signed to it instead of the hyperlinks between pages. They combined it with a simple vectorspace model to perform Web page retrieval and showed that re-ranking the search resultsyielded significant improvements over their document retrieval baseline. Zhou et al. (2008)proposed a unified framework that combines the modeling of tag usage with a languagemodeling approach to IR by enhancing the document and query language models withthe tags. Their experiments on a sample of the Delicious website showed significant im-provements over a traditional retrieval algorithm. Similar experiments were performed byCarman et al. (2008), who used a similar algorithm to construct probabilistic user profilesto combine with regular document retrieval. In addition, they compared creating (1) userprofiles based on tags and (2) profiles based on the content of the bookmarked pages, andshowed that a combination performed best.
Tag recommendation The most popular recommendation task in the literature on socialbookmarking so far has been tag recommendation: suggesting appropriate tags to a userwhen he posts a new bookmark to the system. For instance, the BibSonomy system includesa tag recommender that offers up to ten recommended tags when a user finds an interestingWeb page or publication and posts it to BibSonomy. The experiments behind this tag recom-mendation are described in Jäschke et al. (2007b). They found that a graph-based approachto tag recommendation significantly outperformed collaborative filtering approaches. Col-laborative filtering was first applied to the problem of recommending tags in 2006 by Xuet al. (2006). Sigurbjörnsson and Van Zwol (2008) aggregated tag occurrence informationin different ways to recommend tags for photos on Flickr. Heymann et al. (2008b) exper-imented with tag prediction by mining tag-based association rules on Delicious using theirStanford Tag Crawl data set from Heymann et al. (2008a). Song et al. (2008) used a com-bination of graph partitioning and a two-way Poisson mixture model to cluster tags intoseparate clusters with good results on their two data sets based on Delicious and CiteULike.Chirita et al. (2007) proposed a tag recommender that mined the bookmarked Web pagesand pages similar to it by ranking the terms in those documents by their tf·idf value andrecommending the top N terms. Blogs are an additional area where tag prediction has beenapplied to blog posts by Mishne and de Rijke (2006). For each untagged blog post, theyfirst locate similar blog posts using a retrieval system and then assign the most popular tagsassociated with those best-matching posts to the untagged post (Mishne, 2006).
As a final note, it is worthwhile to ask the question whether these tag recommendations areactually accepted by the user, and what the effects are on the system? Do people convergeto a single vocabulary by accepting the suggestions of the tag recommender, or are theystubborn and do they stick to their own choice of tags? Suchanek et al. (2008) examinedthe influence that these tag recommendations can have on a social bookmarking systemand its folksonomy. They found that up to one in three tags are applied purely because ofthe presence of the tag suggestions. This implies that the distribution of tag popularity ina folksonomy might become biased as a result of offering tag suggestions. However, tagsuggestions do provide a form of control over the tag vocabulary of the users.


IRECOMMENDING BOOKMARKS
In Chapter 1, we described two important characteristics of social bookmarking systems.The first was the presence of the folksonomy, a collaboratively generated categorizationof items in a system by its users. This extra annotation layer of collaboratively generatedtags binds the users and items of a system together. The second observation about socialbookmarking systems is that, in addition to tags, they contain a large amount of additionalmetadata describing the content of those systems and its users. In the first part of this thesis,we will investigate how to exploit these two characteristics, both separately and combined,to provide the best possible recommendations for users of social bookmarking systems. Thisleads us to our first three research questions.
RQ 1 How can we use the information represented by the folksonomy to sup-port and improve the recommendation performance?
RQ 2 How can we use the item metadata available in social bookmarking sys-tems to provide accurate recommendations to users?
RQ 3 Can we improve performance by combining the recommendations gen-erated by different algorithms?
Part I is organized as follows. We begin in Chapter 3, where we present the building blocksof our quantitative experimental evaluation. We formally define our recommendation task,and introduce our data sets. We discuss the filtering we applied to the data, our experi-mental setup, and discuss the evaluation metrics we use. We also critically discuss the prosand cons of our methodological decisions. In Chapter 4, we propose and compare differentoptions for using the folksonomy for item recommendation on social bookmarking websites(RQ 1). Chapter 5 examines how we can use the metadata present in social bookmarkingsystems to improve recommendation performance (RQ 2). Chapter 6 concludes Part I andinvestigates if we can improve upon our best-performing algorithms from Chapters 4 and5 by combining the output of the different algorithms into a new list of recommendations(RQ 3).
33


CH
AP
TE
R 3BUILDING BLOCKS FOR THE EXPERIMENTS
In Chapter 1 we introduced two features of social bookmarking systems that we believe havethe potential to improve recommendation: (1) the folksonomy, serving as an extra layer ofinformation that binds users and items together, and (2) the presence of metadata. In or-der to evaluate the usefulness of different recommender algorithms for social bookmarkingservices and to determine how best to incorporate these extra sources of information, weneed a proper framework for experimentation and evaluation. While we recognize that rec-ommendation accuracy alone does not guarantee users a satisfying experience, we focus ona quantitative, system-based evaluation of recommender system performance in this thesis.It is possible to simulate, to a satisfying degree, the reaction of the user to different variantsof the recommender algorithms and thus determine which algorithms are better suited towhich domains (Herlocker et al., 2004). This can be done automatically without any userintervention.
In this chapter we will describe the building blocks for our experiments and their evalua-tion. First, we need to understand the type of user task we are trying to fulfill with ourrecommender system, as the rest of the experimental evaluation depends on the choice ofrecommendation task. Section 3.1 gives an overview of six possible item recommendationtasks and explains which recommendation task we focus on in this thesis. Section 3.2 thendescribes the four data sets we collected from BibSonomy, CiteULike, and Delicious to eval-uate our recommendation algorithms. Section 3.3 describes how we represent our data. Weconclude this chapter by describing our experimental setup and evaluation for our specificitem recommendation task in Section 3.4.
3.1 Recommender Tasks
A prerequisite of the entire experimental evaluation process is deciding which recommendertask we want to support. The choice of data sets, experimental setup, and evaluation met-rics all depend on which specific recommender task we select. Recommender systems canfulfill different tasks for different stakeholders (Herlocker et al., 2004). First and foremost
35

Chapter 3. Building Blocks for the Experiments 36
among these stakeholders are the end users, who should be provided with novel and inter-esting recommended items. However, recommender systems can also be designed, tweaked,or tuned to serve the goals of other system stakeholders. Marketers may want the recom-mender system to promote new albums or artists for a certain period of time, while otherstakeholders such as store owners may wish to recommend excess inventory items. Her-locker et al. (2004) identify six different user tasks for which recommender systems can beused. In this section we describe these six tasks and explain which one is applicable for ourscenario of recommendation for social bookmarking.
Annotation in Context In the Annotation in Context task, the recommender system gener-ates its suggestions in context, helping the user to make decisions. An example wouldbe an IMA that aids a user during the writing process, recommending relevant liter-ature depending on the user’s task and the content of the document being written(Puerta Melguizo et al., 2008). We do not focus on this user task in this thesis.
Find Good Items In many systems users are provided with a ranked list of recommendeditems, often without the predicted scores or ratings, such as in Web search engines.In such a situation it might be best for a system to generate a few highly useful rec-ommendations even at the cost of being wrong about the others. Presenting the userwith a list of top items1—the ‘best guesses’ made by the system—is the most usefulscenario we envision for recommendation for social bookmarking services, and theone we will address in this thesis. We will try to recommend the best, novel items fora user based on the bookmarks or scientific articles that user has added to his profilein the past.
Find All Good Items In special cases of the Find Good Items task, coverage can be essential,such as in legal search engines or patent search. Here it is important to optimizeon recall and find all the good items in the collection. Although it depends on thesituation and the type of social bookmarking service, we do not believe that findingall good items is essential for our recommendation experiments.
Recommend Sequence In this task the goal is to predict a useful or interesting sequenceof recommended items over time. Ordering is of much greater importance for thisuser task. Examples include generating smooth music playlists that prevent the so-called iPod whiplash phenomenon, where the listener is confronted with clashingtransitions from one musical genre to a completely unrelated one. A second examplewould be creating reading lists meant to familiarize researchers with a certain field(“First read this introduction, then that survey, ...”). In this thesis we do not focus onthis recommendation task.
Just Browsing Sometimes it is rewarding for users to browse around a website and ex-plore the recommendations without an ulterior motive. On social bookmarking web-sites, the folksonomy connecting users and items through tags can enhance the user’sbrowsing experience greatly and increase the possibility of serendipitous findings. Inthese browsing scenarios, the quality of the user interface is usually deemed more im-portant than recommendation accuracy. This task is related to the recommendation
1Also known as Top-N recommendation.

Chapter 3. Building Blocks for the Experiments 37
dialogue aspects of human-recommender interaction we discussed in Section 2.1.5.We do not focus on this user task in this thesis.
Find Credible Recommender In this user task, users tend to play around with the rec-ommender system specifically to see if it will correctly learn their personal prefer-ences and generate trustworthy and credible recommendations. This task is relatedto the recommendation personality aspects of human-recommender interaction wediscussed in Section 2.1.5. This user task is not applicable in our situation either.
3.2 Data Sets
In the previous section we selected the Find Good Items task as the item recommendationtask we wish to address in this thesis. The next step in our quantitative evaluation is collect-ing data sets that we can use to evaluate the recommendation algorithms we will design toaddress this recommender task. In this section we discuss three important issues for collect-ing such realistic data sets. We look at the field of IR, and adapt three common guidelinesfor constructing IR data sets for our own purposes. We describe the four data sets we havecollected and list statistics of the raw, unfiltered versions of these data sets. Then, in Sub-sections 3.2.1 through 3.2.3 we discuss the specifics of how these data sets were collectedand of the social bookmarking websites they originate from.
In order to test our algorithms, we need to use data sets that are realistic representations ofthe daily operation of a social bookmarking website. There are three important issues thatsurface when deciding how to evaluate recommendation in a social bookmarking situation.
Difficult to generalize Using a data set collected from one particular social bookmarkingservice does not necessarily mean that any findings are generalizable to all socialbookmarking services available on the Web. Certain domains might very well havedifferent demands and characteristics that make it hard or even impossible to applythe findings of our experiments there. To counter this, one should always work with areasonable abstraction of a realistic task and as many different, yet realistic data setsas possible. This way we can obtain an estimate of how well results and conclusionscarry over to other social bookmarking settings.
Personal judgments and interestingness Relevance in IR is not quite the same as the no-tions of relevance or interestingness in recommendation. Whereas personal judgmentsfrom the user can be substituted by judgments from impartial, third-party judges to acertain extent in the field of IR, there is no evidence that this is the same for recom-mender systems.
Private vs. public data Many social bookmarking websites, such as Delicious and CiteULike,allow its users to keep part or all of their bookmarked items private. Harvesting a dataset from the public-facing side of a social bookmarking website therefore means thatnot necessarily all data is available for testing.

Chapter 3. Building Blocks for the Experiments 38
To address the first issue of generalizability, we introduce and use four different data setsfrom two different domains: scientific articles and Web bookmarks. This will enable to com-pare our algorithms under different conditions and determine if our findings carry over toother websites and domains. Our four different data sets were taken from three differentsocial bookmarking websites: BibSonomy, CiteULike, and Delicious. One of the websites,BibSonomy, supplies two data sets as it allows its users to post both scientific articles andWeb bookmarks to their profiles. We therefore split the BibSonomy data into a data setcontaining only scientific articles and a data set containing only Web bookmarks. In the re-mainder of this thesis, we will refer to the BibSonomy data sets containing scientific articlesand Web bookmarks as BibArt and BibBoo respectively to avoid confusion. The websiteCiteULike also covers scientific articles while Delicious covers Web bookmarks. This meanswe have two data sets corresponding to the domain of scientific articles (BibSonomy andCiteULike), and two covering the domain of Web bookmarks (BibSonomy and CiteULike).With two pairs of data sets sharing the same domain, we can directly examine and compareif the findings from one data set are generalizable to other social bookmarking websites inthe same domain or in a different domain altogether.
With regard to the second issue of the difference between relevance and interestingness, thefundamental differences and similarities between these two notions are not covered in thisthesis. We therefore abstract away from this and treat relevance the same as interestingness.Extensive user evaluations, such as those performed by McNee (2006) could shed more lighton this difference. However, this is beyond the scope of this thesis.
We do not believe the third issue to have a large influence on our experimental setup andresults. Although we have no way of knowing how substantial a part of the social book-marking website’s database is missing from collecting a crawl of the public-facing section,we do not believe this data to be radically different in either structure or topic. Moreover,public bookmarks are likely to comprise links to personal log-in pages that would not makefor suitable recommendations to other users at any rate. This means we assume any conclu-sions drawn from our experiments on the public-facing sides of social bookmarking websitesto carry over to the private part without any problems.
Constructing Proper Data Sets for Recommendation As far as we know, Herlocker et al.(2004) are the only ones to have explicitly discussed the challenges of creating and usingdata sets specifically for testing recommender algorithms. They stress that it is “very impor-tant that the tasks your algorithm is designed to support are similar to the tasks supportedby the system from which the data was collected” (Herlocker et al., 2004, p. 15). An exam-ple would be the MovieLens2 movie recommender system, which offers support for the FindGood Items user task. This means that the recommender system tends to show those itemsit is most confident about, subsequently resulting in more ratings for these good and oftenmore popular movies. As a consequence of this “rich get richer” effect, the MovieLens dataset is less likely to have many ratings for the more unpopular movies. Using this data setto evaluate a different task, such as Recommend Sequence or Annotation in Context wouldtherefore be inappropriate (Herlocker et al., 2004). Hardly any social bookmarking servicesoffer item recommendation to their users at this point and certainly no data sets based on
2http://www.movielens.org/

Chapter 3. Building Blocks for the Experiments 39
these recommender systems have been made available yet3, so this could not be taken intoaccount when gathering our data sets.
IR and recommendation are considerably similar in many aspects, such as the construc-tion of test collections for IR and the construction of good data sets for recommendation.According to Croft et al. (2009), there are three important guidelines when creating testcollections for IR experiments. We have adapted them to recommendation purposes and listthem here.
Guideline 1 It is important to use a collection that is representative of the application interms of the number, size, and type of resources. This echoes the point made whendescribing the first issue in the beginning of this section: a good data set is a realisticrepresentation of actual content present in a social bookmarking service.
Guideline 2 Queries should be representative of the real-world application. In our rec-ommendation scenario, queries correspond to the user profiles present on the socialbookmarking website—a single user profile is matched against the entire database justas single queries are matched against the document collection. We therefore recom-mend collecting a realistic and sufficiently large set of user profiles in order to createa good recommendation data set.
Guideline 3 Relevance judgments should be created by people who posed the queries orindependent judges. This guideline is especially strict in the case of recommender datasets: judging whether an item is interesting or not is an strictly personal matter, andcannot be done by third parties on behalf of the user for whom the recommendationwas made.
With regard to the third guideline, it is necessary to remark that it is impossible to havea complete set of user–item judgments. Having each user judge all the items on a socialbookmarking website is simply not achievable. This is similar to IR evaluation, where itis practically impossible to judge all query-document pairs for topical relevance. However,according to Carterette et al. (2006), it is better for the quality of the evaluation to judgemore queries than to judge more documents. If a small number of queries are used, theresults should only be considered indicative rather than conclusive. Since all of our datasets contain thousands of users profiles that serve as our queries, we hope that—analogousto the findings of Carterette et al.—having many different users profiles instead of morejudged user–item pairs mitigates the issue of lacking human judgments to a certain extent.
Collecting the Data Sets The field of IR has benefited greatly from the large-scale eval-uation initiatives such as the Text REtrieval Conference (TREC)4. TREC is comprised ofdifferent research tracks, with each track focusing on a specific sub-problem of IR, such asWeb search, blog search, or entity retrieval. Each tracks works with shared data sets ofrealistic size that enable the participants to compare their approaches with each other.
3Of course it is entirely possible that a user added bookmarks to, say, his Delicious account because he or shesaw them on the Recent or Popular lists, but we have no way of knowing why a user added a specific bookmark.
4Available at http://trec.nist.gov/.

Chapter 3. Building Blocks for the Experiments 40
Unlike these large-scale initiatives for IR, however, there were no publicly available datasets of social bookmarking websites when the work described in this thesis was started.We therefore had to collect the CiteULike and Delicious data sets ourselves. In addition,the BibSonomy collection was added when it became available in May 2008 as part of the2008 ECML/PKDD Discovery Challenge. We understand that the quality of any scientificexperiment is dependent on the possibility of verification and comparison of the results. Wetherefore make these data sets publicly available to the recommender systems community5.For each data set, we removed the spam content from our crawls wherever possible, as spamusers and content will only serve to disturb our recommendation experiments.
Table 3.1 lists some of the basic statistics of the raw, unfiltered data sets we collected. Foreach of the four data sets, we list the size in terms of users, items, tags, and posts. Inaddition, we show the average and maximum counts of the relationships of one object typeto another. For instance, the average number of tags per user for CiteULike is equal to27.2, while the maximum numbers of users that share an item in Delicious is 764 in ourraw Delicious data set. We do not list minimum counts for any of the calculated measures,because they are always equal to 0 or 1, depending on the measure. We also list informationabout the sparsity of each of the data sets.
Table 3.1: Statistics of the four different data sets used as the basis for our experiments.
bookmarks articlesBibSonomy Delicious BibSonomy CiteULike
# users 1,913 17,975 1,310 18,072# items 157,304 3,870,535 136,890 585,351# tags 44,194 554,856 27,702 129,409# posts 177,334 5,975,514 156,124 672,396avg. # items per user 92.7 332.4 119.2 37.2avg. # users per item 1.1 1.5 1.1 1.1avg. # tags per user 59.1 238.7 43.9 27.2avg. # users per tag 2.5 7.1 2.1 3.3avg. # tags per item 3.6 3.7 1.9 3.3avg. # items per tag 12.6 24.6 9.5 13.7max # items per user 33,381 15,044 57,739 6,581max # users per item 54 764 45 546max # tags per user 11,165 6,771 4,767 4,045max # users per tag 257 8,974 490 1,399max # tags per item 101 548 143 1,282max # items per tag 35,561 121,274 65,923 150,979% users without tags 0 7.57 0 14.22% items without tags 0 6.01 0.16 8.40% posts without tags 0 6.00 0.19 9.23user-item sparsity (%) 99.9411 99.9914 99.9129 99.9936
The origins of our four data sets are described in greater detail in Subsections 3.2.1 through3.2.3. We briefly describe the spam problem for each of the data sets in those sections. InChapter 7 we examine the presence of spam in our social bookmarking data sets in moredetail, and we investigate the influence on recommendation performance.
5The data sets are available from http://ilk.uvt.nl/~toine/phd-thesis/.

Chapter 3. Building Blocks for the Experiments 41
3.2.1 CiteULike
CiteULike is a social bookmarking service that offers a “a free service to help you to store,organise, and share the scholarly papers you are reading”6. It allows its users to add theiracademic reference library to their online profiles on the CiteULike website. CiteULikewas created in November 2004 by Richard Cameron and contains over 1.5 million uniquearticles7, annotated by more than 46,000 users with over 307,000 unique tags at the timeof writing. Articles can be stored with their metadata (in various formats), abstracts, andlinks to the papers at the publishers’ sites. In addition, users can add reading priorities,personal comments, and tags to their papers. CiteULike also offers the possibility of userssetting up and joining groups that connect users sharing academic or topical interests. Thesegroup pages report on recent activity, and offer the possibility of maintaining discussion foraor blogs. The full text of articles is not accessible from CiteULike, although personal PDFversions can be uploaded, which are then only accessible to the uploading user. Figure 3.1shows a screenshot of a user’s profile page in CiteULike.
Figure 3.1: Screenshot of a user’s profile page in CiteULike.
CiteULike offers daily dumps of their core database to benefit researchers wishing to analyzeor experiment with the data8. We used the dump of November 2, 2007 as the basis for ourexperiments. A dump contains all information on which articles were posted by whom,with which tags, and at what point in time. Each line represents a user-item-tag triple with
6http://www.citeulike.org7When we refer to items as articles, we mean not just journal articles, but also conference papers, theses,
technical reports, books, and so on.8Available from http://www.citeulike.org/faq/data.adp.
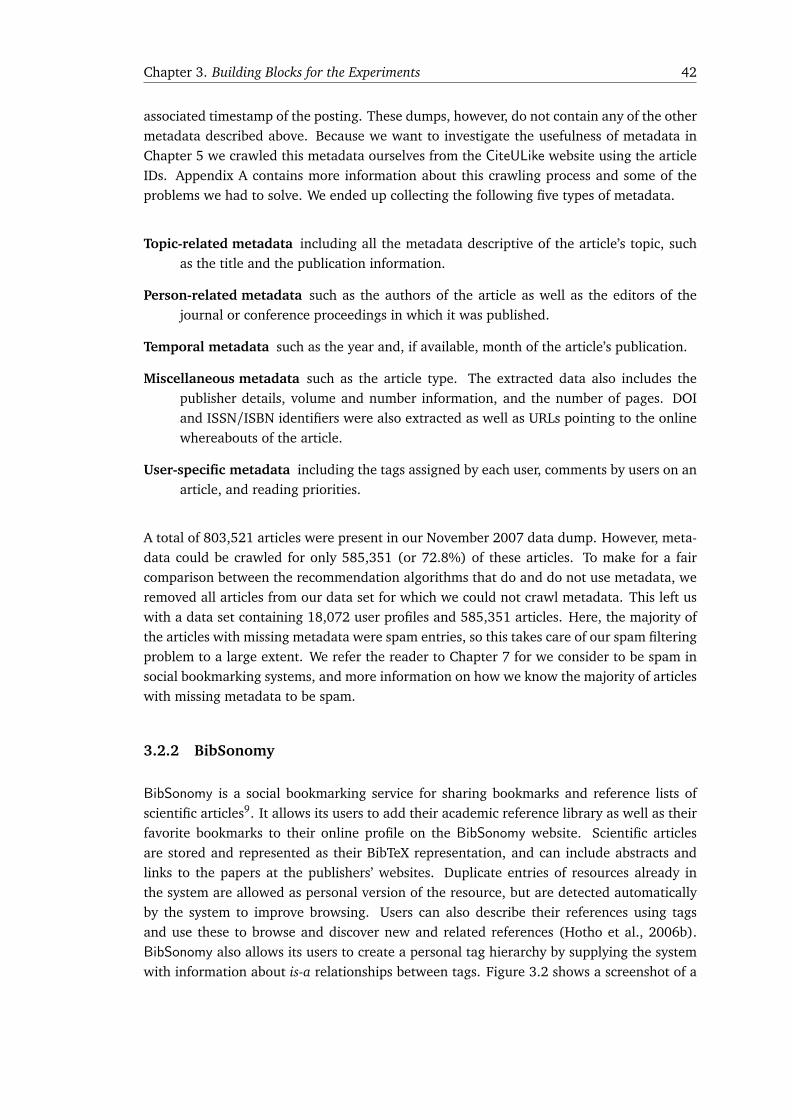
Chapter 3. Building Blocks for the Experiments 42
associated timestamp of the posting. These dumps, however, do not contain any of the othermetadata described above. Because we want to investigate the usefulness of metadata inChapter 5 we crawled this metadata ourselves from the CiteULike website using the articleIDs. Appendix A contains more information about this crawling process and some of theproblems we had to solve. We ended up collecting the following five types of metadata.
Topic-related metadata including all the metadata descriptive of the article’s topic, suchas the title and the publication information.
Person-related metadata such as the authors of the article as well as the editors of thejournal or conference proceedings in which it was published.
Temporal metadata such as the year and, if available, month of the article’s publication.
Miscellaneous metadata such as the article type. The extracted data also includes thepublisher details, volume and number information, and the number of pages. DOIand ISSN/ISBN identifiers were also extracted as well as URLs pointing to the onlinewhereabouts of the article.
User-specific metadata including the tags assigned by each user, comments by users on anarticle, and reading priorities.
A total of 803,521 articles were present in our November 2007 data dump. However, meta-data could be crawled for only 585,351 (or 72.8%) of these articles. To make for a faircomparison between the recommendation algorithms that do and do not use metadata, weremoved all articles from our data set for which we could not crawl metadata. This left uswith a data set containing 18,072 user profiles and 585,351 articles. Here, the majority ofthe articles with missing metadata were spam entries, so this takes care of our spam filteringproblem to a large extent. We refer the reader to Chapter 7 for we consider to be spam insocial bookmarking systems, and more information on how we know the majority of articleswith missing metadata to be spam.
3.2.2 BibSonomy
BibSonomy is a social bookmarking service for sharing bookmarks and reference lists ofscientific articles9. It allows its users to add their academic reference library as well as theirfavorite bookmarks to their online profile on the BibSonomy website. Scientific articlesare stored and represented as their BibTeX representation, and can include abstracts andlinks to the papers at the publishers’ websites. Duplicate entries of resources already inthe system are allowed as personal version of the resource, but are detected automaticallyby the system to improve browsing. Users can also describe their references using tagsand use these to browse and discover new and related references (Hotho et al., 2006b).BibSonomy also allows its users to create a personal tag hierarchy by supplying the systemwith information about is-a relationships between tags. Figure 3.2 shows a screenshot of a

Chapter 3. Building Blocks for the Experiments 43
Figure 3.2: Screenshot of a user’s profile page in BibSonomy.
user’s profile page in BibSonomy; the tag hierarchy for this user is visible in the frame onthe right-hand side.
BibSonomy is used as a testbed for research into various knowledge-organizational aspectsof social bookmarking by the Knowledge and Data Engineering group of the Universityof Kassel, Germany. Some of the tasks that have been investigated using BibSonomy areconstructing topic-specific rankings of bookmarked items (Hotho et al., 2006a), ontologylearning from the BibSonomy folksonomy (Schmitz et al., 2006), tag recommendation fornew posts (Jäschke et al., 2007b), the network properties of the folksonomy (Schmitz et al.,2007), and spam detection in social bookmarking (Krause et al., 2008). As part of theirongoing research efforts, they organized the 2008 ECML/PKDD Discovery Challenge whichfocused on social bookmarking. The BibSonomy data set was released to the public in May2008 as part of this challenge10. Each year a different domain and problem set is chosenas that year’s Discovery Challenge, which is meant to encourage a collaborative researcheffort at knowledge discovery and data mining, and an emphasis on business problems andsolutions to those problems. In 2008, two tasks were selected based on the BibSonomysocial bookmarking service: tag recommendation and spam detection. We go into moredetail about the latter task in Chapter 7. For these tasks the organizers made a snapshot oftheir BibSonomy system available in the form of a MySQL dump. This dump consisted ofall resources posted to BibSonomy between its inception in 2006 and March 31, 2008,and contains the same type of metadata for the scientific articles that we collected for
9http://www.bibsonomy.org/10The website for the challenge can be found at http://www.kde.cs.uni-kassel.de/ws/rsdc08/

Chapter 3. Building Blocks for the Experiments 44
CiteULike. The distinction between bookmarks and BibTeX records is also made in thissnapshot. We therefore split this data dump into a data set containing only Web bookmarksand a data set containing only scientific articles. Since it is possible and even encouragedby the BibSonomy service to add both bookmarks and articles to a user profile, this meansthat certain users can end up in both data sets. However, the participation in both data setsis fairly disjoint in reality: only 22.1% of the users have added both bookmarks and articles.
As required for the spam detection task the data set came with information identifying allspam content in the BibSonomy system. The Discovery Challenge organizers were able tocollect data of more than 2,600 active users and more than 36,000 spammers by manuallylabeling users. The data dump contained these labels that identify users as spammers ornon-spammers. A large portion of all users were spammers, with almost 14 spam users foreach genuine user. We used these labels to remove all spam content from our two data sets,leaving us with 1,913 user profiles containing Web page bookmarks and 1,310 user profilescontaining scientific articles. One of the reasons that the two BibSonomy data sets are anorder of magnitude smaller than the CiteULike and Delicious data sets is the fact that therewas so much spam content in the original data dump.
3.2.3 Delicious
Delicious is a social bookmarking service for storing, sharing, and discovering Web book-marks11. It was created in September 2003 by Joshua Schachter and had grown to 5.3million users and 180 million posts by November 200812. Delicious allows its users to save,tag, manage, and share Web pages, and enables easy browsing of other Web pages, tags,and users by offering separate pages for each URL, user, and tag on Delicious. Figure 3.3displays a screenshot of a user’s profile page in Delicious. It shows the user’s bookmarks onthe left-hand side with the user-generated titles and descriptions for each bookmark, as wellas the tags assigned by the user. The numbers next to each bookmark signal how many peo-ple have added this Web page to Delicious. The user’s tag cloud is visible on the right-handside of the screen. Users also have the possibility of forming a social network with otherusers. Users can declare themselves ‘fans’ of other users by adding them to their personalnetwork; reciprocal fandom by two users is considered as friendship in Delicious. Finally,with regard to duplicate detection, Delicious does a mild form of automatic duplicate detec-tion by calculating MD5 hashes of the URLs. However, from our experience with crawlingDelicious, this does not catch all duplicates, although we can provide no authoritative figureor source for this.
Unlike BibSonomy and CiteULike, Delicious does not offer a data dump of their databases, sowe gathered our data set by crawling a subset of the Delicious website. Since our focus wason item recommendation for users, our focus in crawling was to collect a balanced, unbiasedset of user profiles, i.e., the complete set of bookmarks a user had posted to Delicious. Westarted our data collection process with an earlier crawl performed in November 2006,starting from the list of the 100 most popular tags on Delicious and performing an outward
11http://www.delicious.com/12According to http://blog.delicious.com/blog/2008/11/delicious-is-5.html

Chapter 3. Building Blocks for the Experiments 45
Figure 3.3: Screenshot of a user’s profile page in Delicious.
crawl by treating Delicious as a tripartite graph. For each URL page, all new users andtags were added to the frontier, and for each user and tag page the frontier was likewiseexpanded with the new items, users, and tags. Selecting what tags, users, and items tocrawl next was decided by ordering them by frequency, dividing the frequency range into10 equal logarithmic bands, and then randomly selected an equal number of users, items,and tags from each frequency band. This crawl resulted in a list of 300,000 unique users.We randomly selected 100,000 users from this list to use as the starting point of crawlingour actual data set. For each user we crawled their profile—the entire set of bookmarksposted by that user—and randomly selected about 18,000 of these users to match the sizeof our CiteULike data set. This final data set containing 17,975 user profiles is the onedescribed in Table 3.1.
There are three potential problems with our data collection method. The first problem isthat doing partial crawls of small-world graphs like Delicious can lead to a data set biasedto the popular URLs, users, and tags (Heymann et al., 2008a). However, by selecting newtargets to crawl by randomly selecting them from logarithmically divided frequency bands,we hope to have alleviated that to some extent. The second problem is that by randomlyselecting users from a list of users already present on Delicious in November 2006 andthen crawling their user profiles mid-2008, we observe that this precludes crawling anyusers who joined Delicious in 2007 or later. The third potential problem is that the crawledusers have had more than a year to increase their profile, which will perhaps lead to a slightoverestimation of certain statistics such as the average user profile size. However, we do not

Chapter 3. Building Blocks for the Experiments 46
believe that these problems will influence the outcome of our recommendation experimentsto a great extent.
While we were able to filter out significant amounts of spam from our BibSonomy andCiteULike data sets, we do not have any comparable information about spam content in De-licious. However, (Heymann et al., 2008a) reported that for the data set they crawled fromDelicious—in a similar manner to our crawled method—they found almost no spam. Wetherefore assume that spam presence on Delicious is not as big a problem as on BibSonomyand CiteULike.
3.3 Data Representation
Despite having different metadata fields, we have tried to keep our data representation asuniform as possible across domains and collections from the three different social book-marking websites we focus on. We use two different formats to represent each data set:one to represent the usage information and another to represent the metadata. Usage infor-mation tells us what user added which items with which tags at what point in time. Ourrepresentation is similar to the way the public CiteULike data dumps are represented. Eachpost is represented as one or more lines: one for each tag assigned to the item by that user,represented by the user, item, time stamp, and tag. This representation is exactly the samefor all collections. Figure 3.4 shows an example of how an example post from Delicious isrepresented.
Edgecrusher7711 ba7544754ea353d2540733d0f43a5829 2008-02-28T17:50:00Z hockeyEdgecrusher7711 ba7544754ea353d2540733d0f43a5829 2008-02-28T17:50:00Z sportsEdgecrusher7711 ba7544754ea353d2540733d0f43a5829 2008-02-28T17:50:00Z nhl
USERID ITEMID TIMESTAMP TAG
Figure 3.4: Example of the usage representation format.
In addition to usage data, we also have metadata available for the posts in our collection.Naturally, the amount of assigned metadata varies from user to user and item to item, butthere is a systematic difference in the metadata fields available between the two domains ofbookmarks (Web pages and scientific articles). The following metadata fields were availablefor the four different data sets.
BibSonomy bookmarks: <TITLE>, <DESCRIPTION>, and <URL>
Delicious: <TITLE>, <DESCRIPTION>, and <URL>
BibSonomy articles: <ABSTRACT>, <ADDRESS>, <AUTHOR>, <BOOKTITLE>, <CHAPTER>, <DAY>,<DESCRIPTION>, <EDITION>, <EDITOR>, <ENTRYTYPE>, <HOWPUBLISHED>, <INSTITUTION>,<JOURNAL>, <MONTH>, <NOTE>, <NUMBER>, <ORGANIZATION>, <PAGES>, <PUBLISHER>,<SCHOOL>, <SERIES>, <TITLE>, <TYPE>, <URL>, <VOLUME>, and <YEAR>
Chapter 3. Building Blocks for the Experiments 47
CiteULike: <ABSTRACT>, <ADDRESS>, <AUTHOR>, <BOOKTITLE>, <CHAPTER>, <EDITION>,<EDITOR>, <ENTRYTYPE>, <HOWPUBLISHED>, <INSTITUTION>, <JOURNAL>, <MONTH>,<NUMBER>, <ORGANIZATION>, <PAGES>, <PUBLISHER>, <SCHOOL>, <SERIES>, <TITLE>,<TYPE>, <URL>, <VOLUME>, and <YEAR>
These sets of metadata fields show that there is little difference between the available fieldswithin domains. It is important to remark that we pre-process the <URL> field by replac-ing punctuation by whitespace, and by removing common prefixes and suffixes like www,http://, and .com. We use an SGML format to represent our data with a separate field foreach metadata field. Figure 3.5 shows how the metadata of the example Delicious post fromFigure 3.4 is represented in our SGML format.
!"#$%&'()*+,-./)0*'(1)*22334&56)7+,892:;;2:;)9<:<.=:;>2<<.>?;<9:@=A4B&&
&&!%C%D-B&&
&&&&%1)&EF'*61&")*5F.&GG&HID&IFJK)L&M'7F*(N&%*9.)(N&O*)9K5P/&H)Q(&9P.&7F*)&&
&&!R%C%D-B&&
&&&!SMDB&&
&&&&1TUGRRQQQV61)?F'*61U)*5F.VJF7R&
&&!RSMDB&&
&&!W-$0MC"%C#HB&&
&&&&X&
&&!RW-$0MC"%C#HB&&
!R"#$%B&
Figure 3.5: Example of the metadata representation format.
3.4 Experimental Setup
In order to evaluate different recommender algorithms on our four data sets and to comparethe usefulness of the different information we have available, we need a proper frameworkfor experimentation and evaluation. Recommender systems evaluation—and the differ-ences with IR evaluation—has been addressed by, among others, Breese et al. (1998) andHerlocker et al. (1999, 2004), who make it abundantly clear that the choice for experimen-tal setup and evaluation metrics is dependent on the recommendation task(s) a system issupposed to support. As mentioned earlier in Section 3.1, we focus on the Find Good Itemstask described by Herlocker et al. (2004), where users are provided with a ranked list of‘best bets’ made by the system, based on their personal profile. Our experimental setup istherefore aimed at evaluating this recommendation task.
We start our description of the experimental setup by discussing how we filtered our rawdata sets in Subsection 3.4.1. Then, in Subsection 3.4.2 we describe how we evaluatedour experiments in terms of evaluation metrics and training-test splits. Subsection 3.4.3critically discusses the choice we made in our experimental setup.

Chapter 3. Building Blocks for the Experiments 48
3.4.1 Filtering
It is common practice in recommender systems evaluation to select realistic subsets of thedata sets used to ensure that reliable recommendations can be generated, and to allow forfair comparisons of different recommendation algorithms (Herlocker et al., 1999, 2004;McNee, 2006). This is typically done by filtering out users or items whose profile size orpopularity falls below a certain threshold. It is common to retain only those users who haveadded 20 items or more to their personal profile (Herlocker et al., 1999, 2004). We followthis procedure in our preparation of the data sets as well. In addition, we filter out all itemsthat occur only once, since these items do not contain sufficiently reliable ties to the rest ofthe data set, and thus would only introduce noise for recommendation algorithms13. Fur-thermore, we filter out all untagged posts from our data sets, because we want to investigatethe influence tags can have on the recommendation process. By retaining untagged posts, itis more difficult to properly evaluate the performance of tag-based algorithms as users whonever tag their posts would unfairly decrease the evaluation scores of the algorithms thatrely on tags to generate their recommendations. The recommendation performance for thelatter group of users can be extrapolated from the results of standard algorithms we testsuch as user-based and item-based CF.
Why Perform Filtering? The rationale for restricting our data set to users with 20 itemsor more in their profile is rooted in the fact that users need to have bookmarked at leastsome items before the system can generate useful recommendations for that user. Here, the20-item-threshold has emerged in the literature as an accepted and realistic filtering setupin experiments, although there has been some research into the effect of sparse profiles onrecommendation (see e.g., Breese et al. (1998) and Wang et al. (2006a)). Users new to thesystem could always be shown a list of the most popular content.
There is less consensus in the research community about the filtering threshold for itempopularity, with thresholds reported in the literature ranging from 5 to 20 users minimum.The rationale behind setting such thresholds is that items with fewer or no ties to the rest ofthe data set will be more difficult to predict. In general, the higher the thresholds are set, themore dense the data set becomes. In turn, this reduces the set of possible items to choosefrom, making it easier to generate accurate predictions. This means that by reducing the sizeof the data set, performance is likely to go up, which would seem to be counterproductive toa proper evaluation. A second problem with stronger filtering is that it makes it impossibleto dive into the long tail of items (Celma, 2008).
To ensure a realistic data set, we pick an item filtering threshold of two users and only throwout the hapax legomena items, i.e., the items that occur only once. Compared to the relatedwork discussed in Subsection 2.1.1 and Section 4.5 our filtering regimen is among the moststrict, i.e., for the sake of realism we aim to exclude as few users and items as possible. Asa consequence, the recommendation task becomes more difficult, which is reflected in thescores. Moreover, we do not believe that filtering out the unique items detracts from therealism of our data sets. Although there is no reason to assume that the unique items are less
13If such filtering is done symmetrically, i.e., using the same filtering threshold for all node types, this isusually referred to as selecting the p-core of the data set, where p is the filtering threshold (Seidman, 1983;Jäschke et al., 2007b).

Chapter 3. Building Blocks for the Experiments 49
valuable to their users, we do believe that a considerable majority of these bookmarks aretoo personal to be of any collaborative interest. Exploration of our data sets has shown thatthese hapax items often include links to personal log-in pages or wish lists, which would notmake for good recommendations to other users14. A third reason for filtering out the uniqueitems has to do with our evaluation setup and how hapaxes are impossible to predict. Thiswill be discussed in further detail in the next subsection.
Description of the Filtered Data Sets Table 3.2 shows the statistics of our four data setsafter filtering, and is similar in structure to Table 3.1. These are the versions of our data setsthat we will use in the experiments in the rest of this thesis, unless noted otherwise.
Table 3.2: Statistics of the filtered versions of our four data sets. Untagged posts wereremoved from each data set, and in these versions each user has at least 20 items in hisprofile and each item has been added by at least 2 people.
bookmarks articlesBibSonomy Delicious BibSonomy CiteULike
# users 192 1,243 167 1,322# items 11,165 152,698 12,982 38,419# tags 13,233 42,820 5,165 28,312# posts 29,096 238,070 29,720 84,637avg # items per user 151.5 191.5 178.0 64.0avg # users per item 2.6 1.6 2.3 2.2avg # tags per user 203.3 192.1 79.2 57.3avg # users per tag 2.9 5.6 2.6 2.7avg # tags per item 8.4 4.8 3.1 5.3avg # items per tag 7.1 17.0 7.7 7.3max # items per user 2,404 2,451 6,325 1,264max # users per item 41 66 35 188max # tags per user 5,447 1,784 461 1,186max # users per tag 117 737 97 299max # tags per item 96 101 129 483max # items per tag 1,461 12,021 4,497 1,603user-item sparsity (%) 98.6427 99.8746 98.6291 99.8334
Table 3.2 shows a number of notable characteristics of the data sets. The two largest datasets we collected, Delicious and CiteULike, have about 1,300 users each after filtering, andthe two BibSonomy data sets are a magnitude smaller. Users appear to be the most activeon BibSonomy and Delicious with the average number of items in a user profile betweentwo and three times as high as in the CiteULike collection. When we look at the numberof tags assigned by the users, we see that users bookmarking Web pages tend to use themost tags: more than twice as many as users of social reference manager websites. Webelieve this reflects the greater topical diversity of Web bookmarks compared to scientificarticles. In the latter scenario there may be many different research areas and topics, but ingeneral the task and domain is pretty well-defined: academic research papers and articles.For social bookmarking websites, this would only be one possible domain they could cover.We claim that this greater topical diversity will be reflected later in performance: it is more
14This is especially true for the BibSonomy and Delicious bookmarks data sets.

Chapter 3. Building Blocks for the Experiments 50
difficult to predict for open domains than for closed domains. We revisit this notion later inChapter 4.
All three social bookmarking services allow their users to tag items and the same items canbe tagged by users other than the first user to post the item to the system. This means thatthe aggregation of all user tags forms a broad folksonomy for each of our four data sets. Thisis evident from Table 3.2: the average number of users per item is larger than 1 for all datasets. It is interesting to note that the average number of tags assigned per item is around twoand a half times as large as the average number of users per item. This means that items aredescribed to a greater extent by tags than they are by the users that have added them. Thissuggests that a recommendation algorithm that generates recommendations by comparingitems could benefit from using tags instead of (or in addition to) just usage information, asthe tag information is less sparse. In contrast, the average number of tags assigned by usersis lower than or equal to the average number of items per user for three of our four datasets. This suggests that approaches that directly compare users may benefit less from usingthe assigned tags than from using the items added by those users.
3.4.2 Evaluation
We take a so-called backtesting approach to evaluation that is common in recommender sys-tems literature (Breese et al., 1998; Herlocker et al., 2004; Baluja et al., 2008). For eachuser we withhold 10 randomly selected items from their profile, and generate recommen-dations by using the remaining data as training material. If a user’s withheld items arepredicted at the top of the ranked result list, i.e., if the algorithm is able to correctly predictthe user’s interest in those withheld items, then the algorithm is considered to perform well.In the rest of this thesis, we will refer to the user we are trying to recommend items for asthe active user and his training set items as that user’s active items.
This approach of withholding test items from user profiles also serves as an additional jus-tification for removing the hapax items. When a hapax item is withheld for an active user,then it is not present in the training set anymore. If the recommendation algorithm doesnot know about the item from its presence in the training set, it can never be recommendedto the active user. This puts an artificial ceiling on possible performance and makes for anunfair evaluation of the algorithms. If any item occurs at least twice in the entire data set,then the odds of that item being withheld for evaluation in both cases are much smaller,sketching a more realistic picture of performance. Naturally, the odds of items not beingrecommendable decrease as the item filtering threshold increases even further, the trade-offhere being between unfair and unrealistic evaluation.
The performance of learning algorithms is typically influenced by several parameters. Oneway of optimizing these parameters is by maximizing performance on a given data set. Suchtuning, however, tends to overestimate the expected performance of the system, so in orderto prevent this kind of overfitting we use 10-fold cross-validation (Weiss and Kulikowski,1991). For each of our four data sets, we first divide it into a training and a test set byrandomly selecting 10% of the users to be in our test set. The final performance is evaluatedon this 10% by withholding 10 items from each user, and using the remaining profile items

Chapter 3. Building Blocks for the Experiments 51
together with the training set to generate the recommendations for those 10%. In order toproperly optimize parameters we divide our training set (containing 90% of the users in theentire collection) up again by randomly dividing the users over 10 folds, each containing10% of the training users. Each fold is used as a validation set once, with 10 items beingwithheld for each validation fold user. The remaining profile items and the data in theother 9 folds are then used to generate the predictions. The final values for our evaluationmetrics on the withheld items were then averaged over the 10 folds. This is comparable tomacro evaluation in IR where the individual values for precision or recall are computed firstand averaged afterwards. For our recommendation this means that the result is not biasedtowards the users with profiles that might be easier to predict. The goal in recommendersystems research is to develop recommendation algorithms that can predict equally well forany user, not just the most active ones. Figure 3.6 visualizes this experimental setup.
TRAININGSET TESTSET
divideinto10foldsofequalsize
runexperimentsusing10different
par@@onings
Figure 3.6: Visualization of our 10-fold cross-validation setup. First, the data set is spliton user profiles into a training set and a test set (shaded). The training set is then furtherdivided into 10 equal folds. In ten separate experiments, each fold serves as a test test oncewhile the other nine folds serve as the training set. The results are then averaged over theten test folds scores.
In our evaluation, we adopt an IR perspective by treating each of the users as a separatequery. The 10 withheld items for each user make up the relevant items for which we haverelevance judgments. For each user a ranked list of items is produced and evaluated onwhere these withheld items show up in the result list. While it is certainly possible and verylikely that the recommendation lists contain recommendations that the user would findrelevant or interesting, we cannot know this without the user judging them. This meansthat because our relevance judgments correspond to items added to a user’s profile, we cannever have any items judged as being not relevant without user intervention. This alsomeans that the relevance judgments we derive from our experimental setup are unary andnot binary: we only know if an item is relevant but never if it was not relevant.
Herlocker et al. (2004) assessed the usefulness of different metrics for each of the 6 recom-mendation tasks they identified. For our “Find Good Items” task they found that metrics thattake into account the ranking of the items are most appropriate. We will therefore use MeanAverage Precision (MAP) as our metric for evaluating the performance of our algorithms.MAP is one of the most popular metrics in IR evaluation and provides a stable “single-figuremeasure of quality across recall levels” (Manning et al., 2008). Average Precision is theaverage of the precision values calculated at each relevant retrieved item. To produce the
Chapter 3. Building Blocks for the Experiments 52
MAP, this value is then averaged over all queries. MAP rewards the retrieval of relevantitems ahead of irrelevant items.
In addition to MAP, we evaluated the results of our experiments using three other met-rics, two accuracy-based and one non-accuracy based. Mean Reciprocal Rank (MRR) is theaverage over all queries of the reciprocal of the rank of the first retrieved relevant item.Precision@N (P@N) is the precision at N retrieved items, i.e., the percentage of relevantitems in the set of N retrieved items. The individual P@N values are also averaged overall queries to produce a single-figure measure, and we set N to 10. In our experiments wefound that these two accuracy-based metrics painted the same picture of our algorithms asMAP did, with little or no variation in the statistical significance of differences in runs. Webelieve MAP to be more representative of performance than MRR or P@10, because of itsemphasis on precision across different recall levels. For these reasons we only report MAPscores for our experiments; MRR or P@10 scores will only be mentioned if they help clarifythe situation.
The fourth and final metric, coverage, pertains to an aspect of recommender systems evalua-tion that is not related to accuracy. Coverage is, depending on the definition, the percentageof items or users that the system can produce recommendations for (Herlocker et al., 2004).Certain recommendation algorithms need enough data on a user or item for them to be ableto reliably generate recommendations. Not all algorithms will be able to cover every useror item. We measured user coverage (UCOV), which is the percentage of all users for whichwe were able to generate any predictions at all. As most of the algorithms we will discussin this thesis have perfect user coverage, we will only report the UCOV measure when thisis not the case for a certain algorithm and it is relevant for the discussion. For determiningsignificance of differences between runs, we use a two-tailed paired T-test and report onsignificant differences using Í (and Ï) for α = .05 and Î (and È) for α = .01. For instance,the Í signals a statistically significant improvement over the baseline performance at an αof 0.05. Similarly, a È signals a statistically significant decrease in performance comparedto the baseline at an α of 0.01.
Breese et al. (1998) describe different experimental protocols that represent different levelsof data-set sparsity. While the influence of sparsity on performance is an interesting issue,we leave the sparsity issue for future work. We focus only on the complete data sets inour experiments, i.e., we assume that, within our 10-fold cross-validation experimentationprotocol, we can use all of the profile information we have available about the active users.
3.4.3 Discussion
All experimental setups for evaluating and comparing recommendation algorithms havetheir merits and their drawbacks. As the goal of a recommender system is to entice users toview, read, purchase, or otherwise use items that are new to them and of potential interest,the most direct and appropriate way to evaluate an algorithm is to run it in live service andmeasure the acceptance rate by real users. This is commonly regarded as one side of theevaluation spectrum. However, in a scenario where many different algorithms need to becompared, each with their own parameter settings, it is not always practical to explore all

Chapter 3. Building Blocks for the Experiments 53
these variations. Each variation would have to be run long enough and with sufficient usersto be able to draw statistically significant conclusions about the differences in performance.Additionally, testing poorly performing variations could result in unacceptable degradationof the live performance of the systems for a subset of the user population (Baluja et al.,2008).
On the other end of the evaluation spectrum, backtesting and other offline evaluation meth-ods make it easy to rapidly prototype and compare different algorithms, without having torely on or wait for a sufficiently large group of users to work with the system and react tothe recommendations. As it is still unclear which recommendation algorithms will performbest in social bookmarking systems, we first need to whittle down the space of possiblevariations before a live evaluation or comparison with real users should be attempted. Forthis reason, we focus on backtesting evaluation in this thesis. There are a number of issueswith our system-based evaluation regimen that should be mentioned to put our results inthe right perspective.
One weakness of offline analyses such as our system-based evaluation is that we are limitedto an objective evaluation of our results, and based on this we cannot determine whetherusers will prefer one particular algorithm over another algorithm (Herlocker et al., 2004).System acceptance is dependent not just on prediction quality, but also on other more sub-jective criteria such as the user interface. A second problem of offline evaluation that wasalready discussed earlier, is that we only possess unary relevance judgments, which do notallow us to make any inferences about whether or not unseen items would be appreciated bythe user. In addition, because backtesting is done on a snapshot of the social bookmarkingsystem’s database, it hard to simulate the dynamic nature of live recommendation, wherenew users and items are added continuously, with new trends and old trends coming andgoing. Such aspects are harder to capture in an offline analysis.
Finally, backtesting is a quite conservative paradigm for evaluation, and is likely to under-estimate real performance for actual users, since we can only quantitatively evaluate the 10withheld items for each user (Baluja et al., 2008). Recommendation on such large data setsis also a difficult task, since we are trying to pick the correct 10 withheld items from itemsets ranging in size from 11,000+ tot 152,000+ items. This boils down to correctly pickingout 0.09% of all items as the recommended items, which is like to trying to find a needle ina haystack. These are two of the main reasons that MAP values can be quite low overall, aswe will see later. Ideally, our algorithms should not just be biased towards finding exactlywhat the user is missing, but rather they should find all useful recommendations.


CH
AP
TE
R 4FOLKSONOMIC RECOMMENDATION
One of the defining characteristics of any social bookmarking system that supports socialtagging, is the emergence of a folksonomy. This collaboratively generated categorizationof items in a system serves to bind users and items together through an extra annotationlayer. This extra layer of information can have many different applications, as discussed inChapter 2. For instance, both searching and browsing through the content in a system canbe improved by using the tags assigned to items by users. This leads us to our first researchquestion.
RQ 1 How can we use the information represented by the folksonomy to sup-port and improve the recommendation performance?
More specifically, we are interested in how we can improve the performance of collaborativefiltering algorithms, which base their recommendations on the opinions or actions of otherlike-minded users as opposed to item content. We have two options for incorporating thetagging information contained in the entire folksonomy in CF algorithms. The first option isto treat the tag layer as an extra, refined source of usage information on top of the normalbipartite graph of users and items. Here, we take a standard Collaborative Filtering (CF)algorithm as our starting point and examine a number of ways that tags can be used tofind like-minded users, or to re-rank the recommendations. We will refer to this as Tag-Based Collaborative Filtering (TBCF). The second option is to use a CF algorithm designedto operate on the entire tripartite graph. We will refer to such approaches as Graph-BasedCollaborative Filtering (GBCF). We discuss the most important related work on GBCF ap-proaches and compare two of the state-of-the-art GBCF algorithms to our own tag-basedalgorithms.
This chapter is organized as follows. We start in Section 4.1 by establishing the notation anddefinitions that we will use throughout this chapter. In Section 4.2 we establish a popularity-based recommendation baseline that is currently employed by several social bookmarkingwebsites. Section 4.3 establishes a stronger baseline by applying two CF algorithms to ourdata sets. We examine a number of ways in which we can incorporate tags into our CF
55

Chapter 4. Folksonomic Recommendation 56
algorithms and present these TBCF algorithms in Section 4.4. Section 4.5 discusses therelated work. on recommendation for social bookmarking websites. In Section 4.6 we lookat two state-of-the-art GBCF approaches from the related work and compare them to ourown TBCF algorithms. In Section 4.7 we answer RQ 1 and present our conclusions.
4.1 Preliminaries
We start by establishing the notation and definitions that will be used throughout this chap-ter. To be consistent with other work on recommendation for social bookmarking, we baseour notation in part on the work by Wang et al. (2006a), Clements et al. (2008a), and Tso-Sutter et al. (2008). In the social bookmarking setting that we focus on in this thesis, userspost items to their personal profiles and can choose to label them with one or more tags.We recall that, in Chapter 2, we defined a folksonomy to be a tripartite graph that emergesfrom this collaborative annotation of items. The resulting ternary relations that make upthe tripartite graph can be represented as a 3D matrix, or third-order tensor, of users, items,and tags. The top half of Figure 4.1 illustrates this matrix view. We refer to the 3D matrixas D(uk, il , tm). Here, each element d(k, l, m) of this matrix indicates whether user uk (withk = {1, . . . , K}) tagged item il (with l = {1, . . . , L}) with tag tm (with m = {1, . . . , M}),where a value of 1 indicates the presence of the ternary relation in the folksonomy.
UI
D
R
items
items
users
users
tags
Σ
u1
uK
i1 iL itemsi1 iL
users
u1
uK
binarize
Figure 4.1: Representing the tripartite folksonomy graph as a 3D matrix. The ratings ma-trix R is derived from the tripartite graph itself and directly represents what items wereadded by which users. Aggregation over the tag dimension of D gives us matrix UI, con-taining the tag counts for each user-item pair. By binarizing the values in UI we can obtainR from UI. The figure is adapted from Clements et al. (2008a) and Tso-Sutter et al. (2008).

Chapter 4. Folksonomic Recommendation 57
In conventional recommender systems, the user-item matrix contains rating information.The ratings can be explicit, when they are entered directly by the user, or implicit, when theyare inferred from user behavior. In our case we have implicit, unary ratings where all itemsthat were added by a user receive a rating of 1. All non-added items do not have a ratingand are indicated by ;. We extract this ratings matrix R(uk, il) for all user-item pairs directlyfrom the tripartite graph. We denote its individual elements by xk,l = {1,;}. As evident fromFigure 4.1, we can also extract a user-item matrix from D by aggregating over the tag dimen-sion. We then obtain the K × L user-item matrix UI(uk, il) =
∑Mm=1 D(uk, il , tm), specifying
how many tags each user assigned to each item. Individual elements of UI are denoted byxk,l . We can define a binary version of this matrix UIbinary(uk, il) as sgn
∑Mm=1 D(uk, il , tm)
where the sgn function sets all values > 0 to 1. Because we filtered our data sets to includeonly tagged content, as described in Chapter 3, our ratings matrix R is the same as UIbinary
1.
Similar to the way we defined UI we can also aggregate the content of D over the user andthe item dimensions. We define the K ×M user-tag matrix UT(uk, tm) =
∑Ll=1 D(uk, il , tm),
specifying how often each user used a certain tag to annotate his items. Individual el-ements of UT are denoted by yk,m. We define the L × M item-tag matrix IT(il , tm) =∑K
k=1 D(uk, il , tm), indicating how many users assigned a certain tag to an item. Individ-ual elements of IT are denoted by zl,m. We can define binary versions of UT and IT in amanner similar to UIbinary. Figure 4.2 visualizes the 2D projections in the users’ and items’tag spaces.
!"
!"#$%
&$'($%
)!'*$%
!"
#$"!"#$%
"#$&$'($%
%&"
%'"
#&"
%#$)!'*$%
(&"
()"
!"#$% #$"#&"!"
Figure 4.2: Deriving tagging information at the user level as UT, and the item level as IT,by aggregating over the item and user dimensions respectively.
The ratings matrix R can be represented by its row vectors:
R= [−→u1 , . . . ,−→uk ]T , −→uk = [xk,1, . . . , xk,L]
T , k = 1, . . . , K ,
where each row vector −→ukT corresponds to a user profile, which represents the items that
user added to his profile. R can also be decomposed into column vectors:
R= [−→i1 , . . . ,
−→il ],−→il = [x1,l , . . . , xK ,l]
T , l = 1, . . . , L,
where each column vector−→il represents an item profile, containing all users that have
added that item. We can decompose the UI, UT, and IT matrices in a similar fashion. We
1Note that this would not be the case if R contained explicit, non-binary ratings.

Chapter 4. Folksonomic Recommendation 58
will also refer to the user and item profiles taken from the UI matrix as −→uk and−→il . We
decompose the UT and IT matrices, which have the same number of columns M , into rowvectors in the following way:
UT= [−→d1 , . . . ,
−→dk ]
T ,−→dk = [yk,1, . . . , yk,M]
T , k = 1, . . . , K
IT= [−→f1 , . . . ,
−→fl ]
T ,−→fl = [zl,1, . . . , zl,M]
T , l = 1, . . . , L
The vectors−→dk and
−→fl are the tag count vectors for the users and items respectively.
Formally, the goal of each of the recommendation algorithms discussed in this chapter isto rank-order all items that are not yet in the profile of the active user uk (so xk,l = ;) sothat the top-ranked item is most likely to be a good recommendation for the active user.To this end, we predict a rating or score bxk,l for each item that user uk would give to itemil . In our social bookmarking scenario we do not have explicit ratings information (e.g.,4 out of 5 stars), so we try to predict whether a user will like an item or not. The finalrecommendations for a user RECS(uk) are generated by rank-ordering all items il by theirpredicted rating bxk,l as follows:
RECS(uk) = { il | rank bxk,l , xk,l = ; }. (4.1)
Only items not yet in the user’s profile −→uk are considered as recommendations (xk,l = ;).Regardless of how the ratings bxk,l are predicted, we always generate the recommendationsaccording to Equation 4.1.
4.2 Popularity-based Recommendation
One of the most straightforward recommendation strategies is to recommend the most pop-ular content in a system to every user. Such a popularity-based recommendation algorithmranks the items in the system by popularity, and presents every user with this list of rec-ommendations, minus the items the user already owns. Recommending items based solelyon popularity in the system without any regard for personal preferences can be expected toproduce poor recommendations. The list of most popular items reflects the combined tastesof all users in the system, and thus represents the ‘average’ user of the system. Rather fewactual users will be similar to this average user.
In general, most users have only a few of the most popular items in their profile. Themajority of their items, however, are in the long tail of the item distribution, and not inthe list of most popular content. As a popularity-based algorithm cannot reach into thelong tail, it cannot be expected to provide novel recommendations. We therefore considerpopularity-based recommendations to serve as a weak baseline. We include the algorithmin this chapter, because popularity-based recommendations have become a standard feature

Chapter 4. Folksonomic Recommendation 59
of many social news and social bookmarking websites, and therefore a staple algorithm tocompare new algorithms against (Nakamoto et al., 2008; Zanardi and Capra, 2008; Wetzkeret al., 2009). Delicious is one example of such a social bookmarking website that usespopularity-based recommendation2. We therefore include it as our weak baseline to showhow much more sophisticated algorithms can improve upon a popularity-based algorithm.
Formally, we define popularity-based recommendation as calculating a normalized popular-ity score bxk,l for each item according to Equation 4.2:
bxk,l =
�
�{−→il | xa,l 6= ; }
�
�
K, (4.2)
where the total number of users that have added item il is counted and normalized bydividing it by the total number of users K in the data set. Table 4.1 contains the results ofpopularity-based recommendation runs on our four data sets. We reiterate here for the sakeof the reader that we refer to the BibSonomy data sets containing scientific articles and Webbookmarks as BibArt and BibBoo respectively. For the sake of convenience we include themonce in Table 4.1 as well.
Table 4.1: Results of the popularity-based baseline. Reported are the MAP scores.
Runbookmarks articles
BibSonomy Delicious BibSonomy CiteULike(BibBoo) (Delicious) (BibArt) (CiteULike)
Popularity baseline 0.0044 0.0022 0.0122 0.0040
As expected, the results show that popularity-based recommendation does not achieve veryhigh scores. Popularity-based recommendation achieves its highest MAP scores on the twosmallest data sets, BibBoo and BibArt, and the lowest scores are achieved on the Deliciousdata set. However, all scores are unlikely to be of practical value for most users however.Popularity-based recommendation achieves its highest P@10 score on BibArt at 0.0143,which means that on average only 0.14 correct items can be found among the top 10 ofrecommended items. The highest MRR rank score on BibArt is 0.0565. This means that, onaverage, the first relevant withheld item is found at rank 18. The lowest MRR score on theDelicious data set means that the first relevant item there is found at rank 51 on average.Most users are unlikely to go through the first 50 recommended items to find only one thatwould be of value to them.
The MAP scores on the CiteULike data set are high in comparison to Delicious, the otherlarge data set. It is easier for a popularity-based algorithm to deal with data sets with asmaller number of total items. With less items in total, the probability of a user’s item to bepart of the fixed-size set of most popular items is larger. Another pattern we see is that thescores on the data sets covering scientific articles are higher than those on the bookmarksdata sets at corresponding data set sizes. We believe this is a reflection of the greater topical
2According to http://www.seomoz.org/blog/reddit-stumbleupon-delicious-and-hacker-news-algorithms-exposed (last visited: July 29, 2009).

Chapter 4. Folksonomic Recommendation 60
diversity of social bookmarking websites over social reference managers as we mentionedearlier in Subsection 3.4.1. The greater diversity is reflected in a more difficult predictiontask with lower scores.
4.3 Collaborative Filtering
A common and well-understood source of information for recommendations are usage pat-terns: who added or rated what content in the system? As mentioned earlier in Chapter 2,the class of algorithms that operate on such transaction data are called Collaborative Fil-tering algorithms (CF). We distinguished between two classes of CF algorithms—memory-based and model-based—and described the strengths and weaknesses of both types. In theexperiments described in this chapter we focus on the k-Nearest Neighbor (k-NN) algo-rithm, one of the memory-based CF algorithms, and extend it in various ways to includetagging information in our TBCF algorithms. In this section we describe and establish thek-NN algorithm without tagging information as our strong baseline, and evaluate its per-formance on our four data sets. We implement and evaluate both the user-based and theitem-based variants of the k-NN algorithm as introduced earlier in Subsection 2.1.1.
We pick the k-NN algorithm because it is a well understood algorithm that can intuitivelybe extended to incorporate other additional information (Herlocker et al., 1999; Burke,2002). While model-based algorithms such as PLSA and matrix factorization have beenshown to outperform memory-based algorithms in several cases (Hofmann, 2004; Koren,2008), it is not always clear how to include extra information such as tags elegantly intothese algorithms. Furthermore, memory-based algorithms better allow for the generationof intuitive explanations of why a certain item was recommended to the user. We see suchfunctionality as an important component of social bookmarking systems, which rely heavyon user interaction and ease of use.
In the next Subsection 4.3.1 we formally define both variants of the k-NN algorithm. Wepresent the results of the experiments with these algorithms on our data sets in Subsection4.3.2, and discuss these results in Subsection 4.3.3.
4.3.1 Algorithm
The k-NN algorithm uses the behavior of similar users or items (the nearest neighbors) topredict what items a user might like, and comes in two ‘flavors’. In user-based filtering welocate the users most similar to the active users, and then look among their items to generatenew recommendations for the active users. In item-based filtering we locate the items mostsimilar to items in the active user’s profile, and order and present those similar items tothe active user as new recommendations. In both cases the recommendation process iscomprised of two steps: (1) calculating the similarity between the active object and otherobjects, and (2) using the N most similar neighboring objects to predict item ratings for

Chapter 4. Folksonomic Recommendation 61
the active user3. In the first step we calculate the similarities between pairs of users orpairs of items. Many different similarity metrics have been proposed and evaluated overtime, such as Pearson’s correlation coefficient and cosine similarity (Herlocker et al., 1999;Breese et al., 1998). We use cosine similarity in our experiments because it has often beenused successfully on data sets with implicit ratings (Breese et al., 1998; Sarwar et al., 2001).
User-based CF We first describe the user-based CF algorithm. User similarities are calcu-lated on the user profile vectors −→uk taken from the R matrix. We define the cosine similaritysimcosine(uk, ua) between two users uk and ua as
simcosine(uk, ua) =−→uk ·−→ua
||−→uk || ||−→ua ||
. (4.3)
The next step in user-based filtering is determining the top N similar users (or items) foruser uk. We denote this set as the Set of Similar Users SSU(uk) and define it as
SSU(uk) = { ua | rank simcosine(uk, ua)≤ N , xa,l 6= ; }, (4.4)
where we rank all users ua on their cosine similarity simcosine(uk, ua) to user uk (or onanother similarity metric), and take the top N . Consequently, |SSU(uk)| = N . For each userua, we only consider those items that ua added to his profile (xa,l 6= ;). The next step isto do the actual predictions for each item and generate the list of recommendations. Thepredicting score bxk,l of item il for user uk is defined as
bxk,l =∑
ua ∈ SSU(uk)
simcosine(uk, ua), (4.5)
where the predicted score is the sum of the similarity values (between 0 and 1) of all Nnearest neighbors that actually added item il (i.e., xa,l 6= ;). When applying user-basedfiltering to data sets with explicit ratings, it is common to scale bxk,l to a rating in the originalratings scale (Sarwar et al., 2001). We do not scale our prediction bxk,l as we are workingwith unary ratings and are only interested in rank-ordering the items by their predictedscore4.
A recurring observation from the literature about CF algorithms is that universally likeditems are not as useful in capturing similarity between users as less common items, see e.g.,Breese et al. (1998). Items that are added, rated, or purchased frequently can dominatethe search for similar items, making it difficult to provide the user with novel recommenda-tions. Adapted from the popular tf·idf term weighting algorithm from the field of IR (Saltonand Buckley, 1988), we also try mitigating the influence of frequently occurring items by
3Note that since we reserved the letter k to index the users, we use N instead to denote the number ofnearest neighbors.
4It is also common practice in CF to normalize the user’s ratings by subtracting the user’s average rating(Herlocker et al., 1999). However, we do not need to normalize in this manner, since we are working withimplicit, unary ratings.

Chapter 4. Folksonomic Recommendation 62
weighting the elements of −→uk with the inverse user frequency of the user’s items5. We definethe inverse user frequency of item il as
idf(il) = logK
|{−→il | xa,l 6= ; }|
. (4.6)
We then define user profile vectors−→u′k weighted by the inverse user frequency as
−→u′k =
[xk,1 · idf(i1), . . . , xk,L · idf(iL)]T . Similarity between two idf-weighted user vectors is alsocalculated using the cosine similarity. We will refer to these idf-weighted runs as U-IDF-SIM
and to the runs without idf-weighting, which effectively use binary vectors, as U-BIN-SIM.
Item-based CF The item-based k-NN algorithm follows the same general principle as theuser-based filtering algorithm. Instead of comparing users directly, we try to identify thebest recommendations for each of the items in a user’s profile. In other words, for item-based filtering we calculate the similarities between the test items of the active user uk andthe other items that uk has not yet added (so xk,b = ;). Item similarities are calculated on
the item profile vectors−→il taken from the R matrix. Similar to user similarity, we define
cosine similarity simcosine(il , ib) between two items il and ib as
simcosine(il , ib) =−→il ·−→ib
||−→il || ||
−→ib ||
. (4.7)
Analogous to user-based filtering, we can also suppress the influence of the most prolificusers, i.e., users that have added a disproportionately large number of items to their profile,such as bots or spam users. This inverse item frequency of a user uk is defined as
idf(uk) = logL
|{ −→uk | xk,b 6= ; }|. (4.8)
We then define item profile vectors−→i′l weighted by the inverse item frequency as
−→i′l = [x1,l ·
idf(u1), . . . , xK ,l ·idf(uK)]T . Again, we calculate the similarity between two idf-weighted itemvectors using cosine similarity. The next step is to identify the neighborhood of most similaritems. We define the top N similar items as the Set of Similar Items SSI(il)
SSI(il) = { ib | rank simcosine(il , ib)≤ N , xk,b 6= ; }, (4.9)
where we rank all items ib on their cosine similarity simcosine(uk, ua) to item il (or on anothersimilarity metric), and take the top N . For each item ib, we only consider those items thatare most similar to the items uk added to his profile (xk,b 6= ;). The next step is to do theactual predictions for each item and generate the list of recommendations. The predictedscore bxk,l of item il for user uk is defined as
5We refer to both the inverse user frequency and the inverse item frequency with id f for clarity and consis-tency with previous work.

Chapter 4. Folksonomic Recommendation 63
bxk,l =∑
ib ∈ SSI(il)
simcosine(il , ib), (4.10)
where the predicted score is the sum of the similarity values (between 0 and 1) of all themost similar items that were added by user uk (i.e., xk,b 6= ;). The final recommendationsRECS(uk) for user uk for both algorithms are then generated as described in Section 4.1.We refer to these item-based CF runs with and without idf-weighting runs as I-IDF-SIM andI-BIN-SIM respectively. For the convenience of the reader, we have included a glossary inAppendix B that lists all of the run names used in Chapter 4 with a brief description.
Determining the Optimal Number of Nearest Neighbors After the user and item simi-larities are calculated, the top N neighbors are used to generate the recommendations. Fork-NN classifiers, the neighborhood size is an algorithm parameter that can significantly in-fluence prediction quality. Using too many neighbors might smooth the pool from whichto draw the predictions too much in the direction of the items with the highest generalpopularity, whereas not considering sufficient neighbors might result in basing too manydecisions on accidental similarities.
We use our 10-fold cross-validation setup to optimize the number of neighbors N as de-scribed in Subsection 3.4.2. The questions remains of what values of N should we examine?Examining all possible values from one single neighbor to considering all users or items asneighbors (where N = K or L respectively) would be a form of overfitting in itself, as wellas computationally impractical on the larger data sets. We therefore follow an iterativedeepening approach as described by Van den Bosch (2004) for selecting the values of N .We construct a clipped, pseudo-quadratic series of 100 iterations. For each iteration q, theN value is determined by N = 1.1q, rounded off to the nearest integer. As an example welist the first 40 unique values for N (corresponding to 55 iterations):
1, 2, 3, 4, 5, 6, 7, 8, 9, 10, 11, 13, 14, 15, 17, 19, 21, 23, 25, 28, 30, 34, 37,41, 45, 49, 54, 60, 66, 72, 80, 88, 97, 106, 117, 129, 142, 156, 171, 189, . . .
We employ the following heuristic optimization procedure to find the optimal number ofneighbors. We keep doing additional iterations and evaluating values of N as long as theMAP score keeps increasing. We stop if the MAP score remains the same or decreases for anew value of N . To prevent the problem of ending up in a local maximum, we always take 5more additional steps. If the MAP score has not increased statistically significantly anywherein those 5 steps, then we take as our N the value corresponding to the maximum MAP scorewe encountered so far. If there is a significant increase in MAP within those 5 extra steps,we assume we found a local maximum and keep evaluating additional iterations. When wereach the maximum for N (the number of users or items in the data set, depending on thealgorithm) we stop and take as N the value corresponding to the highest MAP score. Forexample, if the MAP score stops increasing at when N = 13, we examine the next 5 N valuesfrom 14 to 21. If none of those additional runs have MAP scores significantly higher thanthe MAP for N = 13, we take the N with the maximum MAP score in the interval [13, 21].

Chapter 4. Folksonomic Recommendation 64
4.3.2 Results
The relatively low scores achieved by the popularity-based algorithm of the previous sec-tion mean that there is much room for improvement. Table 4.2 shows the results of thetwo user-based and item-based variants of the k-NN algorithm. As expected, the k-NN al-gorithm outperforms popularity-based recommendation on all four data sets, with improve-ments ranging from a 109% increase on Delicious to a more than twenty-fold increase onCiteULike. These improvements are statistically significant on all data sets except Delicious.
Table 4.2: Results of the k-Nearest Neighbor algorithm. Reported are the MAP scores aswell as the optimal number of neighbors N . Best-performing runs for each data set areprinted in bold. The percentage difference between the best popularity-based run and thebest CF run is indicated in the bottom row of the table.
Runsbookmarks articles
BibSonomy Delicious BibSonomy CiteULikeMAP N MAP N MAP N MAP N
Popularity baseline 0.0044È - 0.0022È - 0.0122È - 0.0040È -U-BIN-SIM 0.0258Î 6 0.0046È 15 0.0865Î 4 0.0746Î 15U-BIN-IDF-SIM 0.0277Î 13 0.0040È 15 0.0806Î 4 0.0757Î 15I-BIN-SIM 0.0224Î 13 0.0027È 25 0.0669Î 37 0.0826Î 117I-BIN-IDF-SIM 0.0244Î 34 0.0025È 14 0.0737Î 49 0.0887Î 30% Change +529.5% +109.1% +609.0% +2117.5%
User-based filtering outperforms item-based filtering on three of four data sets; only onCiteULike does item-based filtering work better, where this difference is also statisticallysignificant (p < 0.05). The other differences between user-based and item-based filteringare not significant. There appears to be no clear advantage to applying idf-weighting to theprofile vectors: there are small differences in both directions, but none of the differencesbetween the runs with and without idf-weighting are significant. In general, it seems thatbookmark recommendation is more difficult than article recommendation: even within thesame collection, recommending BibSonomy bookmarks on BibBoo achieves MAP scores thatare nearly three times as low as recommending BibSonomy articles using BibArt. Whilethe BibArt and CiteULike performance numbers are about equal despite the size differencebetween the two data sets, the difference between BibBoo and Delicious is much larger.Finally, we see that the optimal number of neighbors tends to be larger for item-basedfiltering than for user-based filtering, but the actual number seems to be data set dependent.
4.3.3 Discussion
Our first observation is that memory-based CF algorithms easily outperform a recommenda-tion approach based solely on popularity. This was to be expected as recommending itemsbased solely on popularity in the system without any regard for personal preferences canbe expected to produce poor recommendations. In contrast, CF learns the personal pref-erences of users, leading to better, more personalized recommendations. The user-basedfiltering algorithm achieved higher MAP scores on three of our four data sets, althoughthese differences were not statistically significant. What could be the explanation for these

Chapter 4. Folksonomic Recommendation 65
differences between user-based and item-based filtering? A possible explanation for this isthat the average number of items per user is much higher than the average number of usersper item. Since there are more items to potentially match, calculating a meaningful overlapbetween user profile vectors could be easier than between item profile vectors. This couldalso explain why item-based filtering works worst on Delicious, as it has the lowest averageat 1.6 users per item.
The difference in the optimal number of neighbors between user-based and item-based canalso be explained by this. The average number of users per item is much lower than theaverage number of items per users, which makes it more difficult to calculate meaningfuloverlap between item profile vectors. It is then understandable that the item-based filteringalgorithm would need more nearest neighbors to generate correct predictions. However,the user profile vectors in our data sets are slightly more sparse than the item profile vec-tors, which would put user-based filtering at a disadvantage as there might be less overlapbetween the different users. In practice, these two forces are in balance, leading to the lackof significant differences between user-based and item-based filtering.
A second observation was that recommending bookmarks appears to be more difficult thanrecommending scientific articles: MAP scores on the article data sets are nearly three timesas high as the MAP scores on the bookmarks data sets. We believe this reflects that bookmarkrecommendation is a more difficult problem because of the open domain. In our article rec-ommendation task there may be many difficult research areas and topics, but in general thetask and domain is pretty well-defined: academic research papers and articles. In contrast,the Delicious and BibBoo data sets cover bookmarked Web pages, which encompass manymore topics than scientific articles tend to do. Users can be expected to have more differenttopics in their profile, making it more difficult to recommend new, interesting bookmarksbased on their profiles.
To determine whether this explanation is correct, we need to show that user profiles con-taining Web bookmarks are topically more diverse that profiles containing only scientificarticles. In all of our data sets we have topic representations of the content in the form oftags. Tags often represent the intrinsic properties of the items they describe, and we canuse these tags to estimate how topically diverse the user profiles are in our four data sets.We can expect users with topically diverse profiles to have a smaller average tag overlapbetween their items. One metric that can be used to represent topical diversity is the aver-age number of unique tags per user as reported in Table 3.2. These averages are 203.3 and192.1 for BibBoo and Delicious respectively, which is significantly higher than the 79.2 and57.3 for BibArt and CiteULike.
However, it is possible that Delicious and BibBoo users simply use more tags to describetheir bookmarks on average than users who describe scientific articles, but still have a lowtopical diversity. To examine this, we calculate the average Jaccard overlap between thetags assigned to the item pairs for each user profile separately, and then generate a macro-averaged tag overlap score for each data set. This number represents an approximationof the topical diversity of a data set. We find that the average tag overlap for BibBooand Delicious is 0.0058 and 0.0001 respectively, whereas for BibArt and CiteULike it is0.0164 and 0.0072 respectively. This seems to be in line with our assumption that bookmark

Chapter 4. Folksonomic Recommendation 66
recommendation is a more difficult task, because the user profiles are more diverse, andtherefore harder to predict. The difference between performance on BibBoo and Deliciousmight be explained by the fact that BibSonomy, as a scientific research project, attracts alarger proportion of users from academia. In contrast, the scientific community is only asubset of the user base of Delicious, which could again lead to a greater diversity in topics.
4.4 Tag-based Collaborative Filtering
If we only applied the standard memory-based CF algorithms to our data sets, we wouldbe neglecting the extra layer of information formed by the tags, which could help us pro-duce more accurate recommendations. As mentioned before, we consider two options forincorporating the tags: (1) extending existing CF algorithms to create TBCF algorithms, or(2) recommending based on the entire tripartite graph (GBCF algorithms). In this sectionwe propose three different TBCF algorithms, corresponding to three different ways of ex-tending the standard k-NN algorithm to incorporate tag information and find like-mindedusers.
The first TBCF algorithm employs user and item similarities based on the overlap in tagsassigned to items. We discuss this algorithm in Subsection 4.4.1. Subsection 4.4.2 describesthe second type of TBCF algorithm, which calculate user and item similarities based onthe overlap in tagging intensity, without looking at the actual overlap between tags. Thethird TBCF algorithm, described in Subsection 4.4.3, combines tagging information withusage information by fusing together (1) the similarities based on tagging overlap, from thefirst type of TBCF algorithm, and (2) the similarities based on usage information, i.e., fromregular CF. We present the results of our experiments with these three TBCF algorithms inSubsection 4.4.4 and discuss the results in Subsection 4.4.5.
4.4.1 Tag Overlap Similarity
The folksonomies present in our four data sets carry with them an extra layer of connectionsbetween user and items in the form of tags. The tag layer can be used to examine other waysof generating similarities between users or items. For instance, users that assign many ofthe same tags and thus have more tag overlap between them, can be seen as rather similar.Items that are often assigned the same tags are also more likely to be similar than items thatshare no tag overlap at all. We propose calculating the user and item similarities based onoverlap in tagging behavior as opposed to usage information that only describes what itemsa user has added. We will refer to a TBCF algorithm using tag overlap similarities for CF asTOBCF.
What do we expect from such an approach? In the previous section we signaled that sparsityof user profile and item profile vectors can be a problem for the standard memory-based CFalgorithms. As users tend to assign multiple tags to an item—with averages ranging from3.1 to 8.4 in our data sets—when they post it to their personal profile, this means a reducedsparsity, which could lead to better predictions. We expect this effect to be the strongest

Chapter 4. Folksonomic Recommendation 67
for item-based filtering. On average, the number of tags assigned to an item is 2.5 timeshigher than the number of users who have added the item. This means that, on average,item profile vectors from the IT matrix are less sparse than item profile vectors from the UImatrix. This difference is not as well-pronounced for the items per user and tags per usercounts: in some data sets users have more items than tags on average, and more tags thanitems in other data sets. This leads us to conjecture that using tags for user-based filteringwill not be as successful.
Many different similarity metrics exist, but we restrict ourselves to comparing three metrics:Jaccard overlap, Dice’s coefficient, and the cosine similarity. The only difference betweenthis approach and the standard CF algorithm is in the first step, where the similarities arecalculated.
User-based Tag Overlap CF For user-based TOBCF, we calculate tag overlap on the UTmatrix or on the binarized version UTbinary, depending on the metric. These matrices arederived as shown in Figure 4.2. Both the Jaccard overlap and Dice’s coefficient are set-basedmetrics, which means we calculate them on the binary vectors from the UTbinary matrix. TheJaccard Overlap simJaccard(dk, da) between two users dk and da is defined as
simUT−Jaccard(dk, da) =|−→dk ∩
−→da |
|−→dk ∪
−→da |
. (4.11)
Likewise, Dice’s coefficient simDice(dk, da) is defined as
simUT−Dice(dk, da) =2|−→dk ∩
−→da |
|−→dk |+ |
−→da |
. (4.12)
We refer to the user-based runs with Jaccard overlap and Dice’s coefficient as UT-JACCARD-SIM and UT-DICE-SIM respectively. The cosine similarity is calculated in three different ways.First, we calculate it on the regular tag count vectors from UT as simUT−cosine−tf (dk, da),and on the binary vectors from the UTbinary matrix as simUT−cosine−binary(dk, da). In additionto this, we also experiment with idf-weighting of the tags in the user tag count vectorsaccording to Equation 4.6. We then calculate the cosine similarity simUT−cosine−tfidf (dk, da)between these weighted user profile vectors. In each case, the cosine similarity is calculatedaccording to
simUT−cosine(dk, da) =−→dk ·−→da
||−→dk || ||
−→da ||
. (4.13)
We refer to these three runs as UT-TF-SIM, UT-BIN-SIM, and UT-TFIDF-SIM respectively.
Item-based Tag Overlap CF For item-based TOBCF, we calculate the item-based versionsof the similarity metrics simIT−Jaccard( fl , fb), simIT−Dice( fl , fb), and simIT−cosine−binary(dk, da)on ITbinary. We calculate the tag frequency and weighted tag frequency vectors similarities

Chapter 4. Folksonomic Recommendation 68
simIT−cosine−tf (dk, da) and simIT−cosine−tfidf (dk, da) on IT. We refer to these five item-basedruns as IT-JACCARD-SIM, IT-DICE-SIM, IT-BIN-SIM, IT-TF-SIM, and IT-TFIDF-SIM respectively.
4.4.2 Tagging Intensity Similarity
Instead of looking at tag overlap as a measure of user or item similarity, we can also lookat another aspect of tagging behavior to locate kindred users or items: tagging intensity.Adding a tag costs the user a small amount of effort, which could signal that users are moreinvested in those items they to which assign many tags. Tagging intensity could thereforebe seen as an approximation to a user actively rating his items. Here, more effort investedin tagging corresponds to a higher rating for that item. If two users both assign many tagsto the same items and only few tags to other items, they can be thought of as being moresimilar in tagging behavior.
Naturally, users might very well assign many different tags to an item for different reasons.Some items might simply be too complex to describe by just one or two tags. Furthermore,the assumption that more richly tagged items would also be rated more highly by the usersis not without its caveats. Indeed, Clements et al. (2008a) investigated this for their dataset based on the LibraryThing6 data set. They compared actual book ratings to the numberof tags assigned to the books and found only a weak positive correlation between the two.We can not repeat this, since we only have unary ratings in our data sets. However, the ideahas its merits, since Clements et al. did not find any significant differences between usingactual ratings for recommendation compared to using the tag counts.
We propose our own user (and item) similarity metrics that compare users (and items)on the intensity of their tagging behavior. We will refer to the algorithms that use thesesimilarity metrics as TIBCF algorithms. The UI matrix contains the tag counts associatedwith each post in a data set. These represent how many tags were assigned to a certain itemby a user. For user-based TIBCF we calculated these tag intensity-based similarities on theuser profile vectors from UI according to Equation 4.3. For item-based TIBCF we calculatethe item similarities on the item profile vectors from UI according to Equation 4.7. The restof the approach follows the standard k-NN algorithm described in Subsection 4.3.1.
4.4.3 Similarity Fusion
The third TBCF algorithm we propose is one that combines two different algorithms: (1) thestandard k-NN CF algorithm from Section 4.3, which uses data about all users’ preferencesfor items to generate recommendations, and (2) the TOBCF algorithm from Subsection 4.4.1,which looks at the overlap in tagging behavior to identify the like-minded users and gen-erate recommendations. As both approaches use different information to generate theirrecommendations, it is possible that an approach that combines the best of both worlds willoutperform the individual approaches.
6http://www.librarything.com
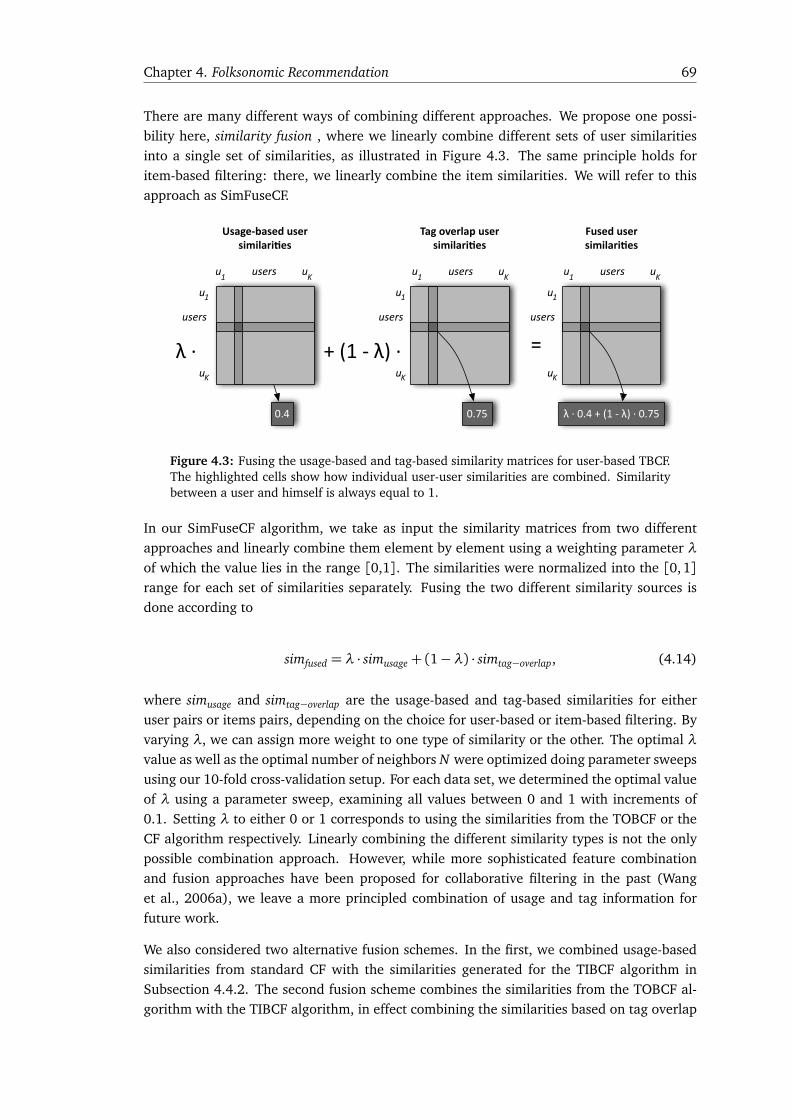
Chapter 4. Folksonomic Recommendation 69
There are many different ways of combining different approaches. We propose one possi-bility here, similarity fusion , where we linearly combine different sets of user similaritiesinto a single set of similarities, as illustrated in Figure 4.3. The same principle holds foritem-based filtering: there, we linearly combine the item similarities. We will refer to thisapproach as SimFuseCF.
λ∙ +(1‐λ)∙
0.4 0.75
=
λ∙0.4+(1‐λ)∙0.75
Usage‐basedusersimilari/es
Tagoverlapusersimilari/es
Fusedusersimilari/es
users
u1
uK
usersu1 uK
users
u1
uK
usersu1 uK
users
u1
uK
usersu1 uK
Figure 4.3: Fusing the usage-based and tag-based similarity matrices for user-based TBCF.The highlighted cells show how individual user-user similarities are combined. Similaritybetween a user and himself is always equal to 1.
In our SimFuseCF algorithm, we take as input the similarity matrices from two differentapproaches and linearly combine them element by element using a weighting parameter λof which the value lies in the range [0,1]. The similarities were normalized into the [0,1]range for each set of similarities separately. Fusing the two different similarity sources isdone according to
simfused = λ · simusage+ (1−λ) · simtag−overlap, (4.14)
where simusage and simtag−overlap are the usage-based and tag-based similarities for eitheruser pairs or items pairs, depending on the choice for user-based or item-based filtering. Byvarying λ, we can assign more weight to one type of similarity or the other. The optimal λvalue as well as the optimal number of neighbors N were optimized doing parameter sweepsusing our 10-fold cross-validation setup. For each data set, we determined the optimal valueof λ using a parameter sweep, examining all values between 0 and 1 with increments of0.1. Setting λ to either 0 or 1 corresponds to using the similarities from the TOBCF or theCF algorithm respectively. Linearly combining the different similarity types is not the onlypossible combination approach. However, while more sophisticated feature combinationand fusion approaches have been proposed for collaborative filtering in the past (Wanget al., 2006a), we leave a more principled combination of usage and tag information forfuture work.
We also considered two alternative fusion schemes. In the first, we combined usage-basedsimilarities from standard CF with the similarities generated for the TIBCF algorithm inSubsection 4.4.2. The second fusion scheme combines the similarities from the TOBCF al-gorithm with the TIBCF algorithm, in effect combining the similarities based on tag overlap

Chapter 4. Folksonomic Recommendation 70
and tagging intensity. Preliminary experiments suggested, however, that these two fusionschemes do not produce any acceptable results. We therefore restricted ourselves to fusingthe usage-based similarities from CF with the tag overlap similarities from TOBCF.
4.4.4 Results
Below we present the results for our three algorithms based on tag overlap (TOBCF), tag-ging intensity (TIBCF), and similarity fusion (SimFuseCF).
Tag Overlap Similarity Table 4.3 shows the results of the user-based and item-based vari-ants of the TOBCF algorithm. We consider the best-performing CF runs from Section 4.3runs as the baseline runs and compare them to the TOBCF runs. What we see in Table 4.3is that item similarities based on tag overlap work well for item-based filtering, as three ofour four data sets show considerable improvements over the best CF baseline runs. Per-formance increases range from 27% on BibArt to almost 120% on Delicious, but these areonly statistically significant on the Delicious data set. A first observation is the oppositetrend for user-based filtering, where tag overlap results in significantly worse scores for al-most all variants on all data sets, with performance decreases ranging from 40% to 63%.This means that using tag overlap in item-based filtering now makes item-based filteringoutperform user-based filtering on all four data sets. A second observation is that on thebookmark collections tag overlap performs even worse for user-based filtering than on thedata sets containing scientific articles. The reverse seems to be true for item-based filtering.It seems that the domain of the social bookmarking website influences the effectiveness ofthe TOBCF algorithm.
The results of the different tag overlap metrics tend to be close together and differencesbetween them are not statistically significant. Even though the best performing metrics aredependent on the data set, we do see that the metrics operating on the binary vectors fromthe UTbinary and ITbinary matrices are among the top performing metrics. It is interesting tonote that although that the runs with idf-weighting tend to perform worst of all five metrics,the IT-TFIDF-SIM produces the best results on the BibArt collection.
A final observation concerns the number of nearest neighbors N used in generating the rec-ommendations. In general, the optimal number of neighbors is slightly lower than whenusing similarities based on usage data. For the item-based runs on BibBoo and BibArt thenumber of neighbors is lower than for user-based which is unexpected, given the neighbor-hood sizes of regular CF in Table 4.2.
Tagging Intensity Similarity Table 4.4 shows the results of the two user-based and item-based variants of the k-NN algorithm that use similarities based on tagging intensity. Tag-ging intensity does not appear to be representative of user or item similarity: 14 out of16 runs perform worse than the best CF runs on those data sets, but most of them notsignificantly. It is interesting to note that tagging intensity similarities do produce smallimprovements in MAP scores on the user-based runs on Delicious. If we disregard thesestatistically not significant improvements, using tagging intensity as a source of user or item

Chapter 4. Folksonomic Recommendation 71
Table 4.3: Results of the TOBCF algorithm. Reported are the MAP scores as well as theoptimal number of neighbors N . Best-performing tag overlap runs for both user-based anditem-based are printed in bold. The percentage difference between the best baseline CFruns and the best tag overlap runs are indicated after each filtering type.
Runsbookmarks articles
BibSonomy Delicious BibSonomy CiteULikeMAP N MAP N MAP N MAP N
Best UB CF run0.0277È 13 0.0046È 15 0.0865È 4 0.0757È 15(U-BIN-IDF-SIM) (U-BIN-SIM) (U-BIN-SIM) (U-BIN-IDF-SIM)
UT-JACCARD-SIM 0.0070È 8 0.0015È 11 0.0459È 6 0.0449È 5UT-DICE-SIM 0.0069Ï 6 0.0007È 6 0.0333Ï 4 0.0439È 2UT-BIN-SIM 0.0102È 5 0.0017È 11 0.0332Ï 4 0.0452È 3UT-TF-SIM 0.0069Ï 2 0.0015Ï 25 0.0368È 4 0.0428È 8UT-TFIDF-SIM 0.0018Ï 6 0.0013Ï 17 0.0169È 2 0.0400È 2% Change over best UB CF run -63.2% -63.0% -46.9% -40.7%
Best IB CF run0.0244È 34 0.0027È 25 0.0737È 49 0.0887È 30(I-BIN-IDF-SIM) (I-BIN-SIM) (I-BIN-IDF-SIM) (I-BIN-IDF-SIM)
IT-JACCARD-SIM 0.0370È 3 0.0083Í 21 0.0909È 6 0.0810È 14IT-DICE-SIM 0.0317È 2 0.0089Í 25 0.0963È 8 0.0814È 8IT-BIN-SIM 0.0334È 2 0.0101Í 23 0.0868È 5 0.0779È 10IT-TF-SIM 0.0324È 4 0.0100Í 11 0.0823È 4 0.0607È 17IT-TFIDF-SIM 0.0287È 8 0.0058È 7 0.1100È 7 0.0789È 21% Change over best IB CF run +51.6% +274.1% +49.3% -8.2%
% Change over best CF run +33.6% +119.6% +27.2% -8.2%
similarity decreases performance by around 20% on average. In fact, the performance ofitem-based filtering on Delicious is even worse than the popularity-based algorithm.
Table 4.4: Results of the TIBCF algorithm. Reported are the MAP scores as well as theoptimal number of neighbors N . Best-performing tagging intensity runs for each data setare printed in bold. The percentage difference between the best baseline CF run and thebest CF run with tagging intensity similarities is indicated in the bottom row of the table.
Runsbookmarks articles
BibSonomy Delicious BibSonomy CiteULikeMAP N MAP N MAP N MAP N
Best CF run0.0277È 13 0.0046È 15 0.0865È 4 0.0887È 15(U-BIN-IDF-SIM) (U-BIN-SIM) (U-BIN-SIM) (I-BIN-IDF-SIM)
U-TF-SIM 0.0229È 13 0.0061È 60 0.0711È 11 0.0700È 14U-TFIDF-SIM 0.0244È 8 0.0052È 45 0.0705È 9 0.0709È 37I-TF-SIM 0.0179È 21 0.0004È 10 0.0624È 17 0.0774È 34I-TFIDF-SIM 0.0140È 21 0.0013Ï 10 0.0654È 17 0.0800È 34% Change -11.9% +32.6% -17.8% -9.8%
Similarity Fusion Table 4.5 shows the results of the experiments with the user-based anditem-based filtering variants of the SimFuseCF algorithm. Fusing the different similaritiestogether does not unequivocally produce better recommendations. For user-based filteringwe see modest improvements of up to 26% for the two bookmark data sets BibBoo andDelicious. Similarity fusion, however, does not help us on the BibArt and CiteULike datasets. For item-based filtering, we see small improvements in MAP scores for two runs,

Chapter 4. Folksonomic Recommendation 72
BibBoo and Delicious after fusing the item-based similarities from the two best componentruns. The other two item-based SimFuseCF runs perform worse than the best componentruns. However, none of the performance increases or almost none of the decreases arestatistically significant. It is interesting to note that in two cases the SimFuseCF algorithmactually performs worse than both component runs. Apparently, the combined similaritiescancel each other out to a certain extent there.
Finally, when we look at the optimal λ values we see that for user-based filtering the λvalues are closer to 1, while for item-based filtering the λ values are closer to 0. This isto be expected as it corresponds to assigning more weight to the similarities of the bestperforming component run of each fusion pair.
Table 4.5: Results of the SimFuseCF algorithm. Reported are the MAP scores as well asthe optimal number of neighbors N and the optimal value of λ. We report each of thebest performing component runs and print the best-performing SimFuseCF runs in boldfor both user-based and item-based filtering. The percentage difference between the bestcomponent run and the best fused run is indicated in the bottom rows of the two tables.
Runsbookmarks articles
BibSonomy Delicious BibSonomy CiteULikeMAP N λ MAP N λ MAP N λ MAP N λ
Best UB CF run0.0277È 13 - 0.0046È 15 - 0.0865È 4 - 0.0757È 15 -
(U-BIN-IDF-SIM) (U-BIN-SIM) (U-BIN-SIM) (U-BIN-IDF-SIM)
Best UB tag run0.0102È 5 - 0.0017È 11 - 0.0459È 6 - 0.0452È 3 -
(UT-BIN-SIM) (UT-BIN-SIM) (UT-JACCARD-SIM) (UT-BIN-SIM)User-based fusion 0.0350È 8 0.8 0.0056È 45 0.7 0.0319Ï 8 0.8 0.0554È 25 0.7% Change +26.4% +21.7% -63.1% -26.8%
Runsbookmarks articles
BibSonomy Delicious BibSonomy CiteULikeMAP N λ MAP N λ MAP N λ MAP N λ
Best IB CF run0.0244È 34 - 0.0027È 25 - 0.0737È 49 - 0.0887È 30 -
(I-BIN-IDF-SIM) (I-BIN-SIM) (I-BIN-IDF-SIM) (I-BIN-IDF-SIM)
Best IB tag run0.0370È 21 - 0.0101È 23 - 0.1100È 5 - 0.0814È 34 -
(IT-JACCARD-SIM) (IT-BIN-SIM) (IT-TFIDF-SIM) (IT-DICE-SIM)Item-based fusion 0.0348È 15 0.3 0.0102È 25 0.3 0.1210È 14 0.1 0.0791È 28 0.4% Change -5.9% +1.0% +10.0% -10.8%
4.4.5 Discussion
Below we discuss the experimental results of our three algorithms based on tag overlap(TOBCF), tagging intensity (TIBCF), and similarity fusion (SimFuseCF).
Tag Overlap Similarity Earlier we saw that the benefits of using tag overlap are depen-dent on the type of TOBCF algorithm. While user-based TOBCF does not seem to get a boostfrom user-user similarities based on tag overlap, item-based TOBCF improves markedly byusing tag overlap between items as its similarity metric.
Why do we see this performance dichotomy? Earlier, in Subsection 4.4.1, we put forwardthat the reduction in sparsity from using tag overlap could produce better recommendationsfor item-based filtering. On average, the number of tags assigned to an item is 2.5 times

Chapter 4. Folksonomic Recommendation 73
higher than the number of users who have added the item. This means that, on average,item profile vectors from the IT matrix are less sparse than item profile vectors from theUI matrix. Using more values in the similarity calculation leads to a better estimate of thereal similarity between two items. We believe this is why using tag overlap works betterfor item-based filtering. For user-based TOBCF this difference is not as well-pronounced:in some data sets users have more items than tags on average, and more tags than itemsin other data sets. This explains why we do not see the same performance increase for theuser-based filtering runs based on tag overlap.
We also noted earlier that the performance on the bookmarks data sets shows the strongestreaction to using tag overlap: item-based TOBCF performs best on the bookmark data sets,while user-based TOBCF performs worst on them. The explanation for the lower perfor-mance of user-based TOBCF on bookmarks is that, as we showed earlier, the profiles ofbookmark users are more diverse topically speaking and therefore harder to match againstother profiles. As the tags assigned by the users to their bookmarks are about as numerousas their items, this does not reduce the sparsity, thereby not providing any help in matchingthe users up correctly. For item-based TOBCF, in the bookmarks case the sparsity is reducedby a factor 3 on average, while in the articles case sparsity is only reduced by a factor of 1.5.This means that sparsity is reduced more for bookmarks, and subsequently that items can bematched better on tag overlap in the bookmarks case, thereby improving performance morethan in the article case. In addition, performance on the bookmarks data sets was alreadylower, making it easier to achieve a bigger percentage-wise improvement. We do not have aspecific explanation for the particularly large increase in performance of item-based TOBCFon the Delicious data set. However, it should be noted that even the best scores on Deliciousare still considerably lower than on the other data sets; the size of the Delicious data setwith its magnitude more items makes recommendation difficult, no matter what metrics oralgorithms are used.
Tagging Intensity Similarity We found that the tagging intensity, i.e., the number of tagsusers assign to items, is not a good source of user and item similarity. Most of our TIBCFruns that used tagging intensity similarities performed considerably worse than the baselinek-NN algorithm that uses transaction data to locate the nearest neighbors. How can weexplain this? The simplest and most likely explanation is the number of tags simply is nota good predictor for interest in an item, and that the topical overlap between items cannotbe captured by the number of tags assigned to them.
One way of investigating this is by looking at the topical overlap between users and itemsas we did in Subsection 4.3.3 using the tags. We assume that, more often than not, a userwill be interested in new items that share some overlap in topics with the items alreadyowned by that user. If tagging intensity is indeed a good indicator of topical overlap, thenthe similarity between two users in tagging intensity should be a good predictor of thetopical similarity between those users, and vice versa. We therefore correlate (1) the cosinesimilarity between two users based on the tags they assigned with (2) the cosine similaritybetween two users based on how intensively they tagged their items7. What we find is
7Effectively, this means we are correlating the user similarities of the UT-TF-SIM run with the user similaritiesof the U-TF-SIM run.

Chapter 4. Folksonomic Recommendation 74
that there is a negligible correlation between these similarities: the correlations range from-0.017 to 0.076.
We posited earlier that the latent complexity of the items might govern how many tagsare needed to describe them—more complex items might simply require more tags. Wetherefore also correlated the item similarities based on tag overlap with the item similaritiesbased on how intensely they were tagged8. Here again, we found similar, weak correla-tions between the two similarity sets. These findings lead us to conclude that looking attagging intensity is not a good way of locating nearest neighbors in social bookmarking sys-tems. Finally, it is interesting to note that tagging intensity similarities did produce a smallimprovement in MAP scores on the user-based runs on Delicious. We do not have a clearexplanation for this.
Similarity Fusion The results of our SimFuseCF algorithm were not clear-cut: some runson some data sets saw an increase in performance, while others saw performance drops,sometimes even below the scores of the original component runs. User-based SimFuseCFworked best on the two bookmark data set BibBoo and Delicious. Here, the sum of theparts is greater than the whole as both usage-based information and tag overlap are bestcombined to match users. There appears to be no clear pattern in when similarity fusionyields improvements and when it does not. From the lack of statistically significant resultswe may conclude that similarity fusion is neither an effective nor an efficient method ofrecommendation: scores are not improved significantly, which does not warrant the doubleeffort of calculating two sets of similarities and merging them—computationally the mostexpensive part of the k-NN algorithm. We believe this to be because the distributions of thetwo set of similarities are too different even after normalization. If the optimal number ofneighbors is very different for the two algorithms using the two sets of similarities, fusing thesimilarities themselves does not results in the best of both worlds, but rather a sub-optimalcompromise between the optimal neighborhood sizes.
4.5 Related work
Social bookmarking and social tagging in general are relatively new phenomena and as aresult there is not a large body of related work. We saw earlier in Chapter 2 that the majorityof the literature so far has focused on the information seeking and organization aspects oftags and on the benefits of tags for information retrieval and Web search. In terms ofrecommendation, most of the research efforts have focused on tag recommendation. Withthe exception of the 2008 Discovery Challenge, there is also an striking absence of largescale experimentation and evaluation initiatives such as TREC or CLEF in the field of IR.This lack of standardized data sets combined with the novelty of social bookmarking makesfor a relatively small space of related work on item recommendation for social bookmarking.We discuss three different types of related work: graph-based, memory-based, and model-based recommendation for social bookmarking
8Effectively correlating the item similarities of IT-TF-SIM runs with item similarities of I-TF-SIM runs.

Chapter 4. Folksonomic Recommendation 75
Graph-based Recommendation One of the first approaches to recommendation for socialbookmarking websites was done by Hotho et al. (2006a), who proposed a graph-basedalgorithm called FolkRank. They start by constructing an undirected tripartite graph of allusers, items, and tags, and perform the same aggregations over these three dimensions aswe described in Section 4.1 to arrive at the 2D projections UI, UT, and IT. They combinethese into a single square matrix with as many rows as nodes in the original tripartitegraph. Like PageRank (Page et al., 1998), the FolkRank algorithm is based on a randomwalk model that calculates the fully converged state transition probabilities by taking awalk of infinite length. The probabilities then represent the rank-ordering of the users,items, and tags on popularity. FolkRank also allows for the incorporation of a preferencevector, similar to the teleporting component of PageRank. In this preference vector, specificusers, items, or tags can be assigned a higher weight to generate user- or topic-specificrankings. They empirically evaluate their algorithm on a self-crawled Delicious data set,making it difficult to compare with other approaches. Clements et al. (2008a) also proposeda random walk model for item recommendation. They test their approach on a data setbased on LibraryThing, which includes both tagging and rating information. They constructa similar matrix like Hotho et al., but include the ratings matrix R from their data set insteadof the UI matrix. They also incorporate self-transition probabilities in the matrix and usethe walk length as an algorithm parameter. We describe this approach in more detail in thenext section when we compare it directly with our own approaches.
Memory-based Recommendation Adaptations of memory-based algorithms that includeinformation about the tags assigned by users to items have also been proposed. Szomszoret al. (2007) proposed ranking items by the tag overlap with the active user’s tag cloudand compare it to popularity-based recommendation. They take on the task of movie rec-ommendation based on the Netflix data set9 and harvest the tags belonging to each moviefrom the IMDB10. Their approach corresponds to calculating the tag overlap on the regularUT matrix using simUT−cosine and tf·idf weighting. They found that tag overlap outper-formed popularity-based recommendation. Yin et al. (2007) also calculate direct user-itemsimilarities in their approach to recommending scientific literature. Nakamoto et al. (2007)augmented a user-based k-NN algorithm with tag overlap. They calculate the similaritiesbetween users using cosine similarity between the user tag profiles (i.e., simUT−cosine onthe regular UT matrix with tag frequency weighting). They evaluated their approach inNakamoto et al. (2008), where they compared it with popularity-based recommendation,which was outperformed by their tag-augmented approach. In their paper, Tso-Sutter et al.(2008) also propose a tag-aware k-NN algorithm for item recommendation. In calculatingthe user and item similarities they include the tags as additional items and users respectively.They then calculate cosine similarity on these extended profile vectors and fuse together thepredictions of the user-based and item-based filtering runs. We describe this approach inmore detail in the next section when we compare it directly with our own approaches. Za-nardi and Capra (2008) propose an approach called Social Ranking for tag-based searchin social bookmarking websites. Inspired by CF techniques, to find content relevant to thequery tags, they first identify users with similar interests to the active users. Content taggedby those users is scored higher, commensurate with the similarity between users based on
9http://www.netflixprize.com/10http://www.imdb.com/
Chapter 4. Folksonomic Recommendation 76
cosine similarity of the tag profiles (i.e., simUT−cosine on the regular UT matrix with tag fre-quency weighting). In addition, they expand the original query tags with related tags toimprove recall. Tag similarity is calculated on the TI matrix using cosine similarity and itemfrequency weighting. Their algorithm showed promising performance on a CiteULike dataset compared to popularity-based rankings of content. Finally, Amer-Yahia et al. (2008) ex-plore the use of item overlap and tag overlap to serve live recommendations to users on theDelicious website. They focus especially on using the nearest neighbors for explaining therecommendations: why was a certain item or user recommended?
Model-based Recommendation Symeonidis et al. (2008b) were among the first to pro-pose a model-based approach that incorporates tagging information. They proposed usingtensor decomposition on the third-order folksonomy tensor. By performing higher-orderSVD, they approximate weights for each user-item-tag triple in the data set, which can thenbe used to support any of the recommendation tasks. They evaluated both item and tagrecommendation on a Last.FM data set (Symeonidis et al., 2008b,a). Comparing it to theFolkRank algorithm (Hotho et al., 2006a), they found that dimensionality reduction basedon tensor decomposition outperforms the former approach. Wetzker et al. (2009) takea Probabilistic Latent Semantic Analysis (PLSA) approach, which assumes a latent lowerdimensional topic model. They extend PLSA by estimating the topic model from both user-item occurrences as well as item-tag occurrences, and then linearly combine the output ofthe two models. They test their approach on a large crawl of Delicious, and find it signifi-cantly outperforms a popularity-based algorithm. They also show that model fusion yieldssuperior recommendation independent of the number of latent factors.
4.6 Comparison to Related Work
While several different classes of recommendation algorithms are reported to have beenmodified successfully to include tag, it remains difficult to obtain an overview of best prac-tices. Nearly every approach uses a different data set, crawled from a different social book-marking website in a different timeframe. Looking closer, we can also find a large variationin the way these data sets are filtered on noise in terms of user, item, and tag thresholds, andthe majority of approaches are filtered more strongly than we proposed in Subsection 3.4.1.There is also a lack of a common evaluation methodology, as many researchers constructand motivate their own evaluation metric. Finally, with the exception of Symeonidis et al.(2008b) who compared their approach with FolkRank, there have been no other compar-isons of different recommendation algorithms on the same data sets using the same metric,making it difficult to draw any definite conclusions about the algorithms proposed.
In this thesis, we attempt to alleviate some of these possible criticisms. With regard to thedata sets, we have enabled the verification of our results by selecting publicly available datasets. In addition, we follow the recommendations of Herlocker et al. (2004) in selectingthe proper evaluation metric. In this section, we will compare two of the state-of-the-artgraph-based CF (GBCF) approaches with our own TBCF approaches on our data sets withthe same metrics to properly compare the different algorithms.

Chapter 4. Folksonomic Recommendation 77
In Subsections 4.6.1 and 4.6.2 we describe two GBCF algorithms in more detail. We presentthe experimental results of the GBCF algorithms in Subsection 4.6.3, and contrast themwith the results of our best-performing TBCF algorithms. We discuss this comparison inSubsection 4.6.4.
4.6.1 Tag-aware Fusion of Collaborative Filtering Algorithms
The first GBCF approach to which we want to compare our work is that of Tso-Sutter et al.(2008). In their paper, they propose a tag-aware version of the standard k-NN algorithm foritem recommendation on social bookmarking websites. We elect to compare our work to thisalgorithm, because it bears many similarities, yet calculates the user and item similarities ina different manner. Their approach consists of two steps: (1) similarity calculation and (2)similarity fusion. In the first step, they calculate the similarities between users and betweenitems based on the R matrix, but extend this user-item matrix by including user tags as itemsand item tags as users. Effectively, this means they concatenate a user’s profile vector −→uk
with that user’s tag vector−→dk , which is taken from UTbinary. For item-based filtering the item
profile vector−→il is extended with the tag vector for that item
−→fl , also taken from ITbinary.
Figure 4.4 illustrates this process.
User‐basedfiltering
Item‐basedfiltering
R UT
ITT
Dusers
itemstags
items
items
tags
users
tags
Figure 4.4: Extending the user-item matrix for tag-aware fusion. For user-based filtering,the UT matrix is appended to the normal UI matrix so that the tags serve as extra items touse in calculating user-user similarity. It does so by including user tags as items and itemtags as users. For item-based filtering, the transposed IT matrix is appended to the normalUI matrix so that the tags serve as extra users to use in calculating item-item similarity.Adapted from Tso-Sutter et al. (2008).
By extending the user and item profile vectors with tags, sparsity is reduced when calculat-ing the user or item similarities, compared to using only transaction data from R to calculatethe similarities. Adding the tags also reinforces the transaction information that is alreadypresent in −→uk and
−→il . At the end of this phase they use the k-NN algorithm with cosine sim-
ilarity to generate recommendations using both user-based and item-based filtering. Whengenerating recommendations, the tags are removed from the recommendation lists; only

Chapter 4. Folksonomic Recommendation 78
items are ever recommended. While this is related to our idea of similarity fusion, it is not
completely the same. We fuse together the similarities calculated on the separate −→uk and−→dk
vectors in the case of, for instance, user-based filtering11. Tso-Sutter et al. first fuse together
the −→uk and−→dk vectors and then calculate the similarity between profile vector pairs. The
difference is identical for item-based filtering.
In the second phase of their approach, similarity fusion, Tso-Sutter et al. (2008) fuse thepredictions of the user-based and item-based filtering algorithms together, to try to effec-tively capture the 3D correlations between users, items, and tags in social bookmarking datasets. Their fusion approach was inspired by Wang et al. (2006a), who proposed two typesof combinations: (1) fusing user- and item-based predictions, and (2) using the similar itemratings generated by similar users. Tso-Sutter et al. (2008) only considered the first type ofcombinations as the second type did not provide better recommendations for them. We alsoemployed this restriction. They fused the user- and item-based predictions by calculatinga weighted sum of the separate predictions. In our comparison experiments, we evalu-ated both the fused predictions as well as the separate user-based and item-based filteringruns using the extended similarities. We refer to the latter two runs as U-TSO-SUTTER-SIM
and I-TSO-SUTTER-SIM. The optimal combination weights were determined using our 10-foldcross-validation setup. Tso-Sutter et al. (2008) tested their approach on a self-crawled dataset from Last.FM against a baseline k-NN algorithm based on usage similarity. They reportedthat in their experiments they found no improvements in performance using these extendedsimilarities in their separate user-based and item-based runs. They did report significantimprovements of their fused approach over their baseline runs, showing that their fusionmethod is able to capture the 3D relationship between users, items, and tags effectively. Werefer the reader to Tso-Sutter et al. (2008) for more details about their work.
4.6.2 A Random Walk on the Social Graph
The second GBCF approach against which we wish to compare our work is the randomwalk method of Clements et al. (2008a). They propose using a personalized Markov ran-dom walk on the tripartite graph present in social bookmarking websites. While othershave used random walks for recommendation in the past (Aggarwal et al., 1999; Yildirimand Krishnamoorthy, 2008; Baluja et al., 2008), applying them to the tripartite social graphis new. Furthermore, the model allows for the execution of many different recommenda-tion tasks, such as recommending related users, interesting tags, or similar items using thesame elegant model. Clements et al. (2008a) represent the tripartite graph of user, items,and tags, created by all transactions and tagging actions, as a transition matrix A. A ran-dom walk is a stochastic process where the initial condition is known and the next state isgiven by a certain probability distribution. A contains the state transition probabilities fromeach state to the other. A random walk over this social graph is then used to generate arelevance ranking of the items in the system. The initial state of the walk is represented inthe initial state vector −→v 0. Multiplying the state vector with the transition matrix gives usthe transition probabilities after one step; multi-step probabilities are calculated by repeat-ing −→v n+1 =
−→v n · A for the desired walk length n. The number of steps taken determines
11I.e. the similarities from the U-BIN-SIM and UT-BIN-SIM runs.

Chapter 4. Folksonomic Recommendation 79
the influence of the initial state vector versus the background distribution: a longer walkincreases the influence of A. A walk of infinite length (−→v ∞) results in the steady state dis-tribution of the social graph, which reflects the background probability of all nodes in thegraph. This is similar to the PageRank model (Page et al., 1998) for Web search and similar,but not identical, to the FolkRank algorithm (Hotho et al., 2006a). The transition matrixA is created by combining the usage and tagging information present in the R, UT, and ITmatrices into a single matrix. In addition, Clements et al. (2008a) include the possibility ofself-transitions, which allows the walk to stay in place with probability α ∈ [0, 1] . Figure4.5 illustrates how the transition matrix A is constructed.
α∙S(1‐α)∙½∙R
(1‐α)∙½∙UT
(1‐α)∙½∙R
α∙S(1‐α)∙½∙IT
(1‐α)∙½∙UT
(1‐α)∙½∙IT
α∙S
uk tm
itemstateprobabili6es
=A
=v
=v
0
n
T T
T
1‐θ θ
USERS
ITEMS
TAGS
USERS ITEMS TAGS
Figure 4.5: The transition matrix A is constructed by combining the R, UT, and IT matricesand their transposed versions. Self-transitions are incorporated by super-imposing a diag-onal matrix of ones S on the transition matrix, multiplied by the self-transition parameterα. In the initial state vector the θ parameter controls the amount of personalization forthe active user. The highlighted part of the final probability vector −→v n after n steps are theitem state probabilities; these are the final probabilities that we rank the items on for theactive users.
A is a row-stochastic matrix, i.e., all rows of A are normalized to 1. Clements et al. (2008a)introduce a third model parameter θ that controls the amount of personalization of therandom walk. In their experiments with personalized search, two starting points are as-signed in the initial state vector: one selecting the user uk and one selecting the tag tm
they wish to retrieve items for. The θ parameter determines the influence of the personalprofile versus this query tag. In our case, we are only interested in item recommendation

Chapter 4. Folksonomic Recommendation 80
based on the entire user profile, so we do not include any tags in the initial state vector.This corresponds to setting θ to 0 in Clements et al. (2008a). In addition, we set α, theself-transition probability, to 0.8 as recommended by Clements et al.. We optimize the walklength n using our 10-fold cross-validation setup. After n steps, the item ranking is producedby taking item transition probabilities from −→v n for the active user (−→v n(K + 1, . . . K + L))and rank-ordering them by probability after removal of the items already owned by the ac-tive user. An advantage of the random walk model of Clements et al. (2008a) is that it cansupport many different recommendation tasks without changing the algorithm. Supportingtag recommendation instead of item recommendation, for instance, can be done by simplyselecting a user and an item in the initial state vector, and then ranking the tags by theirprobabilities from the final result vector. Item recommendation for entire user groups couldalso be supported by simply selecting the group users in the initial state vector, and thenranking by item probabilities.
Clements et al. (2008a) tested their approach on a data set based on LibraryThing12, whichincludes both tagging and rating information. In addition, they artificially constructed a nar-row version of this LibraryThing folksonomy to compare the effectiveness of their methodon collaborative and individual tagging systems. They compared different parameter set-tings of their random walk algorithm and found that, because of the lower density of thenarrow folksonomy, it is difficult to retrieve and recommend items in an individual taggingsystem. We refer the reader to Clements et al. (2008a) for more details about their work.
4.6.3 Results
Table 4.6 shows the results of the tag-aware fusion and random walk algorithms on ourfour data sets. The best-performing CF runs are also listed in the table. What we see, isthat of the two runs using the extended user-item matrices for similarity comparison, I-TSO-SUTTER-SIM performs better than U-TSO-SUTTER-SIM. While U-TSO-SUTTER-SIM performs betterthan using simple usage-based similarities from Section 4.3 on three of the data sets, it doesnot improve upon our best CF runs. The I-TSO-SUTTER-SIM, however, does: the extendeditem similarities outperform the standard tag overlap similarities on every data set. Theperformance increases there range from 16% to 37%.
Fusing the user- and item-based predictions produces the best results so far. For all fourdata sets, the fused predictions improve performance by 18% to 64%, depending on thedata set. Performance on CiteULike is improved significantly. For most of the data sets,the optimal λ assigns more weight to the item-based predictions, which also yield the bestresults on their own. The differences between the fused run and the I-TSO-SUTTER-SIM runare not statistically significant.
The random walk model does not fare as well on any of our four data sets: performance islower than our best CF run and it is especially bad on the Delicious data set. The randomwalk method does outperform the popularity-based baseline on the BibBoo, BibArt, andCiteULike data sets.
12http://www.librarything.com/

Chapter 4. Folksonomic Recommendation 81
Table 4.6: Results of the tag-aware and random walk approaches. Reported are the MAPscores as well as the optimal number of neighbors N . For the random walk model, Ncorresponds to the walk length n. In addition, we report the best-performing CF runsusing usage-based similarity and tag overlap similarity. The best-performing runs for eachdata set are printed in bold. The percentage difference between the best approaches fromrelated work and our best CF runs is indicated in the bottom rows of the two tables.
Runsbookmarks articles
BibSonomy Delicious BibSonomy CiteULikeMAP N MAP N MAP N MAP N
Best CF run0.0370È 3 0.0101È 23 0.1100È 7 0.0887È 30
(IT-JACCARD-SIM) (IT-BIN-SIM) (IT-TFIDF-SIM) (I-BIN-IDF-SIM)U-TSO-SUTTER-SIM 0.0303È 13 0.0057È 54 0.0829È 13 0.0739Ï 14I-TSO-SUTTER-SIM 0.0468È 7 0.0125È 13 0.1280È 11 0.1212Î 10Tag-aware fusion 0.0474È λ = 0.5 0.0166È λ = 0.3 0.1297È λ = 0.2 0.1268Î λ = 0.2Random walk model 0.0182È 5 0.0003È 3 0.0608È 8 0.0536È 14% Change +28.1% +64.4% +17.9% +43.0%
4.6.4 Discussion
According to our results on the four data sets, extending the user-item matrix by includ-ing user tags as items and item tags as users is the superior way of calculating user anditem similarities. Both for user-based and item-based filtering, combining usage and taginformation before computing the similarities outperforms using just one of those similaritysources. We believe sparsity reduction to be a main reason for this. As user profile vectorsincrease in length, they also gain more non-zero elements. The density of the user profilevectors increases by 54% for the Delicious data set and by approximately 6% for the otherdata sets. This means that, on average, larger parts of the vectors can be matched againsteach other in the user similarity calculation, leading to more accurate user similarities. Foritem-based filtering, we see the same thing happening, leading to improved performanceover the separate CF or TOBCF runs. As for the item-based runs with tag overlap, richeritem descriptions lead to better matched items and therefore higher quality recommenda-tions. These results are different from those reported by Tso-Sutter et al. (2008), who didnot find CF with their extended similarities to outperform the standard CF algorithm. Thiseffect might have been specific to their data set.
Fusing the user-based and item-based predictions leads to the best results, superior to anyof our own CF-based runs. This is to be expected, as it combines the best of both worlds.We can confirm with our experiments that tag-aware fusion of CF algorithms is able tocapture the three-dimensional correlations between users, items and tags. Although the tag-aware fusion method does not significantly improve over its component runs, it does provideconsistent improvements. An interesting question is why our own proposed SimFuseCFalgorithm did not show such consistent improvements. We believe this to be because thedistributions of the two set of similarities were too different even after normalization. Ifthe optimal number of neighbors is very different for the two algorithms using the twosets of similarities, fusing the similarities themselves does not result in the best of bothworlds, but rather a sub-optimal compromise between the optimal neighborhood sizes. InChapters 5 and 6 we will take another look at other possibilities for combining differentrecommendation techniques.

Chapter 4. Folksonomic Recommendation 82
The random walk method is not competitive on our data sets with our best CF runs or withthe tag-aware fusion method. We can think of several reasons for this. First, we performedmore strict filtering our of data sets than Clements et al. (2008a) did, and the higher densityof their LibraryThing data set could have led to better results. For instance, we removedonly untagged posts from our crawls, whereas Clements et al. required all tags to occur atleast five times. Increasing the density of our data sets through stricter filtering is likelyto improve the results of all the approaches discussed so far. A second possible reason forthe poor performance is the lack of explicit ratings. While Clements et al. have explicit,five-star ratings in their LibraryThing data set, we only have implicit transaction patterns torepresent item quality. However, in their work they did not find any significant differenceswhen using the ratings from the UI matrix. Finally, we did not perform extensive parameteroptimization: we only optimized the walk length n, but not the self-transition probability α,which could have positively influenced performance on our data sets.
The random walk method performs much better on the article data sets than on the book-mark data sets. We believe this to be because the BibArt and CiteULike data sets comprise aspecific domain of scientific articles. We reported earlier that the user profiles of BibArt andCiteULike users are more homogeneous than the bookmark users, whose profiles reflect alarger variety of topics. The larger number of tags per user on the bookmark data sets, meanthat the random walk has more nodes it can visit. This means the transition probabilitiesare spread out over more nodes, making it more difficult to distinguish between good andbad items for recommendation. This effect is especially pronounced on the Delicious dataset, as is evident in the significantly lower MAP score there. Narrower domains such as sci-entific articles, books, or movies lead to a more compact network and make it easier for therandom walk model to find the best related content. The data set used by Clements et al.(2008a) has a similarly ‘narrow’ domain as our BibArt and CiteULike data sets, making iteasier to find related content and generate recommendations.
4.7 Chapter Conclusions and Answer to RQ 1
Collaborative filtering algorithms typically base their recommendations on transaction pat-terns such as ratings or purchases. In a social bookmarking scenario, the broad folksonomyprovides us with an extra layer of information in the form of tags. In this chapter we focusedon answering our first research question.
RQ 1 How can we use the information represented by the folksonomy to sup-port and improve recommendation performance?
We started our exploration by comparing a popularity-based algorithm with the user-basedand item-based variants of the standard nearest-neighbor CF algorithm. The only informa-tion used here consisted of the user-item associations in the folksonomy, and these exper-iments showed that personalized recommendations are preferable over ranking items bytheir overall popularity.

Chapter 4. Folksonomic Recommendation 83
We then extended both nearest-neighbor CF variants with different tag similarity metrics,based on either the overlap in tags (TOBCF) or the overlap in how intensely items weretagged (TIBCF). We found that the performance of item-based filtering can be improved byusing the item similarities based on the overlap in the tags assigned to those items. Thereason for this is reduced sparsity in the item profile vectors; something we did not find inuser-based filtering, which as a result did not benefit from using tag similarity. We foundthat bookmark recommendation was affected more strongly than reference recommenda-tion. Using tagging intensity as a source of user or item similarity did not produce goodrecommendations, because the amount of tags a user assigns to an item is not correlatedwith its perceived value. We also examined merging usage-based and tag-based similaritiestogether to get the best of both worlds. However, the results of this SimFuseCF algorithmwere inconclusive, probably due to the different distributions of the sets of similarities.
To promote repeatability and verifiability of our experiments, we used publicly availabledata sets, and we compared our algorithms with two state-of-the-art GBCF algorithms. Thefirst algorithm, based on random walks over the social graph, performed worse than ourbest tag-based approaches. The second approach was a tag-aware k-NN algorithm whichmerged usage and tag data before the similarity calculation instead of after. By combiningtwo different representations and combining the results of two different algorithms, thisapproach outperformed our TOBCF, TIBCF, and SimFuseCF algorithms. From these resultswe may conclude that tags can be used successfully to improve performance, but that usagedata and tagging data have to be combined to achieve the best performance.


CH
AP
TE
R 5EXPLOITING METADATA FOR
RECOMMENDATION
Social bookmarking services offer their users the possibility to annotate the content of theiritems with metadata. The extent of this annotation is largely dependent on the domain andthe items being annotated. Services such as Delicious typically allow users to add metadatasuch as titles and descriptions to their Web bookmarks. Social reference managers reflect themore complex creation and publication process of scientific papers; CiteULike for instanceallows its users to add all kinds of citation-related metadata such as author information,publication venue, and abstracts. In this chapter we investigate the role that metadata canplay in recommending interesting bookmarks or references as formulated in our RQ 2.
RQ 2 How can we use the item metadata available in social bookmarking sys-tems to provide accurate recommendations to users?
This general research question gives rise to two more specific subquestions.
RQ 2a What type of metadata works best for item recommendation?
RQ 2b How does content-based filtering using metadata compare with folk-sonomic recommendations?
To answer these three questions, we propose and evaluate two different approaches to usingitem metadata. The standard method for using metadata is content-based filtering, whichfocuses on representing the content in a system and then learning a profile of the user’sinterests. Subsequently, the content representations are matched against the user profile tofind the items that are most relevant to that user. In our content-based filtering approachwe propose matching the metadata assigned by active users directly with the metadata ofall unseen items in a single step. Another perspective on exploiting the metadata is to see itas yet another source for calculating user and item similarities in addition to the transaction
85

Chapter 5. Exploiting Metadata for Recommendation 86
patterns from Chapter 4. We can then plug the newly calculated user and item similaritiesinto a standard Collaborative Filtering (CF) algorithm. The resulting algorithm is a hybridof CF and content-based filtering, and we refer to this perspective as hybrid filtering.
Chapter 5 is organized as follows. In Section 5.1 we start by describing the metadata avail-able in our data sets. We categorize the different metadata fields according to the functionthey perform in describing the items in our data sets. Section 5.2 discusses our differentapproaches to exploiting metadata for recommendation in more detail. We compare theresults of these different approaches in Section 5.3. Section 5.4 discusses the related work,and we conclude this chapter in Section 5.5.
5.1 Contextual Metadata in Social Bookmarking
The type of metadata used to annotate content in social bookmarking systems can varygreatly with the domain used, its conventions, and between individual social bookmarkingsystems. This variability is also reflected in our four data sets. The two data sets dealingwith Web bookmarks contain only four different metadata fields, DESCRIPTION, TAGS, TITLE,and URL—whereas the two data sets that cover scientific articles reflect the variety inherenttheir the more complicated process of creation. The BibArt and CiteULike data sets offer24 and 27 different metadata fields respectively. Table 5.1 lists the different metadata fieldswe were able to obtain for our four data sets (see also Section 3.3). In the experimentsdescribed in this chapter, we have included the tags assigned to an item as an additionalmetadata field. Since we expect that the different metadata fields vary in how benefi-cial they are to recommendation performance, we would like to determine which (sets of)metadata fields contribute most to improving performance. For structuring our research,we divide the metadata into two different groups: item-intrinsic metadata and item-extrinsicmetadata.
Item-intrinsic metadata fields relate directly to the content of the item being annotated.Three of the most representative examples include TITLE, DESCRIPTION, or ABSTRACT, all ofwhich partly describe the content of the item. Other fields, such as AUTHOR and JOURNALcan also be seen as intrinsic to the item and its creation. The intuition behind assigningmetadata fields to the item-intrinsic category is that these fields can be used as stand-alonesources for recommending other content. For instance, given a certain paper from a user’sprofile, papers with similar abstracts, papers written by the same author, or papers publishedat the same workshop are likely to be relevant recommendations.
In contrast, item-extrinsic metadata fields—such as PAGES, MONTH, or ENTRYTYPE—cannotbe used to directly generate appropriate recommendations. We define extrinsic metadata asadministrative information that could play a supporting role in generating recommendation,but never serve as a stand-alone source. For example, that fact that a paper was published inthe same month or allocated to the same pages in some proceedings does not mean that allother papers published in March or on pages 17 through 24 are relevant to the user as well.The exact categorization of metadata fields into these two categories is system-dependentand depends largely on the usage of the different fields. However, we believe that every

Chapter 5. Exploiting Metadata for Recommendation 87
data set is likely to have metadata fields that fall into one of these two categories, and thatclassifying them as such is relatively easy, regardless of the domain.
Table 5.1 gives an overview of how we assigned the metadata fields available to us to thedifferent classes. We will use this categorization to guide the experiments in the rest ofthis chapter, and define different subsets of our data based on this dichotomy. We willrun experiments using only the combination of all intrinsic metadata fields, and performseparate runs for each of the intrinsic fields individually to investigate their contribution.In addition, we will run experiments with the combined set of all intrinsic and extrinsicmetadata fields. Because of the supporting nature of the extrinsic metadata, we do neitherinvestigate the stand-alone usage of this subset, nor do we examine the influence of theextrinsic metadata fields separately.
Table 5.1: Metadata categorization and distribution over the four data sets at the post,item, and user level. Numbers in the table indicate the percentage of posts, items, or usersthat have a value assigned for this field. The top half of the table lists the intrinsic metadatafields and the bottom half the extrinsic metadata fields.
Metadata fieldbookmarks articles
BibSonomy Delicious BibSonomy CiteULikePost Item User Post Item User Post Item User Post Item User
All intrinsic fields 98.4 100 100 98.4 100 100 98.4 100 100 98.4 100 100ABSTRACT - - - - - - 10.4 13.8 80.2 66.4 67.7 99.8AUTHOR - - - - - - 95.3 96.8 100 97.5 98.9 100BOOKTITLE - - - - - - 38.9 40.2 92.2 13.5 13.4 67.5DESCRIPTION 28.8 48.8 90.1 14.2 19.8 79.9 48.4 80 73.1 - - -EDITOR - - - - - - 17 19.6 90.4 1.3 1.4 33.4JOURNAL - - - - - - 34.8 37 96.4 65.4 67.8 98.9NOTE - - - - - - 2.7 3.9 62.9 - - -SERIES - - - - - - 4.7 5.3 68.3 0.3 0.4 11.9TAGS 98.4 100 100 98.4 100 100 98.4 100 100 98.4 100 100TITLE 98.4 100 100 98.4 99.9 100 98.4 100 100 98.4 100 100URL 97 98.2 100 98.4 100 100 25 29.8 91.6 95.9 97 100All extrinsic fields - - - - - - 98.4 100 100 98.4 100 100ADDRESS - - - - - - 25.5 29.9 94.6 38.2 37.2 94.2CHAPTER - - - - - - 0.8 1.0 23.4 0.1 0.1 4.1DAY - - - - - - 0.5 0.6 24.0 - - -EDITION - - - - - - 1.5 1.9 43.7 0.1 0.1 6.2ENTRYTYPE - - - - - - 100 100 100 100 100 100HOWPUBLISHED - - - - - - 2.4 4.0 52.1 9.0 8.2 52.5INSTITUTION - - - - - - 5.3 5.7 64.7 0.5 0.5 19.1MONTH - - - - - - 15.4 17.2 90.4 62.6 60.5 99.5NUMBER - - - - - - 20.7 21.9 93.4 55.6 56.4 98.6ORGANIZATION - - - - - - 0.7 1.1 40.1 0.3 0.3 11.6PAGES - - - - - - 54.9 57.5 98.8 67.4 68.5 98.7PUBLISHER - - - - - - 41.6 44.4 97.6 32.7 31.1 95.6SCHOOL - - - - - - 2.3 2.4 45.5 0.2 0.3 10.5TYPE - - - - - - 1.4 1.6 40.1 0.0 0.0 0.4VOLUME - - - - - - 36.6 38.5 97.0 60.6 61.9 98.9YEAR - - - - - - 94.1 95.0 100 93.6 93.5 100
The numbers in the columns in Table 5.1 denote what percentage of the posts, items, andusers have a value assigned to a particular metadata field. For instance, only 10.4% of thepost in the BibArt data set were assigned an ABSTRACT. At the item level this increases to13.8%, whereas 80.2% of all users have added at least one ABSTRACT to one of their posts.We report two observations here that give more insight into how users employ metadatato describe their content. We also conjecture how these observations could influence itemrecommendation based on metadata, and revisit these observations later.

Chapter 5. Exploiting Metadata for Recommendation 88
First, going to a higher level of granularity typically decreases the sparsity. While a usermight not assign a value to each metadata field for each of his posts, many users do so for atleast one of their posts. The only two fields that have a value for every single post in all fourdata sets are TITLE and TAGS1 It is interesting to note that only a minority of the posts havebeen assigned descriptions, but most users have done so for at least one of their items. Thedecrease in sparsity at higher levels of granularity level could imply that more fine-grainedrepresentations, such as a representation at the post level, could make the matching processmore difficult because of missing data.
A second observation is that the overall usage rate of the different fields varies stronglybetween fields and data sets. Some of item-intrinsic fields are only very sparsely filled atthe post and item level, such as SERIES, EDITOR, and BOOKTITLE, suggesting that recommen-dation based solely on these fields is likely to lead to a lack of accuracy and coverage. Wesee the same variation in sparsity for the extrinsic metadata fields, but this is not likely tolead to a lack of coverage since the extrinsic fields will only be used in combination with theintrinsic fields.
5.2 Exploiting Metadata for Item Recommendation
The presence of rich metadata offers many different possibilities for improving the recom-mendation performance. Metadata could, for instance, be used for re-ranking purposes orincorporated as priors. Certain metadata fields also offer the possibilities of exploring addi-tional link graphs for recommendation, such as author or citation networks. In this chapterwe focus on two specific methods of using the metadata to aid the recommendation process:content-based filtering and hybrid filtering. We discuss them below in Subsections 5.2.1 and5.2.2 respectively. Both methods comprise a shared similarity matching step; we describethis similarity matching in more detail in Subsection 5.2.3. We conclude this section inSubsection 5.2.4 by describing which combinations of metadata fields we experiment with.
5.2.1 Content-based Filtering
The focus of content-based filtering for social bookmarking is on properly representing thecontent in our social bookmarking data sets. Based on these representations our aim isto construct an interest profile of an active user, and then use this profile to rank-orderthe unseen items by similarity to the profile, thereby approximating possible interest inthose items. We propose two different algorithms for content-based filtering: profile-centricmatching and post-centric matching. The difference between the two algorithms is the levelof aggregation. We discuss both algorithms below and illustrate them by means of the sametoy example for the sake of clarity.
Profile-centric Matching The profile-centric matching algorithm consists of two steps whengenerating recommendations for an active user: (1) generating collated user and item pro-files, and (2) matching the active user’s profiles against the item profiles of the unseen items.
1The latter is because we filtered out all untagged content, cf. Subsection 3.4.1.

Chapter 5. Exploiting Metadata for Recommendation 89
In the first step, we start by collating all of the user’s assigned metadata into a single userprofile. The intuition here is that by aggregating all of the metadata assigned by the userwe can completely capture his interests. Similarly, we construct item profiles that captureall of the metadata assigned to those items by all users in the training set.
The second step consists of matching the active user’s profile against the item profiles onsimilarity to produce a ranking of all items. Items that have been assigned metadata thatis similar to the metadata used by an active user to describe his items are likely to begood matches and thus good recommendations for that active user. After removing theitems already in the active user’s profile, we are left with the final rank-ordered list ofrecommendations. Figure 5.1 illustrates the profile-centric matching algorithm.
TrainingitemprofilesAc2veuserprofiles
Profile‐centricmatching
similaritymatching1D 2
3 A C
5 B C
4 C
testpairstrainingpairs
1
A
2
A
3
A
2
B
5
B
1
C
3
C
4
C
5
C
1
D
2
D
3
D
4
D
Figure 5.1: Visualization of our profile-centric matching algorithm for item recommenda-tion. In the profile-centric approach, we directly match the active user’s profile against theitem profiles with the purpose of ranking the items in order of metadata similarity.
The bottom half of Figure 5.1 visualizes our toy data set with four users and five items.The user-item pairs in this toy data set have been divided into a training set and a testset. We have only one active user, D, for whom we are trying to predict items 3 and 4 asinteresting. Using the profile-centric matching algorithm, we first build up a user profile forD that contains all of the metadata that D has added so far (items 1 and 2). Then the itemprofiles are built up for the items unseen by D, i.e., items 3, 4, and 5. The profile of D isthen matched against item profiles 3, 4, and 5 to determine which of the items show thegreatest textual match in metadata. We explain this similarity matching in more detail inSubsection 5.2.3.
A potential problem of the profile-centric matching algorithm is that by aggregating indi-vidual posts into high-level profiles we risk sacrificing precision for recall. Active users witha large number of items are likely to contain metadata for many different topics. Withmore and more different topics (and thus terminology) are covered by a profile, we canalso expect a greater number of user (or item) profiles to partially match it. This is likelyto increase recall, but could also reduce precision by producing false positives. At a certain
Chapter 5. Exploiting Metadata for Recommendation 90
profile size nearly every other profile will match at least some small part of the active user’sprofile, making it harder to find the best neighbors for that user.
Post-centric Matching Our second content-based filtering algorithm, post-centric match-ing, operates at the level of individual posts instead of a higher level of aggregation. Thiscould potentially reduce the influence of topical noise on the matching process when largequantities of metadata are aggregated2. The post-centric matching algorithm consists ofthree steps when generating recommendations for an active user. In the first step, we gen-erate representations of all posts in the data set. We populate these representations withthe metadata assigned to a specific post.
The second step then consists of matching each of the active user’s posts separately againstall the other posts of unseen items in the training set. This similarity matching is describedin in more detail in Subsection 5.2.3. The second step leads to a list of matching posts inorder of similarity for each of the active user’s posts. Since the same item could have beenadded by multiple users, it is possible that the same item occurs multiple times in the rankedlist of posts.
This leads us to the third step of post-centric matching: aggregating the ranked lists of postsinto a single list of recommended items for the active user. To this end, we start by normal-ize the original similarity scores simoriginal, as retrieval scores are not directly comparablebetween runs (Lee, 1997). We normalize simoriginal into [0, 1] using the maximum andminimum similarity scores simmax and simmin using the following formula from Lee (1997):
simnorm =simoriginal− simmin
simmax − simmin. (5.1)
There are different methods for combining the different results lists into a single list ofrecommended items. Two examples include calculating the average score for each itemor summing the different scores each item receives from each post it was retrieved from.Preliminary experiments with combination methods showed that a third method, calculat-ing a rank-corrected sum of similarity scores for each item, gave the best performance. Thismeans that if an item occurs many times it increases the odds of being recommended. At thesame time, items that are recommended hundreds of times but with very low scores do notdominate the rankings unfairly. The final list of recommendations ranks all unseen itemsby their rank-corrected score score(i) for an item i, calculated according to the followingformula:
score(i) =∑ simnorm(i)
log(rank(i)) + 1. (5.2)
After removing the items already in the active user’s profile, we are left with the final rank-ordered list of recommendations. Figure 5.2 illustrates the first two steps of the post-centric
2In contrast, having considerably less metadata when matching the representations could also result in morefalse negatives. Our evaluation will have to determine the effect of the different aggregation levels.

Chapter 5. Exploiting Metadata for Recommendation 91
matching algorithm using the same toy data set as in Figure 5.2. First, the post represen-tations are generated by the algorithm. Then, in the second step, each of user D’s trainingposts is matched against all other, unseen posts. First, D’s post of item 1 is matched againstall other posts: user A’s item 2 post, user A’s item 3 post, user B’s item 2 post, and so on.This results in a ranked lists of posts which serves as input to the third step of post-centricmatching. The same post matching process then takes place for user D’s post of item 2,again resulting in a ranked list of posts.
TrainingpostsAc.veuser'sposts
(b)post‐centricmatching
similaritymatching
1
1
1
2
...
D
D
D
D
2
3
2
2
...
A
A
B
A
testpairstrainingpairs
1
A
2
A
3
A
2
B
5
B
1
C
3
C
4
C
5
C
1
D
2
D
3
D
4
D
Figure 5.2: Visualization of our post-centric matching algorithm for item recommenda-tion. In the post-centric approach, we match metadata at the post level with the purposeof locating the posts most similar to those of the active user in terms of metadata. Theindividual recommendations are then aggregated into a unified list.
5.2.2 Hybrid Filtering
In addition to focusing solely on using the metadata for recommendation, we also con-sider a hybrid approach that joins content-based filtering and CF. By combining these twotechniques, we hope retain the best elements from both techniques. Combining the sepa-rate approaches can help diminish their individual shortcomings, and thus produce a morerobust system. In our hybrid filtering approach we view metadata in social bookmarking sys-tems as another source of information for locating the nearest neighbors in CF algorithms.Analogous to the CF algorithm described in Section 4.3, hybrid filtering also comes in twovariants: (1) user-based hybrid filtering and (2) item-based hybrid filtering.
Instead of only looking at the overlap in items that two users (or two items) have in com-mon when calculating user (or item) similarities, we can use the overlap in the metadataapplied to items to determine the most similar neighbors. For the user-based hybrid fil-tering, for instance, users that describe their profile items using the same terminology are
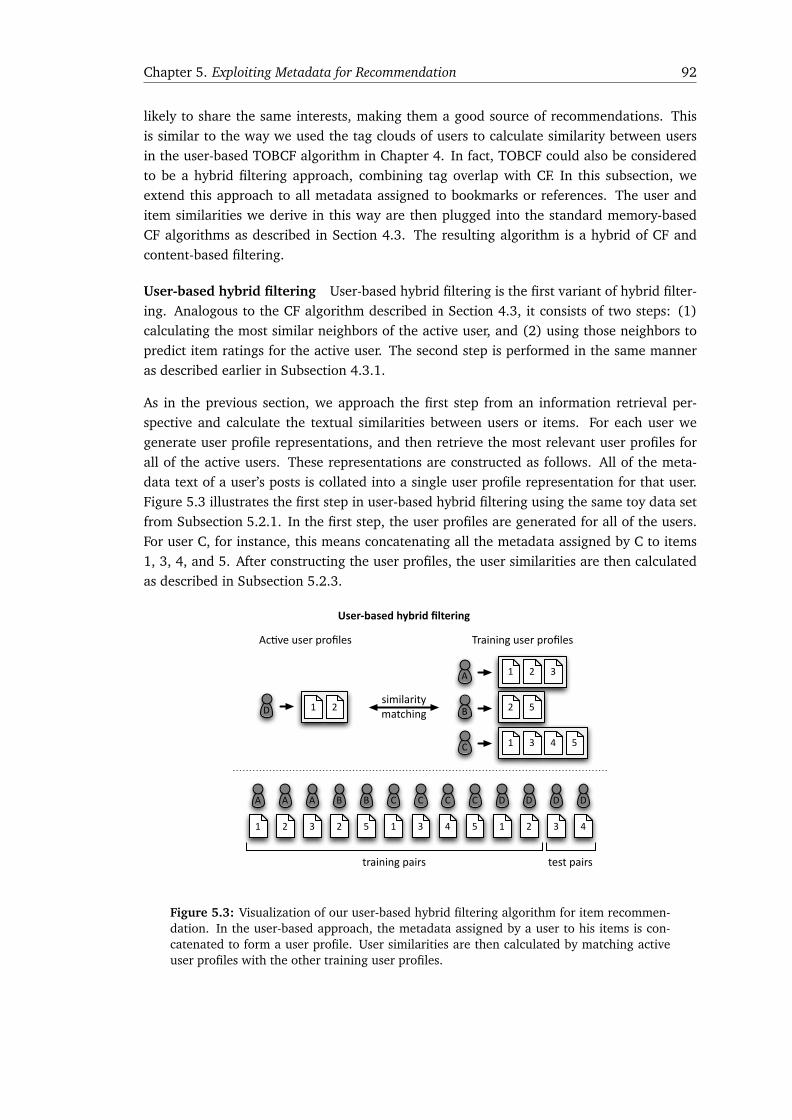
Chapter 5. Exploiting Metadata for Recommendation 92
likely to share the same interests, making them a good source of recommendations. Thisis similar to the way we used the tag clouds of users to calculate similarity between usersin the user-based TOBCF algorithm in Chapter 4. In fact, TOBCF could also be consideredto be a hybrid filtering approach, combining tag overlap with CF. In this subsection, weextend this approach to all metadata assigned to bookmarks or references. The user anditem similarities we derive in this way are then plugged into the standard memory-basedCF algorithms as described in Section 4.3. The resulting algorithm is a hybrid of CF andcontent-based filtering.
User-based hybrid filtering User-based hybrid filtering is the first variant of hybrid filter-ing. Analogous to the CF algorithm described in Section 4.3, it consists of two steps: (1)calculating the most similar neighbors of the active user, and (2) using those neighbors topredict item ratings for the active user. The second step is performed in the same manneras described earlier in Subsection 4.3.1.
As in the previous section, we approach the first step from an information retrieval per-spective and calculate the textual similarities between users or items. For each user wegenerate user profile representations, and then retrieve the most relevant user profiles forall of the active users. These representations are constructed as follows. All of the meta-data text of a user’s posts is collated into a single user profile representation for that user.Figure 5.3 illustrates the first step in user-based hybrid filtering using the same toy data setfrom Subsection 5.2.1. In the first step, the user profiles are generated for all of the users.For user C, for instance, this means concatenating all the metadata assigned by C to items1, 3, 4, and 5. After constructing the user profiles, the user similarities are then calculatedas described in Subsection 5.2.3.
TraininguserprofilesAc1veuserprofiles
1D 2
User‐basedhybridfiltering
similaritymatching B
A
C
2 5
1 2 3
1 3 4 5
testpairstrainingpairs
1
A
2
A
3
A
2
B
5
B
1
C
3
C
4
C
5
C
1
D
2
D
3
D
4
D
Figure 5.3: Visualization of our user-based hybrid filtering algorithm for item recommen-dation. In the user-based approach, the metadata assigned by a user to his items is con-catenated to form a user profile. User similarities are then calculated by matching activeuser profiles with the other training user profiles.

Chapter 5. Exploiting Metadata for Recommendation 93
Item-based hybrid filtering The second variant of hybrid filtering is item-based hybridfiltering, which again consists of two steps: (1) calculating the most similar neighbors of theactive user’s items, and (2) using those neighboring items to predict which unseen items theactive user would. The second step is performed in the same manner as described earlier inSubsection 4.3.1. For each item we generate item profile representations, and then retrievethe most relevant item profiles for all of the active user’s items. The item representationsare constructed as follows. We create item profiles for each item by concatenating all ofthe metadata assigned to that item by all the users who have the item in their profile. Thismeans that items are represented by their aggregated community metadata and not justby a single user’s data. After constructing the item profiles, the item similarities are thencalculated as described in Subsection 5.2.3.
Figure 5.4 illustrates the first step in item-based hybrid filtering using the same toy data setas before. In the first step, the item profiles are generated for all of the active user’s items.For item 1 of user D, for instance, this means concatenating all the metadata assigned byusers A, C, and D to item 1. After constructing the item profiles, the item similarities arethen calculated as described in Subsection 5.2.3.
TrainingpostsAc.veuser'sposts
Item‐basedhybridfiltering
similaritymatching
1 A C D
2 A B D
3 A C
5 B C
4 C
testpairstrainingpairs
1
A
2
A
3
A
2
B
5
B
1
C
3
C
4
C
5
C
1
D
2
D
3
D
4
D
Figure 5.4: Visualization of our item-based hybrid filtering algorithm for item recommen-dation. In the item-based approach we combined the item metadata to form item profiles.The item similarities are then calculated by matching active item profiles with the othertraining item profiles.
5.2.3 Similarity Matching
Both the content-based and hybrid filtering algorithms contain a similarity matching stepwhere user, item, or post representations are matched against each other on similarity inthe metadata assigned. There are many different methods of calculating the similarity be-tween representations. These methods are typically based on techniques from IR, machinelearning, or both (see also Section 5.4). We chose to approach content-based and hybrid

Chapter 5. Exploiting Metadata for Recommendation 94
filtering from an IR perspective because of the rich textual nature of many of the metadatafields.
To calculate the similarities between the different user, item, and post profiles, we usedthe open-source retrieval toolkit Lemur3. The Lemur toolkit implements different retrievalalgorithms based on language modeling as well as probabilistic and Vector Space-basedretrieval algorithms. We used version 2.7 of this toolkit to perform our experiments. Thetoolkit also offers support for options such as stemming and stop word filtering. We referthe reader to Strohman et al. (2005) for more information about the Lemur toolkit.
In order to decide which retrieval algorithm to use for our similarity matching, we comparedfour different algorithms (Strohman et al., 2005): (1) language modeling with Jelinek-Mercer smoothing, (2) language modeling with Dirichlet smoothing, (3) the OKAPI model,and (4) the Vector Space model with tf·idf term weighting. Preliminary experiments showedthat language modeling with Jelinek-Mercer smoothing was the best-performing retrievalmethod. Jelinek-Mercer smoothing interpolates the language model of a user or item profilewith the language model of a background corpus—in our case the training collection of alluser or item profiles. In our experiments, the weighting parameter λ was set to 0.9. Thelanguage models we used were maximum likelihood estimates of the unigram occurrenceprobabilities. Our preliminary findings with regard to Jelinek-Mercer smoothing were inline with the findings of Zhai and Lafferty (2004), who found it to work better for verbosequeries than other smoothing methods such as Dirichlet smoothing, and with our previouswork on news article recommendation in Bogers and Van den Bosch (2007). We also exam-ined stemming and stop word filtering using the SMART stop word list in our preliminaryexperiments. Based on the results we filtered stop words and did not perform stemming.
5.2.4 Selecting Metadata Fields for Recommendation Runs
In Section 5.1, we described the range of metadata fields we have available in our fourdata sets, and how we divided these into intrinsic and extrinsic metadata fields. We wishto address RQ 2a by examining which (combinations of) metadata fields provide the bestperformance for the four algorithms we described in the previous section. Experimentingwith every single possible combination of metadata fields would lead to a combinatorialexplosion of possible sets of metadata fields. In this section we describe which sets ofmetadata fields we decide to examine.
The item-intrinsic metadata fields relate directly to the content of the item being annotated.We will therefore examine the contribution of all intrinsic metadata fields separately, as wellas running experiments using the set of all intrinsic metadata fields combined. In contrast,the item-extrinsic fields can only play a supporting role in generating recommendations.We will therefore only examine the extrinsic metadata fields in conjunction with all of theintrinsic metadata fields combined.
This results in the following experiments. For the two bookmarks data sets, BibBoo and De-licious, we have only four different intrinsic metadata fields and no extrinsic metadata. This
3Available at http://www.lemurproject.org

Chapter 5. Exploiting Metadata for Recommendation 95
results in five different runs for both data sets: one run for each of the intrinsic metadatafields separately, and one run for all intrinsic metadata fields combined.
The data sets covering scientific articles, BibArt and CiteULike, contain more metadatafields. The BibArt data set offers 11 item-intrinsic metadata fields and 16 item-extrinsicmetadata fields; CiteULike offers 9 item-intrinsic and 15 item-extrinsic metadata fields. Thisresults in 13 different experimental runs on the BibArt data set: 11 separate runs for eachof the intrinsic metadata fields, an additional run for all intrinsic metadata fields combined,and final run with all intrinsic and extrinsic metadata fields combined. For the CiteULike wehave 11 experimental runs in total, because of two missing intrinsic metadata fields. Thisresults in a total number of 34 experimental runs for each of the four algorithms, allowingus to determine what metadata works better for which algorithm.
5.3 Results
In this section we present the results of the four algorithms we described in Subsection 5.2.1and 5.2.2 on the 34 experimental runs described in Subsection 5.2.4. For each algorithmwe use the same tabular form to present our results: in the top part of the table we listthe results of a particular algorithm using only the individual intrinsic metadata fields. Thebottom part shows the results for the two runs with the combined metadata fields. Wegroup together the results of the two content-based filtering algorithms in Subsection 5.3.1and the two hybrid filtering algorithms in Subsection 5.3.2 for comparison purposes. InSubsection 5.3.3 we compare the results of recommendation using metadata to the bestTBCF and GBCF algorithms from Chapter 4.
5.3.1 Content-based Filtering
Table 5.2 contains the results of the two content-based filtering approaches. When we com-pare the two algorithms, we see that, overall, the best-performing approach is the profile-centric approach where we match complete user profiles against complete item profiles. Itoutperforms the post-centric approach on three of our four data sets; significantly so on theCiteULike data set with an improvement of 117% (p < 10−6). Only on the Delicious dataset does post-centric matching perform significantly better (p < 0.05). If we look at all theindividual runs, we see that on 22 of 34 runs the profile-centric approach achieves the bestresults. This advantage is even stronger on the article data sets, where 75% of the time theprofile-centric approach performs best.
Metadata Comparison How do the individual fields contribute towards performance ofthe profile- and post-centric approaches? The best-performing single fields are AUTHOR,DESCRIPTION, TAGS, and TITLE, which provide the best individual results on all four datasets for both content-based filtering approaches. This is not surprising, as these fields arethe least sparse of all the intrinsic fields, and they are aimed directly at describing the con-tent of the items, more so than the conference or journal titles or the editors. In ten out ofthirteen instances, these fields perform best in a profile-centric approach. On the CiteULike

Chapter 5. Exploiting Metadata for Recommendation 96
Table 5.2: Results of the profile-centric (top) and post-centric (bottom) content-basedfiltering approaches. Reported are the MAP scores. The best-performing runs for each dataset and approach are printed in bold.
Profile-centric approach
Runsbookmarks articles
BibSonomy Delicious BibSonomy CiteULike
ABSTRACT - - 0.0132 0.0497AUTHOR - - 0.0625 0.0422BOOKTITLE - - 0.0135 0.0182DESCRIPTION 0.0084 0.0004 0.0977 -EDITOR - - 0.0063 0.0000JOURNAL - - 0.0095 0.0121NOTE - - 0.0167 -SERIES - - 0.0108 0.0005TAGS 0.0350 0.0013 0.0980 0.0593TITLE 0.0138 0.0014 0.0502 0.0660URL 0.0119 0.0012 0.0059 0.0165All intrinsic fields 0.0402 0.0011 0.1279 0.0978All intrinsic + extrinsic fields - - 0.1188 0.0987
Post-centric approach
Runsbookmarks articles
BibSonomy Delicious BibSonomy CiteULike
ABSTRACT - - 0.0176 0.0254AUTHOR - - 0.0347 0.0191BOOKTITLE - - 0.0124 0.0079DESCRIPTION 0.0110 0.0003 0.0809 -EDITOR - - 0.0128 0.0000JOURNAL - - 0.0045 0.0063NOTE - - 0.0140 -SERIES - - 0.0142 0.0011TAGS 0.0159 0.0036 0.0715 0.0377TITLE 0.0107 0.0018 0.0215 0.0285URL 0.0146 0.0013 0.0071 0.0048All intrinsic fields 0.0259 0.0023 0.1190 0.0455All intrinsic + extrinsic fields - - 0.1149 0.0441
data set, these differences are all significant. Interestingly, on Delicious the best run is thepost-centric run using only the TAGS field which performs better than all the other runs,and significantly so on all runs except the post-centric run with all intrinsic fields combined.Here, it appears that the extra information actually confuses the recommendation algorithmcompared to using the individual fields.
In general though, the runs with all intrinsic fields combined outperform the runs usingindividual fields. On the article data sets, these differences are significant in the majorityof the cases; on the bookmark data sets the intrinsic combined runs were only significantlybetter in a few cases. If we look at the runs where the two groups of fields are combined, wesee that using only the intrinsic results in slightly better results than using both the extrinsicand the intrinsic metadata fields. In three out of four cases on the BibArt and CiteULikedata sets, the runs with intrinsic fields are slightly better than the runs with all fields, butthese differences are never significant. This suggests that adding the extrinsic fields that

Chapter 5. Exploiting Metadata for Recommendation 97
describe non-content-based aspects of the items might confuse the k-NN algorithm slightlywhen making predictions.
5.3.2 Hybrid Filtering
Table 5.3 contains the results of the two hybrid filtering approaches: user-based and item-based hybrid filtering.
Table 5.3: Results of the user-based (top) and item-based (bottom) hybrid filtering ap-proaches. Reported are the MAP scores as well as the optimal number of neighbors N . Thebest-performing runs for each data set and approach are printed in bold.
User-based approach
Runsbookmarks articles
BibSonomy Delicious BibSonomy CiteULikeMAP N MAP N MAP N MAP N
ABSTRACT - - - - 0.0121 2 0.0494 2AUTHOR - - - - 0.0360 2 0.0605 2BOOKTITLE - - - - 0.0274 2 0.0434 3DESCRIPTION 0.0099 2 0.0007 8 0.0128 2 - -EDITOR - - - - 0.0066 2 0.0358 2JOURNAL - - - - 0.0319 2 0.0409 2NOTE - - - - 0.0203 2 - -SERIES - - - - 0.0231 2 0.0079 2TAGS 0.0168 2 0.0016 13 0.0158 2 0.0405 4TITLE 0.0183 2 0.0020 8 0.0410 2 0.0608 2URL 0.0218 2 0.0029 13 0.0073 2 0.0536 2All intrinsic fields 0.0197 2 0.0039 13 0.0155 2 0.0536 2All intrinsic + extrinsic fields - - - - 0.0105 2 0.0545 2
Item-based approach
Runsbookmarks articles
BibSonomy Delicious BibSonomy CiteULikeMAP N MAP N MAP N MAP N
ABSTRACT - - - - 0.0179 17 0.0423 54AUTHOR - - - - 0.0705 10 0.0325 9BOOKTITLE - - - - 0.0104 5 0.0103 6DESCRIPTION 0.0083 2 0.0003 8 0.0754 13 - -EDITOR - - - - 0.0081 7 0.0000 8JOURNAL - - - - 0.0165 6 0.0096 11NOTE - - - - 0.0165 2 - -SERIES - - - - 0.0094 7 0.0022 7TAGS 0.0399 11 0.0014 4 0.0773 13 0.0746 21TITLE 0.0059 8 0.0007 9 0.0300 23 0.0475 25URL 0.0106 2 0.0006 3 0.0107 3 0.0078 3All intrinsic fields 0.0267 14 0.0017 7 0.1510 21 0.0719 49All intrinsic + extrinsic fields - - - - 0.1482 28 0.0716 49
We see that the best-performing runs for each data set are all from the item-based hybridfiltering approach. On the BibArt and Delicious data sets these differences are statisticallysignificant and especially large at 268% (p < 0.05) and 112% respectively (p < 0.01). It isinteresting to note that on the majority of the 28 individual runs, the user-based approach

Chapter 5. Exploiting Metadata for Recommendation 98
performs best in 19 cases. However, most of these runs are using fields that were onlysparsely filled. It is to be expected then that user-based filtering, the method that aggregatesthe most information, can best deal with these more sparsely populated fields.
Metadata Comparison How do the individual fields contribute towards performance ofthe user- and item-based approaches? As with the content-based filtering approaches, thebest-performing single fields are AUTHOR, DESCRIPTION, TAGS, and TITLE, which provide thebest individual results on all four data sets in 75% of the cases. In addition, however, wesee that the URL, JOURNAL, and BOOKTITLE also tend to perform well, especially for the user-based approach. On the bookmark data sets BibBoo and Delicious, the runs using only thecontent of the URL actually perform best of all individual runs, which is surprising. Anotherinteresting observation is that the TITLE field serves as a better source of user and itemsimilarity on the article data sets than on the bookmark data sets. Apparently, the titlesassigned to bookmarks are not as descriptive as the titles assigned to scientific articles,leading to this big performance gap.
If we look at the runs where the two different groups of fields are combined, we see againthat there are only small performance differences between these two runs. In three out offour cases, the runs with intrinsic fields are slightly better, but these differences are neversignificant. Finally, we see that in five out of eight cases, the runs where all intrinsic fieldsare combined are actually outperformed by runs using only the metadata from a single field.This suggests that for calculating user and item similarities combining all the intrinsic fieldsoften confuses the recommendation algorithms.
5.3.3 Comparison to Folksonomic Recommendation
In this subsection, we compare the best recommendation results obtained by using metadatawith the best results obtained in Chapter 4 where we only used the folksonomy to generaterecommendations. Table 5.4 shows the results of the best content-based and hybrid filteringruns, as well as the best CF and TOBCF runs from Chapter 4. In addition, we compare itto the tag-aware fusion approach of Tso-Sutter et al. (2008), the best-performing GBCFalgorithm.
We can see in Table 5.4 that on three out of four data sets our recommendation algo-rithm that uses metadata is better than the best CF run. Only on the Delicious data set doall metadata-based approaches perform significantly worse than the CF runs that use onlyinformation from the folksonomy. The best-performing runs are all runs that use the com-bination of intrinsic and/or extrinsic fields to calculate the similarities between users anditems. The best metadata-based approach is strongly dependent on the data set, but theprofile-centric approach performs best on two of our four data sets, BibBoo and CiteULike.When we compare all metadata-based approaches with each other, we see that most differ-ences are not statistically significant. On the BibArt data set, the item-based hybrid filteringapproach is significantly better than the user-based approach (p < 0.05). On the CiteULikedata set, the profile-centric approach also significantly outperforms the post-centric anduser-based approaches.

Chapter 5. Exploiting Metadata for Recommendation 99
Table 5.4: Results comparison of the metadata-based runs with our best folksonomic rec-ommendation runs. Reported are the MAP scores as well as the optimal number of neigh-bors N . The best-performing metadata-based runs are printed in bold. In addition, wecompare our best runs so far from both chapters with the tag-aware fusion algorithm weexamined in Subsection 4.6.1. The percentage difference between our best CF approachesand between the tag-aware fusion method are listed in the appropriate rows.
Runsbookmarks articles
BibSonomy Delicious BibSonomy CiteULikeMAP N MAP N MAP N MAP N
Best CF run0.0370È 3 0.0101È 23 0.1100È 7 0.0887È 30(IT-JACCARD-SIM) (IT-BIN-SIM) (IT-TFIDF-SIM) (I-BIN-IDF-SIM)
Profile-centric filtering0.0402È - 0.0014È - 0.1279È - 0.0987È -
(all intrinsic) (TITLE) (all intrinsic) (all extrinsic)
Post-centric filtering0.0259È - 0.0036Ï - 0.1190È - 0.0455È -
(all intrinsic) (TAGS) (all intrinsic) (all extrinsic)
User-based hybrid filtering0.0218È 2 0.0039Ï 13 0.0410È 2 0.0608È 2
(URL) (all intrinsic) (TITLE) (TITLE)
Item-based hybrid filtering0.0399È 11 0.0017È 8 0.1510È 21 0.0746È 21
(TAGS) (all intrinsic) (all intrinsic) (TAGS)% Change over best CF run +8.6% -61.4% +37.3% +11.3%
Tag-aware fusion 0.0474È - 0.0166È - 0.1297È - 0.1268È -% Change over tag-aware fusion run -15.1% -50.0% +16.4% -22.2%
If we compare the metadata-based runs to the tag-aware fusion algorithm, we find that tag-aware fusion is the strongest recommendation algorithm for social bookmarking we haveseen so far. Compared to the metadata runs, only the item-based hybrid filtering approachon the BibArt data set outperforms the tag-aware fusion approach by 16% and this is notstatistically significant. On the other three data sets, tag-aware fusion is the best approach.On the two largest data set Delicious and CiteULike these differences are even statisticallysignificant (p < 0.05).
5.4 Related Work
We start in Subsection 5.4.1 by discussing the related work on content-based filtering. InSubsection 5.4.2 we then discuss the related work on hybrid filtering approaches in recom-mendation.
5.4.1 Content-based Filtering
While a significant amount of research has focused on CF for recommending interestingitems, there has also been considerable work on content-based filtering, which can be seenas an extension of the work done on information filtering (Belkin and Croft, 1992). Typi-cally, content-based filtering approaches focus on building some kind of representation ofthe content in a system and then learning a profile of the user’s interests. The contentrepresentations are then matched against the user’s profile to find the items that are mostrelevant to that user. The type of representations that are constructed depend on the learn-ing methods employed, which typically include techniques from IR, machine learning, or

Chapter 5. Exploiting Metadata for Recommendation 100
both. Content-based filtering has been applied to many different domains. We discuss ap-proaches that cover six of these domains: news, movies, books, music, cultural heritage,and personal agents.
News Early work on content-based filtering in the news domain included the NewsWeedersystem by Lang (1995), which used the words contained in newsgroup messages as its fea-tures and found that a probabilistic approach based on the Minimum Description Lengthprinciple outperformed tf·idf weighting. In their approach to personalization of an onlinenewspaper, Maidel et al. (2008) used an ontology of news concepts to recommend inter-esting news articles to users, because the dynamic nature of news precludes the use of CF.Articles were rank-ordered based on the distance between ontological concepts covered bythe user and item profiles. Their experiments showed that using a hierarchical ontologyproduces better recommendations compared to a flat ontology.
Movies Alspector et al. (1997) compared a CF approach to movie recommendation withcontent-based filtering. For their content-based component they built metadata representa-tions of all movies using fields such as directory, genre, and awards, and used linear regres-sion and classification and regression trees to learn user profiles and rank-order the itemsfor those users. They found that CF performed significantly better than the content-basedmethods, but noted that this was likely due to the poor feature set they used.
Books Mooney and Roy (2000) describe LIBRA, a content-based book recommender sys-tem. In their approach, they crawled the book metadata from the Amazon website andrepresented each book as a bag-of-words vector. They then used a Naive Bayes classifier tolearn user profiles and to rank-order unseen books for the user, with good results.
Music Music retrieval and recommendation is a fourth domain that content-based filteringhas been applied to. It is one of the typical fields where content analysis of the audio signalis often difficult and costly, so metadata and tags are often used for content-based musicretrieval instead. Whitman and Lawrence (2002), for instance, crawled textual descriptionsof artists on web pages, online groups, and discussion forums to do content-based musicrecommendation. They then used this data to calculate artist similarity and recommendrelated artists. They calculated tf·idf-based similarity based on extracted noun phrases andadjectives, and attained good results compared to human-edited lists.
Cultural heritage De Gemmis et al. (2008) tackled the problem of cultural heritage per-sonalization using content-based recommendation. They represented user profiles as fea-ture vectors containing both the metadata and the tags assigned to a user’s selected content,and used the Naive Bayes algorithm to learn user profiles and predict what unseen itemsmight be of interest to the users. On their small data set, they found that using metadataand tags together results in the best performance.
Personal agents A sixth domain in which content-based filtering techniques are oftenused is that of personal agents, the so-called Information Management Assistants (IMAs),that locate and recommend relevant information for the user by inferring a model of theuser’s interests. We already discussed IMAs extensively earlier on in Subsection 2.1.4. We

Chapter 5. Exploiting Metadata for Recommendation 101
noted that the majority of these IMAs approach content-based filtering from an IR perspec-tive. Typically, they condense the Web pages or documents that a user has shown an implicitor explicit interest in, into a set of keywords that then sent off to various search engines.The results are subsequently ranked and presented to the users. The keywords are alsocommonly used to build up a representation of the user to further personalize the recom-mendations. This type of approach to content-based filtering inspired our own approaches,with the difference that we do not condense our item representations into queries, but in-stead let the retrieval engine take care of this.
5.4.2 Hybrid Filtering
We are not the first to propose a union of CF and content-based filtering. The advantages ofboth approaches are largely complementary. CF is the more mature of the two approachesand works best in a situation with a stable set of items and a dense user base that is dividedinto different neighborhoods. In such situations, they are good at exploring new topics andtaking quality into account in the form of ratings. However, CF algorithms are known tohave problems with users with unique tastes and so-called ‘gray sheep’ users with unre-markable tastes that are hard to categorize (Claypool et al., 1999). Content-based filteringmethods are better at dealing with sparse, dynamic domains such as news filtering, and arebetter at recommending for users that are hard to peg. They are also known to producefocused, high precision recommendations, and to suffer less from the cold-start problem.
Several hybrid methods that try to combine the best of both worlds have been proposedover the years. We briefly describe five of them. Basu et al. (1998) were among the first topropose a hybrid recommender system that used both collaborative and content features torepresent the users and items. The collaborative features captured what movies a user likesand the content features include metadata fields such as actors, directors, genre, titles, andtag lines. They used Ripper, a rule-based machine learning algorithm to learn user profilesand predict which items are interesting. They found that the combination of collabora-tive and content-based features did indeed produce the best results. Claypool et al. (1999)present a weighted hybrid recommender system that calculates a weighted average of theoutput of two separate CF and content-based filtering components. The CF component re-ceives a stronger weight as the data sets grows denser, gradually phasing out the influenceof the content-based component. They did not find any significant differences between theperformance of the separate components or the combined version. A third hybrid filteringmethod is that by Baudisch (1999), who proposed an innovative approach to incorporatingmetadata into CF algorithms by joining the metadata descriptions to the user-item matrixas additional users. This is similar to the approach taken by Tso-Sutter et al. (2008), whoadded tags as extra users and items in their approach. The fifth hybrid filtering approachis that of Basilico and Hofmann (2004). They performed movie recommendation and com-bined usage information with metadata collected from IMDB. Their hybrid approach usedJoint Perceptron Ranking with different kernels representing the user correlations and meta-data features to predict movie ratings. Basilico and Hofmann found that using metadataperformed significantly worse than using usage information, but reported that this was dueto the relatively low quality of the metadata collected.

Chapter 5. Exploiting Metadata for Recommendation 102
There are at least three approaches that come closer to our own hybrid in the sense that theycalculate user or item similarities based on extra information and plug those into traditionalCF algorithms. First, Burke (2002) designed a hybrid restaurant recommender system thatcombines CF with a knowledge-based recommender system. They took the semantic ratingsassigned to restaurants (e.g. ‘expensive’, ‘lively’, ‘haute cuisine’) and used those to calculatea semantic similarity between users. These user similarities were then plugged into a CFalgorithm to generate recommendations. Second, Paulson and Tzanavari (2003) also comeclose to our own approach. They used the distance-based similarities between concepts in adomain ontology to determine the similarity between users, and plugged those similaritiesinto a CF algorithm. Third, Ziegler et al. (2004) take a similar approach using a booktaxonomy to extend the similarity calculation between users. All three of these approachesreport significant improvements over traditional CF similarity metrics.
We present two findings with regard to the review of related work on hybrid filtering. First,while some researchers report significant improvements of their hybrid approaches over theseparate algorithms, other researchers do not find any improvement at all. This makes itdifficult to draw any definite conclusions as to the performance benefits of hybrid recom-mender systems. This inconclusiveness is caused partly by the second prevalent finding inthe literature: the performance of content-based filtering depends strongly on (1) the qual-ity of the metadata used and (2) the constructed features based on this metadata. Poorperformance is most often attributed to low quality metadata.
5.5 Discussion
In this section, we step back and take stock of our findings with regard to exploiting meta-data for social bookmarking recommendation. We start by discussing our findings withregard to our content-based filtering and hybrid filtering methods. We then describe theinfluence the different (combinations of) metadata fields have on recommendation perfor-mance. We end this section by discussing the results of our comparison with algorithmsfrom the related work.
Content-based Filtering We first compared the two content-based filtering algorithms,profile-centric matching and post-centric matching. We found that a profile-centric ap-proach, where we match the aggregated metadata of a user directly against the aggregatedmetadata of items, outperforms a similar approach at the post level. A likely explanationfor the latter finding is that posts, as a lower level of information objects, carry much lessmetadata. Indeed, Table 5.1 shows that metadata coverage goes up as we proceed from thepost level to the item and user levels of granularity. Metadata sparseness can be a problemfor the post-centric approach: when most of the metadata fields are not filled for each postthis means that some posts simply cannot be matched to other posts because there is notenough data. At the profile level, posts that lack certain metadata are combined with otherposts that do have this metadata, ensuring more richly filled user and item representations,and subsequently better matching between profiles.

Chapter 5. Exploiting Metadata for Recommendation 103
On the Delicious data set the post-centric approach performed better than the profile-centricapproach. A possible reason for this is that the user profiles on Delicious show the greatesttopical variety. Aggregating all posts into a single profile here might result in too broad auser representation, where there is always a part of the representation that matches someitem. A more fine-grained approach might be able to overcome this. However, we do notsee as strong an effect on BibBoo and do not have a clear explanation for this.
Hybrid Filtering When comparing our two hybrid filtering algorithms, user-based anditem-based hybrid filtering, we found that item-based hybrid filtering performed best. How-ever, it should be noted that user-based filtering was better in many of the individual fieldruns. We could expect the same explanation for the difference between profile-centric andpost-centric to hold here: aggregation at a higher level suffers less from metadata sparse-ness. However, item profiles are a higher-level aggregation than posts, and coverage isindeed a bit higher for item representations. The DESCRIPTION fields in the BibBoo andBibArt data sets, for instance, have their coverage nearly doubled when aggregating postmetadata into item representations.
Most importantly, we believe the algorithmic difference between user-based and item-basedCF comes into play here. For user-based matching we calculate the user similarities basedon content, but this content plays only a small role in generating the final recommendations.For the sake of argument, let us say that we only use the nearest neighbor for predictions(i.e., N = 1). We can expect certain items of the neighbor to be better recommendationsthan others, and indeed those items are what the active user and the neighbor user matchedon so strongly. However, in selecting the items to be recommended no attention is paid tothe actual topical overlap between the active user’s items and the neighbor’s items. Instead,each of the items of the active user’s nearest neighbor is promoted equally, scored with thesimilarity between the users. In the item-based approach, there is a direct focus on the itemsof the active users and what other items in the data set they best match up with. If we holdN at 1 again, then new items are promoted directly according to their topical similarity withthe active user’s items. If the item similarity calculation is not hampered by sparsity as it wasin usage-based CF, then we may expect this approach to generate better recommendationsthan the user-based approach. This argument also holds for larger neighborhood sizes.
Metadata Fields We observed that certain metadata fields provide better recommenda-tions than other fields. The TITLE field, for instance, was found to perform worse on book-mark data sets than on article data sets. A likely explanation for this is that article titles arepicked by the authors and are fixed to the articles. Aggregating the TITLE field into itemprofiles, for instance, will usually amount to mere duplications of the title. Users postingbookmarks, however, are free to change the title of the bookmark and are more likely to doso. These personalized versions of titles are less likely to match the right related items.
An interesting question is how much of an influence the sparseness of a metadata fieldhas on performance. If we look at the correlation between coverage at the different levelsof granularity and MAP, we find only weak correlations at the user level. Most metadatafields have high coverage at the user level, so it is mainly the quality of the field that has thebiggest influence on the recommendation. At the item and user levels however, we find weakto moderate positive correlations ranging from 0.34 to 0.50. The latter finding suggests that

Chapter 5. Exploiting Metadata for Recommendation 104
performance tends to go up as the coverage increases. Upon closer examination, we see thatthe fields with high sparsity always correspond to low performance. The fields with highcoverage do not automatically achieve high MAP scores, suggesting that the usefulness forrecommending related items and the quality of the metadata field play a larger role here,confirming the findings in the related work.
The influence of metadata quality on recommendation is also evident from the fact thatin some cases the runs based on individual fields outperformed runs that combined allmetadata fields. This shows that combining highly predictive fields with lower-quality fieldscan hurt performance and introduce too many false positives in the list of recommendations.We believe that feature selection techniques could be used here to determine the optimal setof metadata fields (Jain and Zongker, 1997). We found no significant differences betweenthe runs with all intrinsic fields versus the runs with both intrinsic and extrinsic fields. Thisabsence of significant differences implies that these supporting fields do not add anythingto the recommendation process.
We cannot declare one of our four metadata-based algorithm as the best one. The optimalmetadata-based algorithm depends on the data set and the metadata fields used. Based onour experimental results, however, we may conclude (1) that profile-centric matching anditem-based hybrid filtering are most consistently among the best-performing algorithms,and (2) that using (at least) all of the intrinsic metadata fields combined typically yields thebest performance.
Comparison to Folksonomic Recommendation In Section 5.4 we discussed a substantialbody of related work for both our content-based and hybrid filtering approaches. We ex-plained that our choice for an IR approach was inspired by the work on IMAs in the 1990s.A main difference is that, where they condensed item representations into the most salientkeywords, we use the entire representation in the matching process. It is complicated, how-ever, to compare findings from the early work on IMAs to those from our own work, becauseof the different conceptual designs and usage scenarios, and the temporal difference.
When comparing our metadata-based algorithms to the CF and TOBCF algorithms fromChapter 4, we found that our best metadata-based runs outperformed the best CF and TO-BCF runs. Metadata-based runs performed best on three of our four data sets: BibBoo,BibArt, and CiteULike. We believe this is because using metadata results in richer repre-sentations for matching users and items. All of our best metadata runs use the combinedmetadata fields. On their own, each field can be seen as imperfect representations of theitems and users, but combined they alleviate each others weak points and better representthe content than they do separately. This is in accordance with, for instance, the principleof polyrepresentation of Ingwersen (1994). However, we do not have an explanation as towhy the CF runs performed better on the Delicious data set.
In addition, we compared the best GBCF algorithm from Section 4.6—the tag-aware fusionmethod of Tso-Sutter et al. (2008)—to our metadata-based algorithms in Subsection 5.3.3.The tag-aware fusion method outperforms our best meta-data algorithms on three of ourdata sets. Tag-aware fusion combines different representations—transaction patterns andtagging patterns—with different algorithms by fusing user-based and item-based filtering
Chapter 5. Exploiting Metadata for Recommendation 105
predictions. In contrast, our metadata-based algorithms only combine different representa-tions.
Because of the clear benefit of fusing different recommendation algorithms and differentrepresentation, we expect that combining different algorithms that use different parts ofthe data set to generate recommendations will lead to improvements over the componentalgorithms. In this light it would be interesting to combine the best CF runs with the bestmetadata-based runs. We will examine this and compare different combination methods inthe next chapter.
An interesting question to ask is why one should consider other recommendation approaches,given that tag-aware fusion outperforms most of the other algorithms proposed so far. Wecan think of two reasons. The first reason is implementation effort. The metadata-basedapproaches are based on textual similarity matching as is commonly performed by searchengines. The existing search infrastructure of a social bookmarking website could there-fore be leveraged to implement metadata-based recommendation. However, the tag-awarefusion algorithm would have to be implemented from scratch. As the best metadata-basedapproaches are quite competitive compared to tag-aware fusion, we conjecture that it mightbe more efficient to implement metadata-based recommendation when mature search in-frastructure is available. A second reason to choose another algorithm over tag-aware fusioncould be running time of the algorithm. The similarity calculation phase in CF algorithmstakes up the majority of the computational resources. As tag-aware fusion extends the nor-mal ratings matrix R with two extra matrices UT and ITT , similarity computation also takesup more time because of the larger size of the combined matrices. This could be anotherreason to prefer one of the TOBCF algorithms, where the user and item similarities arecalculated on only one of the matrices.
5.6 Chapter Conclusions and Answer to RQ 2
The metadata that users assign to their items is a rich source of information that couldpotentially improve recommendation performance. In this chapter we answered our secondresearch question and its two subquestions.
RQ 2 How can we use the item metadata available in social bookmarkingsystems to provide accurate recommendations to users?
RQ 2a What type of metadata works best for item recommendation?
RQ 2b How does content-based filtering using metadata compare with folk-sonomic recommendations?
To address RQ 2, we proposed two types of recommendation methods that employ meta-data: content-based filtering and hybrid filtering. Inspired by the work on IMAs, we tookan IR approach to content-based filtering. We constructed textual representations of the

Chapter 5. Exploiting Metadata for Recommendation 106
metadata assigned by users, assigned to items, and assigned to separate posts. We proposedtwo variants of content-based filtering, profile-centric matching and post-centric matching.The difference between the two variants is the level of granularity at which metadata repre-sentations are matched. We found that a profile-centric approach, where all of the metadataassigned by a user is matched against metadata representations of the items worked betterthan a post-centric approach that matched representations at a finer level of granularity. Webelieve this is due to sparseness issues of the fine-grained post-centric approach.
Our hybrid filtering method combined a standard nearest-neighbor CF algorithm with content-based filtering. Analogous to the standard CF algorithm we defined two variants: user-basedhybrid filtering and item-based hybrid filtering. For both algorithms we use the metadatarepresentations to calculate the user and item similarities respectively. These similaritiesare then used to locate the nearest neighbors to generate the recommendations accordingto the standard user-based and item-based CF algorithm. Of these two algorithms we foundthat item-based filtering with the metadata-derived similarities works best, as it did withtag overlap similarities.
When comparing all four metadata-based algorithms, we cannot single out a single-bestcombination of algorithm and metadata fields. Based on our experimental results, however,we may conclude (1) that profile-centric matching and item-based hybrid filtering are mostconsistently among the best-performing algorithms, and (2) that using (at least) all of theintrinsic metadata fields combined typically yields the best performance.
In answer to RQ 2a, we divided our 27 different metadata fields that occurred in our fourdata sets into two broad categories. The first category was item-intrinsic metadata, whichrelate directly to the content of the item being annotated. The second category was item-extrinsic metadata, which cover the administrative information that could never serve as astand-alone source for recommendations. To determine the influence of the different typesof metadata, we experimented with using different (combinations of) metadata fields. Foreach algorithm, we ran between 5 and 13 different experiments with different metadatafields, depending on the data set. We found that while sparsity of an individual metadatafield does have an influence on recommendation performance, the quality of the informa-tion contained in the field is just as important. Based on our experimental results, we mayconclude that combining all intrinsic metadata fields together tends to give the best perfor-mance, whereas extrinsic information, i.e., information not directly related to the content,does not.
Finally, to answer RQ 2b we compared our metadata-based approaches to the folksonomicrecommendation algorithms proposed in Chapter 4. We found that recommending usingmetadata works better on three of our four data sets, making it a viable choice for recom-mendation despite being underrepresented in the related work so far.

CH
AP
TE
R 6COMBINING RECOMMENDATIONS
In Chapters 4 and 5 we learned that combinations of different algorithms and representa-tions tend to outperform individual approaches. Guided by our third research question, weexamine this phenomenon in more detail in this chapter.
RQ 3 Can we improve performance by combining the recommendations gen-erated by different algorithms?
The problem of effective item recommendation is too complex for any individual solution tocapture in its entirety, and we expect that by combining different aspects of this problem wecan produce better recommendations. Earlier, we saw evidence for the potential success ofcombination in the approach by Tso-Sutter et al. (2008) who successfully fused together thepredictions of different algorithms using different representations of the data. We alreadyproposed two combination approaches ourselves in the previous two chapters: our similarityfusion algorithm in Subsection 4.4.3 and our hybrid filtering algorithm in Subsection 5.2.2.On some data sets these produced superior recommendations, but the results were notconclusive. This naturally leads us to the following subquestion.
RQ 3a What is the best recipe for combining the different recommendationalgorithms?
In this chapter we will examine the possibilities of data fusion1 in more detail. Instead ofaugmenting or combining features for recommendation, we will examine the effectivenessof combining the output of different recommendation runs (RQ 3), and compare the resultsagainst the other fusion variants we have proposed so far (RQ 3a).
Chapter 6 is organized as follows. We start in Section 6.1 by discussing related work on datafusion in the fields of recommender systems, IR and machine learning, and highlight some
1The term ‘data fusion’ can be ambiguous to a certain extent. In this chapter, we take it to mean outputfusion, i.e., fusing the recommendation lists from different runs, analogous to the use of the term in the field ofIR.
107

Chapter 6. Combining Recommendations 108
of the reasons why fusion is often successful. Then, in Sections 6.2 and 6.3, we describe ourapproach to fusing recommendations and which individual runs we select for this. Section6.4 then describes our results, addressing RQ 3 and RQ 3a. In addition, we compare them tothe similarity fusion and hybrid filtering techniques proposed in the previous two chapters(RQ 3a). We end with a discussion of the results in Section 6.5.
6.1 Related Work
We start in Subsection 6.1.1 by discussing related work on fusing different recommendationalgorithms to improve upon the performance of the individual algorithms. Then, in Sub-section 6.1.2, we discuss successful approaches to data fusion in two other fields: machinelearning and IR. We conclude in Subsection 6.1.3 by looking at the underlying explanationsfor the success of data fusion to aid in the analysis of our own experiments with combiningrecommendations.
6.1.1 Fusing Recommendations
In the past decade, the field of recommender systems has already seen several differentapproaches to combining different recommendation algorithms. Burke (2002) presenteda taxonomy of seven different methods for creating hybrid recommendation algorithms,which we reproduce here in Table 6.1. We briefly describe them below.
Table 6.1: A taxonomy of recommender system combination methods, as given by Burke(2002).
Hybridization method Description
Mixed Recommendations from several different recommenders arepresented at the same time.
Switching The system switches between recommendation techniques de-pending on the current situation.
Feature combination Features from different recommendation data sources arethrown together into a single recommendation algorithm.
Cascade One recommender refines the recommendations given by an-other.
Feature augmentation The output from one technique is used as an input feature toanother technique.
Meta-level The model learned by one recommender is used as input toanother.
Weighted The scores of several recommendation techniques are combinedtogether to produce a single recommendation.
The mixed hybridization method, arguably one of the most straightforward methods, presentsall outputs of the different individual algorithms at the same time. The practical applicabilityof this technique is dependent on the scenario in which recommendations have to be pro-duced; if a single results list is called for, then the recommendations will have to be merged.A switching hybrid algorithm switches between the different component algorithms basedon certain criteria. For instance, the cold-start problem we mentioned in Subsection 2.1.1

Chapter 6. Combining Recommendations 109
could be a reason to base initial recommendations on the output of a content-based filter-ing algorithm. As soon as sufficient ratings are collected from the users, the system couldthen switch to a CF algorithm. In a feature combination approach, features from differenttypes of algorithms (i.e., collaborative information, content-based, or knowledge-based)are combined and used as the input feature set for a single recommendation algorithm. Oursimilarity fusion approach from Subsection 4.4.3 is an example of a feature combination ap-proach, as it uses both collaborative and topic-based information in the form of tags. Burkealso describes two hybridization approaches that sequence two different recommendationalgorithms. In the cascaded hybrid approach, one recommendation algorithm is first used toproduce a coarse ranking of the candidate items, and the second algorithm then refines orre-ranks this candidate set into the final list of recommendations. In contrast, in a featureaugmented hybrid algorithm one technique is employed to produce a rating of an item, afterwhich that rating is used as an input feature for the next recommendation technique. Asmentioned before, we view our hybrid filtering approach from Subsection 5.2.2 as a featureaugmentation approach. The meta-level hybrid approach takes this a step further by usingthe entire model generated by the first algorithm as input for the second algorithm. Finally,a popular and straightforward way of combining algorithms is by producing a weighted com-bination of the output lists of the individual algorithms, where the different algorithms areall assigned separate weights.
While each of these seven combination methods has its merits and drawbacks, there has notbeen a systematic comparison of them on the same data sets using the same experimentalsetup. The lack of such a comparison makes it difficult to draw conclusions about whichmethod is most effective in which situation. Most of the related work on recommender sys-tems fusion has focused on combining content-based filtering with collaborative filtering.We discussed the most important of these approaches in Section 5.4, and these range fromfeature combination (Basu et al., 1998) and feature augmentation approaches (Mooney andRoy, 2000) to weighted combination algorithms. The latter combination method is one wewill examine in more detail in this chapter, and the focus of the remainder of this relatedwork subsection. For instance, Claypool et al. (1999) presented a weighted hybrid recom-mender system that calculated a weighted average of the output of two separate CF andcontent-based filtering components. The CF component receives a stronger weight as thedata sets grows denser, gradually phasing out the influence of the content-based compo-nent. They did not find any significant differences between the performance of the separatecomponents or the combined version. Pazzani (1999) combined three different recommen-dation algorithms: a CF algorithm, content-based filtering, and recommendation based ondemographic information. They then used a majority-voting scheme to generate the finalrecommendations which increases precision over the individual approaches. Finally, thetag-aware fusion approach by Tso-Sutter et al. (2008) that we examined earlier, is also anexample of a weighted hybrid recommender system, as it calculates a linearly weighted com-bination of separate user-based and item-based filtering predictions. This fusion approachwas originally inspired by the work of Wang et al. (2006a), who formulated a generativeprobabilistic framework for the memory-based CF approach. Wang et al. generated the finalratings by not only fusing predictions based on three sources: (1) ratings of the same itemby other users (i.e., user-based filtering); (2) different item ratings made by the same user(i.e., item-based filtering); and (3) data from other but similar users that rated other but

Chapter 6. Combining Recommendations 110
similar items. Their original model showed a significant performance increase compared tostandard user-based and item-based filtering, and an improved resistance to ratings sparse-ness.
6.1.2 Data Fusion in Machine Learning and IR
Data fusion has been shown to improve performance not only in the field of recommendersystems, but also in related fields. We discuss related work in two such fields: machinelearning and IR.
Machine Learning In machine learning we see similar methods for combination and hy-bridization as those discussed by Burke (2002), but under different names. We discuss threeof the most popular combination methods in machine learning. The first is stacking, wherethe output of one classifier serves as input feature for the next classifier (Wolpert, 1992).This method is known to be capable of recognizing and correcting recurring errors of thefirst-stage classifier, and corresponds to Burke’s feature augmentation method. A secondcombination method is bagging, which generates multiple versions of a predictor by makingbootstrap replicates of the original data sets (Breiman, 1996). The set of predictors are thenused to obtain an aggregated predictor by doing majority voting when predicting an outputclass. Bagging is similar to Burke’s weighted combination method. Third, boosting involveslearning an optimally weighted combination of a set of weak classifiers to produce a strongclassifier (Freund and Schapire, 1996). The process is iterative, as repeatedly misclassifiedinstances receive a higher weight in the next round of learning the weak classifier. This waythe entire data set can be covered correctly by the resulting strong classifier.
Information Retrieval Throughout this thesis we have taken an IR perspective on rec-ommendation in our evaluation and algorithm design. We turn our attention to discussingrelated work on data fusion in IR in this section. An important distinction to make hereis the one between results fusion, where the results of different retrieval algorithms on thesame collection are combined, and collection fusion, where the results of one or more algo-rithms on different document collections are integrated into a single results list. We are notinterested in the latter approach, and refer the interested reader to, for instance, Voorheeset al. (1995) for more information.
In IR, there are two prevalent approaches to results fusion: (1) combining retrieval runsthat were generated using different query representations but with the same algorithm, or(2) combining retrieval runs that were generated using the same query, but with differentalgorithms. In our social bookmarking scenario, the first type of data fusion corresponds tousing different representations of the user profile for recommendations—such as transac-tion patterns, tagging behavior, or assigned metadata—and then combining those differentrecommendation runs. The second approach corresponds to combining different recom-mendation algorithms—such as CF and content-based filtering—and fusing those predicteditems into a single list of recommended items. Most approaches in IR also fall in one ofthese two categories, with some approaches spanning both. Our contribution in this chap-ter is that we will investigate the usefulness of both approaches for social bookmarkingrecommendation in answering RQ 3 and RQ 3a.

Chapter 6. Combining Recommendations 111
The earliest approaches to data fusion in IR stem from the 1990s when Belkin et al. (1993)investigated the effect of combining the result lists retrieved using different query represen-tations of the same information need. They showed that progressive combination of queryformulations leads to progressively improving retrieval performance, and extended theirown work in Belkin et al. (1995) with an additional set of experiments confirming theirearlier findings. Later work on combining different query and document representationsincludes the work by Ingwersen and Järvelin (2005), who view the fusion problem from acognitive IR perspective. They formulated the principle of polyrepresentation in which eachquery or document representation, searcher, and retrieval model can be seen as a differentrepresentation of the same retrieval process (Ingwersen, 1994, 1996). The validity of thisprinciple has been confirmed for queries, documents, searchers, and retrieval algorithms inSkov et al. (2008) and Larsen et al. (2009).
Some of the earliest work on fusing the results of different retrieval algorithms includesCroft and Thompson (1987), who fused a probabilistic retrieval model with a vector spacemodel. Bartell et al. (1994) also examined results fusion using different retrieval algo-rithms. They proposed a linear combination of retrieval runs using different variants of thesame IR algorithm, and showed significant improvements over the individual runs. Vogtand Cottrell (1998) later revisited this work and used linear regression to determine theoptimal combination of run weights. Fox and Shaw (1994) investigated a set of unweightedcombination methods that have become standard methods for data fusion in IR. They testedthree basic combination methods CombMAX, CombMIN, and CombMED that respectivelytake the maximum, minimum, and median similarity values of a document from among thedifferent runs. In addition, they also proposed three methods CombSUM, CombMNZ, andCombANZ that have consistently shown to provide good data fusion results. The Comb-SUM method fuses runs by taking the sum of similarity values for each document sep-arately; the CombMNZ and CombANZ methods do the same but respectively boost anddiscount this sum by the number of runs that actually retrieved the document. Fox andShaw (1994) showed that the latter three methods were among the best performing fu-sion methods. This work was later extended by Lee (1997) with a more thorough analysis,and they found that CombSUM and CombMNZ were again the best-performing methods.Periodically, these combination methods have been re-examined in different settings, suchas monolingual retrieval (Kamps and De Rijke, 2004), or against different probabilistic fu-sion methods (Croft, 2000; Aslam and Montague, 2001; Renda and Straccia, 2003). TheCombSUM and CombMNZ methods have been shown to consistently improve upon theperformance of the individual retrieval runs.
6.1.3 Why Does Fusion Work?
In this section, we introduce various reasons that have been proposed in the related workto explain the success of data fusion. Because of our IR perspective on recommendation,we focus exclusively on explanations from this field. We will use these explanations later onin the analysis of our experiments to explain what is happening in recommender systemsfusion.

Chapter 6. Combining Recommendations 112
Belkin et al. (1993) argue that the success of query result fusion is due to the fact that theproblem of effective representation and retrieval is so complex that individual solutions cannever capture its complexity entirely. By combining different representations and retrievalmodels, more aspects of this complex situation are addressed and thus more relevant doc-uments will be retrieved. This is similar to the explanation from the polyrepresentationpoint of view (Ingwersen and Järvelin, 2005), which states that using different representa-tions and retrieval models will retrieve different sets of information objects from the samecollection of objects with a certain amount of overlap. Merging cognitively different rep-resentations and retrieval models corresponds to modeling different aspects of the task assuggested by Belkin et al. (1993), and the overlapping documents are therefore seen asmore likely to be relevant.
The latter effect of overlapping documents having a higher likelihood of being relevant wasdubbed the Chorus effect by Vogt and Cottrell (1998). The Chorus effect is also related towhat Vogt and Cottrell define as the Skimming effect:
“ The Skimming Effect happens when retrieval approaches that represent theircollection items differently may retrieve different relevant items, so that acombination method that takes the top-ranked items from each of the re-trieval approaches will push non-relevant items down in the ranking. ”
A third, contradictory explanation by Vogt and Cottrell for the success of fusion is the DarkHorse effect, which states that certain retrieval models might be especially suited to retriev-ing specific types of relevant items compared to other approaches.
Spoerri (2007) describes the two of these effects, the Chorus and Skimming effects, underdifferent names: the Authority effect and the Ranking effect. The Authority effect describesthe phenomenon that the potential relevance of a document increases as the number ofsystems retrieving it increases, while the Ranking effect describes the observation that doc-uments higher up in ranked lists and found by more systems are more likely to be relevant.They provide empirical evidence for these effects as the cause for the success of fusion. Inaddition, they show that the two effects can be observed regardless of the type of queryrepresentation.
It is clear from all of the above definitions that it is possible for one effect to conflict withanother. For instance, although one algorithm might be particularly well-suited for retriev-ing specific types of relevant items (i.e., the Dark Horse effect), they might be pushed downtoo far in the ranking by other items, relevant or not, that occur in multiple retrieval runs(i.e., the Chorus effect).
6.2 Fusing Recommendations
When combining the output of different recommendation algorithms, a decision needs tobe made about what to combine: the scores or ratings assigned to the recommended items,or the ranks of the items in the list of recommendations. These two options are commonly
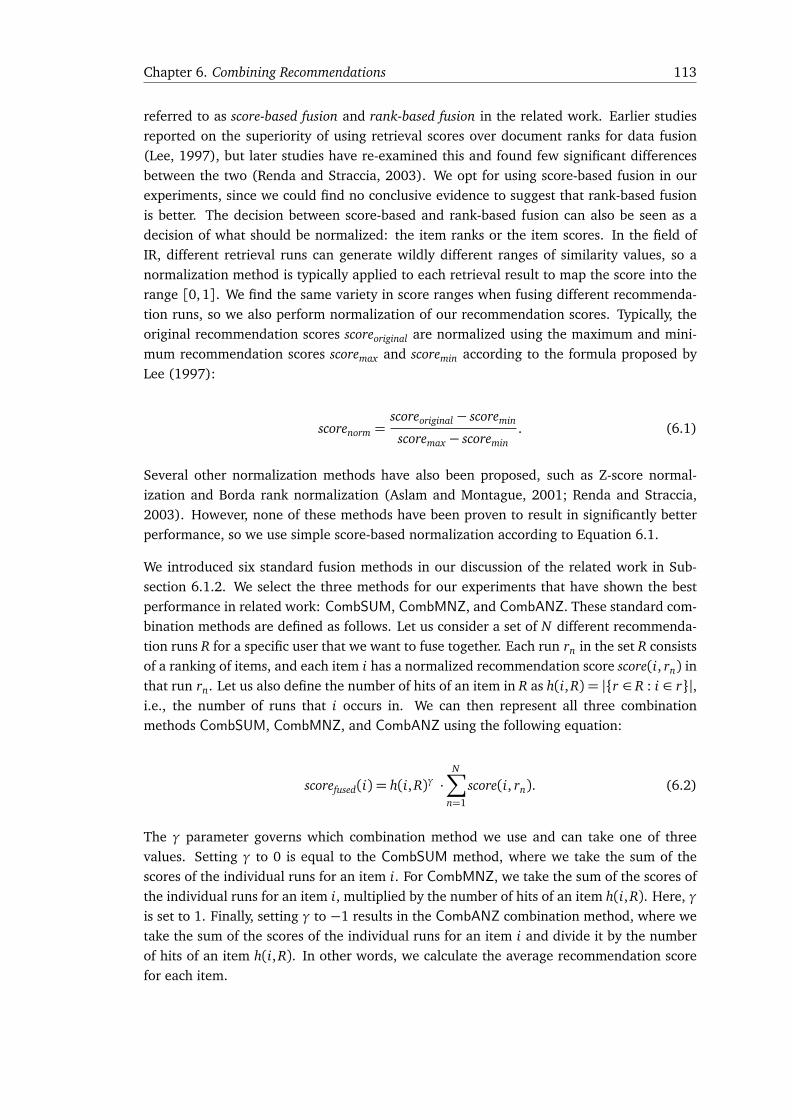
Chapter 6. Combining Recommendations 113
referred to as score-based fusion and rank-based fusion in the related work. Earlier studiesreported on the superiority of using retrieval scores over document ranks for data fusion(Lee, 1997), but later studies have re-examined this and found few significant differencesbetween the two (Renda and Straccia, 2003). We opt for using score-based fusion in ourexperiments, since we could find no conclusive evidence to suggest that rank-based fusionis better. The decision between score-based and rank-based fusion can also be seen as adecision of what should be normalized: the item ranks or the item scores. In the field ofIR, different retrieval runs can generate wildly different ranges of similarity values, so anormalization method is typically applied to each retrieval result to map the score into therange [0, 1]. We find the same variety in score ranges when fusing different recommenda-tion runs, so we also perform normalization of our recommendation scores. Typically, theoriginal recommendation scores scoreoriginal are normalized using the maximum and mini-mum recommendation scores scoremax and scoremin according to the formula proposed byLee (1997):
scorenorm =scoreoriginal− scoremin
scoremax − scoremin. (6.1)
Several other normalization methods have also been proposed, such as Z-score normal-ization and Borda rank normalization (Aslam and Montague, 2001; Renda and Straccia,2003). However, none of these methods have been proven to result in significantly betterperformance, so we use simple score-based normalization according to Equation 6.1.
We introduced six standard fusion methods in our discussion of the related work in Sub-section 6.1.2. We select the three methods for our experiments that have shown the bestperformance in related work: CombSUM, CombMNZ, and CombANZ. These standard com-bination methods are defined as follows. Let us consider a set of N different recommenda-tion runs R for a specific user that we want to fuse together. Each run rn in the set R consistsof a ranking of items, and each item i has a normalized recommendation score score(i, rn) inthat run rn. Let us also define the number of hits of an item in R as h(i, R) = |{r ∈ R : i ∈ r}|,i.e., the number of runs that i occurs in. We can then represent all three combinationmethods CombSUM, CombMNZ, and CombANZ using the following equation:
scorefused(i) = h(i, R)γ ·N∑
n=1
score(i, rn). (6.2)
The γ parameter governs which combination method we use and can take one of threevalues. Setting γ to 0 is equal to the CombSUM method, where we take the sum of thescores of the individual runs for an item i. For CombMNZ, we take the sum of the scores ofthe individual runs for an item i, multiplied by the number of hits of an item h(i, R). Here, γis set to 1. Finally, setting γ to −1 results in the CombANZ combination method, where wetake the sum of the scores of the individual runs for an item i and divide it by the numberof hits of an item h(i, R). In other words, we calculate the average recommendation scorefor each item.

Chapter 6. Combining Recommendations 114
These three combination methods are all unweighted, i.e., each run has an equal weightin the fusion process. However, a different common fusion approach in both recommendersystems and IR research is to do a linear combination of the individual runs as proposedby Bartell et al. (1994) and Vogt and Cottrell (1998). The benefit of weighting differentruns separately is obvious: not every run exhibits the same level of performance, and wouldtherefore not be assigned the same weight in the optimal combination. When we linearlycombine runs, each run is assigned a preference weight wn in the range [0, 1]. We alsotest weighted versions of the CombSUM, CombMNZ, and CombANZ combination methods.The weighted versions of the methods are defined as:
scorefused(i) = h(i, R)γ ·N∑
n=1
wn · score(i, rn). (6.3)
In the situations where we combine the results of two or more recommendation runs, theoptimal combination weights could be determined by a simple exhaustive parameter sweep,as we did for our similarity fusion approach in Subsection 4.4.3. When combining morethan two runs, however, performing an exhaustive search for the optimal weights quicklybecomes intractable, as it is exponential in the number of weights. We therefore useda random-restart hill climbing algorithm to approximate the optimal weights for all ourfusions runs (Russel and Norvig, 2003). We randomly initialized the weights for each run,then varied each weight between 0 and 1 with increments of 0.1. We selected the valuefor which the MAP score is maximized and then continued with the next weight. The orderin which run weights were optimized was randomized, and we repeated the optimizationprocess until the settings converged. We repeated this process 100 times, because the simplehill climbing algorithm is susceptible to local maxima. We used our 10-fold cross-validationsetup to determine these optimal weights. We then selected the weights that result in thebest performance and generated the recommendations on our final test set using theseoptimal weights.
6.3 Selecting Runs for Fusion
After deciding how to fuse recommendation runs together in the previous section, we thenneed to determine which runs we should fuse together. We let ourselves be guided hereby the intuition brought forward in the work of Belkin et al. (1993) and Ingwersen andJärvelin (2005), who argue that recommendations generated using cognitively dissimilarrepresentations and algorithms, i.e., that touch upon different aspects of the item recom-mendation process yield the best fused results. We consider two aspects of recommendationin our selection of recommendation runs: representations and algorithms. For instance, weconsider item-based filtering runs that use transaction patterns as a source of item similarityto be the same algorithmically as item-based filtering runs that use tag overlap similarities,but different in the way they represent the users and items in the system. Our two hybridfiltering approaches on the other hand use the same metadata representation of the system

Chapter 6. Combining Recommendations 115
content, but are different algorithms2. We do not consider fusing runs that do not differ onat least one of these dimensions. For instance, combining two user-based filtering runs thatboth use transaction patterns for finding the nearest neighbors and only differ in the type ofweighting is not likely to result in improved recommendations after fusion. Table 6.2 showswhich fusion experiments we perform.
Table 6.2: An overview of our ten fusion experiments. The second and third columnsdenote if the fusion experiment fuses together runs using different representations or dif-ferent algorithms respectively.
Run ID Diff. repr. Diff. alg. Description
Fusion A No Yes Best user-based and item-based filtering runs based on usagesimilarity (from Section 4.3).
Fusion B No Yes Best user-based and item-based filtering runs based on tag over-lap similarity (from Subsection 4.4.1).
Fusion C Yes Yes Best usage-based and tag overlap runs together.Fusion D No Yes Best content-based filtering runs (from Subsection 5.2.1).Fusion E No Yes Best user-based and item-based filtering runs based on
metadata-based similarity (from Subsection 5.2.2).Fusion F Yes Yes Best content-based and hybrid filtering runs together.Fusion G Yes Yes Best folksonomic and metadata-based runs together.Fusion H Yes Yes All four best runs from fusion experiments A and B together.Fusion I Yes Yes All four best runs from fusion experiments D and E together.Fusion J Yes Yes All eight best runs from fusion experiments A, B, D, and E.
In the first seven of our fusion experiments we fuse only pairs of best-performing runswithin a specific set of runs. From Chapter 4, for instance, we combine the best user-basedand item-based runs for the similarity representations: usage-based and tag overlap. Wealso combine the best runs of each representation type. We perform three similar fusionexperiments for Chapter 5. Fusion experiment G then combines the best runs from Chapter4 and 5 together. In addition to these seven pairwise fusion runs, we also experimentwith fusing the best four runs from each chapter together in fusion experiments H and Irespectively. Finally, we fuse all eight best runs from chapters 4 and 5 together. This resultsin a total of ten experiments.
6.4 Results
Table 6.3 lists the results of our fusion experiments. What we see is that, overall, fusingrecommendation results is successful: in 36 out of 40 fusion runs we find a performanceincrease over the best individual runs. The best fusion runs on our four data sets showimprovements ranging from 14% to 73% in MAP scores. When we take a look at the threedifferent fusion methods, we see that CombSUM and CombMNZ both consistently providegood performance, and that they outperform each other in half of the cases. The differencebetween the two is never significant. In contrast, the CombANZ method performs poorlyacross the board: only on the Delicious data set does it achieve reasonable performance in
2Even though they are both memory-based algorithms, we consider user-based and item-based filtering tobe different algorithms.

Chapter 6. Combining Recommendations 116
Table 6.3: Results of our fusion experiments. Reported are the MAP scores and the best-performing fusion methods for each set of fusion experiments are printed in bold. Boxedruns are the best overall. Significant differences are calculated over the best individualruns of each fusion run. The percentage difference between the best fusion experimentand the best individual run from the previous chapters is indicated in the bottom row.
Run Methodbookmarks articles
BibSonomy Delicious BibSonomy CiteULike
Fusion A
CombSUM 0.0282È 0.0050È 0.0910È 0.0871È
CombMNZ 0.0249È 0.0065È 0.0924È 0.0871È
CombANZ 0.0175È 0.0043È 0.0687È 0.0691È
Weighted CombSUM 0.0362È 0.0056È 0.0995È 0.0949Í
Weighted CombMNZ 0.0336È 0.0065È 0.1017È 0.0947Í
Weighted CombANZ 0.0303È 0.0043È 0.0924È 0.0934Í
Fusion B
CombSUM 0.0360È 0.0024È 0.1062È 0.0788È
CombMNZ 0.0350È 0.0032È 0.1104È 0.0801È
CombANZ 0.0245È 0.0023È 0.0904È 0.0560Ï
Weighted CombSUM 0.0374È 0.0102È 0.1171È 0.0945Í
Weighted CombMNZ 0.0434È 0.0093È 0.1196È 0.0952Í
Weighted CombANZ 0.0314È 0.0105È 0.1028È 0.0798È
Fusion C
CombSUM 0.0424È 0.0102È 0.1543È 0.1235Î
CombMNZ 0.0389È 0.0061È 0.1453È 0.1239Î
CombANZ 0.0229È 0.0057È 0.0787È 0.0896È
Weighted CombSUM 0.0482È 0.0109È 0.1593È 0.1275Î
Weighted CombMNZ 0.0477È 0.0115 È 0.1529È 0.1278Î
Weighted CombANZ 0.0305È 0.0089È 0.1262È 0.0973È
Fusion D
CombSUM 0.0322È 0.0020È 0.1273È 0.0883Ï
CombMNZ 0.0320È 0.0021È 0.1273È 0.0884Ï
CombANZ 0.0257È 0.0013È 0.0142È 0.0112È
Weighted CombSUM 0.0388È 0.0035È 0.1303È 0.1005È
Weighted CombMNZ 0.0387È 0.0037È 0.1302È 0.1008È
Weighted CombANZ 0.0311È 0.0038È 0.1127È 0.0371È
Fusion E
CombSUM 0.0410È 0.0051È 0.1314È 0.0889È
CombMNZ 0.0371È 0.0037È 0.1349È 0.0926Í
CombANZ 0.0247È 0.0036È 0.0636È 0.0464Ï
Weighted CombSUM 0.0514È 0.0051È 0.1579È 0.0908Î
Weighted CombMNZ 0.0473È 0.0043È 0.1596È 0.0945Î
Weighted CombANZ 0.0323È 0.0042È 0.1028È 0.0636È
Fusion F
CombSUM 0.0418È 0.0049È 0.1590È 0.1117Î
CombMNZ 0.0415È 0.0050È 0.1593È 0.1099Í
CombANZ 0.0142È 0.0023È 0.0313Ï 0.0284È
Weighted CombSUM 0.0492È 0.0051È 0.1600È 0.1127Î
Weighted CombMNZ 0.0494È 0.0056È 0.1599È 0.1136Í
Weighted CombANZ 0.0379È 0.0038È 0.1475È 0.0699È
Fusion G
CombSUM 0.0470È 0.0051È 0.1468È 0.1511Î
CombMNZ 0.0472È 0.0046È 0.1404È 0.1448Î
CombANZ 0.0235È 0.0051È 0.1368È 0.0084È
Weighted CombSUM 0.0524È 0.0102È 0.1539È 0.1556Î
Weighted CombMNZ 0.0539È 0.0109È 0.1506È 0.1478Î
Weighted CombANZ 0.0421È 0.0098È 0.1430È 0.0866È
Fusion H
CombSUM 0.0441È 0.0049È 0.1137È 0.1064È
CombMNZ 0.0463È 0.0047È 0.1129È 0.1117Î
CombANZ 0.0134È 0.0041È 0.0627È 0.0540Ï
Weighted CombSUM 0.0619È 0.0077È 0.1671È 0.1276Î
Weighted CombMNZ 0.0616È 0.0092È 0.1409È 0.1286Î
Weighted CombANZ 0.0247È 0.0069È 0.1063È 0.0901È
Fusion I
CombSUM 0.0507È 0.0042È 0.1468È 0.1057È
CombMNZ 0.0502È 0.0035È 0.1479È 0.1077È
CombANZ 0.0171È 0.0027È 0.0049È 0.0084È
Weighted CombSUM 0.0565È 0.0065È 0.1749È 0.1188Î
Weighted CombMNZ 0.0559È 0.0052È 0.1716È 0.1157Í
Weighted CombANZ 0.0307È 0.0033È 0.1206È 0.0454È
Fusion J
CombSUM 0.0507È 0.0056È 0.1617È 0.1211È
CombMNZ 0.0502È 0.0062È 0.1613È 0.1260Í
CombANZ 0.0085È 0.0027È 0.0163Ï 0.0163Ï
Weighted CombSUM 0.0681È 0.0090È 0.1983Í 0.1531Î
Weighted CombMNZ 0.0695 È 0.0086È 0.1904Í 0.1381Î
Weighted CombANZ 0.0309È 0.0039È 0.0954È 0.0589È
% Change over best individual run +72.9% +13.9% +31.3% +57.6%

Chapter 6. Combining Recommendations 117
some cases. The CombANZ method performs especially poorly on the CiteULike data set: inmany cases it performs significantly worse than the individual runs. When we compare theunweighted combination methods against the weighted combination method, we find thatthe latter consistently outperform the unweighted fusion approaches. In some cases, thesedifferences are statistically significant, as is the case in fusion run J for BibArt and CiteULike.Here, the weighted CombSUM runs achieve the data set-best MAP scores of 0.1983 and0.1556 respectively, which are significantly higher than the unweighted CombSUM runs at0.1617 (p = 0.04) and 0.1211 (p = 1.9 ·10−6). This confirms the findings of others such asVogt and Cottrell (1998) and Kamps and De Rijke (2004) who found similar advantages ofweighted combination methods. Typically, the best performing component runs are assignedthe higher weights than the other runs. The optimal weights for the 120 different weightedcombination runs are included in Appendix C.
We considered two different recommendation aspects when deciding which runs to com-bine: representations and algorithms. Pairwise fusion runs A, B, D, and E all combinedifferent algorithms that use the same representations, whereas runs C, F, and G combinepairs of runs that vary both in representation and algorithm. The results show that the lattertype of fusion, where different recommendation aspects are combined consistently performsbetter than when only one of the aspects is varied among the paired runs. We observe thesame thing for runs H, I, and J, that combine more than two runs at the same time. RunJ combines eight different runs that represent six different algorithms and four differenttypes of representations, and achieves the best overall MAP scores on three of our four datasets. On the Delicious data set though, we find that increasing the number of runs to becombined is not always beneficial: we see better performance on the pairwise B, C, and Gfusion runs than on the fusion runs that combine more individual runs.
In the next subsection we extend our analysis from determining which weighted combina-tion methods work best to why these methods provide such superior performance (Subsec-tion 6.4.1). Then, in Subsection 6.4.2, we compare the best weighted combination methodsto the similarity fusion and hybrid filtering techniques introduced in Subsection 4.4.3 andSubsection 5.2.2 respectively.
6.4.1 Fusion Analysis
While it is useful to determine exactly which combination methods provide the best perfor-mance, it would be equally interesting and useful to find out what it is exactly that makesfusion outperform the individual runs. Belkin et al. (1993) provides two different rationalesfor the success of fusion approaches that we already mentioned in Section 6.1. The first isa precision-enhancing effect: when multiple runs are combined that model different aspectsof the task, the overlapping set of retrieved items are more likely to be relevant. In otherwords, more evidence for the relevance of an item to a user translates to ranking that itemwith higher precision. The second rationale is a recall-enhancing effect, and describes thephenomenon that multiple runs that model different aspects will retrieve different set ofrelevant items. Fusing these individual runs can then merge these sets and increase recallof the relevant items.

Chapter 6. Combining Recommendations 118
Let us zoom in on two of the more successful combination runs, and analyze why we see theimprovements that we do. We select two runs that significantly improve over the individualruns: (1) fusion run G for CiteULike, where we combine the best folksonomic recommen-dation run with the best metadata-based run, and (2) fusion run J for BibArt, where wecombine all eight best individual runs from A, B, D, and E. Both runs combine differentalgorithms and different representation types. In our analysis we take an approach simi-lar to Kamps and De Rijke (2004) who analyzed the effectiveness of different combinationstrategies for different European languages. We manipulate our results in two differentways before the MAP scores are calculated to highlight the improvements in precision andrecall due to fusion. Each time we compare the fused run with each of the individual runsseparately to determine the effects of those runs.
For identifying the enhancements due to increased precision, we ignore the ranking of itemsthat did not occur in the individual run in our calculation of the MAP scores. This neutral-izes the effect of additionally retrieved items and isolates the contribution of items receivinga better ranking (Kamps and De Rijke, 2004). Table 6.4 shows the results of our analysisfor the two fusion runs, and the fourth column shows the MAP scores attributed to betterranking of the items that were originally present. For example, if we disregard the addition-ally retrieved items from the fused run in the top table, and only look at the relevant itemsalready retrieved by run 2, we see that for run 2 we get a MAP score of 0.1546. This is anincrease of 56.6% in MAP score over the original MAP score of 0.0987, which is due to abetter ranking of the items retrieved by run 2.
Table 6.4: Results of our fusion analysis. For each individual run we report the origi-nal MAP score, the total number of relevant retrieved items by the run, the MAP scoreattributed to enhanced precision, and the MAP score attributed to enhanced recall.
CiteULike – Fusion run G – Weighted CombSUMRun Original MAP Relevant docs Precision-enh. MAP Recall-enh. MAP
Run 1 0.0887 579 0.1343 +51.3% 0.1084 +22.1%Run 2 0.0987 791 0.1546 +56.6% 0.0992 +0.5%Fused run 0.1556 791 - -
Bibsonomy bookmarks – Fusion run J – Weighted CombSUMRun Original MAP Relevant docs Precision-enh. MAP Recall-enh. MAP
Run 1 0.0853 86 0.1889 +121.5% 0.0937 +9.8%Run 2 0.0726 92 0.1501 +106.7% 0.1071 +47.5%Run 3 0.0452 55 0.1315 +190.9% 0.1123 +148.5%Run 4 0.1084 55 0.1355 +25.0% 0.1685 +55.4%Run 5 0.1261 115 0.1981 +57.1% 0.1263 +0.2%Run 6 0.1173 111 0.1970 +67.7% 0.1186 +1.1%Run 7 0.0404 66 0.1709 +323.0% 0.0638 +57.9%Run 8 0.1488 90 0.1859 +24.9% 0.1591 +6.9%Fused run 0.1983 115 - -
For identifying the enhancements due to increased recall, we look at the contributions theitems newly retrieved by the fusion run make to the MAP score. This means we treat theitems retrieved by an individual run as occurring at those positions in the fused run as well.Any increases in MAP are then due to newly retrieved items that were not present in the
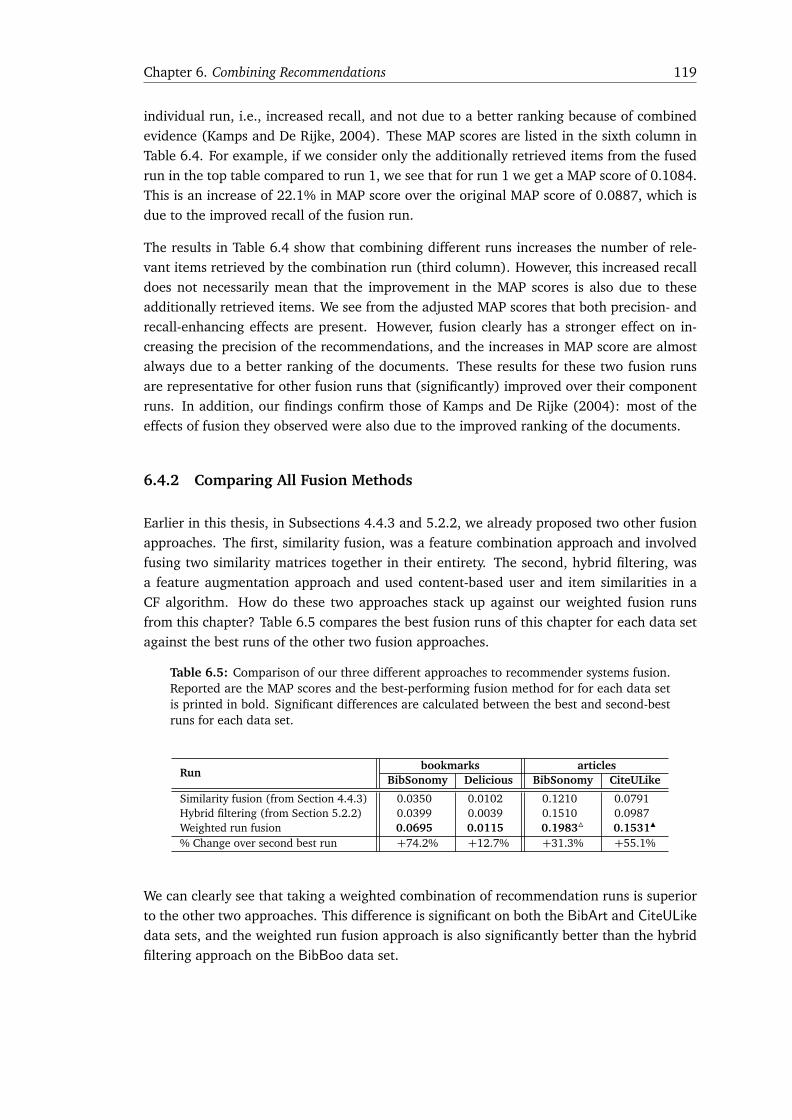
Chapter 6. Combining Recommendations 119
individual run, i.e., increased recall, and not due to a better ranking because of combinedevidence (Kamps and De Rijke, 2004). These MAP scores are listed in the sixth column inTable 6.4. For example, if we consider only the additionally retrieved items from the fusedrun in the top table compared to run 1, we see that for run 1 we get a MAP score of 0.1084.This is an increase of 22.1% in MAP score over the original MAP score of 0.0887, which isdue to the improved recall of the fusion run.
The results in Table 6.4 show that combining different runs increases the number of rele-vant items retrieved by the combination run (third column). However, this increased recalldoes not necessarily mean that the improvement in the MAP scores is also due to theseadditionally retrieved items. We see from the adjusted MAP scores that both precision- andrecall-enhancing effects are present. However, fusion clearly has a stronger effect on in-creasing the precision of the recommendations, and the increases in MAP score are almostalways due to a better ranking of the documents. These results for these two fusion runsare representative for other fusion runs that (significantly) improved over their componentruns. In addition, our findings confirm those of Kamps and De Rijke (2004): most of theeffects of fusion they observed were also due to the improved ranking of the documents.
6.4.2 Comparing All Fusion Methods
Earlier in this thesis, in Subsections 4.4.3 and 5.2.2, we already proposed two other fusionapproaches. The first, similarity fusion, was a feature combination approach and involvedfusing two similarity matrices together in their entirety. The second, hybrid filtering, wasa feature augmentation approach and used content-based user and item similarities in aCF algorithm. How do these two approaches stack up against our weighted fusion runsfrom this chapter? Table 6.5 compares the best fusion runs of this chapter for each data setagainst the best runs of the other two fusion approaches.
Table 6.5: Comparison of our three different approaches to recommender systems fusion.Reported are the MAP scores and the best-performing fusion method for for each data setis printed in bold. Significant differences are calculated between the best and second-bestruns for each data set.
Runbookmarks articles
BibSonomy Delicious BibSonomy CiteULike
Similarity fusion (from Section 4.4.3) 0.0350È 0.0102È 0.1210È 0.0791È
Hybrid filtering (from Section 5.2.2) 0.0399È 0.0039È 0.1510È 0.0987È
Weighted run fusion 0.0695È 0.0115È 0.1983Í 0.1531Î
% Change over second best run +74.2% +12.7% +31.3% +55.1%
We can clearly see that taking a weighted combination of recommendation runs is superiorto the other two approaches. This difference is significant on both the BibArt and CiteULikedata sets, and the weighted run fusion approach is also significantly better than the hybridfiltering approach on the BibBoo data set.

Chapter 6. Combining Recommendations 120
Finally, we would like to remark that, except for the Delicious data set, weighted run fusionoutperforms the tag-aware fusion approach of Tso-Sutter et al. (2008). These improvementsare statistically significant (p < 0.05) on the BibArt and CiteULike data set.
6.5 Discussion & Conclusions
We found that combining different recommendation runs yields better performance com-pared to the individual runs, which is consistent with the theory behind data fusion andwith the related work. Weighted fusion methods consistently outperform their unweightedcounterparts. This is not surprising as it is unlikely that every run contributes equally to thefinal result, and this was also evident from the optimal weight distribution among the runs.
In addition, we observed that combination methods that reward documents that show up inmore of the base runs—CombSUM and CombMNZ—are consistently among the best per-formers. In contrast, the CombANZ method performed worse than expected on our datasets. One reason for this is that CombANZ calculates an average recommendation scoreacross runs for each item. There is no bonus for items that occur in multiple runs such asCombSUM and CombMNZassign, and run overlap is an important indicator of item rele-vance. In addition, the averaging of CombANZ can lead to exceptionally performing baseruns being snowed under; this is especially apparent for the fusion experiments where fourand eight runs were combined. When more runs are combined, CombANZ starts performingworse, relative to the performance of pairwise fusion runs with CombANZ.
A third finding from our fusion experiments was a confirmation of the principle put for-ward by Ingwersen and Järvelin (2005) and Belkin et al. (1993): it is best to combinerecommendations generated using cognitively dissimilar representations and algorithms,touching upon different aspects of the item recommendation process.
We explored two different aspects to recommendation, representation and the choice ofalgorithm, and indeed found that runs that combine multiple, different recommendationaspects perform better than runs that consider variation in only one recommendation aspect.We also observed that for two data sets, BibBoo and BibArt, combining more runs tendsto produce better performance. Here, the best performing fusion runs were those thatcombined eight base runs that varied strongly in the type of algorithm and representation.
A separate analysis confirmed that most of the gains achieved by fusion are due to theimproved ranking of items. When multiple runs are combined, there is more evidencefor the relevance of an item to a user, which translates to ranking that item with higherprecision. Improved recall plays a much smaller role in improving performance. Overall,we find strong evidence for the Chorus effect in our experiments and, to a lesser extent,support for the Ranking effect. The lack of recall-related improvements suggests that we donot see the Dark Horse effect occurring in our fusion experiments.

Chapter 6. Combining Recommendations 121
6.6 Chapter Conclusions and Answer to RQ 3
We observed earlier in Chapters 4 and 5 that combining different algorithms and repre-sentations tends to outperform the individual approaches. Guided by our third researchquestion and its subquestion, we examined this phenomenon in more detail in this chapter.
RQ 3 Can we improve performance by combining the recommendations gen-erated by different algorithms?
RQ 3a What is the best recipe for combining the different recommendationalgorithms?
We found a positive answer to RQ 3: combining different recommendation runs yields betterperformance compared to the individual runs on all data sets. In answer to RQ 3a, weidentified several ingredients for successfully combining recommendation algorithms, suchas combining approaches that cover different aspects of the item recommendation task. Bycombining different algorithms and different representations of the data, we achieved thebest results. We compared weighted fusion methods with unweighted fusion methods andfound that weighted methods performed best. This is understandable, since not every runcontributes equally to the final result. Another ingredient for successful fusion is using acombination method that rewards documents that show up in more of the individual runs,harnessing the Chorus and Authority effects. After a detailed analysis, we learned that theseperformance improvements were largely due to a precision-enhancing effect: the rankingof overlapping items improves when they are retrieved by more runs. While fusion alsoincreases recall, this has only a weak effect on performance.


IIGROWING PAINS: REAL-WORLD ISSUES IN
SOCIAL BOOKMARKING
So far in this thesis, we have focused on recommendation in the social bookmarking sce-nario from a rather idealized perspective. All of the experiments described in the previouschapters were performed on snapshots of the respective social bookmarking websites. Wefroze the situation at a certain point in time to enable a fair comparison between the differ-ent recommendation algorithms. In real life, however, a social bookmarking website is farfrom static. Delicious, for instance, is one of the most popular social bookmarking servicesand received an average of 140,000 posts per day in 2008 according to the independentlysampled data collected by Philipp Keller3.
In addition to freezing our datasets, we also implicitly assumed that all items in our datasetswere unique and of equal quality, at least from the viewpoint of the recommendation algo-rithm. However, with the dynamic growth of social bookmarking also emerged its growingpains. One such problem is spam, and social bookmarking services—as is inevitable fornearly any website supporting user interaction—also suffer from this problem. Here, mali-cious users add items designed to mislead, or items that the site’s genuine users do not wishto receive. Obviously, these spam items should never be recommended to any user, but howserious is this problem? What is the proportion of spam items on social bookmarking web-sites and does it pose a problem for recommendations if these spam items are not detected,demoted, or prevented? A second possible problem for social bookmarking is the presenceof duplicates. Users rarely take the time to check if the items they posted already exist onthe social bookmarking website and many websites do not offer any user interface mecha-nisms for detecting duplicates. However, the question may be raised: does the presence ofduplicate content dilute the connections between users? And if so, (1) how can we detectthese duplicates, and (2) how does this influence the recommendation process?
In Part II of this thesis, we will broaden our narrow perspective on recommendation andinvestigate the effects of the aforementioned growing pains of social bookmarking from arecommendation perspective. Both issues are addressed separately in the next two chaptersand come with their own research questions.
3Available at http://deli.ckoma.net/stats; last visited January 2009.
123

Part II. Growing Pains: Real-world Issues in Social Bookmarking 124
RQ 4 How big a problem is spam for social bookmarking services?
RQ 5 How big a problem is the entry of duplicate content for social bookmark-ing services?
This part of the thesis is organized as follows. In Chapter 7 we look at how pervasive spam isin the social bookmarking services. Moreover, we focus on how we can detect such contentautomatically, and what kind of effect spam has on the recommendation process. Chapter 8follows a similar path in assessing the problem of duplicate content.

CH
AP
TE
R 7SPAM
The term ‘spam’ was originally used to refer to the abuse of electronic messaging systemsthat started in the mid-1990s on Usenet newsgroups, and quickly crossed over to e-mailmessaging. According to conservative estimates, in the first half of 2008 around 85% of alle-mail sent in the world was spam1. The notion of spam is subjective by nature, but we de-fine it here as content designed to mislead the perceiver, or content that the legitimate usersof a system, site, or service do not wish to receive. Motivation for spamming can range frommaking a profit through advertising and self-promotion to disruption and disparagement ofcompetitors (Heymann et al., 2007). Spamming is economically viable because joining theabused systems and injecting spam content into them is straightforward in general. Spam-ming also requires virtually no operating costs beyond the management of the automaticspamming software. In addition, it is often difficult to hold spammers accountable for theirbehavior.
Any system that relies on user-generated content is vulnerable to spam in one form or an-other. Indeed, many other electronic systems that allow users to store, share, and findonline resources have also come under attack from spamming attempts in recent years.Search engines, for instance, suffer increasingly from so-called spamdexing attempts withcontent especially created to trick search engines into giving certain pages a higher rank-ing than they deserve (Gyöngyi and Garcia-Molina, 2005). Spam comments are also be-coming an increasingly bigger problem for websites that allow users to react to content,such as blogs and video and photo sharing websites (Mishne and de Rijke, 2006). Finally,Wikipedia—another system focusing around user-generated content—has also seen an in-crease in research interest in automatic approaches to spam detection (Priedhorsky et al.,2007).
Social websites and social bookmarking services have become an increasingly popular partof the Web, but their focus on user-generated content also makes them vulnerable to spam,threatening their openness, interactivity, and usefulness (Heymann et al., 2007). In this
1According to http://www.maawg.org/about/MAAWG_2008-Q2_Metrics_Report9.pdf, last visited July21, 2009.
125

Chapter 7. Spam 126
thesis, we recognize spam to be one of the growing pains social bookmarking systems ex-perience as they attract more users. In this chapter, we wish to find out how big of aproblem spam is for social bookmarking and whether we can automatically detect spam insocial bookmarking systems. We will also investigate whether and what kind of effect thepresence of spam has on recommendation. Are anti-spam measures necessary to protectrecommendation quality? Or do spammers form a separate clique in the social networkthat has no influence on the recommendation process? This leads us to our fourth researchquestion and two, more specific subquestions.
RQ 4 How big a problem is spam for social bookmarking services?
RQ 4a Can we automatically detect spam content?
RQ 4b What influence does spam have on the recommendation performance?
To answer these questions we need to extend our data sets with spam labels that identify thespam users or entries as such. For an adequate orientation we start by giving an overview ofrelated work of combating spam in social bookmarking websites in Section 7.1. Section 7.2then describes our two collections and how we obtained the spam labeling necessary for ourexperiments. It also describes the setup of our spam detection experiments, and contains ananalysis of the spam problem for social bookmarking services (RQ 4). Then, in Section 7.3,we describe and evaluate a promising method of automatic spam detection using languagemodels (RQ 4a). In Section 7.4 we investigate the influence that spammers and spam postshave on the recommendation quality (RQ 4b).
7.1 Related Work
Spam issues in social bookmarking services have received relatively little attention so far.Heymann et al. (2007) were the first to examine the relationship between spam and socialbookmarking in detail. They classified the anti-spam strategies commonly in practice intothree different categories: prevention, demotion, and detection.
Prevention-based approaches are aimed at making it difficult to contribute spam content tothe social bookmarking system by restricting certain types of access through the interface(such as CAPTCHAs2) or through usage limits (such as post or tagging quota). The nofollowHTML attribute of hyperlinks can also serve as a spam deterrent, since it instructs searchengines that a hyperlink should not influence the link target’s ranking in the search engine’sindex, thereby removing the main motivation of spammers.
Demotion-based strategies focus on reducing the prominence and visibility of content likelyto be spam. Rank-based methods, for instance, try to produce orderings of the system’s
2A CAPTCHA is a challenge-response test used to prevent automated software from abusing online services.This is typically done by asking humans to perform a task that is difficult for a computer to perform prop-erly, such as deciphering distorted characters (Von Ahn et al., 2008). The word ‘CAPTCHA’ is an acronym for‘Completely Automated Public Turing test to tell Computers and Humans Apart’.

Chapter 7. Spam 127
content that are both more accurate and more resistant to spam (Heymann et al., 2007).A demotion-based strategy for combating spam is described by Heymann et al. (2007) andin more detail by Koutrika et al. (2007). The authors constructed a simplified model oftagging behavior in a social bookmarking system and compared different ranking methodsfor tag-based browsing. Moreover, they investigated the influence of various factors on theserankings, such as the proportion and behavior of spam users and tagging quota (Koutrikaet al., 2007). More importantly, they found that approaches that take into account theagreement in tagging behavior between users are best able to decrease the influence ofspam users for single-tag queries. Heymann et al. (2007) also found that restricting users totag budgets—limiting the number of tags per users—decreased the influence of spammers,although at the cost of restraining the positive impact on the system due to good useractivity.
Spam detection methods try to identify likely spam either manually or automatically, andthen act upon this identification by either deleting the spam content or visibly marking itas such for the user (Heymann et al., 2007). Krause et al. (2008) describe, as far as weknow, the only published effort of automatic spam detection with regard to social book-marking websites. Krause et al. investigated the usefulness of different machine learningalgorithms and features to automatically identify spam (Krause et al., 2008). They testedtheir algorithms on a data dump of the BibSonomy system and found that Support Vec-tor Machines (SVM) and logistic regression performed best on the spam detection task.They examined the individual contribution of the different feature sets, and found thatco-occurrence features—such as the number of co-occurrences of a user with spammersand non-spammers, and semantic features—contributed most to separating spammers fromnon-spammers.
In 2008, the Discovery Challenge workshop of the ECML/PKDD conference focused on twodata mining tasks related to social bookmarking. One of these was detecting spam usersin a social bookmarking system. So far, this has been the only TREC-like initiative focus-ing on the task of spam detection. With a total of 13 submissions, the majority of theparticipants’ approaches used machine learning for the prediction task. Six out of the topeight approaches that beat the baseline used a large variety of different content-based andco-occurrence-based features combined with machine learning algorithms to separate thespammers from the genuine users (Hotho et al., 2008). The seventh of the top eight submis-sions used a graph-based algorithm for the detection task (Krestel and Chen, 2008). Ourapproach, described in Bogers and Van den Bosch (2008b) and in more detail in Bogersand Van den Bosch (2009a) (see also Section 7.3), finished fourth at the 2008 DiscoveryChallenge. Wetzker (2008) analyzed a large crawl of Delicious and briefly addressed thepresence of spam in their data set. Contrary to the findings of Heymann et al. (2008a),they found a considerable spam presence on Delicious and reported that a large proportionof spam is created by a small number of users, suggesting automated posting routines forthese accounts.
Casting our nets a bit wider than just social websites, we can also find a wealth of other anti-spam approaching in related fields such as blogs. Mishne et al. (2005) were among the firstto address the problem of spam comments in blogs and used language model disagreementbetween the blog post itself, the comments, and any pages linked to from the comments to

Chapter 7. Spam 128
identify possible spam comments. Their work inspired our approach to spam detection insocial bookmarking. In 2006, the TREC Blog Track also paid attention to the problem ofblog spam (Ounis et al., 2006) by examining the influence of spam posts on blog retrieval.Ounis et al. found that low performing systems were not more likely to retrieve more spamdocuments than high performing systems, and that spam posts did not appear to be a majorhindrance to retrieval performance. In general, IR research on collections where a subset ofthe data has been manipulated for personal gain is known as adversarial IR, because of theopposing goals of the spammers and the search engine owners.
7.2 Methodology
To be able to answer RQ 4 and its two subquestions, we need access to data sets withmanually identified spam objects. One of the two tasks in the 2008 Discovery Challengewas spam detection in a social bookmarking system. Here, we use the organizers’ definitionof the spam detection task to guide our experiments (Hotho et al., 2008). The goal ofthe spam detection task is to learn a model that predicts whether a user is a spammer ornot. An added requirement is that the model should be able to accurately classify initialposts made by new users, in order to detect spammers as early as possible. The decisionto identify spam in BibSonomy at the user level instead of at the post level implies that allof a spam user’s posts are automatically labeled as spam. This decision was justified earlierin Krause et al. (2008) by the observation that users with malicious intent often attemptto hide their motivations by injecting non-spam posts3. In addition, Krause et al. also citeworkload reduction as a reason for their decision to classify spam at the user level. The2008 Discovery Challenge organizers report the following guidelines4 for labeling users asspammers.
“ If we have the impression, that the user tries to advertise some of his websites, tries to get backlinks to pages with a lot of google ads, or add links tooffensive stuff etc. then we set all posts of this user ’private’ and flag him asa spammer. ”
In the experiments described in this chapter, we use the setup of the 2008 Discovery Chal-lenge for our spam detection task and classify spam at the user level in both our BibSonomyand our CiteULike data set, to make for a fair comparison of our results. In the next subsec-tions, we describe our data collection process (Subsection 7.2.1), our data representationformat (Subsection 7.2.2), and how we evaluate the spam detection task (Subsection 7.2.3).
3Krause et al. were also the organizers of the 2008 Discovery Challenge, hence the same justification applies.Note, however, that the results reported in their 2008 paper were not achieved on the same data set as the onemade available in the Discovery Challenge.
4As described in https://mail.cs.uni-kassel.de/pipermail/rsdc08/2008-May/000005.html

Chapter 7. Spam 129
7.2.1 Data Collection
Automatic spam classification approaches typically demand a training or seed set to learnto predict spam characteristics (Heymann et al., 2007). So for us to be able to test ourspam detection approach, we needed access to data sets with manually identified spamobjects. We obtained such spam labels for data sets based on two social bookmarking web-sites: BibSonomy and CiteULike. The BibSonomy collection was pre-labeled as spam by theorganizers of the 2008 Discovery Challenge. For CiteULike we annotated a sizable part ofthe collection ourselves. For Delicious, however, the considerably larger size of that data setand the stronger spam filtering policies (Heymann et al., 2008a) made it impractical to dothe same. Hence, we excluded Delicious from this study. Table 7.1 provides statistics for thepresence of spam in the CiteULike and BibSonomy collections. In both data sets spammersadd two to three times as many tags to their posts on average than genuine users, therebyconfirming what was already signaled in Krause et al. (2008): that tag count seems to bean informative feature for spam prediction. In the next two paragraphs we describe howwe obtained our spam annotations and the specific characteristics of the two data sets.
Table 7.1: Spam statistics of the BibSonomy and CiteULike data sets. All CiteULike itemswere treated as references to scientific articles, since there is no clear-cut distinction be-tween bookmarks and references on CiteULike. For BibSonomy, these are the counts of thetraining material combined with the official test set.
BibSonomy CiteULike
posts 2,102,509 224,987bookmarks, spam 1,766,334 -bookmarks, clean 177,546 -references, spam 292 70,168references, clean 158,335 154,819
users 38,920 5,200spam 36,282 1,475clean 2,638 3,725
average posts/user 54.0 43.3spam 48.7 47.6clean 127.3 41.6
tags 352,542 82,121spam 310,812 43,751clean 64,334 45,401
average tags/post 7.9 4.6spam 8.9 7.7clean 2.7 3.2
BibSonomy One of the data sets we used in our spam detection experiments was theBibSonomy data set, as introduced earlier in Subsection 3.2.2. It was supplemented withinformation about spam content as part of the 2008 ECML/PKDD Discovery Challenge,and contained flags that identified users as spammers or non-spammers. The DiscoveryChallenge organizers were able to collect data of more than 2,600 active users and morethan 36,000 spammers by manually labeling users5. This reveals that the BibSonomy data
5This data set corresponds to the one described in Table 3.1.

Chapter 7. Spam 130
set is strongly skewed towards spam users with almost 14 spam users for each genuineuser. Table 7.1 also shows that spam users in BibSonomy clearly prefer to post bookmarks,whereas legitimate users tend to post more references.
CiteULike Our self-crawled CiteULike data set did not include pre-labeled spam users orposts as the BibSonomy data set did. We therefore set out to collect our own spam labelsfor this data set. Here, we faced the same choice as the team organizing the DiscoveryChallenge: at which level of the folksonomy should we identify spam usage—users, items,tags, or individual posts? Our CiteULike collection contains over 1 million posts and over800,000 items, and going through all of these was not practical. Judging all of the morethan 232,000 tags was also infeasible, in part because it is simply not possible for manytags to unequivocally classify them as spam or non-spam. For instance, while many spamentries are tagged with the tag sex, there are also over 200 valid references on CiteULikethat are tagged with sex. We therefore aimed to obtain an estimate of the pervasivenessof spam on CiteULike by identifying spam users. Judging all 25,375 users in the CiteULikedata set would still be impractical, so we randomly selected 5,200 users (∼20%) from thedata set and asked two annotators to judge these users on whether they were spammers ornot. Each user was judged by only a single annotator to save time. Appendix A.2 goes intomore detail about the spam annotation process, such as our annotation guidelines and theinterface we used.
Of the 5,200 users in our CiteULike subset, 1,475 (or 28.1%) were spam users, which isa smaller proportion than in BibSonomy. The numbers in Table 7.1 are reported for this20% sample of CiteULike users. An extrapolation of these proportions to the full CiteULikedata set results in an estimated 7,200 spam users who posted references to CiteULike. Toassess the accuracy of this estimation we may look at the problem from a different angle. Asalready remarked, certain spam references are removed quickly from the database by theCiteULike administrators, resulting in 404 Not Found errors when crawling their referencepages. During metadata crawling of all 803,521 references in our November 7, 2007 datadump, about 26.5% of the references returned 404 Not Found errors. A second round of re-crawling the metadata of these 213,129 missing references did not change this proportion.While spam removal is not necessarily the only reason for a 404 Not Found error, we foundthat 18.7% of the 7,671 users that posted these 213,129 missing references were spamusers identified in our annotation process, which is commensurate with the 20% sample wetook. Furthermore, we found that 60,796 of the missing references (or 28.5%) belonged tothe positively identified spam users. These estimates of 7,671 spam users (or 30.2%) and213,129 spam references (or 26.5%) suggest that our extrapolation of spam presence onCiteULike is reliable.
7.2.2 Data Representation
After collecting the data we created a single representation format for all posts, capturingall relevant metadata in separate fields. As mentioned before, two types of resources canbe posted to BibSonomy: bookmarks and BibTeX records, the latter with a magnitude moremetadata available. Because there is no such clear distinction in our CiteULike data set, we

Chapter 7. Spam 131
decided to treat BibTeX records and bookmarks the same and thus use the same format torepresent both. We represented all resource metadata in an TREC-style SGML format usingfour fields: TITLE, DESCRIPTION, TAGS, and URL. URLs were pre-processed before they wereused: punctuation was replaced by whitespace and common prefixes and suffixes like www,http://, and .com were removed. Figure 7.1 shows examples of clean and spam posts inour SGML representation. Whereas the clean post in Figure 7.1(a) is clearly recognizable asa regular scientific article, the emphasis on commercial incentives in Figure 7.1(b) signalsthe spam nature of that post.
!"#$%&&
&&&&!"#$'#%&()*+),&!-"#$'#%&&
&&&&!./.01%&&
&&&&&&&&2345&$65&24&$677&6&89:;4<&847=>#?@65ABA5@&&
&&&&!-./.01%&&
&&&&!"18$C/D./#'%&&
&&&&&&&&1$E0&$6?7F:&G4?:345:F5&65H&I?65JA:&K497A@345&&
&&&&!-"18$C/D./#'%&&
&&&&!.EG8%&&
&&&&&&&&:46?J3&6@45;:&A?&;FHF&&
&&&&!-.EG8%&&
&&&&!LC0%&&
&&&&&&&&:M?A5@4?7A5N&<4;6M?4::&FM45O?7&6:M&@45?4&6?PJ74&A::5&&
&&&&&&&&QRQ,&)+*R&SF7O<4&,TQU&:M6@4&(Q(&&
&&&&!-LC0%&&
!-"#$%&
(a) Clean post
!"#$%&
&&&&!"#$'#%&())*+,-&!."#$'#%&
&&&&!/0/12%&&
&&&&&&&&345&/4&6789:&/;<=>&/4&?47;&694@&&
&&&&!./0/12%&
&&&&!"2A$B0C/0#'%&&
&&&&&&&&D&&
&&&&!."2A$B0C/0#'%&
&&&&!/EFA%&&
&&&&&&&&G94@@8H@&:8;I>J4;K&L;4M4N4H&J;<=>&&
&&&&!./EFA%&
&&&&!OB1%&&
&&&&&&&&5IGL;4HI5P&IG7P8HIPP&P8JIL;4M4N4H&&
&&&&&&&&(--Q,(,-345/46789:/;<=>/4?47;694@&&
&&&&!.OB1%&
!."#$%&
(b) Spam post
Figure 7.1: Examples of clean and spam posts in our SGML representation.
A wide variety of metadata fields were available for the posts in the BibSonomy data set.For the bookmarks, the title information was taken from the BOOK_DESCRIPTION field in theMySQL dump, whereas the TITLE field was used for the BibTeX records. The DESCRIPTIONfield was filled with the BOOK_EXTENDED field for bookmarks, whereas the following fieldswere used for the BibTeX records: JOURNAL, PUBLISHER, ORGANIZATION, DESCRIPTION, ANNOTE,AUTHOR, EDITOR, BIBTEXABSTRACT, BOOKTITLE, HOWPUBLISHED, ADDRESS, SCHOOL, SERIES, andINSTITUTION. For both resource types all tags were added to the TAGS field. The URLs wereextracted from the BOOK_URL and URL fields and pre-processed as described above.
Our post representations were significantly poorer for the CiteULike data set: since spamreferences were removed from the CiteULike website, we could not crawl the associatedmetadata of the spam references (cf. Subsection 7.2.1). Full metadata was available for theclean references, but using all metadata of the clean posts and only the tags of the spamposts would yield an unfair comparison. Any classifier would then simply learn a modelwhere the presence or absence of metadata determines the predicted spam label. A systemthat predicts a post to be spam when it is missing metadata is unlikely to be very useful inany real-world situation. We therefore used only the tags for all CiteULike posts, clean andspam alike.

Chapter 7. Spam 132
7.2.3 Evaluation
To evaluate our different approaches and optimized parameters, we divide each data set intoa training set, a validation set, and a test set. Our models are trained on the training set andparameters were optimized on the validation set to prevent overfitting. For the BibSonomydata set, an official test set was supplied as part of the 2008 Discovery Challenge as well astraining material, so we used this partitioning. We randomly selected 80% of the users fromthe training material for our training set and assigned the remaining 20% to our validationset. This gave us a training set of 25,372 users, a validation set of 6,343 users, and a testset of 7,205 users. For the CiteULike data set, we randomly selected 60% of all users forour training set, 20% for our validation set, and assigned the remaining 20% to our test set.This corresponded to 4,160 training users, and 520 validation set users, and 520 users inthe CiteULike test set. For the final predictions on the test sets we used only the trainingsets we created to train our algorithm and generate the spam labeling predictions.
We evaluated our approaches on the validation and test sets using the standard measure ofAUC (area under the ROC curve). The ROC curve plots the true positive rate of a classifierin the range [0, 1] against the false positive rate in the domain [0, 1]. The diagonal in thisgraph represents the performance of a classifier that randomly guesses the output classes.Curves closer to the top left corner are better; a perfect ROC curve would go up horizontallyfrom (0,0) to (0,1) and then vertically from (1,0) to (1,1). The AUC score represent thearea under the ROC curve where 1.0 is the perfect score. We optimized k using AUC ratherthan on measures like the F-score, because AUC is less sensitive to class skew than F-score(Fawcett, 2004). This is especially relevant given that the data is rather skewed indeed,especially in the case of BibSonomy, with 12 spam users to every clean one.
7.3 Spam Detection for Social Bookmarking
Our approach to spam detection was inspired by the approach of Mishne et al. (2005)for dealing with spam in blog comments. It is based on the intuitive notion that spamusers will use different language than ‘legitimate’ users when posting resources to a socialbookmarking system. We detect new spam users in the system by first ranking all the oldusers in the system by the KL-divergence of the language models of their posted content andthe language models of the new user’s posts. We then look at the spam labels assigned to themost similar users in the system to predict a spam label for the new user. We propose usinglanguage models at two different levels of granularity: (1) at the level of separate posts,and (2) combined into user profiles. We will refer to these two variants of our approach asuser-level spam detection and post-level spam detection respectively.
Both variants of our approach correspond to a k-nearest neighbor classifier with KL-diver-gence as its similarity metric. We will refer to our general approach as SPAMORY, becauseit is a memory-based spam detection algorithm. Each of the two variants consist of twosteps: (1) calculating the similarity between users or posts, and (2) determining the finalclassification. In the next two subsections, we describe these two steps in more detail.Subsection 7.3.3 then presents our results, followed by a discussion in Subsection 7.3.4.

Chapter 7. Spam 133
7.3.1 Language Models for Spam Detection
Language models (Jelinek, 1990) are a class of stochastic n-gram models, generally used tomeasure a degree of surprise in encountering a certain new span of text, given a training setof text. The core of most language models is a simple n-gram word prediction kernel that,based on a context of two or three previous words, generates a probability distribution ofthe next words to come. Strong agreement between the expected probabilities and actuallyoccurring words (expressed in perplexity scores or divergence metrics) can be taken asindications that the new text comes from the same source as the original training text.Language models are an essential component in speech recognition (Jelinek, 1990) andstatistical machine translation (Brown et al., 1990), and are also an important model ininformation retrieval (Ponte and Croft, 1998). In the latter context, separate languagemodels are built for each document, and finding related documents to queries is transformedinto ranking documents by the likelihood, estimated through their language model, thateach of them generated the query. We do the same for SPAMORY.
In generating our document language models, we have three different options for the gran-ularity level of what span of text should be considered a document. At the most detailedlevel, we can construct a language model for each individual post, match these to the incom-ing posts, and use the known spam status of the best-matching posts already in the systemto generate a prediction for the incoming posts or users. We can also take a higher-level per-spective and collate all of a user’s posts together to form merged documents that could beconsidered “user profiles”, and generate language models of these individual user profiles.Incoming posts or users can then be matched against the language models of spammersand clean users to classify them as being more similar to one or the other category. A thirdoption—at an even higher level of granularity—would be to only consider two languagemodels: one of all spam posts and one of all clean posts. However, we believe this to be toocoarse-grained for accurate prediction, so we did not pursue this further.
Figure 7.2 illustrates these two variants of SPAMORY. In the user-level variant depicted inFigure 7.2(a), the new user’s profile—the concatenated collection of posts made by thisuser to the system—are matched against all existing user profiles. For each new user, thissimilarity matching process results in a list of the existing users, ranked by how similar theirprofiles are to the new user’s profiles in terms of language use. The users that are mostsimilar to the new user then determine the spam label. In this toy example, the majority ofthe top ranked users are spam users, so the classifier outputs the prediction ‘Spam’.
In the post-level variant in Figure 7.2(b) the matching is done at the post level. Each ofthe new user’s posts is matched separately against all the posts in the collection. For eachnew post, the matching process results in a list of the existing posts, ranked by how similarthey are to the new post terms of language use. In the toy example in Figure 7.2(b) thisresults in ten different ranked lists, one for each new post. For each list separately, the bestmatching posts determine the spam label of the new post, resulting in a spam classificationfor each of the ten new posts. The final user spam label, the level at which we want our finalpredictions, is then generated by aggregating the predictions for the individual posts. In thetoy example only three of the ten new posts were classified as spam, so the final user-levelprediction is ‘Clean’.

Chapter 7. Spam 134
!"! #####$%&'#######
("! #####$%&'#######
)"! #####*+,&-#######
."! #####$%&'#######
/"! #####$%&'#######012230415#16#
7839#:91;238#
new user!
SPAM!8<=<2>9<?@#
=>?0A<5B#
(a) User-level spam detection
!"##$!%"&'"('
)"*+*'
new user! new posts!
CLEAN!
,-''''''''./012'
3-''''''''./012'
4-''''''''5617'
8-''''''''./012'
9-''''''''./012'
:-''''''''./012'
;-''''''''./012'
<-''''''''5617'
=-''''''''./012'
*>?>#@A>+B'
?@+!C>&D'
(b) Post-level spam detection
Figure 7.2: Two variants of our spam detection approach
We used the Kullback-Leibler divergence metric to measure the similarity between the lan-guage models. The KL-divergence measures the difference between two probability distri-butions Θ1, Θ2 is
K L(Θ1||Θ2) =∑
wp(w|Θ1) log
p(w|Θ1)p(w|Θ2)
, (7.1)
where p(w|Θ1) is the probability of observing the word w according to the model Θ1 (Man-ning and Schütze, 1999; Mishne et al., 2005).
The Indri toolkit6 implements different retrieval methods based on language modeling(Strohman et al., 2005). We used version 2.7 of this toolkit to perform our experiments andconstruct and compare the language models of the posts and user profiles. The languagemodels we used are maximum likelihood estimates of the unigram occurrence probabilities.We used Jelinek-Mercer smoothing to smooth our language models, which interpolates thelanguage model of a post or user profile with the language model of a background cor-pus (Jelinek, 1990)—in our case the training collection of posts or user profiles. We choseJelinek-Mercer smoothing because it has been shown to work better for verbose queriesthan other smoothing methods such as Dirichlet smoothing (Zhai and Lafferty, 2004). Ouruser profiles and posts contain enough text to be considered verbose compared to stan-dard IR query lengths. Preliminary experiments with Dirichlet smoothing confirmed this
6Available at http://www.lemurproject.org

Chapter 7. Spam 135
for SPAMORY, as it was consistently outperformed by Jelinek-Mercer smoothing. While it iscertainly possible to use other measures of document similarity, such as the cosine similar-ity, preliminary experiments with the Vector Space model and the cosine similarity metricconsistently underperformed the language modeling approach. We therefore focused ourefforts on language modeling and KL-divergence for user-user and post-post similarity.
We experimented with both the user-level approach and the post-level approach as illus-trated in Figure 7.2. At the user-level, we compared the language models of the user profilesin our validation and test sets with the language models of the profiles in our training set.We then obtained a ranked list of the best-matching training users for each test user. Wedid the same at the post level by comparing the test post language models with the lan-guage models of the training posts. Here, ranked lists of best-matching posts were obtainedfor each test post. The similarity rankings based on the original similarity scores simoriginal
were normalized into [0, 1] using the maximum and minimum similarity scores simmax andsimmin by the formula from Lee (1997):
simnorm =simoriginal− simmin
simmax − simmin. (7.2)
These similarity rankings were normalized, and used as input for the spam classificationstep. In our BibSonomy data set we have four different metadata fields available to gen-erate the language models of the posts and user profiles in our training collection: title,description, tags, and tokenized URL. In addition to these ‘complete’ runs with all fields, wealso ran experiments where we only used the information from the four fields separately.An example would be to use only the tags from the training users and the test users. Thisresulted in five different runs for BibSonomy. For CiteULike we only had the tags avail-able, so we performed only one run here. We experimented with different combinations ofmetadata fields and refer the reader to Bogers and Van den Bosch (2009a) for more details.
7.3.2 Spam Classification
After we generated the language models for all posts and user profiles, we obtained thenormalized rankings of all training documents, relative to each test post or user profile.For each of the best-matching training documents, we used the manually assigned spamlabels (’0’ or ’1’) to generate a single spam score for the new user. The simplest method ofcalculating such a score would be to output the spam label of the top-matching document.A more elegant option would be to take the most common spam label among the top k hits.We settled on calculating a weighted average of the similarity scores multiplied by the spamlabels, as preliminary experiments showed that this combination outperformed the otheroptions. Spam scores score(ui) for a user ui were calculated according to the followingequation:
score(ui) =
k∑
r=1,r 6=i
sim(ui , ur) · label(ur)
k, (7.3)

Chapter 7. Spam 136
where for the top k matching users ur from ranks 1 to k the similarity score sim(ui , ur)between the user in question ui and the matching user ur is multiplied by the spam labellabel(ur) of that matching user. The total weighted scores are divided by the number ofmatches k, yielding a weighted average score for ui .
For post-level classification, this meant that we obtained these weighted average spamscores on a per-incoming-post basis. To arrive at user-level spam scores, we then matchedeach incoming post to a user and calculated the average per-post score for each user. In therare case that no matching documents could be retrieved, we resorted to assigning a defaultlabel of no spam (‘0’). In the BibSonomy validation set, for instance, this only occurred for0.7% of users. Our default classification for these users was ‘clean’ because 84.2% of theseusers in the BibSonomy validation set were legitimate users.
After implementation of all these techniques, one question still remains: how many of thetop matching results should be used to predict the spam score? Here, our approach issimilar to a k-nearest neighbor classifier, where the number of best-matching neighbors kdetermines the prediction quality. Using too many neighbors might smooth the pool fromwhich to draw the predictions too much in the direction of the majority class, while notconsidering sufficient neighbors might result in basing too many decisions on accidentalsimilarities. We optimized the optimal value for k for all of the variants separately on theAUC scores on the validation set. These optimal values of k were then used to calculate thefinal scores on the test sets.
7.3.3 Results
Table 7.2 lists the outcomes of the two different variants of our SPAMORY approach on thetwo collections. Since we optimized on the validation sets, we mainly focus on the test setscores to draw our conclusions. The best performing approach on BibSonomy, at an AUCscore of 0.9661, is spam detection at the user level, using all available metadata fields. Thebest post-level run on BibSonomy also used all of the data for all of the posts, and achievesa score of 0.9536. On the CiteULike data set, the best performance at the user level and postlevel yields AUC scores of 0.9240 and 0.9079, respectively. This seems to suggest that ourapproach generalizes well to other data sets and social bookmarking systems. We observethat in general, using the language models constructed at the user level outperforms usingthe post-level language models. This is also visible in Figure 7.3, which shows the ROCcurves for the best user-level and post-level runs for each collection.
An interesting difference between the validation set and the test set is that using only thetags to construct the language models yields the best performance on the validation set,whereas performance using only tags drops markedly on the test set. Using all availablemetadata fields results in a considerably more stable performance across both BibSonomyevaluation sets. It should therefore be considered as the preferred variant.
In contrast, we observed that most of the other runs using different combinations of meta-data fields tend to perform visibly better on either the validation or the test set. A thirdinteresting observation is the difference in the optimal size of the neighborhood k used to

Chapter 7. Spam 137
Table 7.2: Results of our two spam detection variants on the BibSonomy and CiteULikedata sets. Scores reported are AUC, with the best scores for each set of collection runsprinted in bold. The optimal neighborhood size k is listed for each user-level and post-levelruns. For the same set of runs, the same value of k was used in both the validation and thetest set.
Collection FieldsUser level Post level
Validation Test k Validation Test k
BibSonomy
All fields 0.9682 0.9661 235 0.9571 0.9536 50TITLE 0.9290 0.9450 150 0.9055 0.9287 45DESCRIPTION 0.9055 0.9452 100 0.8802 0.9371 100TAGS 0.9724 0.9073 110 0.9614 0.9088 60URL 0.8785 0.8523 35 0.8489 0.8301 8
CiteULike TAGS 0.9329 0.9240 5 0.9262 0.9079 5
0
0.2
0.4
0.6
0.8
1
0 0.2 0.4 0.6 0.8 1
TP R
ate
FP Rate
ROC curve (best runs)
BibSonomy, post levelBibSonomy, user level
CiteULike, post levelCiteULike, user level
Figure 7.3: ROC curves of the best-performing user-level and post-level approaches forboth collections. Curves closer to the top left corner are better; a perfect ROC curve wouldgo up horizontally from (0,0) to (0,1) and then vertically from (1,0) to (1,1).
predict the spam labels. In almost all cases, the post-level variants require a smaller k thanat the user level. The optimal neighborhood size for CiteULike is the same for both theuser-level and the post-level variants, and surprisingly smaller than for BibSonomy.
Comparison to Other Approaches While we have not compared SPAMORY to standardspam detection approaches such as SVMs or Naive Bayes directly, we can use the outcome ofthe spam detection task at the 2008 Discovery Challenge to measure SPAMORY against suchapproaches. Our updated version of SPAMORY would have achieved the third place with anAUC score of 0.9661, surpassed only by a ridge regression approach with extensive featurepreparation and selection, and a SVM approach to spam detection (Hotho et al., 2008). Four

Chapter 7. Spam 138
of the top eight approaches used SVM; the other three SVM approaches performed worsethan the approach described in this paper. One participant used Naive Bayes learning withextensive feature selection, achieving slightly lower scores than our approach. Finally, oneof the participants compared five different machine learning methods on the spam detectiontask, with none of the five outperforming our kNN-based approach, suggesting that SPAMORY
is competitive with other machine learning methods.
A particular advantage of our SPAMORY approach is that it could be implemented with lim-ited effort on top of an existing social bookmarking search engine. After retrieving rele-vant results for a user query, the top k matching results can then be used to generate thespam classification, requiring only a lookup of predetermined spam labels. Other machinelearning approaches would require a more elaborate implementation without being able toleverage the existing search infrastructure of a social bookmarking website.
7.3.4 Discussion and Conclusions
In this chapter we presented SPAMORY, an adversarial information retrieval approach em-ploying language modeling to detect spam in social bookmarking websites. We started byusing language models to identify the best-matching posts or user profiles for incomingusers and posts. We then looked at the spam status of those best-matching neighbors andused them to guide our spam classification. Our results indicate that our language model-ing approach to spam detection in social bookmarking systems is promising, yielding AUCscores of 0.953 and 0.966 on spam user detection. This confirms the findings of Mishneet al. (2005), who applied a similar two-stage process using language modeling to detect-ing blog spam, albeit on a smaller scale. With our approach and experimental setup wehave improved upon the work described in Mishne et al. (2005) in two ways. One improve-ment is in scale: the data set we used, is several orders of magnitude larger than the oneused by Mishne et al., with 43000+ users and 2,300,000+ posts divided over two differentdata sets, compared to their 50 blog posts and 1024 comments (Mishne et al., 2005). SinceSPAMORY was inspired by their approach, our results serve to confirm that using languagemodel similarity is a good approach for spam detection on a much larger scale as well. Asecond improvement can be found in the evaluation measure used. In the data set used byMishne et al. 68% of the content was spam and in our two data sets these proportions werearound 93% and 28%. When evaluating on such skewed data sets it is much better to use ameasure such as AUC than to use the simple accuracy metric used by Mishne et al. (Fawcett,2004).
Language Model Granularity We experimented with using language models at two dif-ferent levels of granularity and found that matching at the user level and using all of theavailable metadata gave the best results. In general, matching at the user level resulted inbetter performance than matching at the post level for both BibSonomy and CiteULike.
This difference can be partly explained by the fact that the spam labels in both data setswere judged and assigned at the user level, because this is the desired level of the end ap-plication. Even if a spam user posts some ’genuine’ posts, the entire content of the spamuser should be deleted on grounds of the adversarial intentions behind them. Yet, those

Chapter 7. Spam 139
’genuine’ posts of spam users are then automatically flagged as spam, thereby introducingmore noise for the post-level classification than for the user-level classification. Dependingon whether the user’s intentions were genuine or not, the same article or website could beposted multiple times, sometimes labeled as clean content, other times labeled as spam con-tent. This could potentially confuse the post-level classifier, but not the user-level classifier.Early classification of spam users at their earliest posts can therefore be expected to be lessaccurate than the reported 0.95–0.96 range; post-level AUC scores suggest this accuracywould be closer to 0.91–0.95.
A second likely explanation for the better performance of the user-level approach is meta-data sparseness at the post level. A post-level approach is more likely to suffer from incom-ing posts with sparse or missing metadata. For instance, although 99.95% of all posts in theBibSonomy data set have valid tags7, this also means that it is possible for incoming poststo have no tags. Without any tags as metadata or sparse metadata in the other fields, ourpost-level SPAMORY variant cannot find any matching posts in the system. At the user level,this is much less likely to happen: only 0.009% of all users never assign any tags. Aggregat-ing all metadata of a user’s posts can yield sufficient metadata to base reliable predictionson, whereas the post-level approach can be affected by this to a greater extent. Missingtags might also be a reason for the fact that performance on CiteULike is slightly lower thanperformance on BibSonomy.
Neighborhood Size When looking at the optimal neighborhood sizes k for BibSonomy,we see that in almost all cases the post-level approaches required a smaller k than at theuser level. We believe that this is because the presence of multiple topics in user profiles.Individual posts are usually about a single topic, whereas a user profile is composed of allof that user’s posts, which are likely to be about multiple topics of interest. This makesfinding the related posts to an individual post easier, in the sense that it requires fewernearest neighbors to arrive at a prediction. At the user level, however, different parts of auser’s profile might match up with different users already in the system, thus requiring morenearest neighbors to arrive at a reliable prediction. For CiteULike the optimal k values arethe same for both the post level and the user level, but we have no plausible explanationfor this.
Future Work No spam detection approach can be expected to remain successful withoutadapting to the changing behavior of the spammers. One way spammers could circumventour SPAMORY approach would be by generating metadata with a similar language model tothe clean posts in the system. This way, spammers can make it more complicated for ourapproach to distinguish between themselves and genuine users. However, this also makes itmore difficult for the spammers themselves: it is very hard for a spammer to post resourcesto a social bookmarking system that will be both similar to existing posts and to the languageof the spam entry (Mishne et al., 2005). In addition, such behavior could be countered byextending our method to include the language models of the pages and documents behind
7Valid meaning with a tag other than system:unfiled, the default tag that is assigned by the system when notags were added by the user.

Chapter 7. Spam 140
the bookmarks8. In the case of sparse metadata, this might be able to boost performanceof the spam detection algorithm. Extending SPAMORY in such a way is one of the possibleavenues for future work. A second option would be to include extra features such as thePageRank scores (Page et al., 1998) of the bookmarked pages, and see whether pages withlow PageRank are more predictive of spam status than others.
7.4 The Influence of Spam on Recommendation
In the previous section, we described a successful approach to the problem of detecting spamin social bookmarking systems. Spam content is a nuisance to all parties involved but thespammers themselves. For users, spam pollutes the result lists when searching or brows-ing a social bookmarking website, whereas from the system administrators’ standpoint itwastes both computing power and storage capacity. Adequate spam detection and removalis therefore an important component of any mature social bookmarking service. Removingspam is also a boon to the performance of a recommender system. Recommending spamlowers the trust users place in the system, and can impair the efficiency and effectiveness ofrecommendation algorithms such as CF. Removing spam users and items means they do nothave to be taken into account anymore when calculating the similarities between users anditems, severely cutting down on computation time. The question we wish to answer in thissection is how much recommendation effectiveness is weakened by the presence of spam.In other words, how much is recommendation performance degraded by spam content, andhow often does spam content show up in the results? Our experiments here should be re-garded as a case study and a first look into the problem of spam for item recommendationon social bookmarking websites.
7.4.1 Related Work
Most of the related work on spam and recommendation has focused on the creation ofmore robust recommendation algorithms that are less affected by spam. Spam attacks onrecommender systems are commonly referred to as shilling attacks (Lam and Riedl, 2004).In such attacks, a malicious user creates multiple fake identities in the recommender system.Using these fake profiles, coordinated sets of spam user profiles with ratings are injected insuch a manner that they affect the recommendations made by the system to the advantage ofthe spammer. Individually, each user profile will not affect the recommendations, but, whencombined, the profiles are designed to boost certain items in favor of others. Two typesof shilling attacks are distinguished: push attacks, that attempt to promote a certain itemin the recommendations, and nuke attacks, that are aimed at downgrading specific items(O’Mahony et al., 2004). Several robust recommendation algorithms have been proposed inrecent years (O’Mahony et al., 2004; Mobasher et al., 2006; Resnick and Sami, 2007; Bryanet al., 2008; Mehta, 2008), and they have shown that, in general, model-based algorithms
8Although it should be noted that it is far from trivial to obtain the full text of all the source documentslinked to by the BibSonomy and CiteULike posts. Moreover, we suspect that incorporating language modelsfrom all externally linked Web pages and documents would slow down a real-time spam filtering system to anundesirable degree.
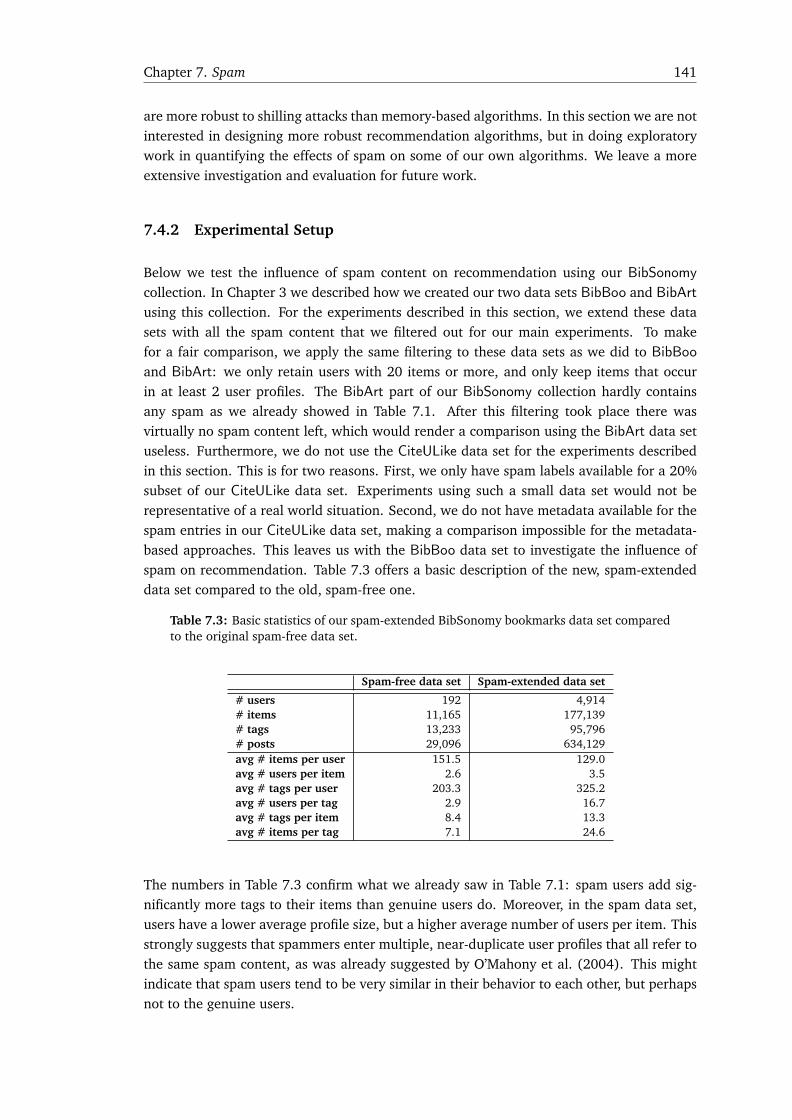
Chapter 7. Spam 141
are more robust to shilling attacks than memory-based algorithms. In this section we are notinterested in designing more robust recommendation algorithms, but in doing exploratorywork in quantifying the effects of spam on some of our own algorithms. We leave a moreextensive investigation and evaluation for future work.
7.4.2 Experimental Setup
Below we test the influence of spam content on recommendation using our BibSonomycollection. In Chapter 3 we described how we created our two data sets BibBoo and BibArtusing this collection. For the experiments described in this section, we extend these datasets with all the spam content that we filtered out for our main experiments. To makefor a fair comparison, we apply the same filtering to these data sets as we did to BibBooand BibArt: we only retain users with 20 items or more, and only keep items that occurin at least 2 user profiles. The BibArt part of our BibSonomy collection hardly containsany spam as we already showed in Table 7.1. After this filtering took place there wasvirtually no spam content left, which would render a comparison using the BibArt data setuseless. Furthermore, we do not use the CiteULike data set for the experiments describedin this section. This is for two reasons. First, we only have spam labels available for a 20%subset of our CiteULike data set. Experiments using such a small data set would not berepresentative of a real world situation. Second, we do not have metadata available for thespam entries in our CiteULike data set, making a comparison impossible for the metadata-based approaches. This leaves us with the BibBoo data set to investigate the influence ofspam on recommendation. Table 7.3 offers a basic description of the new, spam-extendeddata set compared to the old, spam-free one.
Table 7.3: Basic statistics of our spam-extended BibSonomy bookmarks data set comparedto the original spam-free data set.
Spam-free data set Spam-extended data set
# users 192 4,914# items 11,165 177,139# tags 13,233 95,796# posts 29,096 634,129avg # items per user 151.5 129.0avg # users per item 2.6 3.5avg # tags per user 203.3 325.2avg # users per tag 2.9 16.7avg # tags per item 8.4 13.3avg # items per tag 7.1 24.6
The numbers in Table 7.3 confirm what we already saw in Table 7.1: spam users add sig-nificantly more tags to their items than genuine users do. Moreover, in the spam data set,users have a lower average profile size, but a higher average number of users per item. Thisstrongly suggests that spammers enter multiple, near-duplicate user profiles that all refer tothe same spam content, as was already suggested by O’Mahony et al. (2004). This mightindicate that spam users tend to be very similar in their behavior to each other, but perhapsnot to the genuine users.

Chapter 7. Spam 142
Which algorithms do we use to test to determine the influence that spam content has onitem recommendation? We selected the approaches from Chapters 4 and 5 that performedbest on the BibBoo data set: (1) item-based filtering using tag overlap similarity, and (2)profile-centric content-based filtering. We selected IT-JACCARD-SIM as our similarity metricfor the item-based filtering algorithm, and optimized the neighborhood size for the spamextended data sets using our 10-fold cross-validation setup. For the profile-centric approachwe used all of the intrinsic metadata fields for our user and item representations. Using thespam-extended version of our BibSonomy bookmarks data set, we considered all users anditems for calculating the similarities. We only evaluated, however, on the users present inthe clean data sets, because we are not interested in how well we can recommend contentto spam users. We evaluated on MAP and on the average percentage of spam content inthe top 1, top 10, top 25, top 50, top 100, and top 1000 results. We derived a list of spamcontent by assuming all the items not present in our original, spam-free data set were spam.We know this is not a perfect assumption, as spammers tend to include ‘genuine’ posts tothrow off spam detection efforts. If these ‘genuine’ items were not in the original spam-freedata set, then they were misclassified as spam. However, we do not believe this to be a bigproblem.
7.4.3 Results and Analysis
Table 7.4 contains the results of our two selected algorithms on the BibBoo data set withand without spam. What we see is that the content-based approach is affected most by thepresence of spam: the MAP score on the spam-extended data set decreases by almost 30%from 0.0402 to 0.0283, although the difference is not statistically significant (p = 0.060).Surprisingly, the item-based filtering run using tag overlap achieves a slightly higher MAPscore on the spam-extended data set. The increase from 0.0370 to 0.0397 is not statisticallysignificant.
Table 7.4: The influence of spam on recommendation performance on our originalBibSonomy bookmarks data set and the spam-extended version. Reported are MAP scoresand the percentage of spam items at different cutoffs in the ranking.
Tag overlap Content-based
MAP on spam-free data set 0.0370 0.0402MAP on spam-extended data set 0.0397 0.0283Top 1 spam % 10.5% 0.0%Top 10 spam % 15.3% 4.2%Top 25 spam % 14.9% 5.9%Top 50 spam % 15.8% 6.7%Top 100 spam % 13.6% 7.0%Top 1000 spam % 4.0% 18.2%
Figure 7.4 shows the per-user differences in Average Precision (AP) on the spam-extendedand spam-free data sets for both approaches. It can be observed from Figure 7.4(a) that theincrease in MAP for the tag overlap approach is due to the large improvement for a singleuser. For all other users, performance remains the same or decreases slightly. This leads usto believe that the increase in MAP is coincidental and not structural. In contrast, Figure

Chapter 7. Spam 143
7.4(b) shows a consistent, negative effect of spam on the AP scores of the majority of testusers.
-0.2
-0.1
0
0.1
0.2
AP d
iffer
ence
(a) Item-based CF with tag overlap
-0.2
-0.1
0
0.1
0.2
AP d
iffer
ence
(b) Profile-centric approach
Figure 7.4: User level differences in AP scores between the runs on the spam-extendedand spam-free data sets. Figure 7.4(a) shows the score differences for the item-based CFapproach with tag overlap similarity; Figure 7.4(b) shows the differences for the profile-centric approach.
If we look at the actual spam presence in the rankings of the clean and spam-extendeddata sets in Table 7.4, we can see some remarkable differences between the tag-based andcontent-based runs. While the content-based run contains more spam items in its rankingsoverall, we see that this spam mostly concentrated in the lower end of the rankings, afterthe top 100 results. In contrast, for the tag overlap run, most of the spam content is presentin the top 100 of each user’s list of recommendations. This percentage is fairly constant ataround 15%, which means the spam items are evenly distributed over the top 100 items.In 10% of the cases, even the first item recommended by the tag overlap approach is spam;this never happens for the content-based approach.
The tag overlap approach is not harmed by spam in the data, while the content-basedapproach is, even though the item rankings of the former are in fact polluted with morespam in the top 100. This difference is surprising, since we could reasonably expect theapproach with the biggest proportion of spam in the ranking to perform worst, as well asother approaches where the spam content is located at the top end of the rankings. Thefact that this does not happen shows that the presence of spam does not change the rankingof the relevant items by the item-based filtering approach. In the content-based approach,relevant items are actually ranked worse when spam is present, suggesting a precision-decreasing effect. Using the same analysis as described in Subsection 6.4.1, we are ableto confirm this. For both spam-extended runs, recall is down as they retrieve less of therelevant items. However, the items are ranked better by the spam-extended tag overlapapproach as we see a precision-enhancing effect of a 6.3% increase in MAP compared to therun on the spam-free data set. Moreover, we also see a recall-decreasing effect of -9.7%.For the content-based approach, we instead see a precision-related -29.9% decrease in MAPscore and a recall-related decrease of -21.1%.

Chapter 7. Spam 144
Let us attempt to find out what is happening to the rankings generated by the content-basedapproach that causes this decrease in performance. Our content-based recommendationalgorithm is based on a standard language modeling approach to IR, where the user profilerepresentation corresponds to the query and the item representations correspond to thedocuments. In language modeling, the goal is to estimate the likelihood of the query beinggenerated by a documents, and then ranking all documents by those estimated likelihoods.We use the Jelinek-Mercer smoothing method in our experiments, which involves linearinterpolation between a document model and a collection model (Hiemstra, 1998). Foreach query term—i.e., term in the user profile—we calculate the probability of the termbeing generated from the document model θd according to the equation
p(t|θd) = λ · p(t|d) + (1−λ) · p(t), (7.4)
where p(t|d) represents the term probability according to the document model and p(t)represents the term probability according to the background collection model. The weight-ing parameter λ was set to 0.9 in our experiments. When we add large amounts of spamto a data set as we did for BibBoo, the queries and the document models for a particularquery-document pair—or in our case user-item pair—do not change. What can and doeschange, however, is the collection model and the associated term probabilities p(t). Theprobability of a term given the collection model is calculated as the total number of occur-rences of t in the collection
∑
d n(t, d) divided by the total number of terms in the collection∑
d n(d), as in
p(t) =
∑
d n(t, d)∑
d n(d), (7.5)
where n(t, d) is the number of occurrences of term t in document d and n(d) is the totalnumber of terms in document d. We see that the ranking of the relevant items decreases,which could mean one of two things. One possibility is that p(t) decreases for the termsalso occurring in the user’s profile. This can happen when the spam items introduce moreterms into the collection that are not in the user profile. When this happens, the totalnumber of terms in the collection
∑
d n(d) grows faster than the number of occurrencesof a specific term in the collection
∑
d n(t, d). The other possible reason for the rankingsdrop of relevant items is that other non-relevant, non-spam items are ranked higher andrepress the relevant items. This could happen when certain user profile terms that were notmatched against the relevant items in the spam-free data set suddenly occur much more dueto the spam content and become more important for ranking the other non-relevant items.The probability p(t) for these terms could increase either through a decrease in collectionsize—which is impossible here—or through an increase in the occurrence of term t in thecollection. In the latter case, the spam items contain many occurrences of these previously‘unused’ terms and increase the importance of the background model in ranking the items.We believe it is a combination of these two factors that causes the performance drop.
In contrast, the item-based filtering approach with tag overlap is not affected because moreitems are added to the system. For this approach to be affected, the newly injected items

Chapter 7. Spam 145
also have to directly match the items of a specific user to influence the recommendationsfor that user. Since the MAP score of the tag overlap approach is not affected, spammersdo not appear to directly target the system in this way. The item-based CF algorithm hasalso been shown in the past to be fairly robust against spam (Lam and Riedl, 2004). Theend goal of spammers, however, is not per se to ruin the ranking: it is to manipulate itin such a way that their own content can be found at the top of the results lists. Thetag overlap approach does not seem to be better at this than the content-based approach,even though the previously added items are retrieved better by the former approach whenspam is present in the system. When all is said and done, the most important vote here iscast by the users themselves, who do not appreciate the presence of spam in their list ofrecommendations, even when it is alternated with relevant recommendations. We believethis to be the best reason for social bookmarking systems to filter out spam content.
7.5 Chapter Conclusions and Answer to RQ 4
In this chapter we have attempted to determine what the influence of spam content is onsocial bookmarking systems, corresponding to our fourth research question and its twosubquestions.
RQ 4 How big of a problem is spam for social bookmarking services?
RQ 4a Can we automatically detect spam content?
RQ 4b What influence does spam have on the recommendation performance?
We argued that spam is as much of a problem for social bookmarking as it is for other taskssuch as e-mail and search. To quantify the problem, we examined two of our collections,CiteULike and BibSonomy in more detail, and found that these data sets contain largeamounts of spam, ranging from 30% to 93% of all users marked as spammers (RQ 4). Wethen proposed SPAMORY, a k-NN approach to spam detection that builds representationsof the user and item metadata in a system, and uses the KL divergence as its similaritymetric. We implemented SPAMORY at two different levels of granularity: directly matchinguser profiles and matching item profiles. We found that using all available metadata atthe user level provides the best performance, and that our spam detection approach workswell on both data sets (RQ 4a). Finally, we took a closer look at the influence of spam onrecommendation performance, and extended our BibSonomy bookmarks data set with allspam content. We tested a CF and a content-based approach, and found that spam has anegative effect on recommendation. The content-based approach was affected most by thespam presence, but all result lists were unacceptably polluted with spam items, proving thenecessity of adequate spam detection techniques (RQ 4b).

m

CH
AP
TE
R 8DUPLICATES
Another growing pain that social bookmarking systems face, and the second we focus on,is the presence of duplicate items in the system. With many items being bookmarked bydifferent users, the ideal situation would be that, for each new post, the system could recog-nize if that resource has already been posted to the system. Although each post is personalto a user and should be stored separately along with the personal tags and metadata forthat user-item combination, the common resource targeted in all those posts should only bestored once in the system. While most services will attempt to match identical resources—with varying degrees of sophistication—no matching system can be perfect. Compared tospam, this is obviously less an issue of malicious intent, and more one of carelessness orlack of awareness. However, their presence can still have consequences for the social book-marking service. Users might not be able to find all related users based on the articles theyshare if duplicates create a chasm between different user groups. Erroneously storing thesame resource multiple times could diminish the strength of the social bookmarking systemand deflate popularity counts, as well as increase storage and processing requirements. Itmight also affect item recommendation: two versions of the same article might be recom-mended in the same session, and perhaps it is not possible to locate all interesting articleswhen article counts are diluted and fragmented. In this chapter, we focus on this problem:how can we detect duplicates automatically and what effect do they have on recommenda-tion? In other words, how important is it to have a good de-duplication policy in a socialbookmarking system? This leads us to our fifth research question.
RQ 5 How big a problem is the entry of duplicate content for social bookmark-ing services?
The problem of duplicates exists, to varying degrees, in all three social bookmarking ser-vices: CiteULike, BibSonomy, and Delicious. However, we will only examine it for CiteULikein this chapter. Jäschke et al. (2007a) mention that BibSonomy already uses hashing at theposting phase to make users attentive of the fact they might be adding a resource alreadypresent in the system. The BibSonomy data set is therefore not very suited for our experi-ments. While both Delicious and CiteULike could have been used for our investigations in
147

Chapter 8. Duplicates 148
this chapter, we chose to focus only on CiteULike because of its smaller size, allowing forthe manual annotation of a reasonable portion of the data. Our fifth research question givesrise to two, more specific subquestions.
RQ 5a Can we construct an algorithm for automatic duplicate detection?
RQ 5b What influence do duplicates have on recommendation performance?
In the next section we describe how duplicates are currently handled in CiteULike, followedby Section 8.2 where we discuss the most appropriate related work in de-duplication. InSection 8.3, we describe our approach for detecting duplicates in the CiteULike collection,from creating an appropriate test set to doing the actual de-duplication and its results (RQ5 and RQ 5a). Section 8.4 then describes our investigations into the influence duplicatescan have on recommendation (RQ 5b).
8.1 Duplicates in CiteULike
CiteULike users have many different options for adding articles to their own CiteULike pro-file. The easiest option is by simply clicking on the ‘Copy’ link when viewing the dedicatedpage of an interesting article. However, the copy option is not the only method for addingarticles to a personal profile, and many users do not search CiteULike to see if the articlethey want to add is already present. In the 30 days leading up to the Christmas holidaysof 2008, CiteULike reported to have received 116,477 posts, of which only 6,189 posts (or5.3%) were copies made directly from other users’ libraries (Fenner, 2009). Judging by themany import-related tags in the CiteULike data set1, a popular way of adding articles toone’s library is by importing an entire BibTeX or EndNote library at once. If these entriesdo not already contain universal document identifiers like DOI numbers, then no steps aretaken by CiteULike to match these imports to existing items in the database (Chris Hall,Citeulike, personal communication, May 2008).
We expect that, because of these two factors, a sizable part of the articles posted to CiteULikeare duplicates of items already in the database. Since popular articles are added more often,there is a bigger chance that something can go wrong when users enter the item metadatainto the system. It is reasonable to assume that there is a fixed probability that spellingerrors or missing DOIs cause a duplicate article to be spawned. The number of duplicates fora given article is therefore likely to be commensurate with the popularity of the first instanceof that article posted to CiteULike. We examine in Section 8.3 whether this relationship isindeed present.
In terms of popularity of the duplicate items themselves, one would expect that the duplicateversions of an article are rare themselves. Because the percentage of articles that are copieddirectly to a user’s profile via the ‘Copy’ link is relatively small, duplicate versions are not
1We manually identified 57 different import-related tags, such as bibtex-import or endnote_import. Thesetags comprise up to 3.8% of all assigned tags in the November 2, 2007 data set. Most people add ‘real’ tagsthemselves after importing, so the number of items added by batch import is likely to be even higher.

Chapter 8. Duplicates 149
likely to propagate this way. Nevertheless, this is not always the case: the original version ofthe article “Referral Web: Combining Social Networks and Collaborative Filtering” (Kautzet al., 1997) has been added by 40 users, whereas an exact duplicate record of that paperthat was added later to CiteULike has been added by 31 other users. In this case, theduplicate version is nearly as popular as the original version of the same paper. If we assumethat this article spawned other, less frequent duplicate versions as well, this means that thearticle is twice as popular on CiteULike than one would expect from simply observing thefrequency of the original version of the article. In general, however, we expect that allduplicate versions on CiteULike together show a Zipfian frequency distribution with a longtail of unpopular duplicate versions and a handful of duplicates that have become relativelypopular.
8.2 Related Work
Any recommender, retrieval, or information access system that relies on user-generatedcontent or metadata is susceptible to the problem of duplicate or near-duplicate content. Indealing with such duplicate content, system designers have a choice of when to take action:at the moment duplicate content is introduced into the system, at the end when the resultsof some requested action are presented to the user, or somewhere in between. Deferringde-duplication to the end is a lazy approach, whereas the other two options can be classifiedas eager approaches to de-duplication.
Lazy Deduplication The lazy approach to de-duplication is most common in the litera-ture on recommender systems. Here, the problem of removing duplicate content is deferredto after the recommendations have been generated, either by grouping duplicate items to-gether or by removing them from the final list of recommendations presented to the user.For instance, search engines for research papers such as Google Scholar2 attempt to groupall duplicate versions of the same reference together in their search results. Online storessuch as Amazon3 form another example as they try to group together the different formatsof the same item— such as Blu-ray and DVD versions of the same movie—in their recom-mendation lists. In the majority of the literature on recommender systems, de-duplicationis mentioned merely in passing. Most papers mention having a de-duplication module thatperforms post-processing on the final recommendation lists, but do not go into any moredetail about this (Glance et al., 2001; Haase et al., 2004; Horozov et al., 2006). The waythe de-duplication problem is described in these papers suggests that identifying duplicatecontent is often dealt with as an afterthought in the design of such complex systems.
Eager Deduplication In contrast, taking an eager approach means the de-duplication pro-cess takes place before the actual recommendation, retrieval, or aggregation operations areexecuted. Eager de-duplication has several advantages over its lazy counterpart, such asobtaining a cleaner and more compact data set, reducing storage and processing require-ments. In the eager scenario each system module can operate on the same ‘pure’ data set,
2http://scholar.google.com/3http://www.amazon.com/

Chapter 8. Duplicates 150
whereas the lazy situation would require separate de-duplication post-processing steps tobe run on their separate outputs. Arguably the optimal stage to detect duplicates is whenthey are entered into the system if there is a way to involve the user in this. Presentingthe user with a list of similar content already into the system, could prevent the user frompolluting the database with identical information. For practical reasons, however, it mightnot always be possible to involve the user in this process—users might choose to upload alarge batch of their publications that they are not willing to de-duplicate in a single pass.Identifying all duplicates in a (periodic) batch process after data entry but before recom-mendation will often be the most practical option. As we crawled our data sets from theWeb, we cannot elicit the help of users directly, which leads us to resort to a batch approachto de-duplication as well.
We know of no related work on eager de-duplication in the field of recommender systems.In the past 50 years, however, many different research fields have investigated the problemof (near-)duplicate content under various monikers, including record linkage, data integra-tion, database hardening, name matching, and entity resolution (Elmagarmid et al., 2007).
Deduplication on the Web Finding near-duplicate content among Web pages has been anactive research topic in the IR community for more than a decade. It is aimed at reducingthe index sizes of Web search engines, and prevalent approaches operate on the full textof billions of Web pages. We refer the reader to Henzinger (2006) for a comprehensivecomparison and overview of the subject. The techniques described in Henzinger (2006) areoptimized for finding (near-)duplicates of Web pages using the full text. In our approachwe focus on de-duplication using techniques from the record linkage field, as these areoptimized on working with metadata content from database fields4.
Deduplication in Databases In our CiteULike data set we wish to identify duplicate ref-erences, i.e., those items that refer to the same reference. While these duplicate referencesmay match exactly on certain metadata fields, misspellings or incorrect entries can intro-duce difficulties in identifying duplicates. This is most closely related to the field of recordlinkage, which was first explored in the 1950s and 1960s (Elmagarmid et al., 2007). Oneof the earliest and most straightforward approaches to record linkage is a rule-based ap-proach where reasonable rules are manually developed to match the data in the differentfields and subsequently refined when exceptions to the rules are found (Elmagarmid et al.,2007). Such approaches typically achieve high accuracy but at a cost of much manual ef-fort and continuous updating of the rule base. Fellegi and Sunter (1969) were the first topioneer probabilistic approaches to record linkage. Here, pre-labeled data sets are used toautomatically determine the importance weights that should be assigned to the differentmetadata fields in the matching process. Different string similarity metrics are then usedto determine the similarity between matching metadata fields. By setting thresholds on thecombined matching score, pairs of records are then predicted to be duplicates or not (Fellegiand Sunter, 1969).
4This decision is supported by preliminary experiments using shingling and the SimHash algorithm to de-duplicate CiteULike references (Henzinger, 2006). These experiments showed inferior performance comparedto state-of-the-art record linkage approaches.

Chapter 8. Duplicates 151
In recent years, an increasing body of work focuses on the application of machine learningalgorithms to automatically learn the field weights and similarity thresholds for accuratematching functions. State-of-the-art approaches include Parag and Domingos (2004) andBilenko et al. (2003). The latter compared a variety of character-based and token-basedstring similarity metrics such as the Levenshtein distance and tf·idf weighting, and foundthat the choice of optimal metrics is largely dependent on the data set used. They alsoshowed that learning accurate matching functions using Support Vector Machines can yieldsignificant improvements over the traditional probabilistic approach. We follow the work ofBilenko et al. in our de-duplication approach and use machine learning to learn the accuratematching function for combining the different metadata field similarities.
The effect of duplicate content on recommender system performance has not been the topicof much study, but some studies have been carried out in the IR community. Bernsteinand Zobel (2005) explored techniques similar to those used by Henzinger (2006) on theruns submitted to the TREC Novelty track and found that returning duplicate documentshad a significant effect on search experience, with up to 17% of duplicates in the returnedresult lists. In Section 8.4 we perform the same kind of analysis for social bookmarkingrecommendation.
8.3 Duplicate Detection
As mentioned before, unless new posts contain a universal document identifier like a DOInumber, no steps are taken by CiteULike to match these articles to existing items in thedatabase. This can result in a large number of duplicates on CiteULike. A good exampleis the article “Collective Dynamics of Small-World Networks” (Watts and Strogatz, 1998).The original version has been added by 43 different users, but it has at least 28 duplicates,added by 29 different users. This means that over 40% of all users who added the articlemight actually be found by following links in the folksonomy from the original article toother users.
In this section we describe our two-step duplicate detection strategy for CiteULike. The firststep in this strategy was obtaining training material to get an estimate of how widespreadduplicates are on CiteULike, and to train our duplicate classifier on. We describe collectionof this training material in Subsection 8.3.1. In Subsection 8.3.2 we describe the secondstep: how to construct the duplicate classifier. In Subsection 8.3.3 we present the experi-mental results of our classifier.
8.3.1 Creating a Training Set
The first step in analyzing the effect of duplicates on the recommendation process is con-structing a gold standard training set to evaluate our de-duplication methods against. Thistraining set should contain both examples of pairs of duplicate items on CiteULike and ofpairs of unique, different items, because any multi-class discriminative machine learning al-gorithm presented with only positive examples can and will only learn to output a positive

Chapter 8. Duplicates 152
prediction every time. Furthermore, any realistic collection of training material should alsocontain an appropriate ratio of duplicate pairs and different pairs, as social bookmarkingsystems in general are more likely to contain only a small percentage of duplicate content.Our collection process starts by (1) identifying likely pairs of duplicates and an appropriatenumber of pairs of distinct items, followed by (2) a manual annotation phase where allconsidered pairs were judged as being duplicate pairs or not.
We select our training set pairs as follows. First, we order all the items in our originalCiteULike data set5 on popularity counts and divide them into 10 logarithmic bins basedon these frequency counts. From each bin we randomly pick 5 seed items—less if the bincontained less than 5 items—resulting in a total of 34 seed items. For each of these ‘focus’items we extract all bigrams from their tokenized6 titles that do not contain a stop word7.For examples, for an item with the title “Referral Web: Combining Social Networks andCollaborative Filtering” (Kautz et al., 1997) this results in the following 5 bigrams: referralweb, web combining, combining social, social networks, and collaborative filtering.From each seed item’s bigrams we randomly select two of them, which are then used asqueries on all item titles in the CiteULike data set. This means that for each seed itemtwo queries are constructed and matched against all 500,000+ titles in the CiteULike dataset. Because duplicate items can often be the result of spelling errors, this matches a goodnumber of duplicate items with different IDs that effectively represented the same article.In practice, these bigrams also match a wide variety of titles more often than not, resultingin a large number of pairs of distinct items. All items whose title matches one of these twobigram queries are then each paired up with the respective seed item(s) they originatedfrom. This selection process found 2,683 matching items and a total of 2,777 pairs of seeditems and matched items.
In the second phase of our collection process, we manually annotated these 2,777 pairs.Appendix D contains more information about the annotation process. Of the 2,777 an-notated pairs, 189 were found to be duplicates of one of the 34 seed items, and 2,588were not, giving us a training set with 6.8% duplicates. It is very likely that because ofour bigram matching method—a straightforward form of de-duplication in itself—we haveoverestimated this proportion of duplicates in our training set. The actual ratio of positiveto negative examples in the complete CiteULike data set is expected to be much lower. How-ever, we do not believe that overestimating this proportion will hurt our detection method,as the use of sampling methods to artificially constrain the ratio of positive to negativeexamples is common in machine learning and is not dependent on the actual ratio. In ad-dition, our bigram method will result in higher recall at the expense of precision. However,since we use human annotators to interactively check our training set for duplicates andnon-duplicates afterwards, precision can be allowed to take a back seat to recall in ourcollection of the training set. Furthermore, the advantage of using the bigram queries isthat the non-duplicate pairs are more likely to be more difficult to predict properly for ourmachine learning algorithm. If we were to select items randomly to pair up with the seed
5For this selection process we used the original, unfiltered CiteULike data set as described in Table 3.1instead of the data set used in our experiments in Chapters 4–6 and described in Table 3.2.
6Regardless of the algorithm used, normalization of the data is very important and can result in higheraccuracy.
7We filtered stop words using the SMART stop word list.

Chapter 8. Duplicates 153
items, term overlap can be expected to be much lower than in our present case, which couldoverestimate the performance of the classifier.
For 8 of the 34 seed items we could not find any duplicate items. This does not mean thatthese could not have duplicates, merely that our bigram matching method did not find any.For the remaining 26 seed items the number of duplicates varies from 1 to 30, with 5 of ofthe 26 items having more than 25 duplicate versions on CiteULike. Figure 8.1 shows thedistribution of duplicate counts over the seed items.
0
5
10
15
20
25
30
35
40
0 5 10 15 20 25
dupl
icate
cou
nt
seed items
Figure 8.1: Distribution of the duplicates over the different seed items in our training set.
8.3.2 Constructing a Duplicate Item Classifier
The second step of our duplicate detection strategy for CiteULike involves constructing aduplicate item classifier. Our approach to duplicate detection is inspired by Bilenko et al.(2003) and involves a pairwise prediction task: we represent a pair of items by differentfeatures, where each feature represents some type of similarity measure calculated on theitem pair. These instances are then fed to a machine learning algorithm that learns the bestcombination of feature weights, and predicts a binary label: duplicate pair or distinct pairof items.
Feature Representation What features do we use for duplicate classification? Scientificarticles can be annotated with many different metadata fields in CiteULike, but the majorityof these fields are only sparsely filled. Table 5.1 lists how much metadata we have availablefor each field. The following six fields are populated densely enough to be of use in match-ing all of the items in the CiteULike data set: AUTHOR, ENTRYTYPE, TAGS, TITLE, URL, YEAR.Inspection of the ENTRYTYPE metadata field, denoting the BibTeX entry type, showed it isnot used consistently enough to be useful. As electronic versions of papers can be found inmany different location on the Web, the URL field will not be reliable enough either. Finally,since tags represent a personal vocabulary, we do not use them as a source of metadatacomparison either. This leaves us with the AUTHOR, TITLE, and YEAR fields to calculate the

Chapter 8. Duplicates 154
similarity features. Bilenko et al. (2003) compared a variety of character-based and token-based string similarity metrics such as the Levenshtein distance and tf·idf weighting. Wefollow their approach to feature construction and calculate six different features for eachfeature pair: four for the TITLE field, and one each for the AUTHOR and YEAR fields. Table 8.1describes these six features.
Table 8.1: Similarity features used in duplicate detection.
Feature Field Description
F1 TITLE Cosine similarity on length-normalized, unigram term vectors.F2 TITLE Cosine similarity on length-normalized, bigram term vectors.F3 TITLE Length of the longest common substring divided by the length of the
longest string.F4 TITLE Normalized Levenshtein distance on the titles.F5 AUTHOR Unigram term overlap of tokenized author string.F6 YEAR Binary match on publication year.
All feature values are mapped to the [0,1] range. Note that the first three title-based fea-tures are arranged in order of increasing strictness. Feature F1 calculates the cosine sim-ilarity on unigram term vectors of the two item titles, while feature F2 uses bigram termvectors. A high score on F2 automatically means a high score on F1. A high value for fea-ture F3 implies high values for F1 and F2, and additionally requires that the unigrams andbigrams occurring in the longest common substring are also in the right order. The nor-malized Levenshtein distance can be calculated in different ways; we calculate it accordingto Navarro (2001) as 1 − Levenshtein(title1,title2)
max_length(title1,title2). From our experiences with the training set,
sometimes a mistake separating two duplicates can be as simple as entering the year 2003instead of 2004. Generally speaking, however, relaxing the binary matching on years islikely to result in too many false positives. Figure 8.2 shows some examples of training setinstances represented using our six features.
99 1075248 1.0000 1.0000 1.0000 1.0000 1.0000 1.0000 1 99 1075282 1.0000 1.0000 1.0000 1.0000 1.0000 1.0000 1 99 1091096 0.2981 0.0000 0.1111 0.4677 0.0000 1.0000 0 99999 1791032 0.3333 0.2582 0.1250 0.1695 0.0000 1.0000 01272533 1412129 0.2390 0.1508 0.1667 0.2432 0.0000 1.0000 01272533 1416466 1.0000 1.0000 1.0000 1.0000 1.0000 1.0000 11272533 1821589 1.0000 1.0000 1.0000 1.0000 0.0000 1.0000 1
ITEMID1CLASSLABEL
ITEMID2 FEATURE1 FEATURE2 FEATURE3 FEATURE4 FEATURE5 FEATURE6
PAIREDITEMS DUPLICATES?
Figure 8.2: Example instances from our duplicate detection training set. The first instanceshows a perfect match on all features, which is reflected in the ’1’ value for the class label,whereas the fourth instance matches on publication year, but not well on the other features.The seventh instance is an example of two paired items that represent the same content,but where the author field was not filled in for one of the users.

Chapter 8. Duplicates 155
Experimental Setup The next step in constructing a duplicate item classifier is training iton the training set we constructed in the previous section. For each of the 2,777 pairs inthe training set, we create an instance with the six similarity features calculated on the itempair and the class label ‘1’ or ‘0’, denoting a duplicate or distinct pair of items. When wetrain a machine learning algorithm on this data set, it attempts to learn the optimal set ofcombination weights to detect duplicate pairs. Like Bilenko et al. (2003), we use SupportVector Machines (SVMs) as our machine learning algorithm. SVM is a supervised machinelearning algorithm that attempt to find the maximum margin hyperplane separating thetwo classes of pairs. We refer to Burges (1998) for more detailed information about thealgorithm. We used the publicly available SVMlight implementation for our experiments8.Similar to our experimental setup for our recommendation experiments, we divided our2,777 pair data set into a training and a test set, and randomly assigned 15% of the pairs to atest set and the remaining 85% to a training set. We further subdivided our training set into10 folds for 10-fold cross-validation. We optimized the parameters of SVMlight using our 10-fold cross-validation setup with Paramsearch, which is a publicly available implementation9
of the wrapped progressive sampling approach to parameter optimization proposed by Vanden Bosch (2004). Paramsearch optimizes the four SVMlight parameters listed in Table 8.2.
Table 8.2: List of parameters optimized for the SVM classifier by Paramsearch.
Parameter Description
-t Type of kernel function (linear, polynomial, radial basis function, or sigmoid).-g Gamma parameter for the radial basis kernel.-t Trade-off between training error and margin.-j Cost-factor by which training errors on positive examples outweigh errors on
negative examples.
In addition to these parameters, we also experiment with different ratios of positive and neg-ative examples. Data sets that are heavily skewed towards a single class can be problematicto learn for a machine learning algorithm when evaluated on, for instance, accuracy. Thealgorithm might simply learn a classifier that outputs the majority class label all the time,if that results in a high accuracy score. Even when evaluating using a proper evaluationmetric such AUC instead of accuracy, a heavily skewed data set still might not result in thebest possible classifier. Another solution to this problem is adjusting the ratio of positive tonegative instances in the training set. By downsampling the majority class, we can ‘force’the classifier to base its decision purely on the feature value and not just on the evaluationmetric (Japkowicz and Stephen, 2002). This has been shown to work well on other tasksand data sets10. We therefore construct two alternative data sets by randomly sampling thepositive and negative examples in a 1:1 ratio and a 1:2 ratio, where the data sets containone respectively two negative instances—i.e., distinct pairs—for each positive one—i.e., aduplicate pair. We refer to these data sets as POSNEG 1-1 and POSNEG 1-2. Such instancesampling reduces the size of the training set. To show that the reduction does not simplymake the classification problem easier, we also constructed a data set of the same size as
8Available at http://svmlight.joachims.org/9Available at http://ilk.uvt.nl/paramsearch/
10Certain machine learning algorithms are more susceptible to this than others, but SVMs have also beenshown to be affected by this problem (Japkowicz and Stephen, 2002).

Chapter 8. Duplicates 156
POSNEG 1-1 but with randomly selected instance from the entire data set ALLINSTANCES. Per-formance on this new data set, SIZE 1-1, will show if the downsampling simply made theproblem easier by reducing the size, or if the sampling is a successful technique. If the scoreson POSNEG 1-1 are significantly higher than on SIZE 1-1, then the downsampling improvedperformance because of a more optimal instance ratio, and not because of the reduced dataset size. We do the same for the POSNEG 1-2 and create a matching SIZE 1-2 data set. Foreach of these extra four data sets we also partitioned the data as described above and ranParamsearch to find the optimal parameters settings. The optimal settings were then usedto train the model on all of the training data and used to classify the test data. The resultsof these experiments are listed in the next section.
Duplicate Identification in CiteULike After training a duplicate classifier we can use it todetect duplicates in our entire CiteULike data set. We use the unfiltered data set containing585,351 items, so that we can gather complete frequency information about all items, andnot just those that occur at least twice. Ideally, we would want to determine for each pair ofitems in our item set LALL whether or not they are duplicates. To do this we represent eachitem pair in the same format as we did with our training set, as described in Table 8.1 andFigure 8.2, but without the class label which we are trying to predict. Unfortunately, with adata set size |LALL| of 585,351 items considering all possible pairwise comparisons requiresexamining 1
2LALL(LALL− 1) item pairs, which amounts to 171,317,603,925 comparisons.
This is clearly an undesirable situation, but also a common one in the field of record linkage.While the total number of comparisons might be impractical to carry out, most record pairsare clearly non-duplicates, so they do not need to be considered for matching. This can beachieved through blocking by dividing the database records in blocks, where only the recordswithin the same block are compared to each other (Bilenko et al., 2003). An example of ablocking method is the sorted neighborhood method, which sorts the records over the mostimportant discriminating attribute of the data, such as the TITLE field in our case. After thesort, the comparison of records is then restricted to a small neighborhood within the sortedlist (Hernández and Stolfo, 1995). However, we believe that the TITLE field is also the mostvulnerable to spelling errors, so we suspect sorted neighborhood blocking would result intoo many missed duplicate pairs. We therefore apply our own blocking method: popularityblocking, based on the popularity counts of the items. We identify all duplicates in threedifferent steps, as visualized in Figure 8.3.
We can reasonably assume that for an item with duplicates, the original item will often bethe most popular compared to its clones. We therefore divide our items into two popularitygroups: the set of popular or high range LHIGH items that have been added to 10 or more userprofiles, and the less popular, low range set of items LLOW that contains all the remainingitems. This results in 680 and 584,671 items in the high and low range sets respectively. Itis reasonable to assume that the original item of a set of duplicates usually falls into the highrange, while most of its duplicates fall into the low popularity range. In the first step of ourdeduplication process we do a pairwise comparison of each item in LHIGH with each item inLLOW , resulting in 397,576.280 comparisons. Then, in the second step, we compare all thehigh popularity items with each other, resulting in 230,860 comparisons for our data set. Wecompare the high range items with each other on the off-chance that one of the duplicatesis very popular as well. Finally, we select all of the duplicate items found in the first two

Chapter 8. Duplicates 157
(1) between high and!
low range IDs!
high range!
items!
low range!
items!
(2) within high range IDs! (3) between duplicate IDs identified in step (1)!
Figure 8.3: Visualization of our popularity blocking scheme for duplicate identification.Items, represented by the small circles, are divided into two groups based on popularity.Solid black circles represent items for which a duplicate has been identified, with the dottedline connecting a pair of duplicate items.
steps and classify all pairs within this group. We take this third step to detect the duplicateswe missed by not comparing the low popularity items with each other, resulting in another19,279,888 comparisons. In total, we performed 417,087,028 comparisons, which is 99.7%of the total number of possible comparisons.
8.3.3 Results and Analysis
Evaluating the Duplicate Item Classifier Table 8.3 lists the results of our different du-plicate classification experiments on the training set. What we see is that the POSNEG 1-1data set, where positive and negative instances were sampled in an equal ratio, achieves thebest classification performance, at an F-score of 0.9804 and an AUC score of 0.9795. ForF-score, the POSNEG 1-1 data set is significantly better than all other variations at α = 0.05.The POSNEG 1-2 variation, however, does not perform significantly better than the using allinstances in the training set. Both POSNEG variants perform significantly better as measuredby F-score than their corresponding SIZE runs, which shows that the improved performanceis not just due to a reduced size of the training set. When we measure classification perfor-mance by AUC, none of the differences are statistically significant but we still see the samepattern occurring as we do for F-score.
Classifying Duplicates on CiteULike Based on the results in Table 8.3, we select thePOSNEG 1-1 classifier for classifying the duplicate items in the entire CiteULike data set.The optimized parameter settings for this SVM-based classifier include using a radial basisfunction kernel (-t) with the γ parameter (-g) set to 0.128. The cost factor (-j) is set to thedefault value of 1.0, and the training error-margin trade-off (-c) is set to 5. Table 8.4 showsthe number of duplicate pairs identified in each of the three steps shown in Figure 8.3.

Chapter 8. Duplicates 158
Table 8.3: Results of duplicate classification on the training set, evaluated on F-score andAUC. Best scores are printed in bold.
Data set F-score AUC
ALLINSTANCES 0.9274 0.9532POSNEG 1-1 0.9804 0.9795POSNEG 1-2 0.9393 0.9531SIZE 1-1 0.5537 0.9164SIZE 1-2 0.5359 0.9195
Table 8.4: Results of deduplicating the CiteULike data set.
Step Duplicate pairs Total pairs % of pairs classified as duplicates
Step 1 30,421 397,576.280 0.0077%Step 2 752 230,860 0.3257%Step 3 172,814 19,279,888 0.8963%Total 19,374 417,087,028 0.0046%
Certain pairs examined in step (3) were already compared in steps (1) and (2); filteringout these identical pairs left us with a total of 19,374 pairs of duplicate items, which is whythe total duplicate count is lower than the sum of the duplicates uncovered in the threeindividual steps. Overall, of the 400+ million pairs we compared, a little under 0.005%were classified as duplicates. This shows that duplicate identification is like trying to finda needle in a haystack. The largest proportion of duplicates were detected in step 3, whichis to be expected: this set already contains the duplicates detected in the first two steps,and additionally links unpopular duplicates of the same original, popular items. The finalduplicate percentage is several orders of magnitude smaller than the the percentage in ourtraining set. While we already reported that number to be an overestimate, the actualpercentage of duplicates is still lower than we expected. Figure 8.4 shows three examplesof basic graph patterns of how these 19,374 duplicate pairs tend to be connected to eachother.
A B
(a)
E
C
D
(b)
H
G
F
(c)
Figure 8.4: Example duplicate graph patterns
Pattern 8.4(a) is the standard pattern, where item B was classified as a duplicate of itemA. For each pair we wish to replace the newest item by the oldest item, i.e., we considerthe item that was added first to CiteULike to be the original item. The arrow pointing fromitem B to item A denotes that item A is the oldest known version of the item, and that alloccurrences of item B should therefore be replaced by item A. Pattern 8.4(b) occurs when
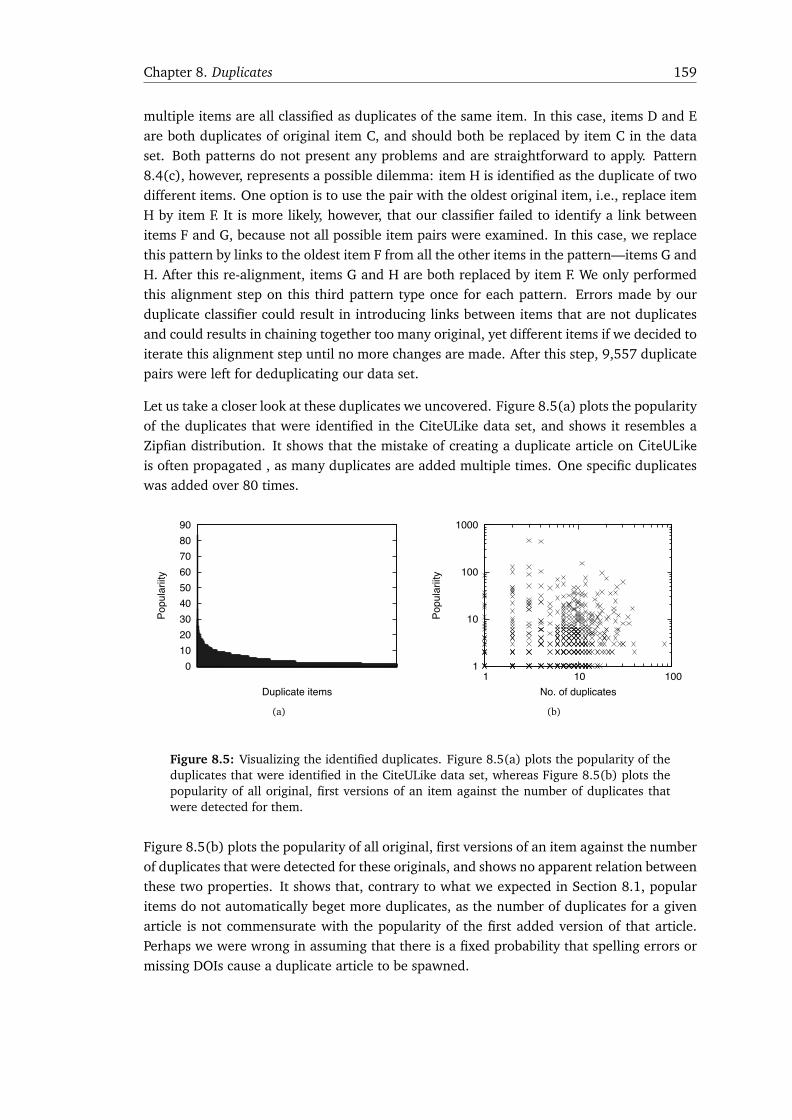
Chapter 8. Duplicates 159
multiple items are all classified as duplicates of the same item. In this case, items D and Eare both duplicates of original item C, and should both be replaced by item C in the dataset. Both patterns do not present any problems and are straightforward to apply. Pattern8.4(c), however, represents a possible dilemma: item H is identified as the duplicate of twodifferent items. One option is to use the pair with the oldest original item, i.e., replace itemH by item F. It is more likely, however, that our classifier failed to identify a link betweenitems F and G, because not all possible item pairs were examined. In this case, we replacethis pattern by links to the oldest item F from all the other items in the pattern—items G andH. After this re-alignment, items G and H are both replaced by item F. We only performedthis alignment step on this third pattern type once for each pattern. Errors made by ourduplicate classifier could result in introducing links between items that are not duplicatesand could results in chaining together too many original, yet different items if we decided toiterate this alignment step until no more changes are made. After this step, 9,557 duplicatepairs were left for deduplicating our data set.
Let us take a closer look at these duplicates we uncovered. Figure 8.5(a) plots the popularityof the duplicates that were identified in the CiteULike data set, and shows it resembles aZipfian distribution. It shows that the mistake of creating a duplicate article on CiteULikeis often propagated , as many duplicates are added multiple times. One specific duplicateswas added over 80 times.
0 10 20 30 40 50 60 70 80 90
Popu
larii
ty
Duplicate items
(a)
1
10
100
1000
1 10 100
Popu
larii
ty
No. of duplicates
(b)
Figure 8.5: Visualizing the identified duplicates. Figure 8.5(a) plots the popularity of theduplicates that were identified in the CiteULike data set, whereas Figure 8.5(b) plots thepopularity of all original, first versions of an item against the number of duplicates thatwere detected for them.
Figure 8.5(b) plots the popularity of all original, first versions of an item against the numberof duplicates that were detected for these originals, and shows no apparent relation betweenthese two properties. It shows that, contrary to what we expected in Section 8.1, popularitems do not automatically beget more duplicates, as the number of duplicates for a givenarticle is not commensurate with the popularity of the first added version of that article.Perhaps we were wrong in assuming that there is a fixed probability that spelling errors ormissing DOIs cause a duplicate article to be spawned.

Chapter 8. Duplicates 160
8.4 The Influence of Duplicates on Recommendation
In the previous section, we described an approach to detecting duplicate items in a socialbookmarking system. Just like spam, duplicate content can be a nuisance to users, dupli-cate items can pollute the search results and prevent users from reaching all related contentwhen browsing the folksonomy. In addition, as with spam content, storing duplicate itemsalso wastes computing power and storage capacity that could be put to better use. Detect-ing and removing duplicate content is therefore another vital component of a mature socialbookmarking service. We believe proper deduplication can be equally beneficial to recom-mendation. User satisfaction is not served by multiple versions of the same item showing upin the lists of recommended items, and a leaner version of the bookmarks database will alsocut down on computation time. The aim of this section is analogous to that of Section 7.4in the previous chapter: in a small case study on one of our data sets we wish to examinehow much recommendation effectiveness is weakened by the presence of duplicate content.We know of no other related work on this problem, and an initial investigation of this issuewill therefore be our contribution here.
8.4.1 Experimental Setup
We test the influence of duplicate content on recommendation using our CiteULike collec-tion, and we described in the previous section how we detected the pairs of duplicate itemsin this collection. After the duplicates have been identified they need to be filtered out, andthis can be done at two different stages: (1) on the original input data set (eager dedupli-cation), and (2) by removing the duplicate items from list of generated recommendations(lazy deduplication). We deduplicate the original data set by replacing all newer items ofeach duplicate pair by their original item until there are no more items left to replace. Thistypically takes 5 to 7 iterations.
1
10
100
1000
1 10 100 1000 10000 100000
Popu
larii
ty
Items (before deduplication)
1
10
100
1000
1 10 100 1000 10000 100000
Popu
larii
ty
Items (after deduplication)
Figure 8.6: Popularity of the CiteULike items before (left) and after deduplication (right).
Figure 8.6 shows the popularity of all items in the CiteULike data set before and afterdeduplication. Plotting the two quantities on a log-log scale shows that both plots resemblea Zipfian distribution, with the curve before deduplication being slightly flatter at the top.Deduplication apparently removes this as the graph on the right shows a stronger Zipfiandistribution.

Chapter 8. Duplicates 161
To make for a fair comparison, we used our filtered version of the CiteULike data set asdescribed in Subsection 3.4.1, and applied our deduplication procedure on this data set.This means we stay as close as possible to retaining users with 20 items or more, and itemsoccurring in at least 2 user profiles. Using a data set that does not filter out the unique itemscould see a greater reduction in items when deduplicating, but such a filtering thresholdwould lead to other problems, such as those discussed in Subsection 3.4.1. In addition, wealso deduplicated the relevance judgments for this deduplicated data set. Table 8.5 offers abasic description of the new, deduplicated CiteULike data set compared to the original one.
Table 8.5: Basic statistics of our deduplicated CiteULike data set compared to the originalversion.
Original data set Deduplicated data set
# users 1,322 1,322# items 38,419 37,339# tags 28,312 28,196# posts 84,637 83,439avg # items per user 64.0 63.1avg # users per item 2.2 2.2avg # tags per user 57.3 57.0avg # users per tag 2.7 2.7avg # tags per item 5.3 5.4avg # items per tag 7.3 7.1sparsity 99.8334 99.9236
If we had a perfect deduplication algorithm, we would see a decrease in item count asduplicate items are rolled back into their earliest, original entries. The number of postsby a user would stay the same here; only the item identifier would be altered. We canassume that very few users would make the mistake of adding duplicate versions of thesame resource to their own profile, so the total number of posts in the data set wouldstay almost the same11. Overall sparsity of the data set would decrease however. As wesee in Table 8.5, this is not the case. This indicates that our deduplication algorithm istoo aggressive in merging duplicate pairs: too many pairs of items within user profiles aremisclassified as duplicates and replaced by a single post. We will discuss the ramificationsof this later on in this section, as well as possible solutions.
Although it would be preferable to deduplicate the entire data set to reduce storage andprocessing requirements, it is also possible to perform deduplication at another stage in therecommendation process. Similar to what Bernstein and Zobel (2005) do for documentsearch, we can also leave the duplicates in the data set and instead deduplicate the outputlist of recommendations. This is the second deduplication method we investigate.
Which algorithms do we use to test to determine the influence of duplicates? As in the pre-vious chapter, we select the best-performing approaches from chapters 4 and 5. The best-performing folksonomic recommendation algorithm was the standard item-based CF algo-rithm with the I-BIN-IDF-SIM similarity metric, i.e., usage-based overlap using idf-weighting.
11This phenomenon does occur, however, and the posting count would therefore decrease slightly even if weused a perfect deduplication algorithm.

Chapter 8. Duplicates 162
We optimize the neighborhood size for the spam extended data sets using our 10-fold cross-validation setup. We select profile-centric content-based filtering as the best metadata-approach and use all intrinsic and extrinsic metadata fields for our user and item repre-sentations. Using the deduplicated version of our data set, we consider all users and itemsfor calculating the similarities. We evaluate on the same users with the same test items aswe did in our previous recommendation experiments on the CiteULike data set.
What do we expect from these two types of algorithms? We expect a metadata-based ap-proach to suffer from the presence of duplicates, since retrieving any item based on theuser’s profile would also mean retrieving all of the duplicates with near-identical metadata.The presence of duplicates could also be detrimental to performance of an item-based CFapproach. If there is an item with duplicates that are relatively popular themselves, theseduplicates and the original item are likely to be divided over the users interested in theoriginal item. This means that there is no guarantee that all the best nearest neighboringitems are located for each item, resulting in suboptimal performance. However, duplicateversions of the same item are not likely to show up in the same list of recommendations,because usually they are not as popular as the original versions. This means there is notenough evidence to recommend them over other items. We expect that a metadata-basedapproach is therefore more vulnerable to spam.
8.4.2 Results and Analysis
Table 8.6 shows the results of our two selected algorithms on the CiteULike data set withdeduplication on the original data set and deduplication of the list of recommendations.We find only small changes in performance of our two deduplication methods comparedto the MAP scores on the original CiteULike data set. For the item-based CF approach,the MAP score drops slightly from 0.0887 to 0.0882 and 0.0886; for the profile-centricapproach, deduplicating the entire data set causes a slight drop from 0.0987 to 0.0985,whereas deduplicating the result list shows a small increase in MAP score to 0.1011. Noneof the changes are statistically significant.
Table 8.6: The influence of duplicate items on recommendation performance on our orig-inal CiteULike data set. Deduplication was at two different stages: on the input data setand on the result list. Reported are MAP scores and best results are printed in bold.
Item-based CF Profile-centric
Original CiteULike data set 0.0887 0.0987Deduplication on data set 0.0882 0.0985Deduplication on result list 0.0886 0.1011
Figure 8.7 shows the same picture in the per-user differences in Average Precision (AP) forthe four different deduplication runs. For all but the profile-centric method with deduplica-tion of the result lists, we find that deduplication provides benefits for some users, but thatmisclassifications introduce errors for others. For the profile-centric method with dedupli-cation of the result lists we see a slightly more positive effect, although the differences aretoo small to be significant or useful.

Chapter 8. Duplicates 163
-0.2
-0.1
0
0.1
0.2
AP d
iffer
ence
Item-based CF, data set deduplication
-0.2
-0.1
0
0.1
0.2
AP d
iffer
ence
Profile-centric, data set deduplication
-0.2
-0.1
0
0.1
0.2
AP d
iffer
ence
Item-based CF, results deduplication
-0.2
-0.1
0
0.1
0.2
AP d
iffer
ence
Profile-centric, results deduplication
Figure 8.7: The top level figures show the performance of our two algorithms when theCiteULike data set is deduplicated; the bottom two figures show the results of deduplicationof the recommendation lists. The figures on the left correspond to the item-based CFalgorithm and the figures on the right correspond to the profile-centric recommendationalgorithm.
We expected the metadata-based algorithm to show the greatest benefits from removingall duplicate content but we do not find any strong evidence for this. One reason for thisis that we find less duplicates than we intuitively expected, which automatically lowersthe possible effect deduplication could have. In addition, we believe that too many ofthe duplicate pairs we did identify within user profiles are misclassified as duplicates andreplaced by a single item. While our classifier performs well on a 1:1 downsampled dataset, the actual percentage of duplicates on CiteULike is orders of magnitude lower. Webelieve our downsampling might have been too much in favor of the positive instances,which caused the classifier to generate too many false positives on the complete CiteULikedata set. There are several things that could be improved upon in future experiments:
• One of the most straightforward ways of increasing the performance of the duplicateclassifier is increasing the size of our training set. In the past prediction accuracyhas been shown to keep increasing with the size of the training set (Brill and Banko,2001). Adding more training examples means the classifier will get better at recog-nizing the different ways that duplicates ‘sneak’ into the system. It will also result in aa data set with a more realistic proportion of duplicates. Perhaps with such a data set,another ratio of positive to negative examples would also provide better performancethan the 1:1 ratio we found in Subsection 8.3.3.

Chapter 8. Duplicates 164
• A cursory glance at some of the misclassified pairs reveals cases where a high titlesimilarity was caused by an overlap in phrases such as “The history of the”, but thenwith differing final nouns. Future work should look into weighting different typesof words, such as determiners and prepositions, when matching phrases, or possiblyfiltering out the stop words altogether. Some mistakes are hard to avoid however: forinstance, we found two genuinely different items in our data set that were both titled“The Semantic Web”, but written by different authors in different years. With a strongfocus on features that represent the TITLE field, however, these will almost always beclassified as false positives.
• We used a blocking scheme based on item popularity to limit the number of compar-isons, but perhaps a sorted neighborhood scheme would result in less false negativesand improve the quality of the classifier.
While we are not able to provide a conclusive, positive answer about the influence of dedu-plication on recommendation, we believe the task itself is still a vital one. Future work thattakes the above suggestions into consideration should be able to give a more precise pictureof the influence of duplicate content on social bookmarking websites.
8.5 Chapter Conclusions and Answer to RQ 5
In this chapter we attempted to determine what the influence of duplicate content is onsocial bookmarking systems, as covered by our fifth and final research question and its twosubquestions.
RQ 5 How big of a problem is the entry of duplicate content for social book-marking services?
RQ 5a Can we construct an algorithm for automatic duplicate detection?
RQ 5b What influence do duplicates have on recommendation performance?
We argued that duplicate entries of the same item can cause the same kind of problems forsocial bookmarking as spam content. To quantify the problem we examined our data setcollected from the CiteULike website, which does not do extensive deduplication of data en-tered by the users. We collected a small training set of nearly 3,000 item pairs and annotatedthem manually as being duplicates or not. This training set was then used to construct aduplicate item classifier for this pairwise detection task with acceptable performance at firstglance (RQ 5a). Because of the large size of our complete CiteULike data set, we employed aheuristic method called popularity blocking to bring the number of necessary classificationsdown to manageable proportions. Classifying the entire CiteULike data set then resulted inthe detection of over 9,000 duplicate pairs. We found no relation between the popularity ofan original item and the number of duplicates it spawns (RQ 5). Finally, we took a closerlook at the influence of duplicate on recommendation performance by examining the effects

Chapter 8. Duplicates 165
of deduplication on the data set and deduplication of the list of resulting recommendations(RQ 5b). We tested a CF and a content-based approach and found that deduplication wasnot beneficial for either algorithm or deduplication option. We believe our duplicate itemclassifier was not good enough at identifying the real duplicate pairs and that this is thereason for our negative results. A larger training set, a better training regimen (e.g., anoptimized downsampling ratio), and better similarity features should be able to remedy thisproblem in future work.

IIICONCLUSION
In Part I of the thesis, we covered the core of our recommendation experiments, and exam-ined how to incorporate information from the folksonomy and metadata into recommenda-tion algorithms. In addition, we examined if it was possible to combine the recommenda-tions generated by our algorithms and improve recommendation performance by exploitingthe complementarity of our different algorithms. In Part II, we zoomed in on two specificgrowing pains that social bookmarking services encounter as they become more popular:spam and duplicate content. We quantified how common these problems are, and proposedalgorithms for the automatic detection of spam and duplicate content. We also investigatedthe influence they can have on recommending items for social bookmarking websites.
We come to a conclusion of this thesis in this final part. We recall our five research questionsand summarize the answers to each of them. We provide practical guidelines for implement-ing a recommender system on a social bookmarking website. Then we list what we believeto be our main contributions with this work, and we conclude with recommendations forfuture research.
167


CH
AP
TE
R 9DISCUSSION AND CONCLUSIONS
In this thesis we have examined how recommender systems can be applied to the domain ofsocial bookmarking. More specifically, we have investigated the task of item recommenda-tion, where interesting and relevant items—bookmarks or scientific articles—are retrievedand recommended to the user, based on a variety of information sources about and char-acteristics of the user and the items. The recommendation algorithms we proposed werebased on two different characteristics: the usage data contained in the folksonomy, andthe metadata describing the bookmarks or articles on a social bookmarking website. Weformulated the following problem statement for the thesis in Chapter 1.
PS How can the characteristics of social bookmarking websites be exploited toproduce the best possible item recommendations for users?
In this chapter we conclude the thesis. We start by answering our five main research ques-tions in Section 9.1. In Section 9.2 we offer a set of practical recommendations for socialbookmarking services seeking to implement a recommender system. We summarize our fivemain contributions in Section 9.3. We conclude this chapter in Section 9.4, where we listfuture research directions, drawing on the work described in this thesis.
9.1 Answers to Research Questions
Our problem statement led us to formulate five main research questions. Along the way,seven additional subquestions were formulated as well. In this section we summarize theanswers to those twelve research questions. The first three research questions focused onhow the two key characteristics of social bookmarking websites—the folksonomy and themetadata—can be utilized to produce the best possible recommendations for users?
RQ 1 How can we use the information represented by the folksonomy to sup-port and improve recommendation performance?
169

Chapter 9. Discussion and Conclusions 170
In answering our first research question we focused on using the tags present in the broadfolksonomy of social bookmarking systems, which describe the content of an item and cantherefore be used in determining the similarity between two objects. We extended a stan-dard nearest-neighbor CF algorithm with different tag similarity metrics to produce ourTOBCF and TIBCF algorithms. We found that the performance of item-based filtering canbe improved by using the item similarities based on the overlap in the tags assigned to thoseitems (TOBCF). The reason for this is reduced sparsity in the item profile vectors; somethingwe did not find in user-based TOBCF, which as a result did not benefit from using tag similar-ity. Bookmark recommendation is affected more strongly than reference recommendation.Our TIBCF algorithms did not produce competitive results. We may therefore conclude thattagging intensity is not a good measure of user and item similarity.
An examination of merging different types of similarity in our SimFuseCF algorithm yieldedinconclusive results. We compared our algorithms with two state-of-the-art GBCF approaches:a graph-based algorithm using random walks and a tag-aware fusion algorithm. Here, weobserved that our algorithm outperformed the random walk algorithm. The tag-aware fu-sion approach outperformed our own TBCF algorithms by fusing different representationsand algorithms. On the basis of these results we may conclude (1) that tags can be usedsuccessfully to improve performance, and (2) that usage data and tagging data have to becombined to achieve the best performance.
RQ 2 How can we use the item metadata available in social bookmarking sys-tems to provide accurate recommendations to users?
To answer RQ 2, we proposed four different algorithms, divided into two classes: twocontent-based filtering approaches and two hybrid approaches. In content-based filtering,a profile-centric approach, where all of the metadata assigned by a user is matched againstmetadata representations of the items, performed better than matching posts with eachother because of sparseness issues. We also compared two hybrid CF approaches that usedthe metadata representations to calculate the user and item similarities. Here, we foundthat item-based filtering with the metadata-derived similarities performed best. What thebest overall metadata-based algorithm is, is dependent on the data set. In Chapter 5, weformulated the following two additional subquestions.
RQ 2a What type of metadata works best for item recommendation?
RQ 2b How does content-based filtering using metadata compare with folk-sonomic recommendations?
We found that while sparsity of the metadata field does have an influence on recommenda-tion performance, the quality of the information is just as important. Based on the experi-mental results we may conclude that combining all intrinsic metadata fields together tendsto give the best performance, whereas extrinsic information, i.e., information not directlyrelated to the content, does not (RQ 2a). Finally, compared to the folksonomic recommen-dation algorithms proposed, recommending using metadata works better on three of our

Chapter 9. Discussion and Conclusions 171
four data sets. Hence, we may conclude that it is viable choice for recommendation despitebeing underrepresented in the related work so far (RQ 2b).
RQ 3 Can we improve performance by combining the recommendations gen-erated by different algorithms?
The answer to this third research question is positive: combining different recommendationruns yielded better performance compared to the individual runs on all data sets (RQ 3).We formulated an additional, more specific research question in Chapter 6.
RQ 3a What is the best recipe for combining the different recommendationalgorithms?
In our experiments, weighted fusion methods consistently outperformed the unweightedones, because not every run contributes equally to the final result. A second ingredientfor successful fusion is using a combination method that rewards documents that showup in more of the individual runs, harnessing the Chorus/Authority effect, and improvingthe ranking of those items retrieved by more runs. Thirdly, the most successful combina-tions came from fusing the results of recommendation algorithms and representations thattouched upon different aspects of the item recommendation process. Hence we may con-clude that the theory underlying data fusion in IR is confirmed for recommender systems.
Our first three research questions were answered by taking a quantitative, system-based ap-proach to evaluation, i.e., we simulated the user’s interaction with our proposed recommen-dation algorithms in a laboratory setting. Such an idealized perspective does not take intoaccount the growing pains that accompany the increasing popularity of social bookmarkingwebsites: spam and duplicate content. We focused on these problems by formulating RQ 4and RQ 5. The fourth research question addresses the problem of spam.
RQ 4 How big a problem is spam for social bookmarking services?
We examined two of our collections, CiteULike and BibSonomy, for spam and found thatthese data sets contain large amounts of spam, ranging from 30% to 93% of all users markedas spammers (RQ 4). We formulated two additional research questions in Chapter 7.
RQ 4a Can we automatically detect spam content?
RQ 4b What influence does spam have on the recommendation performance?
We showed that it is possible to train a classifier to detect spam users in a social bookmark-ing system automatically by comparing all of the metadata they have added together, to themetadata added by genuine users and by other spammers. This is best done at the user levelof granularity instead of at a more fine-grained level (RQ 4a). Finally, we examined the in-fluence of spam on recommendation performance by extending our BibSonomy bookmarks

Chapter 9. Discussion and Conclusions 172
data set with the spam entries we filtered out earlier. We tested a collaborative filtering anda content-based approach and found that spam has a negative effect on recommendation.Based on our experimental results we may conclude that the content-based approach wasaffected most by the spam presence. However, all result lists were unacceptably pollutedwith spam items, proving the necessity of adequate spam detection techniques (RQ 4b).
To address the problem of duplicate content on social bookmarking websites, we formu-lated the fifth research question and two additional, more specific research questions inChapter 8.
RQ 5 How big a problem is the entry of duplicate content for social book-marking services?
RQ 5a Can we construct an algorithm for automatic duplicate detection?
RQ 5b What influence do duplicates have on recommendation performance?
We examined one of our data sets, CiteULike, to quantify the problem of duplicate content(RQ 5). We constructed a training set and trained a duplicate identification classifier whichfound a small percentage of duplicates (RQ 5a). We found that these duplicate items followa Zipfian distribution with a long tail, just as regular items do, which means that certainduplicates can be quite widespread (RQ 5). Finally, we examined the influence of duplicateson recommendation performance by creating a deduplicated version of our CiteULike dataset. We tested a collaborative filtering and a content-based approach, but did not findany clear effect of deduplication on recommendation, because our duplicate identificationclassifier was not sufficiently adequate (RQ 5b).
9.2 Recommendations for Recommendation
Based on the answers to our research questions, we can offer a set of recommendationsfor social bookmarking services seeking to implement a recommender system. Note thatour findings are specific to the task of recommending relevant items to users based ontheir profile; we cannot guarantee that our recommendations hold for other tasks such aspersonalized search or filling out reference lists.
Social bookmarking websites have two options at their disposal that both work equally well:recommending items using only the broad folksonomy or using the metadata assigned to theitems to produce recommendations. The latter option of recommendation based on meta-data is a good option when the website already has a good search infrastructure in place.In that case it is relatively easy to implement a metadata-based recommender system. Anadded advantage of having a good search engine is that it is also useful for detecting spamusers and content with high accuracy. Recommendation using the information contained inthe folksonomy is a good approach as well: here, we recommend implementing an item-based filtering algorithm that uses tag overlap between items to calculate the similarity.

Chapter 9. Discussion and Conclusions 173
However, since not all users tag their items, it would be even better to merge the tag in-formation with the usage information before calculating the item similarities as suggestedby Tso-Sutter et al. (2008). Depending on efficient implementation, performance can begreatly increased by combining the recommendations of different algorithms before theyare presented to the user. It is important here to combine approaches that focus on differentaspects of the task, such as different representations or different algorithms, preferably all.
To provide the user with a satisfactory experience it is important to perform spam andduplicate detection. While they may not influence the recommendations to a strong degree,their presence in the results list can be enough to for a user to lose trust in the recommendersystem. This illustrates that the success of any recommender system depends on the users,and whether or not they are satisfied with the system as a whole. Proper user testing of thesystem is therefore essential, and we will come back to this in Section 9.4.
9.3 Summary of Contributions
In this thesis we performed a principled investigation of the usefulness of different algo-rithms and information sources for recommending relevant items to users of social book-marking services. Below we list the following five contributions we have made.
1. We examined different ways of using the information present in a folksonomy forrecommendation, by extending a standard class of Collaborative Filtering algorithmswith information from the folksonomy. These extensions were then compared to otherstate-of-the-art approaches, and shown to be competitive.
2. We determined the best way of using item metadata for recommendation, and pro-posed several new and hybrid algorithms. These algorithms were shown to be com-petitive with the more popular usage-based approaches that use the folksonomy. Wewere the first to perform such a comparison of content-based recommendation withcollaborative filtering for social bookmarking services.
3. Compared to related work, we took a critical look at different methods for combiningrecommendations from different algorithms on the same data set. We showed thatcombining different algorithms and different representations, that all cover differentaspects of the recommendation task, yields the best performance, confirming earlierwork in the field of IR.
4. We have performed our experiments on publicly available data sets based on threedifferent social bookmarking services covering two different domains of Web pagesand scientific articles for a thorough evaluation of our work. This enhanced the gen-eralizability of our findings.
5. We examined two problems associated with the growth of a social bookmarking web-sites: spam and duplicate content. We showed how prevalent these phenomena are.Moreover, we proposed methods for automatically detecting these phenomena, andexamined the influence they might have on the item recommendation task.

Chapter 9. Discussion and Conclusions 174
9.4 Future Directions
In any research endeavor there is always room for improvement and the work described inthis thesis is no different. While we have covered many different aspects of recommendingitems on social bookmarking websites in this thesis, we believe that the work we have doneis but the tip of the proverbial iceberg. In particular, we acknowledge three fruitful anddesired directions for future research.
User-based Evaluation We remarked already in the first chapter of this thesis that ourchoice for system-based evaluation—while necessary to whittle down the overwhelmingnumber of possible algorithms and representations—leaves out perhaps the most importantcomponent of a recommender system: the user. Herlocker et al. (2004) was among the firstto argue that user satisfaction is influenced by more than just recommendation accuracy,and McNee (2006) followed up on this work with extensive user studies of recommendationalgorithms. Similarly, we believe it is essential to follow up our work with an evaluationwith real users in realistic situations. Ideally, such experiments would have to be run incooperation with one of the more popular social bookmarking websites to attract a largeenough group of test subjects to be able to draw statistically significant conclusions aboutany differences in performance. Typically, such live user studies are done by performingso-called A/B testing, also known as randomized experiments or Control/Treatment testing(Kohavi et al., 2009). In A/B testing, two or more variants of a website are randomlyassigned to the Web page visitors. With enough test subjects, meaningful conclusions canbe drawn about, for instance, differences in clickthrough rates or purchases. To follow up onthe work described in this thesis, it would be fruitful to compare different recommendationalgorithms, such as the best variants of user-based filtering and item-based filtering, andthe best content-based and hybrid filtering methods. Such user-based evaluation might seedifferent algorithms rise to the top that were not the best-performing ones in the system-based experiments. For example, if users turn out to prefer serendipitous recommendations,we might see user-based CF as the algorithm with the highest clickthrough rate of thepresented recommendations as suggested by McNee et al. (2006). Other influences onuser satisfaction, and just as testable through A/B testing, could include the presences ofexplanations: why was a recommendation made. This has been shown to be important touser satisfaction as well (Herlocker et al., 2000).
Task Differentiation In our experiments we focused on one specific task: item recommen-dation based on all of the bookmarks or articles added by a user in the past. This is far fromthe only task that could be supported on a social bookmarking website. Figure 9.1 shows amatrix of possible tasks, each in the form of selecting an object type and then finding relatedobjects, possibly of a different type, to go with them.
So far, related work on social tagging and social bookmarking has focused on ‘Tag recom-mendation’ and ‘Guided search’, and in this thesis we covered ‘Item recommendation’. Otherinteresting and useful tasks still remain largely unexplored, such as finding like-mindedusers or selecting specific items to get recommendations for—commonly known as ‘Morelike this’ functionality—which could be very useful on a social bookmarking website. Someof our algorithms already perform some of these functions, such as finding similar users or

Chapter 9. Discussion and Conclusions 175
Peoplelikeme
Itemrecommen‐
da2on
Peopleprofiling
Itemexperts
Morelikethis
Tagrecommen‐
da2on
Domainexperts
Guidedsearch
Depthbrowsing
USER
ITEM
TAG
USER ITEM TAG
findme...
Givena...
Figure 9.1: An overview of possible research tasks on social bookmarking websites, looselyadapted from Clements (2007). Most of the related work so far has focused on ‘Tag recom-mendation’, ‘Guided search’, and ‘Item recommendation’ (shaded cells). In this thesis wefocused on the latter task.
items for the memory-based CF algorithms. However, more specialized algorithms might bebetter at this.
In deciding which tasks to tackle it is essential to profile the users: what do they want, howand what are they currently using the system for? We believe that focusing on real-worldtasks in research can drive successful innovation, but only if the tasks under investigationare also desired by the users.
Algorithm Comparison In the experimental evaluation of our work, we have focusedon using publicly available data sets and comparing our work against state-of-the-art ap-proaches, something which is lacking from much of the related work. We are aware, how-ever, that our comparisons are by no means complete as we picked only two promisingapproaches to compare our work with. Model-based collaborative filtering algorithms, forinstance, were lacking from our comparison. In ‘regular’ recommendation experiments indifferent domains, model-based algorithms have been shown to hold a slight edge overmemory-based algorithms, but without proper comparison on multiple social bookmarkingdata sets we cannot draw any conclusions about this. One natural extension of the workwould therefore be to extend the comparison we made to all of the relevant related workdiscussed in Section 4.5. Such a comparison would have to include at least the approachesby Hotho et al. (2006a), Symeonidis et al. (2008b), Wetzker et al. (2009), Zanardi andCapra (2008), and Wang et al. (2006b).


REFERENCES
Gediminas Adomavicius and Alexander Tuzhilin. Toward the Next Generation of RecommenderSystems: A Survey of the State-of-the-Art and Possible Extensions. IEEE Transactions on Knowledgeand Data Engineering, 17(6):734–749, 2005.
Charu C. Aggarwal, Joel L. Wolf, Kun-Lung Wu, and Philip S. Yu. Horting Hatches an Egg: A NewGraph-Theoretic Approach to Collaborative Filtering. In KDD ’99: Proceeding of the 5th ACMSIGKDD International Conference on Knowledge Discovery and Data Mining, pages 201–212, NewYork, NY, USA, 1999. ACM.
David W. Aha, Dennis Kibler, and Marc K. Albert. Instance-Based Learning Algorithms. MachineLearning, 6(1):37–66, 1991.
Joshua Alspector, Aleksander Koicz, and Nachimuthu Karunanithi. Feature-based and Clique-basedUser Models for Movie Selection: A Comparative Study. User Modeling and User-Adapted Interac-tion, 7(4):279–304, 1997.
Sihem Amer-Yahia, Alban Galland, Julia Stoyanovich, and Cong Yu. From del.icio.us to x.qui.site:Recommendations in Social Tagging Sites. In SIGMOD ’08: Proceedings of the 2008 ACM SIGMODInternational Conference on Management of Data, pages 1323–1326, New York, NY, USA, 2008.ACM.
Javed A. Aslam and Mark Montague. Models for Metasearch. In SIGIR ’01: Proceedings of the 24thAnnual International ACM SIGIR Conference on Research and Development in Information Retrieval,pages 276–284, New York, NY, USA, 2001. ACM.
Marco Balabanovic. Learning to Surf: Multiagent Systems for Adaptive Web Page Recommendation.PhD thesis, Stanford University, March 1998.
Shumeet Baluja, Rohan Seth, D. Sivakumar, Yushi Jing, Jay Yagnik, Shankar Kumar, DeepakRavichandran, and Mohamed Aly. Video Suggestion and Discovery for Youtube: Taking RandomWalks through the View Graph. In WWW ’08: Proceedings of the 17th International Conference onWorld Wide Web, pages 895–904, New York, NY, USA, 2008. ACM.
Shenghua Bao, Xiaoyuan Wu, Ben Fei, Guirong Xue, Zhong Su, and Yong Yu. Optimizing Web Searchusing Social Annotations. In WWW ’07: Proceedings of the 16th International Conference on WorldWide Web, pages 501–510, New York, NY, USA, 2007. ACM.
Brian T. Bartell, Garrison W. Cottrell, and Richard K. Belew. Automatic Combination of MultipleRanked Retrieval Systems. In SIGIR ’94: Proceedings of the 17th Annual International ACM SIGIRConference on Research and Development in Information Retrieval, pages 173–181, New York, NY,1994. Springer-Verlag New York, Inc.
177

References 178
Justin Basilico and Thomas Hofmann. Unifying Collaborative and Content-based Filtering. In ICML’04: Proceedings of the 21st International Conference on Machine Learning, pages 9–16, New York,NY, USA, 2004. ACM.
Chumki Basu, Haym Hirsh, and William W. Cohen. Recommendation as Classification: Using So-cial and Content-Based Information in Recommendation. In Proceedings of the Fifteenth NationalConference on Artificial Intelligence, pages 714–720, 1998.
Chumki Basu, Haym Hirsh, William W. Cohen, and Craig Nevill-Manning. Technical Paper Recom-mendation: A Study in Combining Multiple Information Sources. Journal of Artificial IntelligenceResearch, 1:231–252, 2001.
Patrick Baudisch. Joining Collaborative and Content-based Filtering. In Proceedings of the ACM CHIWorkshop on Interacting with Recommender Systems. ACM, May 1999.
Nicholas J. Belkin and W. Bruce Croft. Information Filtering and Information Retrieval: Two Sidesof the Same Coin? Communications of the ACM, 35(12):29–38, 1992.
Nicholas J. Belkin, C. Cool, W. Bruce Croft, and James P. Callan. The Effect of Multiple Query Rep-resentations on Information Retrieval System Performance. In SIGIR ’93: Proceedings of the 16thAnnual International ACM SIGIR Conference on Research and Development in Information Retrieval,pages 339–346, New York, NY, USA, 1993. ACM.
Nicholas J. Belkin, P. Kantor, Edward A. Fox, and J.A. Shaw. Combining the Evidence of MultipleQuery Representations for Information Retrieval. Information Processing & Management, 31(3):431–448, May-June 1995.
Yaniv Bernstein and Justin Zobel. Redundant Documents and Search Effectiveness. In CIKM ’05:Proceedings of the Fourteenth International Conference on Information and Knowledge Management,pages 736–743, New York, NY, USA, 2005. ACM.
Mikhail Bilenko, Raymond Mooney, William Cohen, Pradeep Ravikumar, and Stephen Fienberg.Adaptive Name Matching in Information Integration. IEEE Intelligent Systems, 18(5):16–23, 2003.
Kerstin Bischoff, Claudiu S. Firan, Wolfgang Nejdl, and Raluca Paiu. Can All Tags be used for Search?In CIKM ’08: Proceedings of the Seventeenth International Conference on Information and KnowledgeManagement, pages 193–202, New York, NY, USA, 2008. ACM.
H.K. Biswas and Maruf Hasan. Using Publications and Domain Knowledge to Build Research Pro-files: An Application in Automatic Reviewer Assignment. In Proceedings of the 2007 InternationalConference on Information and Communication Technology (ICICT’07), pages 82–86, 2007.
Toine Bogers and Antal Van den Bosch. Comparing and Evaluating Information Retrieval Algorithmsfor News Recommendation. In RecSys ’07: Proceedings of the 2007 ACM Conference on Recom-mender Systems, pages 141–144. ACM, October 2007.
Toine Bogers and Antal Van den Bosch. Recommending Scientific Articles using CiteULike. In RecSys’08: Proceedings of the 2008 ACM Conference on Recommender Systems, pages 287–290. ACM,October 2008a.
Toine Bogers and Antal Van den Bosch. Using Language Models for Spam Detection in Social Book-marking. In Proceedings of 2008 ECML/PKDD Discovery Challenge Workshop, pages 1–12, Septem-ber 2008b.
Toine Bogers and Antal Van den Bosch. Using Language Modeling for Spam Detection in SocialReference Manager Websites. In Robin Aly, Claudia Hauff, I. den Hamer, Djoerd Hiemstra, TheoHuibers, and Franciska de Jong, editors, Proceedings of the 9th Belgian-Dutch Information RetrievalWorkshop (DIR 2009), pages 87–94, Enschede, February 2009a.
Toine Bogers and Antal Van den Bosch. Collaborative and Content-based Filtering for Item Rec-ommendation on Social Bookmarking Websites. Accepted for the ACM RecSys ’09 workshop onRecommender Systems and the Social Web, 2009b.
Kurt D. Bollacker, Steve Lawrence, and C. Lee Giles. Discovering Relevant Scientific Literature onthe Web. IEEE Intelligent Systems, 15(2):42–47, 2000.

References 179
John S. Breese, David Heckerman, and Carl Kadie. Empirical Analysis of Predictive Algorithmsfor Collaborative Filtering. In Proceedings of the Fourteenth Annual Conference on Uncertainty inArtificial Intelligence, pages 43–52, 1998.
Leo Breiman. Bagging Predictors. Machine Learning, 24(2):123–140, 1996.
Eric Brill and Michele Banko. Scaling to Very Very Large Corpora for Natural Language Disam-biguation. In ACL ’01: Proceedings of the 39th Annual Meeting on Association for ComputationalLinguistics, pages 26–33, Morristown, NJ, USA, 2001. ACL.
Peter F. Brown, John Cocke, Stephen A. Della Pietra, Vincent J. Della Pietra, Fredrick Jelinek, JohnLafferty, Robert L. Mercer, and Paul S. Roossin. A Statistical Approach to Machine Translation.Computational Linguistics, 16(2):79–85, 1990.
Kenneth Bryan, Michael O’Mahony, and Pádraig Cunningham. Unsupervised Retrieval of AttackProfiles in Collaborative Recommender Systems. In RecSys ’08: Proceedings of the 2008 ACMConference on Recommender Systems, pages 155–162, New York, NY, USA, 2008. ACM.
Jay Budzik and Kristian Hammond. Watson: Anticipating and Contextualizing Information Needs.In Proceedings of the 62nd Annual Meeting of the American Society for Information Science, Medford,NJ, 1999.
Christopher J.C. Burges. A Tutorial on Support Vector Machines for Pattern Recognition. DataMining and Knowledge Discovery, 2(2):121–167, 1998.
Robin Burke. Integrating Knowledge-Based and Collaborative-Filtering Recommender Systems. InProceedings of the AAAI Workshop on AI in Electronic Commerce, pages 69–72, 1999.
Robin Burke. Hybrid Recommender Systems: Survey and Experiments. User Modeling and User-Adapted Interaction, 12(4):331–370, 2002.
Robin Burke, Kristian J. Hammond, and Benjamin C. Young. The FindMe Approach to AssistedBrowsing. IEEE Expert: Intelligent Systems and Their Applications, 12(4):32–40, 1997.
Vannevar Bush. As We May Think. The Atlantic Monthly, 176:101–108, July 1945.
John Canny. Collaborative Filtering with Privacy via Factor Analysis. In SIGIR ’02: Proceedings ofthe 25th Annual International ACM SIGIR Conference on Research and Development in InformationRetrieval, pages 238–245, New York, NY, USA, 2002. ACM.
A. Capocci and G. Caldarelli. Folksonomies and Clustering in the Collaborative System CiteULike.eprint arXiv: 0710.2835, 2007.
Mark J. Carman, Marik Baillie, and Fabio Crestani. Tag Data and Personalized Information Retrieval.In SSM ’08: Proceeding of the 2008 ACM Workshop on Search in Social Media, pages 27–34, NewYork, NY, USA, 2008. ACM.
Ben Carterette, James Allan, and Ramesh Sitaraman. Minimal Test Collections for Retrieval Evalua-tion. In SIGIR ’06: Proceedings of the 29th Annual International ACM SIGIR Conference on Researchand Development in Information Retrieval, pages 268–275, New York, NY, USA, 2006. ACM.
Ciro Catutto, Christoph Schmitz, Andrea Baldassarri, Vito D. P. Servedio, Vittorio Loreto, AndreasHotho, Miranda Grahl, and Gerd Stumme. Network Properties of Folksonomies. AI Communica-tions Journal, Special Issue on "Network Analysis in Natural Sciences and Engineering", 20:245–262,2007.
Oscar Celma. Music Recommendation and Discovery in the Long Tail. PhD thesis, Universitat PompeuFabra, Barcelona, Spain, 2008.
Liren Chen and Katia Sycara. WebMate: A Personal Agent for Browsing and Searching. In Proceedingsof the Second International Conference on Autonomous Agents, pages 132–139, New York, NY, 1998.ACM.
Paul-Alexandru Chirita, Claudi S. Firan, and Wolfgang Nejdl. Pushing Task Relevant Web Linksdown to the Desktop. In Proceedings of the 8th ACM International Workshop on Web Informationand Data Management (WIDM 2006), November 2006.

References 180
Paul-Alexandru Chirita, Stefania Costache, Wolfgang Nejdl, and Siegfried Handschuh. P-TAG: LargeScale Automatic Generation of Personalized Annotation Tags for the Web. In WWW ’07: Proceed-ings of the 16th International Conference on World Wide Web, pages 845–854, New York, NY, USA,2007. ACM.
Kimberley Chopin. Indexing, Managing, Navigating – A Micro- and Macro-examination of Folkso-nomic Tagging. Master’s thesis, Royal School of Library and Information Science, Copenhagen,Denmark, August 2007.
Mark Claypool, Anuja Gokhale, Tim Miranda, Pavel Murnikov, Dmitry Netes, and Matthew Sartin.Combining Content-Based and Collaborative Filters in an Online Newspaper. In Proceedings ofACM SIGIR Workshop on Recommender Systems, August 1999.
Maarten Clements. Personalization of Social Media. In Proceedings of the BCS IRSG Symposium:Future Directions in Information Access 2007, August 2007.
Maarten Clements, Arjen P. de Vries, and Marcel J.T. Reinders. Optimizing Single Term Queries usinga Personalized Markov Random Walk over the Social Graph. In Proceedings of the ECIR Workshopon Exploiting Semantic Annotations in Information Retrieval (ESAIR ’08), 2008a.
Maarten Clements, Arjen P. de Vries, and Marcel J.T. Reinders. Detecting synonyms in social taggingsystems to improve content retrieval. In SIGIR ’08: Proceedings of the 31st Annual InternationalACM SIGIR Conference on Research and Development in Information Retrieval, pages 739–740, NewYork, NY, USA, 2008b. ACM.
W. Bruce Croft. Combining Approaches to Information Retrieval. Advances in Information Retrieval,7:1–36, 2000.
W. Bruce Croft and R.H. Thompson. I3R: A New Approach to the Design of Document RetrievalSystems. Journal of the American Society for Information Science, 38(6):389–404, 1987.
W. Bruce Croft, Donald Metzler, and Trevor Strohman. Search Engines: Information Retrieval inPractice. Addison Wesley, 2009.
Abhinandan Das, Mayur Datar, Ashutosh Garg, and Shyam Rajaram. Google News Personalization:Scalable Online Collaborative Filtering. In WWW ’07: Proceedings of the 16th International Con-ference on World Wide Web, pages 271–280, 2007.
Marco De Gemmis, Pasquale Lops, Giovanni Semeraro, and Pierpaolo Basile. Integrating Tags in aSemantic Content-based Recommender. In RecSys ’08: Proceedings of the 2008 ACM Conference onRecommender Systems, pages 163–170, New York, NY, USA, 2008. ACM.
Michael De Nie. itList. The Scout Report, 6(18). Retrieved July 16, 2009, from http://www.mail-archive.com/[email protected]/msg00038.html, September1999.
Brenda Dervin. From the Mind’s Eye of the User: The Sense-Making Qualitative-QuantitativeMethodology. Qualitative Research in Information Management, pages 61–84, 1992.
Susan T. Dumais and Jakob Nielsen. Automating the Assignment of Submitted Manuscripts to Re-viewers. In SIGIR ’92: Proceedings of the 15th Annual International ACM SIGIR Conference onResearch and Development in Information Retrieval, pages 233–244, New York, NY, USA, 1992.ACM.
Susan T. Dumais, Edward Cutrell, J.J. Cadiz, Gavin Jancke, Raman Sarin, and Daniel C. Robbins.Stuff I’ve Seen: a System for Personal Information Retrieval and Re-use. In SIGIR ’03: Proceedingsof the 26th Annual International ACM SIGIR Conference on Research and Development in InformationRetrieval, pages 72–79, New York, NY, 2003. ACM.
Ahmed K. Elmagarmid, Panagiotis G. Ipeirotis, and Vassilios S. Verykios. Duplicate Record Detection:A Survey. IEEE Transactions on Knowledge and Data Engineering, 19(1):1–16, January 2007.
Stephen Farrell and Tessa Lau. Fringe Contacts: People-Tagging for the Enterprise. In Proceedings ofthe WWW ’06 Collaborative Web Tagging Workshop, 2006.

References 181
Tom Fawcett. ROC Graphs: Notes and Practical Considerations for Researchers. Machine Learning,31, 2004.
Ivan P. Fellegi and Alan B. Sunter. A Theory for Record Linkage. Journal of the American StatisticalAssociation, 64(328):1183–1210, December 1969.
Martin Fenner. Interview with Kevin Emamy. Retrieved July 10, 2009, from http://network.nature.com/people/mfenner/blog/2009/01/30/interview-with-kevin-emamy, 2009.
S. Ferilli, N. Di Mauro, T.M.A. Basile, F. Esposito, and M. Biba. Automatic Topics Identification forReviewer Assignment. Advances in Applied Artificial Intelligence, pages 721–730, 2006.
Edward A. Fox and Joseph A. Shaw. Combination of Multiple Searches. In TREC-2 Working Notes,pages 243–252, 1994.
Yoram Freund and Robert E. Schapire. Experiments with a New Boosting Algorithm. In L. Saitta,editor, ICML ’96: Proceedings of the 13th International Conference on Machine Learning, pages148–156, San Francisco, CA, 1996. Morgan Kaufmann.
Peter Garama and Patrick De Man. Finding Images Fast with Folksonomies. Master’s thesis, TilburgUniversity, May 2008.
Natalie Glance, Jean-Luc Meunier, Pierre Bernard, and Damián Arregui. Collaborative DocumentMonitoring. In GROUP ’01: Proceedings of the 2001 International ACM SIGGROUP Conference onSupporting Group Work, pages 171–178, New York, NY, USA, 2001. ACM.
David Goldberg, David Nichols, Brian M. Oki, and Douglas Terry. Using Collaborative Filtering toWeave an Information Tapestry. Communications of the ACM, 35(12):61–70, 1992.
Ken Goldberg, Theresa Roeder, Dhruv Gupta, and Chris Perkins. Eigentaste: A Constant Time Col-laborative Filtering Algorithm. Information Retrieval, 4(2):133–151, 2001.
Scott A. Golder and Bernardo A. Huberman. Usage Patterns of Collaborative Tagging Systems.Journal of Information Science, 32(2):198–208, 2006.
Anatoliy A. Gruzd and Michael B. Twidale. Write While You Search: Ambient Searching of a DigitalLibrary in the Context of Writing. In Proceedings of the 1st International Workshop on DigitalLibraries in the Context of Users’ Broader Activities (DL-CUBA), Joint Conference on Digital Libraries(JCDL’06), pages 13–16, 2006.
Zoltán Gyöngyi and Hector Garcia-Molina. Web Spam Taxonomy. In AIRWeb ’05: Proceedings of the1st International Workshop on Adversarial Information Retrieval on the Web, pages 39–47, Chiba,Japan, May 2005.
Peter Haase, Marc Ehrig, Andreas Hotho, and Björn Schnizler. Semantic Web and Peer-to-Peer, chapterPersonalized Information Access in a Bibliographic Peer-to-Peer System, pages 143–157. SpringerBerlin Heidelberg, 2004.
Tony Hammond, Timo Hannay, Ben Lund, and Joanna Scott. Social Bookmarking Tools (I) - AGeneral Review. D-Lib Magazine, 11(4):1082–9873, 2005.
Uri Hanani, Bracha Shapira, and Peretz Shoval. Information Filtering: Overview of Issues, Researchand Systems. User Modeling and User-Adapted Interaction, 11:203–259, 2001.
David Hawking and Justin Zobel. Does Topic Metadata Help With Web Search? Journal of theAmerican Society for Information Science and Technology, 58(5):613–628, 2007.
Monika Henzinger. Finding Near-duplicate Web Pages: A Large-scale Evaluation of Algorithms. InSIGIR ’06: Proceedings of the 29th Annual International ACM SIGIR Conference on Research andDevelopment in Information Retrieval, pages 284–291, New York, NY, USA, 2006. ACM.
Jonathan L. Herlocker, Joseph A. Konstan, Al Borchers, and John Riedl. An Algorithmic Frameworkfor Performing Collaborative Filtering. In SIGIR ’99: Proceedings of the 22nd Annual InternationalACM SIGIR Conference on Research and Development in Information Retrieval, pages 230–237, NewYork, NY, USA, 1999. ACM.
Jonathan L. Herlocker, Joseph A. Konstan, and John Riedl. Explaining Collaborative Filtering Rec-ommendations. In CSCW ’00: Proceedings of the 2000 ACM Conference on Computer Supported
References 182
Cooperative Work, pages 241–250, New York, NY, USA, 2000. ACM.
Jonathan L. Herlocker, Joseph A. Konstan, Loren G. Terveen, and John T. Riedl. Evaluating Collab-orative Filtering Recommender Systems. ACM Transactions on Information Systems, 22(1):5–53,2004.
Mauricio A. Hernández and Salvatore J. Stolfo. The Merge/Purge Problem for Large Databases. InSIGMOD ’95: Proceedings of the 1995 ACM SIGMOD international conference on Management ofdata, pages 127–138, New York, NY, USA, 1995. ACM.
Paul Heymann and Hector Garcia-Molina. Collaborative Creation of Communal Hierarchical Tax-onomies in Social Tagging Systems. Technical report, Infolab, Stanford University, 2006.
Paul Heymann, Georgia Koutrika, and Hector Garcia-Molina. Fighting Spam on Social Web Sites: ASurvey of Approaches and Future Challenges. IEEE Internet Computing, 11(6):36–45, 2007.
Paul Heymann, Georgia Koutrika, and Hector Garcia-Molina. Can Social Bookmarking Improve WebSearch? In WSDM ’08: Proceedings of the International Conference on Web Search and Web DataMining, pages 195–206, New York, NY, USA, 2008a. ACM.
Paul Heymann, Daniel Ramage, and Hector Garcia-Molina. Social Tag Prediction. In SIGIR ’08:Proceedings of the 31st Annual International ACM SIGIR Conference on Research and Developmentin Information Retrieval, pages 531–538, New York, NY, USA, July 2008b. ACM.
Djoerd Hiemstra. A Linguistically Motivated Probabilistic Model of Information Retrieval. In ECDL’98: Proceedings of the Second European Conference on Research and Advanced Technology for DigitalLibraries, pages 569—584, 1998.
Thomas Hofmann. Latent Semantic Models for Collaborative Filtering. ACM Transactions on Infor-mation Systems, 22(1):89–115, 2004.
Tzvetan Horozov, Nitya Narasimhan, and Venu Vasudevan. Using Location for Personalized POI Rec-ommendations in Mobile Environments. In SAINT ’06: Proceedings of the International Symposiumon Applications on Internet, pages 124–129, Washington, DC, USA, 2006. IEEE Computer SocietyPress.
Andreas Hotho, Robert Jäschke, Christoph Schmitz, and Gerd Stumme. Information Retrieval inFolksonomies: Search and Ranking. In Proceedings of the European Semantic Web Conference2006, 2006a.
Andreas Hotho, Robert Jäschke, Christoph Schmitz, and Gerd Stumme. BibSonomy: A Social Book-mark and Publication Sharing System. In Proceedings of the Conceptual Structures Tool Interop-erability Workshop at the 14th International Conference on Conceptual Structures, pages 87–102,2006b.
Andreas Hotho, Dominik Benz, Robert Jäschke, and Beate Krause. Introduction to the 2008ECML/PKDD Discovery Challenge Workshop. In Proceedings of 2008 ECML/PKDD Discovery Chal-lenge Workshop, September 2008.
Peter Ingwersen. Polyrepresentation of Information Needs and Semantic Entities: Elements of aCognitive Theory for Information Retrieval Interaction. In SIGIR ’94: Proceedings of the 17thAnnual International ACM SIGIR Conference on Research and Development in Information Retrieval,pages 101–110, New York, NY, USA, 1994. Springer-Verlag New York, Inc.
Peter Ingwersen. Cognitive Perspectives of Information Retrieval Interaction: Elements of a CognitiveIR Theory. Journal of Documentation, 52(1):3–50, 1996.
Peter Ingwersen. Context in Information Interaction – Revisited 2006. In Theo Bothma, editor,Proceedings of the Fourth Biennial DISSAnet Conference. University of Pretoria, November 2006.
Peter Ingwersen and Kalervo Järvelin. The Turn: Integration of Information Seeking and Retrieval inContext, volume 18 of The Kluwer International Series on Information Retrieval. Springer Verlag,Dordrecht, The Netherlands, 2005.
Anil K. Jain and D. Zongker. Feature Selection: Evaluation, Application, and Small Sample Perfor-mance. IEEE Transactions on Pattern Analysis and Machine Intelligence, 19(2):153–158, 1997.

References 183
Nathalie Japkowicz and Shaju Stephen. The Class Imbalance Problem: A Systematic Study. IntelligentData Analysis, 6(5):429–449, 2002.
Robert Jäschke, Miranda Grahl, Andreas Hotho, Beate Krause, Christoph Schmitz, and Gerd Stumme.Organizing Publications and Bookmarks in BibSonomy. In Harith Alani, Natasha Noy, GerdStumme, Peter Mika, York Sure, and Denny Vrandecic, editors, Proceedings of the WWW ’07 Work-shop on Social and Collaborative Construction of Structured Knowledge, Banff, Canada, 2007a.
Robert Jäschke, Leandro Balby Marinho, Andreas Hotho, Lars Schmidt-Thieme, and Gerd Stumme.Tag Recommendations in Folksonomies. In Joost N. Kok, Jacek Koronacki, Ramon López de Mán-taras, Stan Matwin, Dunja Mladenic, and Andrzej Skowron, editors, PKDD 2007: Proceedingsof the 11th European Conference on Principles and Practice of Knowledge Discovery in Databases,volume 4702 of Lecture Notes in Computer Science, pages 506–514. Springer Verlag, 2007b.
Fredrick Jelinek. Self-organized Language Modeling for Speech Recognition. Readings in SpeechRecognition, pages 450–506, 1990.
Thorsten Joachims, Dayne Freitag, and Tom Mitchell. WebWatcher: A Tour Guide for the WorldWide Web. In IJCAI ’97: Proceedings of the Tenth International Joint Conference on Artificial Intel-ligence, volume 1, pages 770–777. Morgan Kaufmann, 1997.
Jaap Kamps and Maarten De Rijke. The Effectiveness of Combining Information Retrieval Strategiesfor European Languages. In Proceedings 19th Annual ACM Symposium on Applied Computing,pages 1073–1077, 2004.
George Karypis. Evaluation of Item-Based Top-N Recommendation Algorithms. In CIKM ’01: Pro-ceedings of the Tenth International Conference on Information and Knowledge Management, pages247–254, New York, NY, USA, 2001. ACM.
Henry Kautz, Bart Selman, and Mehul Shah. Referral Web: Combining Social Networks and Collab-orative Filtering. Communications of the ACM, 40(3):63–65, 1997.
Margaret E. I. Kipp. Complementary or Discrete Contexts in Online Indexing: A Comparison of User,Creator, and Intermediary Keywords. Canadian Journal of Information and Library Science, 2006.
Ron Kohavi, Roger Longbotham, Dan Sommerfield, and Randal Henne. Controlled Experiments onthe Web: Survey and Practical Guide. Data Mining and Knowledge Discovery, 18(1):140–181,2009.
Yehuda Koren. Factorization Meets the Neighborhood: A Multifaceted Collaborative Filtering Model.In KDD ’08: Proceeding of the 14th ACM SIGKDD International Conference on Knowledge Discoveryand Data Mining, pages 426–434, New York, NY, USA, 2008. ACM.
Georgia Koutrika, Frans Adjie Effendi, Zoltán Gyöngyi, Paul Heymann, and Hector Garcia-Molina.Combating Spam in Tagging Systems. In AIRWeb ’07: Proceedings of the 3rd International Work-shop on Adversarial Information Retrieval on the Web, pages 57–64, New York, NY, USA, 2007.ACM.
Beate Krause, Andreas Hotho, and Gerd Stumme. The Anti-Social Tagger - Detecting Spam in SocialBookmarking Systems. In AIRWeb ’08: Proceedings of the 4th International Workshop on AdversarialInformation Retrieval on the Web, 2008.
Ralf Krestel and Ling Chen. Using Co-occurrence of Tags and Resources to Identify Spammers. InProceedings of 2008 ECML/PKDD Discovery Challenge Workshop, pages 38–46, September 2008.
Shyong K. Lam and John Riedl. Shilling Recommender Systems for Fun and Profit. In WWW ’04:Proceedings of the 13th International Conference on World Wide Web, pages 393–402, New York,NY, USA, 2004. ACM.
Renaud Lambiotte and Marcel Ausloos. Collaborative Tagging as a Tripartite Network. Lecture Notesin Computer Science, 3993(2006):1114–1117, 2006.
F. W. Lancaster. Indexing and Abstracting in Theory and Practice. University of Illinois, GraduateSchool of Library and Information, 3rd edition, 2003.

References 184
Ken Lang. NewsWeeder: Learning to Filter Netnews. In ICML ’95: Proceedings of the 12th Inter-national Conference on Machine Learning, pages 331–339, San Mateo, CA, USA, 1995. MorganKaufmann.
Birger Larsen, Peter Ingwersen, and Berit Lund. Data Fusion According to the Principle of Polyrepre-sentation. Journal of the American Society for Information Science and Technology, 60(4):646–654,2009.
Liz Lawley. Tagging vs. Folksonomy. Retrieved July 17, 2009, from http://many.corante.com/archives/2006/11/02/tagging_vs_folksonomy.php, November 2006.
Julia Lawlor. Web Services Offer Solutions to Bookmark Overload. RetrievedJuly 16, 2009, from http://www.nytimes.com/2000/07/13/technology/web-services-offer-solutions-to-bookmark-overload.html, July 2000.
Joon Ho Lee. Analyses of Multiple Evidence Combination. SIGIR Forum, 31(SI):267–276, 1997.
Rui Li, Shenghua Bao, Ben Fei, Zhong Su, and Yong Yu. Towards Effective Browsing of Large ScaleSocial Annotations. In WWW ’07: Proceedings of the 16th International Conference on World WideWeb, pages 943–951, 2007.
Henry Lieberman. Letizia: An Agent That Assists Web Browsing. In Chris S. Mellish, editor, Pro-ceedings of the Fourteenth International Joint Conference on Artificial Intelligence (IJCAI-95), pages924–929, San Mateo, CA, 1995. Morgan Kaufmann.
Greg Linden, Brent Smith, and Jeremy York. Amazon.com Recommendations: Item-to-Item Collab-orative Filtering. IEEE Internet Computing, 7(1):76–80, 2003.
Veronica Maidel, Peretz Shoval, Bracha Shapira, and Meirav Taieb-Maimon. Evaluation of anOntology-Content Based Filtering Method for a Personalized Newspaper. In RecSys ’08: Proceed-ings of the 2008 ACM Conference on Recommender Systems, pages 91–98, New York, NY, USA, 2008.ACM.
Christopher D. Manning and Hinrich Schütze. Foundations of Statistical Natural Language Processing.MIT Press, Cambridge, MA, 1999.
Christopher D. Manning, Prabhakar Raghavan, and Hinrich Schütze. Introduction to InformationRetrieval. Cambridge University Press, 2008.
Cameron Marlow, Mor Naaman, Danah Boyd, and Marc Davis. HT06, tagging paper, taxonomy,Flickr, academic article, to read. In HYPERTEXT ’06: Proceedings of the seventeenth conference onHypertext and hypermedia, pages 31–40, New York, NY, USA, 2006. ACM.
Adam Mathes. Folksonomies - Cooperative Classification and Communication through Shared Meta-data. Technical report, University of Illinois Urbana-Champaign, 2004.
Sean McNee. Meeting User Information Needs in Recommender Systems. PhD thesis, University ofMinnesota, June 2006.
Sean McNee, Istvan Albert, Dan Cosley, Prateep Gopalkrishnan, Shyong K. Lam, Al Mamunur Rashid,Joseph A. Konstan, and John Riedl. On the Recommending of Citations for Research Papers. InCSCW ’02: Proceedings of the 2002 ACM Conference on Computer Supported Cooperative Work,pages 116–125, New York, NY, USA, 2002. ACM.
Sean McNee, Nishikant Kapoor, and Joseph A. Konstan. Don’t Look Stupid: Avoiding Pitfalls whenRecommending Research Papers. In CSCW ’06: Proceedings of the 2006 ACM Conference on Com-puter Supported Cooperative Work, pages 171–180, New York, NY, USA, 2006. ACM.
Bhashkar Mehta. Cross-System Personalization: Enabling Personalization across Multiple Systems. PhDthesis, Universität Duisberg Essen, 2008.
Peter Mika. Ontologies are us: A Unified Model of Social Networks and Semantics. In Yolanda Gil,Enrico Motta, V. Richard Benjamins, and Mark A. Musen, editors, ISWC 2005, volume 3729 ofLecture Notes on Computer Science, pages 522–536, Berlin, November 2005. Springer-Verlag.
Gilad Mishne. AutoTag: A Collaborative Approach to Automated Tag Assignment for Weblog Posts.In WWW ’06: Proceedings of the 15th International Conference on World Wide Web, May 2006.

References 185
Gilad Mishne and Maarten de Rijke. Deriving Wishlists from Blogs - Show us your Blog, and We’llTell you What Books to Buy. In WWW ’06: Proceedings of the 15th International Conference onWorld Wide Web, pages 925–926, New York, NY, 2006. ACM.
Gilad Mishne, David Carmel, and Ronny Lempel. Blocking Blog Spam with Language Model Dis-agreement. In AIRWeb ’05: Proceedings of the 1st International Workshop on Adversarial Informa-tion Retrieval on the Web, pages 1–6, New York, NY, USA, 2005. ACM.
Bamshad Mobasher, Robin Burke, Chad Williams, and Runa Bhaumik. Analysis and Detection ofSegment-focused Attacks against Collaborative Recommendation. In Olfa Nasraoui, Osmar R.Zaïane, Myra Spiliopoulou, Bamshad Mobasher, Brij Masand, and Philip S. Yu, editors, Web Min-ing and Web Usage Analysis, volume 4198 of Lecture Notes in Computer Science, pages 96–118.Springer, 2006.
Miquel Montaner, Beatriz López, and Josep Lluís de la Rosa. A Taxonomy of Recommender Agentson the Internet. Artificial Intelligence Review, 19(4):285–330, 2003.
Raymond J. Mooney and Loriene Roy. Content-Based Book Recommending Using Learning for TextCategorization. In DL ’00: Proceedings of the Fifth ACM Conference on Digital Libraries, pages195–204, New York, NY, 2000. ACM.
P. Jason Morrison. Tagging and Searching: Search Retrieval Effectiveness of Folksonomies on theWeb. Master’s thesis, Kent State University, May 2007.
Reyn Nakamoto, Shinsuke Nakajima, Jun Miyazaki, and Shunsuke Uemura. Tag-Based ContextualCollaborative Filtering. In Proceedings of the 18th IEICE Data Engineering Workshop, 2007.
Reyn Nakamoto, Shinsuke Nakajima, Jun Miyazaki, Shunsuke Uemura, Hirokazu Kato, and YoichiInagaki. Reasonable Tag-based Collaborative Filtering for Social Tagging Systems. In WICOW’08: Proceeding of the 2nd ACM Workshop on Information Credibility on the Web, pages 11–18,New York, NY, USA, 2008. ACM.
Gonzalo Navarro. A Guided Tour to Approximate String Matching. ACM Computing Surveys, 33(1):31–88, 2001.
Michael O’Mahony, Neil Hurley, Nicholas Kushmerick, and Guénolé Silvestre. Collaborative Rec-ommendation: A Robustness Analysis. ACM Transactions on Internet Technology (TOIT), 4(4):344–377, 2004.
Tim O’Reilly. What Is Web 2.0. Retrieved July 7, 2009, from http://oreilly.com/web2/archive/what-is-web-20.html, 2005.
Iadh Ounis, Maarten de Rijke, Craig McDonald, Gilad Mishne, and Ian Soboroff. Overview of theTREC 2006 Blog Track. In TREC 2006 Working Notes, 2006.
Lawrence Page, Sergey Brin, Rajeev Motwani, and Terry Winograd. The PageRank Citation Ranking:Bringing Order to the Web. Technical report, Stanford Digital Library Technologies Project, 1998.
Parag and Pedro Domingos. Multi-Relational Record Linkage. In Proceedings of the KDD-2004 Work-shop on Multi-Relational Data Mining, pages 31–48. ACM, 2004.
Patrick Paulson and Aimillia Tzanavari. Combining Collaborative and Content-Based Filtering UsingConceptual Graphs. Modelling with Words, pages 168–185, 2003.
Michael J. Pazzani. A Framework for Collaborative, Content-based and Demographic Filtering. Arti-ficial Intelligence Review, 13(5):393–408, 1999.
Michael J. Pazzani, Jack Muramatsu, and Daniel Billsus. Syskill & Webert: Identifying InterestingWeb Sites. In AAAI/IAAI, Vol. 1, pages 54–61, 1996.
Peter Pirolli and Stuart Card. Information Foraging in Information Access Environments. In CHI ’95:Proceedings of the SIGCHI Conference on Human Factors in Computing Systems, pages 51–58, NewYork, NY, 1995. ACM.
Jay M. Ponte and W. Bruce Croft. A Language Modeling Approach to Information Retrieval. InSIGIR ’98: Proceedings of the 21st Annual International ACM SIGIR Conference on Research andDevelopment in Information Retrieval, pages 275–281, New York, NY, 1998. ACM.

References 186
Reid Priedhorsky, Jilin Chen, Shyong K. Lam, Katherine Panciera, Loren Terveen, and John Riedl.Creating, Destroying, and Restoring Value in Wikipedia. In Proceedings of GROUP ’07, 2007.
Mari Carmen Puerta Melguizo, Olga Muñoz Ramos, Lou Boves, Toine Bogers, and Antal Van denBosch. A Personalized Recommender System for Writing in the Internet Age. In Proceedingsof the LREC 2008 workshop on Natural Language Processing Resources, Algorithms, and Tools forAuthoring Aids, 2008.
Al Mamunur Rashid, Istvan Albert, Dan Cosley, Shyong K. Lam, Sean McNee, Joseph A. Konstan,and John Riedl. Getting to Know You: Learning New User Preferences in Recommender Systems.In IUI ’02: Proceedings of the 7th International Conference on Intelligent User Interfaces, pages 127–134, New York, NY, 2002. ACM.
M. Elena Renda and Umberto Straccia. Web Metasearch: Rank vs. Score-based Rank AggregationMethods. In SAC ’03: Proceedings of the 2003 ACM Symposium on Applied Computing, pages841–846, New York, NY, USA, 2003. ACM.
Paul Resnick and Rahul Sami. The Influence Limiter: Provably Manipulation-Resistant RecommenderSystems. In RecSys ’07: Proceedings of the 2007 ACM Conference on Recommender Systems, pages25–32, New York, NY, USA, 2007. ACM.
Paul Resnick and Hal R. Varian. Recommender Systems. Communications of the ACM, 40(3):56–58,1997.
Paul Resnick, Neophytos Iacovou, Mitesh Suchak, Peter Bergstrom, and John Riedl. GroupLens: AnOpen Architecture for Collaborative Filtering of Netnews. In CSCW ’94: Proceedings of the 1994ACM Conference on Computer Supported Cooperative Work, pages 175–186, New York, NY, USA,1994. ACM.
Bradley J. Rhodes and Patti Maes. Just-In-Time Information Retrieval Agents. IMB Systems Journal,39(3-4):685–704, 2000.
Stuart J. Russel and Peter Norvig. Artificial Intelligence: A Modern Approach. Prentice-Hall, UpperSaddle River, NJ, 2nd edition, 2003.
Gerard Salton and Christopher Buckley. Term-Weighting Approaches in Automatic Text Retrieval.Information Processing & Management, 24(5):513–523, 1988.
Badrul Sarwar, George Karypis, Joseph Konstan, and John Riedl. Item-Based Collaborative FilteringRecommendation Algorithms. In WWW ’01: Proceedings of the 10th International Conference onWorld Wide Web, pages 285–295, New York, NY, USA, 2001. ACM.
Badrul Sarwar, George Karypis, Joseph A. Konstan, and John Riedl. Incremental SVD-Based Al-gorithms for Highly Scaleable Recommender Systems. In Proceedings of the Fifth InternationalConference on Computer and Information Technology (ICCIT 2002), 2002.
Andrew I. Schein, Alexandrin Popescul, Lyle H. Ungar, and David M. Pennock. Methods and Metricsfor Cold-start Recommendations. In SIGIR ’02: Proceedings of the 25th Annual International ACMSIGIR Conference on Research and Development in Information Retrieval, pages 253–260, New York,NY, USA, 2002. ACM.
S. Schmitt and R. Bergmann. Applying Case-based Reasoning Technology for Product Selection andCustomization in Electronic Commerce Environments. In Proceedings of the 12th Bled ElectronicCommerce Conference, Bled, Slovenia, 1999.
Christoph Schmitz, Andreas Hotho, Robert Jäschke, and Gerd Stumme. Mining Association Rulesin Folksonomies. In V. Batagelj, H.-H. Bock, A. Ferligoj, and A. Žiberna, editors, Data Science andClassification: Proceedings of the 10th IFCS Conference, Studies in Classification, Data Analysis, andKnowledge Organization, pages 261–270, Heidelberg, July 2006. Springer-Verlag.
Christoph Schmitz, Miranda Grahl, Andreas Hotho, Gerd Stumme, Ciro Cattuto, Andrea Baldassarri,Vittorio Loreto, and Vito D. P. Servedio. Network Properties of Folksonomies. In Scott Golder andFrank Smadja, editors, Proceedings of the WWW ’07 Tagging and Metadata for Social InformationOrganization Workshop, 2007.

References 187
Stephen B. Seidman. Network Structure and Minimum Degree. Social Networks, 5(5):269–287,1983.
Upendra Shardanand and Pattie Maes. Social Information Filtering: Algorithms for Automating“Word of Mouth”. In CHI ’95: Proceedings of the SIGCHI Conference on Human Factors in ComputingSystems, pages 210–217, New York, NY, USA, 1995. ACM.
Prashant Sharma. Core Characteristics of Web 2.0 Services. Retrieved July 7, 2009, from http://www.techpluto.com/web-20-services/, 2008.
Kaikai Shen and Lide Wu. Folksonomy as a Complex Network. Technical report, Department ofComputer Science, Fudan University, 2005.
Clay Shirky. Ontology is Overrated: Categories, Links, and Tags. Retrieved July 17, 2009, fromhttp://www.shirky.com/writings/ontology_overrated.html, 2005.
Börkur Sigurbjörnsson and Roelof Van Zwol. Flickr Tag Recommendation based on Collective Knowl-edge. In WWW ’08: Proceedings of the 17th International Conference on World Wide Web, pages327–336, New York, NY, USA, 2008. ACM.
Mette Skov, Birger Larsen, and Peter Ingwersen. Inter and Intra-Document Contexts Applied inPolyrepresentation for Best Match IR. Information Processing & Management, 44:1673–1683,2008.
Yang Song, Ziming Zhuang, Huajing Li, Qiankun Zhao, Jia Li, Wang-Chien Lee, and C. Lee Giles.Real-time Automatic Tag Recommendation. In SIGIR ’08: Proceedings of the 31st Annual Interna-tional ACM SIGIR Conference on Research and Development in Information Retrieval, pages 515–522,New York, NY, USA, 2008. ACM.
Anselm Spoerri. Authority and Ranking Effects in Data Fusion. Journal of the American Society forInformation Science and Technology, 59(3):450–460, 2007.
Lubomira Stoilova, Todd Holloway, Ben Markines, Ana G. Maguitman, and Filippo Menczer.GiveALink: Mining a Semantic Network of Bookmarks for Web Search and Recommendation.In LinkKDD ’05: Proceedings of the 3rd International Workshop on Link Discovery, pages 66–73,New York, NY, USA, 2005. ACM.
Trevor Strohman, Donald Metzler, and W. Bruce Croft. Indri: A Language Model-based Search Enginefor Complex Queries. In Proceedings of the International Conference on Intelligence Analysis, May2005.
Trevor Strohman, W. Bruce Croft, and David Jensen. Recommending Citations for Academic Papers.In SIGIR ’07: Proceedings of the 30th Annual International ACM SIGIR Conference on Research andDevelopment in Information Retrieval, pages 705–706, New York, NY, 2007. ACM.
Fabian M. Suchanek, Milan Vojnovic, and Dinan Gunawardena. Social Tags: Meaning and Sugges-tions. In CIKM ’08: Proceedings of the Seventeenth International Conference on Information andKnowledge Management, pages 223–232, New York, NY, USA, 2008. ACM.
Panagiotis Symeonidis, Alexandros Nanopoulos, and Yannis Manolopoulos. Tag RecommendationsBased on Tensor Dimensionality Reduction. In RecSys ’08: Proceedings of the 2008 ACM Conferenceon Recommender Systems, pages 43–50, New York, NY, USA, 2008a. ACM.
Panagiotis Symeonidis, Maria Ruxanda, Alexandros Nanopoulos, and Yannis Manolopoulos. TernarySemantic Analysis of Social Tags for Personalized Music Recommendation. In ISMIR ’08: Proceed-ings of the 9th International Conference on Music Information Retrieval, pages 219–224, 2008b.
Martin Szomszor, Ciro Cattuto, Harith Alani, Kieron O’Hara, Andrea Baldassarri, Vittorio Loreto, andVito D.P. Servedio. Folksonomies, the Semantic Web, and Movie Recommendation. In Proceedingsof the ESWC Workshop on Bridging the Gap between Semantic Web and Web 2.0, 2007.
Robert S. Taylor. Question-Negotiation and Information Seeking in Libraries. College and ResearchLibraries, 29:178–194, May 1968.
Nava Tintarev and Judith Masthoff. Similarity for News Recommender Systems. In Proceedings ofthe AH’06 Workshop on Recommender Systems and Intelligent User Interfaces, 2006.

References 188
B. Towle and C. Quinn. Knowledge Based Recommender Systems Using Explicit User Models. InProceedings of the AAAI Workshop on Knowledge-Based Electronic Markets, AAAI Technical ReportWS-00-04, pages 74–77, Menlo Park, CA, 2000. AAAI Press.
Karen H. L. Tso-Sutter, Leandro Balby Marinho, and Lars Schmidt-Thieme. Tag-aware RecommenderSystems by Fusion of Collaborative Filtering Algorithms. In SAC ’08: Proceedings of the 2008 ACMsymposium on Applied computing, pages 1995–1999, New York, NY, USA, 2008. ACM.
Antal Van den Bosch. Wrapped Progressive Sampling Search for Optimizing Learning AlgorithmParameters. In R. Verbrugge, N. Taatgen, and L. Schomaker, editors, Proceedings of the 16thBelgian-Dutch Conference on Artificial Intelligence, pages 219–226, 2004.
Mark Van Setten, Mettina Veenstra, Anton Nijholt, and Betsy van Dijk. Case-Based Reasoning as aPrediction Strategy for Hybrid Recommender Systems. In Proceedings of Advances in Web Intel-ligence: Second International Atlantic Web Intelligence Conference (AWIC 2004), volume 3034 ofLecture Notes in Computer Science, pages 13–22, Berlin, 2004. Springer Verlag.
Thomas Vander Wal. Explaining and Showing Broad and Narrow Folksonomies. Retrieved April 29,2008, from http://www.personalinfocloud.com/2005/02/explaining_and_.html, 2005a.
Thomas Vander Wal. Folksonomy Definition and Wikipedia. Retrieved July 17, 2009, from http://www.vanderwal.net/random/entrysel.php?blog=1750, November 2005b.
Christopher C. Vogt and Garrison W. Cottrell. Predicting the Performance of Linearly CombinedIR Systems. In SIGIR ’98: Proceedings of the 21st Annual International ACM SIGIR Conference onResearch and Development in Information Retrieval, pages 190–196, New York, NY, 1998. ACM.
Luis Von Ahn, Ben Maurer, Colin McMillen, David Abraham, and Manuel Blum. reCAPTCHA: Human-Based Character Recognition via Web Security Measures. Science, 321:1465–1468, September2008.
Ellen M. Voorhees, Narendra K. Gupta, and Ben Johnson-Laird. Learning Collection Fusion Strate-gies. In Edward A. Fox, Peter Ingwersen, and Raya Fidel, editors, SIGIR ’95: Proceedings of the 18thAnnual International ACM SIGIR Conference on Research and Development in Information Retrieval,pages 172–179, New York, NY, 1995. ACM.
Jakob Voß. Tagging, Folksonomy & Co–Renaissance of Manual Indexing? In ISI 2007: Proceedingsof the 10th International Symposium for Information Science, 2007.
Jun Wang, Arjen P. de Vries, and Marcel J. T. Reinders. Unifying User-based and Item-based Collab-orative Filtering Approaches by Similarity Fusion. In SIGIR ’06: Proceedings of the 29th AnnualInternational ACM SIGIR Conference on Research and Development in Information Retrieval, pages501–508, New York, NY, USA, 2006a. ACM.
Xuanhui Wang, Jian-Tao Sun, Zheng Chen, and Chengxiang Zhai. Latent Semantic Analysis forMultiple-Type Interrelated Data Objects. In SIGIR ’06: Proceedings of the 29th Annual InternationalACM SIGIR Conference on Research and Development in Information Retrieval, pages 236–243, NewYork, NY, USA, 2006b. ACM.
Duncan J. Watts and Steven H. Strogatz. Collective Dynamics of ’Small-world’ Networks. Nature,393(6684):440–442, June 1998.
Sholom M. Weiss and Casimir A. Kulikowski. Computer Systems That Learn. Morgan Kaufmann,1991.
Robert Wetzker. Analyzing Social Bookmarking Systems: A del.icio.us Cookbook. In Proceedings ofthe ECAI 2008 Mining Social Data Workshop, pages 26–30. IOS Press, July 2008.
Robert Wetzker, Winfried Umbrath, and Alan Said. A Hybrid Approach to Item Recommendationin Folksonomies. In ESAIR ’09: Proceedings of the WSDM ’09 Workshop on Exploiting SemanticAnnotations in Information Retrieval, pages 25–29, New York, NY, USA, 2009. ACM.
Brian Whitman and Steve Lawrence. Inferring Descriptions and Similarity for Music from CommunityMetadata. In Proceedings of the 2002 International Computer Music Conference, pages 591–598,2002.

References 189
David H. Wolpert. Stacked Generalization. Neural Networks, 5(2):241–259, 1992.
Zhichen Xu, Yun Fu, Jianchang Mao, and Difu Su. Towards the Semantic Web: Collaborative TagSuggestions. In Proceedings of the WWW ’06 Collaborative Web Tagging Workshop, 2006.
Yusuke Yanbe, Adam Jatowt, Satoshi Nakamura, and Katsumi Tanaka. Can Social BookmarkingEnhance Search in the Web? In JCDL ’07: Proceedings of the 7th ACM/IEEE Joint Conference onDigital Libraries, pages 107–116, New York, NY, USA, 2007. ACM.
David Yarowsky and Radu Florian. Taking the Load off the Conference Chairs: Towards a DigitalPaper-Routing Assistant. In Proceedings of the 1999 Joint SIGDAT Conference on Empirical Methodsin NLP and Very Large Corpora, pages 220–230, 1999.
Hilmi Yildirim and Mukkai S. Krishnamoorthy. A Random Walk Method for Alleviating the SparsityProblem in Collaborative Filtering. In RecSys ’08: Proceedings of the 2008 ACM Conference onRecommender Systems, pages 131–138, New York, NY, USA, 2008. ACM.
Ping Yin, Ming Zhang, and Xiaoming Li. Recommending Scientific Literatures in a CollaborativeTagging Environment. Asian Digital Libraries. Looking Back 10 Years and Forging New Frontiers,pages 478–481, 2007.
Valentina Zanardi and Licia Capra. Social Ranking: Uncovering Relevant Content using Tag-basedRecommender Systems. In RecSys ’08: Proceedings of the 2008 ACM Conference on RecommenderSystems, pages 51–58, New York, NY, USA, 2008. ACM.
Chengxiang Zhai and John Lafferty. A Study of Smoothing Methods for Language Models Applied toInformation Retrieval. ACM Transactions on Information Systems, 22(2):179–214, 2004.
Ding Zhou, Jiang Bian, Shuyi Zheng, Hongyuan Zha, and C. Lee Giles. Exploring Social Annotationsfor Information Retrieval. In WWW ’08: Proceedings of the 17th International Conference on WorldWide Web, pages 715–724, New York, NY, USA, 2008. ACM.
Cai-Nicolas Ziegler, Georg Lausen, and Lars Schmidt-Thieme. Taxonomy-driven Computation ofProduct Recommendations. In CIKM ’04: Proceedings of the Thirteenth International Conference onInformation and Knowledge Management, pages 406–415, 2004.


AP
PE
ND
IX ACOLLECTING THE CITEULIKE DATA SET
A.1 Extending the Public Data Dump
We described in Chapter 3 that our CiteULike data set is based on the November 2, 2007data dump that is made available publicly1 by CiteULike. This dump contains all informationon which articles were posted by whom, with which tags, and at what point in time. FigureA.1 shows a tiny subset of this data dump.
42 217369743f9df99964fa16439a01f5f3 2006-12-26T02:03:08.605006+00 metabolism 42 217369743f9df99964fa16439a01f5f3 2006-12-26T02:03:08.605006+00 networks 42 217369743f9df99964fa16439a01f5f3 2006-12-26T02:03:08.605006+00 systems_biology 42 473d9d0924d3aafcf26846d7772a0ae5 2005-06-24T01:22:12.696806+01 small_world 42 473d9d0924d3aafcf26846d7772a0ae5 2005-06-24T01:22:12.696806+01 wireing_digrams 42 61baaeba8de136d9c1aa9c18ec3860e8 2004-11-04T02:25:05.373798+00 barabasi 42 61baaeba8de136d9c1aa9c18ec3860e8 2004-11-04T02:25:05.373798+00 ecoli 42 61baaeba8de136d9c1aa9c18ec3860e8 2004-11-04T02:25:05.373798+00 metabolism 42 61baaeba8de136d9c1aa9c18ec3860e8 2004-11-04T02:25:05.373798+00 networks 42 b8f7de09e5c78bdd72b2fd9c4bb00fc2 2006-06-02T18:02:00.510405+01 metabolism 42 b8f7de09e5c78bdd72b2fd9c4bb00fc2 2006-06-02T18:02:00.510405+01 network 43 951c3216b53eeb01d5ddc75ecfe63753 2007-05-11T16:47:11.366525+01 no-tag 43 32c2ddd35515c3fdc1b7731992887015 2007-01-16T19:45:20.535288+00 key--reg ulatory_network43 32c2ddd35515c3fdc1b7731992887015 2007-01-16T19:45:20.535288+00 key--robustness 43 32c2ddd35515c3fdc1b7731992887015 2007-01-16T19:45:20.535288+00 key--systems_biology 43 32c2ddd35515c3fdc1b7731992887015 2007-01-16T19:45:20.535288+00 type--review 43 86c091c8b7d793966136c07488efe622 2006-12-01T16:02:59.704955+00 robustness
ARTICLEID USERID(HASHED) TIMESTAMP TAG
Figure A.1: A small subset of a CiteULike data dump. The columns from left to rightcontain the article IDs, user IDs. time stamps, and tags.
Each line represents a user-item-tag triple with the associated timestamp of the posting, soif a user posted an article with n tags, then this resulted in n rows in the file for that article-user pair. If a user added no tags, then the article-user pair is represented by 1 row withthe tag no-tag. On the CiteULike website, users can pick their own user name, but these
1Available from http://www.citeulike.org/faq/data.adp.
191

Appendix A. Collecting the CiteULike Data Set 192
were hashed in the data dumps using the MD5 cryptographic hashing function for privacyreasons. Unfortunately, most of the interesting features on the CiteULike website are linkedto the user names and not to the hashed IDs. For instance, each article has a separatepage for the users that added it, which contain the personal metadata such as reviews andcomments. Unfortunately, these article pages display only the CiteULike user names, whichmeans that for us to be able to link the data dump to the personal metadata we had tomatch each user name to its corresponding MD5 hashes.
Directly applying the MD5 hashing function to the username did not result in any matchinghashes, which suggests that CiteULike uses a salt to make reverse lookup practically impos-sible2. We therefore had to find another way of matching the user names to the hashes.First, we crawled all user-specific article pages. Each article on CiteULike has its owngeneric page, which can be accessed by inserting the article ID from the CiteULike datadump in a URL of the form http://www.citeulike.org/article/ARTICLE_ID. Eacharticle page contains metadata and also lists, by user name, all users that have addedthe article to their personal library. We crawled all article pages and collected all infor-mation. After acquiring the names of the users that added an article, we also crawledall user-specific versions of these pages. These can be accessed at a URL of the formhttp://www.citeulike.org/user/USER_NAME/article/ARTICLE_ID. Using the col-lected lists of user names, we collected the personal metadata added by each separate usersuch as tags and comments.
By collecting these article-user name-tag triples from the CiteULike article pages, we werethen able to match user names to MD5 hashes3. This turned the alignment problem intoa matter of simple constraint satisfaction. For a single article A there might be multipleauthors who added the same tag(s) to A, but perhaps only one of those authors addedanother article B with his own unique tags. By identifying those posts that matched uniquelyon articles and tags, we were able to align that user’s name with the hashed ID. We ran thisalignment process for 7 iterations, each round resolving more ambiguous matches, until nomore authors could be matched. Table A.1 shows statistics of our progress in aligning theusernames and hashes.
Table A.1: Statistics of the user alignment process. Each cell lists how many users andassociated articles and tags were matched after the seven steps.
Data dump Step 1 Step 2 Step 3 Step 4 Step 5 Step 6 Step 7
Users 27,133 24,591 25,182 25,260 25,284 25,292 25,352 25,375Articles 813,186 763,999 780,244 780,837 780,851 780,851 803,278 803,521Tags 235,199 224,061 227,678 227,844 227,848 227,848 232,794 232,837
After seven rounds, 93.5% of the initial 27,133 user names were correctly identified. Fur-thermore, 98.8% of all articles were retained and 99.0% of all tags. We believe that thisrepresents a substantial enough subset of our the original data dump to proceed with further
2A salt is a series of random bits used as additional input to the hashing function. It makes reverse lookupusing dictionary attacks more complicated by effectively extending the length and potentially the complexity ofthe password.
3Matching usernames and hashes on the specific timestamps when articles were added would have beeneasier and more specific, but this was not possible: the timestamps were not present on the crawled Web pages.

Appendix A. Collecting the CiteULike Data Set 193
experiments. Figure A.2 shows the same extract of the CiteULike data dump of Figure A.1with the resolved author names. For instance, we were able to resolve the user ID hash61baaeba8de136d9c1aa9c18ec3860e8 to the user name camster.
42 alexg 2006-12-26T02:03:08.605006+00 metabolism42 alexg 2006-12-26T02:03:08.605006+00 networks42 alexg 2006-12-26T02:03:08.605006+00 systems_biology42 barry 2005-06-24T01:22:12.696806+01 small_world42 barry 2005-06-24T01:22:12.696806+01 wireing_digrams42 camster 2004-11-04T02:25:05.373798+00 barabasi42 camster 2004-11-04T02:25:05.373798+00 ecoli42 camster 2004-11-04T02:25:05.373798+00 metabolism42 camster 2004-11-04T02:25:05.373798+00 networks42 tny 2006-06-02T18:02:00.510405+01 metabolism42 tny 2006-06-02T18:02:00.510405+01 network43 OriginalLurch 2007-05-11T16:47:11.366525+01 no-tag43 adepace 2007-01-16T19:45:20.535288+00 key--regulatory_network43 adepace 2007-01-16T19:45:20.535288+00 key--robustness43 adepace 2007-01-16T19:45:20.535288+00 key--systems_biology43 adepace 2007-01-16T19:45:20.535288+00 type--review43 anatiferous 2006-12-01T16:02:59.704955+00 robustness
ARTICLEID
USERNAME
TIMESTAMP TAG
Figure A.2: The same small subset of the CiteULike data dump from Figure A.1 afteraligning the user names with the hashed IDs. The columns from left to right contain thearticle IDs, user names. time stamps, and tags.
A.2 Spam Annotation
Figure A.3 illustrates the straightforward interface we created for the spam annotation pro-cess. For each user it randomly selects a maximum of five articles and displays the articletitle (if available) and the associated tags. It also shows a link to the CiteULike page ofthe article. Preliminary analysis showed that articles that were clearly spam were usuallyalready removed by CiteULike and returned a 404 Not Found error. We therefore instructedour judges to check the CiteULike links if a user’s spam status was not obvious from thedisplayed articles. Missing article pages meant users should be marked as spam. In thisprocess, we assumed that although spam users might add real articles to their profile in anattempt to evade detection, real dedicated CiteULike users would never willingly add spamarticles to their profile. Finally, we noticed that spam content was injected into CiteULikein many different languages. From the experience of the annotators, most spam was inEnglish, but considerable portions were in Spanish, Swedish, and German. Other languagesin which spam content was found were, among others, Dutch, Finnish, Chinese, and Italian.
Of the 5,200 users in our subset, 3,725 (or 28.4%) were spam users, which is a muchsmaller proportion than in the BibSonomy system, but still a considerable part of the entiredata set. The numbers in Table 7.1 are reported for this 20% sample of CiteULike users. It islikely that such a sizable chunk of spam can have a significant effect on the recommendationperformance. We test this hypothesis about the influence of spam in Section 7.4.

Appendix A. Collecting the CiteULike Data Set 194
Figure A.3: A screenshot of the interface used to annotate a subset of CiteULike users aspossible spam users. The user in the screenshot is a typical example of a spammer. Forevery user, we display up to five randomly selected posts with the article title and theassigned tags.

AP
PE
ND
IX BGLOSSARY OF RECOMMENDATION RUNS
In this appendix we list the run names used in Chapter 4 with a brief explanation for theconvenience of the reader in Tables B.1 and B.2.
Table B.1: Run names used in Chapter 4.
Run name Run description
U-BIN-SIM User-based CF using binary vectors from the ratings matrix R andcosine similarity (Subsection 4.3.1).
U-BIN-IDF-SIM User-based CF using tf·idf-weighted vectors from the ratings matrix Rand cosine similarity (Subsection 4.3.1).
I-BIN-SIM Item-based CF using binary vectors from the ratings matrix R andcosine similarity (Subsection 4.3.1).
I-BIN-IDF-SIM Item-based CF using tf·idf-weighted vectors from the ratings matrixR and cosine similarity (Subsection 4.3.1).
UT-JACCARD-SIM User-based CF using binary vectors from the UT matrix and Jaccardoverlap (Subsection 4.4.1).
UT-DICE-SIM User-based CF using binary vectors from the UT matrix and Dice’scoefficient (Subsection 4.4.1).
UT-BIN-SIM User-based CF using binary vectors from the UT matrix and cosinesimilarity (Subsection 4.4.1).
UT-TF-SIM User-based CF using tag frequency vectors from the UT matrix andcosine similarity (Subsection 4.4.1).
UT-TFIDF-SIM User-based CF using tf·idf-weighted tag frequency vectors from theUT matrix and cosine similarity (Subsection 4.4.1).
IT-JACCARD-SIM Item-based CF using binary vectors from the IT matrix and Jaccardoverlap (Subsection 4.4.1).
IT-DICE-SIM Item-based CF using binary vectors from the IT matrix and Dice’scoefficient (Subsection 4.4.1).
195

Appendix B. Glossary of Recommendation Runs 196
Table B.2: Run names used in Chapter 4 (continued).
Run name Run description
IT-BIN-SIM Item-based CF using binary vectors from the IT matrix and co-sine similarity (Subsection 4.4.1).
IT-TF-SIM Item-based CF using tag frequency vectors from the IT matrixand cosine similarity (Subsection 4.4.1).
IT-TFIDF-SIM Item-based CF using tf·idf-weighted tag frequency vectors fromthe IT matrix and cosine similarity (Subsection 4.4.1).
U-TF-SIM User-based CF using frequency vectors from the ratings matrixR and cosine similarity (Subsection 4.4.2).
U-TFIDF-SIM User-based CF using tf·idf-weighted frequency vectors from theratings matrix R and cosine similarity (Subsection 4.4.2).
I-TF-SIM Item-based CF using frequency vectors from the ratings matrixR and cosine similarity (Subsection 4.4.2).
I-TFIDF-SIM Item-based CF using tf·idf-weighted frequency vectors from theratings matrix R and cosine similarity (Subsection 4.4.2).
User-based fusion User-based CF using fused user-user similarities (Subsection4.4.3).
Item-based fusion Item-based CF using fused item-item similarities (Subsection4.4.3).
U-TSO-SUTTER-SIM User-based CF using tag frequency vectors from the combinedR|UI matrix and cosine similarity (Subsection 4.6.1).
I-TSO-SUTTER-SIM Item-based CF using tag frequency vectors from the combinedR|ITT matrix and cosine similarity (Subsection 4.6.1).
Tag-aware fusion Weighted combination of U-TSO-SUTTER-SIM and I-TSO-SUTTER-SIM runs (Subsection 4.6.1).
Random walk model Random walk model according to Clements et al. (2008a) (Sub-section 4.6.2).

AP
PE
ND
IX COPTIMAL FUSION WEIGHTS
In this appendix we list the optimal run weights for the ten weighted fusion experimentsdescribed in Chapter 6. We list the optimal weights for each of our four data sets separatelyin Tables C.2 through C.5. Table C.1 lists the IDs we use to refer to the individual runs inthose four tables.
Table C.1: Run IDs used in Tables C.2–C.5.
Run ID Run description
R1 Best user-based run based on usage similarity (from Section 4.3)R2 Best item-based run based on usage similarity (from Section 4.3)R3 Best user-based run based on tag overlap similarity (from Subsection 4.4.1)R4 Best item-based run based on tag overlap similarity (from Subsection 4.4.1)R5 Best profile-centric run based on metadata (from Subsection 5.2.1)R6 Best post-centric run based on metadata (from Subsection 5.2.1)R7 Best user-based run based on metadata (from Subsection 5.2.2)R8 Best item-based run based on metadata (from Subsection 5.2.2)
197

Appendix C. Optimal Fusion Weights 198
Table C.2: Optimal fusion weights for the different fusion experiments on the Bibsonomybookmarks data set.
Run ID Method R1 R2 R3 R4 R5 R6 R7 R8
Fusion AWeighted CombSUM 0.3 1.0 - - - - - -Weighted CombMNZ 0.3 1.0 - - - - - -Weighted CombANZ 0.2 1.0 - - - - - -
Fusion BWeighted CombSUM - - 0.4 1.0 - - - -Weighted CombMNZ - - 0.4 0.8 - - - -Weighted CombANZ - - 0.4 0.9 - - - -
Fusion CWeighted CombSUM 0.5 - - 0.7 - - - -Weighted CombMNZ 0.2 - - 0.8 - - - -Weighted CombANZ 0.3 - - 0.8 - - - -
Fusion DWeighted CombSUM - - - - 1.0 0.1 - -Weighted CombMNZ - - - - 1.0 0.1 - -Weighted CombANZ - - - - 0.9 1.0 - -
Fusion EWeighted CombSUM - - - - - - 0.5 0.7Weighted CombMNZ - - - - - - 0.1 0.9Weighted CombANZ - - - - - - 0.7 1.0
Fusion FWeighted CombSUM - - - - 1.0 - - 0.4Weighted CombMNZ - - - - 0.5 - - 0.2Weighted CombANZ - - - - 0.1 - - 0.9
Fusion GWeighted CombSUM - - - 0.5 0.7 - - -Weighted CombMNZ - - - 0.2 0.9 - - -Weighted CombANZ - - - 1.0 0.2 - - -
Fusion HWeighted CombSUM 0.3 0.9 0.4 0.8 - - - -Weighted CombMNZ 0.2 1.0 0.3 1.0 - - - -Weighted CombANZ 0.1 1.0 0.2 0.4 - - - -
Fusion IWeighted CombSUM - - - - 0.3 0.1 0.5 0.7Weighted CombMNZ - - - - 0.3 0.4 0.2 0.8Weighted CombANZ - - - - 0.3 0.4 0.2 1.0
Fusion JWeighted CombSUM 0.3 0.8 0.3 0.6 0.9 0.8 0.0 0.8Weighted CombMNZ 0.5 0.7 0.4 1.0 0.9 0.4 0.0 0.7Weighted CombANZ 0.2 0.6 0.2 0.8 0.0 0.9 0.6 1.0

Appendix C. Optimal Fusion Weights 199
Table C.3: Optimal fusion weights for the different fusion experiments on the Deliciousbookmarks data set.
Run ID Method R1 R2 R3 R4 R5 R6 R7 R8
Fusion AWeighted CombSUM 0.6 1.0 - - - - - -Weighted CombMNZ 0.9 0.9 - - - - - -Weighted CombANZ 1.0 0.9 - - - - - -
Fusion BWeighted CombSUM - - 0.0 1.0 - - - -Weighted CombMNZ - - 0.0 1.0 - - - -Weighted CombANZ - - 0.0 0.9 - - - -
Fusion CWeighted CombSUM 0.1 - - 1.0 - - - -Weighted CombMNZ 0.0 - - 0.9 - - - -Weighted CombANZ 0.1 - - 1.0 - - - -
Fusion DWeighted CombSUM - - - - 0.0 0.9 - -Weighted CombMNZ - - - - 0.0 0.7 - -Weighted CombANZ - - - - 0.0 0.9 - -
Fusion EWeighted CombSUM - - - - - - 1.0 0.8Weighted CombMNZ - - - - - - 1.0 0.0Weighted CombANZ - - - - - - 0.4 1.0
Fusion FWeighted CombSUM - - - - - 0.9 0.6 -Weighted CombMNZ - - - - - 0.7 0.2 -Weighted CombANZ - - - - - 1.0 0.5 -
Fusion GWeighted CombSUM - - - 0.9 - - 0.0 -Weighted CombMNZ - - - 0.9 - - 0.0 -Weighted CombANZ - - - 1.0 - - 0.1 -
Fusion HWeighted CombSUM 0.2 0.3 0.1 0.6 - - - -Weighted CombMNZ 0.0 0.3 0.0 0.9 - - - -Weighted CombANZ 0.4 0.3 0.1 1.0 - - - -
Fusion IWeighted CombSUM - - - - 0.0 0.6 0.4 0.9Weighted CombMNZ - - - - 0.0 0.7 0.5 0.9Weighted CombANZ - - - - 0.2 0.9 0.2 0.9
Fusion JWeighted CombSUM 0.2 0.5 0.1 0.7 0.1 0.5 0.0 0.2Weighted CombMNZ 0.7 0.9 0.2 1.0 0.2 0.9 0.1 0.9Weighted CombANZ 0.8 0.8 0.2 0.5 0.0 1.0 0.4 0.9

Appendix C. Optimal Fusion Weights 200
Table C.4: Optimal fusion weights for the different fusion experiments on the Bibsonomyarticles data set.
Run ID Method R1 R2 R3 R4 R5 R6 R7 R8
Fusion AWeighted CombSUM 0.9 0.2 - - - - - -Weighted CombMNZ 0.9 0.2 - - - - - -Weighted CombANZ 0.8 0.5 - - - - - -
Fusion BWeighted CombSUM - - 0.1 0.7 - - - -Weighted CombMNZ - - 0.0 1.0 - - - -Weighted CombANZ - - 0.1 0.9 - - - -
Fusion CWeighted CombSUM 1.0 - - 0.7 - - - -Weighted CombMNZ 1.0 - - 0.4 - - - -Weighted CombANZ 0.3 - - 0.8 - - - -
Fusion DWeighted CombSUM - - - - 0.9 0.3 - -Weighted CombMNZ - - - - 0.9 0.3 - -Weighted CombANZ - - - - 0.1 1.0 - -
Fusion EWeighted CombSUM - - - - - - 0.1 0.9Weighted CombMNZ - - - - - - 0.0 0.9Weighted CombANZ - - - - - - 0.1 0.7
Fusion FWeighted CombSUM - - - - 0.8 - - 0.5Weighted CombMNZ - - - - 0.8 - - 0.5Weighted CombANZ - - - - 0.1 - - 1.0
Fusion GWeighted CombSUM - - - 0.7 - - - 1.0Weighted CombMNZ - - - 0.0 - - - 0.9Weighted CombANZ - - - 1.0 - - - 0.7
Fusion HWeighted CombSUM 1.0 0.2 0.1 0.7 - - - -Weighted CombMNZ 0.8 0.6 0.0 0.2 - - - -Weighted CombANZ 0.4 0.4 0.1 0.7 - - - -
Fusion IWeighted CombSUM - - - - 0.8 0.2 0.1 0.3Weighted CombMNZ - - - - 0.7 0.6 0.1 1.0Weighted CombANZ - - - - 0.1 0.5 0.1 0.8
Fusion JWeighted CombSUM 1.0 0.1 0.4 0.4 1.0 0.4 0.0 0.9Weighted CombMNZ 0.9 0.3 1.0 0.9 0.5 0.0 0.2 1.0Weighted CombANZ 0.6 0.4 0.6 0.8 0.1 0.9 0.2 1.0

Appendix C. Optimal Fusion Weights 201
Table C.5: Optimal fusion weights for the different fusion experiments on the CiteULikebookmarks data set.
Run ID Method R1 R2 R3 R4 R5 R6 R7 R8
Fusion AWeighted CombSUM 0.2 0.8 - - - - - -Weighted CombMNZ 0.1 0.6 - - - - - -Weighted CombANZ 0.1 1.0 - - - - - -
Fusion BWeighted CombSUM - - 0.2 0.8 - - - -Weighted CombMNZ - - 0.1 0.7 - - - -Weighted CombANZ - - 0.1 0.6 - - - -
Fusion CWeighted CombSUM - 0.7 - 0.4 - - - -Weighted CombMNZ - 1.0 - 0.4 - - - -Weighted CombANZ - 0.7 - 0.9 - - - -
Fusion DWeighted CombSUM - - - - 1.0 0.2 - -Weighted CombMNZ - - - - 1.0 0.2 - -Weighted CombANZ - - - - 0.0 1.0 - -
Fusion EWeighted CombSUM - - - - - - 0.1 0.9Weighted CombMNZ - - - - - - 0.1 1.0Weighted CombANZ - - - - - - 0.1 0.8
Fusion FWeighted CombSUM - - - - 0.7 - - 0.5Weighted CombMNZ - - - - 1.0 - - 0.4Weighted CombANZ - - - - 0.1 - - 0.9
Fusion GWeighted CombSUM - 1.0 - - 0.7 - - -Weighted CombMNZ - 1.0 - - 0.7 - - -Weighted CombANZ - 1.0 - - 0.1 - - -
Fusion HWeighted CombSUM 0.3 0.8 0.0 1.0 - - - -Weighted CombMNZ 0.1 0.8 0.0 0.5 - - - -Weighted CombANZ 0.1 0.9 0.0 0.5 - - - -
Fusion IWeighted CombSUM - - - - 1.0 0.1 0.1 0.3Weighted CombMNZ - - - - 0.8 0.2 0.1 0.1Weighted CombANZ - - - - 0.0 0.9 0.1 0.9
Fusion JWeighted CombSUM 0.4 1.0 0.3 0.7 1.0 0.5 0.0 0.7Weighted CombMNZ 0.4 1.0 0.1 0.2 0.2 0.8 0.0 0.1Weighted CombANZ 0.3 1.0 0.6 1.0 0.1 1.0 0.4 1.0


AP
PE
ND
IX DDUPLICATE ANNOTATION IN CITEULIKE
Figure D.1: Screenshot of the interface for judging duplicate CiteULike pairs. The examplepair in the screenshot is a typical example of a duplicate pair. For each article in the pair,we display the hyperlinked article ID pointing to the CiteULike article page, the article title,the publication year, and the author(s).
After obtaining a training set of 2,777 pairs as described in Subsection 8.3.1, we needed todetermine which of these pairs were duplicates and which were different items. Figure D.1shows the simple interface we created for duplicate annotation. The seed item is shown atthe top with its item ID, title, year, and author metadata and the same metadata fields areshown at the bottom of the screen for the matched item. The annotator can then judge the
203

Appendix D. Duplicate Annotation in CiteULike 204
articles to be ‘the same’ or ‘different’. The article IDs are linked to their CiteULike articlepages for easy reference.

LIST OF FIGURES
2.1 Two examples of user-item matrices . . . . . . . . . . . . . . . . . . . . . . . . . . 112.2 Ingwersen’s nested context model for information seeking . . . . . . . . . . . . 182.3 Aspects of Human-Recommender Interaction . . . . . . . . . . . . . . . . . . . . 202.4 Broad vs narrow folksonomy . . . . . . . . . . . . . . . . . . . . . . . . . . . . . . 252.5 Visualization of the social graph . . . . . . . . . . . . . . . . . . . . . . . . . . . . 262.6 Navigation on a social bookmarking website . . . . . . . . . . . . . . . . . . . . 29
3.1 Screenshot of a user’s profile page in CiteULike . . . . . . . . . . . . . . . . . . . 413.2 Screenshot of a user’s profile page in BibSonomy . . . . . . . . . . . . . . . . . . 433.3 Screenshot of a user’s profile page in Delicious . . . . . . . . . . . . . . . . . . . 453.4 Example of the usage representation format . . . . . . . . . . . . . . . . . . . . . 463.5 Example of the metadata representation format . . . . . . . . . . . . . . . . . . 473.6 Visualization of our 10-fold cross-validation setup . . . . . . . . . . . . . . . . . 51
4.1 Representing the folksonomy graph as a 3D matrix . . . . . . . . . . . . . . . . 564.2 Deriving tagging information at the user level and the item level . . . . . . . . 574.3 Fusing the usage-based and tag-based similarity matrices . . . . . . . . . . . . 694.4 Extending the user-item matrix for tag-aware fusion . . . . . . . . . . . . . . . 774.5 Construction of the random walk transition matrix . . . . . . . . . . . . . . . . 79
5.1 Visualization of our profile-centric matching algorithm . . . . . . . . . . . . . . 895.2 Visualization of our post-centric matching algorithm . . . . . . . . . . . . . . . 915.3 Visualization of our user-based hybrid filtering algorithm . . . . . . . . . . . . 925.4 Visualization of our item-based hybrid filtering algorithm . . . . . . . . . . . . 93
7.1 Examples of clean and spam posts in our SGML representation . . . . . . . . . 1317.2 Two variants of our spam detection approach . . . . . . . . . . . . . . . . . . . . 1347.3 ROC curves of best-performing spam detection approaches . . . . . . . . . . . 1377.4 User level differences in AP scores with regard to spam . . . . . . . . . . . . . . 143
8.1 Distribution of the duplicates over the different seed items. . . . . . . . . . . . 1538.2 Example instances from our duplicate detection training set . . . . . . . . . . . 1548.3 Visualization of our popularity blocking scheme for duplicate identification . 1578.4 Example duplicate graph patterns . . . . . . . . . . . . . . . . . . . . . . . . . . . 1588.5 Visualizing the identified duplicates . . . . . . . . . . . . . . . . . . . . . . . . . . 1598.6 Popularity of the CiteULike items before and after deduplication . . . . . . . . 160
205

List of Figures 206
8.7 User level differences in AP scores with regard to deduplication . . . . . . . . 163
9.1 An overview of possible research tasks on social bookmarking websites . . . . 175
A.1 A small subset of a CiteULike data dump . . . . . . . . . . . . . . . . . . . . . . . 191A.2 A small subset of a CiteULike data dump with the proper user names . . . . . 193A.3 Screenshot of the spam annotation interface for CiteULike . . . . . . . . . . . . 194
D.1 Screenshot of the interface for judging duplicate CiteULike pairs . . . . . . . . 203
LIST OF TABLES
2.1 Tag categorization scheme according tag function . . . . . . . . . . . . . . . . . 22
3.1 Statistics of the four data sets used in our experiments . . . . . . . . . . . . . . 403.2 Statistics of the filtered versions of our data sets . . . . . . . . . . . . . . . . . . 49
4.1 Results of the popularity-based baseline . . . . . . . . . . . . . . . . . . . . . . . 594.2 Results of the k-Nearest Neighbor algorithm . . . . . . . . . . . . . . . . . . . . 644.3 Results of the k-NN algorithm with tag overlap similarities . . . . . . . . . . . . 714.4 Results of the k-NN algorithm with tagging intensity similarities . . . . . . . . 714.5 Results of the k-NN algorithm with similarity fusion . . . . . . . . . . . . . . . . 724.6 Results of the tag-aware and random walk approaches . . . . . . . . . . . . . . 81
5.1 Metadata categorization and distribution over the four data sets. . . . . . . . . 875.2 Results of the two content-based filtering approaches . . . . . . . . . . . . . . . 965.3 Results of the two hybrid filtering approaches . . . . . . . . . . . . . . . . . . . . 975.4 Results comparison with folksonomic recommendation . . . . . . . . . . . . . . 99
6.1 A taxonomy of recommender system combination methods . . . . . . . . . . . 1086.2 An overview of our fusion experiments . . . . . . . . . . . . . . . . . . . . . . . . 1156.3 Results of our fusion experiments . . . . . . . . . . . . . . . . . . . . . . . . . . . 1166.4 Fusion analysis results . . . . . . . . . . . . . . . . . . . . . . . . . . . . . . . . . . 1186.5 Comparison of different fusion approaches . . . . . . . . . . . . . . . . . . . . . 119
7.1 Spam statistics of the BibSonomy and CiteULike data sets . . . . . . . . . . . . 1297.2 Results of spam detection on BibSonomy and CiteULike . . . . . . . . . . . . . 1377.3 Basic statistics of our spam-extended BibSonomy bookmarks data set . . . . . 1417.4 The influence of spam on recommendation performance . . . . . . . . . . . . . 142
8.1 Similarity features used in duplicate detection . . . . . . . . . . . . . . . . . . . 1548.2 List of parameters optimized for the SVM classifier . . . . . . . . . . . . . . . . 1558.3 Results of duplicate classification on the training set . . . . . . . . . . . . . . . . 1588.4 Results of deduplicating the entire CiteULike data set . . . . . . . . . . . . . . . 1588.5 Basic statistics of our deduplicated CiteULike data set . . . . . . . . . . . . . . . 1618.6 The influence of duplicate items on recommendation performance . . . . . . . 162
A.1 Statistics of the user alignment process . . . . . . . . . . . . . . . . . . . . . . . . 192
207

List of Tables 208
B.1 Run names used in Chapter 4 . . . . . . . . . . . . . . . . . . . . . . . . . . . . . . 195B.2 Run names used in Chapter 4 (continued) . . . . . . . . . . . . . . . . . . . . . . 196
C.1 Run IDs used in Tables C.2–C.5 . . . . . . . . . . . . . . . . . . . . . . . . . . . . . 197C.2 Optimal fusion weights for Bibsonomy bookmarks data set . . . . . . . . . . . 198C.3 Optimal fusion weights for Delicious bookmarks data set . . . . . . . . . . . . . 199C.4 Optimal fusion weights for Bibsonomy articles data set . . . . . . . . . . . . . . 200C.5 Optimal fusion weights for CiteULike bookmarks data set . . . . . . . . . . . . 201

LIST OF ABBREVIATIONS
AUC Area Under the CurveCAPTCHA Completely Automated Public Turing test to tell Computers and
Humans ApartCBR Case-Based ReasoningCF Collaborative FilteringDOI Digital Object IdentifierGBCF Graph-Based Collaborative FilteringHRI Human-Recommender InteractionHTML Hyper-Text Markup LanguageIB Item-Based filteringIF Information FilteringIMA Information Management AssistantIR Information RetrievalISBN International Standard Book NumberISSN International Standard Serial NumberIT Information TechnologyKL Kullback-Leibler divergenceMAP Mean Average PrecisionMRR Mean Reciprocal RankPDF Portable Document FormatPLSA Probabilistic Latent Semantic AnalysisROC Receiver-Operator CharacteristicSGML Standard Generalized Markup LanguageSSI Set of Similar ItemsSSU Set of Similar UsersSVM Support Vector MachineTBCF Tag-Based Collaborative FilteringTIBCF Tagging Intensity-Based Collaborative FilteringTOBCF Tag Overlap-Based Collaborative FilteringTREC Text REtrieval ConferenceUB User-Based filteringUCOV User COVerageURL Uniform Resource Locator
209


SUMMARY
Under the label of Web 2.0, the past decade has seen a genuine and fundamental changein the way people interact with and through the World Wide Web. One of its prominentfeatures is a shift in information access and creation from local and solitary, to global andcollaborative. Social bookmarking websites such as Delicious and CiteULike are a clear casein point of this shift: instead of keeping a local copy of pointers to favorite URLs or sci-entific articles, users can instead store and access their bookmarks online through a Webinterface. The underlying system then makes all stored information shareable among users.In addition to this functionality, most social bookmarking services also offer the user the op-portunity to describe the content they added to their personal profile with keywords. Thesekeywords, commonly referred to as tags, are an addition to e.g. the title and summarymetadata commonly used to annotate content, and improve the access and retrievability ofa user’s own bookmarked Web pages. These tags are then made available to all users, manyof whom have annotated many of the same Web pages with possibly overlapping tags. Thissocial tagging results in a rich network of users, bookmarks, and tags, commonly referred toas a folksonomy.
As social bookmarking systems become more popular, they need effective access methodsto help users locate all the interesting content present in those systems. One such type oftechnology are recommender systems, which are a form of personalized information filteringtechnology used to identify sets of items that are likely to be of interest to a certain user,using a variety of information sources. In this thesis, we investigate how recommendersystems can be applied to the domain of social bookmarking to recommend interestingand relevant Web pages and scientific articles to the user, based on two main informationsources about the user and the items: usage data and metadata. The former represent thepast selections and transactions of all users, while the latter describe the resources on asocial bookmarking website with e.g. titles, descriptions, authorship, tags, and temporaland publication-related metadata. These two characteristic information sources of socialbookmarking lead us to formulate the following problem statement for this thesis:
How can we utilize the characteristics of social bookmarking websites to producethe best possible item recommendations for users?
211

Summary 212
We start in Chapter 2 by providing the reader with an overview of the general relatedwork on recommender systems. We give a historical overview, describe the most importantapproaches and specific discuss related approaches to recommending Web pages and scien-tific articles. We discuss the history of social tagging and its applications, and we give anoverview of the history and structure of social bookmarking websites.
Chapter 3 describes our research methodology. We define the recommendation task we aretrying to solve, and introduce our four data sets and their collection process. We also discussour experimental setup, from data pre-processing and filtering to our choice of evaluationmetrics.
In Chapter 4 we investigate the first of two important characteristics of social bookmarkingsystems: the presence of the folksonomy. We focus on using the tags present in the folkson-omy of social bookmarking systems, which describe the content of an item and can thereforebe used in determining the similarity between two objects. We extend a standard nearest-neighbor collaborative filtering algorithm with different tag similarity metrics. We find that,because of reduced sparsity, the performance of item-based filtering can be improved byusing the item similarities based on the overlap in the tags assigned to those items. User-based filtering is not helped by using tag overlap similarities. We find that it is easier torecommend scientific articles than bookmarks. We also examine merging different types ofsimilarity with inconclusive results, and compared our algorithms with two state-of-the-artapproaches. We conclude that tags can be used successfully to improve performance.
In Chapter 5, we investigate the usefulness of item metadata in recommendation process,the other characteristic of social bookmarking websites, and examine how we can usethis metadata to improve recommendation performance. We propose four different algo-rithms, divided into two classes: two content-based filtering approaches and two hybridapproaches. In content-based filtering, a profile-centric approach, where all of the meta-data assigned by a user is matched against metadata representations of the items, worksbetter than matching posts with each other because of sparseness issues. We also comparetwo hybrid CF approaches that use the metadata representations to calculate the user anditem similarities. Here, we find that item-based filtering with the metadata-derived similar-ities works best. What the best overall metadata-based algorithm is, is dependent on thedata set. We also find that the quality of the metadata is as important to performance as thesparsity of the metadata field. Depending on the data set, metadata-based recommendationworks as well as folksonomic recommendation or better.
Chapter 6 describes our experiments with combining the different recommendation algo-rithms from the previous chapters. We compared weighted and unweighted methods ofcombining the predictions of different algorithms and find that weighted fusion is superiorto unweighted fusion. The best results are achieved by fusing the results of recommendationalgorithms and representations that touch upon different aspects of the item recommenda-tion process.
In addition to the recommendation experiments described in Chapters 4 through 6, wealso examine two specific growing pains that accompany the increasing popularity of socialbookmarking websites. Chapter 7 examines the problem of spam for two of our collections,and find they contain large amounts of spam, ranging from 30% to 93% of all users marked

Summary 213
as spammers. We show that it is possible to train a classifier to automatically detect spamusers in a social bookmarking system, by comparing all of the metadata they have addedtogether to the metadata added by genuine users and by other spammers. We also examinethe influence of spam on recommendation performance and find that spam has a negativeeffect on recommendation. The influence of spam depends on the recommendation algo-rithm, but all result lists are unacceptably polluted with spam items, proving the necessityof adequate spam detection techniques.
Chapter 8 examines the problem of duplicate content, i.e. when users accidentally and care-lessly add Web pages or scientific articles that are already present in the system. We examineone of our data sets to quantify the problem of duplicate content. We construct a trainingset and train a duplicate identification classifier which found a small percentage of dupli-cates. We find that these duplicate items follow a Zipfian distribution with a long tail, just asregular items do, which means that certain duplicates can be quite widespread. Finally, weexamine the influence of duplicates on recommendation performance by creating a dedu-plicated version of our data set. We two different recommendation algorithms, but do notfind any clear effect of deduplication on recommendation.


SAMENVATTING
Onder de noemer Web 2.0 is er in de afgelopen jaren een fundamentele verandering op-getreden in de manier waarop mensen met elkaar communiceren en interageren op en viahet World Wide Web. Een van de meest prominente eigenschappen hiervan is een verschui-ving in de toegang tot informatie van lokaal en individueel tot globaal en collaboratief.Zogenaamde social bookmarking diensten als Delicious en CiteULikezijn hier een duidelijkvoorbeeld van. Social bookmarking websites staan hun gebruikers toe om hun favorietewebpagina’s or wetenschappelijke artikelen online op te slaan en te beheren middels eenweb-interface, in plaats van deze ‘bookmarks’ lokaal in een browser op te slaan. Het onder-liggende systeem maakt dan alle opgeslagen informatie toegankelijk voor alle gebruikers.Naast deze functionaliteit bieden de meeste social bookmarking diensten de gebruiker ookde mogelijk om de objecten te beschrijven die ze aan hun profiel hebben toegevoegd te be-schrijven met steekwoorden. Deze steekwoorden worden ook wel tags genoemd en vormeneen aanvulling bovenop de gebruikelijke metadata zoals titel en samenvatting. Tags kun-nen gebruikt worden om de bookmarks van een gebruiker te categoriseren en verhogen detoegang tot en de hervindbaarheid van de bookmarks. De tags die een gebruiker toekent,worden beschikbaar gemaakt voor alle gebruikers, waarvan velen dezelfde webpagina’s toehebben gevoegd met mogelijkerwijs overlappende tags. Dit zogenaamde social tagging fe-nomeen leidt tot het onstaan van een rijk netwerk van gebruikers, bookmarks en tags, ookwel een folksonomie genoemd.
De groei in populariteit van social bookmarking systemen brengt een behoefte met zichmee aan effectieve methoden en technieken waarmee gebruikers nieuwe en interessanteinhoud kunnen vinden in dit soort systemen. Een voorbeeld van dit soort technologie wordtgevormd door recommendersystemen, die het filteren van informatie personaliseren voorde gebruiker en op die manier die objecten kunnen identificeren die voor de gebruikerinteressant zouden kunnen zijn. Dit soort suggesties kunnen gebaseerd worden op eenverscheidenheid aan informatiebronnen. In dit proefschrift wordt onderzocht hoe recom-mendersystemen toegepast kunnen worden op het domein van social bookmarking om in-teressante webpagina’s en wetenschappelijke artikelen aan te raden aan gebruikers. Dezesuggesties worden gegenereerd op basis van twee informatiebronnen over de gebruikers ende objecten: gebruiksinformatie en metadata. Gebruiksinformatie biedt een overzicht vande transacties en selecties die gebruikers in het verleden hebben uitgevoerd, d.w.z. welkeobjecten hebben ze toegevoegd aan hun profiel en met welke tags? Metadata beschrijft
215

Samenvatting 216
de objecten op een social bookmarking website met bijvoorbeeld informatie over titels, sa-menvattingen of auteursschap en met tags en tijds- en publicatiegerelateerde informatie.Deze twee voor social bookmarking karakteristieke informatiebronnen brengen ons ertoede volgende probleemstelling te formuleren:
Hoe kunnen we het beste de karakteristieken van social bookmarking websites be-nutten om de beste mogelijke suggesties te genereren voor gebruikers van dit soortsystemen?
We beginnen ons onderzoek in Hoofdstuk 2, waar we de lezer een historisch overzicht bie-den van recommendersystemen. We beschrijven de belangrijkste aanpakken en gaan dieperin op gerelateerde werk aan systemen die webpagina’s of artikelen kunnen voorstellen aangebruikers. We beschrijven ook de geschiedenis van social tagging en haar toepassingen enwe geven een overzicht van de historie en de structuur van social bookmarking websites.
In Hoofdstuk 3 wordt de methodologie beschreven die in onze experimenten gevolgd wordt.We preciseren de taak die we willen vervullen en introduceren de vier datasets waarop onzeexperimenten zijn gebaseerd. We bespreken tevens onze experimentele opzet, van het voor-bewerken van onze data en het filteren ervan, tot onze keuze voor de juiste evaluatieme-trieken.
Hoofdstuk 4 onderzoekt de eerste van de twee eerdergenoemde belangrijke karakteristie-ken van social bookmarking systemen: de aanwezigheid van een folksonomie. Voor hetbepalen van de overeenkomst tussen objecten of gebruikers richten we ons op de tags waar-mee gebruikers de inhoud van objecten beschrijven. We breiden met succes een standaardgeheugengebaseerd recommendation algoritme uit met verschillende ‘similarity’ metriekengebaseerd op tag-overlap. Een vergelijking met bestaande algoritmes toont aan dat onzeaanpak competitief is hiermee.
In Hoofstuk 5 onderzoeken we het nut van het gebruiken van object metadata in het aan-raden van webpagina’s en wetenschappelijke artikelen. We presenteren vier verschillendealgoritmes die deze informatiebron gebruiken om suggesties te genereren. Welk algoritmehet beste werkt is afhankelijk van de data set en domein, maar uit onze experimenten blijktdat de kwaliteit van de toegewezen metadata net zo belangrijk is voor de prestaties van dealgoritmes als de schaarste van de beschikbare metadatavelden. Vergeleken met recommen-dation op basis van de folksonomie werken bepaalde algoritmes gebaseerd op metadata netzo goed of beter.
In Hoofdstuk 6 beschrijven we experimenten waarin we de verschillende algoritmes uit devoorgaande hoofdstukken combineren. We vergelijken gewogen en ongewogen methodenom de voorspellingen van de verschillende algoritmes te combineren; gewogen combinatieblijkt de meest veelbelovende fusiemethode te zijn. De beste resultaten worden behaalddoor het fuseren van verschillende algoritmes en objectrepresentaties die zoveel mogelijkverschillende aspecten van het recommendation-proces benadrukkken.
Naast de experimenten in Hoofdstuk 4 tot en met 6 onderzoeken we tevens twee specifiekeproblemen waar snelgroeiende social bookmarking websites mee te maken kunnen krijgen.

Samenvatting 217
In hoofdstuk 7 onderzoeken we of spam een groot probleem is voor twee van onze datasets.Met een percentage tussen de 30% en 93% aan spammers blijkt dit een veelvoorkomendprobleem te zijn. We tonen aan dat het mogelijk is om een classificatiealgoritme te trainendat automatisch spammers kan detecteren door de door hen toegewezen metadata te verge-lijken met die van echte gebruikers en andere spammers. We constateren verder dat spameen negatieve invloed heeft op het aanraden van interessante webpagina’s voor gebruikers,Alhoewel de invloed afhankelijk is van het gekozen recommendation-algoritme, wordende lijsten met gesuggereerde webpagina’s onacceptabel vervuild met spam. Dit toont denoodzaak aan van effective technieken voor het detecteren van spam.
Hoofdstuk 8 onderzoekt tenslotte het probleem van duplicate content, d.w.z. objecten die perongeluk dubbel toegevoegd worden aan een social bookmarking systeem door gebruikers.We onderzoeken een van onze datasets om een beeld van dit probleem te krijgen en merkendat, alhoewel de meeste duplicaten slechts enkele keren voorkomen, bepaalde duplicatentamelijk populair kunnen worden. Daarnaast creëren we een trainingsset om een automa-tisch classificatiealgoritme te trainen dat dubbele objecten kan leren herkennen. Tenslotteonderzoeken we de invloed van duplicate content op de recommendation-algoritmes, maarvinden hier geen sterk effect op de uiteindelijke prestaties.


CURRICULUM VITAE
Toine Bogers was born in Roosendaal, the Netherlands, on the 21st of September, 1979.After graduating high school at Gertrudiscollege in Roosendaal in 1997, he started studyingInformation Management at Tilburg University and obtained his M.A. degree in 2001. HisM.A. thesis was about a comparison of major Web service frameworks. In 2002, he startedhis studies in Computational Linguistics & AI at Tilburg University; two years later, he ob-tained a second M.A. degree. His second M.A. thesis was about the optimization of a namedentity recognizer for Dutch.
In December 2004, he joined the Induction of Linguistic Knowledge group at Tilburg Uni-versity as a Ph.D. student under the supervision of Antal van den Bosch. Funded by Senter-Novem and the Dutch Ministry of Economic Affairs as part of the IOP-MMI À Propos project,the goal of this project was to develop an adaptive, personalized, just-in-time knowledgemanagement environment for members of professional workgroups, which supports themin writing documents and test its usability in actual offices. The project was carried out incollaboration with the University of Nijmegen and Intelli-Gent. The focus of Toine’s workwas on the personalization and recommendation of relevant document by the informationagent.
In addition, Toine worked on expert search with researchers of the ILPS group at the Univer-sity of Amsterdam, which culminated in the development and adoption of a university-wideexpert search engine for Tilburg University. Another project was developing a system forrecommendation related news articles for the website of the Dutch newspaper Trouw. In2008, Toine spent two and a half months working as a guest researcher at the Royal Schoolof Library and Information Science in Copenhagen, Denmark.
As of October 2009, Toine has been working at the Royal School of Library and InformationScience in Copenhagen, Denmark. His research interests include recommender systems, en-terprise search, information retrieval, intelligent multimedia information systems (contentanalysis, retrieval, and personalization).
219


PUBLICATIONS
The investigations performed during my Ph.D. research resulted in the following publica-tions.
• K. Hofmann, K. Balog, T. Bogers, and M. de Rijke. Contextual Factors for Similar ExpertFinding. To appear in Journal of the American Society for Information Science, 2010.
• T. Bogers and A. van den Bosch. Collaborative and Content-based Filtering for Item Recom-mendation on Social Bookmarking Websites. To appear in Proceedings of the ACM RecSys ’09workshop on Recommender Systems and the Social Web, 2009.
• R. Liebregts and T. Bogers. Design and Implementation of a University-wide Expert SearchEngine. In M. Boughanem et al., editors, Proceedings of the 31st European Conference onInformation Retrieval (ECIR 2009), volume 5478 of Lecture Notes in Computer Science, pages587–594, 2009.
• T. Bogers and A. van den Bosch. Using Language Modeling for Spam Detection in SocialReference Manager Websites. In R. Aly et al., editors, Proceedings of the 9th Belgian-DutchInformation Retrieval Workshop (DIR 2009), pages 87–94, 2009.
• T. Bogers and A. van den Bosch. Recommending Scientific Articles using CiteULike. In RecSys’08: Proceedings of the 2008 ACM Conference on Recommender Systems, pages 287–290. 2008.
• T. Bogers and A. van den Bosch. Using Language Models for Spam Detection in Social Book-marking. In Proceedings of 2008 ECML/ PKDD Discovery Challenge Workshop, pages 1–12,2008.
• A. van den Bosch and T. Bogers. Efficient Context-Sensitive Word Completion for MobileDevices. In MobileHCI 2008: Proceedings of the 10th International Conference on Human-Computer Interaction with Mobile Devices and Services, IOP-MMI special track, pages 465–470,2008.
• K. Hofmann, K. Balog, T. Bogers, and M. de Rijke. Integrating Contextual Factors into Topic-centric Retrieval Models for Finding Similar Experts. In Proceedings of ACM SIGIR 2008 Work-shop on Future Challenges in Expert Retrieval, pages 29–36, 2008.
• M.C. Puerta Melguizo, O. Muñoz Ramos, L. Boves, T. Bogers, and A. van den Bosch. A Person-alized Recommender System for Writing in the Internet Age. In Proceedings of the LREC 2008workshop on Natural Language Processing Resources, Algorithms, and Tools for Authoring Aids,2008.
221
Publications 222
• T. Bogers, K. Kox, and A. van den Bosch. Using Citation Analysis for Finding Experts inWorkgroups. In E. Hoenkamp et al., editors, Proceedings of the 8th Belgian-Dutch InformationRetrieval Workshop (DIR 2008), pages 21–28, 2008.
• T. Bogers and A. van den Bosch. Comparing and Evaluating Information Retrieval Algorithmsfor News Recommendation. In RecSys ’07: Proceedings of the 2007 ACM Conference on Recom-mender Systems, pages 141–144, 2007.
• K. Balog, T. Bogers, L. Azzopardi, M. de Rijke, and A. van den Bosch. Broad Expertise Re-trieval in Sparse Data Environments. In C. Clarke et al., editors, SIGIR ’07: Proceedings of the30th Annual International ACM SIGIR Conference on Research and Development in InformationRetrieval, pages 551–558, 2007.
• T. Bogers, W. Thoonen and A. van den Bosch. Expertise Classification: Collaborative Classifi-cation vs. Automatic Extraction. In J.T. Tennis et al., editors, Proceedings of the 17th ASIS&TSIG/CR workshop on Social Classification, 2006.
• T. Bogers. À Propos: Pro-Active Personalization for Professional Document Writing (longabstract). In I. Ruthven et al., editors, Proceedings of the First IIiX Symposium on InformationInteraction in Context (IIiX 2006), page 303, 2006.
• S. Canisius, T. Bogers, A. van den Bosch, J. Geertzen, and E. Tjong Kim Sang. DependencyParsing by Inference over High-recall Dependency Predictions. In Proceedings of the TenthConference on Computational Natural Language Learning (CoNLL-X), 2006.
• T. Bogers and A. van den Bosch. Authoritative Re-ranking of Search Results. In M. Lalmas etal., editors, Proceedings of the 28th European Conference on Information Retrieval (ECIR 2006),volume 3936 of Lecture Notes in Computer Science, pages 519–522, 2006.
• T. Bogers and A. van den Bosch. Authoritative Re-ranking in Fusing Authorship-based Sub-collection Search Results. In Franciska de Jong and Wessel Kraaij, editors, Proceedings of theSixth Belgian- Dutch Information Retrieval Workshop (DIR 2006), pages 49–55, 2006.
• E. Tjong Kim Sang, S. Canisius, A. van den Bosch, and T. Bogers. Applying Spelling ErrorCorrection Techniques for Improving Semantic Role Labelling. In Proceedings of the NinthConference on Natural Language Learning (CoNLL-2005), 2005.

SIKS DISSERTATION SERIES
1998
1 Johan van den Akker (CWI1) DEGAS - An Active,Temporal Database of Autonomous Objects
2 Floris Wiesman (UM) Information Retrieval byGraphically Browsing Meta-Information
3 Ans Steuten (TUD) A Contribution to the LinguisticAnalysis of Business Conversations within the Lan-guage/Action Perspective
4 Dennis Breuker (UM) Memory versus Search inGames
5 Eduard W. Oskamp (RUL) Computerondersteuningbij Straftoemeting
1999
1 Mark Sloof (VU) Physiology of Quality ChangeModelling; Automated Modelling of Quality Changeof Agricultural Products
2 Rob Potharst (EUR) Classification using DecisionTrees and Neural Nets
3 Don Beal (UM) The Nature of Minimax Search4 Jacques Penders (UM) The Practical Art of Moving
Physical Objects5 Aldo de Moor (KUB) Empowering Communities: A
Method for the Legitimate User-Driven Specificationof Network Information Systems
6 Niek J.E. Wijngaards (VU) Re-Design of Composi-tional Systems
7 David Spelt (UT) Verification Support for ObjectDatabase Design
8 Jacques H.J. Lenting (UM) Informed Gambling:Conception and Analysis of a Multi-Agent Mecha-nism for Discrete Reallocation
2000
1 Frank Niessink (VU) Perspectives on ImprovingSoftware Maintenance
2 Koen Holtman (TU/e) Prototyping of CMS StorageManagement
3 Carolien M.T. Metselaar (UvA) Sociaal-organisatorische Gevolgen van Kennistechnologie;een Procesbenadering en Actorperspectief
4 Geert de Haan (VU) ETAG, A Formal Model of Com-petence Knowledge for User Interface Design
5 Ruud van der Pol (UM) Knowledge-Based QueryFormulation in Information Retrieval
6 Rogier van Eijk (UU) Programming Languages forAgent Communication
7 Niels Peek (UU) Decision-Theoretic Planning ofClinical Patient Management
8 Veerle Coupé (EUR) Sensitivity Analyis of Decision-Theoretic Networks
9 Florian Waas (CWI) Principles of ProbabilisticQuery Optimization
10 Niels Nes (CWI) Image Database Management Sys-tem Design Considerations, Algorithms and Archi-tecture
11 Jonas Karlsson (CWI) Scalable Distributed DataStructures for Database Management
2001
1 Silja Renooij (UU) Qualitative Approaches to Quan-tifying Probabilistic Networks
2 Koen Hindriks (UU) Agent Programming Lan-guages: Programming with Mental Models
1Abbreviations: SIKS - Dutch Research School for Information and Knowledge Systems; CWI - Centrum voorWiskunde en Informatica, Amsterdam; EUR - Erasmus Universiteit, Rotterdam; KUB - Katholieke UniversiteitBrabant, Tilburg; KUN - Katholieke Universiteit Nijmegen; OU - Open Universiteit; RUL - Rijksuniversiteit Lei-den; RUN - Radboud Universiteit Nijmegen; TUD - Technische Universiteit Delft; TU/e - Technische UniversiteitEindhoven; UL - Universiteit Leiden; UM - Universiteit Maastricht; UT - Universiteit Twente, Enschede; UU -Universiteit Utrecht; UvA - Universiteit van Amsterdam; UvT - Universiteit van Tilburg; VU - Vrije Universiteit,Amsterdam.
223

SIKS Dissertation Series 224
3 Maarten van Someren (UvA) Learning as ProblemSolving
4 Evgueni Smirnov (UM) Conjunctive and DisjunctiveVersion Spaces with Instance-Based Boundary Sets
5 Jacco van Ossenbruggen (VU) Processing Struc-tured Hypermedia: A Matter of Style
6 Martijn van Welie (VU) Task-Based User InterfaceDesign
7 Bastiaan Schonhage (VU) Diva: Architectural Per-spectives on Information Visualization
8 Pascal van Eck (VU) A Compositional SemanticStructure for Multi-Agent Systems Dynamics
9 Pieter Jan ’t Hoen (RUL) Towards Distributed De-velopment of Large Object-Oriented Models, Viewsof Packages as Classes
10 Maarten Sierhuis (UvA) Modeling and Simulat-ing Work Practice BRAHMS: a Multiagent Modelingand Simulation Language for Work Practice Analy-sis and Design
11 Tom M. van Engers (VU) Knowledge Management:The Role of Mental Models in Business Systems De-sign
2002
1 Nico Lassing (VU) Architecture-Level ModifiabilityAnalysis
2 Roelof van Zwol (UT) Modelling and SearchingWeb-based Document Collections
3 Henk Ernst Blok (UT) Database Optimization As-pects for Information Retrieval
4 Juan Roberto Castelo Valdueza (UU) The DiscreteAcyclic Digraph Markov Model in Data Mining
5 Radu Serban (VU) The Private Cyberspace Model-ing Electronic Environments Inhabited by Privacy-Concerned Agents
6 Laurens Mommers (UL) Applied Legal Epistemol-ogy; Building a Knowledge-based Ontology of theLegal Domain
7 Peter Boncz (CWI) Monet: A Next-GenerationDBMS Kernel For Query-Intensive Applications
8 Jaap Gordijn (VU) Value Based Requirements Engi-neering: Exploring Innovative E-Commerce Ideas
9 Willem-Jan van den Heuvel (KUB) Integrat-ing Modern Business Applications with ObjectifiedLegacy Systems
10 Brian Sheppard (UM) Towards Perfect Play ofScrabble
11 Wouter C.A. Wijngaards (VU) Agent Based Mod-elling of Dynamics: Biological and OrganisationalApplications
12 Albrecht Schmidt (UvA) Processing XML inDatabase Systems
13 Hongjing Wu (TU/e) A Reference Architecture forAdaptive Hypermedia Applications
14 Wieke de Vries (UU) Agent Interaction: AbstractApproaches to Modelling, Programming and Verify-ing Multi-Agent Systems
15 Rik Eshuis (UT) Semantics and Verification of UMLActivity Diagrams for Workflow Modelling
16 Pieter van Langen (VU) The Anatomy of Design:Foundations, Models and Applications
17 Stefan Manegold (UvA) Understanding, Model-ing, and Improving Main-Memory Database Perfor-mance
2003
1 Heiner Stuckenschmidt (VU) Ontology-Based In-formation Sharing in Weakly Structured Environ-ments
2 Jan Broersen (VU) Modal Action Logics for Reason-ing About Reactive Systems
3 Martijn Schuemie (TUD) Human-Computer Inter-action and Presence in Virtual Reality ExposureTherapy
4 Milan Petkovic (UT) Content-Based Video RetrievalSupported by Database Technology
5 Jos Lehmann (UvA) Causation in Artificial Intelli-gence and Law – A Modelling Approach
6 Boris van Schooten (UT) Development and Specifi-cation of Virtual Environments
7 Machiel Jansen (UvA) Formal Explorations ofKnowledge Intensive Tasks
8 Yong-Ping Ran (UM) Repair-Based Scheduling9 Rens Kortmann (UM) The Resolution of Visually
Guided Behaviour10 Andreas Lincke (UT) Electronic Business Negotia-
tion: Some Experimental Studies on the Interactionbetween Medium, Innovation Context and Cult
11 Simon Keizer (UT) Reasoning under Uncertaintyin Natural Language Dialogue using Bayesian Net-works
12 Roeland Ordelman (UT) Dutch Speech Recognitionin Multimedia Information Retrieval
13 Jeroen Donkers (UM) Nosce Hostem – Searchingwith Opponent Models
14 Stijn Hoppenbrouwers (KUN) Freezing Language:Conceptualisation Processes across ICT-SupportedOrganisations
15 Mathijs de Weerdt (TUD) Plan Merging in Multi-Agent Systems
16 Menzo Windhouwer (CWI) Feature Grammar Sys-tems - Incremental Maintenance of Indexes to DigitalMedia Warehouse
17 David Jansen (UT) Extensions of Statecharts withProbability, Time, and Stochastic Timing
18 Levente Kocsis (UM) Learning Search Decisions
2004
1 Virginia Dignum (UU) A Model for OrganizationalInteraction: Based on Agents, Founded in Logic
2 Lai Xu (UvT) Monitoring Multi-party Contracts forE-business

SIKS Dissertation Series 225
3 Perry Groot (VU) A Theoretical and Empirical Anal-ysis of Approximation in Symbolic Problem Solving
4 Chris van Aart (UvA) Organizational Principles forMulti-Agent Architectures
5 Viara Popova (EUR) Knowledge Discovery andMonotonicity
6 Bart-Jan Hommes (TUD) The Evaluation of Busi-ness Process Modeling Techniques
7 Elise Boltjes (UM) VoorbeeldIG Onderwijs; Voor-beeldgestuurd Onderwijs, een Opstap naar AbstractDenken, vooral voor Meisjes
8 Joop Verbeek (UM) Politie en de Nieuwe Inter-nationale Informatiemarkt, Grensregionale PolitiëleGegevensuitwisseling en Digitale Expertise
9 Martin Caminada (VU) For the Sake of the Argu-ment; Explorations into Argument-based Reasoning
10 Suzanne Kabel (UvA) Knowledge-rich Indexing ofLearning-objects
11 Michel Klein (VU) Change Management for Dis-tributed Ontologies
12 The Duy Bui (UT) Creating Emotions and Facial Ex-pressions for Embodied Agents
13 Wojciech Jamroga (UT) Using Multiple Models ofReality: On Agents who Know how to Play
14 Paul Harrenstein (UU) Logic in Conflict. Logical Ex-plorations in Strategic Equilibrium
15 Arno Knobbe (UU) Multi-Relational Data Mining16 Federico Divina (VU) Hybrid Genetic Relational
Search for Inductive Learning17 Mark Winands (UM) Informed Search in Complex
Games18 Vania Bessa Machado (UvA) Supporting the Con-
struction of Qualitative Knowledge Models19 Thijs Westerveld (UT) Using generative probabilis-
tic models for multimedia retrieval20 Madelon Evers (Nyenrode) Learning from Design:
facilitating multidisciplinary design teams
2005
1 Floor Verdenius (UvA) Methodological Aspects ofDesigning Induction-Based Applications
2 Erik van der Werf (UM) AI techniques for the gameof Go
3 Franc Grootjen (RUN) A Pragmatic Approach to theConceptualisation of Language
4 Nirvana Meratnia (UT) Towards Database Supportfor Moving Object data
5 Gabriel Infante-Lopez (UvA) Two-Level Probabilis-tic Grammars for Natural Language Parsing
6 Pieter Spronck (UM) Adaptive Game AI7 Flavius Frasincar (TU/e) Hypermedia Presentation
Generation for Semantic Web Information Systems8 Richard Vdovjak (TU/e) A Model-driven Approach
for Building Distributed Ontology-based Web Appli-cations
9 Jeen Broekstra (VU) Storage, Querying and Infer-encing for Semantic Web Languages
10 Anders Bouwer (UvA) Explaining Behaviour: UsingQualitative Simulation in Interactive Learning Envi-ronments
11 Elth Ogston (VU) Agent Based Matchmaking andClustering - A Decentralized Approach to Search
12 Csaba Boer (EUR) Distributed Simulation in Indus-try
13 Fred Hamburg (UL) Een Computermodel voor hetOndersteunen van Euthanasiebeslissingen
14 Borys Omelayenko (VU) Web-Service configurationon the Semantic Web; Exploring how semanticsmeets pragmatics
15 Tibor Bosse (VU) Analysis of the Dynamics of Cog-nitive Processes
16 Joris Graaumans (UU) Usability of XML Query Lan-guages
17 Boris Shishkov (TUD) Software Specification Basedon Re-usable Business Components
18 Danielle Sent (UU) Test-selection strategies forprobabilistic networks
19 Michel van Dartel (UM) Situated Representation20 Cristina Coteanu (UL) Cyber Consumer Law, State
of the Art and Perspectives21 Wijnand Derks (UT) Improving Concurrency and
Recovery in Database Systems by Exploiting Appli-cation Semantics
2006
1 Samuil Angelov (TU/e) Foundations of B2B Elec-tronic Contracting
2 Cristina Chisalita (VU) Contextual issues in the de-sign and use of information technology in organiza-tions
3 Noor Christoph (UvA) The role of metacognitiveskills in learning to solve problems
4 Marta Sabou (VU) Building Web Service Ontologies5 Cees Pierik (UU) Validation Techniques for Object-
Oriented Proof Outlines6 Ziv Baida (VU) Software-aided Service Bundling -
Intelligent Methods & Tools for Graphical ServiceModeling
7 Marko Smiljanic (UT) XML schema matching – bal-ancing efficiency and effectiveness by means of clus-tering
8 Eelco Herder (UT) Forward, Back and Home Again- Analyzing User Behavior on the Web
9 Mohamed Wahdan (UM) Automatic Formulation ofthe Auditor’s Opinion
10 Ronny Siebes (VU) Semantic Routing in Peer-to-Peer Systems
11 Joeri van Ruth (UT) Flattening Queries over NestedData Types
12 Bert Bongers (VU) Interactivation - Towards ane-cology of people, our technological environment,and the arts

SIKS Dissertation Series 226
13 Henk-Jan Lebbink (UU) Dialogue and DecisionGames for Information Exchanging Agents
14 Johan Hoorn (VU) Software Requirements: Update,Upgrade, Redesign - towards a Theory of Require-ments Change
15 Rainer Malik (UU) CONAN: Text Mining in theBiomedical Domain
16 Carsten Riggelsen (UU) Approximation Methodsfor Efficient Learning of Bayesian Networks
17 Stacey Nagata (UU) User Assistance for Multitask-ing with Interruptions on a Mobile Device
18 Valentin Zhizhkun (UvA) Graph transformation forNatural Language Processing
19 Birna van Riemsdijk (UU) Cognitive Agent Pro-gramming: A Semantic Approach
20 Marina Velikova (UvT) Monotone models for pre-diction in data mining
21 Bas van Gils (RUN) Aptness on the Web22 Paul de Vrieze (RUN) Fundaments of Adaptive Per-
sonalisation23 Ion Juvina (UU) Development of Cognitive Model
for Navigating on the Web24 Laura Hollink (VU) Semantic Annotation for Re-
trieval of Visual Resources25 Madalina Drugan (UU) Conditional log-likelihood
MDL and Evolutionary MCMC26 Vojkan Mihajlovic (UT) Score Region Algebra: A
Flexible Framework for Structured Information Re-trieval
27 Stefano Bocconi (CWI) Vox Populi: generatingvideo documentaries from semantically annotatedmedia repositories
28 Borkur Sigurbjornsson (UvA) Focused InformationAccess using XML Element Retrieval
2007
1 Kees Leune (UvT) Access Control and Service-Oriented Architectures
2 Wouter Teepe (RUG) Reconciling Information Ex-change and Confidentiality: A Formal Approach
3 Peter Mika (VU) Social Networks and the SemanticWeb
4 Jurriaan van Diggelen (UU) Achieving Semantic In-teroperability in Multi-agent Systems: a dialogue-based approach
5 Bart Schermer (UL) Software Agents, Surveillance,and the Right to Privacy: a Legislative Frameworkfor Agent-enabled Surveillance
6 Gilad Mishne (UvA) Applied Text Analytics for Blogs7 Natasa Jovanovic’ (UT) To Whom It May Concern -
Addressee Identification in Face-to-Face Meetings8 Mark Hoogendoorn (VU) Modeling of Change in
Multi-Agent Organizations9 David Mobach (VU) Agent-Based Mediated Service
Negotiation
10 Huib Aldewereld (UU) Autonomy vs. Conformity:an Institutional Perspective on Norms and Protocols
11 Natalia Stash (TU/e) Incorporating Cogni-tive/Learning Styles in a General-Purpose AdaptiveHypermedia System
12 Marcel van Gerven (RUN) Bayesian Networks forClinical Decision Support: A Rational Approach toDynamic Decision-Making under Uncertainty
13 Rutger Rienks (UT) Meetings in Smart Environ-ments; Implications of Progressing Technology
14 Niek Bergboer (UM) Context-Based Image Analysis15 Joyca Lacroix (UM) NIM: a Situated Computa-
tional Memory Model16 Davide Grossi (UU) Designing Invisible Handcuffs.
Formal investigations in Institutions and Organiza-tions for Multi-agent Systems
17 Theodore Charitos (UU) Reasoning with DynamicNetworks in Practice
18 Bart Orriens (UvT) On the development and man-agement of adaptive business collaborations
19 David Levy (UM) Intimate relationships with artifi-cial partners
20 Slinger Jansen (UU) Customer Configuration Up-dating in a Software Supply Network
21 Karianne Vermaas (UU) Fast diffusion and broad-ening use: A research on residential adoption andusage of broadband internet in the Netherlands be-tween 2001 and 2005
22 Zlatko Zlatev (UT) Goal-oriented design of valueand process models from patterns
23 Peter Barna (TU/e) Specification of ApplicationLogic in Web Information Systems
24 Georgina Ramírez Camps (CWI) Structural Fea-tures in XML Retrieval
25 Joost Schalken (VU) Empirical Investigations inSoftware Process Improvement
2008
1 Katalin Boer-Sorbán (EUR) Agent-Based Simula-tion of Financial Markets: A modular, continuous-time approach
2 Alexei Sharpanskykh (VU) On Computer-AidedMethods for Modeling and Analysis of Organizations
3 Vera Hollink (UvA) Optimizing hierarchical menus:a usage-based approach
4 Ander de Keijzer (UT) Management of UncertainData - towards unattended integration
5 Bela Mutschler (UT) Modeling and simulatingcausal dependencies on process-aware informationsystems from a cost perspective
6 Arjen Hommersom (RUN) On the Application ofFormal Methods to Clinical Guidelines, an ArtificialIntelligence Perspective
7 Peter van Rosmalen (OU) Supporting the tutor inthe design and support of adaptive e-learning
8 Janneke Bolt (UU) Bayesian Networks: Aspects ofApproximate Inference

SIKS Dissertation Series 227
9 Christof van Nimwegen (UU) The paradox of theguided user: assistance can be counter-effective
10 Wauter Bosma (UT) Discourse oriented Summa-rization
11 Vera Kartseva (VU) Designing Controls for NetworkOrganizations: a Value-Based Approach
12 Jozsef Farkas (RUN) A Semiotically oriented Cogni-tive Model of Knowledge Representation
13 Caterina Carraciolo (UvA) Topic Driven Access toScientific Handbooks
14 Arthur van Bunningen (UT) Context-Aware Query-ing; Better Answers with Less Effort
15 Martijn van Otterlo (UT) The Logic of Adaptive Be-havior: Knowledge Representation and Algorithmsfor the Markov Decision Process Framework in First-Order Domains
16 Henriette van Vugt (VU) Embodied Agents from aUser’s Perspective
17 Martin Op’t Land (TUD) Applying Architecture andOntology to the Splitting and Allying of Enterprises
18 Guido de Croon (UM) Adaptive Active Vision19 Henning Rode (UT) From document to entity re-
trieval: improving precision and performance of fo-cused text search
20 Rex Arendsen (UvA) Geen bericht, goed bericht.Een onderzoek naar de effecten van de introductievan elektronisch berichtenverkeer met een overheidop de administratieve lasten van bedrijven
21 Krisztian Balog (UvA) People search in the enter-prise
22 Henk Koning (UU) Communication of IT-architecture
23 Stefan Visscher (UU) Bayesian network models forthe management of ventilator-associated pneumonia
24 Zharko Aleksovski (VU) Using background knowl-edge in ontology matching
25 Geert Jonker (UU) Efficient and Equitable exchangein air traffic management plan repair using spender-signed currency
26 Marijn Huijbregts (UT) Segmentation, diarizationand speech transcription: surprise data unraveled
27 Hubert Vogten (OU) Design and implementationstrategies for IMS learning design
28 Ildiko Flesh (RUN) On the use of independence re-lations in Bayesian networks
29 Dennis Reidsma (UT) Annotations and subjectivemachines- Of annotators, embodied agents, users,and other humans
30 Wouter van Atteveldt (VU) Semantic network anal-ysis: techniques for extracting, representing andquerying media content
31 Loes Braun (UM) Pro-active medical informationretrieval
32 Trung B. Hui (UT) Toward affective dialogue man-agement using partially observable markov decisionprocesses
33 Frank Terpstra (UvA) Scientific workflow design;theoretical and practical issues
34 Jeroen de Knijf (UU) Studies in Frequent Tree Min-ing
35 Benjamin Torben-Nielsen (UvT) Dendritic mor-phology: function shapes structure
2009
1 Rasa Jurgelenaite (RUN) Symmetric Causal Inde-pendence Models
2 Willem Robert van Hage (VU) EvaluatingOntology-Alignment Techniques
3 Hans Stol (UvT) A Framework for Evidence-basedPolicy Making Using IT
4 Josephine Nabukenya (RUN) Improving the Qual-ity of Organisational Policy Making using Collabo-ration Engineering
5 Sietse Overbeek (RUN) Bridging Supply and De-mand for Knowledge Intensive Tasks - Based onKnowledge, Cognition, and Quality
6 Muhammad Subianto (UU) Understanding Classi-fication
7 Ronald Poppe (UT) Discriminative Vision-Based Re-covery and Recognition of Human Motion
8 Volker Nannen (VU) Evolutionary Agent-Based Pol-icy Analysis in Dynamic Environments
9 Benjamin Kanagwa (RUN) Design, Discovery andConstruction of Service-oriented Systems
10 Jan Wielemaker (UvA) Logic programming forknowledge-intensive interactive applications
11 Alexander Boer (UvA) Legal Theory, Sources of Law& the Semantic Web
12 Peter Massuthe (TU/e, Humboldt-Universtät zuBerlin) Operating Guidelines for Services
13 Steven de Jong (UM) Fairness in Multi-Agent Sys-tems
14 Maksym Korotkiy (VU) From ontology-enabled ser-vices to service-enabled ontologies (making ontolo-gies work in e-science with ONTO-SOA)
15 Rinke Hoekstra (UvA) Ontology Representation -Design Patterns and Ontologies that Make Sense
16 Fritz Reul (UvT) New Architectures in ComputerChess
17 Laurens van der Maaten (UvT) Feature Extractionfrom Visual Data
18 Fabian Groffen (CWI) Armada, An EvolvingDatabase System
19 Valentin Robu (CWI) Modeling Preferences, Strate-gic Reasoning and Collaboration in Agent-MediatedElectronic Markets
20 Bob van der Vecht (UU) Adjustable Autonomy:Controling Influences on Decision Making
21 Stijn Vanderlooy (UM) Ranking and Reliable Clas-sification
22 Pavel Serdyukov (UT) Search For Expertise: Goingbeyond direct evidence
23 Peter Hofgesang (VU) Modelling Web Usage in aChanging Environment
24 Annerieke Heuvelink (VU) Cognitive Models forTraining Simulations

SIKS Dissertation Series 228
25 Alex van Ballegooij (CWI) “RAM: Array DatabaseManagement through Relational Mapping"
26 Fernando Koch (UU) An Agent-Based Model for theDevelopment of Intelligent Mobile Services
27 Christian Glahn (OU) Contextual Support of socialEngagement and Reflection on the Web
28 Sander Evers (UT) Sensor Data Management withProbabilistic Models
29 Stanislav Pokraev (UT) Model-Driven Semantic In-tegration of Service-Oriented Applications
30 Marcin Zukowski (CWI) Balancing vectorized queryexecution with bandwidth-optimized storage
31 Sofiya Katrenko (UvA) A Closer Look at LearningRelations from Text
32 Rik Farenhorst and Remco de Boer (VU) Architec-tural Knowledge Management: Supporting Archi-tects and Auditors
33 Khiet Truong (UT) How Does Real Affect Affect Af-fect Recognition In Speech?
34 Inge van de Weerd (UU) Advancing in SoftwareProduct Management: An Incremental Method En-gineering Approach
35 Wouter Koelewijn (UL) Privacy en Politiegegevens;Over geautomatiseerde normatieve informatie-uitwisseling
36 Marco Kalz (OUN) Placement Support for Learnersin Learning Networks
37 Hendrik Drachsler (OUN) Navigation Support forLearners in Informal Learning Networks
38 Riina Vuorikari (OU) Tags and self-organisation: ametadata ecology for learning resources in a multi-lingual context
39 Christian Stahl (TUE, Humboldt-Universität zuBerlin) Service Substitution – A Behavioral Ap-proach Based on Petri Nets
40 Stephan Raaijmakers (UvT) Multinomial LanguageLearning: Investigations into the Geometry of Lan-guage
41 Igor Berezhnyy (UvT) Digital Analysis of Paintings42 Toine Bogers (UvT) Recommender Systems for So-
cial Bookmarking

TICC DISSERTATION SERIES
1. Pashiera BarkhuysenAudiovisual Prosody in InteractionPromotores: M.G.J. Swerts, E.J. KrahmerTilburg, 3 October 2008
2. Ben Torben-NielsenDendritic Morphology: Function Shapes StructurePromotores: H.J. van den Herik, E.O. PostmaCo-promotor: K.P. TuylsTilburg, 3 December 2008
3. Hans StolA Framework for Evidence-based Policy Making using ITPromotor: H.J. van den HerikTilburg, 21 January 2009
4. Jeroen GeertzenAct Recognition and Prediction. Explorations in Computational Dialogue ModellingPromotor: H.C. BuntCo-promotor: J.M.B. TerkenTilburg, 11 February 2009
5. Sander CanisiusStructural Prediction for Natural Language Processing: A Constraint SatisfactionApproachPromotores: A.P.J. van den Bosch, W.M.P. DaelemansTilburg, 13 February 2009
6. Fritz ReulNew Architectures in Computer ChessPromotor: H.J. van den HerikCo-promotor: J.H.W.M. UiterwijkTilburg, 17 June 2009
229

TiCC Dissertation Series 230
7. Laurens van der MaatenFeature Extraction from Visual DataPromotores: E.O. Postma, H.J. van den HerikCo-promotor: A.G. LangeTilburg, 23 June 2009
8. Stephan RaaijmakersMultinomial Language Learning: Investigations into the Geometry of LanguagePromotor: A.P.J. van den BoschTilburg, 1 December 2009
9. Igor BerezhnyyDigital Analysis of PaintingsPromotores: E.O. Postma, H.J. van den HerikTilburg, 7 December 2009
10. Toine BogersRecommender Systems for Social BookmarkingPromotor: A.P.J. van den BoschTilburg, 8 December 2009
Copyright © 2022 FDOKUMEN