A Comparative Evaluation of Recommender Systems for Hotel ...
17
SMU Data Science Review Volume 1 | Number 4 Article 1 2018 A Comparative Evaluation of Recommender Systems for Hotel Reviews Ryan Khaleghi Southern Methodist University, [email protected] Kevin Cannon Southern Methodist University, [email protected] Raghuram Srinivas Southern Methodist University, [email protected] Follow this and additional works at: hps://scholar.smu.edu/datasciencereview Part of the Artificial Intelligence and Robotics Commons , Other Computer Sciences Commons , and the eory and Algorithms Commons is Article is brought to you for free and open access by SMU Scholar. It has been accepted for inclusion in SMU Data Science Review by an authorized administrator of SMU Scholar. For more information, please visit hp://digitalrepository.smu.edu. Recommended Citation Khaleghi, Ryan; Cannon, Kevin; and Srinivas, Raghuram (2018) "A Comparative Evaluation of Recommender Systems for Hotel Reviews," SMU Data Science Review: Vol. 1 : No. 4 , Article 1. Available at: hps://scholar.smu.edu/datasciencereview/vol1/iss4/1 brought to you by CORE View metadata, citation and similar papers at core.ac.uk provided by Southern Methodist University
-
Upload
khangminh22 -
Category
Documents
-
view
1 -
download
0
Transcript of A Comparative Evaluation of Recommender Systems for Hotel ...

SMU Data Science Review
Volume 1 | Number 4 Article 1
2018
A Comparative Evaluation of RecommenderSystems for Hotel ReviewsRyan KhaleghiSouthern Methodist University, [email protected]
Kevin CannonSouthern Methodist University, [email protected]
Raghuram SrinivasSouthern Methodist University, [email protected]
Follow this and additional works at: https://scholar.smu.edu/datasciencereview
Part of the Artificial Intelligence and Robotics Commons, Other Computer Sciences Commons,and the Theory and Algorithms Commons
This Article is brought to you for free and open access by SMU Scholar. It has been accepted for inclusion in SMU Data Science Review by anauthorized administrator of SMU Scholar. For more information, please visit http://digitalrepository.smu.edu.
Recommended CitationKhaleghi, Ryan; Cannon, Kevin; and Srinivas, Raghuram (2018) "A Comparative Evaluation of Recommender Systems for HotelReviews," SMU Data Science Review: Vol. 1 : No. 4 , Article 1.Available at: https://scholar.smu.edu/datasciencereview/vol1/iss4/1
brought to you by COREView metadata, citation and similar papers at core.ac.uk
provided by Southern Methodist University

A Comparative Evaluation of RecommenderSystems for Hotel Reviews
Ryan Khaleghi, KevinCannon, and Raghuram Srinivas
Southern Methodist University, Dallas, TX 75275 USA
Abstract. There has been increasing growth in deployment of recom-mender systems across Internet sites, with various models being used.These systems have been particularly valuable for review sites, as theyseek to add value to the user experience to gain market share and tocreate new revenue streams through deals. Hotels are a prime target forthis effort, as there is a large number for most destinations and a lotof differentiation between them. In this paper, we present an evaluationof two of the most popular methods for hotel review recommender sys-tems: collaborative filtering and matrix factorization. The accuracy ofthese systems has become a focus, as more accurate recommendationscan lead to increases in profits through various means. Also, given therapid growth of big data, processing speed to calculate recommendationsis an important issue. Using hotel reviews from the TripAdvisor website,we measure the speed and accuracy of these two recommender systemmethods to determine which method is superior, or the trade-offs be-tween them. The result of the evaluation is a 10.58 times difference inspeed of the collaborative filtering method over the matrix factorizationrecommender system method, but with significantly better accuracy withthe matrix factorization method.
1 Introduction
Review websites have become an integral part of the online marketplace, oftenheavily influencing consumer behavior. If a consumer is traveling to a new orunfamiliar location, or even looking for a new type of experience, the internetis usually the first stop for information. Whether a consumer is looking for arestaurant, barber, or hotel, customer reviews can sway a potential customer’sopinion before they even step on the premises. Websites like TripAdvisor, whereusers can leave reviews for hotels, restaurants, and other tourist activities, arecommonplace for decision-making and contain ratings on various aspects of abusiness.
The landscape and conversation around business ratings and reputation man-agement has changed with the advent of technology. Consumer focus has shiftedfrom conventional rating systems to personalized ratings based on individualusers and their experiences, thanks to widespread access to the internet. Con-ventional ratings that were once in the hands of a select few have now given wayto consumer ratings, giving customers a say in driving future business success
1
Khaleghi et al.: A Comparative Evaluation of Recommender Systems for Hotel Reviews
Published by SMU Scholar, 2018

and reputation. This paradigm shift is reflected in statistics provided by TripAd-visor, where their site says that 60% of travelers worldwide use TripAdvisor fortravel planning, and 94% of users use a business with a rating of 4 or higher.
This change and accompanying explosion of data has resulted in continuingefforts to develop methods to process this data and monetize it. Processingthe text reviews into something machine interpretable, for example, has led todevelopment of text evaluation algorithms for sentiment analysis and naturallanguage processing. Monetizing the data has resulted in a feedback loop wheresites seek to engage users to provide content, such as ratings and reviews, butalso use it to suggest hotels or restaurants based on the data in those ratingsand reviews – all while selling ads and selling favorable placement in the displayof the suggestions. This has led to the development of recommender systems andthe algorithm and methods that allow them to function.
In this continuing development of recommender systems, numerous methodshave been developed and researched, including regression, matrix factorization,and collaborative filtering, among others. The challenge for any business or siteis then deciding what recommender system to implement. Obviously, accuraterecommendations are important to users, as poor suggestions will lead to usersgoing to another site. Speed is also a factor, as slowing down webpage loads whilethe machine learning algorithm works is not an acceptable solution in today’sinternet. It is difficult to determine what to use in order to maximize accuracy ofpredictions for users while managing the processing speed and complexity thatgoes with an ever-growing amount of data.
Hotels are a prime candidate for this analysis. There are a wide variety ofhotels, from bed and breakfasts to multinational chains, with a lot of segmen-tation in the market. There is also a large amount of data, even compared torestaurants, which are similarly reviewed. A hotel experience lasts much longerthan a dinner at a restaurant, and there are more facets of the experience toreview. Rather than just wait service and food quality, a hotel has a check inexperience, location, room quality, cleanliness, amenities, etc. Given this largeamount of feature-rich data available for hotels, hotel data is a prime candidatefor our examination. We selected a publically available dataset of hotel reviewsfrom the TripAdvisor website to use for our analysis.
In this paper, we will examine recommender systems using the Turi Createpackage, which includes multiple algorithms for said systems. In 2016, Applebought GraphLab Inc., a software company, and their machine learning softwarepackage GraphLab Create, and later released an updated version of GraphLabCreate as Turi Create. We will test the two most popular recommender systemmethods to determine which is superior, in terms of accuracy and speed, for hotelrecommendations, or what the trade-offs are between the two for each model.
2 Recommender Systems
Recommender systems are systems that seek to actively suggest items to a userby predicting a user’s rating or preference for different things and displaying
2
SMU Data Science Review, Vol. 1 [2018], No. 4, Art. 1
https://scholar.smu.edu/datasciencereview/vol1/iss4/1

those that the user prefers. A commonly seen example is the “Users who boughtthis also bought. . . ” feature on Amazon.com. They are frequently used on web-sites for suggesting items to purchase or services to use, including hotels. Rec-ommender systems can be effectively used to increase user satisfaction and salesby personalizing what is essentially advertising.
Many recommender system algorithms exist, from clustering methods, Bayes-ian classifiers, regression based methods, and more. Lee et al. [1] explored multi-ple algorithms, and found that performance differs substantially based on param-eters, such as number of users, number of items, and sparsity of the data. Theyfound that a method similar to Turi Create’s matrix factorization method, usingsingle value decomposition, was generally the most accurate, with the exceptionof very sparse datasets. At the time of their publishing, algorithms like TuriCreate’s collaborative filtering recommender were not in use. As the TripAdvi-sor data set is very sparse, we sought to compare this now-popular algorithmagainst the previous best-in-class.
Collaborative Filtering is a recommender system method that makes predic-tions for a user based on ratings and data from other users. The basic idea isthat two users who share the same opinions on some items will be more likelyto share opinions on other items. This can be extended to unknown items andpredict a user’s preference for items that they have not evaluated. As a useradds reviews or other opinions online, this data forms the basis for a profile thatwill be compared to others users’ profiles. The more data a user adds throughreviews, the better the predictive capability will be, as the profile can be morespecifically defined and compared to those of other users.
A key point in collaborative filtering in Turi Create is that the recommenda-tions are solely based on the user’s ratings. They do not include any “side data,”meaning any personal classifying information such as user age, location, etc. Inthe case of the hotel review dataset we are using, the only features that matterfor collaborative filtering are then the users’ ratings of hotels.
The item similarity recommender model in Turi Create computes the sim-ilarity between two hotels using the reviews of users who have reviewed bothhotels. The similarity between two hotels i and j, S(i, j), is calculated using theCosine similarity we used as
S(i, j) =
∑u∈Uij
ruiruj√∑u∈Ui
r2ui
√∑u∈Uj
r2uj
(1)
where Ui is the set of users who rated item i, Uj is the set of users who rateditem j, and Uij is the set of users who rated both item i and item j. Predictionsare then made, rating an item j for a user u using a weighted average of theuser’s ratings Iu with the equation
yuj =
∑i∈Iu
S(i, j)rui∑i∈Iu
S(i, j). (2)
3
Khaleghi et al.: A Comparative Evaluation of Recommender Systems for Hotel Reviews
Published by SMU Scholar, 2018

One of the drawbacks of collaborative filtering is the “cold start problem.”This is where, due to an inability to build an accurate user profile due to limiteduser data (such as few ratings), the recommendations may be poor. Until a userhas rated many hotels, as in the case of many users in this dataset, the predictivecapability may be weak. Research by Moshfeghi et al. [2] identify this as the mostimportant problem with the collaborative filtering method.
Matrix factorization is a recommender system method that makes predictionsfor a user based on combinations of users and items. The model learns latentfactors for each user/item, and uses them make predictions. Unlike collaborativefiltering, this model uses side data as part of its learning. As users review morehotels, as in our dataset, this changes the user/item combinations and latentfactors that will be used in the model. Users and items are represented by weightsand factors, where the weights account for a user or item’s bias towards lower orhigher ratings, and the factors model the interactions between users and items.For example, a hotel that is rated highly across many reviews would have ahigher weight, or a user who likes beach hotels and dislikes urban hotels wouldhave that reflected in the factors.
The Turi Create Matrix Factorization Recommender predicts a score as
score(i, j) = µ+ ωi + ωj + aTxi + bT yi + uivj (3)
where µ is a global bias term, ωi is the weight for user i, ωj is the weight foruser j, xi and yj are the user and item side feature vectors, and a and b are theweight vectors for those side features. The latent factors are ui and vj .
The model is trained by optimizing the equation
minw,a,b,v,U1
|D|=
∑i,j,rij∈D
L(score(i, j), rij)+λ1(||w||22+||a||22+||b||22)+λ2(||U ||22+||V ||22)
(4)where D is the dataset, rij is the rating that a use i gave to item j, U
is the set of the user’s latent factors and V is the item latent factors. λ1 isthe linear regularization parameter and λ2 is the regularization parameter. L isthe loss function, which is given by (y − y)2. The Turi Create model we usedcomputes two solvers and reports the best result. The two solvers are StochasticGradient Descent and Alternating Least Squares. This model in Turi Create is ageneralization of traditional Matrix Factorization, in that it learns latent factorsfor all variables, including side data, and not just user and item interactions.
3 Data
The TripAdvisor data set used was obtained from the Database and InformationSystems (DAIS) Laboratory at the University of Illinois at Urbana-Champaign[3, 4]. This dataset consists of over 1.5 Million reviews for 12,774 hotels, scrapedfrom the TripAdvisor.com website. The dataset reviews contain the user’s user-name, written review, and ratings for different aspects of each hotel room. The
4
SMU Data Science Review, Vol. 1 [2018], No. 4, Art. 1
https://scholar.smu.edu/datasciencereview/vol1/iss4/1

hotel and its location are also included. There are 9 aspect ratings: Overall, theoverall hotel rating that is aggregated and displayed on the hotel page; Value,the perceived value of the room for the cost; Rooms, the quality of the ho-tel rooms; Location, the rating of the hotel’s location (proximity to attractions,destinations, etc.); Cleanliness, a rating of how clean the hotel/rooms are; Checkin/Front desk, a rating for the hotel lobby and check-in process; Service, a mea-sure of the quality of the hotel’s service and staff; Sleep Quality, which measuresthe beds and sleep environment (noise, etc.); and Business Service, the rating forbusiness amenities (internet, conference rooms, etc.). While the Overall ratingis available to all users leaving a review, the other individual ratings have beenused or not at different times. At the time of this analysis, only Service, SleepQuality, and Cleanliness were available for users writing a hotel review.
Fig. 1. Boxplot of Overall and Aspect Ratings features
As we see from the aspect ratings boxplot and correlation matrix, the as-pect ratings for Business Service, Check In, and Sleep Quality are not stronglycorrelated to the Overall rating, and differ substantially in their distributions.Business Service and Check In have very few ratings in the data set. We expectedthat though these ratings are given individually, they would be correlated witheach and the Overall rating. Chua et al. [5] investigated the reliability of Tri-pAdvisor reviews and found that while text and scores usually were aligned, insome cases they found they were not. We did not implement a method of de-termining the reliability of the reviews, and as such, left the data that existed
5
Khaleghi et al.: A Comparative Evaluation of Recommender Systems for Hotel Reviews
Published by SMU Scholar, 2018

Fig. 2. Correlation Matrix of features
as-is. Previous work by Nilashi et al. [6] explored multi-criteria rating informa-tion, such as the aspect ratings side data in this dataset, and found that whileit can potentially be used to improve prediction accuracy, the sparseness andnoisiness of side data can prevent the realization of any accuracy improvements.We thus chose to replace missing data with the Overall score, as our focus is noton the absolute accuracy, but on the speed and relative accuracy of the mod-els. Replacing the missing values this way provided significantly more featuresand reduced sparseness, as many of the aspect ratings were missing. If there isan advantage to be gained from the inclusion of this data, we want to see thematrix factorization model use it, under the assumption that real-world modelswill collect and include this data.
4 Methods
4.1 Models and Data Loading
The models were built and tested using the Turi Create package from AppleInc.. The algorithms and math used in both packages is the same, with the mainchange being the addition of Apple’s CoreML functionality. Graphlab has beenextensively researched as a framework for machine learning by Low et al [7].
Due to computing challenges from loading and handling such a large dataset, two approaches were attempted. The first was to use Amazon Web Services
6
SMU Data Science Review, Vol. 1 [2018], No. 4, Art. 1
https://scholar.smu.edu/datasciencereview/vol1/iss4/1

(AWS) and hire a more powerful computing instance to run the analysis. Thiswas only able to be used for the written text review processing and analysis, andthe results are discussed below. As AWS does not have the type of operatingsystems available which Turi Create can be used with, it could not be used tobuild the recommender systems and compare them. The second approach, due topersonal computer constraints, was to sample 1000 hotels, import those reviews(averaging around 120,000 reviews for 1000 hotels), create and compare themodels, and repeat. The sampling method chosen was simple random samplingwithout replacement. This iterative process was repeated 10 times and the resultsrecorded.
This approach was applied to two different tests. For the first, we simplyprocessed the 1000 hotels and models, and recorded the results, as above. Forthe second, we wanted to examine the cold start problem, and did so by filteringthe data set on the reviewers. Since the cold start problem is that users with fewreviews are poorly matched, we first decided to remove any grouped, anonymousreviews, such as those by “A TripAdvisor member,” as the model would thinkthey are one user with a wide variety of tastes, since it uses the UserID forscoring. Next, we filtered out the users with only 1 review. This left us with adata set we then split in two: one group with exactly 2 written reviews, andone group with more than 2 reviews. We then processed the models, recordedthe results, and compared them to both each other and to the original unfilteredanalysis, to determine if having 2 reviews was enough to improve RMSE, or weremore reviews needed.
4.2 Written Text Reviews
The written text reviews pose an interesting challenge, as they require someprocessing to be used in a recommender system. Much research has been doneon using only the written text reviews, processing them, and building a modelfrom this processed data, such as Leung et al. [8] using sentiment analysis intheir approach. Other analyses simply remove the written text reviews beforebuilding the models, but this previous work by Liu et al. shows that processingof the written text and inclusion in the model can improve accuracy.
In order to include them in the model, we processed them using sklearns’sTDF-IDF Vectorizer, then classified them to an aspect rating using a LinearSupport Vector Machine (SVM). The SVM was chosen as previous researchfrom Chen et al. [9], Xia et al. [10], and Duvvur [11] shows that this providesbetter accuracy than other models. This TF-IDF Vectorization process was usedeffectively by Liu et al. [12] to predict Overall scores from review text, but itwas not incorporated with the rest of the data into a model like ours. The TF-IDF (term-frequency inverse document-frequency) Vectorizer is a bag of wordsmethod of handling text. The words are weighted using the TF-IDF method,where words are re-weighted according to the multiple of the term-frequencyand inverse-document frequency. The TF, IDF, and TF-IDF are defined as:
7
Khaleghi et al.: A Comparative Evaluation of Recommender Systems for Hotel Reviews
Published by SMU Scholar, 2018

idf(t) = log(Totalnumberofdocuments
Numberofdocumentswithtermtinit) (5)
tf(t) =Numberoftimestermtappearsindocuments
Totalnumberoftermsinthedocument(6)
tf − idf = tf(t)− idf(t) (7)
This serves to reduce the impact of frequent words (“the”, “an”, “is”, etc.)and increase the impact of infrequent, rarer words. The Linear Support VectorMachine was used as noted above for classification with high accuracy, and weachieved a similar high-accuracy result. The main parameter to specify is thenumber of word combinations ,or ngrams, that will be calculated by the model.We found the highest accuracy with 1 and 2 word ngrams.
We processed and classified, using default parameters, the entirety of thetext reviews (over 1.5 million), with a resulting 95% accuracy. Due to the highaccuracy of the result, we moved forward with including this review text aspectrating in the models.
4.3 Evaluation Methods
All processing of results was performed on a MacBook Pro with 2.7 GHz IntelCore i5 processor, with 8 GB of 1867 MHz DDR3 RAM and a 128 GB solidstate HDD. The measure we used for evaluating efficiency was the time usedto process the recommend function of each model. For the accuracy, the metricwe used is the Root Mean Squared Error (RMSE). RMSE is the square root ofthe Mean Squared Error (MSE), and is for this collaborative filtering analysis isdefined as
RMSE =
√√√√1/TT∑u,i
(rui − rui)2 (8)
where T is the total number of ratings in the data, rui is the predicted hotelrating, and rui is the actual hotel rating.
To separate into training and test sets, we use the Turi Create function“recommender.util.random split by user.” Typical methods of train/test split ondata such as this may leave either the test or training data set with no data fromany particular user, which would significantly degrade the predictive capabilitiesof the models. Instead, the Turi Create “recommender.util.random split by user”function splits data for each user along the desired proportion. If a user has 10reviews and an 80%/20% split for train/test, 8 randomly selected reviews fromthat user will go in the training data set, and 2 randomly selected reviews fromthat user will go in the test data set set. This way there is data for each user inboth the test and training data set. We have selected 80%/20% as the train/testproportion for each user, and applied this to each model.
8
SMU Data Science Review, Vol. 1 [2018], No. 4, Art. 1
https://scholar.smu.edu/datasciencereview/vol1/iss4/1
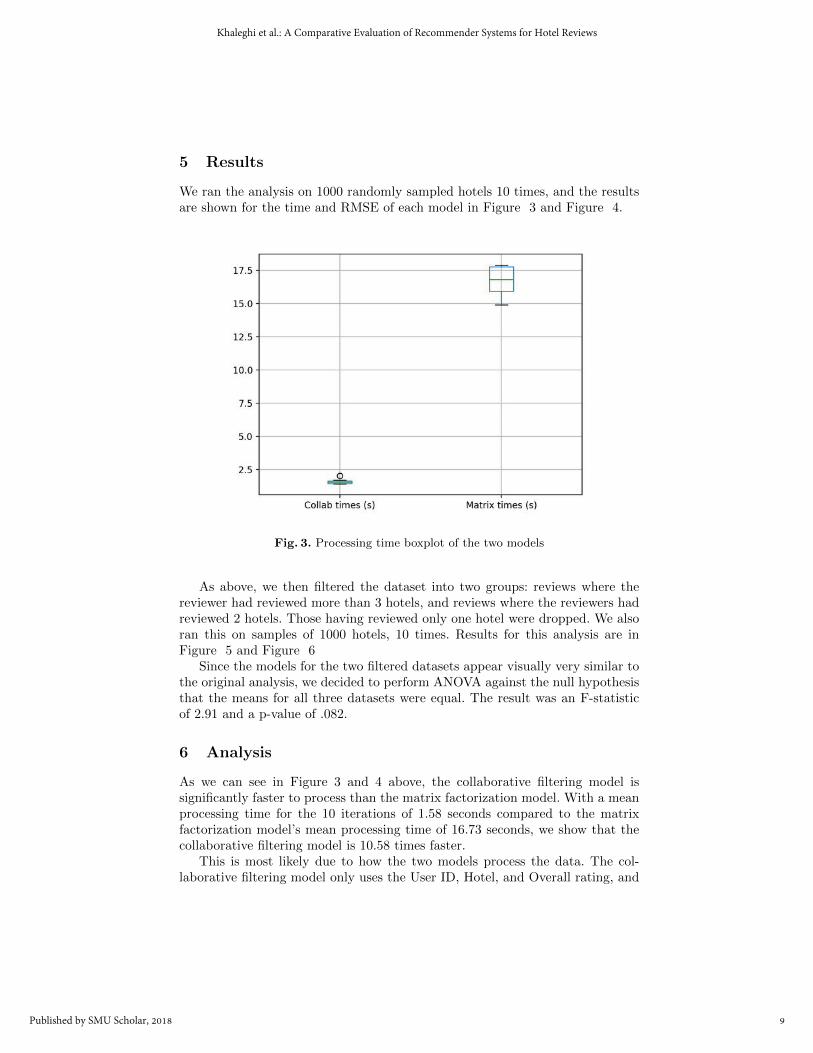
5 Results
We ran the analysis on 1000 randomly sampled hotels 10 times, and the resultsare shown for the time and RMSE of each model in Figure 3 and Figure 4.
Fig. 3. Processing time boxplot of the two models
As above, we then filtered the dataset into two groups: reviews where thereviewer had reviewed more than 3 hotels, and reviews where the reviewers hadreviewed 2 hotels. Those having reviewed only one hotel were dropped. We alsoran this on samples of 1000 hotels, 10 times. Results for this analysis are inFigure 5 and Figure 6
Since the models for the two filtered datasets appear visually very similar tothe original analysis, we decided to perform ANOVA against the null hypothesisthat the means for all three datasets were equal. The result was an F-statisticof 2.91 and a p-value of .082.
6 Analysis
As we can see in Figure 3 and 4 above, the collaborative filtering model issignificantly faster to process than the matrix factorization model. With a meanprocessing time for the 10 iterations of 1.58 seconds compared to the matrixfactorization model’s mean processing time of 16.73 seconds, we show that thecollaborative filtering model is 10.58 times faster.
This is most likely due to how the two models process the data. The col-laborative filtering model only uses the User ID, Hotel, and Overall rating, and
9
Khaleghi et al.: A Comparative Evaluation of Recommender Systems for Hotel Reviews
Published by SMU Scholar, 2018

Fig. 4. RMSE boxplot of the two models
Fig. 5. RMSE boxplot of the two models from the 2 review dataset
generates a finite number of user profiles to match to other users. Each randomsample of 1000 hotels typically has about 100,000 unique reviewers, with only asmall percentage having written more than one review. That sets the limit of userprofiles at that number of unique reviewers. In contrast, the matrix factoriza-
10
SMU Data Science Review, Vol. 1 [2018], No. 4, Art. 1
https://scholar.smu.edu/datasciencereview/vol1/iss4/1

Fig. 6. RMSE boxplot of the two models from the ¿2 review dataset
tion model creates a much larger number of user-hotel pairs. If there are 100,000unique reviewers and 1000 hotels, that creates a maximum of 100,000,000 user-hotel matches to evaluate, which is 1000 times larger than the number of userprofiles created and evaluated in the collaborative filtering model.
The comparison of model processing times gives collaborative filtering asclearly superior, so next we look at the RMSE. With a mean RMSE of 1.21for the matrix factorization model to the mean RMSE of 4.09 for collaborativefiltering, matrix factorization is superior.
RMSE is notably difficult to interpret. Rehorek [13] gives the errors in theRMSE as the difference between the predicted rating and actual rating for rec-ommender systems. For example, if a hotel was rated a 4 by a user, and the modelpredicts 2.5, this would give an error of 1.5. As given in the formula above, theseerrors are then squared, summed, divided by the number of reviews, and thesquare root taken. An RMSE value of 4.09 for the collaborative filtering modelis quite poor, representing an average error per rating of over 4. Since the ratingsonly go from 1 to 5, this represents a significant error.
The next step of the analysis was to filter the dataset and examine whetherhaving only reviewers with more reviews improved the RMSE. Since collabo-rative filtering theoretically performs better with more data for each user, wewould expect an improvement over the original model. The matrix factoriza-tion model should be unaffected by this, but we ran it for consistency with theoriginal analysis. As we can see in Figure 5 and 6 above, there appears to beno improvement. Visually, the results are very similar to the original analysis.Due to this result, we performed ANOVA, as above. The p-value of .082, being
11
Khaleghi et al.: A Comparative Evaluation of Recommender Systems for Hotel Reviews
Published by SMU Scholar, 2018

higher than our threshold of .05, means we fail to reject the null hypothesisthat the means are equal. Thus, we find no evidence that there is a statisticallysignificant difference between the mean RMSE between the original model withthe full dataset, the model which only included reviews where the reviewer hadwritten exactly 2 reviews, and the model which only included reviews where thereviewer had written 3 or more reviews.
This result is surprising. The intent was to examine a facet of the cold startproblem, and look at how many reviews are needed to build a more accuratecollaborative filtering model. The likely explanation is that due to the number ofhotels, our sampling approach, and some aspects of the data, these models areall similar because there would need to be a much larger number of reviews perreviewer to increase the accuracy. Given the large number of hotels, the ability tomake a user profile from reviews that covers any number of them is small. Sincethe collaborative filtering model ignores all data but the hotel, user, and Overallrating, the user profile built likely matches very few other users well. This iscompounded by the sampling approach we took due to computing constraints.A user may have 500 reviews in the system to build a profile, but if we onlysample 2 of those reviews each time, the profile will be inaccurate, especiallycompared to using the entire dataset. As for the data, since most of the Overallreview scores are high, with a mean of 4, it may be easier to build user-userprofiles as a result, and the model may be more accurate due to this skew. Sincealmost all users rate highly, this has the effect of reducing the variation betweenusers, and makes more users similar to others.
7 Ethics
Ethics are a significant concern in our research. The data provided freely toTripAdvisor may be used to build a detailed profile of a user, which could bedangerous. For example, a user who reviews different hotels every summer couldbe profiled as someone to rob while they are on vacation. The data has usernamesand location data, but user data can also be searched on the site or Google. Thisallows relatively simple identification of users who use the same usernames acrossmultiple sites.
We selected users with usernames containing unusual or potentially identi-fying information and multiple reviews as a starting point for our investigation.While many user reviews and data kept by TripAdvisor show the users firstname and last initial, we found that this was not useful for identifying a user.For example, one sample tested for analysis had 13 reviews from a user “DavidB”, however the user location data shows this was likely 9 different users, andidentifying each was difficult. After reviewing the data and pulling usernamesfrom multiple samples, we found two users we will use to highlight the ethi-cal concerns. We will show how the ACM Code of Ethics [14] General EthicalPrinciples 1.2 Avoid Harm and 1.6 Respect Privacy are violated.
The first user we will discuss is Pawel EPWR, A search of EPWR on Googlebrings up multiple references to Wroclaw Strachowice airport, which confirms the
12
SMU Data Science Review, Vol. 1 [2018], No. 4, Art. 1
https://scholar.smu.edu/datasciencereview/vol1/iss4/1

user’s location of Wroclaw, Poland. Searching the username shows an Instagramwith the user’s full name, and this was verified by comparing the user’s Instagrampictures to Pawel EPWR’s travel history via hotel reviews in the dataset. ThisInstagram also contains a picture of the user. So to summarize, with a fewsimple Google searches and an unusual username, we were able to find a realname and picture of a TripAdvisor user. Next, we then researched each of thehotels reviewed by the user, and identified that many of them are gay hotels,which TripAdvisor tags. This tagging metadata was not available in the dataset,but is readily available now on each hotel’s page on the site. This was added inthe time since the dataset was collected. With this information, we now have abreach of the user’s privacy that is significant: it is highly likely the user is a gayman. While homosexuality is legal in Poland, there are more restrictions on gaypeople there than in most of the West, and this information could be used todiscriminate against the user or otherwise be used against him. While this usermay not suffer from this breach, it is easy to see how a user from a country withmore restrictions on homosexuality could also be identified in a similar manner.Given the nature of travel, where many people seek new or different experiences,users may specifically travel for the purposes of engaging in acts or behavior thatis illegal in their home countries. In the case of homosexuality, in some countriesthis can mean execution as a punishment. This adds a dimension of risk to theTripAdvisor review, where a user reviewing hotels tagged with “gay hotel” orother such identifiers could be identified and face punishment, or other harm,at home. There is no mention of any such risk on the TripAdvisor site, or anyreference to these issues in their privacy policy.
The second user, stevied888, is slightly different. A google search of the user-name pulls up a candidate profile for someone who ran for public office, withtheir email as [email protected], as well as a full name, address and phonenumber. The user location for this candidate can be matched to the user locationfor the user profile on the TripAdvisor site, as well as the user location field inthe dataset. This username also matches a Pinterest page with that same user-name, which also gives the user’s matching full name. This case presents severalchallenges. The first is that if the user writes a negative review, a displeasedhotel owner could easily find this information and harass the user via email,mail, or phone. The ability to find a phone number or address using an onlineprofile is not an expected result, as most users assume some level of anonymity.Second, a user running for public office likely does not want their travel historyand reviews able to be easily linked to their professional life. Even if a user hasnothing to hide, this information could be used in attack ads or part of a smearcampaign, possibly by misrepresenting the user’s words from an online review.
Both of these users highlight how this data could be used in a negative way toharm an individual or violate their privacy, and is a completely unintended use.There is no warning on TripAdvisor that the reviews could be aggregated in away that reveals hidden insights, such as a user’s sexual orientation. Often, thisis the actual value data scientists provide. It is easy to see how gay users wouldwant to find hotels that cater to their needs, and that TripAdvisor would collect
13
Khaleghi et al.: A Comparative Evaluation of Recommender Systems for Hotel Reviews
Published by SMU Scholar, 2018

data for that purpose. The challenge is in access to that data. A user who goesto a hotel tagged as “gay hotel”, or one known for prostitution, may not wantthat association known publicly, so common sense would dictate that access tothat information should be protected. Through the TripAdvisor data, though,we have shown how easy it can be for anyone to tie that kind of information toan actual person.
8 Conclusions and Further Work
As a result, given the much faster processing time for the collaborative filter-ing model with poor accuracy, and the comparatively very slow times but muchhigher accuracy for matrix factorization, it’s difficult to say which model is supe-rior. While much more accurate, the times required for the matrix factorizationmodel are a significant challenge. Some of this processing time could be mitigatedby more sophisticated computer hardware. Given that this model processing wasrun in relatively small samples, and not the entire data set, it’s difficult to knowwhat the effect of more computing power would have when all of the data isprocessed.
Still, we know that one laptop could effectively run and create the collab-orative filtering model for some portion of the data in a real-world acceptabletimeframe. On today’s internet and with today’s use, no user would accept awebsite that served recommendations after a 10+ second delay, as with the ma-trix factorization model. That itself shows the value of the collaborative filteringmodel. The accuracy problem would still need to be solved, however.
With this data, we can only build and evaluate the recommender system,and predict how a user would rate the hotel. The other side, evaluating theimpact of these recommendations and how the user responds and they turn intobookings or sales, is unavailable to us. How the ratings affect which hotel theuser will choose to book when presented with multiple recommendations wouldbe interesting research to engage in. Whether or not it is the most accuraterecommendation that is chosen is unknown.
The lack of improvement in accuracy through the filtering of the data setinto different groups is surprising, and suggests a need to examine the cold startproblem more deeply. It is difficult to say how many reviews are necessary tosolve it, but even with multiple users having 20+ reviews in some samples, itdid not affect the accuracy of either model. In the case of hotels with the col-laborative filtering model, each user-user comparison is likely only to matter iftwo users have reviewed one or more of the same hotels, as there is no other dis-tinguishing information used. Several methods have been proposed that wouldsolve this problem without the need to visit and review many hotels before ac-curate recommendations could be given. Nadimi-Shahraki et al [15], for exampleproposed using an interview or questionnaire to classify the user. Hu et al [16]integrated a clustering approach into the pipeline prior to the collaborative fil-tering step to use side data that wouldn’t be used in the model, and achievedimproved accuracy with this method.
14
SMU Data Science Review, Vol. 1 [2018], No. 4, Art. 1
https://scholar.smu.edu/datasciencereview/vol1/iss4/1

A future analysis could also be done using a different package and collabo-rative filtering model that uses more data to see how much of an impact thathas on the accuracy of the model and these metrics, as well as the cold startproblem. If the model uses more of the features than our package did, this maylead to improvements in accuracy for the collaborative filtering model that arestill faster than matrix factorization due to the differences between user-userpair and user-hotel pair computation times.
References
1. Lee, J., Sun, M., Lebanon, G.: A Comparative Study of Collaborative FilteringAlgorithms. (2012) https://arxiv.org/abs/1205.3193.
2. Moshfeghi, Y., Piwowarski. B., Jose, J.M: Handling data sparsity in collaborativefiltering using emotion and semantic based features. (2011)
3. Wang, H., Lu, Y., Zhai, C.: Latent Aspect Rating Analysis without Aspect Key-word Supervision. 17th ACM SIGKDD Conference on Knowledge Discovery andData Mining. (2011) 618-626
4. Wang, H., Lu, Y., Zhai, C.: Latent Aspect Rating Analysis on Review Text Data:A Rating Regression Approach. 16th ACM SIGKDD Conference on KnowledgeDiscovery and Data Mining. (2010) 783-792
5. Chua, A., Banerjee, S.: Reliability of Reviews on the Internet: The Case of TripAd-visor. Proceedings of the World Congress on Engineering and Computer Science,Vol. I. (2013)
6. Nilashi, M., Jannach, D., bin Ibranim, O., Ithnin, N.: Clustering- and Regression-based Multi-Criteria Collaborative Filtering with Incremental Updates. Informa-tion Sciences. (2014)
7. Low, Y., Gonzalez, J., Kyrole, A., Nickson, D., Guestrin, C., and Heller-stein, J.:, GraphLab: A New Framework for Parallel Machine Learning. (2010)https://arxiv.org/abs/1006.4990
8. Leung, C., Chan, S., Chung, F.: Integrating Collaborative Filtering and SentimentAnalysis: A Rating Inference Approach. Proceedings of ECAI Workshop on Rec-ommender Systems. (2006) 62-66
9. Chen, L, Zhang, J.: Prediction of Yelp Review Star Rating using Sentiment Anal-ysis. (2014)
10. Xia, H., Peng, L.: SVM-Based Comments Classification and Mining of VirtualCommunity: For Case of Sentiment Classification of Hotel Reviews. Proceedings ofthe International Symposium on Intelligent Information Systems and Applications.(2009) 507-511
11. Duvvur, P.K.: Predicting Hotel Rating Based on User Reviews. (2016)12. Liu, D, Chai, Y., Zheng. C., Zhang, Y.: Rating Prediction Based on TripAdvisor
Reviews. (2017)13. Rehorek, T.: Evaluating Recommender Systems: Choosing the best one for your
business. (2016) https://medium.com/recombee-blog/evaluating-recommender-systems-choosing-the-best-one-for-your-business-c688ab781a35.
14. Association for Computing Machinery.: Code of Ethics and Professional Conduct.(2018) https://www.acm.org/code-of-ethics.
15. Nadimi-Shahraki, M-H., Bahadorpour, M.: Cold-start Problem in CollaborativeRecommender Systems: Efficient Methods Based on Ask-to-rate Technique. Jour-nal of Computing and Information Technology. (2014) 105-113
15
Khaleghi et al.: A Comparative Evaluation of Recommender Systems for Hotel Reviews
Published by SMU Scholar, 2018

16. Hu, Y., Lee, P., Chen, K., Tam J., Dang, D.: Hotel Recommendation System Basedon Review and Context Information: A Collaborative Filtering Approach. PacificAsia Conference on Information Systems. (2016)
16
SMU Data Science Review, Vol. 1 [2018], No. 4, Art. 1
https://scholar.smu.edu/datasciencereview/vol1/iss4/1

![Prosiding[Halal Hotel]](https://static.fdokumen.com/doc/165x107/6345e46cdf19c083b10845eb/prosidinghalal-hotel.jpg)