NYC Hotel Market Analysis
100
NYC Hotel Market Analysis Existing Conditions and 10-Year Outlook New York City Department of City Planning
-
Upload
khangminh22 -
Category
Documents
-
view
1 -
download
0
Transcript of NYC Hotel Market Analysis

NYC Hotel Market AnalysisExisting Conditions and 10-Year Outlook
New York City Department of City Planning

NEW YOR K C IT Y HOT EL MARKET ANALYSIS AND M1 ZONE I MPACTS
N
Prepared for New York City Department of City Planning by
• BJH Advisors (bjhadvisors.com)
• BAE Urban Economics (bae1.com)
• VHB (vhb.com)
© 2017 City of New York
New York City Department of City PlanningCENTRAL OFFICE 120 Broadway31st FloorNew York, NY 10271
Tel . 1-212-720-3300Fax. 1-212-720-3488
http://www.New York City.gov/planning
New York City Hotel Market Analysisand M1 Zone Impacts

NEW YOR K CI TY DEPA RTMENT OF C ITY PLANNING
Table of Contents
EXECUTIVE SUMMARY I
INTRODUCTION 5
Purpose of Study 6
Methodology 6
DEFINING THE MARKET 12
Hotel Typologies 12
Land Use Controls 14
Geographies 14
Hotel Development and Management 15
CURRENT CONDITIONS 19
Profile of New York City Hotel Supply 19
New York City Hotel Demand Drivers 28
Trends in Occupancy and Room Rates 31
Overview of Hotel Markets in M1 Districts 35
Projected Pipeline of Hotel Rooms in New York City and M1 Districts 40
New York City Borough and Submarket Profiles 45
Manhattan 45
Queens 51
Brooklyn 57
The Bronx 63
Staten Island 65
NEW YORK CITY HOTEL MARKET OUTLOOK: NO ACTION SCENARIO 67
New York City Projected Hotel Demand 67
APPENDIX I: LITERATURE REVIEW 79
APPENDIX II: HOTEL ASSET CLASSES 82
APPENDIX III: MAPS 84

NEW YOR K C IT Y HOT EL MARKET ANALYSIS AND M1 ZONE I MPACTS
Table of Tables
TABLE 1A: PERCENTAGE OF HOTEL ROOMS BY ZONING DISTRICT, ALL INVENTORY 2017 24
TABLE 1B: PERCENTAGE OF HOTEL ROOMS BY ZONING DISTRICT, INVENTORY BUILT 2008–2017 24
TABLE 2: HOTEL ROOM COUNT CHANGE BY TYPOLOGY 2007 AND 2017 26
TABLE 3: M ZONE HOTEL ROOMS AS A PERCENT OF TOTAL ROOMS BY SUBMARKET, 2017 35
TABLE 4: PERCENTAGE OF HOTEL ROOMS BUILT AFTER 2007 BY TYPE 36
TABLE 5A: PIPELINE HOTELS BY SUBMARKET AND ZONING 41
TABLE 5B: PIPELINE HOTELS BY SUBMARKET AND ZONING 42
TABLE 5C: PIPELINE HOTELS BY SUBMARKET AND ZONING 43
TABLE 6: CHANGE IN HOTEL ROOMS BY SUBMARKET AND ZONING DISTRICT ASSUMING COMPLETION OF TOTAL PIPELINE 44
TABLE 7: BUSINESS AND LEISURE TRAVEL, NYC AND US 68
TABLE 8: EXISTING HOTEL DEMAND, 2016 69
TABLE 9: U.S. LEISURE TRAVEL PROJECTIONS, 2016–2020 70
TABLE 10: TRAVEL GROWTH RATES 70
TABLE 11: LEISURE HOTEL DEMAND PROJECTIONS BY BOROUGH 71
TABLE 12: BUSINESS HOTEL DEMAND PROJECTIONS BY BOROUGH 72
TABLE 13: PROJECTED ROOM DEMAND BY BOROUGH AND TRAVEL TYPE 73
TABLE 14: GROSS UNMET ROOM DEMAND BY BOROUGH, 2020 AND 2028 74
TABLE 15: HOTEL DEMAND AFTER ROOMS UNDER CONSTRUCTION, 2016–2028 75
TABLE 16: HOTEL DEMAND AFTER ROOMS UNDER CONSTRUCTION, 2016–2028 76
TABLE 17: RESIDUAL ROOM DEMAND BY BOROUGH, 2016–2028 76
TABLE 18: ADJUSTED GROSS DEMAND, 2016–2028 78

NEW YOR K CI TY DEPA RTMENT OF C ITY PLANNING
Table of Figures
FIGURE 1: NEW YORK CITY HOTEL AND ROOM SUPPLY 2007–2017 19
FIGURE 2: NEW YORK CITY CHANGE IN HOTEL ROOM SUPPLY BY BOROUGH, 2007–2017 21
FIGURE 3: MANHATTAN & OTHER BOROUGHS’ ROOM SUPPLY 2007-2017 22
FIGURE 4: NEW YORK CITY ROOMS BY TYPOLOGY 2007 & 2017 25
FIGURE 5: NEW YORK CITY DOMESTIC AND INTERNATIONAL VISITORS, 2010–2016, MILLIONS OF VISITORS 30
FIGURE 6: NEW YORK CITY AND US HOTEL OCCUPANCY RATES 31
FIGURE 7: HOTEL OCCUPANCY RATES BY BOROUGH, 2015 AND 2016 32
FIGURE 8: NEW YORK CITY AVERAGE DAILY RATE AND OCCUPANCY 2011–2016 33
FIGURE 9: REVPAR GROWTH BY CITY, Q1 2016 34
FIGURE 10: MANHATTAN HOTEL MARKET TRENDS, 2011–2016: MANHATTAN M1 DISTRICTS 47
FIGURE 11: MANHATTAN TRENDS BY SUBMARKET 48
FIGURE 12: QUEENS HOTEL MARKET TRENDS, 2011–2016 52
FIGURE 13: QUEENS HOTEL TRENDS BY SUBMARKET 54
FIGURE 14: BROOKLYN HOTEL MARKET TRENDS, 2011–2016 58
FIGURE 15: BROOKLYN TRENDS BY SUBMARKET, 2011–2016 60
FIGURE 16: BRONX HOTEL MARKET TRENDS, 2015–2016 64
FIGURE 17: STATEN ISLAND HOTEL MARKET TRENDS, 2011–2016 66

I
NEW YOR K C IT Y HOT EL MARKET ANALYSIS AND M1 ZONE I MPACTS
Executive SummaryThis report presents an overview of the hotel industry in New York City over the last decade, as well as current and projected future conditions. It is intended to provide guidance to the New York City Department of Planning regarding the potential impacts of imposing a Special Permit for hotel development in M1 zoning districts. It ana-lyzes trends related to hotel development patterns and typologies, demand drivers, occupancy and revenue, and the projected development pipeline for new hotel construction and delivery, with a particular focus on future development in those M1 areas.
A general New York City market overview is followed by a more in-depth analysis of hotel submarkets within New York City – each borough as well as intra-borough submarkets that have experienced disproportionate hotel development and that overlap with Light Manufacturing districts.
The final section of the report provides an outlook for hotel development based on an analysis of supply and demand factors. Demand drivers include visitor projections; supply drivers include as-of-right development in appropriate location and cost of land and construction. The analysis projects future hotel development condi-tions under a “No-Action Scenario” – meaning no changes are made to development rights within M1 districts.
In preparing this report, the Consultant team relied on both primary and secondary data sources, including stake-holder interviews, proprietary data from Smith Travel Research (STR) regarding the New York City lodging indus-try, and a literature review.
New York City Hotel Supply and Trends
According to Smith Travel Research (STR), a third-party data vendor that provides hotel industry data, there are currently over 115,530 hotel rooms in over 630 hotel properties in the five boroughs of New York City. Just over 80 percent of these rooms are in Manhattan. Over the past decade, the New York City hotel market has been in the midst of a substantial growth in supply, with 42 percent growth in new hotel rooms since 2010. Much of this growth has happened in areas outside of Manhattan, recently creating well-established hotel districts in areas of Brooklyn and Queens. While the number of hotel properties in Brooklyn, Queens, the Bronx and Staten Island continues to grow, this growth is concentrated in a relatively small set of submarkets: Long Island City, Downtown Brooklyn/Gowanus, Flushing, Jamaica, Williamsburg/North Brooklyn, and Sunset Park. Hotels outside Manhat-tan tend to be smaller on average as well as offer fewer amenities related to meetings and business activity.

II
NEW YOR K CI TY DEPA RTMENT OF C ITY PLANNING
Hotel Demand Drivers
The hotel industry in New York City depends on demand from both domestic United States-based travelers and overseas visitors. Although the Great Recession impacted travel, especially by U.S. residents, overall visitation to New York City has recovered significantly since then, reaching record levels in 2016. Specifically, visitors to New York City grew from 47 million in 2007 to 60.7 million in 2016, an increase of almost 30 percent for the period.1 While Manhattan’s position as a global business and cultural center makes it one of the largest and most dynamic hotel markets in the world, Brooklyn, Queens, and to some extent the Bronx and Staten Island’s hotel markets are characterized by spillover demand as well as the following development drivers:
• Proximity to Manhattan• Access to public transportation (principally subway lines) • Presence of services and amenities in neighborhood • Significant office or commercial market• Existing critical mass of hotels in neighborhood (most hotel are market followers not market leaders)• Room rates• Proximity to airports and/or other specialized demand as in the case of the Staten Island market which
serves a major business park
Occupancy and Room Rates
New York City’s robust visitor numbers have led to a commensurate strong demand for hotel rooms, as reflected by annual average occupancy rates that are among the highest of any urban market in the United States. While occupancy rates have remained stable in New York City, room rates have faced some pressure in the past two years and have seen small declines.
Hotel Development in M1 Districts
Over the past ten years in New York City, there has been a marked trend of increased hotel development in M1 districts. This is particularly true in the boroughs outside of Manhattan, where 40 percent of the hotel rooms that have come online in the past ten years have been located in M1 districts. The report identifies three main findings related to M1 hotel development in New York City.
• Boroughs other than Manhattan have a higher percentage of their rooms in M1 districts, however all boroughs have experienced significant hotel room development in commercial districts. However, all boroughs have experienced significant hotel room development in commercial districts. In Manhattan, where zoning permits hotel development in many areas, 20 percent of new rooms between 2008 and 2017 have been located in M1 zones (or conversely 80 have been delivered in Commercial or Special Use districts). Outside Manhattan, 36% of hotel rooms have been delivered in M1 districts and 60 percent in Commercial or Special Use districts.
1 NYC and Company Annual Summary, 2016.

III
NEW YOR K C IT Y HOT EL MARKET ANALYSIS AND M1 ZONE I MPACTS
• M1 district hotel development in Brooklyn and Queens is clustered around just a few areas. Outside Man-hattan, over 75 percent of the hotel rooms built in M1 or M1/R districts in the past ten years are located in just four clusters, excluding John F. Kennedy (JFK) Airport: Long Island City, Jamaica, North Brooklyn and Gowanus, with almost 65 percent of those rooms in Long Island City. Although the current M1 bulk, park-ing, and use regulations tend to favor hotel developments in the current market, developers are choosing to locate in specific M1 districts for multiple and varied reasons, including their proximity to transporta-tion, business centers and access to Manhattan. In other words, only certain M1 districts in areas outside of Manhattan have characteristics that attract hotel development.
• Hotels that are being built in M1 districts outside of Manhattan are decidedly skewed towards the Econo-my and Midscale typology. When one examines the hotel supply in M1 districts only in the four boroughs outside Manhattan, 44 percent of the room inventory is classified as Midscale and 36 percent is classified as Economy, while only 20 percent is Upscale. Compare this to the hotel supply in M1 districts in the Man-hattan where 57 percent of the room inventory is Upscale and 16 percent is Luxury and only 27 percent of the rooms are Economy or Midscale.
Projected Pipeline of Hotels
According to data from the New York City Department of Buildings that was provided to the Consultant Team by the New York City Department of City Planning, there are currently 276 hotels with 37,986 rooms in the supply pipeline across New York City. These include hotels that are both under construction and in pre-construction, with hotels in pre-construction encompassing both those projects that have filed an application with the De-partment of Buildings and those that are in pre-application. Projects under construction are relatively certain to finalize, whereas projects in the pre-construction process are less likely to go to completion. Manhattan has the largest share of rooms in the pipeline (18,958 rooms), followed by Queens (10,286 rooms), and Brooklyn (6,707 rooms). Of these, 34 percent of hotels and 30 percent of rooms will be located in M districts. Most of the pipeline rooms in Staten Island are scheduled to be located in M districts (87 percent), compared to 43 percent in Brooklyn, 36 percent in Queens, 22 percent in Manhattan, and 18 percent in the Bronx.
New York City Hotel Market Outlook
Some real estate analysts and private developers have expressed concern about oversupply in the New York City hotel market, noting that banks are not financing new hotel projects until the current pipeline is absorbed. Oth-ers –including Jones Lang LaSalle (JLL) and Lodging Econometrics – are more confident about future growth. Cit-ing New York’s position as a global center of business and tourism and the resiliency of the local hotel market, JLL projects absorption of new hotel supply by the end of 2018 and a rebound in growth. Many of the developers interviewed by the Consultant Team for this report, however, indicate that supply in New York City, in its entirety and in particular in boroughs other than Manhattan, has been catching up with demand. New York City experi-enced little to no hotel development between 1997 and 2007, despite steady increases in demand.

IV
NEW YOR K CI TY DEPA RTMENT OF C ITY PLANNING
Over the past ten years, room supply has been catching up with growing and pent up demand. As supply and demand reach equilibrium, as evidenced by steady occupancy rates and flat RevPAR,2 hotel development should slow down. However, increases in tourism and employment will continue to put pressure on the development of new rooms, albeit at a much slower rate than indicated by recent supply trends.
Using visitation and employment projection data, along with national tourism demand trends and New York City hotel pipeline information, the following analysis evaluates hotel room demand and supply growth for New York City in total, and by borough, through 2028. The analysis first projects hotel demand by market segment (i.e., lei-sure and business travel), and then subtracts existing hotel supply and pipeline rooms to estimate residual room demand. The residual room demand represents the number of rooms that developers would be expected to build through 2028, after the market absorbs the current pipeline of hotel rooms.
Using this methodology, the Consultant Team has determined that tourism and business travel growth between 2016 and 2028 will generate demand for nearly 28,000 additional rooms in New York City through 2028, after ac-counting for the existing supply of hotel rooms. This translates into annual average demand growth of 1.9 percent for the City overall. This is more than the conservative projection used by New York City Office of Management and Budget (OMB) to project Transient Occupancy Tax (TOT) revenues (0.83 percent), and less than New York City’s historic 2007-2016 annual visitation growth rate of 3.1 percent.
Based on these demand estimates, the nearly 24,200 rooms under construction and 13,800 rooms in various stages of pre-construction will likely satisfy demand through 2028. Although Manhattan remains the primary borough for hotel demand, the geographic distribution of hotels in the pipeline, in addition to interviews with hoteliers and developers, suggest that a portion of the demand generated by Manhattan is already spurring de-velopment in other boroughs in close proximity to Manhattan, particularly those with transit access.
Some submarkets will likely continue to expand, while others may slow down due to short- and mid-term sat-uration, high land prices, or shortages of developable and/or attractive sites, near required transit and other amenities sought by travelers. Still other markets currently unknown, may emerge. Projecting demand at the borough-level allows for flexibility in development based on market saturation, emerging market conditions, and diminishing availability of suitable sites. Development in areas outside of Manhattan will likely continue to be clustered around transit infrastructure, as well as shared between commercial corridors and M1 districts that are proximate to those commercial areas. Clearly the M1 districts have been an important area for new supply to take place and this supply has adequately addressed the needs of the tourism industry to date. In the short-term, recent developments and the existing pipeline will likely accommodate the growing demand.
1 Steady occupancy rates coupled with a flat RevPAR indicate that hotel supply is in equilibrium with demand. New rooms are not creating a glut in the market, which would depress occupancy rates. When hotels cannot increase ADRs, but occupancy and RevPAR remain flat, it indicates that supply is growing in line with demand.

5
NEW YOR K C IT Y HOT EL MARKET ANALYSIS AND M1 ZONE I MPACTS
New York City is one of the world’s most popular travel destinations and in 2016, welcomed a record-breaking 60.7 million travelers.1 Notably, New York City is the largest market in the United States for international travelers, who tend to stay longer and spend more money. According to the most recent figures from the U.S. Department of Commerce’s National Office of Travel and Tourism, New York saw over 10 million foreign visitors in 2015, almost twice as many as second place Miami and representing 26 percent of all visitors to the city.
As a result, New York City is one of the largest and most diversified hotel markets in the United States and, over the past several years, has experienced an unprecedented hotel construction boom that has delivered more new hotel rooms than any market in North America. As recently as 2013, New York City was the fifth largest hotel market in the nation, measured by room count, ranking behind Las Vegas, Orlando, Chicago and Washington, D.C. However, according to Smith Travel Research, the addition of over 12,000 hotel rooms since that time has catapulted New York to third place behind Las Vegas and Orlando with enough hotel rooms currently in the de-velopment pipeline to surpass Orlando and become the second largest national market.2
A particularly distinguishing factor of the current hotel boom in New York is its occurrence across the entire city and not just Manhattan. While Manhattan continues to be the unrivaled focus of the New York City hotel market, each of the four other boroughs has also seen, during the past decade, delivery of new hotel properties and room count increases that are unmatched in recent history. Since 2010, Queens and Brooklyn have both seen hotel room count increases of over 50 percent, with similar growth rates in the smaller markets of the Bronx and Staten Island. In recent years, more of this hotel development has taken place in areas of the city that are zoned for Light Manufacturing. This unprecedented boom in hotel room supply has begun to put pressure on room rates across New York City, which in 2016 fell slightly below those in 2015. Occupancy rates, however, have remained stable for the past four years and remain among the highest of all major U.S. hotel markets.
In addition to accommodating millions of business and leisure travelers from around the world, New York City’s hotels are also, of course, businesses themselves that employ tens of thousands of city residents. As part of a thriving tourism industry cluster, the New York City hotel workforce cleans and maintains facilities, prepares and serves food, helps guests, markets services and manages operations.
1 NYC & Company Annual Summary 2016 - 2017.2 Despite having more rooms than Orlando, New York City received less visitors in 2016. In 2016,
Las Vegas and Orlando attracted 42.9 million and 68 million visitors, respectively, compared to New York City’s 60.7 million visitors. (Las Vegas Sun and Orlando Business Journal).
Introduction

6
NEW YOR K CI TY DEPA RTMENT OF C ITY PLANNING
Purpose of Study
The New York City Department of City Planning (NYCDCP) is studying the introduction of a Special Permit for hotels in Light Manufacturing zones (M1 districts) citywide. M1 districts, which allow hotels as-of-right, are widely mapped in the boroughs outside of Manhattan, where tourism has been growing. M1 districts also encompass some Manhattan neighborhoods, where a large share of New York City’s hotels are located.
The restriction under study potentially affects the tourism industry, an important economic driver in New York City. It could also have potential effects on industry sectors beyond accommodations (restaurant, retail, enter-tainment, transportation, etc.). Accordingly, a detailed study of the hotel industry in New York City, including ex-pected development trends and tourism forecasts within M1 districts, is warranted. This report provides an overview of the hotel industry in New York City over the last decade and trends related to hotel development patterns and typologies, demand drivers, occupancy and revenue and projected development pipeline with particular focus on development in Light Manufacturing zones. This overview of hotel supply trends and demand drivers is followed by a more in-depth analysis of current hotel markets in each borough and specific submarkets with a focus on those submarkets that have experienced disproportionate hotel development and overlap with Light Manufacturing districts. The primary drivers for hotel demand are then analyzed to determine category of stay (e.g. leisure, business) and potential future demand in each category. The analysis then projects fu-ture conditions for a “No-Action” scenario under which no changes are made to development rights in M1 districts.
Methodology
In analyzing current market trends and outlook related to projected hotel development patterns in New York City, its submarkets, and the M1 districts, this report relies on both primary and secondary data sources. Primary data sources used by the Consultant Team include interviews with hotel developers, tourism industry representatives, and local economic development professionals. The principal secondary data source used was Smith Travel Re-search’s proprietary database on New York City hotel inventory, supplemented by data from NYC & Company and the City of New York. The Consultant Team also reviewed numerous reports and media articles related to the New York City and national hotel industry. A detailed description of the major data sources follows.

7
NEW YOR K C IT Y HOT EL MARKET ANALYSIS AND M1 ZONE I MPACTS
Data Sources
PRIMARY DATA
The Consultant Team collected original, primary data through an interview process that extended over several months in the spring of 2017. In total, the Consultant Team undertook 16 interviews with key stakeholders related to the hotel industry in New York City. These stakeholders included hotel developers, hotel general managers, lo-cal economic development leaders, New York & Company staff, and others who are able to speak knowledgeably about hotel development in New York City, trends and outlook, demand drivers, and impacts.
SECONDARY DATA
The Consultant Team used secondary data sources for specific analyses, which are cited throughout the report. The main secondary sources used in the report are two proprietary datasets from Smith Travel Research (STR), which the Consultant Team analyzed in depth at various geographic and hotel typology levels. The two STR data-sets are further described below:
• Smith Travel Research (STR) hotel inventory for New York City for the 2007 thru 2017 period. This dataset describes historic and existing hotel inventory as well as pipeline hotel developments in New York City for the requested period. The Consultant Team purchased an updated version of this dataset directly from STR in the spring of 2017, as well as cited the set through published sources that utilized the STR informa-tion (e.g., New York City & Co. reporting).
NOTE: The Consultant Team eliminated duplicates within STR’s dataset, primarily same buildings which had closed and re-opened under a new hotel name, businesses operated as substandard daily/monthly temporary or permanent housing such as rooming houses and residential hotels and defined as not being available for overnight booking on the top three hotel-booking websites, and other hotels that were announced in the press as being off-market closed due to remodeling/re-opening. This “data cleaning” resulted in several changes to the timing and thus, room counts and changes in supply for the study period.
• Smith Travel Research (STR) HOST data. This STR dataset compiles and averages hotel operating state-ments from participating hotels into aggregated average financial reports by customized groups of hotels.

8
NEW YOR K CI TY DEPA RTMENT OF C ITY PLANNING
The Consultant Team used additional secondary data sources including:
• New York City Department of Building (DOB) Permit DataThe Consultant Team reviewed DOB permit data provided by the New York City Department of City Planning, building permits for hotel projects under construction and in the pre-construction process as of June 2017.
• NYC & Company ReportsThe Consultant Team reviewed NYC & Company’s Annual Summaries for 2016-2017 and earlier years where available. These summaries provide an overview of New York City travel and tourism trends, including total domestic and international visitors and visitation by segment, in addition to hotel performance by Average Daily Rate and Occupancy Rate, total hotel rooms in active inventory, and total room-nights sold.
In addition, the Consultant Team reviewed NYC & Company’s Quarterly Hotel Development Fact Sheets, supplemented by data from STR and New York CityDCP to identify future hotel projects. Further, the Consultant Team reviewed NYC & Company’s updated travel and tourism projections for New York City issued in March 2017.
• New York City Office of Management and Budget DataThe Consultant Team reviewed data from the New York City Office of Management and Budget (NYC OMB) related to forecasts for travel and tourism, hotel inventory and occupancy through 2021.
• New York Metropolitan Transportation CouncilThe Consultant Team reviewed data from the New York Metropolitan Transportation Council (NYMTC) related to forecasts for employment by borough through 2030.
• Literature ReviewThe Consultant Team undertook an overview and analysis of published sources that provided estimates of tourism activity in New York City. The sources included analysis and findings for projections of hotel development in New York City. Sources included third party market evaluation and outlook reports, academic studies, industry reports and outlook projections conducted by New York City and New York State government agencies, and reports conducted by NYC & Company, in addition to relevant recent news articles in local and national newspapers, magazines and industry trade publications that focus on the travel and hospitality industry and New York City real estate. A bibliography of literature is attached in Appendix I.

9
NEW YOR K C IT Y HOT EL MARKET ANALYSIS AND M1 ZONE I MPACTS
Key Definitions
The STR data reports on three key hotel indicators that the Consultant Team uses throughout the analysis, in par-ticular to evaluate demand. These indicators are Occupancy Rates, Average Daily Rates (ADRs) and Revenue per Available Room (RevPAR), all of which are identified as key performance indicators in the hotel industry. Below are definitions of these indicators:
• Occupancy Rate refers to the ratio of rooms that are booked or occupied compared to the total amount of available rooms over a specific period of time, usually calculated as an annual average.
In the U.S., an occupancy rate of 76 percent or higher indicates a tight hotel market. However, as the top hotel market in the Country, New York City enjoys hotel occupancy rates of 85 percent or more. These high occupancy rates signal to banks and other hotel developers that rooms are likely to absorb quickly. This has been the case in New York City over the past 10 years. Hotel rooms continue to be built and absorbed into the market, with strong occupancy rates. However, occupancy rates alone do not indicate whether new hotel development is feasible. A hotel market must have strong occupancy rates and a sufficiently high ADR to support new construction or renovation.
• Average Daily Rate (ADR) is a metric that is widely used in the hotel industry to indicate the average real-ized room rental per paid occupied room per day.
In New York City, ADRs are more likely to fluctuate or stagnate than occupancy rates. As new rooms come into the market, they can prevent existing hotels from increasing their ADRs. When ADRs stagnate, despite strong occupancy rates, it can impact the feasibility of new hotel development. If ADRs are not high enough to create sufficient revenues to support new development, construction of new hotels can slow down or stop. In addition, aging hotels can lower their ADRs to remain competitive to budget travelers. Because room prices can fluctuate daily, by week day or season, hotels can quickly adjust ADRs to maintain high occupancy rates.
• Revenue per Available Room (RevPAR) shows the impact of room vacancy rates on average daily rates and is calculated by multiplying a hotel’s average daily room rate (ADR) by its occupancy rate or by taking a hotel’s gross room revenue and dividing it by the total available room nights (calculated as: number of rooms in the hotel multiplied by 365).
As RevPAR incorporates both occupancy rates and ADR, it is useful for tracking market performance over time. A rising RevPAR could reflect increasing occupancy rates, ADRs, or both, but would show that the market is strengthening. If ADRs and occupancy rates are moving inversely, but RevPAR is still increasing, it indicates that the market is still strong, despite a declining ADR or occupancy rate. A flat or declining RevPAR indicates that markets are not keeping up with general inflation and could be weakening.

10
NEW YOR K CI TY DEPA RTMENT OF C ITY PLANNING
Approach
In analyzing the current hotel market in New York City, and in projecting the future outlook of the market, the Consultant Team pursued a traditional review of supply and demand patterns. The Consultant Team reviewed trends in the industry by studying current and historic supply and demand. Supply was derived from STR’s pro-prietary databases, and other reports, as outlined above, with a focus on locational choices and hotel typologies within the broad New York City market and submarkets. Demand was derived through primary research and analysis of hotel utilization indicators such as tourism, business activity and projections, as well as from STR’s analysis of occupancy rates and pricing. In addition, current and projected demand was established through in-terview findings.
In terms of geographies, the analysis of supply and demand is provided at the citywide, borough, submarket (clus-ters within boroughs) and M1 district levels. The analysis is also provided by hotel typology. Below is further detail on the approach.
HOTEL SUPPLY: EXISTING AND FUTURE OUTLOOK
To determine existing hotel supply conditions, the Consultant Team analyzed data from STR and other sources for the city as a whole and specific geographic submarkets. STR data includes number of hotels and existing room counts by geography. Data on pipeline hotel development (hotels that are either currently under construction or in pre-construction phase) was provided by the Department of City Planning and based on data from the New York City Department of Buildings. In addition, the consultant team used pipeline data from NYC & Company and information from interviews that was validated.
Mapping existing and proposed hotel supply data over the M1 zones, informed by conversations with New York City DCP staff, revealed hotel clusters or concentrations that the Consultant Team defined for deeper evaluation. The Consultant Team used STR complete records data to evaluate the age, type, scale, and indicators for M1 ho-tels, relative to their submarkets. This data showed the amount of M1 hotel inventory compared to borough wide activity, the amount of M1 space in a given submarket that is being developed into hotel uses, and the types of hotels being developed.
Hotel pipeline data provided by New York City DCP and NYC & Company, which includes hotels under construc-tion or in the permitting process, were also mapped and evaluated to determine the near-term market supply conditions and the number of rooms being added to the market by hotel type.

11
NEW YOR K C IT Y HOT EL MARKET ANALYSIS AND M1 ZONE I MPACTS
HOTEL DEMAND: EXISTING AND FUTURE OUTLOOK
Hotel demand in New York City was determined through observation of several indicators including tourism trends, business trends, and occupancy and pricing data.
Using data from NYC & Company - including its quarterly Hotel Development Reports, annual volume studies, visitor profile reports and City Tourism Impact report - plus additional third-party market studies identified as part of the literature review, the Consultant Team evaluated historic and current tourism trends in order to es-timate the strength and direction of demand. Interviews with hoteliers and hotel sales managers supplement this information to provide a better understanding of the types of travelers staying in the M1 hotels, particularly outside of Manhattan.
QUANTITATIVE ANALYSIS PROJECTING OUTLOOK TO 2028
The Consultant Team analyzed historic trends in hotel development – driven by tourism and business sector change as well as other factors including real estate pressures – to estimate hotel market conditions through 2028. The analysis includes an evaluation of whether new hotel supply can absorb projected demand without re-ducing ADRs and/or without occupancy rates dropping below long-term equilibrium rates of 80 percent, at which point hotel markets generally begin to see signs of new hotel development on the horizon.3
The report also includes an analysis of the types of hotels likely to develop in the near future in the submarkets and M1 zones, based on data and information from NYC & Company, New York City DCP, New York City OMB, lo-cal economic development organizations, developer and other stakeholder interviews and the literature review.
It should be noted that, while this report’s examination of historical trends in hotel development generally takes a ten-year view of the years between 2007 and 2017 some of the analysis places closer focus on the years 2011 – 2017. This is due to the fact that of the 49,ooo hotel rooms delivered in New York City over the past decade, over two-thirds were delivered from 2011 onward following the Great Recession. For each analysis, the report identifies the time period that has been considered.
3 U.S. hotel market long-term equilibrium rates are 76 percent. Hotels in New York City enjoy very high occupancy rates, with the equilibrium occupancy rate likely closer to 80 percent. A 76 percent occupancy rate in New York City would likely not indicate a tight market to local hotel developers who are accustomed to seeing higher occupancy rates.

12
NEW YOR K CI TY DEPA RTMENT OF C ITY PLANNING
Defining the MarketThis section of the report provides basic information on the hotel sector that will assist in an understanding of terms and general conditions precedent for hotel development in New York City.
Hotel Typologies
While North America, unlike the United Kingdom, the European Union or Australia, does not have an official common industry standard for categorizing hotels and other lodging facilities, there are commonly accepted, if not standardized, hotel categories. Overall, these categories relate to the level of service and room rates at ho-tels and generally fall into a range of between three and five classes that often include Budget/Limited Service, Mid-Level/Select Service, and Luxury/First-Class Service. Additional descriptive categories may include boutique, extended stay, and conference/convention center. However, as there are no specific official standards for each of these categories, individual hotels may vary.
A major consideration of the Consultant Team in defining hotel typologies stemmed from its reliance on STR data. STR, the nation’s premier firm for tracking supply and demand data for multiple hotel market sectors, uses a six-tier categorization system primarily based on room rates rather than on a general assessment of hotel qual-ity, amenities or other features within the local markets it examines. STR’s tiers are described below.
1. ECONOMY
Examples: Econolodge, Rodeway Inn, Days Inn
2. MID-SCALE
Examples: Best Western, Quality Inn, Ramada
3. UPPER MID-SCALE
Examples: Best Western Plus, Comfort Inn, Clarion, Hampton Inn
4. UPSCALE
Examples: Best Western Premier, Radisson, Hyatt Place, Doubletree, Hilton Garden Inn
5. UPPER UPSCALE
Examples: Hilton, Radisson Blu, Kimpton, Sheraton, Hyatt Regency, Marriott, Wyndham
6. LUXURY
Examples: Ritz Carlton, JW Marriott, Conrad, Andaz, Grand Hyatt, Intercontinental
Because STR’s classifications are so focused on room rate positions within the market over other considerations, the Consultant Team decided to augment the STR classifications with definitions from three broad asset classes used by the hotel industry that are based more on featured services and amenities.

13
NEW YOR K C IT Y HOT EL MARKET ANALYSIS AND M1 ZONE I MPACTS
These asset class categories are (1) Full-Service; (2) Limited-Service; and (3) Select-Service. Limited-Service is de-fined as a hotel without restaurants or banquet facilities. The services and amenities offered to guests of limit-ed-service hotels are typically simple and might include a business center, a fitness room, a guest laundry facility, a market pantry, an indoor and/or outdoor pool and small meeting rooms. A Select-Service hotel is defined as one that offers the fundamentals of limited-service properties together with a selection of the services and amenities characteristic of full-service properties.
Generally, this means certain restaurant and banquet facilities but on a less elaborate scale than one would find at Full Service hotels. Full Service hotels offer an abundant provision of food and beverage services suitable for both guests and groups. Full Service hotels, unlike hotels in other categories, typically play a significant role in servicing the meeting and special events needs in their market area. A more detailed description of the three asset classes, as defined by US Hotel Appraisals, one of the nation’s largest firms for hotel property valuation, is presented in Appendix II.
While not a perfect correlation, it can generally be assumed that hotels classified as Upscale and Luxury by STR are Full-Service hotels, hotels classified as Midscale are Select-Service and hotels classified as Economy are Limited-Ser-vice. However, some Midscale hotels at the lower end may also be classified as Limited-Service and some Upscale hotels may be considered Select-Service. In order to define more useful and well-defined asset classes that better align with the purposes of this study, the Consultant Team collapsed STR’s six above categories into four typologies:
1. ECONOMY
This category describes the lowest tier of hotel in terms of pricing and services/amenities within the market. Many of the new hotels recently developed in areas outside of Manhattan include Economy and Mid-Level facilities.
2. MIDSCALE
This category describes mid-range, primarily nationally branded hotel properties with Limited-Service assets, such as breakfast room, business center and perhaps a fitness center. Many of the hotels that opened in West Midtown and, later in Gowanus and Long Island City can be classified as Midscale.
3. UPSCALE
Upscale hotels are generally Full Service properties with restaurants and, potentially, banquet facilities. This is the largest category of hotels in Manhattan and many newer hotels in Long Island City, Downtown Brooklyn, Jamaica and Flushing fall into this category. The new cohort of hotels in North Brooklyn is also classified as Upscale, more so than in any other submarket. Properties in North Brooklyn tend to be inde-pendent rather than branded.
4. LUXURY
These are the highest and most expensive hotel properties in the city, equivalent to “five-star” properties that attract the global elite. As of today, there are no Luxury hotel properties outside Manhattan.

14
NEW YOR K CI TY DEPA RTMENT OF C ITY PLANNING
Land Use Controls
Transient hotels (Use Group 5) are permitted as-of-right in C4, C5, C6, C8, C1-5 and C2-5 districts and equivalents. In C2-1 through C2-4 districts hotels are permitted only within 1,000 feet of a highway interchange. Hotels are also allowed in Light Manufacturing districts (M1), which do not permit new residences, most Mixed Use Special Districts (MX) and paired M1/R districts mapped as part of other Special Purpose Districts. Hotels are prohibited in all Residential Districts and Medium and Heavy Manufacturing Districts (M2 and M3).
Special Purpose Districts have been established by the City Planning Commission to achieve specific planning and urban design objectives in defined areas with unique characteristics. While most Special Purpose Districts do not have specific controls regarding hotels, there are some exceptions. Hotel Special Permits exist in parts of Special Clinton, Hudson Square, Tribeca, and the Vanderbilt Corridor in Midtown.1 The Garment Center Special District prohibits conversion to hotels in what is known as Preservation Area 1, east of Eighth Avenue. In Preserva-tion Area 2, between 35th and 40th Streets and Eighth and Ninth Avenues, new hotel construction is permitted though conversion of larger buildings to hotel use is permitted only by authorization of the City Planning Com-mission. The Long Island City Mixed Use Special District promotes the longstanding mix of residential, commer-cial, industrial and cultural uses and features “paired districts” that, similar to MX districts, combine Manufactur-ing and Residential districts. This Special District has experienced extensive hotel development in recent years.
Geographies
In examining hotel development and its impacts on M1 districts, this report considers various geographies at dif-fering scales. First, the report evaluates New York City as a whole and then each of the five boroughs. Within Manhattan, Brooklyn and Queens, the report also considers specific submarkets, as follows (these markets are generally based on major existing tourism markets, or in the cases of Brooklyn and Queens, where recent hotel development clusters have arisen):
1 Other areas that require a Special Permit for new hotel development include: R10H districts, M1-6D districts, and the C4-7 within the Special Clinton District. Some ongoing DCP PLACES studies also propose hotel Special Permits.
ManhattanBelow 59th StreetAbove 59th Street
BrooklynDowntown/Gowanus/Red HookNorth BrooklynThe Remainder of Brooklyn
QueensLong Island CityLaGuardia/Flushing/Northern QueensJamaica/JFK
Within these submarkets, where appropriate, the report also addresses specific neighborhoods based on their differentiated markets and trends. For example, Manhattan below 59th Street includes Midtown, Midtown South, the Meatpacking District, SoHo and the Lower East Side, each of which have unique hotel inventories and demand drivers. In Brooklyn, the Gowanus neighborhood also has unique market trends that differentiate it from Downtown Brooklyn.

15
NEW YOR K C IT Y HOT EL MARKET ANALYSIS AND M1 ZONE I MPACTS
Finally, in its analysis of the geography of existing hotel supply and the identification of areas that may be ideal for new supply given demand drivers, the report overlays the zoning districts onto borough market mapping, as well as identifies Commercial corridors that would allow for future hotel development.
Maps of each borough showing existing and projected hotel development are included as Appendix III.
Hotel Development and Management
Ownership Profile of New York City Hotels
New York City’s hotels are owned by a wide array of both New York City-based and national private developers, real estate investment trusts (REITs), and investment partnerships. In its 2016 New York Hotel Intelligence Report, JLL identified New York City and, more specifically, Manhattan, as the most active hotel investment market in the world, outpacing second-place London by 40 percent and cited record hotel transaction volume in 2015. The global nature of the New York City hotel market can be seen by the fact that offshore capital, much of it from Asia but also Canada, accounted for over 70 percent of the 2015 transaction volume, up from 40 percent in 2014.2
Like in most significant hotel markets in the United States, the majority of hotel rooms in New York City (approxi-mately 62 percent) are in hotel properties that are affiliated with a national brand in a franchise agreement. These agreements are between a developer and/or owner as well as a nationally recognized hotel brand, of which there are currently over one hundred. In considering such an agreement, a hotel owner will consider where the hotel best fits the competition among branded hotel within the immediate market area, the upfront cost to affiliate, the required property physical improvements of the specific brand, the costs of doing business under the brand affiliation, and the financial benefits a specific brand may bring to the property’s operation. A hotel owner will likely collaborate with its financial partners and lenders to determine the optimal brand. Some developer/own-ers may tend to affiliate with only one company’s brands, such as Marriott, whose assortment of brands from St. Regis to W to Courtyard by Marriott to Fairfield Suites and Residence Inn run the entire range of hotel typologies from Luxury to Economy, while many developer-owners partner with a wide range of hotel brands or “flags”, the three largest of which are Marriott, Hilton and Hyatt.
Since the mid-2000s, the New York City hotel market has been transformed by locally based developer-owners who specialize in Limited-Service and Select-Service hotel projects that cater to budget travelers. These develop-er-owners have pioneered a midscale hotel product for New York City that has been very attractive to the national franchise brands. By developing a unique room layout and custom furniture, they have been able to create 200 square-foot hotel rooms that are suitable for Manhattan development sites, where the national industry stan-dard has been a minimum of 350 square feet.
2 Hotel Intelligence: New York; JLL; June 2016.

16
NEW YOR K CI TY DEPA RTMENT OF C ITY PLANNING
Putting two to three separately branded hotels in a single building, so-called “Two-pack” and “three-pack” mod-els, has also been a relatively recent phenomenon. Developer-owners of this product tend to affiliate with Econ-omy and Midscale brands, including Comfort Inn and Holiday Inn Express, though they have been expanding to Upscale brands as well. They also tend to work with the same architects, who helped pioneer the standardized hotel product. Certain developer-owners are active in specific submarkets, such as Long Island City or Jamaica.
Approximately 38 percent of the hotel rooms in New York City are independent, meaning that they are not affil-iated with any national brand. Certain Upscale independent hotels, such as the Wythe, High Line and William Vale, benefit from a fashionable reputation and a unique product. Their owners have made a conscious decision not to affiliate with a standardized national brand. Indeed, almost half of the 43,600 hotel rooms (49 percent) in New York City that are independent are either Upscale or Luxury. An additional 28 percent of the indepen-dent hotel rooms are Economy and may not meet the standards of national brands nor wish to pay the affiliation fees. For Midscale hotels that are unaffiliated, some lodging market analysts, such as Lodging Econometrics, are cautious as it is difficult for these hotels to distinguish themselves or attract guests without access to a national reservation system and recognized brand.
It should be noted that some national hotel developer-owners that almost exclusively develop flagged hotels have made a deliberate decision not to do so in New York. Texas-based MCR Development, for instance, typically affiliates with either Marriott or Hilton brands outside of New York City; yet, for their two NYC projects, they de-cided not to affiliate, as they determined such product was saturated in New York.

17
NEW YOR K C IT Y HOT EL MARKET ANALYSIS AND M1 ZONE I MPACTS
Hotel Operations and Management
Hotels in New York City, similar to other markets in the country, are operated and managed in three ways:
1. Managed and operated by a third-party hotel management company. This is the most prevalent model and there are multiple hotel management companies. Real Hospitality is one of the largest hotel man-agement companies in the United States, and manages hotels of multiple brands, including Hilton and Marriott. In New York City, Real Hospitality operates hotels for numerous owners, both branded and inde-pendent, in Manhattan, Brooklyn and Queens, including the Aloft Brooklyn, Fairfield Inns Downtown and Times Square, the Sheraton Brooklyn, MOXY Downtown, BKLYN Bushwick and the Courtyard by Marriott Midtown. Other third-party hotel management companies active in New York City include Interstate Ho-tels and Resorts (based in Virginia), Hersha Hospitality Management (based in Pennsylvania), Highgate Hotels (based in New York City), and M&R Hospitality Group (based in Nassau County).
2. Managed directly by the brand. Other large brands have dedicated management arms and will directly manage hotels on behalf of property owners.
3. Managed and operated directly by the hotel owner. Some hotel owners and developers have the resourc-es and expertise to manage their own hotel properties. This is particularly true for independent upscale properties such as the High Line Hotel in Manhattan’s Chelsea neighborhood and the Wythe Hotel in Williamsburg, Brooklyn.
The large majority of hotels in New York City follow Structure 1 above, and are managed by third party companies, many of which are national in scale and manage multiple hotels under multiple brands.
Hotel Construction Costs
HVS, a national hospitality-consulting firm, reported in 2016 that, while New York City is the most robust market for new hotel construction in the country, it is also the country’s most expensive construction market.3 TThe New York Building Congress reported in 2016 that construction costs in New York City are greatest on a per-square-foot basis for hospitals, followed by university academic buildings, Full-Service hotels and office space, with hard costs for Full-Service hotels averaging $700 to $800 per square foot.4 However, developers who have perfected the construction of a standardized Limited-Service or Select-Service Economy and Midscale products, have likely been able to develop hotels at lower costs.
3 US Hotel Development Cost Survey, HVS, June 2016.4 NYC Construction Outlook 2016, New York Building Congress, March 2016.

18
NEW YOR K CI TY DEPA RTMENT OF C ITY PLANNING
A mixed-use developer in Manhattan that also develops large Midscale hotels, primarily in Midtown, told the Consultant Team that general construction costs for hotels in Manhattan can be broken down as follows: land costs at $400 per square foot; construction costs (hard costs) at $400 per square foot; and soft costs at $300 per square foot. Consequently, less expensive land, often found in Light Manufacturing districts, can help lower de-velopment costs. However, sites must also meet other attributes, such as location, transportation access and neighborhood amenities to support required occupancy levels that will allow investors to meet return hurdles.
Hotel Financing Overview
Most hotels in New York City, including those built by the developers interviewed by the Consultant Team, rely on traditional financing, including a combination of investor (both institutional and individual) and developer-con-tributed equity and debt underwritten by investment banks, capital management firms and traditional lenders.
As New York’s hotel supply has increased, developers that the Consultant Team spoke with, in addition to media reports reviewed as part of the literature review, have noted that lenders have become reluctant to make loans on new hotel projects in New York City until current inventory is absorbed.In February 2017, the New York Commercial Observer reported that banks are no longer lending on new hotel projects in New York City until absorption of the current pipeline takes place and occupancy stabilizes.5
EB-5 financing has also become a popular tool for financing hotels in New York and other markets in the United States. Under the EB-5 program, a foreign national is able to receive a green card for investing a minimum of $500,000 in an area that the federal government deems properly designated as high-unemployment or other-wise economically disadvantaged. While the developers with whom the Consultant Team spoke have not used EB-5 financing, the New York EB-5 Regional Center lists a number of hotel properties across the city that have used the program. The Real Deal has also reported that a number of hotel developers in Flushing have pursued EB-5 financing for new hotel projects.6
5 Ibid.6 The Real Deal, April 21, 2017.

19
NEW YOR K C IT Y HOT EL MARKET ANALYSIS AND M1 ZONE I MPACTS
Profile of New York City Hotel Supply
Inventory and Growth Trends
OVERVIEW
As of the first quarter of 2017, STR data shows that there are 115,532 hotel rooms in over 630 hotel properties in the five boroughs of New York City. Just over 80 percent of these rooms are in Manhattan. While the number of hotel properties in Brooklyn, Queens, the Bronx and Staten Island continues to grow, this latter group of hotels, consists of smaller hotels on average, with a median room count that is generally 50 percent or less than proper-ties in Manhattan.
FIGURE 1: NEW YORK CITY HOTEL AND ROOM SUPPLY 2007 – 2017
ROOMS HOTELSNote: (a) Includes hotel inventory as of April 2017.
Source: STR, 2017.
Current Conditions
0
20000
40000
60000
80000
100000
120000
Room
s
0
100
200
300
400
500
600
700
Hot
els381
2008
76,821
357
2007
73,692
412
2009
81,629
453
2010
88,408
472
2011
90,969
494
2012
93,250
526
2013
98,682
556
2014
103,570
594
2015
108,441
623
2016
113,908
632
2017(a)
115,532

20
NEW YOR K CI TY DEPA RTMENT OF C ITY PLANNING
RECENT HOTEL SUPPLY BOOM
Over the past decade, the New York City hotel market has been in the midst of a substantial growth in supply. The hotel room inventory increased by 42 percent since 2010, with over 33,900 new hotel rooms delivered through 220 new hotel properties. The five years between 2012 and 2016 saw over 23,000 new hotel rooms come online in New York City, a 22 percent increase over the number of rooms that came online during the previous five-year period. To underscore the significance of the recent hotel boom in New York, over one-third (35.3 percent) of all hotel properties in the five boroughs, representing 29 percent of all hotel rooms, have been delivered since 2010, with another 24,200 rooms in 170 hotels under construction as of June 2017. 1
STRONG GROWTH IN BROOKLYN AND QUEENS
While a majority of these new hotel rooms are in Manhattan, the recent supply growth has also been character-ized by what can be described as an explosion in hotel development outside of Manhattan. Of the approximately 20,000 hotel rooms currently existing in Brooklyn, Queens, the Bronx and Staten Island, over 52 percent have been delivered in the past seven years. While this growth is slowing, still almost one-third (30 percent) of hotel rooms in the development pipeline are located in outside of Manhattan.
Trends in Geography
MANHATTAN’S SHARE
Despite the growth in Brooklyn, Queens, the Bronx and Staten Island hotel development, Manhattan unques-tionably remains the largest, most diversified, and most mature hotel market in New York City by a large margin. Manhattan is home to 83 percent of New York City’s hotel rooms and the only borough in New York City to have hotels of every typology. And, while the areas outside of Manhattan have seen an unprecedented boom in new hotel development, almost 75 percent of new hotel rooms that have come online in New York City since 2010 are located in Manhattan.
CHANGE IN SUPPLY BY BOROUGH
While most of the growth in New York City hotel supply has continued to occur in Manhattan, the other boroughs, especially Brooklyn and Queens, also saw significant growth in room supply over the past decade and now ac-count for 20 percent of the hotel rooms in New York City. As of the first quarter of 2017, the office of the New York State Comptroller reported that one-third of the city’s hotel properties are now located outside Manhattan and the number of hotel properties in Brooklyn and Queens has doubled over the past ten years.2
As illustrated in Figure 2, while the majority of hotel room supply growth over the past decade has occurred in Manhattan, there has been remarkable growth in the other boroughs, with the room inventory in Brooklyn more than tripling and the room inventory in Queens almost doubling.
1 NYC Department of Buildings data provided by Department of City Planning.2 The Hotel Industry in New York City; Office of the New York State Comptroller; Feb. 2017.

21
NEW YOR K C IT Y HOT EL MARKET ANALYSIS AND M1 ZONE I MPACTS
FIGURE 2: NEW YORK CITY CHANGE IN HOTEL ROOM SUPPLY BY BOROUGH, 2007 – 2017
2007 2017 % CHANGE
MANHATTAN 64,144 95,449 48.8% BROOKLYN 1,911 5,953 211.5% QUEENS 6,553 12,264 87.2% BRONX 597 1,088 82.2% STATEN ISLAND 487 778 59.8%
TOTAL 73,692 115,532 56.1%
Source: STR, 2017.
The tilt of growth in new supply caused a shift in market share between Manhattan and the other boroughs throughout the past decade, with Manhattan’s total share of hotel room supply in NYC declining from almost 87 percent to 83 percent as illustrated in Figure 3 on the next page.
20,000 40,000 60,000 80,000 100,000 120,000
2017
2007

22
NEW YOR K CI TY DEPA RTMENT OF C ITY PLANNING
FIGURE 3: MANHATTAN & OTHER BOROUGHS’ ROOM SUPPLY 2007-2017
BROOKLYN, QUEENS, BRONX AND STATEN ISLAND (COMBINED) MANHATTAN MANHATTAN SHARE
Note: (a) Year to Date (YTD) includes January through April.
Source: STR, 2017.
0%
10%
20%
30%
40%
50%
60%
70%
80%
90%
100%
0
20,000
40,000
60,000
80,000
100,000
120,000
87.0%
2007 2008 2009 2010 2011 2012 2013 2014 2015 2016
82.6%
2017(a)

23
NEW YOR K C IT Y HOT EL MARKET ANALYSIS AND M1 ZONE I MPACTS
SELECT SUBMARKETS OUTSIDE OF MANHATTAN
In the four boroughs outside Manhattan, hotel development is concentrated in a relatively small number of sub-markets – notably, Long Island City, LaGuardia/Flushing, and Jamaica/JFK in Queens; and Downtown Brooklyn/Gowanus and Williamsburg/Greenpoint in Brooklyn. These five submarkets together account for almost 70 per-cent of all hotel properties and 82 percent of all hotel rooms outside of Manhattan. Put another way, of the 8,715 hotel rooms in Brooklyn, Queens, the Bronx and Staten Island that have been delivered since 2010, 82 percent of them are located in these five submarkets, with Downtown Brooklyn/Gowanus accounting for a quarter of this total and Long Island City accounting for almost 20 percent. Based on stakeholder interviews and market reports, principal factors driving hotel growth in these submarkets are as follows:
• Proximity to Manhattan• Access to public transportation (principally subway lines) • Presence of services and amenities in neighborhood • Significant office or commercial market• Existing critical mass of hotels in neighborhood (most hotel are market followers not market leaders)• Land Value• Proximity to airports• Proximity to neighborhoods (family visitation) • Ability to develop hotels as-of-right without zoning changes
TRENDS IN LOCATION BY ZONING DISTRICT
Over the past ten years in New York City, there has been a marked trend of increased hotel development in M1 districts, as illustrated in Tables 1A and 1B. This is particularly true in the boroughs outside Manhattan where 40 percent of the hotel rooms that have come online in the past ten years have been located in M1 districts. While a much larger portion of new hotel development in Manhattan has been developed in Light Manufacturing districts than in previous years as well, almost 80 percent of hotel rooms delivered in Manhattan since 2008 have been lo-cated in Commercial or Special Districts, compared to almost 64 percent in the four other boroughs combined.
Hotel clustering in M1 districts in boroughs other than Manhattan is noteworthy. Over 75 percent of the hotel rooms built in M1 districts outside Manhattan in the past ten years are located in just four clusters, excluding JFK Airport. These M1 hotel clusters are 1) Long Island City, 2) Jamaica, 3) North Brooklyn and 4) Gowanus. While it is true that zoning in these areas facilitates the development of hotels, through lower parking requirements and height and setback regulations suited to hotels, developers are choosing to locate in these submarkets for multi-ple factors, including their proximity to transportation, business centers and access to Manhattan. For instance, more hotel rooms in Jamaica are built in Commercial districts near the AirTrain than in M1 districts further afield. And while fast-growing Long Island City accounts for 16.5 percent of the hotel rooms in the M1 zones outside Man-hattan, STR data shows that half of the hotel rooms in Long Island City have located in the paired M1/R zoning districts, due to better access to Queens Plaza and the transportation hub.

24
NEW YOR K CI TY DEPA RTMENT OF C ITY PLANNING
Maps for each borough, included as Appendix III, show the development patterns in both M1 and non-Manufac-turing districts across the city. The maps also distinguish hotel properties built before 2010, hotel properties built after 2010, and hotels that are in the development pipeline.
TABLE 1A: PERCENTAGE OF HOTEL ROOMS BY ZONING DISTRICT, ALL INVENTORY 2017
M1 NON-MANUFACTURING
CITYWIDE 13.1% 86.9%MANHATTAN 9.2% 90.8%OTHER BOROUGHS 31.4% 68.6%
Source: STR, 2017.
TABLE 1B: PERCENTAGE OF HOTEL ROOMS BY ZONING DISTRICT, INVENTORY BUILT 2008 - 2017
M1 NON-MANUFACTURING
CITYWIDE 24.2% 75.8%MANHATTAN 20.1% 79.9%OTHER BOROUGHS 36.5% 63.5%
Source: STR, 2017.
Trends in Typology and Services
In addition to the increasing geographic diversity of New York City’s hotel market, reflecting the hotel construc-tion boom in particular in Brooklyn and Queens, several other notable changes have occurred within the city’s hotel supply since 2007, including a shift in the mix of hotel typologies, a change in overall average hotel size measured by number of rooms, and a modest redistribution by borough and commensurate shift in Manhattan’s market share. With the recent boom in hotel supply, there has also been a notable downward shift in the average age of hotel properties in the city. As of 2017, the average hotel property in Manhattan is 34 years old, while in the other boroughs the average hotel property is 14 years old. The median hotel age in Manhattan has decreased from 15 years to eight years. In Brooklyn, the average hotel property is eight years old, while the median hotel property is only six years old.

25
NEW YOR K C IT Y HOT EL MARKET ANALYSIS AND M1 ZONE I MPACTS
GROWING SHARE OF MIDSCALE HOTELS
As of the first quarter of 2017, just over half of the 115,500 hotel rooms in the five boroughs of New York City are categorized by STR as “Upscale.” These include such hotel brands as Marriott, Hilton, Sheraton, Club Quarters, and Doubletree, in addition to independent properties like the High Line Hotel, the Roosevelt Hotel, the Roger Smith and the William Vale. Despite a 56 percent increase in the inventory of Upscale rooms in the past decade, the share of the inventory classified as Upscale actually dropped slightly from 52.6 to 52.4 percent. Midscale class hotel rooms were the only scale that saw its share increase in the past decade. Midscale hotel rooms make up the next second largest segment of the inventory at a 20 percent share, while the inventory of Luxury and Economy class rooms trails at 15 percent and 12 percent respectively.
While all classes of hotel rooms have seen considerable growth over the past decade, the inventory of Midscale hotel rooms in the five boroughs has almost doubled in the past decade. In comparison, the inventory of Econo-my class hotels increased by 26 percent, the inventory of Luxury by 49 percent, and the inventory of Upscale by 56 percent. Despite absolute growth across all four typologies of hotels, Figure 4 emphasizes the relatively stronger growth of the Midscale category of hotel in New York City, showing that Midscale saw its share of rooms grow by 4 percent the past decade, while all other typologies saw their respective shares drop, with Economy experiencing the steepest decline at just over 3 percent.
The substantial growth of Upscale class hotels in New York City reflects national trends. Cushman & Wakefield’s April 2017 overview of the US lodging market, relying on STR data, reported that, in the 25 largest US hotel mar-kets between 2015 and 2016, the Upscale class of hotels experienced the largest growth by far at 7 percent. Luxury class hotels grew by over 3 percent while Upper Midscale, which this report has collapsed into a larger Midscale class, grew by almost 4 percent. Midscale and Economy class hotels saw a slight decline of less than 1 percent.3
FIGURE 4: NEW YORK CITY ROOMS BY TYPOLOGY 2007 & 2017
ECONOMY MIDSCALE UPSCALE LUXURYSource: STR, 2017.
3 Cushman & Wakefield US Lodging Industry Overview April 2017.
Percent of Total Room Count
11,450 Rooms15.5%
38,770 Rooms52.6%
11,857 Rooms16.1%
11,615 Rooms15.8%2007
201714,418 Rooms
12.5%23,301 Rooms
20.2%17,268 Rooms
14.9%60,545 Rooms
52.4%
26
NEW YOR K CI TY DEPA RTMENT OF C ITY PLANNING
INVENTORY DIVERSITY
Manhattan remains, by far, the most diverse hotel market of the five boroughs and the only borough that includes hotels classified in all STR typology classes. While Manhattan still accounts for 75 percent of the rooms that have come online in the past decade, the four other boroughs comprise a significant share of those rooms that are Economy and Midscale class. Of the 2,968 Economy rooms that have been delivered during the past 10 years, 70 percent of these have been in the boroughs other than Manhattan, with Queens claiming the largest share. Of the 11,444 Midscale rooms that have come online, 40 percent have been located outside Manhattan with two-thirds of that share in Queens.
Boutique hotels, which the Consultant Team is defining as small independent Upscale or Luxury hotels of less than 100 rooms, is still dominated by Manhattan, with over 90 percent of the approximately 4,000 rooms in the city that can be categorized as boutique located in there. However, boutique hotels are also a growing typology in the boroughs outside Manhattan, though this market is still dominated by Manhattan. Brooklyn represents a small but growing market for boutique hotels, with 330 rooms. These have all come online since 2010 and are generally located in the North Brooklyn and Downtown/Gowanus submarkets.
DECREASING AVERAGE HOTEL SIZE
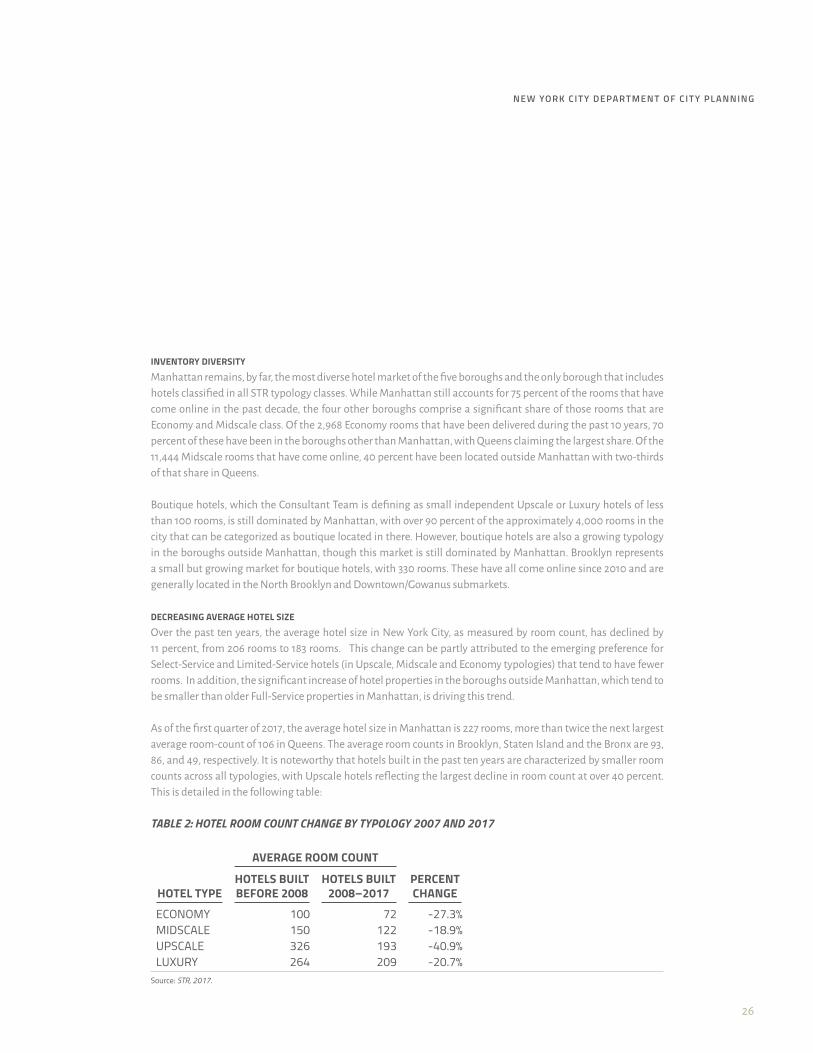
Over the past ten years, the average hotel size in New York City, as measured by room count, has declined by 11 percent, from 206 rooms to 183 rooms. This change can be partly attributed to the emerging preference for Select-Service and Limited-Service hotels (in Upscale, Midscale and Economy typologies) that tend to have fewer rooms. In addition, the significant increase of hotel properties in the boroughs outside Manhattan, which tend to be smaller than older Full-Service properties in Manhattan, is driving this trend.
As of the first quarter of 2017, the average hotel size in Manhattan is 227 rooms, more than twice the next largest average room-count of 106 in Queens. The average room counts in Brooklyn, Staten Island and the Bronx are 93, 86, and 49, respectively. It is noteworthy that hotels built in the past ten years are characterized by smaller room counts across all typologies, with Upscale hotels reflecting the largest decline in room count at over 40 percent. This is detailed in the following table:
TABLE 2: HOTEL ROOM COUNT CHANGE BY TYPOLOGY 2007 AND 2017
HOTEL TYPE
AVERAGE ROOM COUNT
PERCENT CHANGE
HOTELS BUILT BEFORE 2008
HOTELS BUILT 2008–2017
ECONOMY 100 72 -27.3%MIDSCALE 150 122 -18.9%UPSCALE 326 193 -40.9%LUXURY 264 209 -20.7%
Source: STR, 2017.

27
NEW YOR K C IT Y HOT EL MARKET ANALYSIS AND M1 ZONE I MPACTS
HOTEL SERVICES TREND: INCREASING SELECT SERVICE PROPERTIES
STR has noted the increasingly dominant position that Select Service hotels have in major United States hotel markets, and this trend is reflected in the New York City market as well. As of 2015, Select Service hotel rooms ac-counted for 70 percent of all rooms added to the United States supply. In its 2016 Hotel Intelligence Report for the New York City Market, JLL reports that two-thirds of the hotels that opened in New York City in 2015 were Select Service, and that 70 percent of the hotel projects in the pipeline for the next three years are Select Service as well.
Hotel developers with whom the Consultant Team spoke confirmed this trend in New York City and noted that Select Service encompasses both Midscale and Upscale hotel properties. As noted earlier in this report, Select Service hotels offer some Full Service amenities such as breakfast, a business center and a fitness center but do not have other amenities such as a restaurant, dedicated food and beverage and banquet facilities, large meeting rooms or a concierge. Business Travel, a trade publication for the hotel industry, reports that while most Select Service hotels have been in Upscale and upper Midscale typologies, Hilton, Best Western, Marriott and others are developing Select Service products in the lower Midscale tier.
Hotel developers report that they like Select Service hotel products because they are less expensive to develop and offer a better return on investment. Both interviewees and trade journals report that in today’s climate it is much easier to receive bank financing for construction of a Select Service hotel product (both Midscale and Upscale) than it is to secure financing for a Full Service project. Full Service hotels are much more expensive to construct and renovate and therefore viewed as a riskier investment. Customers prefer Select Service because they are viewed as less formal and a greater value for the price.
DIMINISHING AVERAGE SIZE OF MEETING SPACES
With the increase in Select Service hotel product comes a decrease in meeting space. Indeed, hotels built in New York City since 2010 can be characterized by the diminished size of their meeting spaces when compared to older hotels in the city. This is partly due to the large number of Midscale Select Service hotels that have been developed over the past decade, many of which have forgone the larger meeting spaces due to the economics of the market or, in many cases, the smaller development footprints that do not allow for large ballrooms and conference rooms.
The lack of large meeting spaces is especially evident in the boroughs outside Manhattan, where the average prop-erty delivered since 2010 has only 952 square feet of meeting space compared to over 1,300 square feet in Manhat-tan. Of the 220 properties delivered during that time across the city, 46 percent had no meeting space at all.
In interviews the Consultant Team held with economic development officials in Queens and Brooklyn, the lack of adequate large meeting space in local hotels was recognized as a shortcoming that adversely impacts businesses in those boroughs. However, developers that we spoke with pointed to the lack of sufficient development parcels, particularly in Manhattan that are able to accommodate such space. Developers also noted that guestrooms are more lucrative than banquet facilities and therefore, such facilities are often economically not sustainable in new hotel development.

28
NEW YOR K CI TY DEPA RTMENT OF C ITY PLANNING
New York City Hotel Demand Drivers
New York City is one of the largest and most diverse travel and tourism markets in the Western Hemisphere and demand for hotel rooms of all typologies has historically kept up with supply, even with the tremendous increase in supply that the five boroughs of the city have seen in the past decade.
The hotel industry in New York City depends on demand from both domestic United States-based travelers and overseas visitors. Although the Great Recession impacted travel, especially by U.S. residents, overall visitation to New York City has recovered significantly since then, reaching record levels in 2016. Specifically, visitors to NYC grew from 47 million in 2007 to 60.7 million in 2016, an increase of almost 30 percent for the period. These robust visitor numbers have led to a commensurate strong demand for hotel rooms, as reflected by annual average oc-cupancy rates, described further in the section below. New York City consistently averages 20 percentage points or more above occupancy rates for the country as a whole.
Visitor Profile and Market Segments
Of the 60.3 million visitors who came to New York City in 2016, approximately 79 percent were domestic and 21 percent were international in origin. Domestic travel, at 47.6 million, grew over 3 percent from 2015 to 2016, while international travel, at 12.7 million, grew by 3.3 percent from 2015 to 2016.4
Growth in international visitorship has slowed since its peak growth in 2012-2013, when it grew by 5.5 percent. NYC & Company stated that this slower than usual growth in international visitors may have been impacted by unfavorable exchange rates and weak economic growth in many Western European countries that are major sources of visitors to New York. Asian markets however – particularly China, South Korea and India – have shown strong performance, and China has now surpassed Canada and Brazil as source countries for New York visitation.
According to NYC & Company, international travelers tend to book longer hotel stays than domestic travelers and spend about four times more per day on average. Further, both hotel owners/operators and local econom-ic development officials stated that many international travelers, particularly Europeans, are more intrepid and comfortable using public transportation and thus more likely to stay in boroughs other than Manhattan; in hotels that are close to subway lines.
4 NYC & Company, 2017.

29
NEW YOR K C IT Y HOT EL MARKET ANALYSIS AND M1 ZONE I MPACTS
The 2016 MasterCard Global Destination Cities Index notes that New York City is the largest market in the Western Hemisphere when measured by international overnight visitors and spending, though it ranks behind Dubai and London in the spending category. The MasterCard Global Index also states that international visitors spend about 30 percent of their total expenditures on accommodations while in New York on accommodation, on par with New York’s global peers except Paris, where the proportion is 45 percent.5
• Leisure travel is the principal catalyst for visitors to New York, both international and domestic, and has driv-en the increases seen in 2016. Leisure travel, which at 48.2 million people in 2016 accounted for almost 80 percent of all visitors to New York City that year, has seen continual increases for much of the past decades, growing over 8 percent since 2014 and by 4.2 percent in the last year. Vacation travel accounts for 75 percent of leisure travel. Visiting friends and relatives also remains an important segment of the leisure market, though NYC & Company does provide a specific percentage for this share of the market. In its 2014 Annual Report, the most recent data regarding this segment, NYC & Company reported that 19 percent of leisure travelers in general were in New York City to visit friends and family. While there is no specific data as to what percentage of this segment is staying in hotels, anecdotal conversations with hotel managers and de-velopers indicate that it is viewed as an important market, particularly in the boroughs outside Manhattan.6
• Business travel accounts for just over 20 percent of visitors to New York City and is almost equally split between groups (6.2 million) and individuals (6.1 million). While business travel has historically been fo-cused on Manhattan, many submarkets – particularly Long Island City, Jamaica and Downtown Brooklyn – have developed strong business visitor sectors in recent years.7
• Group travel is a vital component of the business travel sector in New York and the city’s largest single draw for group travel is the Javits Convention Center. One of the largest and busiest convention centers in the country, the 840,000 square feet of exhibition spaces saw over 2.1 million attendees to conventions, trade shows, and public events in 2015. Numerous other exhibition venues around the City and hotels with in-house meeting facilities also draw group demand.
Large conventions held at the Javits Convention Center are another driver of hotel demand in New York City. Larg-er Midtown hotels such as the Marriott Marquis, Sheraton and Hilton, which also have their own internal meeting rooms, accommodate this demand to a large extent. Hotel developers in Manhattan with whom the Consultant Team spoke noted that convention business is very important, particularly for hotels in Midtown and the West Side. In its 2015 Annual Report, NYC & Company stated that, there were 664 convention meetings in New York City in 2015, a 5 percent increase from 2014. These conventions in 2015 attracted 6.1 million attendees, translating to 247,000 booked hotel room nights. NYC & Company further noted that 89 percent of these attendees were domestic while 11 percent were international.8
5 MasterCard Global Cities Index 2016.6 NYC & Company Annual Summary 2016–2017.7 Ibid.8 NYC & Company Annual Report 2015.

30
NEW YOR K CI TY DEPA RTMENT OF C ITY PLANNING
FIGURE 5: NEW YORK CITY DOMESTIC AND INTERNATIONAL VISITORS, 2010-2016, MILLIONS OF VISITORS
DOMESTIC INTERNATIONALSource: NYC & Company, 2017.
HOTEL INCENTIVES, AUTHENTICITY/EXPERIENCE, AND LOCATION
While NYC & Company does not track such preferences, based on the Consultant Team’s conversations with hotel developers, owners and operators, demand is also influenced by hotel loyalty/reward programming and location. Many travelers – both business and leisure – are driven significantly by hotel point and award systems and choose to stay in flagged hotel properties that provide them with those points.
Coupled with this trend, both developers and economic development officials told the Consultant Team that an in-creasing number of visitors, both business and leisure, are seeking out boutique and independent hotels that pro-vide a unique New York experience, which is reflected in the number of independent hotels opening in downtown Manhattan, parts of Brooklyn and Long Island City in Queens. Large hotel brands, such as Hilton and Marriott, have also responded to this trend by opening what are called “soft brand” hotels, such as Hilton’s Curio collection and Marriott’s Autograph collection which endeavor to create unique, smaller and less standardized properties that de-emphasize the corporate flag and can be perceived as boutique-style hotels while still providing access to Hilton and Marriott’s reservation and rewards systems. Examples of these include the Renwick Hotel in East Midtown (a Curio collection hotel) and the Carlton Hotel near Madison Square (an Autograph collection hotel).
05
101520253035404550556065
9.7
2010
10.6
2011
10.9
2012
11.5
2013
12
2014
12.3
2015
39.1 40.3 41.8 42.8 44.5 46.2 47.6
12.7
2016

31
NEW YOR K C IT Y HOT EL MARKET ANALYSIS AND M1 ZONE I MPACTS
Trends in Occupancy and Room Rates
Stable Occupancy Rates
New York City is a very stable hotel market in terms of room occupancy and has consistently seen occupancy rates in the mid- to high-80s for much of the past decade. This high occupancy rate has sustained itself, even with the remarkable growth in supply during this period, indicating that supply is keeping up with growing demand. As seen in Figure 6, New York City’s occupancy rate also consistently exceeded the national occupancy rate for the five years between 2010 and 2014 by about twenty percentage points. NYC & Company determined that the 2015 average occupancy rate in New York City in 2015 to be 88 percent, while STR data shows the average 2015 occu-pancy rate to be 85.3 percent. STR data further shows that the average occupancy rate in 2016 increased slightly to 85.9 percent. As of the first quarter of 2017, STR reported that New York City had the highest hotel occupancy rate in the nation at 86 percent, just slightly higher than that of San Francisco (over 85 percent) and considerably higher than those of Washington, D.C., Miami and Chicago (76 percent, 77 percent, and 80 percent respectively.)
FIGURE 6: NEW YORK CITY AND US HOTEL OCCUPANCY RATES
NEW YORK CITY HOTEL OCCUPANCY U.S. HOTEL OCCUPANCYSource: STR, 2017.
At the borough level, occupancy rates remain equally high with Manhattan, Queens and Brooklyn all showing occu-pancy rates from the high-70s to mid-80s, on par or above the average occupancy rates of New York City’s peer mar-kets, as noted above. While Brooklyn did see a small decline in occupancy in 2016, from 79.5 percent to 78.1 percent, Manhattan and Queens both saw small increases. The Bronx and Staten Island, both much smaller markets that have not seen the growth in supply as experienced in the other boroughs, are somewhat outliers. The Bronx experienced the steepest decline in occupancy rates, from 77 percent to 72 percent over the past year, suggesting that new rooms are absorbing slowly.
80.8%
57.6%
2010
81.2%
60.1%
2011
84.4%
62.3%
2013
83.6%
61.4%
2012
64.4%
2014
84.7%

32
NEW YOR K CI TY DEPA RTMENT OF C ITY PLANNING
Nevertheless, Staten Island, which has historically had an average occupancy rate well below those of the other bor-oughs saw a healthy increase in its average occupancy rate between 2015 and 2016, from 65.9 percent to 70.3 percent 9
FIGURE 7: HOTEL OCCUPANCY RATES BY BOROUGH, 2015 AND 2016
2015 2016Source: STR, 2017.
Pressure on Average Daily Rates and Hotel RevenuesBetween 2011 and 2017, ADR increases have generally been quite healthy in areas outside of Manhattan, from 18 percent in Queens to 14 percent in Staten Island to 12 percent in Brooklyn and the Bronx. Over the past two years though, STR data shows that the pressure on ADR has been more pronounced. ADR experienced a 2.7 percent decline in Manhattan, a 7 percent decline in Staten Island and a 1.5 percent decline in Brooklyn. These changes indicate that hotels are lowering ADRs to maintain occupancy rates, which have remained stable. In areas where occupancy is stable and ADRs are stable, new supply is keeping up with demand. In areas where occupancy rates are high and ADRs are increasing, supply is not keeping up with demand.
Recently, the unprecedented growth in new hotel rooms has put pressure on the overall market. In its latest an-nual summary for 2016, NYC & Company stated that rapid growth in New York City’s hotel supply has outpaced strong demand growth, putting pressure on ADRs.
9 STR Data, 2017.
Staten Island
70.3%65.9%
Manhattan
86.8%86.2%
Brooklyn
84.6%83.0%
Queens
78.1%79.5%
Bronx
72.4%77.0%

33
NEW YOR K C IT Y HOT EL MARKET ANALYSIS AND M1 ZONE I MPACTS
NYC & Company noted that in 2016, ADR fell almost 3.5 percent from 2015 rates, from $291 to $281 citywide.10 This trend was corroborated by our conversations with hotel developers in Manhattan, Staten Island, Queens and Brooklyn, who also recognized that ADR has been flat or declined recently, as well as in some instances over the past few years. In the case of Staten Island, where hotel rates are already among some of the lowest in the city, one of the borough’s most established hotel developers stated that the recent increase in supply on Staten Island has made his business very difficult with continual drops in ADR.
FIGURE 8: NEW YORK CITY AVERAGE DAILY RATE AND OCCUPANCY 2011–2016
AVERAGE DAILY RATE OCCUPANCY (%)Source: STR, 2017.
Revenue per available room (RevPAR), which the lodging industry sees as a more accurate performance indicator, has seen similar declines. The Real Deal reported that, as of the first quarter of 2017, RevPAR in New York City as a whole dropped 2.3 percent compared to the same period in the previous year. This is the second year in a row of such drops, and JLL and STR noted a similar drop in RevPAR in New York City in the first quarter of 2016. According to STR data, this places New York City significantly behind its peer cities of Los Angeles, San Francisco and Wash-ington, D.C., which all saw RevPAR increases, as illustrated in the following table:
10 NYC & Company Annual Survey 2016-2017.
60%
65%
70%
75%
80%
85%
90%
$0
$50
$100
$150
$200
$250
$300
$350
82.4%
2011
$251.35
2012
85.0%
$258.33
85.8%
2013
$265.24
85.7%
2014
$269.98
.85 3%
2015
$264.58 $258.04
85.9%
2016

34
NEW YOR K CI TY DEPA RTMENT OF C ITY PLANNING
FIGURE 9: REVPAR GROWTH BY CITY, Q1 2016
Source: STR, 2017.
-10% -5% 0% 5% 10% 15%
Los AngelesSan Francisco
NorfolkNashville
AtlantaAnaheim
TampaOrlando
DallasOahu
Washington DCSt. Louis
Total U.S.SeattleDetroit
MinneapolisSan Diego
PhiladelphiaPhoenix
New YorkDenverBostonMiami
ChicagoNew Orleans
Houston
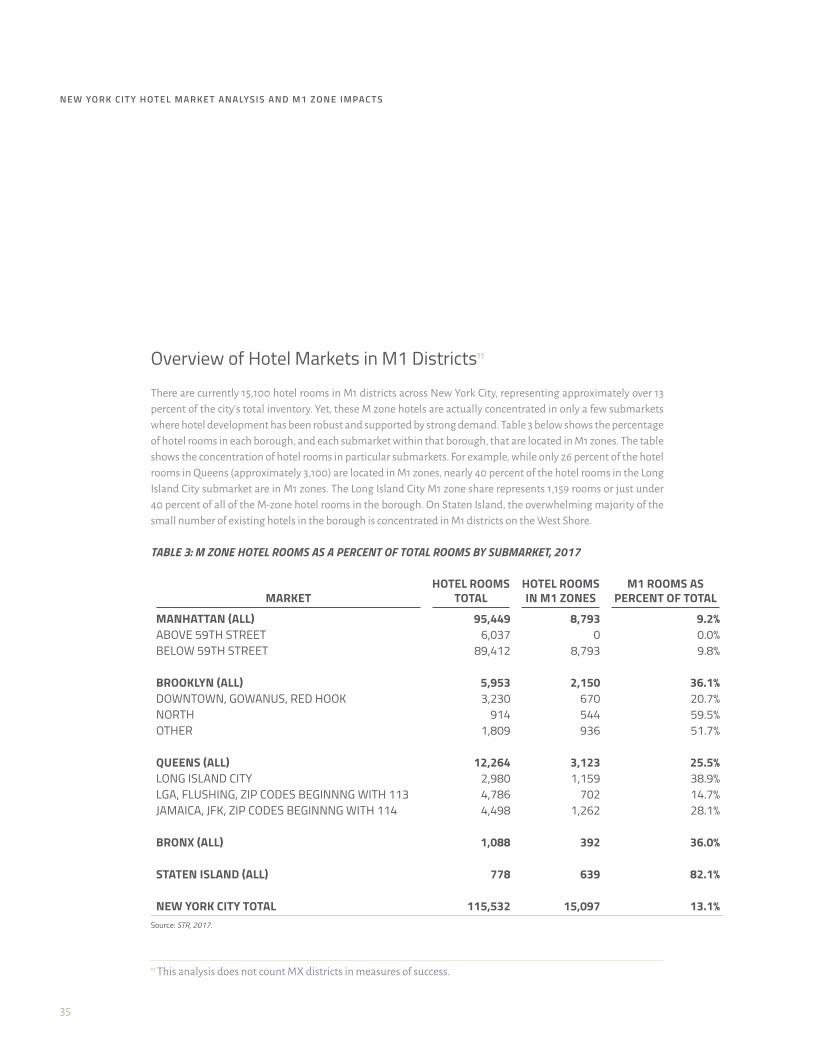
35
NEW YOR K C IT Y HOT EL MARKET ANALYSIS AND M1 ZONE I MPACTS
Overview of Hotel Markets in M1 Districts11
There are currently 15,100 hotel rooms in M1 districts across New York City, representing approximately over 13 percent of the city’s total inventory. Yet, these M zone hotels are actually concentrated in only a few submarkets where hotel development has been robust and supported by strong demand. Table 3 below shows the percentage of hotel rooms in each borough, and each submarket within that borough, that are located in M1 zones. The table shows the concentration of hotel rooms in particular submarkets. For example, while only 26 percent of the hotel rooms in Queens (approximately 3,100) are located in M1 zones, nearly 40 percent of the hotel rooms in the Long Island City submarket are in M1 zones. The Long Island City M1 zone share represents 1,159 rooms or just under 40 percent of all of the M-zone hotel rooms in the borough. On Staten Island, the overwhelming majority of the small number of existing hotels in the borough is concentrated in M1 districts on the West Shore.
TABLE 3: M ZONE HOTEL ROOMS AS A PERCENT OF TOTAL ROOMS BY SUBMARKET, 2017
MARKETHOTEL ROOMS
TOTALHOTEL ROOMS IN M1 ZONES
M1 ROOMS AS PERCENT OF TOTAL
MANHATTAN (ALL) 95,449 8,793 9.2%ABOVE 59TH STREET 6,037 0 0.0%BELOW 59TH STREET 89,412 8,793 9.8%
BROOKLYN (ALL) 5,953 2,150 36.1%DOWNTOWN, GOWANUS, RED HOOK 3,230 670 20.7%NORTH 914 544 59.5%OTHER 1,809 936 51.7%
QUEENS (ALL) 12,264 3,123 25.5%LONG ISLAND CITY 2,980 1,159 38.9%LGA, FLUSHING, ZIP CODES BEGINNNG WITH 113 4,786 702 14.7%JAMAICA, JFK, ZIP CODES BEGINNNG WITH 114 4,498 1,262 28.1%
BRONX (ALL) 1,088 392 36.0%
STATEN ISLAND (ALL) 778 639 82.1%
NEW YORK CITY TOTAL 115,532 15,097 13.1%
11 This analysis does not count MX districts in measures of success.
Source: STR, 2017.

36
NEW YOR K CI TY DEPA RTMENT OF C ITY PLANNING
Recent Hotel Growth in M1 Districts
While the recent period of high growth in New York City’s hotel supply has been a boon to the city’s overall econ-omy, a large portion of the new development has taken place in areas of the city that are zoned for Light Manu-facturing (M1) where, in addition to industrial, commercial and retail uses, hotel development is mostly allowed as-of-right. Since 2010, roughly one fifth of all new hotel rooms in the five boroughs are located in M1 zones. Outside Manhattan, the portion of new hotel rooms in M1 zones is 31 percent.
Many of the largest new clusters of hotels in the outer boroughs, such as Long Island City, Jamaica, Flushing, Gowanus, and Sunset Park, are within M1 or mixed-use zoning districts. While another significant outer borough hotel submarket, Downtown Brooklyn, does not include M1 zones, the M1 corridors extending from Downtown, along Atlantic Avenue and 4th Avenue, have developed noteworthy clusters of hotel development. On Staten Is-land, all three hotels built since 2010 have been built in M1 zones in the borough’s West Shore.
Typology of Hotels in M1 Districts
The typology of hotels built in M1 districts across the city in the past decade differs greatly between Manhattan and the other boroughs, with the inventory in Queens, Brooklyn, the Bronx and Staten Island more dominated by Budget and Economy properties.
Examining the hotels built in M1 districts across the five boroughs in the past decade, the distribution of hotel rooms by typology is very similar to the distribution by typology in all zoning districts, with approximately half of the rooms classified as Upscale, one-third Midscale and the remaining 20 percent distributed fairly equally between Economy and Luxury. However, excluding Manhattan and considering only those hotel rooms built in M1 districts in the four other boroughs in the past decade, almost one third of the inventory is Economy and almost one-half is Midscale. Upscale accounts for less than one quarter and there are no Luxury class hotel properties. The breakdown of hotel types in M1 districts as compared to all zoning districts is detailed in the following table:
TABLE 4: PERCENTAGE OF HOTEL ROOMS BUILT AFTER 2007 BY TYPE
ALL ZONING DISTRICTS M1 DISTRICTS
(ALL BOROUGHS) (ALL BOROUGHS)(OTHER BOROUGHS,
EXCLUDING MANHATTAN)
ECONOMY 2,968 (7.1%) 1,197 (11.8%) 1,197 (31.1%)MIDSCALE 11,444 (27.4%) 3,079 (30.4%) 1,789 (46.5%)UPSCALE 21,775 (52.0%) 4,781 (47.1%) 859 (22.3%)LUXURY 5,653 (13.5%) 1,083 (10.7%) 0 (0.0%)TOTAL (ALL CLASSES) 41,840 (100%) 10,140 (100%) 3,845 (100%)
Source: STR, 2017.

37
NEW YOR K C IT Y HOT EL MARKET ANALYSIS AND M1 ZONE I MPACTS
HOTEL DEVELOPMENT CHARACTERISTICS IN M1 DISTRICTS
M1 districts in New York City encompass a diverse cohort of areas in all five boroughs in which a wide range of new uses and investments have occurred in the past decade. These investments, both for new construction and conversion to permitted uses, have been made based on the specific characteristics of their respective locations. M1 districts that are in Manhattan or near subway stations that provide easy access to Manhattan, have attracted a variety of uses, including hotels, for which this proximity is valuable. M1 districts farther from Manhattan and/or not convenient to subway transit have experienced less hotel development.
Hotels may be developing in these M1 districts because they are one of the uses that provides developers and investors with the threshold rate of return for allowable development based on zoning regulations, demand, and development feasibility. The highest-return use is typically defined by:
• Use is allowed under existing zoning• Market demand exists; and• Development is feasible and provides the highest return of all allowable uses.
Since residential development is not allowed in M1 districts (with some exceptions), hotels are competing with office, retail, mini-storage, ambulatory care, entertainment, industrial and several other use types for develop-able land. Significant competing uses, for which investment has recently occurred in M1 districts, are as follows:
• Office: In certain M1 districts in Brooklyn and Queens, there is increased activity in the office market. However sites need to be available and zoning regulations aligned to support office development. Office uses tend to require a relatively large footprint, for which site assemblage is often necessary. Accordingly, in terms of new development, office uses often lag behind hotel uses, which can locate on small infill sites. In addition, due to the high cost of construction, rents for office uses in M zones may not be high enough to justify ground up development. Developers are typically unwilling to undertake office projects “on spec” or without an anchor tenant, and banks may require higher equity contribution due to the per-ceived higher risk of this development program. Depending on the demand, market rents, availability of capital, and available sites, office is a potential highest-return use in a Light Manufacturing district, as it has become in many parts of Manhattan.
• Industrial: Industrial uses do not often provide a threshold rate of return for new development, since in-dustrial spaces typically generate lower rents than commercial users. Specialized industrial space pres-ents higher returns, but is very expensive to build and anchor tenants are generally required before con-struction. Adding to the difficulty of new industrial development, industrial uses typically require larger sites than those that may be available in the M1 zones. However, as industrial rents are rising and sin-gle-story buildings are becoming feasible, particularly when availing themselves of City and State financ-ing programs, industrial construction does occur. Low-cost land remains available in many M1 areas that do not have high-value competing uses (outside Manhattan, northern Brooklyn and Long Island City).

38
NEW YOR K CI TY DEPA RTMENT OF C ITY PLANNING
• Stand-Alone Retail: Retail uses work best on the ground-floor, and there are many examples of sin-gle-story retail in M1 districts. Stand-alone retail can generate high rents per square foot, and in some cases represents a highest-return use for a parcel,. There are fewer examples of multi-story retail devel-opments. Usually, retail can be found on the ground floor and is coupled with other uses on upper floors of multi-story buildings. Automobile and other more industrial types of retail can also be found in M1 districts. These types of retail are not dependent on foot traffic or local population for sales.
In some industrial areas, there is a low demand for local retail uses, with the exception of auto-oriented and more industrial types of retail. Local retail uses follow households, hotels, and employment centers. In transitioning areas, typically the retail follows other uses, with the exception of bellwether retailers, who are pioneers and provide the necessary “proof of concept” to other retail developers. These bellwethers tend to be independent bars and restaurants that provide a unique experience and act as destinations in their own rights.
• Mini-Storage: Mini-storage is a growth market in New York City. Due to the low operating costs and rela-tively high income, new mini-storage (aka self-storage) developments have cropped up in several higher value M1 districts in New York City, including far west Chelsea (MN), Gowanus (BK), Long Island City (QN) and Port Morris (BX). According to a report from CBRE, New York City is the most undersupplied major metropolitan market nationwide.12 Mini-storage is not without its downsides in dense urban areas, where some municipal planners have discussed ways to limit their proliferation in order to accommodate indus-trial growth, office or other more job-generating uses. Competing with both industrial and commercial office uses, self-storage is likely to continue to be a competitive development type, particularly along ma-jor roadway arteries where visual cues to their presence may drive demand.
In certain areas, the lack of suitable sites and office and/or industrial demand at pricing to justify development and an inability of many uses to take advantage of permitted development rights, means that hotels are one of the highest –return uses for M1 sites. This is particularly true because parking requirements for hotels are low relative to other uses and smaller sites developed as hotels can take advantage of bulk requirements and other favorable land use regulations to this use.
12 CBRE (2016, August 29). “Baltimore, New York, San Jose, Los Angeles and San Diego Rank As Top Five Undersupplied Markets for Self-Storage Facilities According to New CBRE Report”. Retrieved from: https://www.cbre.us/people-and-offices/corporate-offices/tysons-corner/tysons-corner-media- center/top-five-undersupplied-markets-for-self-storage-facilities-0

39
NEW YOR K C IT Y HOT EL MARKET ANALYSIS AND M1 ZONE I MPACTS
LOCATION DRIVERS OF HOTEL DEVELOPMENT M1 DISTRICTS
Hotels typically have been developed in a narrow subset of M1 districts that represent attractive tourist locations. This is because hotels prefer to be located in population centers around amenities that support the area as a tourism draw. Some of these amenities or other uses include bars, restaurants, proximity to transit, and proximity to destinations (i.e., employment centers, convention centers, tourist attractions). The more of these amenities are in a given location, the more hotels tend to locate in and around those areas. Submarkets like Long Island City, which are seeing the development of amenities and have access to transit, have seen this occur. Hotels have typically been developed in a narrow subset of M1 districts that represent attractive tourist locations.
In addition, it should be noted that hotel development can be more challenging than for other commercial uses. Hotels often have a more difficult time securing traditional financing than other uses, particularly as real estate market conditions move through economic cycles. Hotels are often among the first uses to lose financing in a softening market, and the last to regain access to financing markets during a recovery. This occurs because banks generally see hotel development as a particularly risky asset, leading to higher interest rates and fewer loan ap- provals than other asset types, even when traditional financing is available. This is one reason why the EB-5 pro- gram has frequently been used to provide a portion of hotel developments. However, when hotel development is catching up to strong demand, it is possible to experience a hotel construction boom, as happened in the past decade in New York City.
Like banks, hotel developers can also be more risk averse than other commercial developers. Often, hotel devel- opers will wait until a pioneer comes in and shows the others that hotel demand can support new construction. Once the concept has been proven, more risk averse hotel developers become willing to enter the market. This is one reason why emerging markets initially develop slowly, and then have multiple hotels applying for develop- ment. They are rushing to be part of the market, once it has been shown to exist.
In fully examining the factors that drive hotel development in all M1 districts across the city, it is also essential to examine the specific features and attributes of particular M1 zones as each submarket is characterized by its own geography, market dynamics and other unique characteristics. Based on the Consultant Team’s stakeholder interviews, data analysis and literature review, it appears that the key drivers of hotel development in New York City overall are no less important in M1 districts : proximity to Midtown and Downtown Manhattan, access to di-rect subway service, presence of services and amenities, existing clusters of hotels, in addition to land values that allow for developer return or profit.
Because of the diversity of New York City and its submarkets, demand drivers for hotels in M1 districts differ ac-cording to the specific conditions in each district. Each of the boroughs and their submarkets are described in greater detail in Section 4 (Borough and Submarket Profiles).

40
NEW YOR K CI TY DEPA RTMENT OF C ITY PLANNING
Projected Pipeline of Hotel Rooms in New York City and M1 Districts
Many media sources, from The Real Deal (“Numbers Don’t Lie: New York’s Hotel Boom is Crashing” April 2016) to Bloomberg Markets (“Real Estate Deals Vanish in New York….Developers mired in a glut of hotels”, May 18, 2017), to the New York Commercial Observer (“With Oversupply and Falling Room Rates, the Last Thing the New York Hotel Biz Needs is a Travel Ban,” Feb. 8, 2017) have recently written about oversupply and saturation in the New York City hotel market and potential slow growth in the years ahead.
JLL, in its New York Hotel Intelligence Report for 2016, however, states that, while hotel performance in New York City will be under pressure through 2017 “given the city’s elevated supply pipeline, economic volatility in major source markets, and the impact of home-sharing sites,” New York will still remain hotel investors’ top global target.” Despite recommending some caution, JLL forecasts that new hotel supply in New York should likely get absorbed by 2018, “setting the stage for a rebound in growth.” That being said, JLL also notes that RevPAR will continue to be “soft.”
In addition, analysts at Lodging Econometrics, a real estate analysis firm that serves the hospitality industry, re-ported in December 2016 that the New York City hotel construction pipeline is the largest in the United States with 192 projects and 30,540 rooms. Lodging Econometrics reports that, as of the end of 2016, there are 101 proj-ects comprising 17,711 rooms under construction and 63 projects comprising over 9,000 rooms scheduled to start construction in the next 12 months.
NYC DOB data provided by the NYCDCP and augmented by data from NYC & Company, show a hotel pipeline of 276 properties comprising 37,986 rooms both under construction and in varying phases of pre-construction. Projects under construction are relatively certain to finalize, whereas projects in the pre-construction process are less likely to go to completion. In a much more conservative forecast, the NYCOMB forecasts 3,807 additional hotel rooms being delivered in New York City between 2017 and 2021. Differences between these forecasts could be due to the temporal aspect of the OMB projections. NYC and Co’s pipeline does not have a time limit, and could take longer than four years to develop. DOB permit data, especially regarding projects in the pre-construction phase, contains permits for many projects that may be postponed, changed to something else entirely, or may even never occur.
According to the NYC DOB and NYC & Company data, Manhattan has the largest share of rooms in the pipeline (18,958 rooms), followed by Queens (10,286 rooms), and Brooklyn (6,707 rooms). Of these, 34 percent of hotels and 30 percent of rooms will be located in M1 zones. Most of the pipeline rooms in Staten Island are scheduled to be located in M1 zones (87 percent), compared to 43 percent in Brooklyn, 36 percent in Queens, 18 percent in the Bronx, and 22 percent in Manhattan. The following table shows the two phases of the pipeline hotels, including those under construction, and those in pre-construction13 within M1 zones and in total by submarket.
13 Pre-construction hotels include any hotels that have been announced, submitted development applications, and/or had applications approved, but have not yet begun construction.

41
NEW YOR K C IT Y HOT EL MARKET ANALYSIS AND M1 ZONE I MPACTS
TABLE 5A: PIPELINE HOTELS BY SUBMARKET AND ZONING
MARKET
UNDER CONSTRUCTIONNUMBER OF HOTELS TOTAL ROOM COUNT (A)M1 ZONES TOTAL M1 ZONES TOTAL
14 68 3,029 14,09514 67 3,029 13,978
0 1 0 11720.6% 21.5%
4 11 267 93336.4% 28.6%
24 52 2,336 5,17322 30 2,300 2,888
2 14 36 1,4570 8 0 828
46.2% 45.2%
18 36 1,500 3,6525 9 489 1,1725 10 569 1,3628 17 442 1,118
50.0% 41.1%
2 3 270 29866.7% 90.7%
62 170 7,402 24,151
MANHATTAN (ALL)BELOW 59TH STREETABOVE 59TH STREETM ZONE AS A PERCENTAGE OF TOTAL
THE BRONX (ALL)M ZONE AS A PERCENTAGE OF TOTAL
QUEENS (ALL)LONG ISLAND CITYLGA/FLUSHING/NORTHERN QUEENS JAMAICA/JFK/SOUTHERN QUEENSM ZONE AS A PERCENTAGE OF TOTAL
BROOKLYN (ALL)DOWNTOWN/GOWANUS/RED HOOKNORTHOTHERM ZONE AS A PERCENTAGE OF TOTAL
STATEN ISLAND (ALL)M ZONE AS A PERCENTAGE OF TOTAL
NEW YORK CITY TOTALM ZONE AS A PERCENTAGE OF TOTAL 36.5% 30.6%
Note: (a) For pipeline hotels with unknown final room count estimates, the average rooms per site square foot of the respective submarket and zoning district was applied to the square footage of the proposed hotel site.
Source: New York City Planning Department, 2017.
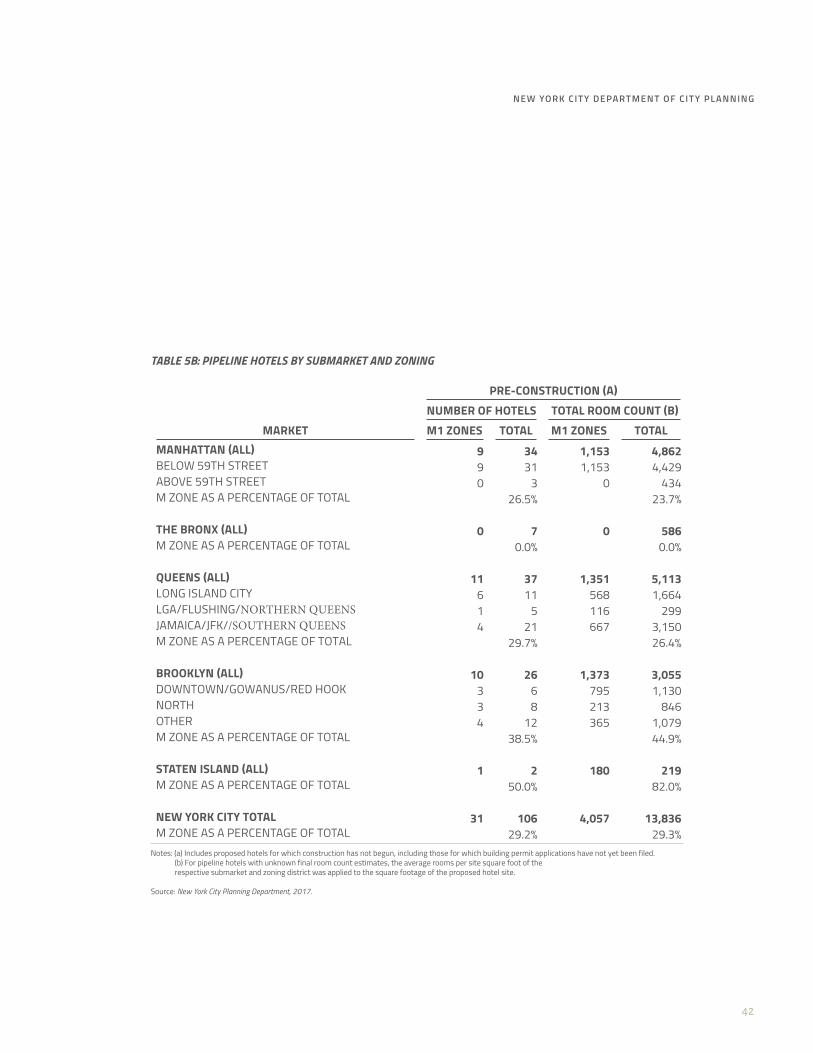
42
NEW YOR K CI TY DEPA RTMENT OF C ITY PLANNING
TABLE 5B: PIPELINE HOTELS BY SUBMARKET AND ZONING
MARKET
PRE-CONSTRUCTION (A)NUMBER OF HOTELS TOTAL ROOM COUNT (B)M1 ZONES TOTAL M1 ZONES TOTAL
9 34 1,153 4,8629 31 1,153 4,4290 3 0 434
26.5% 23.7%
0 7 0 5860.0% 0.0%
11 37 1,351 5,1136 11 568 1,6641 5 116 2994 21 667 3,150
29.7% 26.4%
10 26 1,373 3,0553 6 795 1,1303 8 213 8464 12 365 1,079
38.5% 44.9%
1 2 180 21950.0% 82.0%
31 106 4,057 13,836
MANHATTAN (ALL)BELOW 59TH STREETABOVE 59TH STREETM ZONE AS A PERCENTAGE OF TOTAL
THE BRONX (ALL)M ZONE AS A PERCENTAGE OF TOTAL
QUEENS (ALL)LONG ISLAND CITYLGA/FLUSHING/NORTHERN QUEENS JAMAICA/JFK//SOUTHERN QUEENSM ZONE AS A PERCENTAGE OF TOTAL
BROOKLYN (ALL)DOWNTOWN/GOWANUS/RED HOOKNORTHOTHERM ZONE AS A PERCENTAGE OF TOTAL
STATEN ISLAND (ALL)M ZONE AS A PERCENTAGE OF TOTAL
NEW YORK CITY TOTALM ZONE AS A PERCENTAGE OF TOTAL 29.2% 29.3%
Notes: (a) Includes proposed hotels for which construction has not begun, including those for which building permit applications have not yet been filed.(b) For pipeline hotels with unknown final room count estimates, the average rooms per site square foot of the respective submarket and zoning district was applied to the square footage of the proposed hotel site.
Source: New York City Planning Department, 2017.

43
NEW YOR K C IT Y HOT EL MARKET ANALYSIS AND M1 ZONE I MPACTS
TABLE 5C: PIPELINE HOTELS BY SUBMARKET AND ZONING
MARKET
TOTAL PIPELINE HOTELS (A)NUMBER OF HOTELS TOTAL ROOM COUNT (B)M1 ZONES TOTAL M1 ZONES TOTAL
23 102 4,182 18,95823 98 4,182 18,958
0 4 0 55122.5% 22.1%
4 18 267 1,51922.2% 17.6%
35 89 3,687 10,28628 41 2,868 4,552
3 19 152 1,7564 29 667 3,978
39.3% 35.8%
28 62 2,873 6,7078 15 1,284 2,3028 18 782 2,208
12 29 807 2,19745.2% 42.8%
3 5 450 51760.0% 87.0%
93 276 11,459 37,986
MANHATTAN (ALL)BELOW 59TH STREETABOVE 59TH STREETM ZONE AS A PERCENTAGE OF TOTAL
THE BRONX (ALL)M ZONE AS A PERCENTAGE OF TOTAL
QUEENS (ALL)LONG ISLAND CITYLGA/FLUSHING/NORTHERN QUEENS JAMAICA/JFK//SOUTHERN QUEENSM ZONE AS A PERCENTAGE OF TOTAL
BROOKLYN (ALL)DOWNTOWN/GOWANUS/RED HOOKNORTHOTHERM ZONE AS A PERCENTAGE OF TOTAL
STATEN ISLAND (ALL)M ZONE AS A PERCENTAGE OF TOTAL
NEW YORK CITY TOTALM ZONE AS A PERCENTAGE OF TOTAL 33.7% 30.2%
Notes: (a) Includes proposed hotels under construction and in pre-construction, including those for which building permit applications have not yet been filed.(b) For pipeline hotels with unknown final room count estimates, the average rooms per site square foot of the respective submarket and zoning district was applied to the square footage of the proposed hotel site.
Source: New York City Planning Department, 2017.

44
NEW YOR K CI TY DEPA RTMENT OF C ITY PLANNING
TABLE 6: CHANGE IN HOTEL ROOMS BY SUBMARKET AND ZONING DISTRICTASSUMING COMPLETION OF TOTAL PIPELINE
Based on number of rooms existing in April 2017 and pipeline as known in June 2017
MARKET
CHANGE IN HOTELS CHANGE IN ROOMS
M1 ZONES TOTAL M1 ZONES TOTAL
41.1% 24.2% 47.6% 19.9%41.1% 25.8% 47.6% 20.6%
9.8% 9.1%
66.7% 81.8% 68.0% 139.6%
112.9% 76.7% 118.1% 83.9%254.5% 146.4% 247.4% 152.7%
37.5% 44.2% 21.7% 36.7%33.3% 64.4% 52.9% 88.4%
90.3% 96.9% 133.6% 112.7%100.0% 75.0% 191.6% 71.3%133.3% 163.6% 143.8% 241.6%
70.6% 87.9% 86.2% 121.4%
50.0% 44.4% 70.4% 61.4%
MANHATTAN (ALL)BELOW 59TH STREETABOVE 59TH STREET
THE BRONX (ALL)
QUEENS (ALL)LONG ISLAND CITYLGA/FLUSHING/NORTHERN QUEENSJAMAICA/JFK/SOUTHERN QUEENS
BROOKLYN (ALL)DOWNTOWN/GOWANUS/RED HOOKNORTHOTHER
STATEN ISLAND (ALL)
NEW YORK CITY TOTAL 71.5% 43.5% 75.9% 32.8%
Source: New York City Planning Department, 2017.
This represents a 33 percent increase in rooms in New York City and a 76 percent increase in M1 zone rooms. As the following table shows, Brooklyn is slated to increase its number of M1 zone hotel rooms by 134 percent and double its number of hotels, which translates into a 113 percent increase in total rooms. Nearly all of the Brooklyn sub-markets have enough hotel rooms in pre-construction to at least double the number of M1 zone and total rooms. Pipeline hotels in Long Island City, Queens would increase the submarket’s hotel room count by 153 percent, with a 248 percent increase in M1 zone rooms. While these numbers represent large increases in hotel supply, the majority of pipeline rooms (63 percent) are currently under construction, indicating that they will develop in the short term.

45
NEW YOR K C IT Y HOT EL MARKET ANALYSIS AND M1 ZONE I MPACTS
Manhattan
Manhattan is the tourism and business hub of New York City and by far the largest and most diverse hotel market of any borough in the city. As of the first quarter of 2017, Manhattan had 95,449 rooms in 421 hotel properties. While STR ranks the large majority of hotels in the other boroughs as Economy or Midscale, 75 percent of the hotel properties in Manhattan are Upscale or Luxury. Furthermore, the borough also contains over 100 small independent hotels of under 100 rooms (boutiques), more than any other borough.
A market of Manhattan’s scale and diversity, will have numerous distinct submarkets with their own unique de-mand drivers and hotel supply profile. These include the core of the Midtown business and theater district, the Garment and Flatiron Districts, SoHo and the Lower East Side, and the Downtown Financial District, in addition to the Upper West and Upper East Sides and Harlem. For the purposes of this study, however, we will focus on two submarkets: Manhattan below 59th Street and Manhattan Above 59th Street.
Profile of Manhattan Hotel Market
The supply of hotels and rooms in Manhattan has grown substantially over the past 10 years. From a base of 64,144 rooms in 290 hotels in 2007, Manhattan’s room supply grew by over 0ne half, or over 31,305 rooms in 165 new hotel properties, an average of 3,130 rooms and almost 17 hotels per year. This new supply has generally been well absorbed during the period, matching increased demand from visitors, and reaching a peak occupancy rate of over 89 percent in 2014.
Manhattan Hotel Supply Trends
CHANGE IN TYPOLOGY
The most significant trend in the Manhattan hotel market over the past ten years is the substantial growth in the Midscale class of lodging. Since 2007, the number of Midscale rooms in the borough grew by almost 75 percent, a faster rate than any other class of hotel; Midscale rooms now account for almost one-quarter of Manhattan’s hotel inventory, compared to 15 percent ten years ago. This growth is largely attributable to the nationally brand-ed Limited-Service and Select-Service hotel product that was pioneered in Manhattan by a new cohort of hotel developers. As national brands accepted this new standardized model, developers were able to construct flagged hotel properties on smaller sites that did not easily accommodate other uses.
Meanwhile, Luxury and Upscale hotel rooms grew by about 50 percent while Economy hotels lagged far behind, with only six new projects being built in the last ten years that comprise only 3 percent of new rooms.
New York City Borough and Submarket Profiles

46
NEW YOR K CI TY DEPA RTMENT OF C ITY PLANNING
CHANGE IN AVERAGE HOTEL SIZE
Similar to overall New York City hotel supply trends, the new Manhattan supply was built, on average, in smaller hotels. For instance, whereas hotels built after 2007 had an average room count of 189, those built in 2007 and before had an average of 250 rooms. The most marked difference is in Upscale and Luxury class hotels, where the average room count has dropped by 15 and 20 percent, respectively. This can be attributed to the new types of Upscale and Luxury hotels that have been built in the past decade in Manhattan, including more Select-Service and smaller “boutique” style hotels that were less prevalent in the market in 2007.
MANHATTAN HOTEL DEMAND DRIVERS
As the business, cultural and tourism hub of New York City, Manhattan is one of the largest and most active hotel markets in the world. Both domestic and international travelers are drawn to Manhattan for its theater, muse-ums, restaurants, shopping and other attractions. Business travelers are drawn to the borough because it is the heart of the commercial capital of the United States. As noted, demand for hotels in Manhattan has continued to be stable despite the large increase in supply over the past decade. Visitors also have a much wider array of choic-es in nationally branded Midscale and Upscale properties close to Midtown and the Theater District . These have proven to be very popular with both international and domestic travelers looking for predictable quality rooms in Manhattan at a lower price point.
OCCUPANCY RATE TRENDS
While occupancy rates at hotels in Manhattan have continued to be high since 2014, occupancy has declined slightly from a high of 86.2 percent and 86.8 percent in 2015 and 2016, respectively. This is the first decline in occupancy noted since 2008, though 2017 1Q occupancy is slightly above that of previous years. Manhattan’s occu-pancy rate in the mid-80s is also significantly higher than the U.S. average of 68.8 percent and, with the exception of Las Vegas, higher than those in its peer U.S. markets, including Chicago and Washington.
REVENUE TRENDS
While occupancy rates in Manhattan have generally remained stable, ADR and RevPAR in the Manhattan market have seen a considerable decline since their peak in 2014. ADR has fallen almost 5 percent from $291.03 in 2014 to $277.42 in 2016 while RevPAR has declined similarly from $253.20 to $240.76. 2017 Q1 ADR is the lowest Q1 average rate since 2010. Q1 RevPAR in 2017 is down almost 10 percent from its 2013 high.
Many market analysts and hotel developers have indicated that the hotel supply in Manhattan has reached sat-uration due to the recent hotel boom and noted that while occupancy rates remain stable, daily rates cannot remain at previous levels due to high competition.

47
NEW YOR K C IT Y HOT EL MARKET ANALYSIS AND M1 ZONE I MPACTS
FIGURE 10: MANHATTAN HOTEL MARKET TRENDS, 2011-2016: MANHATTAN M1 DISTRICTS
AVERAGE DAILY RATE OCCUPANCY (%)Source: STR, 2017.
MANHATTAN M1 DISTRICTS
In Manhattan, where there are far more locational alternatives other than M1 that permit hotel development, including the full range of Commercial districts that comprise significant portions of the borough below 59th Street, the concentration of hotel development in Light Manufacturing districts is less pronounced than in the other boroughs; only 20 percent of new hotel properties and 19 percent of hotel rooms delivered since 2010 are located in M1 districts. However, several areas of the borough – particularly M-zoned areas on the Far West Side and in South Midtown – have seen notable concentrations of new hotel development, largely mid-price national-ly flagged properties. In these areas, available parcels often have relatively small footprints that lend themselves well to the nationally branded Limited-Service and Select-Service hotels. These hotels are able to offer travelers rooms of a standardized quality that are walking distance from the Theater District and Times Square at average daily rates that are approximately $50 below Midtown rates.
M1 districts below 14th street, such as the Meatpacking District and Soho, are coterminous with some of New York City’s most fashionable and trendy neighborhoods. The amenities, cachet and other attractions make these neighborhoods highly desirable for tourists and other visitors, consequently helping to drive hotel development.
Manhattan below 59th Street contains almost all of Manhattan’s M1 districts. All of Manhattan’s hotels situated in M1 districts are located in this submarket.
60%
65%
70%
75%
80%
85%
90%
$0
$50
$100
$150
$200
$250
$300
$350
$269.72
683. %
2011
$277.00
85.9%
2012
$284.94
86.6%
2013
$291.03
87.0%
2014
$285.51
86.2%
2015
$277.42
86.8%
2016

48
NEW YOR K CI TY DEPA RTMENT OF C ITY PLANNING
Evaluating the most recent hotel market data from STR, the Consultant Team has determined that 56 hotel prop-erties in Manhattan, or 15 percent of the total Manhattan hotel properties, are located in M1 districts, primarily in West Midtown/Midtown South and SoHo. However, as these hotels tend to be smaller, their share of total room count is considerably less at 10 percent. Fifty-six percent of these hotels have opened since 2010, though these represent just over 20 percent of the 130 hotel properties that have opened in Manhattan during that period. While hotels in M1 districts in Manhattan tend to be newer (14 years average age, eight years median age) than hotels overall in the borough (34 years average age, 15 years median age), the range of hotel typologies and room counts for those properties in M1 districts do not differ drastically from the borough as a whole; M1 districts in Manhattan include the full range of hotel typologies from Luxury to Economy and an average room count of 136, versus 152 borough-wide.
Manhattan Submarket Profile: Below 59th Street
The extent of Manhattan between 59th Street and the Battery accounts for 90 percent of the borough’s hotels and 93 percent of its hotel rooms. If Manhattan is the core of New York City’s tourism industry and hotel market, then Manhattan below 59th Street is the hub of that core, comprising the city’s two largest central business districts – Midtown (the largest business district in the nation) and Downtown. It also includes Midtown South, Greenwich Village/Meatpacking District, SoHo and the Lower East Side, all of which include significant hotel clusters.
FIGURE 11: MANHATTAN TRENDS BY SUBMARKET
MANHATTAN: BELOW 59TH STREET AVERAGE DAILY RATE OCCUPANCY (%)MANHATTAN: ABOVE 59TH STREET AVERAGE DAILY RATE OCCUPANCY (%)
Source: STR, 2017.
50%
55%
60%
65%
70%
75%
80%
85%
90%
$0
$50
$100
$150
$200
$250
$300
$350
2011 2012 2013 2014 2015 2016

49
NEW YOR K C IT Y HOT EL MARKET ANALYSIS AND M1 ZONE I MPACTS
Trends
SUPPLY
Because this submarket encompasses such a vast majority of Manhattan’s hotel supply, the trends cited for the Manhattan market as a whole apply to this submarket as well. This particularly applies to the significant increase in supply over the past decade as 100 percent of new hotels opened in Manhattan since 2010 have been located in this submarket.
Some market analysis reports as well as the Consultant Team’s interviews with hotel developers and business improvement district leadership indicate that this submarket may be reaching saturation in its hotel supply and that, while occupancy rates still appear to be stable, ADR and RevPAR are down. One hotel developer who has five hotel projects in West Midtown and Midtown South with properties that average 250 rooms, told the Consultant Team that these drops in revenue have made many lenders hesitant to fund new hotel projects in Manhattan. This same developer also stated that all of their hotel properties in Manhattan are performing below expecta-tions due to lower room rates and higher taxes, despite that the occupancy has not yet dropped. Confirming that New York remains the most liquid hotel market in the world, this developer noted that 3o hotels in Manhattan are currently for sale.
While the supply of Select Service and Limited Service hotels in Midtown and Midtown South may be approach-ing saturation, both developers and business improvement district representatives informed the Consultant Team that there is still a growing market for independent and boutique hotels, particularly below 23rd Street in the “trendier” neighborhoods of SoHo and the Lower East Side.
The majority of new hotels are Select or Limited Service. The Midtown developer we spoke with informed us that, under current market conditions, the numbers do not work for banquet facilities and many available develop-ment sites in Manhattan do not have adequate footprints to accommodate such facilities.
DEMAND DRIVERS
This submarket is shaped by the same demand drivers as noted for Manhattan as a whole. Midtown and Mid-town South hotels cater to a mix of business and leisure travelers, with the latter seeking less expensive hotels in the Garment District and Midtown South. The Javits Center also remains an important demand driver for hotels in Midtown.
Hotels south of 23rd Street serve a sector that may be more interested in experiencing Downtown culture and at-tractions such as shopping and restaurants, though these hotels also serve a mix of business and leisure travelers.

50
NEW YOR K CI TY DEPA RTMENT OF C ITY PLANNING
Manhattan Submarket Profile: Above 59th Street
This is the second largest hotel market in New York City after Manhattan below 59th Street; however, it contains only ten percent of the borough’s hotel properties and seven percent of Manhattan’s total room-count. In addi-tion, unlike many of the submarkets outside Manhattan, Above 59th Street has seen little new construction or addition of hotel properties in the past decade. Since 2007, only four new hotel have opened in this submarket with a total of 330 rooms. Three of these hotels, including the largest, a 124-room Aloft, are located in Harlem, while the fourth was a small independent hotel that opened on the Upper West Side.
Trends
SUPPLY
This hotel market is a mature and slow-growth submarket that is distinguished by the fact that so few of its hotel rooms are located in nationally branded hotel properties. 78 percent of the hotel properties and 65 percent of the hotel rooms in this submarket are independent unaffiliated properties. Other than the Aloft Harlem, noted above, no other branded hotels have opened in this submarket in the past decade.
Luxury class hotels account for a relatively large portion of the hotel supply in this market, with 28 percent of the hotel rooms in Luxury class properties, located primarily on the Upper East Side in the blocks near Central Park. Similarly, fully one-third of the hotel rooms in this submarket are in Upscale properties, located primarily on the Upper West Side and Upper East Side. There are relatively few Midscale hotel rooms in this submarket (16.5 percent of the total) and they are located overwhelmingly on the Upper West Side. Economy class properties are clustered in Harlem and the northern Upper West Side (north of W. 96th Street).
While the Upper East Side and the Upper West Side account for the large majority of this submarket’s existing hotel rooms, the few hotels in the pipeline are almost all located in Harlem. The slow growth in this submarket may be due to a lack of appropriately zoned sites as much of Upper Manhattan is zoned residential, with com-mercial districts along main thoroughfares. Other than the West Harlem waterfront, there are no M1 districts in this submarket.
DEMAND DRIVERS
The Uptown Manhattan submarket, particularly on the Upper East Side, contains many of New York City’s “grand dame” Luxury class hotels, including the Sherry Netherland, the Plaza-Athenee, the Carlyle and the Pierre. These properties cater to a global elite clientele and those seeking a very specific New York City experience. Midscale hotels on the Upper West Side offer a lower cost alternative than many similar hotels in Midtown and also serve visitors to Columbia University. Harlem, on the other hand, is an emerging hotel market that attracts budget travelers and many visitors that wish to specifically be in Harlem. With the exception of the Aloft, Harlem is dom-inated by smaller independent and boutique hotels.

51
NEW YOR K C IT Y HOT EL MARKET ANALYSIS AND M1 ZONE I MPACTS
Queens
Queens, home of JFK and LaGuardia Airports, is the second largest hotel market of the five boroughs. As of the first quarter of 2017, Queens has 12,264 rooms in 116 hotel properties, more than twice as many as the next largest market, Brooklyn. Queens hotel rooms are more evenly distributed between Economy, Midscale and Upscale, though Midscale accounts for the largest category at 38 percent of its room inventory.
While the airports remain an important driver for Queens hotel demand, it is increasingly being driven by the borough’s booming neighborhood submarkets as well. Most prominent among these is Long Island City, but also Flushing, which have seen some of the most significant hotel growth in New York City outside Manhattan in the past decade. Though proximate to LaGuardia Airport, Flushing has seen hotel growth driven by factors that point to independence from this locational relationship. Interviewees pointed to Flushing’s growth being driven more by the bustling business district of Downtown Flushing than by LaGuardia.
Profile of Queens Hotel Market
The growth of hotel inventory in Queens over the past decade has been significant. From a base of 6,550 rooms in 2007, the room count in Queens has almost doubled in ten years to over 12,260 rooms in 116 properties. Despite this growth in supply, occupancy rates in Queens remain as high as Manhattan, reaching a record rate of 84.6 percent in 2016.
Queens Hotel Supply Trends
TYPOLOGY
Over half of the hotel rooms built in Queens in the past decade are classified as Midscale with a little over a quar-ter of the new inventory classified as Upscale. While Economy rooms made up one-third of the borough’s hotel inventory in 2007, only 20 percent of the rooms delivered in the past decade fit within that class. Long Island City is the only submarket in Queen, other than JFK and LaGuardia, that saw development of Upscale hotels since 2007, though there are several Upscale hotel projects in the pipeline in Jamaica near the AirTrain station.
DEMAND DRIVERS
Queens and its individual submarkets have features that make it the largest hotel market in New York City out-side of Manhattan. Long Island City, Flushing and Jamaica are all significant commercial centers with Long Island City being the second largest central business district outside of Manhattan. Long Island City also has easy ac-cessibility to Manhattan and a growing residential population that has brought a new slate of restaurants and amenities to the area. The city’s two airports are major demand drivers and the development in Downtown Ja-maica around the AirTrain station has made this submarket attractive for hotel guests wishing to be close to JFK in addition to the LIRR. For developers, Queens has less expensive land values and multiple Light Manufacturing districts that are well located and well positioned to facilitate hotel development.

52
NEW YOR K CI TY DEPA RTMENT OF C ITY PLANNING
Finally, there has also been a “market follower” phenomenon in Queens where, as pioneer developers have cata-lyzed new hotel markets and proven their viability, others have followed.
Occupancy Rate Trends
Occupancy rates in Queens have recovered well in the post –Recession years and, even as inventory has grown by unprecedented levels, occupancy rates have continued to climb with the exception of a small dip in 2014. Occu-pancy rates in Queens have also continued to grow even as they have stabilized or fallen in other boroughs.
Revenue Trends
As occupancy rates in Queens have continued to grow, so have ADRs, which have increased by 18 percent since 2011. While some developers and hotel managers we spoke with in Queens expressed concern about oversupply and declining ADR in the Queens market, the borough has continued to see growth in rates and revenue.
FIGURE 12: QUEENS HOTEL MARKET TRENDS, 2011-2016
AVERAGE DAILY RATE OCCUPANCY (%)
Source: STR, 2017.
50%
55%
60%
65%
70%
75%
80%
85%
90%
$0
$20
$40
$60
$80
$100
$120
$140
$160
$180
$200
$127.24
377. %
2011
$138.76
80.3%
2012
$143.94
82.1%
2013
$140.06
80.2%
2014
$145.19
83.0%
2015
$150.09
84.6%
2016

53
NEW YOR K C IT Y HOT EL MARKET ANALYSIS AND M1 ZONE I MPACTS
Queens M1 Districts
As much of Queens is zoned residential, hotel development is channeled into three major clusters characterized by their active business districts and Commercial or Manufacturing zoning: Long Island City, Downtown Flushing and Downtown Jamaica. In addition, there are significant hotel clusters in M1-zoned areas adjacent to JFK and LaGuardia Airports.
Long Island City remains by far the largest hotel district in Queens and much of this area is zoned M1. Demand in this neighborhood is generally driven by proximity to Manhattan and access to multiple subway lines, in addition to the activities and amenities of the city’s second largest central business district in the boroughs outside Man-hattan (after Downtown Brooklyn). Our interviews with stakeholders indicated that many international travelers stay in hotels in this area due to ADRs that are significantly lower than those in Manhattan coupled with easy access to Manhattan. The growth of a large residential population here has also made Long Island City popular with travelers visiting friends and family. While M1 districts provide mostly as-of-right zoning for hotels with land use regulations that support hotel development,1 this was not cited by stakeholders as a primary reason for hotel development. Of the 14 hotels in Long Island City that have opened since 2010, five have been in M1 districts and the remaining nine were in MX and C districts.
Jamaica is the next largest hub of hotels in M1 zoning areas in Queens though the majority of hotels in this neigh-borhood are in C districts or the Downtown Jamaica Special District in the Jamaica business district. Demand in this area is driven by access to the Air Train and JFK, though, due to its location and access to the LIRR, there is some demand from Nassau County as well. Hotel developers and the Greater Jamaica Development Corporation have noted that airline crews are expected to be strong source of room demand, particularly for the new Upscale hotels that are opening in the neighborhood. To emphasize this potential, the manager of the Sheraton LaGuar-dia East in Flushing told the Consultant Team that airline crews can account for up to 50 percent of an airport hotel’s room nights, though he also noted that this percentage is dropping at his particular hotel.
In Flushing, hotel development is less dependent on access to Manhattan and more due to a growing stand-alone hub of businesses that serve a bustling Asian immigrant community that still has strong links to China, Taiwan, South Korea and other East Asian countries. Demand is also driven by proximity to LaGuardia and, to a lesser extent, JFK. Airline crews are also an important source of room demand for some hotels in Flushing. Almost all of this submarket’s recent hotels have been developed in the C districts closer to the core business district and the subway and LIRR. It is only in the past two years that new some hotel development has targeted parcels in M1 districts north of Northern Boulevard, where land values are less than in Downtown Flushing but the location for hotel guests is much less convenient.
1 Due to bulk requirements, site sizes, and low parking requirements.

54
NEW YOR K CI TY DEPA RTMENT OF C ITY PLANNING
Evaluating the most recent hotel market data from STR, the Consultant Team has determined that 3,123 hotel rooms in 31 hotel properties, or approximately one-quarter of the total Queens hotel supply, are located in M1 districts, primarily in Long Island City with much smaller clusters in Flushing and Jamaica. It should be noted that most of the hotel development in Flushing and Jamaica has taken place in Commercial-zoned districts rather than nearby M1 districts, as the Commercial districts are more conveniently located to transit and amenities. In Long Island City, over half the existing hotel rooms are in paired M1/R districts, including the recent large Court-yard, Aloft, and Hilton Garden Inn projects, while approximately 40 percent are in M1. Much of the proposed hotel development in the pipeline in the Long Island City submarket, however, is slated for Ravenswood, in largely M1 districts.
FIGURE 13: QUEENS HOTEL TRENDS BY SUBMARKET
QUEENS: LONG ISLAND CITY AVERAGE DAILY RATE OCCUPANCY (%)QUEENS: LAGUARDIA/FLUSHING ZIP CODES BEGINNING WITH 113 AVERAGE DAILY RATE OCCUPANCY (%)
QUEENS: JAMAICA/JFK/ZIP CODES BEGINNING WITH 114 AVERAGE DAILY RATE OCCUPANCY (%)Source: STR, 2017.
Queens Submarket Profile: Long Island City
Long Island City has been the engine of recent hotel growth in Queens and remains the largest submarket in the borough. The Long Island City Partnership (LICP) reports that there are currently almost 2,000 hotel rooms in the submarket in approximately 42 properties, while STR reports nearly 3,000 hotels rooms. As recently as 2010 there was only one major hotel in all of Long Island City and a group of smaller midscale and economy hotels clustered in Dutch Kills.
50%
55%
60%
65%
70%
75%
80%
85%
90%
$0
$50
$100
$150
$200
2011 2012 2013 2014 2015 2016

55
NEW YOR K C IT Y HOT EL MARKET ANALYSIS AND M1 ZONE I MPACTS
Today, there are several hubs of hotel development in Long Island City in addition to Dutch Kills, including Queens Plaza, Courthouse Square, the waterfront, 44th Avenue and Ravenswood. The eastern edge of Queens Plaza has become the largest hub of activity with the opening of 520 rooms in an Aloft, Courtyard by Marriott and Hilton Garden Inn. Nearly 40 percent of hotel rooms in Long Island City are located in M1 zones.
While Long Island City has been dominated by nationally branded Midscale and, recently, Upscale class hotels, there has also been a rise in small independent Upscale hotels in recent years, including the Boro, Paper Factory and the Z New York City. There have also been some new extended stay hotels, including a Home2Suites in Dutch Kills.
Demand in Long Island City is generated by its easy access to Manhattan and vibrant central business district with large employers such as JetBlue and RWS Entertainment. Both LICP and Queens EDC have expressed some concern that the Long Island City market is becoming oversupplied, particularly with Limited Service and Select Service hotels, and specifically when one considers the number of hotels that have been added in the past decade (1,730 rooms) and the number currently in the pipeline (4,552 rooms). As illustrated in Figure 13, while ADRs in Long Island City have continued to see modest growth, occupancy rates have dropped from the recovery they made after the recession.
Queens Submarket Profile: Flushing/LGA/North Queens
The Flushing/LGA/North Queens market is driven both by the bustling, largely Asian central business district of downtown Flushing and the airport-related business from LaGuardia. While some hotels in downtown Flushing brand themselves as airport hotels, such as the Sheraton LaGuardia East, the growth of the Flushing business community has become an equally important demand driver. The manager of the Sheraton told the Consultant Team that, while airport business has dropped, non-airport business now accounts for 50 percent of the hotel’s guests. Three new hotels have opened in Downtown Flushing since 2010 and the Queens EDC, in addition to the manager of the Sheraton LaGuardia East, has expressed concern about saturation in this market.
The hotel market near LaGuardia Airport, centered along the Grand Central Parkway, is mature and relatively sta-ble. Unlike the JFK market, which has seen a burst of new activity, LaGuardia has seen only two hotels open since 2010 and there are only three hotels in the pipeline.
Despite some concerns, both occupancy rates are high and continue to increase while ADR has also seen a re-spectable rise over the past six years.

56
NEW YOR K CI TY DEPA RTMENT OF C ITY PLANNING
Queens Submarket Profile: Jamaica/JFK
Downtown Jamaica, which has been served by a number of Limited-Service hotels along Jamaica Avenue and near the AirTrain/LIRR Station at Archer Avenue and Sutphin Boulevard, including a 61-room Howard Johnson’s and - slightly further to the east – a 72-room Comfort Inn, a 72-room Days Inn and a 66-room Sleep Inn, is slated to receive an unprecedented supply of Full-Service hotel rooms in several nationally branded hotel properties. These include a co-located Courtyard by Marriott and Fairfield Suites with almost 340 rooms, a Hilton Garden Inn with 240 rooms, and a Select-Service Aloft Hotel with 128 rooms. In addition, a Select-Service 128-room Sprin-ghill Suites by Marriott is planned for Jamaica Avenue and Queens Boulevard a few blocks to the north of the AirTrain station. In all, the Greater Jamaica Development Corporation has identified over 2,000 hotel rooms in various stages of development in Jamaica, though some, like a 155-room Four Points by Sheraton and a 398-room Wyndham Garden/Country Inn seem to be on hold. Hotel development in Jamaica has been catalyzed by the development of the AirTrain with direct service to JFK, in addition to the 2007 rezoning that created the Jamaica Downtown Special District. Jamaica hotels are attractive to those travelers that want quick and easy access to JFK and do not want to pay Manhattan hotel prices. New hotels, such as the Hilton Garden Inn and Courtyard by Marriott will also focus on hosting flight crews.
With nearly 4,000 hotel rooms in various stages of development, the majority of them in Midscale and Upscale class properties, the demand for higher end hotel rooms in Jamaica has been confirmed. Both occupancy rates and ADR have performed respectably over the past six years.

57
NEW YOR K C IT Y HOT EL MARKET ANALYSIS AND M1 ZONE I MPACTS
Brooklyn
Brooklyn, with the third largest inventory of the five boroughs, is a dynamic hotel market that has grown quick-ly over the past decade and encompasses a diverse typology of hotels, from the new business-oriented Select Service nationally branded Midscale and Upscale Downtown, to more leisure-oriented independent Full Service hotels in North Brooklyn to limited service hotels in Gowanus and Sunset Park.
As of the first quarter of 2017, Brooklyn has 5,953 rooms in 64 hotel properties. Reflecting the considerable evolu-tion of the Brooklyn market and the large upmarket hotels that have opened recently in Downtown, in addition to relatively large independent hotels in North Brooklyn, STR ranks almost half (48 percent) of the hotel rooms in Brooklyn as Upscale and just under 30 percent as Midscale. Yet, the smaller scale of the Brooklyn hotel market is evident when one considers that over one-third (35 percent) of the hotel rooms in the borough are in independent properties and that 75 percent of Brooklyn’s hotel properties have less than 100 rooms.
Brooklyn also has numerous distinct submarkets. Downtown Brooklyn/Gowanus/Red Hook encompasses the city’s largest central business district outside Manhattan in addition to rapidly changing industrial neighbor-hoods along the Gowanus Canal and the South Brooklyn waterfront. North Brooklyn includes Williamsburg and Greenpoint, two neighborhoods that, despite their lack of direct subway service to Midtown or Downtown Man-hattan, have developed a cluster of independent Full Service hotels. While this report is not analyzing them in detail, Brooklyn has also developed in recent years additional clusters of hotels in Greenwood/Sunset Park and along the Atlantic Avenue corridor east of Flatbush Avenue.
Profile of Brooklyn Hotel Market
The supply of hotels and rooms in Brooklyn has grown remarkably in recent years. From a base of 2,053 rooms in 24 hotels in 2010, Brooklyn’s room supply has almost tripled, by adding over 3,900 rooms and 24 hotels, an average of 650 rooms and 4 hotels per year. This new supply has generally been well absorbed as Brooklyn has become an increasingly popular place for both business and leisure travelers to stay. In 2016, Brooklyn’s occupan-cy rate was 78 percent, an improvement over the 2011 occupancy rate of 75 percent, but a decrease from the 2013 high of 82 percent.
Brooklyn Hotel Supply Trends
TYPOLOGIES
In addition to the almost tripling of hotel rooms in the borough, a notable trend in the Brooklyn hotel market is the advent of Full-Service Upscale hotels in the North Brooklyn submarket. This includes the Williamsburg, the Wythe, the William Vale and the soon-to-open Hoxton. These are all fashionable luxury independent hotels that cater to a very select, often young clientele that wants to be in North Brooklyn specifically.

58
NEW YOR K CI TY DEPA RTMENT OF C ITY PLANNING
Such a cluster of independent luxury hotels does not exist elsewhere in the borough though the 1 Hotel Brook-lyn Bridge opened in early 2017 in Brooklyn Bridge Park and the renovated Hotel Bossert is expected to open in Brooklyn Heights later this year. In Gowanus, the upscale independent 76-room Gowanus Inn and Yard recently opened.
Elsewhere in Brooklyn, several select service flagged hotels have opened in the Downtown submarket, in addition to a full-scale Hilton; eight additional hotels are in various stages of the development pipeline. Several limited service hotels have opened in Gowanus and Sunset Park with at least 12 more in the pipeline.
HOTEL SIZE
While the average hotel property in Brooklyn remains small, with a median room count of 61, several larger hotels have recently opened, including the Brooklyn Hilton with 196 rooms and the Aloft Brooklyn with 176 rooms. The New York Marriott at the Brooklyn Bridge, the only Full Service hotel in Brooklyn when it opened in 1999, is by far the largest hotel in the borough with 665 rooms.
FIGURE 14: BROOKLYN HOTEL MARKET TRENDS, 2011-2016
AVERAGE DAILY RATE OCCUPANCY (%)
Source: STR, 2017.
$156.61 $170.85 $177.59 $174.00 $173.74 $175.06
74.9%
80.8% 81.6%79.3% 79.5% 78.1%
50%
55%
60%
65%
70%
75%
80%
85%
$0
$50
$100
$150
$200
2011 2012 2013 2014 2015 2016

59
NEW YOR K C IT Y HOT EL MARKET ANALYSIS AND M1 ZONE I MPACTS
Occupancy Rate Trends
While the number of hotel rooms in Brooklyn has tripled since 2010, occupancy rates have not kept pace. From a high of almost 82 percent in 2013, occupancy rates in Brooklyn have declined each year and in 2016 were just over 78 percent, below the New York City average of 86% but well above the average occupancy rate in many large US cities including Miami (76.5 percent), Chicago (71 percent) and Houston (64 percent).
In the Downtown Brooklyn submarket, occupancy rates have seen a similar decline. As hotel development in the North Brooklyn submarket is too recent, there is no available historic trend data, though the 2016 occupancy rate was just under 77 percent.
Hotel Demand Drivers
The Brooklyn hotel market is driven by several factors, depending on exact location of specific submarket with-in the borough. The Downtown Brooklyn hotel market is focused on New York City’s largest Central Business District outside Manhattan with many business-oriented Select-Service and Full-Service properties, while also benefiting from its position as a major subway transportation hub with easy access to Manhattan. In addition, with amenities, BAM, and a vibrant retail sector that has evolved at City Point/DeKalb Market and the surround-ing neighborhoods, Downtown Brooklyn has become a destination in its own right. To the south of Downtown, Gowanus and Sunset Park offer multiple parcels in Light Manufacturing districts that have been ideal for the de-velopment of Economy Limited-Service hotels that benefit from easy access to Manhattan for leisure travelers. North Brooklyn also contains numerous areas zoned for Light Manufacturing that have gained from their proxim-ity to Williamsburg, a neighborhood filled with fashionable amenities and global cachet for both leisure travelers and business travelers in the creative sectors.
Revenue Trends
As occupancy rates have slightly declined in Brooklyn, ADR and RevPAR in the Brooklyn market have also seen a small decline since their peak in 2013. ADR has fallen 1.5 percent from $177.56 in 2013 to $175.06 in 2016 while RevPAR has seen a steeper decline of approximately five percent from $144.83 to $136.72. 2017 Q1 ADR and RevPAR are both up significantly over previous years’ Q1, with RevPAR at $109, a 12.5 percent increase over 1Q 2016. The Downtown Brooklyn submarket has seen similar trends as those in the borough as a whole.
M1 Zone Markets
Brooklyn, like Queens, comprises large swathes of residential zoning districts with commercial corridors. Outside the largely C-zoned Downtown Brooklyn Central Business District, hotel development is largely clustered in Light Manufacturing districts. For instance, almost 40 percent of the borough’s room inventory is in M1 districts.

60
NEW YOR K CI TY DEPA RTMENT OF C ITY PLANNING
The three major clusters of hotels in M1 districts in Brooklyn are the North Brooklyn neighborhoods of Williams-burg and Greenpoint, the blocks along the Gowanus Canal west of Park Slope, and Sunset Park to the south.
Evaluating the most recent hotel market data from STR, the Consultant Team has determined that 31 hotel prop-erties in Brooklyn, or 48 percent of the total Brooklyn hotel supply, are located in M1 districts described above, in addition to a developing cluster along the Atlantic Avenue corridor. Downtown Brooklyn, which is home to Brooklyn’s largest hotels, does not include any M1 districts. This partly accounts for the fact that a smaller share of Brooklyn hotel rooms (40 percent) is located within M1 districts when compared to the other boroughs outside Manhattan. Since the Brooklyn hotel market is relatively new, the average age of hotels is 8 years in M1 districts and 9 years in other zoning districts.
The typology of M1 hotels is greatly dependent on submarket. North Brooklyn is home to most of the borough’s independent Full-Service Upscale hotels, while Sunset Park, the Atlantic Avenue corridor and Gowanus are char-acterized primarily by Limited-Service flagged hotels, though Gowanus has two independent hotels in the devel-opment pipeline. Downtown Brooklyn, the borough’s largest hotel market, does not contain M1 zoning districts.
FIGURE 15: BROOKLYN TRENDS BY SUBMARKET, 2011-2016
BROOKLYN: DOWNTOWN/GOWANUS/RED HOOK AVERAGE DAILY RATE OCCUPANCY (%)BROOKLYN: NORTH AVERAGE DAILY RATE OCCUPANCY (%)BROOKLYN: OTHER AVERAGE DAILY RATE OCCUPANCY (%)
Source: STR, 2017.
40%
50%
60%
70%
80%
90%
$0
$50
$100
$150
$200
$250
2011 2012 2013 2014 2015 2016

61
NEW YOR K C IT Y HOT EL MARKET ANALYSIS AND M1 ZONE I MPACTS
Brooklyn Submarket Profile: Downtown/Red Hook/Gowanus
Downtown Brooklyn is the oldest and most established submarket in the borough and home to the Brooklyn’s largest and longest established Full-Service Upscale hotel, the 666-room Brooklyn Bridge Marriott. The majority of hotels in the Downtown business area are located in C districts. In the past decade, the Downtown business district has seen other large Upscale hotels that cater to the business traveler, including the 200-room Brooklyn Hilton and the 245-room Brooklyn Holiday Inn.
Gowanus, which is largely zoned M1, was one of the first neighborhoods in Brooklyn outside Downtown to expe-rience growth in hotel development. For example, in 2007, the independent upper midscale Hotel LeBleu opened on 4th Avenue in Gowanus. Further, between 2006 and 2010, a Holiday Inn Express, Super 8 and Fairfield Inn all opened within blocks of each other near 3rd Avenue and Union Street. Hotels in M1-zones around Gowanus offer low ADRs with excellent access to subways and the amenities of Park Slope.
Brooklyn Submarket Profile: North Brooklyn
North Brooklyn, encompassing the neighborhoods of Williamsburg, Greenpoint and Bushwick, is a dynamic and fast-growing hotel submarket that is remarkable because just ten years ago, hotels did not exist at all, except for one small Economy hotel on the edge of Williamsburg. Today, this submarket boasts over 915 hotel rooms in over ten hotel properties, half of which are classified as Upscale by STR. The hotel inventory here is largely in in-dependent hotels, such as the William Vale, Wythe, Williamsburg and Condor hotels that cater to a fashionable, young and international clientele. It is not uncommon for these properties to command ADRs that are as high if not higher than hotels in Manhattan. Customers at North Brooklyn hotels generally are not looking for less expensive options with easy access to Manhattan, such as those in Gowanus. According to hotel developers and others with whom the Consultant Team spoke, for hotel guests in North Brooklyn, North Brooklyn is often the primary destination.
ADRs and occupancy rates in North Brooklyn, as of 2016, are slightly lower than Downtown Brooklyn. As this submarket is so new, STR did not track data here before 2016.
There are also at least eight new hotels in the development pipeline in this submarket and as noted above, the majority of hotel development in North Brooklyn is in M1 zones.

62
NEW YOR K CI TY DEPA RTMENT OF C ITY PLANNING
Brooklyn Submarket Profile: Remainder of Brooklyn
The largest cluster of hotels in Brooklyn outside the Downtown/Gowanus and North Brooklyn submarkets is Sun-set Park, particularly along 4th Avenue and 39th Street, areas that are all zoned for Light Manufacturing. Tourists are attracted to ADRs that are far below those in Manhattan and Downtown Brooklyn (as little as $130 per night during some times of the year) while still having access to direct subway lines into Manhattan. Industry City has also served as a recent demand driver, and there is a proposal to build a 400-room hotel at Industry City itself that would be geared toward business travelers.
There are currently eight hotels in this area, every one of which opened since 2010. Most of these hotels are Econo-my, though Midscale properties have also been built closer to Greenwood Heights on the northern edge of Sunset Park. Many of these hotels followed the service and product model of Economy and Midscale hotels that had opened earlier in Gowanus, along the R subway line to the north and, because of land prices, can offer ADRs lower than those in Gowanus. There are at least seven new hotels in the development pipeline in this submarket, all in M1 districts.
Other noteworthy hotel clusters include East New York/Brownsville, and the Atlantic Avenue corridor in Crown Heights. Hotels in East New York/Brownsville tend to be Economy class branded hotels, such as Days Inn and are located in both M1 and Commercial Districts. Hotels on the Atlantic Avenue corridor have historically also been Economy class though two new independent boutique hotels have opened in the past five years, including the 34-room Brooklyn Hotel and the 58-room Lynx. These hotels are generally split between M1 and C8 districts.

63
NEW YOR K C IT Y HOT EL MARKET ANALYSIS AND M1 ZONE I MPACTS
The Bronx
There are currently approximately 20 hotel properties in the Bronx with about 1,000 rooms total. A majority of these properties, however, are independent older motor inns and other Limited -Service economy hotels. Other than an Econo Lodge, which was built in 2000, there were no nationally branded hotels in the borough until 2006, when the Bronx Howard Johnson’s opened with 45 rooms on E. Tremont Avenue. In the last two years, however, three large higher quality hotels have opened in the Bronx – the Residence Inn by Marriott at the Hutchinson Metro Center (125 rooms), the Holiday Inn Express at Yankee Stadium (85 rooms) and a Comfort Inn in Mott Haven (84 rooms). Two independent boutique hotels have also opened in The Hub, the Umbrella Hotel and the Opera House Hotel. The Hub area hotels are located in C4 zones, while the Holiday Inn Express and Comfort Inn are both located in M1 zones.
Profile of Bronx Hotel Market
The Bronx has a small but growing hotel inventory, with almost half of the current rooms built since 2007. From a base of 700 rooms in solely Economy class hotels in 2010, the Bronx’s hotel supply has added about 370 rooms in six properties, an average of 60 rooms and one hotel per year. While the majority of these new hotels have been Economy class, the Bronx has also gained two new Upscale hotels, the Marriott Residence Inn and the boutique Umbrella Hotel in The Hub.
Bronx Hotel Demand Drivers
The visitor profile for hotels in the Bronx is dependent on the location. The borough’s biggest, most upscale hotel, the Residence Inn at the Hutchinson Metro Center, serves guests that are doing business at the business park or in nearby Westchester County, in addition to visitors to nearby Albert Einstein College of Medicine and Mercy Col-lege. It is not easily accessible by public transit and is not generally serving tourists who want access to Manhat-tan. The Holiday Inn Express at Yankee Stadium and Comfort Inn both serve guests who want to be near Yankee Stadium or the courts and tourists looking for easy subway access to Manhattan at ADRs that are a fraction of those in Manhattan (sometimes as low as $130 per night). The same is true with the hotels in The Hub as well as hotels near Fordham University that serve that market.
The Bronx hotel market is very new and its market demand is being tested. The Comfort Inn and Holiday Inn Ex-press have shown favorable occupancy rates and new hotels are planned in the South Bronx by local developers, including a 150-room Hampton Inn that would be the biggest hotel in the borough and a planned 130-room La Quinta Inn in Port Morris. Both of these planned hotels are in M1 zones.

64
NEW YOR K CI TY DEPA RTMENT OF C ITY PLANNING
50%
55%
60%
65%
70%
75%
80%
$0$20$40$60$80
$100$120$140$160$180$200 077. %
2015(a)
$130.05 $145.04
72.4%
2016
As the Bronx hotel market is new, STR has only recently begun to track it separately. Between 2015 and 2016, oc-cupancy rates have declined by almost five percentage points, though ADR has increased respectably. This trend contradicts ADR and occupancy trends in New York City, and the sub-markets individually. The rising ADR indi-cates that some portion of the lodging market is less price sensitive, exhibiting inelastic demand characteristics, while other demand segments may see the higher ADR and opt to stay in another similarly priced area, thereby reducing occupancy rates. Between 2015 and 2016, RevPAR in the Bronx increased from $101 to $105, indicating that hoteliers are willing to accept reduced occupancies because the increase in ADR more than makes up for those losses.
FIGURE16: BRONX HOTEL MARKET TRENDS, 2015-2016
AVERAGE DAILY RATE OCCUPANCY (%)Source: STR, 2017.
M1 Zone Markets
While the Bronx has numerous M1 districts, few of these contain significant clusters of hotel development or meet the criteria that many hotel developers look for when planning a hotel. As noted, the largest hotel in the borough, the Residence Inn at the Hutchinson Metro Center is in an M1 district and benefits from high visibility from the Hutchinson River Parkway. A new generation of independent hotels is opening in C-districts in the Hub, leveraging easy subway access to Manhattan. New branded hotels are planned in the South Bronx that would also benefit from fast subway access to Manhattan.

65
NEW YOR K C IT Y HOT EL MARKET ANALYSIS AND M1 ZONE I MPACTS
Staten Island
With fewer than 800 rooms in fewer than ten individual hotel properties, Staten Island is the smallest borough market in New York City. Because of its distance from the rest of the city, Staten Island’s hotel market is different from the other boroughs’ in that it is much more of a stand-alone market that serves a more local clientele. Un-like Manhattan, where maximizing guest rooms is paramount to economic success and food & beverage is less important, Staten Island’s major hotel developer told the Consultant Team that the food and beverage as well as meeting space are much more important for economic success in the borough. Parking is also a much more im-portant factor in Staten Island than in Manhattan, Brooklyn, Queens and the Bronx, which have access to greater public transportation options. The Hilton Garden Inn on the West Shore, which opened in 2001, is Staten Island’s only Upscale hotel and accounts for almost one-quarter of the borough’s current room inventory.
Profile of Staten Island Hotel Market and Demand Drivers
While the Hilton Garden Inn and (after 2007) adjacent Hampton Inn, with over 300 rooms combined, dominated the Upscale and Midscale hotel market in Staten Island for a decade, the borough’s market changed in 2010 when a Comfort Inn and Holiday Inn Express opened on the West Shore. In the relatively near future, an Upscale Westin with 175 rooms will open in St. George near the Ferry Terminal in addition to another planned hotel as part of the Empire Outlets/Staten Island Wheel project in St. George.
While the developer of the planned Westin Hotel is optimistic about the area’s prospects and the potential to attract tourists and businesses from Manhattan with easy access from the ferry, the existing hotel cluster on the West Shore faces different market dynamics. The West Shore is removed from St. George and public transporta-tion and will likely continue to be dependent on the local market. The developer/owner of the Hilton Garden Inn is pessimistic about the West Shore’s prospects and believes the market has become oversupplied. The corporate park is not driving business to hotels and New Jersey offers lower ADRs and taxes for travelers needing lodging near Newark Liberty Airport. The data from STR show a huge increase in occupancy rates in 2012 and 2013, but this is due to the impact of Superstorm Sandy and the number of Staten Island residents and work crews that stayed in local hotels. By 2016, occupancy rates returned to 2011 levels, at 70.3 percent, the lowest in the five boroughs. ADR have been more stable but are also the lowest in the five boroughs.

66
NEW YOR K CI TY DEPA RTMENT OF C ITY PLANNING
40%
45%
50%
55%
60%
65%
70%
75%
80%
85%
$0$20$40$60$80
$100$120$140$160$180$200
$110.93
67.6%
2011
$124.99
74.9%
2012
$137.21
80.6%
2013
$122.11
65.4%
2014
$126.58
65.9%
2015
$126.95
70.3%
2016
FIGURE 17: STATEN ISLAND HOTEL MARKET TRENDS, 2011-2016
AVERAGE DAILY RATE OCCUPANCY (%)Source: STR, 2017.
Staten Island M1 Districts Profile
The majority of the relatively small number of hotels on Staten Island are located in the M1 zoning districts along the island’s West Shore. This is primarily due to available development sites and favorable zoning in a largely residential borough. New hotels that are planned in St. George near the ferry will be part of larger new mixed use developments and located in the St. George Special Use District.

67
NEW YOR K C IT Y HOT EL MARKET ANALYSIS AND M1 ZONE I MPACTS
New York City Projected Hotel Demand
Using visitation and employment projection data, along with national tourism demand trends and New York City hotel pipeline information, the following analysis evaluates hotel room demand and supply growth for New York City in total, and by borough, through 2028. The analysis first projects hotel demand by market segment (i.e., leisure and business travel), and then subtracts existing hotel supply and pipeline rooms, differentiated by rooms currently under construction and rooms in the pre-construction process, to estimate residual room de-mand. The residual room demand represents the number of rooms, if any, that developers would be expected to build through 2028, after the market absorbs the current pipeline of hotel rooms. The analysis hypothesizes that in 2028, an equilibrium between hotel room supply and demand will exist, meaning that the supply of hotel rooms in 2028 will match projected demand. The analysis supposes that today’s hotel occupancy rates will be reflected in the 2028’s occupancy rates.
New York City is currently experiencing a hotel development boom that is unlikely to continue over the long-term. The hotel pipeline represents a 33 percent increase in the number of hotel rooms throughout New York City. Many of the developers interviewed indicate that this development boom is a result of supply in New York City, in its entirety and in particular in boroughs other than Manhattan, catching up with demand. New York City experi-enced little to no hotel development between 1997 and 2007, despite steady increases in demand. Over the past ten years, room supply has been catching up with growing and pent up demand. As supply and demand reach equilibrium, as evidenced by steady occupancy rates and flat RevPAR,1 hotel development should slow down; although this trend is not yet perceivable.
However, increases in tourism and employment will continue to create pressure for the development of new rooms, albeit at a much slower rate than indicated by recent supply trends. Once supply catches us with pent up demand, demand growth for New York City hotel rooms will return to a more “organic” rate – one that is sustain-able, in line with U.S. travel demand growth, and is based on traditional hotel demand drivers.
Hotel Demand Drivers
There are two major hotel demand drivers in the U.S. and New York City:
• Leisure Travel (tourism and visitation of family and friends), and • Business Travel (including conference/group travel).
1 Steady occupancy rates coupled with a flat RevPAR indicates that hotel supply is in equilibrium with demand. New rooms are not creating a glut in the market, which would depress occupancy rates. When hotels cannot increase ADRs, but occupancy and RevPAR remain flat, it indicates that supply is growing in line with demand.
New York City Hotel Market Outlook: No Action Scenario

68
NEW YOR K CI TY DEPA RTMENT OF C ITY PLANNING
Each of these drivers impacts hotel room demand and is considered separately in projecting new room demand through 2028. NYC & Company track leisure and business visitation for New York City, while the U.S. Travel As-sociation tracks leisure and business visitation for the U.S. overall. Table 7 shows the share of total travel in New York City and the U.S. for leisure and business travel. The ratio happens to be the same for in New York City and the U.S. overall.
TABLE 7: BUSINESS AND LEISURE TRAVEL, NYC AND US
TRAVEL TYPE NYC US
BUSINESS 20.4% 20.4%LEISURE 79.6% 79.6%TOTAL (ALL TRAVEL) 100% 100%
Sources: NYC & Company; US Travel Association; Statistica, 2017.
• Leisure Travel. According to both NYC & Company and U.S. Travel Association data, leisure travel in New York City and the U.S. comprises approximately 79.6 percent of room demand. This includes tourists vis-iting destinations, as well as leisure travelers visiting family and friends, some of whom stay in hotelsduring their visits.
• Business Travel. Business travel makes up the remainder of visitation, representing approximately 20.4percent of room demand, both in New York City and nationally.2 This includes large and small group/conference travel.
The analysis below applies these percentages to 2016 existing room demand3 by borough to estimate current (2016) room demand by segment, and then applies the relevant projection growth rates to determine the number of new rooms demanded through 2028 by borough.
Existing Room Demand
Existing room demand is defined as total occupied rooms for 2016. Applying the occupancy rate to the total num-ber of rooms provides the number of occupied rooms, or total existing room demand. According to STR, in 2016 there were 113,908 rooms in New York City, of which 97,827 were fully occupied on an average nightly basis. Apply-ing the distribution of travel segments, shown in Table 6, to the total demand shows that approximately 78,000 rooms were demanded by leisure travelers, while 20,000 rooms were demanded by business travelers. Table 8 shows the occupied rooms or total nightly room demand by borough in 2016.
2 NYC & Company and U.S. Travel Association, 2017.3 Total occupied rooms, 2016.

69
NEW YOR K C IT Y HOT EL MARKET ANALYSIS AND M1 ZONE I MPACTS
TABLE 8: EXISTING HOTEL DEMAND, 2016
2016 ROOM DEMAND
BOROUGHEXISTING ROOMS
OCCUPANCY RATE
OCCUPIED ROOMS/ TOTAL DEMAND (A) LEISURE (B) BUSINESS (C)
BRONX 1,088 72.4% 788 627 161BROOKLYN 5,689 78.1% 4,443 3,536 907MANHATTAN (B) 94,323 86.8% 81,872 65,157 16,715QUEENS 12,030 84.6% 10,177 8,100 2,078STATEN ISLAND 778 70.3% 547 435 112TOTAL, ALL NYC 113,908 97,827 77,855 19,972
Outlook and Future Trends
HOTEL DEMAND PROJECTIONS
Using current segments’ (leisure and business) shares of total room demand by borough, along with underlying demand driver projections, the Consultant Team estimated room demand through 2028 by borough. Projecting demand at the borough-level allows for flexibility in development based on market saturation, emerging market conditions, and diminishing availability of suitable sites. Based on an understanding of the interplay of various markets, some submarkets will likely continue to expand, while others may slow down due to short- and mid-term saturation, high land prices, or shortages of developable and/or attractive sites, near required transit and other amenities sought by travelers. Still other markets currently unknown, may emerge.
Leisure Travel. Per Table 8 above, leisure travel contributed to demand for nearly 78,000 rooms in New York City in 2016. Leisure travelers include those people coming for arts, culture, music, or sporting events, as well as tour-ists, and those traveling to see family and friends. According to U.S. Travel News, between 2016 and 2020, leisure travel to the U.S. from both domestic and international travelers is expected to increase 1.7 percent per year. Table 9 shows the U.S. leisure visitation projections through 2020.
Notes: (a) Average occupied rooms per night, or total occupied rooms.(b) Leisure demand as a share of total demand: 79.6%(c) Business demand as a share of total demand: 20.4%
Source: STR, 2017.

70
NEW YOR K CI TY DEPA RTMENT OF C ITY PLANNING
TABLE 9: U.S. LEISURE TRAVEL PROJECTIONS, 2016-2020
LEISURE TRAVEL 2016 2017 2018 2019 2020AVG. ANNUAL
GROWTH RATE
TOTAL TRAVELERS, MILLIONS 1,748 1,775 1,804 1,837 1,871GROWTH RATE 1.7% 1.6% 1.6% 1.8% 1.9% 1.7%
Source: US Travel Association, 2017.
According to NYC & Company, New York City visitation grew by 3.1 percent per year between 2007 and 2016. How-ever, the New York City Office of Management and Budget is projecting visitation to grow by 0.8 percent annu-ally through 2021. The U.S. Travel Association also shows that over the past ten years (2007-2016), U.S. visitation increased an average of 1.1 percent per year. These growth rates average 1.7 percent annual growth, which is a conservative but sustainable growth rate for visitation. Table 10 shows various travel growth rates for New York City and the U.S.
TABLE 10: TRAVEL GROWTH RATES
SOURCEAVERAGE ANNUAL
PERCENTAGE GROWTH
OMB ROOM NIGHT PROJECTIONS, 2016-2021 0.8%U.S. NATIONAL PERSON TRIPS, 10-YEAR HISTORIC 1.1%NYC VISITATION, 10-YEAR HISTORIC 3.1%AVERAGE 1.7%
Source: NYC OMB; NYC & Company; US Travel Association.
Using the 1.7 percent average annual growth rate calculated in Table 10 to project leisure travel through 2028, indicates that demand for hotel rooms will increase to over 83,300 rooms in 2020 and nearly 102,200 rooms in 2028.4 Based on the assumption that current trends continue and leisure travelers prefer to lodge predominantly in Manhattan, followed by Queens and Brooklyn, the share of demand for new rooms in each borough will remain consistent with 2016 trends. Table 11 shows the leisure hotel demand projections by borough through 2028.
4 Because occupancy rates are high and stable across New York City, there are no unabsorbed rooms in the existing supply to fulfill new demand. Increases in visitation will result in demand for additional rooms.

71
NEW YOR K C IT Y HOT EL MARKET ANALYSIS AND M1 ZONE I MPACTS
TABLE 11: LEISURE HOTEL DEMAND PROJECTIONS BY BOROUGH
BOROUGH
EXISTING DEMAND (2016)PROJECTED LEISURE HOTEL DEMAND (C)
ADDITIONAL SUPPORTABLE ROOMS
TOTAL (A) LEISURE (B) 2020 2028 2016–2020 2016–2028
BRONX 788 627 671 823 44 196BROOKLYN 4,443 3,536 3,785 4,641 249 1,105MANHATTAN 81,872 65,157 69,743 85,526 4,585 20,369QUEENS 10,177 8,100 8,670 10,632 570 2,532STATEN ISLAND 547 435 466 571 31 136TOTAL, ALL NYC 97,827 77,855 83,334 102,194 5,479 24,338
Notes: (a) Average occupied rooms per night, or total occupied rooms.(b) Based on NYC overall leisure travel share of total travel: 79.6%(c) Based on annual average US growth rate for leisure travel, 2016-2020: 1.7%
Sources: STR, 2017; NYC & Company; US Travel Association, 2017.
Business Travel. According to NYC & Company, business travelers accounted for 20.4 percent of hotel demand, or approximately 20,000 hotel rooms5 across New York City in 2016.6 These travelers come to visit businesses and attend conferences. According to the Global Business Travel Association, the top employment sectors generating business travel in 2016 include: Food Processing and Services, Utilities, Real Estate, Professional and Business Ser-vices, Social and Personal Services, Transportation Services, Government, Wholesale Trade, Construction, Manu-facturing, Communications, and Banking and Finance.7 Based on the prevalence of these and other employment sectors contributing to New York City’s business travel, this analysis uses projected employment growth rates for all non-agriculture employment sectors combined to project business travel growth through 2028.
According to the New York City Fiscal Year 2018 Budget and Financial Plan Summary,8 there were more than 4.3 million non-agriculture jobs in New York City in 2016. The Fiscal Year 2018 Budget and Financial Plan anticipates non-agricultural employment to grow by 3.8 percent between 2016 and 2020, averaging 0.95 percent growth per year. Between 2020 and 2028, the New York Metropolitan Transportation Council’s (NYMTC’s) 2050 SED Fore-casts project that non-agricultural employment will grow at a much slower rate, of 0.21 percent per year, or 1.8 percent between 2020 and 2028.9
5 Total number of rooms, or average nightly demand.6 See Table 7.7 GBTA BTI Outlook – Annual Global Report and Forecast, Q2 2016.8 Page 27.9 The New York City Fiscal Year 18 Budget and Financial Plan projects employment
through 2021. NYMTC projects employment through 2050.

72
NEW YOR K CI TY DEPA RTMENT OF C ITY PLANNING
As employment grows, demand for business traveler lodging will also increase. Applying the Budget and Finan-cial Plan and NYMTC employment growth rates to each borough’s existing share of business travel demand pro-vides the basis for projecting future business travel hotel demand. As Table 12 shows, demand from business travelers will be able to support more than 20,700 rooms by 2020 and 21,100 rooms by 2028. Subtracting off the existing 20,000 room supply shows that increased demand will be able to support nearly 770 additional rooms by 2020, and roughly 1,100 additional rooms by 2028.10
TABLE 12: BUSINESS HOTEL DEMAND PROJECTIONS BY BOROUGH
BOROUGH
EXISTING DEMAND (2016)PROJECTED BUSINESS
HOTEL DEMANDADDITIONAL
SUPPORTABLE ROOMS
TOTAL (A) BUSINESS (B) 2020 (C) 2028 (D) 2016–2020 2016–2028
BRONX 788 161 167 170 6 9BROOKLYN 4,443 907 942 958 35 51MANHATTAN 81,872 16,715 17,358 17,662 643 947QUEENS 10,177 2,078 2,158 2,196 80 118STATEN ISLAND 547 112 116 118 4 6TOTAL, ALL NYC 97,827 19,972 20,741 21,104 768 1,132
Notes: (a) Average occupied rooms per night, or total occupied rooms.(b) Business share of total demand in US: 20.4%(c) Based on citywide non-agricultural 2016-2020 employment projections presented in the Fiscal Year 2018 City
of New York Mayor's Office of Management and Budget Executive Budget growth rate of 3.85%.(d) Based on the New York Metropolitan Transportation Council 2045 Regional Transportation
Plan non-agricultural employment projections by Borough growth rate of 1.75%.
Sources: STR, 2017; NYC & Company, 2017; City of New York, Mayor's Office of Management and Budget, 2018 FY Executive Budget, 2017; New York Metropolitan Transportation Council, 2050 SED Forecasts, 2017; US Travel, 2017.
Although new business travel and supportable rooms are low, these projections align with the U.S. Travel As-sociation’s 2016-2020 projections for business travel growth. The U.S. Travel Association projects that national business travel will grow by 0.5 percent per year between 2016 and 2020. In addition, because New York City is a mature employment center with low annual growth projections between 2016 and 2028, demand for new rooms will be limited. Multiplying the 20,000 business-supported hotel rooms by 365 nights shows that business travel-ers spend more than 7.3 million nights in New York City hotel rooms, per year; by 2028, that number will increase to more than 7.7 million nights.
10 Because occupancy rates are high and stable across New York City, there are no unabsorbed rooms in the existing supply to fulfill new demand. Increases in business visitation will result in demand for additional rooms.

73
NEW YOR K C IT Y HOT EL MARKET ANALYSIS AND M1 ZONE I MPACTS
Gross Hotel Demand Projections. Adding together the existing and projected additional room demand from business and leisure travelers provides gross hotel room demand by borough in 2020 and 2028. As Table 13 shows, there will be demand for nearly 143,600 rooms in New York City by 2028, after accounting for each borough’s 2016 occupancy rate. This translates into annual average demand growth of 1.9 percent for the City overall between 2016 and 2028.11
TABLE 13: PROJECTED ROOM DEMAND BY BOROUGH AND TRAVEL TYPE
BOROUGH
2016 EXISTING
ROOM DEMAND (A)
ADDITIONAL ROOM DEMAND
FUTURE DEMAND (B)
OCCUPANCY RATE
DEMAND WITH
VACANCYLEISURE
2016–2020BRONX 788 44 6 838 72.4% 1,157BROOKLYN 4,443 249 35 4,727 78.1% 6,052MANHATTAN 81,872 4,585 643 87,101 86.8% 100,346QUEENS 10,177 570 80 10,827 84.6% 12,798STATEN ISLAND 547 31 4 582 70.3% 828TOTAL, ALL NYC 97,827 5,479 768 104,075 121,182
2016–2028BRONX 788 196 9 993 72.4% 1,371BROOKLYN 4,443 1,105 51 5,600 78.1% 7,170MANHATTAN 81,872 20,369 947 103,188 86.8% 118,881QUEENS 10,177 2,532 118 12,827 84.6% 15,162STATEN ISLAND 547 136 6 689 70.3% 981TOTAL, ALL NYC 97,827 24,338 1,132 123,297 143,565
Notes: (a) Represents number of occupied rooms.(b) Average annual growth rates: 1.6% (2016–2020) and 1.9% (2016–2028).
Source: STR, 2017.
11 This is more than the conservative projection used by New York City Office of Management and Budget (OMB) to project Transient Occupancy Tax (TOT) revenues (0.83 percent), and less than New York City’s historic 2007-2016 annual visitation growth rate of 3.1 percent. Under OMB’s projected growth rate and NYC & Company’s historic growth rate, which are not available at the borough-level, New York City would anticipate additional demand for 16,100 and 70,400 additional rooms through 2028, respectively.

74
NEW YOR K CI TY DEPA RTMENT OF C ITY PLANNING
Subtracting off the existing hotel supply shows the gross unmet demand, or additional supportable rooms above the existing supply, but not yet accounting for hotels in the development pipeline. As Table 14 shows, account-ing for the existing room stock as of April 2017, future demand will be able to support approximately 5,700 new rooms by 2020 and 28,000 rooms by 2028.
TABLE 14: GROSS UNMET ROOM DEMAND BY BOROUGH, 2020 AND 2028
BOROUGH
FUTURE DEMANDGROSS UNMET
ROOM DEMAND
2020 2028 LESS 2017 SUPPLY (A) 2020 2028
BRONX 1,157 1,371 1,088 69 283BROOKLYN 6,052 7,170 5,953 99 1,217MANHATTAN 100,346 118,881 95,449 4,897 23,432QUEENS 12,798 15,162 12,264 534 2,898STATEN ISLAND 828 981 778 50 203TOTAL, ALL NYC 120,771 143,260 115,532 5,650 28,033
Note: (a) Supply as of April 2017.
Source: STR, 2017.
Residual (Net) Hotel Demand. There are several hotels currently under construction and in various stages of pre-construction, representing the hotel room supply pipeline. This analysis assumes that any rooms currently under construction or in pre-construction would be expected to develop and serve projected unmet demand be-fore any unannounced hotels would come online. However, it should be noted that not all hotels in pre-construc-tion are guaranteed to develop; changes in market conditions may postpone or indefinitely delay development of some of these hotels. Similarly, projects not yet announced may emerge if demand exceeds projections or some of the pre-construction projects fail to get funding or otherwise dissolve.
The analysis subtracts the number of rooms under construction and in pre-construction from the projected gross unmet demand in order to estimate residual demand by borough. Residual demand represents the net new de-mand that will be unmet by existing and pipeline hotels, and could result in additional hotel applications and development. Boroughs outside of Manhattan that have more rooms under construction than demanded are shown to have no remaining room demand, but do not show negative demand, based on the assumption that a portion of these rooms are satisfying the excess demand generated by Manhattan. As the upcoming discussion of pipeline hotels shows later in this chapter, this trend is already underway.

75
NEW YOR K C IT Y HOT EL MARKET ANALYSIS AND M1 ZONE I MPACTS
As Table 15 shows, after accounting for the hotel rooms currently under construction, all Boroughs outside of Manhattan show no residual demand through 2028. As a matter of fact, in all Boroughs except for Manhattan the number of rooms under construction exceeds the estimated demand through 2028, all while Manhattan is projected to have a residual demand for nearly 9,350 rooms. This is because the estimated hotel demand projec-tions are based on existing and projected demand drivers for hotel rooms by borough, the majority of which is centered on Manhattan. However, the geographic distribution of the hotels in the pipeline, in addition to inter-views with hoteliers and developers, suggest that a portion of the demand generated by Manhattan is already spurring development in other boroughs in close proximity to Manhattan, particularly those with transit access. For example, the hotel inventory in Long Island City and North Brooklyn has grown and is anticipated to continue to grow substantially, driven in part by their proximities to Manhattan.
TABLE 15: HOTEL DEMAND AFTER ROOMS UNDER CONSTRUCTION, 2016-2028
BOROUGH
GROSS UNMET ROOM DEMAND
HOTEL ROOMS UNDER CONSTRUCTION2020 2028
BRONX 69 283 933BROOKLYN 99 1,217 3,652MANHATTAN 4,897 23,432 14,095QUEENS 534 2,898 5,173STATEN ISLAND 50 203 298TOTAL, ALL NYC 5,650 28,033 24,151
Source: New York City Planning Department, 2017.
It is important to note the considerable recent growth in hotel development in the other boroughs. Between 2010 and 2017, the four boroughs outside Manhattan collectively saw their inventory of hotel rooms increase by 77 percent, from 11,368 to 20,083. Brooklyn alone experienced a near doubling of its room inventory during this time. Manhattan, on the other hand, saw much more modest growth in its hotel room inventory in the past sev-en years, experiencing an overall increase of 36 percent. As neighborhoods outside of Manhattan become more attractive to tourists, this trend will likely continue. As a result, this analysis assumes that a portion of the hotels under construction in neighboring boroughs will address the excess demand generated by Manhattan of roughly 9,300 rooms. This results in a remaining room demand for the City of New York of roughly 4,000, as seen in Table 16 below.

76
NEW YOR K CI TY DEPA RTMENT OF C ITY PLANNING
TABLE 16: HOTEL DEMAND AFTER ROOMS UNDER CONSTRUCTION, 2016-2028
BOROUGH
GROSS ROOM DEMAND
HOTEL ROOMS UNDER CONSTRUCTION
REMAINING ROOM DEMAND
2020 2028 2020 2028
TOTAL, ALL NYC 5,650 28,033 24,151 0 3,882Sources: New York City Planning Department, 2017.
In order to estimate the remaining demand by Borough, this analysis redistributes the City’s remaining room demand, among all five boroughs based on each borough’s share of rooms in the pipeline. As Table 17 shows, most of these rooms (49.9 percent), are still anticipated to be located in Manhattan.
TABLE 17: RESIDUAL ROOM DEMAND BY BOROUGH, 2016-2028
BOROUGH
REDISTRIBUTION OF MANHATTAN
DEMAND (A)PRE-CONSTRUCTION
HOTEL ROOMS
RESIDUAL (NET) ROOM DEMAND
(2028)PERCENT ROOMS
BRONX 4.0% 155 586 0BROOKLYN 17.7% 685 3,055 0MANHATTAN 49.9% 1,937 4,862 0QUEENS 27.1% 1,051 5,113 0STATEN ISLAND 1.4% 53 219 0TOTAL, ALL NYC 100% 3,882 13,836 0
Note: (a) Due to capacity constraints and other impediments to hotel development within Manhattan, the estimated gross room demand for Manhattan is redistributed to the other Boroughs based on the distribution of hotels in the pipeline.
Source: New York City Planning Department, 2017.
Accounting for the hotel rooms currently in pre-construction results in no remaining residual demand across all Boroughs. That said, the delivery of pre-construction hotels is somewhat uncertain and will depend on a variety of factors, including market forces and availability of financing, among others. It is entirely possible that some of the pre-construction hotels will not be delivered at all, as is evidenced by a recently terminated Long Island City hotel proposal, while other hotels in the pre-construction phase may remain idle until after the projected year of 2028. In addition, hotels in the pipeline may serve as a replacement to any decrease in the supply of rooms if existing hotels are converted to permanent residences, dorms, or homeless facilities.

77
NEW YOR K C IT Y HOT EL MARKET ANALYSIS AND M1 ZONE I MPACTS
The market will likely absorb those rooms currently under construction and those in pre-construction that will be built. New York City has a stable and robust hotel market that continues to absorb rooms and maintain high occupancy rates. Furthermore, construction lenders are typically conservative when making loans to hotel devel-opers. Both points indicate that rooms currently under construction are very likely to absorb. If room absorption slows, developers and lender may delay new hotel starts until occupancy rates and average daily rates return to levels that support new development.
Impacts from Public PoliciesIt should be noted that a number of public policies could impact tourism to New York City. After President Trump signed the first Executive Order reducing immigration and visitation from seven Muslim countries, both bookings and flight searches from foreign countries dropped six and 17 percent from the same period in 2016, respectively.12 As New York receives 30 percent of total international tourism, this could potentially impact local hotel markets significantly.
As of this reporting, the travel ban has been suspended in the U.S. Court system and additional analysis has not been conducted. As of March 2017, NYC & Company has adjusted its tourism forecast for 2017 downward by 300,000 though this is less than 0.5 percent of the 61.7 million visitors originally. forecast.
Similarly, a strengthening dollar could also negatively impact New York City tourism and hotel demand. In 2017, the U.S. dollar was at a 15-year high compared to major currencies, including the Euro.13 As purchasing power from foreign visitors deteriorates due to a strengthening dollar, foreign travel to the U.S. becomes more expen-sive. Travel, lodging, goods, and services are all more expensive than previously, giving fewer foreign travelers the ability to visit the United States and New York City.
Conclusions for Hotel Development under “No Action” Scenario
Holding current market conditions constant and dispelling the likelihood of exogenous factors, New York City’s hotel market will continue to experience growth, albeit not as robust as that of the previous decade, both in Man-hattan and in the other four boroughs. Nonetheless, hotel markets in all of the other boroughs appear to be ap-proaching saturation and absorption of existing and pipeline hotel inventory may be slow, halting or delaying new hotel development in these areas. Projections show that in all boroughs outside of Manhattan, the pipeline of supply exceeds demand to varying extents. Thus, in the short-term, recent developments and the existing pipe-line will likely accommodate the growing demand. However, as Table 18 shows, after hotel rooms currently under construction absorb, there will be demand for an additional 3,900 rooms in all of New York City. Although this demand will continue to be driven by Manhattan, the increasing scarcity of hotel sites in Manhattan will continue to drive development into the other boroughs.
12 http://www.chicagotribune.com/news/nationworld/ct-trump-travel-ban-deters-tourists-20170306-story.html13 Ibid.

78
NEW YOR K CI TY DEPA RTMENT OF C ITY PLANNING
Allocating the 3,900 rooms to all boroughs based on the distribution of pipeline hotels shows that through 2028 there will be demand for 160 rooms in the Bronx, 700 rooms in Brooklyn, 2,000 rooms in Manhattan, 1,100 rooms in Queens, and 50 rooms in Staten Island. While the inventory of rooms in the pre-construction phase outweigh the projected remaining demand after accounting for hotels under construction, it is likely that these hotels will only be built under the necessary market conditions or built to replace existing rooms converted to non-lodging uses, suggesting the City has an adequate supply of rooms in the pipeline to accommodate the projected demand through 2028. However, if some of those projects are not realized, new markets emerge, or hotel demand exceeds projections, there could be some remaining unmet demand.
TABLE 18: ADJUSTED GROSS DEMAND, 2016–2028
BOROUGH
NET NEW ROOM
DEMAND (2028)
HOTEL ROOMS UNDER
CONSTRUCTION
GROSS DEMAND AFTER UNDER
CONSTRUCTION (2028)
PIPELINE DISTRIBUTION (A)
REDISTRIBUTED GROSS DEMAND
PRE-CONSTRUCTION HOTEL ROOMS
BRONX 283 933 4.0% 155 586BROOKLYN 1,217 3,652 17.7% 685 3,055MANHATTAN 23,432 14,095 49.9% 1,937 4,862QUEENS 2,898 5,173 27.1% 1,051 5,113STATEN ISLAND 203 298 1.4% 53 219TOTAL, ALL NYC 28,033 24,151 3,882 100% 3,882 13,836
Note: (a) Due to capacity constraints and other impediments to hotel development within Manhattan, the estimated gross room demand for Manhattan is redistributed to the other Boroughs based on the distribution of hotels in the pipeline.
Source: New York City Planning Department, 2017.
In addition, as new markets emerge or hotel rooms absorb over time, hotel development in areas outside of Man-hattan will likely continue, with the strongest markets clustered around transit infrastructure, as well as in areas shared between commercial corridors and M1 districts that are proximate to those commercial areas. Clearly the M1 districts have been an important area for new supply to take place and this supply has adequately addressed the needs of the tourism industry to date. If historic expansion continues and existing supply is absorbed as some industry analysts, such as JLL, have forecast, then the New York City hotel market, particularly Manhattan and parts of Brooklyn and Queens, will need to expand within the next 3 to 5 years again in order to meet growing demand. Sites with access to population centers, amenities such as bars, restaurants, employment centers, des-tinations, and transit access, as well as favorable land use regulations and relatively low land values will continue to be sought after for hotel development.

79
NEW YOR K C IT Y HOT EL MARKET ANALYSIS AND M1 ZONE I MPACTS
Appendix I: Literature ReviewThe Consultant Team undertook an overview and analysis of published sources related to the tourism industry and projections for hotel development in New York City. Sources for review include third party market evaluation and outlook reports, academic studies, industry reports and outlook projections conducted by New York City and New York State government agencies, and reports conducted by NYC & Company, in addition to relevant recent news articles in local and national newspapers, magazines and industry trade publications that focus on the trav-el and hospitality industry and New York City real estate. The following is a summary of the literature under re-view though this list is expected to continue to expand during the course of this report.
Private Third Party Market Reports
JLL; Hotel Intelligence Report: NYC; June 2016
• Focus: Market analysis and projections for New York City hotel industry with section focused on the outer boroughs market
• Reliability: Strong but must consider primary audience is hotel property investors
Tourism Economics, an Oxford Economics Company; The Economic Impact of Tourism in New York 2015; January 2016
• Focus: Overview of tourism sector and its economic impact on New York State with a section dedicated to New York City
• Reliability: Strong, consider that audience is the tourism sector. Downside is less focus on NYC and age of report.
HVS; Presentation: Hotel Industry Trends and Predictions; Fall 2016
• Focus: National hotel industry trends and predictions with section dedicated to New York City market• Reliability: Good national overview with clear assessment of hotel industry market trends. Focus is na-
tional though section on New York City is relatively large, though less focus on outer boroughs. Audience is industry professionals
Ten-X; Quarterly Hotel Monitor Report: US Hotel Market; December 2016
• Focus: Market analysis and projections for national hotel market with section dedicated to New York City• Reliability: Good recent assessment. Audience is hotel real estate investors and focus on New York City is
high-level.

80
NEW YOR K CI TY DEPA RTMENT OF C ITY PLANNING
Public Sector Reports
NYC and Company; Hotel Development in NYC 2015 – 2019; March 1, 2017
• Focus: New and projected hotel development in the five boroughs of NYC• Reliability. Strong. Excellent source of very recent data though NYC & Company notes that it should not
be considered wholly comprehensive.
Office of the New York State Comptroller; Report: The Hotel Industry in New York City; June 2016
• Focus: Economic impacts of the New York City hotel industry with growth projections• Reliability: Strong
NYC and Company; New York City Visitation Statistics; 2016
NYC and Company; International Travel to NYC 2007 – 2016
Academic Reports
CUNY Graduate Center’s Labor Market Information Service; NYC’s Traveler Accommodation Industry: A Guide for Education and Workforce Development Professionals; December 2012
• Focus: Hotel and lodging labor market and projections in New York City• Reliability: A detailed and well-researched assessment of the NYC hotel industry and labor market, in-
cluding the outer boroughs. Report however is five years old.
Pratt Center for Community Development; Hotel Development in New York City: Room for Improvement; February 2015
• Focus: How New York City policy and land use related to hotel development impacts manufacturing uses in the city
• Reliability: Report is well researched and has good data about hotels in M1 districts across all five bor-oughs. Should be noted that report has strong advocacy position in favor of safeguarding manufacturing uses and limiting hotels in manufacturing districts. Report is also two years old.

81
NEW YOR K C IT Y HOT EL MARKET ANALYSIS AND M1 ZONE I MPACTS
Periodicals and Articles (sampling)
Brooklyn and Queens have become hotel havens; so when will the bubble pop?; The Commercial Observer; June 28, 2016
Fight Looms as Bill de Blasio Seeks 90 new Homeless Shelters; City and State; March 7, 2017
Chinese becoming even bigger portion of NYC tourism market; New York Times, December 19, 2016
Hit by Oversupply, the Last Thing the NYC Hotel Industry Needs is a Travel Ban; The Commercial Observer; February 8, 2017
Mapping Brooklyn’s red-hot hotel development; The Real Deal; January 2015
Hotels in Trendy Nabes Hem in Manufacturers; Crain’s NY Business; March 8, 2015
Hotel Construction Boom in NYC is Over; The Real Deal; April 20, 2016
First a Marriott-Starwood Merger, then Hotel Closures; National Real Estate Investor, April 1, 2016
Staten Island Kicking Other Boroughs’ Butts When it Comes to Hotels;The Commercial Observer; July 24, 2016
NYC’s Great Hotel Boom Days are Over; New York Post; February 1, 2016
New Hotels About to Flood Lower Manhattan; New York Post; January 21, 2016
Jamaica is Pegged as Next Hotel Hot Spot; Wall Street Journal; January 4, 2016
Hotel Glut Leading to Slowdown in Room Rates; Crain’s NY Business; October 6, 2015

82
NEW YOR K CI TY DEPA RTMENT OF C ITY PLANNING
Appendix II: Hotel Asset ClassesLimited Service
Originally defined as a hotel without restaurant or banquet facilities, the services and amenities offered to guests of Limited Service hotels are typically simple. However, these services and amenities have expanded over the past decade and, in today’s market, a limited service hotel’s range of amenities might include a business center, a fit-ness room, a guest laundry facility, a market pantry, an indoor and/or outdoor pool and small meeting rooms.
“Budget” Limited Service hotels offer no-frills rooms at modest prices. More robust Limited Service hotels offer many of the same high-quality amenities that guests would expect from Full Service hotels, with one significant difference: Limited Service hotels lack a dedicated, revenue-producing food and beverage component.
Because of this, Limited Service hotels typically have the lowest operating costs of all three segments because they do not offer catering services or restaurants. Room rates are typically on the lower end of the scale as well, because demand for Limited Service properties generally comes from price-sensitive commercial and leisure travelers.
Examples of brands belonging to the Limited Service asset class include: Comfort Inn, Fairfield Inn, Holiday Inn Express, Homewood Suites, La Quinta, SpringHill, and Staybridge Suites.
Select Service
Select Service hotels are a hybrid category that offers the fundamentals of Limited Service properties together with a selection of the services and amenities characteristic of Full Service properties. Generally, this means cer-tain restaurant and banquet facilities but on a less elaborate scale than one would find at Full Service hotels. On the whole, Select Service properties have more in common with hotels in the Limited Service category, but specific offerings of Select Service properties vary.
Select Service hotels keep operating costs down by offering services and amenities in moderation. Hotels in this category generally do not feature multiple restaurants, expansive catering services, or an abundance of meeting space. For example, a Select Service hotel’s restaurant is likely to offer a limited menu and generally does not open for all three meals, seven days a week.
In-room amenities, however, can approach or meet the levels found at Full Service hotels. In fact, commercial de-mand has grown among Select Service hotels since 2007, as budgets for business travel tighten. The Select Service segment has continued to increase its competitive advantage by offering the in-room amenities of Full Service hotels while keeping prices low in the absence of a full-spectrum product offering.

83
NEW YOR K C IT Y HOT EL MARKET ANALYSIS AND M1 ZONE I MPACTS
While the term “Select Service” may be relatively new to the lodging scene, the concept has been around for many years. For most people, a Hilton Garden Inn, a Courtyard by Marriott, or a Hyatt Place evokes an image of the quintessential Select Service hotel. But the term also describes individual properties from largely Limited Service brands such as Best Western, Days Inn, and Clarion when those properties feature on-site restaurants or a more elaborate array of in-room amenities.
Similarly, the line between Full Service and the Select Service hotels has become increasingly blurred with the release of several new prototypes by Full Service brands such as Holiday Inn and Wyndham. The new prototypes, which include less expansive food and beverage services and feature a smaller overall building footprint, provide for greater operating efficiency for a hotel that is less expensive to build and maintain.
Full Service
The most distinguishing feature of a Full Service hotel is the abundant provision of food and beverage services suitable for both guests and groups. Full Service hotels, unlike hotels in other categories, typically play a signifi-cant role in servicing the meeting and special events needs in their market area. Therefore, on-site restaurants, lounges, and group meeting spaces with banquet facilities are the cornerstones of the Full Service offering. Fur-thermore, selective amenities such as spas, elaborate banquet rooms, doormen, valet parking, extended room service, concierge services, and high-end restaurants and boutiques distinguish many Full Service properties.
These multiple services and amenities come at a higher operational cost for the Full Service hotel, but they also help the hotel capture more selective demand and command a higher average rate. Groups requiring meeting space are a significant source of business for Full Service properties, as are business travelers willing to pay the higher room rates generally charged at these hotels. Leisure and vacation travelers, especially at the upscale and luxury levels, are also a significant market for many Full Service hotels. In all cases, Full Service hotel guests seek the extra amenities and service levels found only at these properties.
Examples of brands belonging to the Full Service asset class include: Hilton, Marriott, Hyatt, InterContinental, Radisson, Renaissance, Ritz Carlton, W and Westin.

84
NEW YOR K CI TY DEPA RTMENT OF C ITY PLANNING
Appendix III: MapsBronx Hotels by Open Date
Brooklyn by Open Date
Manhattan by Open Date
Queens by Open Date
Staten Island by Open Date
Bronx Hotels by Class
Brooklyn Hotels by Class
Manhattan Hotels by Class
Queens Hotels by Class
Staten Island Hotels Class

87
NEW YOR K C IT Y HOT EL MARKET ANALYSIS AND M1 ZONE I MPACTS
Sources: New York City Department of City Planning, 2017; STR, 2017.
"
"
"
"
"
"
"""
""
"
"
"""
"
"
"
"
"
"
""
"
""
"
"
"
""
"" """""
""
"
"
"
"
" "
"
"
"
"
"
"
"
"
"
"
"
"
"
"
"
""
""
"
"
"
""
"
"
"
"
"
"
"
"
""
"
"
"
XY
XY
XY
XYXY
XY
XY
XY
XY
XY
XY
XY
XY
XY
XY
XY
XYXY
XY
XYXY
XY
XYXY
XY
XY
XY
XY
XYXY
XY
XY
XY
XY
XYXY
XY
XY
XY
XY
XY
XY
XY
XY
XY
XYXY
XY
XY
XY
XY
XY
XY
XY
XY
XY
XY
XY
XY
XY
XY
XY
XYXY
XYXY
XY XY
XY
XY
XY
XY
XY
XY
XY
XY
XY
XY
XY
XYXY XY
XY
XY
XY
XYXY
XY
XY
XY
XY
XY
XYXYXY
XY XY
XY
XY
XY
XY
XY
XY
XY
XY
XY
XY
XY
XY
XY
XY
XY
XY
XY
XY
XY
XY
XY
XY
XY
XY
XY
XY
XY
XY
XY
XY
XY
XY
XY
XY
XY
XY
XY
XYXY
XY
XY
XY
XY
XY
XY
XY
XY
XY
XY
XY
XY
XY
XY
XY
XY
XY
XY
XY
XY
XY
XY
XY
XY
XY
XY
!
!!
!
!
!
!
!
!
!
!
!!
!
!
!
!
!
!
!
!
!
!
!
!
!
!
!
!
!!
!
!
! !
!
!
!
!!
! !
!
!
!
!
!
!
!!
!
!
!
!
!
!
!
!
!
!
!
!
!
!
!
!
!
!
!!
!
!
!
!
!
!
! !
!
!
!
!
!
!
!
!
!
!!
!
!
!
!
!
!
!
!
!
!
!
!
!
!
!
!
!
!
!
!
!
!
!
!!
!
!
!
!
!
!
!
!
!
!
!
!
!
!
!
!
!
!
!
!!
!
!
!
!
!
! !
!
!
!
!
!
!
!
!
!
!
!
!
!
!
!
!
!
!
!
!
!
!
!
!
!
!
!
!
!
!
!
!
!
!
!
!
!
!
!
!
!
!
!
!
!
!
!
!
!
!
!
!
!
!
!
!
!
!
!
!
!
!
!
!
!
!
!
!
!
!
!
!
!
!
!
!
!
!
!
!
!
!
!
!
!
!
!!
!
!!
!
!
!
!
!
!
!
!
!
!
!
!
!
!
!
!
!
!
!
!
!
!
!
!
!
!
!
!
!
!
!
!
!
!
!
!
!
!!
!
!
!
!
!
!
!
!!
!
!
!
!
!
!
!
!
!
!
!
!
!
!
!
!
!
!
!
!
!
!!
!
!
!
!!
!
!!
!
!
!
!
!
!
!
!
!
!
!
!
!
!
Manhattanville
Clinton
CentralHarlemSouth
Midtown-MidtownSouth
TurtleBay-EastMidtown
Battery ParkCity-LowerManhattan
MarbleHill-Inwood
MarbleHill-Inwood
YorkvilleUpper EastSide-Carnegie
Hill
EastHarlemSouth
MurrayHill-Kips
Bay
Gramercy
MorningsideHeights
WashingtonHeightsNorth
UpperWestSide
LincolnSquare
HudsonYards-Chelsea-Flatiron-Union
Square
WestVillage
SoHo-TriBeCa-CivicCenter-Little
Italy
Chinatown
LowerEastSide
EastVillage
StuyvesantTown-Cooper
Village
EastHarlemNorth
HamiltonHeights
WashingtonHeightsSouth
Central HarlemNorth-Polo
Grounds
Lenox Hill-Roosevelt Island
MANHATTAN
BRONX
QUEENS
BROOKLYN
Esri, DeLorme, GEBCO, NOAA NGDC, and other contributors
Manhattan Hotels by Open Date! Hotels Opened Before 2010
XY Hotels Opened Since 2010
" Pre-Construction Hotels - March 2017
M1 Districts
M1/R Districts
New York City Submarket
Neighborhood Tabulation Areas

85
NEW YOR K C IT Y HOT EL MARKET ANALYSIS AND M1 ZONE I MPACTS
Sources: New York City Department of City Planning, 2017; STR, 2017.
"
"
""
"
"
"
"
"
"
" "
"
"
"
"
Eastchester-Edenwald-Baychester
SpuytenDuyvil-Kingsbridge
Claremont-Bathgate
FordhamSouth
Soundview-Bruckner
CrotonaPark East
Soundview-CastleHill-Clason Point-Harding Park
Morrisania-Melrose
Westchester-Unionport
Longwood
Schuylerville-ThrogsNeck-Edgewater
Park
Pelham Bay-Country Club-City Island
Belmont
Bronxdale
Williamsbridge-Olinville
Allerton-PelhamGardens
MountHope
VanCortlandt
Village
North Riverdale-Fieldston-Riverdale
Highbridge
Woodlawn-Wakefield
Kingsbridge Heights
University Heights-Morris Heights
Melrose South-Mott Haven North
EastTremont
Van Nest-Morris Park-Westchester Square
MottHaven-Port
Morris
East Concourse-Concourse Village
West Concourse
PelhamParkway
West Farms-Bronx River
Parkchester
Bedford Park-Fordham North
Norwood
HuntsPoint
Co-opCity
XY
XY
XY
XY
XYXY
XY
XY
XY
!
!
!!
!
!
!
!
!
!
!
!!
!
!
!
!
BRONX
Esri, DeLorme, GEBCO, NOAA NGDC, and other contributors
Bronx Hotels by Open Date
! Hotels Opened Before 2010
XY Hotels Opened Since 2010
" Pre-Construction Hotels - March 2017
Neighborhood Tabulation Areas
New York City Submarket
M1 Districts
M1/R Districts
0 0.5 1 1.5 20.25
Miles
´

86
NEW YOR K CI TY DEPA RTMENT OF C ITY PLANNING
Sources: New York City Department of City Planning, 2017; STR, 2017.
"
""
"
"""
"
"
"
"
"
"""
""
"
"
""""
"
"
"
"
""
"""
"
"
"""" """""
""
"
"
"
"
" ""
"
"
"
"
"
"
"
"
"
"
"""
"
""
"
"
"
""
""
"
"
""
"
"
"
"
"
"
""
"
"
"
"
"
"
"
""
"
"
"
XY
XY
XY
XY
XYXY
XY
XY
XY
XY
XY
XY
XY
XY
XY
XY
XY
XY
XY
XY
XY
XY
XY
XYXY
XY
XYXY
XY
XY
XYXY
XY
XY
XY XY
XYXY
XY
XY
XY
XY
XY
XY
XYXY
XY
XY
XY
XY
XY
XY
XY
XY
XYXY
XY
XY
XY
XY
XY
XY
XY
XY
XY
XY
XY
XY
XY
XY
XY
XY
XYXY
XYXY
XY XY
XY
XY
XY
XY
XY
XY
XY
XY
XY
XY
XY
XY
XYXYXY
XY
XY
XY
XY
XY
XYXYXYXY XY
XY
XY
XY
XY
XY
XY
XY
XY
XY
XYXYXY
XY
XY
XY
XY
XY
XY
XY
XYXY
XY
XY
XY
XY
XY
XY
XY
XY
XY
XY
XY
XY XY
XY
XY
XY
XY
XYXY
XY
XY
XY
XY
XY
XY
XY
XY
XY
XY
XY
XY
XY
XY
XY
XY
XY
XY
XY
XY
XY
XY
XY
XY
XY
XYXY
XY
XY
!
!
!!
!
!!
!
!
!
!
!!
!
!
!!
!
!! !
!
!
!!
! !
!
!!!
!
!
!
!
!
!
!
!! !
!
!
!
!! !
!
!
!!!
!
!
!
!
!
!
!
!
!
!
!
!
!
!!
!
!
!!
!
!
!
!
!
!
!
!
!
!
!
!
!!
!
!
!
!
!
!
!
!
!
!
!
!
!
!
!
!
!
!
!
!
!
!
!
!
!
!
!
!
!
!
!
!
!
!
!
!
!
!
!
!
!
!!
!
!
!
!
!
!
!!
!
!
!
!
!
!
! !
!
!
!
!
!
!
!
!
!
!
!
!
!
!
!
!
!
!!
!
!!
!
!
!
!
!
!
!
!
!
!!
!
!
!
!
!
!
!
!
!
!
!
!
!
!
!
!
!
!
!
!
!
!
!
!
!
!
!
!
!
!!!
!
!
!
!
!!
!
!
!
!
!
!
!
!
!
!
!
!
!
!
!
!
!
!
!
!
!
!
!
!! !!
!
!
!
!
!
!
!
!
!
!
!
BoroughPark
Homecrest
NorthSide-South
Side
Madison
WindsorTerrace
Kensington-Ocean
Parkway
Erasmus
CarrollGardens-ColumbiaStreet-Red Hook
ClintonHill
BathBeach
BensonhurstWest
Greenpoint
Sheepshead Bay-Gerritsen Beach-
Manhattan Beach
SunsetParkWest Sunset
Park East
Georgetown-Marine Park-Bergen Beach-Mill Basin
Midwood
Gravesend
BensonhurstEast
BrightonBeach
Flatlands
East New York(Pennsylvania
Ave)Prospect LeffertsGardens-Wingate
EastWilliamsburg
Williamsburg
Bedford
Brownsville
StuyvesantHeights
OceanHillCrown
HeightsNorth
CrownHeights South
Rugby-RemsenVillage
Canarsie
StarrettCityEast
Flatbush-Farragut
BushwickSouth
BushwickNorth
OceanParkwaySouth
Flatbush
FortGreene
BrooklynHeights-Cobble
Hill
DUMBO-Vinegar Hill-DowntownBrooklyn-
Boerum Hill
Seagate-ConeyIsland
WestBrighton
ParkSlope-Gowanus
ProspectHeights
DykerHeights
BayRidge
EastNewYork
CypressHills-City
Line
BROOKLYN
QUEENS
MANHATTAN
Esri, DeLorme, GEBCO, NOAA NGDC, and other contributors
Brooklyn Hotels by Open Date! Hotels Opened Before 2010
XY Hotels Opened Since 2010
" Pre-Construction Hotels - March 2017
Neighborhood Tabulation Areas
New York City Submarket
M1 Districts
M1/R Districts
0 1 2 3 40.5
Miles
«

88
NEW YOR K CI TY DEPA RTMENT OF C ITY PLANNING
Sources: New York City Department of City Planning, 2017; STR, 2017.
"
"
"
"
"
"
"
"" "" """""
"
""
""
"
"
"
"
" ""
""
"
"
"""""
"""""""
"
"
"
"
"
"
"
"
""
"
""
"
"
"
"
"
"
""
" "
"
"
""
"
"
" "
"
XY
XY
XY
XY
XY
XY
XY
XY
XY
XY
XY
XY
XY
XY
XY
XY
XY
XY
XY
XY
XYXY
XY
XYXY
XY
XY
XY
XY
XY
XY
XY
XYXY
XY
XY
XYXY
XY
XY
XYXY
XY
XY
XY
XY
XY XY
XYXY
XY
XY
XY
XY
XY
XY
XY XY
XY
XY
XY
XYXYXY
XY
XY
XY
XYXY
XY
XY
XY
XY
XY
XY
XY
XY
XY
XY
!
!
!
!!
!
!!
!!
!
!
!!
!
!!
!
!
!
!!
!
!
!
!
!
!
!!
!
!
!
!
!
!
!!
!
!
!!!
!!
!
!
!
!
!
!
!
!
!
!!
!
!
!
!
!
!
!
!
!
!
!
!
!
!
!
!
!
!
!
!
!
!
!
!
!
!
!
!
!
!
!
!
!
!
!!!
!
!
!
!
!
!
!
!
!
!
!
!
!
!
! !
!
!
!
!
!
!
!
!
!
!
! !
!
!
!
!
!
!
!
!
!
!
!
!
!
!
!
!
!
!
!
!
!
!
!
!
!
!
!
!
!
!
!
!
!
!
!
! !
!
!
!
!
!
!
!
!!
! !!
!
!!
!
EastFlushing
Auburndale
MurrayHill
EastElmhurst
Hollis
SpringfieldGardens
North
OldAstoria
Bayside-BaysideHills
Pomonok-FlushingHeights-Hillcrest
FreshMeadows-Utopia
RegoPark
Ft. Totten-BayTerrace-Clearview
St.AlbansRichmond
Hill
Corona
SouthOzonePark
JamaicaEstates-HolliswoodMiddle
Village
Whitestone
KewGardens
Hills
NorthCorona
Maspeth
Briarwood-JamaicaHills
Jamaica
Woodside
BaisleyPark
SouthJamaica
CambriaHeights
Astoria
QueensVillage
LaureltonOzonePark
HuntersPoint-Sunnyside-West
Maspeth QueensboroHill
DouglasManor-Douglaston-Little
Neck
Ridgewood
Bellerose
Glen Oaks-FloraPark-NewHyde Park
Flushing
Breezy Point-BelleHarbor-Rockaway
Park-Broad Channel
Breezy Point-BelleHarbor-Rockaway
Park-Broad Channel
ForestHills
KewGardens
Steinway
OaklandGardens
CollegePoint
Glendale
FarRockaway-Bayswater
Elmhurst
Elmhurst-Maspeth
Lindenwood-HowardBeach
Rosedale
JacksonHeights
Woodhaven
QUEENS
MANHATTAN
BROOKLYN
Esri, DeLorme, GEBCO, NOAA NGDC, and other contributors
Queens Hotels by Open Date! Hotels Opened Before 2010
XY Hotels Opened Since 2010
" Pre-Construction Hotels - March 2017
Neighborhood Tabulation Areas
New York City Submarket
M1 Districts
M1/R Districts0 1 2 3 40.5
Miles
´

89
NEW YOR K C IT Y HOT EL MARKET ANALYSIS AND M1 ZONE I MPACTS
Sources: New York City Department of City Planning, 2017; STR, 2017.
"
"
"
"
"
XYXYXY
!
!
!
!
!
!
GreatKills
NewDorp-Midland
Beach
Mariner'sHarbor-Arlington-Port
Ivory-Graniteville
PortRichmond
ArdenHeights
Rossville-Woodrow
Stapleton-Rosebank
New Springville-Bloomfield-Travis
Westerleigh
Annadale-Huguenot-
Prince'sBay-
Eltingville
Charleston-Richmond
Valley-Tottenville
West NewBrighton-New
Brighton-St. George
Old Town-DonganHills-South
Beach
Todt Hill-EmersonHill-Heartland
Village-Lighthouse Hill
Oakwood-OakwoodBeach
GrymesHill-
Clifton-FoxHills
NewBrighton-Silver
Lake
Staten Island Hotels by Open Date! Hotels Opened Before 2010
XY Hotels Opened Since 2010
" Pre-Construction Hotels - March 2017
Neighborhood Tabulation Areas
New York City Submarket
M1 Districts
M1/R Districts
0 1 2 3 40.5
Miles
´

92
NEW YOR K CI TY DEPA RTMENT OF C ITY PLANNING
"
"
"
"
"
"
"
"""
""
"
"
"""
"
"
"
"
"
"
""
"
""
"
"
"
""
"" """""
""
"
"
"
"
" "
"
"
"
"
"
"
"
"
"
"
"
"
"
"
"
""
""
"
"
" "
"
""
"
"
"
"
"
"
"
"
""
"
"
"
"
!
"
X
"
#
#
"
#
"
!
!X
"
"
X
"
"
"
"
X
"
X
"
X"
X
X
"
"
""
!
X
" "
X
"
X
""
# "
"
#
X
"
X
"
""
#
"
X"
XX
"
"
X
!
#
#
"
"
X
!
"
X
# !
#
!
"
"
"
"
" #
!
"
#
#
!
X
#
!
!
""
!
!
X
"
"
"
"
"
"
"
"
!
"
"
"
!
!
#
!
X
"
#
"
""
#
!
"
"
"
#
"
"
!
!
!
"
#
!
"
#
"
!
!
#"
#
"
#
X
#
" #
"
X
#
"
"
!
"
"
"
X
#
X
#
"
X
!
X
#
"
"
"
"
X
X
X
"
"
X
"
X
#
X
X
"
X
!
!
#
!
#
"
"
X
"
"
"
!
"
#
!
##
!
X
!
!
!
!
#
"
!
"
!
#
!
"
#
!
!
!
!
!
X
!
!
!
!
!
"
#
#
"
"
#
"
!
"#
#
#!
"
"
"
!
#
!
#
#
"
#
#
#
"
#
X
!
#
"
"
#
#
"
"
!
#
#
!
"
!
#
"
#
"
"
#
#
#
"
!
XX
!
"
X
X
#
#
X
#"
#
"
#
X
"
X
"
X
#
#
"
#
"
X
!
!
!
"
X
!
!
#
!
#
!
X
X
!
#
X"
#
X
"
!
X
##
!
"
X
#
X
##""
"
"
X
#
"
#
"
"
"
!
!
"
"
"
#
"
"
X
"
"
#
!
"
"
#
"
X
#
#
"
#
"
""#
"
#
#
"
!
!
#
"
#
#
"
#
#
#
"
""
"
"
" #
#
#
!
#
!
"
"
!
"
"
!
"
# X
"
X
!
"
#
!"
#
"
X
#
"
"
"
#
""
#"
"
#
#
"
"
#
#
#
X
"
"
"
X#
!
"
"
"
#
"
"
"
"
X
X
!
"
"
"
"
"
!
!
"
"
"
X
#
##
#
"
#
"
"
"
#
"
#
#
"
X
"
"
X
"
"
"
"
"
"
"
#
"
"
"
!
"
X
!
Manhattanville
Clinton
CentralHarlemSouth
Midtown-MidtownSouth
TurtleBay-EastMidtown
Battery ParkCity-LowerManhattan
MarbleHill-Inwood
MarbleHill-Inwood
YorkvilleUpper EastSide-Carnegie
Hill
EastHarlemSouth
MurrayHill-Kips
Bay
Gramercy
MorningsideHeights
WashingtonHeightsNorth
UpperWestSide
LincolnSquare
HudsonYards-Chelsea-Flatiron-Union
Square
WestVillage
SoHo-TriBeCa-CivicCenter-Little
Italy
Chinatown
LowerEastSide
EastVillage
StuyvesantTown-Cooper
Village
EastHarlemNorth
HamiltonHeights
WashingtonHeightsSouth
Central HarlemNorth-Polo
Grounds
Lenox Hill-Roosevelt Island
MANHATTAN
BRONX
QUEENS
BROOKLYN
Esri, DeLorme, GEBCO, NOAA NGDC, and other contributors
Manhattan Hotels by Class! Economy
# Midscale
" Upscale
X Luxury
" Pre-Construction Hotels - March 2017
M1 Districts
M1/R Districts
New York City Submarket
Neighborhood Tabulation Areas
Sources: New York City Department of City Planning, 2017; STR, 2017.

90
NEW YOR K CI TY DEPA RTMENT OF C ITY PLANNING
Sources: New York City Department of City Planning, 2017; STR, 2017.
"
"
""
"
"
"
"
"
"
" "
"
"
"
"
!
!
!!
!
#
!
!
!
!
!
!!
!
!
!
!
!
!
!
!
"#
!
"
#
Eastchester-Edenwald-Baychester
SpuytenDuyvil-Kingsbridge
Claremont-Bathgate
FordhamSouth
Soundview-Bruckner
CrotonaPark East
Soundview-CastleHill-Clason Point-Harding Park
Morrisania-Melrose
Westchester-Unionport
Longwood
Schuylerville-ThrogsNeck-Edgewater
Park
Pelham Bay-Country Club-City Island
Belmont
Bronxdale
Williamsbridge-Olinville
Allerton-PelhamGardens
MountHope
VanCortlandt
Village
North Riverdale-Fieldston-Riverdale
Highbridge
Woodlawn-Wakefield
Kingsbridge Heights
University Heights-Morris Heights
Melrose South-Mott Haven North
EastTremont
Van Nest-Morris Park-Westchester Square
MottHaven-Port
Morris
East Concourse-Concourse Village
West Concourse
PelhamParkway
West Farms-Bronx River
Parkchester
Bedford Park-Fordham North
Norwood
HuntsPoint
Co-opCity
BRONX
Esri, DeLorme, GEBCO, NOAA NGDC, and other contributors
Bronx Hotels by Class
! Economy
# Midscale
" Upscale
X Luxury
" Pre-Construction Hotels - March 2017
M1 Districts
M1/R Districts
New York City Submarket
Neighborhood Tabulation Areas

91
NEW YOR K C IT Y HOT EL MARKET ANALYSIS AND M1 ZONE I MPACTS
Sources: New York City Department of City Planning, 2017; STR, 2017.
"
""
"
"""
"
"
"
"
"
"""
""
"
"
""""
"
"
"
"
""
"""
"
"
""" """""
""
"
"
"
"
" ""
"
"
"
"
"
"
"
"
"
"""
"
""
"
"
"
""
""
"
"
""
"
"
"
"
"
"
""
"
"
"
"
"
"
"
" "
"
"
"
#
#
""
!
!X
"
"
"
X"
X
"
""
#
!" "X
"""
"""
"
"
#
!
#
X
!
"# !!"
"
"" #
#
!
#""
!
!
"
!
"
"
!
"
"
!
"
"
!!
"#
""
#
"
"
"
!!
!
!
!
"
!
!
#"
"
#
"
"
X
#
""
"
"
"
X
X
X
!
"
"
"
X
X
X
"
"
X
"
#
X
X
X
!
#
!
#
#
"
"
"
"
#
!
##
!
!
!
!
#""
!
#
!
"
!
#
!
! !
X
!
!
!
!
"#
#"
!
#
"
#
"
!
!
!
"#
#
#!
#
!
"
"
!#
#
#
#
#
"#
#
"
X
!
#
"
!
"
!
#
#
"
"
!
#
#
!
!
"
#
#
#
#
"
"
#
#
#
"
!
XX"
X
X
#
X
#"
#
"
#
"
X
"
X
"
"
X
#
#
"
#
"
!
X
!
"
X
#
!
#
!
#
X
#
X"
#
X
#
"
#
X
#
#
#
#
"
X
!
#
#
X
##""
"
"X
#
"
"#
"
"
"
!
"
""
#
"
"
X
#
"
"
"#
!
"
"
#
"
X
#
"
#
"
"
"
#
#
"
!
!
#
"
"
"
#
#
#
#
#
"
""
"
" #
#
!
#
!
!
!
"
!
!
"
!
!
"
"
#
!"
#
#
#
"
"
"
#""
# "
"
#
#
#
"
"
#
#
X
""
#
!
"
"
"
#
#
"
#
"
"
"
X
"
"
!
"
"
"
!
!
"
!
# #
"
"
X
#
##
#
"
#
"
"
"
#
"
"
X
#
#
"
"
X
#
"
"
"
!
"
"
"
"
"
"
"
"
!
BoroughPark
Homecrest
NorthSide-South
Side
Madison
WindsorTerrace
Kensington-Ocean
Parkway
Erasmus
CarrollGardens-ColumbiaStreet-Red Hook
ClintonHill
BathBeach
BensonhurstWest
Greenpoint
Sheepshead Bay-Gerritsen Beach-
Manhattan Beach
SunsetParkWest Sunset
Park East
Georgetown-Marine Park-Bergen Beach-Mill Basin
Midwood
Gravesend
BensonhurstEast
BrightonBeach
Flatlands
East New York(Pennsylvania
Ave)Prospect LeffertsGardens-Wingate
EastWilliamsburg
Williamsburg
Bedford
Brownsville
StuyvesantHeights
OceanHillCrown
HeightsNorth
CrownHeights South
Rugby-RemsenVillage
Canarsie
StarrettCityEast
Flatbush-Farragut
BushwickSouth
BushwickNorth
OceanParkwaySouth
Flatbush
FortGreene
BrooklynHeights-Cobble
Hill
DUMBO-Vinegar Hill-DowntownBrooklyn-
Boerum Hill
Seagate-ConeyIsland
WestBrighton
ParkSlope-Gowanus
ProspectHeights
DykerHeights
BayRidge
EastNewYork
CypressHills-City
Line
BROOKLYN
QUEENS
MANHATTAN
Esri, DeLorme, GEBCO, NOAA NGDC, and other contributors
Brooklyn Hotels by Class! Economy
# Midscale
" Upscale
X Luxury
" Pre-Construction Hotels - March 2017
M1 Districts
M1/R Districts
New York City Submarket
Neighborhood Tabulation Areas

93
NEW YOR K C IT Y HOT EL MARKET ANALYSIS AND M1 ZONE I MPACTS
Sources: New York City Department of City Planning, 2017; STR, 2017.
"
"
"
"
"
"
"
"" "" """""
"
""
""
"
"
"
"
" ""
""
"
"
"""""
"""""""
"
"
"
"
"
"
"
""
"
""
"
"
"
"
"
"
""
"
"
"
""
"
"
" "
"
X
"
#
""
"
X"
"X
"
X
"X
"
XX
X
"
"
""
!
X
!
"
X
X
"
"
X
X
"
""
#
"
X"X
XX
!
!
"
X
!
"
"
"
#
!!
"
!
X
"
!
"
"
!
"
"
"
!
!
#
!
!
!
"
!
!
"
!
!
!
!
!
!
#
!
#
!
"
"
#
"#"
!
X
!
#
!
!
!
"
!
#
!
"
!
# #
#
!
!
!
!
#
#
#
!
!
! #
#
#
"
!
#
#
#
!
#
!
!
"
!
!
#
!
#
X
!
!
!
#
#
!
!
#
#
"
#
X
!
#
#
#
# #
!
!
!
!
!
!
#
X
#
!
#
#
#
#
!
##
#
"
#
"
!
"
#
"
!
#
!
"
#
"
""
#
"
!
!
##
!
!
!
!
!
!
#
XX
!
"
X
#
""
"
#"
!
!
X
#
! #
#!
"
X
"
!
#
!
# #
"
!
#
"
"
#
"
#
"
"
#
"
"
!
!
"
!
"
X
#
!
#
EastFlushing
Auburndale
MurrayHill
EastElmhurst
Hollis
SpringfieldGardens
North
OldAstoria
Bayside-BaysideHills
Pomonok-FlushingHeights-Hillcrest
FreshMeadows-Utopia
RegoPark
Ft. Totten-BayTerrace-Clearview
St.AlbansRichmond
Hill
Corona
SouthOzonePark
JamaicaEstates-HolliswoodMiddle
Village
Whitestone
KewGardens
Hills
NorthCorona
Maspeth
Briarwood-JamaicaHills
Jamaica
Woodside
BaisleyPark
SouthJamaica
CambriaHeights
Astoria
QueensVillage
LaureltonOzonePark
HuntersPoint-Sunnyside-West
Maspeth QueensboroHill
DouglasManor-Douglaston-Little
Neck
Ridgewood
Bellerose
Glen Oaks-FloraPark-NewHyde Park
Flushing
Breezy Point-BelleHarbor-Rockaway
Park-Broad Channel
Breezy Point-BelleHarbor-Rockaway
Park-Broad Channel
ForestHills
KewGardens
Steinway
OaklandGardens
CollegePoint
Glendale
FarRockaway-Bayswater
Elmhurst
Elmhurst-Maspeth
Lindenwood-HowardBeach
Rosedale
JacksonHeights
Woodhaven
QUEENS
MANHATTAN
BROOKLYN
Esri, DeLorme, GEBCO, NOAA NGDC, and other contributors
Queens Hotels by Class! Economy
# Midscale
" Upscale
X Luxury
" Pre-Construction Hotels - March 2017
M1 Districts
M1/R Districts
New York City Submarket
Neighborhood Tabulation Areas

94
NEW YOR K CI TY DEPA RTMENT OF C ITY PLANNING
Sources: New York City Department of City Planning, 2017; STR, 2017.
"
"
"
"
"
#
"
!
!
!
#
##!
GreatKills
NewDorp-Midland
Beach
Mariner'sHarbor-Arlington-Port
Ivory-Graniteville
PortRichmond
ArdenHeights
Rossville-Woodrow
Stapleton-Rosebank
New Springville-Bloomfield-Travis
Westerleigh
Annadale-Huguenot-
Prince'sBay-
Eltingville
Charleston-Richmond
Valley-Tottenville
West NewBrighton-New
Brighton-St. George
Old Town-DonganHills-South
Beach
Todt Hill-EmersonHill-Heartland
Village-Lighthouse Hill
Oakwood-OakwoodBeach
GrymesHill-
Clifton-FoxHills
NewBrighton-Silver
Lake
STATENISLAND
Esri, DeLorme, GEBCO, NOAA NGDC, and other contributors
Staten Island Hotels by Class! Economy
# Midscale
" Upscale
X Luxury
" Pre-Construction Hotels - March 2017
M1 Districts
M1/R Districts
New York City Submarket
Neighborhood Tabulation Areas

© 2017 City of New York
New York City Department of City PlanningCENTRAL OFFICE 120 Broadway31st FloorNew York, NY 10271
Tel . 1-212-720-3300Fax. 1-212-720-3488
http://www.New York City.gov/planning
Prepared for New York City Department of City Planning by
• BJH Advisors (bjhadvisors.com)
• BAE Urban Economics (bae1.com)
• VHB (vhb.com)
© 2017 City of New York
New York City Department of City PlanningCENTRAL OFFICE 120 Broadway31st FloorNew York, NY 10271
Tel . 1-212-720-3300Fax. 1-212-720-3488
http://www.New York City.gov/planning