
Recent Trends in Business Management - PrimaxIJCMR
240
-
Upload
khangminh22 -
Category
Documents
-
view
0 -
download
0
Transcript of Recent Trends in Business Management - PrimaxIJCMR

“Recent Trends in BusinessManagement”
• Research Papers • Articles • Case studies
JJJJJourourourourournal ofnal ofnal ofnal ofnal of Emer Emer Emer Emer Emerging ging ging ging ging TTTTTececececechnolohnolohnolohnolohnologiesgiesgiesgiesgiesand Innoand Innoand Innoand Innoand Innovvvvvaaaaatititititivvvvve Re Re Re Re Researesearesearesearesearccccchhhhh
ISSN: 2349-5162Journal of Emerging Technologies and Innovative Research
Page IIFebruary 2019Special Issue
Managing Editor:Dr. Prof. Jai Paul DudejaDirector, Amity Institute of Laser Technology & Optho Electronics Engineering Hariyana.
Prof. T. Rajeswari., M.Sc.,M.A(Eng).,M.B.A.,M.A.(Soc).,
President, Primax Foundation, Bangalore. Karnataka.
Co-ordinator:Dr. K. V. RamanathanDirector & Professor of Finance & Marketing,AVK Institute of Management, Bangalore.
Dr. V. SelvarajSecretary, Primax Foundation, Bangalore.
Dr. P SomashekarHOD, PGDOMS, PESCE, Mandya
Conference Conveners:Mahesh A SAssociate Professor, PESCE, Mandya.
Dr. AluregowdaAssociate Professor, PESCE, Mandya.
Dr. Kiran Kumar A CAssociate Professor, PESCE, Mandya.
Suman T DAssociate Professor, PESCE, Mandya.
Publication: IJ Publication
Issue:Special Issue, February 2019
COPY RIGHT:1. Reproduction of any part of this Journal in the whole or in part without written permission from the
publisher is prohibited2. All rights reserved : JETIR
Contact:EditorJournal of Emerging Technologies and Innovative Researchwww.jetir.org
Page III P.E.S. College of Engineering, Mandya & Primax Foundation, Bengaluru
UGC ID No: 63975 Impact Factor - 5.87“Recent Trends in Business Management”
ContentsTitle of the Articles
Performance Management in Public Sector Organizations- B. Shobha Rani & P. Durgesh
Financial Inclusion and Role of Reserve Bank of India- P. Durgesh & B. Shobha Rani
Corporate Social Responsibility Initiatives of State Bank of India - A CaseStudy - K. Kusuma & Dr. Murali Krishna
Artificial Intelligence – A Boon or Bane to the Business Houses- Shashwathi B. S & Beena P
Evaluating an Intervention Programme with A Pretest-Posttest Design: withReference to Time Management and Adaptability for Management Students
- Harshita G. Jadwani & Ameer Asra Ahmed
A Study on Indian Intial Public Offering’s (IPO’s) During The Financial YearFrom 2010-2018 - Santosh Kumar
Herding Behaviour In Indian Stock Market – An Empirical Evidence from NSEIndia - Rashitha R. Gowda & Dr. Mahua Biswas
Role of Akshayakalpa in the Promotion of Organic Dairy Entrepreneurship inRural Areas - Parvathi T. M, Dr. Shobharani H. & Akash M.S.
Integration of Commodities Market: The Case of India and US- Dr. Manu K. S & Raghu H .N
The Impact of Debt-Equity Proportion on Profitability of SelectedPharmaceutical Companies of India
- Payal Pattnayak & Prof. Devi Prasad Misra
A Study on Competency Mapping and Assessment of Employees- Krithika Raj & Nagasudha. R
Digital Banking in India – Perception of Customers on Paperless Transaction- Dr. Divya.B.S
Leverage: A Tool for Measuring Risk - Dr. Manoj Kumara N.V
Paperless Mobile Ticket Booking UTS Application: An exploratory study ofregion Thane. - Aarti Vikmani & Dr. Meenakshi Malhotra
Virtual Reality in MBA- Emerging Branding Tool- Dr (Hc). D.M. Arvind Mallik
Perception of Consumers on Goods and Service Tax in Mysore City- Latha .T
1
2
3
4
5
6
7
8
9
10
11
12
13
14
15
16
1 - 5
6 - 10
11 - 18
19 - 22
23 - 26
27 - 32
33 - 37
38 - 43
44 - 52
53 - 62
63 - 70
71 - 74
75 - 84
85 - 89
90 - 94
95 - 98
Sl.No. Page No.

ISSN: 2349-5162Journal of Emerging Technologies and Innovative Research
Page IVFebruary 2019Special Issue
Raymond Re-Imagined: A Case Study- Dr. Pallavi Chandwaskar & Dr. Smita Jape
Woman as the Key Decision-Maker; The Changing Trend in the BusinessWorld. - Joe Ashwin Correa & Dr. Ananthpadmanabha Achar
A Study on Mergers and Acquisitions: (Impact of Mergers and AcquisitionProcess on Corporate Enterprises) - Thorera Leena Ganesh
Digital India (Impact of Digitlisation Towards Agricultural Sector)- Nandha. H. G
Green Marketing: Strategies in the Changing Scenario- Movina Kumara N. P
Social Media Marketing- Challenges and Opportunities - Raghu K. V
A Study on MBA Students’ Perception Towards Sustainable Human ResourceManagement - Dhanalakshmi .P & Dr. N. Babitha Thimmaiah
Analytical Study on Employee Satisfaction with Reference to ShashwatiPlastics, Hebbal Industrial Area, Mysore.
- A.S. Mahesh & Dr. P. Somashekar
A Conceptual Frame Work of Customer Service Strategy Map- Dr. A. C. Kiran Kumar
Children’s Preference towards Game and Toy - A Case Study During MahaSavings Day at Big Bazar, Mandya
- Alure Gowda, Dr. Srinivas K.T & Kiran N. G
A Study on Determinants and Outcomes of Job Crafting in an Organization- Madhusudhan R. Urs & Pooja Nagpal
A Study on Corporate Entrepreneurship Drivers and its Outcome- Fayeeza Khanum & Pooja Nagpal
A Study on Trend Analysis of Key Segments of Indian Automobile Sector andAnalyzing the Factors Affecting the Performance of Automobile Sector in India
- Raghavendra M, Mahendrakumar .N & Chandrika .R
A Study on Significance of Electric Vehicles in Indian Automobile Industry- Hemanth Gowda S.M, Vijayalakshmi .D & Chandrika .R
The Road Ahead of HR – AI to Boost Employee Engagement- Pooja Nagpal, Dr. Senthil Kumar & Dr. H. V. Ravindra
An Empirical Study on Risk and Return Analysis of Selected Indian Companiesand the their Portfolio Construction
- Manjuprasad.M.K, Dr. Somashekar .P & A. S. Mahesh
Title of the ArticlesSl.No. Page No.
17
18
19
20
21
22
23
24
25
26
27
28
29
30
31
32
99 - 102
103 - 106
107 - 110
111 - 113
114 - 117
118 - 121
122 - 126
127 - 133
134 - 139
140 - 144
145 - 151
152 - 158
159 - 170
171 - 179
180 - 183
184 - 188
Page V P.E.S. College of Engineering, Mandya & Primax Foundation, Bengaluru
UGC ID No: 63975 Impact Factor - 5.87“Recent Trends in Business Management”
Title of the ArticlesSl.No. Page No.
33
34
35
36
37
38
39
40
An Empirical Study of Factor Contributing towards Adoption of Mobile Bankingwith Reference to Mandya District, India
- Suman T. D, Dr. A. C. Kiran Kumar, Sahana S. N & Kavya S. T
A Study on Impact of Demonetization on Selected Indices of Indian StockMarket - Suman T. D, Dr. A. C. Kiran Kumar, Vimala & Aishwarya Jos
Human Resource Accounting - Deepa Anil
Factor Affecting Consumer’s Brand Preference of Electronic DurableProducts - D. Prabha
A Study on Consumer’s buying Behaviour and Brand Image with Regard toFast Moving Consumer Goods in Mysuru District
- S. Poornima & Dr. H. C. Honnappa
Reference to Artisanship-Analysis of Top Ten Women’s Ethnic Wear ApparelWebsites - Phinu Jose & Dr. Elangovan .N
Influence of Gender on Impulse Buying Behavior: A Study of Shopping Mallsin Bengaluru City - Umesha s & Dr. MariGowda .S
Programmatic Advertising a New ERA in Digital Marketing – Issues andChallenges - Madhusudan .H.N
189 - 193
194 - 202
203 - 204
205 - 208
209 - 216
217 - 222
223 - 227
228 - 231
Page 1 P.E.S. College of Engineering, Mandya & Primax Foundation, Bengaluru
UGC ID No: 63975 Impact Factor - 5.87“Recent Trends in Business Management”
PERFORMANCE MANAGEMENT IN PUBLICSECTOR ORGANIZATIONS
1. Assistant Professor, PVKK Institute of Technology, Anantapuramu, A.P2. Assistant Professor, PVKK Institute of Technology, Anantapuramu, A.P
Abstract
Performance management is one of the important areas to study in Human resource management. It has been oneof the most discussed and studied human resource functions in world wide. Performance management is ascomprehensive process under taken by organizations worldwide to improve its employee’s performance. It helps toachieve organizations goals through continuous research and feedback leading to improvement of employeeperformance and also make strong use of goal setting and metrics to identify and areas of individual strength. Thepresent study identifies the critical factors of effectiveness of performance management in public sector organizations.And it will report the inconsistencies in the performance management research results.
Key words: performance management, effectiveness, performance management in public sector organizations
IntroductionThe elements of a good performance managementsystem or simple but integrating them in to a businessfundamental operating system is more difficult then itseems. Effective performance management is essentialto businesses through both formal and informalprocesses it helps them align their employees, resourcesand systems to meet their strategic objectives. It worksas a dashboard too, providing an early warning ofpotential problems and allowing managers to know whenthey must make adjustments to keep a business ontrack.
Performance management relies on the analysis of howorganizations employees have historical accomplishedtasks in an effort to improve future performance. Effectivemanagers seek to provide feedback and receive feedbackfrom employee’s continuously, rather than relying onoccasional appraisals. This allows a manager todetermine what motives employees to work hard, suchas potential effects on salary, evaluate what obstaclesare making it difficult for employees to effectively do theirjobs and make adjustments to employee’s workloadsas necessary.
Meaning of Performance managementPerformance management is a process that providesfeedback, accountability and documentation forperformance outcome. It helps employees to channeltheir talents towards organizational goals.
Definitionperformance management is an ongoing process ofcommunication between supervisor and employee that
B. Shobha Rani1 P. Durgesh2
occurs throughout the year in support of accomplishingthe strategic objectives of the organization.
Performance management is the supervision andoversight of employees, departments and organizationswith the objective of seeing that milestones and objectivesare reached in an efficient and effective manner.
The traditional performance management cycleWhile there are many versions of the performancemanagement cycle, the most popular is probably theone cited by Michael Armstrong in his Handbook ofPerformance Management. Below is our representationof this cycle: (Fig.1)The first stage of this performance management cycleis ‘planning’, a phase which was traditionally carried outonly once each year. During this planning phase,employees are set SMART objectives, which contributeto achieving one or more of the company’s goals.The planning phase also includes the formation of apersonal development plan (what strengths and skillsthe employee should develop to achieve their goals) anda review of the employee’s job requirements. The ideais to ensure that the organization’s goals and valuesfeed into this planning phase, thereby ensuring thatindividual performance is aligned with the overall strategyof the organization.The next stages are ‘Act’ and ‘Track’, which occurthroughout the year. Employees aim to achieve theirobjectives and carry out their role effectively, while linemanagers coach their employees, track progress, andprovide feedback.

ISSN: 2349-5162Journal of Emerging Technologies and Innovative Research
Page 2February 2019Special Issue
Historically, companies have placed a large emphasison the final stage, ‘Review’, often combining it withemployee performance ratings. The ‘Review’ phasetraditionally encompasses an annual performance review,a meeting where employee and manager discuss andevaluate goal progression and completion, performanceissues, training and development, and opportunities foradvancement.
This once-a-year meeting can be extremely stressfulfor both employee and manager, and ultimatelyunproductive. Attempting to discuss and achieve somuch in one meeting is simply unfeasible and the reviewfrequently becomes a tick-the-box exercise with littlemeaningful conversation. Because of the inadequaciesof this annual process, a more agile performancemanagement cycle has been adopted by companiesaround the world, which we’ll look at below.
The performance management cycle is shifting andevolvingIn recent years, it has become widely recognized that itis more productive and motivating to discussperformance and give feedback regularly, rather thanonce or twice a year. This mindset has allowed for the
creation of a continuous approach to performancemanagement. This means that instead of one annualperformance management cycle, many companies(including Adobe and Microsoft) have introduced a seriesof consecutive, smaller and more intuitive cycles, asshown below:
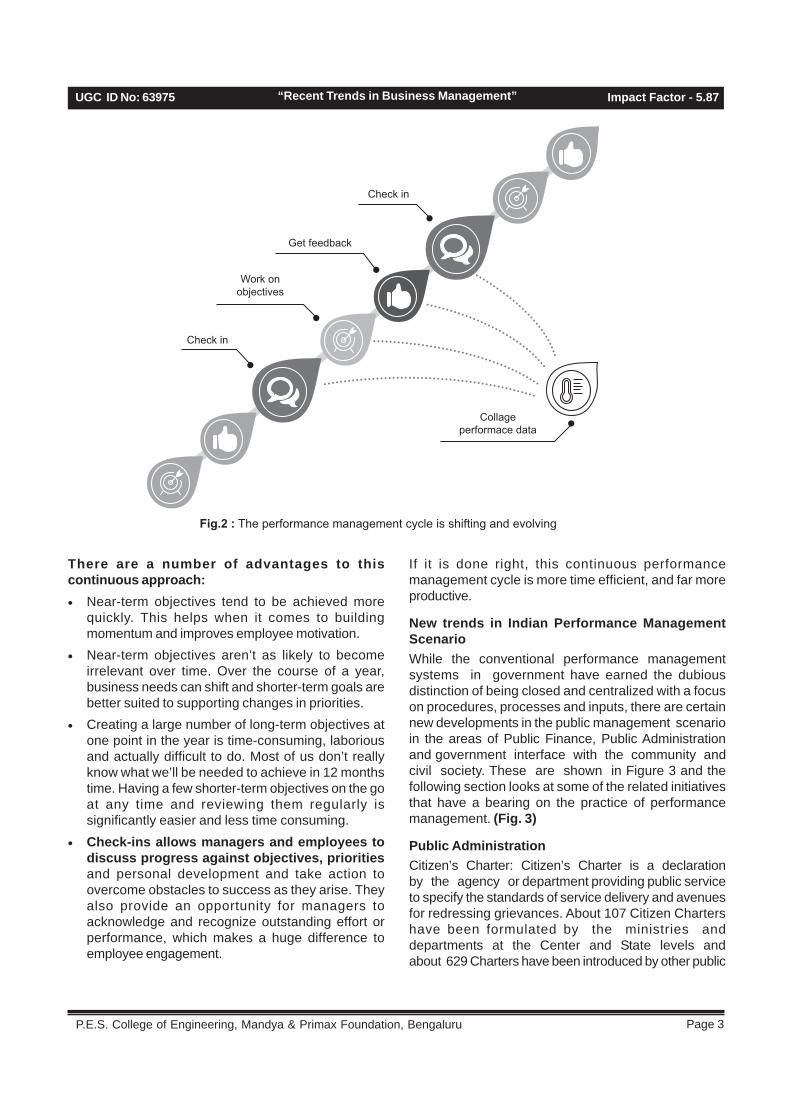
Diagram showing Continuous Performance Improvementcycle (Fig. 2)
This performance management cycle is an ongoingprocess of developmental performance discussions andfeedback, which allows employers and managers to treatperformance management as a process that “connectsan organization’s culture, business goals and strategyto individual performance and contribution”.
Rather than setting an unrealistically large number of12-month objectives at the start of each year, under thisnew approach, employees and managers regularly meetand collaborate on a smaller number of ‘near-term’SMART goals. These goals are then periodically reviewedat ‘check-in’ meetings, when new near-term goals arealso agreed. Meetings are an opportunity for managerand employee to engage in future-focused, action-oriented discussions.
Plan
Set SMART objectivesagree personal
development planupdate role profile
ReviewReview achievements
identify learningsdiscuss career goals
agree actions
Performancemanagement
cycle
ACTAchieve objectives
carry out roleimplement personaldevelopment plan
Track progressregular feedbackmitigate obstacles
coaching
Track
Organisation’sgoals and values
Fig.1 : The traditional performance management cycle
Page 3 P.E.S. College of Engineering, Mandya & Primax Foundation, Bengaluru
UGC ID No: 63975 Impact Factor - 5.87“Recent Trends in Business Management”
There are a number of advantages to thiscontinuous approach:• Near-term objectives tend to be achieved more
quickly. This helps when it comes to buildingmomentum and improves employee motivation.
• Near-term objectives aren’t as likely to becomeirrelevant over time. Over the course of a year,business needs can shift and shorter-term goals arebetter suited to supporting changes in priorities.
• Creating a large number of long-term objectives atone point in the year is time-consuming, laboriousand actually difficult to do. Most of us don’t reallyknow what we’ll be needed to achieve in 12 monthstime. Having a few shorter-term objectives on the goat any time and reviewing them regularly issignificantly easier and less time consuming.
• Check-ins allows managers and employees todiscuss progress against objectives, prioritiesand personal development and take action toovercome obstacles to success as they arise. Theyalso provide an opportunity for managers toacknowledge and recognize outstanding effort orperformance, which makes a huge difference toemployee engagement.
If it is done right, this continuous performancemanagement cycle is more time efficient, and far moreproductive.
New trends in Indian Performance ManagementScenarioWhile the conventional performance managementsystems in government have earned the dubiousdistinction of being closed and centralized with a focuson procedures, processes and inputs, there are certainnew developments in the public management scenarioin the areas of Public Finance, Public Administrationand government interface with the community andcivil society. These are shown in Figure 3 and thefollowing section looks at some of the related initiativesthat have a bearing on the practice of performancemanagement. (Fig. 3)
Public AdministrationCitizen’s Charter: Citizen’s Charter is a declarationby the agency or department providing public serviceto specify the standards of service delivery and avenuesfor redressing grievances. About 107 Citizen Chartershave been formulated by the ministries anddepartments at the Center and State levels andabout 629 Charters have been introduced by other public
Collageperformace data
Get feedback
Check in
Work onobjectives
Check in
Fig.2 : The performance management cycle is shifting and evolving
ISSN: 2349-5162Journal of Emerging Technologies and Innovative Research
Page 4February 2019Special Issue
organizations. The Citizen’s Charter is an important animportant tool to improve the quality of services, addressthe needs of citizens’ rights and set clear standards ofperformance.
Sevottam:The Department of Administrative Reforms and PublicGrievances has introduced a model for benchmarking‘Excellence in Public Service Delivery (Sevottam)’.This is a framework for organizations to assess andimprove the quality of service delivery for the citizens. Itguides government departments to identify the servicesto be delivered to set service norms, align deliverycapability with expectations of citizens, gauge thequality of service delivery through an objectiveassessment and to improve quality using interventionslike business process redesign and informationtechnology. ‘Sevottam’ is currently under implementationin ten central ministries and departments with largepublic interface.
Right to Information (RTI) Act:Through this recently enacted Act, citizens of India haveaccess to information under the control of publicauthorities with the objective of promoting transparencyand accountability in these organizations. The influenceof this Act as a new paradigm in accountability isvery significant in improving performance.
Civil Society initiatives in performancemanagement in governmentWhile the focus of this paper is on the performancemanagement mechanisms in government, it isworthwhile to look at a few path-breaking accountabilitytools initiated by the civil society movement which canbe helpful in improving performance management.
Citizen’s Report Card (CRC)These report cards are surveys that solicit user feedbackon the performance of public services to enhancepublic accountability. These scores reflect theperformance of public service providers based oncitizen feedback. The CRC has a good potential to evolveas a tool to support performance management system.Community Score Card (CSC): It is a communitybased monitoring tool that is a hybrid of the techniquesof social audit and citizen report cards (CRC). This is aninstrument to extract social and public accountabilityand responsiveness from service providers. As thecitizens are empowered to provide immediate feedbackto service provider, it facilitates community monitoringand performance evaluation of services, projects and evengovernment agencies.
Social AuditSocial audit is a mandatory process of transparencywhereby records are placed by government officialsor elected representatives for public scrutiny. Whereasthe 73rd and 74th amendments to the Constitutionhave created a large space for democraticdecentralization, social audits are mandated in theprogrammes under NREGA and NRHM
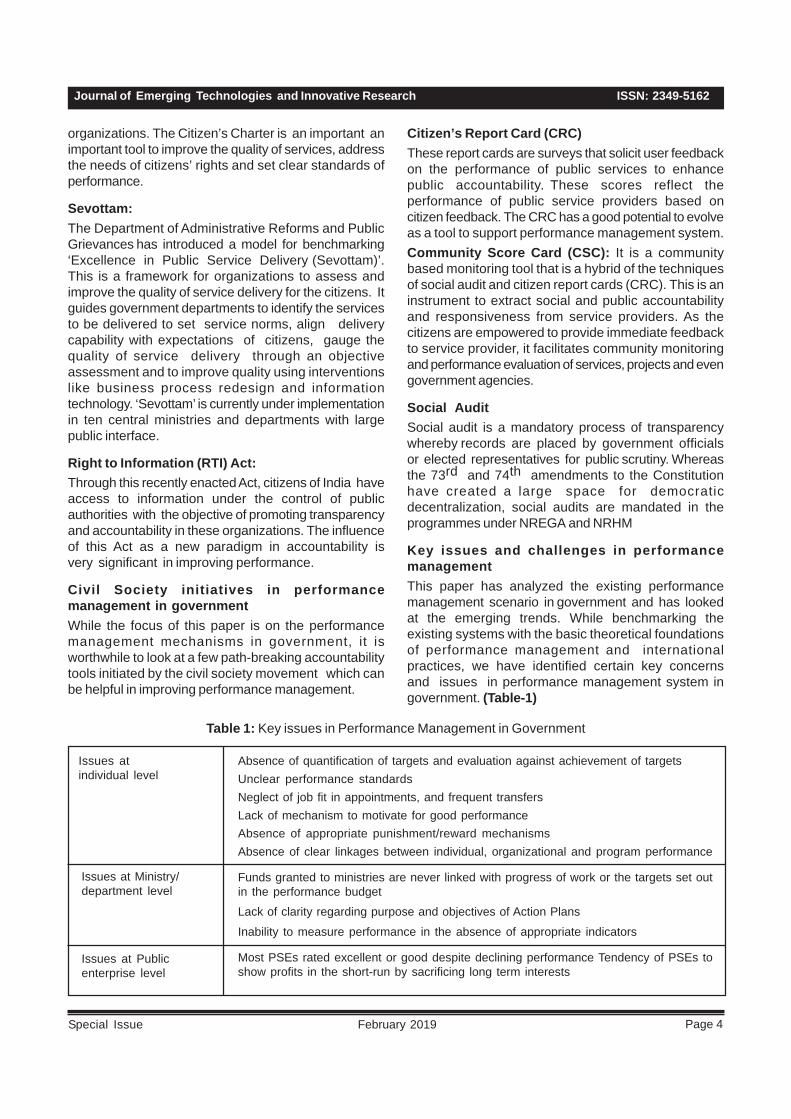
Key issues and challenges in performancemanagementThis paper has analyzed the existing performancemanagement scenario in government and has lookedat the emerging trends. While benchmarking theexisting systems with the basic theoretical foundationsof performance management and internationalpractices, we have identified certain key concernsand issues in performance management system ingovernment. (Table-1)
Table 1: Key issues in Performance Management in Government
Absence of quantification of targets and evaluation against achievement of targetsUnclear performance standardsNeglect of job fit in appointments, and frequent transfersLack of mechanism to motivate for good performanceAbsence of appropriate punishment/reward mechanismsAbsence of clear linkages between individual, organizational and program performance
Funds granted to ministries are never linked with progress of work or the targets set outin the performance budget
Lack of clarity regarding purpose and objectives of Action Plans
Inability to measure performance in the absence of appropriate indicators
Most PSEs rated excellent or good despite declining performance Tendency of PSEs toshow profits in the short-run by sacrificing long term interests
Issues atindividual level
Issues at Ministry/department level
Issues at Publicenterprise level

Page 5 P.E.S. College of Engineering, Mandya & Primax Foundation, Bengaluru
UGC ID No: 63975 Impact Factor - 5.87“Recent Trends in Business Management”
Lack of scope for true negotiationNo mechanisms to enable the movement of accountability to lower levels
Focus on inputs and process compliance neglects the outcomes and impactsLack of measurable indicatorsDichotomy between plans and budgets
Issues at program/project level
Summary of available recommendations on performance managementThis section looks at the major contemporary recommendations on various aspects of performancemanagement in India as given in Table. An analysis of these recommendations is expected to give insights forcharting the future course of action
Table 2: Summary of available recommendations on performance management
Conclusion:Performance management system (PMS) is veryessential in Human Resource management. it helps toachieve the business targets with in time and efficientperformance management system can boost the firmsto maximize the employee performance. Everyorganizations need for a strong performance managementsystem to be implemented in all public sectororganizations. It is importance for every businessorganization to identify the skills of an employee andutilize those skills for organizational requirements. Butnow a days it is very costly activity.PMS can bring theaccountability in public sector organizations.
References:-1. Sameeksha jain and aditya gautam (2016) “
comparison of performance management systemsin public and private sector: a study of manufacturingorganizations” international Journal of Managementin education” vol 6. Issues 5
2. Julia huprich (2008) “ A brief introduction toPerformance Management”
3. Performance management in government, by centrefor good governance, Hyderabad
4. https clearreview.com/stages – of – performancemanagement/cycle.
1. Setting targets and priorities in line with government’s plans and available Resources
2. Preparation and periodical review of performance indicators of each employee withwell-defined principles for achievement.
1. Expanding the present system to a comprehensive performance management system
2. Individual contributions should be linked to the strategic objectives of the Organization
3. Annual performance agreements to be signed between the Minister and the Secretary/Heads of Departments, providing physical and verifiable details of the work to be doneduring a financial year
4. The proposed Central Public Services Authority may be the third party to Monitorperformance
1. PRI (Performance Related Increments) should be introduced as an extra incentive ontop of the total compensation package
2. PRI should be implemented at all levels, individually or for groups, such that theincentive structures of lower-level and higher-level employees are not in contradiction.
3. PRI should be implemented based on multi-dimensional assessment of
4. Performance including public/ stakeholder service delivery.
5. PRI should be paid out of the funds generated by the ministries/ organizations throughtheir own resources so that the system is budget neutral.
Public ServicesBill 2007
Recommendations on performance managementSource
Second AdministrativeReform Commission
Sixth Central PayCommission
ISSN: 2349-5162Journal of Emerging Technologies and Innovative Research
Page 6February 2019Special Issue
FINANCIAL INCLUSION AND ROLE OF RESERVE BANK OF INDIA
1. Assistant Professor,PVKK Institute of Technology, Anantapuramu, A.P2. Assistant Professor,PVKK Institute of Technology, Anantapuramu, A.P
AbstractIndia is one of the fastest developing economies in the world. But there is no uniformity in its growth. Growth of theeconomy is restricted to few sectors only. So the need for inclusive growth comes in the picture of India economicdevelopment. For obtaining the objectives of inclusive growth there is a need for resources and for resource generationand mobilization financial inclusion is required. It plays vital role in the process of economic growth. The presentpaper focuses on to understanding inclusive growth and role of Reserve Bank of India to uplift the weaker section.
Key words: financial inclusion, importance, Role of Reserve bank of India
P. Durgesh1 B. Shobha Rani2
IntroductionFinancial inclusion plays vital role in eradicating povertyin India. It provides banking services to masses includingprivileged and disadvantaged people. In the financialinclusion is everybody have a bank account with anybank. It includes loans, insurance services and otheragency services. Basically it is the delivery of bankingservices at an affordable cost and in a fair and transparentmanner to the vast sections of disadvantaged and lowincome groups. The banking services should availableto the entire population without any discrimination. Butin reality it is not happened. It is seen that poor or weakersections are ignored by the poor and vulnerable groupsis a prerequisite for poverty reduction and socialcohesion. This has to become an integral part of banksefforts to promote inclusive growth through credit; theattempt must be to lift the poor from one level to anotherlevel so that they come out of poverty.
Meaning of financial inclusionFinancial inclusion is where individuals and businesshave access to useful and affordable financial productsand financial services like credit unions, banks, creditcards, insurance and others. That meets their needsthat are delivered in a responsible and sustainable way.
DefinitionFinancial inclusion is defined as the availability andequality of opportunities to access financial services.C. Rangarajan committee in 2008 defines “financialinclusion as the process of ensuring access to financialservices and timely and adequate credit where neededby vulnerable groups such as weaker sections and lowincome groups at an affordable cost”.RBI defines financial inclusion as “ a process of ensuringaccess to appropriate financial products and servicesneeded by all sections of the society in general and
vulnerable groups such as weaker sections and lowincome groups in particular at an affordable cost in a fairand transparent manner by regulated mainstreaminstitutional players”.
Objectives of Financial inclusion1. the availability of financial services that meet the
specific needs of users without discrimination2. to extend financial services to the low income groups,
unreserved populations of the country to unlock itsgrowth potentials
3. It leads to achieve progressive inclusive growth byproviding financial services to the poor.
4. Financial inclusion intends to help people securefinancial services and products at economical pricessuch as deposits, fund transfer services, loans,insurance, and payment services.
5. Financial inclusion intends to improve financial literacyand financial awareness in the nation.
6. It aims establish proper financial institutions to carterto the needs of the poor people. These institutionsshould have clear cut regulations and should maintainhigh standards that are existents in the financialindustry.
Research Methodology: - the present study isdescriptive in nature. The data used for the study issecondary in nature and been collected from RBIwebsites, national financial services, ministry of financeand others. Report on trend and progress of banking inIndia, various reputed journals.
Financial inclusion in India:- In the Indian contextthe term financial inclusion was used for the first time inApril 2005 in the annual policy statement presented byY. V. Venugopal Reddy the governor of RBI. Later onthis concept gained ground and came to be widely used
Page 7 P.E.S. College of Engineering, Mandya & Primax Foundation, Bengaluru
UGC ID No: 63975 Impact Factor - 5.87“Recent Trends in Business Management”
in India and abroad. After the RBI exhorted the bankswith a view to achieving greater inclusion to makeavailable a basic “No Frills” banking account. Mangalamvillage in puducherry became the first village in India,where all households were provided banking facilities.RBI asked the commercial banks in different regions tostart a 100% financial inclusion campaign on a pilotbasis. As a result of the campaign states or unionterritories such as puducherry, Himachal Pradesh andKerala announced 100% financial inclusion in all theirdistricts. The RBI vision for 2020 is to open nearly 600million new customer accounts.
Factors affecting Access to Financial Services:-1. Psychological and cultural barriers: - most of the
people intentionally excluded themselves due topsychological barriers and they think that they areexcluded from accessing financial services. Till nowin India most of the people they do not know how touse ATM’s, mobile banking, net banking. They preferto go banks directly.
2. Legal identity: - lack of legal identity like voter Id,driving license, Aadhar card and others are veryessential to get banking services and governmentpolicies.
3. Illiteracy: - Illiteracy is the major problem in India toaccess banking services like net banking, mobilebanking, ATM’s. People do not know the importanceof various financial services like insurance, finance,cheque facility, and others. So governments educatethe people towards financial literacy and motivate thepeople to access financial services.
4. Banks situated only in urban areas: - commercialbanks operate services only in urban areas. Theyare not interest to extend their services to rural andtribal areas. Commercial banks works on theprinciples of profit maximization. So the people livingin under developed areas find it very difficult to go forany bank transactions in other areas again and again.
5. Terms & Conditions: - while opening accounts andadvancing loans to customers commercial banks wereplaced more conditions. So poor and illiterate peoplefind it very difficult to access financial services.
RBI Initiatives in Financial Inclusion:-RBI and GOI had taken lot of measures to remove allobstacles and hurdles in the way of financial inclusion.
1. NO – FRILLS ACCOUNT: - RBI in the year 2005,took an initiative and has made it compulsory for thebanks to provide no frills savings accounts without aminimum balance requirement and the transactioncharges should be reasonable along with little over
draft facility should be provided. The initiative of RBIproved to be very effective as the banking systemhas opend 139 millions of no frills accountsamounting to Rs 126 million by march 2012 underthe financial inclusion plan.
2. Opening of Branches in Rural Areas: - Based onRBI guidelines the banks have to open their branchesin Rural areas. make them to open savings accountsin banks. It leads to increase savings habit in ruralpeople and low income people. Banks have beenmandated in the monetary policy statement to targetat least 25% of the total number of branches to beopened during in a year in rural centers.
3. Financial Literacy program: - financial literacyprogram have been initiated by RBI to improvefinancial education and literacy so that people willbecome aware about the basis financial terms andservices provided by banks and financial institutions.
4. Make easy to open savings accounts: - bankshave been requested to put in place system to enablethe customer to fill the account opening forma on anonline mode. The banks have to simplify theprocedure to open accounts for the sake of lowincome people, disadvantaged people, labour, streethawkers and others.
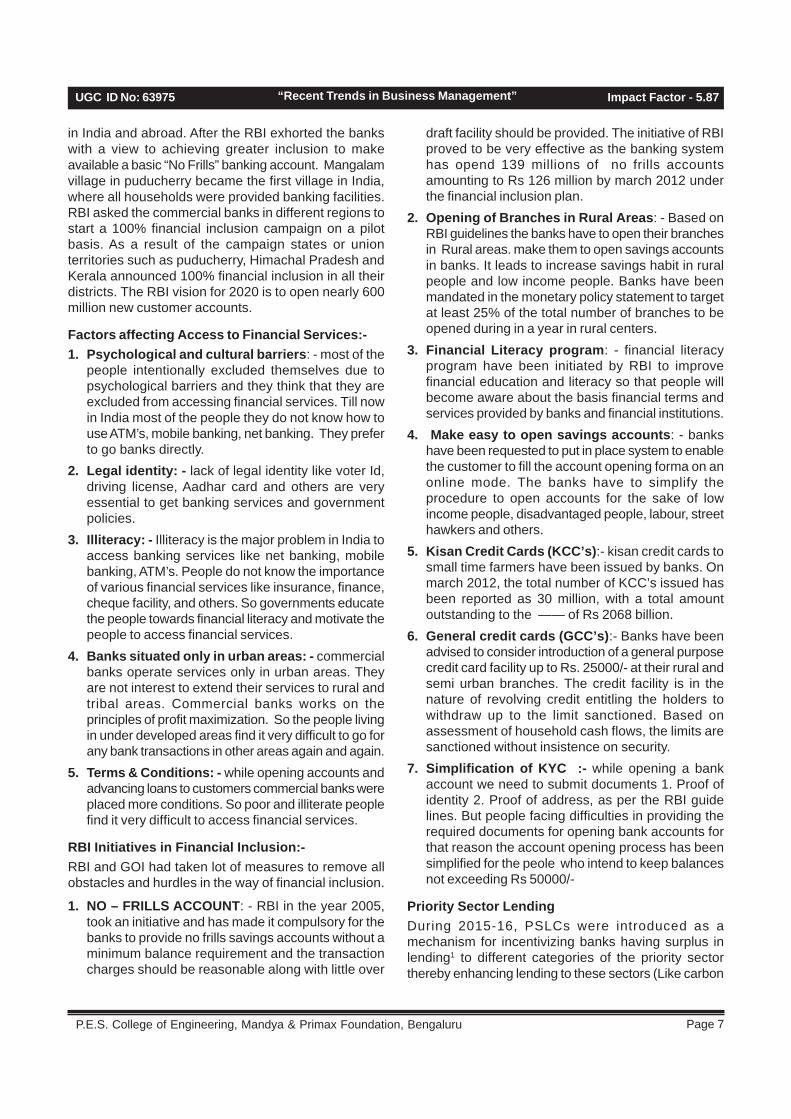
5. Kisan Credit Cards (KCC’s):- kisan credit cards tosmall time farmers have been issued by banks. Onmarch 2012, the total number of KCC’s issued hasbeen reported as 30 million, with a total amountoutstanding to the —— of Rs 2068 billion.
6. General credit cards (GCC’s):- Banks have beenadvised to consider introduction of a general purposecredit card facility up to Rs. 25000/- at their rural andsemi urban branches. The credit facility is in thenature of revolving credit entitling the holders towithdraw up to the limit sanctioned. Based onassessment of household cash flows, the limits aresanctioned without insistence on security.
7. Simplification of KYC :- while opening a bankaccount we need to submit documents 1. Proof ofidentity 2. Proof of address, as per the RBI guidelines. But people facing difficulties in providing therequired documents for opening bank accounts forthat reason the account opening process has beensimplified for the peole who intend to keep balancesnot exceeding Rs 50000/-
Priority Sector LendingDuring 2015-16, PSLCs were introduced as amechanism for incentivizing banks having surplus inlending1 to different categories of the priority sectorthereby enhancing lending to these sectors (Like carbon
ISSN: 2349-5162Journal of Emerging Technologies and Innovative Research
Page 8February 2019Special Issue
credit trading, PSLCs will allow the market mechanismto drive priority sector lending by leveraging thecomparative strengths of different banks. For tradingpurposes, a dedicated portal was launched in April 2016.In view of the critical role played by regional rural banks(RRBs) in driving the financial inclusion agenda, prioritysector lending guidelines were revised for RRBs inDecember 2015 and an overall target of 75 per cent ofthe total outstanding loans to the priority sector was setfor them.
Initiatives for MSME SectorIn August 2015, the banks were advised to review theirexisting lending policies to the micro and small
enterprises (MSEs) sector and fine-tune them by allowingfor standby credit facilities in case of term loans,additional working capital limits, mid-term review of regularworking capital limits and timelines for credit decisions.Subsequent to the notification of a ‘Framework for Revivaland Rehabilitation of Micro, Small and MediumEnterprises’ by the Government to provide a simpler andfaster mechanism for addressing the stress in MSMEaccounts, the Reserve Bank issued related guidelinesalong with operating instructions on March 17, 2016.Under this framework, the revival and rehabilitation ofMSME
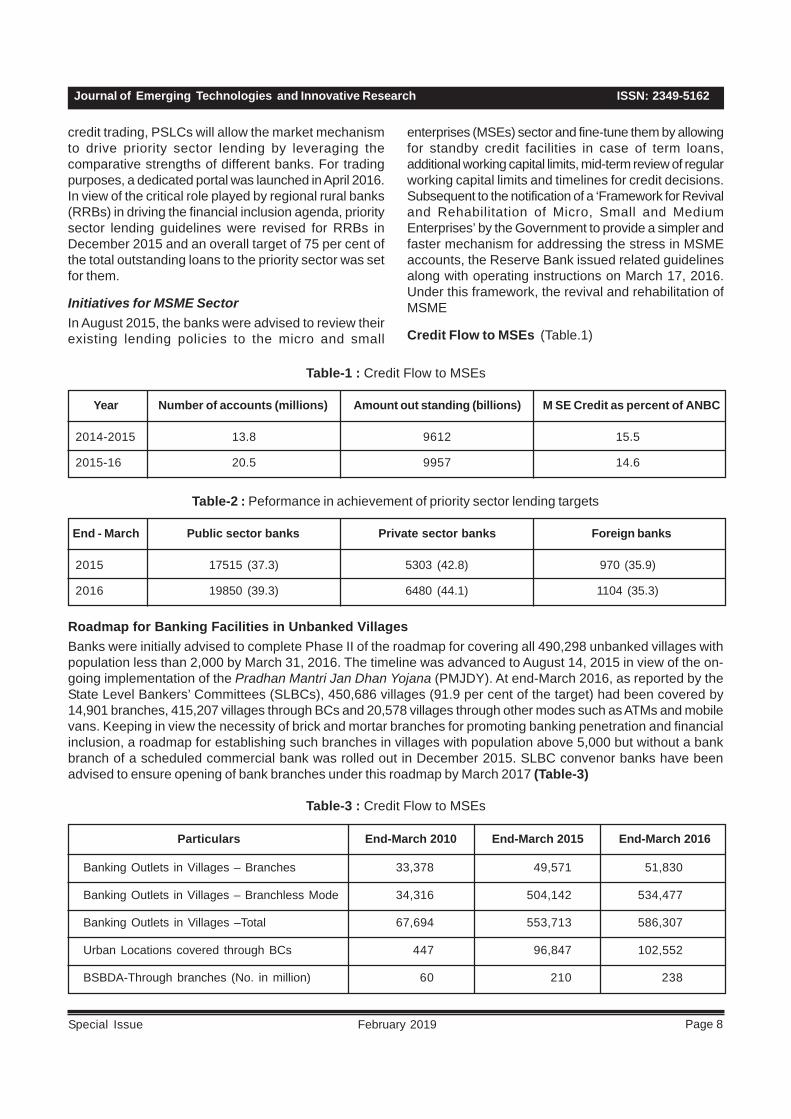
Credit Flow to MSEs (Table.1)
2014-2015 13.8 9612 15.5
2015-16 20.5 9957 14.6
Year Number of accounts (millions) Amount out standing (billions) M SE Credit as percent of ANBC
2015 17515 (37.3) 5303 (42.8) 970 (35.9)
2016 19850 (39.3) 6480 (44.1) 1104 (35.3)
End - March Public sector banks Private sector banks Foreign banks
Table-2 : Peformance in achievement of priority sector lending targets
Table-1 : Credit Flow to MSEs
Roadmap for Banking Facilities in Unbanked VillagesBanks were initially advised to complete Phase II of the roadmap for covering all 490,298 unbanked villages withpopulation less than 2,000 by March 31, 2016. The timeline was advanced to August 14, 2015 in view of the on-going implementation of the Pradhan Mantri Jan Dhan Yojana (PMJDY). At end-March 2016, as reported by theState Level Bankers’ Committees (SLBCs), 450,686 villages (91.9 per cent of the target) had been covered by14,901 branches, 415,207 villages through BCs and 20,578 villages through other modes such as ATMs and mobilevans. Keeping in view the necessity of brick and mortar branches for promoting banking penetration and financialinclusion, a roadmap for establishing such branches in villages with population above 5,000 but without a bankbranch of a scheduled commercial bank was rolled out in December 2015. SLBC convenor banks have beenadvised to ensure opening of bank branches under this roadmap by March 2017 (Table-3)
Table-3 : Credit Flow to MSEs
Banking Outlets in Villages – Branches 33,378 49,571 51,830
Banking Outlets in Villages – Branchless Mode 34,316 504,142 534,477
Banking Outlets in Villages –Total 67,694 553,713 586,307
Urban Locations covered through BCs 447 96,847 102,552
BSBDA-Through branches (No. in million) 60 210 238
Particulars End-March 2010 End-March 2015 End-March 2016
Page 9 P.E.S. College of Engineering, Mandya & Primax Foundation, Bengaluru
UGC ID No: 63975 Impact Factor - 5.87“Recent Trends in Business Management”
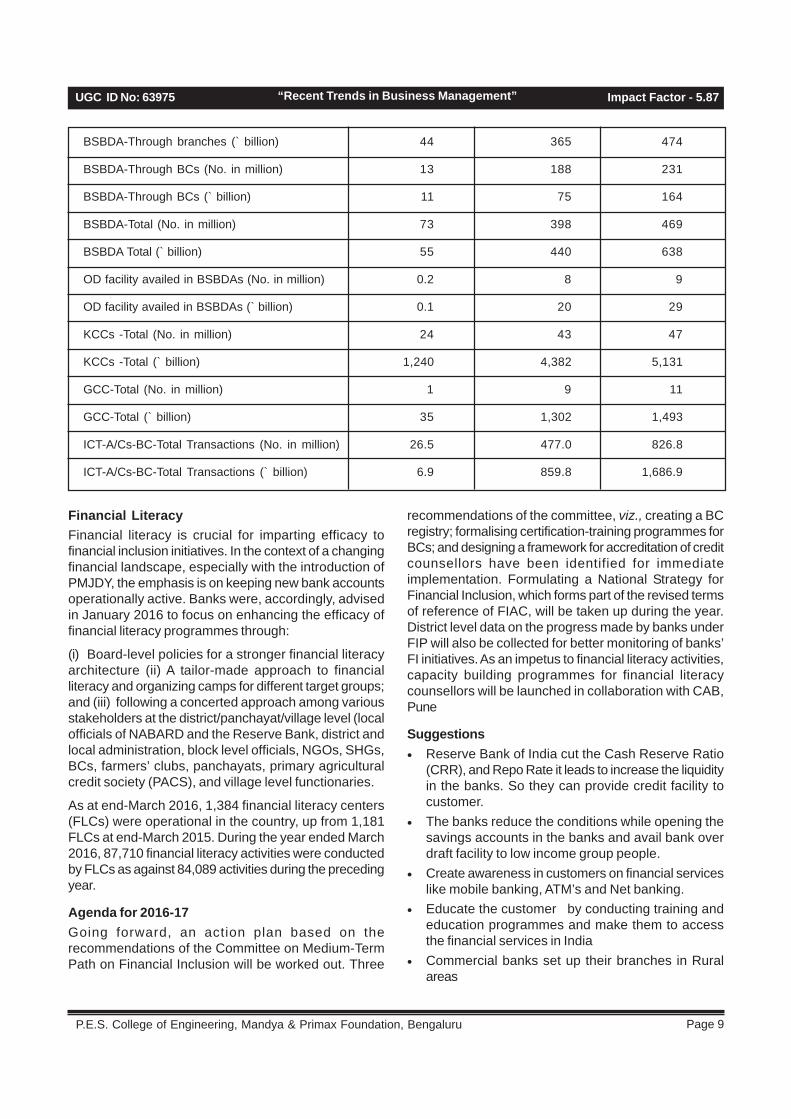
BSBDA-Through branches (` billion) 44 365 474
BSBDA-Through BCs (No. in million) 13 188 231
BSBDA-Through BCs (` billion) 11 75 164
BSBDA-Total (No. in million) 73 398 469
BSBDA Total (` billion) 55 440 638
OD facility availed in BSBDAs (No. in million) 0.2 8 9
OD facility availed in BSBDAs (` billion) 0.1 20 29
KCCs -Total (No. in million) 24 43 47
KCCs -Total (` billion) 1,240 4,382 5,131
GCC-Total (No. in million) 1 9 11
GCC-Total (` billion) 35 1,302 1,493
ICT-A/Cs-BC-Total Transactions (No. in million) 26.5 477.0 826.8
ICT-A/Cs-BC-Total Transactions (` billion) 6.9 859.8 1,686.9
Financial LiteracyFinancial literacy is crucial for imparting efficacy tofinancial inclusion initiatives. In the context of a changingfinancial landscape, especially with the introduction ofPMJDY, the emphasis is on keeping new bank accountsoperationally active. Banks were, accordingly, advisedin January 2016 to focus on enhancing the efficacy offinancial literacy programmes through:
(i) Board-level policies for a stronger financial literacyarchitecture (ii) A tailor-made approach to financialliteracy and organizing camps for different target groups;and (iii) following a concerted approach among variousstakeholders at the district/panchayat/village level (localofficials of NABARD and the Reserve Bank, district andlocal administration, block level officials, NGOs, SHGs,BCs, farmers’ clubs, panchayats, primary agriculturalcredit society (PACS), and village level functionaries.
As at end-March 2016, 1,384 financial literacy centers(FLCs) were operational in the country, up from 1,181FLCs at end-March 2015. During the year ended March2016, 87,710 financial literacy activities were conductedby FLCs as against 84,089 activities during the precedingyear.
Agenda for 2016-17Going forward, an action plan based on therecommendations of the Committee on Medium-TermPath on Financial Inclusion will be worked out. Three
recommendations of the committee, viz., creating a BCregistry; formalising certification-training programmes forBCs; and designing a framework for accreditation of creditcounsellors have been identified for immediateimplementation. Formulating a National Strategy forFinancial Inclusion, which forms part of the revised termsof reference of FIAC, will be taken up during the year.District level data on the progress made by banks underFIP will also be collected for better monitoring of banks’FI initiatives. As an impetus to financial literacy activities,capacity building programmes for financial literacycounsellors will be launched in collaboration with CAB,Pune
Suggestions• Reserve Bank of India cut the Cash Reserve Ratio
(CRR), and Repo Rate it leads to increase the liquidityin the banks. So they can provide credit facility tocustomer.
• The banks reduce the conditions while opening thesavings accounts in the banks and avail bank overdraft facility to low income group people.
• Create awareness in customers on financial serviceslike mobile banking, ATM’s and Net banking.
• Educate the customer by conducting training andeducation programmes and make them to accessthe financial services in India
• Commercial banks set up their branches in Ruralareas

ISSN: 2349-5162Journal of Emerging Technologies and Innovative Research
Page 10February 2019Special Issue
ConclusionTo achieve financial inclusion in India. Reserve bank ofIndia and Government of India work together. Governmenthas to establish one regulatory body to achieve 100%financial inclusion in India. RBI decreases interest Rateson banks it leads to increase liquidity at the banks andthey provide loans to dis-advantaged people. Governmentof India bring new polices to the people. Increase savingshabit among the people. Commercial banks set up theirbranches in rural areas and provide financial access topoor people. Financial access can really boost thefinancial conditions and standards of life of the poorpeople and disadvantaged population of the country. RBIplays essential role in promoting financial inclusion foreconomic growth to increase the installation of newATM’s
References1. Vashisht and wadhwa, financial inclusion social
change, Arabian journal of business and managementReview, symbiosis centre for management studies,Pune, India.
2. Neha dangi and pavan kumar, current situation offinancial inclusion in india and its future visions,international journal of management and socialsciences Research (IJMSSR), ISSN 2319-44241
3. Badar Alamiqbal and Shaista Sami, Role of Banksin Financial inclusion in India, Retrieved fromwww.cya.unam.mx/index.php/cya.
4. RBI annual Report on trend progress of Banking inIndia Various issues
WebsitesV’ www.rbi.org.inV’ Financial services.gov.in
Page 11 P.E.S. College of Engineering, Mandya & Primax Foundation, Bengaluru
UGC ID No: 63975 Impact Factor - 5.87“Recent Trends in Business Management”
CORPORATE SOCIAL RESPONSIBILITY INITIATIVESOF STATE BANK OF INDIA - A CASE STUDY
1. Research Scholar, Andhra University,Andhra.2. Director, Samatha Degree College, Andhra University,Andhra.
AbstractThe present study has been focused on the corporate social responsibility initiatives with reference to state bank ofIndia. Many organizations are playing the vital role by accepting responsibility towards the societal problems. As thegovernment is taking many measures for the inclusive economic growth but due to many socio economic problemslarge sections of the society is lagging behind in taking the economic growth opportunities. The present study hasconsidered the state bank of Indian corporate social responsibility initiatives and examined in two areas, such ascustomer centric and philanthropic centric with help of primary data. The study has considered the simple randommethodology sampling technique and collected the data from 68 beneficiaries. The study applied the statisticalmethod of linear regression and the result stated that banks should open new branches to increase their range. Theconfirmatory factor analysis has given high loading factors that the bank employees should enhance the efficiency,competency, good behaviour and attitude. This paper is useful to the top level management of SBI and otherorganizations stake holders who are having the CSR policies.
Keywords: Attitude, Behaviour, Efficiency, Banking Sector, Corporate Social Responsibility, CSR Initiatives.
K.Kusuma1 Dr. Murali Krishna2
IntroductionCorporate Social Responsibility, known as the TripleBottom Line Framework is largely understood to be thetactic by which a company achieves a balance ofeconomic, environmental and social practices whilemeeting neutral requirements. The increase incompanies implementing CSR practices was reflectedin the increase in socially responsible investments(SRIs). SRI is associate degree investment disciplinethat considers the factors for environmental, social andcorporate governance (ESG) to get competitive long -term financial returns and positive social group impact.SRI is predicated on the premise that banks adopt newESG practices to satisfy potential investors ‘expectations and attract new investment.
CSR within the banking industryUK & US Global Fortune 500 firms spend $ 15.2 billionannually on CSR activities. The banking industry hasfaced increased regulatory pressure and public scrutinyfollowing the global credit crisis. The record level ofregulatory fines and penalties due to bank malpracticehas challenged banks to restore public confidence andestablish clear and transparent business models. As aresult, many leading banks have started to integrateCSR factors over the long term investment strategy. Thishas served as a foundation not only for developing newproducts and new growth opportunities, but has alsoensured better management of risk in the banks’ overallinvestment strategies. For a bank, the integration of ESG
is costly, both in terms of financial investment and inrelation to organisational practices. From a financialperspective, the costs of implementing CSR andsustainability within a bank may include• Capital costs of CSR initiative – value price of the
new equipment, new goods and services etc.• Recurrent cost: Continuous compliance observation
and CSR practices and training.• Communication costs: Disclosure of ethical codes
/ conducts to all parties involved.• Staff costs: Recruitment of skilled workers, creation
of dedicated team etc.Inside their organizational structure, banks will need toadopt new policies and practices from a strategicperspective. This may include retraining, adoption of newrisk management practices and a highly selective portfolioof investors.
Review of Literature:Mahabir Narwal (2007): This paper represents thecorporate social responsibility (CSR) initiatives takenby the banking industry, which enhance their overallperformance. It has noticed CSR improves the banksgoodwill, social image and expanding business whichhas impact on the performance of the banks and givesfruitful outcome for other industries also. The study hasfound that banks are more concentrating on theeducation, balanced growth, health, customersatisfaction and environment as the core CSR activities.
ISSN: 2349-5162Journal of Emerging Technologies and Innovative Research
Page 12February 2019Special Issue
Carolin Juliya Pushpam V, Karthi R, Asha Daisy B(2015): This study mainly focused on the corporatesocial responsibility (CSR) activities which are carriedout by the Indian banks and also to give guidance forthe strategies in the CRS for benefiting from the sameprocess. The study found that many banks are adoptingCSR mainly for the social welfare problems like HIV,training for teachers and man power etc.
Khaled Hossain S.M and Rahat Khan Md (2016): Thispaper is based on the Corporate Social Responsibility(CSR) with a significance of corporate budgetaryexecution. It also include the HSBC global banking whichhas made people aware about the environment, healthand insurance, education and other needs of the society.The study found that CSR activities seek through HSBCbank and its awareness among the employees in bothprivate and public parts around the world.
Deepika Dhingra and Rama Mittal (2014): This articleis focused on the corporate social responsibility (CSR)strategies that will be beneficial different firms orbusinesses in terms of the development. The study foundthat CSR has tremendous increase in control andawareness around the world. It has also concluded thatCSR activities performed by the financial institutions arenot so flourishing in the developing nations.
Objectives of the Study:1. To study the Impact of corporate social responsibility
initiatives on customer engagement in State bank ofIndia.
2. To study the validating measures to improve the CSRinitiatives of the State bank of India.
Hypothesis of the StudyH0: There is no significant group mean difference of thecorporate social responsibility initiatives.H0: There is no impact of corporate social responsibilityinitiatives on customer engagement.
The Sample SizeThe sample data consists of 128 respondents from thebeneficiaries of the corporate social responsibility of theSBI. The questionnaire has been framed keeping view of2 objectives which have focused on CSR initiatives. Thesimple random methodology has been applied to collectthe data.
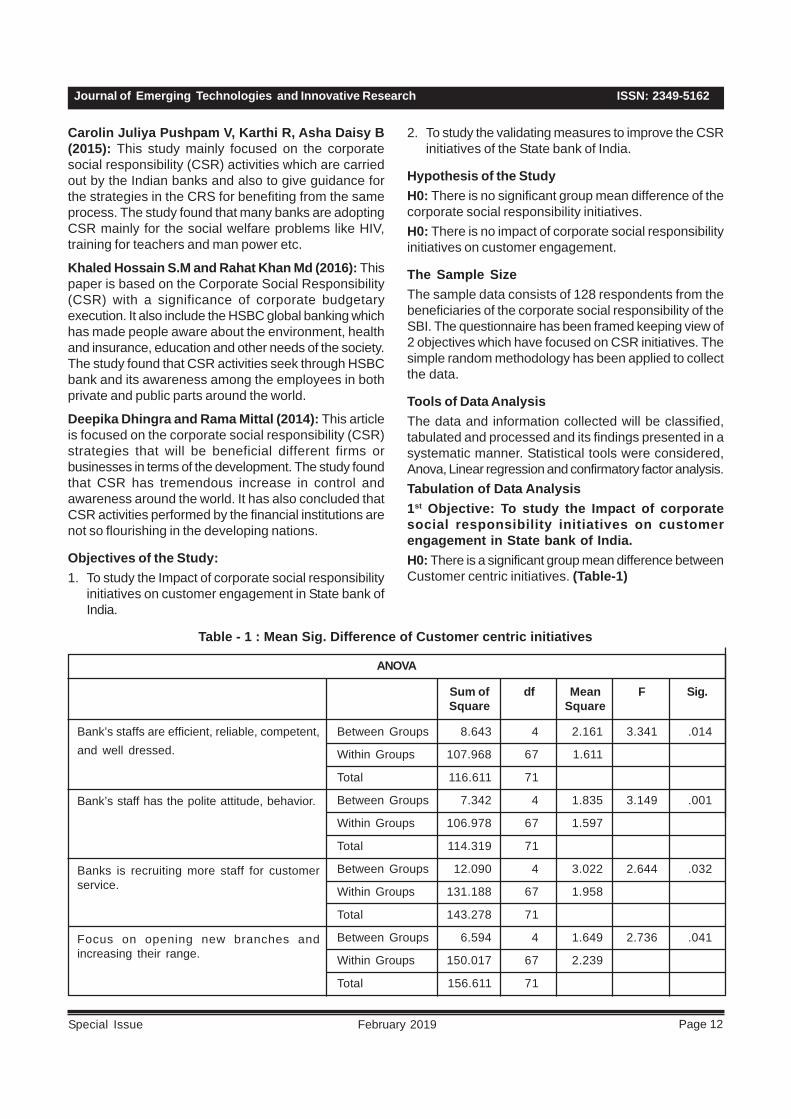
Tools of Data AnalysisThe data and information collected will be classified,tabulated and processed and its findings presented in asystematic manner. Statistical tools were considered,Anova, Linear regression and confirmatory factor analysis.Tabulation of Data Analysis1st Objective: To study the Impact of corporatesocial responsibility initiatives on customerengagement in State bank of India.H0: There is a significant group mean difference betweenCustomer centric initiatives. (Table-1)
Table - 1 : Mean Sig. Difference of Customer centric initiatives
Between Groups 8.643 4 2.161 3.341 .014
Within Groups 107.968 67 1.611
Total 116.611 71
Between Groups 7.342 4 1.835 3.149 .001
Within Groups 106.978 67 1.597
Total 114.319 71
Between Groups 12.090 4 3.022 2.644 .032
Within Groups 131.188 67 1.958
Total 143.278 71
Between Groups 6.594 4 1.649 2.736 .041
Within Groups 150.017 67 2.239
Total 156.611 71
Bank’s staffs are efficient, reliable, competent,and well dressed.
Bank’s staff has the polite attitude, behavior.
Banks is recruiting more staff for customerservice.
Focus on opening new branches andincreasing their range.
ANOVA
Sum ofSquare
df MeanSquare
F Sig.
Page 13 P.E.S. College of Engineering, Mandya & Primax Foundation, Bengaluru
UGC ID No: 63975 Impact Factor - 5.87“Recent Trends in Business Management”
Between Groups 7.472 4 1.868 2.894 .033
Within Groups 140.028 67 2.090
Total 147.500 71
Between Groups 17.333 4 4.333 3.216 .016
Within Groups 130.987 67 1.955
Total 148.319 71
Give customers high returns and charge lowerfees on various transactions.
Introduce new ways of convenient bankingsuch as mobile, internet, and branchlessbanking
Sum ofSquare
df MeanSquare
F Sig.
Result signifies that each customer centric initiatives f-statistic calculated value are observed greater than criticalvalue (2.5252) that means existence of group mean difference among customer centric initiatives. Further, p-valuehad shown significant at 5% level that stands rejection of H0 and Accept H1 i.e., there is a significant meansexistence between customer centric initiatives.
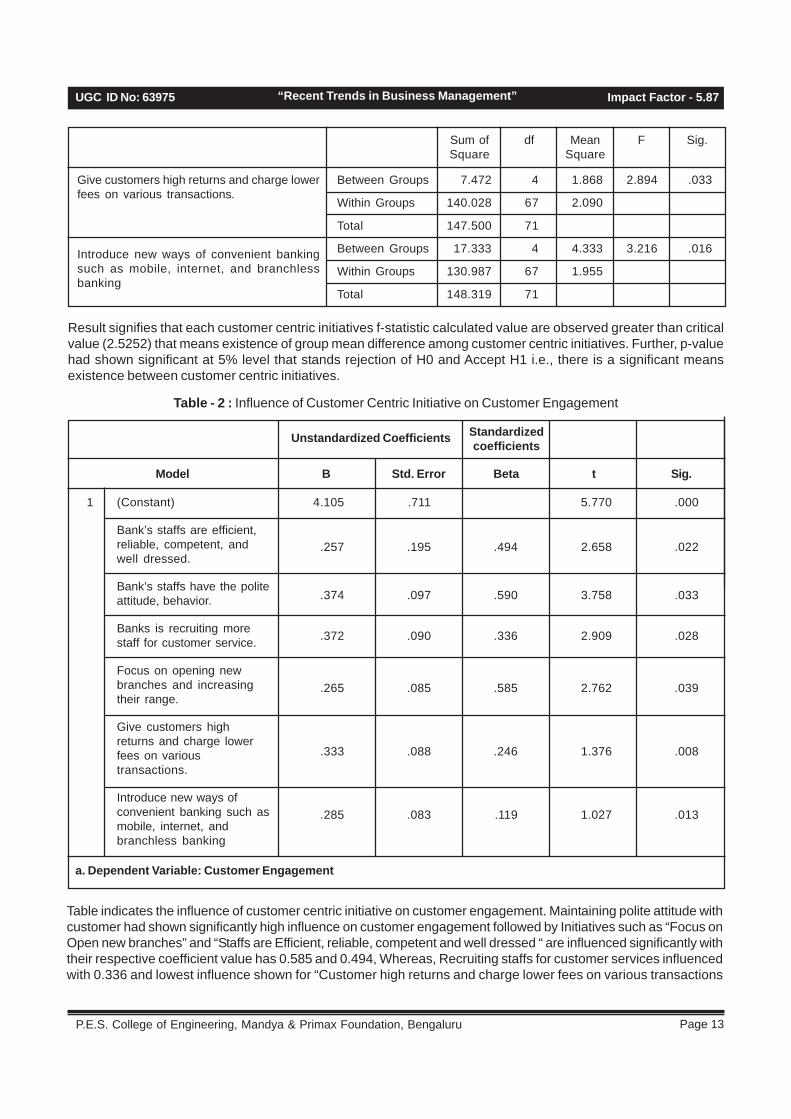
Table - 2 : Influence of Customer Centric Initiative on Customer Engagement
Table indicates the influence of customer centric initiative on customer engagement. Maintaining polite attitude withcustomer had shown significantly high influence on customer engagement followed by Initiatives such as “Focus onOpen new branches” and “Staffs are Efficient, reliable, competent and well dressed “ are influenced significantly withtheir respective coefficient value has 0.585 and 0.494, Whereas, Recruiting staffs for customer services influencedwith 0.336 and lowest influence shown for “Customer high returns and charge lower fees on various transactions
1 (Constant)
Bank’s staffs are efficient,reliable, competent, andwell dressed.
Bank’s staffs have the politeattitude, behavior.
Banks is recruiting morestaff for customer service.
Focus on opening newbranches and increasingtheir range.
Give customers highreturns and charge lowerfees on varioustransactions.
Introduce new ways ofconvenient banking such asmobile, internet, andbranchless banking
4.105 .711 5.770 .000
.257 .195 .494 2.658 .022
.374 .097 .590 3.758 .033
.372 .090 .336 2.909 .028
.265 .085 .585 2.762 .039
.333 .088 .246 1.376 .008
.285 .083 .119 1.027 .013
Unstandardized Coefficients Standardizedcoefficients
a. Dependent Variable: Customer Engagement
B Std. Error Beta t Sig.Model

ISSN: 2349-5162Journal of Emerging Technologies and Innovative Research
Page 14February 2019Special Issue
(0.246)” and “New ways of convenient banking (0.119)”. Thereby, confirming that each initiative of customer centrichad shown significant influence on customer engagement.H0: There is a significant group mean difference between Philanthropic Initiatives.
Table -3 : Mean Sig. Difference of Philanthropic Centric Initiatives
Between Groups 38.067 4 9.517 4.612 .002
Within Groups 138.253 67 2.063
Total 176.319 71
Between Groups 10.109 4 2.527 2.886 .022
Within Groups 122.210 67 1.824
Total 132.319 71
Between Groups 1.882 4 2.470 3.216 .019
Within Groups 145.993 67 2.179
Total 147.875 71
Between Groups 13.768 4 3.442 2.656 .041
Within Groups 139.218 67 2.078
Total 152.986 71
Between Groups 17.590 4 4.397 2.102 .012
Within Groups 140.188 67 2.092
Total 157.778 71
Between Groups 20.342 4 5.085 3.053 .023
Within Groups 111.603 67 1.666
Total 131.944 71
Banks participate in organizing different funds.
Banks raise their funding for art exhibitions.
Banks take measured for delivering of freefinancial planning knowledge to public.
Banks have a separate account for arrangingand donating regularly money to orphanages.
Banks provide underprivileged children inremote areas with school supplies andnutritional meals.
Banks open collection and temporary accountsin case of calamities for collecting anddonating money in disasters
ANOVA
Sum ofSquare
df MeanSquare
F Sig.
Result signifies that each philanthropic initiatives f-statistic calculated value are observed greater than critical value(2.5252) that means existence of group mean difference among Philanthropic initiatives. Further, p-value hadshown significant at 5% level i.e., rejection of H0 and Accept H1 i.e., there is a significant means existencebetween philanthropic initiatives.
Table - 4 : Influence of Philanthropic Initiative on Customer Engagement
1 (Constant)
Banks participate inorganizing different funds.
Banks rise their funding forart exhibitions.
3.585 .646 5.547 .000
.539 .184 .310 1.642 .005
.607 .191 .341 1.177 .034
Unstandardized Coefficients Standardizedcoefficients
B Std. Error Beta t Sig.Model

Page 15 P.E.S. College of Engineering, Mandya & Primax Foundation, Bengaluru
UGC ID No: 63975 Impact Factor - 5.87“Recent Trends in Business Management”
Banks take measured fordelivering of free financialplanning knowledge topublic.
Banks have a separateaccount for arranging anddonating regularly money toorphanages.
Banks provide under-privileged children in remoteareas with school suppliesand nutritional meals.
Banks open collection andtemporary accounts in caseof calamities for collectingand donating money indisasters
337 .088 .251 2.421 .045
.570 .085 .398 2.824 .013
.353 .088 .319 1.737 .017
.462 .087 .382 2.715 .037
Unstandardized Coefficients Standardizedcoefficients
B Std. Error Beta t Sig.Model
a. Dependent Variable: Customer Engagement
Table depicts the influence of philanthropic initiative oncustomer engagement. “Exist of separate account forarranging and donating regularly money to orphanages”shown significantly high influence on customerengagement followed by Initiatives such as “Donatingmoney in disasters” and “Rise fund for art exhibitions “are influenced significantly with their respective coefficientvalue has 0.382 and 0.341.Remaining initiatives areinfluenced accordingly such as “Providing nutritionalmeals under-privileged children in remote areas with0.319 and “Participate in organizing different funds(0.310)” and “Delivering free financial planning knowledgeto public (0.251)” is influence low on customerengagement. Thereby, confirming that each Philanthropicinitiative shown positive influence on customerengagement.
2nd Objective: To study the validating measures toimprove the CSR initiatives of the State bank ofIndia.Confirmatory factors analysis model employed todetermine the high loaded factors derived from corporatesocial responsibility initiatives (i.e., Customer centricinitiatives and Philanthropy initiatives). Initially the modelapplied to check the reliability of the sample (70) andthen fitness of model has been measure with the help ofCMIN, RMSEA,GFI and AGFI that seems to be fit are
recommend level. Finally path diagram had constructedthe link among the variables simultaneously. (Fig. 1 &Table-5)
Table illustrates the initiatives with respective to corporatesociety responsibility. The study considered twoinitiatives namely Customer centric initiative andPhilanthropy initiatives and applied confirmatory factoranalysis to identify the standard loaded factors thatdemonstrate their good corporate citizen ship andprotect the company from outsized risk. Result indicatesthat among 12 factors, 9 factors are highly loaded factorsthat extracted from the CFA.
Customer centric initiativesTable indicates that initiatives related to customer centricare loaded significant except two initiatives are loadedbelow acceptable. In which “Focus on opening newbranches” had shown highly loaded under customercentric initiatives (i.e., with 0.623) followed by “politeattitude and behavior towards customer” (0.543) andEfficient, reliable, competent, and well-dressed of Bankstaffs” (0.519) are the initiatives which rises customerattention towards banks. “Recruiting staff to providecustomer staff” is loaded with 0.513. There by confirmingthat these four initiatives under the head of customercentric will engage the customer.

ISSN: 2349-5162Journal of Emerging Technologies and Innovative Research
Page 16February 2019Special Issue
Fig.1 : Standardized loaded factors with respect to Corporate Social Responsibility Initiatives
Source: Compiled on primary data through the Amos version 24
This model employed good fit with the observed data as mentioned above. Hypothesized path seems to be significantat 5 % level (p-value <0.05) and reveals the standardized factor loaded as below table.
Table - 5 : Result of Standardized loaded factors
Customer centric initiatives
Bank’s staff is efficient, reliable, competent, and well dressed. 0.519
Bank’s staff has the polite attitude, behavior. 0.543
Banks is recruiting more staff for customer service. 0.513
Focus on opening new branches and increasing their range. 0.624
Give customers high returns and charge lower fees on various transactions. 0.421
Factors Standardized Factorloading
Page 17 P.E.S. College of Engineering, Mandya & Primax Foundation, Bengaluru
UGC ID No: 63975 Impact Factor - 5.87“Recent Trends in Business Management”
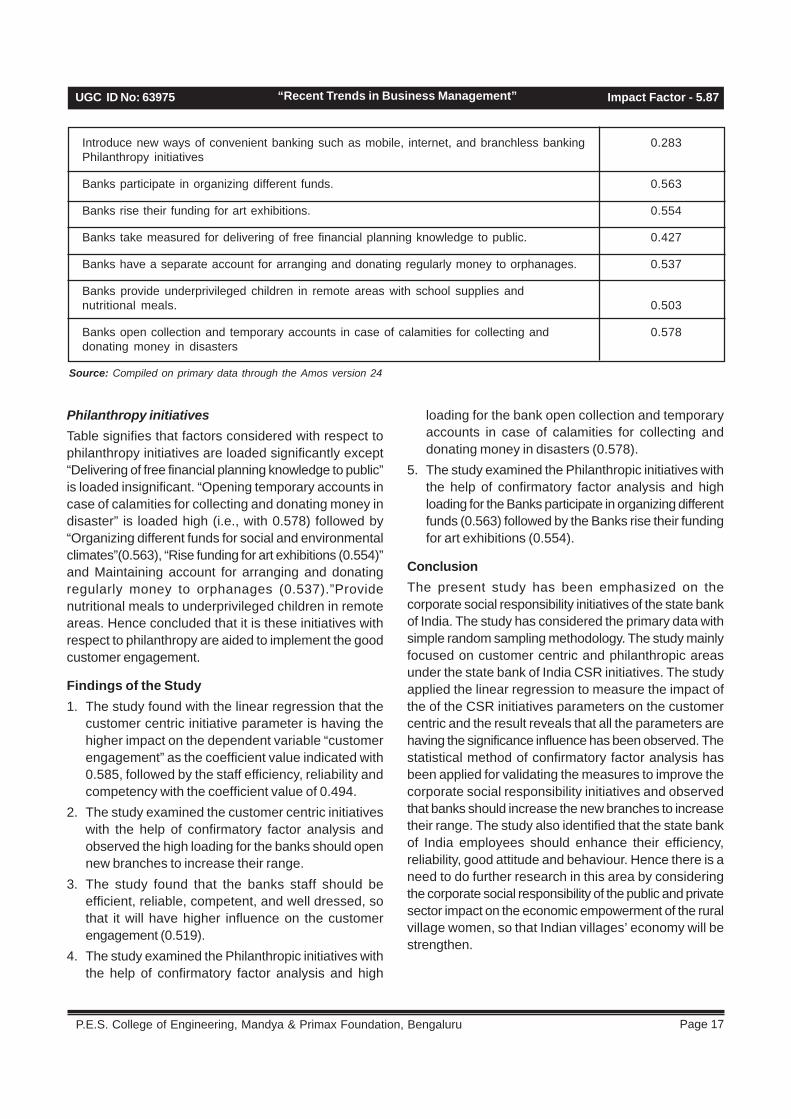
Philanthropy initiativesTable signifies that factors considered with respect tophilanthropy initiatives are loaded significantly except“Delivering of free financial planning knowledge to public”is loaded insignificant. “Opening temporary accounts incase of calamities for collecting and donating money indisaster” is loaded high (i.e., with 0.578) followed by“Organizing different funds for social and environmentalclimates”(0.563), “Rise funding for art exhibitions (0.554)”and Maintaining account for arranging and donatingregularly money to orphanages (0.537).”Providenutritional meals to underprivileged children in remoteareas. Hence concluded that it is these initiatives withrespect to philanthropy are aided to implement the goodcustomer engagement.
Findings of the Study1. The study found with the linear regression that the
customer centric initiative parameter is having thehigher impact on the dependent variable “customerengagement” as the coefficient value indicated with0.585, followed by the staff efficiency, reliability andcompetency with the coefficient value of 0.494.
2. The study examined the customer centric initiativeswith the help of confirmatory factor analysis andobserved the high loading for the banks should opennew branches to increase their range.
3. The study found that the banks staff should beefficient, reliable, competent, and well dressed, sothat it will have higher influence on the customerengagement (0.519).
4. The study examined the Philanthropic initiatives withthe help of confirmatory factor analysis and high
loading for the bank open collection and temporaryaccounts in case of calamities for collecting anddonating money in disasters (0.578).
5. The study examined the Philanthropic initiatives withthe help of confirmatory factor analysis and highloading for the Banks participate in organizing differentfunds (0.563) followed by the Banks rise their fundingfor art exhibitions (0.554).
ConclusionThe present study has been emphasized on thecorporate social responsibility initiatives of the state bankof India. The study has considered the primary data withsimple random sampling methodology. The study mainlyfocused on customer centric and philanthropic areasunder the state bank of India CSR initiatives. The studyapplied the linear regression to measure the impact ofthe of the CSR initiatives parameters on the customercentric and the result reveals that all the parameters arehaving the significance influence has been observed. Thestatistical method of confirmatory factor analysis hasbeen applied for validating the measures to improve thecorporate social responsibility initiatives and observedthat banks should increase the new branches to increasetheir range. The study also identified that the state bankof India employees should enhance their efficiency,reliability, good attitude and behaviour. Hence there is aneed to do further research in this area by consideringthe corporate social responsibility of the public and privatesector impact on the economic empowerment of the ruralvillage women, so that Indian villages’ economy will bestrengthen.
Introduce new ways of convenient banking such as mobile, internet, and branchless banking 0.283Philanthropy initiatives
Banks participate in organizing different funds. 0.563
Banks rise their funding for art exhibitions. 0.554
Banks take measured for delivering of free financial planning knowledge to public. 0.427
Banks have a separate account for arranging and donating regularly money to orphanages. 0.537
Banks provide underprivileged children in remote areas with school supplies andnutritional meals. 0.503
Banks open collection and temporary accounts in case of calamities for collecting and 0.578donating money in disasters
Source: Compiled on primary data through the Amos version 24

ISSN: 2349-5162Journal of Emerging Technologies and Innovative Research
Page 18February 2019Special Issue
References:1. Mahabir Narwal (2007), CSR Initiatives of Indian
Banking Industry, Social Responsibility JournalVolume 3 Issue 4 Page 49-60
2. Carolin JuliyaPushpam. V, Karthi .R, Asha DaisyB (2015), Corporate Social Responsibility of banksin India, International Journal of Scientific andResearch Publications, Volume 5, Issue 4
3. Khaled Hossain S.M, Md. Rahat Khan (2016),Corporate Social Responsibility (CSR) in bankingsector: An empirical study on the Hong Kong andShanghai banking corporation (HSBC) limited, IQSRJournal of Business and Management Volume 18Issue 4 Page 53-61
4. Deepika Dhingra and Rama Mittal (2014), CSRPractices in Indian Banking Sector, Global Journalof Financial and Management, Volume 6 Issue 9 Page853-862

Page 19 P.E.S. College of Engineering, Mandya & Primax Foundation, Bengaluru
UGC ID No: 63975 Impact Factor - 5.87“Recent Trends in Business Management”
ARTIFICIAL INTELLIGENCE – A BOON ORBANE TO THE BUSINESS HOUSES
1. Assistant Professors, Department of Management Studies, B G S Institute of Technology, B G Nagar, Mandya.2. Assistant Professors, Department of Management Studies, B G S Institute of Technology, B G Nagar, Mandya.
AbstractArtificial intelligence (AI) is a branch of computer science which is focussed towards designing of intelligent machinesthat can work and react like human beings. It is related to designing of intelligent robotic agents which can analyse theenvironment and react in prescribed manner in order to achieve the specified objectives like human beings. Some oftheir activities include recognition of speech, learning, planning and problem solving. Every business needs toupgrade itself with the changing technology. An obsolete technology used in a business house can act as a majorreason behind failure of their activities. Nokia Company is the best quotable example here. The main focus of thispaper is to study how AI can become a boon or bane to the business houses. All over the world AI has started seedingits importance in the business processes. AI is being used in the areas of financial analysis, customer service, marketresearch, trend prediction, security, planning and like. Although the AI is not completely developed still and it needs torealise its full potential yet it has started showing a reasonable impact on the business houses. The business housesare expecting improved new products and services, achieve cost efficiencies and many such ways of adapting AI intheir business. Meanwhile the firms are also afraid of the challenges ahead such as lack of skills, difficulties inintegration of business process, changes in the organization design and acceptability by users and so on.
Keywords: Artificial intelligence, Boon or bane to business.
Shashwathi B. S1
IntroductionTechnology has revolutionized the ways by which thebusinesses operate today. It is of no doubt thattechnology is the one such base which is forming thefuture of the world. Artificial Intelligence is one such toolof technology which is acting as major effecting tool ontoday’s business houses. Artificial Intelligence is a partof computer science whose main goal is to create smartmachines which can learn on their own and have capacityto think like the human beings. AI based devices orapplications are capable of carrying out specific activitiesin human ways by functions like learning, reasoning,problem solving, perception and language understanding.AI refers to the copy of human like intelligence can helpin learning, planning, reasoning or processing of naturallanguages. It is also help in speech recognition andproblem solving in business field. Artificial intelligenceis value based on business outcomes such as thecustomer experiences, cost reduction and revenuegeneration. AI has a technological capability which canenable new opportunities and help achieve organisationalgoals. Artificial intelligence has gained attention in recentyears. In that we can see the innovation in thetechnology’s potential socio-economic and ethicalimpacts. Governments are trying to analyse what thistechnology could mean for their citizens. AI is alreadyvisible in healthcare diagnostics, targeted treatment,transportation, public safety, service robots, education,
and entertainment but will be applied for more fields incoming years.
Objectives of the studyThe following are the objectives of the study,1. To study the applications and impact of artificial
intelligence in the business.2. To study the advantages and limitations of artificial
intelligence to the business houses.
Review of literature1. Jana Kochler - “Business process innovation with
artificial intelligence” (2018): European businessmanagement: This article mainly focuses on thecommon business process design. Here the Artificialintelligence is a powerful technology and it is suitedto provide innovation in no business process re-engineering. They are focuses on the three key AItechnologies-Machine learning, decision theory andsearch algorithm. They are introducing a blue printfor the operational risk in the technology mixes basedon a forecasting in business.
2. David he, Micheal guo, Jerry Zhou (2018) - “Theimpact of AI on the financial job market” - The bestconsulting group china development researchfoundation: In this report refers to the prospects ofAI application by examining the status queue and
Beena P2
ISSN: 2349-5162Journal of Emerging Technologies and Innovative Research
Page 20February 2019Special Issue
Artificial Intelligence it is one of boom in the society.Now AI in Banking sector like Insurance, Capitalmarket etc.. In this article discussing the changesin employment demand and talent Requirement inthe Artificial Intelligence era.
3. “AI for markets 2018; Finding value beyond the hyperemarketer, INC”: In this article refers to the Marketsize, Revenue and spending on hardware, softwareand service predict very healthy growth over the nextgeneration. Also concentrated on Interested in thetechnology, the bulk of investment continues to comefrom the largest tech enterprises. AI influenced oncustomer experience management, Brand Buildingand Lead generation and customer expectations andacquisition.
4. Erik Brynjolfsson and Andrew McAfee - “TheBusiness of AI Harvard Business reviews” (2017): Inthis article based on Improving the performance ByMachine learning, big data, and Investment of things.Also Demand will be increased by machine learningand also Impact of change is hard to predict.
5. Nick Easan - “Building machines to be more likeus-Independent publication” (2017) by: In the paperinvolved to emotionally sensitivity, believablynaturalistic and humanly imperfect and also it isconcentrated on customer service based on artificialintelligence. Artificial intelligence based on customerexperience and they going to understand the humanneeds based on this need they going to generatethe Artificial intelligence.
6. Cüneyt Dirican - “The Impacts of Robotics, ArtificialIntelligence on Business and Economics-Procardia- Social and Behavioural Sciences” (2015): In thispaper refers to the new technologies, Mobiles andInternet. In other hand financial crises and economicsdevelopments, supported with the changing needsand behaviour of customers are concentrated on worldeconomies on countries and its budget defect.
7. Burgard, W - “A Probabilistic Framework for LearningKinematic Models of Articulated Objects” (2011) :The contribution of this paper is a approach that robotto learn kinematic models of articulated. control themotion of the manipulator and also its shows howthe robot can improve the model of learning byexploiting the expearince. In this robots can measureforce of learn some additional friction and also thismodel is concept of learning model about robot.
8. Kowalski, R - “Artificial Intelligence and HumanThinking. Proceedings of the Twenty-SecondInternational Joint Conference on ArtificialIntelligence” (2011) : In this literature they focus onthe abductive logic programming form of caputationallogic. They concentrated on ALP Model and also
include the production system in agent system. InALP model they focus on normative and discriptiveproperties.Building upon many different developmentsin Artificial Intelligence can be used by ordinarypeople to improve their own human intelligence.
Applications of Artificial Intelligence in business:AI is becoming vital to any business as it can solvevarious business conflicts through its applications. Theapplications of AI in the business houses can be studiedthrough the following points,• Reasoning: Reasoning refers to the ability to solve
problems backed up with a particular logic. Inbusiness AI is used in reasoning areas such asmanagement of financial assets, legal assessment,processing of financial data, development ofautomatic systems and like such.
• Knowledge: Here the knowledge refers to abilityto present knowledge about the world. AI is appliedin the fields of trading at financial markets, predictionof consumer purchase decisions, prevention of fraud,creation of drugs and medicines, medical diagnosis,recommendation of media for promotion and so on.
• Planning: Planning is setting up of path to achievethe desired goals. AI is used in planning activities ofa business house like inventory management,forecasting of demand, scheduling of operations,logistics planning and many other.
• Communication: Communication here refers toability to understand the spoken and writtenlanguages. AI is used to real time translation ofmessages, real time transcriptions, intelligentassistants, voice control and so on.
• Perception: Perception is the ability to drawinferences on things happening with the help ofsensory inputs. In business AI is used in the areasof medical diagnosis, automatic vehicles andsurveillance.
The widely used applications of Artificial Intelligence inbusiness houses are as follows,• Improving the customer services by usage of
virtual assistants programs to provide the real timesupport to the users.
• Automation of work load through the collectionand analysis of data from smart sensors anddeveloping the applications to automate the work.
• Optimisation of logistics l ike planning ofwarehouse infrastructure and planning of roué forlogistics.
• Increasing the efficiency of manufacturing bythe way of automating production lines andcombining intelligent robots.

Page 21 P.E.S. College of Engineering, Mandya & Primax Foundation, Bengaluru
UGC ID No: 63975 Impact Factor - 5.87“Recent Trends in Business Management”
• Prevention of outages by the way of identifyingvariations before and developing preventive solutions.
• Prediction of performance of workforce at variouslevels.
• Data analysis and management is facilitatedthrough application of AI by easy and less timeconsuming applications.
• Improvising marketing and advertising throughbetter understanding of consumer behaviour andmore précised target marketing from use of AIsources.
Trends of Artificial Intelligence in various sectorsi. Health Care: AI is being used to generate large
amounts of data to train and enable algorithms tospot health patterns much better and faster than ahuman analyst.
ii. Entertainment: AI is used in online entertainmentplatforms such as Netflix and Amazon Prime to knowand analyse the user behaviour to determine therecommendations.
iii. Finance: AI has laid a significance impact in thefinance sector by usage of algorithms to conducttrading, development of robo-advisors to decisionmaking and portfolio management and prevention offrauds.
iv. Data security: AI has strengthened the data securityof business houses by developing automatedapplications to detect and combat viruses andmalware.
v. Manufacturing: AI has made the manufacturingsector more efficient by development of factoryrobots, predicting market demand, findingmicroscopic defects and predicting malfunctions andbreakdown of the equipments.
vi. Automotive Industry: AI being intensively used inautomotive industry has laid various innovations likeself driven cars, intelligent virtual assistants, smartco-pilot systems and vehicle to vehicle communications.
Artificial Intelligence being a boon to the businesshousesThe following are the ways by which artificial intelligenceis acting as a boon to the business houses,1. AI saves money and time by automation of routine
processes and tasks.2. It increases the productivity and efficiency in the
organization.3. It facilitates decision making by making decisions
based on outputs from cognitive technologies.4. AI avoids human errors as smart systems are set
up intelligently.
5. AI provides better customer experiences bypredicting customer preferences based on insightsgenerated.
6. AI mines large amount of data which can be used togenerate quality leads and boosts the growth of thebusiness.
7. AI helps to maximise identification and generationof the sales thus increasing the revenue.
8. AI grows expertise to the business by enablingintelligent advices and support.
Artificial Intelligence being a bane to the businesshousesThe following are the ways by which artificial intelligenceis acting as a bane to the business houses,1. The major limitation of AI is its cost. The creation of
smart technologies can be expensive and themaintenance cost for the devices always adds up.
2. There is a risk of data being lost if not taken careproperly.
3. AI can bear adverse effects on human resource ofthe organizations as they can lose their job whenwork gets replaced by robots.
4. AI can reduce the human touch in the activities ofthe business houses.
5. The implementation of AI technologies in thebusiness takes a longer time.
6. It is difficult to integrate the traditional processeswith the new AI technologies.
7. AI can be difficult to operate with other existingsystems.
8. By usage of AI customer privacy is always at a risk.9. AI can be potential of lack of transparency in the
operations.10. There is a risk of hacking of IT infrastructure.
ConclusionEach and every technology adapted in business isdefinitely going to provide various benefits but also bringstheir own limitations. The business houses also cannotignore the changing technologies as there is a need toadapt them to the changing world. Thus it is necessaryto imply the modern technologies and enjoy their benefitsalong with the best attempt of minimising the limitations.Artificial Intelligence being an emerging technology inthe business area has its own advantages andlimitations. AI also makes business operations easier,saves times, and promotes efficiency and growth. Butthe limitations such as cost, data risks, loss of jobs,hacking and others are questionable. Thus it ischallenging for business houses to adopt AI technologyefficiently along with the constituent limitations.
ISSN: 2349-5162Journal of Emerging Technologies and Innovative Research
Page 22February 2019Special Issue
Bibliography1. Kochler, J. (n.d.). Business process innovation with
artificial intelligence: Levering benefits and controllingoperational risks. European business andmanagement (2018)
2. David He, M. G. (n.d.). The impact of AI on thefinancial job market. The Boston consulting groupchina development research foundation (2018)
3. Erick Brynjolfsson and Andrew McAfee, theBusiness of AI Harvard Business reviews (2017)
4. Nick Easan- Building machines to be more like us-Independent publication (2017)
5. Dirican*, C. (n.d.). The Impacts of Robotics, ArtificialIntelligence. Procedia - Social and BehavioralSciences 195 (2015) 564 – 573.
6. Burgard, W. (n.d.). A Probabilistic Framework forLearning Kinematic Models of Articulated Objects.Journal of Artiûcial Intelligence Research 41 (2011)477–526.
7. Kowalski, R. (n.d.). Artificial Intelligence and HumanThinking. Proceedings of the Twenty-SecondInternational Joint Conference on ArtificialIntelligence. (2011)
8. Rapaport, S. L. (n.d.). Recent and Current ArtificialIntelligence Research in the Department of ComputerScience, State University of New York, New York74260
9. (2018, January 26). Retrieved from New Gen AppsWebsite: https://www.newgenapps.com/blog/ai-uses-applications-of-artificial-intelligence-ml-business
10. Grunwitz, K. (2018, June 29). Retrieved fromCompare the cloud network: https://www.comparethecloud.net/articles/impact-of-ai-workplace/
11. Ikomi, O. (n.d.). Retrieved from Creative PersonnelWebsite: https://www.creativepersonnel.co.uk/blog/2017/06/artificial-intelligence-is-it-a-positive-or-negative-for-business
12. Lath, A. (2018, March 22). www.bbntimes.com.Retrieved from BBN Times: https://www.bbntimes.com/en/companies/impact-of-technology-on-business-environment
13. Philips, A. (2018, June 26). www.becominghuman.ai.Retrieved from www.becominghuman.ai: https://becominghuman.ai/5-roles-of-artificial-intelligence-in-business-9102f56853df
14. www.nibusinessinfo.co.uk. (n.d.). Retrieved fromnibusinessinfo.co.uk: www.nibusinessinfo.co.uk/content/risks-and-limitations-artificial-intelligence-business.
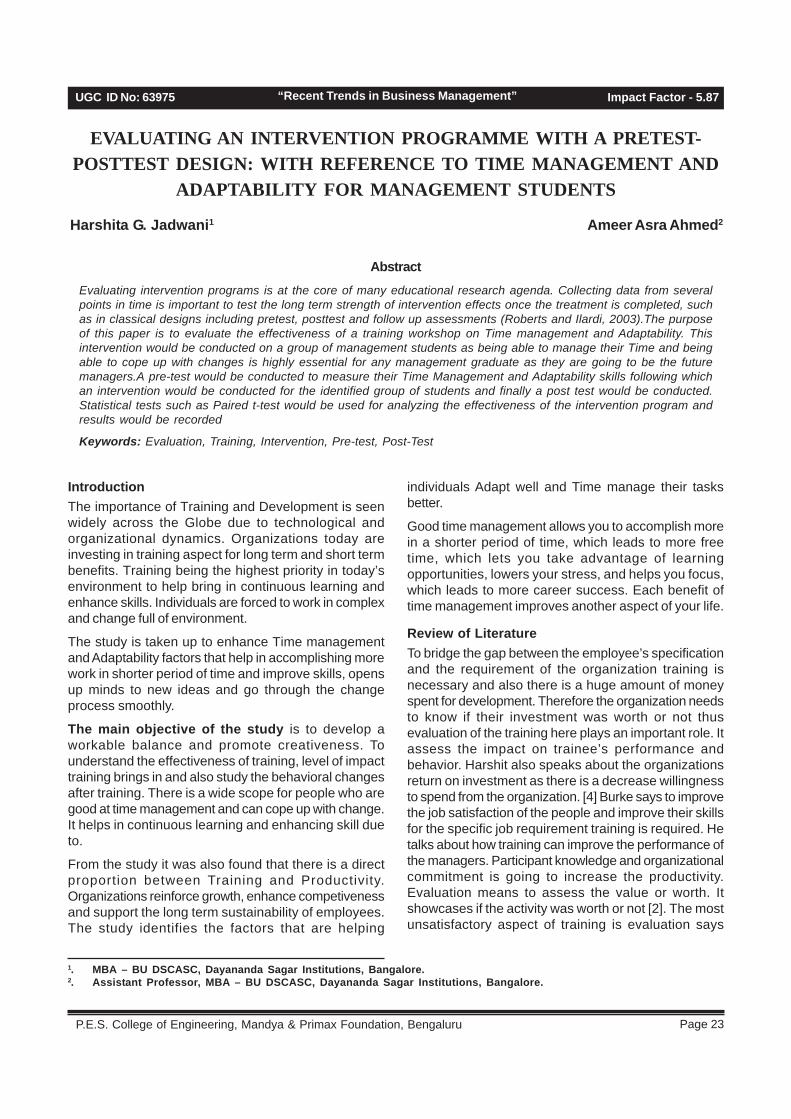
Page 23 P.E.S. College of Engineering, Mandya & Primax Foundation, Bengaluru
UGC ID No: 63975 Impact Factor - 5.87“Recent Trends in Business Management”
EVALUATING AN INTERVENTION PROGRAMME WITH A PRETEST-POSTTEST DESIGN: WITH REFERENCE TO TIME MANAGEMENT AND
ADAPTABILITY FOR MANAGEMENT STUDENTS
1. MBA – BU DSCASC, Dayananda Sagar Institutions, Bangalore.2. Assistant Professor, MBA – BU DSCASC, Dayananda Sagar Institutions, Bangalore.
AbstractEvaluating intervention programs is at the core of many educational research agenda. Collecting data from severalpoints in time is important to test the long term strength of intervention effects once the treatment is completed, suchas in classical designs including pretest, posttest and follow up assessments (Roberts and Ilardi, 2003).The purposeof this paper is to evaluate the effectiveness of a training workshop on Time management and Adaptability. Thisintervention would be conducted on a group of management students as being able to manage their Time and beingable to cope up with changes is highly essential for any management graduate as they are going to be the futuremanagers.A pre-test would be conducted to measure their Time Management and Adaptability skills following whichan intervention would be conducted for the identified group of students and finally a post test would be conducted.Statistical tests such as Paired t-test would be used for analyzing the effectiveness of the intervention program andresults would be recorded
Keywords: Evaluation, Training, Intervention, Pre-test, Post-Test
Harshita G. Jadwani1
IntroductionThe importance of Training and Development is seenwidely across the Globe due to technological andorganizational dynamics. Organizations today areinvesting in training aspect for long term and short termbenefits. Training being the highest priority in today’senvironment to help bring in continuous learning andenhance skills. Individuals are forced to work in complexand change full of environment.
The study is taken up to enhance Time managementand Adaptability factors that help in accomplishing morework in shorter period of time and improve skills, opensup minds to new ideas and go through the changeprocess smoothly.
The main objective of the study is to develop aworkable balance and promote creativeness. Tounderstand the effectiveness of training, level of impacttraining brings in and also study the behavioral changesafter training. There is a wide scope for people who aregood at time management and can cope up with change.It helps in continuous learning and enhancing skill dueto.
From the study it was also found that there is a directproportion between Training and Productivity.Organizations reinforce growth, enhance competivenessand support the long term sustainability of employees.The study identifies the factors that are helping
individuals Adapt well and Time manage their tasksbetter.
Good time management allows you to accomplish morein a shorter period of time, which leads to more freetime, which lets you take advantage of learningopportunities, lowers your stress, and helps you focus,which leads to more career success. Each benefit oftime management improves another aspect of your life.
Review of LiteratureTo bridge the gap between the employee’s specificationand the requirement of the organization training isnecessary and also there is a huge amount of moneyspent for development. Therefore the organization needsto know if their investment was worth or not thusevaluation of the training here plays an important role. Itassess the impact on trainee’s performance andbehavior. Harshit also speaks about the organizationsreturn on investment as there is a decrease willingnessto spend from the organization. [4] Burke says to improvethe job satisfaction of the people and improve their skillsfor the specific job requirement training is required. Hetalks about how training can improve the performance ofthe managers. Participant knowledge and organizationalcommitment is going to increase the productivity.Evaluation means to assess the value or worth. Itshowcases if the activity was worth or not [2]. The mostunsatisfactory aspect of training is evaluation says
Ameer Asra Ahmed2
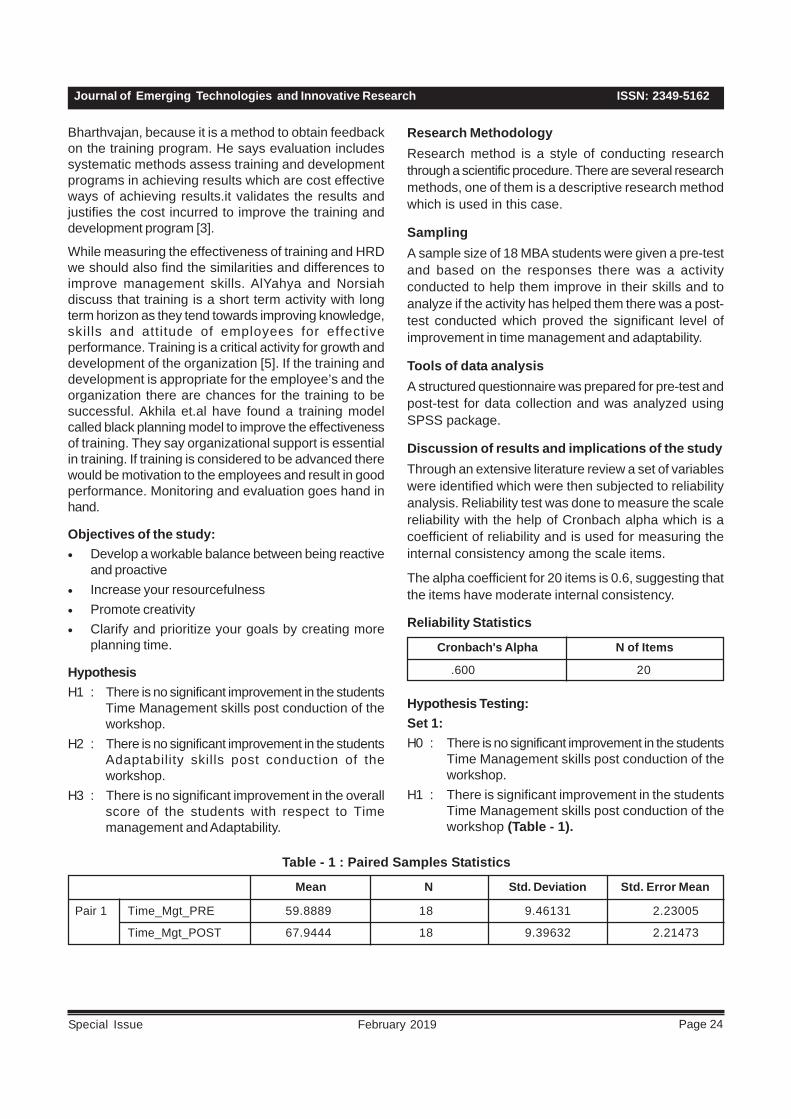
ISSN: 2349-5162Journal of Emerging Technologies and Innovative Research
Page 24February 2019Special Issue
Bharthvajan, because it is a method to obtain feedbackon the training program. He says evaluation includessystematic methods assess training and developmentprograms in achieving results which are cost effectiveways of achieving results.it validates the results andjustifies the cost incurred to improve the training anddevelopment program [3].
While measuring the effectiveness of training and HRDwe should also find the similarities and differences toimprove management skills. AlYahya and Norsiahdiscuss that training is a short term activity with longterm horizon as they tend towards improving knowledge,skills and attitude of employees for effectiveperformance. Training is a critical activity for growth anddevelopment of the organization [5]. If the training anddevelopment is appropriate for the employee’s and theorganization there are chances for the training to besuccessful. Akhila et.al have found a training modelcalled black planning model to improve the effectivenessof training. They say organizational support is essentialin training. If training is considered to be advanced therewould be motivation to the employees and result in goodperformance. Monitoring and evaluation goes hand inhand.
Objectives of the study:• Develop a workable balance between being reactive
and proactive• Increase your resourcefulness• Promote creativity• Clarify and prioritize your goals by creating more
planning time.
HypothesisH1 : There is no significant improvement in the students
Time Management skills post conduction of theworkshop.
H2 : There is no significant improvement in the studentsAdaptability skills post conduction of theworkshop.
H3 : There is no significant improvement in the overallscore of the students with respect to Timemanagement and Adaptability.
Research MethodologyResearch method is a style of conducting researchthrough a scientific procedure. There are several researchmethods, one of them is a descriptive research methodwhich is used in this case.
SamplingA sample size of 18 MBA students were given a pre-testand based on the responses there was a activityconducted to help them improve in their skills and toanalyze if the activity has helped them there was a post-test conducted which proved the significant level ofimprovement in time management and adaptability.
Tools of data analysisA structured questionnaire was prepared for pre-test andpost-test for data collection and was analyzed usingSPSS package.
Discussion of results and implications of the studyThrough an extensive literature review a set of variableswere identified which were then subjected to reliabilityanalysis. Reliability test was done to measure the scalereliability with the help of Cronbach alpha which is acoefficient of reliability and is used for measuring theinternal consistency among the scale items.
The alpha coefficient for 20 items is 0.6, suggesting thatthe items have moderate internal consistency.
Reliability Statistics
.600 20
Cronbach's Alpha N of Items
Hypothesis Testing:Set 1:H0 : There is no significant improvement in the students
Time Management skills post conduction of theworkshop.
H1 : There is significant improvement in the studentsTime Management skills post conduction of theworkshop (Table - 1).
Table - 1 : Paired Samples Statistics
Pair 1 Time_Mgt_PRE 59.8889 18 9.46131 2.23005
Time_Mgt_POST 67.9444 18 9.39632 2.21473
Mean N Std. Deviation Std. Error Mean
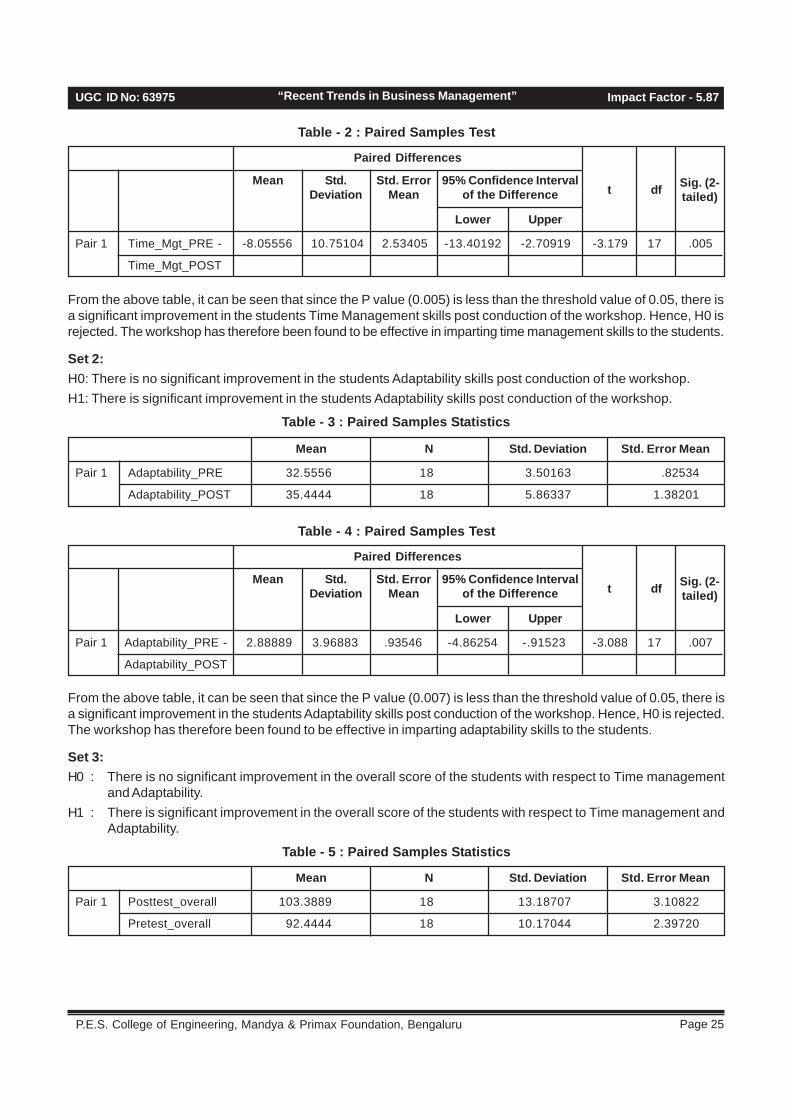
Page 25 P.E.S. College of Engineering, Mandya & Primax Foundation, Bengaluru
UGC ID No: 63975 Impact Factor - 5.87“Recent Trends in Business Management”
Table - 2 : Paired Samples Test
Pair 1 Time_Mgt_PRE - -8.05556 10.75104 2.53405 -13.40192 -2.70919 -3.179 17 .005
Time_Mgt_POST
Paired Differences
Mean 95% Confidence Intervalof the Difference t
Std.Deviation
Std. ErrorMean df Sig. (2-
tailed)
Lower Upper
From the above table, it can be seen that since the P value (0.005) is less than the threshold value of 0.05, there isa significant improvement in the students Time Management skills post conduction of the workshop. Hence, H0 isrejected. The workshop has therefore been found to be effective in imparting time management skills to the students.
Set 2:H0: There is no significant improvement in the students Adaptability skills post conduction of the workshop.H1: There is significant improvement in the students Adaptability skills post conduction of the workshop.
Table - 3 : Paired Samples Statistics
Pair 1 Adaptability_PRE 32.5556 18 3.50163 .82534
Adaptability_POST 35.4444 18 5.86337 1.38201
Mean N Std. Deviation Std. Error Mean
Table - 4 : Paired Samples Test
Pair 1 Adaptability_PRE - 2.88889 3.96883 .93546 -4.86254 -.91523 -3.088 17 .007
Adaptability_POST
Paired Differences
Mean 95% Confidence Intervalof the Difference t
Std.Deviation
Std. ErrorMean df Sig. (2-
tailed)
Lower Upper
From the above table, it can be seen that since the P value (0.007) is less than the threshold value of 0.05, there isa significant improvement in the students Adaptability skills post conduction of the workshop. Hence, H0 is rejected.The workshop has therefore been found to be effective in imparting adaptability skills to the students.
Set 3:H0 : There is no significant improvement in the overall score of the students with respect to Time management
and Adaptability.H1 : There is significant improvement in the overall score of the students with respect to Time management and
Adaptability.
Table - 5 : Paired Samples Statistics
Pair 1 Posttest_overall 103.3889 18 13.18707 3.10822
Pretest_overall 92.4444 18 10.17044 2.39720
Mean N Std. Deviation Std. Error Mean
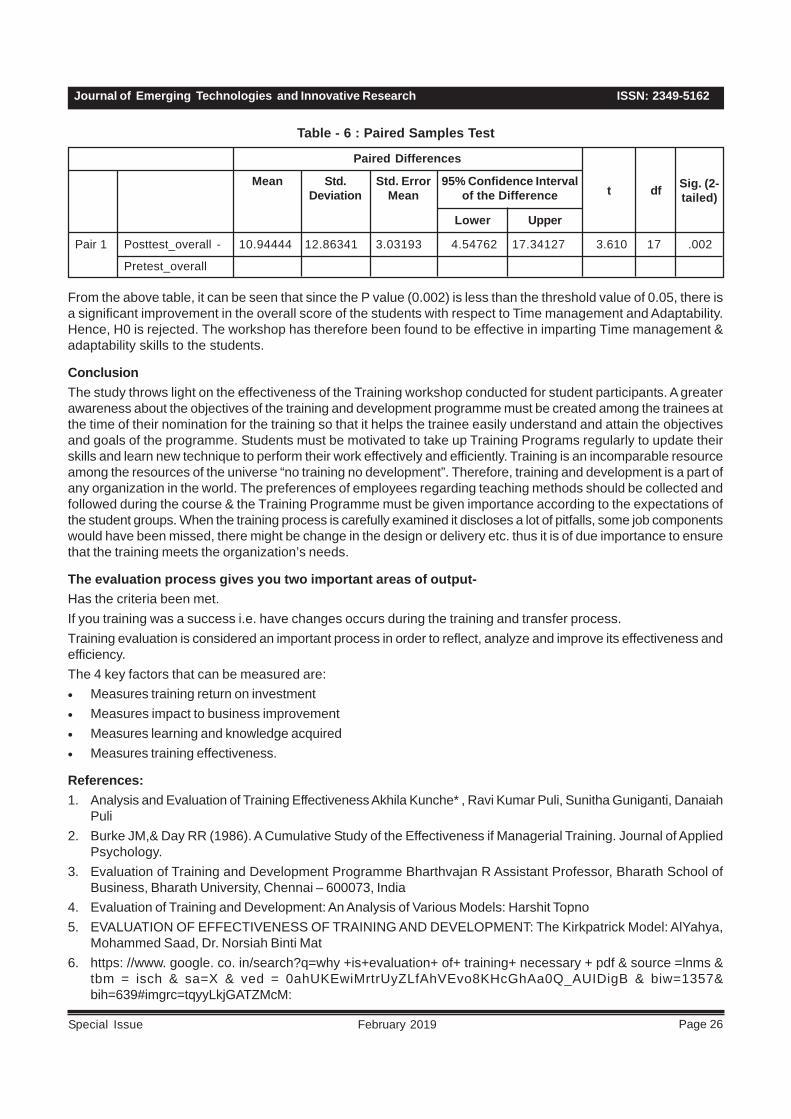
ISSN: 2349-5162Journal of Emerging Technologies and Innovative Research
Page 26February 2019Special Issue
Table - 6 : Paired Samples Test
Pair 1 Posttest_overall - 10.94444 12.86341 3.03193 4.54762 17.34127 3.610 17 .002
Pretest_overall
Paired Differences
Mean 95% Confidence Intervalof the Difference t
Std.Deviation
Std. ErrorMean df Sig. (2-
tailed)
Lower Upper
From the above table, it can be seen that since the P value (0.002) is less than the threshold value of 0.05, there isa significant improvement in the overall score of the students with respect to Time management and Adaptability.Hence, H0 is rejected. The workshop has therefore been found to be effective in imparting Time management &adaptability skills to the students.
ConclusionThe study throws light on the effectiveness of the Training workshop conducted for student participants. A greaterawareness about the objectives of the training and development programme must be created among the trainees atthe time of their nomination for the training so that it helps the trainee easily understand and attain the objectivesand goals of the programme. Students must be motivated to take up Training Programs regularly to update theirskills and learn new technique to perform their work effectively and efficiently. Training is an incomparable resourceamong the resources of the universe “no training no development”. Therefore, training and development is a part ofany organization in the world. The preferences of employees regarding teaching methods should be collected andfollowed during the course & the Training Programme must be given importance according to the expectations ofthe student groups. When the training process is carefully examined it discloses a lot of pitfalls, some job componentswould have been missed, there might be change in the design or delivery etc. thus it is of due importance to ensurethat the training meets the organization’s needs.
The evaluation process gives you two important areas of output-Has the criteria been met.If you training was a success i.e. have changes occurs during the training and transfer process.Training evaluation is considered an important process in order to reflect, analyze and improve its effectiveness andefficiency.The 4 key factors that can be measured are:• Measures training return on investment• Measures impact to business improvement• Measures learning and knowledge acquired• Measures training effectiveness.
References:1. Analysis and Evaluation of Training Effectiveness Akhila Kunche* , Ravi Kumar Puli, Sunitha Guniganti, Danaiah
Puli2. Burke JM,& Day RR (1986). A Cumulative Study of the Effectiveness if Managerial Training. Journal of Applied
Psychology.3. Evaluation of Training and Development Programme Bharthvajan R Assistant Professor, Bharath School of
Business, Bharath University, Chennai – 600073, India4. Evaluation of Training and Development: An Analysis of Various Models: Harshit Topno5. EVALUATION OF EFFECTIVENESS OF TRAINING AND DEVELOPMENT: The Kirkpatrick Model: AlYahya,
Mohammed Saad, Dr. Norsiah Binti Mat6. https: //www. google. co. in/search?q=why +is+evaluation+ of+ training+ necessary + pdf & source =lnms &
tbm = isch & sa=X & ved = 0ahUKEwiMrtrUyZLfAhVEvo8KHcGhAa0Q_AUIDigB & biw=1357&bih=639#imgrc=tqyyLkjGATZMcM:

Page 27 P.E.S. College of Engineering, Mandya & Primax Foundation, Bengaluru
UGC ID No: 63975 Impact Factor - 5.87“Recent Trends in Business Management”
A STUDY ON INDIAN INTIAL PUBLIC OFFERING’S (IPO’s)DURING THE FINANCIAL YEAR FROM 2010-2018
1. Assistant Professor, Department of Management Studies,Hke’s Sln College of Engineering, Raichur.
AbstractA financial system is a system that allows the exchange of funds between lenders, investors and borrowers. It promotessavings and investment in the economy and enlarges the resources flowing into the financial assets which are moreproductive than the physical assets. A financial market is one of the most impartment part of financial system in whichpeople trade financial securities, commodities and other fungible items of value at low transaction costs and at pricesthat reflective supply and demand. It provides the financial resources needed for the long term and sustainabledevelopment of different sectors of the economy.Primary market of a country plays vital role in the growth anddevelopment of capital market. This provides various options to create required capital. Initial Public Offerings areone of them. Now a day Initial Public Offerings (IPO’s) has become one of the most preferable investment opportunitiesfor the investors. Investors have lots of expectations from initial public offerings. IPOs are assumed as a high returnavenue. Initial Public Offering is also known as "New Issue Market" (NIM), which facilitates companies, governmentsand other groups to obtain finance through debt or equity, based securities. Initial Public Offerings plays very significantin raising capital for a company from primary market. When companies need funds for setting up new projects,expansion, diversification, modernization, mergers or takeovers, etc. which can be fulfilled through retained earningsout of profits and external borrowings. The external borrowings can be in the form of equity or preference shares,debentures, loans and advances, deposits from public and inter corporate lending. So the Present study attempts toexplore growth and performance of Indian Initial Public Offerings (IPO’s) during the financial year from 2010-2018.The study is conducted with the help of secondary data from various published source. In this study an attempt hasbeen made to understand Methods and the behaviour of IPO’s issued during the financial year 2010-18.
Key Words: - Financial System, Primary Market, Initial Public Offerings etc.
IntroductionInitial Public Offering means when a company sells itsshare or offer its share in pubic for the first time. Theoffer generally issued by the new and smaller companiesto expand their capital but it can also be done by thelarge privately companies to become public company.The new companies mostly don’t have resources toconduct the IPO. So, they generally depend on the otherprivate funding like personal loans, family and friends.Therefore, they look for the investors which help themfor their IPO process. Investors offer finance to thecompany for the stake in the company. The investor isliable in the decision making process and also advicethe management in most of the company issues. Whenthe investors of the company want to liquidate theirinvestment they have options like sell the equity todifferent company, sell the whole company to anothercompany as an acquisition, or sell the equity in the InitialPublic offering of the company. Also, when a companyin needs of finance for the development of their companythen they have options like private market equity, issue
debt in the market or offer equity in the public whichmeans initial public offer in the market. IPOs performancecan be affect by different factors like issue size, delayin listing time etc. Some advantages for going publicare like significant access to investment capital, somestock price support after the listing etc. While somedisadvantages for going public are like for smallcompanies the cost incurred for IPO is very high etc.SEBI is the regulator of the Indian Capital marketincluding the primary market i.e. IPOs. IPOs have somefixed process and which every company has to followwhen it comes for the IPO in the market.
IPO’s are important milestone in any company’s growthas it progresses from being a start- up/private limitedcompany to public limited. Successful IPO can generatetremendous amount of wealth for company promotersas well as pre IPO investors. Historically a majority ofthe IPO’s were under-priced with an aim to issueabnormal profits on the listing thus attracting moreinvestors to subscribe to their stocks. Empirical studieshave established the above in efficient markets.
Santosh Kumar1
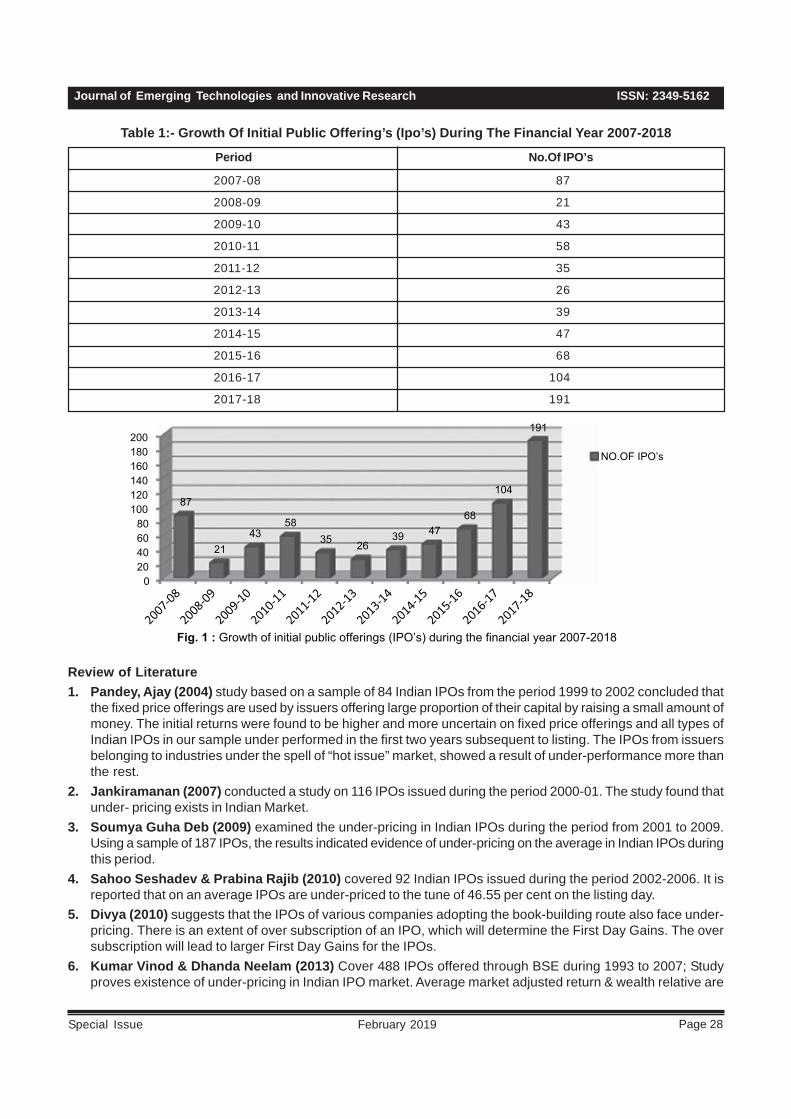
ISSN: 2349-5162Journal of Emerging Technologies and Innovative Research
Page 28February 2019Special Issue
Table 1:- Growth Of Initial Public Offering’s (Ipo’s) During The Financial Year 2007-2018
Period
2007-08 87
2008-09 21
2009-10 43
2010-11 58
2011-12 35
2012-13 26
2013-14 39
2014-15 47
2015-16 68
2016-17 104
2017-18 191
No.Of IPO’s
Fig. 1 : Growth of initial public offerings (IPO’s) during the financial year 2007-2018
020406080
100120140160180200
87
2143
5835 26
39 4768
104
191
NO.OF IPO’s
Review of Literature1. Pandey, Ajay (2004) study based on a sample of 84 Indian IPOs from the period 1999 to 2002 concluded that
the fixed price offerings are used by issuers offering large proportion of their capital by raising a small amount ofmoney. The initial returns were found to be higher and more uncertain on fixed price offerings and all types ofIndian IPOs in our sample under performed in the first two years subsequent to listing. The IPOs from issuersbelonging to industries under the spell of “hot issue” market, showed a result of under-performance more thanthe rest.
2. Jankiramanan (2007) conducted a study on 116 IPOs issued during the period 2000-01. The study found thatunder- pricing exists in Indian Market.
3. Soumya Guha Deb (2009) examined the under-pricing in Indian IPOs during the period from 2001 to 2009.Using a sample of 187 IPOs, the results indicated evidence of under-pricing on the average in Indian IPOs duringthis period.
4. Sahoo Seshadev & Prabina Rajib (2010) covered 92 Indian IPOs issued during the period 2002-2006. It isreported that on an average IPOs are under-priced to the tune of 46.55 per cent on the listing day.
5. Divya (2010) suggests that the IPOs of various companies adopting the book-building route also face under-pricing. There is an extent of over subscription of an IPO, which will determine the First Day Gains. The oversubscription will lead to larger First Day Gains for the IPOs.
6. Kumar Vinod & Dhanda Neelam (2013) Cover 488 IPOs offered through BSE during 1993 to 2007; Studyproves existence of under-pricing in Indian IPO market. Average market adjusted return & wealth relative are
Page 29 P.E.S. College of Engineering, Mandya & Primax Foundation, Bengaluru
UGC ID No: 63975 Impact Factor - 5.87“Recent Trends in Business Management”
used as price performance indicators. The averagemarket adjusted abnormal return has been reported82.67 per cent on the listing of IPOs. All the twentythree sectors have shown existence of under-pricingwith more than one value of wealth relative.
Objectives of the Study:-1. To Evaluate the Growth and Performance of IPO’s in
Indian context2. To elucidate reasons for issuing shares through
Initial Public Offerings (IPO’s)3. To Study the price behaviour of IPO’s on the date of
listing and on a subsequent date4. To study the different methods of issuing the Initial
Public Offerings (IPO’s)5. To analysing whether the stocks are under-priced or
overpriced among the sample companies
Research MethodologyResearch DesignThe methodology for this research is designedconsidering the above facts. In order to accomplish thestated objectives, the researcher will utilize a combinedapproach that embraces features of both descriptive andanalytical research design.
Sample Size:-Public offers made through Bombay Stock Exchangeand National Stock Exchange during 08 financial yearfrom April 1st 2010 to March 31st 2018 were consideredfor this study. There were 601 IPO were issued throughBSE and NSE, out of which 17 issue were withdrawn bythe company and another 16 issues are not trading postlisting. So Total 568 issues are considered for evaluationpurpose.
Sample Profile of Initial Public Offers
Period
2010-11 58 10.21
2011-12 35 06.17
2012-13 26 04.57
2013-14 39 06.86
2014-15 47 08.27
2015-16 68 11.97
2016-17 104 18.30
2017-18 191 33.62
Total 568 100
No.Of IPO’s Percentage (%)
Data CollectionThe study is based on the secondary data. The data issecondary in nature .and these data’s will be collectedfrom different sources like Websites/Internet, CompanyReports / Regulatory Authorities Reports, Books,Journals & Publications etc.
Sources of Data Collection:1. Bombay Stock Exchange, www.bseindia.com2. National Stock Exchange www.nseindia.com3. Money Control www.moneycontrol.com4. Securities Exchange Board of India www.sebi.gov.in5. Chittorgarh www.chittorgarh.com6. Prospectus issued by companies etc.,
Number of IPO’s Issued Under Book Building AndFixed Price Method During The Financial Year From2010 To 2018.Companies can issue their Initial Public Offerings througheither Fixed Price Method or Book Building Price Method.• Fixed Pricing Method
An issuer company is allowed to freely price theissue. The basis of issue Price is to be disclosed inthe offer document where the issuer discloses indetail about the qualitative and
Quantitative factors justifying the issue price. Thereis only one price and issue will be offered at thatprice. Such type of issue is known as Fixed PriceIssue. A one-time offer to purchase a stated numberof shares at a stated fixed price, usually at apremium over the current market price.
• Book Building MethodBook Building is essentially a process used bycompanies raising capital through Public Offerings-both Initial Public Offers (IPOs) and Follow-on PublicOffers (FPOs) to aid price and demand discovery. Itis a mechanism where, during the period for whichthe book for the offer is open, the bids are collectedfrom investors at various prices, which are withinthe price band specified by the issuer. The processis directed towards both the institutional as well asthe retail investors. The issue price is determinedafter the bid closure based on the demand generatedin the process.
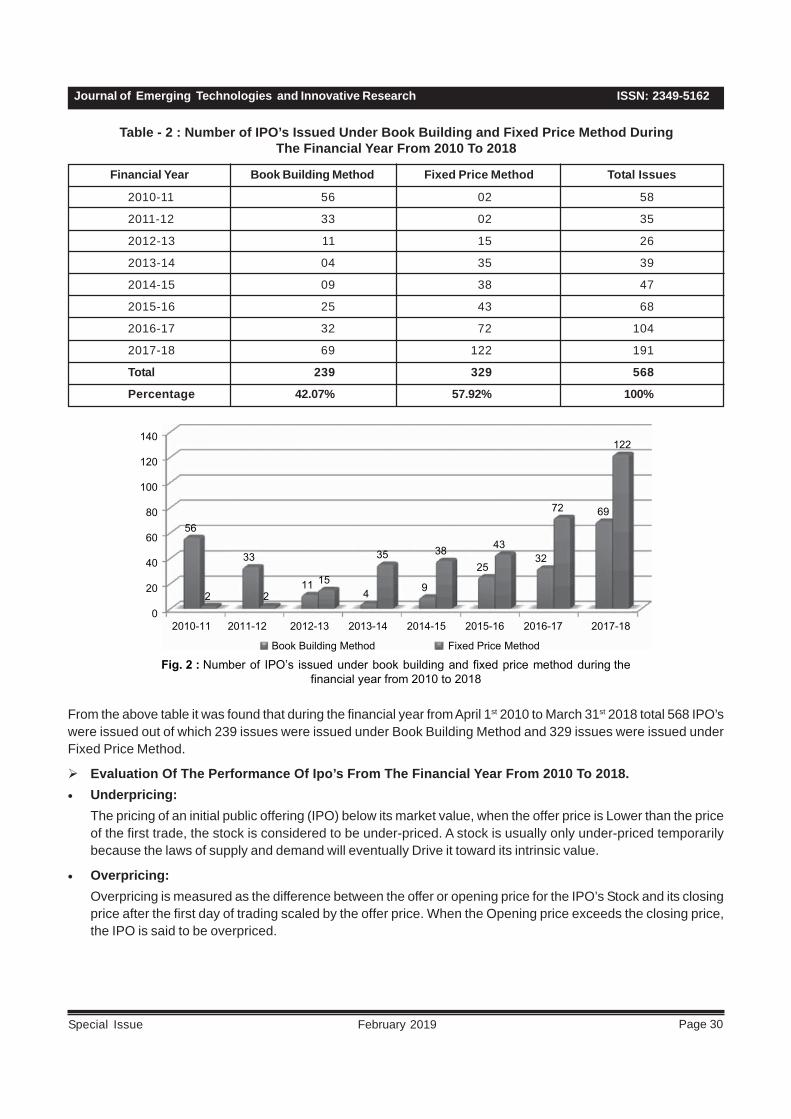
ISSN: 2349-5162Journal of Emerging Technologies and Innovative Research
Page 30February 2019Special Issue
Table - 2 : Number of IPO’s Issued Under Book Building and Fixed Price Method DuringThe Financial Year From 2010 To 2018
Financial Year
2010-11 56 02 58
2011-12 33 02 35
2012-13 11 15 26
2013-14 04 35 39
2014-15 09 38 47
2015-16 25 43 68
2016-17 32 72 104
2017-18 69 122 191
Total 239 329 568
Percentage 42.07% 57.92% 100%
Book Building Method Fixed Price Method Total Issues
Fig. 2 : Number of IPO’s issued under book building and fixed price method during thefinancial year from 2010 to 2018
0
20
40
60
80
100
120
140
2010-11 2011-12 2012-13 2013-14 2014-15 2015-16 2016-17 2017-18
56
33
114 9
2532
69
2 215
35 38 43
72
122
Book Building Method Fixed Price Method
From the above table it was found that during the financial year from April 1st 2010 to March 31st 2018 total 568 IPO’swere issued out of which 239 issues were issued under Book Building Method and 329 issues were issued underFixed Price Method.
Evaluation Of The Performance Of Ipo’s From The Financial Year From 2010 To 2018.• Underpricing:
The pricing of an initial public offering (IPO) below its market value, when the offer price is Lower than the priceof the first trade, the stock is considered to be under-priced. A stock is usually only under-priced temporarilybecause the laws of supply and demand will eventually Drive it toward its intrinsic value.
• Overpricing:Overpricing is measured as the difference between the offer or opening price for the IPO’s Stock and its closingprice after the first day of trading scaled by the offer price. When the Opening price exceeds the closing price,the IPO is said to be overpriced.
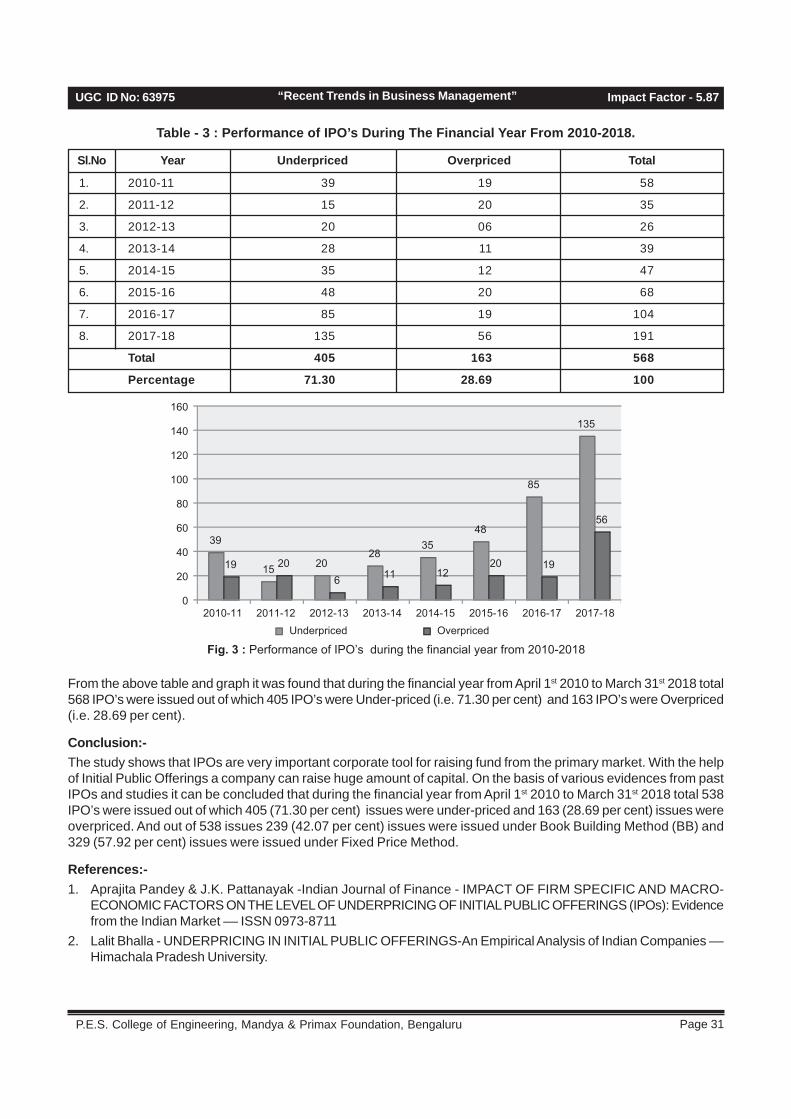
Page 31 P.E.S. College of Engineering, Mandya & Primax Foundation, Bengaluru
UGC ID No: 63975 Impact Factor - 5.87“Recent Trends in Business Management”
Table - 3 : Performance of IPO’s During The Financial Year From 2010-2018.
Sl.No
1. 2010-11 39 19 58
2. 2011-12 15 20 35
3. 2012-13 20 06 26
4. 2013-14 28 11 39
5. 2014-15 35 12 47
6. 2015-16 48 20 68
7. 2016-17 85 19 104
8. 2017-18 135 56 191
Total 405 163 568
Percentage 71.30 28.69 100
Underpriced Overpriced TotalYear
Fig. 3 : Performance of IPO’s during the financial year from 2010-2018
39
15 2028
3548
85
135
19 206 11 12
20 19
56
0
20
40
60
80
100
120
140
160
Underpriced Overpriced2010-11 2011-12 2012-13 2013-14 2014-15 2015-16 2016-17 2017-18
From the above table and graph it was found that during the financial year from April 1st 2010 to March 31st 2018 total568 IPO’s were issued out of which 405 IPO’s were Under-priced (i.e. 71.30 per cent) and 163 IPO’s were Overpriced(i.e. 28.69 per cent).
Conclusion:-The study shows that IPOs are very important corporate tool for raising fund from the primary market. With the helpof Initial Public Offerings a company can raise huge amount of capital. On the basis of various evidences from pastIPOs and studies it can be concluded that during the financial year from April 1st 2010 to March 31st 2018 total 538IPO’s were issued out of which 405 (71.30 per cent) issues were under-priced and 163 (28.69 per cent) issues wereoverpriced. And out of 538 issues 239 (42.07 per cent) issues were issued under Book Building Method (BB) and329 (57.92 per cent) issues were issued under Fixed Price Method.
References:-1. Aprajita Pandey & J.K. Pattanayak -Indian Journal of Finance - IMPACT OF FIRM SPECIFIC AND MACRO-
ECONOMIC FACTORS ON THE LEVEL OF UNDERPRICING OF INITIAL PUBLIC OFFERINGS (IPOs): Evidencefrom the Indian Market –– ISSN 0973-8711
2. Lalit Bhalla - UNDERPRICING IN INITIAL PUBLIC OFFERINGS-An Empirical Analysis of Indian Companies ––Himachala Pradesh University.

ISSN: 2349-5162Journal of Emerging Technologies and Innovative Research
Page 32February 2019Special Issue
3. Dr.S.Poornima And Aalaa J.Haji (2016) - A STUDYON THE PERFORMANCE OF INITIAL PUBLICOFFERING OF COMPANIES LISTED IN NSE, INDIA& Gulf Base GCC Index.- IJRFM- Vol. 6 Issue 11,November - 2016, pp. 31~46.
4. Sahil Narang- UNDER-PRICING OF INITIAL PUBLICOFFERS IN INDIA- International Journal ofCommerce and Management Research -ISSN: 2455-1627, Impact Factor: RJIF 5.22- Volume 3; Issue 5;May 2017; Page No. 183-187.
5. Sahil Narang And Dr. Vinod Kumar-UNDERPRICING OF INITIAL PUBLIC OFFERINGS:AN INDIAN EVIDENCE- (IJRFM) Vol. 7 Issue 4, April- 2017 ISSN(o): 2231-5985 | Impact Factor: 6.397
6. Manpreet Kaur, Dr. Simranjit Singh, Dr. NeetuPrakash- PUBLIC OFFER’S PERFORMANCE- AN
ANALYSIS OF NSE LISTED COMPANIES, SINCE2001. -IOSR Journal of Business and Management(IOSR-JBM) e-ISSN: 2278-487X, p-ISSN: 2319-7668.Volume 19, Issue 7. Ver. IV. (July 2017), PP 33-43
7. Dr. A. S. Ambily, Gayatri Krishna, Aswathy K andDeepa Balakrishnan- A STUDY ONPERFORMANCE OF IPO’S UNDER NSE FROMISSUE PRICE TO LAST TRADING PRICE IN THEYEAR 2013-2015 -Global Journal of Finance andManagement. ISSN 0975-6477 Volume 8, Number1 (2016), pp. 43-48 - Research India Publications.
8. Prof. Sweety Nishant Shah & Prof. DishaHarshadbhai Mehta- INITIAL PERFORMANCE OFIPOs IN INDIA: EVIDENCE FROM 2010-2014-Samvad Volume IX- March 2015

Page 33 P.E.S. College of Engineering, Mandya & Primax Foundation, Bengaluru
UGC ID No: 63975 Impact Factor - 5.87“Recent Trends in Business Management”
HERDING BEHAVIOUR IN INDIAN STOCK MARKET –AN EMPIRICAL EVIDENCE FROM NSE INDIA
1. Assistant Professor, Department of Management Studies, Dayananda Sagar Institutions, Bangalore, India.2. Dayananda Sagar Institution, Bangalore India.
AbstractEfficient market hypothesis states that the investors share same amount of information at the same time so that theycan imagine the expected prices of stock in the same manner. This results in the fair value of securities and theefficient market. But there are many instances of “information cascade” 1 in the stock market. Their theory says thatthe large trends or fads begin when individuals just ignore their own information but take cues from the actions of otherinvestors. The present study has intended to examine the presence of herding in Indian stock market over a period of10 years. Only secondary data i.e. daily closing prices of 50 stocks listed in Nifty and Nifty fifty is collected for the saidperiod. The study found that there is no evidence of herding in Indian stock market, however, there is an evidence ofhigh levels of herd pattern in bear market. The results point out that during the bear phase the investors tend to takeirrational investment decisions and follow the crowd.
Keywords: Herding, Investors, NSE, EMH
Rashitha R. Gowda1
IntroductionEfficient market hypothesis states that the investorsshare same amount of information at the same so theycan imagine the expected prices of stock in the samemanner. This situation results in the fair value ofsecurities that is only possible due to perfect informationwhich is available in efficient market. But there are manyinstances of “information cascade” (Bikhchandani, et al.1992) in the stock market. Their theory says that thelarge trends or fads begin when individuals just ignoretheir own information or knowledge but take cues fromthe actions of others investors. In the given scenario, inthe present study an attempt has been made to studythe presence of herding factor in the Indian stock marketover a period of 10 years, commencing from 01.04.2008to 31.03.2018.
Review of LiteratureHerding is described as the imitation behavior resultingfrom individual factors & often leading to inefficientoutcomes for the market as a whole, Bikhchandari etal. (1992). Herd behavior can be explained in two ways– rational as well as irrational. In rational herding, “herdingcan be referred to as a tendency of investors irrationallyignore their own analysis and information and conformfor the market consensus, even if they do not agree withthat (Christie & Huang, 1995)”.
Poshakwale et al. (2014) attempted to investigate thepresence of herd behavior in India during the time-period1997-2012 by applying Kalman filter model. The findingsshow strong presence of herd behavior in Indian stock
market. The results also prove that herding is existingin Indian market during market swings also, i.e., bullphase or bear phase. The presence of herding is moreduring bear phase than during bull phase.
Garg and Gulati (2014) examined the existence of herdbehavior in Indian Stock Market by using daily, weeklyas well as monthly data of the securities listed in CNX500 during the time period 2000-2013. Christie and Huang(1995) as well as Chang et al. (2000) measures wereemployed in the study. The results provide that Indianstock market does not follow herd behavior. Existenceof herd behavior was also investigated during increasingmarket state, decreasing market state, high volume state,low volume state as well as before sub-prime crisis,during sub-prime crisis as well as post sub-prime crisis.The results nullify the presence of herd behavior in Indianstock market. It seems that Investors’ behavior is quiterational in Indian Stock Market.
Mohanta et al. (2011) investigated that investors makesinvestment decisions to fulfill their financial, social andpsychological need. “They do take into considerationother benefits like safety and security, getting periodicreturn or dividends, high capital gain, secured future,liquidity, easy purchase, tax benefit, meeting futurecontingency etc. while taking decisions”
Bikhchandani et al. (1992) and Nofsinger and Sias (1999)examine that even though there exists an argumentstating that herding may result in efficient outcomes,the obvious outcome of herding is inefficient markets.Herding sentiment makes a group of different investors
Dr. Mahua Biswas2
ISSN: 2349-5162Journal of Emerging Technologies and Innovative Research
Page 34February 2019Special Issue
to invest together, causing the stock prices to moveaway from the economic realities, leading to pricechanges and excess fluctuations.
Economou, Kostakis and Philippas (2010) examinedherd behavior in extreme market conditions using dailydata from the Greek, Italian, Portuguese and Spanishstock markets for the years 1998- 2008 i.e. the existenceof asymmetric Herding behavior associated with marketreturns, trading volume, and return volatility. Along withthis, they also investigated the presence of herd behaviorduring the global financial crisis of 2008. The results ofthe study showed that Herding is found to be strongerduring periods of rising markets in these stock markets.Herding is present in the Portuguese stock market duringperiods of down returns and there is no evidence ofHerding in the Spanish stock market. Finally, it is saidthat there is evidence of Herding during the global financialcrisis of 2008 only for the Portuguese stock market andevidence of anti-Herding for the Spanish and the Italianstock markets. Investor behavior seems to have beenrational for the Greek stock market during the globalfinancial crisis.
Nofsinger and Sias (1999) stated that herding existswhen “a group of investors trading in the same directionover a period of time”. There are several theories whichtry to explain the reasons as to why investors trade inthe same direction, commonly referred to as herding.The first theory stated by Scharfstein and Stein (1990)is that investors may not be comfortable with their owninformation and thus prefer to herd with others becauseof fear of acting differently. Secondly investors may herdin the same direction because they would probably havereceived the same kind of market information, Froot et.al(1992) and Hirshleifer et.al (1994). Third, by Bikhchandani,Hirshleifer and Welch (1992), investors may rely on theirown information from historical trades and herd with others,finally investors may be risk averse to certain stocks.
Kang, W. (2013) herding behavior is the most prominentand also the most influential behavioral bias in terms ofmaking a massive impact in financial markets. Herdingbehavior involves a transition phase which is developedbefore sudden change in the trends of financial markets.Herding behavior among investors has constituted to bethe reason for mass errors and creation of ‘‘bubbles’’ inthe markets, Devenow, A., & Welch, I. (1996).
Chiang et al. (2010) examine the existence of herdbehavior in 18 countries in the global market during theperiod between 1988 and 2009. The samples cover theadvanced markets: Australia, France, Germany, HongKong, Japan, the United Kingdom, and the UnitedStates; Latin American markets: Argentina, Brazil, Chile,and Mexico; Asian markets: China, Indonesia, Malaysia,Singapore, South Korea, Taiwan, and Thailand. CSSD
and CSAD methodology was used to examine the same.Their research shows that herding behavior is present inadvanced stock markets except for the US. Herding ispresent in both up and down markets except in US andLatin American markets. Herding asymmetry is moreprofound in Asian markets during rising markets. Herdingwas also present in the US and Latin American marketsduring crisis periods.
Statement of the ProblemHerding is related to a person’s psychology wheredifferent investors follow each other in the financial worldrationally or irrationally. It was argued that in cases ofextreme market stress or crisis, the investors go withthe consensus rather than following their own beliefs orknowledge so as to seek certainty and conformity. Theywant to avoid the anxiety of making incorrect decisionsthat is loss under the conditions of uncertainty whichcomes with market stress and leads to herding. Thisbehavior reveals market inefficiency and abnormality inmarket volatility. In the present study an attempt is madeto investigate the presence of herding behavior in theIndian stock market viz., National Stock Exchange.
Objectives of the StudyThe broad objectives of the study are:1. To observe the herd pattern in S&P CNX Nifty-50
index during bear and bull markets.2. To determine the presence and impact of herding
behavior in the Indian Equity market.
MethodologyThis present study is consisting of only secondary data,daily data over a period of 10 years i.e., from 01.4.2008to 31.3.2018 of Nifty -50 stocks and S &P CNX Nifty iscollected. Due to non-availability of consistent data forthe study period, out of 50 companies the data of 30companies listed in NIFTY-50 is considered for thepresent study. Daily closing stock prices as well as themarket returns for the period of ten years commencingfrom 01.04.2008 to 31.03.2018 are used for analysis.The historical data is obtained from the NSE web site. Itincludes:• Daily total returns of the index and securities,• Daily high and low values of the index• Daily closing prices of Nifty 50 index options
Descriptive statistics, time series data analysis like unitroot test, correlation and regression analysis etc. areused for analysis. Unit root test of all the time seriesdata using ADF is done. The study uses OLS regressionto demonstrate the herd pattern in Indian stock marketVariables which are considered for present study arefollows:
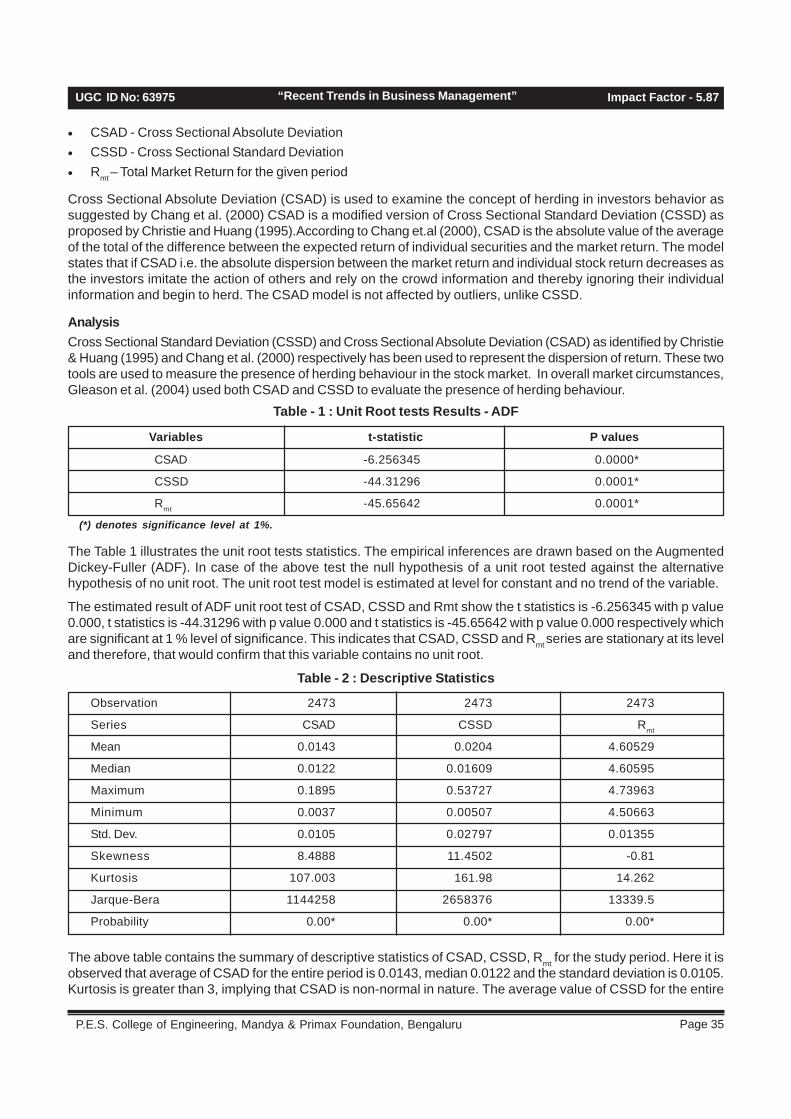
Page 35 P.E.S. College of Engineering, Mandya & Primax Foundation, Bengaluru
UGC ID No: 63975 Impact Factor - 5.87“Recent Trends in Business Management”
• CSAD - Cross Sectional Absolute Deviation• CSSD - Cross Sectional Standard Deviation• Rmt – Total Market Return for the given period
Cross Sectional Absolute Deviation (CSAD) is used to examine the concept of herding in investors behavior assuggested by Chang et al. (2000) CSAD is a modified version of Cross Sectional Standard Deviation (CSSD) asproposed by Christie and Huang (1995).According to Chang et.al (2000), CSAD is the absolute value of the averageof the total of the difference between the expected return of individual securities and the market return. The modelstates that if CSAD i.e. the absolute dispersion between the market return and individual stock return decreases asthe investors imitate the action of others and rely on the crowd information and thereby ignoring their individualinformation and begin to herd. The CSAD model is not affected by outliers, unlike CSSD.
AnalysisCross Sectional Standard Deviation (CSSD) and Cross Sectional Absolute Deviation (CSAD) as identified by Christie& Huang (1995) and Chang et al. (2000) respectively has been used to represent the dispersion of return. These twotools are used to measure the presence of herding behaviour in the stock market. In overall market circumstances,Gleason et al. (2004) used both CSAD and CSSD to evaluate the presence of herding behaviour.
Table - 1 : Unit Root tests Results - ADF
Variables
CSAD -6.256345 0.0000*
CSSD -44.31296 0.0001*
Rmt -45.65642 0.0001*
t-statistic P values
(*) denotes significance level at 1%.
The Table 1 illustrates the unit root tests statistics. The empirical inferences are drawn based on the AugmentedDickey-Fuller (ADF). In case of the above test the null hypothesis of a unit root tested against the alternativehypothesis of no unit root. The unit root test model is estimated at level for constant and no trend of the variable.
The estimated result of ADF unit root test of CSAD, CSSD and Rmt show the t statistics is -6.256345 with p value0.000, t statistics is -44.31296 with p value 0.000 and t statistics is -45.65642 with p value 0.000 respectively whichare significant at 1 % level of significance. This indicates that CSAD, CSSD and Rmt series are stationary at its leveland therefore, that would confirm that this variable contains no unit root.
Table - 2 : Descriptive Statistics
Observation 2473 2473 2473
Series CSAD CSSD Rmt
Mean 0.0143 0.0204 4.60529
Median 0.0122 0.01609 4.60595
Maximum 0.1895 0.53727 4.73963
Minimum 0.0037 0.00507 4.50663
Std. Dev. 0.0105 0.02797 0.01355
Skewness 8.4888 11.4502 -0.81
Kurtosis 107.003 161.98 14.262
Jarque-Bera 1144258 2658376 13339.5
Probability 0.00* 0.00* 0.00*
The above table contains the summary of descriptive statistics of CSAD, CSSD, Rmt for the study period. Here it isobserved that average of CSAD for the entire period is 0.0143, median 0.0122 and the standard deviation is 0.0105.Kurtosis is greater than 3, implying that CSAD is non-normal in nature. The average value of CSSD for the entire
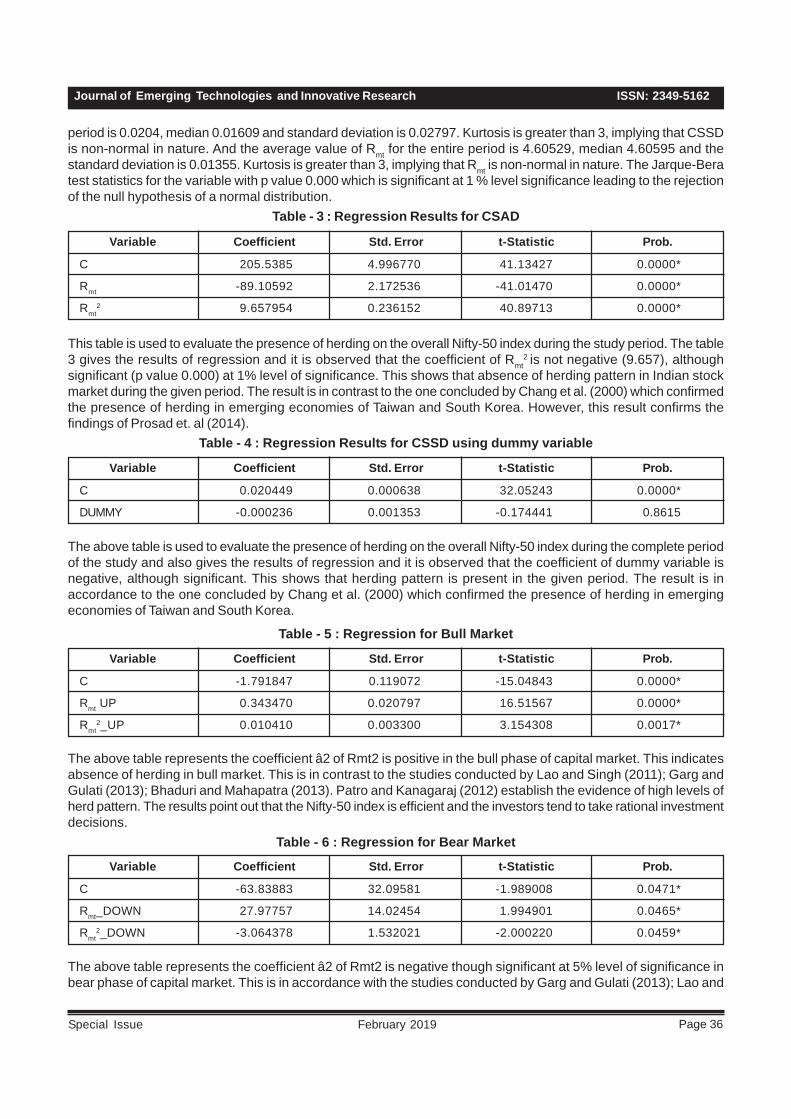
ISSN: 2349-5162Journal of Emerging Technologies and Innovative Research
Page 36February 2019Special Issue
period is 0.0204, median 0.01609 and standard deviation is 0.02797. Kurtosis is greater than 3, implying that CSSDis non-normal in nature. And the average value of Rmt for the entire period is 4.60529, median 4.60595 and thestandard deviation is 0.01355. Kurtosis is greater than 3, implying that Rmt is non-normal in nature. The Jarque-Beratest statistics for the variable with p value 0.000 which is significant at 1 % level significance leading to the rejectionof the null hypothesis of a normal distribution.
Table - 3 : Regression Results for CSAD
Variable
C 205.5385 4.996770 41.13427 0.0000*
Rmt -89.10592 2.172536 -41.01470 0.0000*
Rmt2 9.657954 0.236152 40.89713 0.0000*
Coefficient Std. Error t-Statistic Prob.
This table is used to evaluate the presence of herding on the overall Nifty-50 index during the study period. The table3 gives the results of regression and it is observed that the coefficient of Rmt
2 is not negative (9.657), althoughsignificant (p value 0.000) at 1% level of significance. This shows that absence of herding pattern in Indian stockmarket during the given period. The result is in contrast to the one concluded by Chang et al. (2000) which confirmedthe presence of herding in emerging economies of Taiwan and South Korea. However, this result confirms thefindings of Prosad et. al (2014).
Table - 4 : Regression Results for CSSD using dummy variable
Variable
C 0.020449 0.000638 32.05243 0.0000*
DUMMY -0.000236 0.001353 -0.174441 0.8615
Coefficient Std. Error t-Statistic Prob.
The above table is used to evaluate the presence of herding on the overall Nifty-50 index during the complete periodof the study and also gives the results of regression and it is observed that the coefficient of dummy variable isnegative, although significant. This shows that herding pattern is present in the given period. The result is inaccordance to the one concluded by Chang et al. (2000) which confirmed the presence of herding in emergingeconomies of Taiwan and South Korea.
Table - 5 : Regression for Bull Market
Variable
C -1.791847 0.119072 -15.04843 0.0000*
Rmt UP 0.343470 0.020797 16.51567 0.0000*
Rmt2_UP 0.010410 0.003300 3.154308 0.0017*
Coefficient Std. Error t-Statistic Prob.
The above table represents the coefficient â2 of Rmt2 is positive in the bull phase of capital market. This indicatesabsence of herding in bull market. This is in contrast to the studies conducted by Lao and Singh (2011); Garg andGulati (2013); Bhaduri and Mahapatra (2013). Patro and Kanagaraj (2012) establish the evidence of high levels ofherd pattern. The results point out that the Nifty-50 index is efficient and the investors tend to take rational investmentdecisions.
Table - 6 : Regression for Bear Market
Variable
C -63.83883 32.09581 -1.989008 0.0471*
Rmt_DOWN 27.97757 14.02454 1.994901 0.0465*
Rmt2_DOWN -3.064378 1.532021 -2.000220 0.0459*
Coefficient Std. Error t-Statistic Prob.
The above table represents the coefficient â2 of Rmt2 is negative though significant at 5% level of significance inbear phase of capital market. This is in accordance with the studies conducted by Garg and Gulati (2013); Lao and
Page 37 P.E.S. College of Engineering, Mandya & Primax Foundation, Bengaluru
UGC ID No: 63975 Impact Factor - 5.87“Recent Trends in Business Management”
Singh (2011), Patro and Kanagaraj (2012),Bhaduri andMahapatra (2013). This establishes the evidence of highlevels of herd pattern. The results point out that duringthe bear phase the investors in NSE tend to take irrationalinvestment decisions and follow the crowd. This isconsistent with the research of Chiang and Zheng (2010)who find no asymmetry in herding among advancedcountries. However, it is inconsistent with the recentresearch of Ohlson (2010).
ConclusionThe current study has been intended to examine theherding behaviour of Indian stock market. It is concludedthat herding behaviour is absent in NSE S&P CNX Nifty50 during 2008-2018 as a whole. It is argued thatinvestors are rational and are not following the decisionsof the crowd while taking the investment decision inmany times. However, investors are more irrational ininvesting in times of market slow down. This behaviourplays a major role in the investment decisions taken bythe people, which finally reflect over the changes in theprices of certain stock. The institutional investors showherding when the market is characterized by low levelsof information symmetry. Therefore, every change in thebehaviour basically depends upon the informationavailable to the investors. The dispersion of sufficientinformation into the market helps its absorption by theinvestors suddenly and in taking correct investmentdecisions and there arises no need to mimic thebehaviour of the crowd.
References• Bikhchandani Sushil , Hirshleifer David and Welch
Ivo, “A Theory of Fads, Fashion, Custom, and CulturalChange as Informational Cascades”, Journal ofPolitical Economy, Vol.100(5), pp 992-1026, October1992
• Chang et al (2000) https://www.sciencedirect.com/science/article/pii/S0378426699000965
• Chiang et al (2010) http://lup.lub.lu.se/luur/download? func = download File & record OId =3046944 & file OId = 3046946
• Christie W. G., Huang R.D. (1995) following the piedpiper: Do individual returns herd around the market?Financial Analyst Journal, Vol.51 (4)
• Devenow, A., & Welch, I. (1996). Rational herding infinancial economics. European Economic Review,40(3), 603-615
• Economou, F., Kostakis, A., & Phillippas, N. (2010).Journal of International Financial markets,Institutions and Money, 21(3), 443-460
• Froot (1992) https://doi.org/10.1111/j.1540-6261.1992.tb04665.x
• Garg, A. & Gulati, R. (2014). Do investors herd inIndian market? Decision, 40(3), 181- 196
• Hirshleifer et al (1994) Security analysis and TradingPatterns when some investors receive informationbefore others, journal of Finance 49, 1665-1698.
• Kang, W. (2013). Herd behavior in financial markets.International Business Research, 6(6), 31.
• Mohanta, G., & Debasish, S. (2011). A Study onInvestment Preferences among Urban Investors inOrissa. Prerana: Journal of Management Thoughtand Practice, 3(1), 1-9.
• Nofsinger, J., Sias, R. (1999). Herding and FeedbackTrading by Institutional and Individual Investors.Journal of Finance, 54, 2263-2295.
• Poshakwale, S., & Mandal, A. (2014). InvestorBehavior and Herding: Evidence from the NationalStock Exchange in India. Journal of emerging marketfinance, 13(2), 197-216.
• Prosad, J. M. (2014). Impact of Investors’ BehavioralBiases on the Indian Equity Market and Implicationson Stock Selection Decisions: An Empirical Analysis(Doctoral dissertation, Jaypee Institute of InformationTechnology).
• Scharfstein, David S. and Stein, Jeremy C. “HerdBehavior and Investment.” American EconomicReview, June 1990, 80(3), pp. 465–79
• Welch, I., (2000) ‘Herding Among Security Analysts’,Journal of Financial Economics, vol. 38, no. 3, pp.369-396, Available: http://wlv.summon. serialssolutions.com/search? s.q=Herding+Among +Security+Analysts [Accessed 25th Mar 2013]
ISSN: 2349-5162Journal of Emerging Technologies and Innovative Research
Page 38February 2019Special Issue
ROLE OF AKSHAYAKALPA IN THE PROMOTION OF ORGANICDAIRY ENTREPRENEURSHIP IN RURAL AREAS
1. Research Scholar, Dept. of Commerce, Kuvempu University PG Centre, Kadur.2. Assistant Professor, Dept. of Commerce, Kuvempu University PG Centre, Kadur.3. Dept. of Commerce, Kuvempu University PG Centre, Kadur.
AbstractThe economy of Karnataka is in the process of evolution from a chiefly agrarian economy to an industrial and serviceeconomy. It has been always facing several socio-economic bottlenecks like undeveloped infrastructure poverty,poor per capital income etc. The share of agriculture has more and more decline in recent years resulting in nonstopmigration from the rural to urban areas in search of letters employment opportunities and living standard, thinkingabout the sustainable developmental of this part of the region is still a far cry, this is mainly due to the absence of poorentrepreneurial activity, integrated and wide-ranging developmental strategy and lack of sufficient funds to organizebusiness and inefficiency thus, there is need to strength then employment opportunities in the rural areas by promotingrural entrepreneurship. Development of rural areas means true development of a Nation. So Akshayakalpa is one,help for the development of rural people. Akshayakalpa help for the development of self-employment in rural areas.This can help for the rural peoples to start their own business and giving job to others. Akshayakalpa is moreconcentrate on the rural entrepreneurship and also sell a healthy organic milk or product to the public. Akshayakalpacan introduce the new concept that is organic dairy farming in rural areas. So these are a need to study on promotionof organic dairy entrepreneurship in rural areas. However the present study is undertaken to know the role ofAkshayakalpa in the promotion of Organic Dairy Entrepreneurship in the study area. The present study includes the25 dairy owners in the Kadur Taluk who are established their farming with the support of Akshayakalpa.
Keywords: Entrepreneurship, Dairy Farming, Akshayakalpa, Economy
Parvathi T. M1
Introduction:The majority of the population in India lives in villages.The village is the backbone of the country. Village orrural industries play an important role in the nationaleconomy, particularly in the rural development. The fatherof the nation, Mahatma Gandhi said long ago, “thatdevelopment of its villages is the true development ofIndia”. Government of India is providing many specialprivileges to the developmental of Indian village’s viz.,poverty alleviation schemes, employment generationschemes, housing schemes and many more.India lives in its villages; most of the total populationlives in rural areas where agriculture and allied activitiesare the main stay of their lives. The economic developmentof our country largely depends on the development ofrural areas and the standard of living of its rural mass.Entrepreneurship can play an important role in ruraldevelopment. Entrepreneurship is an economic activity,which is undertaken by an individual or group ofindividuals. Entrepreneurship can help to develop theincome, more employment opportunities and standardof living of the individuals. Entrepreneurship in rural andtribal areas looms large to solve the problem of poverty,unemployment and backwardness of Indian economy.Entrepreneur is an important input of economicdevelopment because they make it possible through their
Dr. Shobharani H2 Akash M.S.3
action and not through words. They do things in acompletely new way. They think beyond the obvious.They do deeper. They think from different perspectivesand angles. There are different kinds of entrepreneurslike Innovating entrepreneur, imitative entrepreneurs,Fabian entrepreneurs, Drone entrepreneurs, Womenentrepreneurs, rural entrepreneurs etc.
Rural entrepreneurship is based on stimulating localentrepreneurial talent and the subsequent growth ofindigenous enterprises. Rural entrepreneurship bringsan economic value to the rural sector by creating newmethods of production, new markets, new products andgenerate employment opportunities thereby ensuringcontinuous rural development.
Rural entrepreneurs use the scares resources in themost efficient manner thereby increasing profits anddecreasing costs. Rural entrepreneurship can beconsidered one of the solutions to reduce poverty,migration, economic disparity, unemployment anddevelop rural areas and backward regions.
Majority of the rural entrepreneurs are facing manyproblems due to non-availability of primary amenities inrural areas especially in developing countries like India.Financial problems, lack of education, and insufficienttechnical and conceptual ability at present it is too difficult
Page 39 P.E.S. College of Engineering, Mandya & Primax Foundation, Bengaluru
UGC ID No: 63975 Impact Factor - 5.87“Recent Trends in Business Management”
for the rural entrepreneurs to establish industries in ruralareas.
The definition of the word “Organic”, an ecologicalmanagement production system that promotes andenhances biodiversity, biological cycles and soilbiological activity. It is based on the minimal use of off-farm inputs and on management practices that restore,maintain and enhance “ecological harmony” (NationalStandards Board of the US Department of agriculture)
Today’s educated society is showing greater interest totheir children’s health and prefers food products with morenutritional values. So most of the peoples prefer almostorganic items like organic milk, organic vegetables,organic foods etc. In recent days city peoples are buyingmore organic items. They don’t think about money. Sofor that reason many institutions or companies aremanufacture and sell organic products.
Today more number of city peoples is using organic milk,because of its benefit. But rural peoples are not usingthis organic milk because of high cost. So for that reasonthe private institutions can buy the organic milk in villagesand sell it in cities. The present study throws a light onthe Role of Akshayakalpa an organic dairy industry inthe promotion of rural entrepreneurship.
Review of Literature:Jayadatta.S. (September 2017) in his study aims atanalyzing the factors, which motivated rural peoples tobecome an entrepreneur. Entrepreneurs are driven toachieve success in their business along with the qualitiesinherited by them of a dreamer, leader, manager,innovator, continuous learner and decision maker andmost important is to implement all these qualities intothe work. Organizations and government should comewith training and sustaining support systems providingall necessary assistance so that rural youth can bemotivated to take up entrepreneurship as a career.
Monika Sharma, Vandana Chaudhary, Rajni Balaand Rachan Chauhan (2013) carried out a study onproblems faced by the rural entrepreneurs for setting upof an enterprise in rural areas. Government shouldprovide financial facilities, schemes and programs forthe development of rural areas and thereby increasingeconomic development. Government of India has takeninitiative for rural socio economic development by creatingemployment opportunities through various sponsoredschemes for appraisal of rural entrepreneurship acrossthe country. Some of these include: Training of RuralYouth for Self Employment (TRYSEM), Jawahar RojgarYojana(JRY), Integrated Rural Development Programme(IRDP), Sampoorna Grameen Rojgar Yojana(SGRY),National Rural Employment Programme(NREP), NationalRural Employment Guarantee Programme(NREGP).
Mansi Paul1 and Achla Sharma (2013) in his studystate that “Rural Development is a key element of strategiesto reduce poverty and create income and employmentopportunities”. The research suggests that operatorshave yet to create and implement business models capableof driving profitable growth through a rural expansion strategy.The result shows that maximum innovations are in fieldof agriculture, rural energy and technology based. So forthe local area is benefiting from the technology and innovationnot much support is there from government to promote.Kushalakshi, Dr.A. Raghurama (2012) a study on“Rural entrepreneurship: A Catalyst for RuralDevelopment” the aim of this paper is to more concentrateon the rural areas, rural entrepreneurship and ruralindustries. This can shows the socio economic characteristicsof rural entrepreneurs. Most of the population in India livesin villages. Village or rural industries play an importantrole in the national economy. Because rural entrepreneurshipcan help for the solution to reduce poverty, migration,economic disparity, unemployment and backward regions.Dr.G.Jayabal and Ms. M.Soundarya “Opportunitiesand Challenges of Rural Entrepreneurship inIndia”(2012) the present study aims at analyzing theimportance of rural entrepreneurship. Rural entrepreneurshipis now a day a major opportunity for the people whomigrate from rural areas or semi urban areas to urbanareas. The study explains the opportunities, necessity,role and significance of rural entrepreneurship. The ruralentrepreneurs need to be motivated to take upentrepreneurship as a career, with training and sustainingsupport systems providing all necessary assistance.Rural entrepreneurship in Europe a research frameworkand agenda Sophia Sathopoulou Demetriouspsaltopoulos and Dimitris skuras: The present workan provides an integrated view of rural entrepreneurshipand sets agenda for future research in the area ruraldefines a territorially specific entrepreneurial milieu indistinct physical, social and economic characteristicslocation natural resources and the landscape, socialcapital, rural governance, exert dynamics and complexinfluence on entrepreneurial activity in rural areas.
Objective of the Study:The main objective of the study is to analyze the role ofAkshayakalpa in the promotion of rural entrepreneurshipand to analyze the training performance and after trainingassistance in Akshayakalpa.
Hypothesis:H1: Financial assistance is the major assistance givenby AkshayakalpaResearch Methodology:The present study concentrates on the promotion oforganic dairy farming in rural areas. Data is collectedfrom both primary and secondary data.
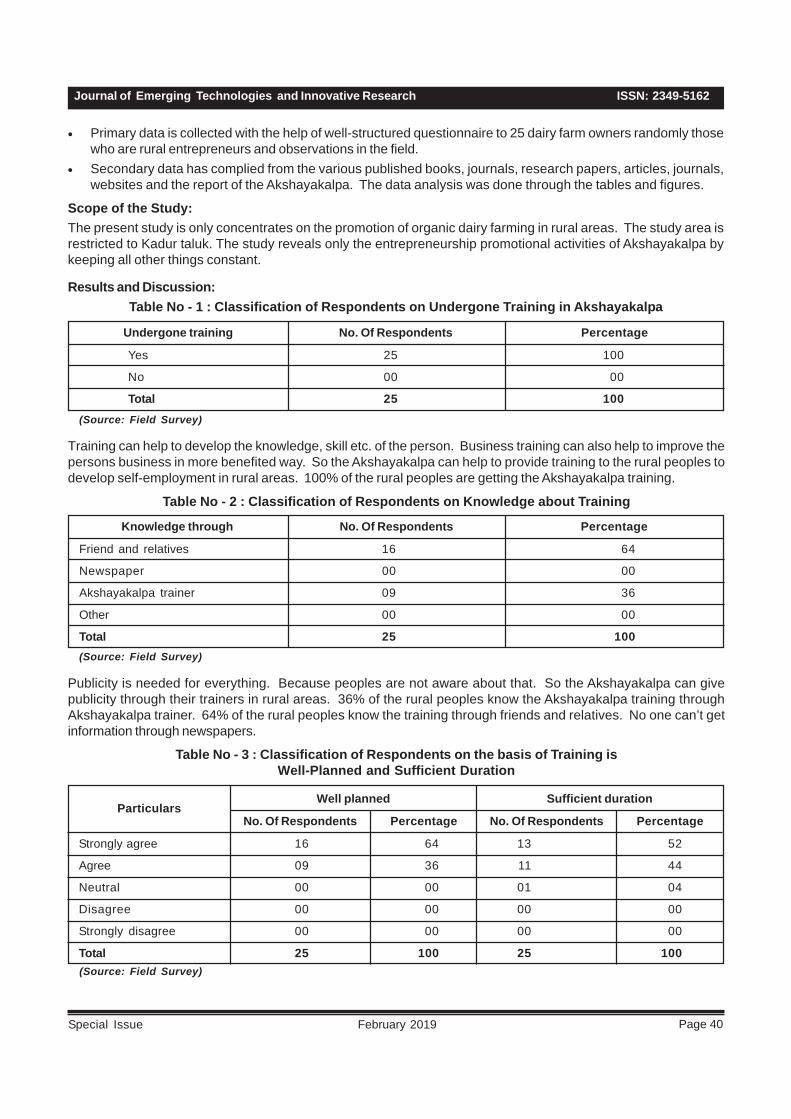
ISSN: 2349-5162Journal of Emerging Technologies and Innovative Research
Page 40February 2019Special Issue
• Primary data is collected with the help of well-structured questionnaire to 25 dairy farm owners randomly thosewho are rural entrepreneurs and observations in the field.
• Secondary data has complied from the various published books, journals, research papers, articles, journals,websites and the report of the Akshayakalpa. The data analysis was done through the tables and figures.
Scope of the Study:The present study is only concentrates on the promotion of organic dairy farming in rural areas. The study area isrestricted to Kadur taluk. The study reveals only the entrepreneurship promotional activities of Akshayakalpa bykeeping all other things constant.
Results and Discussion:Table No - 1 : Classification of Respondents on Undergone Training in Akshayakalpa
(Source: Field Survey)
Training can help to develop the knowledge, skill etc. of the person. Business training can also help to improve thepersons business in more benefited way. So the Akshayakalpa can help to provide training to the rural peoples todevelop self-employment in rural areas. 100% of the rural peoples are getting the Akshayakalpa training.
Table No - 2 : Classification of Respondents on Knowledge about Training
(Source: Field Survey)
Publicity is needed for everything. Because peoples are not aware about that. So the Akshayakalpa can givepublicity through their trainers in rural areas. 36% of the rural peoples know the Akshayakalpa training throughAkshayakalpa trainer. 64% of the rural peoples know the training through friends and relatives. No one can’t getinformation through newspapers.
Table No - 3 : Classification of Respondents on the basis of Training isWell-Planned and Sufficient Duration
Knowledge through
Friend and relatives 16 64
Newspaper 00 00
Akshayakalpa trainer 09 36
Other 00 00
Total 25 100
No. Of Respondents Percentage
Undergone training
Yes 25 100
No 00 00
Total 25 100
No. Of Respondents Percentage
Particulars
Strongly agree 16 64 13 52
Agree 09 36 11 44
Neutral 00 00 01 04
Disagree 00 00 00 00
Strongly disagree 00 00 00 00
Total 25 100 25 100
Well planned Sufficient duration
No. Of Respondents Percentage No. Of Respondents Percentage
(Source: Field Survey)
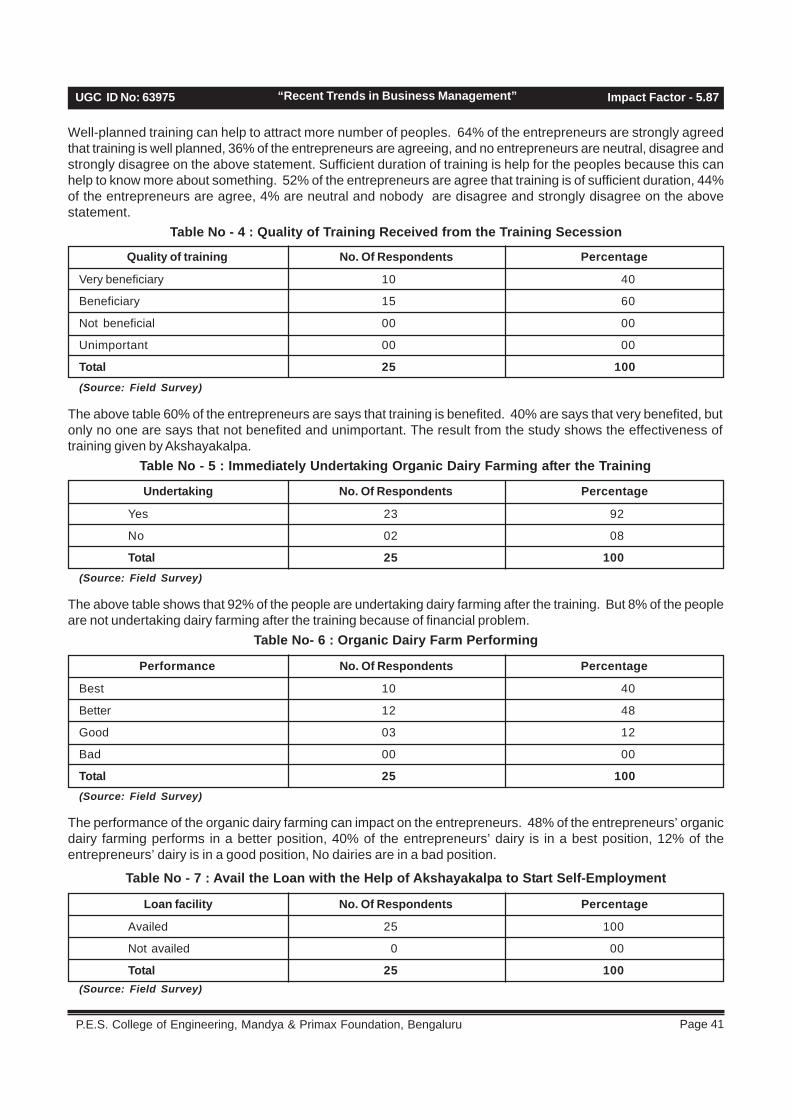
Page 41 P.E.S. College of Engineering, Mandya & Primax Foundation, Bengaluru
UGC ID No: 63975 Impact Factor - 5.87“Recent Trends in Business Management”
Well-planned training can help to attract more number of peoples. 64% of the entrepreneurs are strongly agreedthat training is well planned, 36% of the entrepreneurs are agreeing, and no entrepreneurs are neutral, disagree andstrongly disagree on the above statement. Sufficient duration of training is help for the peoples because this canhelp to know more about something. 52% of the entrepreneurs are agree that training is of sufficient duration, 44%of the entrepreneurs are agree, 4% are neutral and nobody are disagree and strongly disagree on the abovestatement.
Table No - 4 : Quality of Training Received from the Training Secession
Quality of training
Very beneficiary 10 40
Beneficiary 15 60
Not beneficial 00 00
Unimportant 00 00
Total 25 100
No. Of Respondents Percentage
(Source: Field Survey)
The above table 60% of the entrepreneurs are says that training is benefited. 40% are says that very benefited, butonly no one are says that not benefited and unimportant. The result from the study shows the effectiveness oftraining given by Akshayakalpa.
Table No - 5 : Immediately Undertaking Organic Dairy Farming after the Training
Undertaking
Yes 23 92
No 02 08
Total 25 100
No. Of Respondents Percentage
(Source: Field Survey)
The above table shows that 92% of the people are undertaking dairy farming after the training. But 8% of the peopleare not undertaking dairy farming after the training because of financial problem.
Table No- 6 : Organic Dairy Farm Performing
Performance
Best 10 40
Better 12 48
Good 03 12
Bad 00 00
Total 25 100
No. Of Respondents Percentage
(Source: Field Survey)
The performance of the organic dairy farming can impact on the entrepreneurs. 48% of the entrepreneurs’ organicdairy farming performs in a better position, 40% of the entrepreneurs’ dairy is in a best position, 12% of theentrepreneurs’ dairy is in a good position, No dairies are in a bad position.
Table No - 7 : Avail the Loan with the Help of Akshayakalpa to Start Self-Employment
Loan facility
Availed 25 100
Not availed 0 00
Total 25 100
No. Of Respondents Percentage
(Source: Field Survey)
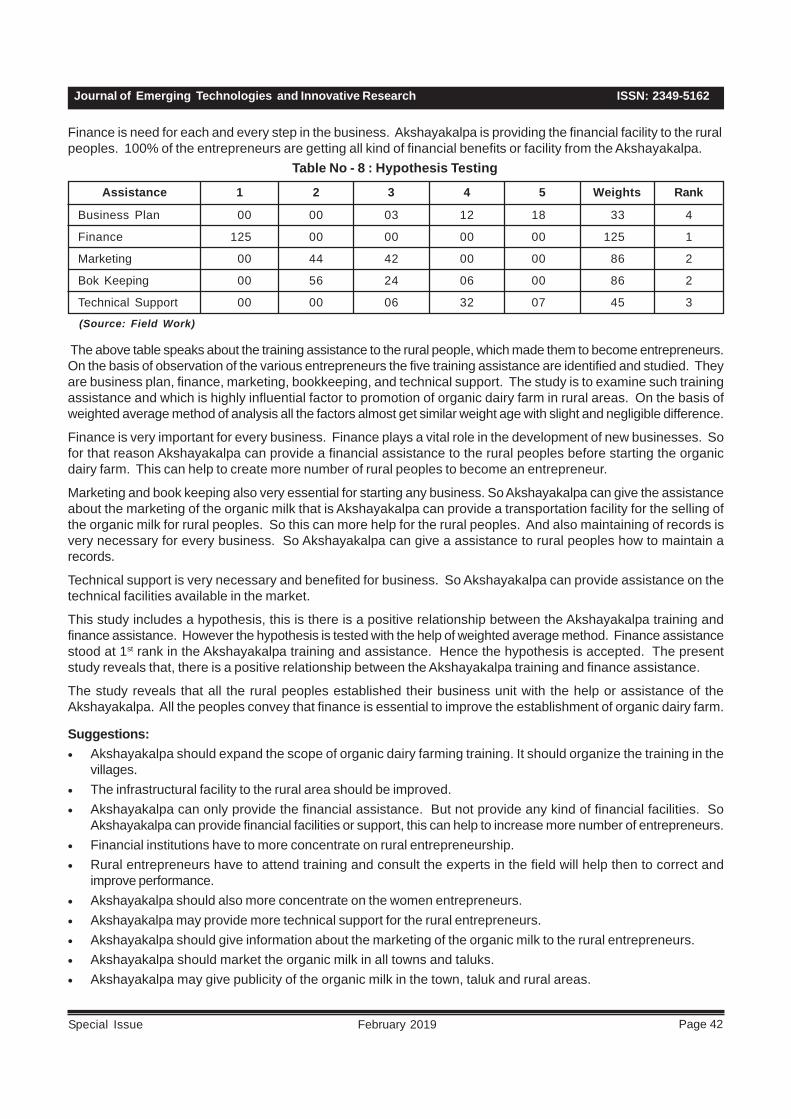
ISSN: 2349-5162Journal of Emerging Technologies and Innovative Research
Page 42February 2019Special Issue
Finance is need for each and every step in the business. Akshayakalpa is providing the financial facility to the ruralpeoples. 100% of the entrepreneurs are getting all kind of financial benefits or facility from the Akshayakalpa.
Table No - 8 : Hypothesis Testing
Assistance
Business Plan 00 00 03 12 18 33 4
Finance 125 00 00 00 00 125 1
Marketing 00 44 42 00 00 86 2
Bok Keeping 00 56 24 06 00 86 2
Technical Support 00 00 06 32 07 45 3
1 Weights Rank2 3 4 5
(Source: Field Work)
The above table speaks about the training assistance to the rural people, which made them to become entrepreneurs.On the basis of observation of the various entrepreneurs the five training assistance are identified and studied. Theyare business plan, finance, marketing, bookkeeping, and technical support. The study is to examine such trainingassistance and which is highly influential factor to promotion of organic dairy farm in rural areas. On the basis ofweighted average method of analysis all the factors almost get similar weight age with slight and negligible difference.
Finance is very important for every business. Finance plays a vital role in the development of new businesses. Sofor that reason Akshayakalpa can provide a financial assistance to the rural peoples before starting the organicdairy farm. This can help to create more number of rural peoples to become an entrepreneur.
Marketing and book keeping also very essential for starting any business. So Akshayakalpa can give the assistanceabout the marketing of the organic milk that is Akshayakalpa can provide a transportation facility for the selling ofthe organic milk for rural peoples. So this can more help for the rural peoples. And also maintaining of records isvery necessary for every business. So Akshayakalpa can give a assistance to rural peoples how to maintain arecords.
Technical support is very necessary and benefited for business. So Akshayakalpa can provide assistance on thetechnical facilities available in the market.
This study includes a hypothesis, this is there is a positive relationship between the Akshayakalpa training andfinance assistance. However the hypothesis is tested with the help of weighted average method. Finance assistancestood at 1st rank in the Akshayakalpa training and assistance. Hence the hypothesis is accepted. The presentstudy reveals that, there is a positive relationship between the Akshayakalpa training and finance assistance.
The study reveals that all the rural peoples established their business unit with the help or assistance of theAkshayakalpa. All the peoples convey that finance is essential to improve the establishment of organic dairy farm.
Suggestions:• Akshayakalpa should expand the scope of organic dairy farming training. It should organize the training in the
villages.• The infrastructural facility to the rural area should be improved.• Akshayakalpa can only provide the financial assistance. But not provide any kind of financial facilities. So
Akshayakalpa can provide financial facilities or support, this can help to increase more number of entrepreneurs.• Financial institutions have to more concentrate on rural entrepreneurship.• Rural entrepreneurs have to attend training and consult the experts in the field will help then to correct and
improve performance.• Akshayakalpa should also more concentrate on the women entrepreneurs.• Akshayakalpa may provide more technical support for the rural entrepreneurs.• Akshayakalpa should give information about the marketing of the organic milk to the rural entrepreneurs.• Akshayakalpa should market the organic milk in all towns and taluks.• Akshayakalpa may give publicity of the organic milk in the town, taluk and rural areas.
Page 43 P.E.S. College of Engineering, Mandya & Primax Foundation, Bengaluru
UGC ID No: 63975 Impact Factor - 5.87“Recent Trends in Business Management”
• Akshayakalpa supports the rural entrepreneursthose who have the land but it should expand itsscope to the other persons who are not have anyland or property. Even though they have morecapacity in doing business compare to thesepersons.
ConclusionRural entrepreneurship eradicates the unemploymentproblem in the rural areas. It also balances theunbalanced regional development. Akshayakalpa is anorganic dairy farm. This can help to develop or increasethe rural entrepreneurs. So for that reason Akshayakalpacan help to give financial assistance to the ruralentrepreneurs before stating their organic dairy farm andalso provide transport and marketing facility for theirorganic milk after starting the dairy farm. However forthat reason in rural areas more number of uneducatedor rural people can start their own dairy farm and becomean entrepreneur.
The main intention or aim of the Akshayakalpa is toincrease the more number of rural entrepreneurs. Hence,Akshayakalpa can more concentrate on the rural areasonly. The main aim of this Akshayakalpa is to marketthe organic milk only. Because to this organic milk wasgood for health. It can be said that they can give trainingto the rural peoples how to produce the organic milkwithout using any chemicals. So Akshayakalpa canhelp to the rural peoples and also the people’s health.
“Akshayakalpa = Organic Milk ““Akshayakalpa = Rural Entrepreneurship “
References:• Kushalakshi, Dr. A.Raghurama: “Rural
Entrepreneurship: A Catalyst for Rural Development”,International Journal of Science and Research (IJSR),ISSN(online) 2319-7064.
• Monika Sharma, Vandana Chaudhary, Rajni Bala andRachan Chauhan “Rural Entrepreneurship inDeveloping Countries: Challenges, Problems andPerformance Appraisal”, Global Journal ofManagement and Business Studies, ISSN 2248-9878, Volume 3, Number 9(2013), pp 1035-1040,Research India Publications.
• Dr. G.Jayabal and Ms. M.Soundarya “Opportunitiesand Challenges of Rural Entrepreneurship in India”,Asia Pacific Journal of Research, ISSN(print) 2320-5504, ISSN(online) 2347-4793.
• Jayadatta S. “Major Challenges and Problems ofRural Entrepreneurship in India”, IOSR Journal ofBusiness and Management (IOSR-JBM), e-ISSN2278-487X, p-ISSN 2319-7668, Volume 19, Issue 9(September 2017).
• Mansi Paul1 and Achla Shama “ Entrepreneurshipas a Tool for Rural development”, Global Journal ofManagement and Business Studies, ISSN 2248-9878, Volume 3, Number 3(2013), pp 319-332.
• D.Joel Jobadurai “An Overview of Problems of Ruralentrepreneurs in India”, International Journal ofAdvanced Research in Management and Socialscience, ISSN 2278-6236, Volume 2, Number 7, July2013.
• S. Moghana Lavanya, S. Hemalatha and V.M.Indumathi “ Perspectives of Rural Entrepreneurshipin India”, Journal of Management Research, ISSN2347-4270, Volume 3, Issue 1, October 2014.
• Ms.Manpreet Kaus, Mr. Jagreet Singh Gill “A Reviewof Rural Entrepreneurs Challenges in India”,International Journal of Business Management ISSN2349-3409, Volume 2(2), 2015.
ISSN: 2349-5162Journal of Emerging Technologies and Innovative Research
Page 44February 2019Special Issue
INTEGRATION OF COMMODITIES MARKET:THE CASE OF INDIA AND US
1. Assistant Professor, Department of Management Studies, CHRIST (Deemed to be University), Bengaluru.2. Assistant Professor, Department of Business Administration, Government First Grade College, Krishnarajapete,
Mandya
AbstractIn the modern era of Globalization, Privatization and Liberalization, the world markets are integrated and the threemajor economic activates (Investment, production and consumption) are highly globalized. It is obvious that theglobal commodity prices influence the domestic prices to a great extent. Study investigates the integration of theIndian commodity market with the US commodity market using four selected commodities namely copper, crude oil,natural gas and silver. The study used cointegration test to analyse the relationship within and between Indian and UScommodities. Overall the study found existence of cointegration relationship between Indian Silver and US SliverCommodity. Further, the study found existence of cointegration relationship between Indian Natural Gas and USNatural Gas. Whereas the study found no cointegration between Indian Copper and US Copper. Further, the studyfound no cointegration between Indian Crude Oil and US Crude Oil. Even the study found cointegration relationshipwithin Indian commodities and US commodities respectively.
Keywords: Globalization, Commodity Markets and Cointegrattion
Dr. Manu K.S1
Introduction In the present era of globalization most of the marketsare becoming global and are vibrant and transparent inintegrating with each other. Due to the emergence ofcommodity futures market, risk can now be mitigated.Many of the world’s largest emerging markets like Indiaare leading producers and consumers of variouscommodities. As a result, its business cycle tends tobe highly dependent on fluctuations in the global pricesof commodities. As global markets are stronglyintegrated and interdependent, many global factors whichinfluence the Indian commodity markets and commodityprices.
The development of commodity market has a dramaticeconomic impact. Over the years, the exchanges helpedto shape the changes and improvements intransportation and financing which led to internationaltrade. The study investigates the integration of Indiancommodity market with US commodity market usingfour selected commodities, namely copper, crude oil,natural gas and silver. The integration between the twomarkets are examined mainly to study the integrationof the selected commodities, consumption and theexchange rates affecting the USD-INR volatility. Sincethe mid-1980s, there’s been a slight positive correlationbetween growth and commodity prices.
Crude oil prices are expected to average $53 per barrel(bbl) in 2017 and Metals prices are expected to surge22 percent in 2017 due to strong demand and supply
Raghu H.N2
constraints (Commodity Markets Outlook Oct 2017). Theglobal growth rate for 2017 has risen slightly sincecommodity prices are on a stability streak. The Indiancommodity futures market grew by 38 per cent in 2008,41 per cent in 2009, and by 51 per cent between Januaryand October 2010, in comparison with the correspondingperiod of the previous year. The commodity futurestrading volumes, taken as a whole, have risen at acompounded annual growth rate of 97.9 per centbetween 2003-4 and 2009-10.
Manisha Dey (2017) pointed out that India import 3/4th
its India’s oil requirements from foreign countries andother components like gold and silver (12% of the totalimports), machinery (10%), electronic goods (7%),pearls, and precious and non-precious stones (5%). MCXcopper futures have near 98.20 per cent correlation withLondon Metal Exchange (LME) copper prices. Indianmetals and energy futures also have a higher intradaycorrelation with global futures (Business Line). Theuncertainty behaviour of the commodities market andevidence of interlinkage of global commodities. Thismade the cross border investors to consider theinterlinkage of global commodity markets. This studyshall help investors in making investment decisions andintegration of Indian commodity market with UScommodity market.
Literature ReviewPatanè1 et al (2017) found significant possible long termand short term relationship among Gold, Oil and EUR/
Page 45 P.E.S. College of Engineering, Mandya & Primax Foundation, Bengaluru
UGC ID No: 63975 Impact Factor - 5.87“Recent Trends in Business Management”
USD exchange rate. Zhang and Tu (2016) found impactof global oil price shocks on the Chinese metal markets.Reboredo et al. (2014) found that there is a weak negativerelationship between oil prices and major currencies’(dollar, euro, Australian dollar, British pound, Canadiandollar, etc.). Brajesh Kumar and Ajay Pandey (2011)found that energy commodities traded at MCX andNYMEX and of industrial metals traded at MCX and theLondon Metal Exchange (LME) are cointegrated. Authorsfound unidirectional causality running from global marketsto Indian markets. Popli and Singh (2012) found that thecommodity futures market were volatile to a great extentin UK, USA and India. Acharya et al. (2012) find no cointegration between domestic and international riceprices. Report (2010) focuses on the significance offutures market as instruments for risk management andstrengthening the capacity of exchanges and regulatorsto ensure efficient performance of these markets. Rajmaland Mishra (2009) found out that the fall and rise ofinternational prices are transmitted from internationalmarket to domestic market in an open trade environment.Kedarnath and Mukherjee (2008) found that there are nomajor changes in spot prices post futures period for basicand essential commodities.
International Bank (2008) pointed out that factors likeweak USD, price stabilization policies and domesticinfrastructure there is a rise in domestic prices withrespect to global prices.. Jha et al. (2005) found that themarket integration was far off for India due to excessivegovernment interference. Murry and Zhu (2004)investigated the impact of the introduction and exit ofEnron Online (EOL) on the efficiency of the U.S. naturalgas market. Using a conventional EGARCH model, hefound little evidence that the introduction of EOLcoincided with the reduction in the market price volatility.Chen and Firth (2004) analyzed the relationship betweenreturn and trading volume of four commodity futures inChina, by using correlation and Granger causality test.They found no correlation between return and volume,but signify the causality from trading volume and return,vice versa.
Objectives of the study:1. To assess the relationship among the selected
commodities of India and USA.2. To analyse the cointegrating relationship between
the selected Indian and US commodities.
Hypothesis:Hoa : The price series of all the selected commodities
of India and US have unit root.Hob : There is no integration of Indian commodity market
with the US commodity market.
H0c : There is no cointegration relationship among theselected commodities of India.
H0d : There is no cointegration relationship among theselected commodities of USA.
Research MethodologyData: The study used monthly closing prices of crudeoil, copper, natural gas and silver. Crude oil prices arefor per barrel, copper prices are for per pound, naturalgas process are for per mmbtu and silver prices are forper troy ounce.Period of Study: Monthly closing prices of all the fourcommodities are collected for the period of 120 monthsfrom January 2008- December 2017.Sources of Data: Monthly data of all the fourcommodities are collected from www.investing.com
Analytical Tools:Augmented Dickey-Fuller Test: The study usedAugmented Dickey-Fuller test statistic to verify thewhether there price series is stationary or not.
Johansen Cointegration Test: Since, all the selectedIndian and USA commodities are non-stationary at levelbut stationary at first order difference, the study usedCointegration test to check whether there exists acointegration among and between the two countries’commodity markets.
The cointegration equations are as follows
Δtr = ν + Πyr - 1 + Γi Δyt - i + et∑P - 1
i = 1
λtrace (r) = - T ∑n
i = r + 11n (1 - λ)
λmax = - T log (1 - λr + 1)
λi is the ith largest eigenvalue of cointegration matrix ∏and T is the number of observations. Trace test, nullhypothesis says that number of distinct cointegrationvectors (r = r1<k) and alyernative hypothesis says that(r=k). Eigen value test statistics, null hypothesis saysthat number of distinct cointegration vectors (r = r1<k)and alyernative hypothesis says that (r = r1 +1).
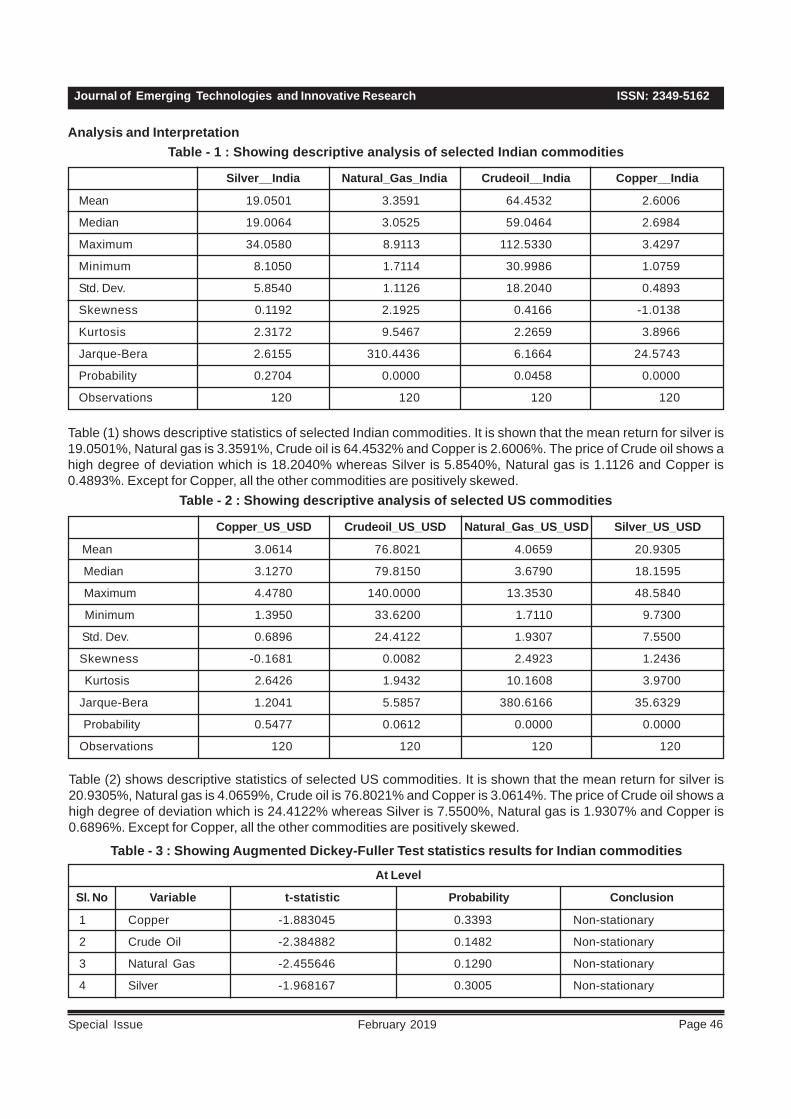
ISSN: 2349-5162Journal of Emerging Technologies and Innovative Research
Page 46February 2019Special Issue
Analysis and InterpretationTable - 1 : Showing descriptive analysis of selected Indian commodities
Mean 19.0501 3.3591 64.4532 2.6006
Median 19.0064 3.0525 59.0464 2.6984
Maximum 34.0580 8.9113 112.5330 3.4297
Minimum 8.1050 1.7114 30.9986 1.0759
Std. Dev. 5.8540 1.1126 18.2040 0.4893
Skewness 0.1192 2.1925 0.4166 -1.0138
Kurtosis 2.3172 9.5467 2.2659 3.8966
Jarque-Bera 2.6155 310.4436 6.1664 24.5743
Probability 0.2704 0.0000 0.0458 0.0000
Observations 120 120 120 120
Silver__India Natural_Gas_India Crudeoil__India Copper__India
Table (1) shows descriptive statistics of selected Indian commodities. It is shown that the mean return for silver is19.0501%, Natural gas is 3.3591%, Crude oil is 64.4532% and Copper is 2.6006%. The price of Crude oil shows ahigh degree of deviation which is 18.2040% whereas Silver is 5.8540%, Natural gas is 1.1126 and Copper is0.4893%. Except for Copper, all the other commodities are positively skewed.
Table - 2 : Showing descriptive analysis of selected US commodities
Mean 3.0614 76.8021 4.0659 20.9305
Median 3.1270 79.8150 3.6790 18.1595
Maximum 4.4780 140.0000 13.3530 48.5840
Minimum 1.3950 33.6200 1.7110 9.7300
Std. Dev. 0.6896 24.4122 1.9307 7.5500
Skewness -0.1681 0.0082 2.4923 1.2436
Kurtosis 2.6426 1.9432 10.1608 3.9700
Jarque-Bera 1.2041 5.5857 380.6166 35.6329
Probability 0.5477 0.0612 0.0000 0.0000
Observations 120 120 120 120
Copper_US_USD Crudeoil_US_USD Natural_Gas_US_USD Silver_US_USD
Table (2) shows descriptive statistics of selected US commodities. It is shown that the mean return for silver is20.9305%, Natural gas is 4.0659%, Crude oil is 76.8021% and Copper is 3.0614%. The price of Crude oil shows ahigh degree of deviation which is 24.4122% whereas Silver is 7.5500%, Natural gas is 1.9307% and Copper is0.6896%. Except for Copper, all the other commodities are positively skewed.
Table - 3 : Showing Augmented Dickey-Fuller Test statistics results for Indian commodities
Sl. No
1 Copper -1.883045 0.3393 Non-stationary
2 Crude Oil -2.384882 0.1482 Non-stationary
3 Natural Gas -2.455646 0.1290 Non-stationary
4 Silver -1.968167 0.3005 Non-stationary
t-statistic Probability ConclusionVariable
At Level
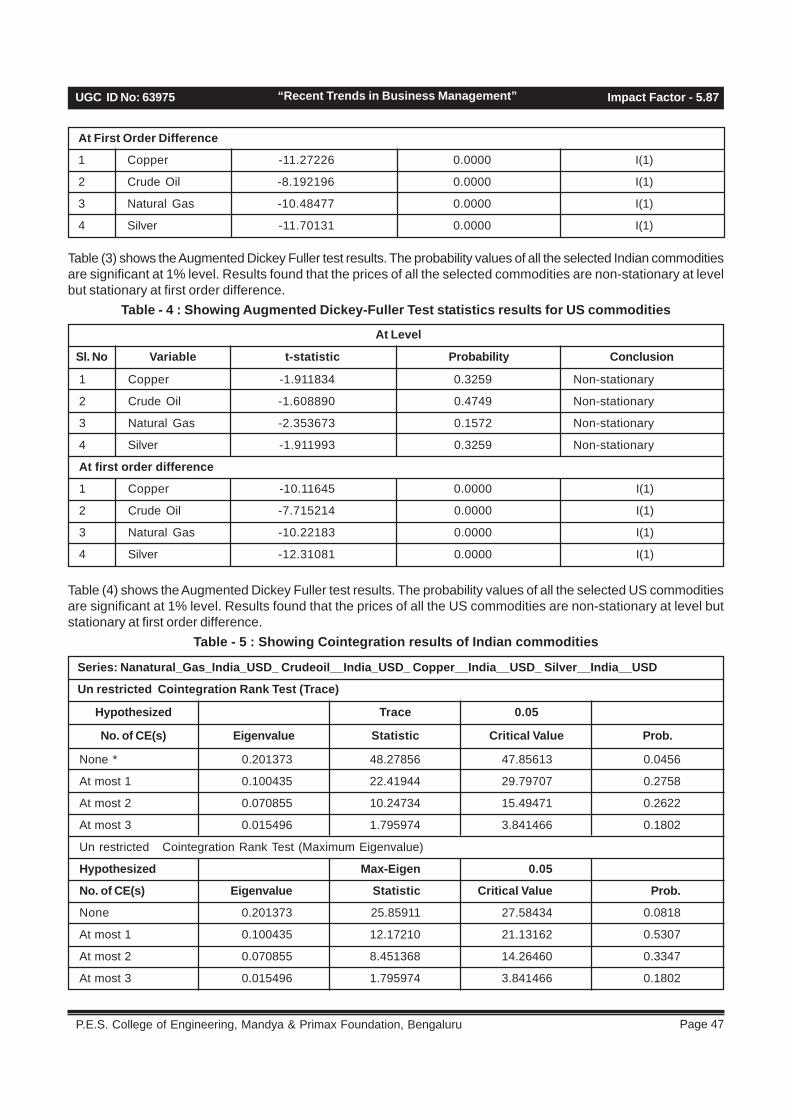
Page 47 P.E.S. College of Engineering, Mandya & Primax Foundation, Bengaluru
UGC ID No: 63975 Impact Factor - 5.87“Recent Trends in Business Management”
At First Order Difference
1 Copper -11.27226 0.0000 I(1)
2 Crude Oil -8.192196 0.0000 I(1)
3 Natural Gas -10.48477 0.0000 I(1)
4 Silver -11.70131 0.0000 I(1)
Table (3) shows the Augmented Dickey Fuller test results. The probability values of all the selected Indian commoditiesare significant at 1% level. Results found that the prices of all the selected commodities are non-stationary at levelbut stationary at first order difference.
Table - 4 : Showing Augmented Dickey-Fuller Test statistics results for US commodities
Sl. No
1 Copper -1.911834 0.3259 Non-stationary
2 Crude Oil -1.608890 0.4749 Non-stationary
3 Natural Gas -2.353673 0.1572 Non-stationary
4 Silver -1.911993 0.3259 Non-stationary
At first order difference
1 Copper -10.11645 0.0000 I(1)
2 Crude Oil -7.715214 0.0000 I(1)
3 Natural Gas -10.22183 0.0000 I(1)
4 Silver -12.31081 0.0000 I(1)
t-statistic Probability ConclusionVariable
At Level
Table (4) shows the Augmented Dickey Fuller test results. The probability values of all the selected US commoditiesare significant at 1% level. Results found that the prices of all the US commodities are non-stationary at level butstationary at first order difference.
Table - 5 : Showing Cointegration results of Indian commodities
None * 0.201373 48.27856 47.85613 0.0456
At most 1 0.100435 22.41944 29.79707 0.2758
At most 2 0.070855 10.24734 15.49471 0.2622
At most 3 0.015496 1.795974 3.841466 0.1802
Un restricted Cointegration Rank Test (Maximum Eigenvalue)
Hypothesized Max-Eigen 0.05
No. of CE(s) Eigenvalue Statistic Critical Value Prob.
None 0.201373 25.85911 27.58434 0.0818
At most 1 0.100435 12.17210 21.13162 0.5307
At most 2 0.070855 8.451368 14.26460 0.3347
At most 3 0.015496 1.795974 3.841466 0.1802
Series: Nanatural_Gas_India_USD_ Crudeoil__India_USD_ Copper__India__USD_ Silver__India__USD
Un restricted Cointegration Rank Test (Trace)
Eigenvalue Statistic Critical Value Prob.No. of CE(s)
Trace 0.05Hypothesized

ISSN: 2349-5162Journal of Emerging Technologies and Innovative Research
Page 48February 2019Special Issue
Table (5) clearly shows the trace test results. It clearly indicates selected Indian commodities have one Cointegrationequation and interdependent.
Table - 6 : Showing Cointegration results of US commodities
None 0.267651 64.54539 47.85613 0.0007
At most 1 0.130897 28.72310 29.79707 0.0661
At most 2 0.072212 12.58938 15.49471 0.1308
At most 3 0.033932 3.969879 3.841466 0.0463
Un restricted Cointegration Rank Test (Maximum Eigenvalue)
Hypothesized Max-Eigen 0.05
No. of CE(s) Eigenvalue Statistic Critical Value Prob
None 0.267651 35.82229 27.58434 0.0035
At most 1 0.130897 16.13372 21.13162 0.2171
At most 2 0.072212 8.619499 14.26460 0.3192
At most 3 0.033932 3.969879 3.841466 0.0463
Series: S Silver_Us_USD_ Natural_Gas_US_USD_ Crudeoil_US_USD_ Copper_US_USD
Un restricted Cointegration Rank Test (Trace)
Eigenvalue Statistic Critical Value Prob.No. of CE(s)
Trace 0.05Hypothesized
Table (6) clearly shows the trace test and eigenvalue results. Both the test results clearly indicate selected UScommodities have one Cointegration equation and interdependent.
Table - 7 : Cointegration results for Indian Silver and US Sliver Commodity
None 0.090816 14.93757 15.49471 0.0605
At most 1 0.034089 3.988618 3.841466 0.0458
Cointegration Rank Test (Maximum Eigenvalue)
Hypothesized Max-Eigen 0.05
No. of CE(s) Eigenvalue Statistic Critical Value Prob
None 0.090816 10.94895 14.26460 0.1568
At most 1 0.034089 3.988618 3.841466 0.0458
Series: SI Silver_US_USD_ Silver__INDIA__USD
Un restricted Cointegration Rank Test (Trace)
Eigenvalue Statistic Critical Value Prob.No. of CE(s)
Trace 0.05Hypothesized
Table (7) clearly shows the trace test and eigenvalue results. Both the test results clearly indicate Indian Silver andUS Sliver Commodity are highly cointegrated and interdependent
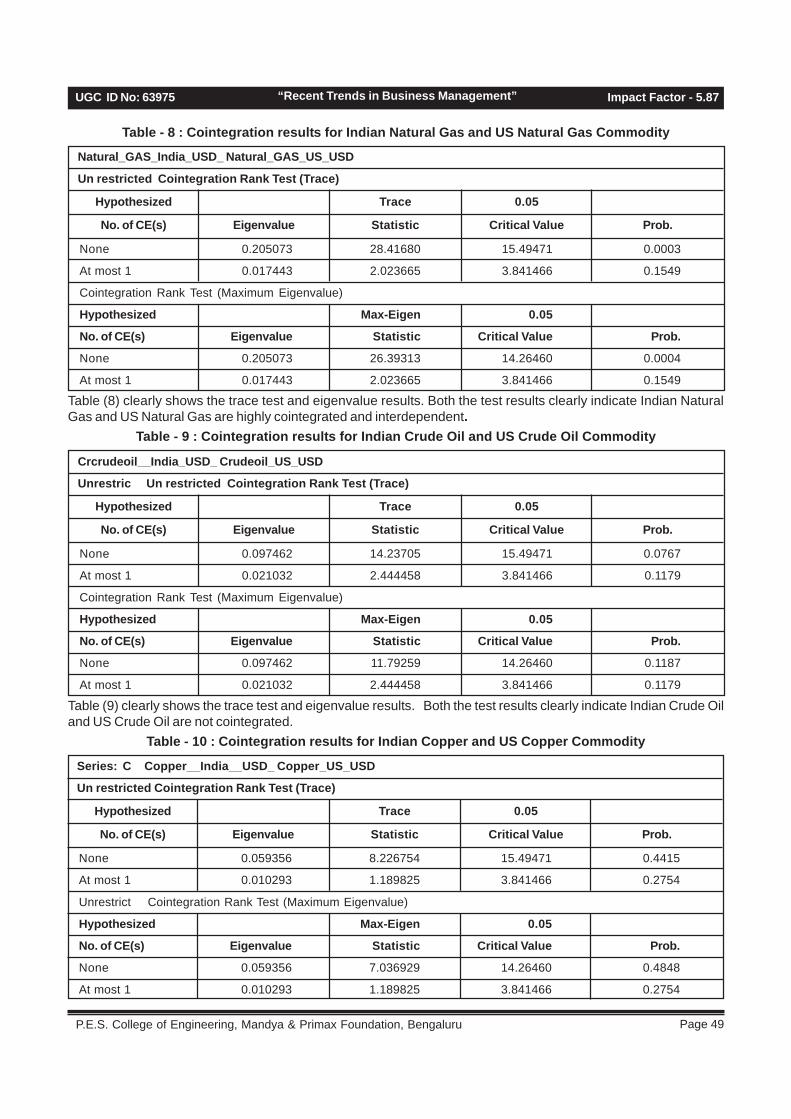
Page 49 P.E.S. College of Engineering, Mandya & Primax Foundation, Bengaluru
UGC ID No: 63975 Impact Factor - 5.87“Recent Trends in Business Management”
None 0.205073 28.41680 15.49471 0.0003
At most 1 0.017443 2.023665 3.841466 0.1549
Cointegration Rank Test (Maximum Eigenvalue)
Hypothesized Max-Eigen 0.05
No. of CE(s) Eigenvalue Statistic Critical Value Prob.
None 0.205073 26.39313 14.26460 0.0004
At most 1 0.017443 2.023665 3.841466 0.1549
Natural_GAS_India_USD_ Natural_GAS_US_USD
Un restricted Cointegration Rank Test (Trace)
Eigenvalue Statistic Critical Value Prob.No. of CE(s)
Trace 0.05Hypothesized
Table - 8 : Cointegration results for Indian Natural Gas and US Natural Gas Commodity
Table (8) clearly shows the trace test and eigenvalue results. Both the test results clearly indicate Indian NaturalGas and US Natural Gas are highly cointegrated and interdependent.
Table - 9 : Cointegration results for Indian Crude Oil and US Crude Oil Commodity
None 0.097462 14.23705 15.49471 0.0767
At most 1 0.021032 2.444458 3.841466 0.1179
Cointegration Rank Test (Maximum Eigenvalue)
Hypothesized Max-Eigen 0.05
No. of CE(s) Eigenvalue Statistic Critical Value Prob.
None 0.097462 11.79259 14.26460 0.1187
At most 1 0.021032 2.444458 3.841466 0.1179
Crcrudeoil__India_USD_ Crudeoil_US_USD
Unrestric Un restricted Cointegration Rank Test (Trace)
Eigenvalue Statistic Critical Value Prob.No. of CE(s)
Trace 0.05Hypothesized
Table (9) clearly shows the trace test and eigenvalue results. Both the test results clearly indicate Indian Crude Oiland US Crude Oil are not cointegrated.
Table - 10 : Cointegration results for Indian Copper and US Copper Commodity
None 0.059356 8.226754 15.49471 0.4415
At most 1 0.010293 1.189825 3.841466 0.2754
Unrestrict Cointegration Rank Test (Maximum Eigenvalue)
Hypothesized Max-Eigen 0.05
No. of CE(s) Eigenvalue Statistic Critical Value Prob.
None 0.059356 7.036929 14.26460 0.4848
At most 1 0.010293 1.189825 3.841466 0.2754
Series: C Copper__India__USD_ Copper_US_USD
Un restricted Cointegration Rank Test (Trace)
Eigenvalue Statistic Critical Value Prob.No. of CE(s)
Trace 0.05Hypothesized

ISSN: 2349-5162Journal of Emerging Technologies and Innovative Research
Page 50February 2019Special Issue
Table (10) clearly shows the trace test and eigenvalue results. Both the test results clearly indicate Indian Copperand US Copper Commodity are not cointegrated.
Fig. 1 : Shows the price movements of selected Indian commodities
0
20
40
60
80
100
120
140
160
2008 2009 2010 2011 2012 2013 2014 2015 2016 2017
CRUDEOIL (USD)SILVER (USD)
COPPER (USD)NATURAL GAS (USD)
Fig. 2 : Shows the price movements of selected US commodities
0
40
80
120
160
200
2008 2009 2010 2011 2012 2013 2014 2015 2016 2017
COPPER (USD)SILVER (USD)
NATURALGAS (USD)CRUDEOIL (USD)
Fig. 3 : Shows the price movements of Indian and US Copper Commodity.
1
2
3
4
5
6
7
8
2008 2009 2010 2011 2012 2013 2014 2015 2016 2017
COPPER (USD)_INDIA COPPER (USD)_US
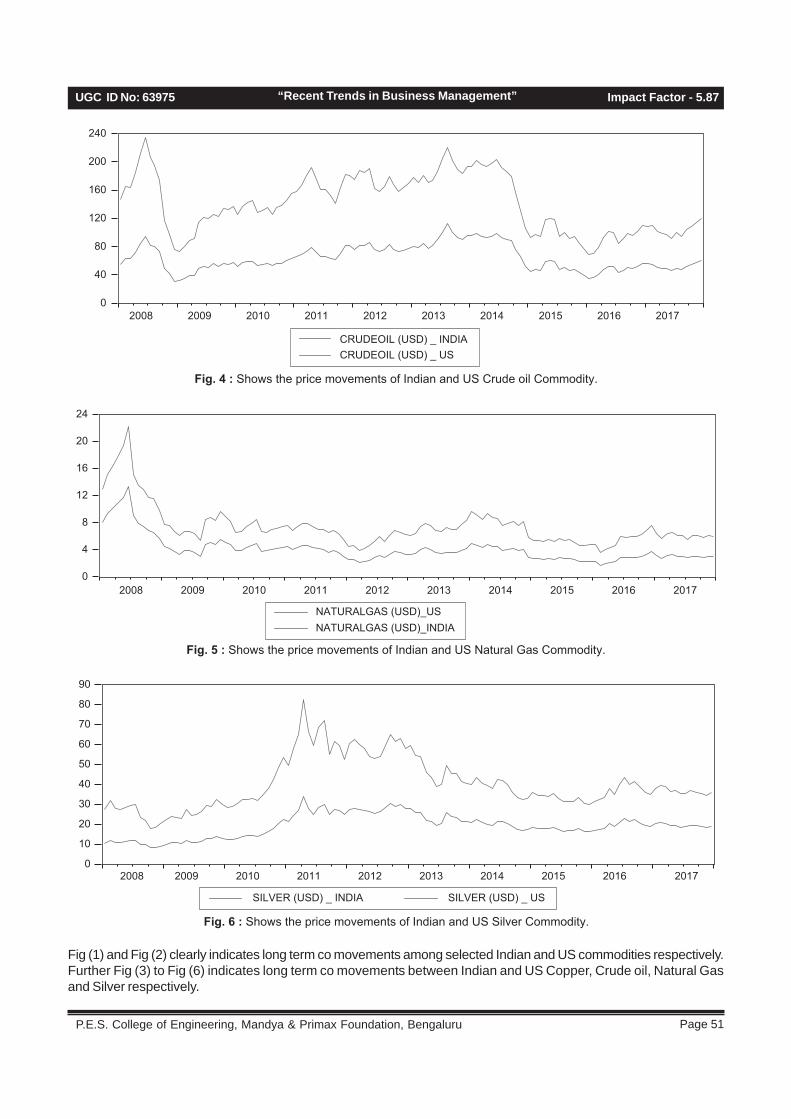
Page 51 P.E.S. College of Engineering, Mandya & Primax Foundation, Bengaluru
UGC ID No: 63975 Impact Factor - 5.87“Recent Trends in Business Management”
Fig. 4 : Shows the price movements of Indian and US Crude oil Commodity.
0
40
80
120
160
200
240
2008 2009 2010 2011 2012 2013 2014 2015 2016 2017
CRUDEOIL (USD) _ USCRUDEOIL (USD) _ INDIA
Fig. 5 : Shows the price movements of Indian and US Natural Gas Commodity.
0
4
8
12
16
20
24
2008 2009 2010 2011 2012 2013 2014 2015 2016 2017
NATURALGAS (USD)_INDIANATURALGAS (USD)_US
Fig. 6 : Shows the price movements of Indian and US Silver Commodity.
0
10
20
30
40
50
60
70
80
90
2008 2009 2010 2011 2012 2013 2014 2015 2016 2017
SILVER (USD) _ INDIA SILVER (USD) _ US
Fig (1) and Fig (2) clearly indicates long term co movements among selected Indian and US commodities respectively.Further Fig (3) to Fig (6) indicates long term co movements between Indian and US Copper, Crude oil, Natural Gasand Silver respectively.
ISSN: 2349-5162Journal of Emerging Technologies and Innovative Research
Page 52February 2019Special Issue
ConclusionThe study pertains to assess and analyse the integrationof Indian commodities market with US commoditiesmarket using four selected commodities. The study usedCointegration Test. Overall the study found cointegrationrelationship between Indian Silver and US SliverCommodity. Further, the study found cointegrationrelationship between Indian Natural Gas and US NaturalGas. Whereas, the study found no cointegration betweenIndian Copper and US Copper. Further, the study foundno cointegration relationship between Indian Crude Oiland US Crude Oil. Even the study found cointegrationrelationship within selected Indian commodities and UScommodities respectively. The global commodity marketinvestors, policy makers can consider the movementsof these commodities to take trading and investmentdecisions.
References1. Acharya, S.S., Chand, R. Birthal, P.S. Shiv Kumar
and Negi, D.S., (2012), “Market Integration and PriceTransmission in India: A Case of Rice and Wheatwith Special Reference to the InternationalAgriculture Crisis of 2007/08”.
2. Brajesh Kumar and Ajay Pandey (2011), InternationalLinkages of the Indian Commodity Futures Markets,Modern Economy, 2, 213-227
3. Chen, G., Firth, M., & Xin, Y. (2004), “The price-volume relationship in China’s commodity futuresmarkets. The Chinese Economy” 37(3), 87–122.
4. Commodity Markets Outlook (October 2017),retrieved from http://pubdocs.worldbank.org/en/743431507927822505/CMO-October-2017-Full-Report.pdf
5. Correlation between Indian and global comexes,Business Line Retrieved from https://www. theh indubus iness l ine.com/markets /commodities/Correlation-between-Indian-and-global-comexes/article20848913.ece
6. Dutta & Hasib Noor, (2017), “Oil and non-energycommodity markets: An empirical analysis ofvolatility spill overs and hedging effectiveness”,Cogent Economics & Finance, 5 , 1-15
7. Kedarnath, M. (2008), “Impact of future trading onIndian agricultural commodity market”. Retrieved fromhttp://ssrn.com/abstract=1763910 (30 September2012).
8. Gupta and Ravi , “Commodity Futures MarketEfficiency in India and Inflationary Impacts”, WorkingPaper, 2013
9. Manisha Dey (2017), Study In Copper Price LinkageBetween International And Indian CommodityMarket, International Journal on Recent Trends inBusiness and Tourism, 1(3), 49-53.
10. Michele Patanè1, Mattia Tedesco1, Stefano Zedda( 2017), “Dynamic Relationship of CommoditiesPrices and EUR/USD Exchange Rate Trends in theRecent Past” , Modern Economy, 8, 995-1004
11. Murry D and Zhu Z (2004), “Enron Online andInformational Efficiency in the US Natural GasMarket”, The Energy Journal, Vol 25, No. 2, 2004
12. Popli, G. S., & Singh, S. (2012), “Commoditymarkets challenges and arbitrage opportunities – aninsight into commodity trading business in India”,Retrieved from http://ssrn.com/abstract=2084082.
13. Rajmal, M. and Mishra, S., (2009) “Transmissionfrom International Agriculture Prices to DomesticAgriculture Prices – The Indian Evidence. ReserveBank of India, Department of Economic Analysis andPolicy”, Working Paper, 6.
14. Reboredo, J.C., Rivera-Castro, M.A., Gilney F.Zebende, 2014, “Oil and US dollar exchange ratedependence: A detrended cross-correlationapproach, Energy Economics”, 42, 132–139.
15. UNCTAD, 2010a, “Recent Commodity MarketDevelopments: Trends and Challenges, 12, Geneva”,TD/B/C.1/MEM.2/7.
Page 53 P.E.S. College of Engineering, Mandya & Primax Foundation, Bengaluru
UGC ID No: 63975 Impact Factor - 5.87“Recent Trends in Business Management”
THE IMPACT OF DEBT-EQUITY PROPORTION ON PROFITABILITYOF SELECTED PHARMACEUTICAL COMPANIES OF INDIA
1. Ph.D Research Scholar,PG Department of Business Management,Fakir Mohan University, Balasore, Odisha.2. PG Department of Business Management,Fakir Mohan University, Balasore, Odisha.
Abstract
The most favorable combination of debt and equity capital plays a vital role in achieving objective of investors of theorganization. It has been necessary for the organizations to compute the impact of debt and equity on profitabilitywhich influences their capital structure decision making to achieve the organizational objectives. Identifying theappropriate proportion of debt and equity of capital structure which can bring profitable results for the organizations isdifficult. There is a continuous research on company financing activities is going on, mostly aimed at consideringapplication and sources of finance.This paper investigates the impact of debt equity mix on profitability of selectedPharmaceutical companies through DuPont Analysis. Based on the market capitalization, top five pharmaceuticalcompanies listed in BSE have been chosen i.e. Sun Pharmaceuticals, Lupin, Dr. Reddy’s Labs, Cipla and AurobindoPharma. Financial data of companies over a period of 5 years from 2012-13 to 2016-2017 is collected. This study alsoattempts to make an intra company analysis with the objective to determine the importance of debt-equity mix forbetter profitability. The study is exploratory to analyse the capital structure decisions of these pharmaceutical companiesand analyzed with the help of DuPont ratio, pecking order theory and trade off theory. The paper mainly aims toanalyse whether there is an impact of debt capital on increase of fixed assets and therefore those assets result inhigher profitability.The paper shows the impact of capital structure on profitability of pharmaceutical companiesacross market capitalizations. Companies have to tradeoff between the tax benefits of debt and bankruptcy costs foran optimal capital structure which shows appropriate growth prospect, maintain solvency and give good return tostakeholders.
Keywords: Capital Structure, Pecking Order Theory, Return on Equity, Trade off Theory, Profitability
Payal Pattnayak1
IntroductionCapital structure is the mix of long term securities knownas debt and equity i.e., the proportion of debt and equityin the capital structure of a firm. As the preference sharesare not the key source of capital for companies of India,this study is limited to analyse the firm’s capital structurein relation to debt equity mix. To maximize the wealth ofthe shareholders and to minimize the cost of capital,capital structure of companies differs. A capital structureshould be ideal which gives maximum benefit to theowner of the business. There are two kinds of capitalstructure- levered and unlevered. The capital structurewhich uses debt funds are known as levered and thecapital structure which uses only owner’s funds areknown as unlevered. Levered capital structure is riskybut provides more benefit to the owners whereasunlevered capital structure is riskless but provides lessbenefit to the owners.
Decisions related to capital structure are considered tobe one of the most critical decisions of a company as ithas a direct impact on the sustainability of the company.More of debt poses the threat of bankruptcy and moreof equity reduces the profitability of the company. Severaltheories have been projected and lot of research has
been done in the view of capital structure decisions. Thechoice of capital structure decision depends on variousfactors such as nature of business, purpose and periodof financing, market environment, control andmanagement, types of the investors, etc. So, none ofthe research or theory has been able to provide accuraterationalization to show factors affecting the capitalstructure decisions.
A number of studies on capital structure have been donein developed countries. But in the developing countrieslike India the area of capital structure is still to be fullyexplored. Hence it is essential for us to know theimportance of capital structure decisions.
In this paper, the most blooming sector of Indianeconomy, i.e., pharmaceutical sector has been chosento study the decisions related to capital structure. Thepaper mainly intends to analyse the impact of debtcapital on procurement of fixed assets and as a resultthose assets resulting in higher output and higher profit.
Pharmaceutical Sector in IndiaIn India many research have been conducted on capitalstructure decisions but there are only few studies which
Prof. Devi Prasad Misra2
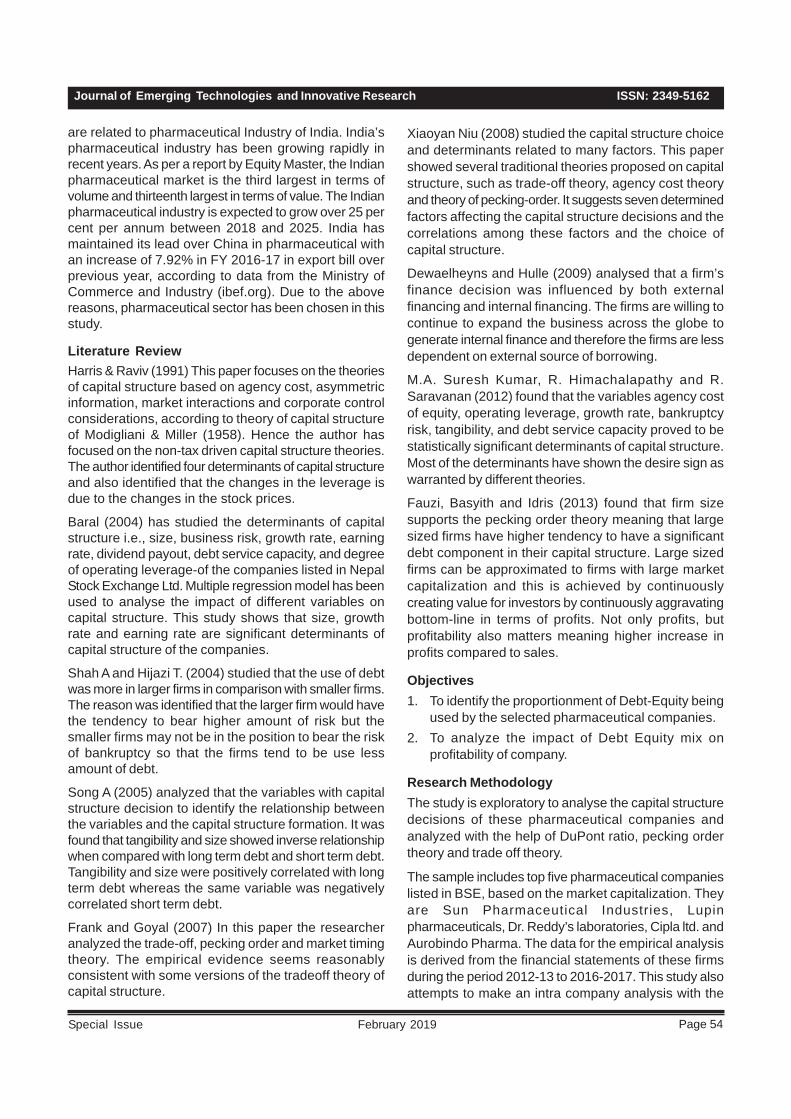
ISSN: 2349-5162Journal of Emerging Technologies and Innovative Research
Page 54February 2019Special Issue
are related to pharmaceutical Industry of India. India’spharmaceutical industry has been growing rapidly inrecent years. As per a report by Equity Master, the Indianpharmaceutical market is the third largest in terms ofvolume and thirteenth largest in terms of value. The Indianpharmaceutical industry is expected to grow over 25 percent per annum between 2018 and 2025. India hasmaintained its lead over China in pharmaceutical withan increase of 7.92% in FY 2016-17 in export bill overprevious year, according to data from the Ministry ofCommerce and Industry (ibef.org). Due to the abovereasons, pharmaceutical sector has been chosen in thisstudy.
Literature ReviewHarris & Raviv (1991) This paper focuses on the theoriesof capital structure based on agency cost, asymmetricinformation, market interactions and corporate controlconsiderations, according to theory of capital structureof Modigliani & Miller (1958). Hence the author hasfocused on the non-tax driven capital structure theories.The author identified four determinants of capital structureand also identified that the changes in the leverage isdue to the changes in the stock prices.
Baral (2004) has studied the determinants of capitalstructure i.e., size, business risk, growth rate, earningrate, dividend payout, debt service capacity, and degreeof operating leverage-of the companies listed in NepalStock Exchange Ltd. Multiple regression model has beenused to analyse the impact of different variables oncapital structure. This study shows that size, growthrate and earning rate are significant determinants ofcapital structure of the companies.
Shah A and Hijazi T. (2004) studied that the use of debtwas more in larger firms in comparison with smaller firms.The reason was identified that the larger firm would havethe tendency to bear higher amount of risk but thesmaller firms may not be in the position to bear the riskof bankruptcy so that the firms tend to be use lessamount of debt.
Song A (2005) analyzed that the variables with capitalstructure decision to identify the relationship betweenthe variables and the capital structure formation. It wasfound that tangibility and size showed inverse relationshipwhen compared with long term debt and short term debt.Tangibility and size were positively correlated with longterm debt whereas the same variable was negativelycorrelated short term debt.
Frank and Goyal (2007) In this paper the researcheranalyzed the trade-off, pecking order and market timingtheory. The empirical evidence seems reasonablyconsistent with some versions of the tradeoff theory ofcapital structure.
Xiaoyan Niu (2008) studied the capital structure choiceand determinants related to many factors. This papershowed several traditional theories proposed on capitalstructure, such as trade-off theory, agency cost theoryand theory of pecking-order. It suggests seven determinedfactors affecting the capital structure decisions and thecorrelations among these factors and the choice ofcapital structure.
Dewaelheyns and Hulle (2009) analysed that a firm’sfinance decision was influenced by both externalfinancing and internal financing. The firms are willing tocontinue to expand the business across the globe togenerate internal finance and therefore the firms are lessdependent on external source of borrowing.
M.A. Suresh Kumar, R. Himachalapathy and R.Saravanan (2012) found that the variables agency costof equity, operating leverage, growth rate, bankruptcyrisk, tangibility, and debt service capacity proved to bestatistically significant determinants of capital structure.Most of the determinants have shown the desire sign aswarranted by different theories.
Fauzi, Basyith and Idris (2013) found that firm sizesupports the pecking order theory meaning that largesized firms have higher tendency to have a significantdebt component in their capital structure. Large sizedfirms can be approximated to firms with large marketcapitalization and this is achieved by continuouslycreating value for investors by continuously aggravatingbottom-line in terms of profits. Not only profits, butprofitability also matters meaning higher increase inprofits compared to sales.
Objectives1. To identify the proportionment of Debt-Equity being
used by the selected pharmaceutical companies.2. To analyze the impact of Debt Equity mix on
profitability of company.
Research MethodologyThe study is exploratory to analyse the capital structuredecisions of these pharmaceutical companies andanalyzed with the help of DuPont ratio, pecking ordertheory and trade off theory.
The sample includes top five pharmaceutical companieslisted in BSE, based on the market capitalization. Theyare Sun Pharmaceutical Industries, Lupinpharmaceuticals, Dr. Reddy’s laboratories, Cipla ltd. andAurobindo Pharma. The data for the empirical analysisis derived from the financial statements of these firmsduring the period 2012-13 to 2016-2017. This study alsoattempts to make an intra company analysis with the

Page 55 P.E.S. College of Engineering, Mandya & Primax Foundation, Bengaluru
UGC ID No: 63975 Impact Factor - 5.87“Recent Trends in Business Management”
objective to determine the importance of debt-equity mixfor better profitability.
Tools for Study1. Du Pont- The DuPont analysis also called the DuPont
model is a financial ratio based on the return onequity ratio that is used to analyze a company’sability to increase its return on equity. In other words,this model breaks down the return on equity ratio toexplain how companies can increase their return forinvestors.The DuPont analysis looks at three maincomponents of the ROE ratio.• Profit Margin• Total Asset Turnover• Financial LeverageBased on these three performances measures themodel concludes that a company can raise its ROEby maintaining a high profit margin, increasing assetturnover, or leveraging assets more effectively.Return on Equity= Profit Margin x Total AssetTurnover x Financial Leverage
2. Pecking order theory- Pecking order theory is atheory related to capital structure. It was initiallysuggested by Donaldson. In 1984, Myers and Majlufmodified the theory and made it popular. Accordingto this theory, managers follow a hierarchy tochoose sources of finance. The hierarchy gives firstpreference to internal financing. If internal financingis not enough, then managers would have to shiftto external sources. They will issue debt to generatefunds. After a point when it is no longer practical toissue more debt, equity is issued as a last option.
3. Trade Off Theory- The trade-off theory of capitalstructure is the idea that a company chooses howmuch debt finance and how much equity finance touse by balancing the costs and benefits. The tradeofftheory assumes that there are benefits to leveragewithin a capital structure up until the optimal capitalstructure is reached. The theory recognizes the taxbenefit from interest payments. Studies suggest,however, that most companies have less leveragethan this theory would suggest is optimal.
Companies under Study1. Sun Pharmaceuticals Ltd.: Sun Pharrmaceuticals
is the world’s fourth largest specialty genericpharmaceutical company and India’s toppharmaceutical company. Sun Pharma’s global
presence is supported by 42 manufacturing facilitiesspread across 6 continents, R&D centres acrossthe globe and a multi-cultural workforce comprisingover 50 nationalities. In India, the company enjoysleadership across 11 different classes of doctors with30 brands featuring amongst top 300 pharmaceuticalbrands in India. Its Global Consumer Healthcarebusiness is ranked amongst Top 10 across 3 globalmarkets. Its API business footprint is strengthenedthrough 14 world class API manufacturing facilitiesacross the globe.
2. Lupin Limited: Incorporated in 1983, Lupin Limitedbased in Mumbai is part of Dr. D B Gupta’s LupinGroup. The promoter’s holding in the company’sequity is around 52 percent, while the institutionalinvestors hold about 33 percent and individuals holdjust above 12 percent share. The marketcapitalization of company is Rs.41,694 crores.
3. Dr.Reddy’s Laboratories Limited - Dr. Reddy’sLaboratories was established by Dr. Anji Reddy in1984. It went public in 1986 and, in 1987; it obtainedUnited States Food and Drug Administration(USFDA) approval for its active pharmaceuticalingredient (API) ibuprofen and started formulationoperations. In 1988, it expanded its bulk activesbusiness by acquiring Benzex Labs. Dr. Reddy’s isnow a vertically integrated internationalpharmaceutical company manufacturing andmarketing APIs, generics and branded formulations.The capitalization of the company is 40,002 crores.
4. Cipla Limited: Cipla was set up in 1935 by KhwajaAbdul Hamied as The Chemical, Industrial &Pharmaceutical Laboratories. Later, it came to bepopularly known as Cipla. Cipla manufactures andmarkets bulk drugs, prescription drugs, OTCproducts and veterinary products. Cipla also offersdifferent technological services for products andprocesses. Technical fees amounting to Rs.76.5crore contributed nearly two per cent of its totalincome in 2006—07. Market capitalization is 30,498crores.
5. Aurobindo Pharma Limited: Aurobindo PharmaLimited is a pharmaceutical manufacturing companyheadquartered in Hyderabad, India was incorporatedin 1986. It manufactures generic pharmaceuticalsand active pharmaceutical ingredients. It generatedrevenue of Rs. 136.50 billion in the year 2016-17. Ithas 16000 employees and generated Rs. 19.780billion as net income.
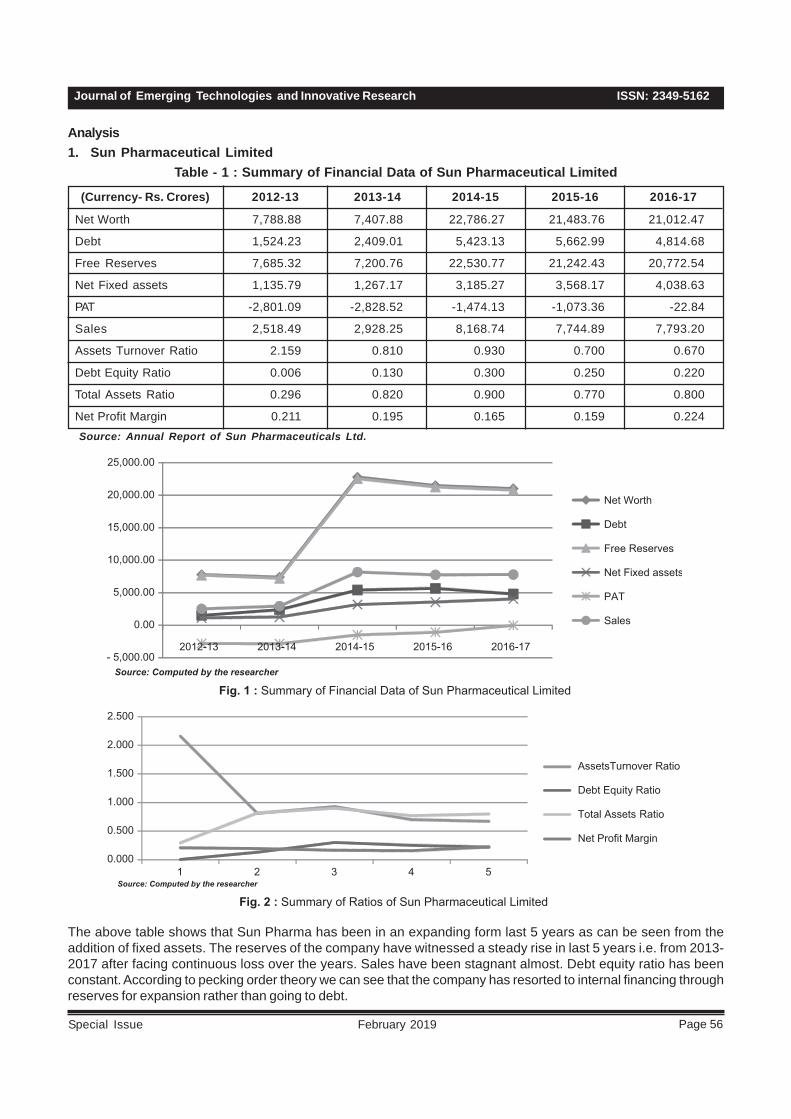
ISSN: 2349-5162Journal of Emerging Technologies and Innovative Research
Page 56February 2019Special Issue
Analysis1. Sun Pharmaceutical Limited
Table - 1 : Summary of Financial Data of Sun Pharmaceutical Limited
(Currency- Rs. Crores)
Net Worth 7,788.88 7,407.88 22,786.27 21,483.76 21,012.47
Debt 1,524.23 2,409.01 5,423.13 5,662.99 4,814.68
Free Reserves 7,685.32 7,200.76 22,530.77 21,242.43 20,772.54
Net Fixed assets 1,135.79 1,267.17 3,185.27 3,568.17 4,038.63
PAT -2,801.09 -2,828.52 -1,474.13 -1,073.36 -22.84
Sales 2,518.49 2,928.25 8,168.74 7,744.89 7,793.20
Assets Turnover Ratio 2.159 0.810 0.930 0.700 0.670
Debt Equity Ratio 0.006 0.130 0.300 0.250 0.220
Total Assets Ratio 0.296 0.820 0.900 0.770 0.800
Net Profit Margin 0.211 0.195 0.165 0.159 0.224
2012-13 2013-14 2014-15 2015-16 2016-17
Source: Annual Report of Sun Pharmaceuticals Ltd.
Fig. 1 : Summary of Financial Data of Sun Pharmaceutical LimitedSource: Computed by the researcher
- 5,000.00
0.00
5,000.00
10,000.00
15,000.00
20,000.00
25,000.00
2012-13 2013-14 2014-15 2015-16 2016-17
Net Worth
Debt
Free Reserves
Net Fixed assets
PAT
Sales
Fig. 2 : Summary of Ratios of Sun Pharmaceutical LimitedSource: Computed by the researcher
0.000
0.500
1.000
1.500
2.000
2.500
1 2 3 4 5
AssetsTurnover Ratio
Debt Equity Ratio
Total Assets Ratio
Net Profit Margin
The above table shows that Sun Pharma has been in an expanding form last 5 years as can be seen from theaddition of fixed assets. The reserves of the company have witnessed a steady rise in last 5 years i.e. from 2013-2017 after facing continuous loss over the years. Sales have been stagnant almost. Debt equity ratio has beenconstant. According to pecking order theory we can see that the company has resorted to internal financing throughreserves for expansion rather than going to debt.
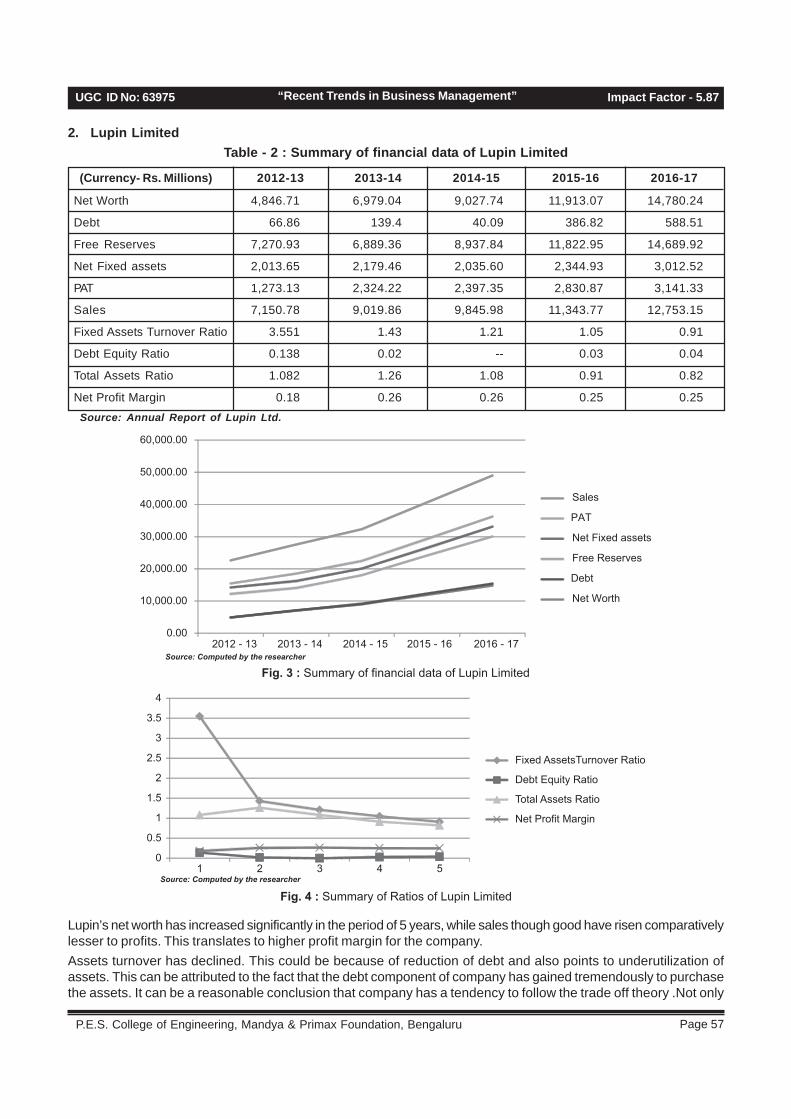
Page 57 P.E.S. College of Engineering, Mandya & Primax Foundation, Bengaluru
UGC ID No: 63975 Impact Factor - 5.87“Recent Trends in Business Management”
2. Lupin LimitedTable - 2 : Summary of financial data of Lupin Limited
(Currency- Rs. Millions)
Net Worth 4,846.71 6,979.04 9,027.74 11,913.07 14,780.24
Debt 66.86 139.4 40.09 386.82 588.51
Free Reserves 7,270.93 6,889.36 8,937.84 11,822.95 14,689.92
Net Fixed assets 2,013.65 2,179.46 2,035.60 2,344.93 3,012.52
PAT 1,273.13 2,324.22 2,397.35 2,830.87 3,141.33
Sales 7,150.78 9,019.86 9,845.98 11,343.77 12,753.15
Fixed Assets Turnover Ratio 3.551 1.43 1.21 1.05 0.91
Debt Equity Ratio 0.138 0.02 -- 0.03 0.04
Total Assets Ratio 1.082 1.26 1.08 0.91 0.82
Net Profit Margin 0.18 0.26 0.26 0.25 0.25
2012-13 2013-14 2014-15 2015-16 2016-17
Source: Annual Report of Lupin Ltd.
Fig. 3 : Summary of financial data of Lupin LimitedSource: Computed by the researcher
0.00
10,000.00
20,000.00
30,000.00
40,000.00
50,000.00
60,000.00
2012 - 13 2013 - 14 2014 - 15 2015 - 16 2016 - 17
Sales
PAT
Net Fixed assets
Free Reserves
Debt
Net Worth
Fig. 4 : Summary of Ratios of Lupin LimitedSource: Computed by the researcher
0
0.5
1
1.5
2
2.5
3
3.5
4
1 2 3 4 5
Fixed AssetsTurnover Ratio
Debt Equity Ratio
Total Assets Ratio
Net Profit Margin
Lupin’s net worth has increased significantly in the period of 5 years, while sales though good have risen comparativelylesser to profits. This translates to higher profit margin for the company.Assets turnover has declined. This could be because of reduction of debt and also points to underutilization ofassets. This can be attributed to the fact that the debt component of company has gained tremendously to purchasethe assets. It can be a reasonable conclusion that company has a tendency to follow the trade off theory .Not only
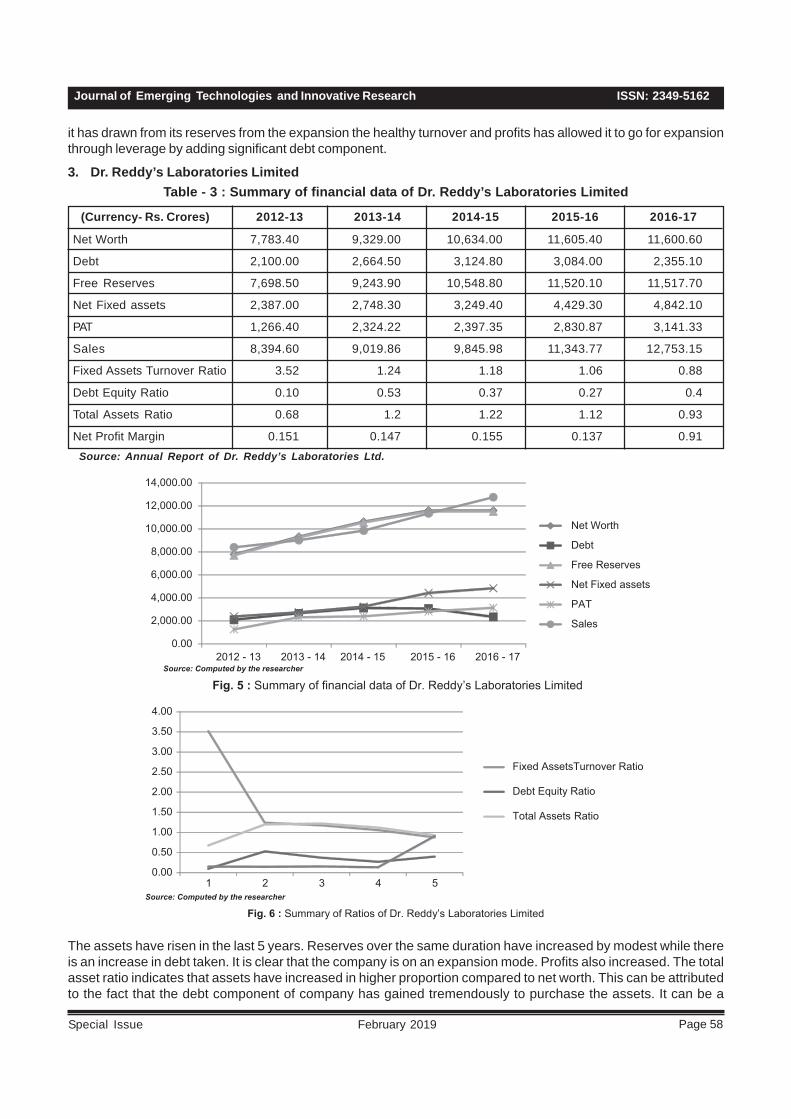
ISSN: 2349-5162Journal of Emerging Technologies and Innovative Research
Page 58February 2019Special Issue
it has drawn from its reserves from the expansion the healthy turnover and profits has allowed it to go for expansionthrough leverage by adding significant debt component.
3. Dr. Reddy’s Laboratories LimitedTable - 3 : Summary of financial data of Dr. Reddy’s Laboratories Limited
(Currency- Rs. Crores)
Net Worth 7,783.40 9,329.00 10,634.00 11,605.40 11,600.60
Debt 2,100.00 2,664.50 3,124.80 3,084.00 2,355.10
Free Reserves 7,698.50 9,243.90 10,548.80 11,520.10 11,517.70
Net Fixed assets 2,387.00 2,748.30 3,249.40 4,429.30 4,842.10
PAT 1,266.40 2,324.22 2,397.35 2,830.87 3,141.33
Sales 8,394.60 9,019.86 9,845.98 11,343.77 12,753.15
Fixed Assets Turnover Ratio 3.52 1.24 1.18 1.06 0.88
Debt Equity Ratio 0.10 0.53 0.37 0.27 0.4
Total Assets Ratio 0.68 1.2 1.22 1.12 0.93
Net Profit Margin 0.151 0.147 0.155 0.137 0.91
2012-13 2013-14 2014-15 2015-16 2016-17
Source: Annual Report of Dr. Reddy’s Laboratories Ltd.
Fig. 5 : Summary of financial data of Dr. Reddy’s Laboratories LimitedSource: Computed by the researcher
0.00
2,000.00
4,000.00
6,000.00
8,000.00
10,000.00
12,000.00
14,000.00
2012 - 13 2013 - 14 2014 - 15 2015 - 16 2016 - 17
Net Worth
Debt
Free Reserves
Net Fixed assets
PAT
Sales
Fig. 6 : Summary of Ratios of Dr. Reddy’s Laboratories LimitedSource: Computed by the researcher
0.00
0.50
1.00
1.50
2.00
2.50
3.00
3.50
4.00
1 2 3 4 5
Fixed AssetsTurnover Ratio
Debt Equity Ratio
Total Assets Ratio
The assets have risen in the last 5 years. Reserves over the same duration have increased by modest while thereis an increase in debt taken. It is clear that the company is on an expansion mode. Profits also increased. The totalasset ratio indicates that assets have increased in higher proportion compared to net worth. This can be attributedto the fact that the debt component of company has gained tremendously to purchase the assets. It can be a

Page 59 P.E.S. College of Engineering, Mandya & Primax Foundation, Bengaluru
UGC ID No: 63975 Impact Factor - 5.87“Recent Trends in Business Management”
reasonable conclusion that company has a tendency to follow the trade off theory .Not only it has drawn from itsreserves from the expansion the healthy turnover and profits has allowed it to go for expansion through leverage byadding significant debt component.4. Cipla Limited
Table - 4 : Summary of financial data of Cipla Limited
(Currency- Rs. Crores)
Net Worth 8,860.50 10,082.67 11,081.18 11,985.88 12,800.51
Debt 99.93 877.34 1,380.61 1,131.81 324.33
Free Reserves 7,270.93 9,922.09 10,920.59 11,825.20 12,639.61
Net Fixed assets 3,418.29 3,515.22 3,584.65 3,826.11 4,235.26
PAT 1,519.27 1,388.34 1,181.09 1,462.30 974.94
Sales 8,297.38 9,479.41 10,224.72 12,117.72 10,974.58
Fixed Assets Turnover Ratio 2.427 0.9 0.86 0.95 0.82
Debt Equity Ratio 0.113 0.09 0.12 0.09 0.03
Total Assets Ratio 0.78 0.86 0.82 0.93 0.83
Net Profit Margin 0.183 14.8 11.65 12.06 9.05
2012-13 2013-14 2014-15 2015-16 2016-17
Source: Annual Report of Cipla Ltd.
Fig. 7 : Summary of financial data of Cipla LimitedSource: Computed by the researcher
0.005,000.00
10,000.0015,000.0020,000.0025,000.0030,000.0035,000.0040,000.0045,000.00
Sales
PAT
Net Fixed assets
Free Reserves
Debt
Net Worth
2012 - 13 2013 - 14 2014 - 15 2015 - 16 2016 - 17
Fig. 8 : Summary of Ratios of Cipla LimitedSource: Computed by the researcher
02468
10121416
1 2 3 4 5
Fixed AssetsTurnover Ratio
Debt Equity Ratio
Total Assets Ratio
Net Profit Margin
Cipla - Cipla has been a very steady performer over the years. The profit has grown over the five year period. Thefixed assets have doubled and some more over the same time frame. Sales increased in the same period. The debtequity ratios have been very less and the reserves have been on a steady rise for the company. However the netprofit margins have steadily grown over the years indicating better profit margins. Thus the company is doingreasonably well not risking any leverage because of adequate funds available but which look to be slightly underutilized.

ISSN: 2349-5162Journal of Emerging Technologies and Innovative Research
Page 60February 2019Special Issue
5. Aurobindo Pharma LimitedTable - 5 : Summary of financial data Aurobindo Pharma Limited
(Currency- Rs. Crores)
Net Worth 2,939.10 4,012.39 5,359.54 6,865.85 8,436.18
Debt 2774.96 1,032.31 687.16 334.76 118.9
Free Reserves 2,909.98 3,983.24 5,330.34 6,807.33 8,377.59
Net Fixed assets 2,011.91 1,937.94 2,190.01 2,568.13 3,211.62
PAT 495.99 1,172.09 1,516.35 1,626.70 1,706.76
Sales 5,425.10 7,269.53 8,244.84 9,322.76 9,781.21
Fixed Assets Turnover Ratio 0 0 1.07 0.97 0.88
Debt Equity Ratio 0.80 0.7 0.54 0.55 0.34
Total Assets Ratio 1.27 1.04 0.98 0.86 0.85
Net Profit Margin 0 0 0.187 0.177 0.178
2012-13 2013-14 2014-15 2015-16 2016-17
Source: Annual Report of Aurobindo Pharma Ltd.
Fig. 9 : Summary of financial data Aurobindo Pharma Limited
2012 - 13 2013 - 14 2014 - 15 2015 - 16 2016 - 17Source: Computed by the researcher
0.00
2,000.00
4,000.00
6,000.00
8,000.00
10,000.00
12,000.00
Net Worth
Debt
Free Reserves
Net Fixed assets
PAT
Sales
Fig. 10 : Summary of Ratios Aurobindo Pharma LimitedSource: Computed by the researcher
00.20.40.60.8
11.21.4
1 2 3 4 5
Fixed AssetsTurnover Ratio
Debt Equity Ratio
Total Assets Ratio
Net Profit Margin
Aurobindo Pharma Limited’s profit has grown in the duration while sales have also increased representing a veryhealthy profit margin. Though the debt has decreased and the fixed assets have increased modestly. It may bebecause of debt being used to finance the fixed assets. Debt equity ratio too has gone down which confirms that therise in net worth and reserves has been significantly more than the debt.
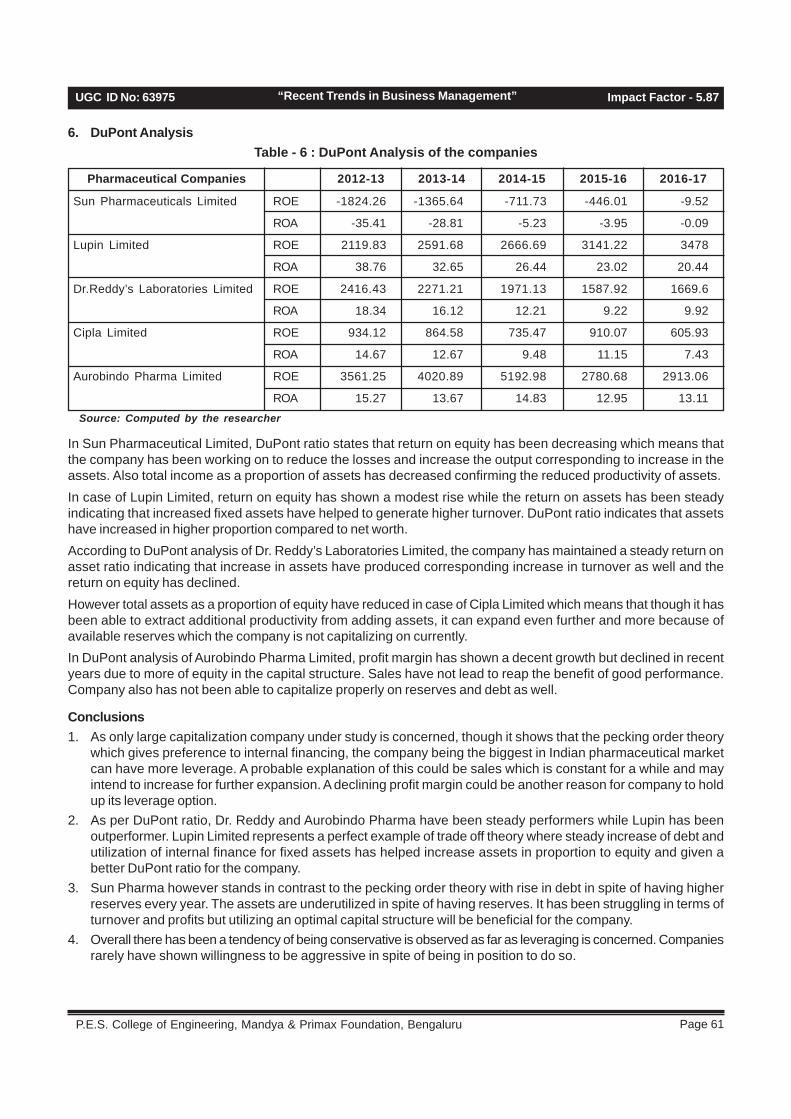
Page 61 P.E.S. College of Engineering, Mandya & Primax Foundation, Bengaluru
UGC ID No: 63975 Impact Factor - 5.87“Recent Trends in Business Management”
6. DuPont AnalysisTable - 6 : DuPont Analysis of the companies
Source: Computed by the researcher
In Sun Pharmaceutical Limited, DuPont ratio states that return on equity has been decreasing which means thatthe company has been working on to reduce the losses and increase the output corresponding to increase in theassets. Also total income as a proportion of assets has decreased confirming the reduced productivity of assets.In case of Lupin Limited, return on equity has shown a modest rise while the return on assets has been steadyindicating that increased fixed assets have helped to generate higher turnover. DuPont ratio indicates that assetshave increased in higher proportion compared to net worth.According to DuPont analysis of Dr. Reddy’s Laboratories Limited, the company has maintained a steady return onasset ratio indicating that increase in assets have produced corresponding increase in turnover as well and thereturn on equity has declined.However total assets as a proportion of equity have reduced in case of Cipla Limited which means that though it hasbeen able to extract additional productivity from adding assets, it can expand even further and more because ofavailable reserves which the company is not capitalizing on currently.In DuPont analysis of Aurobindo Pharma Limited, profit margin has shown a decent growth but declined in recentyears due to more of equity in the capital structure. Sales have not lead to reap the benefit of good performance.Company also has not been able to capitalize properly on reserves and debt as well.
Conclusions1. As only large capitalization company under study is concerned, though it shows that the pecking order theory
which gives preference to internal financing, the company being the biggest in Indian pharmaceutical marketcan have more leverage. A probable explanation of this could be sales which is constant for a while and mayintend to increase for further expansion. A declining profit margin could be another reason for company to holdup its leverage option.
2. As per DuPont ratio, Dr. Reddy and Aurobindo Pharma have been steady performers while Lupin has beenoutperformer. Lupin Limited represents a perfect example of trade off theory where steady increase of debt andutilization of internal finance for fixed assets has helped increase assets in proportion to equity and given abetter DuPont ratio for the company.
3. Sun Pharma however stands in contrast to the pecking order theory with rise in debt in spite of having higherreserves every year. The assets are underutilized in spite of having reserves. It has been struggling in terms ofturnover and profits but utilizing an optimal capital structure will be beneficial for the company.
4. Overall there has been a tendency of being conservative is observed as far as leveraging is concerned. Companiesrarely have shown willingness to be aggressive in spite of being in position to do so.
Pharmaceutical Companies
Sun Pharmaceuticals Limited ROE -1824.26 -1365.64 -711.73 -446.01 -9.52
ROA -35.41 -28.81 -5.23 -3.95 -0.09
Lupin Limited ROE 2119.83 2591.68 2666.69 3141.22 3478
ROA 38.76 32.65 26.44 23.02 20.44
Dr.Reddy’s Laboratories Limited ROE 2416.43 2271.21 1971.13 1587.92 1669.6
ROA 18.34 16.12 12.21 9.22 9.92
Cipla Limited ROE 934.12 864.58 735.47 910.07 605.93
ROA 14.67 12.67 9.48 11.15 7.43
Aurobindo Pharma Limited ROE 3561.25 4020.89 5192.98 2780.68 2913.06
ROA 15.27 13.67 14.83 12.95 13.11
2012-13 2013-14 2014-15 2015-16 2016-17
ISSN: 2349-5162Journal of Emerging Technologies and Innovative Research
Page 62February 2019Special Issue
References• Baral, Keshar J. Determinants of Capital Structure:
A Case Study of Listed Companies of Nepal, Journalof Nepalese business studies Vol.1, No.1, 2004
• Dewaelheyns, N. and Hulle, C. V. (2009). CapitalStructure. Journal of Economic Perspectives, 11(2),8-10.
• Fauzi F. ,Basyith A. & Idris M. (Dec. 2013) - TheDeterminants of Capital Structure: An EmpiricalStudy of New Zealand-Listed Firms, Asian Journalof Finance & accounting ISSN 1946-052X 2013, Vol.5, No. 2. http://dx.doi.org/10.5296/ajfa.v5i2.3740.
• Goyal, V. K., & Frank, M.Z. (2007). Testing thepecking-order theory of capital structure. Journal ofFinancial Economics, 67, 1-30.
• Harris Milton & Raviv Arthur The Theory of capitalstructure The Journal of Finance Vol. XLVI, No.1,March 1991
• Kumar, M. A. S., Himachalapathy, R. andSaravanan, R. (2012). A study on capital structureof the Indian Pharmaceutical companies. Journal ofManagement &Science, 1(4), 14-23.
• Niu Xiaoyan, Theoretical and Practical review ofcapital structure and its determinants, InternationalJournal of Business and Management, March 2008.
• Shah, A. and Hijazi, T. (2004). The determinants ofcapital structure of stock exchange-listed non-financial firms in Pakistan. Pakistan DevelopmentReview, 43(4), 605-618.
• Song, A. (2005). A theory of Capital Structure. Journalof Finance, 46(1), 297-355.
Books and Reports• Annual reports of selected pharmaceutical
companies of last 5 years from 2010-11 to 2014-15• I.M., P. (2004), Financial Management, New Delhi:
Vikas Publishing House.• Khan M.Y. (2010), Financial Management: New
Delhi: The Tata McGraw-Hill Companies.
Websites• www.Wikipedia.org• www.moneycontrol.com
Page 63 P.E.S. College of Engineering, Mandya & Primax Foundation, Bengaluru
UGC ID No: 63975 Impact Factor - 5.87“Recent Trends in Business Management”
A STUDY ON COMPETENCY MAPPING ANDASSESSMENT OF EMPLOYEES
1. Lecturer, Seshadripuram College, Bengaluru.2. Lecturer, Seshadripuram College, Bengaluru.
AbstractOrganizations should establish a highly effective and efficient workforce to develop a competency mapping technique.Organizations should recognize people and truly value their company asset. Competency mapping is an importantresource in organizational environment, and is an adjunct to knowledge management and other organizationalinitiatives. The performance of companies depends mostly on the quality of their manpower.Competency mapping isdesigned to consistently assess and measure individual and group performance as it is used to identify key attributedlike knowledge, skills and attitudes that are required to perform effectively in a job classification. Every well-managedorganization should have well defined roles and list of competencies required to perform each role effectively.Competency mapping identifies an employee’s strengths and weaknesses in order to help them to understandthemselves and it helps improving career development. Competency mapping is done for all employees in anorganization i.e.; confirmed employees and contract employees to understand job knowledge and roles. The mostaccurate means in identifying the job and behavioral competencies of an individual in an organization is competencymapping. Competency requires knowledge, skills and attitudes to perform a job effectively and efficiently. A Competencyis something that describes how a job should be done by dividing the job according to role.The analysis proves thatthe executives have to reach the expected level of competency in many vital areas for their department as well as theorganization. The executives should be able to manage changes and move according to the situation. They shouldalso be ready for self appraisal and healthy criticism, able to analyze their deeds impartially and unbiased. Attemptsshould be done to improve the job satisfaction level. Because job satisfaction will indirectly affect the performance ofthe executives. Also only experienced hands should be appointed in this department.
Key words: Competency mapping, job knowledge, roles of employees and employee performance
Krithika Raj1
IntroductionBackground of the studyIn the global economy, organizations are becoming moreand more aware of the need to have competentemployees. It is not surprising that interest in the conceptof competency mapping is missing. The rising interestin competency mapping is direct fallout of the systematicchanges that the corporate world is witnessing today.One of the core issues companies are facing today isthe increase in manpower cost. Coupled with that isthe pressure to downsize and manage with fewer people,thus increasing efficiency and employee productivity.
There is recognition that technology, finances, customersand markets, systems and processes can all be setright or managed effectively with the right kind of humanresources. Apart from this there is a focus on performingroles, time management, nurturing of competence,increased emphasis on performance managementsystems and recognition of the strategic advantage givenby employee in building the core competencies of theorganization.
What is competency?Competency mapping identifies an individual’s strengthsand weaknesses. The aim is to enable the person tobetter understand him or herself and to point out wherecareer development efforts need to be directedCompetencies are derived from specific job familieswithin the organization and are often grouped aroundcategories such as strategy, relationships, innovation,leadership, risk-taking, decision-making, emotionalintelligence, etc. So far as the way to go about forcompetency mapping is concerned, the first step is jobanalysis, where the company needs to list corecompetency requirements for the job concerned. Thenext step should be development of a competency scalefor the job on the parameters previously identified. Theactual mapping of employees can be a self-doneexercise or done by others like superiors. It can also bedone by using the 360-degree method where peers, firstreports and customers also rate the employee.
Competency is an underlying characteristic required toperform a given task, activity, or role can be consideredas competency. Competency has the following forms:
Nagasudha. R2
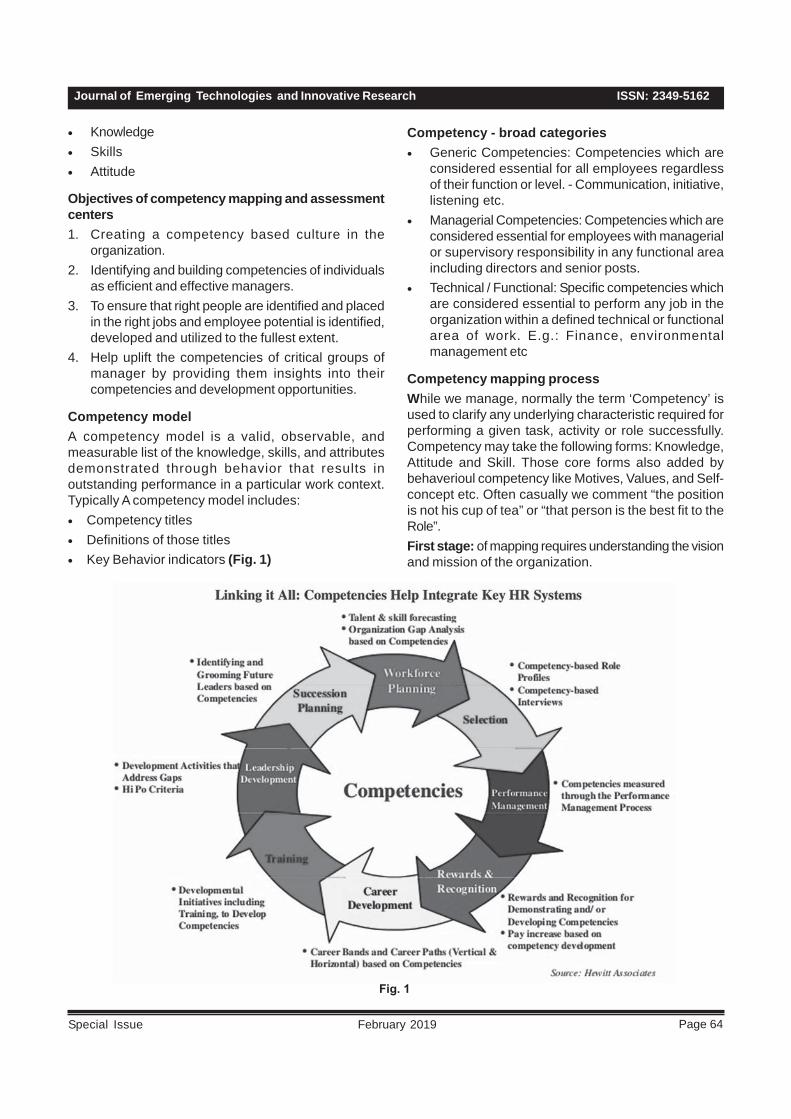
ISSN: 2349-5162Journal of Emerging Technologies and Innovative Research
Page 64February 2019Special Issue
• Knowledge• Skills• Attitude
Objectives of competency mapping and assessmentcenters1. Creating a competency based culture in the
organization.2. Identifying and building competencies of individuals
as efficient and effective managers.3. To ensure that right people are identified and placed
in the right jobs and employee potential is identified,developed and utilized to the fullest extent.
4. Help uplift the competencies of critical groups ofmanager by providing them insights into theircompetencies and development opportunities.
Competency modelA competency model is a valid, observable, andmeasurable list of the knowledge, skills, and attributesdemonstrated through behavior that results inoutstanding performance in a particular work context.Typically A competency model includes:• Competency titles• Definitions of those titles• Key Behavior indicators (Fig. 1)
Fig. 1
Competency - broad categories• Generic Competencies: Competencies which are
considered essential for all employees regardlessof their function or level. - Communication, initiative,listening etc.
• Managerial Competencies: Competencies which areconsidered essential for employees with managerialor supervisory responsibility in any functional areaincluding directors and senior posts.
• Technical / Functional: Specific competencies whichare considered essential to perform any job in theorganization within a defined technical or functionalarea of work. E.g.: Finance, environmentalmanagement etc
Competency mapping processWhile we manage, normally the term ‘Competency’ isused to clarify any underlying characteristic required forperforming a given task, activity or role successfully.Competency may take the following forms: Knowledge,Attitude and Skill. Those core forms also added bybehaverioul competency like Motives, Values, and Self-concept etc. Often casually we comment “the positionis not his cup of tea” or “that person is the best fit to theRole”.First stage: of mapping requires understanding the visionand mission of the organization.
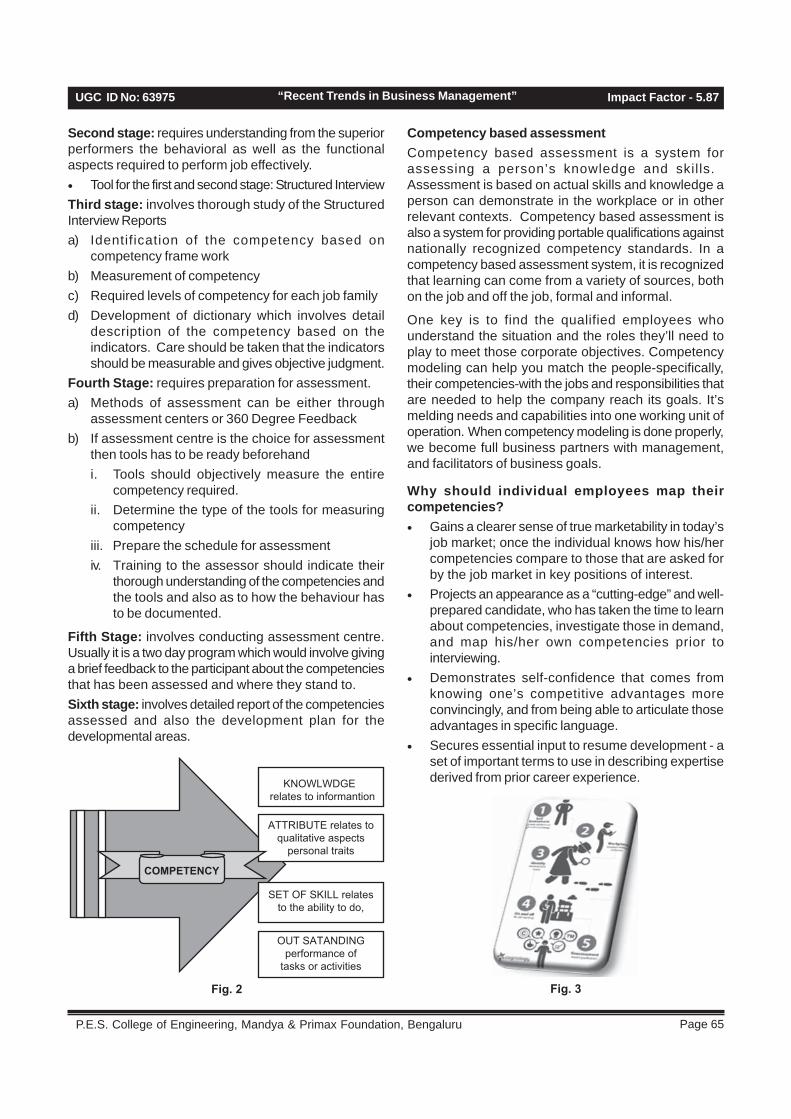
Page 65 P.E.S. College of Engineering, Mandya & Primax Foundation, Bengaluru
UGC ID No: 63975 Impact Factor - 5.87“Recent Trends in Business Management”
Second stage: requires understanding from the superiorperformers the behavioral as well as the functionalaspects required to perform job effectively.• Tool for the first and second stage: Structured InterviewThird stage: involves thorough study of the StructuredInterview Reportsa) Identification of the competency based on
competency frame workb) Measurement of competencyc) Required levels of competency for each job familyd) Development of dictionary which involves detail
description of the competency based on theindicators. Care should be taken that the indicatorsshould be measurable and gives objective judgment.
Fourth Stage: requires preparation for assessment.a) Methods of assessment can be either through
assessment centers or 360 Degree Feedbackb) If assessment centre is the choice for assessment
then tools has to be ready beforehandi. Tools should objectively measure the entire
competency required.ii. Determine the type of the tools for measuring
competencyiii. Prepare the schedule for assessmentiv. Training to the assessor should indicate their
thorough understanding of the competencies andthe tools and also as to how the behaviour hasto be documented.
Fifth Stage: involves conducting assessment centre.Usually it is a two day program which would involve givinga brief feedback to the participant about the competenciesthat has been assessed and where they stand to.Sixth stage: involves detailed report of the competenciesassessed and also the development plan for thedevelopmental areas.
Fig. 2
KNOWLWDGE relates to informantion
ATTRIBUTE relates toqualitative aspects
personal traits
SET OF SKILL relatesto the ability to do,
OUT SATANDINGperformance of
tasks or activities
COMPETENCY
Competency based assessmentCompetency based assessment is a system forassessing a person’s knowledge and skills. Assessment is based on actual skills and knowledge aperson can demonstrate in the workplace or in otherrelevant contexts. Competency based assessment isalso a system for providing portable qualifications againstnationally recognized competency standards. In acompetency based assessment system, it is recognizedthat learning can come from a variety of sources, bothon the job and off the job, formal and informal.
One key is to find the qualified employees whounderstand the situation and the roles they’ll need toplay to meet those corporate objectives. Competencymodeling can help you match the people-specifically,their competencies-with the jobs and responsibilities thatare needed to help the company reach its goals. It’smelding needs and capabilities into one working unit ofoperation. When competency modeling is done properly,we become full business partners with management,and facilitators of business goals.
Why should individual employees map theircompetencies?• Gains a clearer sense of true marketability in today’s
job market; once the individual knows how his/hercompetencies compare to those that are asked forby the job market in key positions of interest.
• Projects an appearance as a “cutting-edge” and well-prepared candidate, who has taken the time to learnabout competencies, investigate those in demand,and map his/her own competencies prior tointerviewing.
• Demonstrates self-confidence that comes fromknowing one’s competitive advantages moreconvincingly, and from being able to articulate thoseadvantages in specific language.
• Secures essential input to resume development - aset of important terms to use in describing expertisederived from prior career experience.
Fig. 3
ISSN: 2349-5162Journal of Emerging Technologies and Innovative Research
Page 66February 2019Special Issue
Review of literature(Farah 2009) has discussed about the performance ofcompanies depends mostly on the quality of their humanresource. For obvious economic and business reasons,organizations have always been concerned about thecompetence of its people. This paper seeks to deliverdeeper into the concept of competency, tracing its historyand its role in the present context. It explains how theconcept has constantly evolved over the years, itsapplications in human resource management, anddevelopment in the present scenario. It also aims to studyits future prospects in the light of other emerging areaslike talent management. The paper proceeds with theexamples of companies, which have successfullyintegrated.
(Kodwani, Amitabh Deo 2009) has focused on thePerformance is the mantra of today’s businessorganization. People with right abilities are able to performbetter. Competencies are the set of such skills andabilities (technical as well as behavioral) which arerequired for desired level of performance. Rightcompetencies are the key to superior performance.These days most of the business organizations aredealing with a problem of competency mapping, whichis basically attaching of capacity of an individual thatleads to behaviour and the organizational/jobrequirement.
(Rice 2006) the author reflects on the leadershipdevelopment among healthcare executives in the U.S.According to the author, competency-based leadershipdevelopment does not just drift, however it is intentionallyfocuses on clear career aspirations. Meanwhile, hestressed that disciplined approach to career growth willenhance the organization’s performance. Along withthese growths is career planning for health leaders thatwould set as innovative strategies for development, theauthor believes.
Research MethodologyStatement of the problem:Every organization is directed contributed towardsattainment of its goals. It works as the foundation pillar.Perhaps the most challenging aspect of any organization
is how they take care of the performance of its system.Keeping this concept in consideration a research studywas conducted to find out information about theCompetency Mapping and Assessment of Employeesin different Private Organizations.
Objectives of the study:• To map the competencies for the employees
responsibilities in an organization.
• To gain insight into the competencies that theemployees should possess for working as asuccessful executives.
Type of research: Descriptive research method.
Sources of data:• Primary data – Primary data was collected with the
help of the structured questionnaire which wasadministered to randomly selected employees.
• Secondary data – Secondary data was collectedwith the help of the documents such as the reports,books, articles and the websites.
Technique of data collection: Simple RandomSampling.
Tools of data collection: Structured questionnaire wasused to collect data from the respondents
Scope of the Study:• The data generated through competency mapping
can be used for promotion to critical roles,succession planning, filling up of vacancies and forforming teams with complementary skills.
• Competencies identified for each position also helpsin job evaluation.
• Competency mapping also helps to uplift thecompetencies of critical groups of executives byproviding them insights into their competencies anddevelopment opportunities.
Limitations• Time, resources have acted has limitation for
research work.
• Only sample size of 50 employees was taken toarrive at the possible conclusions.
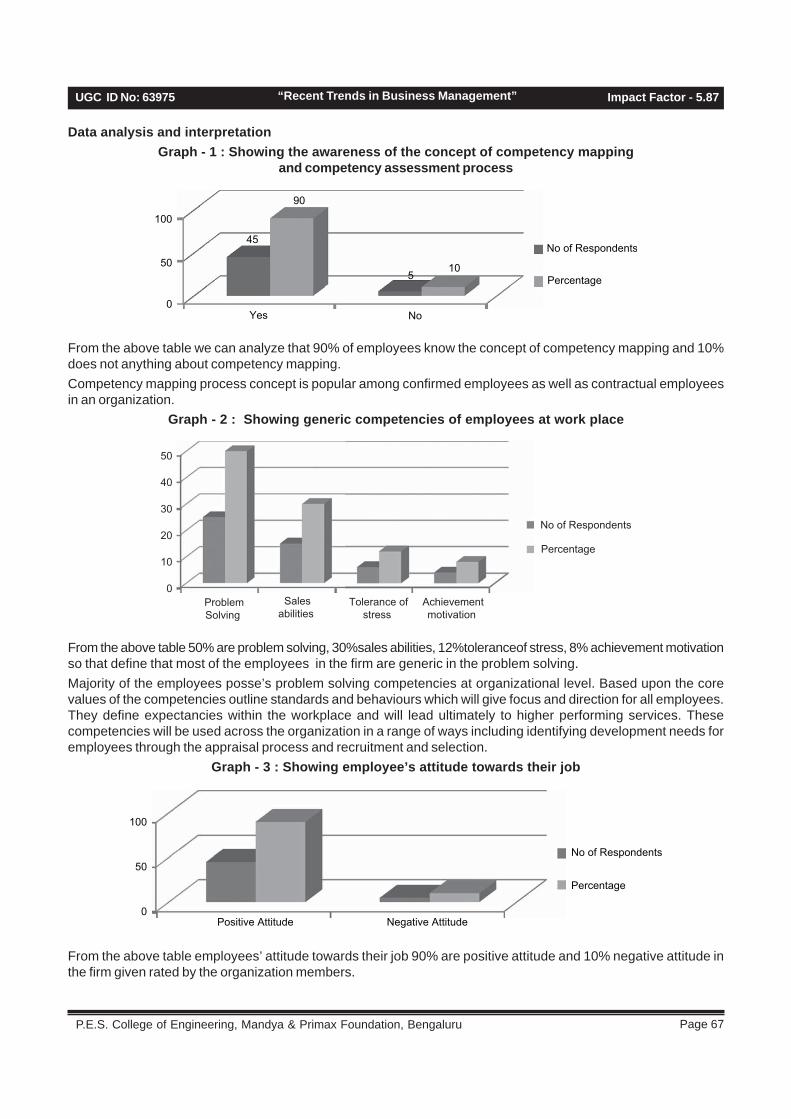
Page 67 P.E.S. College of Engineering, Mandya & Primax Foundation, Bengaluru
UGC ID No: 63975 Impact Factor - 5.87“Recent Trends in Business Management”
0
50
100
Yes No
45
5
90
10
No of Respondents
Percentage
Data analysis and interpretationGraph - 1 : Showing the awareness of the concept of competency mapping
and competency assessment process
From the above table we can analyze that 90% of employees know the concept of competency mapping and 10%does not anything about competency mapping.Competency mapping process concept is popular among confirmed employees as well as contractual employeesin an organization.
Graph - 2 : Showing generic competencies of employees at work place
0
10
20
30
40
50
ProblemSolving
Salesabilities
Tolerance ofstress
Achievementmotivation
No of Respondents
Percentage
From the above table 50% are problem solving, 30%sales abilities, 12%toleranceof stress, 8% achievement motivationso that define that most of the employees in the firm are generic in the problem solving.Majority of the employees posse’s problem solving competencies at organizational level. Based upon the corevalues of the competencies outline standards and behaviours which will give focus and direction for all employees.They define expectancies within the workplace and will lead ultimately to higher performing services. Thesecompetencies will be used across the organization in a range of ways including identifying development needs foremployees through the appraisal process and recruitment and selection.
Graph - 3 : Showing employee’s attitude towards their job
0
50
100
Positive Attitude Negative Attitude
No of Respondents
Percentage
From the above table employees’ attitude towards their job 90% are positive attitude and 10% negative attitude inthe firm given rated by the organization members.

ISSN: 2349-5162Journal of Emerging Technologies and Innovative Research
Page 68February 2019Special Issue
45% of the employees posses a positive attitude while performing their responsibilities. Attitudes help to predictconstructive behaviours; negative job attitudes help to predict undesirable behaviours. When employees aredissatisfied with their jobs, lack job involvement, and are low in their commitment to the organization.
Graph - 4 : Indicating employee’s skills
0
20
40
60
PresentationSkills
ListeningSkills
NegotiationSkills
All the Above
No of Respondents
Percentage
From the above analysis 54% of the employees has indicated that they need presentation, listening and negotiationskills, 14% requires presentation skills, 16% requires listening skills and 16% requires negotiation skills.Most of the Employees require all the above mentioned skills needed to the better performance of their responsibilities.Every employee likes to acquire new skills and learning while at job. A sense of pride develops when they feel thattheir organization is investing time and resources to train them. Employee development is essential for extractingthe best out of employees.
Graph - 5 : Showing employees personal competencies
0
20
40
60
Adaptability Streetolerance
Selfmotivated
Honesty andSincerity
No of Respondents
Percentage
From the above table it is refers 46% of employees are self-tolerance, 34% employees are adaptability, 12%employees are stress-tolerance and 8% employees are honesty and sincerity. This shows employees personalcompetences are at adaptability.
Competency is sometimes thought of as being shown in action in a situation and context that might be different thenext time a person has to act. In emergencies, competent people may react to a situation following behaviors theyhave previously found to succeed. To be competent a person would need to be able to interpret the situation in thecontext and to have a repertoire of possible actions to take and have trained in the possible actions in the repertoire,if this is relevant. Regardless of training, competency would grow through experience and the extent of an individualto learn and adapt.
Graph - 6 : Showing employee’s job related skills
0
10
20
30
40
50
No of Respondents
Percentage
Technicalskills
Concern forexcellence
Initiative LearniingOriented

Page 69 P.E.S. College of Engineering, Mandya & Primax Foundation, Bengaluru
UGC ID No: 63975 Impact Factor - 5.87“Recent Trends in Business Management”
From the above table it can be analyzed that 48% are learning oriented, 30% are technical skills, 10% concern forexcellence, and 12% are initiative.Continuous learning refers to the ability to continually develop and improve employee skills and knowledge in orderto perform job-related tasks effectively and adapt to changes in the workplace. The best type of continuous learningcombines training with “several other elements that enable and encourage employees to engage and learn invarious ways. Continuous learning should emphasize the learner’s experience, and ensure that it is both appealingand fits with their other daily responsibilities.”
Graph - 7 : Cordial interpersonal relationship is very important for career growth
0
20
40
60
80
Stronglyagree
Agree Neutral Disagree Stronglydisagree
No of Respondents
Percentage
From the above table was clear that,20% of employees strongly agreed with the statement that, for employeescarrier growth, cordial interpersonal relationship is very important,62% of employees agreed with the statement,12%n of employees are undecided with the statement, 2% of employees were strongly disagreed with the statement,and 4% of employees disagreed with the statement.
According to the above analysis it is clear that majority of employees are agreed with the statement that, foremployee’s carrier growth, cordial interpersonal relationship is very important. Hence measures to be taken toimprove the cordial
Findings, suggestions and conclusionsFindings• As far as effective communication is concerned the executives fall in line with the desired competencies. In the
field of interpersonal relationship they are very much capable in handling the tasks.• Supervising skill is up to the expected range. Motivating abilities have to be enhanced.• Commitment wise they have to improve long distance to meet with the required level. They have to improve
some more in relationship building skill and cooperation.• All executives can tolerate the stress and are ready to make their mistakes. Adaptability to changes are low for
the executives. This skill has to be improved.• The executives have to improve a long way in the case of risk taking ability. Supervising skill among the
executives are satisfactory motivational abilities have to be enhanced.• All executives lack self insight and are working without enough team spirit. These areas have to be improved
from better functioning.• Commitment wise and cooperative wise they to come up to the competency level. They have to improve further
in relationship skill also.
Suggestions• The training should be imparted to the employees based on the required competencies.• The different level of management should conduct the training to polish the competencies required for the job.• By practicing the concept of competency mapping, the existence of complex relationships with blur boundaries
between organization and the environment.• The competency mapping should be done once in six months to assess employees.

ISSN: 2349-5162Journal of Emerging Technologies and Innovative Research
Page 70February 2019Special Issue
ConclusionThe analysis proves that the executives have to reachthe expected level of competency in many vital areasfor their department as well as the organization. Themost important area is the area of team work. Similarlycommitment to the job has to be enhanced. Executivesshould be encouraged some more to take risk.Interpersonal sill is very important in personnel andadministrative department which is lacking in thisdepartment. So flourishing of interpersonal skill shouldget more importance. Disseminating skill also cannotbe neglected because it is the duty of this departmentto update the knowledge of the whole organization. Itshould make the executive more conscious about selfappraisal.
BibliographyCollection of primary data was done through questionnaireand secondary data through various websites, etc.
JournalsInternational Journal of Scientific & EngineeringResearch, Volume 2, Issue 8, August-2011 1 ISSN 2229-5518 International Journal of Education and ResearchVol. 1 No. 1 January 2013
Websiteshttps://www.worldwidejournals.com/...research-analysis.../November_2014_https://www.researchgate.nethttps://www.worldwidejournals.com/global-journal-for-research-analysis

Page 71 P.E.S. College of Engineering, Mandya & Primax Foundation, Bengaluru
UGC ID No: 63975 Impact Factor - 5.87“Recent Trends in Business Management”
DIGITAL BANKING IN INDIA – PERCEPTION OFCUSTOMERS ON PAPERLESS TRANSACTION
1. Assistant Professor and Coordinator,PG Centre in Economics,Government College for Women.Mandya
Abstract
This paper is going to make an attempt to focus on the modes of cashless payments and also to analyse the opinionsof customers on the introduction and up gradation of banking sector with digital tools and their movement towardscashless economy in India .The study is conducted in Bengaluru and Mysuru and responses from customers showthat cashless economy would improve economic growth of our country. The present study has used the followingmethodology,
• Type of research : both descriptive and analytical• Sample size : 150• Study area : Bengaluru and Mysuru Cities• Data : both primary and secondary
• This study is based on both primary and secondary data.• For analysis purpose primary data has been used.• Both interview and questionnaire methods have been used.
• Sampling technique : Convenient sampling method• analytical tools : five point Likert method, frequency method, Tables and graphs
The present paper has made an attempt to study and understand the various advantages of digital transactions. Thiswill surely pave the way for conducting empirical research related to digital transactions.
Keywords- Cashless Economy, Customers, Economic Growth, Bengaluru and Mysuru , Digital Transaction.
Dr. Divya .B.S1
IntroductionCashless transaction is not only a convenient methodbut it also acts as an important tool to stimulateeconomic growth in a country. India ranks 107 out of193 countries in the UN E- government developmentindex. There is no doubt that, Indians are slowly comingforward to adopt cashless transaction habits. As per theinformation, there are 81 crore of debit cards in Indiabut, only 28.82 lakh point-of-sale (POS) terminals. Nodoubt that, there is a wide scope for digitalization offinancial transactions in India. An increased use ofcashless payments reduces tax evasion and moneylaundering. Cashless Economy also helps banks to gofor cost minimization function. It also becomes boon forRBI to manage inflation and to have stable economicgrowth in our country. Mainly cashless economydiscourages cash related robberies, human traffickingand other crimes. As a result of the introduction of ‘DigitalIndia’ concept, cashless transactions in our country havereached a record of 1.11 Billion in the month of January2018 and it was 1.06 Billion during December 2017.
ObjectivesThe study is based on the following importantobjectives. They are as follows,• To study the various modes of digital banking in
Indian economy• To analyse the perceptions of customers on
paperless transactions
Review of LiteratureThis part of the study deals with the selected reviewswhich analyses the advantages of digital transactions.Various academicians and researchers have alreadyworked on these areas and found their issues andimportance.
Marco and Bandiera (2004) have argued thatdigitalization of banks ensure strong monetary policyand many customers are happy with e- transactions andit does not make any interruptions to the growth processof financial sector of a country.
Raja et al., (2008) in their study, they have describedthe role of e- commerce and have mentioned its success.They have argued that the success of e- commerce highly

ISSN: 2349-5162Journal of Emerging Technologies and Innovative Research
Page 72February 2019Special Issue
depends on upgraded electronic payment systems suchas RTGS, NEFT etc. This paper also elucidates the birthand the growth of e- banking tools.
Piyush Kumar, (2015), in his study made an analysisthat cashless transaction system is rapidly increasingin Indian economy and people are accepting andpracticing it. Globalization has forced banking sector tomove more and more towards digitalization. The cashlesstransition is safer and more transparent than the cashtransaction
MethodologyIn this background, the study analyses the perceptionof customers of two cities namely, Mysuru andBengaluru. This paper is based on both primary andsecondary data. For the primary data purpose the studyhas analysed the perception of 150 customers in thestudy areas i.e., Bengaluru and Mysuru and forsecondary data purpose books, journals, importantwebsites and news papers are utilized. The Convenientsampling method has been adopted. The questionnaireand interview methods have been conducted and fivepoint Likert method has been used. To analyse thedata frequency method and tables, graphs have beenused.
Modes of Digital Banking in IndiaCustomers or sellers for their purchases or sales ofgoods and services do not use physical money i.e.currency notes or coins which are printed or minted bythe government instead, Exchange of money takes placethrough e- cards, e- wallets, UPI, cheque, RTGS, NEFT,IMPS, demand draft etc.
Government of India to promote cashless transactionsand to make India technologically sustainable hasintroduced various modes of cashless payments. Theyare as follows,
Fig. 1.1 : Modes of Digital Banking in India
Modes of Digital Payments
UnifiedPaymentsInterface
AadhaarEnabledPaymentSystem
Debit /CreditCards
InternetBanking
MobileWallets
MobileBanking
Banks offer their consumers wide variety of cards suchas credit, debit and prepaid cards by ensuring enormousflexibility and these cards have two authenticationnamely, PIN and OTP. With RuPay, Visa, Master Cardscustomers can purchase goods and services in storesand malls, through web stores or over the telephone.
Unified Payments Interface (UPI) is a system thatwhere customers by downloading different moneytransaction applications can transfer money or pay theirbills. Each Bank provides UPI App for Android, Windowsand iOS systems. Some of online payment applicationsare
• PhonePe• Paytm• BHIM app• MobiKwik• Airtel Payments Bank• Google Tez• Uber• Chillr• Paytm Payments Bank• SBI Pay• iMobile• Axis Pay• BOB UPI etc.
A mobile wallet is also one of the digital paymentsmethods. Here Instead of using debit or credit card tomake purchases, we can pay with our smartphones,tablet or even with smart watch. Customer links hisaccount to the digital wallet and loads money in it.Many banks have their own e-wallets and even someprivate companies. e.g. Paytm, Freecharge,Mobikwik, Oxigen, mRuppee, Airtel Money, JioMoney, SBI Buddy, itz Cash, Citrus Pay, VodafoneM-Pesa, Axis Bank Lime, ICICI Pockets, SpeedPay etc.
Internet banking is also called as online banking, e-banking or virtual banking. We can transact moneythrough electronic payment system such as RTGS,NEFT, ECS etc. Mobile banking is widely used bycustomers and banks also allow their customers to gofor different types of financial transactions anywhere atany time by using a mobile device. It uses software withthe help of various apps.
Cashless transactions bring transparency to theeconomy and economy is highly benefitted by thegeneration of revenue because, this process helps incurbing the circulation of black money. When blackmoney is registered it automatically reduces real estateprices and criminal activities in the country.
Perception of Customers on Paperless Transactionin Study AreasIndia has a large population of ruralites and these ruralareas lack adequate digital infrastructure. Therefore, itbecomes a great challenge to make India a completecashless economy. But various policies of government

Page 73 P.E.S. College of Engineering, Mandya & Primax Foundation, Bengaluru
UGC ID No: 63975 Impact Factor - 5.87“Recent Trends in Business Management”
are supporting people of India to hug these e-paymenttools. in this context, here customers were asked togive their opinion on digital payments.Table - 1 : Cashless Payment – A Convenient Method
Perception ofCustomers
Strongly Agree 46 30.7
Agree 40 26.7
Cont Say 26 17.3
Disagree 23 15.3
Strongly Disagree 15 10
Total 150 100
Numbers ofRespondent
Percentage
The above table indicates that, 30.7 percent ofrespondents strongly agree, 26.7 percent of respondentsagree, 17.3 percent of respondents are neutral, 15.3percent of respondents disagree and remaining 10percent of respondents strongly disagree about theconvenient method of paperless transaction.
Table - 2 : Cashless Payment Involves PoorInternet Connectivity
Perception ofCustomers
Strongly Agree 30 20
Agree 26 17.3
Cont Say 20 13.3
Disagree 40 26.7
Strongly Disagree 34 22.7
Total 150 100
Numbers ofRespondent
Percentage
The above table shows that, 20 percent of respondentsstrongly agree, 17.3percent of respondents agree, 13.3percent of respondents are neutral, 26.7 percent ofrespondents disagree and remaining 22.7 percent ofrespondents strongly disagree about poor internetconnectivity involved in cashless transactions.Table - 3 : Cashless Payment Encourages Incentives
Perception ofCustomers
Strongly Agree 60 40
Agree 40 26.7
Cont Say 05 3.3
Disagree 30 20
Strongly Disagree 15 10
Total 150 100
Numbers ofRespondent
Percentage
The above table indicates that, 40 percent of respondentsstrongly agree, 26.7 percent of respondents agree, 3.3percent of respondents are neutral, 20 percent ofrespondents disagree and remaining 10 percent ofrespondents strongly disagree about incentives given bydifferent companies encourage people to go for cashlesstransactions.
Table - 4 : Cashless Payment Involves SecurityIssues
Perception ofCustomers
Strongly Agree 50 33.4
Agree 36 24
Cont Say 08 5.3
Disagree 30 20
Strongly Disagree 26 17.3
Total 150 100
Numbers ofRespondent
Percentage
The above table clearly indicates that, 33.4 percent ofrespondents strongly agree, 24 percent of respondentsagree, 5.3 percent of respondents are neutral, 20 percentof respondents disagree and remaining 17.3 percent ofrespondents strongly disagree about security in cashlesstransactions.
It is found from the above analysis that, customers areinterested to participate in cashless transactionsbecause it is easy, simple, convenient and they getincentives in the form of payback and scratch cards butthey fear about the security issues.
Conclusion and SuggestionsWhen cashless transaction enhances its wings, therewill be less scope for hiding money. So, people will comeforward to make tax payments for their speculatedmoney. There will be transparency in each and everytransaction. Everything is recorded and it helps betterbusiness and investment process.
SuggestionsOff course, the paperless transaction increases thetransparency of economy, encourages the financialinclusion and curbs the parallel economy. But in reality,country needs to motivate more and more customers togo for digital payment system. Therefore, somesuggestions have been listed out.• Benefits of cashless transaction should be explained
to the students of colleges• Intensive awareness programmes from banks are
very much needed to motivate customers.• The banks should educate villagers to accept digital
payment system.

ISSN: 2349-5162Journal of Emerging Technologies and Innovative Research
Page 74February 2019Special Issue
• The Government of India should make necessarystep to curb cyber crime to ensure safe digitalpayment system.
The entire country is accepting the process ofdigitalization in money transactions with e-bankingservices and this process is saving their time and energy.It is really a great development that, even street vendorsand small traders are now accepting e – payments.
References• Ashish Das, and Rakhi Agarwal(2010). Cashless
Payment System in India- A Roadmap TechnicalReport, http://dspace.library.iitb.ac.in/jspui/handle/10054/1732.
• Bansi Patel, Urvi Amin.(2012). Plastic Money,Roadmay Towards Cash Less Society Paripex,IndianJournal of research Volume 1, Issue 11,November.
• Deepika Kumari.(2016). Cashless Transaction:Methods, Applications and Challenges, InternationalJournal of Enhanced Research in EducationalDevelopment (IJERED) Vol. 4 Issue 6, Nov-Dec.
• Jain, P. M. (2006). E.-Payments and E-Banking.Indian Banker, March. pp.108-113.
• Jain, V. (2014). Recent Trends in Financial Inclusion.In P. Kumar (Ed.), Emerging Trends in Finance andBanking (pp. 6–9). Himalaya Publishing House.
• Srinivas, N. (2006). An Analysis of the Defaults inCredit Card Payments, Southern Economics . July.pp. 19 -21.RBIBulletin.
• Subramanian.S. (2014). Paper- free paymentsystems in India - an analytical study, internationaljournalof Management (IJM), Volume 5, Issue 1,January IAEME.
• Vaibhav shahaji patil and Jyoti Mishra.( 2017 ) Astudy to find out advantages and disadvantages ofmaking India a cashless economy, Kaav internationaljournal of economics, commerce & businessmanagement, jan-mar17/vol-4/iss-1/a12.
• Wulandari, D., & Soseco, T. (2016). Analysis of theUse of Electronic Money in Efforts to Support theLess Cash Society. International Finance andBanking, 3(1). http://doi.org/10.5296/ifb.v2i2.8802
Page 75 P.E.S. College of Engineering, Mandya & Primax Foundation, Bengaluru
UGC ID No: 63975 Impact Factor - 5.87“Recent Trends in Business Management”
LEVERAGE: A TOOL FOR MEASURING RISK
1. Associate Professor, Department of Management Sciences, Maharaja Institute of Technology-Mysore,
AbstractFinancial Leverage allows greater potential return to the investors it also leads to greater loss due to worthlessinvestment. The study considers the rate of interest paid as return used in applying forces through leverage. Whenlower the interest rate, greater will be the profit; less the chance of loss, the amount borrowed. The lower will be theprofit or loss. This study helps to determine the financial risk of the company and to locate the current profitablefinancial decision regarding to the capital structure of the company. The study considers 5 companies financialleverages and for measuring the industry information takes as a base for analysing financial leverage. The studyoutcome will help to the companies to comparing their performance with the industry standards and evaluate theadequate capital structure of individual entities.
Key words: financial leverage, capital structure, financial risk, financial decision
Dr. Manoj Kumara N.V1
IntroductionFinancial leverage expressed as percentage change inEPS (Earnings per Share) and percentage change inEBIT (Earnings Before Interest & Tax) or also consideredas operating profit and the earnings available to equityshareholders by considerable investment on Fixedassets. It allows profitable financial decision on capitalstructure decision of the firms and measures the fixedcost proportion with adequate total capital of thecompany. When the firm admires to allocate the hugecapital from debt investment with high cost, then earningsfrom those assets, EPS & ROE (return on Equity) willdecrease drastically in the long run performance.However, when earnings are inadequate the leveragesresults in period of persisting adversity. The presence offinancial charges will imply that the shareholders willhave to bear the burden. Thus, the leverage – Trade onEquity will opposite direction such that the EPS, insteadof increasing will actually fall as a result of the use offunds carrying fixed cost.
Theoretical BackgroundPrasanna Chandra (2010) financial leverages emanatefrom the existence of fixed interest expenses. When acompany has fixed financial charges, 1% changes inEBIT leads to more than 1% change in PBT (Profit BeforeTax). M.Y.Khan (2014) the equity shareholders areentitled to the remainders of the operating profits of thefirm after all the prior obligations are met. It results fromthe presence of fixed financial charges in the firm’sincome stream. The financial leverage is concerned withthe effects of changes in EBIT on the earnings availableto equity shareholders. It defined as the ability of thefirm to use fixed financial charges to magnify the effects
of changes in EBIT on the EPS. In other words, emanatethe use of funds obtained at a fixed cost in the hope ofmaximising the returns to shareholders.
Favourable/positive Leverage considers firm earns moreon assets purchased than the fixed cost of their use.Uncomfortable/ negative leverage occurs when the firmdoes not earn as much as the fixed financial charges.
The firm is to earn more on assets that are acquired bythe use of funds on which a fixed financial charge is tobe paid. The use of fixed interest source of funds providesincreased return on equity investment without additionalrequirement of funds from the shareholders. Therefore,financial leverage is also called as ‘Trade on Equity’.
A firm should employ debt to the extent financial riskperceived by the shareholders does not exceed thebenefit of increased in EPS. It can be shows as follows(Table - 1).
A firm can avoid financial risk altogether if it have onlyequity in its capital structure but when no debt in capitalstructure. The equity shareholders will deprive of thebenefit of increase in EPS earnings from financialleverage. Financial leverage is a double edged sword.One hand, it increase EPS and on the other increasefinancial risk. A high financial leverage leads to high fixedfinancial charges and high financial risk (In terms of riskof insolvency increases).
Review of LiteratureM. Ramana Kumar (2014) concentrates on relationshipbetween leverages sand profitability of the firm. The studyuse both financial and statistical tools to analyse therelationship between leverages and profitability.Dr. K.
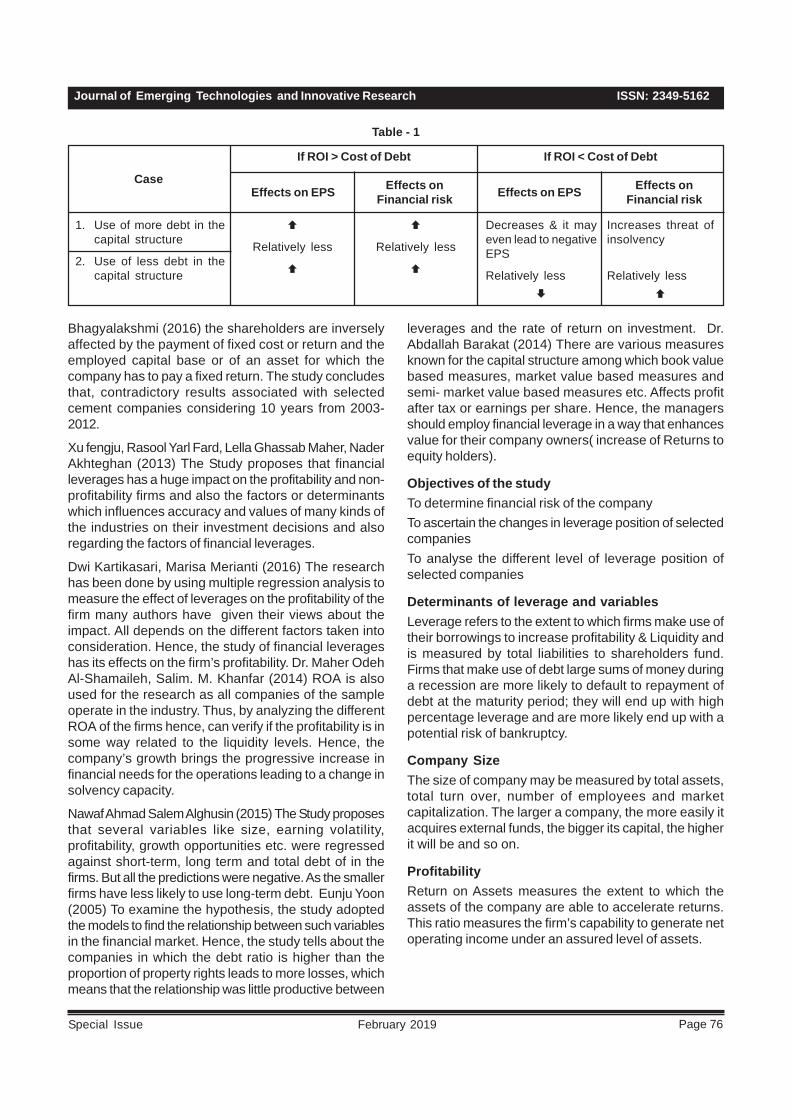
ISSN: 2349-5162Journal of Emerging Technologies and Innovative Research
Page 76February 2019Special Issue
Case
1. Use of more debt in thecapital structure
2. Use of less debt in thecapital structure
If ROI > Cost of Debt If ROI < Cost of Debt
Effects on EPS Effects onFinancial risk Effects on EPS Effects on
Financial risk
Relatively less Relatively less
Decreases & it mayeven lead to negativeEPS
Relatively less
Increases threat ofinsolvency
Relatively less
Table - 1
Bhagyalakshmi (2016) the shareholders are inverselyaffected by the payment of fixed cost or return and theemployed capital base or of an asset for which thecompany has to pay a fixed return. The study concludesthat, contradictory results associated with selectedcement companies considering 10 years from 2003-2012.
Xu fengju, Rasool Yarl Fard, Lella Ghassab Maher, NaderAkhteghan (2013) The Study proposes that financialleverages has a huge impact on the profitability and non-profitability firms and also the factors or determinantswhich influences accuracy and values of many kinds ofthe industries on their investment decisions and alsoregarding the factors of financial leverages.
Dwi Kartikasari, Marisa Merianti (2016) The researchhas been done by using multiple regression analysis tomeasure the effect of leverages on the profitability of thefirm many authors have given their views about theimpact. All depends on the different factors taken intoconsideration. Hence, the study of financial leverageshas its effects on the firm’s profitability. Dr. Maher OdehAl-Shamaileh, Salim. M. Khanfar (2014) ROA is alsoused for the research as all companies of the sampleoperate in the industry. Thus, by analyzing the differentROA of the firms hence, can verify if the profitability is insome way related to the liquidity levels. Hence, thecompany’s growth brings the progressive increase infinancial needs for the operations leading to a change insolvency capacity.
Nawaf Ahmad Salem Alghusin (2015) The Study proposesthat several variables like size, earning volatility,profitability, growth opportunities etc. were regressedagainst short-term, long term and total debt of in thefirms. But all the predictions were negative. As the smallerfirms have less likely to use long-term debt. Eunju Yoon(2005) To examine the hypothesis, the study adoptedthe models to find the relationship between such variablesin the financial market. Hence, the study tells about thecompanies in which the debt ratio is higher than theproportion of property rights leads to more losses, whichmeans that the relationship was little productive between
leverages and the rate of return on investment. Dr.Abdallah Barakat (2014) There are various measuresknown for the capital structure among which book valuebased measures, market value based measures andsemi- market value based measures etc. Affects profitafter tax or earnings per share. Hence, the managersshould employ financial leverage in a way that enhancesvalue for their company owners( increase of Returns toequity holders).
Objectives of the studyTo determine financial risk of the companyTo ascertain the changes in leverage position of selectedcompaniesTo analyse the different level of leverage position ofselected companies
Determinants of leverage and variablesLeverage refers to the extent to which firms make use oftheir borrowings to increase profitability & Liquidity andis measured by total liabilities to shareholders fund.Firms that make use of debt large sums of money duringa recession are more likely to default to repayment ofdebt at the maturity period; they will end up with highpercentage leverage and are more likely end up with apotential risk of bankruptcy.
Company SizeThe size of company may be measured by total assets,total turn over, number of employees and marketcapitalization. The larger a company, the more easily itacquires external funds, the bigger its capital, the higherit will be and so on.
ProfitabilityReturn on Assets measures the extent to which theassets of the company are able to accelerate returns.This ratio measures the firm’s capability to generate netoperating income under an assured level of assets.
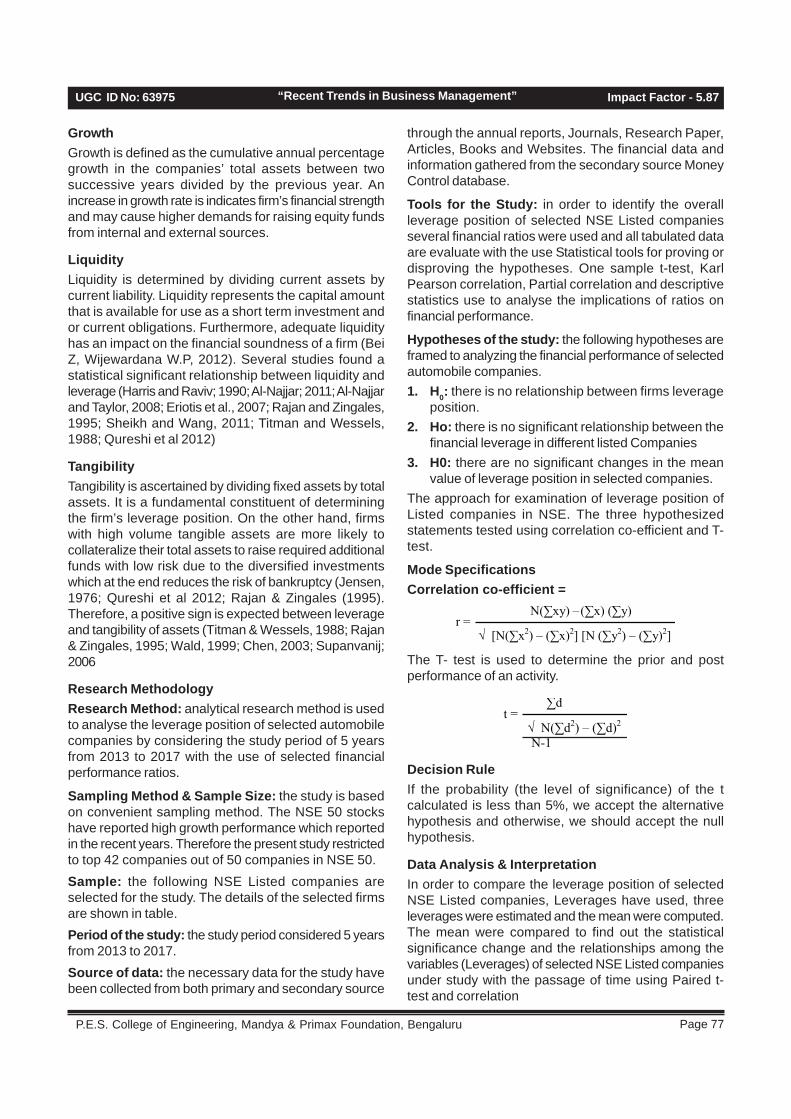
Page 77 P.E.S. College of Engineering, Mandya & Primax Foundation, Bengaluru
UGC ID No: 63975 Impact Factor - 5.87“Recent Trends in Business Management”
GrowthGrowth is defined as the cumulative annual percentagegrowth in the companies’ total assets between twosuccessive years divided by the previous year. Anincrease in growth rate is indicates firm’s financial strengthand may cause higher demands for raising equity fundsfrom internal and external sources.
LiquidityLiquidity is determined by dividing current assets bycurrent liability. Liquidity represents the capital amountthat is available for use as a short term investment andor current obligations. Furthermore, adequate liquidityhas an impact on the financial soundness of a firm (BeiZ, Wijewardana W.P, 2012). Several studies found astatistical significant relationship between liquidity andleverage (Harris and Raviv; 1990; Al-Najjar; 2011; Al-Najjarand Taylor, 2008; Eriotis et al., 2007; Rajan and Zingales,1995; Sheikh and Wang, 2011; Titman and Wessels,1988; Qureshi et al 2012)
TangibilityTangibility is ascertained by dividing fixed assets by totalassets. It is a fundamental constituent of determiningthe firm’s leverage position. On the other hand, firmswith high volume tangible assets are more likely tocollateralize their total assets to raise required additionalfunds with low risk due to the diversified investmentswhich at the end reduces the risk of bankruptcy (Jensen,1976; Qureshi et al 2012; Rajan & Zingales (1995).Therefore, a positive sign is expected between leverageand tangibility of assets (Titman & Wessels, 1988; Rajan& Zingales, 1995; Wald, 1999; Chen, 2003; Supanvanij;2006
Research MethodologyResearch Method: analytical research method is usedto analyse the leverage position of selected automobilecompanies by considering the study period of 5 yearsfrom 2013 to 2017 with the use of selected financialperformance ratios.
Sampling Method & Sample Size: the study is basedon convenient sampling method. The NSE 50 stockshave reported high growth performance which reportedin the recent years. Therefore the present study restrictedto top 42 companies out of 50 companies in NSE 50.Sample: the following NSE Listed companies areselected for the study. The details of the selected firmsare shown in table.Period of the study: the study period considered 5 yearsfrom 2013 to 2017.Source of data: the necessary data for the study havebeen collected from both primary and secondary source
through the annual reports, Journals, Research Paper,Articles, Books and Websites. The financial data andinformation gathered from the secondary source MoneyControl database.
Tools for the Study: in order to identify the overallleverage position of selected NSE Listed companiesseveral financial ratios were used and all tabulated dataare evaluate with the use Statistical tools for proving ordisproving the hypotheses. One sample t-test, KarlPearson correlation, Partial correlation and descriptivestatistics use to analyse the implications of ratios onfinancial performance.
Hypotheses of the study: the following hypotheses areframed to analyzing the financial performance of selectedautomobile companies.1. H0: there is no relationship between firms leverage
position.2. Ho: there is no significant relationship between the
financial leverage in different listed Companies3. H0: there are no significant changes in the mean
value of leverage position in selected companies.The approach for examination of leverage position ofListed companies in NSE. The three hypothesizedstatements tested using correlation co-efficient and T-test.
Mode SpecificationsCorrelation co-efficient =
The T- test is used to determine the prior and postperformance of an activity.
Decision RuleIf the probability (the level of significance) of the tcalculated is less than 5%, we accept the alternativehypothesis and otherwise, we should accept the nullhypothesis.
Data Analysis & InterpretationIn order to compare the leverage position of selectedNSE Listed companies, Leverages have used, threeleverages were estimated and the mean were computed.The mean were compared to find out the statisticalsignificance change and the relationships among thevariables (Leverages) of selected NSE Listed companiesunder study with the passage of time using Paired t-test and correlation

ISSN: 2349-5162Journal of Emerging Technologies and Innovative Research
Page 78February 2019Special Issue
1. To determine financial risk of the companyTable – 6.1 : Descriptive Statistics:
Company
TCS 1.349 0.903 1.222 1.771 0.027 1.621
Tata Cs 1.167 0.903 1.053 0.041 0.027 0.005
APL 1.087 1.030 1.120 0.017 0.017 0.015
AP & SL 1.265 1.193 1.502 0.121 0.092 0.062
ACL 1.216 1.207 1.465 0.115 0.113 0.172
AU PL 1.046 1.271 1.327 0.021 0.249 0.243
BAL 1.183 0.893 1.052 0.080 0.069 0.013
BFL 1.011 2.462 2.489 0.005 0.117 0.122
B AIRTEL 0.946 0.943 1.488 0.385 2.118 1.301
BI 1.373 1.127 1.493 0.289 0.312 0.288
BOSCH 1.298 0.974 1.258 0.099 0.087 0.047
BPCL 1.269 1.417 1.827 0.106 0.402 0.682
CIPLA 1.109 1.188 1.315 0.029 0.119 0.110
COAL 1.001 1.014 1.014 0.000 0.017 0.016
DR.REDDY 1.102 1.214 1.327 0.142 0.172 0.147
E MOTORS 1.187 0.913 1.079 0.095 0.062 0.014
GAIL 1.168 1.148 1.342 0.038 0.122 0.164
HCL 1.136 0.945 1.072 0.044 0.056 0.026
HEROMO 1.109 1.121 1.244 0.016 0.137 0.167
HINDUSTAN 1.189 0.892 1.056 0.089 0.070 0.006
HINDALCO 1.270 2.533 3.166 0.130 1.596 2.030
HPCL 1.188 1.801 2.165 0.048 0.800 1.058
IBHF 1.111 2.377 2.634 0.061 0.163 0.081
INFOSYS 1.210 0.884 1.069 0.035 0.030 0.010
IOC 1.293 1.546 1.995 0.173 0.517 0.672
ITC 1.111 0.967 1.074 0.022 0.022 0.005
L& T 1.407 0.943 1.326 0.060 0.022 0.058
LUPIN 1.055 1.036 1.091 0.052 0.064 0.019
MARUTI 1.150 1.320 1.514 0.066 0.157 0.162
MAHINDRA 1.236 1.028 1.266 0.105 0.069 0.038
NTPC 1.139 1.458 1.638 0.098 0.306 0.232
ONGC 1.143 1.455 1.657 0.057 0.158 0.116
PGCI 1.040 2.225 2.312 0.009 0.208 0.203
RELIANCE 1.243 1.108 1.377 0.045 0.044 0.079
SPI LTD -29.805 0.100 -0.713 71.164 0.690 2.960
Mean Standard Deviation
OperatingLeverage
FinancialLeverage
CombinedLeverage
OperatingLeverage
FinancialLeverage
CombinedLeverage
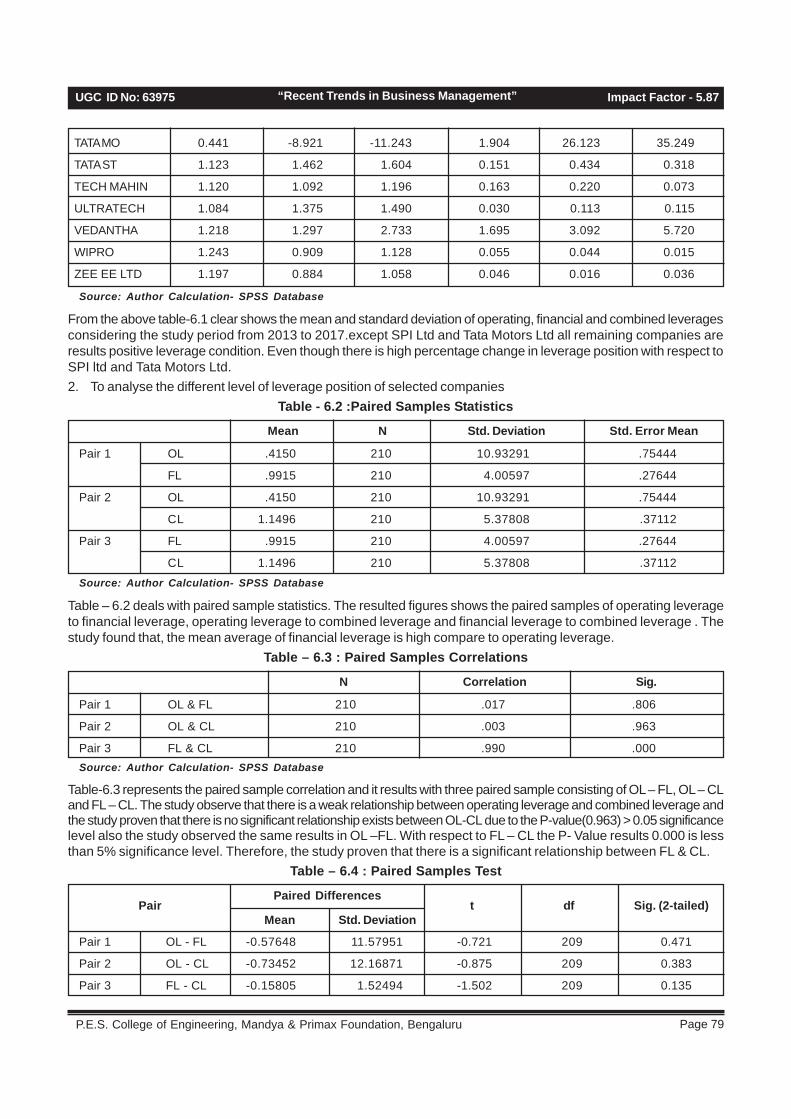
Page 79 P.E.S. College of Engineering, Mandya & Primax Foundation, Bengaluru
UGC ID No: 63975 Impact Factor - 5.87“Recent Trends in Business Management”
TATA MO 0.441 -8.921 -11.243 1.904 26.123 35.249
TATA ST 1.123 1.462 1.604 0.151 0.434 0.318
TECH MAHIN 1.120 1.092 1.196 0.163 0.220 0.073
ULTRATECH 1.084 1.375 1.490 0.030 0.113 0.115
VEDANTHA 1.218 1.297 2.733 1.695 3.092 5.720
WIPRO 1.243 0.909 1.128 0.055 0.044 0.015
ZEE EE LTD 1.197 0.884 1.058 0.046 0.016 0.036
Source: Author Calculation- SPSS Database
From the above table-6.1 clear shows the mean and standard deviation of operating, financial and combined leveragesconsidering the study period from 2013 to 2017.except SPI Ltd and Tata Motors Ltd all remaining companies areresults positive leverage condition. Even though there is high percentage change in leverage position with respect toSPI ltd and Tata Motors Ltd.2. To analyse the different level of leverage position of selected companies
Table - 6.2 :Paired Samples Statistics
Pair 1 OL .4150 210 10.93291 .75444
FL .9915 210 4.00597 .27644
Pair 2 OL .4150 210 10.93291 .75444
CL 1.1496 210 5.37808 .37112
Pair 3 FL .9915 210 4.00597 .27644
CL 1.1496 210 5.37808 .37112
Mean N Std. Deviation Std. Error Mean
Source: Author Calculation- SPSS Database
Table – 6.2 deals with paired sample statistics. The resulted figures shows the paired samples of operating leverageto financial leverage, operating leverage to combined leverage and financial leverage to combined leverage . Thestudy found that, the mean average of financial leverage is high compare to operating leverage.
Table – 6.3 : Paired Samples Correlations
Pair 1 OL & FL 210 .017 .806
Pair 2 OL & CL 210 .003 .963
Pair 3 FL & CL 210 .990 .000
N Correlation Sig.
Source: Author Calculation- SPSS Database
Table-6.3 represents the paired sample correlation and it results with three paired sample consisting of OL – FL, OL – CLand FL – CL. The study observe that there is a weak relationship between operating leverage and combined leverage andthe study proven that there is no significant relationship exists between OL-CL due to the P-value(0.963) > 0.05 significancelevel also the study observed the same results in OL –FL. With respect to FL – CL the P- Value results 0.000 is lessthan 5% significance level. Therefore, the study proven that there is a significant relationship between FL & CL.
Table – 6.4 : Paired Samples Test
Pair 1 OL - FL -0.57648 11.57951 -0.721 209 0.471
Pair 2 OL - CL -0.73452 12.16871 -0.875 209 0.383
Pair 3 FL - CL -0.15805 1.52494 -1.502 209 0.135
MeanPair
Std. Deviationt df Sig. (2-tailed)
Paired Differences
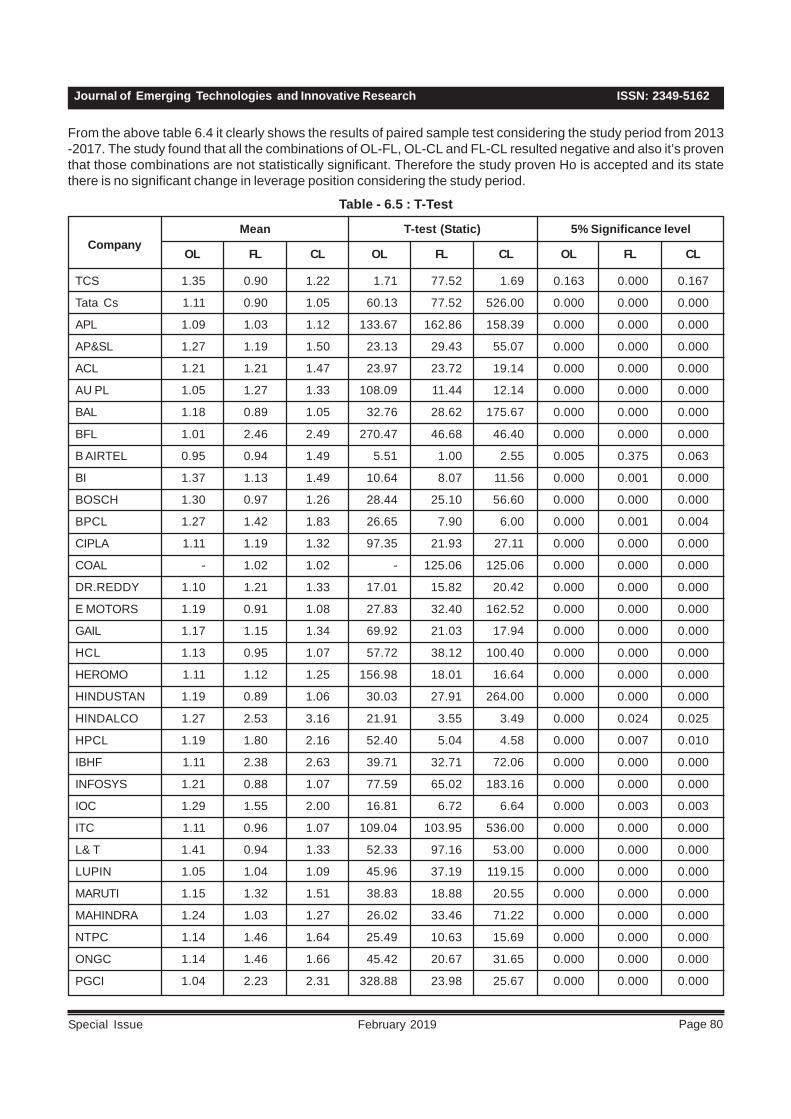
ISSN: 2349-5162Journal of Emerging Technologies and Innovative Research
Page 80February 2019Special Issue
From the above table 6.4 it clearly shows the results of paired sample test considering the study period from 2013-2017. The study found that all the combinations of OL-FL, OL-CL and FL-CL resulted negative and also it’s proventhat those combinations are not statistically significant. Therefore the study proven Ho is accepted and its statethere is no significant change in leverage position considering the study period.
Table - 6.5 : T-Test
Company
TCS 1.35 0.90 1.22 1.71 77.52 1.69 0.163 0.000 0.167
Tata Cs 1.11 0.90 1.05 60.13 77.52 526.00 0.000 0.000 0.000
APL 1.09 1.03 1.12 133.67 162.86 158.39 0.000 0.000 0.000
AP&SL 1.27 1.19 1.50 23.13 29.43 55.07 0.000 0.000 0.000
ACL 1.21 1.21 1.47 23.97 23.72 19.14 0.000 0.000 0.000
AU PL 1.05 1.27 1.33 108.09 11.44 12.14 0.000 0.000 0.000
BAL 1.18 0.89 1.05 32.76 28.62 175.67 0.000 0.000 0.000
BFL 1.01 2.46 2.49 270.47 46.68 46.40 0.000 0.000 0.000
B AIRTEL 0.95 0.94 1.49 5.51 1.00 2.55 0.005 0.375 0.063
BI 1.37 1.13 1.49 10.64 8.07 11.56 0.000 0.001 0.000
BOSCH 1.30 0.97 1.26 28.44 25.10 56.60 0.000 0.000 0.000
BPCL 1.27 1.42 1.83 26.65 7.90 6.00 0.000 0.001 0.004
CIPLA 1.11 1.19 1.32 97.35 21.93 27.11 0.000 0.000 0.000
COAL - 1.02 1.02 - 125.06 125.06 0.000 0.000 0.000
DR.REDDY 1.10 1.21 1.33 17.01 15.82 20.42 0.000 0.000 0.000
E MOTORS 1.19 0.91 1.08 27.83 32.40 162.52 0.000 0.000 0.000
GAIL 1.17 1.15 1.34 69.92 21.03 17.94 0.000 0.000 0.000
HCL 1.13 0.95 1.07 57.72 38.12 100.40 0.000 0.000 0.000
HEROMO 1.11 1.12 1.25 156.98 18.01 16.64 0.000 0.000 0.000
HINDUSTAN 1.19 0.89 1.06 30.03 27.91 264.00 0.000 0.000 0.000
HINDALCO 1.27 2.53 3.16 21.91 3.55 3.49 0.000 0.024 0.025
HPCL 1.19 1.80 2.16 52.40 5.04 4.58 0.000 0.007 0.010
IBHF 1.11 2.38 2.63 39.71 32.71 72.06 0.000 0.000 0.000
INFOSYS 1.21 0.88 1.07 77.59 65.02 183.16 0.000 0.000 0.000
IOC 1.29 1.55 2.00 16.81 6.72 6.64 0.000 0.003 0.003
ITC 1.11 0.96 1.07 109.04 103.95 536.00 0.000 0.000 0.000
L& T 1.41 0.94 1.33 52.33 97.16 53.00 0.000 0.000 0.000
LUPIN 1.05 1.04 1.09 45.96 37.19 119.15 0.000 0.000 0.000
MARUTI 1.15 1.32 1.51 38.83 18.88 20.55 0.000 0.000 0.000
MAHINDRA 1.24 1.03 1.27 26.02 33.46 71.22 0.000 0.000 0.000
NTPC 1.14 1.46 1.64 25.49 10.63 15.69 0.000 0.000 0.000
ONGC 1.14 1.46 1.66 45.42 20.67 31.65 0.000 0.000 0.000
PGCI 1.04 2.23 2.31 328.88 23.98 25.67 0.000 0.000 0.000
Mean
OL
T-test (Static) 5% Significance level
FL CL OL FL CL OL FL CL
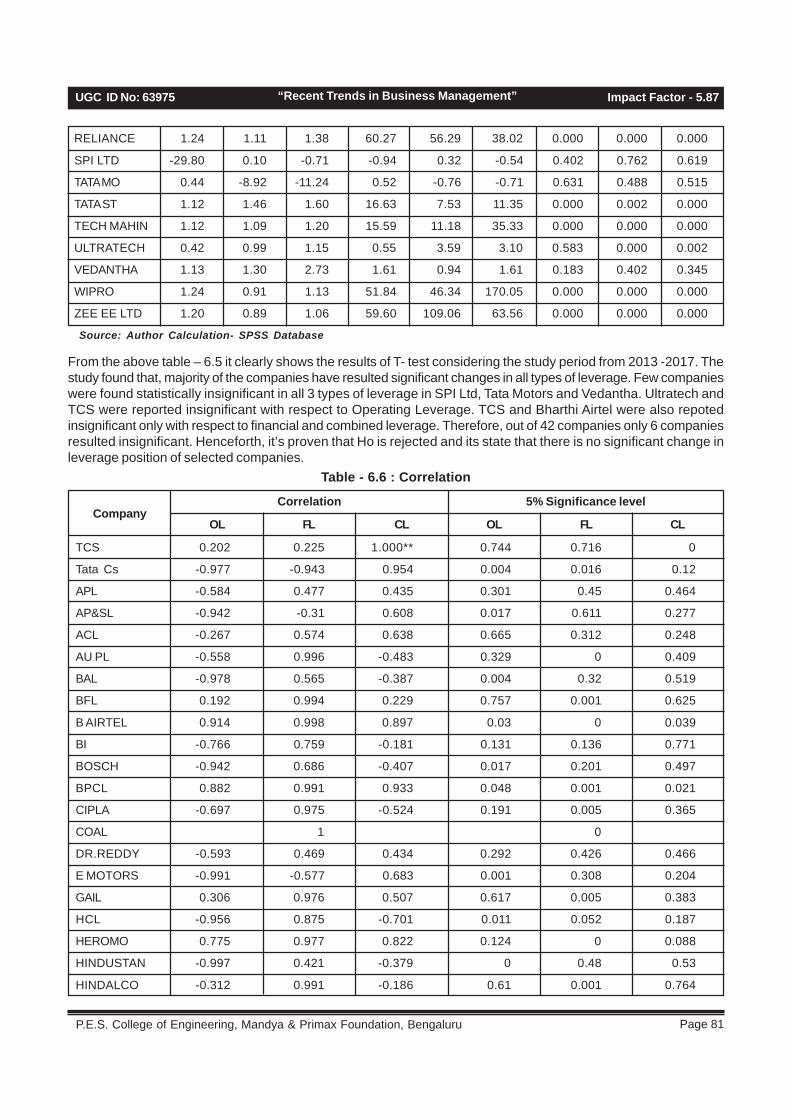
Page 81 P.E.S. College of Engineering, Mandya & Primax Foundation, Bengaluru
UGC ID No: 63975 Impact Factor - 5.87“Recent Trends in Business Management”
RELIANCE 1.24 1.11 1.38 60.27 56.29 38.02 0.000 0.000 0.000
SPI LTD -29.80 0.10 -0.71 -0.94 0.32 -0.54 0.402 0.762 0.619
TATA MO 0.44 -8.92 -11.24 0.52 -0.76 -0.71 0.631 0.488 0.515
TATA ST 1.12 1.46 1.60 16.63 7.53 11.35 0.000 0.002 0.000
TECH MAHIN 1.12 1.09 1.20 15.59 11.18 35.33 0.000 0.000 0.000
ULTRATECH 0.42 0.99 1.15 0.55 3.59 3.10 0.583 0.000 0.002
VEDANTHA 1.13 1.30 2.73 1.61 0.94 1.61 0.183 0.402 0.345
WIPRO 1.24 0.91 1.13 51.84 46.34 170.05 0.000 0.000 0.000
ZEE EE LTD 1.20 0.89 1.06 59.60 109.06 63.56 0.000 0.000 0.000
Source: Author Calculation- SPSS Database
From the above table – 6.5 it clearly shows the results of T- test considering the study period from 2013 -2017. Thestudy found that, majority of the companies have resulted significant changes in all types of leverage. Few companieswere found statistically insignificant in all 3 types of leverage in SPI Ltd, Tata Motors and Vedantha. Ultratech andTCS were reported insignificant with respect to Operating Leverage. TCS and Bharthi Airtel were also repotedinsignificant only with respect to financial and combined leverage. Therefore, out of 42 companies only 6 companiesresulted insignificant. Henceforth, it’s proven that Ho is rejected and its state that there is no significant change inleverage position of selected companies.
Table - 6.6 : Correlation
Company
TCS 0.202 0.225 1.000** 0.744 0.716 0
Tata Cs -0.977 -0.943 0.954 0.004 0.016 0.12
APL -0.584 0.477 0.435 0.301 0.45 0.464
AP&SL -0.942 -0.31 0.608 0.017 0.611 0.277
ACL -0.267 0.574 0.638 0.665 0.312 0.248
AU PL -0.558 0.996 -0.483 0.329 0 0.409
BAL -0.978 0.565 -0.387 0.004 0.32 0.519
BFL 0.192 0.994 0.229 0.757 0.001 0.625
B AIRTEL 0.914 0.998 0.897 0.03 0 0.039
BI -0.766 0.759 -0.181 0.131 0.136 0.771
BOSCH -0.942 0.686 -0.407 0.017 0.201 0.497
BPCL 0.882 0.991 0.933 0.048 0.001 0.021
CIPLA -0.697 0.975 -0.524 0.191 0.005 0.365
COAL 1 0
DR.REDDY -0.593 0.469 0.434 0.292 0.426 0.466
E MOTORS -0.991 -0.577 0.683 0.001 0.308 0.204
GAIL 0.306 0.976 0.507 0.617 0.005 0.383
HCL -0.956 0.875 -0.701 0.011 0.052 0.187
HEROMO 0.775 0.977 0.822 0.124 0 0.088
HINDUSTAN -0.997 0.421 -0.379 0 0.48 0.53
HINDALCO -0.312 0.991 -0.186 0.61 0.001 0.764
Correlation 5% Significance level
OL FL CL OL FL CL
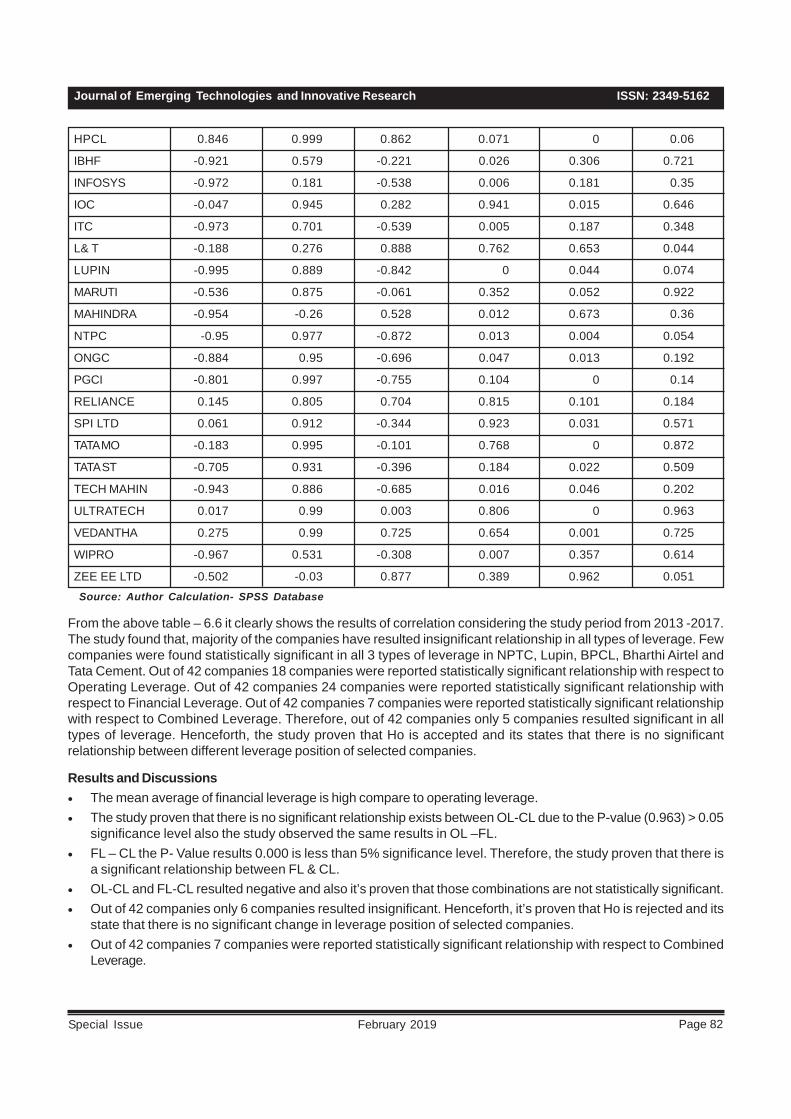
ISSN: 2349-5162Journal of Emerging Technologies and Innovative Research
Page 82February 2019Special Issue
HPCL 0.846 0.999 0.862 0.071 0 0.06
IBHF -0.921 0.579 -0.221 0.026 0.306 0.721
INFOSYS -0.972 0.181 -0.538 0.006 0.181 0.35
IOC -0.047 0.945 0.282 0.941 0.015 0.646
ITC -0.973 0.701 -0.539 0.005 0.187 0.348
L& T -0.188 0.276 0.888 0.762 0.653 0.044
LUPIN -0.995 0.889 -0.842 0 0.044 0.074
MARUTI -0.536 0.875 -0.061 0.352 0.052 0.922
MAHINDRA -0.954 -0.26 0.528 0.012 0.673 0.36
NTPC -0.95 0.977 -0.872 0.013 0.004 0.054
ONGC -0.884 0.95 -0.696 0.047 0.013 0.192
PGCI -0.801 0.997 -0.755 0.104 0 0.14
RELIANCE 0.145 0.805 0.704 0.815 0.101 0.184
SPI LTD 0.061 0.912 -0.344 0.923 0.031 0.571
TATA MO -0.183 0.995 -0.101 0.768 0 0.872
TATA ST -0.705 0.931 -0.396 0.184 0.022 0.509
TECH MAHIN -0.943 0.886 -0.685 0.016 0.046 0.202
ULTRATECH 0.017 0.99 0.003 0.806 0 0.963
VEDANTHA 0.275 0.99 0.725 0.654 0.001 0.725
WIPRO -0.967 0.531 -0.308 0.007 0.357 0.614
ZEE EE LTD -0.502 -0.03 0.877 0.389 0.962 0.051Source: Author Calculation- SPSS Database
From the above table – 6.6 it clearly shows the results of correlation considering the study period from 2013 -2017.The study found that, majority of the companies have resulted insignificant relationship in all types of leverage. Fewcompanies were found statistically significant in all 3 types of leverage in NPTC, Lupin, BPCL, Bharthi Airtel andTata Cement. Out of 42 companies 18 companies were reported statistically significant relationship with respect toOperating Leverage. Out of 42 companies 24 companies were reported statistically significant relationship withrespect to Financial Leverage. Out of 42 companies 7 companies were reported statistically significant relationshipwith respect to Combined Leverage. Therefore, out of 42 companies only 5 companies resulted significant in alltypes of leverage. Henceforth, the study proven that Ho is accepted and its states that there is no significantrelationship between different leverage position of selected companies.
Results and Discussions• The mean average of financial leverage is high compare to operating leverage.• The study proven that there is no significant relationship exists between OL-CL due to the P-value (0.963) > 0.05
significance level also the study observed the same results in OL –FL.• FL – CL the P- Value results 0.000 is less than 5% significance level. Therefore, the study proven that there is
a significant relationship between FL & CL.• OL-CL and FL-CL resulted negative and also it’s proven that those combinations are not statistically significant.• Out of 42 companies only 6 companies resulted insignificant. Henceforth, it’s proven that Ho is rejected and its
state that there is no significant change in leverage position of selected companies.• Out of 42 companies 7 companies were reported statistically significant relationship with respect to Combined
Leverage.
Page 83 P.E.S. College of Engineering, Mandya & Primax Foundation, Bengaluru
UGC ID No: 63975 Impact Factor - 5.87“Recent Trends in Business Management”
ConclusionThis study reveals that leverage has significantrelationship with firm’s performance. Even thoughselected firms have high debt ratio averaging they arestill able to manage their debts efficiently to produceprofits. Last, this research finds that leverages havesignificant change in selected companies. This findingis validated by assuming that other factors contributemore dominantly to operating efficiency, such factor asexpenses, costs, assets, and non-operating revenuesor loss, thus relationship between OL and FL becomestoo weak to be recognized Compare to OL- CL
Further research is expected to add more independentvariables and period of observation in examining the effectof profitability. Comparative study with other countriesin the same period with the same research methodologywould be beneficial for international investors.
References• Akhtar, S., & Oliver, B. (2009). Determinants of
Capital Structure for Japanese Multinational andDomestic Corporations. International Review ofFinance, 9, 1-26.
• Akhtar, S., & Oliver, B. (2009). Determinants ofCapital Structure for Japanese Multinational andDomestic Corporations. International Review ofFinance, 9, 1-26.
• Al-Najjar, B. (2011). The inter-relationship betweencapital structure and dividend policy: empiricalevidence from Jordanian data. International Reviewof Applied Economics, 25 (2), 209-224.
• Al-Najjar, B., Taylor, P. (2008). The relationshipbetween capital structure and ownership structure:new evidence from Jordanian panel data. ManagerialFinance, 34 (12), 919-933.
• Amalendu Bhunia (2012). Leverage Impact on FirmsInvestment Decision: A Case Study of IndianPharmaceutical Companies. International Journal ofContemporary Business Studies, 3, 1, 35-45.
• Chen, J.J. (2003). Determinants of Capital Structureof Chinese-Listed Companies. Journal of BusinessResearch, 57, 1341-1351.
• Dr. Abdullah Barakat, “The Impact of FinancialStructure, Financial Leverage and Profitability onIndustrial Companies Shares Value (Applied Studyon a Sample of Saudi Industrial Companies)”,Research Journal of Finance and AccountingISSN 2222-1697 (Paper) ISSN 2222-2847 (Online)Vol.5, No.1, 2014.
• Dr. K. Bhagyalakshmi (2016) “ Leverage Analysisin Selected Cement Companies”. Indian Journal ofResearch. PERIPEX, Vol.5, Issue.3, Mar-2016.
• Dr. Maher Odeh Al-Shamaileh, Salim. M. Khanfar,“The Effect of the Financial Leverage on theProfitability in the Tourism Companies (AnalyticalStudy- Tourism Sector- Jordan)”, Business andEconomic Research ISSN 2162-4860 2014, Vol. 4,No. 2.
• Dwi Kartikasari, Marisa Merianti, “The Effect ofLeverage and Firm Size to Profitability of PublicManufacturing Companies in Indonesia”, InternationalJournal of Economics and Financial Issues ISSN:2146-4138, International Journal of Economics andFinancial Issues, 2016, 6(2), 409-413.
• Eriotis N, Vasiliou D, Ventoura-Neokosmidi Z (2007).How firm characteristics affect capital structure: anempirical study. Managerial Finance, 33, 5, 321-331.
• Eunju Yoon, “The Effect of Financial Leverage onProfitability and Risk of Restaurant Firms”, Journalof hospitality financial management, The profeesionalreferred journal of the association of hospitalityfinancial management educators, volume 13, ISSUE1, Article 24, 1-1-2005.
• Gaud P., Jani E., Hoesli M. & Bender A. (2005). TheCapital Structure of Swiss Companies: An EmpiricalAnalysis Using Dynamic Panel Data. EuropeanFinancial Management 11, 1, 51-69.
• Hanafi, M.M., Halim, A. (2007), Financial StatementAnalysis [Analisa Laporan Keuangan]. Yogyakarta:UPP YKPN.
• Harris, M. & Raviv, A. (1991). The Theory of CapitalStructure. Journal of Finance. 46, 297-355.
• Jensen, M.C. and W.H. Meckling (1976). Theory ofthe firm: managerial behavior, agency costs andownership structure. Journal of FinancialEconomics, 3, 305-360.
• Liaqat Ali, (2011). The Determinants of Leverage ofthe Listed-Textile Companies in India. EuropeanJournal of Business and Management, 3, 12, 2011.
• M.Ramana Kumar (2014) “An Empirical Study onRelationship Between Leverage and Profitability inBeta India Ltd”, International Journal of AdvanceResearch in Computer Science and ManagementStudies.Vol.2, Issue.5, pp -1-9.
• NAWAF AHMAD SALEM ALghusin, “Do FinancialLeverage, Growth and Size Affect Profitability ofJordanian Industrial Firms Listed”, InternationalJournal of Academic Research in Business andSocial Science, April 2015, Vol. 5, No. 4 ISSN: 2222-6990.
• Qureshi, M.A., Imdadullah, M., Ahsan, T. (2012).What determines leverage in Pakistan? A panel dataanalysis. African Journal of Business Management,6, 3, 978-985.
ISSN: 2349-5162Journal of Emerging Technologies and Innovative Research
Page 84February 2019Special Issue
• Rajan, R.G., & Zingales, L. (1995).What Do WeKnow about Capital Structure? Some Evidence fromInternational Data. Journal of Finance, 50, 1421-1460.
• Rajan, R.G., & Zingales, L. (1995).What Do WeKnow about Capital Structure? Some Evidence fromInternational Data. Journal of Finance, 50, 1421-1460.
• Ross, S. (1977). The determination of financialstructure: The incentive signaling approach. BellJournal of Economics, 8, 23–40.
• Sheikh NA, Wang Z. (2011). Determinants of capitalstructure: An empirical study of firms inmanufacturing industry of Pakistan. ManagerialFinance, 37, 2, 117-133.
• Supanvanij, J. (2006). Capital Structure: Asian Firmsvs. Multinational Firms in Asia. The Journal ofAmerican Academy of Business, 10, 324-330.
• Titman, S., & Wessels, R. (1988). The Determinantsof Capital Structure Choice. The Journal of Finance,43, 1-19.
• Titman, S., & Wessels, R. (1988). The Determinantsof Capital Structure Choice. The Journal of Finance,43, 1-19.
• Wald, J. K. (1999). How Firm Characteristics AffectCapital Structure: An International Comparison.Journal of Financial Research 22, 2, 161-187.
Page 85 P.E.S. College of Engineering, Mandya & Primax Foundation, Bengaluru
UGC ID No: 63975 Impact Factor - 5.87“Recent Trends in Business Management”
PAPERLESS MOBILE TICKET BOOKING UTS APPLICATION:AN EXPLORATORY STUDY OF REGION THANE.
Abstract
With the advent of 21st century, India is moving toward digitalization. Digitalization is helping people to move towardan economy which is cashless and paperless. Our Indian railways are also adopting digitalization with the help ofpaperless online ticket booking application known as UTS (Unreserved Ticketing System). The government providesthis facility for the convenience of the passenger. The main advantage of this application is if the passenger booktickets online then the ticket is sent directly to the mobile and there is no need for printed tickets which makes it apaperless process. Digital payment indirect reduces expenditure for the printing of currency notes, restriction ofcorruption, black money circulation and helps in the growth of the economy. But the usage of this application is quiteless. Therefore, my research focuses on the awareness level of people regarding the digitalized ticket bookingprocess by UTS application. The primary purpose is to study the awareness level and also finding the factors thatpositively and negatively influence the usage of this application. It will help in giving suggestions to the officials formaking strategies regarding increasing the usage of the application and thereby growth of the economy. The datawere collected from the train travellers of the region of Thane by the help structured questionnaires. The questionnairewas grounded on the TAM (Technology Acceptance Model) model. Data analysis was done with the help of SPSS.Result put forward a model which consisted of factors Perceived Usefulness, Perceived Benefits, Trust, Risk andPerceived Ease of Use. Results of the study show that trust is the most important factor in comparison to the risk.Moreover, age and occupation play an important factor in the adoption of technology. Strategies should be made toimprove the trust of the consumer in comparison to work on the risk factor.
Keywords: Digitalization, UTS, TAM, Demographics, Factors
IntroductionDigitalization is the use of technology in the variousbusiness process. There is a change in the socialinteraction in Indians due to digitalization. Digital Indiais the buzz of today’s generation. This has been broughtby the government of India for modernization andremoving all the geographical barriers all over the world(Chaudhuri and Kumar, 2015). There is an impact ofdigitalization both on the private and the public sector.Digitalization has been promoted to the peak under theleadership of Prime Minister Mr Narendra Modi. Theservices are made available to the common man on theonline portals which made the process to be moretransparent and convenient. Everyone remembers whencomputers where introduced not only to the private sectorbut also to the public sector. These real changes arevisible to every citizen in the economy. Similarly, ishappening in the physical transaction of cash, whichwill be considered as to be history in the coming worldbecause the economy is moving towards paperlesstransaction (Gupta, 2017).
The Government emphasized on, going cashless whichwas with a view to impede the operations of the parallelEconomy which was detrimental to the interest of theCountry. Through the process of digitalization, the aim
Aarti Vikmani1 Dr. Meenakshi Malhotra2
of the government is going paperless and the railwaysare also taking a step in this direction by introducingvarious schemes (Nag, 2018). The Indian Railways haskick-started a massive effort to digitize its archivesacross the country that will cover about 25 million pagesof railway history (PTI, 2018). Digitalization with respectto online ticket booking is consumer-centric. Most ofthe railways in the metro cities have implemented thismodel of mobile ticket booking is transparent with respectto the price and the complexity of the situation has beenremoved (ARC Advisory Group, 2018).
Theoretical frame workFirstly, there was Theory of Reasoned Action (TRA) modelwhich was considered to be one of the most importantand widely accepted models of persuasion that considersthe various aspect of the individual performing a definitebehaviour. This theory was developed by Martin Fishbeinand Icek Ajzen in 1967 it is also used in communicationdiscourse as a theory of understanding. It is an extensionof the model based on attitude, the theory of attitude.This theory suggested a relationship between attitudeand behavioural intentions but this theory was questionedin the 1960s because attitude theories were not provingto be good indicators of human behaviour.
1 . Dr. VN Bedekar Institute of Management Studies, Maharashtra.2 . Assistant Professor, DR. VN Bedekar Institute of Management Studies, Maharashtra.

ISSN: 2349-5162Journal of Emerging Technologies and Innovative Research
Page 86February 2019Special Issue
Further, a new model has been introduced which is known Technology Acceptance Model (TAM) which was projectedby Fred Davis in 1989. This theory includes how a user comes to accept and use technology. TAM includes therelationship between the behaviour and the external variables which include beliefs of the individual, attitudes ofindividual, and usage of the system.
PerceivedUsefulness
(U)
PerceivedEase of use
(E)
AttitudeTowardsUsing (A)
BehaviouralIntention to
Use (BI)
ActualSystem UseExternal
Variables
Flow Chart - 1
This model is used in finding out the factors that are influencing the individual in the adoption of the technology.These factors are the driving force for the individual for the acceptance of the technology.
Literature reviewAmin et. al. (2016) defined E-commerce as the transactions that are taking place on the online portals for thebuying of the goods and the services. The manufactures and the customers are affected to a significant level by theintroduction of E-commerce. The model of the business has to be changed by the development that is happeningacross the globe with respect to E-commerce. Even the Small and Medium Enterprise are using E-commercefacility to compete with the large organizations. E-commerce has significant influences on the environment. Althoughthis model is accepted and used in businesses still e-commerce is not explored fully.
Singh and Sinha (2017) studied that India consists of more than 900 million mobile users, but only 40 million aremobile banking users. There can be several reasons being this such as the need for active collaboration betweenbanks and Telecom Company, lack of accessibility to customers, cost, awareness about the mobile banking appetc. Mobile banking awareness has to be created amongst banks to the customers. The customer has differentviews on mobile banking services provided by their service providers. We need to study the impact of mobilebanking on customer experience after using mobile banking.
Kumar et. al. (2015) emphasized the importance of mobile communication and the internet banking facility availablefor the daily use of investors. The time and the cost factor have been reduced by the introduction of mobile banking.The research describes the history and the changes that the mobile baking has brought the life of the common man.Though such facilities are provided with the risk factor associated cannot be ignored. There is a risk to the securityof the transaction and the security of the information provided by the individual.
Ara (2015) find out that India is having a great market potential for investment in which E-commerce is one of thehighest growing business. E-commerce has been a huge change in investment. Due to more and more use ofmobile and Internet has enhanced e-commerce in both urban and rural areas. The research describes the currentstatus of e-commerce in India and the challenges which the different players are facing as a result of the e-commerce.
Rationale of studyWith the advent of 21st century, India is moving toward digitalization. Digitalization is helping people to move towardan economy which is cashless and paperless. Our Indian railways are also adopting digitalization with the help ofpaperless online ticket booking application known as UTS (Unreserved Ticketing System). The government providesthis facility for the convenience of the passenger. Therefore, this research focus on the awareness level of peopleregarding the digitalized ticket booking process by UTS application. Secondly to find out the factor that positivelyand negatively influence the usage of this application.
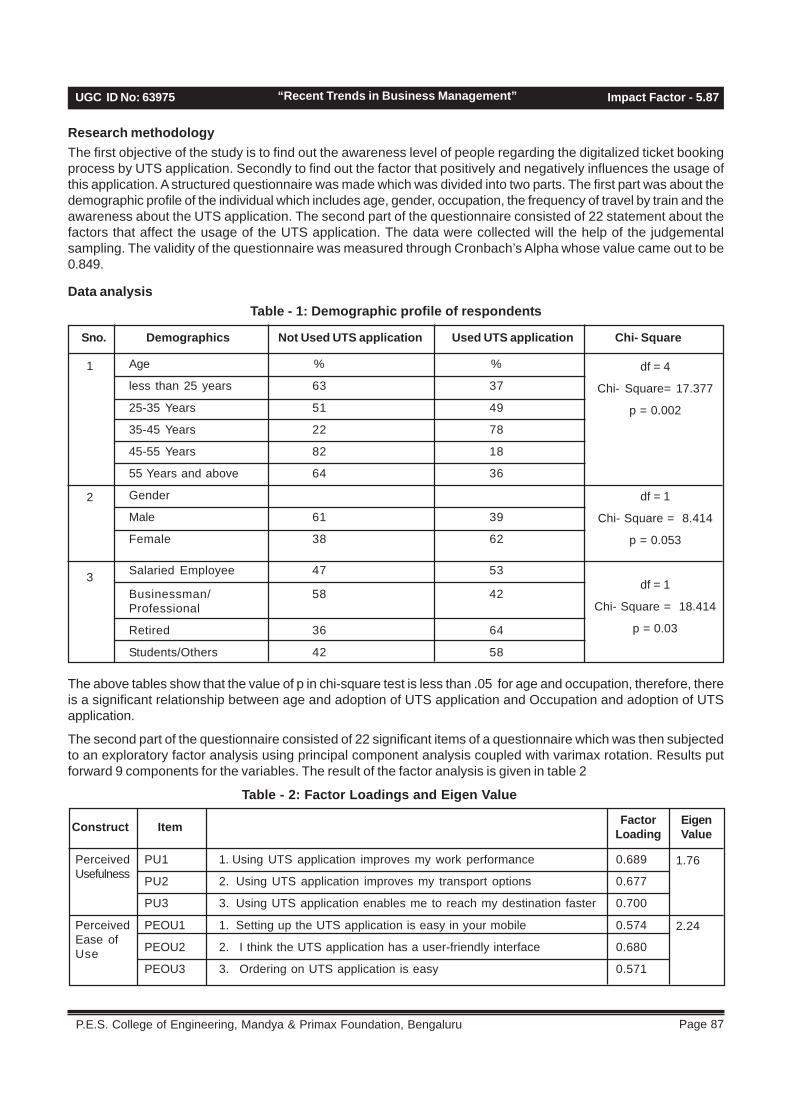
Page 87 P.E.S. College of Engineering, Mandya & Primax Foundation, Bengaluru
UGC ID No: 63975 Impact Factor - 5.87“Recent Trends in Business Management”
Research methodologyThe first objective of the study is to find out the awareness level of people regarding the digitalized ticket bookingprocess by UTS application. Secondly to find out the factor that positively and negatively influences the usage ofthis application. A structured questionnaire was made which was divided into two parts. The first part was about thedemographic profile of the individual which includes age, gender, occupation, the frequency of travel by train and theawareness about the UTS application. The second part of the questionnaire consisted of 22 statement about thefactors that affect the usage of the UTS application. The data were collected will the help of the judgementalsampling. The validity of the questionnaire was measured through Cronbach’s Alpha whose value came out to be0.849.
Data analysisTable - 1: Demographic profile of respondents
Sno. Demographics Not Used UTS application Used UTS application Chi- Square
Age % %
less than 25 years 63 37
25-35 Years 51 49
35-45 Years 22 78
45-55 Years 82 18
55 Years and above 64 36
Gender
Male 61 39
Female 38 62
Salaried Employee 47 53
Businessman/ 58 42Professional
Retired 36 64
Students/Others 42 58
1
2
3
df = 4
Chi- Square= 17.377
p = 0.002
df = 1
Chi- Square = 8.414
p = 0.053
df = 1
Chi- Square = 18.414
p = 0.03
The above tables show that the value of p in chi-square test is less than .05 for age and occupation, therefore, thereis a significant relationship between age and adoption of UTS application and Occupation and adoption of UTSapplication.
The second part of the questionnaire consisted of 22 significant items of a questionnaire which was then subjectedto an exploratory factor analysis using principal component analysis coupled with varimax rotation. Results putforward 9 components for the variables. The result of the factor analysis is given in table 2
Table - 2: Factor Loadings and Eigen Value
EigenValue
1.76
2.24
Construct Item FactorLoading
PerceivedUsefulness
PerceivedEase ofUse
PU1
PU2
PU3
PEOU1
PEOU2
PEOU3
1. Using UTS application improves my work performance
2. Using UTS application improves my transport options
3. Using UTS application enables me to reach my destination faster
1. Setting up the UTS application is easy in your mobile
2. I think the UTS application has a user-friendly interface
3. Ordering on UTS application is easy
0.689
0.677
0.700
0.574
0.680
0.571

ISSN: 2349-5162Journal of Emerging Technologies and Innovative Research
Page 88February 2019Special Issue
Attitude
SubjectiveNorms
Intention
Trust
PEOU4
A1
A2
A3
A4
SN1
SN2
SN3
SN4
I1
I2
T1
T2
T3
T4
T5
4. The payment process of UTS application is effortless
1. I am positive towards the introduction of UTS application
2. I think that UTS application serves a good purpose
3. I think I can save time by using UTS application
4. I think using UTS application is comfortable
1. The public opinion about UTS application in general is positive
2. It is important for me what the public thinks about UTS application
3. The media attention UTS application affects my willingness to use the service
4. My close friends use UTS application
1. I intend to use the UTS application in the future
2. Given all the resources I will always use it
1. Transactions can be easily refunded
2. Errors can be easily reversed
3. I believe that data sent is confidential
4. I get immediate confirmation of the transaction
5. Nobody else could accept the transaction as me
0.530
0.675
0.607
0.608
0.568
0.765
0.633
0.501
0.521
0.704
0.574
0.831
0.733
0.521
0.636
0.593
1.07
4.09
0.73
12.23
The above table shows that the six important factors are Perceived Usefulness, Perceived Ease of Use, Attitude,Subjective Norms, Intention and Trust. Only those variables were considered whose factor loadings were greater orequal to 0.500
Table - 3 : Factor and Variance explained
S No. Factor % Variance explained
1 Trust 55.584
2 Perceived Ease of Use 10.179
3 Perceived Usefulness 7.987
4 Attitude 4.880
5 Subjective Norm 4.085
6 Intention 3.333
According to the variance explained data trust came out to be the most important factor that affects the usage ofUTS application for ticket booking.
Discussion and future implicationTravelling by train is made difficult by standing in the queue for the ticket booking. This painful problem has beensolved by the India Railways through UTS application. This is the official application for booking unreserved tickets.This has provided convenience to the consumer but the usage of the application is limited. This research shows thatthe usage of the application is limited by the users. The usage is more in the case of 25 years and 35 year agegroup. But the usage is not dependent on gender. Since the age and occupation affects the adoption of the UTSapplication, therefore, such target audience should be selected. Secondly, trust plays an important role in theusage of the UTC application. People are fearful about the involvement of the personal information and the onlinemoney transactions. Awareness level should be provided to the people regarding the security of the information andthe money tractions. Since the application is used by the skilled and unskilled population, therefore, the interfaceshould be easy and user-friendly.
Page 89 P.E.S. College of Engineering, Mandya & Primax Foundation, Bengaluru
UGC ID No: 63975 Impact Factor - 5.87“Recent Trends in Business Management”
The future research should focus on the other parameterswhich are psychological in nature. Secondly determinesshould be identified which have moderating and themediation effect on the usage of the UTS application.
References• Ngai, E. W., & Gunasekaran, A. (2007). A review for
mobile commerce research andapplications. Decision support systems, 43(1), 3-15.
• Kumar, A., Sikdar, P., & Makkad, M. (2015). Onlinebanking adoption: A factor validation and satisfactionΧausation study in the context of Indian bankingcustomers. International Journal of BankMarketing, 33(6), 760-785.
• Sinha, P., & Singh, S. (2017). Comparing risks andbenefits for the value enhancement of onlinepurchases. Gadjah Mada International Journal ofBusiness, 19(3), 307.
• Rezaei, S., Ali, F., Amin, M., & Jayashree, S. (2016).Online impulse buying of tourism products: The roleof web site personality, utilitarian and hedonic webbrowsing. Journal of Hospitality and TourismTechnology, 7(1), 60-83.
• Shaikh, A. A., & Karjaluoto, H. (2015). Mobilebanking adoption: A literature review. Telematics andInformatics, 32(1), 129-142.
• Amin, M., Rezaei, S., & Tavana, F. S. (2015). Genderdifferences and consumer’s repurchase intention: theimpact of trust propensity, usefulness and ease ofuse for implication of innovative onlineretail. International Journal of Innovation andLearning, 17(2), 217-233.
• Brutu, M., & Mihai, D. (2018). E-COMMERCE–ANEXPANDING ALTERNATIVE OF THE TRADITIONALSALE IN THE WORLD AND IN ROMANIA. Lucrãri‘tiinifice Management Agricol, 20(1), 17.
ISSN: 2349-5162Journal of Emerging Technologies and Innovative Research
Page 90February 2019Special Issue
VIRTUAL REALITY IN MBA- EMERGING BRANDING TOOL
AbstractPost World Financial Crisis learning, the enthusiasm to continually improve the educational occurrence of students hasbeen growing steadily around the world. We are now in Digital World where we are bounded to connect at a common,seamless connectivity shaping how we learn by leveraging students learning experience and advance motivation andachievement. So, it has become imperative to encourage thinking out of box while delivering world class teaching tostudents in ways that go beyond the mere exchange of information. Modern education often requires a student tocomprehend complex or abstract concepts or appreciate scenarios and situations that no longer exist. “In this fast,rapidly-changing business environment, we need innovation to compete at different levels. And the first step for innovationis creativity, this paper conceptually designed in implementing Virtual Reality, a Futuristic Tool which can boost studentexperience and as well as act as principal Marketing application as branding tool for Management Institutes
Keywords: Virtual Reality, Consumer Behavior, Learning, Student Experience, Branding Tool, Promotion
IntroductionWe know the world through our faculties and recognitionframeworks. In school we as a whole discovered that wehave five detects: taste, contact, smell, sight and hearing.These are anyway just our most clear sense organs.Truly people have numerous a larger number of facultiesthan this, for example, a feeling of equalization forinstance. These other tangible contributions, in additionto some extraordinary handling of tactile data by ourcerebrums guarantees that we have a rich stream of datafrom nature to our brains. Another significant moveoccurring in b-schools is the emphasis on innovationenhanced substance. Today, b-schools discuss Big Data,Artificial Intelligence and investigation in all territories,for example, showcasing, HR and fund. One thing thatall best b-schools on the planet appear to concur uponis that training will end up virtual, as soon as possible. Adecent case of how virtual reenactment can enableunderstudies to rehearse abilities is open talking. Bythe by, educating is a workmanship however would webe able to structure a showing craftsmanship which makeunderstudies ponder subject effectively and FuturisticTeaching help can transport Student creative ability toall together new involvement with mixed learning in thepresent training, Virtual Reality - A blend of Instructor-drove and e-encouraging which is relied upon to be a$75 billion industry by 2021, as per Greenlight Insights,there’s most likely that augmented experience will havea major effect.
MeaningAccording to Wikipedia, Virtual reality (VR) is aninteractive computer-generated experience taking place
Dr (Hc). D. M. Arvind Mallik1
within a simulated environment, that incorporates mainlyauditory and visual, but also other types of sensoryfeedback like haptic. This immersive environment canbe similar to the real world or it can be fantastical, creatingan experience that is not possible in ordinary physicalreality. Augmented reality systems may also beconsidered a form of VR that layers virtual informationover a live camera feed into a headset or through asmartphone or tablet device giving the user the ability toview three-dimensional images.
Virtual reality in academics- new paradigm shiftAdvanced education has dependably been prolific groundfor the formation of new, limit pushing innovation. WhileVR programming and equipment advancement have been,to date, to a great extent the area of new businessesand huge tech organizations, it’s schools and collegesthat are utilizing the innovation in probably the mostintriguing ways. Augmented Reality is actualized by amix of advances that are utilized with the end goal topicture and furnish association with a virtual situation.These conditions regularly delineate three-dimensionalspace which might be sensible or nonexistent, plainlyvisible or minute and dependent on practical physicallaws of elements, or on fanciful elements. As we moveinto 2018, there’s been much discussion on whethercomputer generated reality has satisfied the promotion.While augmented reality amusements have turned outto be to a great degree mainstream, there’s still spacefor development in different divisions, particularly inscholastics and learning. Be that as it may, there havebeen defenders for the reception of computer generatedreality in instruction. As per an ongoing study sponsored
1. Asst. Professor. Dept of MBA, PESITM, Shivamogga.

Page 91 P.E.S. College of Engineering, Mandya & Primax Foundation, Bengaluru
UGC ID No: 63975 Impact Factor - 5.87“Recent Trends in Business Management”
by Samsung, 92 percent of instructors bolster theappropriation of computerized innovations in instructiveconditions and 48% of educators were available to utilizingVR in the classroom. Tech monster HTC is apparentlyworking with designers to make training VR content andfurthermore on an online entry for educators.(Juegostudio, 2017). So it’s not astonishing that educatorsand understudies are diving into all aspects of theinnovation to see how it will affect us, and ideally improveour lives.
A new role for teachersThe transition from analog teaching practices to digitalones is going to change what teaching looks like. Therole of a teacher will change from content delivery tocontent facilitation. Teachers will be focused on creatingconditions for exploring, rather than providing ready-madeknowledge.
Our changing understanding of immersiveexperiencesIt’s clear we’re in the early stages of VR — and it’s goingto keep changing. However, technology will continue topush boundaries of how immersive VR can become.We’re even going to see advancements in eye trackingand body tracking in coming years. What we consideran immersive experience today will be considered tablestakes in the not-too-distant future.
Impact of virtual reality on educationAs expressed before. VR in instructive space is still atearliest stages phase of making enormous effect onunderstudy learning knowledge in days to come. We planto upgrade the instructive experience of studentsworldwide decidedly impacting commitment,maintenance and want to learn. We realize that there isa requirement for school organization and educators toknow about such learning encounters and that it is criticalfor them to get the information expected to adviseinstructive choices. There are two different ways ofutilizing augmented reality in the classroom: the principalincludes a customary work area set up in which theunderstudy investigates a virtual situation utilizing a PC,console and mouse. Or on the other hand utilize someother information gadget, e.g. controller (like the Wiiremote controller). We firmly trust that instructors arethe foundation of classrooms, and their comprehensionof the new advances accessible is critical. With that inmind, we have a similarly solid thoughtfulness regardingannouncing and examination.1. Retention
Research suggests that visualization and a VRenvironment strengthen the connection between astudent and a concept, heightening retention.
2. EngagementIt is about participating in the learning process, havingactual/virtual experiences, and enjoying the process,which heightens engagement.
3. Distraction freeWhen students are inside a virtual environment, theyare far less prone to distractions such as otherstudents, phones, and so on.
Virtual reality in business managementThe previous two decades have seen the improvement ofanother flood of research in the field of computer generatedreality. Its essential utilize was believed to be stimulation,however as research proceeded with the applications tomore viable territories, we perceive how all types oforganizations can and are profiting from augmented realityinquire about. Quickly talks about the examination beingled for different enterprises, and how that exploration willprofit and is profiting those businesses (Himanshu Patel,Richard Cardinali, (1994). Programming like PowerPoint,for instance, which has for some time been utilized asan instruction apparatus, wasn’t intended for training. Inany case, it has been a staple apparatus in trainingsettings, utilized as an approach to show data in layout,nibble estimate positions. The utilization of advancedadvances sees a few instructors and understudiesexhibiting data utilizing layouts, which implies a greatpart of the individual character of educators’ practicescan be lost. While the specialized aptitudes related withthis sort of work are past the limits of numerouseducators, propels in the manner in which we can programthese sorts of devices mean this is probably going to bea genuine alternative for some instructors sooner ratherthan later. The experience gives the material to thedevelopment of a psychological model of the idea, whichthus prompts the establishment of information (Duffy andJanssen, 1992). Teachers around world are on anenergetic minute in reshaping people to come and hasseen a worldview change since most recent 5 years,interruption by advanced innovation will occur at anexponential and it’s very difficult to discuss it withoututilizing innovation. By submerging them in a virtualsituation where they need to lead, work together andtake care of issues with one another, they encounterthat it is so testing to lead in a computerized and howthe present Business Management foundations will survive(Alyssa Walker,2018). It makes a difference how wewanting to incorporate substance into this coursecenters around how Faculty associate with others for allintents and purposes and how Students see!
Business schools’ interest points to a lucrative potentialmarket tech groups leading VR development. Annualsales for head-mounted display units are poised to hit

ISSN: 2349-5162Journal of Emerging Technologies and Innovative Research
Page 92February 2019Special Issue
24 million by 2020, according to Future SourceConsulting.
VR as branding toolSince Virtual Reality going spots in the meantime, itanxious to encourage various applications crosswise overdifferent enterprises and Sector. From being utilized inmaking vivid gaming background, augmented realitystores, land virtual walkthroughs to informationrepresentation and cross-geographic individual’scooperation apparatuses – VR opens a radical newstatistic of business potential outcomes that have beenas of not long ago, unfathomable.
Areas1. Academics1. Each Specialization can enhance VR into subjects
by giving specialized treatment2. Institute can initiate VR course on Business
Management and Executive Level1. FacilitateVocation Expedition-Getting introduction to variousprofessions is a fundamental piece of the learningprocedure. From early adolescence, we long for what weneed to be the point at which we grow up, and thosefantasies are normally enlivened by the experts in ourlives. Frequently, we get this comprehension through entrylevel positions. VR can help widen understudies’presentation to professions. It enhances individuals’capacity to envision themselves in others’ shoes.Profession endeavors indicate what it resembles to workin a field — understudies can investigate multi day insomebody’s vocation, see what individual is examining,and comprehend what a man likes — or doesn’t care for— about their activity. Thus, the experience getscomfortable to understudies.
Group Learning- Some of the most vital information wegain doesn’t originate from what we get notification frominstructors, but instead from collegiality and discussion.VR gives the chance to make learning encounters socialby enabling understudies to speak with one another.Utilizing symbols and mapped outward appearances,individuals can meet up to talk about, orchestrate, andgain from each other.
Distance Learning-VR enables us to cross over anybarrier among teachers and students. With VR, removelearning devices can assemble instructors andunderstudies in a similar live with advanced portrayals ofthemselves — educators can transport into the VR worldand guide understudies through their encounters.
Enhance Creativity-VR is valuable for substanceutilization, as well as incredible for substance creation.By giving understudies great apparatuses, for example,
Tilt Brush, you enable them to help their inventiveness.“Understudies go up against various business ventureswhich are created with genuine associations. They mustbe business visionaries as they enable genuineassociations to tackle genuine issues
Visual Learning- VR is extremely useful for thisgathering of students. Rather than finding out aboutthings, understudies can really observe the things they’refinding out about. Having the capacity to imagine complexcapacities or components makes them less demandingto fathom. he understudies overlaid the 360 visits withpicture and video hotspots, to give important relevantdata. The outcome was a fantastically vivid and importantVR and classroom encounter, which was all madeconceivable at a sensible value point give the prevalenceof 360 cameras and minimal effort VR headsets available.
Social Phobia- Most individuals are not conceived openspeakers; they are prepared to end up one. When theyend up in circumstances where they turn into the focalpoint of consideration as they need to address a groupof people, they encounter feelings like dread andnervousness, prompting queasiness and unreasonableperspiring. A large portion of them endeavor to dodgecircumstances where they need to perform or talk out inthe open, however when unavoidable, suchcircumstances are continued by misery. Open talkinguneasiness is exceptionally regular among bothunderstudies and the overall public. People with opentalking nervousness regularly maintain a strategicdistance from tension delivering social or executioncircumstances, yet when unavoidable, thesecircumstances are persisted with sentiment of extremeuneasiness and pain.
2. Marketing ToolPromotional Tool – With VR in capacity to give eliteexperience to consumer, Educational Institute can useVirtual Reality in promoting Institutes more professionallyand attract student’s community to can enhance trueand enigmatic experience with VR Tour with 360 Degreethrough Website
VR for AdmissionsLike marketing, advanced education affirmations expertswill have numerous approaches to profit by computergenerated reality, for example, giving more tweakedencounters dependent on the particular interests of aprospect. Intrigued by expressions of the humanexperience? Maintainability? Music? Business? Law?Tennis? And so on – confirmations experts will have thecapacity to effortlessly give altered VR encounters takinginto account interests of Students and parents alike.
Moreover, confirmations experts will have the capacityto connect with prospects in the virtual world with the
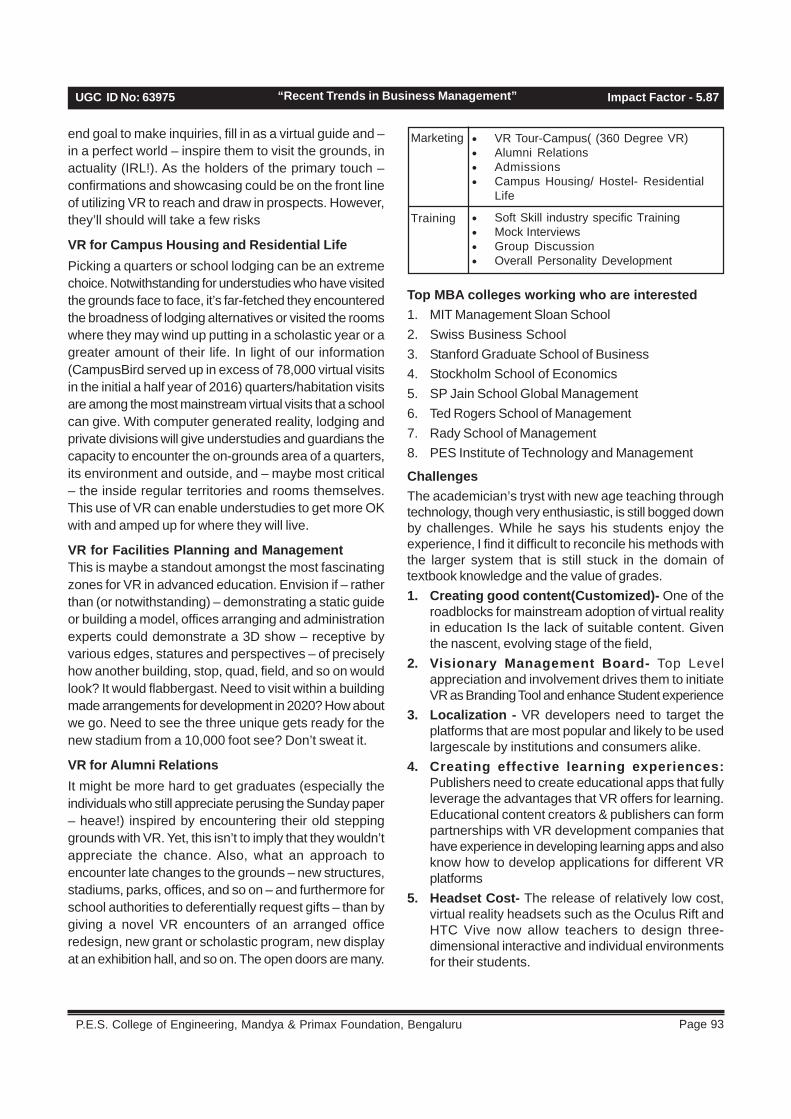
Page 93 P.E.S. College of Engineering, Mandya & Primax Foundation, Bengaluru
UGC ID No: 63975 Impact Factor - 5.87“Recent Trends in Business Management”
end goal to make inquiries, fill in as a virtual guide and –in a perfect world – inspire them to visit the grounds, inactuality (IRL!). As the holders of the primary touch –confirmations and showcasing could be on the front lineof utilizing VR to reach and draw in prospects. However,they’ll should will take a few risks
VR for Campus Housing and Residential LifePicking a quarters or school lodging can be an extremechoice. Notwithstanding for understudies who have visitedthe grounds face to face, it’s far-fetched they encounteredthe broadness of lodging alternatives or visited the roomswhere they may wind up putting in a scholastic year or agreater amount of their life. In light of our information(CampusBird served up in excess of 78,000 virtual visitsin the initial a half year of 2016) quarters/habitation visitsare among the most mainstream virtual visits that a schoolcan give. With computer generated reality, lodging andprivate divisions will give understudies and guardians thecapacity to encounter the on-grounds area of a quarters,its environment and outside, and – maybe most critical– the inside regular territories and rooms themselves.This use of VR can enable understudies to get more OKwith and amped up for where they will live.
VR for Facilities Planning and ManagementThis is maybe a standout amongst the most fascinatingzones for VR in advanced education. Envision if – ratherthan (or notwithstanding) – demonstrating a static guideor building a model, offices arranging and administrationexperts could demonstrate a 3D show – receptive byvarious edges, statures and perspectives – of preciselyhow another building, stop, quad, field, and so on wouldlook? It would flabbergast. Need to visit within a buildingmade arrangements for development in 2020? How aboutwe go. Need to see the three unique gets ready for thenew stadium from a 10,000 foot see? Don’t sweat it.
VR for Alumni RelationsIt might be more hard to get graduates (especially theindividuals who still appreciate perusing the Sunday paper– heave!) inspired by encountering their old steppinggrounds with VR. Yet, this isn’t to imply that they wouldn’tappreciate the chance. Also, what an approach toencounter late changes to the grounds – new structures,stadiums, parks, offices, and so on – and furthermore forschool authorities to deferentially request gifts – than bygiving a novel VR encounters of an arranged officeredesign, new grant or scholastic program, new displayat an exhibition hall, and so on. The open doors are many.
Top MBA colleges working who are interested1. MIT Management Sloan School2. Swiss Business School3. Stanford Graduate School of Business4. Stockholm School of Economics5. SP Jain School Global Management6. Ted Rogers School of Management7. Rady School of Management8. PES Institute of Technology and Management
ChallengesThe academician’s tryst with new age teaching throughtechnology, though very enthusiastic, is still bogged downby challenges. While he says his students enjoy theexperience, I find it difficult to reconcile his methods withthe larger system that is still stuck in the domain oftextbook knowledge and the value of grades.1. Creating good content(Customized)- One of the
roadblocks for mainstream adoption of virtual realityin education Is the lack of suitable content. Giventhe nascent, evolving stage of the field,
2. Visionary Management Board- Top Levelappreciation and involvement drives them to initiateVR as Branding Tool and enhance Student experience
3. Localization - VR developers need to target theplatforms that are most popular and likely to be usedlargescale by institutions and consumers alike.
4. Creating effective learning experiences:Publishers need to create educational apps that fullyleverage the advantages that VR offers for learning.Educational content creators & publishers can formpartnerships with VR development companies thathave experience in developing learning apps and alsoknow how to develop applications for different VRplatforms
5. Headset Cost- The release of relatively low cost,virtual reality headsets such as the Oculus Rift andHTC Vive now allow teachers to design three-dimensional interactive and individual environmentsfor their students.
Marketing
Training
• VR Tour-Campus( (360 Degree VR)• Alumni Relations• Admissions• Campus Housing/ Hostel- Residential
Life
• Soft Skill industry specific Training• Mock Interviews• Group Discussion• Overall Personality Development

ISSN: 2349-5162Journal of Emerging Technologies and Innovative Research
Page 94February 2019Special Issue
ConclusionVR is on the doorstep of instruction, and unmistakably,it’ll change the world as we probably am aware it. 21st-century classrooms will be mechanically best in classspots of learning, with VR innovation fundamentallyexpanding understudies’ commitment and learning. VRwill motivate a radical new age of youthful and brilliantunderstudies, prepared to develop and change the world.These are not thorough with numerous new applicationsbeing right now created. And additionally improvement ofnew frameworks for connected instructive purposes,essential research is likewise being completed on theadequacy of utilizing virtual situations and VR on learningand on other psychological capacities, for example,retention, spatial mindfulness and recognition (Duffy, T.M., and Jonassen, D. H. (1992). In the meantime, thefollowing huge thing in instruction never again dependson innovation, yet rather on an instructor’s choice to pushforward and embrace these advances inside theclassroom. The worldwide objective ought to be to makeinformation accessible, open, and moderate for everybodyon the planet.
References• Alyssa Walker,2018, B Schools Use VR to Teach
Leadership, accessed on https://www.mbastudies.com/news/b-schools-use-vr-to-teach-leadership/-2556/ accessed on 6.6.2018
• Aravindmallik.bogspot(2016), Futuristic Education-Virtual Reality in MBA@PESITM, retrived from http://aravindmallik.blogspot.in/2016/09/futurstic-education-virtual-reality-in.html
• Ashley Scott (2018), Virtual Reality in HigherEducation m https://er.educause.edu/blogs/sponsored/2018/5/virtual-reality-in-higher-educationacessd on 4-5-2018
• Bryan Sinclair and Glenn Gunhouse(2016), ThePromise of Virtual Reality in Higher Educationaccessed on https://er.educause.edu/articles/2016/3/the-promise-of-virtual-reality-in-higher-education on7.7.2018
• Chris Christou (2010). Virtual Reality in Education(PDF) . Available from: https://www.researchgate.net/publication/272677840_Virtual_Reality_in_Education[accessed Oct 12 2018].
• Duffy, T. M., & Jonassen, D. H. (1992). Constructivismand the technology of instruction: A conversation.Hillsdale N.J.: Lawrence Erlbaum
• Himanshu Patel, Richard Cardinali, (1994) “VirtualReality Technology in Business”, ManagementDecision, Vol. 32 Issue: 7, pp.5-12, https://doi.org/10.1108/00251749410068111
• How Does Virtual Reality Affect Us?( 2017) retrievedfrom https://www.vrs.org.uk/virtual-reality/how-does-it-affect-us.html
• How is Virtual Reality Used? (n.d.), retrieved fromhttps://www.vrs.org.uk/virtual-reality/how-is-it-used.html
• How Virtual Reality Will Change How We Learn andHow We Teach(nd), https://theblog.adobe.com/virtual-reality-will-change-learn-teach/ accessed on7.6.2018
• Juegostudio (2017), Virtual Reality in Education: NewFrontiers for Learning, https://www.juegostudio.com/blog/virtual-reality-education accessd on 3.6.2018
• Sala nicoletta (2006), Multimedia and Virtual Realityin Architecture and in Engineering Education,Proceedings of the 2nd WSEAS/IASME InternationalConference on Educational Technologies, Bucharest,Romania, October 16-17, 2006
• Virtual Reality in Education. Available from: https://w w w . r e s e a r c h g a t e . n e t / p u b l i c a t i o n /272677840_Virtual_Reality_in_Education [accessedOct 12 2018].
• Virtual Reality(2018). https://en.wikipedia.org/wiki/Virtual_reality accessed on 25.5.2018
• What is Virtual Reality? (2017),retrieved from https://www.vrs.org.uk/virtual-reality/what-is-virtual-reality.html
• What is Virtual Reality? (n.d.), retrieved from https://www.vrs.org.uk/virtual-reality/what-is-virtual-reality.html
• Zack Mertz (2016), 5 Ways To Practically IncorporateVirtual Reality, Https://Www.Ecampusnews.Com/2016/08/24/Virtual-Reality-Campus/ Accessed On6.7.2018

Page 95 P.E.S. College of Engineering, Mandya & Primax Foundation, Bengaluru
UGC ID No: 63975 Impact Factor - 5.87“Recent Trends in Business Management”
PERCEPTION OF CONSUMERS ON GOODS ANDSERVICE TAX IN MYSORE CITY
Abstract
Today, GST has become a new buzz word in the field of Indian economic scenario. No doubt that, Goods and Servicetax is one of the greatest revolutions in the process of tax reforms in this country. But on the other hand, many peoplehave negative opinion on GST. In such a situation, it is really important to know and analyse the perception of consumersabout GST. So in the present paper the researcher is going to know the perception of consumers toward GST in the studyarea i.e. Mysore city.The present research paper is both descriptive and analytical in nature. The present study is basedpurely on primary data. Researcher has taken the sample size of 80 respondents by adopting simple random samplingmethod. The structured questionnaire method has been adopted. Frequency method, percentage methods and graphsare used to analyse the data.
Keywords: GST, Perception of Consumers, Process of Tax Reforms, Mysore City.
IntroductionGST is an indirect tax and it has been redesigned andredirected to bring the entire indirect taxation under oneumbrella to control tax evasion and also avoid cascadingtax effect i.e., putting ‘Tax on Tax’. Because there areso many indirect taxes applied on goods and servicesby central and state government. Therefore, GST isintroduced to consider all these taxes as one tax withseamless ITC and charged on both goods and servicesin the country.This new version of indirect tax structure wasimplemented from 1st July 2017. It was launched withthe intention of enhancing base of the economic growthof India. As we know that, GST is implemented at nationallevel with the motto of one tax and one country onproduction and sale of goods and services. It is designedto integrate the central and state government taxes viasingle tax system.
Latha .T1
1. Assistant Professor, PG Centre in Economics, Government College for Women, Mandya.
What is GST?Goods and Services Tax in India is a comprehensive,multi-stage, destination-based tax that is imposed onevery value addition of a product manufacturing. Incommon language, GST is an indirect tax imposed onthe supply of goods and services and it was introducedto replace many indirect tax laws that previously existedin India.In India, we find four components of GST. They are asfollows,SGST – State GST, collected by the State Govt.CGST – Central GST, collected by the Central Govt.IGST – Integrated GST, collected by the Central Govt.UTGST – Union territory GST, collected by union territorygovernment
Impact of GST on ConsumersGST has several benefits for consumers. They can beshown in the following figure (Fig. 1 & 2)
SimplerTax system
Transparency intaxation system
Impact ofGST on
Consumers
Increase incmploymentopportunities
Unifrom pricesthroughout the
country
Reduction inprices of goods
and services
Fig. 1
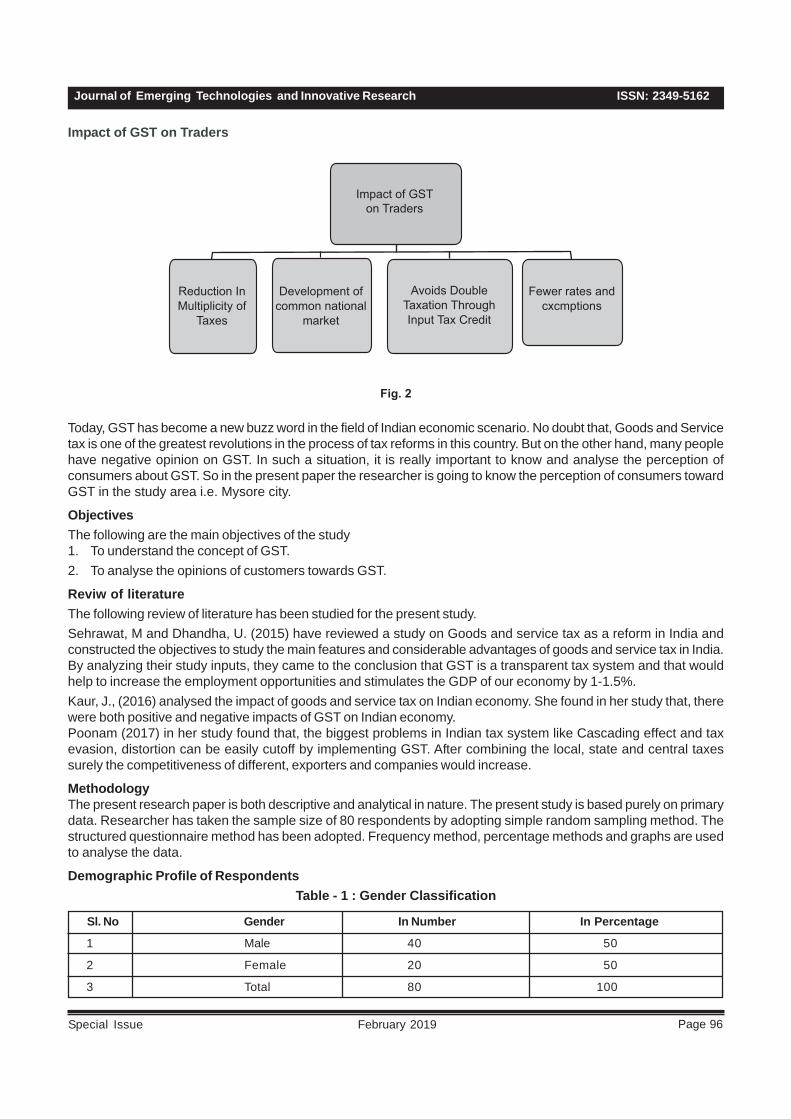
ISSN: 2349-5162Journal of Emerging Technologies and Innovative Research
Page 96February 2019Special Issue
Impact of GSTon Traders
Fewer rates andcxcmptions
Avoids DoubleTaxation ThroughInput Tax Credit
Development ofcommon national
market
Reduction InMultiplicity of
Taxes
Fig. 2
Impact of GST on Traders
Sl. No Gender In Number In Percentage
1 Male 40 50
2 Female 20 50
3 Total 80 100
Today, GST has become a new buzz word in the field of Indian economic scenario. No doubt that, Goods and Servicetax is one of the greatest revolutions in the process of tax reforms in this country. But on the other hand, many peoplehave negative opinion on GST. In such a situation, it is really important to know and analyse the perception ofconsumers about GST. So in the present paper the researcher is going to know the perception of consumers towardGST in the study area i.e. Mysore city.
ObjectivesThe following are the main objectives of the study1. To understand the concept of GST.2. To analyse the opinions of customers towards GST.
Reviw of literatureThe following review of literature has been studied for the present study.Sehrawat, M and Dhandha, U. (2015) have reviewed a study on Goods and service tax as a reform in India andconstructed the objectives to study the main features and considerable advantages of goods and service tax in India.By analyzing their study inputs, they came to the conclusion that GST is a transparent tax system and that wouldhelp to increase the employment opportunities and stimulates the GDP of our economy by 1-1.5%.Kaur, J., (2016) analysed the impact of goods and service tax on Indian economy. She found in her study that, therewere both positive and negative impacts of GST on Indian economy.Poonam (2017) in her study found that, the biggest problems in Indian tax system like Cascading effect and taxevasion, distortion can be easily cutoff by implementing GST. After combining the local, state and central taxessurely the competitiveness of different, exporters and companies would increase.
MethodologyThe present research paper is both descriptive and analytical in nature. The present study is based purely on primarydata. Researcher has taken the sample size of 80 respondents by adopting simple random sampling method. Thestructured questionnaire method has been adopted. Frequency method, percentage methods and graphs are usedto analyse the data.
Demographic Profile of RespondentsTable - 1 : Gender Classification

Page 97 P.E.S. College of Engineering, Mandya & Primax Foundation, Bengaluru
UGC ID No: 63975 Impact Factor - 5.87“Recent Trends in Business Management”
In the above table there are 40 male respondents and 40female respondents in the study area i.e. Mysore city
Table - 2 : Age Classification
In the above table there are 80 respondents among them,37.5 percent of respondents belong to 20-30 age group,25 percent of respondents belong to 30-40, 40-50 agegroup constitutes 30 percent and 7.5 percent belong to50 & above age group in the study area.
Table - 3 : Occupation Classification
1 Teachers and Professors 15 18.8
2 Business Men/Women 25 31.2
3 Doctors/ Engineers 20 25
4 Housewives 20 25
5 Total 80 100
InPercentage
InNumberOccupationSl.no
1 20-30 30 37.5
2 30-40 20 25
3 40-50 24 30
4 50 & above 06 7.5
5 Total 80 100
Sl.no Age In Number In Percentage
1 Yes 75 93.8
2 No 05 6.2
3 Total 80 100
Sl.No
Are WomenWorkers Stressed
In Number InPercentage
Frequency InPercentage
Fig. 1
The above diagram clearly shows that 93.8 percent ofrespondents are aware of GST in the study area andonly 6.2 percent of them are ignorant of GST (Table - 6).
In the above table there are 80 respondents among them18.8 percent of respondents are Teachers andProfessors, 31.2 percent of respondents are BusinessMen/Women and 25 percent of respondents are
Doctors/ Engineers and Housewives respectively inthe study area.
Analysis and interpretationsThis paper has tried to analyse the opinions ofrespondents on GST implementation in the study area.
Table - 4 : Are Respondents in the Study areaware of GST?
Tabl - 5 : Perceptions of Respondents about GST Implementation in the Study Area
Questions Asked For Respondents
1 GST has increased the tax burdenon Common Man
2 GST eradicates differentiation of taxes
3 GST is very difficult to understand
Sl No Perceptio of Respondents Frequency In Percentage
Agree 45 56.3
Disagree 12 15
Cont say 23 28.7
Total 80 100
Agree 40 50
Disagree 22 27.5
Cont say 18 22.5
Total 80 100
Agree 55 68.8
Disagree 17 21.2
Cont say 8 10
Total 80 100
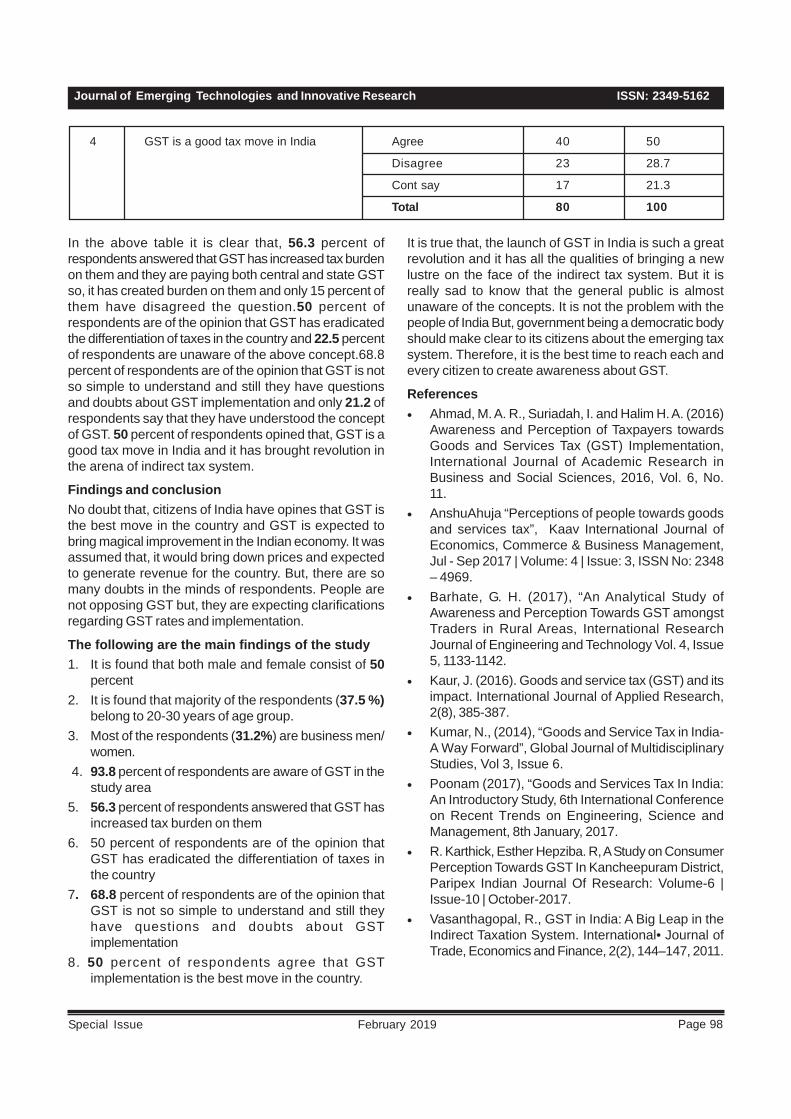
ISSN: 2349-5162Journal of Emerging Technologies and Innovative Research
Page 98February 2019Special Issue
In the above table it is clear that, 56.3 percent ofrespondents answered that GST has increased tax burdenon them and they are paying both central and state GSTso, it has created burden on them and only 15 percent ofthem have disagreed the question.50 percent ofrespondents are of the opinion that GST has eradicatedthe differentiation of taxes in the country and 22.5 percentof respondents are unaware of the above concept.68.8percent of respondents are of the opinion that GST is notso simple to understand and still they have questionsand doubts about GST implementation and only 21.2 ofrespondents say that they have understood the conceptof GST. 50 percent of respondents opined that, GST is agood tax move in India and it has brought revolution inthe arena of indirect tax system.
Findings and conclusionNo doubt that, citizens of India have opines that GST isthe best move in the country and GST is expected tobring magical improvement in the Indian economy. It wasassumed that, it would bring down prices and expectedto generate revenue for the country. But, there are somany doubts in the minds of respondents. People arenot opposing GST but, they are expecting clarificationsregarding GST rates and implementation.
The following are the main findings of the study1. It is found that both male and female consist of 50
percent2. It is found that majority of the respondents (37.5 %)
belong to 20-30 years of age group.3. Most of the respondents (31.2%) are business men/
women. 4. 93.8 percent of respondents are aware of GST in the
study area5. 56.3 percent of respondents answered that GST has
increased tax burden on them6. 50 percent of respondents are of the opinion that
GST has eradicated the differentiation of taxes inthe country
7. 68.8 percent of respondents are of the opinion thatGST is not so simple to understand and still theyhave questions and doubts about GSTimplementation
8. 50 percent of respondents agree that GSTimplementation is the best move in the country.
It is true that, the launch of GST in India is such a greatrevolution and it has all the qualities of bringing a newlustre on the face of the indirect tax system. But it isreally sad to know that the general public is almostunaware of the concepts. It is not the problem with thepeople of India But, government being a democratic bodyshould make clear to its citizens about the emerging taxsystem. Therefore, it is the best time to reach each andevery citizen to create awareness about GST.
References• Ahmad, M. A. R., Suriadah, I. and Halim H. A. (2016)
Awareness and Perception of Taxpayers towardsGoods and Services Tax (GST) Implementation,International Journal of Academic Research inBusiness and Social Sciences, 2016, Vol. 6, No.11.
• AnshuAhuja “Perceptions of people towards goodsand services tax”, Kaav International Journal ofEconomics, Commerce & Business Management,Jul - Sep 2017 | Volume: 4 | Issue: 3, ISSN No: 2348– 4969.
• Barhate, G. H. (2017), “An Analytical Study ofAwareness and Perception Towards GST amongstTraders in Rural Areas, International ResearchJournal of Engineering and Technology Vol. 4, Issue5, 1133-1142.
• Kaur, J. (2016). Goods and service tax (GST) and itsimpact. International Journal of Applied Research,2(8), 385-387.
• Kumar, N., (2014), “Goods and Service Tax in India-A Way Forward”, Global Journal of MultidisciplinaryStudies, Vol 3, Issue 6.
• Poonam (2017), “Goods and Services Tax In India:An Introductory Study, 6th International Conferenceon Recent Trends on Engineering, Science andManagement, 8th January, 2017.
• R. Karthick, Esther Hepziba. R, A Study on ConsumerPerception Towards GST In Kancheepuram District,Paripex Indian Journal Of Research: Volume-6 |Issue-10 | October-2017.
• Vasanthagopal, R., GST in India: A Big Leap in theIndirect Taxation System. International• Journal ofTrade, Economics and Finance, 2(2), 144–147, 2011.
Agree 40 50
Disagree 23 28.7
Cont say 17 21.3
Total 80 100
4 GST is a good tax move in India
Page 99 P.E.S. College of Engineering, Mandya & Primax Foundation, Bengaluru
UGC ID No: 63975 Impact Factor - 5.87“Recent Trends in Business Management”
RAYMOND RE-IMAGINED: A CASE STUDY
Introduction:Raymond India Pvt. Ltd., a leading Indian textile brand,now a diversified conglomerate, begin its journey 9decades ago and is now at an exciting phase oftransformations. With its current initiatives, the brandsince 2017 embarked on the journey of ‘RaymondReimagined’ aims to transform organization into new-age customer centric and future ready organization. Thiscase study analyzes all the current initiatives whichwould render brand a long term sustainable competitiveadvantage, the case also analyzes diversified productportfolio and innovations of Raymond and its businessmodel of excellence.
About RaymondRaymond is India's largest integrated worsted suitingmanufacturer that offers end-to-end solutions for fabricsand garmenting. Over the years, Raymond has beensynonymous with quality, innovation and marketleadership. It has some of the leading brands within itsportfolio – Raymond Ready to Wear, Park Avenue,ColorPlus, Parx, Raymond Made To Measure amongstothers. Raymond has one of the largest exclusive retailnetworks in the country with over 1000 stores across400 towns.As a part of the diversified Group, they have businessin men's accessories, personal grooming & toiletries,prophylactics, engineering and auto components acrossnational and international markets.Having enjoyed the patronage of over a billion consumers,Raymond as a brand has been consistently deliveringworld class quality products to its consumers over thepast nine decades.
Objectives• Analyze Raymond’s Product portfolio in context of
a complete solution for an Indian male’s wardrobe.• With respect to current diversification strategy of
Raymond, What could be key potential productportfolio expansions for global excellence
• Evaluate the recent digital / E-commerce initiativesand current strategies of the Raymond in terms ofcreating sustainable competitive advantage for thecompany.
Dr. Pallavi Chandwaskar1 Dr. Smita Jape2
MethodologySecondary as well as primary sources of informationare used. For gathering secondary data, recentnewspaper articles and company website, its annualreports and official corporate presentation, chairmanspeeches etc., have been considered. A rigorousliterature review of published case studies on RaymondIndia has been carried out to identify the gap betweenpreviously conducted case study and the need toaddress the recent strategic initiatives.Primary data is collected by conducting personalinterviews through structured questionnaire administeredfrom managers in various verticals of business andqualitative analysis is performed through grounded theoryapproach.
OutcomesThe case study identifies the value proposition Raymondis creating through its various initiatives under ‘RaymondRe-imagined’ by having a clear strategic focus in thefollowing key area of business :• Digitization initiatives/ E-commerce strategies:
By developing digital platforms like Raymond Next,Online tailoring, MTM App, Stylist App and E-commerce market place, company is able togenerate 5 million + customer member base. Thesedigitization and e-commerce initiatives as addressedby IT process head at Raymond Mr. Subramanianin our interview with him, with the changing scenarioin the entire sales process over the last decade, asquoted by Mr. Subramanian, IT Head, Raymond, “AtRaymond we observed a change in process ofproduct exploration, discovery, sales transaction,closure and feedback everything which was earliermanaged by sales franchisee is now transformed inonline mode. People read about Raymond productsonline, buy it on Myntra, write about it on twitter,and on all this Raymond had no control.”
“Raymond has thus formed digital team which hada look at all customer touchpoints and started sellingonline through Myntra and Jabong predominantly andalso at Amazon, Filpkart and Paytm thus E-commerce revenue is now substantially contributingto apparel segment sales.”
1 . Asst. Professor, Dr. V.N. Bedekar Institute of Management Studies, Thane (W), Maharashtra.2 . Associate Professor, Dr. V.N. Bedekar Institute of Management Studies, Thane (W), Maharashtra.
ISSN: 2349-5162Journal of Emerging Technologies and Innovative Research
Page 100February 2019Special Issue
By establishing its own website for sales, asRaymondnext.com, company provides all productsof all its brands like Raymond, Park Avenue, ColorPlus, Next look, Khadi, Parx etc. Company alsointroduced MTM platform which stands for Made toMeasure, for providing customized tailoring services.MTM digital platform is available at all MTM stores.
Company website provides customer facing interfacefor lead booking. Fore custom tailoring service a tailorcan be booked online to give home visit to customerfor measurement, fabric and pattern choice andcustom-made apparel can be delivered from factoryat customer door-step. PADIY (Park Avenue Designit yourself) platform at MTM stores, give customervisualization on large screen in the selected type ofattire. With this Raymond is the only player inmarket which provides end-to-end solution right fromfabric manufacturing to custom designing, stitching,alterations, customization and delivery to customerall through modern IT interface.
There is also a Stylist App, which provides a customerwith visualization of various patterns and cuts andstyles with more styling features. An innovativeplatform is “Magic me” which is installed in kiosksin the select stores. Is kind of magic mirror where inyou stand in front of kiosk, select a fabric and apparelpattern and it shows your entire image in that so theperson gets a clear understanding of how the productlooks on him.
In this way all digital platforms are contributingimmensely in value-addition to the brands’ existenceand transformation.
• Diversification and growth strategiesThe structural reforms that took place in financialyear 2017-18 tested the suppleness of the Indianeconomy and businesses faced with the biggesteconomic reform. Having the implementation of GSTcreated headwinds, that had short-term impactacross the value chain, but still most of thebusinesses of Raymond have grown steadily.Raymond Reimagined journey continued throughfocus on ‘Customer Centricity’ and agility in servicesthrusting the group to new altitudes of success.Raymond businesses are now equipped to embracethe future with vigour and are fully geared to combatthe increasingly volatile environment due to decisiveaction and strong execution.
Market & Category expansion and channelpenetration, asset-light network expansion (settingup mini TRS), Exclusive Raymond retail network of800 TRS are the key highlight in expansion. Categoryexpansion in FMCG segment and plans to explore
opportunities in the real estate sector are underfinalization. Establishment of a garmenting plant inEthiopia to ensure duty-free access to key exportmarkets of the US and Europe and established plantin Amravati to support government’s Make in Indiainitiative. Registering growth through digital platforms,MTM business in the USA contributes to 15-20 %revenue.
The top-line growth of the Group was possible dueto the product innovations coupled withimplementation of financial prudence and consistentdelivery mechanism which can be seen in theimproved financial indicators as seen below.
Having commissioned two new state-of-the-artgreenfield projects, in Ethiopia for the Garmentingbusiness and Amravati Plant for Linenmanufacturing, already capex had near to the peakand hence now company is going forward with thefocus on asset-light expansion model. The Ethiopianplant will meet the demand from the increasing globalgarmenting business and with this plant Raymondhas doubled its production capacity, as quoted byMr. Subramanian in the interview with us, while theAmravati plant will largely cater to the high-marginLinen portfolio. In the Tools & Hardware segment,the successful turnaround strategy of buildingoperational efficiency and product rationalisation hasenabled in significantly improving EBITDA marginsto 9% vs. 2% in the previous year.
The Auto Components business witnessed robustsales growth driven by high demand from passengerand commercial vehicle segments. Acquisition ofcustomers in the industrial segment also contributedto this expansion. The high growth in profitabilitycontinued with EBITDA increasing by 90% from ?24Crore in FY 2016-17 to ?45 Crore in FY 2017-18.
• Innovation and sustenance strategiesWith innovations like waterless technology, use oforganic cotton, product portfolio innovations likeTechno Series, All black collection and RaymondWhites. ‘The Raymond Store of Future’ uses cuttingedge technology. New differentiated product offeringsthat included a sustainable range using organiccotton, post-consumer waste (PCW) and waterlesstechnologies, among others.In 2011, Raymond became the first textile companyin the world to produce the Super 250s fabric andthe first in India to produce innovative fabrics frombamboo fibre, stain resistant and UV resistant fabricsand many such innovations.Raymond has always pioneered with innovativeproducts, with its Techno series has fabric called
Page 101 P.E.S. College of Engineering, Mandya & Primax Foundation, Bengaluru
UGC ID No: 63975 Impact Factor - 5.87“Recent Trends in Business Management”
‘Techno-stretch’ is all about stretchable fabrics forcatering to body-fit trend in office wear, these aretermed as ‘Workplace Celebrate’. Raymond alsoventured in ‘Khadi’ by procuring khadi cotton fromfarmers and woven through bringing innovation in‘charkha’, khadi line introduced 2-3 years ago hasan extremely complex procurement process and thefabric is used to manufacture khadi line many typesof apparels like shirts, trousers, kurtas, bandh-galaeven wallets and belts etc. which is still expanding.Khadi and Village Industries Commission (KVIC) hadreceived its largest ever order worth Rs 2 crore fromRaymond for the supply of 98000 metres of the fabric.3-D printing for male accessories are yet anotherinnovation for cuff-lings, belt-buckles etc. is also aunique way of doing things and the production anddesign cycle is very small, instantly after designingit can be produced so it provides additional advantagein faster manufacturing of accessories.‘Raymond Store of Future’ is all about integrating allchannels of shopping. The concept of a futuristicstore is based on four pillars, i.e. knowing thecustomer, his history, his buying preferences andneed identification of customer. All the channels ofshopping should integrate and linking all channelsof shopping seamlessly with each other. Companyshould have a single view of customer and inventoryas well elevating the level of customization byproviding innovative features like Magic mirror, digitalwall, MTM interface pick and drop etc. contribute.Another innovation called Waterless technologyfocuses on primarily reducing water usage in entirefabric manufacturing process from weaving to dyeingat operational level.
• Shareholder value creationCompany has designed a roadmap by creatingfinancial targets in terms of revenue growth, increasebetween 10-12% EBITDA margin, +80-100 basispoints, ROCE of 12%-15%, free cash flow – fromnegative to positive and significant increase in EPS(till 2020).The consolidated revenues have grown by 9% (13%on excluding GST impact) from • 5,509 Crore to• 6,025 Crore. The EBITDA margin increased from7.7% in the previous year to 9.1% in year 2017-18.The flagship business, Branded Textiles, witnessed7% increase (10% on excluding GST impact) insales, driven primarily by the wedding season,recovery in the wholesale channel post GSTstabilisation and growth in the institutional category.The Branded Apparel segment posted strong salesgrowth of 12% (19% on excluding GST impact) on
the back of continued focus on strengthening ofbrands and Raymond’s core proposition as awardrobe solutions provider despite facing industry-wide challenges on account of heavy discountingand extended EOSS across the industry.
Sustained investments in 4 Power Brands coupledwith widening the retail footprint is furtherconsolidating leadership position in the menswearcategory. Additionally, the portfolio is now ablysupported by two new customer segments, Ethnixfor ethnic wear and The Branded Apparel marginexpansion is on track and the business continuesto drive momentum and maintain a profitable growthrate. During the year, export business in the brandedtextile and garmenting businesses faced short-termchallenges due to currency fluctuations whichmoderately impacted the margins.
ConclusionIt can be concluded that Raymond’s apparel division hasmade several key moves to support company’stransformation journey which includes expansion ofproduct categories for all occasions, omni-channel retailnetwork and seamlessly blending it with digital channelsand interface and cutting-edge technology in productinnovations to appeal the dynamic needs of presentcustomer.
The company has also strengthened its global outreachwith increase in global manufacturing base to significantlyexpand its production capacity as well as tapping moreglobal market through its digital platforms.Thus to sum up on all transformation drivers forRaymond, the company is focusing on enhancingstakeholder value through growth by innovation inproducts and services, category expansions as well aschannel penetration by sustaining the margins in theircore business of textile. In the apparel business as agrowth engine transformation took place through asset-light network expansion, enhanced retail experience,omni-channel penetration.
The task of turning Raymond into a true lifestyle, fashionretail company is still a work in progress, but it is safeto say that the company has turned around. It revealsfrom the facts that the company had formed its FMCGGroup in 2016 and its products reach 25 lakh retailers,including 90,000 pharmacies and also exports toSoutheast Asia, West Asia and Africa. Furthermore thedomestic men grooming industry is estimated to be Rs5,000 crore and Raymond’s new strategy of launchingnew products in the category will definitely a matter ofwellbeing to the company. In the next step, anenhancement of product line by exploring the women’ssegment predicts the future of the company.

ISSN: 2349-5162Journal of Emerging Technologies and Innovative Research
Page 102February 2019Special Issue
References• Raymond Annual report 2017-18 http://
w w w . r a y m o n d . i n / s i t e s / d e f a u l t / f i l e s /Raymond_AR_Deluxe_2018%20.pdf
• http://www.indiantextilemagazine.in/corporate-news/raymond-reimagined-journey-continues-unabated/(Accessed on Aug.25,2018)
• http://www.raymond.in/milestone?subcat=131(Accessed on Aug.25,2018)
• http:/ /www.rediff .com/business/report/ the-reinvention-of-raymond/20180402.htm
• https://www.business-standard.com/company/raymond-474/annual-report/chairman-speech
• http://www.raymond.in/reimagined• https://economictimes.indiatimes.com/industry/
cons-products/garments-/-textiles/the-complete-man-raymond-is-now-trying-to-get-a-complete-makeover-heres-how/articleshow/62962580.cms
• https://economictimes.indiatimes.com/industry/cons-products/garments-/-textiles/as-branded-as-it-can-get-raymond-launches-indias-first-branded-khadi-label/articleshow/58751538.cms
Page 103 P.E.S. College of Engineering, Mandya & Primax Foundation, Bengaluru
UGC ID No: 63975 Impact Factor - 5.87“Recent Trends in Business Management”
WOMAN AS THE KEY DECISION-MAKER; THECHANGING TREND IN THE BUSINESS WORLD.
1 . Assistant Professor, Poornaprajna Institute of Management, Udupi. Research Scholar at Sahyadri College ofEngineering & Management, Mangalore.)
2 . Professor and Dean of Corporate Programmer, Justice K. S. Hegde Institute of Management, NITTE.
IntroductionThe modern business has transformed enormously inthe contemporary scenario. From telecommunicationsto cloud computing, service sector to hybrid businessthere has been a huge makeover in the practices andprocesses of the business. This has been possiblebecause of the localization, privatization andglobalization spectacle where the internationalboundaries have been vanquished and businesses haveembraced the International culture. While all of the abovefactors have been crucial and critical in shaping themodern business, the role of leadership in drivingbusiness practices cannot be denied. Business andleadership complement each other and this is anundisputable fact that brings success to anyorganization. A successful business is not only unruffledof business stratagems but also outstanding leadership.A great leader acts as the spur that makes all the otherthings work together. A business that has all the essentialthings which are needed to drive a business but lacks agood leader will not be able to maintain its positioningthe market. Hence a good leader becomes the mostinfluential and critical element of all businesses who hasall the necessary tools and skills to stimulate and sway
Joe Ashwin Correa1 Dr. Ananthpadmanabha Achar2
Abstract
The entry of women into the modern business has been corresponding to the growth of the Indian economy. More andmore women entrepreneurs can be seen creating lasting impressions in the society in their respective domain from timeto time. Conventionally, the role of women in business was quite evident in traditional set up like small marketplaces, asstreet hawkers, in stalls and petty shops. She was also the individual who was seen as a mere care taker and a perfecthome maker discharging her household duties. However, today she has expanded her latitude to become the keydecision maker of the modern business. Today most of the businesses are successfully lined by the women managersand they have become an integral part of the system. They are creative, innovative and exceptionally talented, giving atough edge to the dominant gender in the society. If properly developed, the women as leaders and managers can bringin contemporary wonders as it is apparent in most of the developing Nations. Hence the elementary strategy of anybusiness house should be to identify and develop such talents which can benefit all the relevant stakeholders of thesystem. In today’s context when we voice about gender sensitivity, the role of women in business becomes critical. Thesociety cannot be steered by one gender alone as the system itself has become more complex, dynamic, widespreadand vulnerable. To address and manage things effectively and efficiently women employees have to be scaled up to thenext level so that what is preached about equality is practiced in reality. Equal participation in the hierarchy may berequired to bring in parity in the system. Women empowerment, women activism, women rights, women independence,women liberation etc. has attained a lot of propaganda in the current scenario. In this direction sensitizing the societywith the changing role of woman in the modern scenario becomes the greatest challenge so that it doesn’t remain aflimflam for a peripheral eye-wash.
Key words: entrepreneurs, decision-making, gender- sensitivity, equality, participation, parity.
their teams allowing organizations to run competentlyand smoothly. Modern organizations need strong handswho can lead, guide and direct the business irrespectiveof any background or context. And this is the reasonwhy women have emerged as great leaders in thecorporate of arena. Today the woman is the backbone ofthe business operations be it in the higher or lowerhierarchy. She is instrumental in molding and decoratingthe organization’s prerequisites on an unceasing basis.More and more women are mounting to the leadershipdefy, even in some of the most male-dominatedindustries. Women have progressively gained parity inthe workplace and in the family. Changes in genderlifestyles and roles have drastically taken place.Presently, there are males partaking in the domesticerrands such as childbearing and daily householdchores. Gender roles and etiquette social rules aremalleable, and there is equity in the matrimonial bond.Today, women can navigate life liberally and effortlessly.In addition, a high percentage of women are currently inoccupation. In the U.S about 46% of the workforce iswomen where about 23% of the CEOs are women, 16%of presidents that head U.S universities and collegesare women and the list goes on. The increasing number
ISSN: 2349-5162Journal of Emerging Technologies and Innovative Research
Page 104February 2019Special Issue
of women in the workplace or starting their own businesshas validated to men who own businesses that womencan be both managers and mothers, thus displaying theirmale counterpart that women can in fact "do it all"!
Woman as decision-makerAny organization, whether it is society or businesshouse, in the extant epoch cannot function effectivelywithout women’s equivalent contribution in decisionmaking. Woman creates a perspective that brings toantagonism and association to organizations and teams.In today’s world, organizations that are led bycomprehensive leadership teams make active decisionsthat transport better result. In the twenty-first century,the indispensable potentials required to lead comprisethe ability to collaborate, connect, empathize andcommunicate. All these qualities are feminine in natureand can help shape a more sustainable prospect. Manystatistics show that companies steered by women havebetter financial consequences. Decision making bywomen is vigorous to increase the stride of societalrevolution at home and in the workplace. Women leadersare likely to deliver a unified view of work and family,resulting in an involved and promising personal andprofessional future. Women are more visible incommunity life now than they have been at any otherpoint in modern history. Globally, women have moreaccess to positions of authority than they did 30 yearsago – from the judiciary to legislature, from professionalassociations to the boardroom. Gender uniformity inleadership is important because true advancement cannothappen without a diversity of outlook in leadership roles.The modern business does not distinguish between menand women as managers. However, there are certaintraits that make the woman unique as compared to theopposite gender in decision making.
Self-BrandingUnlike their male counterparts, women leaders oftenseem to be meek or hushed about their own endeavors.They are rarely upright at branding themselves. However,it is necessary that women leaders learn how to brandthemselves by sharing their feats and skills with others.Unless people know or notice what they are proficient of,they cannot spot the leadership qualities of a women leader.
Charismatic leadershipWomen leaders are far more transformational than menleaders. They function as a role model for their underlings.They instigate their team and spend a lot of timeeducating their team. They care a lot about their personaladvancement. Women leaders accentuate teamwork andauthentic communication as a key to success. For mostwomen leaders, leadership is not meant only for realizing
organizational goals but for transmuting their followersinto superior people.
Deadline –FocusedWomen leaders are unvaryingly focused on completionof duties and tasks assigned within deadlines. From anoperational point, completing day-to-day duties andprojects are necessary to safeguard smooth functioningof the company.
Believe in team workWomen leaders generally prefer leading and creatingflat organizational structures that enables all to work ina team based atmosphere independently. Flatorganizational structure superintends the experience andknowledge of veteran employees and the manager.Women leaders usually are perilous of hierarchicalarrangement of organization.
Foster Support and AllianceTo support others is a typical feminine characteristic.Women leaders always endorse cooperation andcollaboration amongst their team members. In this case,all the associates of the team need to be flawless of theirroles and tasks, otherwise, it results in redundant work.
Democratic StyleWomen leaders tend to be involved and possess ademocratic style of leading people. They seem to loathe‘command and control style’ practiced by male leaders.Women often times ramblingly communicate theirprospects of a given task and allow more space infinishing a goal. It sometimes helps the team membersuse their abilities and proficiency to complete the task,however, at other times it can be a hitch if the assignedtask requires a leader to have undeviating communicationwith the members.
The present scenarioMost bizarrely, women have made inroads intoprofessions and careers traditionally dominated by men.Women employees aren’t just secretaries, HRpersonnel, or pressed into support functions anymore.Women have struggled with and have overcome fargreater hurdles to rise into the boardrooms and CEOpositions of large corporations and successful startups.Every protuberant woman business leader is helpingyounger women nurture their dreams to grow up intowhomsoever they want to be. Traditionally, women havenot coped as well as men in the workplace, with mostwomen making just three-quarters of what their malecounterparts make — but that is only half the story. Forthe last 20 years, more women have chosen to starttheir own businesses than ever before, even outperforming

Page 105 P.E.S. College of Engineering, Mandya & Primax Foundation, Bengaluru
UGC ID No: 63975 Impact Factor - 5.87“Recent Trends in Business Management”
men, and they have been blooming. The truth is thatwomen can, and should, have a large existence in thebusiness world. One big benefit women offer the businessworld and organization in particular is that they havedifferent sets of life and work experiences than men doand thus diverse outlooks. This leads to diverse opinions,altered preferences, and different strategies. In turn, thisdiversity countenances decision-making to become moremulti-dimensional and thus more widespread. Boardswith at least one female member incline to take lengthierto green-light acquirements than all-male boards. Thisis because women tend to be more risk-averse andtactical than men. While this propensity may lead tosmaller and/or fewer acquisitions, it also allows for morecautious and more informed decisions. Companies areantagonistically looking to increase their diversity andcreate additional welcoming environments for women. Ithas been found out in many research studies that havingmore women in the board helped drive 42 percent higherreturns on sales, and a 66 percent more successfultranslation of invested capital into profit. This has led toa company pledge to gender diversity to hit an all-timehigh, and compelled companies to enact substantiallywith more women-friendly policies.
The road ahead for woman decision-makerThe inclination for women in business is growing. It ispowered by women determined to “lean in” and get intothe big business game, millennials looking to delineatetheir own career paths, and many others who are moreentrepreneurial in nature. Mentorship programs are aidingpull women up, further than ever before. At the sametime, women are pulling together and generating theirown networking, conferences, and meet-ups — but theystill have a way to go. Women looking to flinch businessesor magnify existing ones have less opportunity for funding,and overall they make less than men, even if they havethe same title and education. Following bottlenecks mayhave to be better managed which act as major obstaclesto get the best out of women managers:
Avenues to funds and investmentsHaving better access to business is a vital reason whymany women aren’t choosing to set up businesses.Women leaders aren’t aware of the full range of financialsolutions available to them.
Support from peerHealthier support is another area which needs work toreassure more women to set up a business. In somecountries, government provides an online resource tohelp give women admittance to things like training andthe break to develop their skills.
MentoringMentors are imperative to help cultivate business skillsand provide regulation to business owners. They are alsosignificant to helping people shape their self-confidence.
Absence of Role-modelsRole models are also vital in stimulating women to stepinto the business world. Female role models comprehendthe skills needed for women to flourish in business. Theyare important in establishing entrepreneurship as a careerpossibility to women and reassuring them to explorenew business opportunities.
ConclusionThe work setting, across the world, is in hysteria: Inmany organizations employee engagement is intenselytruncated, stress and health problems are proliferating,innovation and customer care are lagging, the talent poolis shrinking, rotation and absenteeism are high, and thewell-being of workers, as well as the bottom line aremisery. In this outset, women characterize anextraordinary talent pool. This is particularly significantin light of the histrionic dearth of highly qualified andskilled workers worldwide. Women decision makersmust be considered with utmost seriousness inbusiness, be it as executives or entrepreneurs. Theycan bring dissimilar perspectives to the legendary tableand tend to be more strategic. This propensity may makethem more risk-averse in acquisitions, but it also leadsto superior success from a valuation stance in the start-up phase, when more calculated exchanges have thebiggest impact. It will take time to achieve workplaceparity, but women in business is a trend that can, andshould, be growing.
References• Aycan, Z. (2004) Key success factors for women in
management in Turkey. Applied Psychology: AnInternational Review, 53(3), pp. 453–77.
• Brenner, O., C., Tomkiewicz, J., & Stevens, G.E.,(1991). The relationship between attitudes towardwomen and attitudes toward blacks in managementpositions, Canadian Journal of AdministrativeSciences, 8(2), pp. 80–89.
• Broadbridge, A., & Simpson, R. (2011). 25 yearson: reflecting on the past and looking to the future ingender and management research, British Journalof Management, 22, pp. 470–483
• Carless, S. A. (1998). Gender differences intransformational leadership: An examination ofsuperior, leader, and subordinate perspectives. SexRoles, 39, 887-902.
ISSN: 2349-5162Journal of Emerging Technologies and Innovative Research
Page 106February 2019Special Issue
• Carli, L. L. (1990). Gender, language, and influence.Journal of Personality and Social Psychology, 59,941-951.
• Carter, D. A., Simkins, B. J., & Simpson, W. G.(2003). Corporate governance, board diversity, andfirm value. Financial Review, 38, 33-53.
• Conway, J. M., & Huffcutt, A. I. (1997).Psychometric properties of multisource performanceratings: A meta-analysis of subordinate, supervisor,peer, and self-ratings. Human Performance, 10, 331-360.
• De Carlo J and Lyons PR (1979) A comparison ofselected personal characteristics of minority andnon-minority female entrepreneurs. Journal ofBusiness Management; 1979 (1).
• Demartini P and Paoloni P (2012) The relationalcapital in female SMEs. Journal of Academy ofBusiness and Economics; 12, 23–32.
• Denyer D and Tranfield D (2009) Producing asystematic review. In Buchanan DA and Bryman A(eds). The Sage Handbook of OrganizationalResearch Methods. Sage Publications: ThousandOaks, CA, pp 671–689.
• Eriksson-Zetterquist U and Styhre A (2008)Overcoming the glass barriers: Reflection and actionin the “women to the top” programme. Gender, Work& Organization; 15 (2): 133–160.
• Ezzedeen SR and Ritchey KG (2009) Careeradvancement and family balance strategies ofexecutive women. Gender in Management: AnInternational Journal; 24 (6): 388–411.
• Friedman L (1989) Mathematics and the gender gap:A met-analysis of recent studies on sex differencesin mathematical tasks. Review of Educationalresearch; 59 (2): 185–213.
• Guthrie J, Ricceri F and Dumay J (2012) Reflectionsand projections: A decade of intellectual capitalaccounting research. British Accounting Review; 44(2): 68–92.
• Grisoni L and Beeby M (2007) Leadership, genderand sense-making. Gender, Work and Organization;14 (3): 191–209.
• Guillaume C and Pochic S (2009) What would yousacrifice? Access to top management and the work-life balance. Gender, Work & Organization; 16 (1):14–36.
• Healy G, Bradley H and Forson C (2011)Intersectional sensibilities in analyzing inequalityregimes in public sector organizations. Gender,Work & Organization; 18 (5): 467–487.
• Holvino E (2008) Intersections: The Simultaneity ofRace, Gender and Class in Organization Studies.Gender, Work & Organization; 17 (3): 248–277.
• Koca, C., Bengü, A., & A çi, H. F., (2011). Attitudestowards women' s work roles and women managersin a sports organizations: the case of Turkey, Gender,Work and Organization, 18(6), pp. 592–612.
• Koening, A. M., Eagly, A. H., Mitchell A.A., &Ristikari, T. (2011). Are leader stereotype masculine?A meta-analysis of three research paradigms,Psychological Bulletin, 137(4), pp. 616–642
• Owen, C.I., & Todor, W.D. (1993), Attitudes towardwomen as managers: still the same, BusinessHorizons, (March-April), 12-16.
• Peters, L.K., Terborg, J.R., & Taynor, J. (1974),Women as managers’ scale: a measure of attitudestoward women in management positions, JSASCatalog of selected documents in psychology.
• Powell, G.N., & Butterfield A.D. (2003). Gender,gender identity and aspirations to top management,Women in Management Review, 18(1-2), pp. 88–96.
• Schein, V.E., Mueller, R., Lituchy, T., & Liu, J.(1996). Think manager–think male: a globalphenomenon? Journal of Organizational Behavior,17(1), pp. 33–41
• Wood GJ and Newton J (2006) Childlessness andwomen managers: “Choice”, context and discourses.Gender, Work and Organization; 13 (4): 338–358.
Page 107 P.E.S. College of Engineering, Mandya & Primax Foundation, Bengaluru
UGC ID No: 63975 Impact Factor - 5.87“Recent Trends in Business Management”
A STUDY ON MERGERS AND ACQUISITIONS: (IMPACT OF MERGERSAND ACQUISITION PROCESS ON CORPORATE ENTERPRISES)
1 . Lecturer, Department of Commerce Lorven Educational Centre, Bangalore.
IntroductionRestructuring is the process whereby a firm analysesto achieve consistent growth profitability and forsakewhich is not in the owners but, done by altering capitalstructure which makes an organization to increase thevalue of the firm. Thus the basis of corporate restructurecreates value through mergers and acquisition.Restructuring is an important means for achievingchanges in corporate work culture, values, structure,management systems, technology, skills etc. Thischange depends on the choices made as to what, howand in what way to change occurs in the organizationstructure which is the key strategies and control ofownership.The different techniques of corporaterestructuring include privatization, expansion,diversification and mergers and acquisition
The main aim of this research study is to explore andidentify on why the companies merge with or acquirecompanies. The main reason of acquiring an entity is tocreate shareholder value, hence strong companies willact to buy other companies to create competency, costefficiency so the company will come together to gaingreater market share or achieve greater efficiency andduring the process of merger stocks of the companiesare surrendered and new companies stocks are issuedand this is between similar size companies. In merger itis A+B=C.
In case of an acquisition one company is taken over byanother company and therefore single owner isestablished. Here usually big company acquires smallercompany which indeed will be a less powerful one andhence the big company takes in charge and runs thewhole organization with its identity and the smallercompany will lose its existence and here stock are notsurrendered and it will be traded by the general public inthe stock market.In acquisition it is A+B=A, hence merger is called asfriendly buyout and acquisition is referred as hostiletakeover. Corporate restructure activities are related to:Expansion or contraction of firms activities,Changes inownership structure and changes in assests
The different forms of corporate structure are• Merger or amalgamation
Amalgamation is a process in which the assets andliabilities of two or more companies become underthe control of other company without giving muchownership to the shareholders of the acquiredcompany and the amalgamating companies ceasetheir identities and form as an amalgamated company
• Acquisition or take overIt implies acquisition of smaller firm which becomesa subsidiary company
• Financial RestructureIt is carried out internally with the agreement of thevarious stakeholders by corporate which is facinghuge losses. It is a suitable model for the entityfacing loss for several years and which is formulatedby appropriate restructuring scheme involving anumber of legal formalities. It implies importantchange in the capital structure of a firm which leadsto the change in the payment of fixed financial chargeand change in the pattern of ownership and control.
• DivesturesIt is a form of corporate restructuring which involvessale of segment of a company for cash or securities,which includes some assets like plant, division,product line, subsidiary.
• DemegersIt is a form of corporate restructuring in which one ormore of a company’s undertakings is transferred toanother company .
• BuyoutsThe management buyout (MBO) involves the sale ofthe existing firm to the management and it may befrom the same firm or outside firm. And leveragedfinancing is when debt financing is the substantialpart of the total financing from outside .
• Strategic allianceIt is a form of voluntary formal agreement betweentwo companies to pool their resources to achieve aset of objectives.
Thorera Leena Ganesh1
ISSN: 2349-5162Journal of Emerging Technologies and Innovative Research
Page 108February 2019Special Issue
Meaning of merger and acquisitionMergers and acquisition are considered as very rigidfinancial concept. this type of business activities areused by companies to grow their business, hence atypical mergers and acquisition will have complexity interms of tax legal and now it is a more generic, mergerand acquisition are entirely different businesscombination
MergerMerger is an agreement that combines two existingcompanies into new company , in other words mergerinvolves in the entire absorption of a target firm by theacquires, which leads to a new firm and the target firmceases to exist where only the new firm remains . Thereare several types of mergers and also with differentreasons for a merger to happen.
Types of mergers• Horizontal merger: This merger occurs when two
or more companies in similar lines of activitycombine together. Example: flip kart acquiredMyntra where both are into online retail space andselling goods on their portal .
• Vertical merger: It occurs between two or morecompanies producing different products for onespecific finished product. Example: tata motorsacquiring its supply chain Tata steel to manufactureone of its products.
• Conglomerate merger: This is the merger wheretwo firms come together whereby they are unrelatedin their business but these two companies combinefor the purpose of diversification. Example: SunPharma went ahead and acquired suzlon which isthe power company.
• Concentric merger: It takes place between twocompanies which have common expertise which aremutually advantageous to both the companies.
AcquisitionAn acquisition involves one firm buying only a part ofanother firm and the acquisition may happen to acquireassets or a different portion of the other firm. On theother hand acquisition means acquiring a stake whetherthat is a minority, majority or complete stake in the targetfirm
Merger and acquisition can take place by purchasingassets, common shares, by exchanging share forassets, by exchanging shares for shares and also itcan take two forms through absorption and consolidation.Mergers and acquisition profitability leads to stimulateeconomic growth and development of any nation, hence
mergers and acquisition is recommended to strategicallyaccustomed by firms to improve profitability and valueof the firms.Acquisition can assume to have three forms• Negotiated friendly: This is organized by the
management to parting with the control ofmanagement to another group through negotiation.
• Hostile: The acquiring company takes over theshares from the open market and quoting price higherthan the prevailing market share.
Objectives of the studyA. To find out why the companies merge with other
companies, which is influenced by restructuring ofcompanies and the reasons considered for acquiringcompanies in terms of increasing its size.
B. To study the process for evaluating and executingmergers and acquisitions, this is necessary for allthe acquiring firms’ in order to gain more importanceas competition increases and companies movetowards the growth.
A. Mergers and acquisitions reasons1. Mergers are similar to acquisition in many ways
hence it is often grouped as merger and acquisition2. Mergers occurs when a company finds synergy with
another company which increase shareholder value3. A business will merge with another business that
has equivalent strengths and weakness4. Diversification and sharpening business focus are
the two conflicting goals which is used to describethe mergers and acquisition
5. Mergers can give the acquiring company anopportunity to increase its market share by buyingcompetitors business for a price
6. Merger and acquisition eliminates future competitionand gain a large market share in the product’s marketwhich is usually required for the target companyshareholder to accept the offer
7. Companies use mergers and acquisition to increasein size in order to withstand their rival company
8. Mergers and acquisition engage in domination in theirsector which results in monopoly
9. Companies also use mergers and acquisition for taxpurpose to reduce its tax bill
10. Company’s profitability depends on mergers andacquisition it makes.
11. To increase market share of the companies it shouldbuy a company that is directly competitive and thussecuring its customer base which will increase inthe size of the company and grow overnight

Page 109 P.E.S. College of Engineering, Mandya & Primax Foundation, Bengaluru
UGC ID No: 63975 Impact Factor - 5.87“Recent Trends in Business Management”
12. Acquiring a company whose products are substituteto the current product in the expectation that someof the parts will be greater than the whole.
13. Acquiring a company which has the completepackage of advanced technology which will be helpfulor time consuming for the acquiring company todevelop in its own company
• Mergers and acquisition profitabilityA profitability of a company should be increasedby the acquisitions it makes since the series ofacquisition can make in the deterioration in acompany’s core business, analysts andinvestors often depend on the organic growthrate of revenue and operating margins whichexcludes the effect of mergers and acquisitionsfor such a company. The impact of mergersprofitability is measured by comparing the bookvalue profitability measures pre and post mergerand it is usually measured as the ratios of profitsto sales, rate of return on total net assets.Profitability comparisons can be used toevaluate if mergers take advantage of economiesof scale, and here entity should expect profitsto increase in pre and post merger values toboth acquiring and target company.
B. Process for evaluating and executing mergersand acquisitions
1. Ascertain the growth of markets and servicesAcquisition and evaluation process starts byidentifying growth opportunities in services andbusiness area and in order to analyze the dataregarding client origin , demographic( population ,age employment and unemployment) employersother competitors, business program, field staff,consumer preference options are to be collected forthe purpose of determining growth of market andservices .
2. Classify mergers and acquisition participantsIdentifying potential mergers and acquisitioncandidates who could meet strategic financialgrowth, based on management experience,research, the use of consultants and other methodsare the ways in which participants can be classified.
3. Evaluate financial position of the targetcompanyThe evaluation of financial and credit position of thetarget entities is based on revenue, cost, balancesheet and all financial forecasts.
4. Decision making processCorporate entities should determine the advantagesand disadvantages of mergers and acquisition activity
and identify whether the strategic value added casefor a combined entity is worth enough to proceed ornot.
5. Valuation of the target entityTarget companies value has to be assessed alongwith identifying alternatives for structuring the mergeror acquisitions transactions and evaluating andselecting the structure that would enable theorganization to achieve its objectives and valuationcan be done by, discounted cash flow analysis,comparable transaction analysis and comparablepublicly traded company analysis and to select bestvaluation range, company should select bestvaluation method.
6. Due diligence reviewThe acquiring should review target companiesfinancial, legal and operational position to ensureaccuracy of information obtained before theacquisition process and disclose all the informationregarding to the transaction.
7. Agreement between the entitiesOnce the due diligence review is completed , theparties negotiate definitive agreement and approvalfrom the regulatory is necessary for mergers andacquisition transactions execution, and the acquirerhas to monitor the goals and objectives establishedfor the transaction at the end of strategic assessment
8. Implementing mergers and acquisitiontransactionA successful mergers and acquisition is thecombination of two companies of convenient mannerto maximize strategic value and to minimizedestruction to existing operations which includes amechanism to deal with future problem in theimplementation of the transaction.
••••• Current scenario of mergers and acquisition inIndia1. The mergers and acquisition situation is very
active and there are several deal under discussionin the strategic and private equity domains.
2. The rationale of doing business in India willchange which is due to mergers and acquisitionactivity which upgrades into formalized economy
3. Some of the factors which drive the growth ofmergers and acquisition activities in India are debtreduction and difficulties infamily run business.
4. High capital can be the most important area formergers and acquisition.
5. Mergers and acquisition will consolidate andupgrading to the formalized economy.
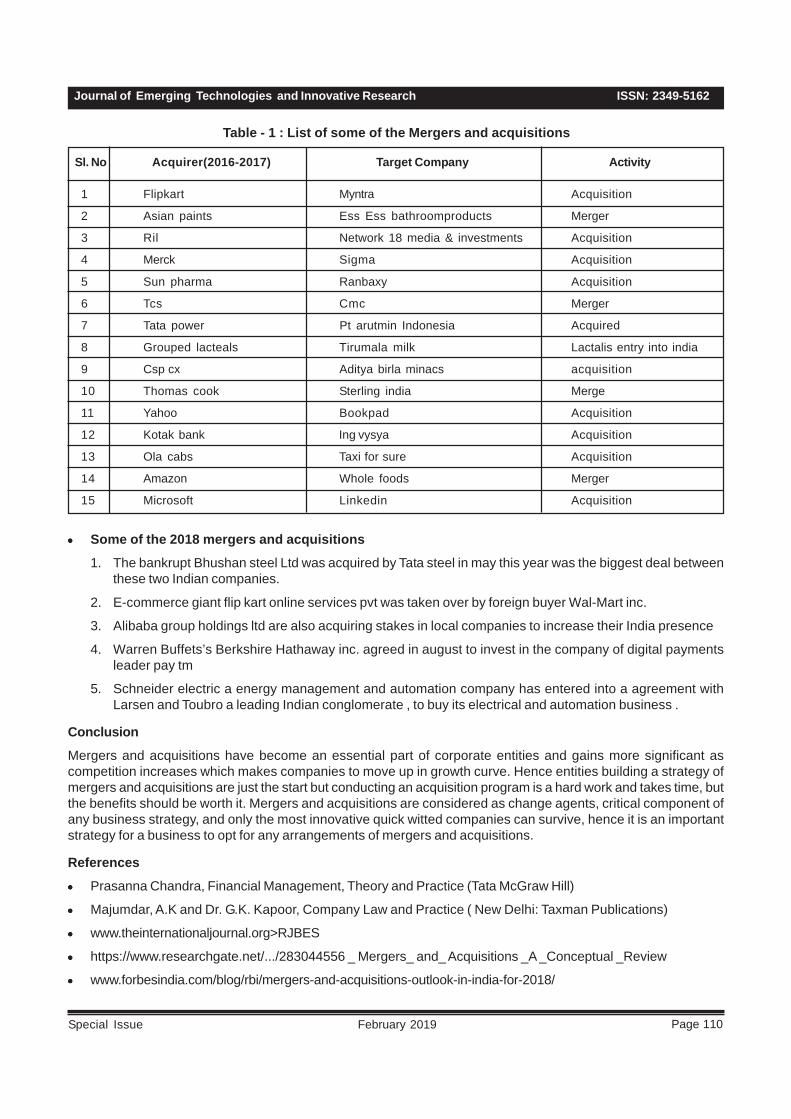
ISSN: 2349-5162Journal of Emerging Technologies and Innovative Research
Page 110February 2019Special Issue
Table - 1 : List of some of the Mergers and acquisitions
Sl. No Acquirer(2016-2017) Target Company Activity
1 Flipkart Myntra Acquisition
2 Asian paints Ess Ess bathroomproducts Merger
3 Ril Network 18 media & investments Acquisition
4 Merck Sigma Acquisition
5 Sun pharma Ranbaxy Acquisition
6 Tcs Cmc Merger
7 Tata power Pt arutmin Indonesia Acquired
8 Grouped lacteals Tirumala milk Lactalis entry into india
9 Csp cx Aditya birla minacs acquisition
10 Thomas cook Sterling india Merge
11 Yahoo Bookpad Acquisition
12 Kotak bank Ing vysya Acquisition
13 Ola cabs Taxi for sure Acquisition
14 Amazon Whole foods Merger
15 Microsoft Linkedin Acquisition
••••• Some of the 2018 mergers and acquisitions
1. The bankrupt Bhushan steel Ltd was acquired by Tata steel in may this year was the biggest deal betweenthese two Indian companies.
2. E-commerce giant flip kart online services pvt was taken over by foreign buyer Wal-Mart inc.
3. Alibaba group holdings ltd are also acquiring stakes in local companies to increase their India presence
4. Warren Buffets’s Berkshire Hathaway inc. agreed in august to invest in the company of digital paymentsleader pay tm
5. Schneider electric a energy management and automation company has entered into a agreement withLarsen and Toubro a leading Indian conglomerate , to buy its electrical and automation business .
Conclusion
Mergers and acquisitions have become an essential part of corporate entities and gains more significant ascompetition increases which makes companies to move up in growth curve. Hence entities building a strategy ofmergers and acquisitions are just the start but conducting an acquisition program is a hard work and takes time, butthe benefits should be worth it. Mergers and acquisitions are considered as change agents, critical component ofany business strategy, and only the most innovative quick witted companies can survive, hence it is an importantstrategy for a business to opt for any arrangements of mergers and acquisitions.
References
••••• Prasanna Chandra, Financial Management, Theory and Practice (Tata McGraw Hill)
••••• Majumdar, A.K and Dr. G.K. Kapoor, Company Law and Practice ( New Delhi: Taxman Publications)
••••• www.theinternationaljournal.org>RJBES
••••• https://www.researchgate.net/.../283044556 _ Mergers_ and_ Acquisitions _A _Conceptual _Review
••••• www.forbesindia.com/blog/rbi/mergers-and-acquisitions-outlook-in-india-for-2018/

Page 111 P.E.S. College of Engineering, Mandya & Primax Foundation, Bengaluru
UGC ID No: 63975 Impact Factor - 5.87“Recent Trends in Business Management”
DIGITAL INDIA (IMPACT OF DIGITLISATION TOWARDSAGRICULTURAL SECTOR)
1 . Lecturer Department of Commerce, Loren Educational Centre Chandapura, Karnataka.
IntroductionEvery year there is a rapid demand of food and products,where the population is unable to produce. As a resultin order to satisfy the demands of food consumptiondigitalization in agriculture would a substantialimprovement.
Since commerce literally means indulging in differenttypes of business and creating more and moreemployment. On trendy basis due to declaim of jobopportunities in IT sector many youths are turned outas agri-entrepreneurs. The ICT revolution has created atechnical divide between urban and rural area people toget access to all digital services.
MS.Swaminathan says “if agriculture fails, everythingelse will fails” farms that add iot capabilities, big dataanalysis and other agriculture tools are making strongstrides which helps to increase the yield up to 10-20%when compared to past.
Indian agriculture sector provides employment to about65% of the labour force, it accounts for 27% GDP, and itcontributes 21% of total exports and raw-materials toseveral industries. Since, farmers are facing manyproblems like insufficient practices for farming, waterscarcity for irrigation, lack of crop rotation etc... undersuch circumstances the concept of digital agriculture ismore vital.
Objectives of the study1. To study the digital applications available to assist
the rural agriculture.
Nandha. H. G1
AbstractDigital India –Governments dream project was launched by our honourable prime minister Narendra Modi on 1 july2015 This project was mainly launched to help the small farmers to increase the efficiency through digital literacy.Around 72% of rural area do not have any access to latest technology , many institutions like state agriculturaldepartments , agricultural universities come forward to contribute their professional knowledge to develop digital eco-system . Under e-governance plan, farmers get information through multiple channels including common servicecentres and SMS. Currently 12 identified clusters provides information on weather, soil health , seeds, nutrients etc.According to 2015 survey national tele density was 79% and rural tele density was 46.5%, wherein the aim is toincrease rural tele density at least 60% by 2018.Purpose of the study is to know different digital applications availableto assist the rural agriculture 2) to know the growth and changes taking place after digitalization 3) to know the impactof digital agriculture.Hence, an attempt is been made to know about the smart technology used in agricultural sectorlike credit services, insurance and market services available to farmers .
Key factors: ICT(information and communication technology), M-Commerce, E- governance.
2. To study the growth and changes taken place inagricultural sector.
3. To study the impact of digitalization in agriculturalsector.• Digital applications available to rural
farmers:- Indian economy’s major sharedepends on agricultural income, as a result GDPis declaiming year by year. So to improve farmproduction government of India has launcheddigital apps which helps in weather forecasting,soil fertility through fertilizers and pesticides,market information, demand of quality crop,money lenders, logistics, packing methods, dateof sowing, ploughing ,nursing crops etc... heresome of the identified applications.
• ENAM:- Electronic national agricultural marketis an pan-Indi electronic trading portal whichnetworks the existing (APMC) agriculturalproduce marketing committee, mandis to createnational market. Government is taking mandisonline by providing trading software to manditraders along with grading, assaying andlogistics.
Features of the app• Committee related information and services.• Portal window service for all APMC• Opportunity to buy and sell offers.• Reduces the transaction cost• Information about commodity arrivals and prices.
ISSN: 2349-5162Journal of Emerging Technologies and Innovative Research
Page 112February 2019Special Issue
• Agrimarket app:-Through this app farmers can getinformation about prices of crops in market within50km of their own device location using these mobileapps.
• Crop insurance mobile app:- It can gives completedetails of crop insurance like♦ Calculate the premium for notified crops based
on area♦ Coverage amount and loan amount.♦ Details of normal sum insured and extended
sum insured.♦ Information about notified crop in any notified
area.
• Kisan suvidha app:- A smart mobile app for helpthem to provide relevant information relating to♦ Current day and next 5 days weather alerts.♦ Agro advisories and plant protection practices♦ Market prices of commodities nearest area and
maximum prices of products in state as well
• Bhuvan hailsrorm app:- Mainly developed tocapture the loss arrived due to hailstorm. This iscapable in capture the following things• Photograph of field with latitude and longitude• Name of the crop and date of sowing.• Date of likely harvesting and source of irrigation.
• Farm-o-pedia:- It has been developed by CDACMumbai and the main functions of this app are, getstable crops as per soil and season, crop wiseinformation, check weather in particular area,managing the cattle etc...
••••• Formers portal:- The main aim of this app is toprovide relevant information and services to theforming community. For example agriculture, animalhusbandry, fisheries etc..
• Mkisan:- App is been developed by in-house IT teamthis enables the formers and other stakeholders toobtain data sent by experts, government officials atdifferent levels.
• Unmanned aerial vehicles that can capturemultispectral images to access crop health, damageand yield for more accurately than satellites.
• Growth and changes in agriculture sector afterdigitalisation.Farming turns to be predominant form of agriculturein our Asia and Pacific. Approximately 570 millionfarmers in the world under that 500 millions are familyowned, who are expecting at least 56% ofagricultural production.FOA has been promoting the
use f ICT in agriculture for increasing productivity.With the use of these techniques growth is beentaking place.
Growth of gdp:- Indian agriculture contributesaround 7.68% total global output and Indianagriculture is much higher than worlds average thatis (6.1%) march 21 2017. GDP from agriculture inIndia is averaged about 4037.84 INR billion from 201-2018.
State GDP is about 56.2% and per capita growth of43.9% in the last decade.
Now Karnataka leading to 10th place in GDP percapital income and GDP ranks at 5th position with7.4% (2017-2018). The overall growth is beenincreased compared to previous data.
Agriculture providing employment to 48.9% of entirework force, agro innovations in tribal areas and around150 backward district were practicing farming activities.
In this scenario many changes had been taken placeand this can be illustrated with the help of followingcase study’s
Case study 1:- Vijaya rao, successful capsicumfarmer from kadbanwadi village in pune obtaining BSc(2010) was unable to succeeded in his carrier. So,he decided to become agri-entrepreneur performingdigital methods over traditional farming. for that heattended one week workshop at horticulture trainingcentre in pune. After that he decided to cultivatecoloured capsicum in polyhouse with a latesttechnology methods using mobile app and servicesand he got a financial assistance from a bank alongwith subsidy with the help of government agriculturaldepartment. Currently he produced 40 tonnes ofcapsicum, in 10 months and earned 13lakhin a shortperiod and also he is creating employmentopportunities to unemployed and he becomesuccessful entrepreneur.
Case study:-2 By seeing all the hurdles facing bythe farmers in the country IIT and IIM pass outs havelaunches an app “GRAMAPHONE” which is dedicatedto all the suffered farmers. This app provides solutionrelating to agronomy and agriculture market.
By using this app Mr. Rajesh anjana from Indore, a31 year old smart phone user succeeded in farmingactivities. According to him to make farming aprofitable one we need to maximize yield and cutdown the cost of farming. By getting information fromthis app, he started cultivating onions with preciseuse of modern agronomy with , plant hybridation,pesticides, fertilizers and latest technology and hehas improved his onion yield up to 30% with 50%.

Page 113 P.E.S. College of Engineering, Mandya & Primax Foundation, Bengaluru
UGC ID No: 63975 Impact Factor - 5.87“Recent Trends in Business Management”
Case study 3:- Farmer San San using a :GREENWAY APP” which was set up by two farmeragricultural students in 2011. This app advised herfor growing paddy with appropriate use of pesticidesand he earns huge profits.
Case study 4 :- Mr.Vidhya kara a farmer fromHimachala Pradesh had multi-herb portfolio and heis earning 2.5 to 3 lakh per acre. He says that buadopting latest technology we no need to sprayregularly and fertilizers implementation can be minimal.
• Impact of digitalization:- By observing thechallenges faced by farmers like lack of production,unemployment, rapid poverty etc... in order toovercome these issues in 2016 Modi governmentintroduced a new digital India programme to reducethe poverty levels, food securities and climatechanges which is effecting the agriculture frequentlywith temperature changes, draughts, flood etc..
Digitalization involve adoption of digital technologiestomodify agro economy by creating a value from theuse of new and advanced technologies by exploitingdigital network dynamics and giant digital flow ofinformation through ICT, E-governance.
Following are the some of the impacts ofdigitalization• New job creation:- Un employees can get
connected through ICT(information andcommunication technology)
••••• Access to agriculture knowledge data:- Relevantand related up to date data about all agriculturalactivities is gained through ICT, E-governance, E-commerce.\
• Increased return and investment:- Using properdigital data for agricultural practice improve agroeconomy and market which returns all investment.
• Infrastructural development:- Digitalization willhelps to improvising infrastructural facilities like greenhousing, warehousing, transportation facilities etc...
• Agricultural literacy:- With the help of ICT and E-governance plan the digital literacy is increasing dayby day. If farmer get access to internet it may improvebetter farming skills.
• Farmers can sell their produce to mandis or to onlineplatform.
••••• Mobile money:- Paper money is expensive andrisky for rural consumers but mobile money is saferespecially for women’s and less cost for transfers.It also useful for farmers to save money and credit.
The government of India pays more attention towardsthe improvement of farmers. For this purpose gvt
addressed some amendments like minimum supportprice for crops, they planned to working with NITI ayogto set up optimal farm price etc...
Future of Indian agricultureIn this 21st century there should be a need for improvingagricultural implements for that purpose NABARD hasconducted a seminar on “doubling farmers income by2022, in this programme they highlighted the ways toincrease the income of farmers by reducing cost. In thisprogramme they highlighted some strategies to enhancethe income.• Special focus on dry land area• Reducing cost through smart nutrient management.• Leveraging water resource for enhancing farmers
income.• Reducing the post harvest losses.• Research activities to reduce yield gap.• Use of seed drills to increase agricultural efficiency etc..The union budget of 2018 mainly concerned towards ruraland agricultural development, because the country isfacing many problems like low capital formation, highinput cost, less productivity, etc.. for this purposegovernment had taken many initiatives for rural economylike pradhana mantri fiscal bima jojana, crop insurance,allocation of budget up up to 15% for farm research andeducation and government will also taking severalmeasures to improve warehousing and agriculture. Thishelps India to become stronger with the use of ICT,different innovative ideologies, strategies to stand Indiaas a developed nation.
ConclusionAs per the study it can be concluded that there is arapid growth in agriculture through digitalization. Throughthe adoption of smart farming techniques that helps inproduction, distribution and consumption of agriculturalproducts and creates more employment and selfbusiness opportunities. Digitalization reduce the costand improves the productivity with advancement in farmmanagement techniques, fast internet and Its, scientificknowledge of crop growth, water preservationtechniques, crop rotation ideology in long term helps inconserving green belt of India. The digital scenario createsscope for advanced innovations and opportunities candouble the income of farmers by 2025.
References• Information and communication technology-wikipedia• Digital India magazine for agricultural development.• www.IJARIT.com• www.jcbl.com• http:s//m.business to day. in• www.ideaforindia. com

ISSN: 2349-5162Journal of Emerging Technologies and Innovative Research
Page 114February 2019Special Issue
1. Assistant Professor, Department of Commerce, Government First Grade College, Udayapura, ChannarayapatnaTaluk, Hassan District.
GREEN MARKETING: STRATEGIES IN THE CHANGING SCENARIO
Introduction:It is observed that the concept of environment andviewpoints about the environment- in parallel with resultsof social, economic, political developments andenvironmental problems- considerably undergo a changein recent years. Chimney gasses, toxic waste, and otherwaste which occur as the result of industrialization whichhas started in England with the industrial revolution andcontinued with advancing in other Western countriescause serious environmental problems. While ambitiousand unrestrained production desire cause waste ofsources, fabrication waste, and consumption waste havestarted to pollute atmosphere, seas, rivers and landsinternationally. In the beginning of 21st century, thispollution prompted to countries for searchinginternationally binding solutions about how the world isgoing to be cleaned. With the aim of being protected byenvironmental threats of rapid development andunrestrainedly increasing trade, internationalenvironmental organizations have started to come up inthe second half of the 19.century.
Nowadays, businesses in any field have understood thatthey cannot carry on without being sensitive towardsenvironmental problems. Accordingly, businesses haveto take into consideration environmental issues whilethey prepare their strategies and long-term plans
because, in any market, environmental awarenessprovides a competitive advantage yet. In that point, greenmarketing concept has occurred in both industry andservice industries and with the help of support andpressure of consumers, stakeholders and government,businesses enter into the new process.
Green Marketing Concept:Environmental sustainability is not simply a matter ofcompliance or risk management. Businesses areincreasingly recognizing the many competitiveadvantages and opportunities to be gained from eco-sustainability. Worldwide evidence indicates that peopleare concerned about the environment and are changingtheir behavior accordingly. As a result, there is a growingmarket for sustainable and socially responsible productsand services. The types of businesses that are emerging,what they manufacture, and their approach to marketingare changing.
Green marketing is the marketing of products that arepresumed to be environmentally preferable to others.Thus green marketing incorporates a broad range ofactivities, including product modification, changes to theproduction process, sustainable packaging, as well asmodifying advertising. Yet defining green marketing isnot a simple task where several meanings intersect and
Movina Kumara N. P1
AbstractThe world has now become a single stage, and we are now moving forward with a common goal of protecting theenvironment and attaining sustainable development. The green marketing philosophy is getting stronger among themasses, and this attitude of the consumers has forced the business fraternity to rethink and plan their strategies to dotheir businesses in a more innovative and environmentally friendly way. This has forced the industries to adopt waysand means to sell out their products by way of attracting customers by putting eco-labels and making products moreof environmentally friendly in nature. This paper aims to give information about concept of green marketing, significanceof green marketing, Problems with Green Marketing and green marketing strategies in the changing scenario.
Methodology:The scope of the study on the Green marketing: Strategy in the changing scenario - is based on the secondary data,library references materials, news papers and internet websites.
Objective of the study:1. To understand the meaning of the green marketing.2. The see impact of green marketing on society.3. To understand how the green marketing affect consumers.4. To know the recent strategy in green marketing.

Page 115 P.E.S. College of Engineering, Mandya & Primax Foundation, Bengaluru
UGC ID No: 63975 Impact Factor - 5.87“Recent Trends in Business Management”
contradict each other; an example of this will be 43 theexistence of varying social, environmental and retaildefinitions attached to this term. Other similar terms usedare environmental marketing and ecological marketing.
Green, environmental and eco-marketing are part of thenew marketing approaches which do not just refocus,adjust or enhance existing marketing thinking andpractice, but seek to challenge those approaches andprovide a substantially different perspective. In more detailgreen, environmental and eco-marketing belong to thegroup of approaches which seek to address the lack offit between marketing as it is currently practiced andthe ecological and social realities of the wider marketingenvironment.
Green marketing involves developing and promotingproducts and services that satisfy customers’ wants andneeds for quality, performance, affordable pricing andconvenience – all without a detrimental impact on theenvironment. People generally want to do the right thing,so the challenge and opportunity for the green marketeris to make it easy for people to do so. When all else(quality, price, performance and availability) is equal, anenvironmental benefit will most likely tip the balance infavour of a product. The marketing industry can ‘walkand talk’ and become the new corporate champions ofthe environment. Successful green marketers will reapthe rewards of healthy profits and improved shareholdervalue, as well as help to make the world a better placein the future.
Significance of Green Marketing:Since resources are limited and human wants unlimited,it is important for the marketers to utilize the resourcesefficiently without waste while achieving theorganization’s objective. Today’s consumers arebecoming more and more rational about the environmentand are also becoming socially responsible. Thereforeall companies are attentive towards the consumers’aspirations for environmentally less damaging or neutralproducts. Many companies want to have an early moveradvantage as eventually they have to move towardsbecoming green.
There is a growing awareness among consumersworldwide regarding protection of the environment inwhich they live. People do want to bestow a clean earthto their descendants. Various studies by environmentalistsindicate that people are concerned about the environmentand are changing their behavior pattern so as to be lesshostile towards it.
Green marketing is becoming increasingly important dueto the following reasons:
1. Opportunities:Business firms perceive green marketing to be anopportunity that can be used to achieve theirobjectives. For example Xerox introduced a highquality recycled photocopier paper in order to satisfythe demand for less environmentally harmfulproducts.
2. Social Responsibility:Many firms are beginning to realize that as membersof the wider community they must behave in anenvironmentally responsible fashion. Therefore,environmental issues are being integrated into thefirm’s corporate culture.
3. Government Pressure:Government agencies are creating more and moreregulations to control hazardous wastes producedby industry. Those regulations seek to protectconsumers and the society from negative impact ofbusiness activities on the environment. In somecases, governments try to induce firms andindividuals to become more responsible towards theenvironment.
4. Competitive Advantage:Firms marketing environment friendly products andservices will have a competitive advantage over firmsmarketing non environment friendly products andservices. For example McDonald’s replaced itsclamshell packaging with waxed paper to minimizeozone depletion.
5. Cost Factor:Firms also use green marketing to reduce costs.Disposing of harmful by-products such aspolychlorinated biphenyl (PCB) contaminated oil isbecoming increasingly costly and difficult. Thereforefirms that can reduce harmful wastes can gainsubstantial cost savings. More efficient productionprocesses cannot only reduce waste but also theneed for raw material. A firm may develop atechnology for reducing and recycling waste. Forexample firms that clean the oil in large industrialcondensers increase the life of those condensers.Remove the need for replacing the oil, as well as theneed to dispose of the waste oil. This reducesoperating costs for the owners of condensers andgenerates revenues for the firms cleaning the oil3 ..
Problems with Green Marketing:Marketers need to develop strategies which will allowthem to overcome three major problems associated withgreen marketing: poor credibility, consumer cynicism,and consumer confusion. If these problems cannot be
ISSN: 2349-5162Journal of Emerging Technologies and Innovative Research
Page 116February 2019Special Issue
overcome, then it is questionable whether greenmarketing, as a whole, will be effective Peattie and Cranehave identified five marketing practices which led to thefailure of green marketing during the last three decades:
1. Green spinning:Taking a reactive approach by using public relationsto deny or discredit the public’s criticisms againstthe company’s practices.
2. Green selling:Taking an opportunistic approach by adding somegreen claims to existing products with the intentionto boost sales.
3. Green harvesting:Becoming enthusiastic about the environment onlywhen greening could result in cost savings (e.g., interms of energy and material input efficiencies,package reductions, etc.).
4. Entrepreneur marketing:Developing innovative green products to marketwithout really understanding what the consumersactually want.
5. Compliance marketing:Using simple compliance with compulsoryenvironmental legislation as an opportunity topromote the company’s green credentials withouttaking voluntary initiative in green policies. Non-voluntary green procedures should not be promotedpublicly and should not treated as green marketingstrategy.
Strategies to be executed for Green Marketing:In order to expand the market of green products it requiresome of strategies which can be conducive to boost upthe market of the green products. Those strategies canbe implemented as follows:
1. Green Differentiation:It is a paramount need to make continuous effortswhich can be helpful to differentiate then productsand services using green marketing practices. Thereis a wide range of markets which includes retailingetc. the manufactures have used eco-performanceto differentiate and to compete. It has been observedthat the product with poor eco-performance canbecome target for new substitution, as a result ofthis many organization are products from thecompetitors.
2. Green Positioning:The organization can design environmental productsto perform as promoting and delivering the
customer’s desired value of environmental productsand target relevant customer market segment canbe proved conducive to organization to differentiate.
3. Designing of bio-degrading prone packaging:It has been observed that promotion of green productshave been strongly influenced by the design makingof the customers. Thus it indicates that bio-degradable packing will affect in a strong andmoderate on their decision making. It is therefore,an imperative to the personnel’s associated withgreen marketing should modify the productpackaging by making use of recycle as well ashandmade paper packaging rather than using moremechanized material. The manufacturers, who areusing plastic for packaging, should meet some ofrequisite standard.
4. E-Newsletters:Many businesses offer monthly newsletters to theircustomers. A business can cut paper waste andprinting costs, while providing equal or greater levelsof content, by shifting over to e-newsletters.
5. Green Disposal:An effective green marketing strategy takes intoconsideration every aspect of a product’s life cycle.From production to disposal, everything must besustainable. Unsustainable disposal practices canbe hazardous to both the environment and humanhealth.
Conclusion:Green marketing is relatively a new notion to the mostof the consumers. However, the green marketing is themarketing of product that are presumed to beenvironmentally safe. Green marketing is fulfillmentneeds and wishes of the consumers with an environment-friendly approach. Because one the most important factorof green marketing idea adoption by businesses isconsumer’s environmental consciousness increase andtendency to prefer Eco credential products. This paperhas states that marketing like other functional areas ofa business contribute to environmental concerns facingthe world today. Therefore, it has a role to play in lookingfor solutions to these environmental problems. In thatmarketing through green marketing and specifically greenmarketing strategies is addressing the challenge withpositive outcomes of improved organizationalperformance, better physical environment which will leadto sustainable development. Finally, consumers,industrial buyers and suppliers need to pressurize effectson minimize the negative effects on the environment-friendly. Green marketing assumes even more importanceand relevance in developing countries like India.

Page 117 P.E.S. College of Engineering, Mandya & Primax Foundation, Bengaluru
UGC ID No: 63975 Impact Factor - 5.87“Recent Trends in Business Management”
References:• Amitabha Ghosh (2008) ‘Green Marketing Strategies’ ICFAI University Press, Hydrabad.• Suresh K (2008) ‘Green Marketing- Concept and Cases’ ICFAI Uni-versity Press, Hyderabad.• Goliath - journal of International Business Research• Yakup Durmaz(2016) ‘Green Marketing and Benefits to Business” Hasan Kalyoncu University• Neeti Kasliwal(2016) ‘Green Marketing: Trends, Challenges, Future Scope and Case Studies’ Indian Institute of
Health Managment Research• Kumar, P. (2011). Green Marketing: A start to environmental safety. Advances in Management,• Rajeshkumar, L. (2012). An overview of green marketing. Naamex International Journal of• Management Research• www.firstcarbonsolutions.com/resources/newsletters/july-2016-effective-green-marketing-strategies/5-effective-
green-marketing-strategies• www.greenbiz.com/blog/2014/01/14/five-strategies-avoid-taint-greenwash-business• Business line news paper• Economics Times news paper
ISSN: 2349-5162Journal of Emerging Technologies and Innovative Research
Page 118February 2019Special Issue
1. Assistant Professor, Department of Commerce, Government First Grade College, Udayapura, ChannarayapatnaTaluk, Hassan District.
SOCIAL MEDIA MARKETING - CHALLENGES AND OPPORTUNITIES
IntroductionAccording to Liz strauss –SOBCon social media wouldbe any object or tool, that connects people in dialogueor interaction — in person, in print, or online. In commonusage, social media has come to mean a specificcategory practices, technology, tools, and online sitesthat involve social relationships, participation, and user-generated content.
Social media are a means for consumers to share text,images, audio, and video information with each otherand with companies and vice versa. Social media allowmarketers to establish a public voice and presence onthe web and reinforce other communication activities.Because of their day-to-day immediacy, they can alsoencourage companies to stay innovative and relevant.Therefore; business must learn how to use social mediain a way that is consistent with their business plan. Thisis especially true for companies striving to gain acompetitive advantage. The popularity of social mediafor marketing purposes can be attributed to a number ofadvantages associated with social media when comparedto traditional marketing channels. 44% of brands spendmore than 20% of their marketing budget on digitalmarketing while 24% of brands are spending more than16% or more from their marketing budget on socialmedia. 92% of marketers declared that social media
marketing plays a vital role for their business. 97% ofmarketers are showing interest by participating socialmedia (Report by social media examiner). 62% of themarketers said Social media played dynamic role inmarketing past 6 months (State of Inbound marketing,2012). Presently, Companies that picked up customersare from Social media. As per the Statistics an averageof 42 minutes were spent by users on Facebook daily.The above statistics exhibits a vast prospective of socialmedia marketing to surge sales.
According to the recent studies, companies recognizedthe importance and role of social media marketing andplanned to increase social media budgets for next 5years. It is a best medium to convey our informationeasily and effectively online. From last 7 or 8 years wehave seen a sudden increase and progression on SocialMedia sites. Presently the most diversified Social medianetworks are Facebook, Twitter, Google+ and LinkedInetc. India is World’s 7th largest in Internet Market; thereare 21 million people in India who are estimated to visitsocial media sites regularly which is 60.3% of the totalactive Indian Internet audience. More than 90% of Indianonline users belong to 18-45 age group which has highpurchase power and high disposable income. The socialmedia websites in India are growing by almost 100%year after year.
Raghu K V1
AbstractSocial media is a platform which not only connects people worldwide but also serves best for Digital Marketing. Digitalmarketing is a practice which is usually performed to connect the target audience to the business owners. This is doneto expand the business quickly and efficiently. Role of social media in digital marketing is one of the most suitable andpreferred methods to generate leads. Days are gone when people took help of televisions and newspapers to attractpeople. Since technology is handy and internet connection is a necessity today, traditional methods are almostdiscarded. Ever since social media has gained popularity among humans, we cannot think of promoting a brandwithout taking help of social media. Connecting with new clients and expressing your thoughts become quite easy withsocial media. The social media has changed the power structures in the market place. Social media are a means forconsumers to share text, images, audio and video information with each other and with companies and vice versa.With the rise of social media marketing as an important domain of practice and research, a growing number ofscholarly and practitioner articles have emerged highlighting best practices in social media marketing. Therefore,business must learn how to use social media in a way that is consistent with their business plan. This is especially truefor companies striving to gain a competitive advantage. The popularity of social media for marketing purposes can beattributed to a number of advantages associated with social media when compared to traditional marketing channels.Today, we are in 21st century and people do not find time to come and interact with each other. Social media helps inconnecting themselves with social networking sites through which now people can stay far and yet remain connected.The trend of online marketing is increasing all over the world as well as in India also.

Page 119 P.E.S. College of Engineering, Mandya & Primax Foundation, Bengaluru
UGC ID No: 63975 Impact Factor - 5.87“Recent Trends in Business Management”
MeaningSocial media marketing (SMM) refers to techniques thattarget social networksand applications to spread brandawareness or promote particular products. Social mediamarketing campaigns usually center around:Establishing a social media presence on majorplatforms.
DefinitionAccording to Techopedia, Social media marketingpresence is a necessity for many customer-drivenenterprises as it gives the impression of a moreimmediate connection between the customer and theseller. Moreover, campaigns spread through social mediaare believed to have more resonance because they areusually discovered through links shared by trustedsources.
Objectives1. To know the opportunities of social media marketing
in India2. To know the impact of social media marketing on
products and services.
MethodologyThe paper is conceptual in nature. Data collection wasachieved by online websites and the data is filtered toimprove the quality of paper. The interpretations are madeby the authors with the help of guide.
Few Popular Social Media NetworksFacebookThis is the biggest social media network on the Internet,both in terms of total number of users and namerecognition. facebook has within 12 years managed toaccumulate more than 1.59 billion monthly active usersand this automatically makes it one of the best mediumsfor connecting people from all over the world with yourbusiness. It is estimated that more than 1 million smalland medium-sized businesses use the platform toadvertise their business. Marketing campaigns onFacebook can make your social presence more visibleand vivacious. FB marketing solutions consists ofintegrated Facebook advertising campaign, Facebook.application development, page design, paid advertising,viral marketing and a lot more.
TwitterYou might be thinking that limiting your posts to 140characters is no way to advertise your business, butyou will be shocked to know that this social mediaplatform has more than 320 million active monthly userswho make use of the 140 character limit to pass oninformation. Businesses can use Twitter to interact with
prospective clients, answer questions, release latestnews and at the same time use the targeted ads withspecific audiences. Twitter provides innovative marketingservices which can help to increase your followers andmake your products and services more visible in severalsocial media platforms. It provides your business toengage your product or service with millions of users ata time.
LinkedInLinkedIn is hands-down the most popular social mediasite for professional networking. The website is availablein 24 languages and has over 400 million registeredusers. LinkedIn is great for people looking to connectwith people in similar industries, networking with localprofessionals and displaying business related informationand statistics. LinkedIn promotes services helps youlink with your targeted audience.
The innovative strategies and ideas can play an activerole in enhancing your social presence and make itbetter than your opponent.
Google+While it’s no Twitter, Facebook or LinkedIn, Google+ hasits place among the popular social media sites. Its SEOvalue alone makes it a must-use tool for any smallbusiness. Google+ has joined the big leagues registering418 active million users. Google+ offers an excitingopportunity by which any organization can competentlypromote their business.
You TubeYouTube the largest and most popular video-based socialmedia website YouTube has over 1 billion website visitorsper month and is the second most popular search enginebehind Google. YouTube offers an exciting opportunityby which any organization can competently promote theirbusiness.
InstagramInstagram is a visual social media platform. It has morethan 400 million active users and is owned by Facebook.Many of its users use it to post information about travel,fashion, food, art and similar subjects.
It provides details about customer need informationimmediately.
WhatsAppWhatsApp Messenger is a cross-platform instantmessaging client for smart phones, PCs and tablets.The app relies on the Internet to send images, texts,documents, audio and video messages to other usersthat have the app installed on their devices. Today, morethan 1 billion people use the service to communicate
ISSN: 2349-5162Journal of Emerging Technologies and Innovative Research
Page 120February 2019Special Issue
with their friends, loved ones and even customers. Itconnects the people and sends the images, videos fromone person to another about the product
Opportunities by Social Media MarketingApp DeveloperApp development is typically a humble field but offers asignificant potential for success. A great idea, if givenenough effort and exposure, can grow a tiny start-upinto a wildly popular social media giant. At the very least,though, developers can be satisfied knowing that theirwork is making the Internet a better, more diverse place.
Blogger/ CopywriterThe post and articles you read on the internet were writtenby people. Working as a blogger or online writer meansmanaging a varied workload and keeping track of plentyof deadlines, but it’s hard to argue with the convenienceof working from your home computer.
Web Designer A great idea for the Next Big Thing in social media maybe technically sounds, but it won’t do much good unlessit’s presented in an accessible, user - friendly package.This is where the web designer comes in. Designerscreate the layout and aesthetic of a site, essentiallybuilding a bridge between the codes that makes the sitework and ordinary users.
Digital MarketerDigital marketers focus on the critical task of studyinginternet trends and using them to cleverly draw traffic toa particular site. As social media’s influence on societyhas grown, more and more businesses have recognizedthe importance of sbuilding their web presence, soopportunities for digital marketers are more widespreadthan ever.
Hacker/Security Specialist It’s generally more about stealing and destroying top-secret files, extorting money from large corporations andgovernment institutions, and more often than not, flyingthrough wire-frame environments. The reality is a lot lessfantastic, but real-world hacking is invaluable to today’ssocial media and is an honest, paying job, to boot.
Issues of Social Media Marketing1. Choosing appropriate Brand Ambassador for the
organization.2. In social media it involves high budget to promote
product effectively.3. Ignorance of advertisements from customers in
social media to save time.4. There is no direct contact with customers.
5. Fake news and false promises in social media leadsto decrease in reputation of organization.
6. Develop a social media strategy.7. Choosing appropriate social media.
Findings1. Organization in order to save their budget they
should promote their products and services on oneproper channel, which is used by majority of thepeople.
2. Choose the Brand Ambassador which is having morefollowers in social networks.
3. Advertisements should be designed in an effectivemanner in social media.
4. By providing quick response to the customers canbuild strong relationships
5. Social media is a backbone of marketing to createbrand image.
6. Social media acts as the root cause for thedevelopment of media richness.
7. Social media marketing helps to promote saleseffectively.
8. Social media marketing helps to fulfill the customersatisfaction
9. Social media marketing provides a good platform tocommunicate with large number of customers at atime.
Suggestions1. By using innovative social media we can attract
more customers2. Organization should choose one popular social
media channel to promote their products and serviceswhich in turn increases reputation of company.
3. The company should choose the brand ambassadorwho is very active and who has more followers insocial networks (Facebook, twitter).
4. The company must promote products as accordingto the present trend which leads to stand in thecompetition.
ConclusionSocial media marketing is emerging rapidly to promotethe products and services in online through various socialnetworks like LinkedIn, Facebook, twitter, Instagram etc.Major benefit of social media marketing, which resultsin increasing profit of your company, is improving sales,regardless if you own an online shop or you want toencourage people to visit your business a specificlocation. So basically the organizations must adoptsocial media strategies to sustain in the market. If you
Page 121 P.E.S. College of Engineering, Mandya & Primax Foundation, Bengaluru
UGC ID No: 63975 Impact Factor - 5.87“Recent Trends in Business Management”
know what kind of position to look for, social media could just be the source of your dream career. Use of Socialmedia are very helpful to organisation, customer etc. and it helps to solve the problem of middlemen betweencustomer and firm.
References• https://www.ey.com/Publication/vwLUAssets/EY-social-media-marketing-india-trends-study-2016/%24File/EY-
social-media-marketing-india-trends-study-2016.pdf• http://www.aims-international.org/myconference/cd/PDF/MSD2-3010-Done.pdf• h t t p s : / / w w w . g o o g l e . c o m / s e a r c h ?
q=social+media+marketing+meaning+in+english&oq=social+media+marketing+meaning&aqs=chrome.0.69i59j69i60j69i57j69i60j0l2.15470j0j 7&sourceid=chrome&ie=UTF-8
• https://www.techopedia.com/definition/5396/social-media-marketing-smmhttps://www.google.com/search?q=few+popular+social+media+network&oq=fe&aqs=chrome.0.69i59j69i57j0l4.2965j0j7&sourceid=chrome&ie=UTF-8
• https://www.entrepreneur.com/article/254046https://technians.com/blog/role-social-media-digital-marketing/• www.wikipedia.com• The Hindu news paper• Decan herald News paper
ISSN: 2349-5162Journal of Emerging Technologies and Innovative Research
Page 122February 2019Special Issue
1. Associate Professor, DOS in Business Administration, PBMMEC,KRS Road, Metagalli, Mysore.2. Assistant Professor, Department of MBA, VTU Regional PG Centre, Mysore.
A STUDY ON MBA STUDENTS’ PERCEPTION TOWARDS SUSTAINABLEHUMAN RESOURCE MANAGEMENT
IntroductionOrganisations to remain competitive needs to focus onSustainability Development. It becomes inevitable for theorganizations to adopt Sustainability practices in all itsbusiness functions. It is very important to embedsustainability practices in Human ResourceManagement function as it involves people managementwho are responsible for the sustainable growth of theorganization. Sustainable Human Resource Managementcan be achieved by greening the HR practices.
SustainabilityThe term Sustainability can be defined “as thedevelopment that meets the present withoutcompromising the ability of future generations to meettheir own needs”. Definition given by WCED p.g no 49.It defined three components for sustainabilitydevelopment: environmental protection, economic growthand social equity. Sustainable development is reallymostly identified by referring to this establishment of abalance between Profit, Planet and People. ASustainable organization can be defined as anundertaking that all together gives economic, social, andenvironmental benefits- known as the “Triple bottom line”.
Sustainability is often defined as the “ability to meet theneeds of the present without compromising the abilityof future generations to meet their needs.” Sustainabilityinitially meant environmental sustainability, but todaythe term is used to refer to all aspects of social andenvironmental impacts.
Sustainable development is “a process of achievinghuman development . . . in an inclusive, connected,equitable, prudent, and secure manner.”
HR and SustainabilitySustainable HRM is the utilization of HR tools to helpembed a sustainability strategy in the organization andthe creation of an HRM system that contributes to thesustainable performance of the firm. Sustainable HRMcreates the skills, motivation, values and trust to achievea triple bottom line and at the same time ensures thelong-term health and sustainability of both theorganization’s internal and external stakeholders, withpolicies that reflect equity, development and well-beingand help support environmentally friendly practices.
Configuring HR Practices to the principles ofsustainability need not essentially mean changing theHR function. It means that HR People will haveobservation of all HR decisions through the prism ofshareholders perspective. Organizations are catchingthemselves on to the green practices in their intensityto sand up their image, ratchet up employee morale andsignificantly score their costs. Green human resourcesrefer to using all employee touch point/interface to supportsustainable practices and improve employeeresponsiveness and commitments on the problems ofsustainability.
It engages enterprising environment-friendly HR schemesconsequential in greater efficiencies, better employeeengagement and lower costs and retention which in turn,
Dhanalakshmi P1
AbstractSustainable business also known as green business is an enterprise that has minimal negative impact on theenvironment, community, society, or economy. Organizations are giving importance to adapting Sustainability basedpractices or Green Practices in all its functional areas. Employees are responsible for achieving sustainability goalsof the organization. Hence, embedding Sustainability in the functional area of Human Resource Management is veryimportant as it deals with the people management. Greening Human Resource functions would help organization inachieving sustainability through economic, social and environmental benefits. People would prefer to work for suchGreen companies. This research paper explores Students Preferrence towards Sustainable HRM companies, studentsperception towards e-Recruitment, Interview through teleconference, Requirement of Green Skills.
Key words: Sustainability, Sustainable Development, Environment Sustainability, Green HRM, Green Companies,Green Business Functions.
Dr. N Babitha Thimmaiah2
Page 123 P.E.S. College of Engineering, Mandya & Primax Foundation, Bengaluru
UGC ID No: 63975 Impact Factor - 5.87“Recent Trends in Business Management”
help organizations to job-sharing, car sharing,teleconferencing and virtual interviews, telecommuting,online training, recycling, reduce employee carbonfootprints by the likes of electronic filing, energy-efficientoffice spaces etc.
In this green world the green HR or people managementfunction has sustainability at its center as part of itspeople management and talent management spotlightand organizations connect with the society by supportingtheir programs with it. Communities, customers andcontractors all grow to be equal stakeholders along withemployees and shareholders.
Definition of Green HRMGreen HRM is referred to all the activities involved indevelopment, implementation and on-going maintenanceof a system that aims at making employees of anorganization green. It refers to the policies, practicesand systems that make employees of the organizationgreen for the benefit of the individual, society, naturalenvironment, and the business. The purpose of greenHRM is to create, enhance and retain greening withineach employee. In order to make sure that theorganization gets right employee green inputs and rightemployee green performance of job, it is indispensablethat HRM functions are adapted or modified to be green.
Objectives1. To explore Preferences of management students to
Green Companies2. To understand the E-Recruitment preference of
Students3. To examine the preference of students towards video
conference / Telephonic interview.4. To explore the Students perception towards their
comfortability with video conference/ telephonicinterview.
Literature ReviewWirtenberg, Harmon, Russell, & Fairfield (2007):The sustainability issue is fast moving up on the list ofpriorities of the leaders of corporate world as theawareness on incorporating “green” into the corporatestrategy is making its way in business, but still the topicis not comfortable with most practitioners in the HRenvironment.
Brio, Fernandez, and Junquera, (2007): discovers theneed of building environmental considerations/responsibilities into job descriptions and/or teamobjectives and finds that the most advancedenvironmental approaches are people intensive anddepend upon tacit skill development through employeedevelopment. Further he lays emphasis to the need of
joint and regular environmental training and greenbriefings to employees.
Brockett (2007): discovers that some firms areexperiencing challenges in recruiting talent for their greentechnology projects. Smedley (2007) finds the need formore management education in EM but, manyuniversities are still not offering ‘Green’ courses’. Theneed for sustainable development to be included in someModern Apprenticeships. Environmental concerns havemoved from being one element of Corporate SocialResponsibility (CSR) to now being concerned withpersonal skills development and teambuilding foremployees in large firms across the globe.
Lee (2009). In the past, resonance economicperformance of the organization was likely to assurecorporate achievement by organizations and itsshareholders, but now it is no longer suitable; economicand financial outcomes need to be accompanying byminimization of environmental footprints and improvedconcentration to social and environmental features.
Lee (2009), Daily and Huang, (2001). Greenmanagement is defined as the process wherebycompanies manage the environment by developingenvironmental management strategies in whichcompanies need to balance between industrial growthand conservation the natural environment so that futuregeneration may thrive.
Vij P et al (2013): Increased Savings, Improved SocialImage and Greater focus on CSR is found in theCompanies with Green Human Resource ManagementSystems compared to companies with Established HRMsystems without Green Practices.
Research MethodologyA. Data Sources: Students who are pursuing Final year
Master of Business Administration in the year 2018.B. Collection Methods: The primary data was collected
through questionnaire method. The questionnairecomprised of both closed and open type questionsfor collection of the primary data.
C. Sampling Method: The random sampling method wasused
D. Tools and Techniques of Analysis: SPSS 22.0 forwindows, a statistical software package was usedto analyze the data collected. The statistical analysisincludes one-way Analysis of Variance (ANOVA),Descriptive statistics and Percentage analysis forthe data collected.
Data Analysis and ResultsQuestionnaires were administered to the Studentspursuing Managament Education. These students were

ISSN: 2349-5162Journal of Emerging Technologies and Innovative Research
Page 124February 2019Special Issue
selected using Random sampling method. Out of these,the data were collected from 50 students. Data relatedto the Perception of students towards Sustainable HRMwere collected from these students.
The data thus received from respondents aboutSustainable HRM were analyzed using descriptivestatistics and percentage analysis and ANOVA. Theresults of the analysis are as detailed below.
Table - 1 : Gender wise Responses Received Gender
Male
Female
Total
Frequency
33
17
50
Percent
66
34
100
Gender
Urban
Rural
Total
Frequency
30
20
50
Percent
60
40
100
Table - 2 : Response from Urban and RuralStudents
Gender
Yes
No
Total
Frequency
47
3
50
Percent
94.0
6.0
100
Table - 3 : Preferences to Green Companies
Table - 4 : Genderwise Preferred Type ofRecruitment
Gender
Male
Female
Total
Recruitment Type
%
67%
76%
70%
Electronic
22
13
35
Traditional
11
4
15
%
33%
24%
30%
Toatal
33
17
50
Table - 5 : Preferred Recruitment Type fromRural/urban Students
Gender
Urban
Rural
Total
Recruitment Type
%
67%
75%
70%
Recruitment
20
15
35
TraditionalRecruitment
10
5
15
%
33%
25%
30%
Toatal
30
20
50
Comfortability with Video Conference / TelephonicInterviewStatistical HypothesesH0 : There is no significant difference in the perceptionof respondents towards ‘Comfortability with VideoConference / Telephonic Interview’ based on Gender.
H1 : There is significant difference in the perception ofrespondents towards ‘Comfortability with VideoConference / Telephonic Interview’ based on Gender.
A one-way analysis of variance (ANOVA) test was usedto compare the means of the Respondents perceptiontowards ‘Comfortability with Video Conference /Telephonic Interview’ based on their Gender. The resultis shown in Table - 6.
We can see that the significance value is 0.461 (i.e., p =.461), which is greater than 0.05. Since p > 0.05, NullHypothesis is accepted at 5% significant level. Therefore,there is no statistically significant difference in theperception of Male and Female respondents towards‘Students Comfortability with Video Conference /Telephonic Interview’.
Statistical HypothesesH0 : There is no significant difference in the perceptionof respondents towards ‘Comfortability with VideoConference / Telephonic Interview’ based on Rural/Urban locality.
H1 : There is significant difference in the perception ofrespondents towards ‘‘Comfortability with VideoConference / Telephonic Interview’ based on Rural/ Urbanlocality.
A one-way analysis of variance (ANOVA) test was usedto compare the means of the Respondents perceptiontowards ‘Comfortability with Video Conference /Telephonic Interview’ based on Rural/ Urban locality. Theresult is shown in Table 7.
We can see that the significance value is 0.735 (i.e., p =.735), which is greater than 0.05. Since p > 0.05, NullHypothesis is accepted at 5% significant level. Therefore,there is no statistically significant difference in theperception of Rural and Urban respondents towards‘Comfortability with Video Conference / TelephonicInterview’ (Table - 6 & 7)
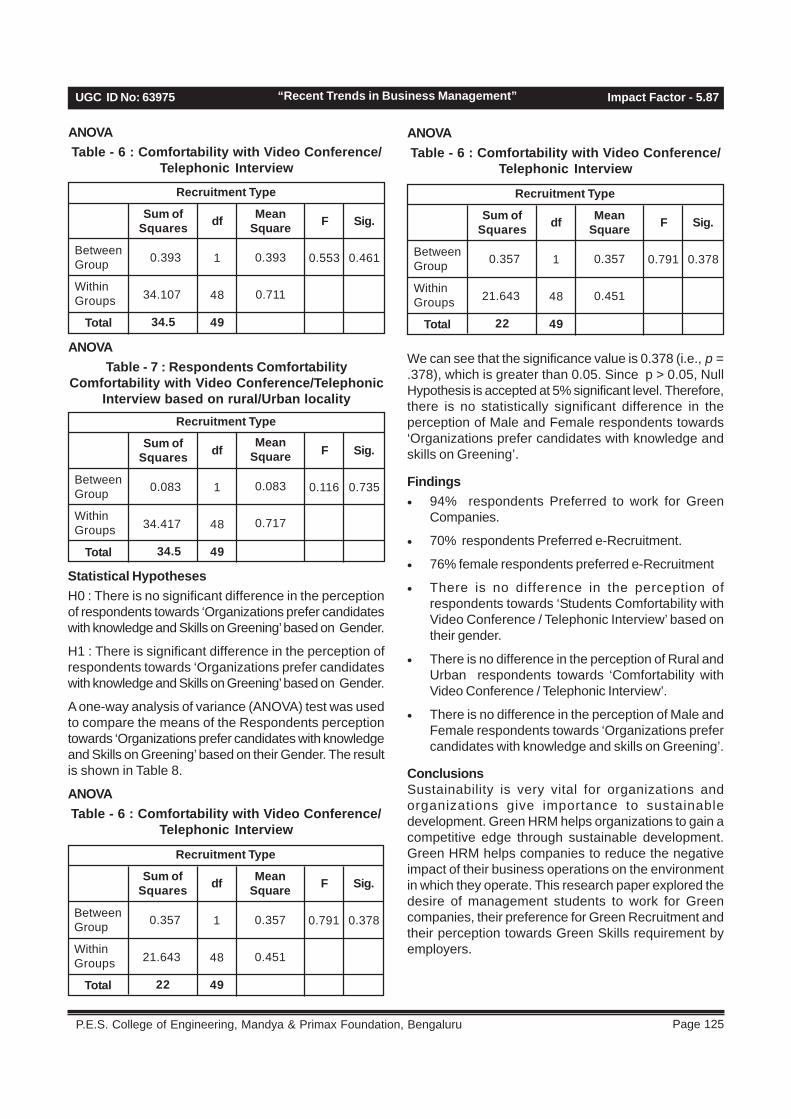
Page 125 P.E.S. College of Engineering, Mandya & Primax Foundation, Bengaluru
UGC ID No: 63975 Impact Factor - 5.87“Recent Trends in Business Management”
ANOVATable - 6 : Comfortability with Video Conference/
Telephonic Interview
ANOVATable - 7 : Respondents Comfortability
Comfortability with Video Conference/TelephonicInterview based on rural/Urban locality
Statistical HypothesesH0 : There is no significant difference in the perceptionof respondents towards ‘Organizations prefer candidateswith knowledge and Skills on Greening’ based on Gender.
H1 : There is significant difference in the perception ofrespondents towards ‘Organizations prefer candidateswith knowledge and Skills on Greening’ based on Gender.
A one-way analysis of variance (ANOVA) test was usedto compare the means of the Respondents perceptiontowards ‘Organizations prefer candidates with knowledgeand Skills on Greening’ based on their Gender. The resultis shown in Table 8.
ANOVATable - 6 : Comfortability with Video Conference/
Telephonic Interview
ANOVATable - 6 : Comfortability with Video Conference/
Telephonic Interview
BetweenGroup
WithinGroups
Total
Recruitment Type
df
1
48
49
Sum ofSquares
0.393
34.107
34.5
MeanSquare
0.393
0.711
F
0.553
Sig.
0.461 BetweenGroup
WithinGroups
Total
Recruitment Type
df
1
48
49
Sum ofSquares
0.357
21.643
22
MeanSquare
0.357
0.451
F
0.791
Sig.
0.378
BetweenGroup
WithinGroups
Total
Recruitment Type
df
1
48
49
Sum ofSquares
0.357
21.643
22
MeanSquare
0.357
0.451
F
0.791
Sig.
0.378
We can see that the significance value is 0.378 (i.e., p =.378), which is greater than 0.05. Since p > 0.05, NullHypothesis is accepted at 5% significant level. Therefore,there is no statistically significant difference in theperception of Male and Female respondents towards‘Organizations prefer candidates with knowledge andskills on Greening’.
Findings• 94% respondents Preferred to work for Green
Companies.
• 70% respondents Preferred e-Recruitment.
• 76% female respondents preferred e-Recruitment
• There is no difference in the perception ofrespondents towards ‘Students Comfortability withVideo Conference / Telephonic Interview’ based ontheir gender.
• There is no difference in the perception of Rural andUrban respondents towards ‘Comfortability withVideo Conference / Telephonic Interview’.
• There is no difference in the perception of Male andFemale respondents towards ‘Organizations prefercandidates with knowledge and skills on Greening’.
ConclusionsSustainability is very vital for organizations andorganizations give importance to sustainabledevelopment. Green HRM helps organizations to gain acompetitive edge through sustainable development.Green HRM helps companies to reduce the negativeimpact of their business operations on the environmentin which they operate. This research paper explored thedesire of management students to work for Greencompanies, their preference for Green Recruitment andtheir perception towards Green Skills requirement byemployers.
BetweenGroup
WithinGroups
Total
Recruitment Type
df
1
48
49
MeanSquare
0.083
0.717
F
0.116
Sig.
0.735
Sum ofSquares
0.083
34.417
34.5

ISSN: 2349-5162Journal of Emerging Technologies and Innovative Research
Page 126February 2019Special Issue
References1. Brio, J.A.D., Fernandez, E., and Junquera, B. (2007) ‘Management and employee involvement in achieving an
environmental action-based competitive advantage: an empirical study’. The International Journal of HumanResource Management. vol.18, no.4, (April), pp.491-522.
2. Brockett, J. (2007) ‘Prepare now for big rise in ‘green’ jobs’, People Management, 17th May, p.9.
3. Daily, B. F. and Huang, S. (2001). Achieving sustainability through attention to human resource factors inenvironmental management. International Journal of Operations & Production Management, 21(12), 1539-1552.
4. Lee, K. H. (2009). Why and how to adopt green management into business organizations: The case study ofKorean SMEs in manufacturing industry. Management Decision, 47(7), 1101-1121.
5. Shrivastava, P., & Berger, S. (2010). Sustainability principles: A review and directions. Organization ManagementJournal, 7, 246–261.
6. Sushma Rani, Dr. K Mishra. (2014). ‘Green HRM: Practices and Strategic Implementation in the Organizations’.International Journal on Recent and Innovation Trends in Computing and Communication, November 2014,Volume: 2 Issue: 11, Page:3633-3639.
7. Vij, P. et al (2013), Green HRM- Delivering High Performance HR Systems, International Journal of Marketingand Human Resource Management, Volume 4, Issue 2, May - August (2013), pp. 19-25.
8. Wirtenberg, J., Harmon, K. D., Russell, W. G., & Faireld, K. D. (2007). HR’s role in building a sustainableenterprise. Human Resource Planning, 30, 10–20

Page 127 P.E.S. College of Engineering, Mandya & Primax Foundation, Bengaluru
UGC ID No: 63975 Impact Factor - 5.87“Recent Trends in Business Management”
1 . Associate Professor, Department of MBA, PES College of Engineering, Mandya, Karnataka.2 . Professor, Department of MBA, PES College of Engineering, Mandya-571401, Karnataka
ANALYTICAL STUDY ON EMPLOYEE SATISFACTION WITH\REFERENCE TO SHASHWATI PLASTICS, HEBBAL
INDUSTRIAL AREA, MYSORE.
Introduction
To Be a Globally Benchmarked Employer of Choice by Harnessing Employee Capital and Providing an Environmentof Continuous Growth, Challenge and Innovation.
A. S. Mahesh1 Dr P. Somashekar2
AbstractHuman resources are the most valuable assets of an organization. The successful management of an organization’shuman resources is an interesting and challenging task especially at the time when the world has become globalvillage. The lack of resources and the growing expectations of the modern day worker have further increased thedifficulty of human resource function. Particular human resource functions or activities are the responsibility of thehuman resource Department. The maintaining of job satisfaction and employee self esteem are very importantcomponents of the corporate system. Satisfaction is directly related to performance and efficiency which from anorganizational standpoint, have to be maximized.
Key words: Employee Satisfaction, HRM, Shashwati Plastics.
Fig. 1
The study on employee satisfaction, this survey provides better information about the satisfaction of employees,which is essential part of the HR department and management. The results of this type of feedback process providean understanding how the employee perceives the organization along different dimensions. This process helps theorganization understand how the employees perceives them. The scope of the study is limited to the employees ofShaswathi Plasics.The survey is carried out from the sample representatives amongst employees of ShaswathiPlastics of various departments.
Company ProfileEstablished in 1997, Shashawati Plastics is actively engaged in the manufacturing of Plastic Injection MouldingComponents and Auto Electrical Assemblies. The technology identified and selected are plastic injection mouldingand auto electrical assembly. The major and important
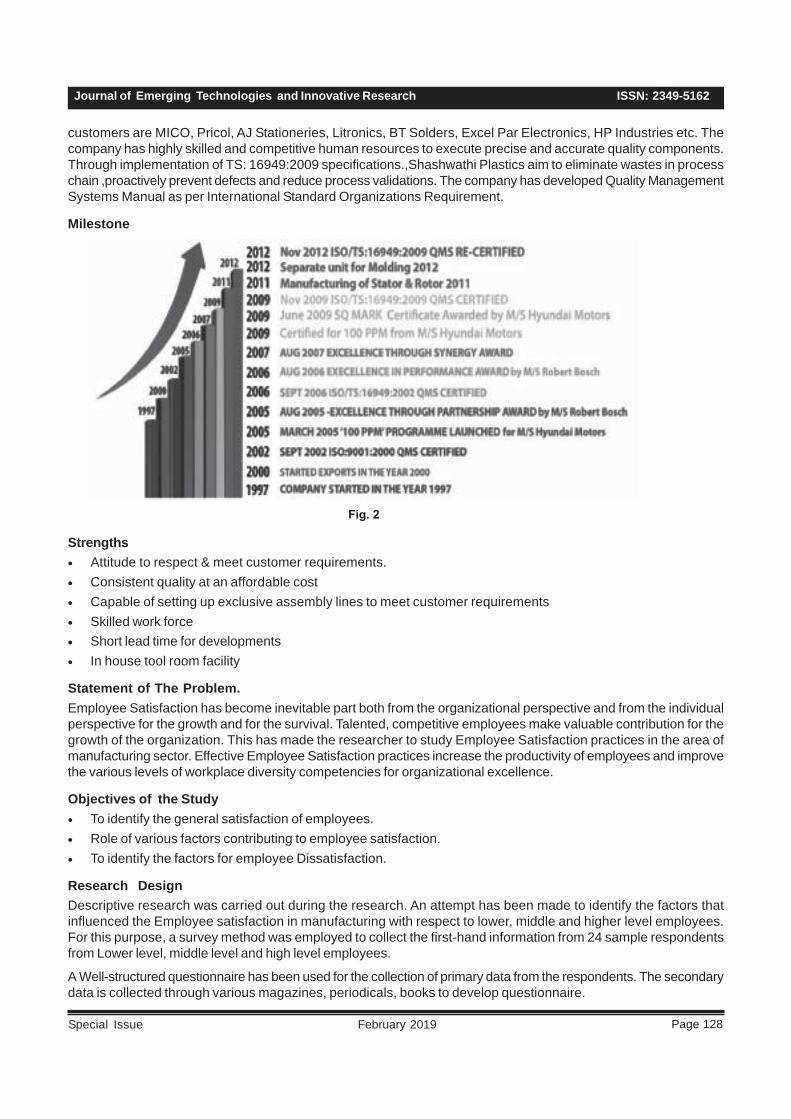
ISSN: 2349-5162Journal of Emerging Technologies and Innovative Research
Page 128February 2019Special Issue
customers are MICO, Pricol, AJ Stationeries, Litronics, BT Solders, Excel Par Electronics, HP Industries etc. Thecompany has highly skilled and competitive human resources to execute precise and accurate quality components.Through implementation of TS: 16949:2009 specifications.,Shashwathi Plastics aim to eliminate wastes in processchain ,proactively prevent defects and reduce process validations. The company has developed Quality ManagementSystems Manual as per International Standard Organizations Requirement.
Milestone
Fig. 2
Strengths• Attitude to respect & meet customer requirements.• Consistent quality at an affordable cost• Capable of setting up exclusive assembly lines to meet customer requirements• Skilled work force• Short lead time for developments• In house tool room facility
Statement of The Problem.Employee Satisfaction has become inevitable part both from the organizational perspective and from the individualperspective for the growth and for the survival. Talented, competitive employees make valuable contribution for thegrowth of the organization. This has made the researcher to study Employee Satisfaction practices in the area ofmanufacturing sector. Effective Employee Satisfaction practices increase the productivity of employees and improvethe various levels of workplace diversity competencies for organizational excellence.
Objectives of the Study• To identify the general satisfaction of employees.• Role of various factors contributing to employee satisfaction.• To identify the factors for employee Dissatisfaction.
Research DesignDescriptive research was carried out during the research. An attempt has been made to identify the factors thatinfluenced the Employee satisfaction in manufacturing with respect to lower, middle and higher level employees.For this purpose, a survey method was employed to collect the first-hand information from 24 sample respondentsfrom Lower level, middle level and high level employees.
A Well-structured questionnaire has been used for the collection of primary data from the respondents. The secondarydata is collected through various magazines, periodicals, books to develop questionnaire.

Page 129 P.E.S. College of Engineering, Mandya & Primax Foundation, Bengaluru
UGC ID No: 63975 Impact Factor - 5.87“Recent Trends in Business Management”
Departments covered: Planning, Purchase,Manufacturing, Maintenance, Quality Assurance.
Research Tools and TechniquesThe data collected from the primary sources wereanalyzed by using e percentage Analysis,
Limitations of the Study• The study is limited to the responses received from
the respondents.• The perception of the individual is an emotional state
or mental condition a level can only be estimated.
Survey DesignThe questionnaire was prepared with a five-point Likertscale, the scale ranged from Strongly Agree1. Agree,2. Somewhat agree3. Disagree4. Strongly Disagree5. All the questions are positive in tone. The choice for
each question is given as1. Strongly Agree (SA) : Highly Satisfied (HS)2. Agree (A) : Satisfied (S)3. Somewhat Agree (SWA) : Less Satisfied (LS)4. Disagree (D) : Dissatisfied (DS)5. Strongly disagree(SD) : Highly Dissatisfied
(HDS).Analysis and Interpretation.
Table - 1: Career Growth Opportunities AreProvided to High Performers.
1 Strongly Agree 09 38
2 Agree 12 50
3 Somewhat Agree 01 04
4 Disagree 02 08
5 Strongly Disagree 0 0
6 Tota 24 100
Response Number ofRespondents %Serial
Number
It is clear from the table that 38% respondents are highlysatisfied,50% respondents are satisfied,4% respondentsare less satisfied and 8% respondents dissatisfied. Bythis we can conclude that 88% respondents are in favorthat company provides career development opportunitiesfor performers.
It is clear from the table that 29% respondents are highlysatisfied,50% respondents are satisfied,21%respondents are less satisfied. By this we can concludethat 79%respondents are satisfied with the strongcommunication network.
Table - 3 : Company Maintains the CompensationStructure in Accordance with The Performance of
the Employee.
It is clear from the table that 34% respondents are highlysatisfied,58% respondents are satisfied,8% respondentsare less satisfied .92% respondents are satisfied withthe compensation structure.
Table - 4: Employee Get Support from TheirSuperiors.
1 Strongly Agree 8 34
2 Agree 14 58
3 Somewhat Agree 02 08
4 Disagree 0 0
5 Strongly Disagree 0 0
6 Total 24 100
Response Number ofRespondents %Serial
Number
1 Strongly Agree 07 29
2 Agree 12 50
3 Somewhat Agree 05 21
4 Disagree 0 0
5 Strongly Disagree 0 0
6 Tota 24 100
Response Number ofRespondents %Serial
Number
1 Strongly Agree 15 63
2 Agree 04 16
3 Somewhat Agree 05 21
4 Disagree 0 0
5 Strongly Disagree 0 0
6 Total 24 100
Response Number ofRespondents %Serial
Number
Table - 2: Company maintains bettercommunication Within the organization as a
whole.

ISSN: 2349-5162Journal of Emerging Technologies and Innovative Research
Page 130February 2019Special Issue
It is clear from the table that 63% respondents are highlysatisfied,16% respondents are satisfied,21%respondents are less satisfied .79% of the respondentsare satisfied with the support from their superiors.
Table- 5: Employee Creativity Is Appreciated.
1 Strongly Agree 13 54
2 Agree 10 42
3 Somewhat Agree 1 04
4 Disagree 0 0
5 Strongly Disagree 0 0
6 Total 24 100
Response Number ofRespondents %Serial
Number
It is clear from the table that 54% respondents are highlysatisfied,42% respondents are satisfied,4% respondentsare less satisfied. By this we can conclude that 86%respondents are in favour that employee’s creativity isappreciated.
Table - 6: Organization Support to AchieveCareer Goals.
It is clear from the table that 34% respondents are highlysatisfied,42% respondents are satisfied,4% respondentsare less satisfied. By this we can conclude that 86%respondents are in favor that there is a support from themanagement to achieve career goals.
Table - 7 : The Ambience in The Organization IsDirected Towards Higher Efficiency.
1 Strongly Agree 08 33.3
2 Agree 08 33.3
3 Somewhat Agree 08 33.3
Response Number ofRespondents %Serial
Number
4 Disagree 0 0
5 Strongly Disagree 0 0
6 Total 24 100
It is clear from the table that 33.3% respondents arestrongly agree,33.3% respondents agree, where as33.4% respondents are not agreeing strongly. By thiswe can conclude that 67% respondents are in favor thatgood ambience leads to higher efficiency, where as 33%are less satisfied.
Table - 8: Performance Appraisal System in OurOrganization Is the Best Way for Motivation and
Morale Boost Which Leads to CareerDevelopment.
1 Strongly Agree 06 26
2 Agree 12 50
3 Somewhat Agree 04 16
4 Disagree 02 08
5 Strongly Disagree 0 0
6 Total 24 100
Response Number ofRespondents %Serial
Number
1 Strongly Agree 13 34
2 Agree 10 42
3 Somewhat Agree 01 4
4 Disagree 0 0
5 Strongly Disagree 0 0
6 Total 24 100
Response Number ofRespondents %Serial
NumberIt is clear from the table that 26% respondents are highlysatisfied,50% respondents are satisfied,16%respondents are less satisfied and 8% respondentsdissatisfied. By this we can conclude that 76%respondents are in favor that performance appraisalsystem is good.
Table - 9: Management Is Supportive in PersonalCrisis.
1 Strongly Agree 14 58
2 Agree 09 38
3 Somewhat Agree 01 04
4 Disagree 0 0
5 Strongly Disagree 0 0
6 Tota l24 100
Response Number ofRespondents %Serial
Number
It is clear from the table that 58% respondents are highlysatisfied,38% respondents are satisfied,4% respondentsare less satisfied. By this we can conclude that 96%respondents agrees that management supports inpersonal crisis.
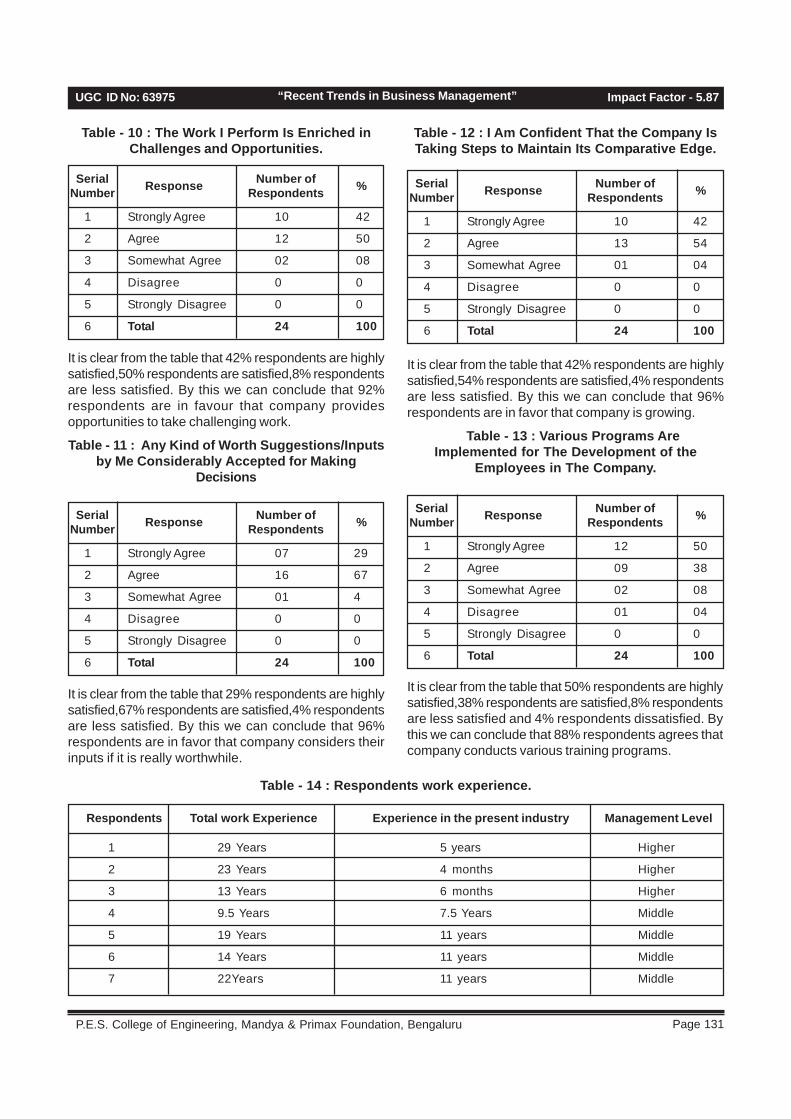
Page 131 P.E.S. College of Engineering, Mandya & Primax Foundation, Bengaluru
UGC ID No: 63975 Impact Factor - 5.87“Recent Trends in Business Management”
Table - 10 : The Work I Perform Is Enriched inChallenges and Opportunities.
1 Strongly Agree 10 42
2 Agree 12 50
3 Somewhat Agree 02 08
4 Disagree 0 0
5 Strongly Disagree 0 0
6 Total 24 100
Response Number ofRespondents %Serial
Number
It is clear from the table that 42% respondents are highlysatisfied,50% respondents are satisfied,8% respondentsare less satisfied. By this we can conclude that 92%respondents are in favour that company providesopportunities to take challenging work.
Table - 11 : Any Kind of Worth Suggestions/Inputsby Me Considerably Accepted for Making
Decisions
1 Strongly Agree 07 29
2 Agree 16 67
3 Somewhat Agree 01 4
4 Disagree 0 0
5 Strongly Disagree 0 0
6 Total 24 100
Response Number ofRespondents %Serial
Number
It is clear from the table that 29% respondents are highlysatisfied,67% respondents are satisfied,4% respondentsare less satisfied. By this we can conclude that 96%respondents are in favor that company considers theirinputs if it is really worthwhile.
1 Strongly Agree 10 42
2 Agree 13 54
3 Somewhat Agree 01 04
4 Disagree 0 0
5 Strongly Disagree 0 0
6 Total 24 100
Response Number ofRespondents %Serial
Number
It is clear from the table that 42% respondents are highlysatisfied,54% respondents are satisfied,4% respondentsare less satisfied. By this we can conclude that 96%respondents are in favor that company is growing.
Table - 13 : Various Programs AreImplemented for The Development of the
Employees in The Company.
1 Strongly Agree 12 50
2 Agree 09 38
3 Somewhat Agree 02 08
4 Disagree 01 04
5 Strongly Disagree 0 0
6 Total 24 100
Response Number ofRespondents %Serial
Number
It is clear from the table that 50% respondents are highlysatisfied,38% respondents are satisfied,8% respondentsare less satisfied and 4% respondents dissatisfied. Bythis we can conclude that 88% respondents agrees thatcompany conducts various training programs.
Table - 12 : I Am Confident That the Company IsTaking Steps to Maintain Its Comparative Edge.
Table - 14 : Respondents work experience.
Respondents Total work Experience Experience in the present industry Management Level
1 29 Years 5 years Higher
2 23 Years 4 months Higher
3 13 Years 6 months Higher
4 9.5 Years 7.5 Years Middle
5 19 Years 11 years Middle
6 14 Years 11 years Middle
7 22Years 11 years Middle
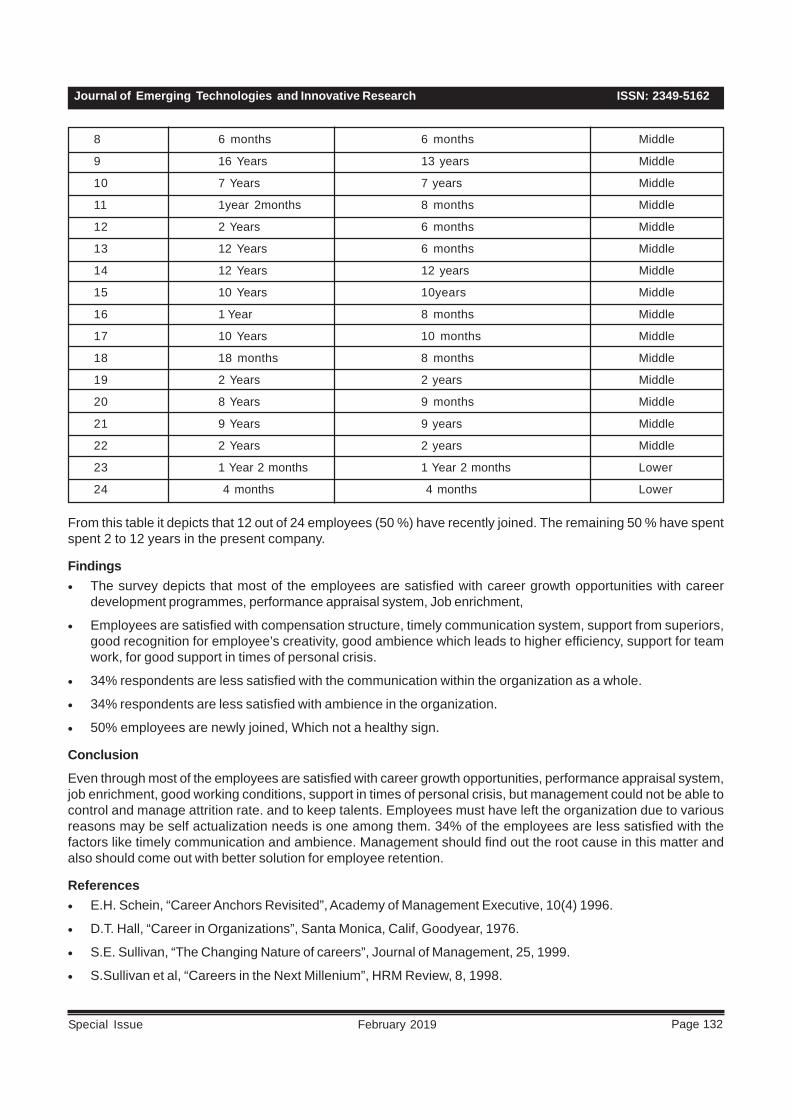
ISSN: 2349-5162Journal of Emerging Technologies and Innovative Research
Page 132February 2019Special Issue
8 6 months 6 months Middle
9 16 Years 13 years Middle
10 7 Years 7 years Middle
11 1year 2months 8 months Middle
12 2 Years 6 months Middle
13 12 Years 6 months Middle
14 12 Years 12 years Middle
15 10 Years 10years Middle
16 1 Year 8 months Middle
17 10 Years 10 months Middle
18 18 months 8 months Middle
19 2 Years 2 years Middle
20 8 Years 9 months Middle
21 9 Years 9 years Middle
22 2 Years 2 years Middle
23 1 Year 2 months 1 Year 2 months Lower
24 4 months 4 months Lower
From this table it depicts that 12 out of 24 employees (50 %) have recently joined. The remaining 50 % have spentspent 2 to 12 years in the present company.
Findings• The survey depicts that most of the employees are satisfied with career growth opportunities with career
development programmes, performance appraisal system, Job enrichment,
• Employees are satisfied with compensation structure, timely communication system, support from superiors,good recognition for employee’s creativity, good ambience which leads to higher efficiency, support for teamwork, for good support in times of personal crisis.
• 34% respondents are less satisfied with the communication within the organization as a whole.
• 34% respondents are less satisfied with ambience in the organization.
• 50% employees are newly joined, Which not a healthy sign.
Conclusion
Even through most of the employees are satisfied with career growth opportunities, performance appraisal system,job enrichment, good working conditions, support in times of personal crisis, but management could not be able tocontrol and manage attrition rate. and to keep talents. Employees must have left the organization due to variousreasons may be self actualization needs is one among them. 34% of the employees are less satisfied with thefactors like timely communication and ambience. Management should find out the root cause in this matter andalso should come out with better solution for employee retention.
References• E.H. Schein, “Career Anchors Revisited”, Academy of Management Executive, 10(4) 1996.
• D.T. Hall, “Career in Organizations”, Santa Monica, Calif, Goodyear, 1976.
• S.E. Sullivan, “The Changing Nature of careers”, Journal of Management, 25, 1999.
• S.Sullivan et al, “Careers in the Next Millenium”, HRM Review, 8, 1998.

Page 133 P.E.S. College of Engineering, Mandya & Primax Foundation, Bengaluru
UGC ID No: 63975 Impact Factor - 5.87“Recent Trends in Business Management”
• R.E.Miles, “Characteristics of Managerial Careers in the 21st Century”, Academy of Management Executive,10,1996.
• J.GreenHaus, “Career Management”, Fort Worth, Tx Dryden. 1987.
• EH.Schein, “Career Survival: Strategic job and Role Planning”, San Diego,CA,Pfeiffer,1993.
• E.H.Scheim, “The Individual, the organization and the Career: A Conceptual Scheme”, Journal of Applied BehavioralScience, 7 1971.
• Schein, “Career Anchors Revisited”, op cit, pp.80-8.
• H.J.Bernardin, J.E.Russell, “Human Resource Management”, NewYork, McGrawHill,2002, McGrawHill,2002.
• R.L. Knowdell, “Building a Career Development Program”, Palo Alto,CA:Davies Black Publishing,1996.
• B.Lvowitz, “Designing Career Development Systems”, Human Resource Planning,10,1987.
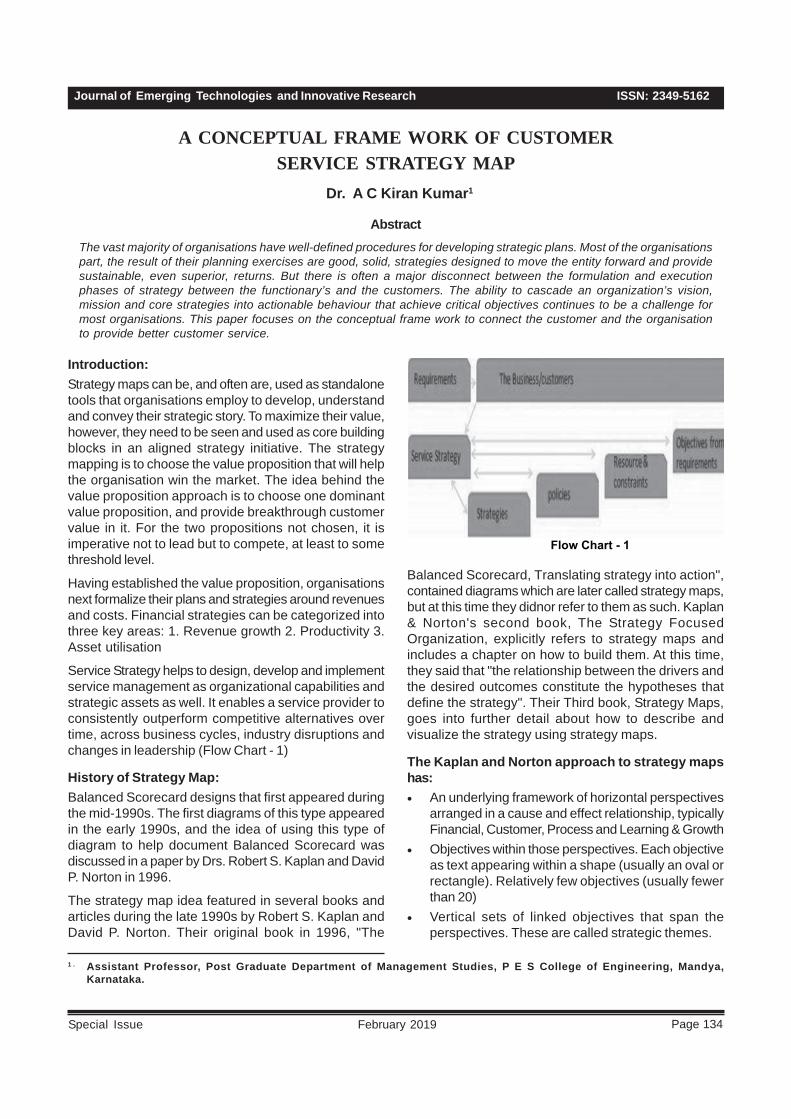
ISSN: 2349-5162Journal of Emerging Technologies and Innovative Research
Page 134February 2019Special Issue
1 . Assistant Professor, Post Graduate Department of Management Studies, P E S College of Engineering, Mandya,Karnataka.
A CONCEPTUAL FRAME WORK OF CUSTOMERSERVICE STRATEGY MAP
Dr. A C Kiran Kumar1
AbstractThe vast majority of organisations have well-defined procedures for developing strategic plans. Most of the organisationspart, the result of their planning exercises are good, solid, strategies designed to move the entity forward and providesustainable, even superior, returns. But there is often a major disconnect between the formulation and executionphases of strategy between the functionary’s and the customers. The ability to cascade an organization’s vision,mission and core strategies into actionable behaviour that achieve critical objectives continues to be a challenge formost organisations. This paper focuses on the conceptual frame work to connect the customer and the organisationto provide better customer service.
Introduction:Strategy maps can be, and often are, used as standalonetools that organisations employ to develop, understandand convey their strategic story. To maximize their value,however, they need to be seen and used as core buildingblocks in an aligned strategy initiative. The strategymapping is to choose the value proposition that will helpthe organisation win the market. The idea behind thevalue proposition approach is to choose one dominantvalue proposition, and provide breakthrough customervalue in it. For the two propositions not chosen, it isimperative not to lead but to compete, at least to somethreshold level.
Having established the value proposition, organisationsnext formalize their plans and strategies around revenuesand costs. Financial strategies can be categorized intothree key areas: 1. Revenue growth 2. Productivity 3.Asset utilisation
Service Strategy helps to design, develop and implementservice management as organizational capabilities andstrategic assets as well. It enables a service provider toconsistently outperform competitive alternatives overtime, across business cycles, industry disruptions andchanges in leadership (Flow Chart - 1)
History of Strategy Map:Balanced Scorecard designs that first appeared duringthe mid-1990s. The first diagrams of this type appearedin the early 1990s, and the idea of using this type ofdiagram to help document Balanced Scorecard wasdiscussed in a paper by Drs. Robert S. Kaplan and DavidP. Norton in 1996.
The strategy map idea featured in several books andarticles during the late 1990s by Robert S. Kaplan andDavid P. Norton. Their original book in 1996, "The
Flow Chart - 1
Balanced Scorecard, Translating strategy into action",contained diagrams which are later called strategy maps,but at this time they didnor refer to them as such. Kaplan& Norton's second book, The Strategy FocusedOrganization, explicitly refers to strategy maps andincludes a chapter on how to build them. At this time,they said that "the relationship between the drivers andthe desired outcomes constitute the hypotheses thatdefine the strategy". Their Third book, Strategy Maps,goes into further detail about how to describe andvisualize the strategy using strategy maps.
The Kaplan and Norton approach to strategy mapshas:• An underlying framework of horizontal perspectives
arranged in a cause and effect relationship, typicallyFinancial, Customer, Process and Learning & Growth
• Objectives within those perspectives. Each objectiveas text appearing within a shape (usually an oval orrectangle). Relatively few objectives (usually fewerthan 20)
• Vertical sets of linked objectives that span theperspectives. These are called strategic themes.
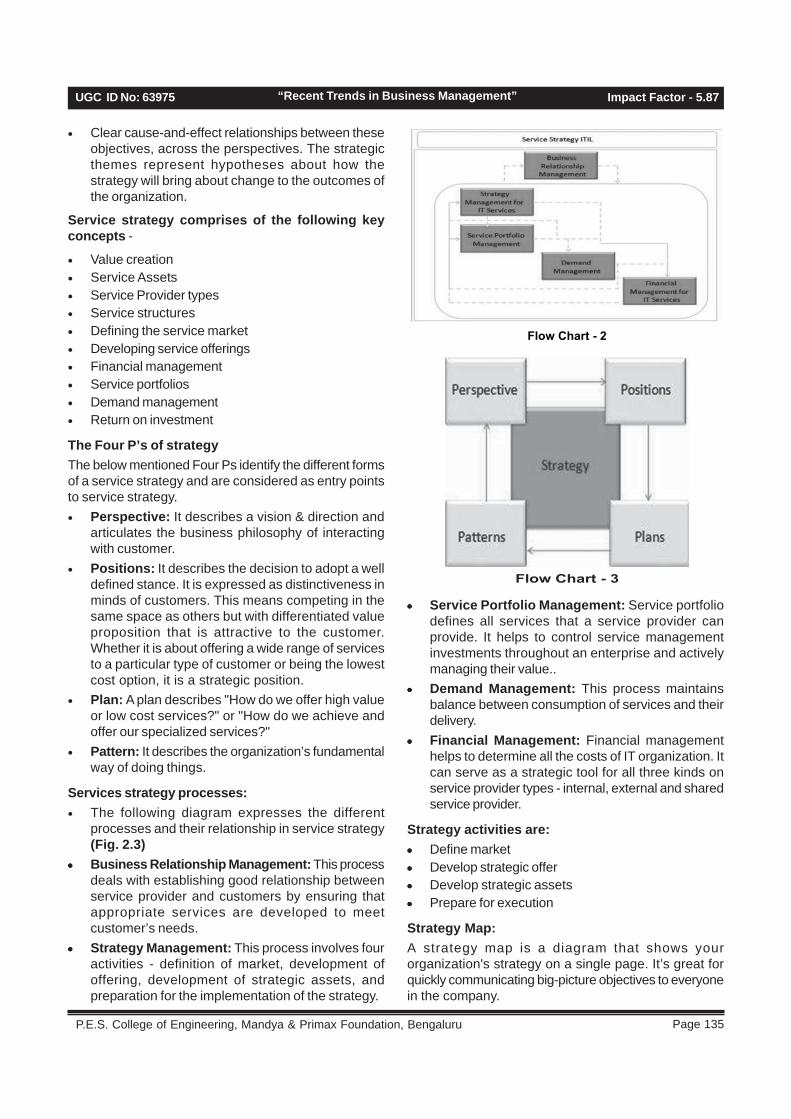
Page 135 P.E.S. College of Engineering, Mandya & Primax Foundation, Bengaluru
UGC ID No: 63975 Impact Factor - 5.87“Recent Trends in Business Management”
• Clear cause-and-effect relationships between theseobjectives, across the perspectives. The strategicthemes represent hypotheses about how thestrategy will bring about change to the outcomes ofthe organization.
Service strategy comprises of the following keyconcepts -
• Value creation• Service Assets• Service Provider types• Service structures• Defining the service market• Developing service offerings• Financial management• Service portfolios• Demand management• Return on investment
The Four P’s of strategyThe below mentioned Four Ps identify the different formsof a service strategy and are considered as entry pointsto service strategy.• Perspective: It describes a vision & direction and
articulates the business philosophy of interactingwith customer.
• Positions: It describes the decision to adopt a welldefined stance. It is expressed as distinctiveness inminds of customers. This means competing in thesame space as others but with differentiated valueproposition that is attractive to the customer.Whether it is about offering a wide range of servicesto a particular type of customer or being the lowestcost option, it is a strategic position.
• Plan: A plan describes "How do we offer high valueor low cost services?" or "How do we achieve andoffer our specialized services?"
• Pattern: It describes the organization’s fundamentalway of doing things.
Services strategy processes:• The following diagram expresses the different
processes and their relationship in service strategy(Fig. 2.3)
••••• Business Relationship Management: This processdeals with establishing good relationship betweenservice provider and customers by ensuring thatappropriate services are developed to meetcustomer’s needs.
••••• Strategy Management: This process involves fouractivities - definition of market, development ofoffering, development of strategic assets, andpreparation for the implementation of the strategy.
Flow Chart - 2
Flow Chart - 3
••••• Service Portfolio Management: Service portfoliodefines all services that a service provider canprovide. It helps to control service managementinvestments throughout an enterprise and activelymanaging their value..
••••• Demand Management: This process maintainsbalance between consumption of services and theirdelivery.
••••• Financial Management: Financial managementhelps to determine all the costs of IT organization. Itcan serve as a strategic tool for all three kinds onservice provider types - internal, external and sharedservice provider.
Strategy activities are:••••• Define market••••• Develop strategic offer••••• Develop strategic assets••••• Prepare for execution
Strategy Map:A strategy map is a diagram that shows yourorganization's strategy on a single page. It’s great forquickly communicating big-picture objectives to everyonein the company.

ISSN: 2349-5162Journal of Emerging Technologies and Innovative Research
Page 136February 2019Special Issue
A Strategy Map is a diagram showing a company orbusiness unit's overall strategy. Along with Strategy Mapscomes the concept of a Balanced Scorecard. A BalancedScorecard contains the quantitative measures showinghow well the strategy is going, such as market segmentshare and average cost per customer. The two work handin hand, so much so that the terms "Strategy Map" and"Balanced Scorecard" have become interchangeable.This is unfortunately often confusing.
Flow Chart - 4
Strategy Map Pyramid:
Fig. 1
With a well-designed strategy map, every employee canknow your overall strategy and where they fit in. It helpskeep everyone on the same page, and it allows people tosee how their jobs affect the company’s strategic objectives.
If you’re using balanced scorecard software, yourstrategy map will also show how your organization isperforming at a glance. Each bubble is automaticallycolored red, yellow, or green based on your actualmeasures and the goals you set for them.
Showing Performance in software directly:Some balanced scorecard software packages allow youto build your strategy map directly in the software. Thereare many benefits to automating your balancedscorecard, but the ability see your strategy map lightup with real performance colors may be the biggest.Your static strategy map becomes a live performancedashboard. You can see at a glance how yourorganization is performing, and you can click on a coloredbubble to drill down to more information.
A Six-Step Process:This tool provides an integrated view of the developmentof a strategy map. The steps are:1. Specify an overriding objective.2. Choose the value proposition.3. Choose the financial strategies.4. Choose the customer strategies.5. Execute through the internal perspective strategies.6. Plan the learning and growth strategies.
Service Strategy Map:Service strategy map is a diagram that showsorganization strategy and customer value creation anddesigns on a single big picture. It helps to recognize thecustomer necessity and their expectations and it ismainly focused on the design and develop theorganizational capability as a whole through identify thecustomer expectation. It helps to identify the companygrowth and customer values through using the servicestrategy map easily.
Some Benefits of A Strategy Map:••••• It provides a simple, clean, visual representation
that is easily referred back to: Strategy mappingis visually appealing. It’s far easier to remember astrategy map that has “curb appeal” than somethingscribbled down in a notepad or typed out in an email.In fact, it can easily be added to your website ordisplayed in offices around your organization withoutbeing an eyesore.
••••• It unifies all goals into a single strategy: Often,organizations have floating ideas of what the companystrategy is, and what it should look like. But if theseconcepts don’t have a home, and team membersdon’t know which strategic ideas are important, thestrategy becomes muddled and confusing. The BSC

Page 137 P.E.S. College of Engineering, Mandya & Primax Foundation, Bengaluru
UGC ID No: 63975 Impact Factor - 5.87“Recent Trends in Business Management”
changes that. It transcribes a bunch of different“languages” into a strategy that is easy to interpret.
• It gives every employee a clear goal to keep inmind while accomplishing tasks and measures:If members of the leadership team are the only peoplewho know what your strategy is or what your overallorganizational objectives are, you’re going to have avery confused team. The BSC helps to get rid ofconfusing language, and acts as an ‘authority’ onthe subject of strategy.
• It helps identify your key goals: When you decideto create a strategy map, you are deciding to arriveupon high-level goals. Maybe this isn’t evensomething you’ve set out to do, so if you’d like tocreate a strategy map, this is a great time to start.
• It allows you to better understand whichelements of your strategy need work: When allof your high-level goals are laid out in plain sight,it’s much easier to notice what needs improvement.
• It helps you see how your objectives affect theothers: The Balanced Scorecard dividesimportant objectives into four perspectives:Financial, Customer, Process, and People. Whenyou look at these perspectives on a strategy map,you can literally see which objective is the mostcritical, and how the success or failure of eachobjective changes the whole strategic ecosystem.
Depending on your organization’s mission, visionand strategy, below are four customer valuepropositions you can choose to follow:• Operational excellence: Following this value
proposition means your focus is on lowest total cost,convenience and often ‘”no extras”. Your objectivesfor operational excellence should underscoreattractive prices, excellent and consistent quality,short lead times, ease of purchase and goodselection. Possible objectives under this valueproposition include:♦♦♦♦♦ Attractive prices – Ensure lowest prices, Offer
lower prices than competitors and Offer bestvalue to the consumer.
♦ Excellent and consistent quality – Reducemanufacturing defect rates and Eliminate serviceerrors.
♦ Convenience – Reduce customer complaintsrelating to service or delivery.
♦ Good selection – Maximize inventory turns, Ensureproduct availability and Minimize stock outs.
• Product innovation and leadership: For you tobe able to deliver on this value proposition, your
products must offer superior functionalities thatleading-edge customers value and are prepared topay more for them. Being a product leader meansyou should be prepared to promote yourorganization’s brand image and build strong brandawareness to ensure the market recognizes yourinnovative new products. The objectives you mayinclude in your customer perspective are:♦ Monitor help line calls per product. This will help
you determine the level of interest in your latestproducts or services.
♦ Increase number of customer needs satisfied.This enables you ensure expectations are beingmet.
• Customer intimacy: The organization mustcompletely understand its customers and be ableto provide them with customized products andservices bespoke to their needs. Thus you muststrive to offer a complete solution that ensures thecustomer receives the greatest benefit from theproducts offered. Should you follow the customer-intimate approach, below are some of the customer-intimate attributes and objectives you might use:
♦ Customer knowledge – You need to possessa deep and detailed knowledge of yourcustomers. Using an objective such as “Increasetraining hours on products and services offered”enables you to determine staff knowledge andsee if more training is required.
♦ Solutions offered – It is important to note thatcustomers turn to you because you are offeringthem an unmatched total solution. You maytherefore include as an objective within thecustomer perspective “Increase total number ofsolutions offered per client”.
♦ Customer data – In order to deliver completecustomer total solutions, organizations requireabundant and insightful data on their customers.“Increase % of employees with access tocustomer information” may be stated as anobjective to ensure this key differentiator ofsuccess will be monitored.
♦ Customer relationships – As a customer-intimate organization, your goal should be tobuild long-lasting relationships with yourcustomers. “Provide staff at client locations”could be an objective illustrating the deeprelationships your organization maintains withits clients.
••••• Lock-in: This arises when companies create highswitching costs for their customers by making their

ISSN: 2349-5162Journal of Emerging Technologies and Innovative Research
Page 138February 2019Special Issue
products the standard of the industry. “Create barriersto entry and high switching costs” may be stated asan objective to ensure the organization remains asone of the dominant suppliers.
Strategy map implication in Philips Electronics:Philips’ underlying belief in creating their balancedscorecard is that understanding what drives presentperformance is the basis for determining how to achievefuture results. With this understanding in mind, Philipsdesigned the scorecard to provide a sharedunderstanding of the organization’s strategic policies andvision of the future. Their operating principle in the designwas to determine factors that were critical for achievingthe company’s strategic goals.
The tool has helped Philips Electronics focus on factorscritical for their business success and align hundreds ofindicators that measure their markets, operations, andlaboratories. The business variables crucial for creatingvalue, which are known as the four critical successfactors (CSFs) on the Philips Electronics BSC, are:• Competence (knowledge, technology, leadership,
and teamwork),• Processes (drivers for performance),• Customers (value propositions), and• Financial (value, growth, and productivity).
Six key indicators consistently came to the forefrontfor all business units:• Profitable revenue growth,• Customer delight,• Employee satisfaction,• Drive to operational excellence,• Organizational development,• IT support.
Successes and Challenges:Although there are many successful implementationsat the Philips companies, let’s look at the implementationof the balanced scorecard at Philips. It served as analignment tool to focus on their strategic intent tobecome a $1 billion company by the year 2001.
It simultaneously guided a cultural change effort toincrease accountability for results. Eventually the BSCis expected to replace the monthly accountability callsto the field office where sales are reported againstforecasted numbers. Another success for the card withinthis division is the creation of an operational scorecardfor action planning and tracking results in real-time: Dataare automatically transferred from internal reportingsystems and fed into the online BSC report, which isimmediately accessible and contains the new results.
An upcoming enhancement to customer service andsatisfaction reporting will be the automatic feed of datagathered by the Gallup Organization into the online BSCreport in a similar fashion.
Finally, implementing the card responded to commonquestions raised in the annual employee motivationsurvey, such as “How does what I do every day fit intothe bigger picture of the company?” The balancedscorecard enables employees to understand exactlywhat they need to do on a daily basis in order to impactresults.
Chris Farr, former vice president of quality and regulatoryat PMSNA and who was responsible for the BSC, saysthat companies must get buy-in to the metrics and sharemeasures quarterly with all employees in order tosucceed. “Management must give full access to theiremployees,” Farr says. “The metrics must be sharedand visible.” To share the metrics with employees, PhilipsElectronics uses traffic-light reporting to indicate howthe actual performance compares with the target. Greenindicates meeting
A recent study shows that organizations that realizesignificant benefits from their scorecard systemshave the following characteristics:• Activity-based costing is in place with recognized
value to the organization.• A primary impetus for deploying the system is to
communicate strategy and align employees withstrategy.
• Formal ties exist between strategy and thescorecard system.
• The system is comprehensive, utilizing scorecardson many levels.
• Compensation and reward systems are linked tomeasures used in the scorecard system.
• Employees accept and use the scorecard system.Philips Electronics has implemented a scorecardsystem to align company views, to focus employees onhow they fit into the big picture, and to educateemployees on what drives the business. Philipsmanagement uses the scorecard as a guide at quarterlybusiness reviews worldwide to promote organizationallearning and continuous improvement.
Philips created its balanced scorecard with the beliefthat understanding what drives present performance isthe basis to determine future results. Philips uses thescorecard as a basis for employees to understandmanagement’s strategic policies and vision for the future.Philips created four critical success factors (CSFs) toalign indicators that measure markets, operations and
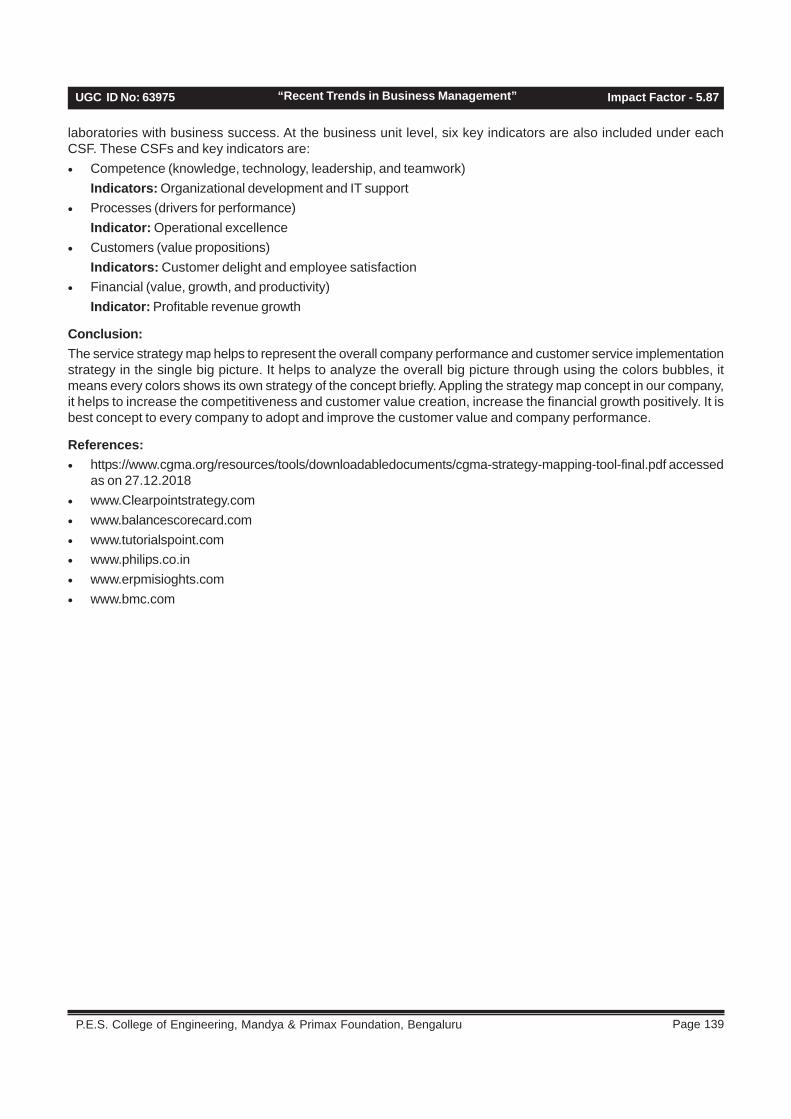
Page 139 P.E.S. College of Engineering, Mandya & Primax Foundation, Bengaluru
UGC ID No: 63975 Impact Factor - 5.87“Recent Trends in Business Management”
laboratories with business success. At the business unit level, six key indicators are also included under eachCSF. These CSFs and key indicators are:• Competence (knowledge, technology, leadership, and teamwork)
Indicators: Organizational development and IT support• Processes (drivers for performance)
Indicator: Operational excellence• Customers (value propositions)
Indicators: Customer delight and employee satisfaction• Financial (value, growth, and productivity)
Indicator: Profitable revenue growth
Conclusion:The service strategy map helps to represent the overall company performance and customer service implementationstrategy in the single big picture. It helps to analyze the overall big picture through using the colors bubbles, itmeans every colors shows its own strategy of the concept briefly. Appling the strategy map concept in our company,it helps to increase the competitiveness and customer value creation, increase the financial growth positively. It isbest concept to every company to adopt and improve the customer value and company performance.
References:• https://www.cgma.org/resources/tools/downloadabledocuments/cgma-strategy-mapping-tool-final.pdf accessed
as on 27.12.2018• www.Clearpointstrategy.com• www.balancescorecard.com• www.tutorialspoint.com• www.philips.co.in• www.erpmisioghts.com• www.bmc.com
ISSN: 2349-5162Journal of Emerging Technologies and Innovative Research
Page 140February 2019Special Issue
1 . Assistant Professor, Dept. of Management Studies &Research Centre, P E S College of Egineering, Mandya, Karnataka2 . Associate Professor, School of economics and commerce ,CMR University, Bangalore, Karnataka, India.3 . 2nd year Student, Dept. of Management Studies & Research Centre, P E S College of Engineering, Mandya, Karnataka,
India
CHILDREN’S PREFERENCE TOWARDS GAME AND TOY A CASESTUDY DURING MAHA SAVINGS DAY AT BIG BAZAR, MANDYA
Introduction To Big BazaarRetail is the process selling goods to final consumers.The big bazaar at Mandya is established in the year2001 to serve to rural farmers and urban consumers.The unique strategies adopted by big Bazaar to attractconsumer. They offer all household products and servicesunder the one roof. The big bazaar has specially designedthe product mix for the consumers in the demographicand geographic basis. Big Bazaar conducts promotionalstrategies adopted national and regional festivals. Theprofile of consumers is mixed with both urban and ruralconsumers depend on agricultural produce. This studyis conducted during the Maha savings day promotedduring IndependenceDay.The Services also offered to theconsumers within Mandya city they purchase morevolume of products and services offered to the onlineconsumers.
Games and ToysChildren’s prefer toys and games vary with changingsocial norms and values. A toys and games moreattracted as the services are emerged gradually afterprivatization. More electronic and online games areengaged by children to play at home more advancetechnology and faster intranet services available in mobileand electronic devices. Children use the toys and gameswith own experience is more enjoyable. Children playingwith toyshelp to training young children in social andcultural life. Different materials like
AlureGowda1 Dr. Srinivas K T2 Kiran N G3
AbstractA toy is an objects used for children’s playing activities. The choice of the toys and games helps to shapes children’sexperience, stimulates imagination, and directs their behavior, conveying the values of a certain historical period. Thepresent study society’s change reflect upon the choice of toys and games conscious with changing social and culturalvalues of parents life style. In the earlier days the decision of toys more depend upon the price, quality, designs.Themodern parents and children expectations increases gradually in earlier days the toys should be made by thewooden but now all were machine and electric devices. So children would more prefer more electric toys and gamesto rather than going for wooden toys. The scope of the study is to understand the strategies adopted by the Big Bazaarto satisfy the children and parents during the special occasion of Maha savings day. The methodology used to collectthe data based on personal interview and observation method. The promotional strategies like demonstration ofgames and toys more impact on the decision making of children’s and parents. The most moveable product likeRemote car, Badminton kit, and Teddy bear.It concludes that the decision making of toys store depend upon attractiveprice, discount, and services during Maha Savings Day.
Keywords —: Big bazar, Maha Saving Days, Mandya, Games and Toys;
wood, clay, paper, and plastic are used to make toys.Many items are designed to serve as toys, but goodsproduced for other purposes can also be used. Forinstance, a small child may fold an ordinary piece ofpaper into an airplane shape and "fly it". Newer forms oftoys include interactive digital entertainment. Some toysare produced primarily as collectors' items and areintended for display only. This study on childrenpreference towards choice of toys and parentscontribution on selection toys during Maha Savings Day.
Objectives• This study is to understand the childrenpreference
towards Toys and Games• To understand the marketing strategiesof toys and
games adopted by Big Bazaar during Maha SavingsDay.
• To identifying the most movable toys products duringthe Independence Day.
• To know the consumer profile of toys and gameswith changing life style.
• To understand the consumer behaviour of childrenand parents about toys and games.
Scope of the StudyThe scope of the study is to analyzes the Big Bazaartoy and games department regarding marketingstrategies adopted by Big Bazaar and the satisfactionof children and parents with the products and services
Page 141 P.E.S. College of Engineering, Mandya & Primax Foundation, Bengaluru
UGC ID No: 63975 Impact Factor - 5.87“Recent Trends in Business Management”
are customize and promotion than regular working days.The consumers visited to BigBazaar during IndependenceDay offer are different behavior than the regularly visitingto the outlet. The product and pricing strategies wereadapted to special sales for Maha Savings Day and gainthe attention of the customers and the Big Bazaar madean attempt to balance the demand and supply in thenon-festive season.
MethodologyThe methodology of this study is empirical in nature. Aprimary study was conducted at Big BazarMandyaduring Maha Saving Days. The data which iscollected both primary and secondary. The primary datacollected on the personal interview and observationmethods.
Limitaions• The limitations of the study are:• The study is conducted only at the Big Bazar,
Mandya.• The study is focused on the Toys and Games
department only.• The study is purely qualitative in nature, the views
and opinions are related to Mandya only.• The period of the study is limited from 11th August
2018 to 15th August 2018.
Maha Savings DayOn the eve of Independence Day,theToy department hasadopted unique marketing strategies about products andservices to increase the sales and attracts the morelocal customers are spending holidays with familymembers. They expect more young couples and childrenwith different age, gender and culture play predominantrole to prefer toys and electric devices.Demonstrationof the product like children Bikes, Scooter and otherriding toys because in order to increase the attention ofthe children and the special discount pricing was adoptingto delight the parents than normal days.Big Bazaar MahaSaving Day offers various products and services informedwell in the advance for all consumers. It increase salesadopting discount in all departmentson shop of Rs.3000and above consumers gets flat Rs1200 cash back. Rs600 cash back in Future Pay Wallet with Paytm cashback of Rs.600 on purchase Big Bazaar E-gift cardsfrom Paytm and 10% instant discount when you paywith SBI debit card.
Consumer ProfileThe Games and Toys shopping experience of parentsand children usually start with entering the store andgoing through the assortment of toys andgames productsthat the store has to offer. The child plays a dominant
role to involve selecting the toys. Traditionally motherinvolve to decide the purchase of toys and games has ithas continue to decide the toys for their children. Theyare not only direct purchasers but also quite influentialindirect purchasers, with the span of their influenceranging from items directly consumed by them to a largenumber of household purchase decisions. The impactof influence exerted by children varies by productcategory and stage of the decision makingprocess.Majority of the purchase decision are made bythe children’s.The changing social and culture factors,the family structure of the modern nuclear family, childselects the products based on toexamine in theindividual isolation and incomplete picture base on thesocial and demographic factors. Parents were madepurchase decisions based on the personality to expecttheir children , biological gender, and the role of themother changes over a period of time also influence onthe socialize of children with toys and games. Childrenchoice of toys and games is associated with their parents’choice. Children choice is depend on age and sex.Whereas the parents are the mirror image of biologicalpredetermine position shaping to contribute and impacton children toys and game preferences.
ProductclassificationBig Bazaar Toys adopted unique strategies to displayand assort the toys and games, toys have other brancheslike Babies and Kids. It includes the baby products andessentials and baby toys. Toys are specializing in avery limited range of products rather than generalizingand losing their uniqueness like other retailers. It providesretail chain service and its marketing mix and offers toysin the following categories:• Learning toys: Desk kit••••• Riding toys: Cycle• Building sets• Dolls: Teddy bears, animal toys• Arts & Crafts• Children’s books: story books, autobiography books• Kitchen set and cookware toys• Electronic and high-tech toys: Remote cars• Puzzles and Games,• Video Games• Outdoor Play sets: Cricket kit, scatting,• Indore Play sets: Badminton kit.
Pricing Strategy:It faces issues pricing toys products because it setsthem on a bit higher side. They do not carry a very uniqueselection of toys and similar toys could be foundelsewhere. Also, there are many manufacturers in China
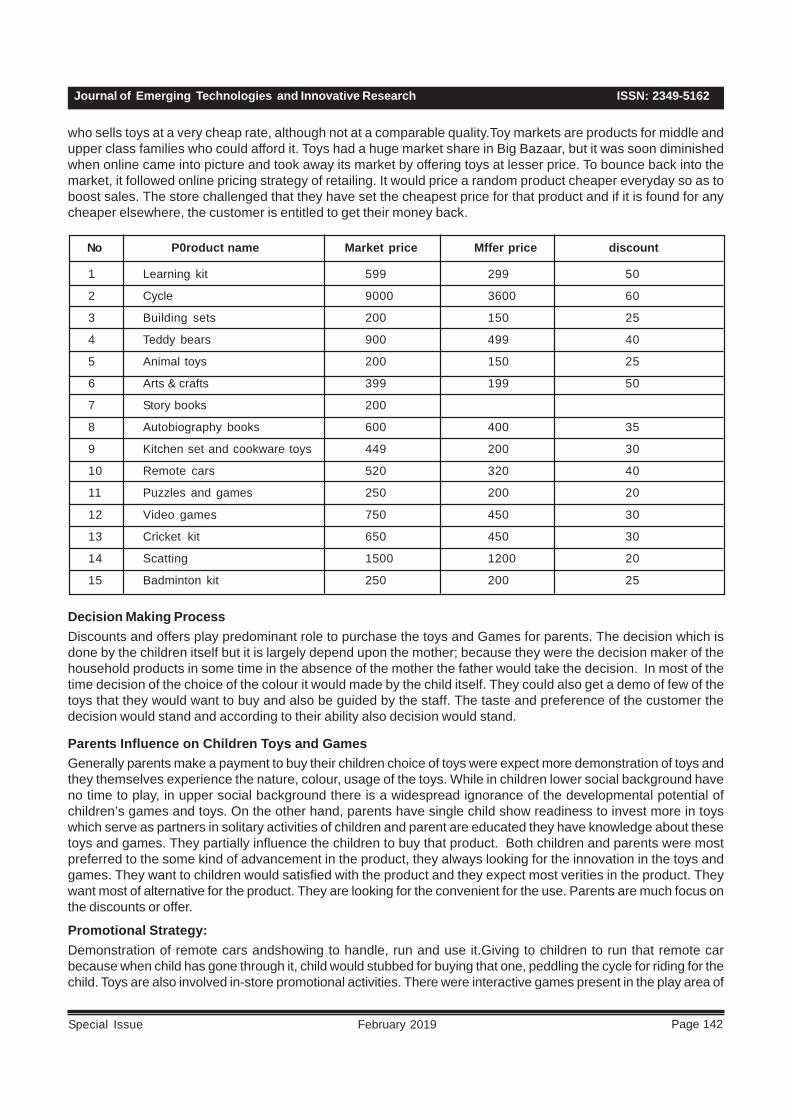
ISSN: 2349-5162Journal of Emerging Technologies and Innovative Research
Page 142February 2019Special Issue
who sells toys at a very cheap rate, although not at a comparable quality.Toy markets are products for middle andupper class families who could afford it. Toys had a huge market share in Big Bazaar, but it was soon diminishedwhen online came into picture and took away its market by offering toys at lesser price. To bounce back into themarket, it followed online pricing strategy of retailing. It would price a random product cheaper everyday so as toboost sales. The store challenged that they have set the cheapest price for that product and if it is found for anycheaper elsewhere, the customer is entitled to get their money back.
No P0roduct name Market price Mffer price discount
1 Learning kit 599 299 50
2 Cycle 9000 3600 60
3 Building sets 200 150 25
4 Teddy bears 900 499 40
5 Animal toys 200 150 25
6 Arts & crafts 399 199 50
7 Story books 200
8 Autobiography books 600 400 35
9 Kitchen set and cookware toys 449 200 30
10 Remote cars 520 320 40
11 Puzzles and games 250 200 20
12 Video games 750 450 30
13 Cricket kit 650 450 30
14 Scatting 1500 1200 20
15 Badminton kit 250 200 25
Decision Making ProcessDiscounts and offers play predominant role to purchase the toys and Games for parents. The decision which isdone by the children itself but it is largely depend upon the mother; because they were the decision maker of thehousehold products in some time in the absence of the mother the father would take the decision. In most of thetime decision of the choice of the colour it would made by the child itself. They could also get a demo of few of thetoys that they would want to buy and also be guided by the staff. The taste and preference of the customer thedecision would stand and according to their ability also decision would stand.
Parents Influence on Children Toys and GamesGenerally parents make a payment to buy their children choice of toys were expect more demonstration of toys andthey themselves experience the nature, colour, usage of the toys. While in children lower social background haveno time to play, in upper social background there is a widespread ignorance of the developmental potential ofchildren’s games and toys. On the other hand, parents have single child show readiness to invest more in toyswhich serve as partners in solitary activities of children and parent are educated they have knowledge about thesetoys and games. They partially influence the children to buy that product. Both children and parents were mostpreferred to the some kind of advancement in the product, they always looking for the innovation in the toys andgames. They want to children would satisfied with the product and they expect most verities in the product. Theywant most of alternative for the product. They are looking for the convenient for the use. Parents are much focus onthe discounts or offer.
Promotional Strategy:Demonstration of remote cars andshowing to handle, run and use it.Giving to children to run that remote carbecause when child has gone through it, child would stubbed for buying that one, peddling the cycle for riding for thechild. Toys are also involved in-store promotional activities. There were interactive games present in the play area of
Page 143 P.E.S. College of Engineering, Mandya & Primax Foundation, Bengaluru
UGC ID No: 63975 Impact Factor - 5.87“Recent Trends in Business Management”
the store where children could play free of cost. Childrenare more joyful to ride the toys and based on the childrenexperience they decide the products and parents alsoindirect involvebuying the toys and games. The productsare select depend on the size, fitness and safety usagedecided by parents based on the predeterminedassessment. They provide warranty and guaranty servicefor the remote car for six months. In case of any damagelike mother board problem would happen provide thereplace of that remote car.
Unidentified NeedsIn this department parents expects the bigger sizebicycles than the availablebicycles in the shop. Fewparents and children expect more colour and ranges tobuy the bicycle productsthe basic version of skating areavailable but some of the customer demanding for theadvanced skating. There is no hockey kit in toys section,parents and children were specific for hockey kit. Someof the parents enquired more about toys and games theyare familiar. The toys section has manage with moreproducts and services but they fail to reach theexpectation of all consumers visiting in the shop.
Most Moveable Product••••• Remote car:
The demonstration of the product and they usingthe best discount strategy, the market price is aboutRs. 520 areproviding an offer price Rs.320 whichhaving a discount of 40%. Cars having a uniquecolour of red, black, white, yellow. That’s way thechildren would get attracted for those colour.
• Badminton kitIt’s an indoor playing game they giving BadmintonKit is about Rs. 200 the market price is about Rs.250which having 25% discount. The mother getsattracted more about the discounted price.
• Teddy bearIt is one of the most moving products. The teddybear quality so good enough, it has a soft cottonoutside, women so attracted because it’s so cuteand attractive one.
Price Comparisons Between Offline and OnlineParents much focus on the price and quality that’s waythey were made comparisons between online and offline.Some of the parentsask that in online the bicycle pricearound Rs. 3000 but it is available Rs.3600. Then thereis no discount here and they are swathing to online.Consumers are eagerly looking for the best product tobe purchase for their comforts so they makingcomparisons between online and offline.
RecommendationsThe entrance of the store creates more impressions towhich attract children and parents. Consumersrepurchase depend upon colourful, attractive and styledwith attractive décor. To create an excited and welcomingfeeling and displaying the most trending toys, games,cartoon characters or action figures in life size or largescale proportions at the entrance would definitely sparkthe excitement levels of kids, making them want to stayin the store forever. Employees of the Toy departmentdressed up in costumes as kids’ favourite superheroesand interacting with them or taking pictures with themand signing autographs are also unique ideas that wouldset in store apart from the rest. Businesses selling toysand games simply cannot expect every customer to bea child under ten years of age accompanied by theirparents willing to buy them what they prefer. There hasto be diversity among the product range. Offer somethinginteresting for people of all ages, so no child goes homeempty handed. While diversifying product range isimportant, it would also be a great option to make thetoy store an entertainment hub. Staff could be trained ina way to be close enough to see and reach out tocustomers if they seem confused or in need ofassistance.
Future Scope of the StudyThe study is emphasizes on the products in the toysand games department to understand the childrenpreference and parents involvement towards toys. Thisstudy is based on the single store i.e. toys and games.In future the study can extend to other products likehome appliances, staples, fashion wear, food etc. Thestudy is also conducted in other cities during variousperiod and different occasion to know the promotionalstrategies of Big Bazaar.
ConclusionToys are purchased by children and parents are reallysatisfied with more products and demonstration byBigBazaar. Some of the customers are looking for theunidentified needs also, like advanced skating, hockeykit, bigger cycle, some customers are asking for morevariants. The Big Bazaar toy department has managedwide range of product in the store. This study revealsproduct and pricing strategies adopted during Mahasavings day and to match the demand and supply oftoys and games.The customers are highly expected withprice, quality, design, advancement, technology, brandand more innovation toys and games. But Big Bazaartoy department has come out with diverse strategy tothe attention of the children and parents and they weremanaged to offer diversified toys and games. The toyswould increase the mental ability of the child, by telling
ISSN: 2349-5162Journal of Emerging Technologies and Innovative Research
Page 144February 2019Special Issue
of this concept to the customer about product likePuzzles and Games, the sales would gradually increases. Themost moveable products are remote car and badminton kid.Consumers were comparing the online and offline retailprice in the shop itself regarding final decision of buying toys. Children prefer more kids’ oriented image and pictureto further mental satisfaction of toys and services in the outlet
Reference• Marie E. Bathiche (1993) childrens games and toys prefences: A contemporary Analysis PP. (1-82)
• Allen, M. (2004). Tangibleinter faces in smarttoys. InJ.Goldstein, D. Buckingham, & G. Brougère (Eds.), Toys,games, and media (pp. 179–194). Mahwah, NJ: Lawrence Erlbaum Associates.
• Hughes, F. P. (1999). Children, play and development. Boston, MA: Allyn and Bacon.
• PekkaMertala,Vesa-MattiSarenius. April 2016, The Value of Toys: 6–8 -year-old children's toy preferences andthe functional analysis of popular toys
• JasminaKlemenovic. 2013. How Do Today’s Children Play and with Which Toys?
• Dr John Morris, Dr Carolynne Mason, Dr Rachel Sandford, Dr Rebecca Duncombe, Dr Trish Gorely, SophieHobson, James Dorling, Susie Brown, Hayley Musson, Dr Mary Nevill. 2012. The Impact of Toys and Play onChildren’s Physical Activity
• www.BigBazaar.com
• www.wikipedia.com

Page 145 P.E.S. College of Engineering, Mandya & Primax Foundation, Bengaluru
UGC ID No: 63975 Impact Factor - 5.87“Recent Trends in Business Management”
1 . PES College of Engineering, Mandya, Karnataka.2 . Assistant Professor, PES College of Engineering, Mandya, Karnataka.
A STUDY ON DETERMINANTS AND OUTCOMES OF JOBCRAFTING IN AN ORGANIZATION
1. IntroductionJob crafting is a new-fangled concept adopted inhuman resource where in an employee throughcrafting and making use of his talent and creativitycan modify the job within his work boundary for hisbetter job outcome ultimately which leads to theemployee engagement. It is the level of commitmentand involvement an employee has towards theirorganisation and value. The employee whosignificantly crafts their job leads to the better workingenvironment and job satisfaction. Job crafting is ameans of describing the ways in which employeeutilize opportunities to customize their jobs byactively changing their tasks and interaction withothers at work. Those who are engaged in theseactions are called as job crafters. The vast majorityof job redesign studies have followed a “top-down”approach, in which management to obtainsuccessful organisational outcome (Brienes andReyonds, 1999; Nielsen, 2013). But job crafting theemployees redesign and re-crafts his own job withset job context.
2. Literature ReviewJustin M. Berg, Jane E. Dutton and AmyWrzesniewsk (2007) The authors suggested jobcrafting captures how employees redesign their ownjobs so that can foster job satisfaction, as well as,engagement, resilience and thriving at work. Jobcrafting leads to high degree of autonomy towardstheir job which leads to the employee engagement.
Evangelia Demerouti (2014) The author viewed jobcrafting as a change in the employee initiate in thejob demands and resources for the meaningful,
Madhusudhan R.Urs1 Pooja Nagpal
AbstractJob crafting is a pro-active behaviour and it is the process of changing ones job into the way they desired within thework boundary. When the job gets monotonous and boring, the employee tries to be more creative and improves thework outlook. Through job crafting the employee can improve his skill and knowledge in the job, can achieve morejob satisfaction, improves their job performance which in turn would facilitates the new role in the job and also it canenhance the working relationship in the organization. Job crafting provides the job engagement and effectiveness inthe working condition, which would enlarges the employee’s mobility and increases the adoptability to the job. Thispaper adopts the literature review method and attempts to understand the concept of job crafting along with itsdeterminants and outcomes of the job crafting.
Key Words: Job Crafting, Determinants, Outcome.
engage and satisfying job. They said job craftingacts as a tool used to redesign and to respond tothe complexity of jobs and also deals with theworkforce in the organisation.
Pelin Kanten(2014) The author focused on thefactors that leads employees job crafting and howthey customize their jobs on the basis of theirabilities, preferences and needs. The authorprescribes that job crafting can be acheived throughorganisational support and job characteristics. Theresearch data was collected from 252 hotelemployees by the survey method analysis was doneusing the structural equation modelling. The resultof the study found that self-efficacy has a positiveand significant effect on job crafting.
Arnold B. Bakker, Alfredo Rodriguez-Mu • ozand Ana Isabel Sanz Vergel(2015) Theresearchers investigated job demand-resourceapproach of job crafting which was investigated bythe pro-active change in the one’s workingenvironment influencing on employee’s (actor’s) andcolleagues (partner’s) work engagement. The studywas done on the 206 employees using socialcognitive theory of hypothesized job craftingbehaviour and that influence on the work engagement.The result shows that the crafting of social andstructural job resources. The crafting of challengingjob demands was positively related to workengagement.
Donald E Ferderic and Tyler J Vander Weele(2015) The researcher made a study on job craftingwith a random-effects using meta analysis on theeffect of job crafting on work engagement. They

ISSN: 2349-5162Journal of Emerging Technologies and Innovative Research
Page 146February 2019Special Issue
describe the job crafting as a set of pro-activebehaviour where individuals change their work andwork environment. The significance of the study isthat the association between increased job craftingleads to the increased work engagement.
Evangelia Demerouti, Arnold B. Bakker andJonathan R.B. Halbesleben (2015) The studysuggests that the way daily job crafting influencesdaily job performance. The hypothesis is on the dailyjob crafting relates to daily job demands andresources (work pressure and autonomy). A sampleof 95 employees filled in a quantitative diary for 5consecutive working days. The author predicted thatthe daily seeking resource is associated with dailytask performance because of daily autonomy andwork engagement.
Michaela Schoberva (2015) The researcher wasconcerned on understanding overall wellbeing andperformance of an employee which proactivelyengage in their work through the positive psychologyand organisation and it was suggested that theemployee should craft their job which would resultin the new personal development of crafting practicesof an employee and does resulted in reducingunwanted consequences and misalignment withorganisational goal.
Cornelia Niesson, Daniela Weseler and PetyaKastova (2016) Authors in their paper suggestedjob crafting is a pro-active behaviour which relatesto the change in task and the social boundaries atwork. The researchers conducted the study with thethree different dimensional structure of job crafting(work crafting, relational crafting and cognitivecrafting). The article focused on the antecedents ofjob crafting and the development & validation of jobcrafting scale with reference to the exploratory factoranalysis and confirmatory factor analysis, the resultshowed that the self oriented behaviour refers to thepositive job performance.
Paraskvas Petrou, Evangeliva Demerouti andWilmar B Schanfeli (2016) In this study theresearchers suggested that job crafting is a tool usedby the employees in order to respond and cope withthe implementation of organisational change. Thestudy was made on the 368 police officers usingscore analytical approach via three-wave longitudinaldesign. This resulting in the seeking challenges inpositively associated with adoptability and reducingdemands is negatively associated with workengagement.
Darya Moghini, Susanne Scheibe and NicohoYperen (2017) The authors defined Job crafting as
“self-initiated behaviour displayed by employees withthe goal to increase the fit between the individualand the job. Fit can be achieved by matchingpersonal needs and abilities to work supplies anddemands”.
Luse Trong Tuna (2017) The research suggestedemployee flexibility could be created by contributingto organisational flexibility and dynamism throughjob crafting. The study found knowledge sharingdepends on the relationship between the flexibilityand the job crafting, which would be resulting in theinteraction and motivation leading towards theknowledge sharing among the employees.
Tomoki Sekiguchi, Jie Li and Masaki Hosomi(2017) The authors suggested job crafting as bottom-up approach where the employee changes their workboundaries and play the important role in themanagement of organisational change. Theresearchers made the study on two different samples-Study 1- sample of 509 part-time employees whereantecedents were autonomy and social skills on jobcrafting; Study 2- sample was on 564 full-timeemployees which proved high autonomy and highsocial skills would leads to the job crafting,regardless of the level of employees status.
Changyi Peng (2018) The researcher found jobcrafting aids in redesign and reshape the job incontext of job, work mode and relationship amongthe team-mates and also suggested apart from thejob crafting, the organisation can optimise workrelation and improves the employee identity andcoping ability in the organisation.
Evy Kuijpers, Dorien De Kooij & Marianne VanWoeskon (2018) The study found intervention of jobcrafting through experimental design. The hypothesisof job crafting interventions could lead to level of jobcrafting and work engagement. The result of the studyshows that the significance of work engagement isenhanced through job crafting.
Xiaoyu Guan and Stephen Frenkel (2018) Theauthors found that encouraging employeeparticipation through job crafting by investigating bythe role of human resource practices in fosteringhigher in-role and extra-role employee performance.The survey was on the sample of 455 employeesworking in five Chinese manufacturing firms to testtheir theoretical model. The finding of the study werethat the employees are more likely to be engaged intheir work and participate in job crafting shown inperformance management.
To summarise job crafting through various studies andby different researchers, job crafting allows employees
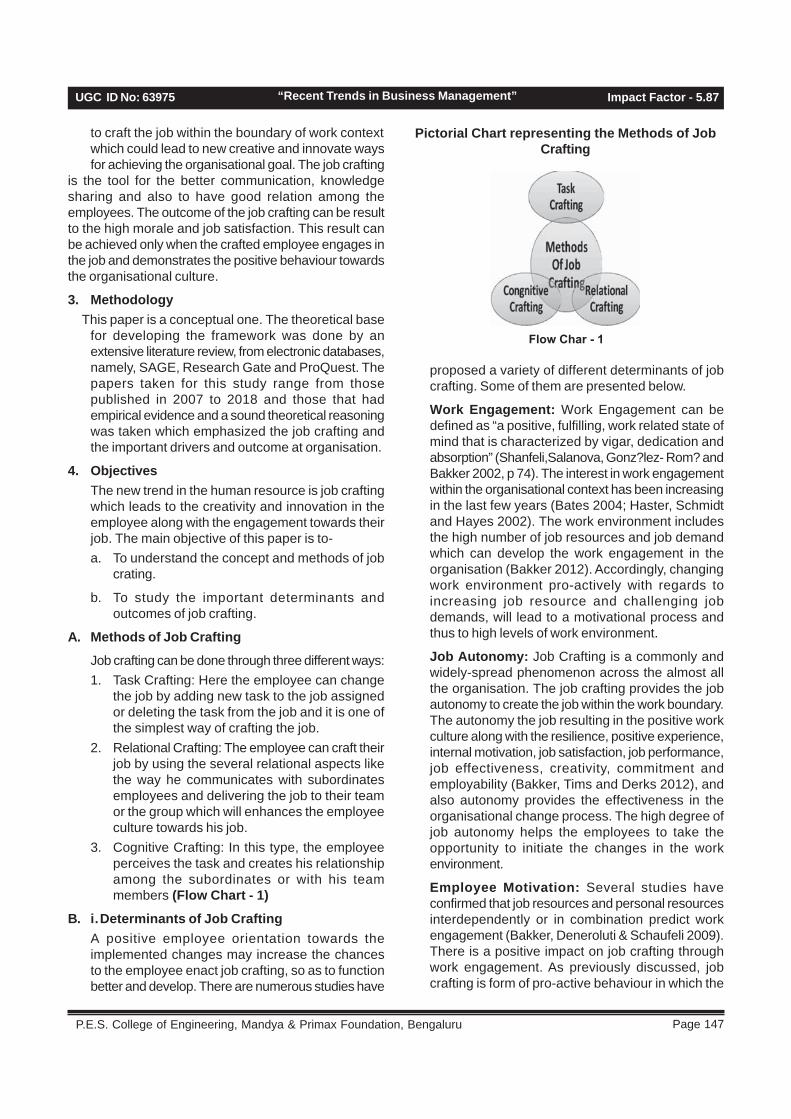
Page 147 P.E.S. College of Engineering, Mandya & Primax Foundation, Bengaluru
UGC ID No: 63975 Impact Factor - 5.87“Recent Trends in Business Management”
to craft the job within the boundary of work contextwhich could lead to new creative and innovate waysfor achieving the organisational goal. The job crafting
is the tool for the better communication, knowledgesharing and also to have good relation among theemployees. The outcome of the job crafting can be resultto the high morale and job satisfaction. This result canbe achieved only when the crafted employee engages inthe job and demonstrates the positive behaviour towardsthe organisational culture.
3. Methodology This paper is a conceptual one. The theoretical base
for developing the framework was done by anextensive literature review, from electronic databases,namely, SAGE, Research Gate and ProQuest. Thepapers taken for this study range from thosepublished in 2007 to 2018 and those that hadempirical evidence and a sound theoretical reasoningwas taken which emphasized the job crafting andthe important drivers and outcome at organisation.
4. ObjectivesThe new trend in the human resource is job craftingwhich leads to the creativity and innovation in theemployee along with the engagement towards theirjob. The main objective of this paper is to-a. To understand the concept and methods of job
crating.
b. To study the important determinants andoutcomes of job crafting.
A. Methods of Job Crafting
Job crafting can be done through three different ways:1. Task Crafting: Here the employee can change
the job by adding new task to the job assignedor deleting the task from the job and it is one ofthe simplest way of crafting the job.
2. Relational Crafting: The employee can craft theirjob by using the several relational aspects likethe way he communicates with subordinatesemployees and delivering the job to their teamor the group which will enhances the employeeculture towards his job.
3. Cognitive Crafting: In this type, the employeeperceives the task and creates his relationshipamong the subordinates or with his teammembers (Flow Chart - 1)
B. i.Determinants of Job CraftingA positive employee orientation towards theimplemented changes may increase the chancesto the employee enact job crafting, so as to functionbetter and develop. There are numerous studies have
proposed a variety of different determinants of jobcrafting. Some of them are presented below.
Work Engagement: Work Engagement can bedefined as “a positive, fulfilling, work related state ofmind that is characterized by vigar, dedication andabsorption” (Shanfeli,Salanova, Gonz?lez- Rom? andBakker 2002, p 74). The interest in work engagementwithin the organisational context has been increasingin the last few years (Bates 2004; Haster, Schmidtand Hayes 2002). The work environment includesthe high number of job resources and job demandwhich can develop the work engagement in theorganisation (Bakker 2012). Accordingly, changingwork environment pro-actively with regards toincreasing job resource and challenging jobdemands, will lead to a motivational process andthus to high levels of work environment.
Job Autonomy: Job Crafting is a commonly andwidely-spread phenomenon across the almost allthe organisation. The job crafting provides the jobautonomy to create the job within the work boundary.The autonomy the job resulting in the positive workculture along with the resilience, positive experience,internal motivation, job satisfaction, job performance,job effectiveness, creativity, commitment andemployability (Bakker, Tims and Derks 2012), andalso autonomy provides the effectiveness in theorganisational change process. The high degree ofjob autonomy helps the employees to take theopportunity to initiate the changes in the workenvironment.
Employee Motivation: Several studies haveconfirmed that job resources and personal resourcesinterdependently or in combination predict workengagement (Bakker, Deneroluti & Schaufeli 2009).There is a positive impact on job crafting throughwork engagement. As previously discussed, jobcrafting is form of pro-active behaviour in which the
Methods
Flow Char - 1
Pictorial Chart representing the Methods of JobCrafting
ISSN: 2349-5162Journal of Emerging Technologies and Innovative Research
Page 148February 2019Special Issue
employees take the initiate to change the level ofjob demand and resources (Tims, et al, 2012). Jobcrafting enables the employees to experience themeaning of their work. This represents that theorganisation encourages keeping their employeesenthusiastic for and engaged in their work.
HR Flexibility: HR Flexibility is an environment thata nature such pro-active or change behaviour as jobcrafting, which allows encompasses resources andco-ordination flexibility in employees skill, behaviourand practise (Lepak, Takeuchi and Snell, 2003).There is an equal contribution towards the individualand team level. HR Flexibility is a multi-dimensionalconstruct consisting of two broad dimensions:resource flexibility and co-ordination flexibility (Wayet al., 2015). Despite recognizing the value of HRflexibility practices in activating knowledge sharingin terms of individual and collective job crafting, theresearcher acknowledge that the mere investigationof management practices seldom captures the fullcomplexity of individual characteristics (Tuan, 2017).The flexibility in employees allows the cognitive andphysical change in the task and relational boundariesof their job enables them to reframe the aim of thejob and experience the job differently.
Perceived Organisational Support: HumanResource are considered to be one of the mostimportant source for acquiring competitive advantagein organization by providing supportive workingenvironment to attract and retain skilled and valuableemployees (Salehzadeh et al., 2014). The socialexchange relationship between the employer andemployee can achieved through the perceivedorganisational support. Eisemberger et al., definedperceived organisational support as a “global belief”developed by employees concerning the extent towhich the organisational values their contributionsand its concerned about their welfare.
Job Characteristics: Job characteristics areconsidered to be one of the driver of job crafting whichfunctions as the motivational factor in employees.The specific aspects of a job includes knowledgeand skills, mental and physical demands and workingconditions influencing on the welfare, security,relationship, feedback, autonomy and the opportunityof development (Tsaur et al., 2011). The fivedimensions of positive work attitude and work qualityof job characteristics are skill variety, tasksignificance, autonomy and feedback (Griffin andMoorhead, 2010).
Job Engagement: Khan(1990) was the first tocoined term job engagement. It refers to “the
simultaneous employment and expression ofpersons ‘preferred self’ in task behaviour thatpromote connections to work and to others, personalpresence and active full performance” (Khan 1990,p700). The two major drivers of the job engagementare job resource factor and job demand factor, whichfocuses on the engagement towards their job.
B. ii.Outcomes of Job Crafting“Employees are not passive recipients oforganisational design, but they pro-actively modifytheir jobs so that they fit to their preferences”(Wrzeiewski and Dutton, 2001). As there arenumerous outcomes of the job crafting and there isa fair amount of consistency in the practitioners andacademic literature reviews regarding the benefitsof doing so. This section will explore some of theoutcomes of job crafting in an organisation.
Employee Well Being : Job Crafting helps theemployees to engage in their work boundary andstudy aims at the multiple positive individual, groupand organisational outcome that ensures theemployee well being and employee performance(Mechaela Schoberova 2015). The factors describesthe employee well being are work engagement, workmeaningfulness and job satisfaction. Job crafting isa pro-active behaviour which leads to the workengagement in the organisation. The engagedemployee proactively change their work environmentand actively manages the well-being at theorganisation (Bakker 2011).
Organisational Change: Job crafting plays animportant role in the organisational change. Theemployees have the autonomy to craft the job asthey desire within the boundary. The pro-activenessin the employee results to the organisational change.Job crafting plays a major role in promoting theorganisational change, which enables the employeesto cope with the uncertainties that emerges (Petrouet al, 2015). For example, the employee engages injob crafting to adjust to the changing environmentthey are facing in daily work, the accumulation andaggregation of such small changes would eventuallyresult in the large scale organisational level change,which enables the organisation to adapt to the newenvironment (Grant & Parker 2009). During theorganisational change the pro-active behaviour ofemployee includes the job resources, work pressureassociated with the change and seeking challengesthat will transform change in the organisation (Avey,Weensing and Luthans, 2008). These threebehaviours are presenting in job crafting of anemployee during the organisational change.

Page 149 P.E.S. College of Engineering, Mandya & Primax Foundation, Bengaluru
UGC ID No: 63975 Impact Factor - 5.87“Recent Trends in Business Management”
Positive Relation : Assessing of the job crafting in employees which resulting in increasing structural jobresources, social job resources, challenging job demands and decreasing hindering job demands (Jaya andNidhi, 2017). Job crafting found that, it leads to the positive correlation with colleagues and it leads to reduce turnoverintentions, higher level of employee performance and work engagement (Bakker, Hackmen Demerouti and Xanthopoulou.2007).
Knowledge Sharing: Knowledge sharing reflects a “social interaction culture, involving the exchange ofemployee’s knowledge, experience and skills through the whole department or organisation” (H F. Lin, 2007,p.136). The pro-active behaviour and HRM of job crafting which mediates the role if knowledge sharing. Teamknowledge sharing is an extent to which team members share task relevant ideas, information and suggestionswith one another. The exchange of knowledge among team members can be done through the collective jobcrafting (Tims et al., 2013). Knowledge sharing is also engenders feedback from all the directions includingsuperiors, peers and sub-ordinates.
Self-Efficacy: Self-efficacy is a personality construct or an individual characteristics emerges from ‘socialcognitive theory’ (Karatepe et al., 2007:25). Social cognitive theory suggests that the employee performancecan influence on the environmental factor and personal self-efficacy. It is known as individual perceived capabilitiesto perform a specific task or role in their work place and social life (Kanten, 2014). Increase in the social jobresources leads to the employees seeking feedback from their supervisors. To engage in the pro-active behaviourof job crafting an individual needs high self-efficacy and experience control (Parker et al, 2006). There is apositive relationship among the role related self-efficacy and pro-active behaviour in the crafting.
Job Satisfaction: Job satisfaction has always been a matter of interest for both employees and employers,because of its profound effects and consequences. The job satisfaction can be predicted through the autonomygiven to employees in the work place (Elise 2017). An individual is more likely to engage in pro-active behaviourunder autonomy. The pro-active behaviour in shaping the work environment concentrates on job crafting. Throughthe crafting employees pro-actively improve the work situation and improves their job satisfaction (Slemp andVella-Brogdrick, 2014). For the perfect working condition in employees autonomy is provided to craft their job inthe desired way and latter leads to the job satisfaction in the employees.
Social Skills: Social skills represents the ability to adjust one’s behaviour to different and changing situationaldemands and to effectively influence and control others responses reflects in interpersonal perceptiveness andbehavioural flexibility (Witt and Ferris, 2003). Social skill is also different from personality such that social skillscan be learned and trained. There is an influence of social skills on employee status between job autonomy andjob crafting (Tomoki et al., 2017).
Flow Chart - 2
ISSN: 2349-5162Journal of Emerging Technologies and Innovative Research
Page 150February 2019Special Issue
Pictorial Chart representing Job crafting, it’sDeterminants and the OutcomesV. Conclusion: Job crafting is a very powerful tool
that can lead to higher employee motivation whichthereby affects employee engagement in theorganisation and in turns aids in future organizationalgrowth. This paper attempts to understand theconcept of job crafting its determinants and outcomeusing a literature review method.
Bibliography:
• Arnold B. Bakker, Alfredo Rodriguez- Mu?oz and AnaIsabel Sanz Vergel (2016). “Modelling Job CraftingBehaviours: Implications for Work Engagement”. Vol.69(1) 169-189.
• Avey J B, Wernsing T S, & Luthans F (2008). “CanPositive employers help Positive OrganisationalChange? Impact of Psychological Capital andEmotions on Relevant Attitudes & Behaviours”.Journal of Applied Behavioural Science, 44, 48-70.
• Bakker A B, Tims M & Derks D (2012). “Proactivepersonality and job performance: the role of jobcrafting and work engagement”, Human relations,65, 1359-1378.
• Cornelia Nissen, Daniela Weseler and DetyaKostova (2016). “When and why individuals craft theirjobs? The role of individual motivation and workcharacteristics for job crafting”, Human relations, Vol.69(6), 1287-1313.
• Drayan Moghini, Susanne Scheibe and Nino W VanYperen (2017). “job crafting in aging employees”,Encyclopedia of Geropsychology. DOI 10.1007/987-981-287-080-3_29-1.
• Demerouti E (2014). “Design your job through jobcrafting”, European psychology, 19(4), 237-247.
• Elise Chung (2017). “The relationship between jobautonomy, job satisfaction and the mediating role ofjob crafting”.
• Evangelia Demerouti, Aronld B. Bakker and JonathanR B Halbesleben (2015). ”Productive andcounterproductive job crafting: a daily diary study”,Journal of occupational health psychology, Vol. 20,No. 04, 457-469.
• Evy Kerijpers, Dorien Dekooij and Marianne VanWoerkom (2018). “ Align your job with you: Theeffects of a job crafting interventions on workenvironment” ISBN 978-80-87927-47-2, IISES.
• Grant A M and Paker S K(2009). “Redesigning workdesign theories: the rise relational and pro-active
perspective”, Academy of management annals, 3,317-375.
• Griffin R W and Moorhead G (2010). “OrganisationalBehaviour managing people and organisation”, 11thedition, USA: South Cengage Learning.
• Jaya Ahuja and Nidhi Chaturvedi (2017). “Job craftingand Employee engagement: A motivational study”,NMIMS management review(1), 106-120.
• Karatepe O M, Ararli H and Khan A (2007). “Theimpact of self-efficacy on job outcome of hotelemployees: Evideance from north Cyprus”,International journal of Hospitality and TourismAdministration, Vol. 8, No. 4, 23-46.
• Khan W A (1990). “Psychological Condition ofpersonal engagement and disengagement at work”,Academy of Management Journal 33, 692-724.
• Lepak D P, Takeuchi R, Snell S A (2003). “Employeeflexibility and firm performance: Examining theinteraction effect of employment mode, environmentaldynamism and technological intensity”. Journal ofManagement, 29, 681-703.
• Liaoyu Guan, Stephen Frenkel (2018). “ How HRpractices, work environment and job craftinginfluence employee performance”, ChineseManagement studies.
• Lin H F (2007). “Effects of externisic and internisicmotivation on employee knowledge sharingintention”, Journal of Information Science, 33, 135-149.
• Luu Trong Tunan (2017). HR Flexibility and jobcrafting in public organisation: the role of knowledgesharing and public service motivation”, Group andOrganisation management, 1-29.
• Maria Tims, Arnold B Bakker, Doantje Perks andWillem Van Rhenen (2013). “Job crafting at the teamand individual level: Implications for work environmentand performance”, Group and OrganisationManagement, 38(4), 427-453.
• Paraskeva Petrou, Evangelia Demerouti and WilmarB Schaufeli (2016). “Crafting the change: the role ofemployee job crafting behaviour for successfulorganisational change”, Journal of Management. 1-27.
• Pelin Kanten (2014). “The antecedents of jobcrafting: Perceived organisational support, jobcharacteristics and self-efficacy”, European Journalof Business and Social Science, 33, 135-149.
• Peng C Y (2018). “A literature review on job craftingand its related researches”, Journal of HumanResources and Sustainable Studies, 6, 1-7.
Page 151 P.E.S. College of Engineering, Mandya & Primax Foundation, Bengaluru
UGC ID No: 63975 Impact Factor - 5.87“Recent Trends in Business Management”
• Petrou P, Demerouti E & Schaufeli W B (2015). “Job crafting in changing organisations: antecedents andimplications for exhaustion and performance”. Journal of Occupational Health Psychology, 20, 470-480.
• Rana Mislim (2015). “Job Crafting in organisations: A valuable approach for job performance or just a theoreticalframe work? Department of work organisational and health psychology, 1-61.
• Schoberva Michaela (2015). “Job crafting and personal development in the work place: Employees and Managersco-creating meaningful & productive work in personal development discussions”, Masters of Applied PositivePsychology (MAPP), Capstone Project, 6, 1-7.
• Seleiguchi, Tomoki; Li, Jei; Hosonie, Masaki (2017).” Prediciting Job crafting from socially embedded perspective:The interactive effects of job autonomy, social skills and employee status”, The Journal of Applied BehaviouralScience, 53(4), 470-487.
• Tims M, Bakker A B & Derks D (2012), “Development and validation of the job crafting scale”, Journal ofVocational Behaviour, 80, 173-186.
• Tsaur S, Yen C & Yang W (2011). “Do job characteristics lead to employee creativity in Travel Agencies?”,International Journal of Tourisms Research, 13, 191-204.
• Xanthopoulou D, A B Domrouti E & Schanfeli W B (2009). “Work engagement and financial returns: A dialystudy on the role of job and personal resources”, Journal of Occupational and Organisational Paychology, 82,183-200.

ISSN: 2349-5162Journal of Emerging Technologies and Innovative Research
Page 152February 2019Special Issue
1. PES College of Engineering. Mandya, Karnataka.2 . Assistant Professor, PES College of Engineering. Mandya, Karnataka.
A STUDY ON CORPORATE ENTREPRENEURSHIPDRIVERS AND ITS OUTCOME
Introduction:Corporate entrepreneurship is an old concept where everytype of organization tries to interpret this concept toface the challenges in this competitive world. (Lumpkinand dess in 1996) explained corporate entrepreneurshipin terms of entrepreneurial orientation and theydetermined main characteristics as innovativeness, pro-activeness, risk taking, autonomy and competitiveaggressiveness. (J.P.J de jong, 2011) defines the CE atthe individual level where they develop the intrapreneurialbehavior in the organization on the basis of 3 dimensions;innovativeness, pro-activeness, risk taking. (GiffordPinchot 1987) explained that the entrepreneurship is toprovide the opportunity and exploitation withinorganization for growth. (Covin and Selvin 1989) stressedthat CE is a different theme or posture which isconsidered strategic entrepreneurship concept.
Literature Review1. Peterson and Berger 1971: This literature identifies
that there is a unique leadership style,entrepreneurship, the large size of organization haveto cope with risk factor and turbulent marketscenario. In this article the author tried to explainwith example of popular music recording industrywhich shows the potentially disruptive outcome ofentrepreneurship are decreased. The marketturbulence will be occurring since World War 2 andthen CE directly link with degree of turbulence inorder to show clear picture of generality ofrelationship.
Fayeeza Khanum1 Pooja Nagpal2
AbstractCorporate Entrepreneurship plays a significant role from decades in corporate field. Every firm strives to createinnovative ideas to get opportunity to increase and improve their productivity and profitability. Corporateentrepreneurship is a way to improve and develop the business within a large context with the risk and balancing theircompetitors. Corporate entrepreneurship is a process where it mainly concentrates on innovation and growth insidethe organization which is used to develop and establish the product, services, quality, and new business. Whencorporate entrepreneurship adequately implement in a firm it gives strong variables which leads to effective performanceand employee engagement for long term business growth. Effective performance helps the organization andemployees to develop new technology and new pattern of products. On the basis of employee performance thecompany facilitates the rewards and recognition to the employees, where the employees are committed and engagewith their work and produce positive outcomes. This literature review put a light on how the corporate entrepreneurdeals with performance and risks which impact on the employee engagement and work commitment.
Key Words: Corporate Entrepreneurship (CE), Drivers, Outcome.
2. Stevenson 1983: This paper review is aboutopportunity based management practice, which helpfirm to remain as large and contribute to firm andcreate the value for society level which help to bringnew innovative instruments, but there is a lack ofempirical tools to examine his proposition. Fordevelopment of instrument Stevenson use full scaleon a very large (1200+cases) stratified randomsample of firm with different size. The output resultof this sample show that both like full sample andvarious sub samples contribute the 6 sub-dimensions which includes high discriminationvalidity and moderate to high reliability. Sub-dimensions are strategic orientation, resourceorientation, management structure, rewardphilosophy, growth orientation, and entrepreneurialculture. These dimensions are used as Stevenson’stheoretical reasoning.
3. Shaker a Zahra and Covin 1995: According theirresearch the corporate entrepreneurship is sourcewhere companies are improving their financialperformance and productivity. There is a logic behindthe corporate entrepreneurship concept seems tobe that risk taking, innovation, and aggressivecompetitive action. And CE makes the firm strongerto take opportunity to produce qualitative productand also achieving superior competition level.
4. Alex Maritz 2005: In this article the author tries toexplain how entrepreneurial orientation conceptworks on system franchise. To identify the
Page 153 P.E.S. College of Engineering, Mandya & Primax Foundation, Bengaluru
UGC ID No: 63975 Impact Factor - 5.87“Recent Trends in Business Management”
improvement of system franchise they make twofocus group and interview held with 8 franchisees.As a part of franchise system council. And thisexperiment encourages considering both areas suchas entrepreneurial and as well as non- entrepreneurialissue. Based on their findings of this qualitativeresearch they adopted and designed 20 items ofquestionnaire (Thompson 2002).And the next stageof process of research paper is based on 164franchised outlets of convenience sample whichincludes length of service. The franchise system issuccessfully identified the market leader in servicesector in South Africa. The designed questionnaireis very much useful to measures the perception offranchise and also useful to measured theassessment of overall franchise systems ofentrepreneurial orientation.
5. Sally sambrook and Clair Roberts 2005: Thispaper literature give the extensive review of the broadarea of CE and organizational learning which derivedthree outcomes first, intra- relationship and also acontinuous process within each area. Second inter-relationship which covering the process, thirdinteraction and synergy between the CE and OL.This literature contributes the possible way to knowabout contemporary organizational problems, whichare constantly encouraged and manage strategicchange. Recently both concepts which is CE andOL are plays a very important role to enhance theeffectiveness of each. The specific research questionare arise which if empirically researched, contributeto a more complex and dynamic relationshipbetween CE and OL it directly impact on strategicchange.
6. Astrid Heidemann Lassen 2007: This literatureexplains about the importance of entrepreneurialdynamics in corporate context which involve andconsidered both the areas which is entrepreneurshipand strategic management. The author try to definehow every firm make the framework of innovationwhich is use as element of survival. From this reviewthe author derives the outcome which is strategicentrepreneurship. This literature explores thestrategic entrepreneurship through the seven casestudies which involves the radical technologicalinnovation.
7. Olga Belousova, Benoit Gailly, Olivier Basso2009: This paper aims to develop and test anintegrative model of corporate entrepreneurialbehavior. Entrepreneurial behavior explains thediscovery, evaluation, and exploitation ofentrepreneurial opportunities. Firstly the studyaccumulate and confronts from research on CE and
venturing, secondly, it contributes the four integrativemodel which allows the systematical frameworkwhich considered the CE behavior, thirdly, the casestudies are used to teaching corporateentrepreneurship in top business school.
8. Ghulam Nabi and Francisco Linan 2011: CE asa rational decision making concept in terms ofprogress for those student whose career is newlystart up in business field as a monitor and supporter.This article shows the journey of student to start upof policy maker. This article is dived into the severalsections: entrepreneurial intentions, attitudes andmotivation, this article provides the opportunity andchallenges for graduate entrepreneurship. Thisliterature suggests that there is lack of research inthe field of graduate entrepreneurship in the growthworld. In this paper there are two themes, firstentrepreneurial concept is higher consideration indeveloping countries rather than developed ones.Second, in entrepreneurial filed the framework ofeconomic and institution is unfavorable activity. Inthis sense the two instruments key which is highereducation in general and entrepreneurship educationare promotes the entrepreneurial activity.
9. Andrew C Corbett et al., 2013: This paper is mainlyfocus on how competitive strategy helps the firm toachieve competitive superiority. Because thestrategic entrepreneurship is the part of CE whichnot only identify the disruptive innovation but alsoseek to generate the path which create new businesswith the idea about how the firm struggle and tackleto understand how the opportunities are generatedin the level of uncertainty on several dimension. CEis an important concept which provides theopportunity to invites the new ideas and innovationfrom various perspectives to establish theorganization with positive respond.
10. E. Serra yurt koru and Begum Seray Teraman2014: This literature is about how the organizationis willing to take risk in many areas. The authorargued that entrepreneurial personality determinantsare inadequate to have reliable and generalizeoutcome. This literature purpose is to measure theeffect of willingness to take risk on entrepreneurialintentions and also compare between the state andprivate university students. For their sampling testthey considered 207 state and 214 privateuniversities. And result derived some differencebetween 2 groups and effect of willingness to takerisk on entrepreneurial intension.
11. E. Serra yurt koru and Ahmet Doganay 2014:This literature review explores the determinants onentrepreneurial intention of university students. For
ISSN: 2349-5162Journal of Emerging Technologies and Innovative Research
Page 154February 2019Special Issue
theoretical framework the author uses theory ofplanned behavior model (TBM). This paper is mainlyfocus on future entrepreneurship which includeseducational and structural support as antecedentsof personal attitude and behavioral control. The modelis examined on 425 university students. Its outcomeis providing useful interpretation for policy makersand educators.
12. Dean and Shepherd 2014: In this paper the authorshows the judgment and decision-making has a longtradition in management which represents thesubstantial layer of research in entrepreneurship.Various reviews of this concept in the firm behavior,psychology, and marketing fields, in this literaturethis is the first review of entrepreneurial decisionmaking is given the solid decision in the context ofhigh unpredictability. Author collects the data fromvarious articles like 602 in initial screening and 156in a refined search. In this paper they categorizedthe articles into decision making topics with primaryactivities associated with entrepreneurshipopportunity assessment decision, entry decision,exploiting opportunity, exit decision, and analyze allthese decision in each context using generaldecision making framework.
13. Tezcan Kasmer Sahin and Tuncer Asunakutlu2014: Their study aims to analyze entrepreneurialintention through influence of national culture thatpeople follows. And to explain the relationshipbetween people’s perception they conduct surveyof this study was on 384 people who live in Bulgariawith Turkish roots. For testing this survey they dohypotheses and also conduct the questionnaires.And the data was analyzed with the help of SPSSsoftware and also t test and regression analysis alsotested.
Gibre afework and R. Satya Raju 2015: This papercontributes towards relationship between corporateentrepreneurship and employee engagement usingcorporate entrepreneurship assessment instrument(CEAI) and Utrecht work engagement scale (UWES).This study followed descriptive survey design in across-sectional time. The primary data of thisliterature collected from structured questioner whichwas constructed based on the CEAI developed byHornsby et al. (2002) to assess the employeeengagement. The sample will be 332 respondentstaken from six leather footwear companies in AddisAbaba, Ethiopia. And social exchange theory wasused to define the hypothesized relationships. Thisstudy showed the Effect of CEAI on the dimensionswhich includes employee engagement, whileconsidering different demographic groups like salary
ranges, age groups, gender, experience, workposition.
14. Didem Enginoglu and Cenk Lacin Arikan 2016:The study suggested competitive advantages aremain reason which increasing difficulties. The wayof success only innovation and creativeness,effectiveness. In such high competitive advantageenvironment the firms have to think unique ideas tostrong the base of availability of resources withinorganization. Corporate strategy is the essential wayto achieve the strategic goal of the firm. The firmtaking competitive advantage on the basis ofemployee skills and performance. To compete withchanging environment the competitive advantage offirms is influenced by technological, social, political,economic, legal, and global environmental condition.
15. Boris urban, Eric Wood 2017: “This literaturemainly focuses on integrated model of corporateentrepreneurship which consider both organizationaland individual-positional factor which is based onthe qualitative empirical support. In a firm the behaviorand individual interaction is an important factor whichcontributes the multi dimensional level of innovation.The success of the organization is mainly dependingon combination of entrepreneurship and innovationcomplementary. In this literature they considered thesample of 784 responses from the South Africanfinancial sector was surveyed. For test the literaturethey used structural equation modeling fit becausethis result showed that entrepreneurial alertness hadthe greatest direct path impact on corporateentrepreneurship.
16. Chandrasekhar Kamatigam 2017: In this literaturethe author tries to give the knowledge about role ofleaders through the means of creativity andinnovation. The CE is the continuous process whereit shows the broad range of employees andmanagers serve their service as entrepreneurs in theinnovation process. To identify the elements whichcontribute to the development and growth ofentrepreneurial venture there is continuous need forresearch which gives the better result. There is anotion that the manager’s supervision has asignificant impact on the individual creativity, ability,and also timely reported high quality task and alsomakes positive relationship with supervisor whichencourages towards generating creative ideas. Butexisting literature on CE shows the strongassociation between employee ability, and creativityand employee engagement and retention strategywith entrepreneurial activities. This literature exploresthe role of leader relation with the CE with theconsideration of employee creativity and innovation.
Page 155 P.E.S. College of Engineering, Mandya & Primax Foundation, Bengaluru
UGC ID No: 63975 Impact Factor - 5.87“Recent Trends in Business Management”
Methodology:This paper is conceptual one. The theoretical base fordeveloping the frame work is done by an extensiveliterature review, from electronic database because of alack of empirical tools to examine the proposition.Hitherto best established empirical instrument forassessing a firm’s level of entrepreneurship and alsoproquest data base which bringing theory with practices.
Objective• To understand the concept of corporate
entrepreneurship in organization• To study the drivers and outcomes of CE in firm.The objective of this literature is bringing the importanceof CE in organization which improves the organizationlearning and innovative components with each individual.
Drivers of Corporate Entrepreneurship• Team Management : (Prof. Dr. Daniela Dimitrova
Popova) Team management is very importanttowards the improvement of the firm as well asindividual performance. Team management plays avital role in the form of managing the crisis orincreasing pressure on firm strategy against thecompetitive level. During the trouble the topmanagement executive have suggested and applythe several approaches to defined the CE andgenerate and balance the knowledge network.
• Compensation : (Doherty and Noverd)compensation concept provide the firm with effectivetools to convert the general and long-term elementsof strategy into specific and routine action ofemployee. Compensation creates the positivity inthe firm because the compensation praises thecapable one who proves his or her skills andknowledge towards the firm goal.
• Risk taking : (Crowe and Horn (1967) define risk “asthe possibility that a sentient entity will incur loss”.Risk which directly attached with uncertainty andunpredictability which result in disappointing outcomeswhich influence the firm productivity, Sitkin and Pablo(1992). The overall definition of risk which is alsoknown as loss which means damage the firmeffectiveness and innovative creation it not only effectthe financial position of firm but also goal of the firm.
• Opportunity Recognition : (Boris Urban and EricWood (2013) opportunity recognition is mainlydepend on the firm and individual contribution.Recognition promoting and motivating the individualon the basis of performance and contribution ofskills. This article is study under research emergingmarket survey where 187 respondents wereexamined in the financial sector industry. From this
study they understand how the perception of eachindividual is different to take initiative. Recognitionwhich positively link with willingness to engage incorporate entrepreneurial initiatives.
• Pro-activeness : (Lumpkin and Dess (1996) whodefine that firm who implement pro-activeness inorganization they enjoy first mover advantage whichmeans who enter the market with the innovative andunique product with reasonable price and takinginitiative to get new opportunity to anticipate the firmproductivity for long period of time.
• Work life balance : (Estes and Michael, 2005)Thisliterature help to understand how the employees arebalance their work life and personal life which leadsto employee engagement in the corporate field. It isthe drivers of the employee engagement which showsthe relationship and involvement fit between thedifferent roles in person daily routine of life. Worklife balance usually considered the flexibility in thework and stress free personal life. (Hallberg et al,2007) define 2 results: first they identified aconnection between over work load and emotionaldrained. Secondly high workload related to the higherengagement.
• Leadership: (Peterson and Berger 1971) firstintroduced the corporate entrepreneurship strategyand leadership style which adopted and implementin the large firm to compete with the increasing levelof market growth and share and also turbulence andcompetitive advantage. Corporate strategy laterdefined as “an entrepreneurial behavior or set ofbehaviors with an organization-wide reliance andvision. Which continuously and purposefullyrejuvenate the firm and shapes the scope of itsoperations by recognizing and exploringentrepreneurial opportunities”(kuratko,2011, p.61)
• Autonomy : (Daniel Wehle et al., 2013) in thisliterature they defined the scope of autonomy insmall, medium, and high- tech firms. They dived intofour parts which is functional autonomy, decisionautonomy, structure autonomy and strategicautonomy. The main purpose of this literature isestablishing a level of autonomy which develop thedecision and control over the new business and alsoenhance the performance and responsibility towardsthe positive outcome.
Outcomes of Corporate Entrepreneurship• Commitment : (Lumpkin and Dess 1996) employee
commitment is a non- financial outcome whichprovides the satisfaction to the employee towardstheir work and firm goals. Commitment can beexplain as employee involvement in organizational
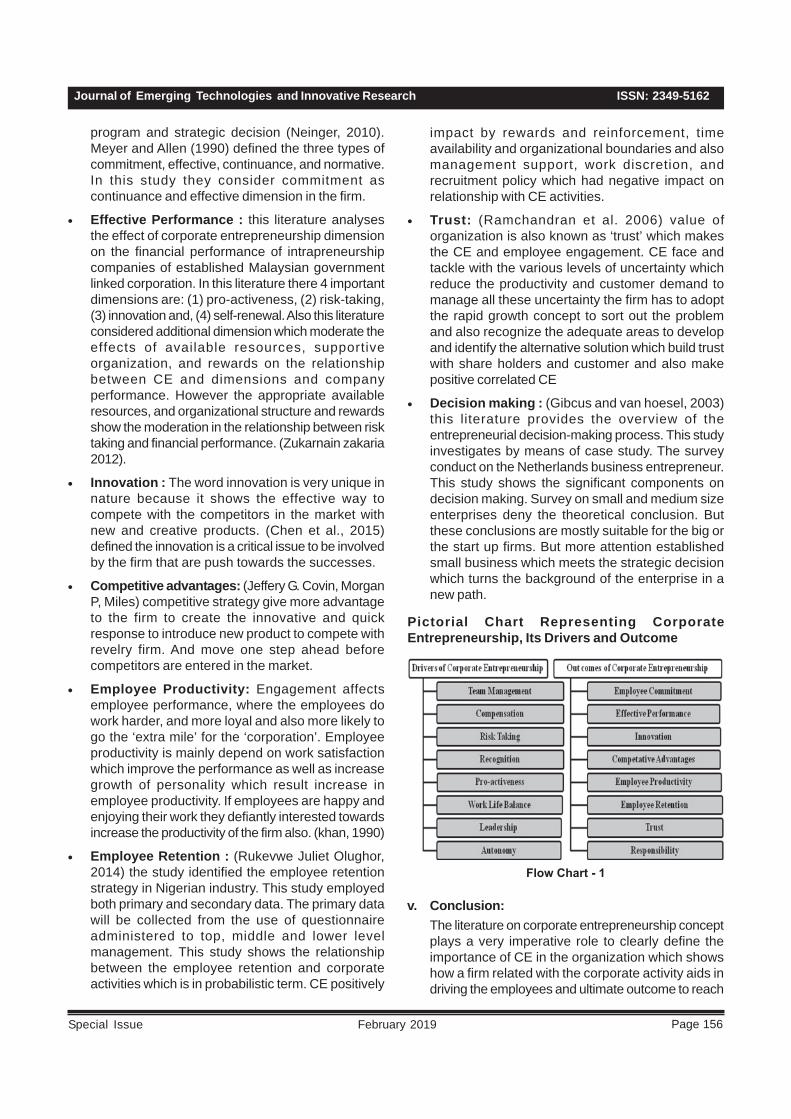
ISSN: 2349-5162Journal of Emerging Technologies and Innovative Research
Page 156February 2019Special Issue
program and strategic decision (Neinger, 2010).Meyer and Allen (1990) defined the three types ofcommitment, effective, continuance, and normative.In this study they consider commitment ascontinuance and effective dimension in the firm.
• Effective Performance : this literature analysesthe effect of corporate entrepreneurship dimensionon the financial performance of intrapreneurshipcompanies of established Malaysian governmentlinked corporation. In this literature there 4 importantdimensions are: (1) pro-activeness, (2) risk-taking,(3) innovation and, (4) self-renewal. Also this literatureconsidered additional dimension which moderate theeffects of available resources, supportiveorganization, and rewards on the relationshipbetween CE and dimensions and companyperformance. However the appropriate availableresources, and organizational structure and rewardsshow the moderation in the relationship between risktaking and financial performance. (Zukarnain zakaria2012).
• Innovation : The word innovation is very unique innature because it shows the effective way tocompete with the competitors in the market withnew and creative products. (Chen et al., 2015)defined the innovation is a critical issue to be involvedby the firm that are push towards the successes.
• Competitive advantages: (Jeffery G. Covin, MorganP, Miles) competitive strategy give more advantageto the firm to create the innovative and quickresponse to introduce new product to compete withrevelry firm. And move one step ahead beforecompetitors are entered in the market.
• Employee Productivity: Engagement affectsemployee performance, where the employees dowork harder, and more loyal and also more likely togo the ‘extra mile’ for the ‘corporation’. Employeeproductivity is mainly depend on work satisfactionwhich improve the performance as well as increasegrowth of personality which result increase inemployee productivity. If employees are happy andenjoying their work they defiantly interested towardsincrease the productivity of the firm also. (khan, 1990)
• Employee Retention : (Rukevwe Juliet Olughor,2014) the study identified the employee retentionstrategy in Nigerian industry. This study employedboth primary and secondary data. The primary datawill be collected from the use of questionnaireadministered to top, middle and lower levelmanagement. This study shows the relationshipbetween the employee retention and corporateactivities which is in probabilistic term. CE positively
impact by rewards and reinforcement, timeavailability and organizational boundaries and alsomanagement support, work discretion, andrecruitment policy which had negative impact onrelationship with CE activities.
• Trust: (Ramchandran et al. 2006) value oforganization is also known as ‘trust’ which makesthe CE and employee engagement. CE face andtackle with the various levels of uncertainty whichreduce the productivity and customer demand tomanage all these uncertainty the firm has to adoptthe rapid growth concept to sort out the problemand also recognize the adequate areas to developand identify the alternative solution which build trustwith share holders and customer and also makepositive correlated CE
• Decision making : (Gibcus and van hoesel, 2003)this literature provides the overview of theentrepreneurial decision-making process. This studyinvestigates by means of case study. The surveyconduct on the Netherlands business entrepreneur.This study shows the significant components ondecision making. Survey on small and medium sizeenterprises deny the theoretical conclusion. Butthese conclusions are mostly suitable for the big orthe start up firms. But more attention establishedsmall business which meets the strategic decisionwhich turns the background of the enterprise in anew path.
Pictorial Chart Representing CorporateEntrepreneurship, Its Drivers and Outcome
Flow Chart - 1
v. Conclusion:The literature on corporate entrepreneurship conceptplays a very imperative role to clearly define theimportance of CE in the organization which showshow a firm related with the corporate activity aids indriving the employees and ultimate outcome to reach

Page 157 P.E.S. College of Engineering, Mandya & Primax Foundation, Bengaluru
UGC ID No: 63975 Impact Factor - 5.87“Recent Trends in Business Management”
an competitive advantage through the employeeskills the effective leadership. The CE develops thesystem thinking to adopt the unique ideas andinnovative work culture which to improve theemployee relationship among the peer group withinthe organization and also in turn increases the firmproductivity. To conclude this paper made an attemptto understand the concept of CE, its drivers and itsoutcomes through literature review method.
Bibliography:• Abu shams Mohammad mhamudul hoque, uzairu
Muhammad gwadabe, MD atiqur rahaman, facultyof economics and science, (December 2017), ‘themediation of employee engagement’, ‘journal ofhumanities, CE upshot on innovation performance’,vol: No.6page 54-67/ www.icohlcb.com/ elSSN:01268147.
• Afework G. kassa, R satya raju, (June 2015),‘investigating the relationship between corporateentrepreneurship and employee engagement’, articlein ‘journal of entrepreneurship in emergingeconomics’, Vol: No 7(2):148-167.
• Alex martiz, (January 2005), article in‘entrepreneurial orientation in a franchise system’,with 526 reads, [email protected]
• Amarpreet Singh ghura, abhishek goel,‘organizational behavior’, (June 2018), ‘a study ofantecedents of CE and employee engagement aconceptual framework’, WPS NO 809/, http://facultylive.iimcal.ac.in
• Andrew Corbett, Jeffrey G. Covin, Gina C O’Connor,Christopher L. Tucci, published: (26/June/2013)journal of ‘product innovation management’, ‘articlein CE- state-of-the-art research and future researchagenda’, Vol: No 30, issue 5, , https://doi.org/10.1111/jpim.12031
• Boris urban, Eric wood, (July 2017) “innovating firmas CE”, European journal of innovation management,Vol. 20 issue: 4, pp. 532-556, , https://doi.org/10.1108
• Chandrasekhar kamatigam, (may 21, 2017), CE‘exploring the role of leaders’ supervision by meansof employee creativity and innovation, , http://www.duo.uio.no
• Covin, J.G. and D.P selvin, published (1989),‘strategic management of small firms in hostile andbenign environments’, journal in ‘strategicmanagement’, Vol: NO 10, 75-87.
• Dean A. shepherd, Trenton A. Williams, holgerpatzelt, (December 2014), ‘thinking about
entrepreneurial decision making’ ‘article in journalof management’ Vol: No 41(1):11-46.
• Didem ENGINOGLU, cenk lacin ARIKAN, 1/2016,journal in ‘crating a corporate entrepreneurshipstrategy for competitive advantage’ ‘article ininternational review of economic and management’,Vol: No 4, 14-28, , DOI:10.18825/irem.77735.
• Dr. Astrid heidemann Lassen, (2007), journal in CE:an empirical study of the importance of strategicconsiderations in the creation of radical innovation’,‘managing global transition’, Vol: N0 5(2): 109-131.
• E. Serra yurtkouru, begum serey teraman, (15September 2014), journal in ‘willingness to take riskand entrepreneurial intention of university students:an empirical study comparing private and stateuniversities’, ‘article in social and behavioral science’,volume 150, pages 834-840, https://doi.org./10.1016/j.sbspro.2014.09.092
• E. Serra yurtkoru, Ahmet Doganay, (September2014), journal in ‘exploring the antecedents ofentrepreneurial intention on Turkish universitystudents’, ‘article in social and behavioral science’,volume 150, pages 841-85015, https://doi.org./10.1016/j.sbspro.2014.09.092
• G.T. Lumpkin, Gregory G. dess, (2001), ‘journal ofbusiness venturing’, volume 16, 429-451, ,[email protected]
• Ghulam nabi, Francisco linan, (June 2011), journalin ‘graduate entrepreneurship in the developingworld: intentions, education and development’, ‘articlein education and training’, volume 53: 325-334.
• Haal berg UE, Schmidt WB (2006) ‘same same butdifferent? Can work engagement discriminate fromjob involvement and organizational commitment?European phychologist.volume:11(2), 119-127.
• Jaffrey G covin, Morgan P. miles, (January 1999),‘journal in CE and the pursuit of competitiveadvantage’, https://www.researchgate.net/publicatin/285255717
• Jerome gard, Daniel wehle, Guido H. baltes,Bernhard katzy, published: (July 2013). ‘Journal inan integrating model of autonomy in CE’, conference:international ICE conference on engineering,technology and innovation, DOI: 10.1109/ITMC.2013.735265 volume: 19.
• J.P.J. de jong, S.K. parker, S. wennekers, C. Wu,published: (march 2011), ‘journal in CE at individuallevel’, reference number H201108, page number: 27,[email protected].
ISSN: 2349-5162Journal of Emerging Technologies and Innovative Research
Page 158February 2019Special Issue
• Khan, W, (1990), ‘Psychological conditions ofpersonal 22 raja, U, and F Ntalianis, 2004, ‘the impactof personality on engagement and disengagementat work’, management journal, Vol 33, No 4, p 692.Vol 47, pp 350-367.
• Kuratko, D.F (2011). Entrepreneurship theory,process, and practices in the 21st century,‘international journal of entrepreneurship and smallbusiness’ (vol.13). https://doi.org/ 10.1504/ijesb.2011.040412.
• Olga belousova, benoit gaily, Olivier basso,published (2008-2009), ‘journal on an integrativemodel of corporate entrepreneurial behavior’, workingpaper 09/16.
• Petra gibcus, elissaveta ivanova, published (2003/01/01), article in “the decision-making entrepreneur’.
• Ramchandran, K. DEVARAJAN, TP and sougata,R. (2006) CE how? vikalpa: the journal for decisionmakers, volume 31(1),85-97
• Richard Peterson and Berger, D.G (1971), journal in‘entrepreneurship in organization: evidence from thepopular music industry administrative sciencequarterly’, volume No 16(1), 97. https://doi.org/10.2307/2391293.
• Rukevwe Juliet olughor, (may 2014), ‘CE andemployee retention strategies in Nigeriantelecommunication industry’, ‘European journal ofbusiness and social sc
• Sally sambrook, Clair Roberts, (may 2005), ‘articlein CE and organizational learning: a review of theliterature and the development of a conceptualframework’, volume 14, issue 3, pages 141-155, ,https://doi.org/10.1002/jsc.716
• Shaker A. Zahra, Jeffrey G. covin, (January 1995),‘contextual influence on the CE-performancerelationship: a longitudinal analysis,’ ‘journal ofbusiness venturing’, volume 10, issue 1, , page 43-58, https://doi.org/10.1016/0883-9026(94)00004-E.
• Terrence, brown, and Davidson, per and wiklund,Johan (2001) an operationalisation of Stevenson’sconceptualization of entrepreneurship asopportunity-based firm behavior, ‘journal in strategicmanagement’, volume: 22(10):pp.953-968, http://eprints.qut.edu.au
• Tezcan kasmer sahin, tuncer asunakutlu,(September 2014), journal in ‘entrepreneurship in acultural context: a research on Turks in Bulgaria’,‘article in social and behavioral science’, volume:150, 15, pages 851-861, https://doi.org/10.1016/j.sbspro.2014.09.094.
• Zukarnain zakaria, jaizah Othman, sofianshamsuddin, Mohammad asmady shahadan,(November 2012), ‘the dimensions of CE and theperformance of established organization’, ACRN‘journal of entrepreneurship perspectives’, vol. 1, issue2, p. 111-131, ISSN 2224-9729.
Page 159 P.E.S. College of Engineering, Mandya & Primax Foundation, Bengaluru
UGC ID No: 63975 Impact Factor - 5.87“Recent Trends in Business Management”
1. MBA, PESCE, Mandya, Karanataka.2 . MBA, PESCE, Mandya, Karanataka.3 . Assistant Professor and Research Scholar, PESCE, Mandya, Karanataka.
A STUDY ON TREND ANALYSIS OF KEY SEGMENTS OFINDIAN AUTOMOBILE SECTOR AND ANALYZING THE FACTORS
AFFECTING THE PERFORMANCE OF AUTOMOBILE SECTOR IN INDIA
IntroductionIt was in 1897 when first car ran on Indian roads. Thehistory says that Indian Auto industry emerged in 1940swhen Hindustan Motors was launched. Later competitorslike Premier, Chrysler, Dodge, Fiat, Mahindra andMahindra entered the sector. After independence, theGovernment of India and the private sector launchedefforts to create an automotive-component manufacturingindustry to supply to the automobile industry. Later soonIndian auto sector started growing at a rapid pace. Indianautomobile industry went aboard on a new journey in1991 with deli censing of the sector and subsequentopening up for 100 percent FDI through automatic route.Now, Indian auto sector has become the 4th largest inthe world with the growth rate of 9.5% in terms of sales.The market size of Indian auto sector is growing at arate of 7% on an average. India is also a prominentexporter with the growth rate in exports standing atCAGR 6.86% and expected growth rate (CAGR) of 3.05%during 2016-2026. It is also expected that Indian twoand three wheeler segment market will be the leadingmarket in the world by 2020. The government of Indiaalso aims to develop India as a global manufacturingcentre and an R&D hub.
Indian Auto Sector: An overviewThe sector has widened with its various types of vehicles.It has passenger cars, commercial vehicles, threewheelers and two wheelers. 25.3 million Automobilesproduced in FY17. Domestic automobile productionincreased at 7.08 per cent CAGR between FY13-18 with29.07
Raghavendra M1 Mahendrakumar N2 Chandrika R3
AbstractIndian automobile industry is the 4th largest in the world with the growth rate of 9.5% in terms of sales. The market sizeof Indian auto sector is growing at a rate of 7% on an average. India is also a prominent exporter with the growth ratein exports standing at CAGR 6.86% and expected growth rate (CAGR) of 3.05% during 2016-2026. It is also expectedthat Indian two and three wheeler segment market will be the leading market in the world by 2020. The governmentof India allowed 100% FDI in the auto sector under automatic route. The government of India also aims to developIndia as a global manufacturing centre and an R&D hub. In this background, the paper is structured to analyze thetrend of selected key economic factors of Indian automobile industry at first stage and analyses the effect of selectedmacro economic factors on the performance of the auto sector in India.
Keywords: Automobile industry, economic performance, trend, Auto Index, etc
million vehicles expected to get manufactured in thecountry in FY18. Overall domestic automobiles salesincreased at 7.01 per cent CAGR between FY13-18.Sales of electric two-wheelers are estimated to havecrossed 55,000 vehicles in 2017-18. In order to keep upwith the growing demand, several auto makers havestarted investing heavily in various segments of theindustry during the last few months. The industry hasattracted Foreign Direct Investment (FDI) worth US$19.29 billion during the period April 2000 to June 2018,according to data released by Department of IndustrialPolicy and Promotion (DIPP). The industry also providesgreat opportunities for investment and direct and indirectemployment to skilled and unskilled labour. Indianautomotive industry (including component manufacturing)is expected to reach Rs 16.16-18.18 trillion (US$ 251.4-282.8 billion) by 2026. Two-wheelers are expected togrow 9 per cent in 2018.
In the past few years, the production and managementsystems in the India automobiles industry have beenrevolutionaries. The important growth drivers are roadinfrastructure development, increase in per capitaincome, cost effectiveness, availability of skilled andqualified engineers, R&D and innovations, urbanizationchanges, growing middle and working class people,availability of cheaper and easier finance, favorable Govt.policies, growing finance industry, etc. India is the largestbase to export compact cars to Europe. Moreover, hybridand electronic vehicles are new developments on theautomobile canvas and India is one of the key marketsfor them. Global and Indian manufacturers are focusing
ISSN: 2349-5162Journal of Emerging Technologies and Innovative Research
Page 160February 2019Special Issue
their efforts to develop innovative products, technologiesand supply chains.
Some of the recent initiatives taken by the Governmentof India are – Under NATRiP, the Government of India isplanning to set up R&D centres at a total cost of US$388.5 million to enable the industry to be on par withglobal standards; The Ministry of Heavy Industries,Government of India has shortlisted 11 cities in the countryfor introduction of electric vehicles (EVs) in their publictransport systems under the FAME (Faster Adoption andManufacturing of (Hybrid) and Electric Vehicles in India)scheme. The government will also set up incubationcentre for start-ups working in electric vehicles space.
In this background the paper aims to analyze the trendof selected economic variables/factors of Indianautomobile sector.
Review of LiteratureIn this section, literatures on Indian auto sector, itsevolution, growth and road map are covered to getbroader view on it. Jyoti Pradhan (2013) opinions thatThe role of Industry will primarily be in designing andmanufacturing products of world-class qualityestablishing cost competitiveness and improvingproductivity in labour and in capital. With a combinedeffort of manufacturers and conducive Governmentalpolicies, the Indian Automotive industry will emerge asthe destination of choice in the world for design andmanufacturing of automobiles. Sarbapriya Ray (2012)tried to examine the trends in capacity utilization in theIndian automobile sector at aggregate level during postliberalized economic scenario. It was found that growthrate of capacity utilization was not uniform over yearsduring our study period; annual average growth rate ofcapacity output shows steep upward trend but actualoutput grows at a much slower rate than capacity output;the trend in capacity expansion reflects that capacityexpanded more rapidly in post-reform period. Indian AutoIndustry is likely to retain low cost advantage for asizeable period. Attractive collaboration opportunitiesbetween Indian CV industry / Auto componentmanufacturing with global OEMs and the Supply Chainmajors are being noticed. Therefore, there is a greatopportunity to associate and use India’s competitiveadvantages for sourcing and setting up collaborativeoperations which is a Win-Win opportunity – both forIndian Commercial vehicle industry and the globalcounterparts. Walmik Kachru Sarwade (2015) arguedthat the Indian auto market is still untapped, the majorityof the people in country, don’t own a four wheeler, andall the major auto companies are trying to increase theirsales by several moves. Like TATA has launched NANO,the people’s car and now TATA Motors is also planningto come up with an electric car as well as hybrid car. By
analyzing the current trend of Indian Economy andAutomobile Industry we can say that being a developingeconomy there is lot of scope for growth and this industrystill have to cross many levels so there is hugeopportunities to invest in and this is proving as moreand more foreign companies setting up there venturesin India. Rekha Melwani (2017) analyzed the exportperformance of Indian Automobile Industry in varioussegments for the study period and forecast the trendvalues for the next three financial years. The forecasttrend values showed that the exports in the all thesegments viz, personal vehicles, commercial vehicles,two wheelers and three wheelers will be increasing infuture. Krishnaveni (2015) expressed that the industryhas recorded phenomenon growth during the last decade.A market trend is growing at a faster rate. The openingof the Indian automobile market for foreign companiesthe competition is expected to enhance further. Theopportunities can be grabbed through the diversificationof export basket in untouched foreign destinations. Thusstrict quality standards, services and use of latesttechnology can provide an edge over competitors acrossthe globe. Mukesh (2013) has said that the foreignersare green-eyed in the performance of the Indianautomobile industry. The industry has shown a robustgrowth of 23% in the financial year 2006-07 after a flatgrowth in the previous year. The future of the industry isin safe custody of the massive middle-class populationin India. The Indian middle-class population would growto 300 million people by 2009. Passenger cars in Indiaare projected to double to 2 million units by 2010. By2030, India would be the biggest car market after theUS and China.
Research MethodologyThe study undertaken is an analytical study, requiringsecondary data on production, turnover, market share,domestic sales, BSE’s AUTO Index and exports ofvarious categories of vehicles. The data is majorlysourced from Society of Indian AutomobileManufacturers (SAIM). To analyze the data, linear trendmodel is used. Trend estimation is a statisticaltechnique to aid interpretation of data. When a series ofmeasurements of a process are treated as a time series,trend estimation can be used to make and justifystatements about tendencies in the data, by relatingthe measurements to the times at which they occurred.This model can then be used to describe the behavior ofthe observed data, without explaining it. When decidedto fit the straight line trend fit for the data, least squarelinear model was chosen, this method minimizes thesum of the squared errors in the data series y.
The linear trend line is defined by-ŷ ∝= + βχ
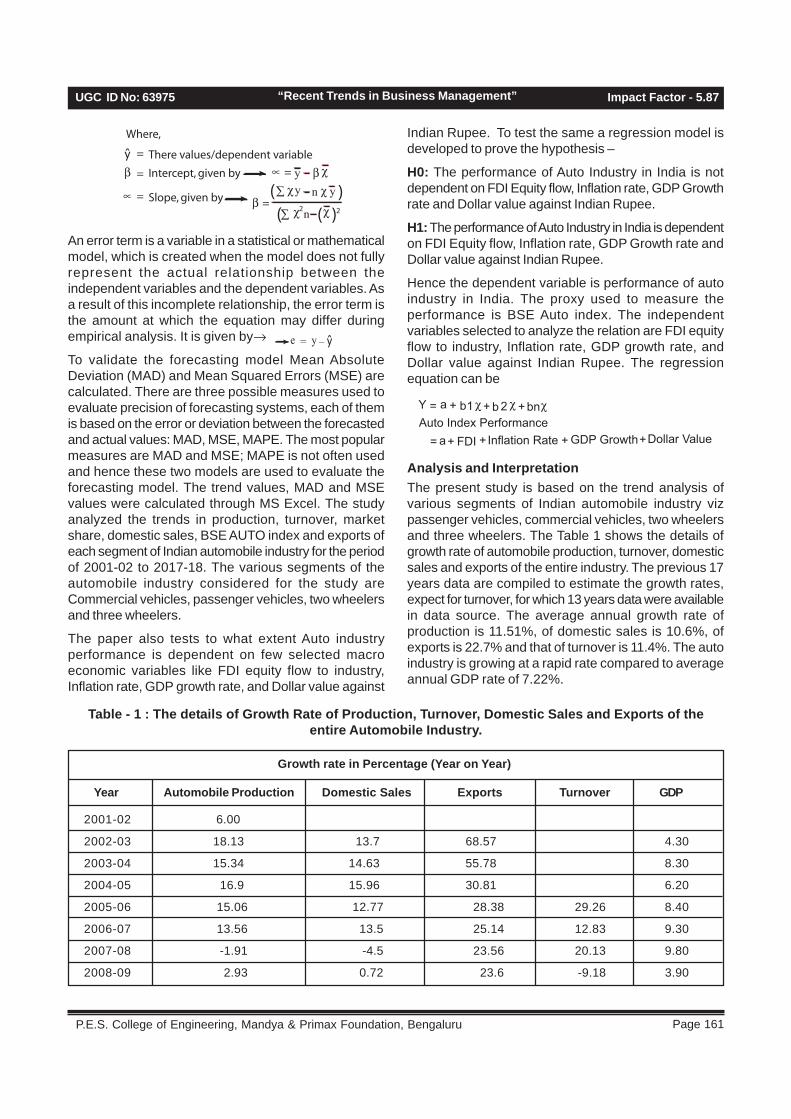
Page 161 P.E.S. College of Engineering, Mandya & Primax Foundation, Bengaluru
UGC ID No: 63975 Impact Factor - 5.87“Recent Trends in Business Management”
Where,
=
=
=
There values/dependent variable
Intercept, given by
Slope, given by∝
ŷβ
=β)( n∑ y yχ χ
)( (n 22∑ χ χ
= y β χ∝
An error term is a variable in a statistical or mathematicalmodel, which is created when the model does not fullyrepresent the actual relationship between theindependent variables and the dependent variables. Asa result of this incomplete relationship, the error term isthe amount at which the equation may differ duringempirical analysis. It is given by→
To validate the forecasting model Mean AbsoluteDeviation (MAD) and Mean Squared Errors (MSE) arecalculated. There are three possible measures used toevaluate precision of forecasting systems, each of themis based on the error or deviation between the forecastedand actual values: MAD, MSE, MAPE. The most popularmeasures are MAD and MSE; MAPE is not often usedand hence these two models are used to evaluate theforecasting model. The trend values, MAD and MSEvalues were calculated through MS Excel. The studyanalyzed the trends in production, turnover, marketshare, domestic sales, BSE AUTO index and exports ofeach segment of Indian automobile industry for the periodof 2001-02 to 2017-18. The various segments of theautomobile industry considered for the study areCommercial vehicles, passenger vehicles, two wheelersand three wheelers.
The paper also tests to what extent Auto industryperformance is dependent on few selected macroeconomic variables like FDI equity flow to industry,Inflation rate, GDP growth rate, and Dollar value against
ŷye _=
Y 1b b bn= + +2Auto Index Performance
+a
= Dollar ValueInflation Rate GDP Growth FDI ++ ++a
χ χ χ
Analysis and InterpretationThe present study is based on the trend analysis ofvarious segments of Indian automobile industry vizpassenger vehicles, commercial vehicles, two wheelersand three wheelers. The Table 1 shows the details ofgrowth rate of automobile production, turnover, domesticsales and exports of the entire industry. The previous 17years data are compiled to estimate the growth rates,expect for turnover, for which 13 years data were availablein data source. The average annual growth rate ofproduction is 11.51%, of domestic sales is 10.6%, ofexports is 22.7% and that of turnover is 11.4%. The autoindustry is growing at a rapid rate compared to averageannual GDP rate of 7.22%.
Indian Rupee. To test the same a regression model isdeveloped to prove the hypothesis –
H0: The performance of Auto Industry in India is notdependent on FDI Equity flow, Inflation rate, GDP Growthrate and Dollar value against Indian Rupee.
H1: The performance of Auto Industry in India is dependenton FDI Equity flow, Inflation rate, GDP Growth rate andDollar value against Indian Rupee.
Hence the dependent variable is performance of autoindustry in India. The proxy used to measure theperformance is BSE Auto index. The independentvariables selected to analyze the relation are FDI equityflow to industry, Inflation rate, GDP growth rate, andDollar value against Indian Rupee. The regressionequation can be
Table - 1 : The details of Growth Rate of Production, Turnover, Domestic Sales and Exports of theentire Automobile Industry.
Year Automobile Production Domestic Sales Exports Turnover GDP
2001-02 6.00
2002-03 18.13 13.7 68.57 4.30
2003-04 15.34 14.63 55.78 8.30
2004-05 16.9 15.96 30.81 6.20
2005-06 15.06 12.77 28.38 29.26 8.40
2006-07 13.56 13.5 25.14 12.83 9.30
2007-08 -1.91 -4.5 23.56 20.13 9.80
2008-09 2.93 0.72 23.6 -9.18 3.90
Growth rate in Percentage (Year on Year)

ISSN: 2349-5162Journal of Emerging Technologies and Innovative Research
Page 162February 2019Special Issue
2009-10 25.82 26.44 17.89 30.21 8.50
2010-11 27.28 25.91 28.57 35.31 10.30
2011-12 13.91 12.24 25.44 13.11 6.60
2012-13 1.2 2.4 -0.38 2.03 5.46
2013-14 4.24 3.54 7.3 -18.33 6.39
2014-15 8.64 7.06 14.88 6.7 7.41
2015-16 2.82 3.78 1.96 8.41 8.16
2016-17 5.47 6.81 -4.51 6.04 7.11
2017-18 14.78 14.23 16.12 6.68
Annual 11.51 10.6 22.7 11.4 7.22
Source: Author’s own calculations based on actual values sourced from SAIM
Gross Turnover of the Automobile Manufacturers in India (In USD Million)This part of the section deals with trend analysis. The Table 2 gives the details of % Growth and Cumulative Growthof segment wise Gross Turnover of the Automobile manufacturers in India. As one can observe passenger vehiclesProduction is increasing in India and has a cumulative growth rate of 137% from past 12 years. Due to unavailabilityof data, all 17 years is not considered for analysis. Latest year under study (2017-18) data is also not available inreliable source like SAIM. Hence it is ignored while analyzing the trend, which is one of the limitations of the study.
Table - 2: The details of % Growth and Cumulative Growth of segment wise Gross Turnover of theAutomobile manufacturers in India
Year % Growth rate Cumulative Growth rate
2005-06 29 29
2006-07 13 42
2007-08 20 62
2008-09 -9 53
2009-10 30 83
2010-11 35 119
2011-12 13 132
2012-13 2 134
2013-14 -18 115
2014-15 7 122
2015-16 8 130
2016-17 6 137
2017-18 -- --
% Growth and Cumulative Growth of segment wise Gross Turnover of the Automobile manufacturers in India
Source: Author’s own calculations based on actual values sourced from SAIM
The section shows figures and charts of selected variables to analyze the trend. The first variable considered toanalyze the trend is Gross turnover (in USD Million) of the automobile manufacturers in India. The Figure 1 belowshows actual and linear trend values. The trend line is
36.14 + 3.84=ŷ χ+= βŷ χ∝
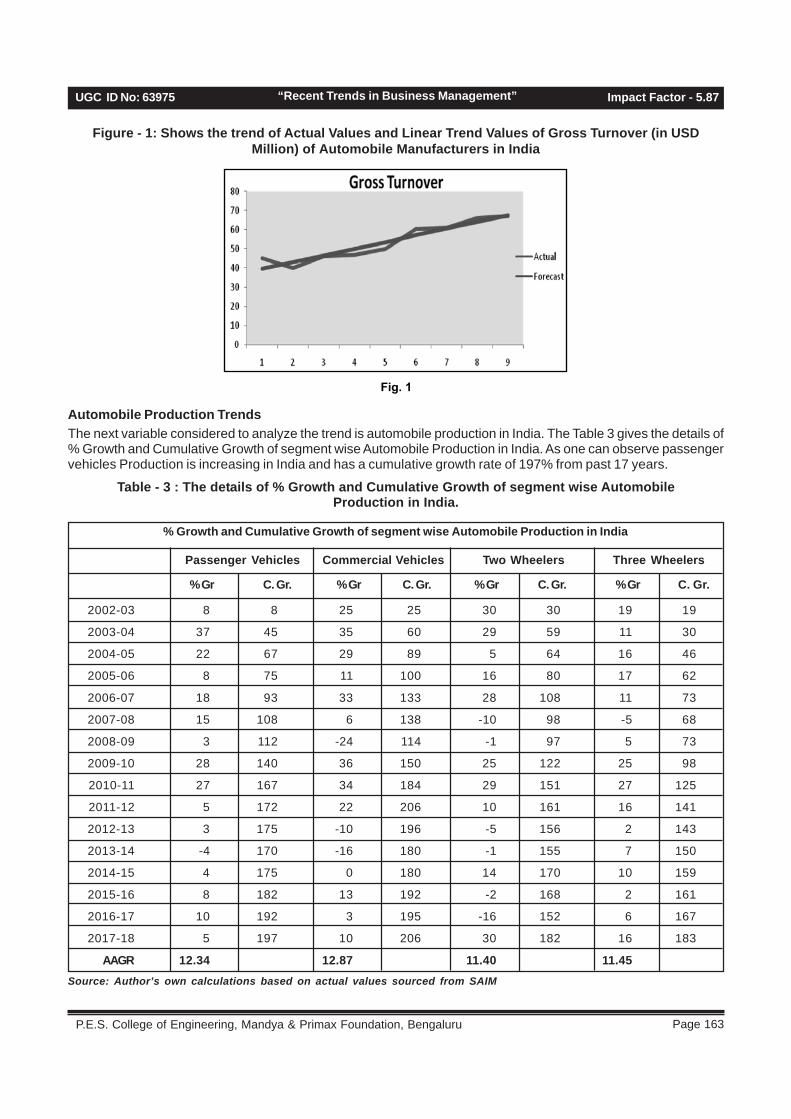
Page 163 P.E.S. College of Engineering, Mandya & Primax Foundation, Bengaluru
UGC ID No: 63975 Impact Factor - 5.87“Recent Trends in Business Management”
Figure - 1: Shows the trend of Actual Values and Linear Trend Values of Gross Turnover (in USDMillion) of Automobile Manufacturers in India
Automobile Production TrendsThe next variable considered to analyze the trend is automobile production in India. The Table 3 gives the details of% Growth and Cumulative Growth of segment wise Automobile Production in India. As one can observe passengervehicles Production is increasing in India and has a cumulative growth rate of 197% from past 17 years.
Table - 3 : The details of % Growth and Cumulative Growth of segment wise AutomobileProduction in India.
Fig. 1
Source: Author’s own calculations based on actual values sourced from SAIM
% Growth and Cumulative Growth of segment wise Automobile Production in India
Passenger Vehicles Commercial Vehicles Three WheelersTwo Wheelers
% Gr C. Gr. % Gr C. Gr. % Gr C. Gr. % Gr C. Gr.
2002-03 8 8 25 25 30 30 19 19
2003-04 37 45 35 60 29 59 11 30
2004-05 22 67 29 89 5 64 16 46
2005-06 8 75 11 100 16 80 17 62
2006-07 18 93 33 133 28 108 11 73
2007-08 15 108 6 138 -10 98 -5 68
2008-09 3 112 -24 114 -1 97 5 73
2009-10 28 140 36 150 25 122 25 98
2010-11 27 167 34 184 29 151 27 125
2011-12 5 172 22 206 10 161 16 141
2012-13 3 175 -10 196 -5 156 2 143
2013-14 -4 170 -16 180 -1 155 7 150
2014-15 4 175 0 180 14 170 10 159
2015-16 8 182 13 192 -2 168 2 161
2016-17 10 192 3 195 -16 152 6 167
2017-18 5 197 10 206 30 182 16 183
AAGR 12.34 12.87 11.40 11.45

ISSN: 2349-5162Journal of Emerging Technologies and Innovative Research
Page 164February 2019Special Issue
2434455.67 + 1470536. 41χ
=
=
+y
y
∝ β χ
Figure 2 : Shows the Actual Values and Linear Trend Values of Automobile Production in India
Fig. 2
Automobile Domestic Sales TrendsAnother factor under study is Domestic sales trend of Indian Automobile sector. The Table 4 gives the details of %Growth and Cumulative Growth of segment wise Automobile domestic sales in India. As one can observe passengervehicles domestic sales is increasing in India and has a cumulative growth rate of 173% from past 17 years.
Table - 4: The details of % Growth and Cumulative Growth of segment wise Automobile domestic salesin India.
The Figure 2 below gives the details of linear trend values. The trend line is-
2002-03 5 5 30 30 16 16 14 14
2003-04 28 32 36 66 23 38 11 26
2004-05 18 50 22 89 8 47 16 42
2005-06 8 58 10 99 17 64 14 55
2006-07 21 78 33 132 12 76 11 67
2007-08 12 91 5 137 -10 66 -8 59
2008-09 0 91 -22 116 -4 62 3 62
2009-10 26 117 39 154 26 88 26 88
2010-11 28 145 29 183 19 107 26 113
2011-12 5 149 18 201 -2 105 14 127
2012-13 2 151 -2 199 5 110 3 130
2013-14 -6 145 -20 179 -11 99 7 137
% Growth and Cumulative Growth of segment wise Automobile Domestic sale in India
Passenger Vehicles Commercial Vehicles Three WheelersTwo Wheelers
% Gr C. Gr. % Gr C. Gr. % Gr C. Gr. % Gr C. Gr.

Page 165 P.E.S. College of Engineering, Mandya & Primax Foundation, Bengaluru
UGC ID No: 63975 Impact Factor - 5.87“Recent Trends in Business Management”
2014-15 4 149 -3 176 11 110 8 145
2015-16 7 156 12 187 1 111 3 148
2016-17 9 166 4 192 -5 106 7 155
2017-18 8 173 20 211 24 130 15 170
Average Annual 10.84 13.22 8.14 10.62Growth Rate
Source: Author’s own calculations based on actual values sourced from SAIM
The Figure 3 below gives the details of linear trend values. The trend line is
χ= 2815178.52 + 1207909.69
= +β∝ χ
y
y
Figure 3 : Shows the Actual Values and Linear Trend Values of Automobile Domestic sales in India
Fig. 3
Automobile Export sales trendAnother factor under study is Export sales trend of2w Indian Automobile sector. The Table 5 gives the details of %Growth and Cumulative Growth of segment wise Automobile Export sales in India. As one can observe passengervehicles Export sales is increasing in India and has a cumulative growth rate of 322% from past 16 years. But lastyear passenger vehicle export sales are decreasing by 2 %.
Table - 5 : The details of % Growth and Cumulative Growth of segment wise Automobile Export sales inIndia.
2002-03 41 41 3 3 180 180 72 72
2003-04 78 120 42 45 57 238 48 120
2004-05 27 147 72 117 -2 236 38 158
2005-06 6 153 36 153 15 251 40 198
2006-07 11 164 23 175 87 338 21 219
2007-08 15 179 19 194 -2 336 32 251
% Growth and Cumulative Growth of segment wise Automobile Export sale in India
Passenger Vehicles Commercial Vehicles Three WheelersTwo Wheelers
% Gr C. Gr. % Gr C. Gr. % Gr C. Gr. % Gr C. Gr.
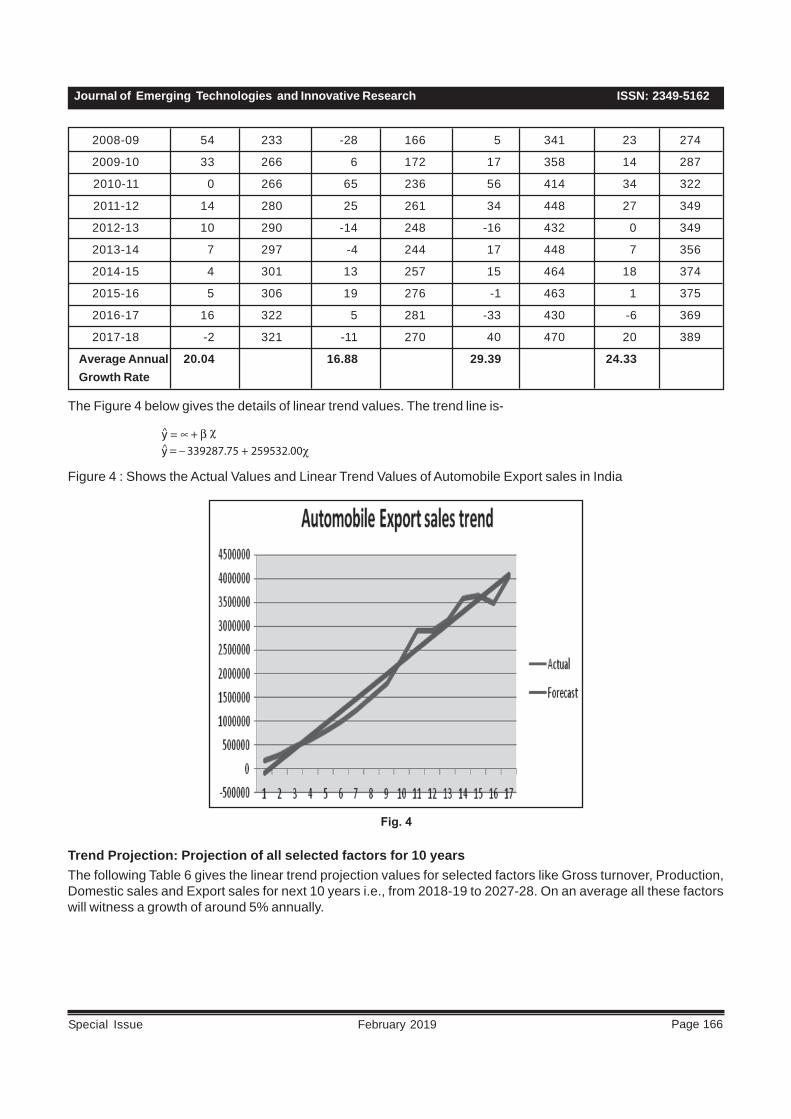
ISSN: 2349-5162Journal of Emerging Technologies and Innovative Research
Page 166February 2019Special Issue
2008-09 54 233 -28 166 5 341 23 274
2009-10 33 266 6 172 17 358 14 287
2010-11 0 266 65 236 56 414 34 322
2011-12 14 280 25 261 34 448 27 349
2012-13 10 290 -14 248 -16 432 0 349
2013-14 7 297 -4 244 17 448 7 356
2014-15 4 301 13 257 15 464 18 374
2015-16 5 306 19 276 -1 463 1 375
2016-17 16 322 5 281 -33 430 -6 369
2017-18 -2 321 -11 270 40 470 20 389
Average Annual 20.04 16.88 29.39 24.33Growth Rate
The Figure 4 below gives the details of linear trend values. The trend line is-
339287.75 + 259532.00χ+
_β∝ χ=
=
yy
Figure 4 : Shows the Actual Values and Linear Trend Values of Automobile Export sales in India
Fig. 4
Trend Projection: Projection of all selected factors for 10 yearsThe following Table 6 gives the linear trend projection values for selected factors like Gross turnover, Production,Domestic sales and Export sales for next 10 years i.e., from 2018-19 to 2027-28. On an average all these factorswill witness a growth of around 5% annually.
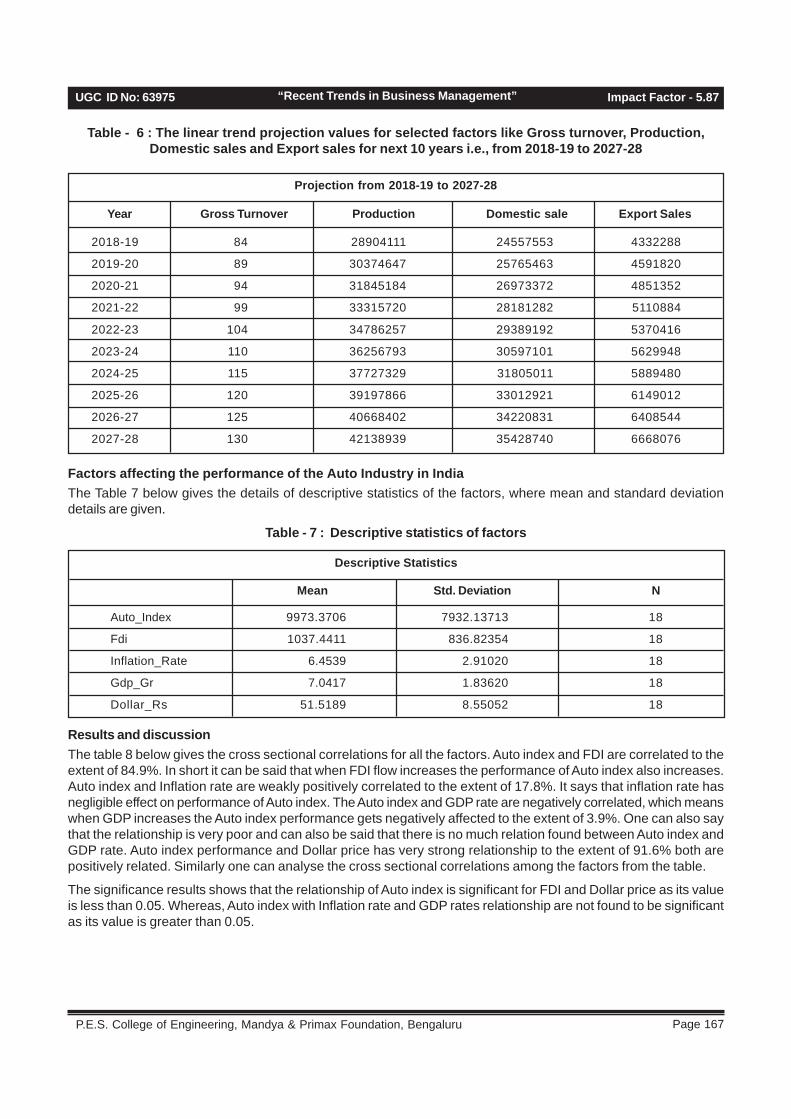
Page 167 P.E.S. College of Engineering, Mandya & Primax Foundation, Bengaluru
UGC ID No: 63975 Impact Factor - 5.87“Recent Trends in Business Management”
Table - 6 : The linear trend projection values for selected factors like Gross turnover, Production,Domestic sales and Export sales for next 10 years i.e., from 2018-19 to 2027-28
2018-19 84 28904111 24557553 4332288
2019-20 89 30374647 25765463 4591820
2020-21 94 31845184 26973372 4851352
2021-22 99 33315720 28181282 5110884
2022-23 104 34786257 29389192 5370416
2023-24 110 36256793 30597101 5629948
2024-25 115 37727329 31805011 5889480
2025-26 120 39197866 33012921 6149012
2026-27 125 40668402 34220831 6408544
2027-28 130 42138939 35428740 6668076
Projection from 2018-19 to 2027-28
Year Gross Turnover Production Domestic sale Export Sales
Factors affecting the performance of the Auto Industry in IndiaThe Table 7 below gives the details of descriptive statistics of the factors, where mean and standard deviationdetails are given.
Table - 7 : Descriptive statistics of factors
Auto_Index 9973.3706 7932.13713 18
Fdi 1037.4411 836.82354 18
Inflation_Rate 6.4539 2.91020 18
Gdp_Gr 7.0417 1.83620 18
Dollar_Rs 51.5189 8.55052 18
Descriptive Statistics
Mean Std. Deviation N
Results and discussionThe table 8 below gives the cross sectional correlations for all the factors. Auto index and FDI are correlated to theextent of 84.9%. In short it can be said that when FDI flow increases the performance of Auto index also increases.Auto index and Inflation rate are weakly positively correlated to the extent of 17.8%. It says that inflation rate hasnegligible effect on performance of Auto index. The Auto index and GDP rate are negatively correlated, which meanswhen GDP increases the Auto index performance gets negatively affected to the extent of 3.9%. One can also saythat the relationship is very poor and can also be said that there is no much relation found between Auto index andGDP rate. Auto index performance and Dollar price has very strong relationship to the extent of 91.6% both arepositively related. Similarly one can analyse the cross sectional correlations among the factors from the table.
The significance results shows that the relationship of Auto index is significant for FDI and Dollar price as its valueis less than 0.05. Whereas, Auto index with Inflation rate and GDP rates relationship are not found to be significantas its value is greater than 0.05.

ISSN: 2349-5162Journal of Emerging Technologies and Innovative Research
Page 168February 2019Special Issue
Table 8: Correlation analysis results
From the Table 9 it can be inferred that the R value represents the simple correlation and is 0.961 (the "R" Column),which indicates a high degree of positive correlation. The R2 value (the "R Square" column) indicates how much ofthe total variation in the dependent variable, Auto Index, can be explained by the independent variables, FDI, GDP,Inflation rate, Dollar value. In this case, 92.4% can be explained, which is very large. The Durbin-Watson explainswhether the model is a good fit. If its value is around 2, it can be said that the model is a good fit. Hence with thevalue of 2.216 we can say that the proposed model is a good fit.
Table - 9 : Summary of Model
Auto_Index 1.000 .849 .178 -.039 .916
Fdi .849 1.000 .317 -.067 .860
Inflation_Rate .178 .317 1.000 .010 .020
Gdp_Gr -.039 -.067 .010 1.000 -.286
Dollar_Rs .916 .860 .020 -.286 1.000
Auto_Index .240 .439 .000
Fdi .000 . .100 .396 .000
Inflation_Rate .240 .100 . .484 .468
Gdp_Gr .439 .396 .484 . .125
Dollar_Rs .000 .000 .468 .125 .
Correlations
Auto_Index Fdi Inflation_Rate Gdp_Gr Dollar_Rs
Pearson Correlation
Sig. (1-tailed)Auto_Index
1 .961a .924 .900 2503.50847 2.216
Model R R Square Std. Error of theEstimate
Model Summaryb
Durbin-WatsonAdjusted R Square
A. Predictors: (Constant), DOLLAR_RS, INFLATION_RATE, GDP_GR, FDI
B. Dependent Variable: AUTO_INDEX
The Table 10 below gives the ANOVA test results, which reports how well the regression equation fits the data (i.e.,predicts the dependent variable). This table indicates that the regression model predicts the dependent variablesignificantly well. This indicates the statistical significance of the regression model that was run. Here, p < 0.05,and indicates that, overall, the regression model statistically significantly predicts the outcome variable (i.e., it is agood fit for the data). Hence the null hypothesis (H0) shall be rejected and can be inferred that the performance ofAuto Industry in India is not dependent on FDI Equity flow, Inflation rate, GDP Growth rate and Dollar value againstIndian Rupee.
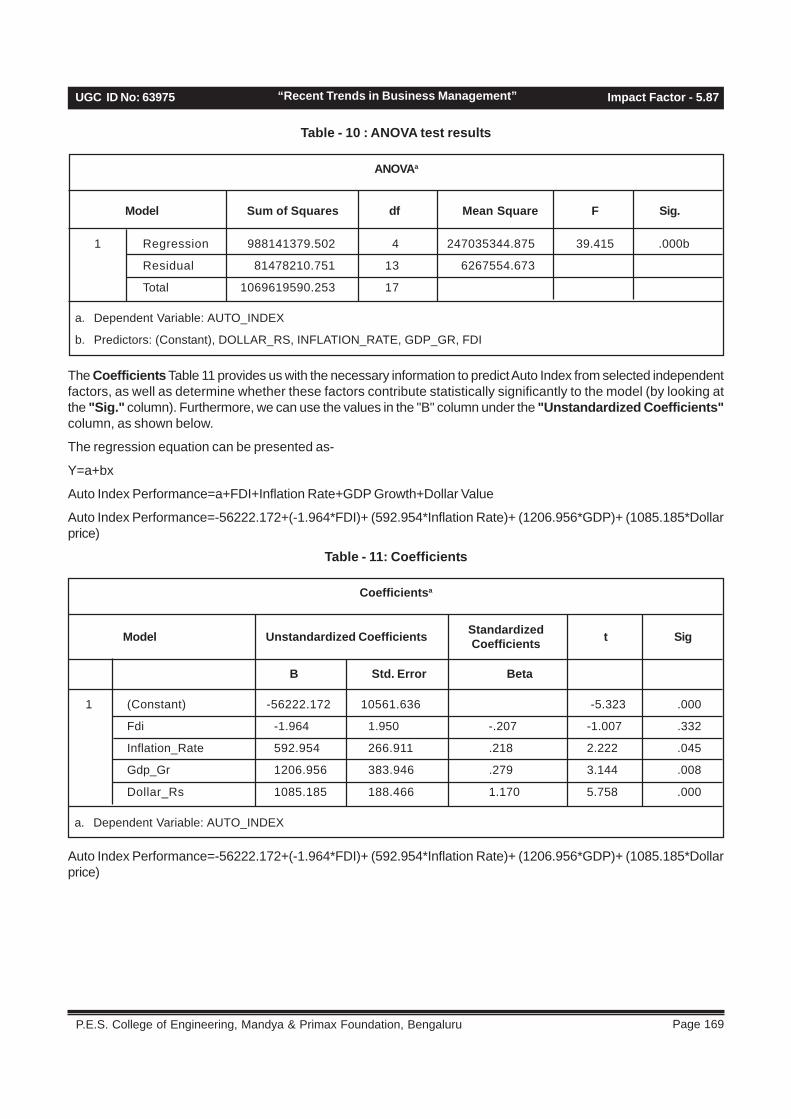
Page 169 P.E.S. College of Engineering, Mandya & Primax Foundation, Bengaluru
UGC ID No: 63975 Impact Factor - 5.87“Recent Trends in Business Management”
Table - 10 : ANOVA test results
1 Regression 988141379.502 4 247035344.875 39.415 .000b
Residual 81478210.751 13 6267554.673
Total 1069619590.253 17
ANOVAa
Model Sum of Squares df Mean Square F Sig.
a. Dependent Variable: AUTO_INDEX
b. Predictors: (Constant), DOLLAR_RS, INFLATION_RATE, GDP_GR, FDI
The Coefficients Table 11 provides us with the necessary information to predict Auto Index from selected independentfactors, as well as determine whether these factors contribute statistically significantly to the model (by looking atthe "Sig." column). Furthermore, we can use the values in the "B" column under the "Unstandardized Coefficients"column, as shown below.
The regression equation can be presented as-
Y=a+bx
Auto Index Performance=a+FDI+Inflation Rate+GDP Growth+Dollar Value
Auto Index Performance=-56222.172+(-1.964*FDI)+ (592.954*Inflation Rate)+ (1206.956*GDP)+ (1085.185*Dollarprice)
Table - 11: Coefficients
1 (Constant) -56222.172 10561.636 -5.323 .000
Fdi -1.964 1.950 -.207 -1.007 .332
Inflation_Rate 592.954 266.911 .218 2.222 .045
Gdp_Gr 1206.956 383.946 .279 3.144 .008
Dollar_Rs 1085.185 188.466 1.170 5.758 .000
Coefficientsa
a. Dependent Variable: AUTO_INDEX
Unstandardized Coefficients StandardizedCoefficientsModel t Sig
B Std. Error Beta
Auto Index Performance=-56222.172+(-1.964*FDI)+ (592.954*Inflation Rate)+ (1206.956*GDP)+ (1085.185*Dollarprice)

ISSN: 2349-5162Journal of Emerging Technologies and Innovative Research
Page 170February 2019Special Issue
ConclusionThe paper aimed to analyse the trend of importanteconomic performance indicators of Automobile industryin India. The trend analysis shows that the Gross turnover,Production, sales in domestic market and export saleshave been increasing over 17 years of period under study.The projections using linear trend model also estimatesthat these factors will have similar growth for next 10years of period. Hence one can be optimist over theindustry and its performance. The second stage of thestudy analyses the effect of few selected macroeconomic factors on performance of Auto sector. As aproxy to Auto sector performance, BSE Auto index isused and the regression results shows that the factorslike FDI flow, GDP growth rate, Dollar price and Inflationrates significantly influence the performance of the sector.
References
• Tharun Shastry.L, Jyoti Pradhan, “Indian ForeignTrade With Reference To Automobile Industry-AnAnalysis”, International Journal of Business andManagement Invention ISSN (Online): 2319 – 8028,ISSN (Print): 2319 – 801X www.ijbmi.org Volume 2Issue 9? September. 2013? PP.62-71
• Sarbapriya Ray, “Economic Performance of IndianAutomobile Industry: An Econometric Appraisal”,Business Intelligence Journal, Page no. 151-163,January, 2012 Vol.5 No.1
• Walmik Kachru Sarwade, “Evolution and Growth ofIndian Auto Industry”, Journal of ManagementResearch and Analysis, April - June 2015; 2(2):136-141
• Rekha Melwani, Manish Sitlani, “Export Performanceand Trends of Autombile Industry in India”, Prestigee-Journal of Management and Research, Volume 4,Issue 1 (April 2017), ISSN 2350-1316
• M Krishnaveni, R Vidya, “Growth of Indian AutomobileIndustry”, International Journal of Current Researchand Academic Review, ISSN: 2347-3215 Volume 3Number 2 (February-2015) pp. 110-118
• Mukesh R, “Performance of Indian AutomobileIndustry”, Eco sentiments Journal, Volume 1, Issue2, 2013
• Sakshi Modi, Dr Tapasya Jhulka, ‘Rising IndianAutomobile Industry: Looks do Matter!’, InternationalJournal of Bussiness Management, EconomicsResearch, Vol 3(3), 2012, PP 522-526, ISSN 2229-6247
• Anubha Srivastava, ‘A Comprehensive Study ofPerformance of Indian Automobile Industry - A stockMarket Perspective’, www.indiastat.com July -August, 2014.
• Maruti Vitthal Khaire, Raghuvir Singh, ‘Five InnovationInspirations from Indian Automobile Market’, IOSRJournal of Business and Management (IOSR-JBM)e-ISSN: 2278-487X, p-ISSN: 2319-7668. Volume 19,Issue 1. Ver. I (Jan. 2017), PP 10-18www.iosrjournals.org
• https://www.ibef.org/archives/industry/automobiles-reports/indian-automobiles-industry-analysis-september-2018
• http://www.siamindia.com/
Page 171 P.E.S. College of Engineering, Mandya & Primax Foundation, Bengaluru
UGC ID No: 63975 Impact Factor - 5.87“Recent Trends in Business Management”
A STUDY ON SIGNIFICANCE OF ELECTRIC VEHICLESIN INDIAN AUTOMOBILE INDUSTRY
IntroductionIndia is addicted to crude oil imports as she is not selfreliant in her oil production. She has 11 crude oil reserves,with estimation of 763.48 million tonnes of oil during 2015and which declined to 604.10 million tonnes during 2017.Domestic oil production trend shows her oil reservesare exhausting slowly; during FY 2016 India’s oilproduction was 0.74 million barrels per day (MBPD)which declined to 0.72 MBPD during FY 2017 and duringFY 2018 it still declined to 0.64 MBPD. India accountedfor 0.92% of world oil production. However, her annualconsumption stood at 4.00 MBPD of oil. India is expectedto account for almost one-third of the global growth inenergy demand by 2040. Nonetheless she is fulfillingthe growing oil demand by importing it from theorganization of the Petroleum Exporting Countries(OPEC). OPEC accounts for nearly 60% of world’sproven oil reserves & its exports represent 55% of theoil traded internationally. India imports 82% of its oilneeds and has worn the crown of being third largestimporter of crude oil after United States and China bysurpassing Japan in terms of oil imports multiple timesover the past few years. India’s appetite for crude oil isjust climbing along with her growing economy. Petroleumimports are nearly 30% (on an average) of India’s grossimports from almost a decade and the number is onlygrowing. The table below shows the details of production
Hemanth Gowda S M1 Vijayalakshmi D2 Chandrika R3
AbstractIndia is addicted to crude oil imports as she is not self reliant in her oil production. India is having a crown for beingthird largest oil consumer in the world. Petroleum imports are nearly 30% (on an average) of India’s gross imports fromalmost a decade and the number is only growing. This stress the Indian Rupee (INR) against the UD Dollar (USD $)and INR will depreciate further. This will have its impact on increasing deficit Balance of Trade in India and increase ininflation rate. As a matter of fact, when inflation rate rises, it will have direct impact on standard of living of people,industrial production, consumption, savings and investment done by people. This is one face of problems associatedwith Indian oil imports. On the other face of the coin, unlike Norway/Netherland, Indian automobile sector mainlyproduces and sells fossil fuel (particularly Petrol and Diesel) vehicles. It is also a major reason why Indian dependencyon oil imports is increasing. These vehicles cause high level of pollution in environment and affects sustainability. Inthis economic context it is significant to introduce electric vehicles in India. In this context, the paper is structured toanalyse the impact of oil imports on various macro economic factors to justify that it is the right time to plan forintroducing electric vehicles in India. The paper also covers the road map for Indian electric vehicle industry.
Keywords: Crude Oil, Electric Vehicles, Imports, Sustainability, etc
and imports of crude oil and petroleum products in India.It clearly shows that production is very negligiblecompared to imports of crude oil and POL products.This is evident that India is very much dependent onImports for its crude oil needs (Table - 1)
Petroleum imports are nearly 30% (on an average) ofIndia’s gross imports from almost a decade and thenumber is only growing. This stress the Indian Rupee(INR) against the UD Dollar (USD $) and INR willdepreciate further. This will have its impact on increasingdeficit Balance of Trade in India and increase in inflationrate. As a matter of fact, when inflation rate rises, it willhave direct impact on standard of living of people,industrial production, consumption, savings andinvestment done by people. This is one face of problemsassociated with Indian oil imports.
Transportation sector is completely dependent on crudeoil. Transport system in India consists of transport byland, water, and air. Railways and roads are the dominantmeans of transport carrying more than 95% of total trafficgenerated in the country. In all the three main ways oftransportation, Indian transport industry has majorlyfossil fuel vehicles. Transport sector is the majorconsumer of diesel accounting for 70% of the total dieselsales consumed by passenger vehicles, andcommercial transport vehicles. Petrol is almost entirely(99.6%) consumed by the transport sector. Therefore it
1 . MBA, PESCE, Mandya, Karnataka.2 . MBA, PESCE, Mandya, Karnataka.3 . Asst. Prof & Research Scholar, PESCE, Mandya, Karnataka.

ISSN: 2349-5162Journal of Emerging Technologies and Innovative Research
Page 172February 2019Special Issue
2007-08 34 150 122 22
2008-09 33 158 133 19
2009-10 33 186 159 15
2010-11 38 196 164 17
2011-12 38 204 172 16
2012-13 38 218 185 16
2013-14 38 221 189 17
2014-15 37 221 189 21
2015-16 37 232 203 29
2016-17 36 244 214 36
2017-18 36 254 220 36
Production And Imports of Crude Oil and Petroleum Products
(Million tonnes)
Production Imports
Crude oil POL products Crude oil POL productsYear
1 2 3 4 5
POL : Petroleum, oil and lubricants.
Note : Data for 2017-18 are Provisional. Crude oil production data for 2017-18 is target for the year.
Source: Ministry of Petroleum and Natural Gas, Government of India, PPAC.
is evident that Indian transportation sector demands large amount of fossil fuels. Because India is not self sufficientin production of such oil, she is dependent on imports.
Hence, on the other face of the coin, unlike Norway/Netherland, Indian automobile sector mainly produces and sellsfossil fuel (particularly Petrol and Diesel) vehicles. The automobile industry in India is currently rapidly growing withan annual production of over 4.6 million vehicles, with an annual growth rate of 10.5% and vehicle volume is expectedto rise greatly in the future. It is also a major reason why Indian dependency on oil imports is increasing asmentioned earlier. These vehicles cause high level of pollution in environment and affects sustainability.
In this economic and sustainability context it is significant to introduce electric vehicles in India. In this context, thepaper is structured to analyse the impact of oil imports on various macro economic factors to justify that it is theright time to plan for introducing electric vehicles in India. The paper also covers the road map for Indian electricvehicle industry.
ObjectivesThe paper aims to answer the following –• What is the trend of oil production and oil imports in India?• What is the effect of oil imports on few selected macro economic factors?• Whether transportation vehicles cause high pollution in India?• Is this the right time to introduce the electric vehicles to Indian automobile sector?• What is the road map for introducing the electric vehicles in Indian automobile sector?
Table - 1
Page 173 P.E.S. College of Engineering, Mandya & Primax Foundation, Bengaluru
UGC ID No: 63975 Impact Factor - 5.87“Recent Trends in Business Management”
Review of LiteraturesA lot of research work can be studied in to understandthe impact of crude oil imports on economic performanceof a country. The paper argues that there is a negativeimpact of crude oil import dependency on Indianeconomic performance and sustainable development. Inthis background it is also thought that it is a peak timefor our auto sector not just to think but to introduceelectric vehicles in our domestic transportation industry.Uma et al. (2013) argue that India is dependent onimported crude oil but not entirely about 1/4th of thenation’s requirements come from the fields within thecountry. To reduce dependence on crude oil imports Indiashould develop alternative sources of energy. Aparna(2013) said that if there is any positive change in thecrude oil price, it has an immediate negative impact onthe increment in the GDP and IIP whereas it affects theWPI positively. Any sudden change in the price of oilhas the ability to impact the industrial growth adversely.It also causes a very high spurt in the WPI. Altogether,change in oil price, WPI increase and declining IIP affectthe economy negatively and even if the impulse or shockis short term, it has a long lasting impact on the economy.Firdous A Wani et al. (2015) argued that the crude oilprices all across the globe have a significant impact onglobal economies directly or indirectly. However, theincrease in the crude oil prices results in increase inalmost all the consumable and non-consumablecommodities. Any positive change in the crude oil pricehas negative impact on the increment in GDP of a country.The Indian economy is not an exception to the impactof change in crude oil prices. In India the demand forpetroleum related products is increasing at a rapid pacewhich results in increase in crude oil imports. In case ofany increase in crude oil prices a shock or impulse isvisible which paves way for strengthening energy efficientmechanisms in order to reduce the dependency onpetroleum products. Priyanshi Gupta’s (2014) researchresults suggest that the maximum impact of oil pricefluctuations is felt on the price level and net exports.Given India’s high dependence on oil imports, India facesthe impact of imported inflation, which is the generalprice level rise in a country because of rise in prices ofimported commodities. For an expanding economy likeIndia, such vulnerability to oil price shocks is notsustainable and thus it becomes crucial to come upwith efforts to expedite the process of exploring domesticavenues and diversify its sources of oil supply. Further,there is an urgent need for development of non-conventional (including renewable) sources as asubstitute for conventional sources to meet the energyneeds. Energy subsidy reforms along with regulations,standards, and targets directing the efficient level ofutilization of oil as a fuel are important to reduce
dependence on oil imports. This applies to developedand developing nations alike. Eshita Gupta (2014)assesses the relative oil vulnerability of 26 net oil-importing countries for the year 2004 on the basis ofvarious indicators- the ratio of value of oil imports to grossdomestic product (GDP), oil consumption per unit of GDP,GDP per capita and oil share in total energy supply,ratio of domestic reserves to oil consumption, exposureto geopolitical oil market concentration risks asmeasured by net oil import dependence, diversificationof supply sources, political risk in oil-supplying countries,and market liquidity. The results show that there areconsiderable differences in the values of individualindicators of oil vulnerability and overall oil vulnerabilityindex among the countries (both inter and intraregional).Christini (1998) observed a very strong correlationbetween macroeconomic factors and oil prices. Kumarand Dash (2013) discusses about the potential needfor electric vehicles (EV), charging station (CS)infrastructure and its challenges for the Indian scenario.They found that the cost of fuel i.e. electricity for EVs is45% cheaper than petrol and diesel. But still it requiresa large charging station infrastructure to be installedthroughout the country before encouraging the societyfor adapting it. Government subsidy, public awareness,instant technical support and extended manufacturerwarranty are the key measures to attract Indiancustomers. Rokadiya and Bandivadekar (2016) saysit is important to understand that, from a consumerperspective, there is a difference between owning electric(and plug-in hybrid) and hybrid technologies. While hybridownership is similar in experience to owning aconventional internal combustion engine-basedtechnology, electric technologies call for a significantshift in driving habits. At the same time there is potentialto realign allocations to focus more on electrictechnologies compared with hybrid, particularly forpassenger cars, including increased emphasis onsupporting aspects such as creation of public andprivately owned charging infrastructure.
MethodologyThe study is an empirical analysis covering 10 years(from 2009 to 2018) data on various macro economicfactors like crude oil prices, petrol and diesel prices,import of crude oil and petroleum products, dollar valueagainst Indian Rupee, Indian inflation rate, India’s GDPrate, Exports of Indian auto sector, net balance ofpayment, etc.
The first part of the analysis focuses on finding therelationship between crude oil imports and Crude oilprices, FDI to auto sector, inflation rate, GDP rate,Balance of payment, Dollar value against Indian Rupee

ISSN: 2349-5162Journal of Emerging Technologies and Innovative Research
Page 174February 2019Special Issue
and Auto exports. The study expects to result in findinga strong positive relation among the above said variables.
When relation is found to be significant, the second partof the paper focuses on analyzing the rationality andsignificance of introducing the electric vehicles, giving aroad map for developing infrastructure needed to supportthe growth of electric vehicle industry.
To do so, the 10 years (from 2009 to 2018) data on variousmacro economic factors are collected from varioussecondary sources. To find the relationship among thevariables, correlation analysis using SPSS is done.Various journal papers are reviewed to draft the secondpart of the paper covering the rationality and road mapfor developing infrastructure needed to support the growthof electric vehicle industry.
Data AnalysisTrend of Crude oil Imports in IndiaThe Chart 1 below shows the trend of crude oil importsin India. The graph shows that Indian crude oil importsare constantly increasing. Indian crude oil imports haverisen by 53% cumulatively over our study period.Whereas, Indian production of crude oil has shown aflatter growth of 9% but its consumption has increasedby 79% over these period. The rate of growth ofconsumption of crude oil is very high compared to itsproduction in India. To fill the gap between the demand
Fig. 1
Mean Std. Deviation N
Crudeoil_Imports 205.0000 33.38662 10
Crudeoil_Price 82.2830 23.27222 10
Dollar_price 58.3590 7.69895 10
Inflation_rate 7.6400 3.20462 10
GDP_Rate 6.9230 1.38032 10
BOP 15734.9000 23926.85924 10
FDI 1652.5060 591.87180 10
Auto_Exports 2931070.3000 822489.95883 10
Respon
The Table below shows the relationship between the crude oil imports and GDP rate, inflation rate, dollar valueagainst Indian Rupee, balance of payments, FDI and auto exports. From the results of the correlation test, we canunderstand that Crudeoil imports have very strong positive relations with Dollar price against Indian Rupee (explainedto the extent of 83.8%) and Auto exports (explained to the extent of 92.3%). We can say that when India importsmore of crude oil, the Indian Rupee depreciates against UD Dollar where as Auto exports of Indian manufacturers’increases. These results are found to be significant as its sig. value is less than 0.05. As expected Crude oilimports affect Indian inflation rate. The results show that both are explained with negative relationship to the extentof 87.7%. This means that when Indian crude oil imports are increased, her inflation rate decreases. This is a
and domestic production, India is evident to be dependenton oil imports (Fig.1)
Relationship between the crude oil imports and fewselected economic factors
In this background the paper is trying to analyze theimpact of increasing crude oil dependency on othercountries (imports) on selected macro economic factors.The table below shows the descriptive statistics detailsof the variables selected (Table - 2)
(Table - 2)
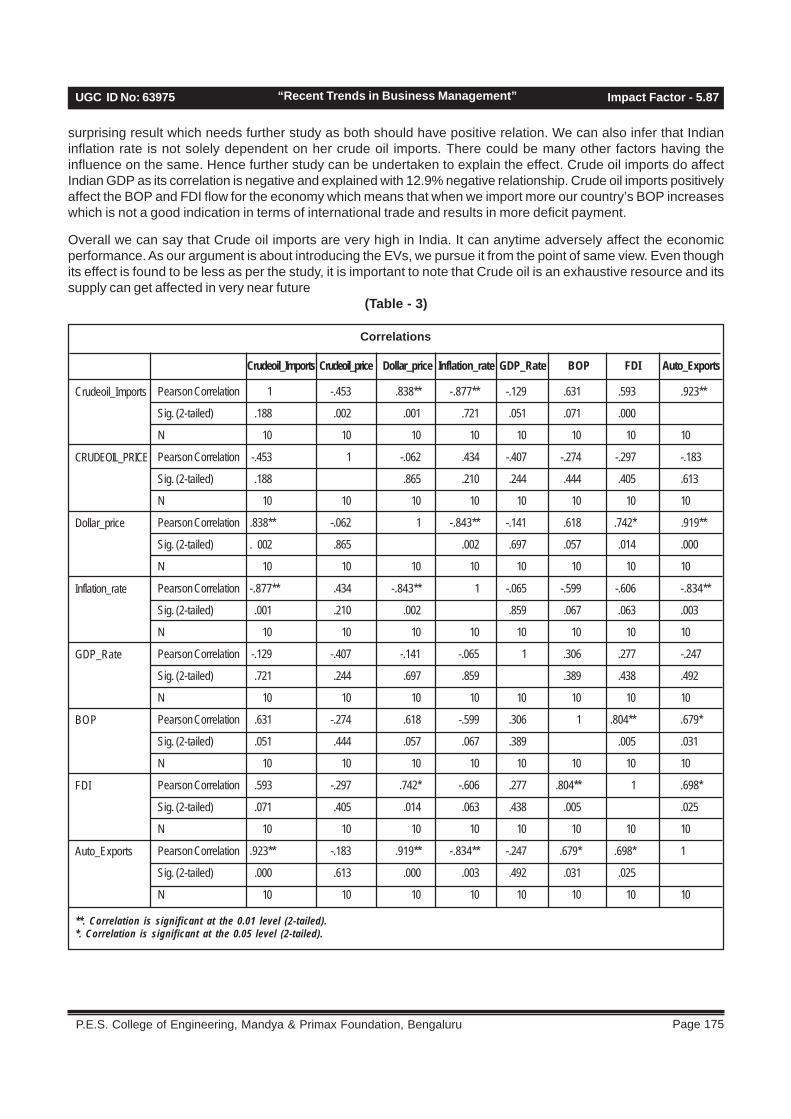
Page 175 P.E.S. College of Engineering, Mandya & Primax Foundation, Bengaluru
UGC ID No: 63975 Impact Factor - 5.87“Recent Trends in Business Management”
surprising result which needs further study as both should have positive relation. We can also infer that Indianinflation rate is not solely dependent on her crude oil imports. There could be many other factors having theinfluence on the same. Hence further study can be undertaken to explain the effect. Crude oil imports do affectIndian GDP as its correlation is negative and explained with 12.9% negative relationship. Crude oil imports positivelyaffect the BOP and FDI flow for the economy which means that when we import more our country’s BOP increaseswhich is not a good indication in terms of international trade and results in more deficit payment.
Overall we can say that Crude oil imports are very high in India. It can anytime adversely affect the economicperformance. As our argument is about introducing the EVs, we pursue it from the point of same view. Even thoughits effect is found to be less as per the study, it is important to note that Crude oil is an exhaustive resource and itssupply can get affected in very near future
(Table - 3)
1 -.453 .838** -.877** -.129 .631 .593 .923**
.188 .002 .001 .721 .051 .071 .000
10 10 10 10 10 10 10 10
-.453 1 -.062 .434 -.407 -.274 -.297 -.183
.188 .865 .210 .244 .444 .405 .613
10 10 10 10 10 10 10 10
.838** -.062 1 -.843** -.141 .618 .742* .919**
. 002 .865 .002 .697 .057 .014 .000
10 10 10 10 10 10 10 10
-.877** .434 -.843** 1 -.065 -.599 -.606 -.834**
.001 .210 .002 .859 .067 .063 .003
10 10 10 10 10 10 10 10
-.129 -.407 -.141 -.065 1 .306 .277 -.247
.721 .244 .697 .859 .389 .438 .492
10 10 10 10 10 10 10 10
.631 -.274 .618 -.599 .306 1 .804** .679*
.051 .444 .057 .067 .389 .005 .031
10 10 10 10 10 10 10 10
.593 -.297 .742* -.606 .277 .804** 1 .698*
.071 .405 .014 .063 .438 .005 .025
10 10 10 10 10 10 10 10
.923** -.183 .919** -.834** -.247 .679* .698* 1
.000 .613 .000 .003 .492 .031 .025
10 10 10 10 10 10 10 10
Correlations
Crudeoil_Imports Crudeoil_price Dollar_price Inflation_rate GDP_Rate BOP FDI Auto_Exports
Crudeoil_Imports
CRUDEOIL_PRICE
Dollar_price
Inflation_rate
GDP_Rate
BOP
FDI
Auto_Exports
Pearson Correlation
Sig. (2-tailed)
N
Pearson Correlation
Sig. (2-tailed)
N
Pearson Correlation
Sig. (2-tailed)
N
Pearson Correlation
Sig. (2-tailed)
N
Pearson Correlation
Sig. (2-tailed)
N
Pearson Correlation
Sig. (2-tailed)
N
Pearson Correlation
Sig. (2-tailed)
N
Pearson Correlation
Sig. (2-tailed)
N
**. Correlation is significant at the 0.01 level (2-tailed).*. Correlation is significant at the 0.05 level (2-tailed).

ISSN: 2349-5162Journal of Emerging Technologies and Innovative Research
Page 176February 2019Special Issue
Impact of transportation vehicles on pollutionVehicular pollution in India is at alarming rate. Theurbanization and improved standard of living are the mainfactors resulting in ever increasing pollution. The pollutionfrom vehicles has begun to tell through symptoms likecough, headache, nausea, irritation of eyes, variousbronchial and visibility problems. The main pollutantsemitted from the automobiles are hydrocarbons, lead/benzene, carbon monoxide, sulphur dioxide, nitrogendioxide and particulate matter. The main cause ofvehicular pollution is the rapidly growing number ofvehicles. The two wheelers are the major contributors ofvehicular air pollution followed by four-wheeler (e.g., car,jeep, taxi etc.), trucks and buses in decreasing order ofmagnitude. The Air (Prevention and Control of Pollution)Act was passed in 1981 to regulate air pollution andthere have been some measurable improvements.However, the 2016 Environmental Performance Indexranked India 141 out of 180 countries. As fuel pricesrise, the public transport driver cuts costs by blendingthe cheaper hydrocarbon into highly taxed hydrocarbon.The blending may be as much as 20–30 percent. For alow wage driver, the adulteration can yield short termsavings that are significant over the month. Theconsequences to long term air pollution, quality of lifeand effect on health are simply ignored. Also ignoredare the reduced life of vehicle engine and highermaintenance costs, particularly if the taxi, auto-rickshawor truck is being rented for a daily fee. This is resultingin high pollution. The following picture shows the mostpolluted cities of the world according to the WTOs reporton pollution. As shown below, most polluted cities ofthe world are in India. In this background Government ofIndia is framing a new policy to introduce electric vehiclesin India.
Fig. 1
Present and Future scenarioAs we all know that crude oil is a exhaustible resource,and the IEA (International Energy Agency) anticipatescrude oil production from existing fields falling from68.5?mb per day in 2011 to only 26?mb per day in 2035[Miller (2014)]. This is evident that oil production andsupply will get affected in near future. As India is highlydependent on other countries to meet its domestic oildemand, it is advised by many researchers to plan forfuture to meet its oil needs by choosing substitutes tocrude oil wisely from now. As such crude oil is consumedlargely by transport industry in India; we should try tofind out alternative vehicles for transportation sector. Inthis context, we are suggesting to plan for introducingthe electric vehicles in Indian market in full fledge.
The company's first vehicle was the REVAi electric car,available in 26 countries with more than 4,000 of itsdifferent versions sold worldwide by mid March 2011.Revawas acquired by Indian conglomerate Mahindra &Mahindra in May 2010. After the acquisition, the companylaunched the electric hatchback e2o in 2013. India delaysplan to roll out 10,000 electric cars to 2019. There areabout 150 cars in the capital New Delhi and about 100in southern Andhra Pradesh state and other provincesas of now. The electric cars available in India are:Mahindra e2oPlus, Mahindra e-Verito, Tata Tigor Electric,Mahindra e-KUV 100, Tata Tiago Electric and few morein the list.
Government Initiatives to promote EVs in IndiaGovernment of India (GOI) is slowly but progressivelypreparing for introduction of EVs by preparing a new policyfor its promotion. GOI is planning to build ecosystem innine most polluted cities with population over four millionat first phase as a part of its pilot project. In the secondphase it will step into cities with population of one millionplus. a new policy to create favourable ecosystems fortransition to electric vehicles is silently being workedupon. The government has already begun consultationswith industry bodies, including the Confederation of IndianIndustries, FICCI and auto makers on five aspects. Theseinclude challenges and support required for electricvehicles manufacturing, battery manufacturing, settingup charging infrastructure, promoting electric vehiclesin commercial fleet and the role of renewable energy inelectric mobility.
FAME India SchemeThe FAME India (Faster Adoption and Manufacture of(Hybrid and) Electric Vehicles) Scheme was launchedby the Ministry of Heavy Industries and PublicEnterprises in 2015 to incentivize the production andpromotion of eco-friendly vehicles including electricvehicles and hybrid vehicles. FAME India is a part of the
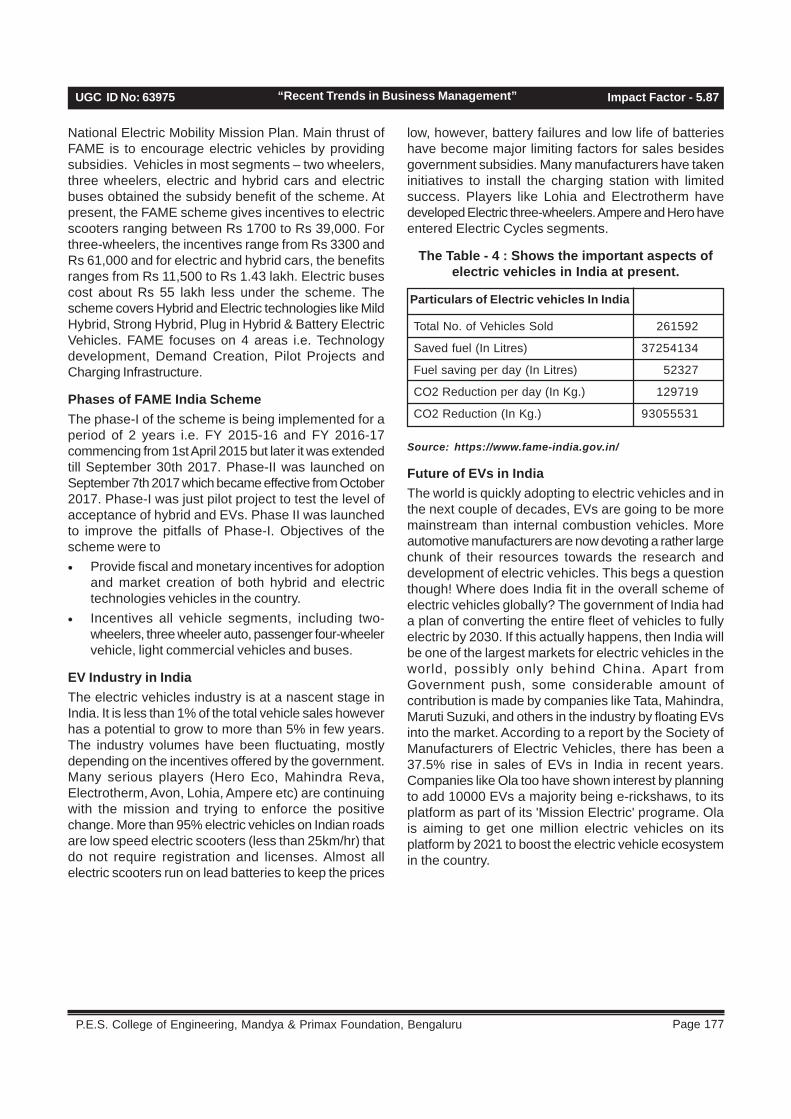
Page 177 P.E.S. College of Engineering, Mandya & Primax Foundation, Bengaluru
UGC ID No: 63975 Impact Factor - 5.87“Recent Trends in Business Management”
National Electric Mobility Mission Plan. Main thrust ofFAME is to encourage electric vehicles by providingsubsidies. Vehicles in most segments – two wheelers,three wheelers, electric and hybrid cars and electricbuses obtained the subsidy benefit of the scheme. Atpresent, the FAME scheme gives incentives to electricscooters ranging between Rs 1700 to Rs 39,000. Forthree-wheelers, the incentives range from Rs 3300 andRs 61,000 and for electric and hybrid cars, the benefitsranges from Rs 11,500 to Rs 1.43 lakh. Electric busescost about Rs 55 lakh less under the scheme. Thescheme covers Hybrid and Electric technologies like MildHybrid, Strong Hybrid, Plug in Hybrid & Battery ElectricVehicles. FAME focuses on 4 areas i.e. Technologydevelopment, Demand Creation, Pilot Projects andCharging Infrastructure.
Phases of FAME India SchemeThe phase-I of the scheme is being implemented for aperiod of 2 years i.e. FY 2015-16 and FY 2016-17commencing from 1st April 2015 but later it was extendedtill September 30th 2017. Phase-II was launched onSeptember 7th 2017 which became effective from October2017. Phase-I was just pilot project to test the level ofacceptance of hybrid and EVs. Phase II was launchedto improve the pitfalls of Phase-I. Objectives of thescheme were to• Provide fiscal and monetary incentives for adoption
and market creation of both hybrid and electrictechnologies vehicles in the country.
• Incentives all vehicle segments, including two-wheelers, three wheeler auto, passenger four-wheelervehicle, light commercial vehicles and buses.
EV Industry in IndiaThe electric vehicles industry is at a nascent stage inIndia. It is less than 1% of the total vehicle sales howeverhas a potential to grow to more than 5% in few years.The industry volumes have been fluctuating, mostlydepending on the incentives offered by the government.Many serious players (Hero Eco, Mahindra Reva,Electrotherm, Avon, Lohia, Ampere etc) are continuingwith the mission and trying to enforce the positivechange. More than 95% electric vehicles on Indian roadsare low speed electric scooters (less than 25km/hr) thatdo not require registration and licenses. Almost allelectric scooters run on lead batteries to keep the prices
low, however, battery failures and low life of batterieshave become major limiting factors for sales besidesgovernment subsidies. Many manufacturers have takeninitiatives to install the charging station with limitedsuccess. Players like Lohia and Electrotherm havedeveloped Electric three-wheelers. Ampere and Hero haveentered Electric Cycles segments.
The Table - 4 : Shows the important aspects ofelectric vehicles in India at present.
Source: https://www.fame-india.gov.in/
Future of EVs in IndiaThe world is quickly adopting to electric vehicles and inthe next couple of decades, EVs are going to be moremainstream than internal combustion vehicles. Moreautomotive manufacturers are now devoting a rather largechunk of their resources towards the research anddevelopment of electric vehicles. This begs a questionthough! Where does India fit in the overall scheme ofelectric vehicles globally? The government of India hada plan of converting the entire fleet of vehicles to fullyelectric by 2030. If this actually happens, then India willbe one of the largest markets for electric vehicles in theworld, possibly only behind China. Apart fromGovernment push, some considerable amount ofcontribution is made by companies like Tata, Mahindra,Maruti Suzuki, and others in the industry by floating EVsinto the market. According to a report by the Society ofManufacturers of Electric Vehicles, there has been a37.5% rise in sales of EVs in India in recent years.Companies like Ola too have shown interest by planningto add 10000 EVs a majority being e-rickshaws, to itsplatform as part of its 'Mission Electric' programe. Olais aiming to get one million electric vehicles on itsplatform by 2021 to boost the electric vehicle ecosystemin the country.
Total No. of Vehicles Sold 261592
Saved fuel (In Litres) 37254134
Fuel saving per day (In Litres) 52327
CO2 Reduction per day (In Kg.) 129719
CO2 Reduction (In Kg.) 93055531
Particulars of Electric vehicles In India
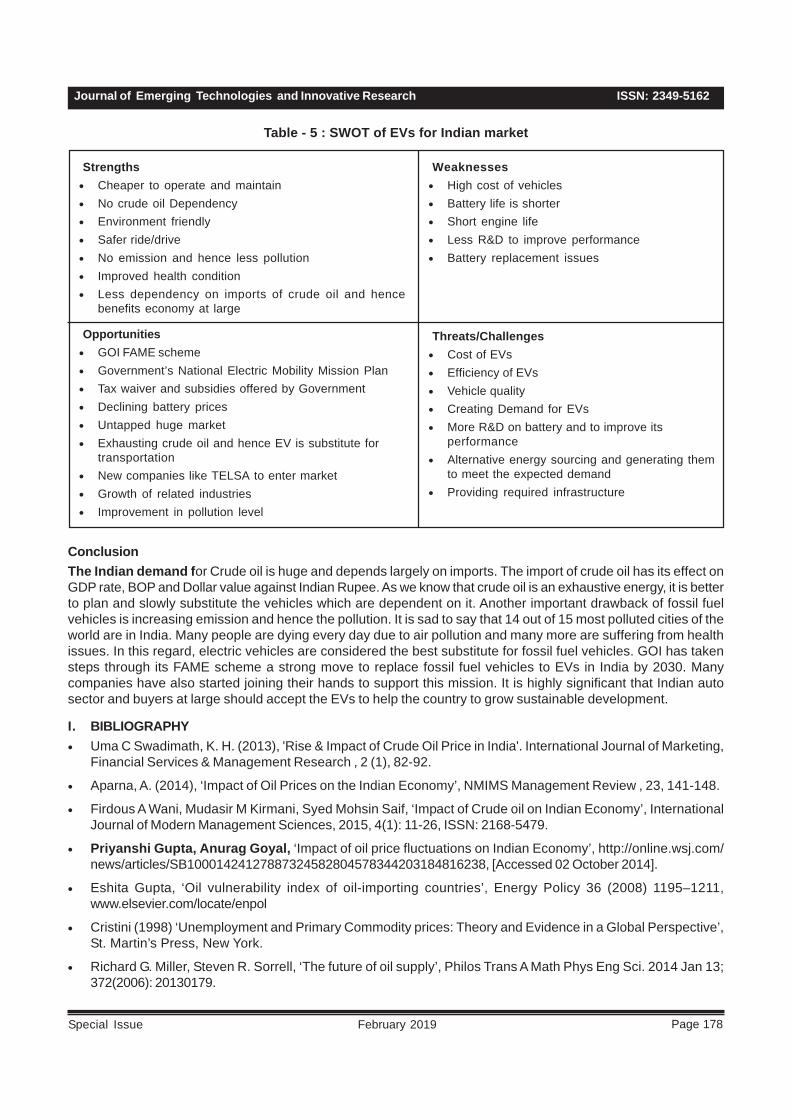
ISSN: 2349-5162Journal of Emerging Technologies and Innovative Research
Page 178February 2019Special Issue
Table - 5 : SWOT of EVs for Indian market
ConclusionThe Indian demand for Crude oil is huge and depends largely on imports. The import of crude oil has its effect onGDP rate, BOP and Dollar value against Indian Rupee. As we know that crude oil is an exhaustive energy, it is betterto plan and slowly substitute the vehicles which are dependent on it. Another important drawback of fossil fuelvehicles is increasing emission and hence the pollution. It is sad to say that 14 out of 15 most polluted cities of theworld are in India. Many people are dying every day due to air pollution and many more are suffering from healthissues. In this regard, electric vehicles are considered the best substitute for fossil fuel vehicles. GOI has takensteps through its FAME scheme a strong move to replace fossil fuel vehicles to EVs in India by 2030. Manycompanies have also started joining their hands to support this mission. It is highly significant that Indian autosector and buyers at large should accept the EVs to help the country to grow sustainable development.
I. BIBLIOGRAPHY• Uma C Swadimath, K. H. (2013), 'Rise & Impact of Crude Oil Price in India'. International Journal of Marketing,
Financial Services & Management Research , 2 (1), 82-92.
• Aparna, A. (2014), ‘Impact of Oil Prices on the Indian Economy’, NMIMS Management Review , 23, 141-148.
• Firdous A Wani, Mudasir M Kirmani, Syed Mohsin Saif, ‘Impact of Crude oil on Indian Economy’, InternationalJournal of Modern Management Sciences, 2015, 4(1): 11-26, ISSN: 2168-5479.
• Priyanshi Gupta, Anurag Goyal, ‘Impact of oil price fluctuations on Indian Economy’, http://online.wsj.com/news/articles/SB10001424127887324582804578344203184816238, [Accessed 02 October 2014].
• Eshita Gupta, ‘Oil vulnerability index of oil-importing countries’, Energy Policy 36 (2008) 1195–1211,www.elsevier.com/locate/enpol
• Cristini (1998) ‘Unemployment and Primary Commodity prices: Theory and Evidence in a Global Perspective’,St. Martin’s Press, New York.
• Richard G. Miller, Steven R. Sorrell, ‘The future of oil supply’, Philos Trans A Math Phys Eng Sci. 2014 Jan 13;372(2006): 20130179.
Strengths• Cheaper to operate and maintain• No crude oil Dependency• Environment friendly• Safer ride/drive• No emission and hence less pollution• Improved health condition• Less dependency on imports of crude oil and hence
benefits economy at large
Opportunities• GOI FAME scheme• Government’s National Electric Mobility Mission Plan• Tax waiver and subsidies offered by Government• Declining battery prices• Untapped huge market• Exhausting crude oil and hence EV is substitute for
transportation• New companies like TELSA to enter market• Growth of related industries• Improvement in pollution level
Weaknesses• High cost of vehicles• Battery life is shorter• Short engine life• Less R&D to improve performance• Battery replacement issues
Threats/Challenges• Cost of EVs• Efficiency of EVs• Vehicle quality• Creating Demand for EVs• More R&D on battery and to improve its
performance• Alternative energy sourcing and generating them
to meet the expected demand• Providing required infrastructure
Page 179 P.E.S. College of Engineering, Mandya & Primax Foundation, Bengaluru
UGC ID No: 63975 Impact Factor - 5.87“Recent Trends in Business Management”
• Praveen Kumar, Kalyan Dash, ‘Potential Need for Electric Vehicles, Charging Station Infrastructure and itsChallenges for the Indian Market’, Advance in Electronic and Electric Engineering. ISSN 2231-1297, Volume 3,Number 4 (2013), pp. 471-476
• Shikha Rokadiya, Anup Bandivadekar, ‘Hybrid and Electric Vehicles in India Current Scenario and MarketIncentives’, December 2016, International Council on Clean Transportation, 2016, Working paper.
• Sarita C Singh, ET Bureau, ‘Government plans new policy to promote electric vehicles’, Aug 02, 2018 https://economictimes.indiatimes.com/industry/auto/auto-news/government-plans-new-policy-to-promote-electric-vehicles/articleshow/65237123.cms
• BusinessToday.In, New Delhi, August 2, 2018, 9 ‘Most polluted Indian cities to get electric vehicles ecosystem:Report’, https://www.businesstoday.in/current/economy-politics/9-most-polluted-indian-cities-to-get-electric-vehicles-ecosystem-report/story/280901.html
• https://www.smev.in/
ISSN: 2349-5162Journal of Emerging Technologies and Innovative Research
Page 180February 2019Special Issue
THE ROAD AHEAD OF HR – AI TO BOOST EMPLOYEE ENGAGEMENT
1. Assistant Professor, PESCE, Mandya, Karnataka.2. Associate Professor, Nitte Meenakshi Institute of Technology, Bangalore.3. Professor, PESCE, Mandya, Karnataka.
Abstract
This paper generates insights on the utilization of Artificial Intelligence (AI) its intense effect on HR process andpractices and how AI boosts employee engagement. AI can create tremendous effectiveness towards building smartorganizations and transform HR process for talent acquisition, on boarding, individualization learning, careermanagement, improve employee engagement and retention thereby transforming human knowledge to organizationalknowledge and creating learning organizations. Today employee engagement is crucial for organizations as it playsa key role in boosting productivity and staying competitive in the business. HR experts earlier used to be relied ononly yearly surveys to measure employee engagement and classify problem areas. Now real time data enables themto take jiffy action in a more personalized manner. The study is descriptive in nature and secondary data like websources, research papers, company reports and blogs have been used.
Keywords: Artificial Intelligence, Human Resource Management Process, Employee Engagement.
Pooja Nagpal1
Introduction:AI is the ability to make the software think intelligentlyjust like intelligent human brain thinks, makes decisionsbased on reasoning, generalizing and taking intoconsiderations past experience while solving complexproblem. AI power is growing at the appalling speedeliminating the need for human interventions, and thecurrent business houses have already started to reapits benefits. AI is also transforming how HR operationsare being conducted, earlier several HR fraternity usedto take decisions which were purely based on theirpersonal judgments and raw data and this lead tobiasness in resolving issues but now with AI has thepotential to improve and automate ad hoc decisions takenby HR in recruiting, on boarding, learning, careermanagement, engagement and retention.
Artificial intelligence (AI) is revamping the way thatcompanies administer their workforce and make HRstrategies to boost employee engagement and indirectlythis enhances the productivity. The anonymousenterprise and employee data is stored in the repositoriesand these can be linked to HR backend systems toaccess employee data so that it automates thecommunication related to job quires raised by them andto larger extent eliminating the vast need for humaninvolvement.
Literature Review:Manju Amla & Dr Meenakshi Malhotra (2017) theauthors explored the use of AI in the HR processes, theAI tools used, the benefits of digital transformation itsbarriers and strategies to overcome these barriers incontext to Indian companies.
Tandon et al. (2017) the authors review the literatureon emergence of AI in HRM processes and proceduresthe benefits that AI is providing the HR and the impact ofAI on effectiveness of HR processes.
Ravin Jesuthasan , (2017) the author emphasis notonly on HR being steward but also how it enables digitalengagement on business leverage the article also throwslight on best practices for enabling engagement.
Dianna L. et. al (2015) the authors reviewed the influencethe current impact of technology on HR processes itsadvantages and probable limitations of it. The authorsdiscuss the road ahead of HR where they need toconsider all the stake holders while making the decisionsand adding value to the organizations through HRpractices and HR analytics.
Pooja Tripathi, Jayanthi Ranjan Tarun Pandeya(2012) The paper studies the role of artificial intelligencein HR and how different applications are used. Theauthors emphasised on how expert system whichconceptualizes the job behaviours that are required toperform a precise tasks here teaching and learningthrough decision aid in a job evaluation system in aneducational institute.
Bhushan Kapoor & Joseph Sherif (2012) the paperdiscusses the influences of business intelligencetechniques adopted by the HR department byassembling global data bases of the employeeinformation related to HR information’s of the globalenterprises to gain insights and make informed decisionson all levels of managements.
Dr. Senthil Kumar2 Dr. H. V. Ravindra3
Page 181 P.E.S. College of Engineering, Mandya & Primax Foundation, Bengaluru
UGC ID No: 63975 Impact Factor - 5.87“Recent Trends in Business Management”
Research Methodology:Material and Method: - This is a literature review baseddescriptive study, the material that have been consideredare secondary in nature. The secondary data wascollected from journals, online blogs, company reports,websites, and the articles written by experts.
Research Objectives:I. To study the impact of AI on Human Resource
Management processes.II. To study the impact of AI on Employee Engagement.
I. To study the impact of AI Human ResourceManagement processes.HRM have been revamped by evolution of technology.AI analyses huge behavioral data based on businessdealings and HR data is accumulated from induction,performance management, general issues,leadership summit, exit interviews, etc and this couldbe diagnosed to identify issues like risks and alsofuture development of employees and enterprise.
Following are some of the Human ResourceManagement processes where AI has made itspresences felt:a. AI prominent HR Chatbots : HR chatbot is a robotic
application which conversate with humans usingelectronic medium. It helps the users to have aconversation regarding company policies andprocedures, leaves and employee benefits,reimbursement, personalizing individual learning’s,interaction and automation initiatives. These botsoffers various benefits like twenty four bar seven anemployee can access it, have an incessant dialoguealong with its response and cross-channel integrationtoo.
b. Attracting Talent: The companies always have aneye on prospective hire. Catching the attention ofthe talented candidates making them to apply forthe position is the prominent job of HR. AI throughmachine learning recommends recruiters through thedata collected from the users posts, the clicks thatthey made to other company websites, the pastsearch history that they have browsed providesinformation based on these recommendations.
c. Talent Acquisition: The monotonous job of HR isscreening of applications. AI talent acquisition toolsand predictive analytics, have made the screeningprocess quite easy has these software’s likeapplicant tracking software can evaluate applicationbased on the companies requirement and eliminatealmost three fourth of unrelated resumes. Othersoftware’s drives through predictive languageanalysis creep through more than two hundred social
websites, deploy algorithms match the candidatesprofile, schedule automated interviews, providefeedback to candidates and reply to their queries.This process is reducing the hiring cost, time.
d. On Boarding: The on boarding process is quitecomplicated and lengthy a new recruit needs to fithimself in new environment and he seeks a lot ofattention in an organization and for a HR it’s impossibleto devote time with every employee. AI chatbot allowsthe new employees to ask the query that needs to beaddressed. AI assists for quicker customize on boardingprocess with accurate information for each position.
e. Individualisation Training: Today the workforceconstitutes of mainly the millennial that are techsavvy unique individuals with different learning stylesexperiencing technological advancement at the rapidphase and counter many hindrances while executingthe job and they require instant solutions to all quiresraised by them. Predictive analysis aids in predictinghigher level of learning based on prior data ofemployee on his learning experience and behaviouralpattern tries to enhance personal skill in specificand organizational skill in general and successfullyplan, determine time frame, schedule the lessonsbased on individual preferences and execute thetraining programmes using online courses and digitalclassrooms. The individual training could be relatedlike an individual mentor to the employees.
f. Performance Analysis: The most challenging jobof an HR is to remain unbiased during performanceappraisal because it is subjective in nature andemployees are never satisfied with the review processand the feedback. AI tools could assist by giving360 degree feedback by carrying out employeeassessments all year round and not on last minuteon work graphs based on hard data and othervariables and limited chances of biases creeping inalso utilize AI to evaluate career path of theemployees for succession planning.
g. Retention: Employee turnover incurs huge financiallosses to the company. In the competitive world thereis a war for talent and retain talented employees isas difficult as hiring them. The HR data using AI candetermine affinity and show patterns about their worksatisfaction, dissatisfaction, work life balance. Basedon these data a HR needs to follow best practices,resolve the problems in bud and retain engagedemployees by taking timely action.
II. To study the impact of AI on EmployeeEngagement:Employee individual performance is always linkedto organizational productivity and productivity is
ISSN: 2349-5162Journal of Emerging Technologies and Innovative Research
Page 182February 2019Special Issue
linked to the employee engagement which in turnhelps organization stays competitive in the market.Engaged employees are and will always remain thekey to a successful enterprise. Earlier totechnological advancement HR used to heavily relyonly on annual surveys of employee engagement tocheck their engagement levels, but now AI toolsenable HR to get individual data and insights in realtime.
Some of the AI and robotics technologies that thataids in employee engagement are worthmentioning:a. Data Mining: Employee engagement is extremely
important but the accuracy of its measure lacks byleaps. The tremendous growth of the organizationhas enormous information of enterprise andemployees on day to day basis, the behaviouralaspect recorded of employee while executing thetask are stored, all these data are measured helpsthe HR to understand the present engagement leveland also to forecast on future which can facilitate inimproving productivity and profitability.
b. Predictive Analysis: Numerous organizationsmeasure employee engagement based on annualsurveys without contributing to concrete strategy toimprove it. Through advancement of AI and predictiveanalysis, using the past and present data acrossvariables are scanned and analyzed using employeesemail, videos, photo and emotional state can capturereal time sentiment analysis, through these HRmetrics and rate employees on the engagement anddissatisfaction level, the HR can run interventionstrategies which are tailored made to enhanceengagement, reduce attrition and retain them.
c. Natural Language Processing and Machinelearning: Employee’s major areas of discontent inan enterprise are often due to non financial rewardsas career path, training and development, challengingtasks, delayed feedback. The effective way to trackemployee engagement is through straight employeefeedback which is in volumes and subjective in natureand quite difficult to analyze. Natural languageprocessing and machine learning are empoweringleaders with pulse survey which is frequent surveyconducted weekly or every couple of weeks thatgives quick insights of the company termed as“pulse”. Getting feedback quite often relieves thestate of mind, morale and state of satisfaction ofemployee at the present moment and regularfeedback encourages positive engagement thesetools also predict strategic future course of actionto be taken.
d. Chatbots: Communication is a fundamental elementof employee engagement. Chatbots helps employeeget solutions for the problems via chats, instead oflengthy survey it allows real time survey. Throughchats HR gets insights into employee’s performance,behaviour analysis and predicts the presentengagement level.
e. Managing Rewards and Benefits: Employeeengagement is at maximum when employee feelshe is treated fairly and unbiased at his workplacebased on hierarchical level in his enterprise. AIthrough its personalised rewards and benefits makesthe entire procedure efficient. Employees can viewthey own rewards and benefits through AI tools whichare quite user friendly, flexible and are ease tooperate giving an employee novel experience.
f. Learning and Training: AI is made a difference inindividual learning and training by proving innovative,interacting and real life situations with high qualitytraining aids based on individual job task, experienceand position in the enterprise. Skilling is an areawhere employee competence can be enhanced foremployees to remain engaged in organizations.
g. Enable better Decision Making: The AI tools areaiding in decision support through the use of vastand reliable data available by analyzing trends,assisting in providing feedback and information andsuggesting next course of action. Employees areable to take timely and better decision. AI improvesthe strategic prominence of the business.
Findings:The main purpose of the study was to provide insight onhow AI has drizzled into the field of HR and with specialreference of employee engagement which was previouslyobsessed by human’s only. But now this machine learningis potentially used in core HR functions like attractingthe best talent, luring them to apply to the enterprisewebsites, on boarding them to the organization at ease,assisting in personalized training by understanding thegap, analyzing the performance on day to day basisand also making them content so has to retain them forlong. Employee engagement is directly related toretention, productivity and profitability for an enterprisesuccess. AI aids in employee engagement through thetools like data mining, predictive analysis, naturallanguage processing, charbots, managing rewards andbenefits, providing individual learning and training andassisting in decision making.
Discussions and Conclusions:AI is not future but it’s the current phenomenon which isconstantly maximizing effectiveness of business in
Page 183 P.E.S. College of Engineering, Mandya & Primax Foundation, Bengaluru
UGC ID No: 63975 Impact Factor - 5.87“Recent Trends in Business Management”
general and HR in particular. It is employee centricdigitally magnified in the dynamic environment. Fromscreening of resumes in the initial states to improvingemployee engagement and predicting potential highperformers AI is used to transfigure HR and thesemanagers should experiment on all aspects of AI whichdeliver value to the enterprise. It is a definite way torevolutionize employee engagement. AI no doubtharnessing human potential, still it is a double edge swordwhich cannot be operated without a human effort. A lotof issues need to be addressed as barriers to change,short of experts who deliver AI, lack of infrastructure,efficient leadership for carefully interventions. Enterpriseneeds to look closely at the Pro-quo payback of AIopposed to apprehension of redundancy. To concludethe road ahead of HR seems quite promising becauseof AI has a straight solid impact on attraction, retention,engagement and productivity and HR leaders shouldcomplement their and machine learning capabilitiesrather than replacing each other.
Bibliography:Journals:1. Manju Amla & Dr Meenakshi. Malhotra “Digital
Transformation in HR” International Journal ofInterdisciplinary and Multidisciplinary Studies(IJIMS), 2017, Vol 4, No.3,536-544.
2. Lochan Sharma Tandon, Dr. Parikshit Joshi & RichaKinger Rastogi. “Understanding the scope of artificialintelligence in human resource managementprocesses – a theoretical perspective” InternationalJournal of Business and Administration ResearchReview, Vol.1, Issue.19, July- Sept 2017. Page 62-66
3. Pooja Tripathi, Jayanthi Ranjan Tarun Pandeya.Human Resource Management through AI Approach:An Experimental Study of an Expert System.National Conference on CommunicationTechnologies & its impact on Next GenerationComputing CTNGC 2012 Proceedings published byInternational Journal of Computer Applications®(IJCA) pg 23-27
4. Ravin Jesuthasan , (2017),” HR’s new role: rethinkingand enabling digital engagement “, Strategic HRReview, Vol. 16 Iss pp 1-4
5. Bhushan Kapoor & Joseph Sherif Human resourcesin an enriched environment of business intelligence.Kybernetes Vol. 41 No. 10, 2012 pp. 1625-1637,Emerald Group Publishing Limited
6. Ulrich, D. and Dulebohn, J. (2015), Are we there yet?What’s next for HR?, Human Resource ManagementReview 25 (2015), 188-204.
Web Articles, Blogs, Reports:• http://www.humanresourcesonline.net/boosting-
employee-engagement-with-ai-and-machine-learning/
• https://www.newgenapps.com/blog/growing-role-of-artificial-intelligence-in-hr
• https://www.vccircle.com/how-ai-and-machine-learning-will-impact-hr-practices/
• https://analyticsindiamag.com/top-use-cases-ai-human-resources/
• https://www.allegisgroup.com/insights/blog/2017/september/ais-impact-on-hr
• http://bigdata-madesimple.com/5-ways-to-use-artificial-intelligence-ai-in-human-resources/
• https://www.cmswire.com/digital-workplace/7-ways-artificial-intelligence-is-reinventing-human-resources/
• http://www.cxotoday.com/story/how-artificial-intelligence-can-enhance-employee-engagement/
• https://www.peoplematters.in/article/employee-engagement/using-ai - to-boost-employee-engagement 17053? utm_s ource=people matters& utm_medium=interstitial & utm_campaign =learnings -of-the-day
• http://www.humanresourcesonline.net/boosting-employee-engagement-with-ai-and-machine-learning/
• https: / /www.sociabble.com/blog/art i f ic ia l -intelligence-means-employee-engagement/
• https://www.ultimatesoftware.com/blog/AI-key-improving-employee-engagement

ISSN: 2349-5162Journal of Emerging Technologies and Innovative Research
Page 184February 2019Special Issue
AN EMPIRICAL STUDY ON RISK AND RETURN ANALYSIS OF SELECTEDINDIAN COMPANIES AND THE THEIR PORTFOLIO CONSTRUCTION
1. Asst. Professor MBA Dept. PESCE Mandya2. Professor, Hod of Dept. PES College of Engineering, Mandya.3. Associate Professor, PES College of Engineering, Mandya.
AbstractThe knowledge of investment is very much essential in the competitive world of finance. The risk and return are veryimportant concepts of finance in relation with investment attributes. This study analyses the risk and return aspectsassociated with the selected stocks .An investment would possess the characteristic of Risk & Return. The Risk &Return are the two sides of the same coin when an Investment instrument is considered in the field of finance. Returnon an investment is the financial outcome for the investor. Risk and Return Analysis plays very important role indecision making process of whether to make investment. Every investor wants to maximize their return with minimumrisk. In general, risk and return are the two faces of the same coin. If an investor wants to earn higher returns, that canonly be achieved by accepting high risk. Based on risk and return analysis, high risk gives high returns with low riskgives low returns, however, we should be in a position to understand and analyse the risk and return for all securitiesindividually and risk and return varies with time period and each stock of that particular company.An individual orinvestor must have knowledge of finance or take advice from experts or professionals while investing in stock market,though it yields good return, the quantum of risk involved is also quite high. Any investor who is willing to invest in stockmarket must firstly determine the level of risk involved in investing on any particular stock.
Manjuprasad .M.K1
IntroductionRisk and return are the inherent features of an investment.These attributes decide whether it is good investmentor not. Every investor does analyse and estimate therisk and return for their intention motive before theinvestment is made.
The risk and return go hand in hand as per the investmentfundamentals. One can expect the return as per the riskhe/she assumes; it means higher the risk, higher thereturn. The amount of risk and return varies with the kindof security we make investment in, however, we shouldbe in a position to understand and analyse the risk andreturn for all securities individually and for the portfolioas well.
The risk and return quantum do also varies with the timeperiod and the kind of economy.
Objectives of the studyThe following are the objectives of the study• To determine the Risk & Return of the selected
companies and the market• To construct the portfolio for the selected companies
MethodologyTypes of ResearchThis study is an empirical study where we determinethe risk and return of the selected Indian companies,
based on their historical data along with the market data.This research helps many stakeholders to takeinvestment decision effectively.
Sampling TechniqueThe Probability Sampling Technique has been used forthe study
Sampling MethodWe have used Judgemental Sampling method for thestudy
Sample SizeFor the Study, we have selected 2 companies and oneindex Companies include Texmaco Infrastucutre andHoldings Ltd and JBF Industries Ltd and the market indexis NSE Nifty.
Data UsedWe have used the secondary data for the study. Thedata has been collected from the NSE website.Companies include Tata steel ltd, Wipro and the marketindex is NSE Nifty.
Dr. Somashekar P2 A. S. Mahesh3
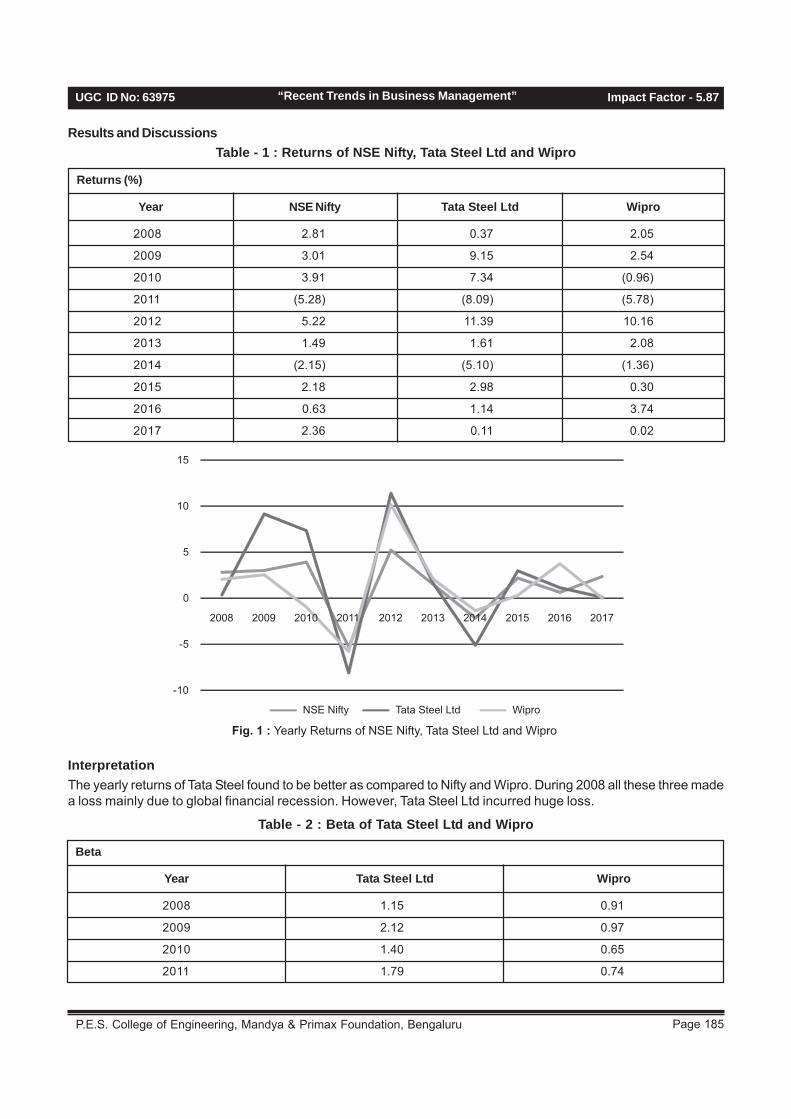
Page 185 P.E.S. College of Engineering, Mandya & Primax Foundation, Bengaluru
UGC ID No: 63975 Impact Factor - 5.87“Recent Trends in Business Management”
Results and DiscussionsTable - 1 : Returns of NSE Nifty, Tata Steel Ltd and Wipro
NSE Nifty Tata Steel Ltd
2008 2.81 0.37 2.05
2009 3.01 9.15 2.54
2010 3.91 7.34 (0.96)
2011 (5.28) (8.09) (5.78)
2012 5.22 11.39 10.16
2013 1.49 1.61 2.08
2014 (2.15) (5.10) (1.36)
2015 2.18 2.98 0.30
2016 0.63 1.14 3.74
2017 2.36 0.11 0.02
WiproYear
Returns (%)
-10
-5
0
5
10
15
2008 2009 2010 2011 2012 2013 2014 2015 2016 2017
NSE Nifty Tata Steel Ltd Wipro
Fig. 1 : Yearly Returns of NSE Nifty, Tata Steel Ltd and Wipro
InterpretationThe yearly returns of Tata Steel found to be better as compared to Nifty and Wipro. During 2008 all these three madea loss mainly due to global financial recession. However, Tata Steel Ltd incurred huge loss.
Table - 2 : Beta of Tata Steel Ltd and Wipro
Tata Steel Ltd Wipro
2008 1.15 0.91
2009 2.12 0.97
2010 1.40 0.65
2011 1.79 0.74
Year
Beta

ISSN: 2349-5162Journal of Emerging Technologies and Innovative Research
Page 186February 2019Special Issue
2012 2.19 0.84
2013 2.05 0.60
2014 1.30 0.76
2015 2.02 0.59
2016 0.81 (0.90)
2017 2.85 (0.06)
-1.5
-1
-0.5
0
0.5
1
1.5
2
2.5
3
3.5
2008 2009 2010 2011 2012 2013 2014 2015 2016 2017
Tata Steel Ltd Wipro
Fig. 2 : Beta of Tata Steel Ltd and Wipro
InterpretationThe beta for the Tata Steel Ltd found higher than Wipro for all the ten years indicating that it is very risk scrip. TheWipro’s beta is less than 1 in all the years except last two years where the beta is even is negative.
Table - 3 : Alpha of Tata Steel Ltd and Wipro
Tata Steel Ltd Wipro
2008 (2.86) (0.52)
2009 2.77 (0.37)
2010 1.86 (3.51)
2011 1.36 (1.86)
2012 (0.06) 5.75
2013 (1.44) 1.19
2014 (2.31) 0.27
2015 (1.41) (0.98)
2016 0.63 4.31
2017 (6.62) 0.15
Year
Alpha
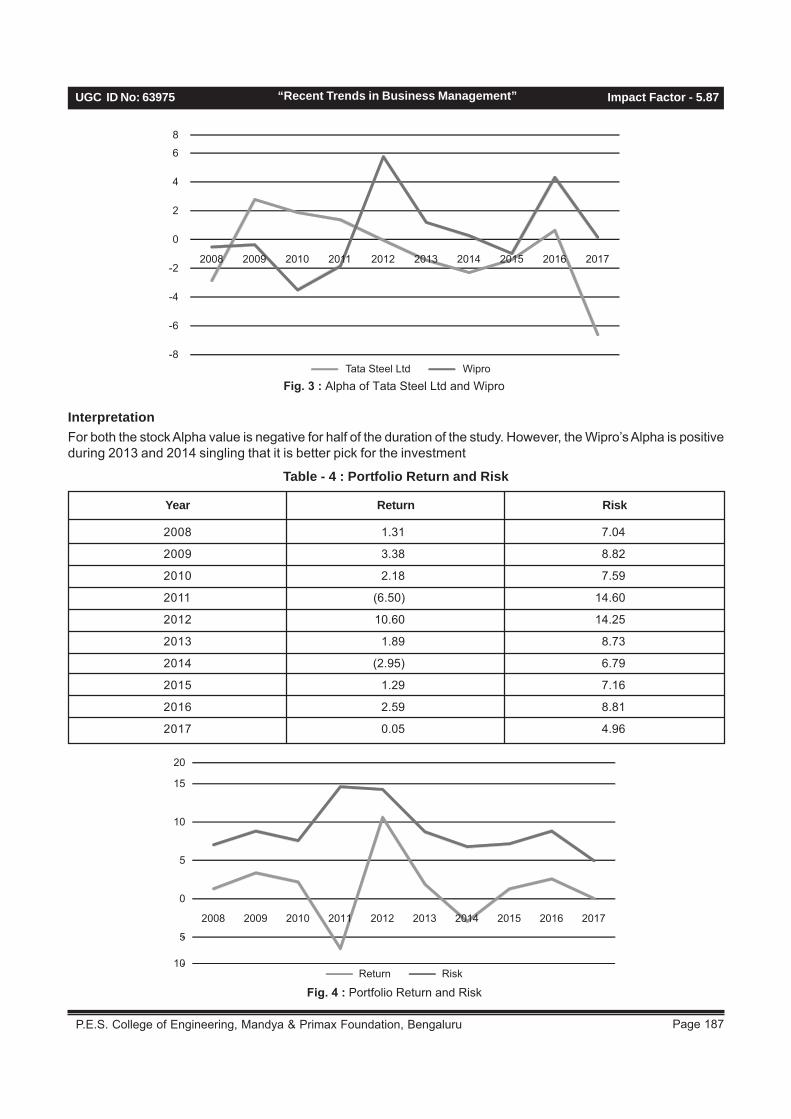
Page 187 P.E.S. College of Engineering, Mandya & Primax Foundation, Bengaluru
UGC ID No: 63975 Impact Factor - 5.87“Recent Trends in Business Management”
-8
-6
-4
-2
0
2
4
6
8
2008 2009 2010 2011 2012 2013 2014 2015 2016 2017
Tata Steel Ltd WiproFig. 3 : Alpha of Tata Steel Ltd and Wipro
InterpretationFor both the stock Alpha value is negative for half of the duration of the study. However, the Wipro’s Alpha is positiveduring 2013 and 2014 singling that it is better pick for the investment
Table - 4 : Portfolio Return and Risk
Return Risk
2008 1.31 7.04
2009 3.38 8.82
2010 2.18 7.59
2011 (6.50) 14.60
2012 10.60 14.25
2013 1.89 8.73
2014 (2.95) 6.79
2015 1.29 7.16
2016 2.59 8.81
2017 0.05 4.96
Year
-10
-5
0
5
10
15
20
2008 2009 2010 2011 2012 2013 2014 2015 2016 2017
Return Risk
Fig. 4 : Portfolio Return and Risk
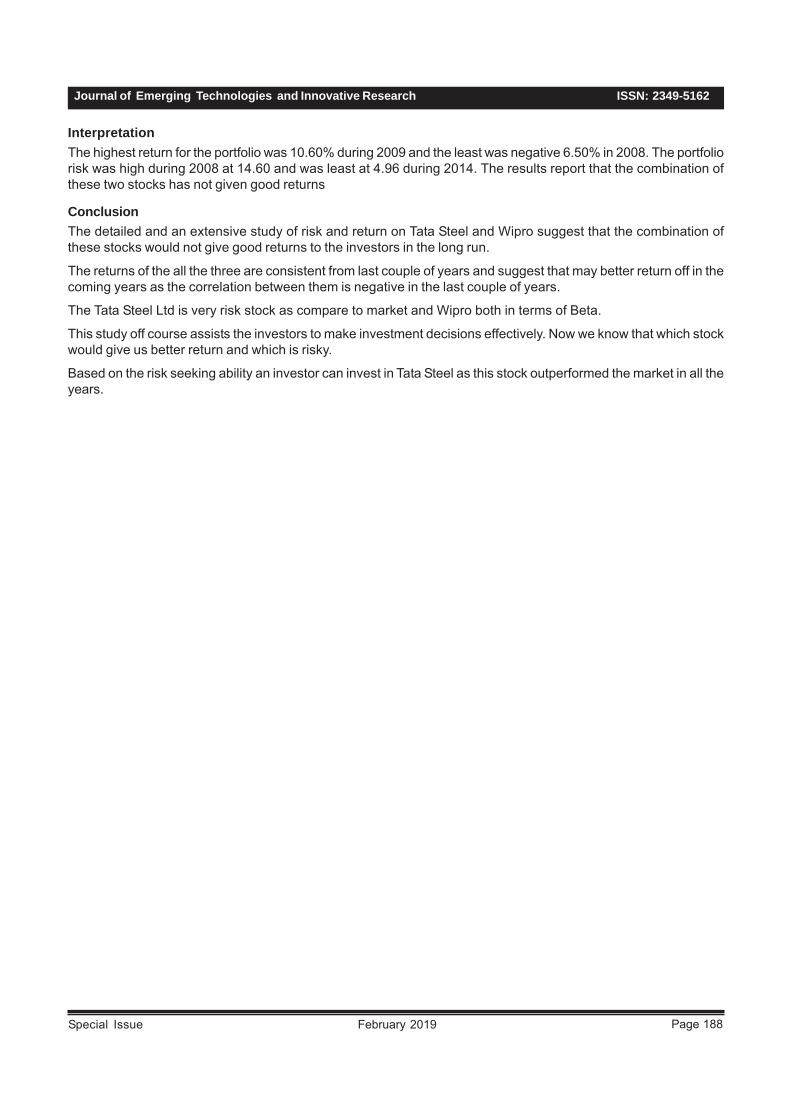
ISSN: 2349-5162Journal of Emerging Technologies and Innovative Research
Page 188February 2019Special Issue
InterpretationThe highest return for the portfolio was 10.60% during 2009 and the least was negative 6.50% in 2008. The portfoliorisk was high during 2008 at 14.60 and was least at 4.96 during 2014. The results report that the combination ofthese two stocks has not given good returns
ConclusionThe detailed and an extensive study of risk and return on Tata Steel and Wipro suggest that the combination ofthese stocks would not give good returns to the investors in the long run.
The returns of the all the three are consistent from last couple of years and suggest that may better return off in thecoming years as the correlation between them is negative in the last couple of years.
The Tata Steel Ltd is very risk stock as compare to market and Wipro both in terms of Beta.
This study off course assists the investors to make investment decisions effectively. Now we know that which stockwould give us better return and which is risky.
Based on the risk seeking ability an investor can invest in Tata Steel as this stock outperformed the market in all theyears.
Page 189 P.E.S. College of Engineering, Mandya & Primax Foundation, Bengaluru
UGC ID No: 63975 Impact Factor - 5.87“Recent Trends in Business Management”
AN EMPIRICAL STUDY OF FACTOR CONTRIBUTING TOWARDSADOPTION OF MOBILE BANKING WITH REFERENCE
TO MANDYA DISTRICT, INDIA
1. Assistant Professor, Dept. Management Studies, PES College of Engineering, Mandya2. Assistant Professor, Dept. of Management, PES College of Engineering, Mandya.3. Dept. Management Studies, PES College of Engineering, Mandya4. Dept. Management Studies, PES College of Engineering, Mandya
Abstract
In the era of internet, technology plays a pivotal role in the life of people. Today survival of human being withouttechnology is almost impossible. Mobile Banking implies use of sophisticated information technology using onlineservices to help banks to provide better and competitive services to its customer. The importance of technology interms of competitive advantages to banks has contributed to effective customer services. Mobile banking is anemerging technology that gives the Indian e-circle a new face. India having a well developed Banking sector haswitnessed considerable growth in E-banking system. Indian Government’s initiative to become a digital economy andrecent demonetization (2016) has contributed to adoption of mobile banking services among the service seekers.Statistically India tops second among top 10 internet using countries in the world, on the contrary is not in the list of Top10 countries where mobile banking services is popular in the world. In this backdrop, the study tries to understand andevaluate mobile banking service users perceived service quality. The study also tries to analyze the factors that arecontributing to adoption of mobile banking services with reference Mandya district using Factor Analysis.
Keywords: Mobile Banking, Digital Economy, E-banking, Perceived Service Quality, Factor Analysis
Suman T.D1
IntroductionMobile banking is the latest technology offered by banksin India. The term M-banking refers to the access tobanking services and facilities offered by financialinstitutions such as account-based saving, paymenttransactions and other products by use of an electronicmobile device. The advent of the internet has changedthe way financial services sector conducts business,empowering organisations with new business modelsand new way to offer 24 hour accessibility to theircustomers. Over the years, the mobile and wirelessmarket has been one of the fastest growing marketsglobally. Over the last few years, the mobile and wirelessmarket has been one of the fastest growing markets inthe world and it is still growing at a rapid race. And alsospread of mobile phones across the developing world isone of the most remarkable technology stories of thepast decade. The penetration of mobile in India has maderapid change in communication system. Apart from thereach of communication device; revolution in mobiletechnology like 2G, 3G, 4G are created more marketwhere the potential people are adopting the latesttechnologies. One can see the impact of mobile bankingtypes due to the advancement in technology.
In the year 2002, Mobile Banking was started in Indiaby way of SMS Banking. Now it is becoming a newgeneration platform in India. Indian banks are taking
efforts to expand the usage and scope of mobile banking.Telecom Regulatory Authority of India (TRAI) issued thenew regulations for mobile banking to ensure faster andreliable communication for enabling banking throughmobile phone. As the number of mobile users in India isincreasing day by day, there is a great scope for mobilebanking. ICICI bank pioneered in mobile banking servicesin India. Among public banks, Union Bank of India wasfirst to introduce mobile banking (2010). Today manycommercial banks have launched mobile banking usingITC technology and now they can reach out to customersand provide them with not only general information aboutits ser-vices but also the opportunity of performinginteractive retail banking transactions anytime, anywhere.Some banks in India have started providing the mobilebanking service to their customers that include StateBank of India (SBI), Union Bank of India (UBI), PunjabNational Bank (PNB), HDFC, ICICI, Axis Bank, etc
Literature reviewNisha Sharma Et al (2016): Conducted a study onMobile banking are now widely used for mobilecommunication as well as mobile service. M-services isa limited concept of eservice, which can provide servicesanywhere at any time. Popularity is popular among ofthis mobile banking. The Indian banking association hasurged investment in evolving and protecting technologiesagainst future threats, as well as the current pressuresfrom malware and social engineering.
Dr. A.C. Kiran Kumar2 Sahana S.N3 Kavya S.T4
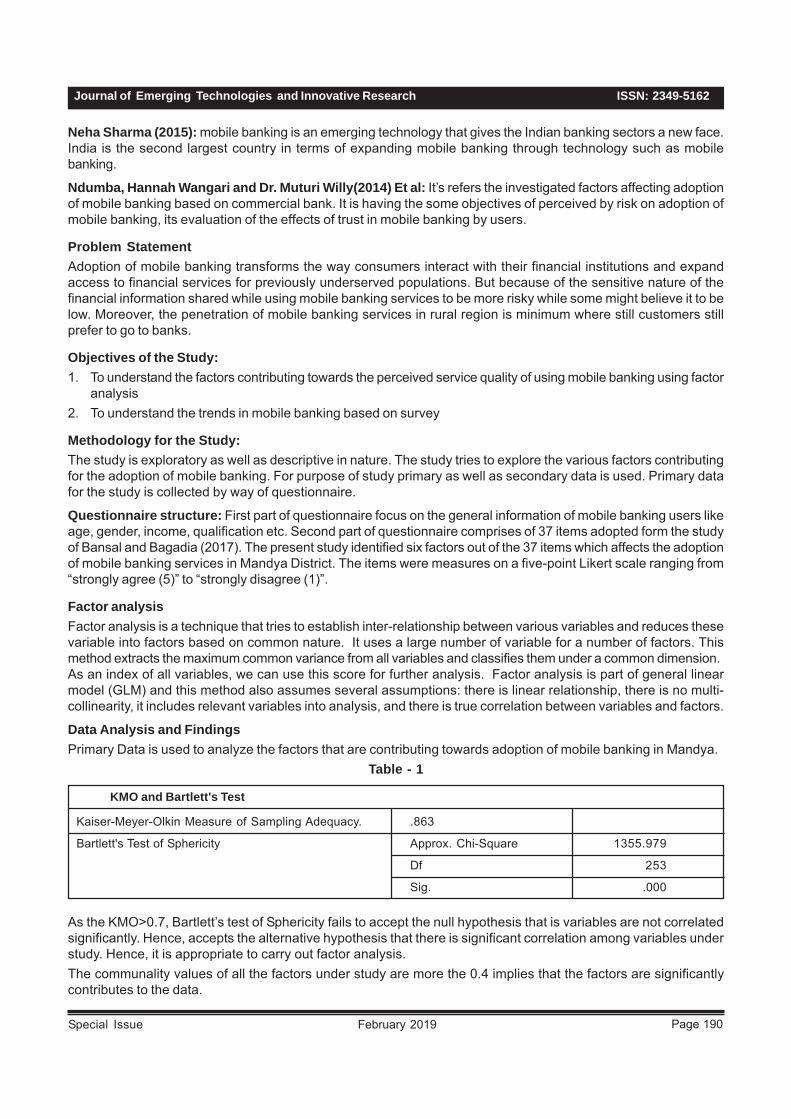
ISSN: 2349-5162Journal of Emerging Technologies and Innovative Research
Page 190February 2019Special Issue
Neha Sharma (2015): mobile banking is an emerging technology that gives the Indian banking sectors a new face.India is the second largest country in terms of expanding mobile banking through technology such as mobilebanking.
Ndumba, Hannah Wangari and Dr. Muturi Willy(2014) Et al: It’s refers the investigated factors affecting adoptionof mobile banking based on commercial bank. It is having the some objectives of perceived by risk on adoption ofmobile banking, its evaluation of the effects of trust in mobile banking by users.
Problem StatementAdoption of mobile banking transforms the way consumers interact with their financial institutions and expandaccess to financial services for previously underserved populations. But because of the sensitive nature of thefinancial information shared while using mobile banking services to be more risky while some might believe it to below. Moreover, the penetration of mobile banking services in rural region is minimum where still customers stillprefer to go to banks.
Objectives of the Study:1. To understand the factors contributing towards the perceived service quality of using mobile banking using factor
analysis2. To understand the trends in mobile banking based on survey
Methodology for the Study:The study is exploratory as well as descriptive in nature. The study tries to explore the various factors contributingfor the adoption of mobile banking. For purpose of study primary as well as secondary data is used. Primary datafor the study is collected by way of questionnaire.
Questionnaire structure: First part of questionnaire focus on the general information of mobile banking users likeage, gender, income, qualification etc. Second part of questionnaire comprises of 37 items adopted form the studyof Bansal and Bagadia (2017). The present study identified six factors out of the 37 items which affects the adoptionof mobile banking services in Mandya District. The items were measures on a five-point Likert scale ranging from“strongly agree (5)” to “strongly disagree (1)”.
Factor analysisFactor analysis is a technique that tries to establish inter-relationship between various variables and reduces thesevariable into factors based on common nature. It uses a large number of variable for a number of factors. Thismethod extracts the maximum common variance from all variables and classifies them under a common dimension. As an index of all variables, we can use this score for further analysis. Factor analysis is part of general linearmodel (GLM) and this method also assumes several assumptions: there is linear relationship, there is no multi-collinearity, it includes relevant variables into analysis, and there is true correlation between variables and factors.
Data Analysis and FindingsPrimary Data is used to analyze the factors that are contributing towards adoption of mobile banking in Mandya.
Table - 1
Kaiser-Meyer-Olkin Measure of Sampling Adequacy. .863
Bartlett's Test of Sphericity Approx. Chi-Square 1355.979
Df 253
Sig. .000
KMO and Bartlett's Test
As the KMO>0.7, Bartlett’s test of Sphericity fails to accept the null hypothesis that is variables are not correlatedsignificantly. Hence, accepts the alternative hypothesis that there is significant correlation among variables understudy. Hence, it is appropriate to carry out factor analysis.The communality values of all the factors under study are more the 0.4 implies that the factors are significantlycontributes to the data.
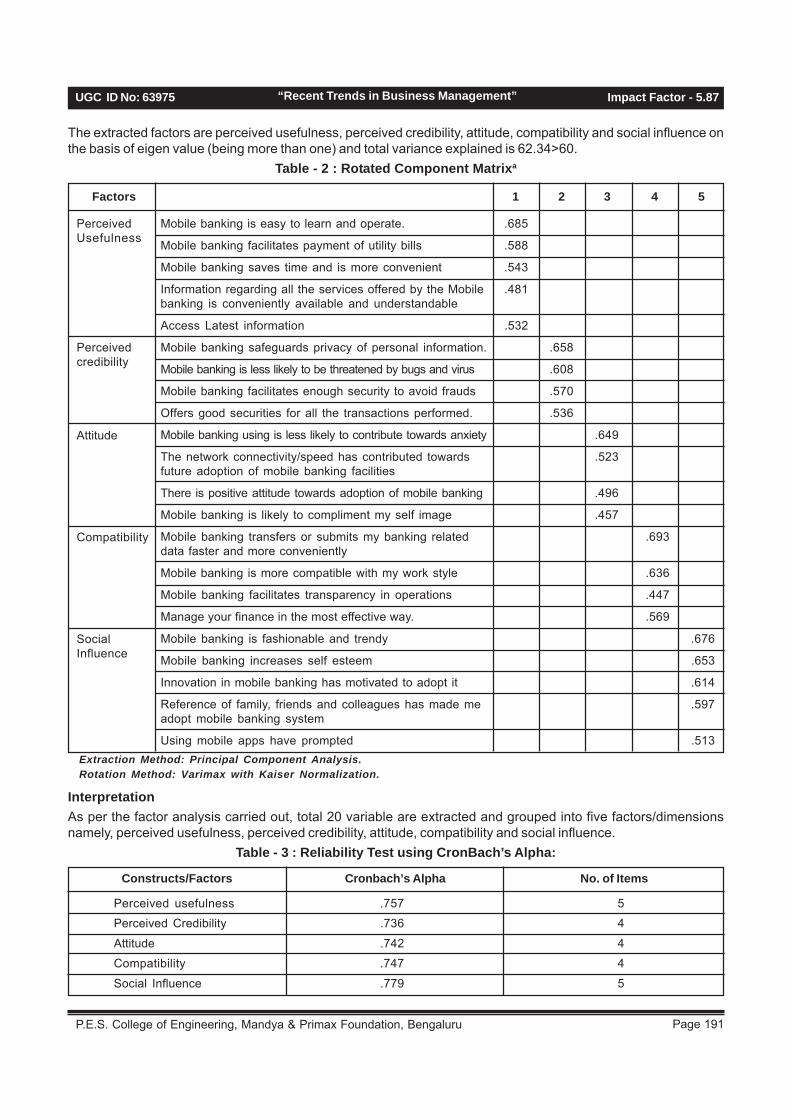
Page 191 P.E.S. College of Engineering, Mandya & Primax Foundation, Bengaluru
UGC ID No: 63975 Impact Factor - 5.87“Recent Trends in Business Management”
The extracted factors are perceived usefulness, perceived credibility, attitude, compatibility and social influence onthe basis of eigen value (being more than one) and total variance explained is 62.34>60.
Table - 2 : Rotated Component Matrixa
1
Mobile banking is easy to learn and operate. .685
Mobile banking facilitates payment of utility bills .588
Mobile banking saves time and is more convenient .543
Information regarding all the services offered by the Mobile .481banking is conveniently available and understandable
Access Latest information .532
Mobile banking safeguards privacy of personal information. .658
Mobile banking is less likely to be threatened by bugs and virus .608
Mobile banking facilitates enough security to avoid frauds .570
Offers good securities for all the transactions performed. .536
Mobile banking using is less likely to contribute towards anxiety .649
The network connectivity/speed has contributed towards .523future adoption of mobile banking facilities
There is positive attitude towards adoption of mobile banking .496
Mobile banking is likely to compliment my self image .457
Mobile banking transfers or submits my banking related .693data faster and more conveniently
Mobile banking is more compatible with my work style .636
Mobile banking facilitates transparency in operations .447
Manage your finance in the most effective way. .569
Mobile banking is fashionable and trendy .676
Mobile banking increases self esteem .653
Innovation in mobile banking has motivated to adopt it .614
Reference of family, friends and colleagues has made me .597adopt mobile banking system
Using mobile apps have prompted .513
Factors
PerceivedUsefulness
Perceivedcredibility
Attitude
Compatibility
SocialInfluence
2 3 4 5
Extraction Method: Principal Component Analysis.Rotation Method: Varimax with Kaiser Normalization.
InterpretationAs per the factor analysis carried out, total 20 variable are extracted and grouped into five factors/dimensionsnamely, perceived usefulness, perceived credibility, attitude, compatibility and social influence.
Table - 3 : Reliability Test using CronBach’s Alpha:
Cronbach’s Alpha No. of Items
Perceived usefulness .757 5
Perceived Credibility .736 4
Attitude .742 4
Compatibility .747 4
Social Influence .779 5
Constructs/Factors

ISSN: 2349-5162Journal of Emerging Technologies and Innovative Research
Page 192February 2019Special Issue
Since the cronbach alpha is > 0.7 the given data set isreliable. Cronsbach alpha is the most common measureof internal consistency. When multiple Likert questionsin a survey is used cronbach alpha is used for reliabilityand acceptable.
Findings:Perceived usefulness: Among the many variables thatmay influence system use, the extent to which anindividual believes that using an information system willenhance their productivity termed as “PerceivedUsefulness”. It is an important factor for measuring theuser acceptance of information technology. This factoris adopted by several studies as an important adoptionfactor such as Schultz and Slevin (1975) and Robey(1979), Chiu et al, (2005), Bansal and Bagadia (2017).
As per the survey:• 64.1% of the respondents strongly agree that mobile
banking is easy to learn and operate.• 72.2% of the respondents strongly agree that mobile
banking facilitates of utility bills of payments.• 66.5% of the respondents strongly agree mobile
banking saves time and more convenient.• 73.9% of the respondents agree all the services
offered by the mobile banking conveniently availableand understandable.
• 72.2% of the respondents strongly agreeconveniently access latest information.
Perceived Credibility: another factor that is consideredimportant that influences the adoption of mobile bankingis perceived credibility. Perceived credibility is definedas textent to which one perceives information to bebelievable. Early research works by Wang et al (2003),Srivastava and Thakur (2013), and Bansal and Bagadia(2017) have strongly believed that this factor influencethe adoption of mobile banking.
As per the survey:• 71.4% of the respondents strongly agree mobile
banking safeguards privacy of personal informationconveniently.
• 72.8% of the respondents strongly agree mobilebanking is less likely to be threatened by bugs andvirus.
• 69.7% of the respondents strongly agree mobilebanking facilitates enough security to avoid frauds.
• 74.9% of the respondents strongly agree offers goodsecurities for all the transactions performed.
Attitude: Attitudes have been uniquely defined by eachdiscipline that uses them and information systems (IS)research is no exception. Attitude is one of the very
important factor in determining the decision of consumersof use mobile banking. Recent studies by Brown et al.(2002), Venkatesh et al. (2003) and Grandon et al. (2011)have used this as factor in assessing the influence ontechnology adoptions.
As per the survey:• Only 67.6% of the respondents strongly agree mobile
banking using is not contributing towards.• 73.5%of the respondents strongly agree network
connectivity/speed has contributed towards futureadoption of mobile banking facilities.
• Only 71.5%of the respondents strongly agree positiveattitude towards.
• 73.2% of the respondents strongly agree mobilebanking is likely to compliment self image only.
Social influence: Loyalty of customers to any productor service is influenced by social interactions ofcustomers with their friends, relatives and co-workers.Social influence is an important construct which hasbeen used in well-known technology adoption modelslike Theory of Reasoned Action (TRA), Theory ofPlanned Behavior (TPB), Technology acceptance model(TAM2), Unified Theory of Acceptance and Use ofTechnology (UTAUT). Many researchers have confirmedthe positive effects of social influence on M-Bankingadoption.
As per the survey:• 74.3% of the respondents strongly agree mobile
banking is fashionable and trendy.• 69.4% of the respondents strongly agree mobile
banking increases self esteem.• 80.8% of the respondents strongly agree innovation
in mobile banking has motivated to adopt it.• 72.8% of the respondents strongly agree reference
of family, friends and colleagues has made me adoptmobile banking system.
• 24% of the respondents strongly agree using mobileapps have prompted.
Compatibility: Compatibility is defined as the degreeto which using a technology is considered consistent tothe potential user’s value, experience and need.Reference states that compatibility is essential aspectof a technology adoption, since compatibility with user’svalue and lifestyle can accelerate adoption rate. In thecontext of mobile banking adoption, compatibility is alsoconsidered an essential attribute. Compatibility is usedas a construct in previous studies by Chen (2013) andBansal Bagadia (2017).
Page 193 P.E.S. College of Engineering, Mandya & Primax Foundation, Bengaluru
UGC ID No: 63975 Impact Factor - 5.87“Recent Trends in Business Management”
As per the survey:• 72.5% of the respondents strongly agree mobile
banking transfers or submits my banking relateddata faster and more conveniently.
• 71.4 % of the respondents strongly agree Mobilebanking is more compatible with my work style.
• 71.8% of the respondents strongly agree mobilebanking facilitates transparency in operations.
• 70.4 % of the respondents strongly agree manageyour finance in the most effective way.
Conclusion:Mobile Banking seems to possess the potential tobecome one of the widely spread and acceptedapplication in banking sector. Today mobile banking iswidely accepted across commercially important sectionsof the society. The rural population is not out of theinfluence of the mobile banking services. With the adventof technology and increasing use of Smartphone andtablet based devices, the use of Mobile Bankingfunctionality would enable customer connect acrossentire customer life cycle much comprehensively thanbefore. This study found perceived usefulness, attitude,and compatibility as the main determinant of intentionto continue using mobile banking. However, perceivedcredibility and social influence have also influence maybe at small proportion.
References:• T. Laukkanen, “Internet vs mobile banking:
Comparing customer value perceptions,” BusinessProcess Management Journal, vol. 13, no. 6, pp.788-797, 2007.
• P. Hanafizadeh, M. Behboudi, A. A. Koshksaray, andM. J. S. Tabar, “Mobile-banking adoption by Iranianbank clients,” Telematics and Informatics, vol. 31,pp. 62-78, 2014.
• F. D. Davis, R. P. Bagozzi, and P. R. Warshaw, “Useracceptance of computer technology: A comparisonof two theoretical models,” Management Science,vol. 35, no. 8, pp. 982-1003, 1989.
• E. M. Rogers, Diffusion of innovations, Fifth ed., NewYork: Free Press, 2003.
• S. Ghosh, H. Surjadaja, and J. Antony, “Optimizationof the determinants of e-service operations,”Business Process Management Journal, vol. 10, no.6, pp. 616-636, 2004.
• A. Parasuraman, V. A. Zeithaml, and L. L. Berry,“SERVQUAL: A multiple item scale for measuringconsumer perceptions of service quality,” Journal ofRetailing, vol. 64, no. 1, pp. 12-40, 1988.
• P. Asubonteng, K. J. McCleary, and J. E. Swan,“SERVQUAL revisited: A critical review of servicequality,” The Journal of Services Marketing, vol. 10,no. 6, pp. 62-81, 1996.
• V. A. Zeithaml, A. Parasuraman, and A. Malhotra,“E-service quality: Definition, dimensions andconceptual model,” Marketing Science Institute,Cambridge, M.A., 2000.
• Banzal S. (2010), “Mobile Banking & M–Commerceand Related Issues”, | 2. www. public.webfoundation.org/.../25.Mobile_banking_M-commerce15.03.pdf [accessed 10 Jul 2010]. | 3.Uppal R.K., Customer Perception of E – BankingServices of Indian Banks: Some Survey.
• Evidence, The ICFAI Journal of Bank Management,Vol. VII No.10. | 4. Donner, J. (2008). Researchapproaches to mobile use in the developing world: Areview of the literature. The Information Society,24(3), 140-159. | 5. Ivatury, G., & Pickens, M. (2006).Mobile phone banking and low-income customers:Evidence from South
• Africa. Washington, DC: Consultative group to assistthe poor (CGAP) and the United Nations Foundation.| 6. Townsend, A. M. (2000). Life in the real-timecity:
• Mobile telephones and urban metabolism. | 7.Journal of Urban Technology, 7(2), 85-104. | 8.Sharma, Prerna, Bamoriya & Preeti Singh (2011) -Issues & Challenges
• In mobile Banking In India: A Customer‘s IPerspective.www.bankrate.com/ûnance/banking/ûnding-best-mobile-banking.aspx. .
• Shift In User Behavior. Retrieved from http://www.mobilegroove.
• com/mobile-banking-apps-convenience-triggers-shift-user-
ISSN: 2349-5162Journal of Emerging Technologies and Innovative Research
Page 194February 2019Special Issue
A STUDY ON IMPACT OF DEMONETIZATION ONSELECTED INDICES OF INDIAN STOCK MARKET
1. Asst. Prof., Dept. of Management, PES College of Engineering, Mandya.2. Asst. Prof., Dept. of Management, PES College of Engineering, Mandya.3. Dept. of Management, PES College of Engineering, Mandya.4. Asst. Prof., PES Degree College, Mandya.
AbstractThe scrutiny focuses on the impact of demonetization on Indian stock market, where demonetization is the act ofstripping paper money of its status as legal tender. 2016’s Demonetization of Indian Economy was one of the historicalevent that aimed at curbing out black money and terrorism along with aspiration to become digital economy.Demonetization impact can be far reaching on the stock markets and investors. The effect of demonetization waswitnessed by various sectors. The sectors which were mainly driven by cash transactions were badly hit whereasbanking, e-commerce were the major gainers of demonetization who cashed on the electronic transactions. Even thesectors which were driven by black money like real estate, construction had to face many challenges due todemonetization. Stock markets are usually subject to systematic as well as unsystematic risk. Demonetization attributesto systematic risk spread across Indian stock market. In this paper an attempt is made to study the impact ofdemonetization on selected sectors indices of Indian stock market using dummy regression analysis. This studydivides the period under consideration into pre and post demonetisation and tries to find out the impact of it onselected indices i.e. Nifty auto, S&P BSE Auto, Nifty bank, S&P BSE Bank, Nifty information technology, S&P BSEinformation technology, Nifty media, S&P BSE telecom, Nifty pharma, S&P BSE health care from major five sectorsnamely, Auto, Bank, Information technology, Telecom, Health care.
Key words: Per-Demonetization, Post-Demonetization, Stock Indices, Dummy Regression.
Suman T.D1
IntroductionOn 8th Nov 2016 Prime Minister Narendra Modiannounced demonetisation by making it an historicalmoment for India. Indian government banned the highdenomination notes of Rs.1000 and Rs.500 as move tobattle Inflation, curb terrorism and black money. Indianeconomy lost 1.5 per cent of GDP in terms of growth asan immediate impact. To understand the impact ofdemonetization on the stock market, one should firstunderstand how significant a move this is. In the pastmany countries have attempted demonetization, somesuccessfully and some unsuccessfully, but all of themwere done when their economies were having majorproblems like hyper-inflation in Germany in the 1920s.This is the first time that a perfectly healthy economyhas attempted it and that too to target black money.
The immediate impact of removing so much money fromcirculation is of course the impact it can have on severalsectors that are driven by the black economy like realestate, construction etc, but more so also the sectorsthat are more driven by cash, because they are the firstthat are affected when so much money is suddenlyremoved from circulation.
Literature ReviewDr.P.Chellasamy, Anu.K.M (2017) in his research titled“The impact of demonetization on the Indian stockmarket” analyzes the role of cash transactions in aninformal economy. Study revealed that Public sectorbanking segment, Pharma, Energy and IT has recordeda rise in returns after the announcement ofdemonetization. The study concluded that the there isa wide spread negative returns across sectors afterdemonetization which reflects the immediate negativesentiments attached with the overall economic activity.
Dr. S. Padmavathy, Dr. M. Umashankar, V. Indhu(2017) conducted a study on “Share price behavior arounddemonetization” analyzes The impact of demonetizationon share price of companies listed in National StockExchange and the population of this study includes indexcompanies of Banking and Automobile sector wereselected. This analysis indicates that demonetizationannouncement does not have any significant impact onIndian stock market.
R. Siva Kumar, P. William Robert, Dr. CH. Balanageswara rao (2017) carried out research “A studyon the impact of demonetization on Bombay StockExchange” This research paper aims to evaluate theimpact of demonetization on sect oral indices of Bombay
Dr. A. C. Kiran Kumar2 Vimala3 Aishwarya Jos4
Page 195 P.E.S. College of Engineering, Mandya & Primax Foundation, Bengaluru
UGC ID No: 63975 Impact Factor - 5.87“Recent Trends in Business Management”
Stock Exchange. The collected data has been analyzedfor the window period -15 to +15 from the announcementdate. The result of the study finds that the cashdependent and consumption based sectors werenegatively affected while the financial sectors were thebiggest beneficiaries.
Methodology of The StudyThe study is descriptive and based on literature reviewbasis. The study tries to describe the impact ofdemonetization on Indian stock market. The data usedis from secondary sources NIFTY Indices and BSINDIA.It also includes different books, journals, newspaper andrelevant websites articles as secondary source ofinformation. Dummy Regression Analysis is used toanalyze the impact of demonetization (Pre and Post) onstock market.
Augmented Dickey–Fuller test (ADF)For all Time series data testing stationarity is mandatory.Time series data cannot be used for analysis withoutaccessing the stationarity test. Augmented Dickey-Fullertest is one test used to check the stationarity of thetimes series data under consideration. Tests the nullhypothesis that a unit root is present in a time seriessample. The alternative hypothesis is different dependingon which version of the test is used, but is usuallystationarity or trend-stationarity. It is an augmentedversion of the Dickey–Fuller test for a larger and morecomplicated set of time series models. The more negativeit is the stronger the rejection of the hypothesis thatthere is a unit root at some level of confidence.
ΔYt = γ Yt - 1 +p
pi - 1
(δi Δ Y1 - i) + et∑
ΔYt = α + γ Yt - 1 +i - 1
(δi Δ Yt - i) + et∑p
ΔYt = α + βt + γ Yt - 1 +i - 1
(δi Δ Yt - i) + et∑
Dummy Regression Analysis: In statistics andeconometrics, particularly in regression analysis,a dummy variable is one that takes the value 0 or 1 toindicate the absence or presence of some categoricaleffect that may be expected to shift the outcome. Adummy independent variable (also called a dummyexplanatory variable) which for some observation has avalue of 0 will cause that variable’s coefficient to haveno role in influencing the dependent variable, while whenthe dummy takes on a value 1 its coefficient acts toalter the intercept.
Nifty Auto Index: The NIFTY Auto Index is designed toreflect the behavior and performance of the Indianautomobiles sector. The NIFTY Auto Index is computedusing free float market capitalization method with a basedate of January 1, 2004 indexed to a base value of 1000.
Nifty Bank Index: It is comprised of the most liquidand large capitalized Indian Banking stocks. It providesinvestors and market intermediaries with a benchmarkthat captures the capital market performance of IndianBanks.
Nifty IT Index: Information Technology (IT) industry hasplayed a major role in the Indian economy. In order tohave a good benchmark of the Indian IT sector, NIFTY ITsector index has been developed. NIFTY IT providesinvestors and market intermediaries with an appropriatebenchmark that captures the performance of the ITsegment of the market in India
Nifty Media Index: The NIFTY Media Index is designedto reflect the behavior and performance of the Media &Entertainment sector including printing and publishingin India.
Nifty Pharma Index: The NIFTY Pharma Index isdesigned to reflect the behavior and performance of thepharmaceutical sector in India.
Data Analysis and Findings:Trend analysis of selected Indices of selectedsectorsAuto Sector (Fig. 1)From the chat it is clear that during the demonetizationi.e. form Nov., 2016 to March 2017 both Nifty auto andS&P BSE Auto shows stepper fall in price. However, theprice shows a upward trend after the demonetizationperiod and steady accelerates upward trend.
Banking Sector (Fig. 2)From the chat it is clear that during the demonetizationi.e. form Nov., 2016 to March 2017 Nifty Bank and formNov., 2016 to July 2017 S&P BSE Bank shows stepperfall in price. However, the price shows a upward trendafter the demonetization period and steady acceleratesupward trend.
Information Technology Sector (Fig. 3)From the chat it is clear that during the demonetizationi.e. form Nov., 2016 to June 2018 Nifty IT and form Nov.,2016 to March 2017 S&P BSE IT shows stepper fall inprice. However, the price shows a upward trend after thedemonetization period and steady accelerates upwardtrend.
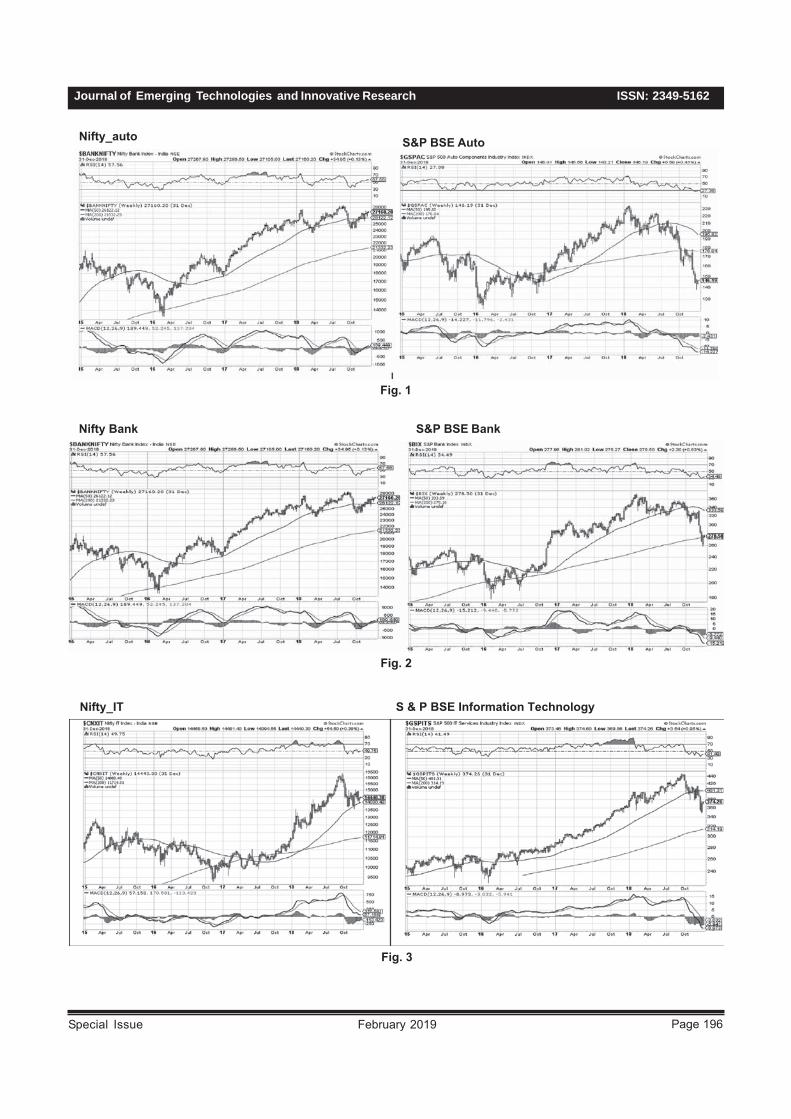
ISSN: 2349-5162Journal of Emerging Technologies and Innovative Research
Page 196February 2019Special Issue
Nifty_auto S&P BSE Auto
Fig. 1
Fig. 2
Nifty Bank S&P BSE Bank
Fig. 3
Nifty_IT S & P BSE Information Technology

Page 197 P.E.S. College of Engineering, Mandya & Primax Foundation, Bengaluru
UGC ID No: 63975 Impact Factor - 5.87“Recent Trends in Business Management”
Telecom Sector
Fig. 4
Nifty_telecom S & P BSE Telecom
From the chat it is clear that during the demonetization i.e. form Nov., 2016 to June 2018 Nifty Telecom and formNov., 2016 to March 2017 S&P BSE telecom shows stepper fall in price. However, the price shows a upward trendafter the demonetization period and steady accelerates upward trend.
Pharma Sector
Fig. 5
Nifty_pharma S & P BSE Healthcare
From the chat it is clear that during the demonetization i.e. form Nov., 2016 to March 2017 S&P BSE Healthcareand in Nifty pharma shows stepper fall in price. However, the price shows a upward trend after the demonetizationperiod and steady accelerates upward trend.
ISSN: 2349-5162Journal of Emerging Technologies and Innovative Research
Page 198February 2019Special Issue
ADF TESTNull Hypothesis: Indices has a unit rootAlternative Hypothesis: Indices does not have a unit root
Table - 1 : Results of Augmented Dickey-Fuller Test
Nifty auto -0.002895 -0.966073 -0.013252 -0.023589
BSE auto -0.002765 -0.9525 -0.033684 -0.053382
Nifty bank -0.01494 -0.965586 0.35349 0.009587
BSE_Bank -0.016319 -0.977545 0.304506 0.007834
Nifty IT -0.00845 -0.985005 0.094751 0.028637
BSE_IT -0.006847 -0.974483 0.058211 0.02342
Nifty Media -0.004008 -0.950081 -0.005487 -0.008487
BSETELE -0.006159 -0.972845 -0.002363 -0.001528
Nifty Pharma -0.027367 -0.920517 -0.101337 0.018199
BSE_Healthcare -0.031696 -0.882658 494.138 0.01992
TrendInterceptVariable
Level 1st difference level 1st difference
Since the p value is >0.05 at level as such we fail to accept null hypothesis. Therefore, the given data is non-stationary. Hence the p value is >0.05 at level as such we accept null hypothesis. Therefore, the underlying data isstationary.
HYPOTHESIS TESTINGH01 : There is no significant impact of demonetization on S & P BSE AUTO and NIFTY AUTO IndicesH1 : There is significant impact of demonetization on S & P BSE AUTO and NIFTY AUTO Indices
DBSE_AUTO / DNIFTY_AUTO = β0 + β1 D + μi
D(DBSE_AUTO / DNIFTY_AUTO /Di=0) = β0 ++ μi
D(DBSE_AUTO / DNIFTY_AUTO /Di=1) = β0 + β1 ++ μi
Table - 2
Dependent Variable: DBSE_AUTO
Variable Coefficient Std. Error t-Statistic Prob.
Variable Coefficient Std. Error t-Statistic Prob.
C 14.91474 14.87169 1.002895 0.3162
PRE_DEMONE -18.1799 17.9869 -1.01073 0.3125
Durbin-Watson stat 1.901401
Dependent Variable: DNIFTY_AUTO
C 3.003052 7.747312 0.387625 0.6984
PRE_DEM -3.91406 9.370166 -0.41772 0.6763
Durbin-Watson stat 1.928577
(Sources: Eviews 9)

Page 199 P.E.S. College of Engineering, Mandya & Primax Foundation, Bengaluru
UGC ID No: 63975 Impact Factor - 5.87“Recent Trends in Business Management”
Since the p<.05 null hypotheses is accepted and we fail to accept alternative hypotheses. Therefore, there is notsignificant impact of demonetization on NIFTY Auto and S&P BSE Auto Indices.Pre-Demonetization DBSE_AUTO = 14.914+ μi
Post-Demonetization DBSE_AUTO = 14.914-18.18D+μi
Pre-Demonetization DNIFTY_AUTO = 3.003 + μi
Post-Demonetization DNIFTY_AUTO = 3.003 -3.914D +μi
H02 : There is no significant impact of demonetization on S & P BSE Bank and NIFTY Bank IndicesH2 : There is significant impact of demonetization on S & P BSE Bank and NIFTY Bank IndicesDBSE_BANK / DNIFTY_BANK = β0 + β1 D + μi
D(DBSE_BANK / DNIFTY_BANK /Di=0) = β0
D(DBSE_BANK / DNIFTY_BANK /Di=1) = β0 + β1
Table - 3
Dependent Variable: DBSE_BANK
Variable Coefficient Std. Error t-Statistic Prob.
Variable Coefficient Std. Error t-Statistic Prob.
C 9.525863 16.34307 0.58286 0.5601
PRE_DEM 6.797148 19.7665 0.343872 0.731
Durbin-Watson stat 1.953936
Dependent Variable: DNIFTY_BANK
C 11.61201 17.98893 0.645509 0.5188
PRE_DEM 9.216356 21.75713 0.423602 0.672
Durbin-Watson stat 1.930111
(Sources: Eviews 9)
Since the p<.05 null hypotheses is accepted and we fail to accept alternative hypotheses. Therefore, there is notsignificant impact of demonetization on NIFTY Bank and S&P BSE Bank Indices.Pre-Demonetization DBSE_BANK =9.525863+ μi
Post-Demonetization DBSE_BANK = 9.5258+6.797D+μi
Pre-Demonetization DNIFTY_BANK =11.61201 + μi
Post-Demonetization DNIFTY_BANK = 11.612+9.216D +μi
H03 : There is no significant impact of demonetization on S & P BSE IT and NIFTY IT IndicesH3 : There is significant impact of demonetization on S&P BSE IT and NIFTY IT IndicesDBSE_IT / DNIFTY_IT = β0 + β1 D + μi
D(DBSE_IT / DNIFTY_IT /Di=0) = β0
D(DBSE_IT / DNIFTY_IT /Di=1) = β0 + β1
Table - 4
Dependent Variable: DBSE_IT
Variable Coefficient Std. Error t-Statistic Prob.
C -5.92357 8.064526 -0.734522 0.4628
PRE_DEM 13.89387 9.753827 1.424453 0.1547
Durbin-Watson stat 1.95065
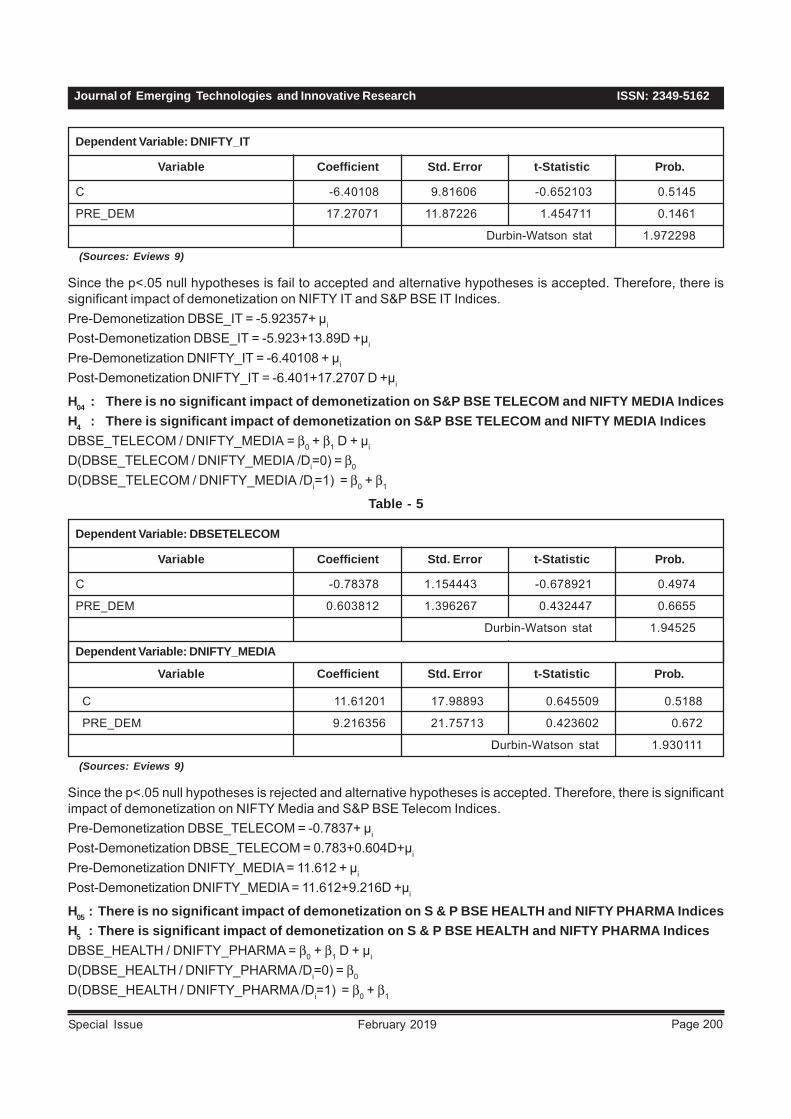
ISSN: 2349-5162Journal of Emerging Technologies and Innovative Research
Page 200February 2019Special Issue
Dependent Variable: DNIFTY_IT
Variable Coefficient Std. Error t-Statistic Prob.
C -6.40108 9.81606 -0.652103 0.5145
PRE_DEM 17.27071 11.87226 1.454711 0.1461
Durbin-Watson stat 1.972298
(Sources: Eviews 9)
Since the p<.05 null hypotheses is fail to accepted and alternative hypotheses is accepted. Therefore, there issignificant impact of demonetization on NIFTY IT and S&P BSE IT Indices.Pre-Demonetization DBSE_IT = -5.92357+ μi
Post-Demonetization DBSE_IT = -5.923+13.89D +μi
Pre-Demonetization DNIFTY_IT = -6.40108 + μi
Post-Demonetization DNIFTY_IT = -6.401+17.2707 D +μi
H04 : There is no significant impact of demonetization on S&P BSE TELECOM and NIFTY MEDIA IndicesH4 : There is significant impact of demonetization on S&P BSE TELECOM and NIFTY MEDIA IndicesDBSE_TELECOM / DNIFTY_MEDIA = β0 + β1 D + μi
D(DBSE_TELECOM / DNIFTY_MEDIA /Di=0) = β0
D(DBSE_TELECOM / DNIFTY_MEDIA /Di=1) = β0 + β1
Table - 5
Dependent Variable: DBSETELECOM
Variable Coefficient Std. Error t-Statistic Prob.
Variable Coefficient Std. Error t-Statistic Prob.
C -0.78378 1.154443 -0.678921 0.4974
PRE_DEM 0.603812 1.396267 0.432447 0.6655
Durbin-Watson stat 1.94525
Dependent Variable: DNIFTY_MEDIA
C 11.61201 17.98893 0.645509 0.5188
PRE_DEM 9.216356 21.75713 0.423602 0.672
Durbin-Watson stat 1.930111
(Sources: Eviews 9)
Since the p<.05 null hypotheses is rejected and alternative hypotheses is accepted. Therefore, there is significantimpact of demonetization on NIFTY Media and S&P BSE Telecom Indices.Pre-Demonetization DBSE_TELECOM = -0.7837+ μi
Post-Demonetization DBSE_TELECOM = 0.783+0.604D+μi
Pre-Demonetization DNIFTY_MEDIA = 11.612 + μi
Post-Demonetization DNIFTY_MEDIA = 11.612+9.216D +μi
H05 : There is no significant impact of demonetization on S & P BSE HEALTH and NIFTY PHARMA IndicesH5 : There is significant impact of demonetization on S & P BSE HEALTH and NIFTY PHARMA IndicesDBSE_HEALTH / DNIFTY_PHARMA = β0 + β1 D + μi
D(DBSE_HEALTH / DNIFTY_PHARMA /Di=0) = β0
D(DBSE_HEALTH / DNIFTY_PHARMA /Di=1) = β0 + β1
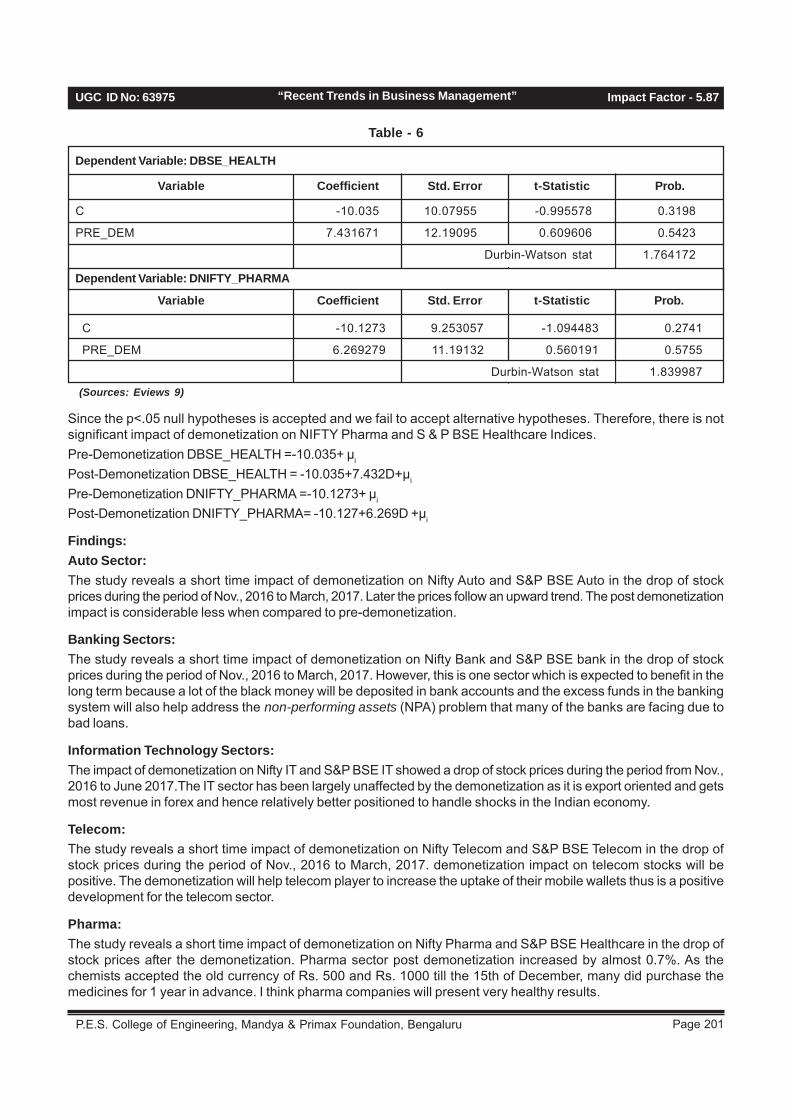
Page 201 P.E.S. College of Engineering, Mandya & Primax Foundation, Bengaluru
UGC ID No: 63975 Impact Factor - 5.87“Recent Trends in Business Management”
Table - 6
Dependent Variable: DBSE_HEALTH
Variable Coefficient Std. Error t-Statistic Prob.
Variable Coefficient Std. Error t-Statistic Prob.
C -10.035 10.07955 -0.995578 0.3198
PRE_DEM 7.431671 12.19095 0.609606 0.5423
Durbin-Watson stat 1.764172
Dependent Variable: DNIFTY_PHARMA
C -10.1273 9.253057 -1.094483 0.2741
PRE_DEM 6.269279 11.19132 0.560191 0.5755
Durbin-Watson stat 1.839987
(Sources: Eviews 9)
Since the p<.05 null hypotheses is accepted and we fail to accept alternative hypotheses. Therefore, there is notsignificant impact of demonetization on NIFTY Pharma and S & P BSE Healthcare Indices.Pre-Demonetization DBSE_HEALTH =-10.035+ μi
Post-Demonetization DBSE_HEALTH = -10.035+7.432D+μi
Pre-Demonetization DNIFTY_PHARMA =-10.1273+ μi
Post-Demonetization DNIFTY_PHARMA= -10.127+6.269D +μi
Findings:Auto Sector:The study reveals a short time impact of demonetization on Nifty Auto and S&P BSE Auto in the drop of stockprices during the period of Nov., 2016 to March, 2017. Later the prices follow an upward trend. The post demonetizationimpact is considerable less when compared to pre-demonetization.
Banking Sectors:The study reveals a short time impact of demonetization on Nifty Bank and S&P BSE bank in the drop of stockprices during the period of Nov., 2016 to March, 2017. However, this is one sector which is expected to benefit in thelong term because a lot of the black money will be deposited in bank accounts and the excess funds in the bankingsystem will also help address the non-performing assets (NPA) problem that many of the banks are facing due tobad loans.
Information Technology Sectors:The impact of demonetization on Nifty IT and S&P BSE IT showed a drop of stock prices during the period from Nov.,2016 to June 2017.The IT sector has been largely unaffected by the demonetization as it is export oriented and getsmost revenue in forex and hence relatively better positioned to handle shocks in the Indian economy.
Telecom:The study reveals a short time impact of demonetization on Nifty Telecom and S&P BSE Telecom in the drop ofstock prices during the period of Nov., 2016 to March, 2017. demonetization impact on telecom stocks will bepositive. The demonetization will help telecom player to increase the uptake of their mobile wallets thus is a positivedevelopment for the telecom sector.
Pharma:The study reveals a short time impact of demonetization on Nifty Pharma and S&P BSE Healthcare in the drop ofstock prices after the demonetization. Pharma sector post demonetization increased by almost 0.7%. As thechemists accepted the old currency of Rs. 500 and Rs. 1000 till the 15th of December, many did purchase themedicines for 1 year in advance. I think pharma companies will present very healthy results.

ISSN: 2349-5162Journal of Emerging Technologies and Innovative Research
Page 202February 2019Special Issue
ConclusionThe impact on stock market is temporary i.e. the pricesof stocks were fluctuating in the week of announcementof demonetization. The result reveals that public sectorbanking segment, Telecom, Auto and IT has recorded arise in stock price after a short period. However, Healthcare sector showed a consistent downward trend in theindices price. Since demonetization has not affected thestocks of the selected sectors, investors need not worryabout their investment and it was a better opportunityfor investors and speculators to purchase stocks at lowerprices when they were trading at lower prices in the weekof announcement of demonetization. Speculators whobuy at lower prices with the expectations of selling themat higher prices in future had expected that this movewould drastically affect the market and the impact wouldbe long period but this study proved that demonetizationhad no impact on stock market.
References• Kavita Rao et. al., Demonetization: Impact on the
Economy. Working paper no 182. National instituteof Public finance and policy, 2016.
• Ramesh S, Rajumesh. Stock market reaction topolitical events: A study of listed companies inColombo stock exchange of Sri Lanka. Journal of
Economics and Sustainable Development 2015; 6(3):131-139.
• Sathyanarayana S, Gargesha S. Impact of BREXITReferendum on Indian Stock Market. InternationalJournal of Management & Social Sciences 2016;5(1): 104-121.
• Shah S, Mehta D. Impact of Dividend Announcementon Share Prices. Anevesha 2016; 9(2): 10-19.
• Joel Rebello & Gayatri Nayak, (Nov 29, 2016)Demonetisation and its side-effects, The EconomicTimes,Retreivedfrom http://economictimes.indiatimes.com/articleshow/55678393.cms? utm_source =content of interest & utm_medium=text &utm_campaig n=cppst
• Narendra Nathan (November 14 2016),Howdemonetisation and Donald Trump’s victory impactyour investments, The Economic Times, Retreivedfrom http://economictimes.indiatimes.com/articleshow/55384579. cms? utm_source=content ofinterest & utm_ medium=text & utm_ campaign =cppst
• Pronab Sen, (16/11/2016) Modi’s DemonetisationMove May Have Permanently Damaged India’sInformal Sector
Page 203 P.E.S. College of Engineering, Mandya & Primax Foundation, Bengaluru
UGC ID No: 63975 Impact Factor - 5.87“Recent Trends in Business Management”
HUMAN RESOURCE ACCOUNTING
1. Assistant Professor, Christ Academy Institute for Advanced Studies, Bangalore.
Abstract
The concept of human resource accounting is one of comparatively recent origin in the business world. Humanresources are the most essential part of an organizations workforce. Without it, companies are nothing but emptydesks and offices. The prime powers and abilities that organizations have, come from the employees and employers.Due to the increasing emphasis put on human resources, a new line of accounting has come up called humanresource accounting. This paper attempts to explain the various aspects of human resource accounting and why it hasbecome an integral part of the accounting process in an organisation. It also touches on the importance of auditing ofhuman resources.
Key words: Human resource accounting, Human resource audit.
Deepa Anil1
Objectives of This Study1. To highlight the importance of Human Resource
Accounting in organisations2. To understand how it assists in organisational
development.3. To bring out the importance of being able to identify
the levels of efficiency in human capital in order toevaluate them properly.
IntroductionThough the concept of HRA was first developed in the17th century, research on the subject started only aslate as the 1960s. The need for human asset valuationarose as a result of growing concern for human relationsmanage-ment in the industry. Measuring the value ofhuman resources can assist organizations in accuratelydocumenting their assets. Maintaining relations withyour employees and staff is of crucial importance if youwant your organization to succeed in today’s world. Theemphasis on human resources has increased since thelate 1990’s leading to a revised outlook on the humanresource of individual companies. Different organizationscater to the needs of their employees in different ways.This is what makes a crucial and smart differencebetween the companies at the top and bottom of thestack. Human resource accounting has risen due tovarious reasons including monitoring effectively the useof human resources by the management which includes,• Analysis of the Human Asset and whether such
assets are conserved, depleted, or appreciated inthe course of a particular period.
• Aiding in the development of management principlesand proper decision making for the future, byclassifying financial consequences of variouspractices.
It also involves identifying the manpower of theorganisation and relating the information to necessaryparties. In Human resource accounting, manpower isconsidered as the key asset.
Importance of HR AccountingAt a time when most economies are shifting fromtechnology and manufacturing based to service based,human capital is being considered as the biggest asset.The success of any organisation depends to a largeextent on the calibre and skills of its human resource.
Through HRA, it is possible for an organization to checkthe costs involved in hiring an employee and calculatethe return on investment. It is to be noted here that inrecent times HRA is treated more as an investment ratherthan as a cost in most organisations. Just like in anyother asset, any expense incurred in its acquisition willbe treated as an investment. This acquisition costconsists primarily of the cost of recruitment, selection,placement, training and welfare expenses. Accountingfor these costs can help to reallocate the employee tomore productive activities and thereby reduce cost.One of the primary reasons that HRA should be takenup in organisations is to decide on whether an employeeshould be promoted, transferred or retrenched.Valuation of human assets along with other intangibleassets seems to be a major problem faced by organisationstoday. There are many ways in which they can beclassified such as intellectual, social, emotional etcIntellectual capital is the knowledge levels, skills etc.,social capital refers to the relationships within and outsidethe organisation, while emotional capital is the risk-takingability and other such qualities of the person.Out of the four factors of production, Land, labour, capitaland organisation, labour or human resource is the only
ISSN: 2349-5162Journal of Emerging Technologies and Innovative Research
Page 204February 2019Special Issue
factor that had not been accounted for in the conventionalsense. However, the last 2 decades has seen an increasein the interest and research by organisations to find asuitable way to account for human resources.Before accounting for human resources it is alsonecessary to review the performance of the employee inorder to assess the actual worth or contribution of thatemployee. For this, human resource benchmarking maybe done where, just like organisational benchmarking,the performance of each employee is evaluated againsta pre-set standard. This not only helps in accountingbut also in identifying weaknesses in employees,introducing corrective measures and thereby improvingoverall performance.
Methods Used In HR AccountingThere are several methods that are applied in thecalculation of human assets like Historical cost method,replacement cost method, opportunity cost method etc.that can be used while accounting for human resources.The historical cost method, the value of the humanresources is taken by considering the cost incurred inhiring or acquisition of the asset, plus the cost of trainingand induction. In some cases this may also includecosts like relocation expenses, travelling cost etc. Butthis may not show the true value of the resource sincethe cost incurred for training an experienced employeeis considerably less than others.The replacement cost method on the other hand measuresthe sacrifice that has to be made to replace a personwith the same abilities and who would give the same output.The opportunity cost approach is usually used whenemployees are scarce – in other words, the worth of anemployee can be measured based on how much it wouldcost to use him in another department or job in the sameorganisation.
HR Accounting In IndiaHuman Resource Accounting is comparatively a newpractice in India with very few companies actuallyincluding human capital in their balance sheet. Perhapsthe reason is that small and medium companies find ittoo cumbersome and expensive to implement it.Another reason may also be that in the absence of anyset standard, it is up to each individual organisation tocome up with their own standards to measure theiremployee’s worth. While large organisations like BHEL,RELIANCE and INFOSYS have been following thepractice of HRA, a vast majority have still not includedthis as an integral part of their accounting process.
Human Resource AuditOnce an organisation has set standards and accountedfor its human resources, it undertakes the process of
evaluation to measure the effectiveness of the system.This systematic evaluation of a company’s HumanResource Management system is called HumanResource Audit. A HR Audit helps a company to identifyareas that need improvement and check for lapses incompliance of laws if any.Human resource audits are not mandatory butorganisations are opting for conducting audit of theirhuman capital with a view to identify strengths andweaknesses and to regularise any discrepancies thatmay have been identified. It is a laborious process whichinvolves detailed processing of employee records, theirreasons for absenteeism and turnover, compensationclaims, reports of performance appraisal etc.Though audits need not be conducted every year, it mustbe done at least once in two years to help identify lapsesin compliance and to update any policies and practicesto make them more user friendly.
SuggestionsThe following suggestions may be considered byorganisations:1. All organisations should take up Accounting for
human resources as an integral part of theiraccounting process.
2. Evaluation of all employees must be based on aproper accounting system.
3. Investment in human resources can be limited tothose areas which yield high returns.
It must however be noted that there is no universallyaccepted method for human resource accounting andorganisations can adopt any method they see fit.
ConclusionWe may rightly conclude that accounting for humanresources has now become an integral part of accountingin organisations. In today’s challenging businessenvironment, it has become imperative for organisationsto properly manage and retain good employees. In thiscontext, human resource accounting and auditing haveassumed immense importance. After all the mostimportant asset for any organisation is human capital.
Bibliography1. Rao VSP, ‘Human Resource Management, Text and
Cases’, Excel books.2. Rensis Likert and David G Bowers, ’Organisational
Theory and Human Resource Accounting’3. Eric Flamholtz, “Human Resource Accounting”
Dickenson Pub.Co.,4. William.B.Werther and Keith Davis, Human
Resource Management and Personnel Management,Mc Graw Hill

Page 205 P.E.S. College of Engineering, Mandya & Primax Foundation, Bengaluru
UGC ID No: 63975 Impact Factor - 5.87“Recent Trends in Business Management”
FACTOR AFFECTING CONSUMER’S BRAND PREFERENCEOF ELECTRONIC DURABLE PRODUCTS
1. Doctorate Research Scholar, School of Management Studies, Vels Institute of Science Technology and Advanced Studies,Vels University, Chennai, India.
AbstractThe purpose of this study is to compile the antecedents and components of brand preferences and to create acomprehensive framework for measuring brand preferences in Indian consumer products. Every effort was made tocollect relevant studies. The review is carried out in great detail in order to obtain a detailed knowledge of the subjectunder study. A total 521 respondents were interviewed through structured questionnaire, and test was used to find thereliability of the questionnaire. The data collection questionnaire contains various questions which include Likertscale questions to investigate on consumer brand preference of electronics durables products. The researcher hasused statistical techniques to reach at conclusion of this study. Our study found that the factors like Brand Preference,Perceived Quality, Convenient Services, Price, Information and Purchase Decision are the most important factorswhich influence the consumer preference towards Electronic durables. Demographical Factors such as Age, Gender,Marital Status, Qualification, Occupation, Income and Family Structure also plays a key role in selecting BrandedDurable products.
Keywords: Electronic durables, Brand Preference, Consumer Behaviors, Products, Quality
D. Prabha1
IntroductionThe purpose of this study is to compile the antecedentsand components of brand preferences and to create acomprehensive framework for measuring brandpreferences in Indian consumer products. Every effortwas made to collect relevant studies. The review is carriedout in great detail in order to obtain a detailed knowledgeof the subject under study. These studies were carriedout by renowned Indian and foreign journals, PhD. Thesesand research works unpublished. These studies outlinethe theories involved in the research and provide thevariables with conceptual clarity. Indeed, this review is avaluable help in defining the research problem. This studyis comprehensive by including various factors that guidethe purchasing behavior of various electrical andelectronic appliances in your home. The related studieswere therefore found to be useful in identifying andformulating research problems that focus on production,marketing, after-sales services, and purchasing factors,buying behavior, brand preferences and customersatisfaction. This chapter provides information on thestudies of the researcher’s home appliances.
Literature ReviewJames U. McNeal, Chyon-Yeh, (2016)1 examinedUnethical Consumer Behavior Tolerance provides animportant key insight into how people act as consumersworldwide. This study investigates consumer reactionsto unethical consumer behavior scenarios using sampledata from Austria, Brunei, France, Hong Kong, the UnitedKingdom and the United States.
Koufaris and Hampton (2002)2 studied the consumerbehavior of online shopping. He insisted that perceivedusefulness in TAM had more important influence onconsumer behavior of online shopping compared to othervariables. From the research of previous people, we canfound that the key determinant is perceived usefulnessof consumers whether consumers are willing to accepta new information systems or technology in TAM.
Todd (2011)3 considered that the trust was the consumerperception of the business commitments and consumerawareness of the business honest behavior.
Lee and Turban (2010)4 studied the trust tendency ofconsumers would act on trust through three factors ofsafety, online shopping environment, and trustworthinessof online businesses together.
Jain and Sharma (2000)5 considered 584 respondentsof Delhi in five different product categories in terms ofboth durability and frequency of purchase as required.The study insist that the levels of consumer involvementdiffer across products. As against non-durables, consumerperceives electronic durables as more involving products.
Gupta and Raghbir Singh (2002)6 analyzed the behaviorof consumers in Amritsar in selecting TV sets. The studywas empirically based. The questionnaire for the surveywas prepared and 300 customers were taken as sample.Sampling technique for convenience was used. Theyanalyzed that the consumers purchasing decisions arealways influenced by a wide range of factors that leadthem to choose a specific brand instead of others.
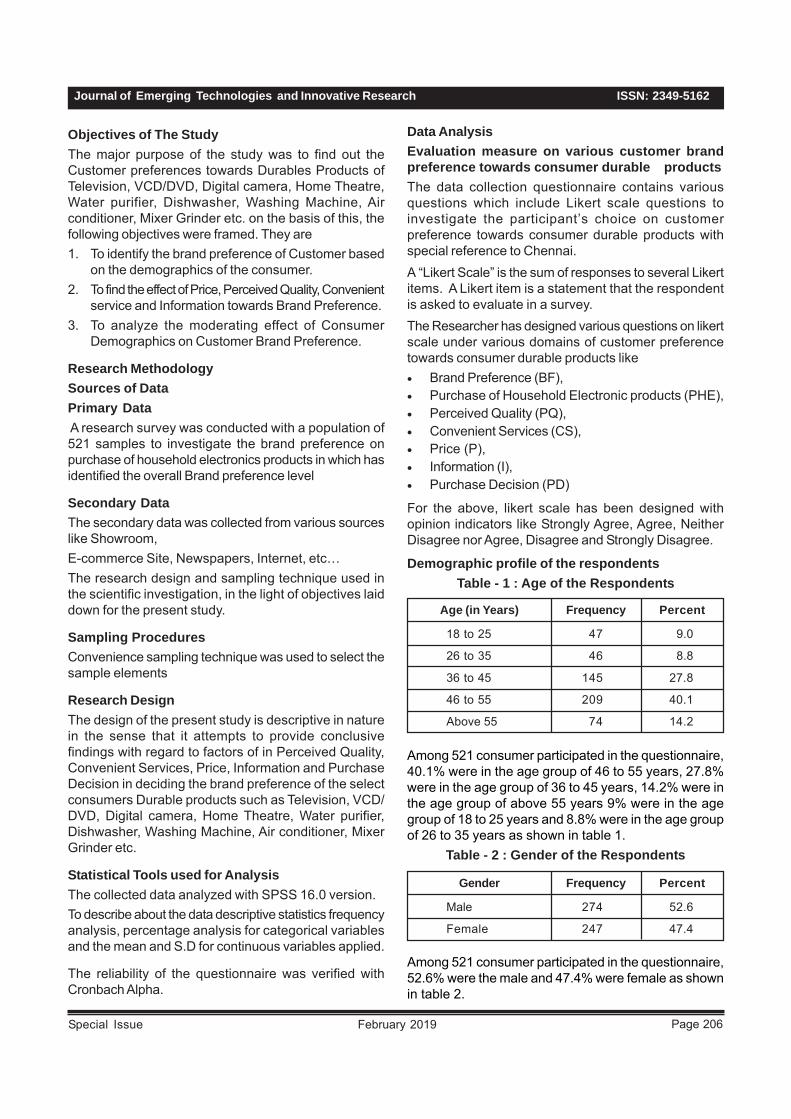
ISSN: 2349-5162Journal of Emerging Technologies and Innovative Research
Page 206February 2019Special Issue
Objectives of The StudyThe major purpose of the study was to find out theCustomer preferences towards Durables Products ofTelevision, VCD/DVD, Digital camera, Home Theatre,Water purifier, Dishwasher, Washing Machine, Airconditioner, Mixer Grinder etc. on the basis of this, thefollowing objectives were framed. They are1. To identify the brand preference of Customer based
on the demographics of the consumer.2. To find the effect of Price, Perceived Quality, Convenient
service and Information towards Brand Preference.3. To analyze the moderating effect of Consumer
Demographics on Customer Brand Preference.
Research MethodologySources of DataPrimary Data A research survey was conducted with a population of521 samples to investigate the brand preference onpurchase of household electronics products in which hasidentified the overall Brand preference level
Secondary DataThe secondary data was collected from various sourceslike Showroom,E-commerce Site, Newspapers, Internet, etc…The research design and sampling technique used inthe scientific investigation, in the light of objectives laiddown for the present study.
Sampling ProceduresConvenience sampling technique was used to select thesample elements
Research DesignThe design of the present study is descriptive in naturein the sense that it attempts to provide conclusivefindings with regard to factors of in Perceived Quality,Convenient Services, Price, Information and PurchaseDecision in deciding the brand preference of the selectconsumers Durable products such as Television, VCD/DVD, Digital camera, Home Theatre, Water purifier,Dishwasher, Washing Machine, Air conditioner, MixerGrinder etc.
Statistical Tools used for AnalysisThe collected data analyzed with SPSS 16.0 version.To describe about the data descriptive statistics frequencyanalysis, percentage analysis for categorical variablesand the mean and S.D for continuous variables applied.
The reliability of the questionnaire was verified withCronbach Alpha.
Data AnalysisEvaluation measure on various customer brandpreference towards consumer durable productsThe data collection questionnaire contains variousquestions which include Likert scale questions toinvestigate the participant’s choice on customerpreference towards consumer durable products withspecial reference to Chennai.A “Likert Scale” is the sum of responses to several Likertitems. A Likert item is a statement that the respondentis asked to evaluate in a survey.The Researcher has designed various questions on likertscale under various domains of customer preferencetowards consumer durable products like• Brand Preference (BF),• Purchase of Household Electronic products (PHE),• Perceived Quality (PQ),• Convenient Services (CS),• Price (P),• Information (I),• Purchase Decision (PD)
For the above, likert scale has been designed withopinion indicators like Strongly Agree, Agree, NeitherDisagree nor Agree, Disagree and Strongly Disagree.
Demographic profile of the respondentsTable - 1 : Age of the Respondents
Age (in Years) Frequency Percent
18 to 25 47 9.0
26 to 35 46 8.8
36 to 45 145 27.8
46 to 55 209 40.1
Above 55 74 14.2
Among 521 consumer participated in the questionnaire,40.1% were in the age group of 46 to 55 years, 27.8%were in the age group of 36 to 45 years, 14.2% were inthe age group of above 55 years 9% were in the agegroup of 18 to 25 years and 8.8% were in the age groupof 26 to 35 years as shown in table 1.
Table - 2 : Gender of the Respondents
Gender Frequency Percent
Male 274 52.6
Female 247 47.4
Among 521 consumer participated in the questionnaire,52.6% were the male and 47.4% were female as shownin table 2.
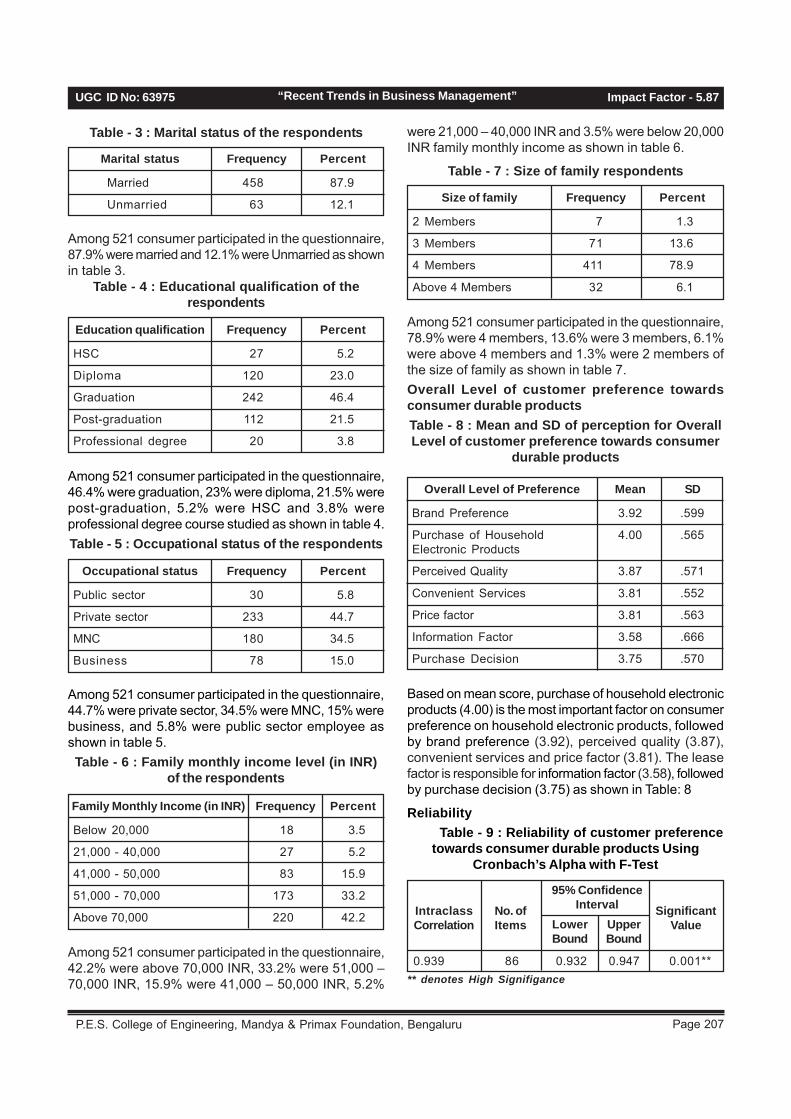
Page 207 P.E.S. College of Engineering, Mandya & Primax Foundation, Bengaluru
UGC ID No: 63975 Impact Factor - 5.87“Recent Trends in Business Management”
Marital status Frequency Percent
Married 458 87.9
Unmarried 63 12.1
Among 521 consumer participated in the questionnaire,87.9% were married and 12.1% were Unmarried as shownin table 3.
Table - 4 : Educational qualification of therespondents
Education qualification Frequency Percent
HSC 27 5.2
Diploma 120 23.0
Graduation 242 46.4
Post-graduation 112 21.5
Professional degree 20 3.8
Among 521 consumer participated in the questionnaire,46.4% were graduation, 23% were diploma, 21.5% werepost-graduation, 5.2% were HSC and 3.8% wereprofessional degree course studied as shown in table 4.Table - 5 : Occupational status of the respondents
Occupational status Frequency Percent
Public sector 30 5.8
Private sector 233 44.7
MNC 180 34.5
Business 78 15.0
Among 521 consumer participated in the questionnaire,44.7% were private sector, 34.5% were MNC, 15% werebusiness, and 5.8% were public sector employee asshown in table 5.Table - 6 : Family monthly income level (in INR)
of the respondents
Family Monthly Income (in INR) Frequency Percent
Below 20,000 18 3.5
21,000 - 40,000 27 5.2
41,000 - 50,000 83 15.9
51,000 - 70,000 173 33.2
Above 70,000 220 42.2
Among 521 consumer participated in the questionnaire,42.2% were above 70,000 INR, 33.2% were 51,000 –70,000 INR, 15.9% were 41,000 – 50,000 INR, 5.2%
Size of family Frequency Percent
2 Members 7 1.3
3 Members 71 13.6
4 Members 411 78.9
Above 4 Members 32 6.1
Among 521 consumer participated in the questionnaire,78.9% were 4 members, 13.6% were 3 members, 6.1%were above 4 members and 1.3% were 2 members ofthe size of family as shown in table 7.Overall Level of customer preference towardsconsumer durable productsTable - 8 : Mean and SD of perception for OverallLevel of customer preference towards consumer
durable products
Overall Level of Preference Mean SD
Brand Preference 3.92 .599
Purchase of Household 4.00 .565Electronic Products
Perceived Quality 3.87 .571
Convenient Services 3.81 .552
Price factor 3.81 .563
Information Factor 3.58 .666
Purchase Decision 3.75 .570
Based on mean score, purchase of household electronicproducts (4.00) is the most important factor on consumerpreference on household electronic products, followedby brand preference (3.92), perceived quality (3.87),convenient services and price factor (3.81). The leasefactor is responsible for information factor (3.58), followedby purchase decision (3.75) as shown in Table: 8
Reliability Table - 9 : Reliability of customer preference
towards consumer durable products UsingCronbach’s Alpha with F-Test
0.939 86 0.932 0.947 0.001**
IntraclassCorrelation
No. ofItems Lower
BoundUpperBound
SignificantValue
95% ConfidenceInterval
** denotes High Signifigance
Table - 3 : Marital status of the respondents were 21,000 – 40,000 INR and 3.5% were below 20,000INR family monthly income as shown in table 6.
Table - 7 : Size of family respondents

ISSN: 2349-5162Journal of Emerging Technologies and Innovative Research
Page 208February 2019Special Issue
The reliability of the whole questions was verified withCronbach’s Alpha is shown that α = 0.939. The 95%confidence interval for the lower bound is 0.932 and upperbound is 0.947. The significant level is ρ = 0.001 level,which is high reliability as shown in table- 3
ConclusionFindings of this study were consistent with the literaturecustomer preference towards consumer durableproducts. Moreover, the result suggests that reliabilityof the customer preference towards consumer durableproducts are significant (ρ = 0.001). Above 55 years ofage group, Graduation educational qualification, MNCworking, 4 members in size of the family, nuclear familytype and two members in a family members are earningcustomers are also satisfied in all the domains. Thosewho are earning family monthly income in INR of above70, 000 are satisfied in brand preference, purchase ofhousehold electronic products, perceived quality, andprice and information factor. Those who are earning familymonthly income in INR of 51,000 - 70, 000 are satisfiedin convenient services and purchase decision.
But there is a remarkable change in the buying behaviorof the consumer towards household electronic products.The present study has aimed at analyzing the factorsinfluencing the Brand preference towards householdelectronic products by the consumers. The results foundthat Based on mean score, purchase of householdelectronic products is the most important factor onconsumer preference on household electronic products,followed by brand preference, perceived quality,convenient services and price factor. The least factor is
responsible for information factor, followed by purchasedecision.
Limitation And Scope For Further ResearchThe study was conducted based on data acquired fromthe Consumers of Chennai city only, and the findingsmay not be applicable to other cities. The sample sizeis small and it may not be the representative of thepopulation in general. Therefore is a wide scope forrepeating this research with a more based sample whichcould lead to a different set of results.
References:• James U Mc Neal, (2016),”Chinese Children’s
attitude towards television advertising: Truth full nessand liking, 23 (3): 337-359.
• Koufaris M (2002). Customer Trust Online:Examining the Role of the Experience with the WebSite. Depart. Statistics, Comput. Inform. Syst.(5):1157-1164.
• Todd. EA (2011). Consumer Reactions to ElectronicShopping on the World Wide Web. J. ElectronicCommerce 1(2):59-88.
• Lee MK, Turban E (2010). A Trust Model forConsumer Internet Shopping. Int. J. ElectronicCommerce 6(1):75-91.
• Gupta and Verma, (2000), “Role of family membersin Purchase Decision Making Process, Departmentof Management Studies, Punjabi University.
• Jain and Sharma, (2000) “Consumer BuyingBehaviour & Brand Selection of Households” Journalof Product & Management, Vol.5 (2).
Page 209 P.E.S. College of Engineering, Mandya & Primax Foundation, Bengaluru
UGC ID No: 63975 Impact Factor - 5.87“Recent Trends in Business Management”
A STUDY ON CONSUMER’S BUYING BEHAVIOUR AND BRANDIMAGE WITH REGARD TO FAST MOVING CONSUMER
GOODS IN MYSURU DISTRICT
1. Research Supervisor, JSS Research Foundation, SJCE Campus, Associate Professor, JSS College of Arts, Commerceand Science, (Autonomous) B N Road, Mysuru
2. Research Scholar, JSS Research Foundation, SJCE Campus, Assistant Professor, Vidyavardhaka First Grade College,PG Centre, Department of Commerce, Sheshadry Iyer Road, Mysuru.
AbstractThe term FMCG (Fast Moving Consumer Goods), although popular and frequently used does not have a standarddefinition and is generally used in India to refer to products of everyday use. Conceptually, the term refers to relativelyfast moving items that are used directly by the consumer. The Indian FMCG sector has a market size of US$ 13.1billion and is the fourth largest sector in the Indian economy. Brand image has not to be created, but is automaticallyformed. The brand image includes product’s appeal, ease of use, functionality, fame, and overall value. Brand imageis actually brand content. When the consumers purchase the product, they are also purchasing its image. Brandimage is the objective and mental feedback of the consumers when they purchase a product. Positive brand imageis exceeding the customers’ expectations. Positive brand image enhances the goodwill and brand value of anorganization. The sales of FMCG Personal care segment is growing in Mysuru district, with the most literate and trans-culture embracing consumers in India. Mysuru has been witnessing a social transformation over the past decade toform a modern consumerism state with little focus on farming sector, increased interest in I.T related parks, educationalservices, medical facilities and tourism, higher income with huge remittances from the NRI’s and increased livingstandards even in the rural areas providing better growth prospects and demand for the FMCG sector. The study aimsat analyzing consumer’s behaviour relating to FMCG products. The focal point of the study is to identify the influenceof brand image on FMCG products. The sample population was selected based on random sampling method.Primary data was collected through close ended questionnaire and secondary data has also been used by theinvestigator has gone through the relevant field. The study is confined to Mysuru District. It is believed that theresearch is useful to the marketers and the FMCG giants to know the consumer buying behaviour and brand imageregard to FMCG products. Based on the result of this research FMCG giants can improve their quality, awareness levelof consumer.
Key words: FMCG, Brand image, Consumer buying behaviour.
S. Poornima1
Introduction:The rate of change in the Indian consumer during thelast decade is nothing but remarkable. As the numberof brands increased in the market, customers havebecome more sensitive and demanding. The marketershence adopted various marketing techniques like heavydiscounting and free sample schemes which ended upas just short term gainers and totally failed to achievebrand equity. Changes in the socio-economic profile ofIndian consumer, increased per-capita income,increasing number of upper middle class and middleclass segments brought revolutionary changes in thecorporate offering and smooth way for entry of numberof multi-national corporations, domestic companies intoIndian FMCG segment. These developments potentiallyaffect the fortune of brands.
The Fast Moving Consumer Goods (FMCG) sector isone of the booming sectors of the Indian economy, which
has experienced outstanding growth in the past decade.This sector comprises of five main segments, whichinclude personal care, household care, branded andpackaged food, beverages, and tobacco. Personal carecomprises of oral care, hair care, toiletries, soaps, andcosmetics; household care comprises of fabric washand household cleaners; and beverages include healthbeverages, soft drinks, cereals, dairy products, bakeryproducts, chocolates, and staples. FMCG is animportant contributor to India’s Gross Domestic Product(GDP) and is the fourth largest sector in the Indianeconomy, responsible for providing employment toapproximately five per cent of the total factoryemployment. This sector also creates employment foraround three million people in downstream activities,which are generally carried out in smaller towns andrural India. Rural markets account for 56 per cent of thetotal FMCG demand. In this backdrop, the present studyenvisages to explore the various aspects of brand image
Dr. H. C. Honnappa2
ISSN: 2349-5162Journal of Emerging Technologies and Innovative Research
Page 210February 2019Special Issue
in the Indian FMCG market in general and Personal CareSegment in particular.
Fast Moving Consumer Goods: (FMCGs)Products that have a quick turnover and relatively lowcost are known as Fast Moving Consumer Goods(FMCG). FMCG products are those that are replacedwithin a year. FMCG generally includes wide range offrequently purchased consumer products such astoiletries, soap, cosmetics, tooth cleaning products,shaving products and detergents, as well as other non-durables such as glassware, bulbs, batteries, paperproducts, and plastic goods. FMCG also includepharmaceuticals, consumer electronics, packaged foodproducts, soft drinks, tissue paper, and chocolate bars.Fast moving consumer goods are also known asConsumer Packaged Goods (CPG).
Review of Literature:AneesKazmi, QaziShujaatMehmood (2016) studiedthe effect of electronic word of mouth communicationand brand image on purchase intention: A case ofconsumer electronics in Haripur, Pakistan. In this articleauthors aims to focus on the purchase intention of theconsumer specifically the millennial age group withrespect to the effect of Electronic word of mouthcommunication and brand image. In this study isperformed among the students of the University of Haripur.The Study reveals that the effect of Electronic word ofmouth and brand image for the purchase of consumerelectronics products have positively correlated and theeffect is significant, which means that the Word of mouthcommunication can positively respond to the purchaseof the said products in case when the products arebranded and have certain image in the mind of consumer.
NurhanBabürTosun, AytaçBurakDereli, (2016)describes the effect of using parody on brand image inadvertising: In the article authors feels that brandcommunication studies objective is formed sometimesthe target audience by affecting existing beliefs andvalues on occasion by creating the new beliefs and valuesis to create a brand image. To contribute to both theirimage and brands competing brands negatively influencetheir image in order to spoof ad messages. In order tocriticize a work of parody existing structure by changingthe satire, hyperbole and emulated by using a commontype that was used to create a new work. Uses of abrand’s image and the spoof ad message to rival brandsimage their positive or negative direction. In this study,the use of brand image in the ad parody in order todetermine the impact of the two brands in thetelecommunications industry uses advertising of parodyand spoof commercials that do not use. All this work isperformed by the method of experimental research group
pre-test and post-test analysis. Contains the currentbrand image and parody advertising post on whetherdifferences between the image that occurs after watchingthe ad, the main objective of their study to examine inthe context of the policy. Research of preliminary test ofattitudes toward the brand and the brand awareness,brand image is taken from the scale. The research isthe latest test of brand image scales. Research as atool for survey data collection method was carried outon 131 participants. In this article criticism, satire andparody of the ads containing the imitation brand imagedimensions, social awareness, brand identity, brandelements, size of the brand’s commercial elements ofbrand value, consumer-oriented brand effect in brand andconsumer attitudes.
Need for the Study:The studies on Brand are many and have richlycontributed to the concept of Brand Loyalty. But thestudies reveal that most of them are taken up for ahomogeneous group and have not focused much onheterogeneous customer groups. The studies in Indiaon Brand Image are scanty. Further, the relationship ofawareness, preference, satisfaction and loyalty in theIndian FMCG market is unexplored. Brand Image is anasset for companies operating in FMCG market has itsown advantages.
Brand Image is not less sensitive and hence the companygets enough time to react to the competitors’ promotionstrategies. Even though FMCGs fall under lowinvolvement category characterized by the absence ofbrand loyalty, this may not be true for personal careproducts as they represent the life-style of a customer.The customer may feel that his/her choice of a particularbrand of personal care product represents his/herpersonality and thus may get involved with the purchasedecision. So for this category of FMCG brand image isan important aspect of marketing strategy.
Hence this study is taken up to investigate into the Indiancustomers’ awareness, preference and loyalty status inthe FMCG market and to suggest methods to enhancethe image status among the multi segment. The presentstudy explores various dimensions of brand image as itexists in Indian FMCG market.
Objectives of the study:1. The study aims at analyzing consumer’s behaviour
relating to FMCG products.2. The focal point of the study is to identify the influence
of brand image on FMCG products.
Significance of the study:The findings of the study will be very useful for themarketers to understand the factors influencing the
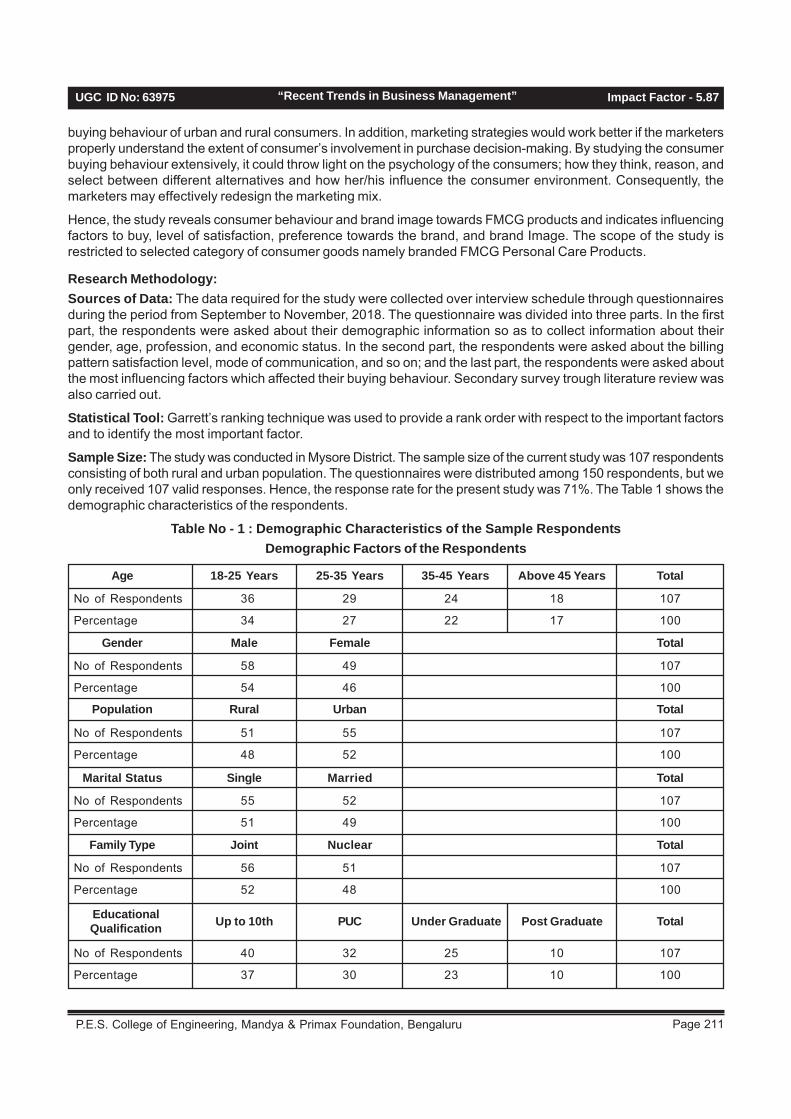
Page 211 P.E.S. College of Engineering, Mandya & Primax Foundation, Bengaluru
UGC ID No: 63975 Impact Factor - 5.87“Recent Trends in Business Management”
buying behaviour of urban and rural consumers. In addition, marketing strategies would work better if the marketersproperly understand the extent of consumer’s involvement in purchase decision-making. By studying the consumerbuying behaviour extensively, it could throw light on the psychology of the consumers; how they think, reason, andselect between different alternatives and how her/his influence the consumer environment. Consequently, themarketers may effectively redesign the marketing mix.
Hence, the study reveals consumer behaviour and brand image towards FMCG products and indicates influencingfactors to buy, level of satisfaction, preference towards the brand, and brand Image. The scope of the study isrestricted to selected category of consumer goods namely branded FMCG Personal Care Products.
Research Methodology:Sources of Data: The data required for the study were collected over interview schedule through questionnairesduring the period from September to November, 2018. The questionnaire was divided into three parts. In the firstpart, the respondents were asked about their demographic information so as to collect information about theirgender, age, profession, and economic status. In the second part, the respondents were asked about the billingpattern satisfaction level, mode of communication, and so on; and the last part, the respondents were asked aboutthe most influencing factors which affected their buying behaviour. Secondary survey trough literature review wasalso carried out.
Statistical Tool: Garrett’s ranking technique was used to provide a rank order with respect to the important factorsand to identify the most important factor.
Sample Size: The study was conducted in Mysore District. The sample size of the current study was 107 respondentsconsisting of both rural and urban population. The questionnaires were distributed among 150 respondents, but weonly received 107 valid responses. Hence, the response rate for the present study was 71%. The Table 1 shows thedemographic characteristics of the respondents.
Table No - 1 : Demographic Characteristics of the Sample RespondentsDemographic Factors of the Respondents
No of Respondents 36 29 24 18 107
Percentage 34 27 22 17 100
Age 18-25 Years 25-35 Years 35-45 Years Above 45 Years Total
Gender Male Female Total
No of Respondents 40 32 25 10 107
Percentage 37 30 23 10 100
EducationalQualification Up to 10th PUC TotalUnder Graduate Post Graduate
No of Respondents 58 49 107
Percentage 54 46 100
No of Respondents 51 55 107
Percentage 48 52 100
Population Rural Urban Total
No of Respondents 55 52 107
Percentage 51 49 100
Marital Status Single Married Total
No of Respondents 56 51 107
Percentage 52 48 100
Family Type Joint Nuclear Total
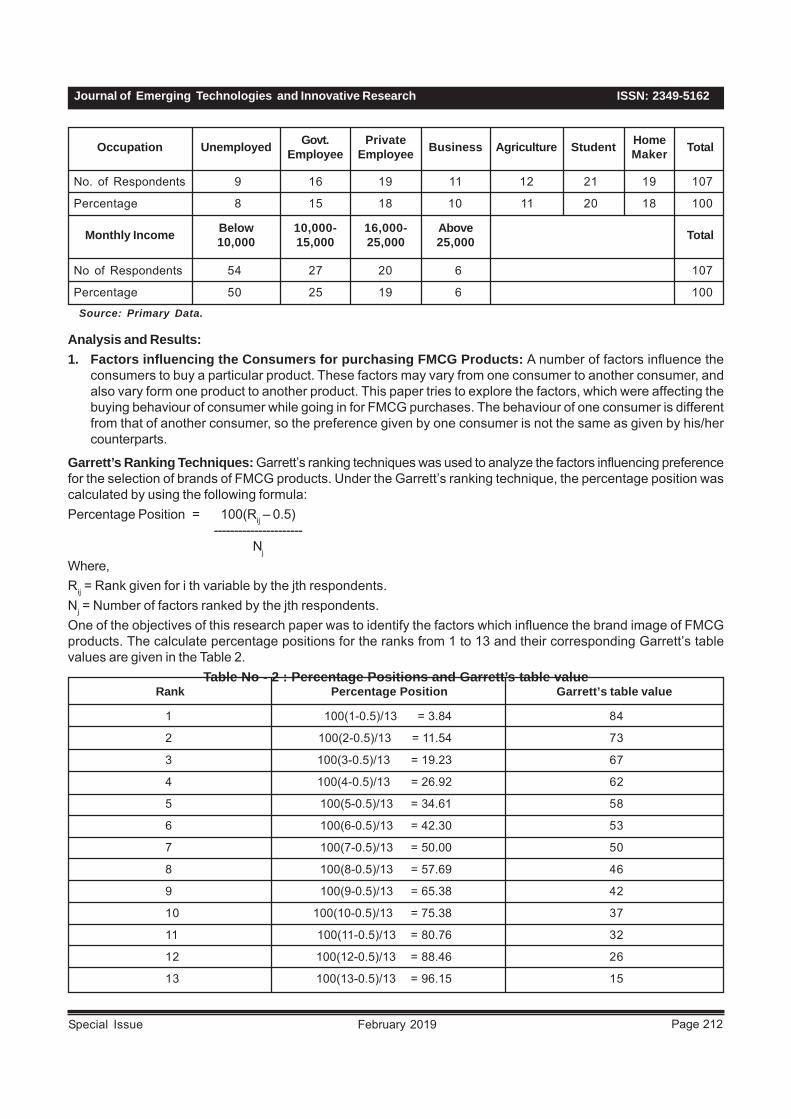
ISSN: 2349-5162Journal of Emerging Technologies and Innovative Research
Page 212February 2019Special Issue
No. of Respondents 9 16 19 11 12 21 19 107
Percentage 8 15 18 10 11 20 18 100
Occupation Unemployed Govt.Employee
PrivateEmployee Business TotalAgriculture Student Home
Maker
No of Respondents 54 27 20 6 107
Percentage 50 25 19 6 100
Monthly Income Below10,000
10,000-15,000
16,000-25,000
Above25,000 Total
Source: Primary Data.
Analysis and Results:1. Factors influencing the Consumers for purchasing FMCG Products: A number of factors influence the
consumers to buy a particular product. These factors may vary from one consumer to another consumer, andalso vary form one product to another product. This paper tries to explore the factors, which were affecting thebuying behaviour of consumer while going in for FMCG purchases. The behaviour of one consumer is differentfrom that of another consumer, so the preference given by one consumer is not the same as given by his/hercounterparts.
Garrett’s Ranking Techniques: Garrett’s ranking techniques was used to analyze the factors influencing preferencefor the selection of brands of FMCG products. Under the Garrett’s ranking technique, the percentage position wascalculated by using the following formula:Percentage Position = 100(Rij – 0.5)
----------------------Nj
Where,Rij = Rank given for i th variable by the jth respondents.Nj = Number of factors ranked by the jth respondents.One of the objectives of this research paper was to identify the factors which influence the brand image of FMCGproducts. The calculate percentage positions for the ranks from 1 to 13 and their corresponding Garrett’s tablevalues are given in the Table 2.
Table No - 2 : Percentage Positions and Garrett’s table value
1 100(1-0.5)/13 = 3.84 84
2 100(2-0.5)/13 = 11.54 73
3 100(3-0.5)/13 = 19.23 67
4 100(4-0.5)/13 = 26.92 62
5 100(5-0.5)/13 = 34.61 58
6 100(6-0.5)/13 = 42.30 53
7 100(7-0.5)/13 = 50.00 50
8 100(8-0.5)/13 = 57.69 46
9 100(9-0.5)/13 = 65.38 42
10 100(10-0.5)/13 = 75.38 37
11 100(11-0.5)/13 = 80.76 32
12 100(12-0.5)/13 = 88.46 26
13 100(13-0.5)/13 = 96.15 15
Garrett’s table valuePercentage PositionRank

Page 213 P.E.S. College of Engineering, Mandya & Primax Foundation, Bengaluru
UGC ID No: 63975 Impact Factor - 5.87“Recent Trends in Business Management”
For Rank 1, the calculated percentage position is 3.84, and table value is 84. This value is given in the Garrett’sraking table for the percentage 3.89, which is very near 3.84. For all the calculated percentage positions, the tablevalues are referred from Garrett’s ranking table.
It can be inferred from the Table 3 that price factor received the highest mean score of 68.28. It proves that the pricefactor was considered as the most important factor influencing the respondent’s decision to purchase an FMCGproduct. Brand name got the second rank with a mean score of 63.19, which proves that the consumers are brandloyal; quality of the product got the third rank with a mean score of 58.40. Other most important factors arepackaging, sales promotion, quality and availability of products.
Table No - 3 : Factors Influencing the Consumers for Purchasing the FMCG Products
84 73 67 62 58 53 50 46 42 37 32 26 15
Price f 44 13 12 3 5 5 8 7 5 5 0 0 0 7307 68.28 1
f x 3696 949 804 186 290 265 400 322 210 185 0 0 0 107
Packing f 7 7 12 16 14 7 15 6 7 4 6 2 4 5850 54.67 5
f x 588 511 804 992 812 371 750 276 294 148 192 52 60 107
Brand Name f 17 19 20 13 12 9 1 3 4 3 1 5 0 6762 63.19 2
f x 1427 1387 1340 806 696 477 50 138 168 111 32 130 0 107
Personality f 1 0 3 1 `1 5 4 6 5 16 19 21 26 3492 32.63 13
f x 84 0 201 62 58 265 200 276 210 592 608 546 390 107
Past-Experience f 3 14 15 11 10 3 7 13 12 12 2 4 1 5779 54 6
f x 252 1022 1005 682 580 159 350 598 504 444 64 104 15 107
Sales Promo-tion f 1 5 3 14 7 13 15 9 9 10 12 6 3 5140 48.03 7
f x 84 365 201 868 406 689 750 414 378 370 384 156 75 107
Availabi-lity f 15 7 12 6 7 15 12 10 6 10 3 1 3 6027 56.37 4
f x 1260 511 804 372 406 795 600 460 252 370 96 26 75 107
Payment Method f 4 4 1 8 2 3 4 14 11 13 11 14 18 4239 39.16 11
f x 336 292 67 496 116 159 200 644 462 481 352 364 270 107
Location f 2 4 3 9 19 23 5 6 10 2 9 3 12 5106 47.71 8
f x 168 292 201 558 1102 1219 250 276 420 74 288 78 180 107
Quantity f 2 7 8 7 12 7 6 15 12 7 10 8 6 5087 47.54 9
f8x 168 511 536 434 696 371 300 690 504 259 320 208 90 107
Need f 1 10 6 1 4 4 8 7 9 9 16 23 9 4400 41.12 10
f x 84 730 402 62 232 212 400 322 378 333 512 598 135 107
Quality f 10 17 8 16 8 8 14 6 8 6 6 1 0 6249 58.40 3
f x 840 1241 536 992 464 424 700 276 336 222 192 26 0 107
Product Feature f 0 1 4 2 6 5 8 5 9 10 12 19 26 3724 34.80 12
f x 0 73 268 124 348 265 400 230 378 370 384 494 390 107
ΣfTotal 107 107 107 107 107 107 107 107 107 107 107 107 107
Rank Scale and Scale value of Rank
TotalScore
MeanScore
MeanRankFactors
ScaleValue
(x)I II III IV V VI VII VIII IX X XI XII XIII
Source: Primary Data.
2. Most effective mode of communication: Table 4 shows the responses of the respondents for the mosteffective mode of communication. After analysis of the data, it was found that most of the respondents agreed
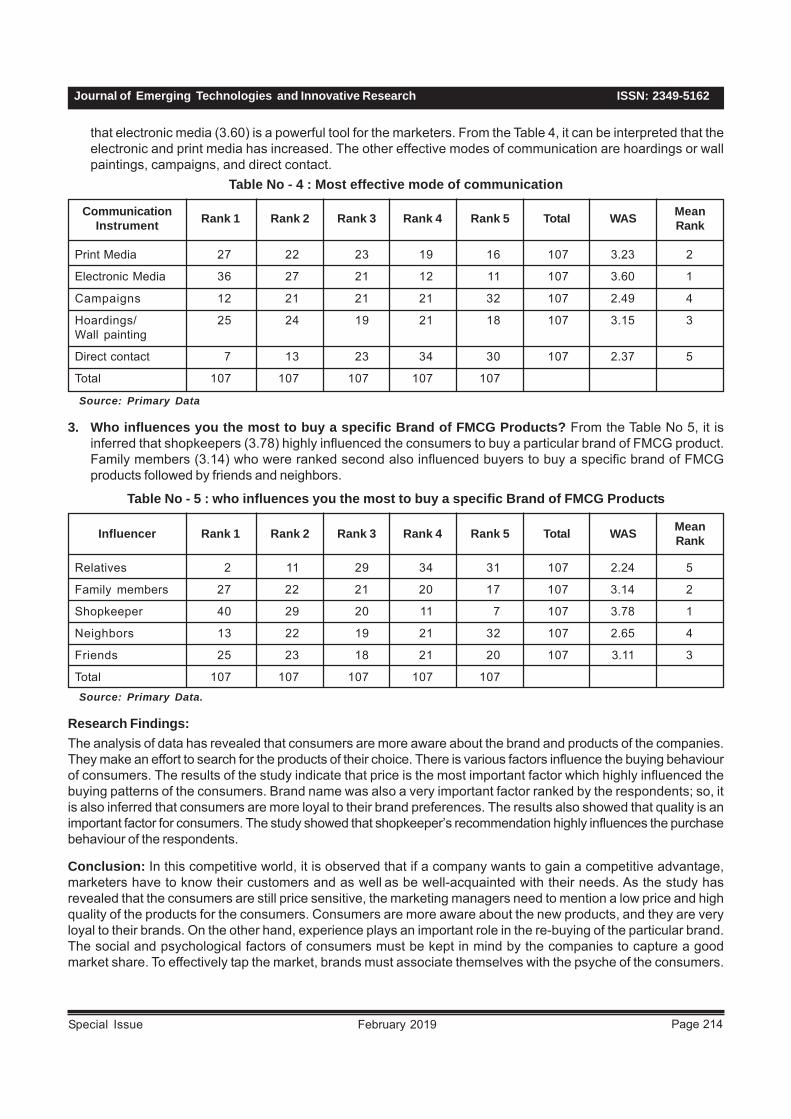
ISSN: 2349-5162Journal of Emerging Technologies and Innovative Research
Page 214February 2019Special Issue
that electronic media (3.60) is a powerful tool for the marketers. From the Table 4, it can be interpreted that theelectronic and print media has increased. The other effective modes of communication are hoardings or wallpaintings, campaigns, and direct contact.
Table No - 4 : Most effective mode of communication
Print Media 27 22 23 19 16 107 3.23 2
Electronic Media 36 27 21 12 11 107 3.60 1
Campaigns 12 21 21 21 32 107 2.49 4
Hoardings/ 25 24 19 21 18 107 3.15 3Wall painting
Direct contact 7 13 23 34 30 107 2.37 5
Total 107 107 107 107 107
CommunicationInstrument Rank 1 Rank 2 Rank 3 Rank 4 Rank 5 Total WAS Mean
Rank
Source: Primary Data
3. Who influences you the most to buy a specific Brand of FMCG Products? From the Table No 5, it isinferred that shopkeepers (3.78) highly influenced the consumers to buy a particular brand of FMCG product.Family members (3.14) who were ranked second also influenced buyers to buy a specific brand of FMCGproducts followed by friends and neighbors.
Table No - 5 : who influences you the most to buy a specific Brand of FMCG Products
Relatives 2 11 29 34 31 107 2.24 5
Family members 27 22 21 20 17 107 3.14 2
Shopkeeper 40 29 20 11 7 107 3.78 1
Neighbors 13 22 19 21 32 107 2.65 4
Friends 25 23 18 21 20 107 3.11 3
Total 107 107 107 107 107
Influencer Rank 1 Rank 2 Rank 3 Rank 4 Rank 5 Total WAS MeanRank
Source: Primary Data.
Research Findings:The analysis of data has revealed that consumers are more aware about the brand and products of the companies.They make an effort to search for the products of their choice. There is various factors influence the buying behaviourof consumers. The results of the study indicate that price is the most important factor which highly influenced thebuying patterns of the consumers. Brand name was also a very important factor ranked by the respondents; so, itis also inferred that consumers are more loyal to their brand preferences. The results also showed that quality is animportant factor for consumers. The study showed that shopkeeper’s recommendation highly influences the purchasebehaviour of the respondents.
Conclusion: In this competitive world, it is observed that if a company wants to gain a competitive advantage,marketers have to know their customers and as well as be well-acquainted with their needs. As the study hasrevealed that the consumers are still price sensitive, the marketing managers need to mention a low price and highquality of the products for the consumers. Consumers are more aware about the new products, and they are veryloyal to their brands. On the other hand, experience plays an important role in the re-buying of the particular brand.The social and psychological factors of consumers must be kept in mind by the companies to capture a goodmarket share. To effectively tap the market, brands must associate themselves with the psyche of the consumers.

Page 215 P.E.S. College of Engineering, Mandya & Primax Foundation, Bengaluru
UGC ID No: 63975 Impact Factor - 5.87“Recent Trends in Business Management”
Reference:• AbdusSamad K and M. Sabeerdeen,(2016): A Study
on Effective Brand Promotional Strategies InfluencingCustomers. International Journal of Management,7(2), 2016, pp. 52-65.http://www.iaeme.com/ijm/index.
• Alexandra Zaif (Transilvania University of Brasov,Romania) 2016:The Impact of Brand Awareness onCompanies‘ Marketing Strategies. 3213-219,JournalTitle: Risk in Contemporary Economy, ISSN: 2067-0532 (Print),Publisher: Dunarea de Jos University ofGalati.
• AneesKazmi, QaziShujaatMehmood: 2016: Theeffect of electronic word of mouth communicationand brand image on purchase intention. DOI 10.5267/j.msl.2016.5.003Journal Title: Management ScienceLetters ISSN: 1923-9335 (Print); 1923-9343 (Online)6(7)499-508 Publisher: Growing Science.
• Anilkumar N and Jelsy joseph 2014: A Study onConsumer Behaviour towards FMCG Productsamong the Rural-Suburban HHs of ErnakulamInternational Journal of Economics & ManagementSc iencesht tp : / /dx .do i .o rg /10.4172/2162-6359.1000208
• Arpita Mukherjee, DivyaSatija and Tanu M.GoyalMurali K. Mantrala and ShaomingZou: AreIndian consumers brand conscious? www.emeraldinsight.com/1355-5855.
• Ashwini K. Awasthi, Madhura Kane (2014),Consumers Perceptions and Behaviour aboutBrands: Effect of Complaint Resolutions on SocialMedia: International Journal of Marketing andBusiness Communication, Volume 3 Issue 3/4
• Balgopal Singh, (2012), Emerging Trends in BrandingStrategy, International Journal of Marketing andBusiness Communication, Volume 1 Issue 3.
• Balgopal Singh (2014), Impact of Corporate BrandingStrategy on the Consumer Loyalty: An EmpiricalInvestigation, International Journal of Marketing andBusiness Communication, Volume 3 Issue 1.
• Bhimrao M. Ghodeswar: Building brand identity incompetitive markets: a conceptual model,www.emeraldinsight.com/1061-0421.htm, Journal ofProduct & Brand Management 17/1 (2008) 4–12q,Emerald Group Publishing Limited [ISSN 1061-0421][DOI 10.1108/10610420810856468]
• Cristina Calvo-Porral, Valentín-AlejandroMartínezFernández, Oscar Juanatey-Boga, 2016;56(1)29-42: Journal Title: RAE :Revista deAdministração de Empresas, ISSN: 0034-7590(Print); 2178-938X (Online).
• David Sam Jayakumar G S and Mr. S. Dawood Ali.(2016): Modeling the brand image of cosmetics andits impact on customer satisfaction and loyaltyintention with special reference to face creams,international journal of management,7(2), 2016, pp.226-236. Http://www.iaeme.com/ijm/index.asp.
• Debiprasad Mukherjee, Impact of CelebrityEndorsements on Brand Image, Indian journal ofmarketing, Volume 42, Issue 2, February 2012.
• Deepa S., P. Chitramani Customer Based RetailerEquity of Apparel Retail Stores: Indian journal ofmarketing, Volume 46, Issue 5, May 2016.
• Hemanthkumar S and B.V. Pushpa, Role of EventOrganising Companies in Increasing the Brand Imageof the Client Companies, International Journal ofManagement, 7(7), 2016, pp. 303–312. http://www.iaeme.com/IJM/issues.
• Mr. IRFAN MUMTAZ K.S, (2013), Retailer’s brandawareness: An Exploratory Approach, InternationalJournal of Management (IJM), ISSN 0976 –6502(Print), ISSN 0976 - 6510(Online), Volume 4,Issue 6, November - December
• KatarzynaWrona2015;16(2)91-119: Visual identityand rebranding, Journal Title: Marketing of Scientificand Research Organisations, ISSN: 2353-8503(Print); 2353-8414 (Online), Publisher: The Instituteof Aviation.
• Kerry Kilduff, Julia M. NúñezTabales2016;17(1)83-104: Country Branding and its effect on the consumerin the global market: In this article they mentionedJournal Title: Cuadernos de Gestión, ISSN: 1131-6837 (Print); 1988-2157 (Online).
• MónicaDíaz-Bustamante, Sonia Carcelén,MaríaPuelles, 2016;6(2): Image of Luxury Brands:Journal Title: SAGE Open, ISSN: 2158-2440(Online), Publisher: SAGE Publications.
• Nikhil K Mehta (2012): The Impact of comparativecommunication in advertisements on brand image:An Exploratory Indian Perspective: The UP Journalof Brand Management, Dec, 2012.
• NurhanBabür TOSUN, AytaçBurak DERELÝ,2016;12(46)321-338: Effect of using Parody on BrandImage in Advertising: Journal Title: Öneri, ISSN: 1300-0845 (Print), Publisher: Marmara University.
• Prabakaran N, N. Panchanatham (2013), BrandValue of Bridgestone Tyre Limited - A Study withReference to Puducherry State, International Journalof Marketing and Business Communication, Volume2 Issue 3.
• Punniyamoorthy R, Dr. B.Parthiban, An investigationon brand awareness in fast moving consumer goodswith special reference to orphanages in Chennai

ISSN: 2349-5162Journal of Emerging Technologies and Innovative Research
Page 216February 2019Special Issue
region, ISSN 0976-6502 (print) Issn 0976-6510 (online), volume 6, issue 1, January (2015), pp. 268-279 ©iaeme: http://www.iaeme.com/ijm.asp.
• Sachin S. Vernekar, PreetyWadhwa, Marketing India as a Brand (Brand India, an Idea Whose Time has Come):Indian journal of marketing, Volume 39, Issue 6, June 2009.
• SeethaNaik (2014), Brand loyalty of tasty product – Survey on Mysore city. ISSN 0976-6502 (Print), ISSN0976-6510 (Online) Volume 5, Issue 2, February (2014), pp. 138-146, © IAEME: www.iaeme.com/ijm.asp
• Vaishnani Haresh B., (2011): Effects of Sales Promotions on Consumer Preferences and Brand Equity Perception:with specific reference to FMCG Products, thesis PhD, Saurashtra University.
• Yuliana Riana Pand, WilianyGui: 2016;7(1)64-78: Influence of Advertisement Message on Fitbar Billboard towardsBrand Awareness and Its Implication to Brand Image, Journal Title: Humaniora, ISSN: 2087-1236 (Print).
Page 217 P.E.S. College of Engineering, Mandya & Primax Foundation, Bengaluru
UGC ID No: 63975 Impact Factor - 5.87“Recent Trends in Business Management”
REFERENCE TO ARTISANSHIP-ANALYSIS OF TOP TENWOMEN’S ETHNIC WEAR APPAREL WEBSITES
1. Asst. Professor, Department of Management Studies, CHRIST (Deemed to be University), Bangalore.2. Director, NIFT, Kannur, Kerala.
Abstract
Apparel Retailing in India has seen a lot of evolution in formats through the centuries. There has been overwhelmingsupport for all of these phases of growth both by marketers and customers. The onslaught of e-commerce is also anevidence to the acceptance of a new dynamic form of reaching out to the customer although it is not completely provento have touched all lives or becoming more profitable than traditional formats.Online Visual Merchandising of Women’sEthnic Apparel is an interesting area for Apparel retailers today thanks to increasing internet penetration, a largeconsumer base time pressed for a commute to the physical store and more importantly a greater affinity to eco-friendly products. A large number of customers emphasize the importance of the origin of the garment in their apparelpurchases today, the knowledge of the art and craft involved in turning out a piece of garment reinforces the purchaseintention. This premise is the trigger behind the research endeavour.This paper seeks to delve into the OVM elementsused by the Top Ten Apparel Retailers on their websites and build a list of commonalities and differences betweenthem. In addition to drawing out the significance given to artisanship/craftsmanship as part of the OVM efforts. Theinsights thus gathered can be a beacon for Apparel Retailers to reach out to a more conscious customer base at thesame time, connect with the original source of the ethnic garment. The lessons can be shared with small businessesor start-ups mushrooming in Tier Two cities could also act as aggregators in this chain of events.
Keywords: online visual merchandising, women’s ethnic apparel, site atmospherics, website design, artisanship,craftsmanship
Phinu Jose1
IntroductionThe evolution of e-commerce is a closely watched onein the past decade, it has taken interesting twists andturns thanks to the dynamic changes witnessed in oureconomic policies. As a nation, India has always beena nation of ‘what is in it for me?’ the average IndianCustomer or Businessman desires to satiate his hungernot for more but for something adequately supplementinga comfortable solution to the problem at hand. It is inthis scenario that the onslaught of online retailers tooksome offline retailers by shock and came as a pleasantsurprise to many who couldn’t afford to set up a physicalstore. In 2008-2009, when e-commerce as a businessmodel was starting off on Indian Shores, Click-and-Orderbecame the most-sought after model for numerous e-tailers who did not have deep pockets to build a brick-and-mortar store and also wanted to sell their productsat minimal costs. In the LPG Era, when India opened upits economy to the world, the single focus by the peoplein power has been to balance the domestic economyand not fall prey to global oligopoly, taking us back tothe British Era of Colonialism.
India’s ethnic market stands estimated at around $30billion while ethnic wear is the single biggest category
in the women’s wear segment with a share of 71%. Indianconsumers are increasingly spending more on ethnicwear, a category which was assumed to initiallyrestricted to old-age customers has moved on to enticeyoungsters more than ever.
Ethnic wear has been accepted as formal wear for womenat the workplace, this seems to be the primary driver forincreasing use of this attire apart from the keen interestin non-Asians across the globe in ethnic wear. Moreimportantly the trigger for growth of online ethnic apparelshopping is the fact that e-tailers reach out to customersin smaller cities making them gain more popularity. It ispredicted that the surge in growth will continue,especially as 2018 was a hallmark year as far astraditional wear at occasions especially for India’s powercouples.
According to the latest financial report of The House ofAnita Dongre, the past year saw Queen Mathilde ofBelgium, Sophie Gregoire Trudeau, wife of CanadianPrime Minister Justin Trudeau, and presidential nomineeHillary Clinton wearing India ethnic attire from thecollection of the acclaimed designer, when they visitedthe country.
Dr. Elangovan N2

ISSN: 2349-5162Journal of Emerging Technologies and Innovative Research
Page 218February 2019Special Issue
Companies Sales(in ` crore) FY17-18 FY16-17
TCNS 845 702
Manyavar 769 603
Biba 549 460
AND 487 459
Soch 366 339
Table - 1 : Portrays the surge in growth evidentlyin Online Shopping of Ethnic wear
Source:http//economictimes.indiatimes.com/articleshow/67121176.cms ?utm_ source= content of interest &utm_medium =text & utm_campaign=cppst
This paper delves into a few elements that define OnlineVisual Merchandising among the top ten retailers in thespace of ethnic women’s wear especially in the contextof artisanship focus. Possible pathways can be probedinto blending the best of the online visual merchandisingelements into a lucrative experience for both marketersand customers.
Literature Review-OVM elementsThe internet has become a major or complementary saleschannel for many retailers, research on online buyingenvironment has increased manifold. More attention ispaid to the unique attributes of online shopping todaythan ever before due to the influx of many players.
Significant results have provided implications for industrypractitioners and researchers alike (Yoh, 1999) priorexperience with the internet had the strongest influenceon the intention to purchase apparel through the internetis a key understanding that could help devise bettercommunication mechanism for ecommerce players toreach out to prospects.
A research study that investigated into ways of designingthe Web atmospherics of retail shopping sites to bettersupport consumers in their product information seeking,reveals two significant modes of product informationseeking and concentrates on two specific types of webatmospherics, the dynamics leading to increased levelsof consumer perceived value with ecommerce sites.(Allan, H. 2007)
Another study (Es-haghi, Afshardoost, & Mehdi, 2015)suggests that cultural values pre-exist or rather logicallyprecedes Website Trust, perceived Website privacy andWebsite quality significantly affected the frequency ofonline shopping in one country while it did not in another.
The SERVQUAL has been a tool that has been usedrepeatedly to study customer perceptions of internetmarketing. (Lee & Lin, 2005) proposed that the
dimensions of website design, reliability, responsiveness,and trust affect overall service quality and customersatisfaction, which in turn are related to customerpurchase intentions.
Investigations into online atmospherics have always beenan interesting route for ecommerce research scholars.(Price-Rankin, 2004) examined the impact of onlineatmospheric cues namely colour and music upon feeling,attitude and purchase intention of consumers in theonline environment. (Wu, Cheng, & Yen, 2008) believedthat a well-designed website with emphasis on musicand colour would create a desired environment and thusentice and retain target customers.
That inspiration for Online Visual Merchandising comesfrom Physical stores is also a well-researched area.(Kumar, 2014) has emphasised the need for online visualmerchandising and physical store visual merchandisingas well.
Consumer Behaviour online is becoming interestingthanks to ecommerce. A lot of advantages are cited bycustomer groups, especially internet-savvy ones formoving to ecommerce, the predominant ones beingconvenience, ease and speed including good returnpolicy. (Bridges & Florsheim, 2008)
(Yoh, 1999) propounded that general innovation on theinternet instigated customers to adopt internet shoppingeasily, thereby encouraging more etailers to experimentwith novel concepts on their website. (Garbarino &Strahilevitz, 2004) in this context also delved into genderdifferences in the perceived risk of buying online and theeffects of receiving a site recommendation from a friend,reflecting a demonstrable difference in both cohorts.
(Hunter & Mukerji, 2011) presented an ecologically validinterpretation of the importance of online atmosphericsas a conceptual model, and suggested that etailers tailortheir website atmospherics according to thecharacteristics of the target market incorporatingconsumer preferences.
Using Bitner’s Servicescape idea, many scholars haveproposed the need to encompass the environment as amarketing tool, initiated by Kotler in 1973. Today themeaning of market place has taken a definition that wasunimaginable decades ago.
Top Ten RetailersThe inspiration to delve into this study was from the factthat in the last decade unorganised retail in our countryhas moved form a meagre 6%to 30% and all successivegovernments in power have had enough share of politicalfootage derived through policy-making gimmicks. Thechallenge for marketers has been in judging the bestbet for both customers and producers, today the concern
Page 219 P.E.S. College of Engineering, Mandya & Primax Foundation, Bengaluru
UGC ID No: 63975 Impact Factor - 5.87“Recent Trends in Business Management”
seems to be far removed from the point of view of theproducer. Women’s wear has been an intriguing subjectof study due to the wide array of possibilities availablein the market space, more so ethnic wear due to thecharm it exudes both on the person who crafted it andthe person who adorns it. The pride that women take inflaunting the ethnic wear is attributed to the craft of theweave through the eye of the beholder!
It is this aspect of fashion wear in ethnic apparel thatwas interesting to capture, a quick browsing throughthe websites brought out the Top Ten Retailers and acomparative analysis helped present the requiredimpetus for etailers to focus on the Artisanship of theGarment in addition to other aspects of productpresentation.
A secondary research into the available online retailersof Apparel-Women’s Ethnic Wear in India reveals aconservative list. The top 10 Indian online shoppingwebsites for women that fuse ethnicity with fashion arelisted below:1. BIBA,2. Jaypore,3. Ritu Kumar,4. Rangriti,5. Fabindia,6. Shoppers Stop,7. W for Woman,8. India Rush,9. Global Desi, and10. Melange
From the above list, BIBA and FabIndia seem to be themost recalled names apart from Shoppers Stop, W forWoman, Rangriti and Soch not particularly in that order.
A brief introduction to each of them as portrayed on theirrespective websites is stated below:
BIBABIBA Apparels Private Limited (“BIBA”), is the apparentlymost loved ethnic wear brand. The brand has beendressing and enhancing the ethnic looks of women fromevery corner of India since 1986. Mrs. Meena Bindra,the founder of BIBA, used the name BIBA which is aPunjabi endearment for a young and pretty girl. It retainsthe ethos of sublime qualities to this day in its brandingefforts. BIBA’s commitment to fashion enthusiasts is -contemporary ethnic fashion at an affordable price,offering ladies’ churidars and dupatta sets in cotton, inshades of every color, and with irresistible colorcombinations and patterns. In time, new rangecollections were introduced. The mix-and-match range
today, has a very contemporary sensibility, and thesalwar-kameez range is very ethnic, defined by an Indiancrafted look, hand-block prints, and vegetable dyes. Thegarments are produced by applying Indian handloomswith traditional embroideries and other techniques. BIBAcaters to the full demands of a woman boasting ofunstitched suits and a festive collection for two-to-12-year-old girls as well.
JayporeJaypore promises to bring the world a little closertogether, they are engaged in discovering the bestdesigns from artisans and craftsmen from all over India,and delivering them at exceptional value to theirmembers. Their constant focus has been on creatingamazing products and the sharing stories of the peoplebehind them. This promise is fulfilled through uniqueproducts, high quality craftsmanship and unmistakablylocal designs that feel at home anywhere in the world.Apparel is only one category among an array of otherslike accessories, home décor, jewellery, gifts, vintageitems and more.
Ritu KumarRitu Kumar is the largest & most respected designer-wear brand in India is a well-known fact today. Since1969, it has developed a unique style of its own, albeitin a contemporary vocabulary reflecting the ancienttraditions of Indian craftsmanship. Mrs. Kumar hassuccessfully created a new classicism through herunderstanding of ancient designs and the innovative useof traditional crafts. The company is renowned for itsdistinctive use of colors, quality of fabrics, intricateembroideries and a gloriously rich Indian aesthetic today.It has made a significant impact in creating employmentin underdeveloped areas since the company was builton patronage of craftspeople. It has patronized severalorganizations working in those areas and helped indeveloping skills and taking them to the market.
RangritiRangriti – the name itself suggests two important themesof colour and fashion. The attempt is to fine blend offeminine cuts and beautiful shades in sync with the latestfashion trends, at affordable prices. The aim at Rangritihas been to bring freshness, variety & Style to everywoman’s closet. Despite being a relatively new brand ithas come to be accepted as a brand that offers brightand beautiful women’s Indian wear.
FabIndiaFabindia is perhaps the most recognized brand in IndianWear especially promoting artisans. The credit for beingthe largest private platform for products that are madefrom traditional techniques, skills and hand-based
ISSN: 2349-5162Journal of Emerging Technologies and Innovative Research
Page 220February 2019Special Issue
processes goes to Fabindia. It links over 55,000 craftbased rural producers to modern urban markets, whichis its mainstay-USP, it has created a base for skilled,sustainable rural employment, and preserving India’straditional handicrafts in the process. The products fromFabIndia are natural, craft based, contemporary, andaffordable. The assurance to the customer is the factthat Fabindia works closely with artisans by providingvarious inputs including design, quality control, accessto raw materials and production coordination. The visioncontinues to be to maximize the handmade element inall products, whether it is handwoven textiles, hand blockprinting, hand embroidery or handcrafting home products.
Shoppers StopShoppers Stop is one of the largest chain of departmentstores in India, it caters to the needs of the entire familyby offering a multitude of some of the leading global andnational brands for apparels, fragrances, accessories,cosmetics, footwear, home décor and furnishings. Theiraspiration is to provide customers a memorable shoppingexperience matching international standards. Throughits existence, Shoppers Stop has progressed from beinga single brand shop to becoming a Fashion & Lifestylestore for the family. Today, Shoppers Stop is a householdname for providing a complete shopping experience.
W for WomanW is a part of TCNS CLOTHING CO. LIMITED started inthe year 2001 catering to a large clientele through bothretail and e-commerce space. Interestingly, W is thedream of two brothers – Mr. OS Pasricha and Mr. ASPasricha with an aim to provide fashion in a modernretail environment to the Indian woman. W proudlyproclaims that it is the only brand in the Indian retailspace which offers ‘Indian contemporary’ wear and staysa step ahead of the fashion curve. The companyapparently claims that they are the pioneers inintroducing the concept of ‘Mix n Match’ in retail, Wdesigners, inspired by the fashion trends and forecastsfrom the west, transform them into silhouettes and stylesacceptable to the modern Indian woman.
India RushIndiaRush makes traditional fashion reach the top ofevery woman’s list by bringing a magical carnival ofeverything ethnic along with captivating styles. Localartisans at PAN India level design the exquisite featuresof traditional Indian wears brought out by India Rush,they propose to be the hub of online shopping place andcater diversified online women wears and showcase arich array of ethnic wears to be worn with elegantjewellery and accessories, all at an affordable range withdiscounts and offers second to none.
The best way to unfold the ethnic essence is throughIndiaRush.com, through the complete range in designersarees, wedding lehengas, contemporary lehengas,salwar suits, Indo-Western kurtis and embroidered classicdrapes, ensuring an easy online shopping experience.Being the largest online ethnic store IndiaRush takespride in putting forth Indian heritage and cultural diversityin women wears. Every state in India is represented intheir differentiated works patterns and the vivacity incolours thus catering to a wide range of Indian Fashion.
Global DesiGlobal Desi is a brand from one of India’s leading fashiondesigners-Anita Dongre. It has revolutionized the conceptof Indian wear with a fantastic play of colour, fabric andcuts. The parent company, House of Anita DongreLimited founded in 1995 by Anita Dongre, Meena Sehraand Mukesh Sawlani, is one of India’s leading fashionhouses today—a well-recognised, well-respected andwell-loved name. The company offers a distinct identityin each of its four brands. AND offers a line of chiccontemporary western wear for women; Global Desi, avibrant and free-spirited brand of boho-chic ensembles;their third offering Anita Dongre is all about exquisitebridal couture and a prêt line for men & women alongwith Pinkcity, handcrafted jadau jewellery; and finallyGrassroot by Anita Dongre, seeks to revive and sustainheirloom traditions and empower artisans in villages andthe brand is a tribute to the handcrafted traditions ofIndia. The Global Desi collection stands apart since it ispredominantly India-inspired and delves deep into ourrich heritage of colours, textures and prints to combinethem to create international appeal. Global Desi waslaunched in 2007, and is currently available at 146exclusive brand outlets and 402 multi-brand storesacross the country.
MelangeMelange is the in-house brand of the Lifestyle Stores,Melange aspires to be your one-stop destination to shopfor Indian ethnic wear with a touch of western influence.Their collection has a wide range of tops, jackets, skirts,churidars and lots more to choose from thus offering acomplete wardrobe solution. The shopping can be routedthrough Myntra as well. Lifestyle is part of the Dubai-based retail and hospitality conglomerate the LandmarkGroup, offering women’s, men’s and kids’ apparel,footwear, handbags, fashion accessories, beauty productsand much more, the parent brand features a massiveselection of great products from hundreds of leadingnational and international brands. Lifestyle introducescollections that embrace the hottest trends from acrossthe globe every season. Customers can look forward toa seamless and hassle-free shopping experiencewhether stepping into a Lifestyle store or shopping online.

Page 221 P.E.S. College of Engineering, Mandya & Primax Foundation, Bengaluru
UGC ID No: 63975 Impact Factor - 5.87“Recent Trends in Business Management”
Comparative AnalysisThe elements of online visual merchandising have been studied by many a researchers, the pioneering investigationinto OVM elements proposed through (Ha, Kwon, & Lennon, 2007) highlight two types of cues-central and peripheral.Central Cues implies all product related stimuli and Peripheral Cues means all stimuli not related to the product. Aquick comparison between all the top ten brands based on five criteria was undertaken. The parameters included-Colour, Brand Ambassadors, Brand Endorsed, Key Word, Artisanship.
Table - 2 : Showing the Comparison of Top Ten Brands
BIBA Cherry Parineeti Rangriti Ethnic No
Jay pore Amber No No Handmade Yes
Ritu Kumar Macaroon/Biscotti Nimrat Kaurand Aditi Rao Beautiful hands Indian Yes
Rangriti Violet Parineeti Same No No
Fabindia Currant No No Hand woven Yes
Shoppers Stop B/W Sonam Kapoor Same No No
W For Woman Cherry QshaPatani Home No No
India Rudi Tiger No No No Yes
Global Desi Parmesan Shradha Kapoor/ Same Yes YesKanganaRanaut
Melange B/W Tapsee Same No No
ColourWebsite Brand Ambassadors Brand Endorsed Keyword Artistisanship
Inference of the above table reflected the emphasis has been on product presentation which is rightly placed and onunbeatable offers. The need for highlighting colour stems from the need for brand imagery, one of the crucialelements in Visual Merchandising, both offline and online. The use of Celebrities as against Models does not seemto drive too many website design orientations. There are also sub-branding or co-branding efforts undertakenseemingly necessary for driving sales. The probe into these popular websites were driven through suggested keywordssometimes none. The most striking feature sought as study beacon was Artisanship-five out of the ten websitesmentioned Artisanship yet in varying degrees and it is heartening to note that it is also a significant mission theseretailers have set out to achieve.
This paper is developed with an intention to serve the cause of these weavers, artisans and various craftsmen whosafeguard the rich heritage of India through a piece of garment. The story that garment narrates not only enhancesits appeal but also influences the orientation of the customer to the lives and livelihood of skilled artisans.
SuggestionsIn order to encourage and retain the craft involved in putting together a garment it is necessary to further theinterests of the people whose skill and effort makes the shopping experience complete. In the case of OnlineShopping, these stories gain momentum while presenting the product and the people involved holistically. TheNational Skill Development Corporation reinforces that, there is a need to create an eco-system for artisans who areself-employed individuals, for skills that are passed on from generation to generation and due to lack of marketabilityand recognition, these skills run the risk of being lost, since the younger generation do not want to associatethemselves with trades which neither give financial stability nor recognition. It has been a while since agencies likeNSDC and other NGOS realize that weavers-artisans and craftsmen need to be provided with funds, market linkagesand intelligence, a platform to market their products, apart from education about raw materials and the productsused and also how to market them. Educating the customer about the skill involved hence commanding a premiumprice for the product and promoting of fair trade practices to build awareness among artisans and customers alikeof the benefits of using of eco-friendly products and processes is also important if the cause of the farmer/weaver isupheld.
ISSN: 2349-5162Journal of Emerging Technologies and Innovative Research
Page 222February 2019Special Issue
ConclusionConsidering the blurring lines between online and offline,it is imperative to integrate both formats and notdemonise each other if retail has to grow in India. ThePolicy changes make an impact on the nature ofinnovations retailers are willing to make in the field ofonline or offline shopping so each one gets a larger shareof the customer’s wallet. The reason ethnic fashion isgetting popular is thanks to the influx of ecommerce,the same platform should not be the reason its relevancegets diluted. The task is much easier and engaging forcustomers to adopt to ethnic wear with the right emphasisand impact resulting for artisans and marketers both.The scope of delving deep into this field of inquiry islimitless and definitely promises to be worth every penny,every ounce of effort of erudite scholars.
The need for enlightening the customer on the role ofartisans in presenting a piece of garment replete withstories of how it came to be, is therefore the best stepforward.
Bibliography• Bridges, E., & Florsheim, R. (2008). Hedonic and
utilitarian shopping goals: The online experience.Journal of Business Research, 61(4), 309–314.https://doi.org/10.1016/j.jbusres.2007.06.017
• Es-haghi, S. M. S., Afshardoost, M., & Mehdi, M.(2015). Antecedents of online purchase intention/ :A Cross-national study, 5(2), 159–182.
• Garbarino, E., & Strahilevitz, M. (2004). Genderdifferences in the perceived risk of buying online andthe effects of receiving a site recommendation.Journal of Business Research, 57(7), 768–775.https://doi.org/10.1016/S0148-2963(02)00363-6
• Ha, Y., Kwon, W. S., & Lennon, S. J. (2007). Onlinevisual merchandising (VMD) of apparel web sites.Journal of Fashion Marketing and Management,11(4), 477–493. https://doi.org/10.1108/13612020710824553
• Hunter, R., & Mukerji, B. (2011). The role ofatmospherics in influencing consumer behaviour inthe online environment. International Journal ofBusiness and a Social …, 2(9), 118–125. Retrievedfrom http://www.ijbssnet.com/journals/Vol._2_No._9_[Special_Issue_-_May_2011]/14.pdf
• Kumar, V. (2014). A study on Needs of VisualMerchandising for Online & Physical Store. Journalof Business and Management, 16(9), 98–101.
• Lee, G. G., & Lin, H. F. (2005). Customer perceptionsof e-service quality in online shopping. InternationalJournal of Retail and Distribution Management,33(2), 161–176. https://doi.org/10.1108/09590550510581485
• Price-Rankin, K. (2004). Online atmospherics: Aninvestigation of feeling and Internet purchaseintention. ProQuest Dissertations and Theses, 85–85 p. https://doi.org/CR-2004-178 [pii]
• Wu, C. S., Cheng, F. F., & Yen, D. C. (2008). Theatmospheric factors of online storefront environmentdesign: An empirical experiment in Taiwan.Information and Management, 45(7), 493–498.https://doi.org/10.1016/j.im.2008.07.004
• Yoh, E. (1999). Consumer adoption of the Internetfor apparel shopping. ProQuest Dissertations andTheses, 20(December 2003), 126–126 p. https://doi.org/10.1002/mar.lOllO
Page 223 P.E.S. College of Engineering, Mandya & Primax Foundation, Bengaluru
UGC ID No: 63975 Impact Factor - 5.87“Recent Trends in Business Management”
INFLUENCE OF GENDER ON IMPULSE BUYING BEHAVIOR:A STUDY OF SHOPPING MALLS IN BENGALURU CITY
1. Research scholar in Vidyavardhaka Research Foundation, Mysuru, Karnataka, India2. Principal & Professor of Commerce, VVFGC, Mysuru, Karnataka, India.
AbstractIn the current scenario, Shopping malls are playing vital role in meeting the requirements of the customers with thehelp of modern marketing strategies in India. There are big challenges to shopping malls to persuade the customersto buy the offered products and enhance the spending tendency in order to boost the sales. Marketers are required tounderstand the customer’s demographic factors like age, gender, education and income status for the formulation andimplementation of suitable marketing strategies. The main aim of the study to identify the differences in men andwomen in the affective and cognitive processes associated with impulse buying behavior in shopping malls regime.The study is based on the primary data gathered from shopping malls consumers in Bengaluru city with the help of astructured questionnaire by using judgmental sampling method. The gathered data have been analyzed with the helpsuitable statistical tools like mean, standard deviation and independent sample t-test in SPSS. The major findings ofthe study point out that visit without list of shopping items, good offers, Cashless transactions, window display, salesperson’s communication, fee as prestigious, ambience, encouraged by family members, encouraged by friends, newtrend and specialty of product, brand loyalty, income status and spending more time while shopping involvementtypically influence the impulse buying behavior among the both male and female customers. The study evidencedthat there is a significant relationship between impulse purchase among the gender and tested factors except brandloyalty.
Keywords: Gender, impulse buying behavior, influenced factors, Shopping malls
Umesha .S1
Introduction:The term “Impulse buying” is generally defined as anunplanned, on the spot purchase triggered by variousstimuli. Stimuli are specified through sensory marketingand the possibility to touch the products, by perfect andnoticeable information about special offers and tie-insto help the consumer remember what they need andwhat they have to buy. However, Impulse buying behavioris a perplexity in the marketing world. Hence, there is abehavior which the literature and consumers both stateis normatively wrong which cause for unplannedpurchase.
As India vicissitudes and reinvents it at a remarkablyaccelerated pace, the private consumption patterns ofits population have been transformed as the day moves.The ultimate shifts in consumer spending patterns havefar-reaching implications not only for suppliers of rawmaterials, manufacturers, marketers and retailers ofconsumer products and services, but for India and Indiansociety at large. The key lies in understanding the factsof this change in consumer behavior and consumptionpatterns and thereby the change in the wallet-share ofIndian consumers. Today’s veracity consists of manynew, unique and disparate factors that have come intoplay simultaneously in the modern retail operations.
Shopping Malls In IndiaIn India, Shopping malls has the maximum opportunityfor the expansion of the business. Shipping mallscontains a variety of stores that have multiple collectionsof products and services for the consumers as theyexpected. Most of the Indian shopping malls are providedwith the all necessary products for the customer basedon their expectation like price, availability of the products,packaging of the product, quality of the product,availability of all brands, appearance of the shops etc,.Since the physical visibility of the products have to begood and the customer has to experience the productwhich create the key for the purchase of product.Ambience of the shopping malls has to be like Aircondition facility, Window facility, food court, theaters,place for the entertainment, game facilities etc, whichmakes the customer to feel nice that they have to visitthe shopping malls again and again.1. Impulse buying behaviour
Impulse buying is synonymous with unplanneddecision to buy and has been defined by Baumeister,(2002) the evidence on the extent of the phenomenonvaries according to the definition used of “unplannedpurchases”. Aaccording to Sterm, (1962) defined theterm impulse buying as “any purchases which ashopper makes but has not yet planned in advance”.
Dr. MariGowda .S1
ISSN: 2349-5162Journal of Emerging Technologies and Innovative Research
Page 224February 2019Special Issue
Recently, the majority of the researchers haveexpressed their views about impulse purchase as“unplanned purchase to embrace an emotionalelement or an urge to make the purchases”.Emotions and feelings play a significant role inpurchasing, triggered by seeing the product or uponexposure to an attractive promotional message.Marketers and retailers tend to make use of theseimpulses which are fixed to the basic want for instantsatisfaction.Impulse purchasing disrupts the normaldecision making models in consumers’ minds. Therational sequence of the consumers’ actions isreplaced with an irrational moment of self-satisfaction. Impulse things appeal to the emotionalside of consumers. Some items bought on impulseare not considered functional or essential in theconsumers’ lives. Preventing impulse buying consistthe techniques such as setting financial plan beforeshopping and taking time out prior to the purchaseis made. Some of the imperative factors of impulsivepurchase are classified into two types as internaland external factors. External factors comprise Storevisible characteristics which includes attractiveness,i.e. the store location, ambience, size, ventilation,attractive layouts, persuasive shop assistance,convenience, store patronage, credit facilities,discounts effect the impulsiveness of consumer whilemaking purchase at shopping malls. Internal factorsor individual characteristics which hub on individualthat make them engaged in impulsive buyingbehavior, it mainly absorbs consumer’s personalitytraits, psychological factors, demographic factorsand situational factors.
2. Role of gender: buying decision.Is there a gender impact on the wisdom of appealthat that happens instantly after seeing the productand ends in buying the product? Before answeredto this question, another question that should beraised is: Do females and males respond differentlyin emotional things? Usually, females aredeliberation to be more “emotional” than males andso it appears, so normal that females behave moreemotionally in purchasing a thing than males. Malesand females in reality, experience emotions differentlyare controversial, but consistent support has beenfound for gender differences in emotional expressionand its consequence. (Fisher,2005). The studycarried out on the representative sample verifies thatvariations in purchase decision-making of male andfemale depend largely on the type of purchasedecision. In order to identify with purchaseorientations and tendency in purchase decision-making better, particularities in link to product haveto be scrutinized. The gender has an important role
in pattern of purchase motives (Alena, 2004). Thedifferences in the instinctive shopping tendencies ofconsumers is depends on their genders, it hasascertained that women have more preference forinstinctive shopping compared to men. Apart fromthis, it has stated that females and males basicallydiffer in the factors of not planning and enjoying theshopping to get satisfaction (Coley, 2003).
Literature review focused on Impulse buyingbehavior and gender buying behaviourVerplankan et. al., (2001) contended in a study thatimpulse buying is generally connected with anunplanned a sudden purchase, which is initiated on thespot when consumer visit to shop. It is described asmore exciting, less calculated, and more on alluring ortempting buying behavior compared to the plannedpurchasing behavior among the buyers.
Amir et al., (2010) revealed in a study that organizedretailers need to ensure that the lightening at their retailstore was right for their targeted customers. Monitorthe practices to enhance their product appearance andthat will influence the consumer mood which again wouldhelp contribute to make better sales through impulsebuying pattern. Hence, modern retail outlets likeshopping malls need to consider the consumer’s moodand psychological factors.
Mohd et al., (2013) highlighted in a study that Customeris affected by both internal and external factors of impulsebuying. Since, impulse buying behavior is often stimulusdriven increased exposure of retailers pertaining to theirproducts to certain stimuli boost the likelihood ofimpulsively buying refer to marketing tactics. These areplaced and controlled by the marketer in attempted toattract consumers into purchase behavior. The studyfound that impressive cues in the retail environment actas vital initiate that influences a desire to purchaseimpulsively.Nagadeepa et al., (2015) found in his study that the twosignificant sales promotional schemes specificallyRebates & discount offers and the Loyalty programs ofthe retailers are more impressive on impulse buyingbehavior of customers on apparels. The further three salespromotional schemes explicitly price packs, couponsand contests are less impressive on consumers.Kaur et al., (2016) examined in a study that there ispositive effect of visual merchandising on impulse buyingbehavior in organized retail stores which means that ifvisual merchandising will be effective in retail stores soimpulse buying will encourage ultimately.Chanthima (2010) investigated that comparing the foodpreferences of male and female, female eat more fruitbut males are more likely to eat meat. Moreover, different
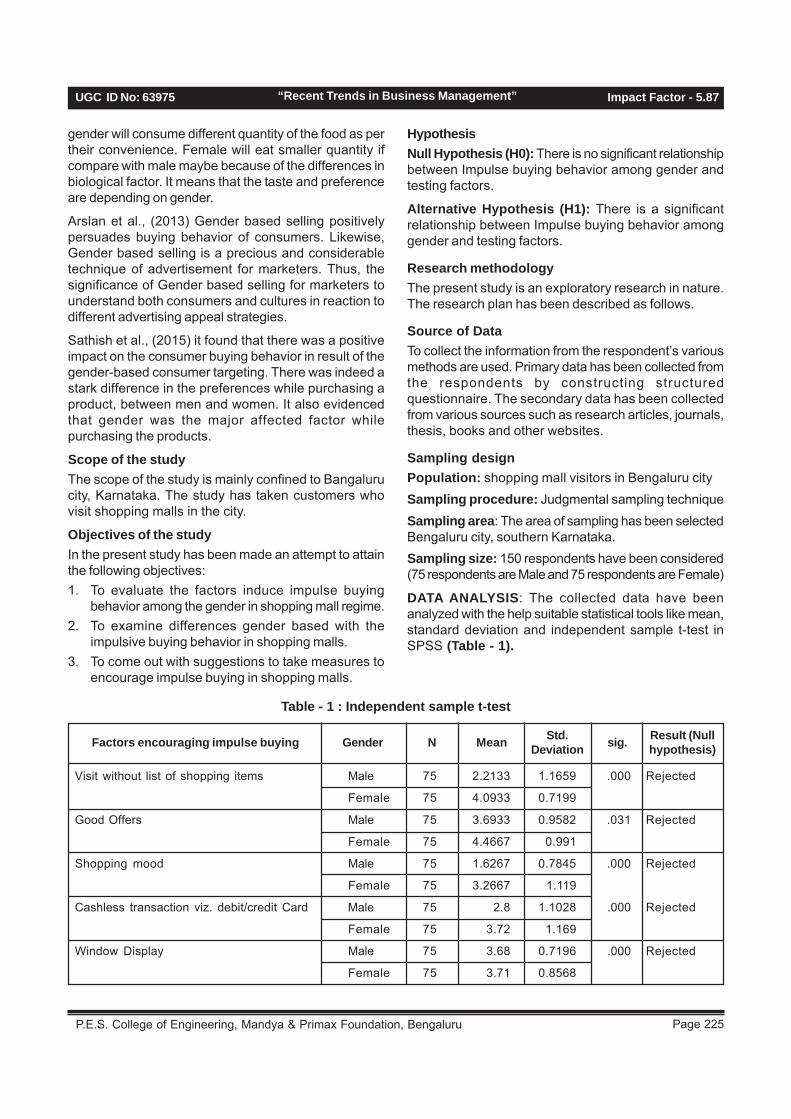
Page 225 P.E.S. College of Engineering, Mandya & Primax Foundation, Bengaluru
UGC ID No: 63975 Impact Factor - 5.87“Recent Trends in Business Management”
gender will consume different quantity of the food as pertheir convenience. Female will eat smaller quantity ifcompare with male maybe because of the differences inbiological factor. It means that the taste and preferenceare depending on gender.
Arslan et al., (2013) Gender based selling positivelypersuades buying behavior of consumers. Likewise,Gender based selling is a precious and considerabletechnique of advertisement for marketers. Thus, thesignificance of Gender based selling for marketers tounderstand both consumers and cultures in reaction todifferent advertising appeal strategies.
Sathish et al., (2015) it found that there was a positiveimpact on the consumer buying behavior in result of thegender-based consumer targeting. There was indeed astark difference in the preferences while purchasing aproduct, between men and women. It also evidencedthat gender was the major affected factor whilepurchasing the products.
Scope of the studyThe scope of the study is mainly confined to Bangalurucity, Karnataka. The study has taken customers whovisit shopping malls in the city.
Objectives of the studyIn the present study has been made an attempt to attainthe following objectives:1. To evaluate the factors induce impulse buying
behavior among the gender in shopping mall regime.2. To examine differences gender based with the
impulsive buying behavior in shopping malls.3. To come out with suggestions to take measures to
encourage impulse buying in shopping malls.
HypothesisNull Hypothesis (H0): There is no significant relationshipbetween Impulse buying behavior among gender andtesting factors.
Alternative Hypothesis (H1): There is a significantrelationship between Impulse buying behavior amonggender and testing factors.
Research methodologyThe present study is an exploratory research in nature.The research plan has been described as follows.
Source of DataTo collect the information from the respondent’s variousmethods are used. Primary data has been collected fromthe respondents by constructing structuredquestionnaire. The secondary data has been collectedfrom various sources such as research articles, journals,thesis, books and other websites.
Sampling designPopulation: shopping mall visitors in Bengaluru citySampling procedure: Judgmental sampling techniqueSampling area: The area of sampling has been selectedBengaluru city, southern Karnataka.Sampling size: 150 respondents have been considered(75 respondents are Male and 75 respondents are Female)
DATA ANALYSIS: The collected data have beenanalyzed with the help suitable statistical tools like mean,standard deviation and independent sample t-test inSPSS (Table - 1).
Table - 1 : Independent sample t-test
Visit without list of shopping items Male 75 2.2133 1.1659 .000 Rejected
Female 75 4.0933 0.7199
Good Offers Male 75 3.6933 0.9582 .031 Rejected
Female 75 4.4667 0.991
Shopping mood Male 75 1.6267 0.7845 .000 Rejected
Female 75 3.2667 1.119
Cashless transaction viz. debit/credit Card Male 75 2.8 1.1028 .000 Rejected
Female 75 3.72 1.169
Window Display Male 75 3.68 0.7196 .000 Rejected
Female 75 3.71 0.8568
Factors encouraging impulse buying Gender N Mean Std.Deviation sig. Result (Null
hypothesis)
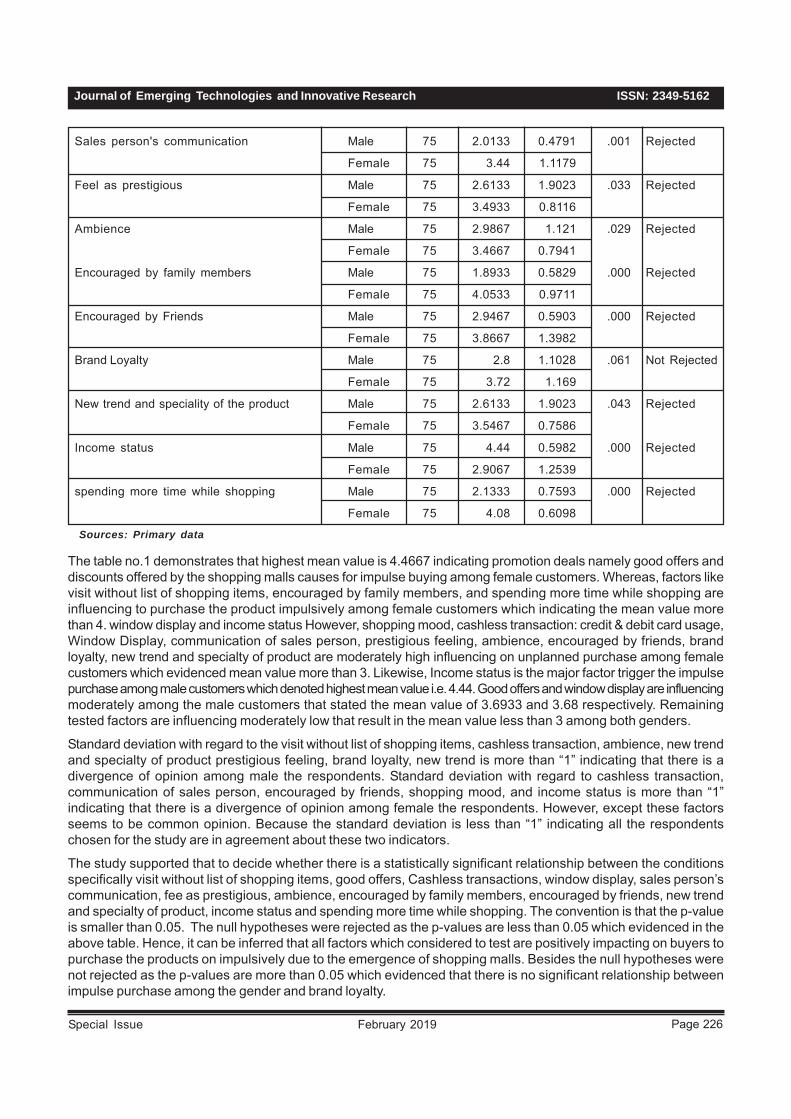
ISSN: 2349-5162Journal of Emerging Technologies and Innovative Research
Page 226February 2019Special Issue
Sales person's communication Male 75 2.0133 0.4791 .001 Rejected
Female 75 3.44 1.1179
Feel as prestigious Male 75 2.6133 1.9023 .033 Rejected
Female 75 3.4933 0.8116
Ambience Male 75 2.9867 1.121 .029 Rejected
Female 75 3.4667 0.7941
Encouraged by family members Male 75 1.8933 0.5829 .000 Rejected
Female 75 4.0533 0.9711
Encouraged by Friends Male 75 2.9467 0.5903 .000 Rejected
Female 75 3.8667 1.3982
Brand Loyalty Male 75 2.8 1.1028 .061 Not Rejected
Female 75 3.72 1.169
New trend and speciality of the product Male 75 2.6133 1.9023 .043 Rejected
Female 75 3.5467 0.7586
Income status Male 75 4.44 0.5982 .000 Rejected
Female 75 2.9067 1.2539
spending more time while shopping Male 75 2.1333 0.7593 .000 Rejected
Female 75 4.08 0.6098
Sources: Primary data
The table no.1 demonstrates that highest mean value is 4.4667 indicating promotion deals namely good offers anddiscounts offered by the shopping malls causes for impulse buying among female customers. Whereas, factors likevisit without list of shopping items, encouraged by family members, and spending more time while shopping areinfluencing to purchase the product impulsively among female customers which indicating the mean value morethan 4. window display and income status However, shopping mood, cashless transaction: credit & debit card usage,Window Display, communication of sales person, prestigious feeling, ambience, encouraged by friends, brandloyalty, new trend and specialty of product are moderately high influencing on unplanned purchase among femalecustomers which evidenced mean value more than 3. Likewise, Income status is the major factor trigger the impulsepurchase among male customers which denoted highest mean value i.e. 4.44. Good offers and window display are influencingmoderately among the male customers that stated the mean value of 3.6933 and 3.68 respectively. Remainingtested factors are influencing moderately low that result in the mean value less than 3 among both genders.
Standard deviation with regard to the visit without list of shopping items, cashless transaction, ambience, new trendand specialty of product prestigious feeling, brand loyalty, new trend is more than “1” indicating that there is adivergence of opinion among male the respondents. Standard deviation with regard to cashless transaction,communication of sales person, encouraged by friends, shopping mood, and income status is more than “1”indicating that there is a divergence of opinion among female the respondents. However, except these factorsseems to be common opinion. Because the standard deviation is less than “1” indicating all the respondentschosen for the study are in agreement about these two indicators.
The study supported that to decide whether there is a statistically significant relationship between the conditionsspecifically visit without list of shopping items, good offers, Cashless transactions, window display, sales person’scommunication, fee as prestigious, ambience, encouraged by family members, encouraged by friends, new trendand specialty of product, income status and spending more time while shopping. The convention is that the p-valueis smaller than 0.05. The null hypotheses were rejected as the p-values are less than 0.05 which evidenced in theabove table. Hence, it can be inferred that all factors which considered to test are positively impacting on buyers topurchase the products on impulsively due to the emergence of shopping malls. Besides the null hypotheses werenot rejected as the p-values are more than 0.05 which evidenced that there is no significant relationship betweenimpulse purchase among the gender and brand loyalty.

Page 227 P.E.S. College of Engineering, Mandya & Primax Foundation, Bengaluru
UGC ID No: 63975 Impact Factor - 5.87“Recent Trends in Business Management”
Suggestions:• The shopping mall managers have to consider the
brand loyalty for making it as a trigger attribute inorder to boost the sales by concentrating gender factor.
• There is a prominence for trained up the employeesto respond and convinces the customers byobserving their behavior and mood in case of bothgenders.
• Convey the facts and give the demonstration orsamples for encourage impulsiveness.
• Window display should impressive andunderstandable to persuade the customers to buythe products.
• Don’t make panic while customers involved in buyingdecision especially for female.
• Good offers or discounts plays greater role to convertthe window shopper into impulse purchaser inshopping malls. Hence, marketers have to takesuitable measures keeping in this view.
ConclusionThe study can be concluded by considering the empiricalevidence that habitually, there is a change in buyingdecision among the genders. Impulse buying is an eagerand immediate purchase made during shopping withoutpre-shopping plans either to purchase the specificproduct or to fulfill specific purchasing desires. The majorfindings of the study point out that visit without list ofshopping items, good offers, Cashless transactions,window display, sales person’s communication, fee asprestigious, ambience, encouraged by family members,encouraged by friends, new trend and specialty ofproduct, brand loyalty, income status and spending moretime while shopping involvement typically influence theimpulse buying behavior among the both male and femalecustomers. The study evidenced that there is asignificant relationship between impulse purchaseamong the gender and tested factors except brandloyalty. Hence, marketers are required to considerdissimilarities of individuals and gender to understandingtheir behavior to formulate and implement the marketingstrategies.
Bibliography• Alena Kusá, Zuzana Danechová, Stanislav Findra
and Miroslav Sabo. 2014. Gender differences inpurchase decision-making styles, European Journalof Science and Theology, Vol.10, No.5, 113-123.
• Amir Foroughi , Nor Aishah Buang , Zizah Che Senik,Reihaneh Sadat Hajmisadeghi Impulse BuyingBehaviour and Moderating Role of Gender amongIranian Shoppers ISSN 2090-4304 Journal of Basicand Applied Scientific Research. 760-769.
• Arslan Ayub, Muhammad Salman Aslam, AdeelRazzaq & Hanan Iftekhar2013,.2013. Impact ofGender based Selling on Consumer Buying Behavior:Cultural Analysis of Consumer Markets in Pakistan,INTERDISCIPLINARY JOURNAL OFCONTEMPORARY RESEARCH IN BUSINESS,MARCH 2013 VOL 4, NO 11,427-435.
• Baumeister, R.F. 2002, Yielding to temptation, selfcontrol failure impulsive purchasing and consumerbehavior. Journal of consumer Behavior research vol.28 p 4.
• Chanthima p.2010. Gender influence on purchaseintention the case study of thailand, Research reportin partial fulfilment of the requirements for the degreeof Master in Business Administration, Universitisains Malaysia, p19.
• Coley amanda and Brigitte burgess. 2003. GenderDifferences in cognitive and affective Impulse buying,Journal of Fashion Marketing and Management, Vol7 No 3, 282-295.
• Dr. Shahid Akhter,& Iftekhar Equbal,2012. OrganizedRetailing in India: Challenges and Opportunities,International Journal of Multidisciplinary Research,Vol.2 Issue 1.
• Fisher robert j. and laurette dube. 2005. Genderdifferences in responses to emotional advertising: asocial desirability perspective, journal of consumerresearch, inc., vol. 31. 850-858.
• Mohd. Rumzi Taushif, Manisha Gupta 2011.International Journal of Research and Development- A Management Review (IJRDMR) ISSN (Print):2319–5479, Volume-2, Issue – 2, 46-50.
• Mr. M. Sathish, Mr. Sachin Menon & YuvaraajMahendran, 2015. Gender differences in BuyingBehavior and Brand preferences towards Backpack,International Academic Research Journal of Businessand Management Vol. no.4 issue no 4, 12-27
• Nagadeepa, J. Tamil Selvi & Pushpa A.2015. Impactof Sale Promotýon Technýques on Consumers’Impulse Buyýng Behavýour towards Apparels atBangalore, Asian Journal of Management Sciences& Education Vol. 4(1).116-124.
• Stern, H. 1962. The significance of impulse buyingtoday. Journal of Marketing, Vol. 26, 59-63.
• Verplanken, B & Herabadi, A. 2001. Individualdifferences in impulse buying tendency: Feeling andno thinking. Euro. Journal of Personality, 15, S71-S83. doi: 10.1002/ p423.
Websites• www.ibef.org• www.global-retail.com

ISSN: 2349-5162Journal of Emerging Technologies and Innovative Research
Page 228February 2019Special Issue
PROGRAMMATIC ADVERTISING A NEW ERA IN DIGITALMARKETING – ISSUES AND CHALLENGES
1. Assistant Professor, Department of Commerce, Government First Grade College, Udayapura, ChannarayapatnaTaluk, Hassan District.
AbstractIn olden days It used to be that if you were an advertiser, you would simply work with your agency to define the creativestrategy, see a handful of creative ideas and tell them how much you wanted to spend, and what your goals were. Theagency would then spec out a short list of identified publications, you would discuss pros and cons of each, and thenplace insertion orders that met your criteria. You’d wait. While of course there was mathematics involved and a lot ofsmart thinking, success was more about brand recall and brand association and less about return on investmentback in the day. Over the course of the last decade the process and accountability for marketers and advertisers hasvastly shifted. Whereas marketing used to be known as the cost of business money function, it has now become a keychannel for monetization and revenue accountability. So, while that has become a tremendous advantage forbusinesses and marketers, it has also shifted the advertisers to be technology and data driven experts, along withbeing brand champions. There arises the digital marketing- The programmatic advertising.
Methodology:The scope of the study on the programmatic advertisinga new era in digital marketing - is based on the secondarydata, library references materials, news papers andinternet websites.
Objective of the study:1. To understand the meaning of the programmatic
advertising2. The see impact of programmatic advertising in digital
marketing3. To understand how the programmatic advertising is
affecting internet users4. To know how the programmatic advertising is helping
the marketers to advertise
Programmatic advertising – the beginning:It was started in 2013, the International Data Corporation(IDC) predicted that spending on RTB (real-time bidding)display advertising, one form of programmatic buyingwould accelerate at a 59% compound annual growthrate through the year 2016, making it the fastest growingsegment of digital advertising. They were right, Bid Ithas also shifted marketers to be technology and datadriven experts, along with being brand champions.
Additionally, e-Marketer predicts that in the US alone,programmatic advertising spending will be over $20 billionin 2016, more than double the amount seen in 2014. Inthe UK, programmatic advertising spending is expectedto increase to over $4 billion in 2016, up from just under$3 billion in 2015. Moreover, according to Gartner
Madhusudan H. N1
Research, programmatic techniques and technologiesare transforming the advertising marketplace, andautomated media buying and selling systems arechallenging agencies and capturing a significant shareof the value in a majority of digital media transactions.
The reason for this shift is that not only could technologyfinally deliver the accountability to the marketer but alsothat there was vast inventory that has shifted TV spendto online channels. TV and video inventory, specifically,have contributed to the exponential growth of digital mediaand the need for programmatic approaches to deliveryand measurement associated with the businessoutcomes supporting these formats. Innovative deliveryand content is the currency in advertising and onlyprogrammatic platforms can deliver the value to theadvertiser to ensure the return on these immersive mediaformats.
That movement happened quickly and brands had tostill find a way to connect and with the accountabilitybeing included, could finally measure success basedon more than recall or click through rate (CTR).Programmatic advertising provides for repeatable,automated advertising that allows for exponentialsuccess and accountability, which is precisely whatadvertisers historically were missing and continuallyseek.
What is programmatic advertising?We define it simply as “Automated advertising buyingcoupled with machine learning.” However, there are noshortages of definitions of the term programmaticadvertising.

Page 229 P.E.S. College of Engineering, Mandya & Primax Foundation, Bengaluru
UGC ID No: 63975 Impact Factor - 5.87“Recent Trends in Business Management”
“Programmatic ad buying typically refers to the use ofsoftware to purchase digital advertising, as opposed tothe traditional process that involves RFPs, humannegotiations and manual insertion orders. It’s usingmachines to buy ads, basically.” —Digiday
“Programmatic advertising helps automate the decision-making process of media buying by targeting specificaudiences and demographics.” —Marketing Land
The first definition helps explain it in very simply termswhereas the second helps explain what it does. In termsof the different types of programmatic advertising,according to the Interactive Advertising Bureau (IAB)—which is an industry organization geared toward ensuringstandards across the advertising ecosystem.
Types of programmatic buying (the process in whichyou’re buying advertising)1. Programmatic Direct Also known as Premium
Programmatic Advertising, this is an automatedtechnology-driven method used for buying, selling,or fulfilling advertising. It provides for an AutomatedGuarantee Systematic automation of sales process.No insertion order (IO) or master services agreement(MSA) covered within the partnership.
2. Programmatic Real Time Bidding (RTB) Twotypes of RTBs are Open Auction (audience targeting)and Private Marketplace Deals—which require aprivate marketplace and allow for fixed pricing anddata overlays. We are beginning to see more andmore of this type of programmatic advertising beingused every day.
Issues and challenges of Programmatic AdvertisingThe business requirement grew to connect marketingand advertising to revenue, measurement strategiesbecame critical to success. To that end, programmatictactics started as an accountable way for advertisers toget the best bang for their buck using media arbitrageas a way to increase ROI on lower funnel acquisitionefforts. Technically speaking, programmatic is supportedby industry protocol called Open RTB (real-time bidding).
The shift to programmatic tactics means a few thingsfor marketers and the industry as a whole. In essence,it has validated and delivered against the need for datadriven, and accountable ROI-based media delivery. It hasenabled an efficient method for publishers to monetizecore inventory. That said, some advertisers have struggledwith premium inventory falling outside of the standardprogrammatic categories and are still being required tofulfill unique and exclusive campaign needs. Regardless,the entire programmatic category is seeing increasedspending across the board due to its predictive yieldand ROI for marketers and publishers alike, not to
mention easy insertion processes and lower barriers toentry for most advertisers.
Native advertising has adopted programmatic techniquesand tactics and continues to grow because advertisersare able to see returns on these unique and/or customplacements and can dynamically adjust and deliveradded value to a brand based on learned characteristics.Without an automated process, these highly contextualad units would not be able to see the return they arenow and advertisers would be less willing to invest inunique content programming. In a nutshell,programmatic advertising aligns media with brand liftmetrics for real ROI and only spends money where itwill be effective. Media professionals still need to beexperienced and have an understanding and idea forwhere it might be best to reach audiences. That said,programmatic advertising can help advertisers bestoptimize on the fly and bid appropriately on the rightinventory when it is available so that they can bestmanage their return and/or value of their media spend.That’s the true value of moving to a programmatic mediastrategy. The ability to automate insertion strategies andget the most value from them
Programmatic media buying has been a boon for digitaladvertising, but that doesn’t mean problems withprogrammatic advertising are nonexistent. Despite themany benefits programmatic brings to the table -increased efficiency, less human error and less manualeffort, for starters - many media buyers are reticent tocommit their digital ad dollars to programmatic channels.
Following are some of important problems facedin programmatic advertising1. Lack of Transparency
In a recent survey of media agencies conductedearlier this year, this was by far the top challengecited by programmatic advertisers. With so manydifferent players involved in getting an ad from anadvertiser to their target audience - not to mention allof their acronyms - it can be hard for some to keeptrack of everyone and determine who is and isn’tinvolved in a given campaign.
2. Brand SafetyThis is a fairly recent concern. If brands are notcareful, they could find their ads appearing next toobjectionable content, and that proximity could leadsome to erroneously believe that the brand endorsesthe content. For instance, let’s say a brand chooseswho they advertise with basely solely on total appusers and total web traffic, which means their adsappear on properties owned by top news outlets.But, it’s entirely feasible that unless they’re careful,a display ad could appear next to a news story about
ISSN: 2349-5162Journal of Emerging Technologies and Innovative Research
Page 230February 2019Special Issue
something objectionable, like violence or racism. Themere fact that their ad appears next to such a newsstory could cast them in a highly negative light thatsignificantly damages their brand perception.
3. Mobile Ad FraudAs programmatic spending rises, it makes sensethat fraudsters follow the money. But, as mobile in-app ad fraud grows to new heights, many advertisersare worried that their budgets are being improperlyspent and eaten up by fraud.
4. Not Enough Quality DataConcerns about a lack of quality data abound amongboth those who own programmatic tech and thosewho don’t. The 2018 survey found that a majority ofboth groups cited this as a major challenge.
5. Lack of High-Quality Inventory and ScaleUltimately, what does any advertiser want? Theywant to reach the right people, and get them toactually take action off the advertisement. They wantto reach as many people as possible, and to reachthem where they actually are. This is not unique toprogrammatic, but these concerns are just asprevalent in mobile in-app advertising.
6. Multi-Device MeasurementIt’s challenging enough for marketers to track useracquisition, engagement, retention and conversionon a single platform. With programmatic advertising,the use of multiple devices and channelsmakes cross-platform attribution a potentialnightmare. It’s no longer about basic website trackersand cookies, but about keeping up with a ton of touchpoints across a huge number of different contexts.Managing this is no picnic, but without effectivemetrics marketers have no idea whether they’regetting ROA on their expenditure or not
Suggestions:1. Transparency is a common concern, it can be
addressed. For starters, it is totally transparent withall of the supply chain partners about what data thecompany collects and how it’s used. Also thecompany should let advertisers know exactly whothey’re targeting and what apps they’re using beforea campaign is ever run.
2. While brand safety is a growing concern, it’s onethat it is taken many strides recently to addresspermanently. One potential solution is through blacklisting, in which we make sure that certain apps don’treceive ads, or white listing, so that only certain appsget a brand’s ads. It is also recently started usingan innovative brand safety solution from IAS toguarantee the quality of the app inventory. Certain
ad formats help here too. For example, with fullscreen video ads, you never have to worry about anad appearing next to objectionable content, sinceliterally nothing else besides the ad appears on thescreen. It’s also important to know that apps areinherently more brand safe than digital inventory.With apps, it’s easier to determine if the environmentis suitable in all instances. Take a weather app forinstance. There’s an extremely slim probability for abrand safety concern to be present here. The samecan’t be said of a news website’s weather section.
3. Mobile ad fraud may be a growing issue, but now itis rising to the occasion to address it. There aremany good mobile applications which hasbeen independently certified by the TrustworthyAccountability Group’s Anti-Fraud Program. Theseapps invalid traffic rates are consistently much lowerthan industry averages as noted. It is constantlyinnovating to go above and beyond mobile ad fraud,including by applying our artificial intelligencecapabilities to fighting the issue.
4. Addressing concerns about data quality by collectinghigh quality insights directly. Not only its mobile firstdata highly valuable, with information including deviceIDs, location, demographics information and more,but the concerned audience insights are certified.Data quality is an area where mobile in-appadvertising blows browser-based digital advertisingout of the water
5. Compared to other programmatic exchanges, theuse of some are uniquely suited to address theseconcerns, in large part because a good mobileapplication can be the largest independent mobilein-app exchange, capable of helping advertisersreach up to billion people globally. And, the qualitydata ensures that advertisers can talk to the rightpeople with every campaign. That is way advertiserscan be sure their ads are only running on the verybest apps out there.
6. Use a good cross-platform attribution partner whocan track your performance across all the channels,platforms and devices encompassed in marketersstrategy. They need to utilize one of two types ofattribution models: a rule-based approach or astatistical model. The option they select should offera complete overview of a campaign’s performance,to help them make data-driven decision.
Conclusion:Programmatic Advertising is a way to deliver digitaladvertising to the right person, at the right time inthe right place. It is the algorithmic purchase and saleof advertising space in real time, using a vast network of
Page 231 P.E.S. College of Engineering, Mandya & Primax Foundation, Bengaluru
UGC ID No: 63975 Impact Factor - 5.87“Recent Trends in Business Management”
hi-speed machines and software to automate the buying,placement, and optimisation of media inventory via abidding system. Therefore, advertisers are able to tailora specific message to a specific person to maximizethe opportunity to convert exposure to an ad into anaction that the advertiser wants the person to take. In50 years programmatic will be considered as anincredible achievement. But so long as marketerscontinue to focus on achieving the greatest lift inperformance for the least amount of money,programmatics’ true potential may soon be within reach.While issues around inventory, fraud, quality andtransparency may persist, they are problems withexisting solutions. These can be overcome very easily.Its in the fingertip of programmers. Future is going to bevery tough in market. This programmatic advertisementwill make the marketers to locate and sell the productsvery easy. This advertising is going to be the marketleader in coming days. So better we keep updated.
References:• https://lineate.com/• https://blog.bannerflow.com/programmatic-
advertising/
• https://programmatic.wbresearch.com/top-programmatic-advertising/
• https://marketingland.com/programmatic-problems/• http://www.adotas.com/2017/07/challenges-facing-
programmatic-marketers/• https://www.inmobi.com/blog/2018/10/04/how-to-
solve-common-problems-with-programmatic-advertising
• https://www.nusparkmedia.com/2018/10/how-to-overcome-the-problems-of-programmatic-advertising/
• https://wikipedia.org/wiki/Programmatic_Advertising• http://downloads.digitalmarketingdepot.com/• https:/ /www.market ingf i rst .co.nz/2018/09/
programmatic-advert is ing-the-successful-transformation-to-automated-data-driven-marketing-in-real-time-by-oliver-busch/
• Times now news paper• Business line news paper


![ChemInform Abstract: Recent Trends in the Chemistry of Aminobenzo[b]thiophenes](https://static.fdokumen.com/doc/165x107/6323ed8c3c19cb2bd106befc/cheminform-abstract-recent-trends-in-the-chemistry-of-aminobenzobthiophenes.jpg)

