Recent Trends in U.S. Services Trade - USITC
215
Recent Trends in U.S. Services Trade 1998 Annual Report Investigation No. 332-345 Publication 3105 May 1998 www.usitc.gov
-
Upload
khangminh22 -
Category
Documents
-
view
1 -
download
0
Transcript of Recent Trends in U.S. Services Trade - USITC

Recent Trends in U.S. Services Trade
1998 Annual ReportInvestigation No. 332-345
Publication 3105 May 1998
www.usitc.gov

U.S. International Trade Commission
Washington, DC 20436
Publication 3105 May 1998
Recent Trends in U.S. Services Trade
1998 Annual Report
www.usitc.gov

U.S. International Trade Commission
Robert A. RogowskyDirector of Operations
COMMISSIONERS
Marcia E. Miller, Chairman
Lynn M. Bragg, Vice Chairman
Carol T. Crawford
Address all communications toSecretary to the Commission
United States International Trade CommissionWashington, DC 20436
This report was prepared by the Office of IndustriesDennis Luther, Project Leader
[email protected](202) 205-3497
Staff assigned:Tsedale Assefa, Jennifer Baumert, James Bedore, Michael Bystry, William Chadwick, Heidi Colby,
Vincent DeSapio, Zachary Falls, Dennis Fravel, Hugh Graham, Christopher Johnson,Christopher Melly, and Amanda Yarusso
Support Staff:Cynthia O. Payne, Monica J. Reed, and Wanda Tolson
Vern SimpsonDirector of Industries
Richard W. BrownDivision Chief

Starting with the 1997 issue, the title of the report on services was changed from U.S.1
Trade Shifts in Selected Industries: Services to Recent Trends in U.S. Services Trade.
i
PREFACE
On August 27, 1993, on its own motion and pursuant to section 332 (b) of the TariffAct of 1930 (19 U.S.C. 1332(b)), the U.S. International Trade Commission (USITC)instituted investigation No. 332-345, Annual Reports on U.S. Trade Shifts in SelectedIndustries. The current report format was developed by the USITC in response toCongressional interest in establishing a systematic means of examining and reportingon the significance of major trade shifts, by product, and with leading U.S. tradingpartners, in service, agricultural, and manufacturing sectors. A significant amount ofthe information contained in this recurring report reflects basic research that is requiredto maintain a proficient level of trade expertise. The Commission has found suchexpertise to be essential in its statutory investigations and in apprising its variedcustomer base of global industry trends, regional developments, and competitivenessissues.
On December 20, 1994, the Commission on its own motion expanded the scope of thisreport to include detailed coverage of service industries. Under the expanded scope,the Commission publishes two reports annually, one entitled Shifts in U.S.Merchandise Trade (July) and the second entitled Recent Trends in U.S. ServicesTrade (May). Services trade is presented in a separate report in order to provide more1
comprehensive and timely coverage of the sector’s performance.
The current report begins with a statistical overview of U.S. trade in services and adiscussion of key trends. Thereafter, the report presents industry-specific analyses thatfocus on trends in exports, imports, and trade balances during 1991-96. Industry-specific analyses also identify major trading partners during the subject period. Thereport concludes with an examination of commitments on basic telecommunicationservices scheduled for the 20 largest foreign telecommunication markets under theGeneral Agreement on Trade in Services (GATS) administered by the World TradeOrganization.
Further USITC analyses of the GATS may be found in the reports General Agreementon Trade in Services: Examination of Major Trading Partners’ Schedules ofCommitments (USITC Publication 2940, Dec. 1995), General Agreement on Tradein Services: Examination of South American Trading Partners’ Schedules ofCommitments (USITC Publication 3007, Dec. 1996), General Agreement on Tradein Services: Examination of the Schedules of Commitments Submitted by Asia/PacificTrading Partners (USITC publication 3053, Aug. 1997), and General Agreement onTrade in Services: Examination of the Schedules of Commitments Submitted byTrading Partners of Eastern Europe, European Free Trade Area, and Turkey,(forthcoming, 1998).
The information and analysis in this report are for the purpose of this report only.Nothing in this report should be construed to indicate how the Commission would findin an investigation conducted under other statutory authority.

ii

CONTENTS
Page
Preface . . . . . . . . . . . . . . . . . . . . . . . . . . . . . . . . . . . . . . . . . . . . . . . . . . . . . . . . . . . . . . . i
Chapter 1: Introduction . . . . . . . . . . . . . . . . . . . . . . . . . . . . . . . . . . . . . . . 1-1
Scope and purpose . . . . . . . . . . . . . . . . . . . . . . . . . . . . . . . . . . . . . . . . . . . . . . . . . . . . 1-1Methodology and organization . . . . . . . . . . . . . . . . . . . . . . . . . . . . . . . . . . . . . . . . . . . 1-1
Chapter 2: U.S. trade in services . . . . . . . . . . . . . . . . . . . . . . . . . . . 2-1
Nature of trade in services . . . . . . . . . . . . . . . . . . . . . . . . . . . . . . . . . . . . . . . . . . . . . . 2-1Cross-border trade . . . . . . . . . . . . . . . . . . . . . . . . . . . . . . . . . . . . . . . . . . . . . . . . . . . . 2-1
Cross-border trade by industry . . . . . . . . . . . . . . . . . . . . . . . . . . . . . . . . . . . . . . . 2-4Cross-border trade by trading partner . . . . . . . . . . . . . . . . . . . . . . . . . . . . . . . . . . 2-6
Affiliate transactions . . . . . . . . . . . . . . . . . . . . . . . . . . . . . . . . . . . . . . . . . . . . . . . . . . 2-8Affiliate transactions by industry . . . . . . . . . . . . . . . . . . . . . . . . . . . . . . . . . . . . . 2-10Affiliate transactions by trading partner . . . . . . . . . . . . . . . . . . . . . . . . . . . . . . . . 2-11
Chapter 3: Industry discussions . . . . . . . . . . . . . . . . . . . . . . . . . . . . 3-1
Distribution services . . . . . . . . . . . . . . . . . . . . . . . . . . . . . . . . . . . . . . . . . . . . . . . . . . . 3-1Wholesale trade . . . . . . . . . . . . . . . . . . . . . . . . . . . . . . . . . . . . . . . . . . . . . . . . . . . 3-2
Introduction . . . . . . . . . . . . . . . . . . . . . . . . . . . . . . . . . . . . . . . . . . . . . . . . . . . 3-2Recent trends in affiliate transactions, 1991-95 . . . . . . . . . . . . . . . . . . . . . . . 3-2Summary and outlook . . . . . . . . . . . . . . . . . . . . . . . . . . . . . . . . . . . . . . . . . . . 3-4
Retail trade . . . . . . . . . . . . . . . . . . . . . . . . . . . . . . . . . . . . . . . . . . . . . . . . . . . . . . . 3-6Introduction . . . . . . . . . . . . . . . . . . . . . . . . . . . . . . . . . . . . . . . . . . . . . . . . . . . 3-6Recent trends in affiliate transactions, 1991-95 . . . . . . . . . . . . . . . . . . . . . . . 3-7Summary and outlook . . . . . . . . . . . . . . . . . . . . . . . . . . . . . . . . . . . . . . . . . . . 3-7
Education services . . . . . . . . . . . . . . . . . . . . . . . . . . . . . . . . . . . . . . . . . . . . . . . . . . . . 3-11Introduction . . . . . . . . . . . . . . . . . . . . . . . . . . . . . . . . . . . . . . . . . . . . . . . . . . . . . . 3-11Recent trends in cross-border trade, 1991-96 . . . . . . . . . . . . . . . . . . . . . . . . . . . . 3-12Summary and outlook . . . . . . . . . . . . . . . . . . . . . . . . . . . . . . . . . . . . . . . . . . . . . . 3-15
Financial services . . . . . . . . . . . . . . . . . . . . . . . . . . . . . . . . . . . . . . . . . . . . . . . . . . . . . 3-17Banking and securities . . . . . . . . . . . . . . . . . . . . . . . . . . . . . . . . . . . . . . . . . . . . . . 3-17
Introduction . . . . . . . . . . . . . . . . . . . . . . . . . . . . . . . . . . . . . . . . . . . . . . . . . . . 3-17Recent trends . . . . . . . . . . . . . . . . . . . . . . . . . . . . . . . . . . . . . . . . . . . . . . . . . . 3-18
Cross-border trade, 1992-96 . . . . . . . . . . . . . . . . . . . . . . . . . . . . . . . . . . 3-18Affiliate transactions, 1991-95 . . . . . . . . . . . . . . . . . . . . . . . . . . . . . . . . 3-20
Summary and outlook . . . . . . . . . . . . . . . . . . . . . . . . . . . . . . . . . . . . . . . . . . . 3-22

iv
CONTENTS—Continued
Page
Chapter 3: Industry discussions—Continued
Insurance services . . . . . . . . . . . . . . . . . . . . . . . . . . . . . . . . . . . . . . . . . . . . . . . . . 3-25Introduction . . . . . . . . . . . . . . . . . . . . . . . . . . . . . . . . . . . . . . . . . . . . . . . . . . 3-25Recent trends . . . . . . . . . . . . . . . . . . . . . . . . . . . . . . . . . . . . . . . . . . . . . . . . . 3-26
Cross-border trade, 1991-96 . . . . . . . . . . . . . . . . . . . . . . . . . . . . . . . . . . 3-26Affiliate transactions, 1991-95 . . . . . . . . . . . . . . . . . . . . . . . . . . . . . . . . 3-27
Summary and outlook . . . . . . . . . . . . . . . . . . . . . . . . . . . . . . . . . . . . . . . . . . . 3-28Integration of financial services . . . . . . . . . . . . . . . . . . . . . . . . . . . . . . . . 3-29Globalization and consolidation . . . . . . . . . . . . . . . . . . . . . . . . . . . . . . . 3-30Changing market and technological changes . . . . . . . . . . . . . . . . . . . . . 3-31
Intellectual property-related services . . . . . . . . . . . . . . . . . . . . . . . . . . . . . . . . . . . . . . 3-32Introduction . . . . . . . . . . . . . . . . . . . . . . . . . . . . . . . . . . . . . . . . . . . . . . . . . . . . . . 3-32Recent trends . . . . . . . . . . . . . . . . . . . . . . . . . . . . . . . . . . . . . . . . . . . . . . . . . . . . . 3-32
Cross-border trade, 1991-96 . . . . . . . . . . . . . . . . . . . . . . . . . . . . . . . . . . . . . 3-32Affiliate transactions, 1991-95 . . . . . . . . . . . . . . . . . . . . . . . . . . . . . . . . . . . 3-34
Summary and outlook . . . . . . . . . . . . . . . . . . . . . . . . . . . . . . . . . . . . . . . . . . . . . . 3-35Professional services . . . . . . . . . . . . . . . . . . . . . . . . . . . . . . . . . . . . . . . . . . . . . . . . . . 3-36
Accounting and management consulting services . . . . . . . . . . . . . . . . . . . . . . . . . 3-36Introduction . . . . . . . . . . . . . . . . . . . . . . . . . . . . . . . . . . . . . . . . . . . . . . . . . . 3-36Recent trends . . . . . . . . . . . . . . . . . . . . . . . . . . . . . . . . . . . . . . . . . . . . . . . . . 3-37
Cross-border trade, 1991-96 . . . . . . . . . . . . . . . . . . . . . . . . . . . . . . . . . . 3-37Affiliate transactions, 1991-95 . . . . . . . . . . . . . . . . . . . . . . . . . . . . . . . . 3-37
Summary and outlook . . . . . . . . . . . . . . . . . . . . . . . . . . . . . . . . . . . . . . . . . . . 3-39Architectural, engineering, and construction services . . . . . . . . . . . . . . . . . . . . . . 3-42
Introduction . . . . . . . . . . . . . . . . . . . . . . . . . . . . . . . . . . . . . . . . . . . . . . . . . . 3-42Recent trends in cross-border trade, 1991-96 . . . . . . . . . . . . . . . . . . . . . . . . 3-43Summary and outlook . . . . . . . . . . . . . . . . . . . . . . . . . . . . . . . . . . . . . . . . . . . 3-45
Computer and data processing services . . . . . . . . . . . . . . . . . . . . . . . . . . . . . . . . 3-50Introduction . . . . . . . . . . . . . . . . . . . . . . . . . . . . . . . . . . . . . . . . . . . . . . . . . . 3-50Recent trends . . . . . . . . . . . . . . . . . . . . . . . . . . . . . . . . . . . . . . . . . . . . . . . . . 3-50
Cross-border trade, 1991-96 . . . . . . . . . . . . . . . . . . . . . . . . . . . . . . . . . . 3-50Affiliate transactions, 1991-95 . . . . . . . . . . . . . . . . . . . . . . . . . . . . . . . . 3-52
Summary and outlook . . . . . . . . . . . . . . . . . . . . . . . . . . . . . . . . . . . . . . . . . . . 3-53Health care services . . . . . . . . . . . . . . . . . . . . . . . . . . . . . . . . . . . . . . . . . . . . . . . . 3-55
Introduction . . . . . . . . . . . . . . . . . . . . . . . . . . . . . . . . . . . . . . . . . . . . . . . . . . 3-55Recent trends . . . . . . . . . . . . . . . . . . . . . . . . . . . . . . . . . . . . . . . . . . . . . . . . . 3-56
Cross-border trade, 1991-96 . . . . . . . . . . . . . . . . . . . . . . . . . . . . . . . . . . 3-56Affiliate transactions, 1991-95 . . . . . . . . . . . . . . . . . . . . . . . . . . . . . . . . 3-57
Summary and outlook . . . . . . . . . . . . . . . . . . . . . . . . . . . . . . . . . . . . . . . . . . . 3-58

v
CONTENTS—Continued
Page
Chapter 3: Industry discussions—Continued
Legal services . . . . . . . . . . . . . . . . . . . . . . . . . . . . . . . . . . . . . . . . . . . . . . . . . . . . 3-61Introduction . . . . . . . . . . . . . . . . . . . . . . . . . . . . . . . . . . . . . . . . . . . . . . . . . . . 3-61Recent trends in cross-border trade, 1991-96 . . . . . . . . . . . . . . . . . . . . . . . . 3-62Summary and outlook . . . . . . . . . . . . . . . . . . . . . . . . . . . . . . . . . . . . . . . . . . . 3-62
Maintenance and repair, installation, alteration, and training services . . . . . . . . . 3-65Introduction . . . . . . . . . . . . . . . . . . . . . . . . . . . . . . . . . . . . . . . . . . . . . . . . . . . 3-65Recent trends in cross-border trade, 1991-96 . . . . . . . . . . . . . . . . . . . . . . . . 3-66Summary and outlook . . . . . . . . . . . . . . . . . . . . . . . . . . . . . . . . . . . . . . . . . . . 3-68
Telecommunication services . . . . . . . . . . . . . . . . . . . . . . . . . . . . . . . . . . . . . . . . . . . . 3-70Introduction . . . . . . . . . . . . . . . . . . . . . . . . . . . . . . . . . . . . . . . . . . . . . . . . . . . . . . 3-70Recent trends . . . . . . . . . . . . . . . . . . . . . . . . . . . . . . . . . . . . . . . . . . . . . . . . . . . . . 3-71
Cross-border trade, 1991-96 . . . . . . . . . . . . . . . . . . . . . . . . . . . . . . . . . . . . . 3-71Affiliate transactions, 1991-95 . . . . . . . . . . . . . . . . . . . . . . . . . . . . . . . . . . . . 3-73
Summary and outlook . . . . . . . . . . . . . . . . . . . . . . . . . . . . . . . . . . . . . . . . . . . . . . 3-74Transportation services . . . . . . . . . . . . . . . . . . . . . . . . . . . . . . . . . . . . . . . . . . . . . . . . 3-76
Introduction . . . . . . . . . . . . . . . . . . . . . . . . . . . . . . . . . . . . . . . . . . . . . . . . . . . . . . 3-76Recent trends . . . . . . . . . . . . . . . . . . . . . . . . . . . . . . . . . . . . . . . . . . . . . . . . . . . . . 3-76
Cross-border trade, 1991-96 . . . . . . . . . . . . . . . . . . . . . . . . . . . . . . . . . . . . . 3-76Affiliate transactions, 1991-95 . . . . . . . . . . . . . . . . . . . . . . . . . . . . . . . . . . . . 3-77
Summary and outlook . . . . . . . . . . . . . . . . . . . . . . . . . . . . . . . . . . . . . . . . . . . . . . 3-79Travel and tourism services . . . . . . . . . . . . . . . . . . . . . . . . . . . . . . . . . . . . . . . . . . . . . 3-81
Introduction . . . . . . . . . . . . . . . . . . . . . . . . . . . . . . . . . . . . . . . . . . . . . . . . . . . . . . 3-81Recent trends . . . . . . . . . . . . . . . . . . . . . . . . . . . . . . . . . . . . . . . . . . . . . . . . . . . . . 3-82
Cross-border trade, 1991-96 . . . . . . . . . . . . . . . . . . . . . . . . . . . . . . . . . . . . . 3-82Affiliate transactions, 1991-95 . . . . . . . . . . . . . . . . . . . . . . . . . . . . . . . . . . . . 3-84
Summary and outlook . . . . . . . . . . . . . . . . . . . . . . . . . . . . . . . . . . . . . . . . . . . . . . 3-84
Chapter 4: Examination of WTO agreement onbasic telecommunications . . . . . . . . . . . . . . . . . . . . . . . . . . . . . . 4-1
Introduction . . . . . . . . . . . . . . . . . . . . . . . . . . . . . . . . . . . . . . . . . . . . . . . . . . . . . . . . . 4-1Methodology . . . . . . . . . . . . . . . . . . . . . . . . . . . . . . . . . . . . . . . . . . . . . . . . . . . . . . . . . 4-2WTO agreement on basic telecommunication services . . . . . . . . . . . . . . . . . . . . . . . . 4-3
The General Agreement on Trade in Services . . . . . . . . . . . . . . . . . . . . . . . . . . . . 4-4The GATS framework . . . . . . . . . . . . . . . . . . . . . . . . . . . . . . . . . . . . . . . . . . 4-10The annex on telecommunications . . . . . . . . . . . . . . . . . . . . . . . . . . . . . . . . . 4-10Ministerial decisions and the fourth protocol . . . . . . . . . . . . . . . . . . . . . . . . . 4-11

vi
CONTENTS—Continued
Page
Chapter 4: Examination of WTO agreement onbasic telecommunications—Continued
Supplementary schedules on basic telecommunication services . . . . . . . . . . 4-12Scheduling methodology . . . . . . . . . . . . . . . . . . . . . . . . . . . . . . . . . . . . . 4-12Telecommunication schedules . . . . . . . . . . . . . . . . . . . . . . . . . . . . . . . . . 4-12Chairman’s notes . . . . . . . . . . . . . . . . . . . . . . . . . . . . . . . . . . . . . . . . . . . 4-13Reference paper . . . . . . . . . . . . . . . . . . . . . . . . . . . . . . . . . . . . . . . . . . . . 4-13
International trade in basic telecommunication services . . . . . . . . . . . . . . . . . . . . . . . 4-14Cross-border supply . . . . . . . . . . . . . . . . . . . . . . . . . . . . . . . . . . . . . . . . . . . . . . . 4-14Commercial presence . . . . . . . . . . . . . . . . . . . . . . . . . . . . . . . . . . . . . . . . . . . . . . 4-15Other modes . . . . . . . . . . . . . . . . . . . . . . . . . . . . . . . . . . . . . . . . . . . . . . . . . . . . . 4-19
Overview of subject countries . . . . . . . . . . . . . . . . . . . . . . . . . . . . . . . . . . . . . . . . . . . 4-19Argentina . . . . . . . . . . . . . . . . . . . . . . . . . . . . . . . . . . . . . . . . . . . . . . . . . . . . . . . . . . . 4-23
Foreign investment . . . . . . . . . . . . . . . . . . . . . . . . . . . . . . . . . . . . . . . . . . . . . . . . 4-25Market access . . . . . . . . . . . . . . . . . . . . . . . . . . . . . . . . . . . . . . . . . . . . . . . . . . . . 4-25Regulatory principles . . . . . . . . . . . . . . . . . . . . . . . . . . . . . . . . . . . . . . . . . . . . . . 4-26
Australia . . . . . . . . . . . . . . . . . . . . . . . . . . . . . . . . . . . . . . . . . . . . . . . . . . . . . . . . . . . . 4-27Foreign investment . . . . . . . . . . . . . . . . . . . . . . . . . . . . . . . . . . . . . . . . . . . . . . . . 4-29Market access . . . . . . . . . . . . . . . . . . . . . . . . . . . . . . . . . . . . . . . . . . . . . . . . . . . . 4-29Regulatory principles . . . . . . . . . . . . . . . . . . . . . . . . . . . . . . . . . . . . . . . . . . . . . . 4-30
Brazil . . . . . . . . . . . . . . . . . . . . . . . . . . . . . . . . . . . . . . . . . . . . . . . . . . . . . . . . . . . . . . 4-31Foreign investment . . . . . . . . . . . . . . . . . . . . . . . . . . . . . . . . . . . . . . . . . . . . . . . . 4-31Market access . . . . . . . . . . . . . . . . . . . . . . . . . . . . . . . . . . . . . . . . . . . . . . . . . . . . 4-33Regulatory principles . . . . . . . . . . . . . . . . . . . . . . . . . . . . . . . . . . . . . . . . . . . . . . 4-34
Canada . . . . . . . . . . . . . . . . . . . . . . . . . . . . . . . . . . . . . . . . . . . . . . . . . . . . . . . . . . . . . 4-34Foreign investment . . . . . . . . . . . . . . . . . . . . . . . . . . . . . . . . . . . . . . . . . . . . . . . . 4-34Market access . . . . . . . . . . . . . . . . . . . . . . . . . . . . . . . . . . . . . . . . . . . . . . . . . . . . 4-37Regulatory principles . . . . . . . . . . . . . . . . . . . . . . . . . . . . . . . . . . . . . . . . . . . . . . 4-37
European Union . . . . . . . . . . . . . . . . . . . . . . . . . . . . . . . . . . . . . . . . . . . . . . . . . . . . . . 4-38Foreign investment . . . . . . . . . . . . . . . . . . . . . . . . . . . . . . . . . . . . . . . . . . . . . . . . 4-41Market access . . . . . . . . . . . . . . . . . . . . . . . . . . . . . . . . . . . . . . . . . . . . . . . . . . . . 4-41Regulatory principles . . . . . . . . . . . . . . . . . . . . . . . . . . . . . . . . . . . . . . . . . . . . . . 4-42
Hong Kong . . . . . . . . . . . . . . . . . . . . . . . . . . . . . . . . . . . . . . . . . . . . . . . . . . . . . . . . . . 4-44Foreign investment . . . . . . . . . . . . . . . . . . . . . . . . . . . . . . . . . . . . . . . . . . . . . . . . 4-44Market access . . . . . . . . . . . . . . . . . . . . . . . . . . . . . . . . . . . . . . . . . . . . . . . . . . . . 4-46Regulatory principles . . . . . . . . . . . . . . . . . . . . . . . . . . . . . . . . . . . . . . . . . . . . . . 4-47
India . . . . . . . . . . . . . . . . . . . . . . . . . . . . . . . . . . . . . . . . . . . . . . . . . . . . . . . . . . . . . . . 4-48Foreign investment . . . . . . . . . . . . . . . . . . . . . . . . . . . . . . . . . . . . . . . . . . . . . . . . 4-48Market access . . . . . . . . . . . . . . . . . . . . . . . . . . . . . . . . . . . . . . . . . . . . . . . . . . . . 4-48Regulatory principles . . . . . . . . . . . . . . . . . . . . . . . . . . . . . . . . . . . . . . . . . . . . . . 4-50

vii
CONTENTS—Continued
Page
Chapter 4: Examination of WTO agreement onbasic telecommunications—Continued
Indonesia . . . . . . . . . . . . . . . . . . . . . . . . . . . . . . . . . . . . . . . . . . . . . . . . . . . . . . . . . . . . 4-51Foreign investment . . . . . . . . . . . . . . . . . . . . . . . . . . . . . . . . . . . . . . . . . . . . . . . . 4-55Market access . . . . . . . . . . . . . . . . . . . . . . . . . . . . . . . . . . . . . . . . . . . . . . . . . . . . 4-55Regulatory principles . . . . . . . . . . . . . . . . . . . . . . . . . . . . . . . . . . . . . . . . . . . . . . . 4-56
Israel . . . . . . . . . . . . . . . . . . . . . . . . . . . . . . . . . . . . . . . . . . . . . . . . . . . . . . . . . . . . . . . 4-56Foreign investment . . . . . . . . . . . . . . . . . . . . . . . . . . . . . . . . . . . . . . . . . . . . . . . . 4-57Market access . . . . . . . . . . . . . . . . . . . . . . . . . . . . . . . . . . . . . . . . . . . . . . . . . . . . 4-59Regulatory principles . . . . . . . . . . . . . . . . . . . . . . . . . . . . . . . . . . . . . . . . . . . . . . . 4-59
Japan . . . . . . . . . . . . . . . . . . . . . . . . . . . . . . . . . . . . . . . . . . . . . . . . . . . . . . . . . . . . . . . 4-60Foreign investment . . . . . . . . . . . . . . . . . . . . . . . . . . . . . . . . . . . . . . . . . . . . . . . . 4-60Market access . . . . . . . . . . . . . . . . . . . . . . . . . . . . . . . . . . . . . . . . . . . . . . . . . . . . 4-62Regulatory principles . . . . . . . . . . . . . . . . . . . . . . . . . . . . . . . . . . . . . . . . . . . . . . . 4-62
Korea . . . . . . . . . . . . . . . . . . . . . . . . . . . . . . . . . . . . . . . . . . . . . . . . . . . . . . . . . . . . . . . 4-63Foreign investment . . . . . . . . . . . . . . . . . . . . . . . . . . . . . . . . . . . . . . . . . . . . . . . . 4-63Market access . . . . . . . . . . . . . . . . . . . . . . . . . . . . . . . . . . . . . . . . . . . . . . . . . . . . 4-65Regulatory principles . . . . . . . . . . . . . . . . . . . . . . . . . . . . . . . . . . . . . . . . . . . . . . . 4-65
Malaysia . . . . . . . . . . . . . . . . . . . . . . . . . . . . . . . . . . . . . . . . . . . . . . . . . . . . . . . . . . . . 4-66Foreign investment . . . . . . . . . . . . . . . . . . . . . . . . . . . . . . . . . . . . . . . . . . . . . . . . 4-68Market access . . . . . . . . . . . . . . . . . . . . . . . . . . . . . . . . . . . . . . . . . . . . . . . . . . . . 4-68Regulatory principles . . . . . . . . . . . . . . . . . . . . . . . . . . . . . . . . . . . . . . . . . . . . . . . 4-68
Mexico . . . . . . . . . . . . . . . . . . . . . . . . . . . . . . . . . . . . . . . . . . . . . . . . . . . . . . . . . . . . . 4-69Foreign investment . . . . . . . . . . . . . . . . . . . . . . . . . . . . . . . . . . . . . . . . . . . . . . . . 4-69Market access . . . . . . . . . . . . . . . . . . . . . . . . . . . . . . . . . . . . . . . . . . . . . . . . . . . . 4-69Regulatory principles . . . . . . . . . . . . . . . . . . . . . . . . . . . . . . . . . . . . . . . . . . . . . . . 4-72
New Zealand . . . . . . . . . . . . . . . . . . . . . . . . . . . . . . . . . . . . . . . . . . . . . . . . . . . . . . . . . 4-74Foreign investment . . . . . . . . . . . . . . . . . . . . . . . . . . . . . . . . . . . . . . . . . . . . . . . . 4-74Market access . . . . . . . . . . . . . . . . . . . . . . . . . . . . . . . . . . . . . . . . . . . . . . . . . . . . 4-74Regulatory principles . . . . . . . . . . . . . . . . . . . . . . . . . . . . . . . . . . . . . . . . . . . . . . . 4-76
Norway . . . . . . . . . . . . . . . . . . . . . . . . . . . . . . . . . . . . . . . . . . . . . . . . . . . . . . . . . . . . . 4-77Foreign investment . . . . . . . . . . . . . . . . . . . . . . . . . . . . . . . . . . . . . . . . . . . . . . . . 4-77Market access . . . . . . . . . . . . . . . . . . . . . . . . . . . . . . . . . . . . . . . . . . . . . . . . . . . . 4-77Regulatory principles . . . . . . . . . . . . . . . . . . . . . . . . . . . . . . . . . . . . . . . . . . . . . . . 4-77
Poland . . . . . . . . . . . . . . . . . . . . . . . . . . . . . . . . . . . . . . . . . . . . . . . . . . . . . . . . . . . . . . 4-80Foreign investment . . . . . . . . . . . . . . . . . . . . . . . . . . . . . . . . . . . . . . . . . . . . . . . . 4-80Market access . . . . . . . . . . . . . . . . . . . . . . . . . . . . . . . . . . . . . . . . . . . . . . . . . . . . 4-80Regulatory principles . . . . . . . . . . . . . . . . . . . . . . . . . . . . . . . . . . . . . . . . . . . . . . . 4-83
Singapore . . . . . . . . . . . . . . . . . . . . . . . . . . . . . . . . . . . . . . . . . . . . . . . . . . . . . . . . . . . 4-84Foreign investment . . . . . . . . . . . . . . . . . . . . . . . . . . . . . . . . . . . . . . . . . . . . . . . . 4-84Market access . . . . . . . . . . . . . . . . . . . . . . . . . . . . . . . . . . . . . . . . . . . . . . . . . . . . 4-84

viii
CONTENTS—Continued
Page
Chapter 4: Examination of WTO agreement onbasic telecommunications—Continued
Regulatory principles . . . . . . . . . . . . . . . . . . . . . . . . . . . . . . . . . . . . . . . . . . . . . . 4-87South Africa . . . . . . . . . . . . . . . . . . . . . . . . . . . . . . . . . . . . . . . . . . . . . . . . . . . . . . . . . 4-88
Foreign investment . . . . . . . . . . . . . . . . . . . . . . . . . . . . . . . . . . . . . . . . . . . . . . . . 4-88Market access . . . . . . . . . . . . . . . . . . . . . . . . . . . . . . . . . . . . . . . . . . . . . . . . . . . . 4-90Regulatory principles . . . . . . . . . . . . . . . . . . . . . . . . . . . . . . . . . . . . . . . . . . . . . . 4-90
Switzerland . . . . . . . . . . . . . . . . . . . . . . . . . . . . . . . . . . . . . . . . . . . . . . . . . . . . . . . . . . 4-92Foreign investment . . . . . . . . . . . . . . . . . . . . . . . . . . . . . . . . . . . . . . . . . . . . . . . . 4-92Market access . . . . . . . . . . . . . . . . . . . . . . . . . . . . . . . . . . . . . . . . . . . . . . . . . . . . 4-92Regulatory principles . . . . . . . . . . . . . . . . . . . . . . . . . . . . . . . . . . . . . . . . . . . . . . 4-94
Thailand . . . . . . . . . . . . . . . . . . . . . . . . . . . . . . . . . . . . . . . . . . . . . . . . . . . . . . . . . . . . 4-95Foreign investment . . . . . . . . . . . . . . . . . . . . . . . . . . . . . . . . . . . . . . . . . . . . . . . . 4-95Market access . . . . . . . . . . . . . . . . . . . . . . . . . . . . . . . . . . . . . . . . . . . . . . . . . . . . 4-95Regulatory principles . . . . . . . . . . . . . . . . . . . . . . . . . . . . . . . . . . . . . . . . . . . . . . 4-98
Box
4-1. International settlement payments . . . . . . . . . . . . . . . . . . . . . . . . . . . . . . . . . . . . . . . . 4-16
Figures
1-1. U.S. cross-border trade volume, by sector, 1996 . . . . . . . . . . . . . . . . . . . . . . . . . . . . 1-21-2. U.S. private-sector gross domestic product, by sector, 1996 . . . . . . . . . . . . . . . . . . . 1-31-3. U.S. private-sector employment, by sector, 1996 . . . . . . . . . . . . . . . . . . . . . . . . . . . . 1-32-1. U.S. cross-border trade in services: Exports, imports, and trade balance, 1987-96 . . 2-22-2. U.S. merchandise and services trade balances, 1987-96 . . . . . . . . . . . . . . . . . . . . . . . 2-22-3. U.S. cross-border service exports and imports, by industries, 1996 . . . . . . . . . . . . . . 2-52-4. Royalties and license fees in the U.S. cross-border services trade balance, 1987-96 . 2-72-5. Travel and tourism in the U.S. cross-border services trade balance, 1987-96 . . . . . . 2-72-6. U.S. cross-border service exports and imports, by selected trading partners, 1996 . . 2-82-7. Affiliate service transactions: U.S. sales, purchases, and balance, 1989-95 . . . . . . . 2-92-8. Affiliate service transactions: U.S. sales and purchases, by industry, 1995 . . . . . . . . 2-102-9. Affiliate service transactions: U.S. sales and purchases, by selected trading
partners, 1995 . . . . . . . . . . . . . . . . . . . . . . . . . . . . . . . . . . . . . . . . . . . . . . . . . . . . 2-113-1. Wholesale services transactions by majority-owned affiliates: U.S. sales, purchases,
and balance, 1991-95 . . . . . . . . . . . . . . . . . . . . . . . . . . . . . . . . . . . . . . . . . . . . . . 3-33-2. Wholesale services transactions by majority-owned affiliates: U.S. sales and
balance, by major trading partners, 1995 . . . . . . . . . . . . . . . . . . . . . . . . . . . . . . . 3-5

ix
CONTENTS—Continued
Page
Figures—Continued
3-3. Retail services transactions by majority-owned affiliates: U.S. sales, purchases, and balance, 1991-95 . . . . . . . . . . . . . . . . . . . . . . . . . . . . . . . . . . . . . . . . . . . . . . . . . . 3-8
3-4. Retail services transactions by majority-owned affiliates: U.S. sales and balance, bymajor trading partners, 1995 . . . . . . . . . . . . . . . . . . . . . . . . . . . . . . . . . . . . . . . . . 3-8
3-5. Education services: U.S. cross-border exports, imports, and trade balance, 1991-96 3-133-6. Education services: U.S. cross-border exports and trade balance, by major trading
partners, 1996 . . . . . . . . . . . . . . . . . . . . . . . . . . . . . . . . . . . . . . . . . . . . . . . . . . . . 3-143-7. Banking and securities services: U.S.-cross border exports, imports, and trade
balance, 1992-96 . . . . . . . . . . . . . . . . . . . . . . . . . . . . . . . . . . . . . . . . . . . . . . . . . . 3-193-8. Banking and securities services: U.S.-cross border exports and trade balance, by
major trading partners, 1996 . . . . . . . . . . . . . . . . . . . . . . . . . . . . . . . . . . . . . . . . . 3-203-9. Banking and securities services transactions by majority-owned affiliates:
U.S. sales, purchases, and balance, 1991-95 . . . . . . . . . . . . . . . . . . . . . . . . . . . . 3-213-10. Banking and securities services transactions by majority-owned affiliates:
U.S. sales and balance, by major trading partners, 1995 . . . . . . . . . . . . . . . . . . . 3-223-11. Insurance services: U.S. cross-border exports, imports, and trade balance,
1991-96 . . . . . . . . . . . . . . . . . . . . . . . . . . . . . . . . . . . . . . . . . . . . . . . . . . . . . . . . . 3-263-12. Insurance services: U.S. cross-border exports and trade balance, by major trading
partners, 1996 . . . . . . . . . . . . . . . . . . . . . . . . . . . . . . . . . . . . . . . . . . . . . . . . . . . . 3-273-13. Insurance services transactions by majority-owned affiliates: U.S. sales, purchases,
and balance, 1991-95 . . . . . . . . . . . . . . . . . . . . . . . . . . . . . . . . . . . . . . . . . . . . . . 3-283-14. Insurance services transactions by majority-owned affiliates: U.S. sales and
balance, by major trading partners, 1995 . . . . . . . . . . . . . . . . . . . . . . . . . . . . . . . 3-293-15. Intellectual property-related services: U.S. cross-border exports, imports, and trade
balance, 1991-96 . . . . . . . . . . . . . . . . . . . . . . . . . . . . . . . . . . . . . . . . . . . . . . . . . . 3-333-16. Intellectual property-related services: U.S. cross-border exports and trade balance,
by major trading partners, 1996 . . . . . . . . . . . . . . . . . . . . . . . . . . . . . . . . . . . . . . 3-343-17. Intellectual property-related services transactions by majority-owned affiliates:
U.S. sales, purchases, and balance, 1991-95 . . . . . . . . . . . . . . . . . . . . . . . . . . . . 3-353-18. Accounting and management consulting services: U.S. cross-border exports,
imports, and trade balance, 1991-96 . . . . . . . . . . . . . . . . . . . . . . . . . . . . . . . . . . . 3-383-19. Accounting and management consulting services: U.S. cross-border exports and
trade balance, by major trading partners, 1996 . . . . . . . . . . . . . . . . . . . . . . . . . . . 3-383-20. Accounting and management consulting service transactions by majority-owned
affiliates: U.S. sales, purchases, and balance, 1991-95 . . . . . . . . . . . . . . . . . . . . 3-393-21. Accounting and management consulting service transactions by majority-owned
affiliates: U.S. sales and balance, by major trading partners, 1995 . . . . . . . . . . . 3-403-22. Architectural, engineering, and construction services: U.S. cross-border exports,
imports, and trade balance, 1991-96 . . . . . . . . . . . . . . . . . . . . . . . . . . . . . . . . . . . 3-443-23. Architectural, engineering, and construction services: U.S. cross-border exports
and trade balance, by major trading partners, 1996 . . . . . . . . . . . . . . . . . . . . . . . 3-44

x
CONTENTS—Continued
Page
Figures—Continued
3-24. Computer and data processing services: U.S. cross-border exports, imports, andtrade balance, 1991-96 . . . . . . . . . . . . . . . . . . . . . . . . . . . . . . . . . . . . . . . . . . . . . 3-51
3-25. Computer and data processing services: U.S. cross-border exports and tradebalance, by major trading partners, 1996 . . . . . . . . . . . . . . . . . . . . . . . . . . . . . . . 3-52
3-26. Computer and data processing services transactions by majority-owned affiliates:U.S. sales, purchases, and balance, 1991-95 . . . . . . . . . . . . . . . . . . . . . . . . . . . . 3-53
3-27. Health care services: U.S. cross-border exports, imports, and trade balance, 1991-96 . . . . . . . . . . . . . . . . . . . . . . . . . . . . . . . . . . . . . . . . . . . . . . . . . . . . . . . . . 3-57
3-28. Health care services transactions by majority-owned affiliates: U.S. sales,purchases, and balance, 1991-95 . . . . . . . . . . . . . . . . . . . . . . . . . . . . . . . . . . . . . 3-58
3-29. Legal services: U.S. cross-border exports, imports, and trade balance, 1991-96 . . . . 3-633-30. Legal services: U.S. cross-border exports and trade balance, by major
trading partners, 1996 . . . . . . . . . . . . . . . . . . . . . . . . . . . . . . . . . . . . . . . . . . . . . . 3-633-31. Maintenance and repair, installation, alteration, and training services: U.S.
cross-border exports, imports, and trade balance, 1991-96 . . . . . . . . . . . . . . . . . 3-673-32. Maintenance and repair, installation, alteration, and training services: U.S.
cross-border exports and trade balance, by major trading partners, 1996 . . . . . . 3-673-33. Telecommunication services: U.S. cross-border exports, imports, and trade
balance, 1991-96 . . . . . . . . . . . . . . . . . . . . . . . . . . . . . . . . . . . . . . . . . . . . . . . . . . 3-723-34. Telecommunication services: U.S. cross-border exports and trade balance, by
major trading partners, 1996 . . . . . . . . . . . . . . . . . . . . . . . . . . . . . . . . . . . . . . . . . 3-733-35. Transportation services: U.S. cross-border exports, imports, and trade balance,
1991-96 . . . . . . . . . . . . . . . . . . . . . . . . . . . . . . . . . . . . . . . . . . . . . . . . . . . . . . . . . 3-773-36. Transportation services: U.S. cross-border exports and trade balance, by major
trading partners, 1996 . . . . . . . . . . . . . . . . . . . . . . . . . . . . . . . . . . . . . . . . . . . . . . 3-783-37. Transportation services transactions by majority-owned affiliates: U.S. sales,
purchases, and balance, 1991-95 . . . . . . . . . . . . . . . . . . . . . . . . . . . . . . . . . . . . . 3-783-38. Travel and tourism services: U.S. cross-border exports, imports, and trade
balance, 1991-96 . . . . . . . . . . . . . . . . . . . . . . . . . . . . . . . . . . . . . . . . . . . . . . . . . . 3-823-39. Travel and tourism services: U.S. cross-border exports and trade balance,
by major trading partners, 1996 . . . . . . . . . . . . . . . . . . . . . . . . . . . . . . . . . . . . . . 3-833-40. Travel and tourism services transactions by majority-owned affiliates: U.S.
sales, purchases, and balance, 1991-95 . . . . . . . . . . . . . . . . . . . . . . . . . . . . . . . . 3-853-41. Travel and tourism services transactions by majority-owned affiliates: U.S. sales and balance, by major trading partners, 1995 . . . . . . . . . . . . . . . . . . . . . . . . . . . . 3-854-1. Components of the WTO agreement on basic telecommunication services . . . . . . . . 4-54-2. Structure of the General Agreement on Trade in Services . . . . . . . . . . . . . . . . . . . . . 4-94-3. Telecommunication architecture . . . . . . . . . . . . . . . . . . . . . . . . . . . . . . . . . . . . . . . . . 4-184-4. Teledensity and GDP in largest 20 foreign telecommunication service markets,
1995 . . . . . . . . . . . . . . . . . . . . . . . . . . . . . . . . . . . . . . . . . . . . . . . . . . . . . . . . . . . . 4-204-5. Telecommunication investment as a share of revenue in largest 20 foreign
markets, 1995 . . . . . . . . . . . . . . . . . . . . . . . . . . . . . . . . . . . . . . . . . . . . . . . . . . . . 4-23

xi
CONTENTS—Continued
Page
Tables
2-1. Derivation of U.S. private-sector, cross-border services trade balance, 1987-96 . . . . 2-34-1. Elements of the WTO agreement on basic telecommunication services . . . . . . . . . . . 4-64-2. The four modes of supplying telecommunication services . . . . . . . . . . . . . . . . . . . . . 4-154-3. Largest 20 foreign telecommunication markets measured by revenue, 1995 . . . . . . . 4-204-4. Largest public telecommunication operators in largest 20 foreign markets, 1995 . . . 4-214-5. Investment in largest 20 foreign telecommunication markets, 1995 . . . . . . . . . . . . . . 4-224-6. Highlights of Argentina’s commitments on basic telecommunication services . . . . . 4-244-7 Highlights of Argentina’s commitments on enhanced telecommunication services . . 4-274-8. Highlights of Australia’s commitments on basic telecommunication services . . . . . . 4-284-9. Highlights of Australia’s commitments on enhanced telecommunication services . . . 4-304-10. Highlights of Brazil’s commitments on basic telecommunication services . . . . . . . . 4-324-11. Highlights of Brazil’s commitments on enhanced telecommunication services . . . . . 4-334-12. Highlights of Canada’s commitments on basic telecommunication services . . . . . . . 4-354-13. Highlights of Canada’s commitments on enhanced telecommunication services . . . . 4-384-14. Highlights of the European Union’s commitments on basic telecommunication
services . . . . . . . . . . . . . . . . . . . . . . . . . . . . . . . . . . . . . . . . . . . . . . . . . . . . . . . . . . 4-394-15. Highlights of the European Union’s commitments on enhanced telecommunication
services . . . . . . . . . . . . . . . . . . . . . . . . . . . . . . . . . . . . . . . . . . . . . . . . . . . . . . . . . . 4-434-16. Highlights of Hong Kong’s commitments on basic telecommunication services . . . . 4-454-17. Highlights of Hong Kong’s commitments on enhanced telecommunication services 4-474-18. Highlights of India’s commitments on basic telecommunication services . . . . . . . . . 4-494-19. Highlights of India’s commitments on enhanced telecommunication services . . . . . . 4-514-20. Highlights of Indonesia’s commitments on basic telecommunication services . . . . . . 4-524-21. Highlights of Indonesia’s commitments on enhanced telecommunication services . . 4-574-22. Highlights of Israel’s commitments on basic telecommunication services . . . . . . . . . 4-584-23. Highlights of Israel’s commitments on enhanced telecommunication services . . . . . . 4-604-24. Highlights of Japan’s commitments on basic telecommunication services . . . . . . . . . 4-614-25. Highlights of Japan’s commitments on enhanced telecommunication services . . . . . 4-634-26. Highlights of Korea’s commitments on basic telecommunication services . . . . . . . . . 4-644-27. Highlights of Korea’s commitments on enhanced telecommunication services . . . . . 4-664-28. Highlights of Malaysia’s commitments on basic telecommunication services . . . . . . 4-674-29. Highlights of Malaysia’s commitments on enhanced telecommunication services . . . 4-684-30. Highlights of Mexico’s commitments on basic telecommunication services . . . . . . . 4-704-31. Highlights of Mexico’s commitments on enhanced telecommunication services . . . . 4-734-32. Highlights of New Zealand’s commitments on basic telecommunication services . . . 4-754-33. Highlights of New Zealand’s commitments on enhanced telecommunication
services . . . . . . . . . . . . . . . . . . . . . . . . . . . . . . . . . . . . . . . . . . . . . . . . . . . . . . . . . . 4-764-34. Highlights of Norway’s commitments on basic telecommunication services . . . . . . . 4-784-35. Highlights of Norway’s commitments on enhanced telecommunication services . . . . 4-794-36. Highlights of Poland’s commitments on basic telecommunication services . . . . . . . . 4-81

xii
CONTENTS—Continued
Page
Tables—Continued
4-37. Highlights of Poland’s commitments on enhanced telecommunication services . . . . 4-834-38. Highlights of Singapore’s commitments on basic telecommunication services . . . . . 4-854-39. Highlights of Singapore’s commitments on enhanced telecommunication services . . 4-874-40. Highlights of South Africa’s commitments on basic telecommunication services . . . 4-894-41. Highlights of South Africa’s commitments on enhanced telecommunication
services . . . . . . . . . . . . . . . . . . . . . . . . . . . . . . . . . . . . . . . . . . . . . . . . . . . . . . . . . 4-914-42. Highlights of Switzerland’s commitments on basic telecommunication services . . . . 4-934-43. Highlights of Switzerland’s commitments on enhanced telecommunication
services . . . . . . . . . . . . . . . . . . . . . . . . . . . . . . . . . . . . . . . . . . . . . . . . . . . . . . . . . 4-944-44. Highlights of Thailand’s commitments on basic telecommunication services . . . . . . 4-964-45. Highlights of Thailand’s commitments on enhanced telecommunication services . . . 4-97

CHAPTER 1Introduction
Scope and Purpose
The U.S. International Trade Commission (USITC) routinely monitors tradedevelopments in the service, agricultural, and manufacturing sectors. This report,prepared annually, analyzes significant trends in services trade as a whole, assessestrade in selected service industries, and identifies major U.S. trading partners. Sincea considerable share of services trade takes place through affiliates established abroad,data for both cross-border and affiliate transactions are presented to provide acomprehensive analysis of the international activities of U.S. service industries.
Methodology and Organization
The data presented herein are drawn from the most recent annual data available forU.S. trade in services, which are estimated and published by the U.S. Department ofCommerce, Bureau of Economic Analysis. Comparable annual data regarding cross-border services trade are available for the period 1986-96, whereas comparable datapertaining to affiliate transactions are available for the period 1987-95.
Chapter 2 of this report describes the nature of cross-border and affiliate trade inservices and provides an overview of U.S. services trade by industry and by tradingpartner. Chapter 3 examines trade in selected service industries, describing how theservices are traded and indicating whether recent trade performance marks acontinuation of, or a departure from, trends observed since 1991. Chapter 3 featuresseparate discussions of the distribution, education, financial, intellectual property-related, accounting, architectural/engineering/construction, computer, health care, legal,maintenance, telecommunication, transportation, and travel service industries. Thediscussions compare cross-border trade performance in 1996 with trends evident during1991-95, and affiliate transactions in 1995 with trends during 1991-94. Eachdiscussion in chapter 3 also reviews the principal factors underlying the volume anddirection of recent trade, and identifies factors likely to influence future tradeperformance. Outlooks regarding the subject service industries are based on USITCstaff interviews with industry representatives and reviews of secondary sources, suchas industry journals. Chapter 4 of the report examines the commitments on basictelecommunication services scheduled for the 20 largest foreign telecommunicationmarkets under the General Agreement on Trade in Services (GATS). The World TradeOrganization (WTO) carried out negotiations over basic telecommunication services

Goods 78.2%
Services 21.8%
Total trade volume: $1.8 trillion
Source: U.S. Department of Commerce, Bureau of Economic Analysis, Survey of Current Business, Oct. 1997, p. 69.
The USITC has published several reports that examine in detail the commitments1
scheduled by GATS signatories. See USITC, General Agreement on Trade in Services:Examination of Major Trading Partners’ Schedules of Commitments, USITC publication2940, 1995; USITC, General Agreement on Trade in Services: Examination of SouthAmerican Trading Partners’ Schedules of Commitments, USITC publication 3007, 1996;USITC, General Agreement on Trade in Services: Examination of the Schedules ofCommitments Submitted by Asia/Pacific Trading Partners, USITC publication 3053, 1997;USITC, U.S. Trade Shifts in Selected Industries: Services, USITC publication 2969, 1996;and Recent Trends in U.S. Services Trade, USITC publication 3041, 1997. Total trade volume is the sum of imports and exports.2
U.S. Department of Commerce (USDOC), Bureau of Economic Analysis (BEA),3
Survey of Current Business, Oct. 1997, p. 69. USDOC, BEA, National Accounts Data, Gross Domestic Product by Industry, 1987-96,4
found at Internet address http://www.bea.doc.gov/, retrieved Dec. 5, 1997. USDOC, BEA, Survey of Current Business, Aug. 1997, p. 96.5
1-2
Figure 1-1Figure 1-1U.S. cross-border trade volume, by sector, 1996U.S. cross-border trade volume, by sector, 1996
during 1994-97, with 69 countries submitting finalized commitments on February 15,1997. 1
U.S. merchandise trade is not presented in this report. As noted in the Preface, it is thesubject of a separate USITC annual report. However, to put U.S. services trade inperspective with merchandise trade, in 1996, cross-border services trade accounted for22 percent of total U.S. cross-border trade volume (figure 1-1). U.S. cross-border2
trade in services generated an $80-billion surplus in 1996, in contrast to a U.S.merchandise trade deficit of $191 billion. Further, the service sector accounted for 773
percent of U.S. private-sector gross domestic product (GDP) in 1996 (figure 1-2). By4
comparison, manufacturing accounted for 20 percent of GDP, and mining andagriculture together accounted for 4 percent. In 1996, the service sector provided 78percent of total private-sector employment, compared to manufacturing with 19percent, and mining and agriculture together with 3 percent (figure 1-3). 5

Services 76.5%
Manufacturing 19.9%
Mining and agriculture 3.6%
1 The services sector consists of distribution, education, financial, intellectual property-related,telecommunication, travel, and a broad range of business, professional, and technical services.
Source: U.S. Department of Commerce, Bureau of Economic Analysis, National Accounts Data,Gross Domestic Product by Industry, 1987-96, found at Internet address http://www.bea.doc.gov/,retrieved Dec. 5, 1997.
Total private-sector GDP: $6.6 trillion
Services 78.4%
Manufacturing 19.0%
Mining & agriculture 2.5%
Total full-time equivalent employees = 95.4 million workers
1-3
Figure 1-2Figure 1-2U.S. private-sector gross domestic product, by sector, 1996U.S. private-sector gross domestic product, by sector, 1996
Figure 1-3Figure 1-3U.S. private-sector employment, by sector, 1996U.S. private-sector employment, by sector, 1996


The current account of the balance of payments reports trade in goods and services,1
flows of investment income, and unilateral transfers of funds (e.g., U.S. Government grants,pensions, and other funds). USDOC, BEA, Survey of Current Business, Oct. 1997, p. 76.2
2-1
CHAPTER 2U.S. Trade in Services
Nature of Trade in Services
Nations trade services through two principal channels. One channel, cross-bordertrade, entails sending individuals, information, or money across national borders. Thecurrent account of the United States explicitly delineates cross-border exports and1
imports of services. The other channel, affiliate transactions, entails selling servicesthrough affiliates established by multinational companies in foreign markets. Thecurrent account does not list such transactions among exports and imports, but doesreport direct investors’ shares of the income generated by these affiliates as investmentincome.
Cross-Border Trade
The analysis of cross-border trade in this report examines private-sector transactionsonly. Part of cross-border services trade reported in the current account reflects U.S.public-sector transactions (e.g., expenditures related to the operations of the militaryand U.S. embassies). As a result, they are not considered to be representative of U.S.service industries’ performance and introduce anomalies due to such events as peace-keeping operations in Bosnia.
The volume and growth of U.S. cross-border service exports have consistentlyexceeded those of imports in recent years, yielding a services trade surplus that grewto $80 billion in 1996 (figure 2-1) and offsetting 42 percent of the merchandise tradedeficit (figure 2-2). When public-sector transactions are removed from the 1996 data,the volume and growth of service exports still exceed those of imports, but the servicestrade surplus totals only $78 billion (table 2-1).2
In 1996, private-sector cross-border service exports increased by 8 percent, to $221billion. Export growth in 1996 was slower than the 1987-95 average annual exportgrowth rate of 11 percent. In comparison, private-sector cross-border service importsincreased by 6 percent in 1996, to $143 billion. As with exports, imports grew moreslowly in 1996 than during 1987-95, when annual import growth averaged 7 percent.

2-2
Figure 2-2 U.S. merchandise and services trade balances, 1987-961
Figure 2-1U.S. cross-border trade in services: Exports, imports, and trade balance,1987-961

2-3
Tab
le 2
-1D
eriv
atio
n o
f U
.S. p
riva
te-s
ecto
r, c
ross
-bo
rder
ser
vice
s tr
ade
bal
ance
, 198
7-96
1987
1988
1989
1990
1991
1992
1993
1994
1995
1996
))))))))))))))))))))))))))))))))))))))))))))))))))))))))
Mill
ion
dolla
rs )
))))))))))))))))))))))))))))))))))))))))))))))))))))))
Tot
al e
xpor
ts..
....
....
....
..98
,553
111,
024
127,
142
147,
824
164,
236
177,
154
186,
711
197,
248
218,
739
236,
764
Pub
lic-s
ecto
r ex
port
s..
....
(11,
632)
(9,9
48)
(9,1
52)
(10,
600)
(11,
823)
(13,
228)
(14,
354)
(13,
053)
(14,
574)
(15,
540)
Priv
ate-
sect
or e
xpor
ts..
....
86,9
2110
1,07
611
7,99
013
7,22
415
2,41
316
3,92
617
2,35
718
4,19
520
4,16
522
1,22
4
Tot
al im
port
s..
....
....
....
..(9
2,34
9)(9
9,96
5)(1
04,1
85)
(120
,019
)(1
21,1
95)
(120
,255
)(1
26,4
03)
(135
,472
)(1
47,0
36)
(156
,634
)P
ublic
-sec
tor
impo
rts
....
..16
,843
17,5
2417
,184
19,4
4918
,524
16,0
9814
,456
12,8
5212
,513
13,
548
Priv
ate-
sect
or im
port
s..
....
(75,
506)
(82,
441)
(87,
001)
(100
,570
)(1
02,6
71)
(104
,157
)(1
11,9
47)
(122
,620
)(1
34,5
23)
(143
,086
)
Priv
ate-
sect
or tr
ade
bala
nce
....
11,4
1518
,635
30,9
8936
,654
49,7
4259
,769
60,4
1061
,575
69,6
4278
,138
Sou
rce:
U.S
. Dep
artm
ent o
f Com
mer
ce, B
urea
u of
Eco
nom
ic A
naly
sis,
Sur
vey
of C
urre
nt B
usin
ess,
Jul
y 19
97, p
p. 6
4-65
, and
Oct
. 199
7, p
p. 1
08-1
09.

USDOC, BEA, Survey of Current Business, Oct. 1997, pp. 108-109.3
Ibid.4
Ibid.5
2-4
As export growth exceeded import growth during 1996, the surplus on cross-bordertrade in services increased, by 12 percent. Though considerable, growth of the servicetrade surplus in 1996 was about half of the 25-percent average annual growth rateexperienced in 1987-95. 3
Cross-Border Trade by Industry
In 1996, travel and tourism services accounted for 32 percent of U.S. service exports,the largest share of total service exports represented by any single industry. Travel andtourism exports consistently loom large in the service trade account because they reflectinbound travelers’ total expenditures while in the United States (e.g., food, lodging,recreation, local transportation, and gifts). Other services accounting for large sharesof total U.S. exports were intellectual property-related services, representing 14percent; freight transportation services (including port services), representing 12percent; and passenger fares (airline and maritime) and professional services, eachrepresenting 9 percent (figure 2-3). Travel and tourism, freight transportation, andpassenger fares also figured prominently among U.S. service imports in 1996,accounting for 34 percent, 20 percent, and 11 percent of total service imports,respectively.4
In 1996, all U.S. service industries registered trade surpluses, with the exception ofthose providing freight transportation, telecommunication, and insurance services. Thetrade deficits posted by these service industries, however, largely reflect accountingconventions and trade estimation methodologies, rather than unfavorable competitivepositions. For instance, the shortfall in freight transportation services mirrors thedeficit in U.S. merchandise trade in large part, as payments for freight transportationare generally made by importers to maritime carriers of exporting countries. Becausethe United States imports more merchandise than it exports, U.S. importers are likelyto pay foreign freight carriers more than U.S. freight carriers receive from foreignimporters of U.S. goods. The deficit in telecommunication services reflects therelatively high volume of international calls originating in the United States, and aninternational accounting convention whereby carriers providing outbound internationalcalls compensate the carriers handling inbounds calls (see chapter 4). Last, the surplusof premiums received by U.S. insurers over claims paid to foreign policyholders (i.e.,net exports by accounting convention) was less than the surplus of premiums collectedby foreign insurers over claims paid to U.S. policyholders (i.e., net imports byaccounting convention), resulting in a cross-border deficit.
Intellectual property-related services, involving sales of rights to and use of intangibleproperty, accounted for 29 percent of the overall services trade surplus, followed bytravel and tourism with 27 percent, and professional services such as law and healthcare with 18 percent. Intellectual property-related trade, measured by flows of5

2-5
Fig
ure
2-3
U.S
. cro
ss-b
ord
er s
ervi
ce e
xpo
rts
and
imp
ort
s, b
y in
du
stri
es, 1
996
1
2

Ibid.6
2-6
royalties and license fees, encompasses a vast array of transactions involvingproprietary rights over manufacturing processes, copyrights, broadcast rights,trademarks, and other intangible property. U.S. trade in intellectual property rightstakes place principally between U.S. parent companies and their foreign affiliates,reflecting the large volume of U.S. direct investment abroad, and the predominance ofU.S. firms as innovators. This trade has consistently generated large U.S. surpluses asU.S. parent firms have licensed foreign affiliates to sell intellectual property abroad,and collected licensing fees in return, with the latter appearing as exports in the U.S.balance of payments. During 1991-96, the surplus on trade in intellectual propertyaccounted for between 24 percent and 30 percent of the overall cross-border surplusin services trade (figure 2-4).
Since 1989, the surplus on trade in travel and tourism services has increased every year,with the exception of 1994 (figure 2-5). However, the continuation of this surplusappears to be dependent on exchange rates, as historical data show high negativecorrelation between the balance on travel and tourism trade and the value of the dollar.The importance of this relationship was demonstrated most recently in 1994-95, whenthe depreciation of the Mexican peso severely curtailed inbound tourism in the UnitedStates from Mexico. As a result of the peso’s devaluation, U.S. cross-border tourismexports to Mexico dropped from $5.1 billion in 1993 to $4.9 billion in 1994 and $2.9billion in 1995, while a stronger dollar encouraged more U.S. outbound tourism toMexico. Consequently, the U.S. deficit in cross-border tourism trade with Mexicowidened from $43 million in 1993 to $468 million in 1994 and $2.5 billion in 1995.In this light, it is reasonable to expect that the recent currency crisis in Southeast Asiawill have an adverse impact on the overall U.S. tourism trade surplus.
Cross-Border Trade by Trading Partner
In 1996, the European Union (EU) was the largest U.S. partner with respect to cross-border trade in services, accounting for 32 percent of U.S. exports and 33 percent ofimports. Japan was second, accounting for 16 percent of exports and 9 percent ofimports. Canada was third, with 9 percent of exports and 10 percent of imports, andMexico fourth, with 4 percent of exports and 8 percent of imports (figure 2-6).Jointly, these four major trading partners accounted for 60 percent of both U.S. cross-border service exports and imports.
In 1996, the United States registered cross-border trade surpluses in services with allmajor trading partners except Mexico. Surpluses ranged from $6.1 billion with Canadato $22 billion each with Japan and the European Union. For the second consecutive6
year, the United States recorded a deficit on cross-border services trade with Mexico,which amounted to $3.6 billion in 1996. Much of the United States’ services tradedeficit with Mexico stems from lower inbound travel from Mexico compared to theperiod preceding the peso’s declining value.

Figure 2-4Royalties and license fees in the U.S. cross-border services trade balance,1987-96
Figure 2-5Travel and tourism in the U.S. cross-border services trade balance, 1987-96

European Union31.6%Japan
15.9%
Canada9.0%
Mexico3.6%
Other39.9%
European Union33.4%Canada
9.7%
Japan9.3%
Mexico8.1%
Other39.6%
1 Trade data exclude public-sector trade. Source: U.S. Department of Commerce, Bureau of Economic Analysis, Survey of Current Business, Oct. 1997, pp. 110-111.
Total exports: $221.2 billion Total imports: $143.1 billion
Majority-owned foreign affiliates of U.S. firms are defined as foreign affiliates for which7
the combined direct and indirect ownership interest of all U.S. parents exceeds 50 percent. Majority-owned U.S. affiliates of foreign firms are U.S.-based affiliates for which thecombined direct and indirect ownership interest of all foreign parents exceeds 50 percent. For reporting purposes, the country in which the U.S.-based affiliate’s “ultimate beneficialholder” resides receives credit for sales to U.S. persons. An ultimate beneficial holder of aU.S. affiliate is the entity, proceeding up the affiliate’s ownership chain, that is not ownedmore than 50 percent by another person.
2-8
Figure 2-6U.S. cross-border service exports and imports, by selected trading partners,1
1996
Affiliate Transactions
Data on affiliate transactions track majority-owned affiliates’ sales to unaffiliatedforeigners in the host market. The provision of many services requires the physical7
presence of the provider in proximity to the consumer for practical and regulatoryreasons. For example, the delivery of hospitality services is not feasible across borders.On the other hand, accounting firms prefer to provide services to overseas clientsthrough foreign affiliates, in part, because regulations may restrict, or renderuneconomic, cross-border transmission of financial data. Similarly, architectural andengineering firms find that establishment of a commercial presence in foreign marketsis often a necessary prerequisite for obtaining contracts.
In 1995, sales by foreign-based affiliates of U.S. companies increased by 20 percent,double the 10-percent average annual growth posted during 1989-94 (figure 2-7).Sales grew by 35 percent in the European Union, principally in Germany and theUnited Kingdom. This reflected continued economic recovery in these two countries

1989 1990 1991 1992 1993 1994 19950
50
100
150
200Sales Purchases Balance
Billion dollars
Source: U.S. Department of Commerce, Bureau of Economic Analysis, Survey of Current Business,Oct. 1997, p. 136.
Organization for Economic Co-operation and Development (OECD), OECD Economic8
Outlook, vol. 61, June 1997 (Paris: OECD, 1997), p. A4. Ibid., p. 136.9
2-9
in 1995, which resulted in increased demand for U.S. services, especially insurance,8
and computer and data processing services. By comparison, purchases from U.S.-based affiliates of foreign firms increased by 9 percent, equal to the 9-percent averageannual rate established in 1989-94. Purchases from affiliates of Japanese parentsdeclined by 14 percent, while those from affiliates of Canadian parent firms increasedby 19 percent, due in part to the April 1995 transfer of Universal Studios-MCA Inc.,9
a major motion picture company in the United States, from Japanese to Canadianownership. Purchases from affiliates of European firms increased by 10 percent, inlarge part due to sales by Swiss-owned insurance companies in the United States.Overall, sales by foreign-based affiliates of U.S. firms exceeded purchases from U.S.-based affiliates of foreign firms by $32.4 billion, more than double the previous year’slevel.
Figure 2-7Affiliate service transactions: U.S. sales, purchases, and balance, 1989-95

Ibid., pp. 137-138.10
Ibid., p. 138.11
2-10
Figure 2-8Affiliate service transactions: U.S. sales and purchases, by industry, 19951
Affiliate Transactions by Industry
In 1995, sales by U.S.-owned insurance affiliates in foreign countries accounted for 18percent of total affiliate sales, the largest share held by a single industry (figure 2-8).The computer and data processing service industry, accounting for 12 percent of totalsales, placed second. By comparison, purchases of insurance services from U.S.-10
based affiliates of foreign parents accounted for 36 percent of total U.S. purchasesfrom affiliates, reflecting the large presence of foreign insurance companies in the U.S.market. Purchases of services from U.S. affiliates of foreign-owned freighttransportation firms represented 7 percent of total affiliate sales.11

European Union53.8%
Japan10.2%
Canada9.4%
Other26.6%
European Union49.4%
Canada16.6%
Japan12.5%
Other21.5%
1 Due to rounding, figures may not equal 100 percent.
Source: U.S. Department of Commerce, Bureau of Economic Analysis, Survey of Current Business, Oct. 1997, p. 136.
Total purchases: $159.1 billionTotal sales: $191.5 billion
Ibid., pp. 136-138.12
Ibid.13
2-11
Figure 2-9Affiliate service transactions: U.S. sales and purchases, by selected tradingpartners, 19951
Affiliate Transactions by Trading Partner
The great majority of U.S. affiliate sales and purchases are transacted with theEuropean Union, Japan, and Canada, reflecting the substantial flow of directinvestment capital between the United States and these trading partners. In 1995, theEuropean Union accounted for 54 percent of U.S.-owned affiliates’ sales of servicesto foreigners, while Japan and Canada accounted for 10 and 9 percent, respectively(figure 2-9). By comparison, affiliates owned by EU-parent companies accounted for49 percent of total U.S. purchases from foreign-owned affiliates, followed by affiliatesof Canadian and Japanese firms, with 17 percent and 13 percent, respectively. 12
In 1995, the United States posted a $24.4-billion surplus on affiliate transactions withthe European Union, more than 4 times larger than the previous year. However, thedeficit on affiliate transactions with Canada nearly doubled to $8.4 billion, mainly dueto Canada’s direct investment in the U.S. insurance and motion picture markets. TheU.S. affiliate trade deficit with Japan declined from $3.7 billion in 1994 to $325million in 1995, principally because of the decrease of Japanese direct investment inthe U.S. motion picture industry, as discussed above.13


Franchising services and commission agent services are sometimes considered to be1
additional components of distribution services. However, international trade data are notavailable for commission agent services. Certain data on trade in franchising royalties andfees are available, but they principally reflect revenues from the sale of intellectual property. Hence, this report examines franchising transactions in the chapter on intellectual property-related services.
3-1
CHAPTER 3Industry Discussions
This chapter discusses U.S. international trade in services, by industry. Each sectiondescribes how services are traded within the industry and examines cross-border tradeduring 1991-96 and affiliate transactions during 1991-95 to the extent that suchinformation is available. Each section concludes with a brief summary of the factorsthat determined the volume and direction of recent trade, and an outlook that identifiesindustry trends and other factors that may shape future trade patterns.
Distribution Services
Distribution service providers move merchandise through various channels fromproducers to consumers. Generally, merchandise proceeds from producers throughwholesalers to retailers and ultimately to consumers. Wholesalers and retailers collectfees for services that typically are calculated as a percentage of the value of the product.These fees then constitute the value of the distribution service provided. Manydistributors also routinely earn revenue for providing services that are unrelated to thedistribution of merchandise, such as financial services or installation and maintenanceservices.
International trade in distribution services takes place when a customer located in onemarket pays fees for distribution or nondistribution services to a foreign-owned affiliatealso located in the customer’s market, or to an overseas distributor operating in thecustomer’s market. The volume of transactions by foreign affiliates of distributionservice firms appears to be much greater than the volume of cross-border transactionsand, in fact, only data on affiliate transactions are tracked by data collection agencies.For this reason, the following discussion focuses on the transactions that take placethrough affiliates established as wholesalers or retailers in foreign markets. 1

Dun & Bradstreet, Dun’s Business Rankings (Bethlehem, PA: Dun & Bradstreet,2
1996), pp. 109-119. The Commission calculates the average annual rate of change by using the standard3
statistical method employed in calculating compound interest.
3-2
Wholesale Trade
Introduction
Wholesalers serve as intermediaries, purchasing merchandise from manufacturers thatis subsequently resold to retailers. In addition to buying and selling merchandise,wholesalers often provide nonwholesaling services to manufacturers, retailers, andother consumers. For example, wholesalers may sell inventory management services;extend credit; assemble, install, or deliver products; provide maintenance and repairservices; and, with respect to computers, provide systems integration services.Foreign-based wholesaling affiliates also may act as agents for their parentmanufacturing concerns and license patents or trademarks to local retailers in exchangefor royalties and license fees (see discussion of intellectual property-related services).Because wholesale trade services incidental to the wholesaling of merchandise areindistinguishable from merchandise trade data, only nonwholesaling services providedby wholesalers are captured in official services trade data. Consequently, thisdiscussion focuses solely on services provided by wholesalers that are not incidentalto merchandise wholesaling.
International trade in wholesaling services principally occurs through foreign-basedaffiliates. In many cases, these affiliates are owned by manufacturers and essentiallyserve as manufacturers’ representatives in foreign markets. For this reason,international trade in wholesale services is closely related to international trade in goodsand direct investment flows. For example, the largest durable-goods wholesaler in theUnited States is American Honda Motor Co., which is an affiliate of Honda Motor Co.of Japan. This relationship between merchandise trade and wholesaling, combined2
with enormous U.S. merchandise trade volumes, explains why international trade inwholesale services accounts for a large portion of total service sales through foreignaffiliates.
Recent Trends in Affiliate Transactions, 1991-95
In 1995, foreign sales of services by wholesaling affiliates of U.S. firms totaled $15billion, while corresponding purchases from U.S.-based affiliates of foreign firmsamounted to only $9.4 billion (figure 3-1). These values represented 8 percent and 6percent of total sales and purchases of services through affiliates, respectively.
Foreign sales of services by wholesaling affiliates of U.S. firms increased by 8 percentin 1995, reversing the overall negative trend recorded during 1991-94, when salesdeclined at an average annual rate of 7 percent (except for a slight increase in 1992).3

1991 1992 1993 1994 19950
5
10
15
20Sales Purchases Balance
Billion dollars
1 Data for 1991 understate U.S. purchases because selected data were suppressed in order to avoiddisclosing information about the operations of individual firms.
Source: U.S. Department of Commerce, Bureau of Economic Analysis, Survey of Current Business,Sept. 1994, Sept. 1995, Nov. 1996, and Oct. 1997, pp. 137-138.
USDOC, BEA, Survey of Current Business, Sept. 1996, pp. 95 and 126.4
Ibid., p. 95.5
USDOC, BEA, Foreign Direct Investment in the United States, preliminary 19956
estimates, table A-1. OECD, OECD Economic Outlook, vol. 61, June 1997, annex table 1.7
3-3
Figure 3-1Figure 3-1Wholesale services transactions by majority-owned affiliates: U.S. sales, purchases, andWholesale services transactions by majority-owned affiliates: U.S. sales, purchases, andbalance, 1991-95balance, 1991-9511
Meanwhile, purchases from U.S. affiliates of foreign firms declined by 9 percent in1995. This reversed the trend of 18-percent average annual growth in these purchasesduring 1991-94. As a result of increased sales and reduced purchases, the U.S. surplusin such trade increased by 58 percent in 1995, from $3.6 billion in 1994.
General economic conditions and direct investment activity significantly influence thevolume of wholesaling affiliates’ transactions. Inbound and outbound directinvestment flows in wholesaling establishments grew at a similar rate in 1995, withforeign investment in the United States growing by 7 percent and U.S. investmentabroad growing by 6 percent. However, foreign investment in U.S.-based affiliates4
involved in the wholesale of motor vehicles and equipment declined by more than $1billion in 1995, a drop of 7 percent from the 1994 level. This could explain the nearly5
$1 billion decline in U.S. purchases of services through wholesalers, since most ofthese purchases were related to motor vehicles and equipment. In addition, the U.S.6
economy grew by 2 percent in 1995, considerably slower than the 3.5-percent growthrate recorded in 1994. Slower economic growth may have discouraged U.S.7
consumption of large items such as motor vehicles, which in turn may have contributedto the modest decline in U.S. purchases of related services from affiliates of foreignfirms.

The noted Asian economies include Taiwan, Hong Kong, Malaysia, the Philippines,8
Singapore, and Thailand. OECD, OECD Economic Outlook, June 1997, tables 23-4 andannex table 1. USDOC, BEA, U.S. Direct Investment Abroad, preliminary 1995 estimates, table9
II.A.2. Federal Reserve Bulletin, Oct. 1997, p. A62.10
Automotive News, Market Data Book, 1997, p. 46.11
3-4
The increase in sales by foreign affiliates of U.S. firms appears to be explained byrelatively strong overall economic growth recorded by several major trading partners.While the U.S. economy grew by 2.0 percent in 1995, the European Union grew by 2.4percent, the heretofore dynamic Asian economies grew by 6.7 percent, and Brazil andChile grew by 4.1 percent and 8.5 percent, respectively. Such relatively fast economic8
growth likely spurred purchases of professional and commercial equipment andsupplies, including computers and peripheral equipment, which accounted for thelargest single share of U.S.-owned wholesaling affiliates’ sales. Concomitant sales of9
computer services by foreign wholesaling affiliates could explain the increase in sales.
In terms of bilateral trade relationships, the United States recorded a surplus onwholesaling transactions with most countries, but deficits of $4.8 billion and $1.8billion with Japan and Germany, respectively (figure 3-2). These two countriesaccounted for most U.S. purchases, with Japan responsible for 63 percent and Germanyfor 25 percent. However, purchases from U.S. affiliates of Japanese firms declined by$1.6 billion or 21 percent in 1995, leading to a $1.7 billion reduction in the deficitrecorded with Japan. The decline in purchases through U.S. affiliates of Japanese firmsmost likely reflected the effects of Japan’s currency appreciation. In 1995, theJapanese yen appreciated to 93.96 yen per dollar, as compared to 102.18 in 1994 and108.78 in 1996. The higher value of the yen in 1995 made the price of Japanese10
products more expensive for U.S. consumers, which may in part account for a 5-percentdrop in the number of Japanese automobiles purchased in that year. In 1995, Japan11
displaced the United Kingdom as the largest market for U.S.-owned wholesalingaffiliates. These affiliates registered sales of $1 billion in Japan, accounting for 7percent of total U.S. sales. This shift, too, may be explained by Japan’s currencyappreciation, which made Japanese affiliates of U.S. service providers morecompetitive in the Japanese market.
Summary and Outlook
In 1995, international trade in wholesaling services appeared to undergo significantchange, as trends for both sales and purchases through affiliates reversed direction.The causes of this change appear to be macroeconomic factors such as Japan’scurrency appreciation and the relative economic growth rates of major U.S. tradingpartners. Another factor affecting the amount of purchases through U.S. affiliates offoreign firms was the apparent $1-billion disinvestment by foreign firms in the U.S.motor vehicle sector.

Germany
Canada
Switzerland
Netherlands
United Kingdom
Japan
-5 -4 -3 -2 -1 0 1 2
Sales BalanceBillion dollars
1 Ranked in order of U.S. sales.Source: U.S. Department of Commerce, Bureau of Economic Analysis, Survey of Current Business,Oct. 1997, pp. 137-138.
Statistics Canada, “Canadian Statistics: The Economy in detail,” found at Internet12
address http://www.statcan.ca/, retrieved May 5, 1998, and USDOC, International Trade(continued...)
3-5
Figure 3-2Figure 3-2Wholesale services transactions by majority-owned affiliates: U.S. sales and balance, by majorWholesale services transactions by majority-owned affiliates: U.S. sales and balance, by majortrading partners,trading partners, 1995 199511
As noted, wholesaling affiliates established by U.S. manufacturers of professional andcommercial equipment, including computers, computer peripheral equipment, andmedical equipment, are most active in foreign service markets. Since U.S.manufacturers of professional and commercial equipment enjoy a relatively strongcompetitive position internationally, foreign-based wholesale affiliates of these firmswill likely continue to offer related services aggressively. Demand for professional andcommercial equipment is likely to remain strong in developed and developing marketsalike.
However, sales of equipment, and hence services, are heavily influenced by economicfactors such as currency fluctuations, disposable income levels, and overall economicgrowth. The global outlook on such factors is mixed. The Asia-Pacific region, longconsidered to be the most promising market for exports of goods and services, wasprofoundly affected by currency instability during the latter half of 1997. The currencydevaluations that occurred in Thailand, Malaysia, and Indonesia will increase therelative prices of products imported into these countries and likely reduce sales ofgoods and services through wholesaling affiliates of U.S. firms. A decline in theregional growth rate would also diminish the income generated by U.S. wholesalers.However, the Canadian economy grew more strongly in 1997, the Latin American12

(...continued)12
Administration (ITA), “Canada - Retail Trade Restructuring - IMI970616,” Stat-USADatabase, found at Internet address http://www.stat-usa.gov/, posted June 16, 1997,retrieved Oct. 14, 1997. OECD, OECD Economic Outlook, June 1997, pp. 1, 124, and A4.13
Bob Davis, “Trade Deficit Widened a Bit in August, Reflecting a Growing Gap with14
China,” The Wall Street Journal, Oct. 22, 1997, p. A3. Justin Zubrod, Robert Tasiaux, and Alan Beebe, “The Challenges of Logistics Within15
Asia,” T&D, Feb. 1996, p. 86. Philippine Government representative, letter dated Mar. 25, 1997, and industry16
representative, telephone interviews by USITC staff, Apr. 15, 1997, and Oct. 8, 1997. International Monetary Fund (IMF), World Economic Outlook (Washington, DC: IMF,17
Oct. 1996), p. 2.
3-6
market appears to be growing rapidly, and the European market appears to berecovering from recent slow growth.13
Conversely, the continued strength of the U.S. economy and rising strength of thedollar are likely to generate more purchases of services from U.S. wholesaling14
affiliates of foreign parents. Since most of these parents are Japanese motor vehiclemanufacturers, an increase in U.S. purchases of Japanese vehicles is likely to lead tocorresponding growth in purchases of financing and repair services from Japanese-owned affiliates.
Another major factor affecting the balance on affiliate transactions is the relative abilityof foreign firms to acquire or establish a commercial presence. While the United Statesis generally open to foreign investment, many other countries, particularly those inAsia, remain restrictive. For example, China generally does not permit foreigncompanies to act as wholesalers, although it is experimenting with foreign-owneddistribution facilities in Shanghai. Others, including Thailand, Indonesia, and the15
Philippines, may limit foreign firms to minority shareholding positions. Such policies16
may deter U.S. firms from establishing wholesaling affiliates in these markets, therebyhindering the growth of these affiliates’ sales of services.
Despite the adverse effects of remaining limitations on direct investment and weakenedeconomic conditions in the Asia-Pacific region, the outlook for sales of services byaffiliates of U.S. wholesalers remains positive. Global merchandise trade andinvestment flows continue to grow strongly, indicating that markets for goods and17
services are expanding. As a result, both sales and purchases of services throughwholesaling affiliates should expand. Should developing countries continue to growand open further to U.S. investment, U.S. sales of services likely will continue to grow.
Retail Trade
Introduction
Retailers serve as intermediaries between wholesalers or manufacturers, and ultimateconsumers, who may be individuals, households, or businesses. Retailers may take titleto merchandise or they may hold merchandise through a contractual arrangement.Although international trade in retail services is increasingly taking place acrossborders through catalogue shopping and the Internet, the majority of transactionscurrently take place through foreign-based affiliates. For this reason, data collection

Data for 1994 are believed to understate U.S. sales through foreign affiliates because18
selected data were suppressed by BEA in order to avoid disclosing information about theoperation of individual firms. BEA representative, telephone interview by USITC staff, Dec. 13, 1996.19
Data on sales through French affiliates of U.S. retailers are not available, as BEA20
statistics suppressed the data in order to avoid disclosing proprietary information about theoperation of individual firms. In contrast to relatively minimal affiliate sales in Japan by U.S. firms, due to the slow21
opening of the Japanese retail market and the complicated Japanese distribution structure.
3-7
agencies focus solely on affiliate transactions. As with wholesale trade, revenues fromretailing services cannot be distinguished from merchandise sales. Thus, trade datacapture sales of services that are unrelated to the basic retailing activity. Nonretailingservices provided by retailers could include installation or repair services, creditservices, or warranty services, as well as promotion and advertising services. In thecase of computer systems, retailers also may provide systems integration and supportservices.
Recent Trends in Affiliate Transactions, 1991-95
In contrast to services provided by wholesalers, services provided by retailers constitutea small proportion of total service transactions by affiliates. In 1995, U.S. sales ofservices through foreign retail affiliates measured $1.1 billion, while purchasesamounted to $576 million, or less than 1 percent of total sales and purchases (figure3-3). In 1995, sales of services through retailing affiliates of U.S. parents continuedto increase as during 1991-94 (except for a slight decline in 1993), although limitationson sales data published for 1994 preclude precise estimation of the growth rate in1995. Corresponding purchases increased by 29 percent in 1995, a sharp reversal to18
an average annual decline of 15 percent during 1991-94 (except for an increase in1992). This decline was most pronounced in 1994, when U.S. purchases dropped by45 percent. The sharp reversal of transaction patterns that brought the United Statesinto surplus in 1994 was principally accounted for by changes in accountingclassifications of two U.S. affiliates of foreign firms, which are no longer classified asretailing affiliates. 19
On a bilateral basis, Germany, Canada, and the United Kingdom accounted for mostsales of services from retailing affiliates of U.S. firms in 1995, with sales of $251million (22 percent), $138 million (12 percent), and $100 million (9 percent),respectively (figure 3-4). Reflecting a high level of investment in the United States,20
Japanese firms accounted for 22 percent of total U.S. purchases of services throughaffiliates of foreign firms, amounting to $125 million. U.S. consumers also21
frequented retailing affiliates of U.K. firms, purchasing services valued at $85 million,or 15 percent of total U.S. purchases.
Summary and Outlook
As indicated above, the United States has posted recent surpluses on retailing affiliates’transactions after a long period of deficits, in part due to a change in the accountingclassification of certain large foreign-owned affiliates. This change in accounting

1991 1992 1993 1994 1995-200
0
200
400
600
800
1000
1200
1400Sales Purchases Balance
Million dollars
1 Data for 1994 understate U.S. sales because selected data were suppressed in order to avoid disclosinginformation about the operations of individual firms.
Source: U.S. Department of Commerce, Bureau of Economic Analysis, Survey of Current Business, Sept. 1994,Sept. 1995, Nov. 1996, and Oct. 1997, pp. 137-138.
Japan
United Kingdom
Canada
Germany
-200 -100 0 100 200 300
Sales BalanceMillion dollars
Source: U.S. Department of Commerce, Bureau of Economic Analysis, Survey of Current Business, Oct. 1997, pp. 137-138.
3-8
Figure 3-3Figure 3-3Retail services transactions by majority-owned affiliates: U.S. sales, purchases, and balance,Retail services transactions by majority-owned affiliates: U.S. sales, purchases, and balance,1991-951991-9511
Figure 3-4Figure 3-4Retail services transactions by majority-owned affiliates: U.S. sales and balance, by majorRetail services transactions by majority-owned affiliates: U.S. sales and balance, by majortrading partners, 1995trading partners, 1995

Alice Z. Cuneo, “New Markets Lure Retailers Wanting Growth,” Ad Age22
International, Oct. 1996, p. 118. “Top 10 Retailers,” Discount Merchandiser, Mar. 1997, p. 26.23
Debra Hazel, “U.S. Development Comes to the World,” Chain Store Age, Feb. 1997,24
p. 131. Ibid.25
Laura Liebeck, “It’s a Small World after All,” Discount Store News, Dec. 9, 1996, 26
p. 117. Alice Z. Cuneo, “New Markets Lure Retailers Wanting Growth,” Ad Age27
International, Oct. 1996, p. 118.
3-9
classification impedes trend analysis of purchases from U.S. affiliates of foreign firms.Nonetheless, sales of services through foreign affiliates of U.S. firms havedemonstrated consistently strong growth that seems to be indicative of a broader trendtoward increased internationalization of U.S. retailers.
The United States has one of the most vibrant and competitive retail industries in theworld. U.S. consumers have access to an enormous range of products and servicesthrough distribution channels that range from the Internet to factory outlets anddepartment stores. The large U.S. retailing industry continues to benefit from steadyeconomic growth and relatively high disposable incomes. Furthermore, to keep priceslow, U.S. retailers have become highly efficient at the fundamental elements ofretailing, which include sourcing, logistics, and merchandising. To boost profitabilityfurther, U.S. retailers have developed the skills necessary to provide services such ascredit card financing, installation and repair, or systems integration services.
Despite intense competition, the U.S. market remains attractive to major foreignretailers due to its size and level of consumption. Foreign retailers with well-knownbrands such as Benetton find it advantageous to participate in one of the world’s largestconsumer markets. Other foreign retailers choose to take advantage of the relativelyopen U.S. policy toward foreign direct investment by acquiring major U.S. retailers.
The intensity of competition and the relative ease of market entry, exerting downwardpressure on prices and profitability, have motivated U.S. retailers to seek newgeographic markets, particularly in the developing regions of Asia, Latin America, andEastern Europe. Until the recent financial market upheavals, Asian retail markets havebeen particularly promising as a result of the sustained period of strong economicgrowth that fostered the development of a middle class with high disposable income.22
A number of U.S. retailers have been pursuing opportunities in the region through jointventures or licensing agreements with local partners. These include Costco’swarehouse store in Seoul and Wal-Mart’s store in Shanghai.23 24
Although U.S. retailers continue to find the Asia-Pacific region attractive, competitionamong retailers is increasingly intense. Some local competitors are well entrenched,such as P.T. Matahari Putra Prima in Indonesia and Robinson Department Store inThailand. Singapore and Hong Kong are already highly competitive markets, which25
prompted Kmart to leave Singapore and Wal-Mart to exit from its joint-venture26
agreement in Hong Kong. In addition, the 1997 currency crisis in Southeast Asia is27
expected to lead to slower growth in the retail sector, which may curb some of thedevelopments planned by U.S. firms. J.C. Penney, Calvin Klein, and Donna Karan had

Alice Z. Cuneo, “New Markets Lure Retailers Wanting Growth,” Ad Age28
International, Oct. 1996, p. 118. Industry representatives, telephone interviews by USITC staff, Feb. 11 and 12, 1998.29
Philippine Government representative, letter dated Mar. 25, 1997.30
Industry representative, telephone interview by USITC staff, Apr. 15, 1997.31
USDOC, ITA, “Indonesia - Restrictions on Retail Chains - IMI970611,” Stat-USA32
Database, found at Internet address http://www.stat-usa.gov/, posted June 11, 1997,retrieved Oct. 14, 1997. Industry representative, telephone interview by USITC staff, Apr. 15, 1997.33
James Mammarella and Pete Hisey, “Wal-Mart International reshapes the world34
retailing order,” Discount Store News, Jan. 20, 1997, pp. 21 and 28. Debra Hazel, “U.S. Development Comes to the World,” Chain Store Age, Feb. 1997,35
p. 131. Coopers & Lybrand, “Emerging Opportunities,” Assignment: Eastern Europe, 1996,36
p. 2.
3-10
been pursuing opportunities throughout the region; however, in light of the Asian28
currency crisis these firms have adjusted their market entry strategies. For example,Donna Karan has decided to take a wait-and-see approach, while J.C. Penney hasclosed its joint venture stores in Indonesia and the Philippines, and curtailed plans toopen new stores in the region. 29
Another difficulty in Asian markets is presented by widespread limitations on foreigndirect investment. For example, in the Philippines, only Filipinos may engage in retailtrade. Other countries, such as Indonesia, limit the ownership position of foreign30
firms, typically requiring them to operate through a joint venture as a minoritypartner. Indonesia also appears to be taking some steps to protect small- and31
medium-sized retail establishments by requiring large retailers to partner with smallerestablishments in towns outside provincial capital cities. While in some cases it may32
be advantageous for foreign firms to partner with local firms and thereby acquire localexpertise, regulatory requirements to establish joint ventures may limit the control ofthe parent organization over the use of the brand name or the quality of the servicesprovided. 33
Other developing markets have been more receptive to foreign investment andconsequently are attracting the attention of U.S. retailers. Due to lower inflation andstronger economic growth in recent years, Argentina, Chile, and Brazil are presentlyviewed with relative optimism. As a result, Wal-Mart has established discount storesin Argentina and Brazil, and National Amusements is developing multiscreen movie34
theaters in Chile. U.S. retailers have also become interested in Eastern Europe,35
particularly countries such as the Czech Republic and Poland, which are thought topresent the least risk. Although European firms have a leading position in thesecountries, U.S. firms that have established a presence include Levi Strauss, EstéeLauder, and LA Gear.36
Although developing countries generally present some of the most promising businessopportunities to U.S. retail firms, the industrial economies of Canada, Japan, andWestern Europe also offer considerable potential. In Canada, higher interest rates andunemployment combined with low disposable income growth have hurt retail expansion

USDOC, ITA, “Canada - Retail Trade Restructuring - IMI970616,” Stat-USA37
Database, found at Internet address http://www.stat-usa.gov/, posted June 16, 1997,retrieved on Oct. 14, 1997. “Top 10 Retailers,” Discount Merchandiser, Mar. 1997, p. 26.38
James Mammarella and Pete Hisey, “Wal-Mart International Reshapes the World39
Retailing Order,” Discount Store News, Jan. 20, 1997, pp. 21 and 28. Laura Liebeck, “Staples, OfficeMax Look Abroad,” Discount Store News, Jan. 6,40
1997, p. 6. USITC staff estimates.41
Foreign residents do not include U.S. citizens, immigrants, or refugees.42
3-11
over the past few years. However, these factors have led to a shift in consumer37
patterns that favors discounting, a competitive strength of U.S. firms such as Costcoand Wal-Mart. In response, Costco has developed 55 warehouse stores and Wal-38
Mart has captured the largest share of the discount retail market in Canada. In39
Europe, U.S. firms have steadily been developing a presence, most visibly in the majormarkets of the United Kingdom and Germany. Examples include Costco, which has5 discount stores in the United Kingdom, and Staples, which has 34 office-supplyoutlets in the United Kingdom and 16 Maxi-Papier stores in Germany.40
Future prospects for U.S. sales of services through retailers are generally promising,although upheaval in several major Asia-Pacific countries’ currencies and financialmarkets in 1997 may slow sales in the near term. Retailing in developed countriescontinues to grow and, increasingly, to favor the development of discount outlets,where U.S. firms have established a competitive advantage. In addition, as foreigninvestment policies are gradually liberalized, sales through U.S. affiliates shouldimprove, particularly when foreign majority ownership is permitted. Conversely, whileU.S. purchases of services from affiliates of foreign-owned firms are likely to continuegrowing and major acquisitions may shift the balance on affiliate transactions, thehighly competitive domestic market is likely to grow more slowly than many foreignmarkets. This suggests that the balance on service transactions through retailingaffiliates will likely continue in surplus.
Education Services
Introduction
Education services include formal academic instruction in primary, secondary, andhigher education institutions such as colleges and universities, as well as instructionalservices offered by correspondence, vocational, language, and special educationschools, and libraries. Formal foreign study programs sponsored by colleges anduniversities account for approximately 90 percent of trade in education services. U.S.41
cross-border exports reflect the estimated tuition and living expenses of foreignresidents enrolled in U.S. colleges and universities. U.S. imports of education42
services represent the estimated tuition and living expenses of U.S. residents who study

U.S. residents must receive credit from accredited U.S. institutions to be included in43
trade data; those who do not transfer foreign academic credit to U.S. institutions, or whostudy abroad on an informal basis, are not included. BEA trade data reported for 1996 include services provided during the 1995-9644
academic year. The same pattern of reporting holds for each year beginning in 1991, whichspans the 1990-91 academic year. Amy Magaro Rubin, “Colleges Offer Financial Help to Encourage Foreign Travel,”45
The Chronicle of Higher Education, Nov. 1, 1996, p. A41; Amy Magaro Rubin, “Study-Abroad Programs for Americans Had Boom Year in 1994-95,” The Chronicle of HigherEducation,” Dec. 6, 1996, p. A66; “Researchers Say Study Abroad is Key to LearningLanguages,” The Chronicle of Higher Education, Feb. 7, 1997, p. A45; and Katherine S.Mangan, “Business Schools Promote International Focus, but Critics See More Hype ThanSubstance,” The Chronicle of Higher Education, Sept. 12, 1997, p. A14. Paul Desruisseaux, “The Number of Americans Studying Abroad Increases by 5.7%,”46
The Chronicle of Higher Education, Dec. 12, 1997, p. A44-A46. U.S. Department of Education, National Center for Education Statistics, “Degrees47
Earned by Foreign Graduate Students: Fields of Study and Plans After Graduation,” IssueBrief, Nov. 1997. See, for example, David Cohen, “Malaysian Higher Education Finds Itself at a48
Crossroads: Government’s plans stress science and technology,” The Chronicle of HigherEducation, Oct. 17, 1997, pp. A55-A56.
3-12
abroad. Affiliate trade in education services occurs when U.S. institutions provide43
courses overseas using their own faculty and facilities, or when foreign institutionsprovide courses in the United States using their own faculty and facilities. Becausecomprehensive data on affiliate trade are not available, this chapter will focus solely oncross-border trade.
Recent Trends in Cross-Border Trade, 1991-96
In 1996, U.S. exports of education services totaled $7.8 billion, while U.S. importsmeasured $1 billion (figure 3-5). Exports rose by 4 percent, slower than the 7-percent44
average annual increase during 1991-95. By comparison, U.S. imports grew by nearly10 percent, surpassing the 8-percent average annual growth rate during 1991-95, dueto increased expenditures by U.S. students pursuing language skills and experienceabroad. Although imports grew at a higher rate, the rate of growth in the number of45
U.S. students studying abroad slowed in the 1995-96 academic year. Trade in46
education services generated a $6.8-billion U.S. surplus in 1996. Despite a $200-million addition to the surplus in education services, proportional growth of the surplusslowed to 3 percent from the 7-percent average annual increase during 1991-95.Slower growth of this surplus is attributable to increased competition from abroad. Ithas long been clear that higher education is integral to the continued development ofindustrializing nations. Thus, in the late 1970s and 1980s, lacking sufficient facilitiesand expertise, industrializing countries sent their students abroad, often to the UnitedStates, to obtain high quality educations, especially in the sciences. At the same47
time, these nations committed themselves to expanding and modernizing their owneducation systems and, although the absolute numbers continue to increase, this48
decade has seen a steady decline in the rate at which foreign students travel to theUnited States for their educations. Foreign students studying in the United Statesnumbered 453,787 in the 1995-96 academic year, increasing at the smallest rate since

Todd M. Davis, ed., Open Doors 1995/96: Report on International Educational49
Exchange (New York: Institute of International Education, 1996), p. 1. Robert Lawrence, “Service, Not Product: Australia’s successful educational50
marketing,” International Educator, Winter 1997, pp. 29-30; Kyna Rubin, “Australia TakesCenter Stage,” and “Luring Students to the United Kingdom,” both in InternationalEducator, Summer 1996, pp. 26-30, 36; Denis Blight, “International Education: Australia’sPotential Demand & Supply,” in Davis, ed., Open Doors 1995/96, pp. 12-13; and industryrepresentative, telephone interview by USITC staff, Oct. 16, 1997. Jefferey Holmes, “Export-Readiness in Canadian Higher Education,” International51
Educator, Winter 1997, pp. 31-34; and Jennifer Lewington, “Canadian Universities SeeU.S. As a Fertile Recruiting Ground,” The Chronicle of Higher Education, Oct. 24, 1997,pp. A63-A64.
3-13
the early 1970s, at 0.3 percent above the 1994-95 academic year. These latest datacontinued a 6-year deceleration in foreign student enrollment in U.S. institutions.49
Figure 3-5Figure 3-5Education services: U.S. cross-border exports, imports, and trade balance, 1991-96Education services: U.S. cross-border exports, imports, and trade balance, 1991-96
The United States also faces competition from other countries and educationalinstitutions that have stepped up efforts to recruit foreign students, especially Asianstudents. In recent years, Australia and the United Kingdom have been particularlyaggressive, and successful, in recruiting foreign students. More recently, Canadian50
institutions, in concert with provincial governments and the federal government, haveexpanded recruitment efforts, not only targeting Asian students, but U.S. students aswell. In addition, higher education in Europe is moving away from centralized state51
control and towards more institutional autonomy. Consequences of this shift in control

Indonesia
Malaysia
India
Taiwan
Korea
China
Japan
0 100 200 300 400 500 600 700 800
Exports Trade balanceMillion dollars
Source: U.S. Department of Commerce, Bureau of Economic Analysis, Survey of Current Business, Oct. 1997, pp. 126-127.
Burton Bollag, “European Universities Expect Less Support From Government, More52
Competition,” The Chronicle of Higher Education, Oct. 10, 1997, p. A49; and BortonBollag, “Higher Education in Europe Moves Away from State Control,” The Chronicle ofHigher Education, Nov. 7, 1997, p. A47.
3-14
are less government funds, more competition, and institutional reforms aimed at cuttingcosts and raising revenue. Thus, in an effort to attract more fee-paying students,European universities have expanded international recruitment of students.52
Major U.S. export markets for education services continue to be Asian countries. In1996, Asia accounted for just under 58 percent of all U.S. exports of educationservices. Specifically, Japan, China, Korea, Taiwan, India, Malaysia, and Indonesia arethe top-seven export markets for the United States (figure 3-6). In 1996, exports ofeducation services on a value basis increased in 5 of the 7 markets, with exports toTaiwan and India declining from 1995 levels. However, U.S. export growth ratescontinued to slow in 2 of the 5 leading markets—Japan, the largest, and Korea—eventhough the value of exports increased. Korea replaced Taiwan as the third-largestexport market, while Hong Kong dropped from number seven to number nine, replacedby Indonesia. As stated earlier, these trends are due, in varying degrees, toimprovements in higher education systems abroad and increased competition.
European markets continued to be the principal destination for U.S. residents studyingabroad, accounting for 64 percent of all U.S. imports of education services in 1996.As in years past, the United Kingdom held the largest share of U.S. imports, followedby France, Spain, Mexico, and Italy. The United States maintained an educationservices trade surplus with all of its trading partners except Italy and the UnitedKingdom.
Figure 3-6Figure 3-6Education services: U.S. cross-border exports and trade balance, by major tradingEducation services: U.S. cross-border exports and trade balance, by major tradingpartners, 1996partners, 1996

Robert Lawrence, “How Asian Students Buy Education,” International Educator,53
Summer 1997, pp. 18-19, 30. The survey, conducted between March and May 1997,included students from China, Hong Kong, India, Indonesia, Japan, Malaysia, Singapore,South Korea, Taiwan, and Thailand. The students were first-year undergraduate studentsstudying at 50 universities in the United States, Canada, Great Britain, and Australia. Ibid., p. 19. The majority of students surveyed from Malaysia and Singapore, however,54
chose the United Kingdom above the United States; the United Kingdom and the UnitedStates received equal votes among Hong Kong students who were surveyed. Lawrencesuggests that the United Kingdom is more favorably viewed in these countries because of itsstrong influence there historically. Ibid., p. 18. Similarly, of Asian students who chose to study in Canada, 41 percent55
cited “better quality of education,” and 27 percent chose “to broaden experience.” Robert Lawrence, “Service, Not Product: Australia’s successful educational56
marketing,” International Educator, Winter 1997, pp. 29-30; and industry representative,telephone interview by USITC staff, Oct. 16, 1997. Geoffrey Maslen, “Australian Educators Alarmed by Decline in Number of Fee-Paying57
Asian Students,” The Chronicle of Higher Education, Sept. 19, 1997, p. A52; and“Australian Officials Embark on Tour to Recruit Southeast Asian Students,” The Chronicleof Higher Education, Nov. 7, 1997, p. A49.
3-15
Summary and Outlook
Although the United States continued to enjoy a substantial trade surplus in educationservices, the rate of growth of the U.S. trade surplus slowed in recent years and stoodat 3 percent in 1996. Asian countries continued to be the largest foreign consumers ofU.S. education services, with Japan, China, Korea, Taiwan, and India continuing to topthe list.
A recent survey of Asian students studying abroad examined opinions with regard toeducation services. When asked to name the most important factor in choosing to53
study overseas, Asian students from all countries included in the survey gaveprecedence to country destination, rather than city, university, or even course of study.Further, surveyed students, regardless of which country they were studying in,overwhelmingly chose the United States as the country that was “first in quality ofeducation.” Among Asian students who chose to study in the United States, 3654
percent cited “better quality of education” as their reason for choosing the UnitedStates; 28 percent responded that they were seeking to “broaden [their] experience.”55
Despite remaining the preferred destination for Asian students, the United States facescompetition for Asian education revenue. In the Asia-Pacific region, Australia is theleading exporter of education services to Asian consumers. Australia’s primaryadvantage in the Asian market is, of course, its relative proximity to the consumer,which means lower travel costs for Asian students. In addition, the AustralianGovernment has undertaken a long-term effort to bolster its share of the internationalmarket, looking out to 2020. In September 1997, however, Australian educators56
nevertheless noted a sharp decline in the number of Asian students who chose to studyin Australia and suggested that recent Australian public debate over race, Asianimmigration, and Australian employment might be discouraging potential candidates.57
In China, which is the second-largest export market for U.S. education services, thegovernment took steps that could result in a loss to U.S. service providers. In the faceof rising numbers of Chinese scholars who choose not to return to China after

Amy Margo Rubin, “China Requires Deposit of Scholars Going Abroad,” The58
Chronicle of Higher Education, Sept. 5, 1997, p. A74. Chinese students who receivegovernment scholarships to study abroad are required to sign an agreement that obligatesthem to repay the scholarships in full if they choose not to return to China. For a moreextensive examination of Chinese students and scholars in the United States, see John H. Jiaand Kyna Rubin, “China’s Brain Trust Abroad: Students Are Pivotal Players in China’sReform and in U.S.-China Relations,” International Educator, Spring 1997, pp. 16-25. Test of English as a Foreign Language. The TOEFL is designed by Graduate and59
Professional Educational Testing Services (ETS) in Princeton, New Jersey. As of December 1997, the computer-based version was still being tested. In December60
1997, ETS announced that, in July 1998, they would introduce the computer formatthroughout the world. See electronic mail to all NAFSA members, from John Yopp, VicePresident, ETS, “TOEFL on Computer Update,” Dec. 18, 1997. Industry representatives, telephone interviews by USITC staff, Oct. 16 and 30, 1997. 61
Tony Gillotte, “Financial Crisis in Thailand Disrupts Plans of College Students,” The62
Chronicle of Higher Education, Nov. 14, 1997, p. A49; and Cohen, “Malaysian HigherEducation Finds Itself at a Crossroads,” p. A 55.
3-16
completing training, the State Education Commission announced that government-sponsored scholars who travel abroad, primarily to the United States, for advancedtraining will be required to post a $6,000 bond, refundable only upon the scholar’sreturn. Observers argue that this added expense may preclude some scholars fromchoosing to study abroad. 58
Another development that may dissuade foreigners from choosing to study in theUnited States is a change in the manner in which the TOEFL exam is administered.59
The TOEFL exam, designed to measure a non-native speaker’s proficiency in theEnglish language, is required for all foreign students wishing to study in U.S.universities. The new administrator of the TOEFL exam will eliminate the paper andpencil exam in most parts of the world and offer a computer-based exam only. Theshift to a computer-based exam will raise the exam fee from the current US$55 toUS$100 in the United States and Canada and US$125 in all other countries. It is not60
clear whether this added expense will prove burdensome, but educators in the UnitedStates are concerned that it may prompt some foreign students to study elsewhere.61
Perhaps the greatest threat to the United States’ export position in education servicesis the recent economic turmoil that has struck several countries in Southeast Asia. Fourcountries in particular — Indonesia, Korea, Malaysia, and Thailand — have seen theircurrencies plummet in the second half of 1997. Like all exports (products andservices), as foreign currencies lose relative value, U.S. educational services becomerelatively more expensive. The sudden and severe currency erosions effectivelydoubled or tripled the cost of U.S. tuitions when expressed in several Asian currencies.Thus, currency devaluations accompanied by rising unemployment reportedly aremotivating parents to withdraw their children from universities in the United States, asthey can no longer afford the tuition.62
Despite the challenges, the United States maintains its position as the world’s leadingexporter of education services. And while four-year, degree-producing colleges anduniversities continue to account for the overwhelming majority of these exports,industry professionals point to other areas that are of increasing interest. In particular,U.S. community colleges have begun to attract a larger share of foreign students.Community colleges are increasingly viewed by foreign students as a viable and less

Industry representative, telephone interview by USITC staff, Oct. 16, 1997.63
Ibid. This is possibly because foreign students who choose community colleges over 4-64
year colleges and universities generally have less financial resources. See, for example, Amy Magaro Rubin, “Intensive English Programs Are Lucrative for65
Universities,” The Chronicle of Higher Education, Dec. 12, 1997, p. A48. Industry representatives, telephone interviews by USITC staff, Oct. 16, 1997.66
Industry representative, telephone interview by USITC staff, Oct. 16, 1997.67
Desruisseaux, “The Number of Americans Studying Abroad Increases by 5.7%,” p.68
A44; and industry representative, telephone interview by USITC staff, Oct. 16, 1997. A custodian holds securities under a written agreement for a client and buys or sells69
when instructed. Custody services include securities safekeeping as well as collection of(continued...)
3-17
expensive entry point into the U.S. system of higher education. There is a concern,63
however, that foreign students who wish to attend a community college in the UnitedStates face greater difficulties in obtaining a visa. 64
Other areas that have seen significant increases in the number of foreign students arecontinuing education and extension programs. In particular, short-term certificateprograms and intensive English as a Foreign Language programs have becomeincreasingly popular among foreign students. In response to the demand, major65
universities on the U.S. east and west coasts vigorously market such programs tostudents abroad. The attraction to these programs stems in part from the often66
interesting locations such as New York or Los Angeles, and from the ability to attendthese programs on a tourist visa. Thus, such short-term students are often referred toas “educational tourists.” 67
On the import side, time spent abroad continues to be viewed as a valuable experience,and U.S. students continue to go abroad in record numbers. The rate at which they go,however, has slowed considerably. While the 1994-95 academic year saw an over 11-percent increase in the number of U.S. students who studied abroad, the 1995-96academic year saw less than a 6-percent increase. Further, U.S. students continue to68
pursue short-term opportunities abroad; rarely do they pursue a degree from a foreigncollege or university.
Financial Services
The following section presents a discussion of trade in financial services. The firstdiscussion examines banking and securities services; the second examines insurance.
Banking and Securities
Introduction
International trade data on financial services, excluding insurance, encompass both thefee-based commercial banking business and securities-related activities of financialservice firms. Fee-based commercial banking essentially involves banking servicesother than deposit-taking and lending activities. These include financial managementand transaction services; advisory services; custody services; credit card services; and69

(...continued)69
dividends and interest. Thomas P. Fitch, Dictionary of Banking Terms (New York:Barron’s, 1990), p. 172. A standby letter of credit represents an obligation by the issuing bank to a designated70
third party (the beneficiary) that is contingent on the failure of the bank’s customer toperform under the terms of a contract with the beneficiary. A standby letter of credit is mostoften used as a credit enhancement, with the understanding that, in most cases, it will neverbe drawn against or funded. Ibid., p. 591. A securities loan is a loan made by broker-dealers, banks, or other organizations to71
finance the purchase of securities. Ibid., p. 552. A private placement is the sale of an entire issue of securities to a small group of72
investors. Ibid., pp. 481-482. In 1996, BEA completed its first Benchmark Survey of Financial Services Transactions73
Between U.S. Financial Services Providers and Unaffiliated Foreign Persons. The surveyenabled BEA to improve its measurement of financial services transactions, which resultedin some significant revisions of previously reported data. Due to limitations in source dataand methodology, BEA’s revisions could only provide reasonable estimates for cross-bordertrade dating back to 1992. Consequently, the discussion of cross-border trade in financialservices is limited to the time period 1992-96. Exports grew by 24 percent in 1993, 15 percent in 1994, and 22 percent in 1995, while74
imports grew by 39 percent in 1993, 21 percent in 1994, and 49 percent in 1995. Thesevariations loosely reflect growth in global market capitalization of 29 percent in 1993, 9percent in 1994, and 17 percent in 1995. BEA, Survey of Current Business, Oct. 1997, pp.120-127, and International Finance Corporation (IFC), Emerging Stock Markets Factbook1996 (Washington: IFC, 1996), p. 17.
3-18
other credit-related services, such as providing standby letters of credit for trade70
financing. Securities-related activities include securities lending services, mutual fund71
services, securities clearance and settlement services, securities trading services, privateplacements, and underwriting services. Both fee-based commercial banking services72
and securities-related services may be provided either on a cross-border basis orthrough the transactions of foreign affiliates.
Recent Trends
Cross-Border Trade, 1992-9673
In 1996, U.S. financial service firms generated cross-border exports of $8 billion, whileimports measured $3.2 billion, resulting in a $4.8-billion surplus (figure 3-7). Bankingand securities services accounted for 4 percent and 2 percent of total U.S. servicesexports and imports, respectively. U.S. exports grew by 14 percent in 1996, which issomewhat slower than the average annual growth rate of 20 percent recorded during1992-95. Import growth of 29 percent in 1996 was similarly slower than the averageannual rate of 36 percent recorded during 1992-95. Growth rates in cross-borderfinancial services trade have fluctuated widely during 1992-96, reflecting trends inglobal financial markets. The relatively rapid pace of import growth is due in part to74
the smaller base of imports, as, in absolute terms, exports increased by $1 billion, whileimports increased by only $712 million.

1992 1993 1994 1995 19960
2
4
6
8
10Exports Imports Trade balance
Billion dollars
1 Improvements in BEA’s coverage of financial services in 1996 led to significant revisions of cross-border data reportedpreviously. However, these revisions could only be carried back to 1992 due to limitations in the source data.
Source: U.S. Department of Commerce, Bureau of Economic Analysis, Survey of Current Business, Oct. 1997,pp. 108-109.
3-19
Figure 3-7Figure 3-7Banking and securities services: U.S. cross-border exports, imports, and trade balance, 1992-Banking and securities services: U.S. cross-border exports, imports, and trade balance, 1992-969611
On a bilateral basis, the United States maintained a surplus with its five leading tradingpartners in cross-border financial services transactions in 1996 (figure 3-8). U.S.financial services exports to the United Kingdom amounted to $1.4 billion, whileimports were $913 million, resulting in the largest U.S. bilateral trade surplus infinancial services. These values accounted for 18 percent and 29 percent of U.S. cross-border financial services exports and imports, respectively. The $494-million surpluswith the United Kingdom contributed 10 percent of the overall U.S. surplus in cross-border financial services transactions. Other significant trading partners includeCanada and Japan, which accounted for 8 percent and 6 percent of U.S. exports,respectively.
Bilateral trade patterns indicate that the United States derives its exports from a widerange of countries, while imports tend to be more concentrated in the major developedmarkets. In 1996, the top 5 U.S. export markets accounted for only 39 percent of U.S.exports, while these same countries accounted for 50 percent of imports. Outside ofthe top 5 export markets, no market accounted for more than 3 percent of total U.S.exports of banking and securities services.

Exports Trade balance
France
Switzerland
Japan
Canada
United Kingdom
0 200 400 600 800 1000 1200 1400 1600
Million dollars
Source: U.S. Department of Commerce, Bureau of Economic Analysis, Survey of Current Business,Oct. 1997, pp. 126-127.
BEA data on sales transactions between majority-owned affiliates of U.S. financial75
service firms (except banking and insurance) and non-affiliated firms are somewhat limitedin order to avoid disclosing confidential, proprietary information pertaining to individualfirms. Consequently, the data reported for U.S. sales and the U.S. trade surplus are believedto understate U.S. sales and surpluses during 1991-95. Growth rates have been estimated byUSITC staff. USDOC, BEA, Survey of Current Business, Sept. 1996, p. 127.76
3-20
Figure 3-8Banking and securities services: U.S. cross-border exports and tradebalance, by major trading partners, 1996
Affiliate Transactions, 1991-95
As with cross-border trade, U.S. affiliate transactions in financial services consistentlyresult in a strong U.S. surplus (figure 3-9), valued at $6.9 billion in 1995 . Sales by75
foreign affiliates of U.S. firms amounted to $13.6 billion, as compared to purchasesfrom U.S. affiliates of foreign firms, which amounted to $6.8 billion. These valuesrepresent 7 percent and 4 percent of total affiliate sales and purchases, respectively.Sales through foreign affiliates of U.S. firms grew by 14 percent in 1995, faster thanthe average annual growth rate of 3 percent recorded during 1991-94 (despite a slightdecrease in 1994). Purchases through U.S. affiliates of foreign firms grew by 7 percentin 1995, slightly slower than the average annual growth rate of 9 percent recordedduring 1991-94. The strong increase in sales in 1995 reflects an 11-percent increasein the level of U.S. direct investment abroad in the financial sector as U.S. firmscontinued to expand their already formidable international operation.76

1991 1992 1993 1994 19950
2
4
6
8
10
12
14
16Sales Purchases Balance
Billion dollars
1 Data understate U.S. sales and surpluses, as selected U.S. sales data were suppressed in order to avoiddisclosing information about the operations of individual firms.
Source: U.S. Department of Commerce, Bureau of Economic Analysis, Survey of Current Business, Sept. 1994,Sept. 1995, Nov. 1996, and Oct. 1997, pp. 137-138; and estimated by USITC staff.
3-21
Figure 3-9Figure 3-9Banking and securities services transactions by majority-owned affiliates: U.S. sales, purchases,Banking and securities services transactions by majority-owned affiliates: U.S. sales, purchases,and balance, 1991-95and balance, 1991-9511
On a bilateral basis, the largest trading partners were those countries where U.S. firmshave established a substantial commercial presence in order to participate in the localmarket. These include the United Kingdom and Japan (figure 3-10), which host thelargest financial markets outside the United States, as well as Canada, which figuresprominently due to its geographic proximity and strong commercial ties with the UnitedStates. In the United Kingdom, sales through foreign affiliates of U.S. firms were $5.8billion in 1995, or 43 percent of total U.S. sales of financial services through affiliates.Corresponding purchases through British affiliates operating in the United States were$1.7 billion, accounting for 25 percent of total U.S. purchases. The $4.1-billionsurplus represented 61 percent of the total U.S. surplus in financial servicestransactions through affiliates. The very strong role of the United Kingdom in financialservices trade through affiliates reflects the global importance of the British financialmarkets and the level of involvement by U.S. firms. Relative to the United Kingdom,affiliate trade with Canada ranks a distant second in terms of U.S. sales. Sales byforeign affiliates of U.S. firms operating in Canada amounted to $2.9 billion in 1995,or 21 percent of U.S. financial services sales. Purchases of $408 million were only 6percent of total purchases, and the surplus of $2.5 billion contributed 36 percent of theU.S. surplus on affiliate transactions in financial services. The small level of purchasessuggests that Canada has relatively few firms participating in U.S. financial markets,while U.S. firms are well established within Canada. As for Japan, sales of $1.9 billioncontributed 14 percent of total sales, while purchases of $1.7 billion accounted for 26percent of purchases. The small surplus of $183 million contributed only 3 percentto the overall surplus.

Sales Balance
Switzerland
France
Australia
Japan
Canada
United Kingdom
-1 0 1 2 3 4 5 6
Billion dollars
Source: U.S. Department of Commerce, Bureau of Economic Analysis, Survey of Current Business, Oct. 1997,pp. 137-138.
“Awards for Excellence 1997,” Euromoney, July 1997, pp. 70-94.77
U.S. financial service firms also scored high in individual product areas, as Goldman78
Sachs, Morgan Stanley, and Merrill Lynch were rated best international equity underwriters;Bankers Trust and J.P. Morgan, the best in risk advisory services; Citibank, the best inforeign exchange services; Chase Manhattan, the best in syndicated loan services; andMorgan Stanley, the best for mergers and acquisitions advice. Ibid.
3-22
Figure 3-10Figure 3-10Banking and securities services transactions by majority-owned affiliates: U.S. sales andBanking and securities services transactions by majority-owned affiliates: U.S. sales andbalance, by major trading partners, 1995balance, by major trading partners, 1995
Summary and Outlook
U.S. banks and securities firms are highly competitive internationally, as reflected bythe strong, sustained surplus in both cross-border and affiliate transactions. Thestrength of U.S. firms was recognized in an annual survey of international bankperformance in which U.S. financial service firms placed at or near the top in mostmajor categories. For banking services, Citibank was ranked a close second in thecategory for the world’s best bank in 1996 in terms of profitability and global reach.77
As for securities services, Merrill Lynch was rated best global investment bank,followed by Morgan Stanley. On a regional basis, Citibank was considered the bestbank in Latin America, Africa, and the Middle East, while J.P. Morgan was rated thebest securities firm in Latin America.78
The international strength of U.S. financial service firms stems from the highlycompetitive domestic market. Intensely competitive conditions in the home markethave led to declining profit margins in traditional lines of business, which in turnencourages consolidation in pursuit of greater scale economies. Industry consolidationin the United States has also been spurred by trends toward retail banking deregulation,the increased provision of financial services by nonbanks, and the electronic deliveryof financial services through the telephone and personal computer. These factors have

Jane Lucien-Scholle, Jay Norman, and Nick Perch, “Global trends in retail banking,”79
Banking Strategies, Nov./Dec. 1996, pp. 18-19. Ibid.80
Fred R. Bleakley, “New global financial firms stir debate,” The Wall Street Journal,81
Oct. 9, 1997, p. A12. Paul J. Deveney, “Lima airport to be privatized,” and Matt Moffett, “Brazil gets rich in82
sell-offs,” The Wall Street Journal, Oct. 22, 1997, p. A16, and Paul J. Deveney, “FranceTelecom begins trading,” The Wall Street Journal, Oct. 20, 1997, p. A18. Jonathan Friedland, “Citibank dives into Latin pensions,” The Wall Street Journal,83
Sept. 25, 1997, p. A16. Sara Calian and Nicholas Bray, “Investment banks near M&A record in Europe,” The84
Wall Street Journal, Oct. 14, 1997, p. A16.
3-23
led to a 36-percent reduction in the number of U.S. banks during 1985-95. Merger79
announcements in 1998 among large financial firms Citicorp and Travelers,NationsBank and Bank America, and Banc One and First Chicago indicate thatmomentum to consolidate remains strong. These same trends, however, have alsoforced U.S. firms to innovate and embrace new technologies to improve efficiency andcapture additional revenue.
Similar consolidation patterns have been observed in France and Sweden, where thenumber of banks declined by 43 percent and 81 percent during 1985-95, respectively.Consolidation is also taking place in the developing regions of Latin America andSoutheast Asia. For example, Brazil has established a program called Proer that offerssubsidized loans and tax benefits as incentives for banking acquisitions, and Singaporeprojected a 50-percent decline in the number of banks due to recent legislationpermitting larger bank-equity holdings. In 1997, consolidation appeared to spread80
into the securities business, as evidenced by the mergers of Travelers Group/SmithBarney with Salomon, Inc., and Morgan Stanley with Dean Witter, Discover.81
Industry consolidation suggests that in the future there will be fewer financialinstitutions, and that those remaining will be larger and offer a broader range ofservices. Since major U.S. financial service firms tend to be on the forefront in termsof cost control, technological adaptation, and new product development, they appearto be well positioned to compete in developing international markets.
Another factor influencing international financial services trade is the trend towardprivatization of government entities. For example, in 1997, Peru privatized the Limaairport, Brazil continued to sell government-owned electricity distribution companies,and France followed through with its sale of a significant stake in France Telecom.82
In addition, governments, particularly in Latin America, are increasingly privatizingaspects of social security programs. Capitalizing on such policies, Citibank hasbecome the largest administrator of private pension-fund accounts in Latin America,holding 17 percent of all pension fund assets despite limitations on cross-selling andthe use of its name. U.S. securities firms are also likely to benefit from economic83
stability in much of Latin America and Eastern Europe, which is leading morecompanies based in those regions to raise capital through public offerings. Also,Western Europe appears to be experiencing an increase in merger and acquisitionactivity that is benefitting U.S. securities firms. In 1997, Morgan Stanley advised inEuropean deals worth $59.1 billion, more than any other firm, while Goldman Sachsand J.P. Morgan also were among the top 5 firms in Europe.84

Brian Garrity, “Bank lending to Latin America is still alive and well, again,” Investment85
Dealers Digest, vol. 63, Iss. 22, June 2, 1997, pp. 20-21. Andrew Tanzer, “Citibank blitzes Asia,” Forbes, May 6, 1996.86
“Battle of the banks,” Asian Business, Mar. 1997, p. 41.87
Thomas T. Vogel, Jr., “Foreign banks target the little guy in Latin America,” The Wall88
Street Journal, Oct. 9, 1997, p. A15. Sam Zuckerman, “Patience pays off in Latin America,” USBanker, Apr. 1997, p. 48.89
3-24
As for international banking services, the continued growth of global businesstransactions is likely to lead to steady growth in the commercial banking functions oftrade finance, cash management, foreign exchange, and risk management services.Additionally, one of the most promising opportunities lies in the development of retailbanking markets. Traditionally, international banks focused on the commercialbanking sector, because economic instability and low levels of disposable income madeconsumer markets less attractive in much of the world. Because of sustained economicgrowth in Southeast Asia and parts of Latin America, there has been a correspondingincrease in the size of the middle class and in consumer spending. As a result, retail85
banking is becoming a more significant source of revenue for banks. For example,credit cards are becoming increasingly popular in Asia. Citibank, a major issuer ofcards, saw revenue increase by an estimated 150 percent in the region over two yearswith a loss rate half that of the U.S. industry average of 4 percent. In India, Citibank86
accounts for 70 percent of the 1.5 million cards issued. With only 1 percent of adultscarrying a credit card and only 1 percent of transactions executed with credit cards inAsia, excluding Japan, the credit card business appears to offer significant growthopportunities. Other forms of consumer lending also seem promising, such as tax loansthat allow customers to borrow up to 200 percent of their tax obligation, and personalloans for expenses related to education, home improvements, and weddings. Similar87
conditions are arising in Latin America, where interest rate margins for consumerlending are double those in developed markets and where declining inflation in manycountries has made it easier for banks to offer mortgages and car loans. Citibank,88
BankBoston, and Banco Santander of Spain are the three major foreign bankscompeting in the Latin American retail market. As in Asia, Citibank has beenparticularly strong in the credit card sector, using credit cards as an entry product intoretail banking. In Brazil, Citibank owns one-third of the largest credit card issuer,Credicard, offering its own branded card as well as a cobranded card with AmericanAirlines.89
While the ongoing discussion suggests a favorable outlook, some factors posesignificant obstacles to U.S. financial service providers. For example, the 1997currency crisis in Southeast Asia has forced a reevaluation of these economies and ofthe strategies of U.S. financial services firms holding or contemplating partitions in theregion. In the short term, the weakened currencies and government efforts to curbspending could lead to a drop in consumption that would adversely affect the incomeof U.S. firms. This could be exacerbated in the longer term should these economies notreturn to previous levels of strong growth. Another challenge to U.S. financial servicefirms could be tied to the performance of the capital markets. While U.S. capitalmarkets continue to rise to new highs, increased volatility in 1997 is a reminder thatcontinued growth is not assured. A significant correction or even a period of slowgrowth could have significant effects on the revenue of U.S. firms involved inunderwriting and trading securities.

World Trade Organization, “Successful Conclusion of the WTO’s Financial Services90
Negotiations,” press release, found at Internet address http://www.wto.org/, posted Dec. 15,1997, retrieved Dec. 17, 1997. Office of the United States Trade Representative, “Statement by Secretary Rubin and91
Ambassador Barshefsky Regarding the Successful Conclusion of WTO Financial ServicesNegotiations,” press release, found at Internet address http://www.ustr.gov/, posted Dec. 13,1997, retrieved Dec. 17, 1997. This is often due to favorable tax treatment received. Japan is the largest insurance92
market in the world, largely because insurance companies are one of the few financialsavings mechanisms that are widely understood and available in that country. See Sigma,Swiss Reinsurance Company, No. 4, 1997, table I, p. 19.
3-25
Despite these cautionary factors, international economic conditions suggest that U.S.financial service firms will continue to grow and remain highly competitive. LatinAmerica is enjoying a sustained period of reduced inflation and economic growth,China is experimenting with easing its restrictions on the activities of foreign banks,Japan is planning major financial sector deregulation in 1998, parts of Eastern Europeare stabilizing and beginning to prosper, and Western Europe is moving towardmonetary unification.
In addition, the United States was party to an agreement among WTO membercountries that successfully concluded negotiations on financial services in December1997. The agreement would bring more than 95 percent of world trade in banking andsecurities, insurance, and financial information under the WTO’s multilateral, legallyenforceable rules on a permanent and most-favored-nation basis when the agreemententers into force by March 1, 1999. Previous negotiations through 1995 had elicited90
offers on financial services from 97 countries, many of which were deemed insufficientby the United States. By the conclusion of negotiations in 1997, however, 102 WTOmembers had made commitments to accord market access and national treatment toforeign financial service firms. Overall, it is likely that these commitments will openmore financial services markets to U.S. firms, especially in developing countries thatare beginning to liberalize their financial sectors and poised for substantial growth.91
Insurance Services
Introduction
The traditional core business of the insurance industry is the transfer of risk. Thebusiness includes the underwriting of financial risk for life and non-life (both propertyand casualty) products, as well as many specialty insurance products. The latterinclude reinsurance (further transferring of risk between insurance companies), marineand transportation insurance (hulls, cargoes, off-shore oil rigs), and insurancebrokerage (specialists who package policies from several insurance underwriters tocover a given risk). In addition to risk transfer, insurance also is an importantindividual savings device in most countries. Insurance companies may also be92
important to the functioning of national economies because of their ability to providerelatively large amounts of long-term investment capital. International trade ininsurance takes place both on a cross-border and affiliate basis. Because insurance

1991 1992 1993 1994 1995 1996-4
-2
0
2
4
6
8Exports Imports Trade balance
Billion dollars
1 All figures are provided on a net basis; i.e., insurance premiums received minus insurance claims paid. Includesprimary insurance and reinsurance. Cross-border trade data are not comparable with affiliate trade data.
Source: U.S. Department of Commerce, Bureau of Economic Analysis, Survey of Current Business, Oct. 1997, pp. 108-109.
Judging insurance premiums only (without the cost of claims paid against them), U.S.93
cross-border trade had $15 billion in imports and $6 billion in exports in 1996, while U.S.affiliate transactions for 1995 (latest available) experienced $57 billion in purchases and$35 billion in sales. USDOC, BEA, Survey of Current Business, Oct. 1997, pp. 131, 137-138. All cross-border trade figures for insurance services are presented on a net basis, i.e.,94
imports comprise premiums paid for foreign insurance coverage, minus claims receivedfrom foreign insurers. Exports comprise premiums received from foreign policyholders,minus payments for claims. USDOC, BEA, Survey of Current Business, Oct. 1997, p. 102.95
The 1992 decline in the insurance trade deficit almost entirely reflects reinsurance96
reimbursement claims paid by non-U.S. reinsurers for damage caused by Hurricane Andrewin South Florida.
3-26
sales often demand knowledge of, and proximity to, consumers of insurance,international affiliate transactions are considerably larger than cross-border trade.93
Recent Trends
Cross-Border Trade, 1991-96
In 1996, U.S. cross-border exports amounted to $2.1 billion and imports totaled $4.494
billion. The resulting negative trade balance of $2.3 billion decreased by 43 percentfrom a deficit of $4.0 billion in 1995. The difference was due largely to a leveling offof claims paid by U.S. insurers to insurance clients abroad, while foreign companiesselling insurance into the United States found their claims increase by 13 percent.95
U.S. cross-border insurance trade in 1996 reflected the trade patterns experienced since1991, with imports exceeding exports by between $1 billion and $4 billion annually(figure 3-11). 96
Figure 3-11Figure 3-11Insurance services: U.S. cross-border exports, imports, and trade balance, 1991-96Insurance services: U.S. cross-border exports, imports, and trade balance, 1991-96 11

Switzerland
Bermuda
Germany
Japan
Canada
United Kingdom
-3500 -3000 -2500 -2000 -1500 -1000 -500 0 500
Exports Trade balanceMillion dollars
1 U.S. exports are depicted as negative values because claims paid to policyholders in Switzerland exceededpremiums collected from them by U.S. insurers. The U.S. trade balance with Switzerland is positive becauseclaims received by U.S. policyholders from Swiss companies exceeded claims received by Swiss policyholdersfrom U.S. companies.
Source: U.S. Department of Commerce, Bureau of Economic Analysis, Survey of Current Business, Oct. 1997, pp. 126-127.
1
Over the past 5 years, Bermuda has become a reinsurance center, specializing97
especially in large catastrophe insurance and reinsurance. Favorable business and tax lawshave promoted this growth.
3-27
Figure 3-12Figure 3-12Insurance services: U.S. cross-border exports and trade balance, by major trading partners,Insurance services: U.S. cross-border exports and trade balance, by major trading partners,19961996
In terms of premiums, the largest markets for U.S. primary insurance and reinsurancecombined in 1996 included the United Kingdom, with 27 percent of inbound premiums;Canada, with 18 percent; Japan, with 9 percent; and Germany, with 7 percent (figure3-12). The largest suppliers to U.S. insurance consumers included Bermuda, with 3397
percent of outbound premiums; the United Kingdom, with 22 percent; Germany, with9 percent; Canada, with 7 percent; and Switzerland, with 4 percent.
Affiliate Transactions, 1991-95
In 1995, U.S.-owned affiliates’ sales abroad totaled $35 billion, while foreign insurersin the United States generated $57 billion through their U.S. affiliates, resulting in anegative U.S. balance on affiliate transactions of $22 billion (figure 3-13). Sales byinsurance affiliates of U.S. firms grew by 12 percent in 1995, slightly faster than the10-percent average annual growth rate during 1991-94. However, U.S. purchasesgenerated by U.S. insurance affiliates of foreign firms grew even faster, at 18 percentin 1995. This high growth rate in U.S. purchases far exceeded the 1-percent averageannual growth rate during 1991-94 (despite declining purchases in 1992 and 1993).U.S. affiliates of foreign-owned insurance firms accounted for a very large 36 percentof total purchases of services through U.S. affiliates of foreign parents in 1995. Theincrease in foreign-owned insurance affiliate sales in the United States is accounted

1991 1992 1993 1994 1995-40
-30
-20
-10
0
10
20
30
40
50
60
70Sales Purchases Balance
Billion dollars
1 Data reflect premiums for primary insurance and reinsurance only. Affiliate trade data are not comparable withcross-border insurance trade data because cross-border data are net of claims paid.
Source: U.S. Department of Commerce, Bureau of Economic Analysis, Survey of Current Business, Sept. 1994,Sept. 1995, Nov. 1996, and Oct. 1997, pp. 137-138, and USITC staff estimates.
USDOC, BEA, Survey of Current Business, Oct. 1997, pp. 105-107.98
Ibid.99
3-28
Figure 3-13Figure 3-13Insurance services transactions by majority-owned affiliates: U.S. sales, purchases, and balance,Insurance services transactions by majority-owned affiliates: U.S. sales, purchases, and balance,1991-951991-9511
for largely by increases in U.S. sales by affiliates of Swiss insurers and reinsurers.98
By comparison, foreign insurance affiliates of U.S. parent firms accounted for 18percent of all foreign affiliates’ sales of services to foreign consumers. Such99
transactions are partially explained by local foreign exchange rates against the U.S.dollar. In 1995, U.S. insurers commercially established abroad did the most businessin Japan, which accounted for 21 percent of sales; the United Kingdom, 20 percent;Canada, 14 percent; and Germany, 10 percent (figure 3-14).
Conversely, foreign companies selling insurance from affiliates established in the U.S.market originated principally in Switzerland and the United Kingdom, each accountingfor 22 percent of U.S. purchases; Canada, 20 percent; and France and Germany, eachat 9 percent. The largest U.S. surplus on affiliate transactions was with Japan, at $6.7billion. Large negative balances for affiliate insurance transactions occurred withSwitzerland, at $12.4 billion; Canada, $7 billion; the United Kingdom, $5.3 billion;France, $4.4 billion; and Germany, $1.7 billion.
Summary and Outlook
The large imbalances in both cross-border trade and affiliate transactions reflect theability of European and Canadian firms to compete in the large, diverse U.S. insurance

Sales Balance
Switzerland
France
Germany
Canada
United Kingdom
Japan
-15000 -10000 -5000 0 5000 10000
Million dollars
Source: U.S. Department of Commerce, Bureau of Economic Analysis, Survey of Current Business, Oct. 1997,pp. 137-138.
See the U.S. National Association of Insurance Commissioners’ annual reports on100
foreign penetration of the U.S. market, beginning in 1992. In 1997, the 50-state system of regulation was under considerably increased political101
and industry pressure, due especially to financial services reforms proposed in the U.S.Congress, to streamline state procedures, reduce regulatory costs, and improve, enhance, ormaintain its communication with the U.S. Congress. See, for example, InsuranceRegulator, 1997 editions, and “State Regulations Supporters Warned They are Too Silent,”National Underwriter, Nov. 24, 1997, p. 24. Also, although there is broad consensus thatinsurance regulators are far behind their banking and securities colleagues in cooperativeefforts regarding international regulation, some improvements to international regulatorymechanisms are evident. See, for example, “Changing the Rules,” ReActions, Mar. 1997, p.67ff.
3-29
market and their long establishment in the United States. More than 10 percent of allU.S. premiums are collected by foreign-based insurance firms.100
Figure 3-14Figure 3-14Insurance services transactions by majority-owned affiliates: U.S. sales and balance, by majorInsurance services transactions by majority-owned affiliates: U.S. sales and balance, by majortrading partners, 1995trading partners, 1995
Broadly, the current U.S. insurance market is facing the integration of the financialservices market at home while dealing with the globalization of markets everywhere.Older questions of market consolidation, alternative risk-transfer mechanisms, andtechnological change also remain. The only constant is a static domestic regulatorymechanism, based on an overlapping but long-standing 50-state system. However, thissystem, too, is increasingly under pressure to harmonize, simplify, and deregulate insome major insurance areas.101
Integration of Financial Services
The newest, and in some ways most challenging, development in the U.S. insurancemarkets is the entry of banking, securities, and related financial service firms. A series

The U.S. Office of the Comptroller of the Currency (OCC), the regulator of banks102
holding a national license, issued guidelines on November 4, 1996, clarifying the conditionsunder which national banks could sell insurance. The U.S. Supreme Court concurred withthe OCC’s interpretation of Section 92 of the Bank Holding Company Act (12 U.S.C. 92). The U.S. Supreme Court decision on Barnett v. Nelson et al. (116 S.Ct. 1103, (1996))widened significantly the ability of banks in towns with population of less than 5,000 todistribute insurance, while the decision on NationsBank v. Valic (513 U.S. 251, (1995))widened the ability of banks to offer annuities, declaring that they were primarily investmentrather than insurance mechanisms. Bernard Fink, Global Marketing: An Alternative or Necessity? Paper delivered to the103
International Insurance Seminar of the International Insurance Society, San Francisco, CA,June 16-20, 1991. The U.S. Treasury generally favors this expansion of banking powers. See “Treasury104
Report: Time is Right to Break With Past In Financial Services Regulation,” NationalUnderwriter, Dec. 15, 1997, p. 40. Large insurers such as the Principal Mutual Life Insurance Company of Des Moines,105
Iowa, and the Travelers, New York, for example, have thrift banking charters. See NationalUnderwriter, Dec. 1, 1997, p. 3. United States, Canada, Germany, United Kingdom, France, Italy, and Japan.106
Sigma, Swiss Reinsurance Company, Number 4, p. 26, 1997.107
Indonesia, Malaysia, Philippines, Thailand, and Singapore.108
Sigma, Swiss Reinsurance Company, Number 4, p. 26, 1997.109
“Year in Review,” Insurance Finance & Investment, Dec. 29, 1997, p. 8.110
“An uphill struggle,” ReActions, Feb. 1997, pp. 10-14.111
3-30
of U.S. Supreme Court decisions in 1995 and 1996 has permitted banks to begindistributing insurance in major sectors, and perhaps underwrite such policies. An102
axiom of insurance is that much of it is sold, rather than bought, meaning that sales andmarketing are key. Depending on the insurance product and local market tradition,perhaps 30 or more cents of every premium dollar is directed toward sales andmarketing. However, customers frequently transact business at their banks, many103
of which have absorbed establishment costs and can thus extend into new businesslines with minimal expense. Most insurance companies and their agents do not have104
this advantage, and thus have contested banks’ entry to the insurance market, with littleconsequence. Although some insurers are buying banks, it appears likely that banks105
will increasingly take over several important lines of insurance distribution.
Globalization and Consolidation
Insurance markets in many developed countries are mature. Between 1994 and 1995(latest available figures) the overall U.S. insurance market grew by only 1.1 percent.For the G7 countries, the figure was 3.3 percent. Conversely, the insurance106 107
markets of the five original members of the Association of South East Asian Nations108
(ASEAN), grew by 12.8 percent in real terms during the same period. In order to109
grow, insurers in developed countries must either undertake mergers and acquisitions(M&A), or expand into foreign markets. Both are happening, with mergers andacquisitions being the favored approach in both the United States and Europe. In theUnited States alone, as of mid-December 1997, some 264 M&A deals had beencompleted, worth $27 billion. This compares to $23.2 billion the previous year. The110
global insurance brokerage market has now consolidated to perhaps four majorbrokers and significant M&A activity has taken place in the insurance markets of111

Despite the European Union’s Third Insurance Directives on market openings, much112
of the European M&A activity remains confined to EU member states. There are significantexceptions, however, and the introduction of the unitary monetary system would presumablyspeed further intra-European insurance integration. Office of the United States Trade Representative, press release on WTO financial113
services negotiation, Dec. 13, 1997. DRI/McGraw-Hill, Standard & Poor’s, U.S. Department of Commerce, U.S. Industry114
and Trade Outlook ‘98 (New York: McGraw-Hill, 1998), p. 47-14.
3-31
Switzerland, Germany, the United Kingdom, and France. For quite different reasons,112
i.e., those of financial solvency brought on by regulatory lapses, over-extended propertyinvestments, and depreciating currencies, the insurance markets of Japan, Korea, andthe ASEAN countries are also expected to experience considerably increased mergerand acquisition activity, including foreign investment in those markets.
The successful completion of the Financial Services negotiations for the World TradeOrganization on December 13, 1997, will likely lead to expanded entry of developedcountries’ insurance firms in developing country markets. The agreement codifiesliberalized guarantees of market access and national treatment for foreign tradingpartners among 102 trading partners. 113
Changing Market and Technological Changes
The advent of new risk transfer mechanisms and changing technology are challengesto the global insurance industry. New risk-transfer mechanisms may reduce insurancefirms’ business opportunities. For instance, most large companies outside theinsurance industry now have specialists who prepare advice on the mitigation andreduction of costs associated with risk. “Captive” insurance companies, whereingroups of companies, like airlines, self-insure, are now common. In addition,traditional insurance products like annuities are sold by banks as much as by lifeinsurance companies. Such practices place considerable pressure on the globalinsurance industry to create new products and to reduce costs, especially since thesealternative risk-transfer devices tend to focus on lower cost and lower risk areas, thusleaving greater and/or costlier risks for traditional underwriters.
Similarly, technological advances are necessary in order to reduce distribution andadministrative costs, but require expensive training and large capital expenditures.Commerce Department data indicate that U.S. insurance companies spend about 83percent of all equipment investment on information technology improvements, wellabove the norm of 49 percent. In 1994 (latest available), this information technology114
expenditure alone amounted to $14.5 billion.

Business format franchising entails selling rights to use a franchisor’s entire business115
concept, from business plans to training materials. A franchisor’s business concept,trademark, and brand name determine in large part the value of a franchise and arerecognized as intellectual property by the U.S. Department of Commerce (USDOC) and thefranchising industry. See Ralph Kroman, “International Intellectual Property Aspects ofFranchising” ch. in International Franchising: An In-Depth Treatment of Business andLegal Techniques, pp. 88-89. For a comprehensive discussion of trade in business formatfranchising, see USITC, Industry and Trade Summary: Franchising, USITC publication2921, Sept. 1995. For instance, one company that provides blueprints and technical advice to its affiliate116
may classify the associated charges as a licensing fee for providing know-how, whereasanother company may classify these charges as management fees. For a discussion of theUSDOC survey of trade in intellectual property, see USDOC, BEA, “U.S. InternationalTransactions in Royalties and Licensing Fees: Their Relationship to the Transfer ofTechnology,” Survey of Current Business, Dec. 1973, p. 15. In the context of this discussion, foreign-based affiliates of U.S. firms are those at least117
10 percent owned directly or indirectly by U.S. parent firms. Similarly, U.S.-based affiliatesof foreign-owned firms are those that are at least 10 percent owned by foreign parents. USDOC, BEA, “ International Sales and Purchases of Private Services,” Survey of118
Current Business, Oct. 1997, pp. 101-102. Ibid., pp. 108-109.119
3-32
Intellectual Property-Related Services
Introduction
Trade in intellectual property encompasses sales of the rights to, or the use of,intangible property such as industrial processes, techniques, formulas, and designs;copyrights, trademarks, and patents; business format franchising; and management115
services. Intellectual property embodied in merchandise lies outside the scope of this116
discussion.
Recent Trends
Cross-Border Trade, 1991-96
Cross-border trade in intellectual property is captured under the entry for royalties andlicense fees in the balance of payments, and includes transactions between unaffiliatedU.S. and foreign entities and intra-corporate trade between parent companies and theirforeign affiliates. Intracorporate trade accounts for close to 80 percent of cross-117
border trade in intangible intellectual property.
In 1996, U.S. cross-border exports and imports of intellectual property accounted for14 percent and 5 percent, respectively, of such trade recorded for all private services.U.S. cross-border exports of intellectual property increased by 9 percent, to $30 billion(figure 3-15). Export growth during 1996 was lower than the annual growth rate118
recorded during 1991-95, which averaged 11 percent. U.S. imports increased by 13percent, to $7.3 billion, continuing the average annual growth rate established during1991-95 (despite the slight decline in 1993). Payments to the International Olympic119
Committee for broadcast rights during the 1996 Summer Olympics in Atlanta propelled

1991 1992 1993 1994 1995 19960
5
10
15
20
25
30
35Exports Imports Trade balance
Billion dollars
Source: U.S. Department of Commerce, Bureau of Economic Analysis, Survey of Current Business, Oct. 1997,pp. 108-109.
Ibid., p. 102.120
Ibid., pp. 137-138.121
3-33
U.S. imports. On balance, the United States registered a $22.6-billion surplus on120
trade in intellectual property in 1996, representing 8-percent growth from the previousyear, which is lower than the 11-percent average annual growth rate in 1991-95.
Figure 3-15Figure 3-15Intellectual property-related services: U.S. cross-border exports, imports, and tradeIntellectual property-related services: U.S. cross-border exports, imports, and tradebalance, 1991-96balance, 1991-96
In 1996, U.S. parent companies’ receipts from foreign-based affiliates totaled $22billion, approximately 12 times higher than U.S.-based affiliates’ total receipts fromforeign parents, which totaled $1.8 billion. The growth in intra-corporate tradereflects the continuing globalization of manufacturing and service industries,manifested in rapidly growing inbound and outbound direct investment. Intellectualproperty holders who desire to sell such property in foreign markets usually first sellintellectual property rights to their foreign affiliates, who subsequently transact the saleof intellectual property on behalf of the parent firm. Intellectual property holdersprefer to sell this property through foreign affiliates, as it provides property holderswith more effective means of distributing and monitoring the use of their property.
The major U.S. export markets for intellectual property were Japan, the UnitedKingdom, Germany, France, and the Netherlands in 1996 (figure 3-16). Japanremained the largest single export market, accounting for sales of $5.5 billion, whilethe United Kingdom and Germany tied for second, with exports of $2.7 billion . 121

Netherlands
France
Germany
United Kingdom
Japan
0 1000 2000 3000 4000 5000 6000
Exports Trade balanceMillion dollars
Source: U.S. Department of Commerce, Bureau of Economic Analysis, Survey of Current Business, Oct. 1997,p. 119.
Ibid.122
Ibid.123
Ibid.124
3-34
Figure 3-16Figure 3-16Intellectual property-related services: U.S. cross-border exports and trade balance, by majorIntellectual property-related services: U.S. cross-border exports and trade balance, by majortrading partners, 1996trading partners, 1996
Affiliate Transactions, 1991-95
Data on majority-owned affiliate transactions in intellectual property are limited inscope, reflecting sales of motion pictures and television tape and film only. Foreign-based affiliates of major U.S. motion picture studios generated sales of $8 billion in1995 (figure 3-17), primarily in Western Europe. This reflected a 23-percent increasein affiliate sales from 1994, substantially above the 9-percent average annual rate ofincrease during 1991-94. Meanwhile, U.S. purchases of such services from U.S.-basedaffiliates of foreign firms grew by 12 percent to $8.7 billion in 1995 from $7.7 billionin 1994. Consequently, the United States posted a deficit of $610 million on affiliate122
transactions in motion pictures in 1995. This deficit, which continued a pattern thatbegan in 1991 following several foreign acquisitions of large Hollywood studios,narrowed in 1995 due to sharply increased sales of U.S. motion pictures in Japan andmajor European markets, including France and the United Kingdom. The UnitedKingdom continued to provide U.S.-owned affiliates with the largest market for motionpictures, accounting for $1.2 billion in sales in 1995.123
It appears that U.S. affiliates of Canadian and European parent firms continued to bethe largest foreign-owned suppliers of motion pictures to the U.S. market in 1995,accounting for 33 percent and 25 percent of purchases, respectively, by U.S.customers.124

1991 1992 1993 1994 1995-2
0
2
4
6
8
10
12Sales Purchases Balance
Billion dollars
Source: U.S. Department of Commerce, Bureau of Economic Analysis, Survey of Current Business, Sept. 1994,Sept. 1995, Nov. 1996, and Oct. 1997, pp. 137-138.
USDOC, BEA, “U.S. Direct Investment Abroad: Detail for Historical-Cost Position125
and Related Capital and Income Flows, 1996,” Survey of Current Business, Sept. 1997, pp.127-128. For more information, see “U.S. film industry: How mergers and acquisitions are126
reshaping distribution patterns worldwide,” Industry, Trade, and Technology Review,USITC, Jan. 1997.
3-35
Figure 3-17Intellectual property-related services transactions by majority-ownedaffiliates: U.S. sales, purchases, and balance, 1991-95
Summary and Outlook
In 1996, U.S. cross-border exports of intellectual property-related services increasedat a pace slightly below the annual average rate during 1991-95, increasing the tradesurplus on this account to nearly $22.6 billion. In 1995, sales by foreign-based U.S.-owned affiliates increased markedly, and helped to reduce the longstanding deficit onaffiliate transactions from $1.2 billion in 1994 to $610 million in 1995.
The U.S. direct investment position abroad in manufacturing industries will likelycontinue to influence the volume of affiliate sales of intellectual property. In 1996, theU.S. direct investment position abroad increased by 12 percent in the chemicalmanufacturing industry and by 4 percent in the machinery manufacturing industry, bothof which produce goods with high intellectual property content. In addition, several125
events took place in the U.S. audiovisual industry in 1995-96 which could furtherinfluence affiliate sales. In April 1995, Matsushita of Japan sold 80 percent of its stakein Universal Studios to Seagram, a Canadian company. In 1996, a U.S. holdingcompany bought Metro-Goldwyn-Mayer/United Artists (MGM/UA) from CreditLyonnais, a French bank. However, MGM reported a 44-percent decrease in film126
revenues in the year following the purchase, mainly due to a significant drop in the

Metro-Goldwyn-Mayer, Inc., Form S-1, Registration Statement Under The Securities127
Act of 1933, found at Internet address http://www.sec.gov/archive/edgar/, posted Sept. 11,1997, retrieved Oct. 20, 1997. Mary Meeker and Chris DePuy, The Internet Retailing Report, p. 2-6, Morgan128
Stanley, found at Internet address http://www.ms.com/, posted May 28, 1997, retrievedAug. 28, 1997. Motion Picture Association of America, “Congress should ratify the new World129
Intellectual Property Organization (WIPO) copyright treaties without concurrentlyconsidering the issue of OSP (online service provider) liability,” facsimile, June 24, 1997. For further information, see USITC, “Electronic Trade Transforms Delivery of AudiovisualServices,” Industry, Trade and Technology Review, Oct. 1997. For this analysis, cross-border trade data on accounting and management consulting130
services are the sum of such data on accounting, auditing, and bookkeeping services, andmanagement, consulting, and public relations services. Affiliate trade data includeaccounting, research, management, and related services. See USDOC, BEA, Survey ofCurrent Business.
3-36
number of new movie releases. Although the transfer of Universal Studios between127
two foreign entities should not change total U.S. purchases from affiliates of foreignfirms, future trade data will likely show an increase in Canadian affiliates’ sales and adecrease in Japanese affiliates’ sales.
Recent developments in digital technology are also expected to have a significantimpact on trade in audiovisual services. The Internet, which reached 47 million peopleworldwide in 1997, is expected to provide a faster, less expensive, and more reliable128
medium for audiovisual products. The U.S. audiovisual industry is expected to benefitfrom use of this technology. However, the technology also increases the potential forpiracy. To combat piracy, the U.S. audiovisual industry has endorsed WorldIntellectual Property Organization treaties which aim to extend the protection ofintellectual property rights to the digital environment.129
Professional Services
Professional service industries treated in this report include accounting andmanagement consulting; architecture, engineering, and construction; computer and dataprocessing; health care; legal; and maintenance and repair services. Firms in theseindustries provide professional and technical expertise, information, and counsel toindividuals, private-sector businesses, and government institutions.
Accounting and Management Consulting Services
Introduction
Trade data on accounting and management consulting services also include revenuesfor closely related services, such as auditing, bookkeeping, and public relations.130
International trade in accounting and management consulting services takes place onboth a cross-border and an affiliate basis. Affiliate transactions of accounting andmanagement consulting services far exceed cross-border transactions due to the

Typically, there are fewer legal restrictions on servicing clients through affiliates, than131
providing such services across borders. Industry representatives, interviews by USITC staff,Washington, DC, May 1995. Although cross-border export data by individual foreign markets are not available for132
accounting services, the data reported for management consulting services are believed toidentify principal export markets for the combined accounting and management consultingservice industry.
3-37
difficulty of providing such services across borders, and the purported advantage of131
establishing permanent overseas operations in order to better evaluate local marketconditions.
Recent Trends
Cross-Border Trade, 1991-96
Cross-border trade of accounting and management consulting services generated a U.S.surplus of $969 million in 1996, compared to a surplus of just over $1 billion in 1995.U.S. cross-border exports of such services totaled $1.7 billion in 1996, whereasimports totaled $742 million (figure 3-18). U.S. cross-border exports of accountingand management consulting services increased by 3 percent in 1996, slower than the13-percent average annual increase during 1991-95 (despite a decline in 1992). U.S.cross-border imports increased by 15 percent in 1996, only slightly below the 16-percent average annual increase during 1991-95.
Cross-border trade data in management consulting services indicate that Europe132
accounted for 40 percent of U.S. exports in 1996. The United Kingdom was the largestsingle export market for U.S. services, accounting for 10 percent of U.S. cross-bordersales (figure 3-19). European nations were also the predominant suppliers of cross-border imports of management consulting services, accounting for 44 percent of allsuch imports. In 1996, the United Kingdom was also the largest single supplier ofmanagement consulting services to the U.S. market, accounting for 24 percent of U.S.imports.
Affiliate Transactions, 1991-95
In 1995, U.S. affiliate transactions in accounting and management consulting servicesgenerated a trade surplus of $3.4 billion, unchanged from the surplus generated in 1994(figure 3-20). U.S. sales of such services by foreign affiliates of U.S. companiestotaled $6 billion, or 3 percent of total sales of all services by foreign-based affiliatesof U.S. firms. Sales by foreign-based affiliates of U.S. companies rose by 5 percentin 1995, up from the average increase of 3 percent per year during 1991-94 (despite thedecline experienced in 1993). Purchases from U.S.-based affiliates of foreigncompanies totaled $2.7 billion, or 2 percent of total purchases of services from suchaffiliates. Purchases from U.S.-based affiliates of foreign companies rose by 14percent in 1995, substantially slower than the 54-percent average annual rate ofincrease during 1991-94.

1991 1992 1993 1994 1995 19960
500
1000
1500
2000Exports Imports Trade balance
Million dollars
Source: U.S. Department of Commerce, Bureau of Economic Analysis, Survey of Current Business, Oct. 1997, pp. 108-109.
Mexico
Indonesia
Germany
Japan
Saudi Arabia
Canada
United Kingdom
0 20 40 60 80 100 120 140 160
Exports Trade balanceMillion dollars
1 Country-specific trade data are unavailable for accounting services. Data in this figure represent managementconsulting services only, and consequently understate trade volume in the accounting and management consultingindustry overall.
Source: U.S. Department of Commerce, Bureau of Economic Analysis, Survey of Current Business, Oct. 1997,p. 135.
3-38
Figure 3-18Figure 3-18Accounting and management consulting services: U.S. cross-border exports, imports, andAccounting and management consulting services: U.S. cross-border exports, imports, andtrade balance, 1991-96trade balance, 1991-96
Figure 3-19Figure 3-19Accounting and management consulting services: U.S. cross-border exports and trade balance,Accounting and management consulting services: U.S. cross-border exports and trade balance,by major trading partners, 1996by major trading partners, 199611

1991 1992 1993 1994 19950
1000
2000
3000
4000
5000
6000
7000Sales Purchases Balance
Million dollars
Source: U.S. Department of Commerce, Bureau of Economic Analysis, Survey of Current Business, Sept. 1994,Sept. 1995, Nov. 1996, and Oct. 1997, pp. 137-138.
Estimated by USITC staff and based on data for North American management133
consulting revenue provided by Consultants News, Kennedy Information Publications,Fitzwilliam, NH. The Big Six accounting firms (Arthur Andersen, Ernst & Young, Deloitte & Touche,134
KPMG Peat Marwick, Coopers & Lybrand, and Price Waterhouse) were responsible for 83percent of revenue generated by the largest 100 U.S. tax and accounting firms in 1996. RickTelberg, “Accounting Today’s Top 100 Tax and Accounting Firms,” Accounting Today,Mar. 17-Apr. 6, 1997, pp. 22-34.
3-39
Figure 3-20Figure 3-20Accounting and management consulting service transactions by majority-owned affiliates: U.S.Accounting and management consulting service transactions by majority-owned affiliates: U.S.sales, purchases, and balance, 1991-95sales, purchases, and balance, 1991-95
European nations were the largest foreign markets for accounting and managementconsulting services provided through foreign-based affiliates of U.S. companies,absorbing 66 percent of sales. The United Kingdom was the largest single foreignmarket for these services, accounting for 21 percent of U.S.-owned affiliate sales,which amounted to $1.2 billion (figure 3-21). Similarly, U.S. purchases of accountingand management consulting services from U.S.-based affiliates of foreign companieswere dominated by European firms, which accounted for 87 percent of such purchasesin 1995. Affiliates with corporate parents in the United Kingdom supplied 57 percentof U.S. purchases.
Summary and Outlook
U.S. accounting and management consulting firms are highly competitive in worldmarkets. In 1996, U.S. accounting and management consulting firms accounted for anestimated 60 percent of the global industry’s worldwide revenue. Total revenue at133
the 100 leading U.S. firms stood at $21.2 billion, having risen by 14 percent in 1996.134
The strength of the U.S. industry is due largely to its expertise in certain market sectors,such as corporate restructuring and information technology management. Thisexpertise has resulted in large trade surpluses, especially on an affiliate basis. U.S.

Japan
France
Canada
Germany
United Kingdom
-500 0 500 1000 1500
Sales BalanceMillion dollars
Source: U.S. Department of Commerce, Bureau of Economic Analysis, Survey of Current Business, Oct. 1997, pp. 137-138.
Jim Kelly, “Accountants Plan Global Merger,” Financial Times, Sept. 19, 1997, p. 1.135
Tony Jackson, “The Growth of Monsters,” Financial Times, Sept. 22, 1997, p. 17.136
3-40
Figure 3-21Accounting and management consulting service transactions by majority-owned affiliates: U.S. sales and balance, by major trading partners, 1995
exports of accounting and management consulting services are presently concentratedin Western European nations, although growing markets for these services includeAsia, Eastern Europe, and Latin America.
U.S. firms’ competitive position in accounting and management consulting servicesalso stems from the global expansion and influence of their U.S. multinational clientfirms. As clients expand geographically, they typically continue to use the sameaccounting or consulting firms that they use in their home market. To maintainbusiness relationships which began in the home market, accounting and managementconsulting firms have followed their clients overseas, largely through mergers andacquisitions. In September 1997, two of the Big Six firms, Coopers Lybrand and PriceWaterhouse, announced plans to merge operations. According to industryrepresentatives, the proposed merger was undertaken to expand the firms’ globalcoverage. By uniting Coopers’ strong presence in Europe with Price Waterhouse’spresence in Asia and South America, the new entity would be better able to provideintegrated multinational business services across many regions and business cultures.135
The merger would also reportedly combine Coopers’ strengths in business strategy andhuman resource consulting with Price Waterhouse’s strengths in the implementationof packaged software and global information technology. 136
For many large U.S. accounting firms, management consulting has displacedaccounting and accounting-related activities (e.g., auditing and tax services) as theprincipal engine for revenue growth. At the 100 leading U.S. firms, managementconsulting and other management services represented the largest single source of totalrevenue ($8.3 billion, or 39 percent) and the business area with the highest annualgrowth (24 percent) in 1996. By comparison, accounting and auditing generated

“Management Consultancy: The Advice Business,” Survey of Management137
Consultancy, The Economist, Mar. 22, 1997, p. 3. Rick Telberg, “Accounting Today’s Top 100 Tax and Accounting Firms,” Accounting138
Today, Mar. 17-Apr. 6, 1997, pp. 22-34. Robert W. Scott, “CPA Firms are not Just for Accounting Anymore,” Accounting Today, 139
Mar. 17-Apr. 6, 1997, p. 24. Ibid.140
3-41
$7.9 billion and grew by 6 percent, while tax services provided $5 billion and increasedby 12 percent. The relatively faster rate of growth in management consulting serviceshas also been evident among the Big Six firms, for which revenue derived frommanagement consulting grew at an annual rate of nearly 20 percent over the pastdecade, exceeding single-digit annual growth rates for accounting-related activities.137
Among these largest firms, revenue from management consulting activities accountedfor 43 percent of total revenue in 1996, whereas accounting-related activitiesrepresented 38 percent. There are several reasons for more rapid growth in138
management consulting revenue:
C Corporate Outsourcing and the Pressures on Accounting FeeIncome.—Many corporations now focus managerial resources ontheir core business, while contracting with management consultantsto oversee auxiliary activities, such as information technology andpersonnel management. Typically, these specialty functions are not139
competitively bid and, consequently, profit margins are higher thanfor accounting functions, where contracts generally are awarded on acompetitive-fee basis. At the same time, downward pressure on140
accounting fee income has occurred in two ways. Large firms thatonce employed external accounting firms are now managing more oftheir accounting functions, such as auditing. In addition, becauseaccounting services provided by one firm are similar to servicesprovided by a competitor, firms have had difficulty in raising theiraccounting fees on the basis of product differentiation. However, inmanagement consulting, individual firms have been able todifferentiate their services, and raise fee income, by specializing inparticular market niches.
C Corporate Expansion and Restructuring.—Many U.S. corporationshave begun to shift from restructuring their companies and cuttingoperating costs to expanding their businesses. This shift has requiredmanagement and planning skills that firms often lack after a decadefocused on reducing costs. Increasingly, consultants are being askedto develop strategic plans for expanding these businesses. Incontrast, a significant number of European corporations are presentlybeginning to close inefficient facilities and reduce employment,echoing U.S. corporate practice of the last decade and creating a nichefor U.S. consultants to market the cost-reduction skills that theygained during this recent period.

141
Despite the increasing globalization of the accounting and management consulting industry,foreign revenue, as a percentage of worldwide revenue, declined at Big Six firms from 63percent in 1992 to 60 percent in 1996. This was the first period in nearly a decade that U.S.revenue growth exceeded foreign growth and was largely the result of more robust economicgrowth in the United States. Bowman’s Accounting Report, Dec. 1996, p. 9. Architectural services also include preliminary site study, schematic design, design142
development, final design, contract administration, and post-construction services. Engineering services also include undertaking preparatory technical feasibility studies143
and project impact studies; preparing preliminary and final plans, specifications, and costestimates; and delivering various services during the construction phase.
3-42
C Corporate Globalization and Privatization.—Strategies prepared byglobal management consulting firms have been critical elements in theexpansion of private economic activity into markets having littleprivate sector tradition, such as Eastern Europe and China. At thesame time, a wave of privatization of formerly government-ownedenterprises, either in formerly socialist economies or in marketeconomies, has created a need for new corporate strategies, preparedby management consultants, to allow these firms to compete withinnew, more competitive, business environments.141
Continued strong growth is anticipated during the next decade, with growth in revenueand profit derived from management consulting expected to exceed that derived fromaccounting. Growth will likely be driven by strong global economic growth, the spreadof free markets, continued privatization of formerly government-owned companies, andcorporate expansion into rapidly growing developing markets. These global economicforces are expected to engender strong growth in U.S. exports of accounting andmanagement consulting services, given the present dominance of U.S. multinationalfirms in such key areas as corporate restructuring and information technology. Animportant element in this growth may be the progress achieved by the Working Partyon Professional Services (WPPS), functioning under the umbrella of the World TradeOrganization (WTO). The WPPS is working toward a multilateral understanding onrules and principles applicable to the accounting sector. These would take the form oflegally binding obligations under the GATS in such areas as transparency, licensingrequirements and procedures, qualification requirements and procedures, and technicalstandards. Thus far, the WPPS has agreed to a set of nonbinding guidelines for mutualrecognition agreements in accounting.
Architectural, Engineering, and Construction Services
Introduction
Architectural, engineering, and construction (AEC) services comprise interrelatedservice activities. Architectural firms provide blueprint designs for buildings andpublic works and may oversee the construction of projects. Engineering firms142
provide planning, design, construction, and management services for projects such ascivil engineering works and residential, commercial, industrial, and institutionalbuildings. Construction services include pre-erection work; new construction and143
repair; and alteration, restoration, and maintenance work. Such services may beprovided by general contractors, who complete all construction work for those

BEA data on transactions between majority-owned affiliates of U.S. AEC firms and144
nonaffiliated firms are limited, in order to avoid disclosing confidential, proprietaryinformation pertaining to individual firms. Nevertheless, in 1995, BEA estimated that salesof engineering, architectural, and surveying services solely by European affiliates of U.S.parents amounted to $5.2 billion surpassing U.S. cross-border exports to all foreign marketscombined, which totaled $2.8 billion in the same year. USDOC, BEA, Survey of CurrentBusiness, Oct. 1997, pp. 108 and 137. Data pertaining to cross-border trade in architectural, engineering, and construction145
services reflect certain limitations. Data on U.S. exports are reported on a net basis (i.e.,U.S. contractors’ expenditures on merchandise and labor are excluded), whereas data onU.S. imports are reported on a gross basis. As a result, the U.S. surplus on the architectural,engineering, and construction services account is understated. In addition, data pertaining toarchitectural, engineering, and construction services also reflect trade in mining andsurveying services, which inflates estimated trade volumes.
3-43
awarding the contract, or specialty subcontractors who perform discrete sections of theconstruction.
Trade in architectural, engineering, and construction services is predominantlyundertaken by affiliates in foreign markets. U.S. firms that engage in international144
trade in architectural, engineering, and construction services generally establish sometype of subsidiary, joint venture, or representative office in important foreign marketsas local presence is often a determining factor in contract awards. Cross-border tradein AEC services is generally limited to transporting items such as blueprints anddesigns via mail, telecommunication networks, or other means across nationalboundaries.
Recent Trends in Cross-Border Trade, 1991-96
In 1996, U.S. exports of architectural, engineering, and construction services measured$3 billion, an increase of 5 percent from 1995 (figure 3-22). This growth rate wassubstantially slower than the 18-percent average annual growth rate recorded during1991-95. By contrast, U.S. cross-border imports of AEC services rose by 44 percent145
to $489 million in 1996. This rate of increase was significantly higher than the 2-percent average annual growth rate in 1991-95 (despite declines experienced in 1992and 1994), reflecting the record performance of the U.S. construction market in 1996.The resulting $2.5-billion surplus in cross-border AEC services trade remainedunchanged from 1995, in sharp contrast to the 21-percent average annual growth rateof the surplus during 1991-95. This surplus represented 3 percent of the total U.S.cross-border services trade surplus in 1996.
Asia-Pacific nations remained the largest export markets for U.S. cross-borderarchitectural, engineering, and construction services in 1996, although exports of suchservices to the region declined by 2 percent (figure 3-23). Exports to Indonesia andChina continued to lead all other markets, despite falling 5 percent and 19 percent,respectively. Exports to Malaysia rose more rapidly than those to any major partnerboth by proportion and value (334 percent), placing Malaysia among the leadingmarkets for U.S. exports of AEC services for the first time during 1991-96. Malaysiahas undertaken numerous infrastructure and commercial projects in anticipation of theCommonwealth Games in 1998, and U.S. firms are involved in major works such asthe Petronas Twin Towers and LRT transport system. Exports to Japan grew by 70percent, which may reflect both an acceleration of activity in the construction and

1991 1992 1993 1994 1995 19960
500
1000
1500
2000
2500
3000
3500Exports Imports Trade balance
Million dollars
1 Data on U.S. exports are reported on a net basis (i.e., U.S. contractors’ expenditures onmerchandise and labor are excluded), whereas data on U.S. imports are reported on a gross basis. Inaddition, data pertaining to architectural, engineering, and construction services also reflect trade inmining and surveying services.
Source: U.S. Department of Commerce, Bureau of Economic Analysis, Survey of Current Business,Oct. 1997, pp. 108-109.
Malaysia
Thailand
Japan
China
Indonesia
0 50 100 150 200 250 300
Exports Trade balanceMillion dollars
1 Data on U.S. exports are reported on a net basis (i.e., U.S. contractors’ expenditures onmerchandise and labor are excluded), whereas data on U.S. imports are reported on a gross basis. Inaddition, data pertaining to architectural, engineering, and construction services also reflect trade inmining and surveying services.
Source: U.S. Department of Commerce, Bureau of Economic Analysis, Survey of Current Business,Oct. 1997, p. 135.
3-44
Figure 3-22Figure 3-22Architectural, engineering, and construction services:Architectural, engineering, and construction services: U.S. cross-border exports, imports, and U.S. cross-border exports, imports, and1 1
trade balance, 1991-96trade balance, 1991-96
Figure 3-23Figure 3-23Architectural, engineering, and construction services:Architectural, engineering, and construction services: U.S. cross-border exports and trade U.S. cross-border exports and trade11
balance, by major trading partners, 1996balance, by major trading partners, 1996

“American Look Producing Work,” Engineering News-Record, Dec. 2, 1996, p. 20,146
and USDOC, ITA, National Trade Data Bank, “Japan—Action Plan Construction Projects,”Stat-USA Database, found at Internet address http://www.stat-usa.gov/, posted July 1, 1997,retrieved Nov. 18, 1997. USDOC, ITA, National Trade Data Bank, “Korea—Architectural Services,” Stat-147
USA Database, found at Internet address http://www.stat-usa.gov/, posted Jan. 1, 1996,retrieved Dec. 10, 1997; and industry representative, interview by USITC staff, Seoul, Jan.27, 1997. While recent data on the investment activities of U.S. architectural, engineering, and148
construction firms are not available, figures pertaining to total U.S. direct investment abroadin service industries as a whole show a 57-percent increase in investment in Korea between1995-96. USDOC, BEA, Survey of Current Business, July 1997, p. 36. U.S. firms are most active in the markets of Europe, Asia, and the Middle East with149
international revenues of approximately $6.6 billion, $5.5 billion, $4.2 billion, respectively.“The Top 400 Contractors,” Engineering News-Record, May 26, 1997, pp. 54 and 64. “The Top 400 Contractors,” Engineering News-Record, May 26, 1997, p. 101, and150
“The Top 400 Contractors,” Engineering News-Record, May 20, 1996, p. 87. USDOC, ITA, National Trade Data Bank, “Indonesia-Construction Industry Trends,”151
Stat-USA Database, found at Internet address http://www.stat-usa.gov/, posted Aug. 20,1997, retrieved Oct. 15, 1997.
3-45
design services market and a realization of the expected benefits of Japan’s “ActionPlan on Reform of the Bidding and Contracting Procedures for Public Works,”promulgated in 1994 to increase transparency and foreign access to Japan’s publicworks industry. By contrast, exports to Korea fell sharply, by 46 percent, to the146
lowest level since 1993. Given that the Korean construction market and relateddemand for U.S. technical design expertise have grown steadily, the decline in cross-147
border exports may reflect increased sales of architectural, engineering, andconstruction services by U.S. affiliates, as Korea fully opened its construction market148
to wholly-owned foreign commercial enterprises on January 1, 1996. Based onavailable data, Canada and the United Kingdom remained the top suppliers of U.S.cross-border imports of AEC services in 1996, followed by Australia and Indonesia.
Summary and Outlook
U.S. architectural, engineering, and construction firms are highly competitive andmaintain a strong presence in the global marketplace. Data pertaining to the totalvalue of contracts secured by AEC enterprises indicate that in 1996 U.S. firms’ totalforeign billings grew by nearly 20 percent to $23.8 billion, and 5 of the top 10 U.S.contractors received over 50 percent of their revenues from international work. In149
addition, between 1995 and 1996, the number of U.S. contractors operating in overseasmarkets grew to 616 firms, an increase of 10 percent. Growth in developing nations,150
U.S. firms’ established record overseas, and the high level of demand for U.S.engineering, design, and technical skills are among the factors contributing to continuedU.S. strength in international trade in architectural, engineering, and constructionservices.
U.S. firms face dynamic opportunities in the global market for AEC services. In someinstances, restrictions on the participation of non-domestic firms in foreign constructionmarkets are being lifted. For example, in 1996 Indonesia revoked the regulation whichbanned foreign contractors from operating without a local partner in Indonesia. In151
early 1997, India announced automatic approval for joint ventures with up to 74-

“Indian Government Plans to Deepen Economic Reforms,” Comtex Scientific Corp.,152
received by NewsEDGE/Lan, Jan. 15, 1997. “The Top 225 International Contractors,” Engineering News-Record, Aug. 25, 1997,153
p. 38. Industry representatives, interviews by USITC staff, Kuala Lumpur, Malaysia and154
Jakarta, Indonesia, Feb. 19-21, 1997. USDOC, ITA, National Trade Data Bank, “China-Construction & Engineering155
Services,” Stat-USA Database, found at Internet address http://www.stat-usa.gov/, postedJuly 1, 1997, retrieved Oct. 15, 1997. “Hopewell Warns on Rising Costs of Bangkok Project,” Financial Times Limited,156
found at Internet address http://www.newsedge/, posted and retrieved July 21, 1997, and“The Top 225 International Contractors,” Engineering News-Record, Aug. 25, 1997, p. 40. U.S. Department of State telegrams, No. 5699, “Indonesia Announces Project Delays157
in Effort to Improve Current Account Deficit,” prepared by U.S. Embassy, Jakarta, Sept. 26,1997, and No. 5706, “Indonesian Power Projects Facing Review,” Sept. 26, 1997.
3-46
percent foreign equity in the field of construction in response to that nation’s extensivebuilding needs. In addition, the AEC services industry has seen progress on mutual152
recognition agreements and multinational accords that will make it easier for U.S.architects and engineers to operate in foreign countries with their U.S.-basedcredentials. Increased global foreign direct investment flows benefit U.S. contractors153
as well, as international corporations tend to hire experienced multinational firms todesign and construct their overseas operations. Finally, the tradition of financing frominternational institutions such as the World Bank ensures that large scale developmentprojects are subject to nondiscriminatory international bidding procedures, a concernfor international contractors who find that preferential treatment and local influence areoften determinants in public procurement.154
U.S. AEC firms confront myriad challenges as well, including persistent restrictions onmarket access and commercial presence in many nations. Several countries continueto limit foreign equity participation in joint ventures to less than 50 percent, leavingforeign partners with limited control over such enterprises. China in particular, withprojections of 10- to 13-percent growth in the construction industry for the next 3 to5 years, has designated the construction sector a “pillar industry” in the hopes ofbuilding up national firms’ strengths in this sector. For purposes of technologytransfer, foreign providers of AEC services are required to establish joint ventures withChinese partners, and foreign firms are permitted to bid only on a small percentage ofChina’s numerous construction projects. Currency fluctuations and financial policies155
also concern U.S. firms seeking international tender. For example, the devaluation ofthe Thai baht caused construction costs to rise for certain companies operating inThailand and spurred subsequent currency depreciations and reduced bank lending insome neighboring nations. Such financial disturbances, coupled with certain foreign156
governments’ contractionary fiscal policies, have led to the postponement or delay ofprojects, as in Indonesia, where a number of national infrastructure projects, severalwith U.S. participation, were put on hold to reduce Indonesia’s current accountdeficit. 157
A new trend in the AEC services industry involves competitive financing, as AEC firmsare discovering that to procure work, a company must first secure the necessary capitalto bring projects to fruition. An increasing number of firms have turned to the buildoperate transfer (BOT) method of finance as a competitive tool in international bidding.Under such arrangements, a developer builds and operates a project long enough to

“Zimbabwe Construction Boom Expected,” Comtex Scientific Corp., found at Internet158
address http://www.newsedge/, posted Sept. 11, 1997, retrieved Sept. 16, 1997, and“Turkey Power Plant Go-ahead,” Financial Times Limited, found at Internet addresshttp://www.newsedge/, posted July 21, 1997, retrieved July 24, 1997. “Reform in China,” Infrastructure Finance, May 1997, p. 93, and “China: Domestic159
Digest,” Chamber World Network, found at Internet address http://www.newsedge/, postedSept. 8, 1997, retrieved Sept. 10, 1997. “BE&K and Bechtel Team Up to Hunt International Jobs,” Engineering News-160
Record, Feb. 10, 1997, p. 7, and “The Top 400 Contractors,” Engineering News-Record,May 26, 1997, p. 104. “Chinese Start Full-Scale Repair of Nigerian Railway,” Comtex Scientific Corp.,161
found at Internet address http://www.newsedge/, posted June 26, 1997, retrieved June 27,1997, and “Li Peng’s Visit Spotlights Burgeoning Sino-Nigerian Friendship,” ComtexScientific Corporation, received by NewsEDGE/Lan, May 10, 1997. “Chinese, Argentine Firms Sign Agreements,” Comtex Scientific Corp., received by162
NewsEDGE/Lan, May 16, 1997. “Consortium to Help Rebuild Bosnia,” New Straits Times Press, Chamber World163
Network, found at Internet address http://www.newsedge/, posted Aug. 13, 1997, retrievedAug. 14, 1997. USDOC, ITA, National Trade Data Base, “China-Construction & Engineering164
Services,” Stat-USA Database, found at Internet address http://www.stat-usa.gov/, postedJuly 1, 1997, retrieved Oct. 15, 1997.
3-47
regain construction costs and turn a profit before transferring the operation to stateownership. For developing nations such as Zimbabwe, whose government recentlyannounced that it will increase the number of BOT projects, and Turkey, wherelegislation was passed to encourage the use of BOT financing, such arrangements helpto attract the necessary private funds for infrastructure projects. BOT funding,158
already established in many Asian countries, is in the early stages in China, whichbegan construction of its first BOT-funded project in September 1997. An159
additional example of building financial strength to generate projects is seen in theformation of a global energy infrastructure fund by Bechtel Inc. and M.W. Kellogg,along with two other major investors. Each participant will contribute $200 million tothe fund, which is expected to grow to $1 billion in assets for investment in energy,petrochemical, and related infrastructure projects in Asia and Latin America.160
Competition in the global AEC services industry is fierce, with the emergence of newsources of competition from developing nations eager to extend their domesticexperience to the international level. China, for example, has found success in Africa,having procured the $526-million rehabilitation project for the Nigerian railway, inaddition to participation in that country’s housing sector. China has also signed161
letters of intent for the construction of industrial plants in Argentina. Malaysian162
firms, in addition to forming partnerships in South Africa and the Middle East, havecreated a 12-member consortium to take part in rebuilding Bosnia-Herzegovina.163
Similarly, Indonesian and Brazilian firms are active in providing AEC services inneighboring countries. It is in the home markets, however, where locally-owned firmspose a far greater challenge to U.S. service providers. In China, 11,000 local designfirms and over 94,000 experienced construction enterprises compete against U.S. andother non-Chinese interests, which are allowed access to a limited number ofinternationally funded projects or projects for which the domestic industry lackstechnology, experience, or personnel. In Indonesia, Malaysia, and Thailand, U.S.164
firms find that local companies often have the upper hand in winning large contracts

Industry representatives, interviews by USITC staff, Malaysia, Indonesia, and165
Singapore, Feb. 19-21, and Feb. 24, 1997. Ibid.; “Architects or Growth,” Export Today, Mar. 1997, pp. 62-65; and USDOC,166
ITA, National Trade Data Base, “China-Construction & Engineering Services,” Stat-USADatabase, found at Internet address http://www.stat-usa.gov/, posted July 1, 1997, retrievedOct. 15, 1997. “Germany Predicts Construction Upturn,” International Construction, Aug. 1997, p.167
45. Industry representative, interview with USITC staff, Jakarta, Indonesia, Feb. 20, 1997,168
and USDOC, ITA, National Trade Data Base, “China-Construction & EngineeringServices,” Stat-USA Database, found at Internet address http://www.stat-usa.gov/, postedJuly 1, 1997, retrieved Oct. 15, 1997. “The Top 225 International Contractors,” Engineering News-Record, Aug. 25, 1997,169
pp. 38-39. “U.S. Market Dips, Global Grows,” Engineering News-Record, Apr. 14, 1997, p. 32.170
USDOC, ITA, National Trade Data Base, “China-Construction & Engineering171
Services,” Stat-USA Database, found at Internet address http://www.stat-usa.gov/, postedJuly 1, 1997, retrieved Oct. 15, 1997; “China: More Foreign Capital Used to Speed UpHighway Construction,” Beijing Review, Chamber World Network, found at Internet addresshttp://www.newsedge/, posted July 22, 1997, retrieved July 24, 1997; and “AirportConstruction Flies High Worldwide,” Engineering News-Record, p. H-23.
3-48
and public works. However, U.S. firms enjoy an excellent reputation in these165
markets and large U.S. enterprises such as Bechtel, Fluor Daniel, Brown & Root, andBlack & Veatch have captured a substantial share of the available market. 166
As in the past, U.S. service providers can expect the strongest competition fromEurope, especially Germany, whose construction market, where one-third of totalEuropean construction occurs, has been in a persistent recession. In Asia, U.S.167
providers of architectural, engineering, and construction services face an increasingcompetitive challenge from Japanese and Korean firms who enjoy the advantages ofproximity and familiarity with the local business environment. In 1996, international168
billings in Asia totaled $42.5 billion. Of this figure, Japan captured 40 percent or $17billion in contracting revenues, followed by the United States and Korea with 13percent or $5.5 billion, and 10 percent or $4.1 billion, respectively. Japan has also169
demonstrated the ability to provide substantial loans and aid to Asian nations includingthe Philippines, Indonesia, and Thailand through agents such as the Overseas EconomicCooperation Fund (OECF) and private banks. Japanese engineering firms andcontractors have participated in many of the infrastructure projects funded by theseagencies.
Despite the challenges faced by architectural, engineering, and construction firmsabroad, the massive power, infrastructure, and industrial demands of developingnations present U.S. firms with a wealth of export potential. Asia, traditionally thelargest foreign market for AEC services, demonstrates the greatest need particularly inthe power sector as the Asia-Pacific region is expected to add more than 1.5 millionmegawatts in capacity by 2020. China, Indonesia, and Malaysia require an170
estimated $1 trillion in infrastructure, and China alone has indicated plans for theconstruction of 200 new airports, 230 new cities, 110,000 km of highways, and anannual $25 billion in housing by 2000. At present, however, U.S. design and171
construction firms face an immediate challenge with Asia’s recent economic crisis.Currency devaluations have led to a drop in selective Asian economies’ construction

Gary Tulacz, “Construction Firms Squeezed by Asian Economic Meltdown,”172
Engineering-News Record, Oct. 20, 1997, p. 16, and Don Lee, “Asia’s Economic CrisisExpected to Curb State Growth,” Los Angeles Times, Dec. 17, 1997, p. A36. “Some Big Projects Continue Skyward in Thai Capital,” Knight-Ridder/Tribune173
Business News, found at Internet address http://www.newsedge.co, posted Jan. 25, 1998,retrieved Feb. 2, 1998. Tulacz, “Construction Firms Squeezed,” p. 16.174
“Impact of the Economic Downturn on Major Projects in Korea,” U.S. Department of175
State, unclassified cable 000329, Seoul, Korea, Jan. 1998. “Bumpy Start for Market Giant,” Engineering News-Record, Dec. 15, 1997, p. 32.176
“Bechtel Opens up Office at Sao Paulo,” Comtex Scientific Corporation, received by177
NewsEDGE/Lan, Apr. 23, 1997. “South America: Inflation Scourge Cured,” Engineering News-Record, Dec. 22, 1997,178
pp. 44-45; and “It’s High-Level Growth for Chile,” Engineering News-Record, Dec. 15,1997, pp. 26-29. “The Top 400 Contractors,” Engineering News-Record, May 26, 1997, p. 104.179
“European Upturn Predicted,” International Construction, Aug. 1997, p. 6, and180
“Germany Revs Up Loan Activity,” Engineering News-Record, Mar. 31, 1997, p. 9.
3-49
lending and increased prices of imported building materials and other inputs. Moreimportant, the Asian economies hit hardest by the crisis, including Thailand, Indonesia,and Korea, have been forced to postpone or cancel significant public works projects,some with U.S. participation, and U.S. firms anticipate future delays in many Asianinfrastructure projects. At the same time, projects with foreign funding are172
proceeding, and many firms are optimistic that in the next 1 to 3 years many of the173
canceled projects will resurface as the region’s financial difficulties subside. In174
addition, weakened Asian AEC firms may seek foreign partners for financial andtechnical assistance, thus giving U.S. firms an expanded opportunity to participate175
in future overseas projects.
The Latin American region has drawn renewed interest from U.S. design andconstruction firms. Bechtel, for example, hopes to increase its Latin Americanbusiness from 7 percent to 25 percent of revenues, and has established a new office176
in Sao Paulo with the intent of making Brazil its largest market in Latin America.177
Other U.S.-based AEC firms have won power and industrial contracts in the region andsee further opportunities, particularly in Argentina, Brazil, and Chile. With respect178
to Europe, the size of the total market means that even a low percentage of overallgrowth translates into several new projects. The European construction industry is179
expected to grow by 1.5 percent in 1998, with best opportunities in the private andnon-residential markets. In addition, Germany plans to boost economic activity withnearly $15 billion in subsidized loans available for infrastructure-related constructionwork. In short, U.S. architectural, engineering, and construction firms face180
promising opportunities in most overseas markets, and the level of U.S. exports ofAEC services should continue to rise. This, in conjunction with the tradition ofrelatively low imports and expectations of slow growth in the U.S. construction marketin the ensuing years, should perpetuate the favorable U.S. balance of trade in AECservices.

Data pertaining to computer leasing do not reflect financing fees.181
This service category excludes prepackaged software shipped to or from the United182
States and included in U.S. merchandise trade statistics. USDOC, BEA, Instructions to BE-22 Survey, OMB form No. 0608-0060, July 20, 1995. IT services involve a broad scope of activities related to the design, installation, and183
operation of business information, computer, and communications systems. Computer and data processing services are well suited for cross-border trade as184
network transmission is often an integral part of their design and implementation. As globalnetworks continue to improve, telecommunication traffic is increasingly distance-insensitive,meaning that a deliverable may be transmitted across the Atlantic as easily as across theoffice. Systems integration comprises the development, operation, training, and maintenance185
of seamless companywide computer networks. Tasks are wide-ranging and involve allphases of systems design, including planning, coordinating, testing, and scheduling ofprojects; analysis and recommendation of hardware and software; system installation;software customization; and end-user training. Outsourcing describes the practice of contracting out internal functions, ranging from186
low-skill services such as data entry to more important functions such as managing acompany’s telecommunication and computer networks. Custom programmers create or modify software to perform tasks that are unique to187
client companies.
3-50
Computer and Data Processing Services
Introduction
Computer and data processing services include computer systems analysis, design, andengineering; custom software and programming services; rights to use, reproduce, ordistribute customized and prepackaged computer software, including master copies andelectronically transmitted software; computer leasing; systems integration services;181
data entry, processing, and tabulation; and other computer-related services such ascomputer timesharing, maintenance, and repair.182
In 1996, the U.S. computer and data processing industry experienced continued revenuegrowth, aided by a steadily expanding domestic economy and a growing internationalmarket for services relating to information technology (IT). U.S. firms sell computer183
and data processing services in foreign markets primarily through foreign-basedaffiliates. However, cross-border trade is increasing as advances in electronictransmission technologies enable firms to provide computer and data processingservices from remote locations. Computer and data processing services most often184
delivered to foreign clients include systems integration, outsourcing, and custom185 186
programming.187
Recent Trends
Cross-Border Trade, 1991-96
U.S. cross-border trade in computer and data processing services reversed direction andrecorded declines in both exports and imports in 1996. U.S. exports decreased byapproximately 2 percent to $3.1 billion, well below the 17-percent average annualgrowth rate experienced during 1991-95 (figure 3-24). A slow fourth quarter 1996 for

1991 1992 1993 1994 1995 19960
500
1000
1500
2000
2500
3000
3500
4000Exports Imports Trade balance
Million dollars
Source: U.S. Department of Commerce, Bureau of Economic Analysis, Survey of Current Business, Oct. 1997, pp. 108-109.
EDS is reportedly the largest company listed under SIC 7374 (data processing and188
preparation), having revenue of approximately $12 billion in 1996. Second largest is FirstData Corp. with 1996 revenues of $4.2 billion. Automatic Data Processing Inc. (ADP)ranks third in this listing, with revenue totaling $3.6 billion. Computer Sciences Corp.(CSC) is the largest vendor listed under SIC 7373 (computer integrated systems design),with about $4 billion in revenue in 1996. Wards Business Directory of U.S. Private andPublic Companies — Vol. 5: Ranked by Sales within 4-digit SIC (Detroit, MI: GaleResearch, 1997), pp. 907 and 912. Electronic Data Systems Corp., Form 10-K: Annual Report, filed Mar. 6, 1997, found189
at Internet address http://www.sec.gov/, retrieved Nov. 6, 1997.
3-51
Electronic Data Systems (EDS), a leading provider of computer and data processingservices, may have contributed to the overall decline in U.S. exports. U.S. imports188 189
fell by 21 percent to $334 million, sharply below the 38-percent average annualincrease during 1991-95 (despite the decline experienced in 1994). The steeper rateof decline in imports relative to exports in 1996 produced a slight 1-percent increasein the computer and data processing services trade surplus. This was significantlyslower than the 14-percent average annual growth rate seen during 1991-95.
With regard to computer and data processing services, Japan, the United Kingdom,Canada, and Germany were the leading cross-border trading partners of the UnitedStates in 1996 (figure 3-25). Exports to these four countries accounted for 46 percentof total U.S. exports of computer and data processing services. Japan, the largestmarket for such services, accounted for 16 percent of U.S. exports. Available datasuggest that Japan, the United Kingdom, Canada, and Germany were also thepredominant suppliers of computer and data processing services to the United Statesin 1996. These trade patterns are very similar to those experienced in 1995, when thefour economies accounted for more than one-third of U.S. imports.
Figure 3-24Figure 3-24Computer and data processing services: U.S. cross-border exports, imports, and tradeComputer and data processing services: U.S. cross-border exports, imports, and tradebalance, 1991-96balance, 1991-96

Exports Trade balance
Taiwan
Germany
Canada
United Kingdom
Japan
0 100 200 300 400 500
Million dollars
Source: U.S. Department of Commerce, Bureau of Economic Analysis, Survey of Current Business, Oct. 1997, p. 135.
Bruce Caldwell and Marianne K. McGee, “Surge In Services -- Year 2000, Labor190
Shortages, and Profitability Goals Drive Services Demand,” InformationWeek, Jan. 5, 1998,Issue: 663, found at Internet address http://www.techweb.com/, retrieved Jan. 7, 1998. To avoid disclosing the operations of individual companies, BEA suppressed much of191
the country-specific data regarding affiliate transactions.
3-52
Figure 3-25Figure 3-25Computer and data processing services: U.S. cross-border exports and trade balance, byComputer and data processing services: U.S. cross-border exports and trade balance, bymajor trading partners, 1996major trading partners, 1996
Affiliate Transactions, 1991-95
In 1995, U.S. sales of computer and data processing services through foreign-basedaffiliates totaled $22.7 billion, accounting for 12 percent of total U.S. sales throughforeign affiliates. U.S. sales rose by 21 percent, slightly below the 24-percent averageannual growth rate during 1991-94 (figure 3-26). U.S. purchases of such services fromU.S.-based affiliates of foreign firms increased by 11 percent, to $3.5 billion. During1991-94, U.S. purchases had increased much faster, at an average annual growth rateof 22 percent. Yet, U.S. demand for certain computer services was strong enough tolure vendors based overseas, such as Cap Gemini, Logica, Origin, and Sema, toestablish additional operations in the U.S. market. As the growth rate of U.S. sales190
of computer and data processing services nearly doubled that of purchases in 1995, theU.S. surplus on affiliate transactions continued to widen, reaching $19.2 billion. Datalimitations preclude a meaningful discussion of country-specific affiliate activity.191
U.S. firms believe that the European market is set for expansion and have increasinglydevoted resources to tap the market. Overall, the investments have paid off, due in partto a strong demand for outsourcing and systems integration — two service segments

1991 1992 1993 1994 19950
5
10
15
20
25
30Sales Purchases Balance
Billion dollars
Source: U.S. Department of Commerce, Bureau of Economic Analysis, Survey of Current Business, Sept. 1994,Sept. 1995, Nov. 1996, and Oct. 1997, pp. 137-138.
In 1996, outsourcing services and systems integration services grew across Europe by192
22 and 13 percent, respectively, out pacing growth registered by sales of software andrelated computer-based products. Douglas Hayward, “Euro Service Sales Boom, SoftwareLags,” TechWire, Mar. 3, 1997, found at Internet address http://www.techwire.com/,retrieved Nov. 20, 1997. Revenue derived from the U.S. Federal Government is excluded.193
Computer Sciences Corp., Form 10-K/A: Annual Report, filed June 26, 1997, found194
at Internet address http://www.sec.gov/, retrieved Nov. 6, 1997. 1996 EDS Annual Report.195
3-53
Figure 3-26Figure 3-26Computer and data processing services transactions by majority-owned affiliates: U.S. sales,Computer and data processing services transactions by majority-owned affiliates: U.S. sales,purchases, and balance, 1991-95purchases, and balance, 1991-95
dominated by the U.S. industry. In fiscal years 1995 and 1996, CSC’s U.S.192
commercial revenue, as a percentage of the company’s global commercial revenue,193
decreased from 60 percent to 56 percent, while European commercial revenue increasedfrom 29 percent to 35 percent. In 1996, EDS’s European revenue increased by 34194
percent, while U.S. revenue increased by 14 percent. ADP has also targeted its195
European operations for expansion either through acquisitions, alliances, or commercialpresence.
Summary and Outlook
Although U.S. cross-border exports of computer and data processing services slowedin 1996, sales by foreign-based affiliates of U.S. firms, which account for the bulk ofU.S. exports, recorded strong gains as many U.S. affiliates continued to generaterevenue at near record levels. At the end of March 1996, revenue from services
Cheryl Gerber, “Why is IBM First in Services?” Datamation (Newton, MA: Cahners196
Publishing Co., July 1996), p. 37. In 1996, CSC’s international revenue grew at a faster rate than the healthy rise in197
domestic revenue. The international increase also came from acquisition of majority equityinterests of Danish IT service providers, growth in Australian affiliate operations, andgrowth in the firm’s international outsourcing and systems integration activities, especially inGermany. CSC Annual Report. 1996 EDS Annual Report.198
A recent worldwide survey indicates that 8 of the top 10 information technology199
companies are U.S.-owned firms. Datamation, July 1997, p. 73. Industry representative, interview by USITC staff, Washington, DC, Nov. 4, 1997.200
3-54
surpassed revenue from software for the first time in IBM’s history, reflecting stronggrowth in the outsourcing and systems integration markets. In recent years,196
expanding economies throughout the world have generated demand for U.S. dataprocessing services such as payroll processing and human resource services, as well asfor specialized services such as those needed by the banking and insurance industries.Also, the continued rise of multinational corporations has made global integration ofcomputer systems and operations a growth area for U.S. computer and data processingfirms. For example, CSC, a major systems integrator and outsourcing vendor, saw itsinternational revenue rise from 25 percent to 30 percent of total company revenue in1996. The growth was primarily due to acquisition activity in France, where thecompany is establishing a wider presence. During 1996, EDS’s non-General Motors197
(GM) international revenue, excluding Europe, increased by 22 percent, due to newcontracts in the Asia-Pacific region and Canada, and higher income from businessacquisitions in New Zealand.198
The United States leads the world in the provision and consumption of computer anddata processing services. Although the U.S. market for computer and data199
processing services is the world’s largest, it is also fiercely competitive and, therefore,major overseas business markets such as Europe often offer greater expansionopportunities. Success in the global computer services industry is primarily based ona firm’s ability to deliver a competitively priced product, on time, that incorporatessuperior strategic concepts and technical ability. U.S. service providers are wellpositioned to compete effectively in the global marketplace due to their broadinternational market presence, which places them in proximity to clients and enhancestheir on-time performance, and substantial and diverse technical expertise.Furthermore, a significant portion of the hardware and software used in businessapplications worldwide originates in the United States, often from the same firms thatprovide computer and data processing services. Such proximity to rapidly changingdevelopments in the hardware and software industries permits U.S. service vendors torespond quickly to clients’ demands and anticipate future needs in both the domesticand foreign markets. Priorities of the newest technologies include integrating disparatesystems, streamlining business processes, reducing costs, or improving networkconnectivity.
U.S. providers of computer and data processing services believe international revenueswill increase significantly in the coming years, spurred by the global demand forcompany-wide information systems, implementation support, and outsourced businessfunctions. The U.S. industry, generally regarded as the leader in supplying200

Y2K is a legacy of a widely practiced computer programming shortcut. Many date-201
dependent applications use only the last two digits of the year and therefore will not be ableto distinguish between, for example, the year 2001 and 1901. Although a potentiallymassive problem for computer users, the Y2K presents computer software and servicesvendors with significant opportunity — worldwide repair estimates range from $200 billionto more than $500 billion. A specific example is the U.S. Office of Management andBudget’s (OMB) plan to make government systems year 2000-compliant by January 1999 atan estimated cost of $2.3 billion. Bob Violino, “Federal Government Estimates Year 2000Effort To Cost $2.3 Billion,” InformationWeek, Feb. 10, 1997, TechWeb News, found atInternet address http://www.techweb.com/, retrieved Nov. 19, 1997. Projects related to networks, including network outsourcing and value-added network202
(VAN) services, provide the U.S. industry with significant opportunity. Furthermore, asInternet and intranet development continues, new needs are realized, such as the need forsecurity products including firewalls, authentication, and encryption. U.S. Industry and Trade Outlook ‘98, chapter on information services.203
IBM is the largest supplier of information technology services in Europe and one of204
the 20 U.S.-owned firms included in the market’s top 50 IT suppliers. In 1992, only 12 ofthe top 50 suppliers were U.S.-owned. Douglas Hayward, “Euro Service Sales Boom,Software Lags,” TechWire, TechWeb News, Mar. 10, 1997, found at Internet addresshttp://www.techweb.com/, retrieved on Nov. 14, 1997. ADP has developed a lucrative practice area that provides expertise in the German205
SAP database system. Includes health maintenance organizations (HMOs) and similar organizations engaged206
in providing medical or other health care services to members. However, health care(continued...)
3-55
multinational computer and data processing applications, will also benefit from theincreasing need for services and systems that provide global integration. Currently,important industry issues and opportunities include the “Year 2000 Problem” (Y2K)201
and the proliferation of intranets and the Internet. Also, a significant industry trend202
is the convergence of complementary market segments such as computer hardware,software, and telecommunications. Such alliances allow companies to integratepreviously disparate technologies, thereby increasing the depth and breadth of thefirms’ delivery of products and services. 203
Europe likely will continue to be a major source of opportunity for U.S. firms, asEuropean businesses have traditionally relied heavily upon U.S.-owned computer anddata processing services. Where European information technology vendors have204
made gains, the U.S. industry is reportedly likely to respond by acquiring thecompetitors or by quickly developing expertise in the discipline and then adding it totheir service portfolio.205
Health Care Services
Introduction
For the purposes of this report, health care services include those performed byhospitals and hospital chains; offices and clinics of medical doctors and other healthcare professionals; nursing homes and other long-term health care providers;rehabilitation facilities; home health care providers; certain health maintenanceorganizations (HMOs); medical and dental laboratories; kidney dialysis centers; and206

(...continued)206
services do not include HMOs that limit services to the provision of insurance forhospitalization or medical costs. Cross-border exports largely consist of the treatment of foreign persons in the United207
States by hospitals, clinics, medical doctors, and other health care service professionals. Cross-border imports comprise the treatment of U.S. citizens overseas by foreign health careservice providers. Trade through affiliates includes health care services provided to foreign persons by208
majority-owned, foreign-based affiliates of U.S. health care service providers, and to U.S.persons by majority-owned, U.S.-based affiliates of foreign health care service providers. USITC staff estimate, based on information provided by U.S. industry representatives209
and BEA official, telephone interviews by USITC staff, Nov. 12-18, 1997. U.S. hospital officials, telephone interviews by USITC staff, Oct. 27-29, 1997.210
Ibid.211
3-56
specialty outpatient facilities. U.S. health professionals provide services to foreignpatients through cross-border transactions and affiliates established in foreign markets.Cross-border trade in this sector primarily consists of the treatment of citizens of onecountry by health care providers in another country. Trade through affiliates includes207
health care services provided to persons in their home countries by affiliates of foreign-based health care companies. In recent years, cross-border transactions have208
accounted for the greatest portion of U.S. exports of health care services, while affiliatetransactions have accounted for most U.S. purchases.
Recent Trends
Cross-Border Trade, 1991-96
In 1996, U.S. cross-border exports of health care services amounted to $872 million,representing a 4-percent increase over the previous year’s exports. Such growth was2 percentage points less than the average annual export growth rate of nearly 6 percentfor health care services during 1991-95 (figure 3-27). U.S. cross-border imports ofhealth care services amounted to an estimated $550 million in 1996, representing a209
5-percent increase from 1995, compared to the 8-percent average annual rate ofincrease of cross-border imports during 1991-95. U.S. exports and imports of healthcare services accounted for less than 1 percent of such cross-border trade in all serviceindustries in 1996. The U.S. cross-border trade surplus in health care servicesamounted to $322 million in 1996, increasing at the same 2-percent rate over theprevious year as was recorded on average during 1991-95.
Canada remained the leading export market for U.S. health care services in 1996,accounting for an estimated one-half of the total. Other leading markets for U.S.210
cross-border exports of health care services were the United Kingdom, Germany,Mexico, Australia, and Japan. 211

1991 1992 1993 1994 1995 19960
200
400
600
800
1000Exports Imports Trade balance
Million dollars
Source: U.S. Department of Commerce, Bureau of Economic Analysis, Survey of Current Business, Oct. 1997, p. 108 for U.S. exports; and USITC staff estimates for imports and trade balance.
U.S. hospital company, telephone interview by USITC staff, Nov. 18, 1997.212
These U.S.-owned affiliates were subsequently sold in 1996, as the U.S. hospital213
company exited the foreign market to focus on restructuring of its operations in the U.S.market. Community Psychiatric Centers, “Third Quarter Results Reflect Gain on Sale of UKOperations,” press release, Oct. 1, 1996. Following a sharp 33-percent decline in U.S. purchases in 1992 from 1991, U.S.214
purchases increased by an average annual rate of 9 percent during 1992-94.
3-57
Figure 3-27Figure 3-27Health care services: U.S. cross-border exports, imports, and trade balance, 1991-96Health care services: U.S. cross-border exports, imports, and trade balance, 1991-96
Affiliate Transactions, 1991-95
Sales by foreign-based affiliates of U.S. health care service companies amounted to$469 million in 1995 (figure 3-28). This represented a 1-percent decrease in such salesfrom 1994, contrasting with 17-percent average annual growth during 1991-94. Muchof the decline in 1995 reflected the sale by a major U.S.-based hospital chain of a groupof hospitals it owned in Singapore and Malaysia. However, foreign-based affilate212
sales of U.S. firms increased in some overseas markets. For example, British-basedaffiliate sales of U.S. health care firms almost doubled with the acquisition ofadditional hospitals in the United Kingdom by a major U.S. psychiatric hospitalcompany. U.S. purchases through U.S.-based affiliates of foreign health care213
companies amounted to $1.8 billion in 1995, representing a 10-percent increase overthe previous year. This contrasted with a 7-percent average annual rate of declineduring 1991-94, but closely mirrored the most recent upward trend. The German-214
owned hospital company, Paracelsus, continued to increase its U.S. market share withthe acquisition of several hospitals on the West Coast. Meanwhile, revenue increasedfor a chain of outpatient medical and surgical care facilities purchased by a French

1991 1992 1993 1994 1995-2
-1
0
1
2
3Sales Purchases Balance
Billion dollars
Source: U.S. Department of Commerce, Bureau of Economic Analysis, Survey of Current Business, Sept. 1994,Sept. 1995, Nov. 1996, and Oct. 1997, pp. 137-138.
U.S. health care investment analysts, interviews by USITC staff, New York, NY, Sept.215
25-26, 1997. Ibid.216
European health care industry representatives, telephone interviews by USITC staff,217
Oct. 15-16, 1997.
3-58
company in the Midwest. Increased U.S. purchases through U.S.-based affiliates in215
the health care services industry were also attributed to Japanese and Australianinvestments in the U.S. hospital and nursing care sectors. Affiliate transactions in216
health care services in 1995, both sales and purchases, accounted for less than 1percent of such transactions in all service industries.
Figure 3-28Figure 3-28Health care services transactions by majority-owned affiliates: U.S. sales, purchases, andHealth care services transactions by majority-owned affiliates: U.S. sales, purchases, andbalance, 1991-95balance, 1991-95
Summary and Outlook
The decline in growth rates in both U.S. cross-border exports and imports of healthcare services in 1996 reflected efforts in the United States and its major tradingpartners to contain rapidly escalating health care costs. In the United States, theseefforts were about equally divided between U.S. Government administrators of healthcare programs such as Medicare and Medicaid, and private-sector insurers. Similarfactors were at play in major foreign markets; however, cost-containment effortsabroad were primarily undertaken by governments attempting to gain control overrapidly increasing public-sector expenditures. 217
Although sales by foreign-based affiliates of U.S. companies decreased in 1995, therewas an increase in U.S. health care purchases from U.S.-based affiliates of foreignfirms. However, the increase in U.S. purchases was at least partly attributable toincreased revenue resulting from the foreign acquisition of U.S. health care facilities

U.S. health care investment analysts, interviews by USITC staff, New York, NY, Sept.218
25-26, 1997. U.S. health care industry representatives, personal and telephone interviews by USITC219
staff, May-July 1996 and Oct.-Nov. 1997. In 1993, the United States spent $884.2 billion on health care, an 8-percent increase220
from 1992. This spending growth was among the lowest rates of growth recorded since1960. Similar growth rates were recorded in both 1994-96. Katherine R. Levit, Cathy A.Cowan, Helen C. Lasenby, Patricia A. McDonnell, Arthur L. Sensenig, Jean M. Stiller, andDarleen K. Won, “National Health Spending Trends, 1960-1993,” Health Affairs, Winter1994; and Chief, National Health Expenditures Branch, Office of National Health Statistics,Health Care Financing Administration, telephone interview by USITC staff, Dec. 3, 1996. Saburo Kimura, Japan Health Care Services, Market Research Reports, USDOC,221
Apr. 1, 1997, pp. 1-12.
3-59
in the outpatient medical and surgical care segment of the market. The outpatient218
care sector is currently in favor among health insurance firms and major employers thatpay most health care costs, due to its proven ability to reduce costs of treatmentstraditionally performed in more expensive hospital inpatient settings.
Historically, health care services in most foreign countries have largely been theresponsibility of the public sector. This has made it difficult for U.S. private-sectorhealth care providers to market in foreign countries many of the innovative conceptsdeveloped in the U.S. market in recent years, such as for-profit hospital and nursinghome chains, outpatient surgery centers, free-standing diagnostic centers, health-maintenance-organizations, and other managed care delivery systems. This difficulty219
has occurred despite the fact that the competition and innovation engendered in themore dynamic U.S. health care system is recognized as having slowed the rate ofgrowth in health care costs in the United States, especially in the past several years.220
However, there are several emerging global trends that could benefit U.S. health careservice suppliers in overseas markets. One of these is the rapid growth in health careexpenditures in a large number of countries. Rapidly expanding health careexpenditures in many developed countries, such as Canada, Germany, and Japan, aredue to an increase in their aged populations, the demographic segment that uses healthcare services most intensively. Meanwhile, increased health expenditures in rapidlydeveloping economies such as Singapore, Thailand, Malaysia, Argentina, and Brazilare occurring as newly emerging middle classes demand the levels of health carepreviously enjoyed only in more developed economies, such as the United States andWestern Europe. These increasing health care demands are occurring at the same timethat many of these countries are attempting to gain control over rising health careexpenditures, another major global trend.
To contend with these conflicting demands, a number of countries are eitherundertaking or contemplating reform of their health care systems. Many of thesereform efforts include privatization of public health care systems, or some level ofprivate sector financing and supply of health care services. In Japan, for instance,aging of the population is proceeding faster than in other countries and, consequently,the government has recognized the need for cost-containment measures. Although221
profit-making companies may still encounter significant legal obstacles to establishingand providing medical treatment in Japan, government promotion of deregulation,health care reform, and planned introduction of social insurance for long-term care in

The Japanese Medical Services Law limits the establishment, management, or222
operation of hospitals and clinics to licensed physicians and physician groups. It also doesnot allow for-profit companies to provide health care services generally provided byphysicians and nurses. However, under recent deregulation initiatives of the JapaneseGovernment, operation of hospitals by for-profit companies is being discussed. SaburoKimura, Japan Health Care Services, Market Research Reports, USDOC, Apr. 1, 1997, p.7. Ibid.; and U.S. health care representative, telephone interview by USITC staff, Oct.223
22, 1997. USDOC, ITA, National Trade Data Bank, “The German Health Care System,” Stat-224
USA Database, found at Internet address http://www.stat-usa.gov/, posted Sept. 1, 1997,retrieved Sept. 18, 1997, pp. 1-12. Ibid.225
Health care investment analyst, interview by USITC staff, New York, NY, Sept. 26,226
1997. Assisted living services include a variety of residential, health care, and other social227
services for elderly persons who are not ready for custodial nursing care. Karen Pallarito,“Assisted Living Leads Growth,” Modern Health Care, May 20, 1996, p. 96. USDOC, ITA, National Trade Data Bank, “Argentina Health Care Systems,228
Privatization,” Stat-USA Database, found at Internet address http://www.stat-usa.gov/,posted Sept. 1, 1995, retrieved Sept. 18, 1997, pp. 1-2.
3-60
the year 2000, should accelerate expansion of the Japanese health care services marketand business opportunities for U.S. companies to participate. One U.S. company222
that has already had a measure of success in Japan is Beverly Enterprises, the largestnursing home chain in the United States. Beverly operates Japanese nursing carefacilities through joint ventures and contractual relationships with Japanese private-sector and government social welfare organizations. Other U.S. health care service223
companies recently initiating Japanese ventures include Caremark, Inc., ServiceMaster,and Marriott Corp.
In Germany, the increasing impact of health care costs on federal and state budgets has,thus far, led to enactment of cost-containment measures in public-owned hospitals.However, a debate about the privatization of health care continues. The effectiveness224
of the U.S. private-sector model with regard to cost-cutting is widely recognized evenby its critics in Germany. However, opposition is strong, especially from the politicalleft, which fears that purely economic considerations might conflict with the bestinterests of patients. However, total expenditures on health care costs have reached225
over 10 percent of German GDP, and are rising three times faster than general wages,increasing pressure from workers and their employers for the government to considermore private-sector involvement in organizing, financing, and delivering health careservices in that country. 226
Private-sector HMOs and other managed care plans, outpatient surgical care, and evenassisted living for the aged are also gaining acceptance in less developed countries,227
such as Argentina, Romania, and Malaysia. In Argentina, private prepaid medical careplans (known as PREPAGAS) have appeared in recent years. Similar to HMOs in228
the United States, prepaid plans provide a full range of hospital and outpatient services.The coverage and quality of care provided through these plans are often superior to thatprovided by the public-sector health benefit programs known as “obras sociales,”which have been synonymous with Argentine health care since the Peron period (1945-

Ibid.229
USDOC, ITA, National Trade Data Bank, “Romania: Medical Equipment,” Stat-USA230
Database, found at Internet address http://www.stat-usa.gov/, posted May 1, 1997, retrievedSept. 18, 1997, pp. 1-8. Ibid.231
USDOC, ITA, National Trade Data Bank, “Malaysia Health Care Services,” Stat-232
USA Database, found at Internet address http://www.stat-usa.gov/, posted Mar. 1, 1997,retrieved Sept. 18, 1997, p. 2. Health care investment analyst, interview by USITC staff, New York, NY, Sept. 26,233
1997.
3-61
55). Managed care is now estimated to account for approximately 10 percent of theArgentine health care market.229
In Romania, more than 90 percent of hospitals are still state-owned. However, theprivatization of hospitals and of the health care system has been explored by thegovernment. In fact, there has been strong growth in the establishment of private230
outpatient surgery clinics and medical testing laboratories during the past several years.Romanian authorities state that reform of the national health care system will continueto be one of its top priorities and will likely include some type of health insurance planproviding coverage for private- and state-run clinics and hospitals. Similarly, in an231
effort to reduce public expenditures in Malaysia, the government has adopted a policyof corporatization and privatization of health facilities and services. A second232
purpose of the privatization effort is to promote further economic efficiency. Becauseof the expertise developed by private-sector health care service companies in theextremely competitive U.S. market, many analysts believe that the U.S. industry willbe in the best position to profit from the emergence of privatized and managed healthcare in overseas markets. 233
Legal Services
Introduction
Legal services include legal advisory and representation services in various fields oflaw (e.g., criminal or corporate law), advisory and representation services in statutoryprocedures of quasi-judicial bodies, and legal documentation and certification services.Legal services are traded both on an affiliate and cross-border basis, although tradedata are available only for the latter. Cross-border trade in this service industry occurswhen legal professionals travel abroad to provide services to clients, when clients travelabroad to engage the services of foreign attorneys, or when legal documents or adviceare transmitted via telecommunication devices, postal delivery, or other forms ofcorrespondence. Trade through affiliates occurs when foreign affiliates of legal serviceproviders engage in commercial activity.
In limited instances, legal service providers may become members of foreign bars,conferring on them the right to appear in foreign courts and prepare advice on foreignlaw. However, most U.S. lawyers operating in foreign markets are not fully accreditedby authorities overseas and, therefore, function more narrowly as foreign legal

Although the term ‘foreign legal consultant’ (FLC) is widely used throughout the234
international legal community, the specific definition may differ among jurisdictions. In aneffort to reduce ambiguity, the American Bar Association (ABA) and the Brussels Barjointly proposed a common approach to foreign legal consultancy. The Brussels Accordrecognizes the ability of foreign lawyers to enter a country so as to qualify as a FLC, to hirelocal lawyers as partners, and, although restrictions would apply, to participate fully withlocal lawyers in providing a wide variety of legal services. Paul Barrett, “Law Firms Say Profits Reach All-Time Highs,” The Wall Street235
Journal, July 1, 1997. “Professional Business Services,” U.S. Industry and Trade Outlook ‘98, p. 49-2.236
3-62
consultants. Typically, foreign legal consultants may provide advice regarding U.S.234
law, international law, and third-country law, but are precluded from appearing inforeign courts or giving advice on foreign law, unless that advice is based on thespecific advice of a member of the foreign bar.
Recent Trends in Cross-Border Trade, 1991-96
In 1996, U.S. cross-border exports of legal services totaled $1.9 billion (figure 3-29),up nearly 15 percent over the previous year. This increase exceeded the 6-percentaverage annual increase achieved during 1991-95. U.S. imports of legal servicesincreased by 10 percent to $516 million in 1996, slower than the 18-percent averageannual growth rate realized during the preceding 5 years. Consequently, the U.S. cross-border trade surplus in this sector widened to approximately $1.4 billion in 1996.Legal services trade accounted for about 1 percent of total U.S. cross-border exportsof services, but less than one-half of 1 percent of imports in 1996.
Japan and the United Kingdom remained the largest foreign markets for U.S. legalservices in 1996, absorbing 19 percent and 17 percent, respectively, of total U.S.exports of legal services (figure 3-30). Other significant cross-border export marketsfor U.S. legal services included France, Germany, and Canada. Import patterns weresimilar, with U.S. residents purchasing approximately 21 percent of foreign-providedlegal services from the United Kingdom and 13 percent from Japan. The United Statesrecorded a surplus on legal services trade with each of the aforementioned countries.
Summary and Outlook
The increases in both U.S. cross-border exports and imports of legal services in 1996extended previous trends of year-to-year increases during 1991-95. The rise in cross-border exports in 1996 is notable, as it represented the largest yearly increase in U.S.legal firms’ sales in foreign markets within the period of review. New York-basedShearman & Sterling, for example, saw sales increase markedly and profits increase 25percent in 1996, as the firm’s long-term investment in financial and human capital inEurope and Asia continued to generate strong returns. Global demand for U.S. legal235
services is expected to grow at a rate of 6 percent to 7 percent per year into the nextcentury, as the industry builds on its worldwide reputation for expertise in236

1991 1992 1993 1994 1995 19960
500
1000
1500
2000
2500Exports Imports Trade balance
Million dollars
Source: U.S. Department of Commerce, Bureau of Economic Analysis, Survey of Current Business, Oct. 1997, pp. 108-109.
Exports Trade balance
Canada
Germany
France
United Kingdom
Japan
0 50 100 150 200 250 300 350 400
Million dollars
Source: U.S. Department of Commerce, Bureau of Economic Analysis, Survey of Current Business, Oct. 1997, p. 135.
3-63
Figure 3-29Figure 3-29Legal services: U.S. cross-border exports, imports, and trade balance, 1991-96Legal services: U.S. cross-border exports, imports, and trade balance, 1991-96
Figure 3-30Figure 3-30Legal services: U.S. cross-border exports and trade balance, by major trading partners, 1996Legal services: U.S. cross-border exports and trade balance, by major trading partners, 1996

For further background on New York law’s ascendancy, see USITC, Recent Trends in237
U.S. Services Trade, USITC publication 3041, 1997, pp. 3-51 and 3-53. In 1994, China required two large U.S. law firms with offices in Beijing to close their238
offices in Shanghai in order to comply with the country’s policy restricting foreign law firmsto registration in one city. Shortly thereafter, the Chinese Government approved 16 foreignlaw firms, indicating that although the Government has no solid objections to the presence offoreign law firms, it does believe in maintaining control over the operations. J. Reif, J.Whittle, A. Woznick, M. Thurmond, J. Kelly, Services: The Export of the 21st Century (SanRafael, CA: World Trade Press, 1997), p. 111. Peter D. Ehrenhaft, Esquire, testimony before USITC, Feb. 4, 1997.239
Donald Rivkin and Michael Sandler, “International Legal Developments in Review —240
Transnational Legal Practice,” International Lawyer, summer 1997, p. 31.
3-64
areas such as international finance, telecommunications, and entertainment, and as NewYork law increasingly becomes the standard for legal language in agreementsundertaken by parties from different countries. In addition, U.S. legal practitioners’237
use of high-technology tools including the Internet, information retrieval tools such asLEXIS-NEXIS, and simple IT applications such as Email is expected to lower researchand operational costs, and allow attorneys to interact more extensively and efficientlywith clients both globally and locally.
Generating revenue and profits from foreign operations is increasingly important toU.S. legal service providers as the U.S. market shows signs of saturation.Consequently, U.S. law firms have moved to improve their ability to provide servicesassociated with international joint ventures, project finance, privatization, and mergersand acquisitions. These firms have increasingly recruited lawyers admitted to barsoutside the United States and established foreign affiliates, particularly in regionsundergoing rapid economic growth or market liberalization. For instance, multinationallaw firms have recently moved into markets in Eastern Europe and the countries of theformer Soviet Union. The People’s Republic of China and Taiwan also appear to bepotential markets of significant opportunity. In China, a number of U.S. law firms haverecently established operations or increased their market presence, encouraged by thecountry’s economic growth in recent years.238
Overseas expansion by U.S. law firms has not been without challenges, as formal andinformal trade barriers continue to exist worldwide. Principal barriers include thosewhich limit U.S. legal firms’ ability to establish foreign legal consultancies, or whichlimit the recruitment or hiring of members of foreign bars. The American Bar239
Association (ABA) continues to work with associations of legal professionals in othercountries to eliminate conditions that impede trade in legal services. For example, theABA and the Paris Order of Advocates recently signed an agreement to work towardsgreater cooperation and reciprocity, especially regarding the establishment ofcommercial presences. Work in conjunction with the International Bar Association(IBA) has not been as successful. A recent ABA report notes that the IBA has notmade significant progress in efforts to promulgate proposed Guidelines for ForeignLegal Consultants. Objections ranged from concerns of bars in developing countriesthat the Guidelines would expose them to excessive competition, to contentions by theCouncil of the Bars and Law Societies of the European Communities that pan-European rules must be established before international standards can be created.240

The data analyzed and presented in this writeup are derived from BEA’s Form BE-22,241
Annual Survey of Selected Services Transactions with Unaffiliated Foreign Persons andinclude repairs performed on a contract basis, but not under warranty. In BEA’s Form BE-20, Benchmark Survey of Selected Services Transactions with Unaffiliated ForeignPersons, BEA eliminated repairs in order to improve the quality of the data. Repairs arenow considered as trade in merchandise. Data collected and compiled from Form BE-20were used in BEA’s “U.S. International Transactions, Revised Estimates for 1974-96,”Survey of Current Business, July 1997. Excluded are services where the cost is included in the price of the goods and not242
separately billed or is declared as part of the price of the goods on the import or exportdeclaration filed with the U.S. Customs Service. USDOC, BEA, instructions to Form BE-22, Annual Survey of Selected Services Transactions with Unaffiliated ForeignPersons—1995, OMB Form No. 0608-0060. Training services not connected with the sale of goods, for example, are classified243
under educational services. Services provided with the sale of integrated computer hardware and software systems244
are classified under computer and data processing services. Similarly, services related to themaintenance and repair of telecommunications equipment are classified undertelecommunication services. USDOC, BEA, instructions to Form BE-22, Annual Survey ofSelected Services Transactions with Unaffiliated Foreign Persons—1995, OMB Form No.0608-0060. Oil and gas field maintenance and repair services, such as cleaning lease tanks, or245
repairing derricks or gas well rigs and performed on a contract basis, are classified underconstruction, engineering, architectural, and mining services. The USDOC, BEA,instructions to Form BE-47, Annual Survey of Construction, Engineering, Architectural,and Mining Services Provided by U.S. Firms to Unaffiliated Foreign Persons, OMB FormNo. 0608-0015, p. 1. See instructions to BEA Form BE-36, Foreign Airline Operators’ Revenues and246
Expenses in the United States; Form BE-37, U.S. Airline Operators’ Foreign Revenues andExpenses; Form BE-29, Foreign Ocean Carriers’ Expenses in the United States; and FormBE-30, Ocean Freight Revenues and Foreign Expenses of United States Carriers.
3-65
Maintenance and Repair, Installation, Alteration, and241
Training Services
Introduction
Trade in maintenance and repair, installation, alteration, and training services(hereafter, maintenance and repair services) encompasses a broad range of services andactivities. Such trade entails the maintenance and repair of machinery and equipment,as well as the maintenance and repair of buildings, structures, dams, highways, andother construction works. Further, this trade includes “such services as the periodicoverhaul of turbines or locomotives, the extinguishing of natural gas well fires, andrefinery maintenance.” Installation and training services include installation, startup,242
and training services provided by a manufacturer only in connection with the sale ofgoods. This category excludes services provided with the sale of integrated computer243
hardware and software systems; maintenance and repair of telecommunicationsequipment; oil and gas field maintenance and repair services, when performed on a244
contract basis; and most maintenance and repair services of U.S. and foreign airline245
and ocean carriers. Maintenance and repair services related to aircraft are generally246
limited to aircraft engine overhaul, where the engine is removed from the aircraft and

USDOC, BEA, Benchmark Survey of Selected Services Transactions with247
Unaffiliated Foreign Persons 1996, Form BE-20, item 9, “Projects with U.S. Governmentnonmilitary agencies,” p. 4. Officials of BEA, interview by USITC staff, Nov. 14, 1997.248
BEA,“U.S. International Sales and Purchases of Private Services,” Survey of Current249
Business, Oct. 1997, p. 100.
3-66
transported to a different repair site, and training in connection with the sale of aircraft.Maintenance and repair services on projects arranged through the Foreign MilitarySales program of the U.S. Department of Defense are also excluded for this category.247
In 1996, U.S. exports of maintenance and repair services were concentrated intransportation machinery; measurement, testing, and medical equipment; and a widevariety of other industrial machinery. U.S. imports were concentrated in248
transportation machinery. Although maintenance and repair services are traded on botha cross-border and affiliate basis, official trade data track only cross-border trade.
Recent Trends in Cross-Border Trade, 1991-96
As the result of changes to BEA’s survey methodology for gathering data onmaintenance and repair services, as well as other selected services, U.S. export data249
for maintenance and repair services for 1994 and 1995, and U.S. import data for 1992-95, were revised. U.S. exports rose slightly as a result of the revisions, but U.S.imports were revised downward to a significant degree. The lack of revisions to U.S.exports for 1991-93 does not appear to appreciably change export trends.Consequently, the discussion of exports found below spans all the years of interest tothis study, 1991 through 1996. However, as U.S. import data were revisedsignificantly, the following discussion of import trends focuses on revised data for theperiod 1992-96 only; import data for 1991, which were not revised, are not referenced.
U.S. exports of maintenance and repair services grew by an average annual rate of 5percent during 1991-95 (despite experiencing a decline in 1995), then rose by 17percent in 1996, to $3.7 billion (figure 3-31). Based upon revised data, U.S. importsof maintenance and repair services rose by an average annual rate of 2 percent during1992-95 (despite registering declines during 1993-94), then increased substantially, by54 percent, to $315 million in 1996.
In 1996, the principal U.S. export markets for maintenance and repair services wereJapan, Saudi Arabia, the United Kingdom, Canada, and Korea (figure 3-32). Japan,the leading destination for U.S. maintenance and repair services, accounted for $449million, or 12 percent, of U.S. exports. Exports to Japan likely were attributable toaircraft engine overhaul operations, resulting from the large installed base of U.S.-builtaircraft engines in Japan’s aircraft fleet; and installation, maintenance, and repair ofnuclear and conventional electric power generation equipment and semiconductormanufacturing and testing equipment. Saudi Arabia, which held second place as a U.S.export destination of maintenance and repair services, accounted for almost 10 percentof exports in 1996. Exports of maintenance and repair services to Saudi Arabia werelikely related to the Saudi Government's efforts to promote growth in the private

1991 1992 1993 1994 1995 19960
900
1800
2700
3600
4500Exports Imports Trade balance
Million dollars
1 U.S. import data for 1992-95 and U.S. export data for 1994-95 reflect revisions necessitated by recent changes inBEA’s estimation methodology. Import data for 1991 were not revised and, therefore, may be overstatedsignificantly.
Source: U.S. Department of Commerce, Bureau of Economic Analysis, Survey of Current Business, Oct. 1997, pp. 108-109.
Exports Trade balance
Korea
Canada
United Kingdom
Saudi Arabia
Japan
0 100 200 300 400 500
Million dollars
Source: U.S. Department of Commerce, Bureau of Economic Analysis, Survey of Current Business, Oct. 1997, p. 135.
3-67
Figure 3-31Figure 3-31Maintenance and repair, installation, alteration, and training services: U.S. cross-borderMaintenance and repair, installation, alteration, and training services: U.S. cross-borderexports, imports, and trade balance, 1991-96exports, imports, and trade balance, 1991-9611
Figure 3-32Figure 3-32Maintenance and repair, installation, alteration, and training services: U.S. cross-borderMaintenance and repair, installation, alteration, and training services: U.S. cross-borderexports and trade balance, by major trading partners, 1996exports and trade balance, by major trading partners, 1996

Census data indicate that U.S. exports of repaired articles also declined, from $150250
million in 1994 to $113 million in 1996. The value of U.S. exports of repaired or altered articles, as reported for Schedule B251
subheading 9801.10.000 by the U.S. Department of Commerce, Bureau of the Census,totaled $1.8 billion in 1995 and 1996. These Census data would include repairs ofcomputers, telecommunications equipment, ships, and airline aircraft, which are excluded inBEA export estimates for the category maintenance and repair services.
3-68
sector and to reduce the country’s dependence on petroleum and petrochemicalindustries. U.S. exports of such services appear to have been related to installation ofnew power plants, air-conditioning and refrigeration equipment, oil refinery upgrades,petrochemical production machinery, medical equipment, industrial safety and securityequipment, and aircraft engine overhaul. U.S. exports to the United Kingdom werelikely related to aircraft training and aircraft engine overhaul, while exports to Canadaseem to have been related to aircraft training, aircraft engine overhaul, motor vehiclemanufacturing machinery, and locomotive repair.
In 1996, Korea became the fifth largest market for U.S. exports of maintenance andrepair services, while Mexico, which ranked fifth in 1995, fell to sixth place. Exportsto Korea likely related to power generation projects, semiconductor manufacturing andtesting equipment, and aircraft engine overhaul. Exports to Mexico declined during1994-96, from $241 million to $174 million, as a likely consequence of declining U.S.direct investment in Mexico.250
In 1996, U.S. imports of maintenance and repair services were principally supplied bythe United Kingdom, Japan, and Canada, which together accounted for 65 percent ofU.S. imports of maintenance and repair services. Imports from the United Kingdomaccounted for 43 percent, or $137 million, and appear to have been related to aircrafttraining and aircraft engine overhaul. Imports from Japan accounted for 14 percent andwere probably related to a wide variety of production machinery installed and servicedin U.S. manufacturing plants. Imports from Canada accounted for 7 percent. Overall,the EU accounted for 62 percent of U.S. imports of maintenance and repair services.
Japan, Saudi Arabia, and Canada were the largest contributors to the U.S. trade surplusin maintenance and repair services in 1996. The U.S. trade surplus with Japan alonetotaled $404 million and accounted for 12 percent of the $3.4-billion trade surplus inmaintenance and repair services. The trade surplus with Saudi Arabia totaled $362million, or 11 percent of the trade surplus; and with Canada, $223 million, or 7 percent.
Summary and outlook
The ability to maintain a trade surplus in maintenance and repair services is largelydependent on U.S. producers’ ability to export aircraft, aircraft engines, and aircraftparts; power generation machinery; semiconductor manufacturing and testingequipment; petroleum refinery and petrochemical production machinery; and otherindustrial products. The value of repairs or alterations probably accounted for less thanhalf of the category of maintenance and repair services. Such services are dependent251
upon a large overseas base of installed U.S.-origin machinery and equipment and therepair cycle of such items.

General Electric Co., 10-K405, Mar. 24, 1997. 252
Dan Morgan and David B. Ottaway, “U.S. Reactor Firms Maneuvering to Tap China's253
Vast Market,” Washington Post, Oct. 21, 1997, p. A1. Applied Materials, Inc., 10-Q, Sept. 12, 1997.254
Applied Materials, Inc., 10-K, Jan. 27, 1997. KLA Tenecor Corp., 10-K, June 29,255
1997. George Burns, “The Next Fab Building Boom: Breaking Ground,” Channel, Oct.256
1997, table 1, p. 11
3-69
Future prospects for the U.S. export of maintenance and repair services appear to berelated to U.S. exports of power generation machinery, semiconductor manufacturingand testing machinery, and aircraft engines. Power generation machinery is requiredworldwide, by mature markets in North America and Western Europe and by moredynamic markets in Asia, the Middle East, Eastern Europe, and the former SovietUnion. U.S. exports of power generation equipment, and concomitant installation252
services, will likely experience significant increases in China and Latin America.Growth in China will be driven by the continually increasing demand for energy aseconomic development continues. However, further growth of nuclear powerequipment and related services to China depends on the easing of U.S. export restraintson nuclear technology to China. Privatization of some electric power generation253
operations, as well as increased access by foreign firms in Latin America, will help spurthe export of installation, maintenance, and repair services there. Installation of U.S.nuclear power equipment is largely complete at power plants in Japan, Korea, andTaiwan, with increasing U.S. exports of maintenance and repair services related tonuclear power equipment likely to follow.
Continued growth of U.S. exports of semiconductor manufacturing and testingequipment is likely to result in strong U.S. exports of maintenance and repair services.However, export of semiconductor manufacturing and testing equipment declinedslightly in 1997, because significantly lower prices for memory devices and excessproduction capacity in Asia caused semiconductor manufacturers there to postpone neworders for equipment and to delay the delivery of systems already ordered. Over the254
longer term, as demand for cutting-edge semiconductor manufacturing and testingequipment continues, installation and maintenance revenue should grow as foreignsemiconductor factories will seek to maximize equipment reliability and machineoperating time. Global demand for U.S. equipment is likely to increase further as the255
global semiconductor industry continues to move from using 200mm semiconductorwafers to 300mm wafers in 1998. Worldwide, new semiconductor fabricationequipment spending was forecast to rise by 26 percent, from $14.5 billion in 1995 to$18.0 billion in 1997. 256
Exports of maintenance and repair services related to aircraft are dependent on theability of U.S. aircraft engine producers to maintain and expand their market share ofengines installed in both U.S.- and foreign-built aircraft. Continued strong U.S.exports of maintenance and repair services may also result from the building andupgrading of petroleum refining and petrochemical production facilities in response togrowth in worldwide demand for petroleum and petrochemicals, and from strongexports of medical equipment.

Basic services entail the transmission of voice and data without change in form or257
content. Value-added services include computer processing, electronic mail, electronic data258
interchange, electronic funds transfer, enhanced facsimile, and on-line database access. Call-back services require a customer outside the United States to call an assigned259
U.S. telephone number and hang up; the caller will then receive a computer-driven, returncall with a U.S. dial tone from a U.S. call-back firm. The customer may then place a call tothe desired destination at a rate substantially less than that charged for calling directly. These calls appear as outbound U.S. calls for accounting purposes. Country direct services provide a customer in a foreign location with access to a U.S.260
carrier for the purpose of placing calls to the United States or foreign destinations. Thesecalls also appear as outbound U.S. calls for accounting purposes. Calling cards are pre-paid telephone cards that are frequently distributed abroad261
through U.S. multinational corporations. David Molony, “Callback operators diversify tosurvive,” Communications Week, issue 171, Sept. 23, 1996. Toll-free phone numbers are those in which the receiver of the connection pays for the262
call (e.g., 800 and 888 numbers). Cellular and mobile satellite service providers must secure the proper licensing263
requirements or “roaming agreements” from foreign governments in order for their(continued...)
3-70
Saudi Arabia is likely to remain a significant destination for U.S. exports ofmaintenance and repair services as that nation's economy continues to grow.Additional opportunities for U.S. exports of maintenance and repair services are likelyto develop in China as that nation’s economy continues to industrialize. U.S. importsof maintenance and repair services are not expected to increase substantially, becausethe United States is a mature market for new industrial machinery, with many foreignmachinery and service providers having established U.S. subsidiaries to performinstallation, training, maintenance, and repair operations. U.S. imports of maintenanceand repair services are likely to remain concentrated in the transportation machineryindustry.
Telecommunication Services
Introduction
Telecommunication services trade encompasses both basic and value-added257 258
services, which can be exchanged across national borders and through foreign-basedaffiliates. Cross-border trade, which involves the placement of a call in the homemarket and the termination of the call in a foreign market, is the dominant mode oftrade. However, affiliate trade is increasing in importance as U.S. trading partnersprivatize state-owned monopolies and liberalize foreign ownership restrictions,allowing for greater overseas participation by U.S. carriers. Both cross-border andaffiliate trade are evolving to keep pace with the globally mobile customer, anddeveloping new telecommunication services such as call-back and country direct259
services. In addition, trade has been facilitated by the distribution of calling cards260 261
and international toll-free phone numbers, and by the completion of roaming262
agreements. Related services, such as telecommunications training, consultancy, and263

(...continued)263
customers to utilize their services when resident in foreign countries. Build-operate-transfer (BOT) programs describe a growing range of projects in which264
a private company is awarded a concession to build a telecommunication network or toprovide telecommunication services for a specified period of time. Once the time hasexpired, ownership is transferred to a designated telecommunication operator in that country. International Telecommunication Union (ITU), World Telecommunication DevelopmentReport, 1994, p. 106. ITU, World Telecommunication Development Report, 1994, pp. 27-29.265
USDOC, BEA, Survey of Current Business, Oct. 1997, pp. 124-127.266
3-71
build-operate-transfer programs, constitute a relatively minor portion of264
telecommunication services trade.
Recent Trends
Cross-Border Trade, 1991-96
U.S. carriers collect fees from domestic customers for outbound calls and periodicallymake settlement payments to foreign carriers according to bilaterally negotiatedsettlement rates, which are prices charged by carriers for terminating international calls.U.S. settlement payments to foreign carriers are recorded as imports in the U.S. balanceof payments, whereas settlement payments collected from foreign carriers are recordedas exports. The United States consistently recorded a trade deficit in cross-bordertelecommunication services during 1991-96 (figure 3-33), principally because mostcalls between the United States and foreign countries originate in the United States.Other factors that affect the U.S. cross-border trade balance include the average lengthof calls, which tends to be longer for calls originating in the United States; relativelylow U.S. international calling prices, which promote outbound calls; the exchange rateof the dollar, which may increase or decrease the size of settlement payments; the265
relative wealth of the United States, which increases the volume of outbound calls; andthe magnitude of foreign direct investment abroad, which promotes outbound callsfrom U.S.-based parent companies to foreign affiliates. Telecommunication servicestrade accounted for 2 percent of total U.S. cross-border exports of services and 6percent of imports in 1996.
U.S. cross-border exports in telecommunication services were valued at $3.4 billion in1996, an increase of 7 percent over the 1995 level. Corresponding telecommunicationservice imports measured $8.4 billion in 1996, reflecting an increase of 8 percent fromthe previous year. The U.S. deficit in telecommunication services increased by 9266
percent in 1996, to nearly $5 billion, despite more favorable settlement rates negotiatedwith major U.S. trading partners during 1994-95. The growth in U.S. exports oftelecommunication services in 1996 contrasted with the overall 1-percent averageannual rate of decline during 1991-95. By comparison, the 8-percent increase in U.S.imports in 1996 doubled the average annual increase of 4 percent recorded during1991-95 (despite the decline experienced in 1992). This import growth reflected 15-percent annual growth in outgoing call volume and indicates that, while prices chargedby foreign carriers declined somewhat, these declines only partially offset growth inoutbound call volume.

1991 1992 1993 1994 1995 1996-6
-4
-2
0
2
4
6
8
10Exports Imports Trade balance
Source: U.S. Department of Commerce, Bureau of Economic Analysis, Survey of Current Business, Oct. 1997, pp. 108-109.
BEA representative, telephone interview by USITC staff, Dec. 3, 1997.267
3-72
Figure 3-33Figure 3-33Telecommunication services: U.S. cross-border exports, imports, and trade balance, 1991-96Telecommunication services: U.S. cross-border exports, imports, and trade balance, 1991-96
Mexico, Canada, the United Kingdom, and Japan constituted the largest U.S. cross-border telecommunication export markets, although of these countries, the UnitedStates posted a bilateral trade surplus only with the United Kingdom (figure 3-34). In1996, these four countries accounted for 32 percent of U.S. cross-bordertelecommunication services exports and 28 percent of U.S. imports, reflecting littlechange from previous years. Although U.S customers called Canada the most amongthe four markets, the United States recorded the largest bilateral deficit with Mexicobecause the U.S.-Mexico accounting rate is much higher than the U.S.-Canada rate.The $835-million trade deficit with Mexico in 1996 represented 17 percent of the U.S.cross-border trade deficit in telecommunication services. One of the significantdevelopments in U.S. bilateral telecommunication services trade in 1996 was thegrowth in transactions with China. In 1996, U.S. telecommunication exports to Chinaincreased by 152 percent over the previous year, following mostly modest growth sincethe early 1990s. The surge in exports to China was due in part to major payments forU.S. satellite launch services, which are classified under telecommunication supportservices. U.S. imports from China also increased in 1996, by 45 percent, reflecting267
continued growth in the volume of U.S. outbound calls terminating in China.

Exports Trade balance
China
Japan
United Kingdom
Canada
Mexico
-1000 -800 -600 -400 -200 0 200 400
Million dollars
Source: U.S. Department of Commerce, Bureau of Economic Analysis, Survey of Current Business, Oct. 1997,pp. 126-127.
Data on telecommunication service sales through affiliates are bundled with other268
services, such as radio and broadcasting services. Telephone and telegraph sales constitutean estimated 80 percent of “communications” sales. In addition, the data on affiliatetransactions of communication services are not available in certain years and in sufficientdetail to identify all major trading partners. USDOC representative, interview by USITCstaff, Washington, DC, Nov. 25, 1996. USDOC, BEA, Survey of Current Business, Oct. 1997.269
3-73
Figure 3-34Figure 3-34Telecommunication services: U.S. cross-border exports and trade balance, by major tradingTelecommunication services: U.S. cross-border exports and trade balance, by major tradingpartners, 1996partners, 1996
Affiliate Transactions, 1991-95
As noted, trade in telecommunication services through foreign-based affiliates isdramatically increasing in importance due to liberalization of market access andforeign-ownership restrictions undertaken unilaterally or through multilateralagreements such as the General Agreement on Trade in Services (GATS). In 1995,sales of telecommunication services by foreign affiliates of U.S. firms substantiallyoutpaced those by U.S. affiliates of foreign firms. Sales by foreign affiliates of U.S.firms amounted to $3.7 billion, while corresponding purchases from U.S. affiliates offoreign firms totaled $941 million. Sales to the United Kingdom amounting to $1.1268
billion in 1995 stood out markedly, both by growing 68 percent above sales in 1994and by accounting for 29 percent of all telecommunication sales by foreign affiliatesof U.S. firms. The large growth in U.S. affiliate sales in the United Kingdom is269
likely related to the liberalization of foreign ownership restrictions in the UnitedKingdom’s telecommunication market.

FCC, Statistics of Communications Common Carriers, 1995.270
Facilities-based services are those provided using transmission facilities owned in271
whole or in part by the carrier providing the service. There are two types of resale services. A carrier provides pure resale services by272
switching traffic to another carrier, which subsequently transmits the originating carriers’traffic over its network. A carrier provides facilities resale services by sending traffic overtransmission facilities leased from other carriers. See Chapter 4 for further information concerning the WTO agreement and individual273
country commitments. Roger Fillion, “U.S. FCC Adopts Rules for Telecom Trade Pact,” Reuters, through the274
PointCast Network, Nov. 25, 1997.
3-74
Summary and Outlook
The preceding discussion reveals that both cross-border exports and imports oftelecommunication services increased relatively strongly in 1996, although importsgrew more than exports in absolute terms. The increase in cross-border transactionsreflects growth in international calling volume, which may have been fostered by U.S.Government efforts to reduce settlement rates and promote liberalization. Additional270
rate reductions are expected to result from the successful conclusion of the WorldTrade Organization (WTO) negotiations on basic telecommunications trade.Signatories to the agreement include the United States and 68 of its leading tradingpartners, together representing over 90 percent of global telecommunication servicerevenues. Subject to explicit exceptions listed by trading partners, the agreementprovides foreign telecommunication carriers with access to local, long-distance, andinternational service markets through all means of network technology (e.g., wireline,cellular, microwave, and satellite technology), either on a facilities basis or through271
resale. The agreement also ensures that foreign investors can acquire, establish, or272
hold a significant stake in many foreign telecommunication companies, and obligatesmost U.S. trading partners to maintain or implement largely new pro-competitivetelecommunication regulations. Commitments made through this agreement enteredinto force in early 1998 when supplementary telecommunication schedules became partof the GATS.273
As a result of this agreement, competition is being introduced into telecommunicationmarkets around the world that should lead to decreases in rates paid by consumers forboth domestic and international services. Charges for international calls are expectedto be reduced by 70 to 80 percent over 5 years from the present average of 88 cents perminute paid by U.S. callers. As rates decline, consumers will be more likely to274
originate calls, resulting in growth of U.S. cross-border transactions, both outgoing andincoming. Since collection charges, consisting of the fees collected from consumers bytelecommunication carriers, are likely to decline more sharply in foreign markets thanin the United States where prices are already relatively low, the U.S. cross-border tradedeficit may improve. However, the fact that the United States tends to make more callsthan it receives suggests that the United States will continue to post deficits even asglobal prices converge.
Another major achievement of the WTO basic telecommunications agreement is theprogress it makes with respect to foreign participation in domestic telephone markets.The agreement’s provisions on foreign direct investment will provide greater

To comply with U.S. commitments under the WTO agreement, the FCC adopted the275
Foreign Carrier Entry Order on November 25, 1997. This Order opens the U.S. market tomore competition from foreign telecommunication carriers. Prior to the FCC action, foreigncarriers wishing to enter the U.S. market had to demonstrate that U.S. carriers had effectivecompetitive opportunities in the foreign market. This reciprocity provision has beenreplaced by an open entry standard, under which the FCC presumes that foreign entry isprocompetitive and, therefore, applies streamlined procedures for granting applications. FCC, "Commission Liberalizes Foreign Participation in the U.S. TelecommunicationsMarket," FCC News Release, found at Internet address http://www.fcc.gov/, posted Nov. 25,1997, retrieved Dec. 2, 1997. FCC, “Commission Adopts International Settlement Rate Benchmarks,” FCC News276
Release, found at Internet address http://www.fcc.gov/, posted Aug. 7, 1997, retrieved Nov.11, 1997. Ibid.277
3-75
opportunities for U.S. carriers to establish or acquire a foreign commercial presence.As U.S. firms increase their presence abroad, corresponding sales through affiliates willincrease. While foreign firms may similarly invest in the United States, increasing275
U.S. purchases, it is likely that the balance of such investment will flow out of theUnited States, leading to strong growth in the existing U.S. surplus in affiliatetransactions. In addition to increasing affiliate transactions, U.S. firms participatingin foreign markets are likely to become more competitive by acquiring multinationalexpertise and a broader base of sales and assets.
Another factor that may affect the balance of trade in telecommunication services is theunilateral action taken by the FCC to reduce imbalances in settlement rates paidbetween U.S. and foreign carriers. Existing settlement rates are substantially largerthan the actual costs incurred by foreign carriers for terminating calls that originate inthe United States. According to the FCC, nearly 70 percent of U.S. settlement276
payments are not justified by the cost of service, meaning U.S. consumers are in effectsubsidizing foreign telecommunication carriers. In an effort to bring these settlement277
rates closer to actual costs, the FCC adopted the International Settlement RateBenchmarks order on August 7, 1997. The order, which went into effect on January1, 1998, requires U.S.-licensed carriers to negotiate new settlement rates that fall withina benchmark range of 15 cents per minute for upper income countries and 23 cents perminute for lower income countries. These benchmarks must be reached at the end ofa 5-year transition period. Through this order, the FCC has essentially declared thatU.S. carriers will no longer pay settlement rates that are not substantially based on thecost of service.
If the FCC Order succeeds in reducing settlement rates, the cost of international callsoriginating in the United States may decline significantly. However, the effects oflower settlement rates on the U.S. deficit in cross-border telecommunication servicesis less clear. For example, lower settlement rates could encourage U.S. consumers tomake more calls of longer duration, and the resulting increase in call volume couldmitigate the price effect on the balance of trade. Also, if settlement rates are onlyreduced for calls between the United States and other countries, consumers fromcountries that are still paying higher rates may have an incentive to route their callsthrough the United States using call-back services, which could further increase thevolume of calls categorized as originating in the United States. In the end, increases

This category mainly covers transactions for freight and port services for the278
transportation of goods by ocean, air, and truck to and from the United States. USDOC, BEA, Survey of Current Business, Oct. 1997.279
Ibid.280
3-76
in U.S. call volume could compensate for the reduction in settlement rates, leaving theUnited States with a sustained deficit in cross-border telecommunication trade.
Transportation Services
Introduction
For the purpose of this discussion, transportation service receipts include passengerfares, freight transportation receipts, and receipts for port services and othertransportation services. Trade data pertaining to transportation services are availablefor both cross-border and majority-owned affiliate transactions. Although cross-bordertrade predominates, the relative importance of cross-border delivery and affiliatetransactions varies substantially depending upon both the type of transportation serviceprovided and the geographic location of the countries involved. For example, trade inairline transportation services is inherently a cross-border transaction, whereas salesby affiliates play a large role in freight transportation in countries where regulatorybarriers prohibit cross-border trade.
Recent Trends
Cross-Border Trade, 1991-96
Transportation services contribute significantly to overall U.S. cross-border trade inservices. In 1996, exports and imports of transportation services accounted for 22percent and 31 percent of all cross-border service exports and imports, respectively.U.S. cross-border exports of transportation services totaled $47.8 billion, up from theprevious year’s level by 3 percent (figure 3-35). Such growth was slower than the 4-percent average annual increase recorded during 1991-95. Cross-border imports oftransportation services, amounting to $44.2 billion in 1996, increased byapproximately 4 percent. This, too, was slower than the average annual increase of 5percent recorded during 1991-95. As the $1.5-billion increase in imports surpassed the$1.2-billion gain in exports in 1996, the U.S. cross-border trade surplus intransportation services decreased by 5 percent, from $3.8 billion in 1995 to $3.6 billionin 1996. The slower growth of cross-border exports of transportation services was dueprincipally to a decrease in exports of ocean freight and port services. A decrease278
in exports of ocean freight services may have been due to a reduction of freight ratesper ton attributable to overcapacity in the ocean freight market. A decrease in279
exports of ocean port services may have been due to a decline in the volume of foreignvessels handled in U.S. ports and lower costs of goods and services in U.S. ports.280
The lower growth rate of imports of transportation services was due primarily to alower growth rate in imports of ocean freight and port services.

1991 1992 1993 1994 1995 19960
10
20
30
40
50
60Exports Imports Trade balance
Billion dollars
Source: U.S. Department of Commerce, Bureau of Economic Analysis, Survey of Current Business, Sept. 1994,Sept. 1995, Nov. 1996, and Oct. 1997, pp. 108-109.
3-77
Figure 3-35Transportation services: U.S. cross-border exports, imports, and tradebalance, 1991-96
Major U.S. trading partners in transportation services in 1996, as in previous yearsunder review, included Japan, Canada, the United Kingdom, Korea, Germany, andTaiwan (figure 3-36). Both exports and imports of transportation services between theUnited States and trading partners Canada, the United Kingdom, and Korea continuedto rise in 1996. However, imports of transportation services from both Japan andTaiwan decreased as a result of decreased imports of freight and port services, whichdominate imports from these countries. Imports of ocean freight services experiencedthe most significant decline in both countries, reflecting the general trend mentionedabove. Exports of transportation services to Germany decreased mainly as a result ofdecreased exports of ocean port services provided to German freighters. During 1991-96, the United States posted a persistent trade surplus with Japan, primarily stemmingfrom substantial airline passenger fare exports. However, the United States postedchronic deficits on trade in transportation services with the United Kingdom. Thisdeficit, principally the result of U.S. residents’ trips aboard British airlines, hasremained above $1 billion per year since 1993.
Affiliate Transactions, 1991-95
Sales by foreign-based affiliates of U.S. firms rose from $8.8 billion in 1994 to $9.5billion in 1995, or by 9 percent, which was slower than the average annual growth rateof 15 percent recorded during 1991-94 (figure 3-37). Purchases from U.S.-basedaffiliates of foreign firms grew by 8 percent, from $10.4 billion in 1994 to $11.2billion in 1995. This was slower than the average annual growth rate of 10 percentrecorded during 1991-94. The resulting deficit of $1.6 billion principally reflectedforeign firms’ strong presence in the United States, primarily attributable to the sizeand openness of the U.S. market. The deficit did not change significantly in 1995.

Taiwan
Germany
Korea
United Kingdom
Canada
Japan
-2 0 2 4 6 8 10
Exports Trade balanceBillion dollars
Source: U.S. Department of Commerce, Bureau of Economic Analysis, Survey of Current Business, Oct. 1997, p. 115.
1991 1992 1993 1994 1995-4
-2
0
2
4
6
8
10
12
14 Sales Purchases Balance
Billion dollars
Source: U.S. Department of Commerce, Bureau of Economic Analysis, Survey of Current Business, Sept. 1994,Sept. 1995, Nov. 1996, and Oct. 1997, pp. 137-138.
3-78
Figure 3-36Figure 3-36Transportation services: U.S. cross-border exports and trade balance, by major tradingTransportation services: U.S. cross-border exports and trade balance, by major tradingpartners, 1996partners, 1996
Figure 3-37Figure 3-37Transportation service transactions by majority-owned affiliates: U.S. sales, purchases, andTransportation service transactions by majority-owned affiliates: U.S. sales, purchases, andbalance, 1991-95balance, 1991-95

Intermodal transportation is the conveyance of freight by at least two modes of281
transport, i.e., rail, maritime, and trucking. “Transportation,” U.S. Industry & Trade Outlook ‘98, p. 43-13.282
Ibid., p. 43-10.283
“Passenger Traffic Forecast,” International Air Transport Association, 1997.284
Leo Quigley, “Asia-Pacific Business Booming,” Traffic World, July 14, 1997.285
3-79
Although much of the country-specific data on transactions by majority-ownedaffiliates of transportation services are unavailable, to prevent disclosing informationon the operation of individual firms, available data indicate that Europe is the largesttrading partner of the United States, accounting for 47 percent of U.S. sales and 59percent of U.S. purchases through affiliates in 1995. Individual country data indicatethat Canadian affiliates of U.S. firms accounted for 18 percent of U.S. sales oftransportation services in 1995, followed by British affiliates, with 17 percent, andGerman affiliates, with 14 percent. U.S. purchases from U.S.-based affiliates offoreign firms appear to be dominated by British- and Japanese-owned affiliates, whichaccounted for 26 percent and 21 percent of U.S. purchases, respectively.
Summary and Outlook
Cross-border transactions continue to dominate trade in transportation services. Thisrelationship is likely to continue because of the global expansion of trade and increasedair transport liberalization. Air, rail, and maritime transportation continue toexperience growth as a consequence of deregulation and consolidation. Theimplementation of NAFTA and increasing intermodal transportation will likely281
contribute to increased trucking freight traffic with Canada and Mexico. Overall,worldwide intermodal traffic is expected to continue strong growth relative to othermodes in 1997.
The U.S. airline industry experienced strong growth in 1996 after achieving an industrynet profit in 1995 for the first time since 1989. The industry experienced huge net282
losses in the early 1990s due to overcapacity, the U.S. recession, the Gulf War, andrising fuel prices. U.S. carriers were obliged to cut operating costs in order to regainprofitability. In 1996, a number of airlines were able to pay a portion of theiroutstanding debt, lowering their debt to equity ratios and reducing interest expenses.283
Airlines are likely to continue attempting to control labor costs, which are their highestoperating expense, with low-cost airlines driving the cost-cutting trend.
Air traffic, both passenger and freight, continues to grow strongly. The InternationalAir Transport Association predicts an increase in air travel by an average of 6.6 percentworldwide, between 1997 and 2001. The highest growth is expected to be found in284
Northeast and Southeast Asia, followed by the southern cone of South America. TheAPEC Transportation Committee predicted that international air traffic between PacificRim nations would continue to grow by approximately 7.4 percent annually until2010. The growing number of bilateral “Open Skies” treaties will likely increase285
passenger and freight traffic as countries liberalize their air service agreements. “OpenSkies” treaties lift curbs on flights between countries and allow the continuation offoreign-originated flights to third countries. The United States is pursuing bilateral“Open Skies” treaties in several regions. The U.S. Government seeks full liberalization

Code-sharing is the practice of marketing two or more airlines’ flights under a single286
code in computer reservation systems, giving greater priority on reservation screens to thejoint flights. Terry Brennan, “Mergers Reshaping Maritime,” Traffic World, June 9, 1997.287
Industry representative, telephone interview by USITC staff, Oct. 14, 1997.288
David Biederman, “Waiting for Deregulation,” Traffic World, June 9, 1997.289
Industry representative, telephone interview by USITC staff, Oct. 14, 1997.290
Ibid.291
Rail intermodal traffic is the rail component of intermodal shipping.292
Industry representative, telephone interview by USITC staff, Oct. 9, 1997.293
3-80
with each treaty, but certain countries are resisting immediate liberalization in favor ofgradual liberalization over several years.
“Open Skies” treaties are also encouraging the formation of international passengerairline alliances. The U.S. Government has offered antitrust immunity to signatorycountries for airline alliances. Alliances extend the reach and scope of services offeredby airlines, as carriers jointly market their flights through code-sharing and revenue286
pooling. Alliances allow airlines to extend their route systems without adding the costsof new aircraft and crew. Code-sharing alliances between pairs of airlines, andstrategic alliances that create global networks will likely reduce costs and increasepassenger traffic. Alliances in air freight are less prevalent, and have not had muchsuccess. Nevertheless, freight traffic is also expected to grow, possibly due to theincreasing importance of just-in-time shipping and a strong U.S. economy.
The maritime industry is experiencing consolidation in the form of ocean carriermergers and multi-carrier alliances. Mergers that create economies of scale and enablerigorous cost reduction programs have freed the capital necessary to invest in larger,cost-efficient containerships. While the trend towards building larger containerships287
will likely continue, smaller ports may be unable to handle the larger containerships288
and the resulting increase of intermodal traffic. Consequently, larger ports will likelybecome hub ports, or load center ports, that feed smaller ports. Increased traffic willchallenge port capacity and intermodal connections while shipping rates continue todecrease, due largely to increased competition and overcapacity in the industry.289
Pacific Rim trade is expected to increase, with much of the growth coming from U.S.trade with China. Traffic with Latin America is expected to grow due in part toincreased political stability.
The Association of American Port Authorities expects U.S. legislation to continue thederegulation of ocean shipping. Legislation that increases the amount of confidentialitybetween shippers and carriers is expected to increase price competition if it is passed.U.S. carriers, which are required to file their shipping rates while foreign carriers arenot, suffer from a competitive disadvantage in negotiating shipping contracts.290
U.S. rail firms are changing from conveyors of bulk commodities, such as coal andgrain, to conveyors of intermodal freight. Intermodal traffic is the second-largestsource of revenue for railroad transportation, and is expected to supplant coal as thelargest source of revenue in the next several years. Rail intermodal traffic291 292
increased by 6 percent to 7 percent annually during 1991-96. The Association of293

Pradnya Joshi, “As U.S. Economy Soars, Shipping Delays Grow,” Newsday, Los294
Angeles Times - Washington Post News Service, Oct. 2, 1997. “Transportation,” U.S. Industry & Trade Outlook ‘98, p. 43-19.295
Ibid., p. 43-20.296
3-81
American Railroads projects 3- to 5-percent growth of intermodal shipping in 1997.Strong 8-percent growth was recorded in the first three quarters of 1997. 294
U.S. rail firms are consolidating domestically in order to enhance their competitiveposture and improve operating margins, while looking to generate revenue throughparticipation in newly privatized Mexican railroads. U.S. acquisitions in Mexico areconsistent with the pattern of consolidation in the U.S. rail industry, which has beendriven by the need to reduce costs in an increasingly competitive environment. U.S.railroad companies have purchased minority stakes in the busiest Mexican railroad, andanother U.S. company is in the process of acquiring a stake in the second busiestMexican railroad. In both cases, Mexican groups maintain the controlling interest.Private investment in Mexico’s railway system may boost rail utilization, encourage themodernization of existing routes, and motivate creation of new connections between theUnited States and Mexico. 295
The trucking industry has experienced increased traffic with Mexico since NAFTA wasenacted. Truck traffic with Canada also increased during 1991-96, and will likelycontinue to do so. Spurred by cost-containment measures in the manufacturingindustry, many large manufacturers are locating their facilities within a 1-day haul oftheir suppliers in order to take advantage of just-in-time inventory systems. Such296
strategies are boosting freight volumes, and the trucking industry expects continuedhigh growth in intermodal traffic spurred by increased freight volumes.
Travel and Tourism Services
Introduction
Trade in travel and tourism services encompasses expenditures made by travelers whilein another country, such as for lodging and meals. U.S. exports are inbound travelers’expenditures in the United States, whereas U.S. imports are U.S. travelers’expenditures abroad. Although passenger fares may be considered a component oftravel and tourism revenues, such fares fall outside the scope of this discussion.Passenger fares are addressed in the previous discussion of transportation services.Travel and tourism services are traded mainly through cross-border channels, althoughaffiliate trade also takes place.

1991 1992 1993 1994 1995 19960
10
20
30
40
50
60
70
80Exports Imports Trade balance
Billion dollars
Source: U.S. Department of Commerce, Bureau of Economic Analysis, Survey of Current Business, Oct. 1997,pp. 108-109.
3-82
Recent Trends
Cross-Border Trade, 1991-96
In 1996, the United States earned $69.9 billion from cross-border travel and tourismexports (figure 3-38), representing 32 percent of total U.S. service exports. Cross-border exports increased by 10 percent in 1996, faster than the average annual growthrate of 7 percent during 1991-95. Cross-border imports of $48.7 billion in 1996reflected 6-percent growth, slightly below the average annual growth rate of 7 percentduring 1991-95. The resulting U.S. surplus of $21.2 billion in 1996 grew by 22percent, triple the average annual growth rate of 7 percent during 1991-95 (despite adecline in the surplus in 1994). Much of the increase in exports and the surplus couldbe attributed to the 1996 Olympic Games in Atlanta. Expenditures by visitors to theUnited States increased significantly before and during the Olympics.
Figure 3-38Figure 3-38Travel and tourism services: U.S. cross-border exports, imports, and trade balance, 1991-96Travel and tourism services: U.S. cross-border exports, imports, and trade balance, 1991-96

Mexico
Germany
Canada
United Kingdom
Japan
-5 0 5 10 15
Exports Trade balanceBillion dollars
Source: U.S. Department of Commerce, Bureau of Economic Analysis, Survey of Current Business, Oct. 1997, p. 115.
3-83
Visitors from Japan, the United Kingdom, Canada, Germany, and Mexico, ranked byexpenditures in the United States, accounted for one-half of U.S. cross-border traveland tourism exports in 1996 (figure 3-39). The United States recorded a travel andtourism trade surplus with all these countries except Mexico, with which it recorded adeficit amounting to $3 billion. The peso devaluation in late 1994 adversely affectedcross-border travel and tourism trade with Mexico. Thereafter, U.S. exports to Mexicoplummeted by 41 percent in 1995, and recovered by only 5 percent in 1996.Meanwhile, U.S. imports from Mexico continued to grow during 1991-96, by 12percent in 1996 alone, and contributed to a widening U.S. deficit in travel and tourismtrade with Mexico. Of the countries with which the United States experienced asurplus in 1996, Japan accounted for the largest share of U.S. travel and tourismexports, 19 percent, and the largest trade surplus, at $10 billion. Japanese travelers’expenditures in the United States grew by 12 percent in 1996.
Receipts from other Asia-Pacific nations combined also posted a strong increase,growing by 17 percent in 1996 and generating a $3-billion surplus. This made 1996the only year during 1991-96 in which U.S. receipts from Asia-Pacific countries ($23.3billion) exceeded those from Europe ($23.0 billion). It is also the only year in whichexpenditures of Canadian visitors to the United States increased. U.S. travel andtourism services exports to Canada grew by 9 percent in 1996 after experiencing anaverage annual decline of 8 percent during 1991-95. As measured by imports, theleading foreign destinations for U.S. travelers during 1991-96 were Mexico, the UnitedKingdom, Canada, and Japan, which collected $6 billion, $4.8 billion, $4.6 billion, and$3.2 billion, respectively, from these travelers in 1996.
Figure 3-39Figure 3-39Travel and tourism services: U.S. cross-border exports and trade balance, by major tradingTravel and tourism services: U.S. cross-border exports and trade balance, by major tradingpartners, 1996partners, 1996

U.S. Industry & Trade Outlook ‘98, pp. 44-1, 44-2.297
3-84
Affiliate Transactions, 1991-95
As noted, travel and tourism services are also sold through majority-owned affiliates.However, data on affiliate transactions in such services are available only for thelodging industry, comprising hotels, motels, and similar establishments. Foreign-basedlodging affiliates of U.S. firms generated sales estimated at $2.8 billion in 1995, up by26 percent from 1994 (figure 3-40). Such growth was six times greater than the 4-percent average annual growth rate recorded during 1991-94. U.S. purchases fromforeign-owned lodging affiliates in the United States increased by 12 percent, to $7.5million, in 1995. This was slightly above the average annual increase of 10 percentduring 1991-94. The resulting $4.7-billion U.S. deficit in affiliate transactions, whilelarger by 5 percent than the 1994 deficit, was far less than that which would haveresulted had it increased at the average annual rate of 14 percent experienced during1991-94. Available data on U.S.-owned affiliates’ transactions indicate that sales werelargest in Canada, which accounted for 14 percent, followed by the United Kingdom,Australia, and France (figure 3-41). Conversely, Japanese-owned affiliates accountedfor the largest single share, 37 percent, of total U.S. purchases of travel and tourismservices, as well as the largest U.S. deficit in such services. British-owned affiliatesplaced second, accounting for 14 percent of U.S. purchases.
Summary and Outlook
The 46 million visitors arriving in the United States in 1996 surpassed arrivals in allother countries except France, which attracted 62 million. Travelers to the UnitedStates accounted for 8 percent of arrivals anywhere in the world. Moreover, the UnitedStates accounted for 16 percent of worldwide expenditures by international travelers.297
These data indicate that foreign travelers tend to spend substantially more when visitingthe United States than when visiting other countries, in the aggregate.
Although Canada and Mexico accounted for nearly half of the foreign tourist arrivalsin the United States in 1996, these two countries ranked behind Japan and the UnitedKingdom as sources of U.S. travel and tourism revenue. In part, this reflects the shorterduration of stays by Canadian and Mexican travelers. Nonetheless, recentimprovements in the Canadian economy could enable Canadians to spend higheramounts in the United States in 1997 and may even enable their spending to approachlevels attained in the early 1990s. Expenditures by Mexico’s visitors to the UnitedStates likewise may be expected to rebound further as the adverse consequences of the1994 peso devaluation dissipate.

1991 1992 1993 1994 1995-6
-4
-2
0
2
4
6
8
10Sales Purchases Balance
Billion dollars
Source: U.S. Department of Commerce, Bureau of Economic Analysis, Survey of Current Business,Sept. 1994, Sept. 1995, Nov. 1996, and Oct. 1997, pp. 137-138.
Japan
France
Australia
United Kingdom
Canada
-3000 -2500 -2000 -1500 -1000 -500 0 500
Sales BalanceMillion dollars
Source: U.S. Department of Commerce, Bureau of Economic Analysis, Survey of Current Business,Oct. 1997, pp. 137-138.
3-85
Figure 3-40Figure 3-40Travel and tourism services transactions by majority-owned affiliates: U.S. sales, purchases, andTravel and tourism services transactions by majority-owned affiliates: U.S. sales, purchases, andbalance, 1991-95balance, 1991-95
Figure 3-41Figure 3-41Travel and tourism services transactions by majority-owned affiliates: U.S. sales and balance, byTravel and tourism services transactions by majority-owned affiliates: U.S. sales and balance, bymajor trading partners, 1995major trading partners, 1995

Marion Bywater, “The Impact of the Single European Currency on the Travel and298
Tourism Market,” Travel and Tourism Intelligence, No. 5, 1997 (Oct. 1997), pp. 99-100. Michael Mackey, “Where Have All the Tourists Gone?” Air Transport World, vol. 34299
(Dec. 1997), p. 22. Carrie Lee, HK Poultry Dealers Denounce Compensation Offer, Reuters News300
Service, found at Internet address http://www.yahoo.com/headlines/, posted Jan. 6, 1997,5:17 p.m., retrieved Jan. 7, 1998. ASEAN Ministers Begin Two-Day Smog Meeting, Reuters News Service, found at301
Internet address http://www.pathfinder.com/, posted Dec. 22, 1997, 8:22 EST, retrieved Jan. 7, 1998, and Nisid Hajari, “Dark Cloud of Death,” Time Asia, Oct. 6, 1997.
3-86
The outlook for U.S. travel and tourism revenue generated from European countries isalso positive and may ease expected weakness in U.S. exports derived from anticipateddecreases in Asia-Pacific travelers to the United States. Moreover, Europe is likely toremain the dominant beneficiary of U.S. travel expenditures. It is believed that, in thelong run, a single European currency, once implemented, may simplify travel andreduce consumer prices. However, in the short run, costs of conversion to a singlecurrency could exert upward pressure on prices, and consumers could delaydiscretionary travel until assured about use of the new currency.298
The outlook for exports derived from visitors to the United States from the Asia-Pacificregion was believed to be positive prior to declines in several Asian currencies andstock markets beginning in mid-1997. Currently, arrivals and expenditures in theUnited States, Europe, and within the Asia-Pacific region by travelers from Asiancountries are expected to be negatively affected by these events, as potential travelersfrom Indonesia, Malaysia, South Korea, and Thailand lost substantial savings andincome that would have enabled or motivated travel abroad. Such travel may fall below1996 levels for some time.
With respect to prospective U.S. imports, a number of Asia-Pacific countries reportedlyfear declines in U.S. travelers in reaction to recent events. Hong Kong’s return toChina and public health concerns over the avian flu in Hong Kong, as well as299 300
forest fire-bred smog that spread over much of Southeast Asia may have dampenednormally strong tourism growth.301

In 1995, the global market for all telecommunication services was valued at $6021
billion, reflecting average annual growth of 9.8 percent since 1990. Basictelecommunication services are generally assumed to account for about 85 percent of thisfigure, or $512 billion. See International Telecommunication Union (ITU), WorldTelecommunication Development Report 1996-97 (Geneva: ITU, 1997), p. 29; andAmbassador Jeffrey M. Lang, testimony before the House Subcommittee on Commerce,Trade, and Hazardous Materials, May 9, 1996. Facilities-based services are those provided using transmission facilities owned in whole2
or in part by the carrier providing the service. There are two types of resale services. A carrier provides pure resale services by3
switching traffic to another carrier, which subsequently transmits the originating carriers’traffic over its network. A carrier provides facilities resale services by sending traffic overtransmission facilities leased from other carriers. Most-favored-nation (MFN) status accords to one trading partner terms and conditions4
of trade that are no less favorable than those accorded to any other trading partner. Certain schedules indicate that commitments will be phased in. In these instances, the5
schedules will enter into force on February 5, 1998, but the actual implementation date ofthe subject commitments will be the date specified in the national schedules. The GATS entered into force on January 1, 1995.6
4-1
CHAPTER 4Examination of WTO Agreement onBasic Telecommunications
Introduction
On February 15, 1997, the World Trade Organization (WTO) concluded nearly 3 yearsof extended negotiations on the $512-billion global market for basic telecommunicationservices. Signatories to the agreement include the United States and 68 of its trading1
partners, which together represent over 90 percent of global telecommunication servicerevenues. Subject to explicit exceptions listed by trading partners, the agreementprovides U.S. telecommunication carriers with access to local, long-distance, andinternational service markets through all means of network technology (e.g., wireline,cellular, and satellite technology), either on a facilities basis or through resale. The2 3
agreement also ensures that U.S. investors can acquire or establish telecommunicationcompanies in many countries, and obligates most U.S. trading partners to maintain orimplement largely new, procompetitive telecommunication regulations. Parties to theagreement have predominantly scheduled binding commitments regarding marketaccess, investment, and regulatory principles on a most-favored-nation basis.4
Signatories’ commitments became operative on February 5, 1998, when5
supplementary telecommunication schedules were folded into the General Agreementon Trade in Services (GATS). 6

Hong Kong’s commitments under the GATS remain in effect for 50 years following its7
restoration to China, which occurred July 1, 1997. Hong Kong’s trade obligations weregrandfathered by the Sino-British Joint Declaration on the Question of Hong Kong, ratifiedon May 27, 1985. The GATT Secretariat’s Services Sectoral Classification List (MTN.GNS/W/120)8
specified 155 distinct services over which negotiations were to be conducted during theUruguay Round of the GATT, now replaced by the WTO. Basic telecommunicationservices account for 7 of the 155 services listed by the Secretariat. Packet-switched services entail dividing data messages into discrete units called9
packets, which are then routed individually over telecommunication networks. Packet-switching provides for more efficient use of telecommunication networks for interactive datacommunications because shorter packets may be routed through momentarily unutilizedtransmission equipment. By contrast, circuit-switching establishes an end-to-end circuit forthe duration of interactive data transmissions, prohibiting use of the circuit for otherpurposes until the connection is closed. Harry Newton, Newton’s Telecom Dictionary, 11thed. (New York: Flatiron Publishing, 1996), p. 129. Telex is a global messaging system that, while popular and sometimes faster and more10
reliable than voice and data telephony in some foreign countries, is being replaced by fasterand more reliable electronic mail and facsimile services. Ibid., p. 601. Private leased line services range from providing users with a leased line or circuit,11
which is dedicated solely to use by that customer, to establishing dedicated networks for theprovision of voice, data, and value-added (e.g., electronic mail) services.
4-2
This chapter examines commitments scheduled by the 20 largest foreign signatories tothe agreement for the purposes of identifying the benefits conferred, and restrictionsimposed, on U.S. service providers. The 20 largest foreign signatories, which accountfor 60 percent of global telecommunication service revenues, include, in descendingorder, the European Union (EU), Japan, Australia, Canada, Switzerland, Korea, Brazil,Mexico, Argentina, Hong Kong, India, South Africa, Norway, Indonesia, Singapore,7
Israel, Poland, Malaysia, New Zealand, and Thailand. Basic telecommunicationservices, as delineated in the GATT Secretariat’s Services Sectoral Classification List,8
include voice, packet-switched data transmission, circuit-switched data transmission,9
telex, telegraph, facsimile, and private leased circuit services.10 11
Methodology
For the purposes of this examination, USITC staff have gathered information byconducting in-person and telephone interviews with domestic and foreign firms,telecommunication regulators, and other government authorities. In addition, USITCstaff have drawn information from secondary sources, specifically trade journals andindustry reports.
Examinations of foreign telecommunication commitments are qualitative in nature;USITC staff have made no attempt to quantify the benefits of this agreement. Examinations of the schedules proceed on a country-by-country basis, with theexception of the examination of the EU schedule, which inscribes the commitments ofthe 15 EU Member States.

Indonesia and Malaysia declined to submit questionnaires to the NGBT. To12
characterize the nature of commitments scheduled by these countries, USITC staff drawfrom information gathered through interviews with telecommunication regulators conductedin these countries in February 1997. Certain other parties to the WTO agreement, such asBrazil, India, Israel, Poland, Singapore, South Africa, and Thailand, did not submitresponses to the NGBT questionnaire until 1995-96.
4-3
Each examination begins by identifying the scope of services covered by thecommitments and summarizing the extent to which the commitments broadly permitforeign carriers to enter local, long-distance, and international markets; to accesswireline, cellular, and satellite networks; to provide facilities-based and resale services;and to invest in telecommunication carriers. In addition, the discussion specifies theprocompetitive regulatory principles adopted by each subject trading partner. Theexaminations predominantly identify the terms and conditions under which foreignfirms may provide basic telecommunication services. However, because commitmentson regulatory principles will affect foreign provision of enhanced, as well as basic,telecommunication services, each examination briefly notes the extent to which theinscribed commitments promote or impede trade in enhanced services.
Where possible, the examinations identify rollback commitments, which liberalize tradeand investment policies; standstill commitments, which bind current policies; andregressive commitments, which add further restrictions on trade and investment.USITC staff have identified rollback, standstill, and regressive commitments bycomparing the commitments scheduled in February 1997 with questionnaire responsesthat summarize pre-existing regulatory policies and practices in foreign markets. Mostparties to the WTO Negotiating Group on Basic Telecommunications (NGBT)completed these questionnaires in September-October 1994 to facilitate negotiations.12
The inscription of rollback commitments is one of the distinguishing achievements ofthe WTO basic telecommunication agreement, as commitments scheduled for otherservices during the Uruguay Round are overwhelmingly standstill commitments.Standstill commitments establish benchmarks and enhance regulatory transparency, butdo not achieve actual trade liberalization.
Summary tables following the text provide readers with a quick reference to keyelements of the subject countries’ commitments. The first summarizes key elementsof signatories’ commitments on basic telecommunication services. The secondsummarizes commitments on enhanced telecommunication services, scheduled in April1994.
WTO Agreement on Basic Telecommunication Services
Before proceeding to the examination of foreign schedules, it is appropriate to describebriefly the elements of the WTO agreement on basic telecommunication services, thenature of trade in telecommunication services, and the variance of the subject tradingpartners in terms of market size, firm size, and investment. There is no singledocument which embodies the basic telecommunication agreement. Rather, theagreement comprises several documents, the content and interrelationships of which setforth the agreement, and consequently influence the content and interpretation of basic

Although there are 69 signatories to the agreement, the schedules number 55 as the EU13
submitted a unified schedule that inscribes the commitments of all 15 member states. The U.S. International Trade Commission has published several reports that examine14
in detail the commitments scheduled by GATS signatories. See USITC, General Agreementon Trade in Services: Examination of Major Trading Partners’ Schedules ofCommitments, USITC publication 2940, 1995; USITC, General Agreement on Trade InServices: Examination of South American Trading Partners’ Schedules of Commitments,USITC publication 3007, 1996; USITC, U.S. Trade Shifts in Selected Industries: Services,USITC publication 2969, 1996; USITC, Recent Trends in U.S. Services Trade, USITCpublication 3041, 1997; and USITC, General Agreement on Trade in Services:Examination of Schedules of Commitments Submitted by Asia/Pacific Trading Partners,USITC publication 3053, 1997. The legal enforceability of the GATS offers service providers a predictable avenue for15
redress if their exports or sales are impaired by trade barriers erected by other WTOmembers. GATS signatories are entitled to consultations with trading partners and access tothe formal dispute settlement mechanism available under the WTO. Uruguay Round Agreements Act (URAA) Statement of Administrative Action (SAA),16
published in H. Doc. 103-316, 103d Cong., 2d Session, 1994. The Statement ofAdministrative Action was submitted to the Congress on September 27, 1994, incompliance with section 1103 of the Omnibus Trade and Competitiveness Act of 1988, andaccompanied the implementing bill for the Agreement Establishing the World TradeOrganization and the agreements annexed to that Agreement (the Uruguay RoundAgreements). In enacting the URAA, Congress approved the Statement of AdministrativeAction (see URAA, sec. 101(a)(2), approved Dec. 8, 1994; Pub. Law 103-465, 108 Stat.4809; hereafter URAA documents). SAA, p. 297; URAA documents, p. 966.
4-4
telecommunication commitments. At a minimum, the agreement comprises the FourthProtocol to the GATS, 55 supplementary schedules of commitments, 9 lists of most-13
favored-nation (MFN) exemptions, a reference paper on procompetitive regulatoryprinciples, and 2 notes on scheduling methodology from the Chairman of the WTO’sGroup on Basic Telecommunications (GBT) (figure 4-1). The text below discussesthese documents, as well as documents that shaped negotiations and the ultimateagreement (table 4-1).
The General Agreement on Trade in Services
The principal document shaping the telecommunication agreement is the GATS, whichis an annex to the Agreement Establishing the World Trade Organization signed inMarrakesh, Morocco, on April 15, 1994. The GATS is the first multilateral, legally14
enforceable agreement covering trade and investment in services. The GATS15 16
comprises three elements: (1) a framework of general obligations and disciplines forgovernment regulation of trade and investment in services; (2) a series of annexes andministerial decisions that supplement rules found in the framework and provide forfollow-on activities or additional negotiations; and (3) national schedules whereincountries inscribe commitments to accord foreign service providers market access andnational treatment, subject to defined exceptions (figure 4-2).

4-5

4-6
Table 4-1Elements of the WTO agreement on basic telecommunication services
Document Highlights
General Agreement on Trade in Services (GATS) C Calls on WTO members to observe 14 general(Apr. 15, 1994) obligations conducive to trade and investment in
services (e.g., MFN treatment, regulatorytransparency, domestic regulations, monopoliesand exclusive service providers)
C Calls on WTO members to schedule marketaccess, national treatment, and additional(optional) commitments specific to certainindustries, including basic telecommunicationsand enhanced telecommunications, in nationalschedules of commitments
C Calls on WTO members to observe eightannexes, two of which pertain totelecommunications (Annex onTelecommunications and Annex on Negotiationson Basic Telecommunications)
Ministerial Decision on Negotiations on Basic C Specifies that WTO members would participate inTelecommunications (Dec. 15, 1993) negotiations pertaining to basic
telecommunication services on a voluntary basisC Specifies that negotiations should be
comprehensive in scopeC Establishes Negotiating Group on Basic
Telecommunications (NGBT) to carry outnegotiations
C Specifies that negotiations should commence nolater than May 16, 1994, and conclude by April 30, 1996
C Prohibits implementation of measures that wouldimprove negotiating position and leverage
Annex on Telecommunications (Apr. 15, 1994) C Requires WTO members to allow serviceproviders access to and use of publictelecommunication transport networks andservices (PTTNS)
C Requires WTO members to interconnect privateleased or owned circuits with PTTNS or withcircuits leased or owned by another servicesupplier
C Requires WTO members to allow the use ofprotocols of the service supplier’s choice in thesupply of any service
C Requires WTO members to allow servicesuppliers use of PTTNS for the movement ofinformation within and across borders, includingfor intra-corporate communications of suchservice suppliers
C Provides for technical cooperation through bodiessuch as the International TelecommunicationUnion (ITU) and International Organization forStandardization (IOS)
C Excludes cable and broadcast distribution of radioand television programming from scope of thenegotiations
Annex on Negotiations on Basic C Requires WTO members to accord MFNTelecommunications (Apr. 15, 1994) treatment by agreed date if negotiations succeed,
or by April 30, 1996, if negotiations do notsucceed

4-7
Table 4-1—ContinuedElements of the WTO agreement on basic telecommunication services
Document Highlights
Decision on Commitments in Basic C Council for Trade in Services adopts the “FourthTelecommunications (Apr. 30, 1996) Protocol to the General Agreement on Trade in
Services” C Establishes period from January 15, 1997 to
February 15, 1997, during which WTO memberswith schedules attached to the Fourth Protocolmay supplement or modify national schedules andlists of MFN exemptions
C Establishes the Group on BasicTelecommunications (GBT) to carry negotiationsforward to February 15, 1997
C Allows WTO members which have not attachednational schedules or lists of MFN exemptions tothe Fourth Protocol to submit such documents byJanuary 1, 1998
Fourth Protocol to the General Agreement on Trade C Annexes national schedules and lists of MFNin Services (Apr. 30, 1996) exemptions to the GATS
C Establishes November 30, 1997 as date foracceptance of protocol (and thus final nationalschedules and lists of MFN exemptions)
C Indicates that the Protocol will enter into force onJanuary 1, 1998
Chairman’s Note of January 16, 1997 C Outlines assumptions underlying scheduledcommitments on basic telecommunicationservices
C Unless explicitly exempted in the schedules, basictelecommunication services:
(i) encompass local, long-distance, andinternational services for public and non-public use;(ii) may be provided on a facilities basis or byresale; and(iii) may be provided through any means ofnetwork technology (e.g., wireline, terrestrialwireless (cellular), or satellite)
C Indicates private leased circuit services involve theability to sell or lease any type of network capacity(e.g., that on wireline, cellular, or satellitenetworks) for the provision of any type of basictelecommunication services, unless explicitlyexempted
C WTO members may maintain separate entries forcellular or mobile services
Chairman’s Note of February 3, 1997 C WTO members do not need to listfrequency/spectrum management policies,including the ability to allocate frequency bandstaking into account existing and future needs, asmarket access restrictions

Table 4-1—ContinuedElements of the WTO agreement on basic telecommunication services
Document Highlights
4-8
Report of the Group on Basic Telecommunications C Summarizes issues addressed since April 30,(Feb. 15, 1997) 1996
C Indicates that 55 schedules (submitted by 69countries) and 9 lists of MFN exemptions hadbeen submitted by February 15, 1997 (Note: TheEuropean Union (EU-15) submitted a jointschedule.)
C Indicates agreement among WTO members thatdifferential accounting rates applied tointernational traffic should not give rise to disputesettlement procedures as MFN violations, yetindicates this understanding will be reviewed nolater than January 1, 2000
C Notes further national schedules and lists of MFNexemptions may be submitted prior to January 1, 1998
55 Schedules of Commitments and 9 Lists of MFN C List market access and national treatmentExemptions (Feb. 15, 1997) commitments on basic telecommunication
services in 69 countries, abiding by Chairman’snotes
C List commitments on procompetitive regulatoryprinciples found in the Reference Paper, whetherin part or in entirety
C List exemptions to MFN treatment by 9 WTOmembers
Reference Paper on Procompetitive Regulatory Provides for:Principles (Feb. 15, 1997) (i) safeguards to protect against anticompetitive
practices by major suppliers;(ii) interconnection to PTTNS undernondiscriminatory terms and conditions;(iii) nondiscriminatory and competitively neutraluniversal service requirements;(iv) transparent licensing criteria;(v) independent regulators; and(vi) nondiscriminatory allocation of scarceresources, including frequencies, numbers, andrights of way
Source: Compiled by USITC staff from World Trade Organization, found at Internet address http://www.wto.org/, andChairman’s Notes (S/GBT/W/2/Rev. 1 of Jan. 16, 1997) and (S/GBT/W/3 of Feb. 3, 1997).

4-9
Figure 4-2Structure of the General Agreement on Trade in Services
GATS
Framework of Rules of Commitments Ministerial Decisions
Contains general obligations Provide information regardingconducive to international trade on-going negotiations and rightsin services, including: to temporary MFN exemptions,
C Most-Favored-NationtreatmentC TransparencyC Increasing participation of developing countriesC Economic integrationC Domestic regulationC RecognitionC Monopolies and exclusiveservice suppliersC Business practicesC Emergency safeguard
measuresC Payments and transfersC Restrictions to safeguardthe balance of paymentsC Government procurementC General exceptionsC Subsidies
National Schedules Annexes and
Submitted by each of 131signatory countries. Theschedules contain commitmentsregarding restrictions andlimitations to market access andnational treatment. Schedulestypically comprise:
C Cross-industry commitmentsC Industry-specific commitments
with respect to 4 modes ofsupply:
-cross-border supply -consumption abroad -commercial presence -presence of natural
personsC MFN exemptions (optional)
including:
C Annex on MFN exemptionsC Annex on movement of natural
persons supplying servicesunder the Agreement
C Annex on financial servicesC Second annex on financial
servicesC Annex on negotiations on
maritime transport servicesC Annex on telecommunicationsC Annex on negotiations on basic telecommunicationsC Decision on Institutional Arrangements for the GATSC Decision on Certain Dispute Settlement Procedures for the GATSC Decision on Trade in Services and the EnvironmentC Decision on Negotiations on Movement of Natural PersonsC Decision on Financial ServicesC Decision on Negotiations on Maritime Transport ServicesC Decision on Negotiations on Basic TelecommunicationsC Decision on Professional ServicesC Understanding on Commitments in Financial
Services
Source: Compiled by USITC staff from World Trade Organization, legal texts, found at Internet addresshttp://www.wto.org/wto/legal/.

Despite the general obligation to observe the most-favored-nation principle, signatories17
to the agreement could register narrowly defined exceptions. Nine WTO memberssubmitted Lists of Article II (MFN) Exemptions in February 1997. These members wereAntigua and Barbados, Argentina, Bangladesh, Brazil, India, Pakistan, Sri Lanka, Turkey,and the United States.
4-10
The GATS Framework
The GATS framework lists 14 obligations and disciplines intended to facilitateinternational trade and investment in services. The telecommunication agreementincorporates the obligations set forth in the framework and, in some instances, fleshesout certain obligations, making them directly applicable to basic telecommunicationservices. For instance, the telecommunication agreement incorporates Article II of theframework, which generally obligates WTO members to accord other members MFNtreatment. The WTO members’ interest in achieving an MFN-based17
telecommunication agreement motivated them to extend talks past December 1993,when most other GATS negotiations concluded. Prior to December 1993, somemembers expressed concern that trade liberalizing commitments scheduled on an MFNbasis would disadvantage firms from open markets. Specifically, the concern was thatfirms from restrictive markets, “free-riding” on the MFN principle, would be able toenter relatively liberal markets, while firms from liberal markets could still beprohibited from entering restrictive markets, and left with little leverage to negotiatefuture entry. While this concern existed in other service industries, too, it wasparticularly acute in so-called “infrastructure services” — telecommunication, financial,and transportation services — the vitality and efficiency of which exert a strongeconomy-wide influence. The interest in negotiating MFN-based, trade-liberalizingcommitments on basic telecommunication services led to a delay in negotiations untilsuch a time as negotiators and regulators could focus a large share of their energies onthese talks.
Other key framework obligations reflected in the telecommunication agreement includethose on regulatory transparency (article III), domestic regulation (article VI), andmonopolies and exclusive service providers (article VIII). Article III requires promptpublication of measures relevant to trade and investment in services, and notificationof changes to these measures. Article VI requires that all measures affecting trade inservices be administered in a reasonable, objective, and impartial manner. Article VIIIrequires WTO members to ensure that monopoly service providers in their marketsobserve MFN obligations and that monopolies and other firms with market power donot act in a manner inconsistent with scheduled commitments. The telecommunicationagreement fleshes out certain of these obligations in the reference paper on pro-competitive regulatory principles, which is discussed below.
The Annex on Telecommunications
The Annex on Telecommunications influenced the scope of negotiations and ensuredthat all firms requiring the use of telecommunication networks would be provided withadequate access. To set the scope, the annex stipulates that negotiations would focuson “public telecommunication transport networks and services,” thereby signaling thatWTO members would negotiate conditions of access to and use of telecommunicationfacilities as well as the provision of services. The annex also stipulates that cable andbroadcast distribution of radio and television programming would be outside the scope

Cable and broadcast distribution of radio and television programming reside within the18
scope of the GATS, but are treated as audiovisual services rather than basictelecommunication services. WTO, The Results of the Uruguay Round of Multilateral Trade Negotiations19
(Geneva: WTO, 1995), p. 359. WTO, The Results of the Uruguay Round, p. 461.20
WTO members continued talks principally at the insistence of U.S. negotiators, who21
considered the commitments submitted by most other trading partners to be insufficientlytrade-liberalizing. WTO, “Trade in Services: Decision on Commitments in Basic Telecommunications,”22
found at Internet address http://www.wto.org/, retrieved Feb. 20, 1997.
4-11
of negotiations. This was significant as it placed the provision of audiovisual services18
through satellite networks outside the scope of the telecommunication agreement. Withrespect to establishing an acceptable degree of network access, the annex stipulates thatforeign firms requiring the use of telecommunication facilities would be accordedaccess to and use of public telecommunication networks on reasonable andnondiscriminatory terms and conditions. Thus, providers of enhanced19
telecommunication services, financial services, and computer services, among others,obtained some degree of certainty that they would not be disadvantaged in performingtheir core businesses due to adverse terms and conditions of accessingtelecommunication services and facilities.
Ministerial Decisions and the Fourth Protocol
Two ministerial decisions also shaped the telecommunication agreement. TheMinisterial Decision on Negotiations on Basic Telecommunications, issued December15, 1993, indicated that negotiations on basic telecommunication services would beundertaken on a voluntary basis and would be comprehensive in scope, with no basictelecommunication service excluded in the absence of a thorough examination andagreement among negotiators. It also established the NGBT to undertake negotiations;indicated that the NGBT should make its final report no later than April 30, 1996; andproscribed for the duration of the talks the implementation of measures that wouldimprove negotiating position and leverage. 20
When WTO members agreed to extend talks past the April 1996 deadline, the Councilfor Trade in Services adopted the Decision on Commitments in BasicTelecommunications. The decision, issued April 30, replaced the NGBT with the21
GBT; established January 15 to February 15, 1997, as the period during which WTOmembers could modify or supplement schedules and MFN exemption lists; adopted theFourth Protocol in order to preserve the best offers to date, and to incorporate finalizedschedules and MFN exemptions in the GATS; and invited WTO members who had notparticipated in the negotiations to submit commitments and MFN exemptions forapproval by January 1, 1998.22

In addition, 29 countries have submitted applications to join the WTO. Schedules23
submitted by these countries are under review by accession working parties. WTO, WTOMembership, found at Internet address, http://www.wto.org/, retrieved May 22, 1997. In addition, most GATS signatories have scheduled cross-industry (horizontal)24
commitments to market access and national treatment that pertain to all service industrieslisted in their schedules. For a fuller discussion of the GATS and scheduling methodologies, see USITC,25
General Agreement on Trade in Services: Examination of Major Trading Partners’Schedules of Commitments, USITC publication 2940, 1995; USITC, General Agreementon Trade In Services: Examination of South American Trading Partners’ Schedules ofCommitments, USITC publication 3007, 1996; USITC, U.S. Trade Shifts in SelectedIndustries: Services, USITC publication 2969, 1996; USITC, Recent Trends in U.S.Services Trade, USITC publication 3041, 1997; and USITC, General Agreement on Tradein Services: Examination of Schedules of Commitments Submitted by Asia/Pacific TradingPartners, USITC publication 3053, 1997.
4-12
Supplementary Schedules on Basic Telecommunication Services
Scheduling Methodology
Most of the detail of the GATS appears in national schedules of commitments. Todate, 131 countries have specified commitments on trade and investment in services,23
predominantly on a sector-by-sector basis. GATS signatories schedule commitments24
on both market access and national treatment with respect to four distinct modes ofsupply (i.e., cross-border supply, consumption abroad, commercial presence, andpresence of natural persons), meaning that eight explicit or implicit schedule entries arerecorded for each of the industries currently covered under the GATS.
Within national schedules, trading partners have in many cases inscribed “full” marketaccess and/or national treatment commitments, which indicate that no sector-specificrestrictions exist, or “partial” commitments, which describe existing restrictions. Inother cases, trading partners have indicated that trade and investment restrictionsremain “unbound.” Importantly, full and partial commitments are “binding” under theterms of the GATS, meaning that they prevent countries from becoming morerestrictive in the future, unless those countries that regress are willing to compensateaggrieved parties. Where countries have indicated that limitations remain unbound,they have preserved the right to impose additional restrictions on market access and/ornational treatment in the future without penalty.25
Telecommunication Schedules
Commitments on basic telecommunication services appear in supplementary schedulesof commitments and constitute the bulk of the telecommunication agreement. Basictelecommunication schedules are especially complex because they not only delineatemarket access and national treatment commitments regarding the seven basictelecommunication services, but communicate commitments regarding distinctgeographic telecommunication markets (e.g., local, long-distance, and internationalmarkets), distinct network technologies (e.g., wireline, cellular, and satellite networks),and facilities-based and resale services. Further, the supplementary schedules delineatecommitments regarding regulatory principles.

The term “non-public use” covers services provided over private networks, such as26
those used for intracorporate communications. The Chairman’s note of January 16, 1997, obviated the need to explicitly schedule27
commitments specific to cellular and satellite services. However, many GBT membersopted to schedule commitments on these services apart from those on wireline services. WTO, Group on Basic Telecommunications, Report of the Group on BasicTelecommunications, p. 1-2, found at Internet address http://www.wto.org/, retrieved Feb.20, 1997. Ibid., p. 1-3.28
4-13
Chairman’s Notes
To facilitate the scheduling of commitments on geographic markets, networktechnologies, and facilities-based and resale services, the Chairman of the GBT issueda note to WTO members on January 16, 1997. The note indicated that unlessotherwise specified in the schedule, commitments pertaining to basictelecommunication services would apply to (1) local, long-distance, and internationalservices for public and non-public use; (2) networks based on all transmission26
technologies (e.g., wireline, cellular, and satellite networks); and (3) facilities-based andresale services. The note also indicated that unless otherwise specified, private leased27
circuit services encompass telecommunication carriers’ ability to sell or lease capacityon wireline or wireless networks for the supply of any of the other basictelecommunication services.
Thus, each supplementary telecommunication schedule implicitly or explicitly indicatesthrough its market access and national treatment commitments the extent to whichforeign telecommunication firms may gain access to local, long-distance, andinternational service markets through all means of network technologies, on a facilitiesbasis or through resale. Additionally, each supplementary schedule indicates the extentto which foreign firms may acquire, establish, or hold significant shares in othertelecommunication firms.
To further clarify schedules, the Chairman issued another note on February 3, 1997.This note recognized the legitimacy of domestic frequency and spectrum management,and indicated that GBT members need not identify frequency and spectrum policies asmarket access restrictions so long as members comply with article VI of the GATS.28
As noted, article VI requires that regulations pertaining to trade and investment inservices be reasonable, impartial, and objective.
Reference Paper
Supplementary schedules also delineate GBT members’ commitments onprocompetitive regulatory principles. During the course of negotiations, GBT membersdeveloped a reference paper listing these principles as means to safeguard the value ofmarket access commitments. These procompetitive principles include:
C Safeguards against anticompetitive practices, including cross-subsidization, among monopolies or other firms with marketpower;

Universal service requirements generally specify that every citizen should have access29
to basic telecommunication services at affordable prices. WTO, Group on Basic Telecommunications, Reference Paper, found at Internet30
address http://www.wto.org/, retrieved Feb. 20, 1997. WTO, The WTO Negotiations on Basic Telecommunications found at Internet address31
http://www.wto.org/, retrieved June 11, 1997. ITU, World Telecommunication Development Report 1996-97, p. 2.32
For a fuller discussion of mobile satellite systems, see USITC, “Mobile Satellite33
Services,” Industry, Trade, and Technology Review (ITTR), USITC publication 3054, July1997.
4-14
C Timely and cost-based interconnection under nondiscriminatoryterms, conditions, rates, and quality;
C Transparent and nondiscriminatory universal servicerequirements that are no more burdensome than necessary;29
C Transparent and publicly available licensing criteria and reasonsfor denial;
C Independence of regulators and suppliers of basictelecommunication services; and
C Objective, timely, transparent, and nondiscriminatory allocation ofscarce resources, including frequencies, numbers, and rights ofway.30
In February 1997, 57 of the 69 governments negotiating the agreement scheduledcommitments on the procompetitive principles contained in the reference paper inwhole or in part. Six other countries scheduled commitments that bind them toobserve regulatory principles of their own creation.31
International Trade in Basic Telecommunication Services
Cross-Border Supply
Data regarding international trade in telecommunication services are incomplete, asdata exist for only one of the four modes of trade referenced in the GATS: cross-border supply. Among all modes, cross-border supply predominates (table 4-2). Thismode principally comprises international calling, which in 1995 generated $53 billionin global retail revenues and $28 billion in international net settlement payments (seebox 4-1).32
International calls cross international gateways in the originating and terminatingcountries and are predominantly transmitted through undersea cables or satellitesystems (figure 4-3). To date, satellite telecommunications have been provided byinternational satellite organizations such as INTELSAT and INMARSAT, regionalorganizations such as EUTELSAT and ARABSAT, and private firms, such asPanAmSat. Soon, however, mobile satellite systems such as Iridium, Globalstar,Odyssey, and ICO will provide international calling services using mobile handsets,similar to cellular phones. Impediments to international calling include restricted33

ITU, World Telecommunication Development Report 1996-97, p. 45.34
4-15
Table 4-2The four modes of supplying telecommunication services
Mode of delivery Cross-border presence abroad natural personsCommercial Consumption Presence of
Example International Foreign-owned Roaming between Consultingtelephone calls. company offering cellular or satellite services.
telecommunication systems.services.
Significance for Predominant Second most Growing due to Growing due totelecommunication mode of trade in common mode of popularity and demand for advicetrade telecommunication trade in penetration of in area of network
services. telecommunication wireless systems. development andservices. privatization.Significance isgrowing in light ofthe privatizationtrend.
Examples of Restrictions on Foreign investment Incompatible Restrictions onexisting trade cable landing limitations and technical working permits.barriers rights and satellite licensing standards, lack of
gateway. restrictions. roamingagreements, anddiscriminatoryspectrumallocation.
Source: International Telecommunication Union, World Telecommunication Development Report 1996-97;World Trade Organization; and USITC staff.
cable landing rights, restricted access to satellite gateways, and especially with respectto mobile satellite systems, restricted interconnection with the public switched networkand discriminatory allocation of radio frequencies.
Commercial Presence
The second most common mode of supply is commercial presence, althoughcomprehensive data on sales through such establishments do not exist. Commercialpresences include representative offices, joint ventures, strategic partnerships, andsubsidiaries. This form of trade has grown as countries have privatized state-ownedcarriers, a trend which began when the United Kingdom privatized Cable and Wirelessin 1981. By year-end 1996, 44 public telecommunication operators had been partiallyor wholly privatized worldwide. Privatizations of public telecommunication operatorshave attracted investment valued at $159 billion, one-third of which has been providedby investors outside the country undertaking privatization.34
Commercial presences provide local, long-distance, and international calling throughwireline, cellular, and satellite networks. Foreign operators have been most successfulin establishing cellular systems for local calling purposes, in part because manycountries have allowed competition in the wireless market since its inception.

4-16
Figure AInternational net settlement payments, 1990-95
Box 4-1International settlement payments
Settlement payments are made in accordance with the C originating and terminating carriers were“accounting rate system,” fashioned by European monopolies, capable of unilaterally setting andcarriers in the latter half of the nineteenth century. maintaining collection charges.This system has been updated progressively since,with the most recent changes promulgated in 1988, These conditions, present at the inception of thebut the basic elements of the system remain accounting rate system, no longer exist due tounchanged. Under the accounting rate system, regulatory and technological developments over thetelecommunication carriers bilaterally negotiate fees, past 15 years. For instance, many countries havecalled accounting rates, for carrying international introduced competition in the international callingtraffic, measured in calling minutes. Each carrier’s market, which has driven collection chargesportion of the accounting rate is referred to as the downward in these countries, and outbound callingsettlement rate, which in almost all cases is equal to volume upward. The resulting tendency towardone-half of the negotiated accounting rate. As greater traffic imbalances, and thus larger settlementimbalances in traffic flows occur, the carrier whose payments (figure A), has been exacerbated byoutbound calling minutes exceed its inbound calling technological developments that enable, for example,minutes makes a net settlement payment to its foreign the provision of country-direct and call-back services,counterpart. The net settlement payment is essentially which allow callers in high-cost markets to directlycalculated by multiplying the settlement rate by the access carriers in low-cost markets, and dial out atnumber of imbalanced calling minutes. Net cheaper rates. These calls appear as outbound calls1
settlement payments register as imports on the in the low-cost country, and consequently requirebalance of payments, whereas net settlement receipts register as exports. This system worked well as longas:
C collection charges (i.e., the fee collected by theoriginating carrier from the business or residentialcaller) were equivalent between
2
Settlement payments may also reflect surcharges that some1
countries impose on collect and country-direct calls. ITU, World Telecommunication Development Report, 1996-2
97, p. 91.
countries, so that there was no trade-distortingincentive for callers in low-cost countries tooriginate a disproportionate share of internationalcalls;
C the volume of incoming and outgoing traffic wascomparable, so that net settlement payments werenot too large; and
Table AAccounting rates negotiated by the United Statesand the subject countries, 1990 and 1997
Country 1990 1997 Change1
Argentina $1.65 $0.92 -44.2%
Australia 0.8 SDR 0.308 SDR -62.3%2
Brazil $2.50 $1.03 -58.8%
Canada $0.28 $0.22 -21.4%
EU 1.18 SDR 0.31 SDR -74.4%3
Hong Kong $2.20 0.58 SDR -63.2%
India $2.25 $1.58 -29.8%
Indonesia $2.00 $1.30 -35.0%
Israel $2.40 $0.96 -60.0%
Japan 1.34 SDR 0.63 SDR -53.9%
Korea Rep. $2.10 0.72 SDR -52.4%
Malaysia $2.00 $0.89 -55.5%
Mexico $1.32 $0.70 -47.0%
New Zealand 1.80 SDR 0.20 SDR -89.1%
Norway 1.00 SDR 0.20 SDR -80.3%
Poland $1.50 $0.70 -53.3%
Singapore 0.84 SDR 0.62 SDR -28.3%
South Africa $2.00 $1.00 -50.0%
Switzerland 1.12 SDR 0.255 SDR -78.0%
Thailand $2.30 $1.50 -34.8%
Average $1.80 $0.78 -56.7%
Percentage changes reflect change in dollar-denominated1
accounting rates. A SDR is a special drawing right from the International2
Monetary Fund. SDRs were valued at $1.42266 in 1990, and at$1.39180 on June 1, 1997. Figures reflect the average accounting rate among the 153
Member States of the European Union.
Source: FCC

4-17
Box 4-1—ContinuedInternational settlement payments
settlement payments by the most-efficient, low-cost which would allow originating carriers to keep all thecarriers. revenues they collect. In addition, some countries3
There is also sentiment among low-cost countries that example, adopted international settlement rateaccounting rates are too high, in part because benchmarks on August 7, 1997. Under this system,monopoly providers in many countries have little the FCC established settlement rates that vary by theincentive to negotiate these fees downward. High-cost national income of U.S. trading partners: $0.15 percountries are often the beneficiaries of the accounting minute for upper income countries, $0.19 per minuterate system because high prices discourage outbound for upper middle countries, and $0.23 per minute forinternational calls, leaving them with calling lower income countries. The United States and itsimbalances in their favor and net settlement receipts trading partners will move to these rates over a 5-yearwith which to improve telecommunication networks transition period.and fund other government programs. Although accounting rates have declined in the past severalyears (table A), these rates remain far above theincremental cost of carrying international traffic,estimated by the Federal CommunicationsCommission to be between $0.12 and $0.18 perminute. 4
In this light, the ITU and other multilateral bodies haveexplored options for modifying the accounting ratesystem, or replacing it altogether. Proposals includethe imposition of call termination charges, which arefixed fees that are more transparent and lessdiscriminatory than bilaterally negotiated accountingrates; facilities-based interconnection charges, whichwould tie fees to the incremental cost of carryinginbound traffic; and a sender-keeps-all system,
5
have taken unilateral action. The United States, for
6
Refile practices, which route international3
telecommunication traffic through the least-cost path,thereby taking advantage of third countries with lowaccounting rates, also inflate net settlement payments bycarriers in low-cost countries. Federal Communications Commission (FCC), In the4
Matter of International Settlement Rates: Notice ofProposed Rulemaking, IB Docket No. 96-261, Dec. 19,1996, pp. 14-15. The average accounting rate between theUnited States and all trading partners, weighted by minutesof U.S. outbound traffic, is $0.73 per minute, whichtranslates into a settlement rate of approximately $0.36 perminute. ITU, pp. 95-96.5
FCC, News Release: Commission Adopts International 6
Settlement Rates.

4-18

Ibid., pp. A-57 through A-59.35
Ibid., p. A-84.36
4-19
Impediments to this mode of trade include foreign investment ceilings and licensingrestrictions.
Other Modes
Less common forms of trade in telecommunication services include consumptionabroad, principally international roaming between wireless (i.e., cellular and satellite)networks, and presence of natural persons, principally the provision of technical orfinancial consultancy. Yet, these forms of trade will likely grow in light of thepopularity of cellular systems, the advent of mobile satellite systems, and the demandfor technical and financial expertise among entities attempting to construct and upgradenetworks, fund modernization programs, and privatize state-owned operators.Historically, impediments to these forms of trade have included incompatible technicalstandards and restrictions on obtaining business visas.
Overview of Subject Countries
The largest 20 foreign signatories to the WTO basic telecommunication agreement aredisparate in terms of market size and infrastructure development, with wealthiernations, mostly member countries of the Organization for Economic Cooperation andDevelopment (OECD), constituting one distinct group, and developing nations, manyin East Asia, constituting the other (figure 4-4). The European Union and Japan, withrevenues of $170 billion and $94 billion, respectively, were the largest foreign marketsby a significant margin in 1995, and accounted for 74 percent of the revenue generatedin the subject markets (table 4-3). Other developed trading partners, with revenues35
of $9 to $11 billion, rounded out the top five in terms of market size. By comparison,Thailand, the smallest of the subject markets, generated revenues of $2 billion in 1995.Differences in firm size are similarly pronounced. NTT (Japan), Deutsche Telekom(Germany), France Telecom, British Telecom, Telecom Italia, Telefonica (Spain), andTelstra (Australia) generated revenues exceeding $10 billion in 1995 (table 4-4). TheTelephone Organization of Thailand (TOT), at the other extreme, generated $1.3billion in revenues.36

GDP per capita (1994 dollars)0 5000 10000 15000 20000 25000 30000 35000 40000
0
10
20
30
40
50
60
70
United States
Canada
European Union
Source: USITC staff.
Switzerland
Australia
India
Indonesia
Korea
Malaysia
Norway
Singapore
BrazilSouth Africa
Hong Kong
Poland
Thailand
Argentina
Israel
New Zealand
Japan
Mexico
1 Teledensity is a basic indicator of the development of telecommunication infrastructure, reporting the number of main telephone linesin a country for each 100 inhabitants.
4-20
Figure 4-4Teledensity and GDP in largest 20 foreign telecommunication service markets, 19951
Table 4-3Largest 20 foreign telecommunication markets measured by revenue, 1995
Rank Country Revenue
Million dollars
1 European Union . . . . . . . . . . . . . . . . . . . . . . . . . . . . . . . . . . . . . . . . . . . . . . . . . . . 170,458.6 2 Japan . . . . . . . . . . . . . . . . . . . . . . . . . . . . . . . . . . . . . . . . . . . . . . . . . . . . . . . . . . . 93,562.0 3 Australia . . . . . . . . . . . . . . . . . . . . . . . . . . . . . . . . . . . . . . . . . . . . . . . . . . . . . . . . . 11,493.3 4 Canada . . . . . . . . . . . . . . . . . . . . . . . . . . . . . . . . . . . . . . . . . . . . . . . . . . . . . . . . . . 10,274.2 5 Switzerland . . . . . . . . . . . . . . . . . . . . . . . . . . . . . . . . . . . . . . . . . . . . . . . . . . . . . . . 8,889.2 6 Korea . . . . . . . . . . . . . . . . . . . . . . . . . . . . . . . . . . . . . . . . . . . . . . . . . . . . . . . . . . . 8,727.8 7 Brazil . . . . . . . . . . . . . . . . . . . . . . . . . . . . . . . . . . . . . . . . . . . . . . . . . . . . . . . . . . . . 8,622.2 8 Mexico . . . . . . . . . . . . . . . . . . . . . . . . . . . . . . . . . . . . . . . . . . . . . . . . . . . . . . . . . . 6,509.1 9 Argentina . . . . . . . . . . . . . . . . . . . . . . . . . . . . . . . . . . . . . . . . . . . . . . . . . . . . . . . . 6,183.010 Hong Kong . . . . . . . . . . . . . . . . . . . . . . . . . . . . . . . . . . . . . . . . . . . . . . . . . . . . . . . 5,112.711 South Africa . . . . . . . . . . . . . . . . . . . . . . . . . . . . . . . . . . . . . . . . . . . . . . . . . . . . . . 3,674.712 India . . . . . . . . . . . . . . . . . . . . . . . . . . . . . . . . . . . . . . . . . . . . . . . . . . . . . . . . . . . . 3,253.21
13 Norway . . . . . . . . . . . . . . . . . . . . . . . . . . . . . . . . . . . . . . . . . . . . . . . . . . . . . . . . . . 3,234.314 Indonesia . . . . . . . . . . . . . . . . . . . . . . . . . . . . . . . . . . . . . . . . . . . . . . . . . . . . . . . . 2,735.015 Singapore . . . . . . . . . . . . . . . . . . . . . . . . . . . . . . . . . . . . . . . . . . . . . . . . . . . . . . . . 2,539.916 Israel . . . . . . . . . . . . . . . . . . . . . . . . . . . . . . . . . . . . . . . . . . . . . . . . . . . . . . . . . . . . 2,248.917 Poland . . . . . . . . . . . . . . . . . . . . . . . . . . . . . . . . . . . . . . . . . . . . . . . . . . . . . . . . . . 2,161.518 Malaysia . . . . . . . . . . . . . . . . . . . . . . . . . . . . . . . . . . . . . . . . . . . . . . . . . . . . . . . . . 2,097.519 New Zealand . . . . . . . . . . . . . . . . . . . . . . . . . . . . . . . . . . . . . . . . . . . . . . . . . . . . . 2,091.120 Thailand . . . . . . . . . . . . . . . . . . . . . . . . . . . . . . . . . . . . . . . . . . . . . . . . . . . . . . . . . 2,040.6
Estimates by ITU. 1
Source: International Telecommunication Union, World Telecommunication Development Report 1996-97.

4-21
Table 4-4Largest public telecommunication operators in largest 20 foreign markets, 1995Country/Company Total revenue
Million dollarsEuropean Union
Belgacom (Belgium) . . . . . . . . . . . . . . . . . . . . . . . . . . . . . . . . . . . . . . . . . . . . . . . . . . . . . . . . . . . 4,309.8BT (United Kingdom) . . . . . . . . . . . . . . . . . . . . . . . . . . . . . . . . . . . . . . . . . . . . . . . . . . . . . . . . . . . 22,785.5Deutsche Telekom (Germany) . . . . . . . . . . . . . . . . . . . . . . . . . . . . . . . . . . . . . . . . . . . . . . . . . . . 46,151.4France Télécom (France) . . . . . . . . . . . . . . . . . . . . . . . . . . . . . . . . . . . . . . . . . . . . . . . . . . . . . . . 29,610.3Mercury (United Kingdom) . . . . . . . . . . . . . . . . . . . . . . . . . . . . . . . . . . . . . . . . . . . . . . . . . . . . . . 2,690.7OTE (Greece) . . . . . . . . . . . . . . . . . . . . . . . . . . . . . . . . . . . . . . . . . . . . . . . . . . . . . . . . . . . . . . . . 2,559.9Portugal Télécom (Portugal) . . . . . . . . . . . . . . . . . . . . . . . . . . . . . . . . . . . . . . . . . . . . . . . . . . . . . 2,145.1PTA (Austria) . . . . . . . . . . . . . . . . . . . . . . . . . . . . . . . . . . . . . . . . . . . . . . . . . . . . . . . . . . . . . . . . . 4,306.0PTT Telecom (Netherlands) . . . . . . . . . . . . . . . . . . . . . . . . . . . . . . . . . . . . . . . . . . . . . . . . . . . . . 8,487.9Tele Danmark (Denmark) . . . . . . . . . . . . . . . . . . . . . . . . . . . . . . . . . . . . . . . . . . . . . . . . . . . . . . . 3,363.0Telecom Italia (Italy) . . . . . . . . . . . . . . . . . . . . . . . . . . . . . . . . . . . . . . . . . . . . . . . . . . . . . . . . . . . . 18,463.4Telefónica (Spain) . . . . . . . . . . . . . . . . . . . . . . . . . . . . . . . . . . . . . . . . . . . . . . . . . . . . . . . . . . . . . 11,007.8Telia (Sweden) . . . . . . . . . . . . . . . . . . . . . . . . . . . . . . . . . . . . . . . . . . . . . . . . . . . . . . . . . . . . . . . . 5,755.5Vodafone (United Kingdom) . . . . . . . . . . . . . . . . . . . . . . . . . . . . . . . . . . . . . . . . . . . . . . . . . . . . . 2,211.7
JapanDDI . . . . . . . . . . . . . . . . . . . . . . . . . . . . . . . . . . . . . . . . . . . . . . . . . . . . . . . . . . . . . . . . . . . . . . . . . 7,119.0JT . . . . . . . . . . . . . . . . . . . . . . . . . . . . . . . . . . . . . . . . . . . . . . . . . . . . . . . . . . . . . . . . . . . . . . . . . . 3,567.8KDD . . . . . . . . . . . . . . . . . . . . . . . . . . . . . . . . . . . . . . . . . . . . . . . . . . . . . . . . . . . . . . . . . . . . . . . . 2,640.2NTT . . . . . . . . . . . . . . . . . . . . . . . . . . . . . . . . . . . . . . . . . . . . . . . . . . . . . . . . . . . . . . . . . . . . . . . . 84,080.1
AustraliaTelstra . . . . . . . . . . . . . . . . . . . . . . . . . . . . . . . . . . . . . . . . . . . . . . . . . . . . . . . . . . . . . . . . . . . . . . 10,430.7
BrazilTelebras . . . . . . . . . . . . . . . . . . . . . . . . . . . . . . . . . . . . . . . . . . . . . . . . . . . . . . . . . . . . . . . . . . . . . 9,387.5
SwitzerlandSwisscom . . . . . . . . . . . . . . . . . . . . . . . . . . . . . . . . . . . . . . . . . . . . . . . . . . . . . . . . . . . . . . . . . . . 8,747.0
KoreaKT . . . . . . . . . . . . . . . . . . . . . . . . . . . . . . . . . . . . . . . . . . . . . . . . . . . . . . . . . . . . . . . . . . . . . . . . . 8,464.5
MexicoTelmex . . . . . . . . . . . . . . . . . . . . . . . . . . . . . . . . . . . . . . . . . . . . . . . . . . . . . . . . . . . . . . . . . . . . . . 6,509.0
CanadaBell Canada . . . . . . . . . . . . . . . . . . . . . . . . . . . . . . . . . . . . . . . . . . . . . . . . . . . . . . . . . . . . . . . . . . 5,960.2
ArgentinaTelefónica . . . . . . . . . . . . . . . . . . . . . . . . . . . . . . . . . . . . . . . . . . . . . . . . . . . . . . . . . . . . . . . . . . . 2,732.4Telecom . . . . . . . . . . . . . . . . . . . . . . . . . . . . . . . . . . . . . . . . . . . . . . . . . . . . . . . . . . . . . . . . . . . . . 1,980.7
Hong KongHong Kong Telecom . . . . . . . . . . . . . . . . . . . . . . . . . . . . . . . . . . . . . . . . . . . . . . . . . . . . . . . . . . . 3,818.9
South AfricaTelkom . . . . . . . . . . . . . . . . . . . . . . . . . . . . . . . . . . . . . . . . . . . . . . . . . . . . . . . . . . . . . . . . . . . . . . 3,674.7
NorwayTelenor . . . . . . . . . . . . . . . . . . . . . . . . . . . . . . . . . . . . . . . . . . . . . . . . . . . . . . . . . . . . . . . . . . . . . . 3,133.8
SingaporeSingapore Telecom . . . . . . . . . . . . . . . . . . . . . . . . . . . . . . . . . . . . . . . . . . . . . . . . . . . . . . . . . . . . 2,627.3
IndiaDOT . . . . . . . . . . . . . . . . . . . . . . . . . . . . . . . . . . . . . . . . . . . . . . . . . . . . . . . . . . . . . . . . . . . . . . . . 2,439.6
IndonesiaPT Telkom . . . . . . . . . . . . . . . . . . . . . . . . . . . . . . . . . . . . . . . . . . . . . . . . . . . . . . . . . . . . . . . . . . . 2,270.3
IsraelBezeq . . . . . . . . . . . . . . . . . . . . . . . . . . . . . . . . . . . . . . . . . . . . . . . . . . . . . . . . . . . . . . . . . . . . . . . 2,248.9
MalaysiaTM . . . . . . . . . . . . . . . . . . . . . . . . . . . . . . . . . . . . . . . . . . . . . . . . . . . . . . . . . . . . . . . . . . . . . . . . . 2,097.5
New ZealandTCNZ . . . . . . . . . . . . . . . . . . . . . . . . . . . . . . . . . . . . . . . . . . . . . . . . . . . . . . . . . . . . . . . . . . . . . . . 2,091.1
PolandTP . . . . . . . . . . . . . . . . . . . . . . . . . . . . . . . . . . . . . . . . . . . . . . . . . . . . . . . . . . . . . . . . . . . . . . . . . 2,036.0
ThailandTOT . . . . . . . . . . . . . . . . . . . . . . . . . . . . . . . . . . . . . . . . . . . . . . . . . . . . . . . . . . . . . . . . . . . . . . . . 1,259.2CAT . . . . . . . . . . . . . . . . . . . . . . . . . . . . . . . . . . . . . . . . . . . . . . . . . . . . . . . . . . . . . . . . . . . . . . . . 664.7
Source: International Telecommunication Union, World Telecommunication Development Report 1996-97.

Ibid., pp. A-60 through A-63.37
4-22
The EU and Japan also lead in terms of investment in telecommunication infrastructure,accounting for 72 percent of the investment undertaken in the subject markets. Yet,two developing countries, Brazil and Korea, place among the top five in terms ofinvestment, reflecting the relatively significant sums developing countries arechanneling into telecommunications (table 4-5). In fact, when countries are rankedaccording to the share of their telecommunication revenues channeled into constructingnetwork infrastructure, the developing countries of East Asia, Latin America, and EastEurope place highest (figure 4-5). Indonesia, Malaysia, and India lead the list,investing between 55 percent and 60 percent of telecommunication revenues inimproving telecommunication infrastructure. Thus, a significant number of37
developing countries appear committed to the construction of advancedtelecommunication networks that may one day rival the best seen in OECD countries.
Table 4-5Investment in largest 20 foreign telecommunication markets, 1995TotalRank Country Investment
Million dollars
1 European Union . . . . . . . . . . . . . . . . . . . . . . . . . . . . . . . . . . . . . . . . . . . . . . . . . 41,007.3 2 Japan . . . . . . . . . . . . . . . . . . . . . . . . . . . . . . . . . . . . . . . . . . . . . . . . . . . . . . . . . 35,442.3 3 Brazil . . . . . . . . . . . . . . . . . . . . . . . . . . . . . . . . . . . . . . . . . . . . . . . . . . . . . . . . . . 4,404.1 4 Korea . . . . . . . . . . . . . . . . . . . . . . . . . . . . . . . . . . . . . . . . . . . . . . . . . . . . . . . . . 3,634.21
5 Australia . . . . . . . . . . . . . . . . . . . . . . . . . . . . . . . . . . . . . . . . . . . . . . . . . . . . . . . 2,818.8 6 Argentina . . . . . . . . . . . . . . . . . . . . . . . . . . . . . . . . . . . . . . . . . . . . . . . . . . . . . . 2,609.4 7 Switzerland . . . . . . . . . . . . . . . . . . . . . . . . . . . . . . . . . . . . . . . . . . . . . . . . . . . . . 2,580.5 8 Canada . . . . . . . . . . . . . . . . . . . . . . . . . . . . . . . . . . . . . . . . . . . . . . . . . . . . . . . . 2,096.1 9 India . . . . . . . . . . . . . . . . . . . . . . . . . . . . . . . . . . . . . . . . . . . . . . . . . . . . . . . . . . 1,793.510 Indonesia . . . . . . . . . . . . . . . . . . . . . . . . . . . . . . . . . . . . . . . . . . . . . . . . . . . . . . 1,650.611 Malaysia . . . . . . . . . . . . . . . . . . . . . . . . . . . . . . . . . . . . . . . . . . . . . . . . . . . . . . . 1,252.012 Hong Kong . . . . . . . . . . . . . . . . . . . . . . . . . . . . . . . . . . . . . . . . . . . . . . . . . . . . . 1,163.113 Mexico . . . . . . . . . . . . . . . . . . . . . . . . . . . . . . . . . . . . . . . . . . . . . . . . . . . . . . . . 1,106.914 Poland . . . . . . . . . . . . . . . . . . . . . . . . . . . . . . . . . . . . . . . . . . . . . . . . . . . . . . . . 886.215 Norway . . . . . . . . . . . . . . . . . . . . . . . . . . . . . . . . . . . . . . . . . . . . . . . . . . . . . . . . 809.416 South Africa . . . . . . . . . . . . . . . . . . . . . . . . . . . . . . . . . . . . . . . . . . . . . . . . . . . . 768.017 Israel . . . . . . . . . . . . . . . . . . . . . . . . . . . . . . . . . . . . . . . . . . . . . . . . . . . . . . . . . . 551.018 Singapore . . . . . . . . . . . . . . . . . . . . . . . . . . . . . . . . . . . . . . . . . . . . . . . . . . . . . . 435.919 New Zealand . . . . . . . . . . . . . . . . . . . . . . . . . . . . . . . . . . . . . . . . . . . . . . . . . . . 391.120 Thailand . . . . . . . . . . . . . . . . . . . . . . . . . . . . . . . . . . . . . . . . . . . . . . . . . . . . . . . 384.5 Total . . . . . . . . . . . . . . . . . . . . . . . . . . . . . . . . . . . . . . . . . . . . . . . . . . . . . . 105,784.9
Estimates by ITU. 1
Source: International Telecommunication Union, World Telecommunication Development Report 1996-97.

WTO, GATS, Argentina: Schedule of Specific Commitments, supp. 238
(GATS/SC/4/Suppl.2), Apr. 1997.
4-23
Figure 4-5Telecommunication investment as a share of revenue in largest 20 foreignmarkets, 1995
Argentina
Argentina’s commitments apply to all basic telecommunication services found in theGATT Secretariat’s classification list, except telegraph services (table 4-6). In38
addition, Argentina’s commitments address mobile telephone (MTS), personalcommunication, paging, special mobile radio (SMR) trunking, and mobile dataservices. The commitments will allow foreign firms nearly unrestricted access toArgentina’s telecommunication services markets on November 8, 2000. Until then,foreign firms may provide local and long-distance services only in cooperation with tworegional monopolies, Telecom Argentina in northern Argentina and Telefonica deArgentina in southern Argentina. International services may be provided solely throughthe carrier TELINTAR, which is jointly owned by Argentina’s same two regionalmonopolies. The commitments obligate Argentina to observe all of the procompetitiveregulatory principles outlined in the GBT reference paper.

4-24
Tab
le 4
-6H
igh
ligh
ts o
f A
rgen
tin
a’s
com
mit
men
ts o
n b
asic
tel
eco
mm
un
icat
ion
ser
vice
s
Co
vera
ge
of
Co
mm
itm
ents
Fo
reig
n In
vest
men
tM
arke
t A
cces
sP
rin
cip
les
Exe
mp
tio
ns
1R
egu
lato
ryA
rtic
le II
MF
N
2.C
. T
elec
omm
unic
atio
n se
rvic
esA
llow
s 10
0% in
199
8.A
llow
s in
199
8.A
dopt
ed r
efer
ence
MF
N e
xem
ptio
nb.
dom
estic
pac
ket-
pape
r on
reg
ulat
ory
for
DT
H, D
BS
,sw
itche
d da
taC
PC
752
3pr
inci
ples
, with
a fe
wan
d di
gita
l aud
io2
c.do
mes
tic c
ircui
t-om
issi
ons
and
tran
smis
sion
switc
hed
data
CP
C 7
523
mod
ifica
tions
with
thro
ugh
2
d.do
mes
tic te
lex
CP
C 7
523
rega
rd to
geos
tatio
nary
2
f.do
mes
tic fa
csim
ile
CP
C 7
521/
29in
terc
onne
ctio
nsa
telli
tes
2
o.ot
her
No
CP
Cpr
ovis
ions
.C
pagi
ngC
SM
R tr
unki
ng
Cm
obile
dat
a se
rvic
esC
Com
petit
ive
safe
guar
dsC
Inte
rcon
nect
ion
CU
nive
rsal
ser
vice
CLi
cens
ing
crite
riaC
Inde
pend
ent
regu
lato
rC
Sca
rce
reso
urce
allo
catio
n
a.do
mes
tic a
ndin
tern
atio
nal
voic
e se
rvic
esC
PC
752
1 b.
inte
rnat
iona
l pac
ket-
switc
hed
data
CP
C 7
5232
c.in
tern
atio
nal c
ircui
t-sw
itche
d da
taC
PC
752
32
d.in
tern
atio
nal t
elex
CP
C 7
5232
f.in
tern
atio
nal
facs
imile
CP
C 7
521/
292
g.do
mes
tic a
ndin
tern
atio
nal
leas
ed c
ircui
tsC
PC
752
2/23
2
Will
allo
w 1
00%
on
Nov
. 8, 2
000.
Will
allo
w o
n N
ov. 8
, 200
0.
Link
s us
ed to
pro
vide
inte
rnat
iona
l fac
sim
ilese
rvic
es m
ust b
e ow
ned
by T
ELI
NT
AR
unt
ilN
ov. 8
, 200
0.
Cur
rent
pro
vide
rs o
f lea
sed
circ
uit s
ervi
ces
have
a p
refe
rent
ial i
nsta
llatio
n pe
riod
until
Nov
. 8, 2
000.
2.C
.A
llow
s 10
0% in
199
8.C
MT
S a
re s
uppl
ied
unde
r a
o. o
ther
No
CP
Cdu
opol
istic
reg
ime.
Cm
obile
tele
phon
ese
rvic
es (
MT
S)
Cpe
rson
al
com
mun
icat
ions
serv
ices
(P
CS
)
CT
he n
umbe
r of
PC
Sse
rvic
e su
pplie
rs w
ill b
ede
cide
d by
the
adm
inis
trat
ive
auth
ority
inlig
ht o
f pre
sent
and
futu
rene
eds.
WT
O m
embe
rs w
ere
aske
d to
sch
edul
e co
mm
itmen
ts o
n ba
sic
tele
com
mun
icat
ion
serv
ices
foun
d in
the
GA
TT
Sec
reta
riat’s
Ser
vice
s S
ecto
ral C
lass
ifica
tion
List
.
1
Thi
s lis
t def
ined
eac
h se
rvic
e us
ing
the
Uni
ted
Nat
ions
’ Pro
visi
onal
Cen
tral
Pro
duct
Cla
ssifi
catio
n (C
PC
) C
ode,
foun
d to
the
right
of t
he s
ched
uled
ser
vice
s w
here
appl
icab
le. W
TO
mem
bers
cou
ld s
ched
ule
com
mitm
ents
on
“oth
er”
tele
com
mun
icat
ion
serv
ices
at t
heir
disc
retio
n.
S
ervi
ce is
one
com
pone
nt o
f a m
ore
aggr
egat
ed C
PC
item
.2
Sou
rce:
Com
pile
d by
US
ITC
sta
ff fr
om W
TO
, GA
TS
, Arg
entin
a: S
ched
ule
of S
peci
fic C
omm
itmen
ts, s
upp.
2 (
GA
TS
/SC
/4/S
uppl
.2),
Apr
. 199
7.

USITC staff have attempted to identify rollback, standstill, and regressive commitments39
by comparing the commitments inscribed in Argentina’s supplementary telecommunicationschedule with questionnaire responses provided by Argentina in 1994. The NegotiatingGroup on Basic Telecommunications (NGBT) circulated a questionnaire upon thecommencement of extended negotiations to gather and share information regardingconditions and regulatory practices in each basic telecommunication market. Decree 1853, of Sept. 8, 1993, governs foreign investment in Argentina, by which40
foreign companies may invest without registration or prior government approval on the sameterms as investors domiciled in Argentina. Additionally, in 1991, the Governments of theUnited States and Argentina signed an agreement for reciprocal promotion and protection ofinvestments. The agreement was amended, ratified by the Congresses of both countries, andimplemented on Oct. 20, 1994. In that year, the two countries also signed a memorandum ofunderstanding regarding cooperation in developing a global information infrastructure,which, among other provisions, recognizes the principles of competition and promotion ofprivate investment. Government of Argentina, Ministry of Economy, “Investment Law:Argentine Foreign Investment Act,” Sept. 8, 1993, found at Internet addresshttp://www.mecon.ar/, retrieved Aug. 18, 1997; U.S. Department of State telegram, No.1915, “Argentina Investment Climate Statement 1997,” prepared by U.S. Embassy, BuenosAires, Apr. 15, 1997; and USDOC, ITA, “Argentina - Telecom. Equip. and Services -ISA9507,” Stat-USA Database, found at Internet address http://www.stat-usa.gov/, postedApr. 1, 1997, retrieved Aug. 19, 1997.
4-25
Foreign Investment
Argentina’s schedule appears to feature standstill commitments, allowing foreign39
investors to acquire or establish significant stakes in telecommunication carriers andfacilities, but also imposing significant restrictions. Argentina does not impose foreignequity limits, and appears to accord foreign investors national treatment. Foreign40
investors may presently build and operate facilities, or establish resale operations, thatprovide data transmission, telex, facsimile, paging, special mobile radio, and mobiledata services in the domestic market. However, by virtue of the exclusive rightsgranted Telefonica de Argentina and Telecom Argentina, foreign investors may notpresently establish firms that provide voice service in the domestic market.
Further, in accordance with the monopoly granted TELINTAR, foreign investors maynot presently build facilities to provide international voice, data transmission, telex, orleased circuit services, and may not control international facilities that carry enhancedtelecommunication services. Yet it appears that opportunities for foreign investors willexpand significantly on November 8, 2000, when most existing restrictions on foreignprovision of basic telecommunication services through independently establishedcarriers and facilities are scheduled to be terminated.
Market Access
Argentina’s schedule generally binds through November 8, 2000, measures that werein force upon the resumption of basic telecommunication negotiations in 1994,although it makes significant departures from this approach in certain areas. Until year2000, Telefonica de Argentina and Telecom Argentina retain their regional monopoliesover the provision of local and long-distance voice service. TELINTAR similarlyretains its monopoly over international voice, data transmission, telex, and leasedcircuit services, and links used for supplying international facility-based facsimile

Argentina Reference Paper annex, paragraph 2.2(c).41
Reference Paper, paragraph 2.2(b).42
Reference Paper, paragraphs 2.5 and 5.43
Argentina, Response to Questionnaire on Basic Telecommunications.44
USITC, General Agreement on Trade in Services: Examination of South American45
Trading Partners’ Schedules of Commitments (Investigation No. 332-367), USITCpublication 3007, Dec. 1996, p. 4-9.
4-26
services must belong to TELINTAR. Argentina also indicates that mobile telephoneservices will be supplied through a system of regional duopolies, and that the NationalCommunications Commission (CNC) will decide on the number of personalcommunication suppliers in each region. In all these respects, Argentina appears tohave scheduled standstill commitments. However, it appears that Argentina scheduledrollback commitments that permit foreign firms to provide international basic servicesvia resale, which was formerly prohibited.
At present, foreign firms may use all means of network technology in order to providethose services subject to competition, with the exception of services using geostationarysatellites, for which Argentina took an MFN exemption. This exemption limits allcountries’ access to satellite services for one-way satellite transmissions of Direct toHome (DTH), Direct Broadcast Service (DBS) television, and Digital Audio Service(DAS), citing the need to develop domestic satellite systems. This limit on marketaccess did not exist upon resumption of telecommunication negotiations in 1994.
Regulatory Principles
Argentina scheduled commitments to abide by the GBT reference paper onprocompetitive principles. However, the Argentine annex on regulatory practicesdiffers somewhat from the GBT reference paper with regard to interconnection.Argentina omits reference paper language which indicates that interconnection will be“provided, upon request, at points in addition to the network termination points offeredto the majority of users, subject to charges that reflect construction costs of necessaryadditional facilities.” Further, the Argentine annex, unlike the GBT reference paper,41
provides neither that interconnection be economically feasible nor that interconnection42
disputes be settled by an independent regulator.43
Argentina’s commitments on procompetitive regulatory principles roll back, orliberalize, its previous regulatory regime by binding universal service and public44
availability of licensing criteria. Additionally, Argentina’s annex on procompetitiveregulatory principles significantly strengthens the country’s previously scheduledcommitments on enhanced telecommunication services (table 4-7). Argentina’s 199445
GATS commitments place no restrictions on the foreign provision of enhancedtelecommunication services, whether provided on a cross-border basis or through anArgentine affiliate.

WTO, GATS, Australia: Schedule of Specific Commitments, supp. 246
(GATS/SC/6/Suppl.2), Apr. 1997.
4-27
Table 4-7Highlights of Argentina’s commitments on enhanced telecommunication services
Coverage of Commitments Foreign Investment Market Access1
2.C. Telecommunication services Allows 100% foreign Allows for all services.h. electronic mail CPC 7523 ownership in all services.2
i. voice mail CPC 75232
j. on-line informationand data baseretrieval CPC 75232
k. electronic datainterchange CPC 75232
l. enhanced facsimile(including store and
forward) CPC 75232
m. code and protocolconversion No CPC
n. on-line informationand/or data processing(including transactionprocessing) CPC 8432
o. other No CPC
WTO members scheduled commitments on enhanced telecommunication services in their initial GATS 1
schedules, adopted in April 1994. Service is one component of a more aggregated CPC item. 2
Source: Compiled by USITC staff from WTO, GATS, Argentina: Schedule of Specific Commitments(GATS/SC/4), Apr. 1994.
Australia
Australia’s commitments cover all basic telecommunication services as well as digitalcellular, paging, personal communication, trunked radio, and mobile data services(table 4-8). The Australian Competition and Consumer Commission (ACCC) allows46
the foreign provision of local, long-distance, and international services, on a facilitiesbasis or by resale and through any means of technology, including wireline, cellular,and satellite networks. Australia maintains certain restrictions on foreign investmentin existing telecommunication service providers, but will allow up to 100 percentforeign investment in new carrier licenses. Further, Australia scheduled commitmentsto observe procompetitive regulatory principles, as outlined in the GBT referencepaper.

4-28
Tab
le 4
-8H
igh
ligh
ts o
f A
ust
ralia
’s c
om
mit
men
ts o
n b
asic
tel
eco
mm
un
icat
ion
ser
vice
s
Co
vera
ge
of
Co
mm
itm
ents
Fo
reig
n In
vest
men
tM
arke
t A
cces
sP
rin
cip
les
Exe
mp
tio
ns
1R
egu
lato
ryA
rtic
le II
MF
N
2.C
. T
elec
omm
unic
atio
n se
rvic
esA
llow
s 10
0% fo
reig
nA
llow
s in
199
8.
Ado
pted
ref
eren
ce p
aper
Non
e –
Aus
tral
ia s
ched
uled
a.vo
ice
CP
C 7
521
owne
rshi
p in
new
car
riers
on r
egul
ator
y pr
inci
ples
inM
FN
-bas
ed c
omm
itmen
ts,
b.pa
cket
-sw
itche
d da
taC
PC
752
3in
199
8.
Ser
vice
s co
vere
d by
entir
ety.
acco
rdin
g al
l WT
O m
embe
rs2
c.ci
rcui
t-sw
itche
d da
taC
PC
752
3th
e B
road
cast
ing
Act
acce
ss to
its
mar
ket o
n th
e2
d.te
lex
CP
C 7
523
Lim
its fo
reig
n eq
uity
of 1
992
are
excl
uded
CC
ompe
titiv
e sa
fegu
ards
sam
e te
rms
and
cond
ition
s.2
e.te
legr
aph
CP
C 7
522
owne
rshi
p in
Tel
stra
tofr
om th
e ba
sic
CIn
terc
onne
ctio
nf.
facs
imile
CP
C 7
521/
2911
.7%
, with
no
sing
lete
leco
mm
unic
atio
nC
Uni
vers
al s
ervi
ce2
g.pr
ivat
e le
ased
circ
uit
CP
C 7
522/
23fo
reig
n in
vest
or a
llow
edse
ctor
.C
Lice
nsin
g cr
iteria
2
o.ot
her
No
CP
Cgr
eate
r th
an 1
.7%
CIn
depe
nden
t reg
ulat
orC
digi
tal c
ellu
lar
Cpa
ging
C
pers
onal
com
mun
i-ca
tions
ser
vice
s C
trun
ked
radi
o sy
stem
Cm
obile
dat
a
indi
vidu
al e
quity
.C
Sca
rce
reso
urce
Lim
its in
divi
dual
fore
ign
equi
ty to
an
unsp
ecifi
edam
ount
in O
ptus
and
lim
itsto
tal f
orei
gn e
quity
inV
odaf
one
to a
nun
spec
ified
min
ority
sha
re.
Pla
ces
natio
nalit
yre
quire
men
ts o
n th
e bo
ard
of d
irect
ors
at O
ptus
.
allo
catio
n
WT
O m
embe
rs w
ere
aske
d to
sch
edul
e co
mm
itmen
ts o
n ba
sic
tele
com
mun
icat
ion
serv
ices
foun
d in
the
GA
TT
Sec
reta
riat’s
Ser
vice
s S
ecto
ral C
lass
ifica
tion
List
.
1 Thi
s lis
t def
ined
eac
h se
rvic
e us
ing
the
Uni
ted
Nat
ions
’ Pro
visi
onal
Cen
tral
Pro
duct
Cla
ssifi
catio
n (C
PC
) C
ode,
foun
d to
the
right
of t
he s
ched
uled
ser
vice
s w
here
appl
icab
le.
WT
O m
embe
rs c
ould
sch
edul
e co
mm
itmen
ts o
n “o
ther
” te
leco
mm
unic
atio
n se
rvic
es a
t the
ir di
scre
tion.
Ser
vice
is o
ne c
ompo
nent
of a
mor
e ag
greg
ated
CP
C it
em.
2 Sou
rce:
Com
pile
d by
US
ITC
sta
ff fr
om W
TO
, GA
TS
, Aus
tral
ia: S
ched
ule
of S
peci
fic C
omm
itmen
ts, s
upp.
2 (
GA
TS
/SC
/6/S
uppl
.2),
Apr
. 199
7.

USITC staff have attempted to identify rollback, standstill, and regressive commitments47
by comparing the commitments inscribed in Australia’s supplementary telecommunicationschedule with questionnaire responses provided by Australia in 1994. The NegotiatingGroup on Basic Telecommunications (NGBT) circulated a questionnaire upon thecommencement of extended negotiations to gather and share information regardingconditions and regulatory practices in each basic telecommunications market. There are also citizenship requirements placed on members of the board of directors at48
Optus. Cable and Wireless (U.K.) obtained a waiver and currently owns 49 percent of Optus.49
Australia, Response to Questionnaire on Basic Telecommunications.50
4-29
Foreign Investment
Australia places no limits on foreign investment in new telecommunication carriers,except that the carriers must be incorporated under Australian law, which representsa significant rollback since the commencement of negotiations in 1994. However,47
restrictions on foreign holdings in preexisting carriers Telstra, Optus, and Vodafoneremain in place. In November 1997, Australia privatized one-third of Telstra, of whichonly 35 percent (about 11.7 percent of total equity) could be sold to foreign interests.Individual foreign investors’ stakes were limited to about 1.7 percent of total equity.This represents a modest foreign-ownership rollback from Telstra’s former whollygovernment-owned status. By contrast, Australia scheduled standstill commitmentsregarding foreign investment in Optus and Vodafone. Although there are no limits48
on total foreign equity in Optus, investment by any single foreign investor is limited to24.5 percent, unless a waiver is obtained. However, discussions are reportedly49
underway to remove restrictions on foreign investment in Optus. With respect toVodafone, Australia scheduled a commitment that will limit total foreign investmentto a minority stake. Vodafone was 100 percent foreign-owned in 1994, but its licenserequired foreign divestiture to a minority equity holding by 2003. Concerning foreigninvestment in resale services, Australia scheduled a standstill commitment that permits100 percent foreign ownership.
Market Access
Australia places no market access restrictions on the foreign provision of basictelecommunication services. In accordance with the Trade Practices Amendment(Telecommunications) Act 1997 (the Act), Australia terminated quantitative limits onthe issuance of carrier licenses for facilities-based providers of basictelecommunication services. This represents a significant rollback, as provision offacilities-based basic services was previously limited to a duopoly. The Australianschedule indicates that foreign firms remain free to provide voice, packet- and circuit-switched data transmission, and facsimile services on a resale basis, resulting in astandstill commitment with respect to these services.
Australia’s schedule also provides for foreign carriers’ use of all network technologieson a facilities basis, representing a significant rollback. Foreign carriers, once requiredto obtain capacity from other facilities-based wireline, cellular, and satellite carriers,50
may now use their own networks for the provision of basic telecommunication services.
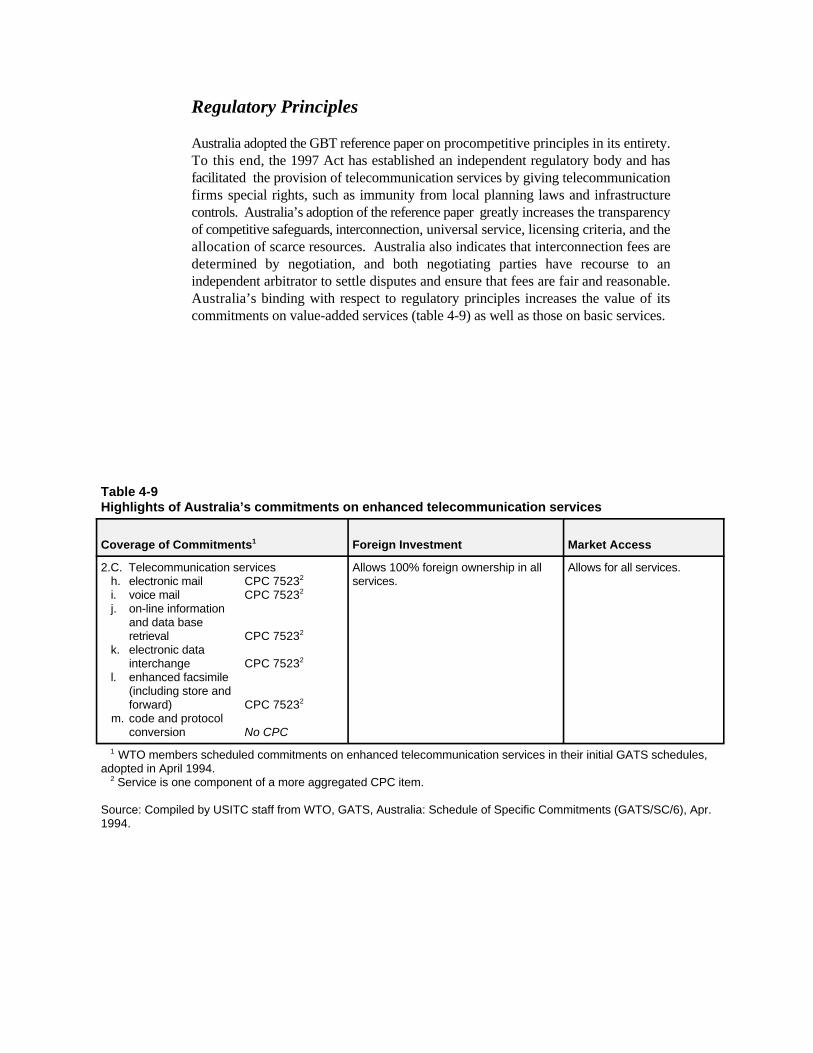
Regulatory Principles
Australia adopted the GBT reference paper on procompetitive principles in its entirety.To this end, the 1997 Act has established an independent regulatory body and hasfacilitated the provision of telecommunication services by giving telecommunicationfirms special rights, such as immunity from local planning laws and infrastructurecontrols. Australia’s adoption of the reference paper greatly increases the transparencyof competitive safeguards, interconnection, universal service, licensing criteria, and theallocation of scarce resources. Australia also indicates that interconnection fees aredetermined by negotiation, and both negotiating parties have recourse to anindependent arbitrator to settle disputes and ensure that fees are fair and reasonable.Australia’s binding with respect to regulatory principles increases the value of itscommitments on value-added services (table 4-9) as well as those on basic services.
Table 4-9Highlights of Australia’s commitments on enhanced telecommunication services
Coverage of Commitments Foreign Investment Market Access1
2.C. Telecommunication services Allows 100% foreign ownership in all Allows for all services.h. electronic mail CPC 7523 services.2
i. voice mail CPC 75232
j. on-line informationand data baseretrieval CPC 75232
k. electronic datainterchange CPC 75232
l. enhanced facsimile(including store andforward) CPC 75232
m. code and protocolconversion No CPC
WTO members scheduled commitments on enhanced telecommunication services in their initial GATS schedules, 1
adopted in April 1994. Service is one component of a more aggregated CPC item. 2
Source: Compiled by USITC staff from WTO, GATS, Australia: Schedule of Specific Commitments (GATS/SC/6), Apr.1994.

WTO, GATS, Brazil: Schedule of Specific Commitments, supp. 251
(GATS/SC/13/Suppl.2), Apr. 1997. Only one small regional provider, Companhia Riograndense de Telecommunicacoes52
(CRT), resides outside the TELEBRAS system. CRT is majority owned by the state of RioGrande do Sul. A closed user group utilizes data networks for a common purpose, such as airline53
bookings or check-clearing systems, but proscribes use of the network by persons outsidethe group, such as the general public. USITC staff have attempted to identify rollback, standstill, and regressive commitments54
by comparing the commitments inscribed in Brazil’s supplementary telecommunicationschedule with questionnaire responses provided by Brazil in 1995. The Negotiating Groupon Basic Telecommunications (NGBT) circulated a questionnaire upon the commencementof extended negotiations to gather and share information regarding conditions and regulatorypractices in each basic telecommunications market.
4-31
Brazil
Brazil’s commitments apply to all basic telecommunication services, as well as cellular,paging, and satellite services (table 4-10). In addition, Brazil’s schedule lists51
commitments that apply to all value-added telecommunication services (table 4-11).Brazil declined to schedule commitments on value-added services only three yearsprior, at the conclusion of the Uruguay Round in 1994. In general, foreign firms mayprovide local, long-distance, and international basic services using wireline, cellular,or satellite technology. However, they may do so only on a facilities basis, and only incooperation with government-owned monopoly providers, most of which are held byTELEBRAS. Brazil allows substantial foreign ownership in closed user groups and52
value-added service providers, but continues to restrict substantial foreign ownershipof facilities-based services. Brazil declined to adopt the procompetitive regulatoryprinciples outlined in the GBT reference paper, but indicated it would adopt similarprinciples of its own.
Foreign Investment
In light of the enactment of the General Telecommunications Law of July 1997,Brazil’s regulation of foreign investment in telecommunication carriers is changing.In its schedule dated April 11, 1997, Brazil indicates that it does not restrict foreigninvestment in facilities-based closed user groups, facilities-based providers of paging53
services, and providers of value-added services. Brazil also indicates that it willimpose no limits on foreign investors in cellular and satellite service providers fromJuly 20, 1999 onward, although it will limit direct and indirect foreign equity in suchproviders to 49 percent until then. However, Brazil imposes unbound restrictions onforeign investment in facilities-based providers of basic telecommunication servicesover the public network. These commitments appear to bind the status quo in mostcases, although the relaxation of investment restrictions on cellular services in 1999represents a rollback.54

4-32
Tab
le 4
-10
Hig
hlig
hts
of
Bra
zil’s
co
mm
itm
ents
on
bas
ic t
elec
om
mu
nic
atio
n s
ervi
ces
Co
vera
ge
of
Co
mm
itm
ents
Fo
reig
n In
vest
men
tM
arke
t A
cces
sP
rin
cip
les
Art
icle
II M
FN
Exe
mp
tio
ns
1R
egu
lato
ry
2.C
.Tel
ecom
mun
icat
ion
serv
ices
Lim
itatio
ns c
urre
ntly
Lim
itatio
ns c
urre
ntly
Did
not
ado
pt G
BT
MF
N e
xem
ptio
n fo
r D
TH
and
(fac
ilitie
s-ba
sed)
unbo
und.
Bra
zil c
omm
its to
unbo
und.
Bra
zil
refe
renc
e pa
per
onD
BS
.a.
voic
eC
PC
752
1bi
nd th
e re
leva
nt p
ortio
ns o
fco
mm
its to
bin
d th
ere
gula
tory
prin
cipl
es, b
utb.
pack
et-s
witc
hed
its G
ener
alre
leva
nt m
arke
t acc
ess
com
mitt
ed to
bin
d re
leva
ntda
taC
PC
752
3T
elec
omm
unic
atio
ns L
aw b
ypo
rtio
ns o
f its
Gen
eral
regu
lato
ry p
ortio
ns o
f its
2
c.ci
rcui
t-sw
itche
dJu
ly 1
998.
T
elec
omm
unic
atio
nsG
ener
alda
taC
PC
752
3La
w b
y Ju
ly 1
998.
Tel
ecom
mun
icat
ions
Law
2
d.te
lex
CP
C 7
523
by J
uly
1998
. R
egul
ator
y2
e.te
legr
aph
CP
C 7
522
prin
cipl
es th
at m
ay b
ef.
facs
imile
CP
C 7
521/
29in
clud
ed a
re:
2
CC
ompe
titiv
esa
fegu
ards
CIn
terc
onne
ctio
nC
Uni
vers
al s
ervi
ceC
Lice
nsin
g cr
iteria
CIn
depe
nden
t reg
ulat
orC
Sca
rce
reso
urce
allo
catio
n
2.C
.Tel
ecom
mun
icat
ion
serv
ices
Allo
ws
100%
fore
ign
Allo
ws
in 1
998.
(fac
ilitie
s-ba
sed
clos
ed u
ser
grou
ps)
owne
rshi
p in
199
8.a.
voic
eC
PC
752
1b.
pack
et-s
witc
hed
data
CP
C 7
5232
c.ci
rcui
t-sw
itche
dda
taC
PC
752
32
d.te
lex
CP
C 7
5232
e.te
legr
aph
CP
C 7
522
f.fa
csim
ileC
PC
752
1/29
2
g.pr
ivat
e le
ased
circ
uit
CP
C 7
522/
232
2.C
.Li
mite
d to
49%
fore
ign
Allo
ws
fore
ign
prov
isio
no.
othe
r:
No
CP
Cow
ners
hip
in r
egio
nal
only
thro
ugh
the
regi
onal
Can
alog
/dig
ital
cellu
lar
duop
olie
s un
til J
uly
20,
duop
olie
s un
til J
uly
20,
1999
, whe
n it
will
allo
w19
99.
Bra
zil m
ay is
sue
100%
fore
ign
owne
rshi
p in
ne
w li
cens
es a
fter
1999
.ad
ditio
nal l
icen
ses.
2.C
.A
llow
s 10
0% fo
reig
nA
llow
s in
199
8.o.
othe
r:
No
CP
Cow
ners
hip
in 1
998.
Cpa
ging
2.C
.Li
mite
d to
49%
fore
ign
Allo
ws
in 1
998.
o.
othe
r:
No
CP
Cow
ners
hip
until
Jul
y 20
,E
MB
RA
TE
L ha
sC
sate
llite
1999
, whe
n it
will
allo
wex
clus
ive
links
with
100%
fore
ign
owne
rshi
p.In
tels
at a
nd In
mar
sat.
WT
O m
embe
rs w
ere
aske
d to
sch
edul
e co
mm
itmen
ts o
n ba
sic
tele
com
mun
icat
ion
serv
ices
foun
d in
the
GA
TT
Sec
reta
riat’s
Ser
vice
s S
ecto
ral C
lass
ifica
tion
List
.
1 Thi
s lis
t def
ined
eac
h se
rvic
e us
ing
the
Uni
ted
Nat
ions
’ Pro
visi
onal
Cen
tral
Pro
duct
Cla
ssifi
catio
n (C
PC
) C
ode,
foun
d to
the
right
of t
he s
ched
uled
ser
vice
s w
here
appl
icab
le.
WT
O m
embe
rs c
ould
sch
edul
e co
mm
itmen
ts o
n “o
ther
” te
leco
mm
unic
atio
n se
rvic
es a
t the
ir di
scre
tion.
Ser
vice
is o
ne c
ompo
nent
of a
mor
e ag
greg
ated
CP
C it
em.
2 Sou
rce:
Com
pile
d by
US
ITC
sta
ff fr
om W
TO
, GA
TS
, Bra
zil:
Sch
edul
e of
Spe
cific
Com
mitm
ents
, sup
p. 2
(G
AT
S/S
C/1
3/S
uppl
.2),
Apr
. 199
7.

4-33
Table 4-11Highlights of Brazil’s commitments on enhanced telecommunication services1
Coverage of Commitments Foreign Investment Market Access2
2.C. Telecommunication services Allows 100% foreign ownership in Allows in 1998.h. electronic mail CPC 7523 1998.3
i. voice mail CPC 75233
j. on-line informationand databaseretrieval CPC 75233
k. electronic datainterchange CPC 75233
l. enhanced facsimile(including store-and-forward, store-and-retrieve) CPC 75233
m. code and protocolconversion No CPC
n. on-line informationand/or dataprocessing(includingtransactionprocessing) CPC 8433
Although other parties to the WTO agreement on basic telecommunication services submitted1
commitments on enhanced telecommunication services in April 1994, Brazil scheduled commitments onboth enhanced and basic telecommunication services in 1997.
WTO members were asked to schedule commitments on basic telecommunication services found in 2
the GATT Secretariat’s Services Sectoral Classification List. This list defined each service using the UnitedNations’ Provisional Central Product Classification (CPC) Code, found to the right of the scheduled serviceswhere applicable. WTO members could schedule commitments on “other” telecommunication services attheir discretion.
Service is one component of a more aggregated CPC item. 3
Source: Compiled by USITC staff from WTO, GATS, Brazil: Schedule of Specific Commitments(GATS/SC/13/Suppl. 2), Apr. 1997.
Brazil’s schedule also indicates that by July 1998 the President of Brazil will introducea revised schedule of commitments that reflect enactment of the GeneralTelecommunications Law. As noted, this law empowers the Brazilian president toestablish foreign investment limitations by decree, thereby reducing the certainty andtransparency that the scheduling process was intended, in part, to foster.
Market Access
In its schedule dated April 11, 1997, Brazil indicates that foreign firms may currentlyoperate closed user group networks and supply paging, satellite, and value-addedservices to the general public. Foreign suppliers may also provide cellular services,although they must do so as investors in preexisting duopoly providers until July 20,1999, after which additional licenses may be granted. Brazil imposes unboundrestrictions on foreign provision of facilities-based services to the general public.Brazil’s commitments on market access generally appear to be standstills, although theindication that additional cellular service licenses may become available in 1999represents a rollback.

WTO, GATS, Canada: Schedule of Specific Commitments, supp. 255
(GATS/SC/16/Suppl.2), Apr. 1997. USITC staff have attempted to identify rollback, standstill, and regressive commitments56
by comparing the commitments inscribed in Canada’s supplementary telecommunicationschedule with questionnaire responses provided by Canada in 1994. The Negotiating Groupon Basic Telecommunications (NGBT) circulated a questionnaire upon the commencementof extended negotiations to gather and share information regarding conditions and regulatorypractices in each basic telecommunications market.
4-34
Regulatory Principles
Brazil did not adopt the GBT reference paper on procompetitive regulatory principles.However, Brazil specifies that it will adopt principles pertaining to competitivesafeguards, interconnection, universal service, licensing criteria, regulatoryindependence, and allocation of scarce resources by July 1998. Beyond this, Brazilprovides no further information, making unclear the degree to which Brazil’s regulatoryprinciples will promote competition and liberalize trade.
Canada
Canada’s commitments under the WTO agreement apply to all basictelecommunication services, as well as mobile services (table 4-12). Canada’s55
commitments permit foreign firms to provide local, long-distance, and internationalservices through any means of technology, on a facilities or resale basis. However,Canada continues to limit foreign investment in facilities-based carriers to a minorityshare. Canada agrees to abide by the procompetitive principles in the GBT referencepaper.
Foreign Investment
Canada limits foreign investment in facilities-based telecommunication serviceproviders to 20 percent direct investment and 33.3 percent indirect investment, with thecumulative foreign investment not to exceed 46.7 percent. The same restrictions applyto international carrier Teleglobe after October 1, 1998, which is a rollback fromCanada’s earlier prohibition on foreign equity in the firm. Canada continues to allow56
100 percent foreign ownership of telecommunication resale providers in the long-distance and international markets, and further scheduled a commitment to allow 100percent foreign ownership of resale providers in the local exchange market. Further,Canada allows 100 percent foreign ownership in mobile satellite services. However,GTE’s 51 percent ownership of domestic carriers BC Telecom and Quebec-Telephone,which was allowed to stand under the 1993 Telecommunications Act, may be subjectto unspecified restrictions.

4-35
Table 4-12Highlights of Canada’s commitments on basic telecommunication services
Coverage of Commitments Foreign Investment Market Access Principles Exemptions1Regulatory Article II MFN
2.C. Telecommunication services Limited to 46.7% foreign ownership in Will allow in 1998, except: Adopted reference None –a. voice CPC 7521 facilities-based carriers in 1998, based on C Mobile satellite services paper on regulatory Canadab. packet-switched data CPC 7523 20% direct and 33 1/3% indirect will be unrestricted principles in entirety. scheduled 2
c. circuit-switched data CPC 7523 investment, but will allow 100% investment between points in MFN-based2
d. telex CPC 7523 in resale services and mobile satellite Canada and between C Competitive commitments,2
e. telegraph CPC 7522 systems in 1998. Canada and points in the safeguards according all2
f. facsimile CPC 7521/29 United States on Jan. 1, C Interconnection WTO2
g. private leased circuit CPC 7522/23 Will allow 46.7% foreign ownership of 1998; C Universal service members2
o. other No CPC Teleglobe Canada in Oct. 1998. C Mobile satellite services C Licensing criteria access to itsC mobile services
Will allow 100% foreign ownership of on Oct. 1, 1998; regulator same termsinternational submarine cable operators in C All international services C Scarce resource andOct. 1998. will be unrestricted on allocation conditions.
Will allow 100% foreign ownership of fixed fixed satellite servicessatellite operators providing services between Canada andbetween points in Canada and all points points in the Unitedoutside Canada (except the United States) States;on Dec. 31, 1999, and will allow 100% C Satellite services will beforeign ownership of fixed satellite fully unrestricted on Mar.operators providing services between 1, 2000.points in Canada and between points inCanada and the United States on Mar. 1, Teleglobe Canada will no2000. longer be the sole overseas
At least 80% of the members of the board Oct. 1, 1998.of directors must be Canadian.
will be fully unrestricted C Independent market on the
Jan. 1, 2000, except for
facilities-based provider on
Restrictions on foreignaccess to submarine cablelanding licenses will beterminated Oct. 1, 1998.
See footnotes at end of table.

4-36
Table 4-12—ContinuedHighlights of Canada’s commitments on basic telecommunication services
Coverage of Commitments Foreign Investment Market Access Principles Exemptions1Regulatory Article II MFN
2.C. Telecommunication services— GTE’s 51% ownership of BC Tel and Foreign shares in Maritime(continued) Quebec-Telephone may be subject to Telephone and Telegraph and
restrictions. Manitoba Telecom servicesare limited to 1,000 shares perperson and 10% per person(or affiliate), respectively.
Telesat loses its monopoly onfixed satellite services used toprovide national and U.S.-Canada services on Mar. 1,2000.
Licenses to operate earthstations for the provision ofCanada-U.S. fixed satelliteservices may be limited untilMar. 1, 2000.
Competition over the localwireline network may belimited in the areas served byNorthwestel, Inc., OntarioNorthland TransportationCommission, Prince RupertCity Telephones, TelusCommunications (Edmonton)Inc., and the otherindependent telephonecompanies listed in CRTCTelecom Public Notice 95-15.
Competition in the long-distance service market maybe limited in the areas servedby Northwestel, OntarioNorthland, and Prince Rupert.
WTO members were asked to schedule commitments on basic telecommunication services found in the GATT Secretariat’s Services Sectoral Classification List. 1
This list defined each service using the United Nations’ Provisional Central Product Classification (CPC) Code, found to the right of the scheduled services whereapplicable. WTO members could schedule commitments on other telecommunication services, under “other” services, at their discretion.
Service is one component of a more aggregated CPC item. 2
Source: Compiled by USITC staff from WTO, GATS, Canada: Schedule of Specific Commitments, supp. 2 (GATS/SC/16/Suppl.2), Apr. 1997.

Competition in the local exchange will continue to be limited in the territories of 4857
independent (non-Stentor) carriers, accounting for 7 percent of total Canadiantelecommunication service revenues. Competition in the local market may be limited in theterritories served by Northwestel, Ontario Northland Transportation, Prince Rupert CityTelephones, Telus Communications, and the other independent carriers listed in CRTCTelecom Public Notice 95-15. Likewise, competition may be limited in the long-distanceservice markets served by Northwestel, Ontario Northland Transportation, and PrinceRupert City Telephones. Industry Canada, The Telecommunications Service Industry:Trend Analysis Canada-United States 1980-95, Jan. 1996, p. 3.
4-37
Canada requires that at least 80 percent of the members of the board of directors offacilities-based carriers be Canadian citizens. Foreign investment restrictionspertaining to international submarine cable operators and fixed satellite serviceproviders will be terminated in October 1998 and March 2000, respectively. Withrespect to foreign investment, Canada’s commitments are generally a mix of standstillsand rollbacks. However, the 46.7-percent limit, if employed to force disinvestment byGTE, would constitute a significant regressive measure. At a minimum, it limits thetransparency of the Canadian schedule and leaves regulatory bodies with broaddiscretionary authority.
Market Access
Under its WTO commitments, competition in the local exchange market is allowedthroughout most of Canada. This represents a significant rollback of market accessrestrictions. Further, Teleglobe will no longer be the sole international service57
supplier after October 1, 1998, and licenses to land submarine cables will no longer belimited as of that date. Telesat Canada will relinquish its monopoly control of fixedsatellite space segment facilities used to provide national and U.S.-Canadatelecommunication services on March 1, 2000. However, licenses to operate earthstations for these services may be limited until March 2000. In sum, Canada’s marketaccess commitments represent further rollbacks.
Regulatory Principles
Canada scheduled commitments to abide by the GBT reference paper onprocompetitive principles in its entirety. Many of these commitments are consistentwith earlier Canadian regulatory decisions, such as Telecom Decision 94-19, by theCanadian Radio-television Telecommunications Commission (CRTC), that laid outmuch of the framework for increased competition in the local exchange market.Nonetheless, Canada’s commitment to provide the interconnection of competingcarriers in the local exchange market on a nondiscriminatory basis represents anoteworthy rollback. In addition, Canada’s prohibition of cross-subsidization, intandem with nondiscriminatory interconnection provisions, strengthens Canada’sliberal bindings on enhanced telecommunication services (table 4-13) scheduled at theconclusion of the Uruguay Round.

WTO, GATS, European Union: Schedule of Specific Commitments, supp. 258
(GATS/SC/31/Suppl.2), Apr. 1997.
4-38
Table 4-13Highlights of Canada’s commitments on enhanced telecommunication services
Coverage of Commitments Foreign Investment Market Access1
2.C. Telecommunication services Allows 100% foreign ownership Allows in allh. electronic mail CPC 7523 in all services. services.2
i. voice mail CPC 75232
j. on-line informationand databaseretrieval CPC 75232
k. electronic datainterchange CPC 75232
l. enhanced facsimile(including storeand forward) CPC 75232
m. code and protocolconversion No CPC
n. on-line informationand/or data processing(including transactionprocessing) CPC 843 2
WTO members scheduled commitments on enhanced telecommunication services in their initial GATS 1
schedules, adopted in April 1994. Service is one component of a more aggregated CPC item. 2
Source: Compiled by USITC staff from WTO, GATS, Canada: Schedule of Specific Commitments(GATS/SC/16), Apr. 1994.
European Union
The EU’s commitments cover the entire range of basic telecommunication services, aswell as mobile and personal communication services (table 4-14). Foreign firms are58
granted access to local, long-distance, and international service markets and they mayprovide these services through any means of technology, including wireline, cellular,and satellite technology, on both a facilities and resale basis. The commitmentsguarantee a relatively liberal foreign investment environment, thereby allowing foreignfirms to acquire, establish, or hold significant stakes in telecommunication carriers. Inaddition, the commitments obligate EU members to observe procompetitive principles,which include implementing safeguards on anticompetitive practices, providingunretricted interconnection, and maintaining independent regulatory bodies.

4-39
Table 4-14Highlights of the European Union’s commitments on basic telecommunication services
Coverage of Commitments Foreign Investment Market Access Principles Exemptions1Regulatory Article II MFN
All sectors Allows 100% foreign ownership in 1998, Allows in 1998, except: Adopted reference paper None – Theexcept: on regulatory principles European Union
C Finland specifies that, in order to establish C Greece limits market access baseda legal entity, half the founders, half the to companies established as C Competitive commitments,board of directors, and the managing an S.A. that are exclusively safeguards according alldirector must have permanent residence in engaged in the supply of C Interconnection WTO membersthe European Economic Area (EEA). If telecommunication services. C Universal service access to itsthe founder is a legal person, it must have C Licensing criteria markets on theresidence in the EEA. C Independent regulator same terms and
C France allows 100% indirect foreign establishment in order to allocationinvestment, but limits non-EC natural or provide basic services.juridical persons to no more than 20%direct holdings of the shares or votingrights of companies authorized to establishand operate radio-based infrastructure forthe provision of services to the generalpublic. However, companies or firmslegally established according to the laws ofa Member State of the EC are consideredEC juridical persons.
C Portugal limits direct or indirectparticipation of natural persons, who arenon-nationals of EC Member States, ornon-EC companies or firms, to 25%foreign investment.
C Portugal requires C Scarce resource conditions.
in entirety. scheduled MFN-
See footnotes at end of table.

4-40
Table 4-14—ContinuedHighlights of the European Union’s commitments on basic telecommunication services
Coverage of Commitments Foreign Investment Market Access Principles Exemptions1Regulatory Article II MFN
2.C. Telecommunication services Greece delays liberalization ofa. voice CPC 7521 public voice and facilities-b. packet-switched based services until Jan. 1,
data CPC 7523 2003.2
c. circuit-switched data CPC 7523 Ireland delays liberalization of2
d. telex CPC 7523 public voice and facilities-2
e. telegraph CPC 7522 based services until Jan. 1,f. facsimile CPC 7521/29 2000.2
g. private leased circuit CPC 7522/232
Luxembourg requested adelayed date for liberalizationof Jan. 1, 2000. EC decisionpending.
Portugal delays liberalizationof public voice, telex, andtelegraph until Jan. 1, 2000,and facilities-based servicesuntil July 1, 1999.
Spain will offer one additionalnation-wide license inJanuary 1998, with fullliberalization to followbeginning Nov. 30, 1998.
o. other No CPC Ireland and Portugal delayC mobile servicesC personal communication
services
interconnection of mobilenetworks with other mobile orfixed networks until Jan. 1,1999.
WTO members were asked to schedule commitments on basic telecommunication services found in the GATT Secretariat’s Services Sectoral Classification List. 1
This list defined each service using the United Nations’ Provisional Central Product Classification (CPC) Code, found to the right of the scheduled services whereapplicable. WTO members could schedule commitments on “other” telecommunication services at their discretion. Service is one component of a more aggregated CPC item.2
Source: Compiled by USITC staff from WTO, GATS, European Union: Schedule of Specific Commitments, supp. 2 (GATS/SC/31/Suppl.2), Apr. 1997.

The European Economic Area includes the 15 EU Member States plus Iceland and59
Norway. USITC staff have attempted to identify rollback, standstill, and regressive commitments60
by comparing the commitments inscribed in the EU’s supplementary telecommunicationschedule with questionnaire responses provided by the EU in 1994. The Negotiating Groupon Basic Telecommunications (NGBT) circulated a questionnaire upon the commencementof extended negotiations to gather and share information regarding conditions and regulatorypractices in each basic telecommunications market. European Community, Response to Questionnaire on Basic Telecommunications, 61
pp. 7-11.
4-41
Foreign Investment
The EU as a whole imposes no limitations on direct or indirect investment intelecommunication service providers, but Finland, France, and Portugal maintain somebroad limitations on foreign ownership. In Finland, half the founders, half the boardof directors, and the managing director of all foreign service providers, includingproviders of telecommunication services, must have permanent residence in theEuropean Economic Area (EEA). In Portugal, non-EU natural persons or entities59
may not directly or indirectly hold more than 25 percent of the capital of companiessupplying basic telecommunication services. Similarly, in France, while 100 percentindirect investment is permitted, non-EU entities or individuals may not directly holdmore than 20 percent of the shares or voting rights of companies that operate radio-based infrastructure for the provision of services to the public. However, Francedefines foreign companies that establish a legal entity anywhere within the EU to be EUentities, and therefore does not subject them to the 20-percent direct-equity limitation.
Commitments scheduled by the EU concerning foreign investment represent significantrollbacks. As of October 19, 1994, Belgium, Portugal, and Spain limited non-EU60
participation to 25 percent; France, Greece, and Ireland did not permit any foreignequity participation; and Italy permitted only minority foreign equity participation.61
Under the EU schedule dated April 11, 1997, most of these investment limitations wererolled back, with only Portugal and France still maintaining foreign equity ceilings. Asnoted, France’s remaining restrictions have been scaled back to permit 100 percentindirect participation, limiting only direct holdings of radio-based infrastructure.
Market Access
The EU provides favorable market access conditions to foreign service providers, asforeign firms are generally guaranteed the ability to enter local, long-distance, andinternational service markets, using any means of network technology, on a facilitiesor resale basis. However, Greece and Portugal restrict cross-border supply of allservices, including telecommunication services, by requiring foreign service providersto establish a locally incorporated commercial presence. In addition, Greece, Ireland,Portugal, and Spain list some market access limitations that affect certaintelecommunication services delivered on a cross-border basis or through a commercialpresence. Greece states that, except when provided through mobile and PCS, provisionof public voice telephony and facilities-based services may be restricted until

The European Union refused to extend Greece’s transition period beyond Jan. 1, 2001,62
meaning that Greece will be required to open its market for public voice and facilities-basedservices provided by EU firms. However, since the date recorded in the WTO commitmentsis Jan. 1, 2003, Greece is not obligated to provide the same level of treatment to non-EUmembers until 2003. European Community, Response to Questionnaire on Basic Telecommunications, 63
pp. 3, 4, and 14.
4-42
January 1, 2003. Similarly, Ireland may restrict public voice and facilities-based62
services until January 1, 2000. Portugal states that public voice, telex, and telegraphservices may be restricted until January 1, 2000, and facilities-based services untilJuly 1, 1999. In addition, both Ireland and Portugal note that internationalinterconnection of mobile networks with other mobile or fixed networks may berestricted until January 1, 1999. Spain states that full liberalization will take place onNovember 30, 1998.
As of October 1994, basic telecommunication services were not open to competitionwithin the EU. These services included public voice, telegraph, telex, mobile, paging,and satellite services. With respect to these services, most of which were still providedby monopolies, a timetable was established to introduce competition and remove intra-EU restrictions by January 1, 1998. However, EU members were under no obligation63
to extend market access privileges to non-EU members, nor were they subject to anypenalty should they treat non-EU carriers in a discriminatory manner. Through the1997 WTO commitments, the EU made a binding commitment to extend its currentinternal level of market access to non-EU service providers. In addition, the EuropeanUnion scheduled commitments to provide full market access on a national treatmentbasis by specified dates. These commitments reflect a significant rollback fromprevious conditions.
Regulatory Principles
The EU scheduled a commitment to uphold the procompetitive principles contained inthe GBT reference paper in their entirety. As discussed previously, the EU hasprogressively developed a competitive regulatory framework through a series ofCommmission Directives. Full implementation was scheduled for January 1, 1998,although certain EU members have been granted transition periods. The principlescontained in the Commission Directives are comparable with those expressed in theWTO reference paper on procompetitive regulatory principles. These principlesinclude competitive safeguards such as those prohibiting cross-subsidization, fullinterconnection on nondiscriminatory terms, public presentation of licensing criteria,and the independence of regulators. Since all EU members scheduled commitments toabide by the principles listed in the WTO reference paper, they have effectively rolledback the regulatory framework to permit greater competition among both EU and non-EU firms. The European Union’s commitments on procompetitive regulatory principlesalso improve the value of previously bound commitments regarding enhancedtelecommunication services. While the EU’s commitments on enhanced

For additional information on the EU’s commitments on enhanced telecommunication64
services, see USITC, General Agreement on Trade in Services: Examination of MajorTrading Partner’s Schedules of Commitments, Inv. No. 332-358, publication No. 2940,Dec. 1995.
4-43
telecommunication services (table 4-15) were fairly comprehensive, in the absence64
of a procompetitive regulatory environment, foreign firms could still have been subjectto discriminatory or exclusionary practices. Thus the principles espoused by thereference paper strengthen previously scheduled commitments by improving thecompetitive and regulatory environment.
Table 4-15Highlights of the European Union’s commitments on enhanced telecommunication services
Coverage of Commitments Foreign Investment Market Access1
2.C. Telecommunication services Allows 100% foreign Allows in all services.h. electronic mail CPC 7523 ownership in all services,2
i. voice mail CPC 7523 except:2
j. on-line informationand databaseretrieval CPC 7523 C Portugal limits capital2
k. electronic data holdings ofinterchange CPC 7523 telecommunications2
l. enhanced facsimile infrastructure by non-EU(including store companies to 25%.and forward) CPC 75232
m. code and protocolconversion No CPC
n. on-line informationand/or data processing(including transactionprocessing) CPC 843 2
o. other No CPC
WTO members scheduled commitments on enhanced telecommunication services in their initial GATS1
schedules, adopted in April 1994. Service is one component of a more aggregated CPC item.2
Source: Compiled by USITC staff from WTO, GATS, European Union: Schedule of Specific Commitments(GATS/SC/31), Apr. 1994.

WTO, GATS, Hong Kong: Schedule of Specific Commitments, supp. 265
(GATS/SC/39/Suppl.2), Apr. 1997. Although Hong Kong’s commitments under the GATS remain in effect for 50 years66
under the terms of the Sino-British Joint Declaration, the practicality of acquiring fullownership of Hong Kong Telecom is dubious in light of China Telecom’s purchase of half ofthe shares owned by Cable & Wireless, as agreed in June 1997. USITC staff have attempted to identify rollback, standstill, and regressive commitments67
by comparing the commitments inscribed in Hong Kong’s supplementary telecommunicationschedule with questionnaire responses provided by Hong Kong in 1994. The NegotiatingGroup on Basic Telecommunications (NGBT) circulated a questionnaire upon thecommencement of extended negotiations to gather and share information regardingconditions and regulatory practices in each basic telecommunications market.
4-44
Hong Kong
Hong Kong’s commitments apply to all basic telecommunication services except fortelex, telegraph, and international private leased circuit services (table 4-16). The65
commitments also cover cellular, paging, and mobile data services provideddomestically, and call-back, satellite, virtual private network, and mobile servicesprovided internationally on a resale basis. Foreign firms have access to the localmarket on both a facilities and resale basis, although only four licenses have beenissued for local wireline network services. Hong Kong’s commitments guaranteeforeign firms access to the international market only on a resale basis or through equityownership of Hong Kong Telecom, the area’s dominant carrier. Hong Kong’scommitments allow foreign firms to provide local services and to control necessaryfacilities based on wireline and cellular network technology. Use of satellite technologyis permitted only for intracorporate and closed user group communications. Provisionof satellite services over the public network is prohibited. Hong Kong’s commitmentsimpose no limitations on foreign investment, thereby guaranteeing foreign firms theright to acquire, establish, or hold significant stakes in telecommunication carriers. Inaddition, Hong Kong scheduled a commitment to observe procompetitive regulatoryprinciples.
Foreign Investment
Hong Kong’s commitments accord national treatment to foreign investors. As a result,foreign firms have the same rights and privileges as domestic firms with respect toestablishment of, or investment in, facilities- or resale-based enterprises. Accordingto Hong Kong’s commitments, foreign firms may acquire 100 percent of existingproviders of domestic and international telecommunication services, including HongKong Telecom. Investment through the establishment of a new commercial presence66
is technically not restricted for either domestic or international services. However,since Hong Kong Telecom retained exclusive rights to provide all facilities-basedinternational services until March 1998, foreign firms have been effectively preventedfrom establishing new facilities. Since Hong Kong has traditionally maintained liberalpolicies toward foreign investment, the commitments guaranteeing national treatmentwith no investment limitations represent a standstill position. 67

4-45
Tab
le 4
-16
Hig
hlig
hts
of
Ho
ng
Ko
ng
’s c
om
mit
men
ts o
n b
asic
tel
eco
mm
un
icat
ion
ser
vice
s
Co
vera
ge
of
Co
mm
itm
ents
Fo
reig
n In
vest
men
tM
arke
t A
cces
sP
rin
cip
les
Exe
mp
tio
ns
1R
egu
lato
ryA
rtic
le II
MF
N
2.C
. D
omes
tic s
ervi
ces
Allo
ws
100%
fore
ign
owne
rshi
p fo
rN
one,
exc
ept:
Ado
pted
ref
eren
ce p
aper
Non
e –
Hon
g
a.
voic
eC
PC
752
1do
mes
tic s
ervi
ces
in 1
998.
CC
hubb
Ele
ctro
nics
has
the
on r
egul
ator
y pr
inci
ples
Kon
g
b.
pack
et-s
witc
hed
data
CP
C 7
523
excl
usiv
e rig
ht to
pro
vide
ain
ent
irety
. sc
hedu
led
2
c
. ci
rcui
t-sw
itche
d da
taC
PC
752
3fir
e al
arm
tran
smis
sion
MF
N-b
ased
2
f.
fa
csim
ileC
PC
752
1/29
syst
em c
onne
ctin
g th
e F
ireC
Com
petit
ive
com
mitm
ents
, 2
g
. pr
ivat
e le
ased
circ
uit
CP
C 7
522/
23S
ervi
ces
Dep
artm
ent a
ndsa
fegu
ards
acco
rdin
g al
l2
o
. ot
her
No
CP
Cpu
blic
bui
ldin
gs.
CIn
terc
onne
ctio
nW
TO
mem
bers
Cce
llula
r C
pagi
ng
Cm
obile
dat
a
CN
ew li
cens
es fo
r fa
cilit
ies
CU
nive
rsal
ser
vice
acce
ss to
its
will
not
be
cons
ider
edC
Lice
nsin
g cr
iteria
mar
kets
on
the
befo
re J
une
1998
.C
Inde
pend
ent r
egul
ator
sam
e te
rms
CS
carc
e re
sour
cean
d co
nditi
ons.
allo
catio
n
2.C
. In
tern
atio
nal s
ervi
ces
Allo
ws
100%
fore
ign
owne
rshi
p fo
rA
ll in
tern
atio
nal s
ervi
ces,
(re
sale
bas
ed o
nly)
inte
rnat
iona
l res
ale
serv
ices
inex
cept
for
mob
ile s
atel
lite
a.
voic
eC
PC
752
119
98.
serv
ices
, may
be
prov
ided
b. p
acke
t-sw
itche
d da
taC
PC
752
3on
ly o
n a
resa
le b
asis
.2
c. c
ircui
t-sw
itche
d da
taC
PC
752
3M
arke
t acc
ess
limita
tions
effe
ctiv
ely
2
f. f
acsi
mile
CP
C 7
521/
29pr
eclu
de e
stab
lishm
ent o
f fac
ilitie
sP
ublic
ext
erna
l tel
epho
ne2
o. o
ther
No
CP
Cfo
r th
e pr
ovis
ion
of in
tern
atio
nal
serv
ice,
def
ined
as
pers
on-t
o-C
call-
back
ser
vice
sor
alte
rnat
ive
calli
ngpr
oced
ures
Cse
lf-pr
ovis
ion
ofex
tern
al s
atel
lite
circ
uits
for
intr
a-co
rpor
ate
and
clos
edus
er g
roup
com
mun
icat
ions
Cvi
rtua
l priv
ate
netw
ork
Cm
obile
sat
ellit
e
serv
ices
.pe
rson
voi
ce c
omm
unic
atio
nsw
ith p
lace
s ou
tsid
e of
Hon
gK
ong,
is n
ot a
llow
ed.
For
intr
a-co
rpor
ate
and
clos
ed u
ser
grou
p sa
telli
telin
ks a
nd v
irtua
l priv
ate
netw
ork
serv
ices
, con
nect
ion
to H
ong
Kon
g’s
publ
ic-
switc
hed
tele
phon
e ne
twor
k(P
ST
N)
may
be
rest
ricte
d.
For
mob
ile s
atel
lite
serv
ices
,es
tabl
ishi
ng g
atew
ay s
tatio
nsfo
r m
obile
sat
ellit
e tr
affic
is n
otal
low
ed.
WT
O m
embe
rs w
ere
aske
d to
sch
edul
e co
mm
itmen
ts o
n ba
sic
tele
com
mun
icat
ion
serv
ices
foun
d in
the
GA
TT
Sec
reta
riat’s
Ser
vice
s S
ecto
ral C
lass
ifica
tion
1
List
. T
his
list d
efin
ed e
ach
serv
ice
usin
g th
e U
nite
d N
atio
ns’ P
rovi
sion
al C
entr
al P
rodu
ct C
lass
ifica
tion
(CP
C)
Cod
e, fo
und
to th
e rig
ht o
f the
sch
edul
ed s
ervi
ces
whe
re a
pplic
able
. W
TO
mem
bers
cou
ld s
ched
ule
com
mitm
ents
on
“oth
er”
tele
com
mun
icat
ion
serv
ices
at t
heir
disc
retio
n.
S
ervi
ce is
one
com
pone
nt o
f a m
ore
aggr
egat
ed C
PC
item
.2
Sou
rce:
Com
pile
d by
US
ITC
sta
ff fr
om W
TO
, GA
TS
, Hon
g K
ong:
Sch
edul
e of
Spe
cific
Com
mitm
ents
, sup
p. 2
(G
AT
S/S
C/3
9/S
uppl
.2),
Apr
. 199
7.

4-46
Market Access
As noted above, Hong Kong’s commitments treat domestic and international servicesseparately. Commitments on domestic services cover facilities- and resale-basedprovision of voice, packet- and circuit-switched data transmission, facsimile, privateleased circuit, and mobile services. Mobile services specifically include cellular andpersonal communication services, mobile data services, and radio paging services.Telex and telegraph services are not covered by Hong Kong’s commitments ondomestic services.
For the domestic services delineated in its schedule, Hong Kong accords full marketaccess to foreign firms providing services through cross-border supply andconsumption abroad. With respect to foreign firms establishing a commercial presence,market access is limited, as only four licenses for domestic wireline network serviceshave been issued. Issuance of additional licenses will not be considered until June1998. Market access for local services is also limited in regards to fire alarmtransmission systems, as the Government has indefinitely granted exclusive rights toChubb Electronics of Hong Kong to provide the transmission systems between the firedepartment and public buildings. Hong Kong’s mobile services market is completelyopen to foreign participation.
Hong Kong’s commitments on international services apply predominately to servicesprovided through resale. Hong Kong’s supplementary schedule indicates that foreignfirms may provide resale of international voice, packet- and circuit-switched datatransmission, facsimile, and other services. The latter include call-back, virtual privatenetwork services, and self-provision of satellite links for intracorporate and closed usergroup communications. However, Hong Kong places a number of significantrestrictions on provision of these services, diminishing the value of its commitments.Specifically, public external telephone service, defined as person-to-person voicecommunication to locations outside Hong Kong, is not allowed. In addition, connectionto Hong Kong’s public-switched telephone network may be restricted for intracorporatesatellite links and for virtual private network service. Hong Kong’s schedule alsoindicates that foreign firms may provide mobile satellite services on a facilities basis,but may not establish their own gateway stations. The March 1998 termination ofHong Kong Telecom’s exclusive rights over international facilities-based services mayresult in more liberal market access conditions than those currently reflected in HongKong’s commitments. However, since these changes are not reflected in thecommitments, foreign firms presently have no guarantee that new rights will beextended to them.
In 1994, Hong Kong had only one licensed provider of telecommunication services thatenjoyed a full monopoly over domestic and international services, except for localmobile services. By 1997, Hong Kong had opened the domestic market to competitionby issuing three new licenses to provide facilities-based or resale services andliberalized the international market by permitting resale of international services. Thus,Hong Kong’s schedule contains binding commitments to maintain more liberal marketaccess conditions than were available in 1994. However, since Hong Kong had plannedthe local service liberalization in 1992, and as these measures were merely implementedin 1995, Hong Kong’s bindings on domestic services constitute standstillcommitments. Regarding international services, Hong Kong had provided no indication

4-47
prior to February 1997 that market access for services provided on a resale basis wouldbe guaranteed. For international resale services, therefore, Hong Kong rolled backlimitations on foreign firms, although the degree of liberalization is modest in light ofthe restrictions specified above.
Regulatory Principles
Hong Kong scheduled a commitment to uphold the procompetitive principles containedin the GBT reference paper. In so doing, Hong Kong implemented safeguards toprevent anticompetitive practices, to ensure interconnection with the major supplier onnondiscriminatory terms, to provide licensing criteria publicly, and to maintain anindependent regulator. These commitments reflect a standstill position from that takenin 1994. Nevertheless, the binding of these commitments increases the value of HongKong’s commitments on basic and enhanced telecommunication services (table 4-17),the latter of which guaranteed full market access and national treatment for theprovision of services through a commercial presence from 1995 onward. Without sucha guarantee, foreign firms could still have been subject to discriminatory orexclusionary practices.
Table 4-17Highlights of Hong Kong’s commitments on enhanced telecommunication services
Coverage of Commitments Foreign Investment Market Access1
2.C. Telecommunication services No limitations except that a commercial Limitations on marketh. electronic mail CPC 7523 presence must be incorporated in access under cross-2
i. voice mail CPC 7523 Hong Kong or be registered as a border supply remain2
j. on-line information and foreign company under the Companies unbound.data base retrieval CPC 7523 Ordinance.2
k. electronic data Limitations on marketinterchange CPC 7523 access under the2
l. enhanced facsimile presence of natural(including store persons remainand forward) CPC 7523 unbound except for2
m. code and protocol measures permittingconversion No CPC the intracorporate
n. on-line information transfer of generaland/or data processing managers, senior(including transaction managers, andprocessing) CPC 843 specialists.2
WTO members scheduled commitments on enhanced telecommunication services in their initial GATS1
schedules, adopted in April 1994. Service is one component of a more aggregated CPC item.2
Source: Compiled by USITC staff from WTO, GATS, Hong Kong: Schedule of Specific Commitments(GATS/SC/39), Apr. 1994.

WTO, GATS, India: Schedule of Specific Commitments, supp. 268
(GATS/SC/42/Suppl.2), Apr. 1997. India indicates that its commitments pertain to long-distance services, but has delayed69
an examination of whether to open this market until 1999. USITC staff have attempted to identify rollback, standstill, and regressive commitments70
by comparing the commitments inscribed in India’s supplementary telecommunicationschedule with questionnaire responses provided by India in 1995. The Negotiating Groupon Basic Telecommunications (NGBT) circulated a questionnaire upon the commencementof extended negotiations to gather and share information regarding conditions and regulatorypractices in each basic telecommunications market.
4-48
India
India’s schedule covers local voice services, both cellular and wireline; circuit-switcheddata transmission; facsimile; and private leased circuit services (table 4-18). The68
schedule excludes long-distance and international voice services, packet-switched69
data transmission, telex, and telegraph services. India has scheduled modestcommitments regarding market access, and its commitments regarding foreigninvestment appear to be regressive. Further, India has accepted only limited sections70
of the GBT reference paper on procompetitive principles, and has either significantlyaltered or deleted most principles found in the reference paper.
Foreign Investment
India’s WTO commitments fall well short of present government policy regarding theallowable level of foreign ownership of telecommunication service providers. India’scommitments limit foreign investment in local wireline and cellular voice serviceproviders to 25 percent. India’s foreign investment commitment is regressive ascurrent government policy allows foreign investors up to 49 percent ownership of suchcarriers. Although the potential for sizable returns in the Indian telecommunicationsmarket will continue to attract foreign investment, regressive commitments could createsufficient uncertainty, deterring many other investors, and thereby delayinginfrastructure development. India makes no commitments regarding foreign investmentlimits for monopoly international carrier Videsh Sanchar Nigam Ltd. (VSNL). Foreigninvestment in VSNL is presently negligible.
Market Access
India grants licenses for the provision of local wireline voice telecommunication serviceonly if a “designated authority” determines that a need exists for such services. Indianeither identifies the designated authority nor requires that such authority beindependent from any telecommunication service provider. Further, carriers thatreceive licenses to provide telecommunication services are subject to unspecified termsand conditions laid down by the designated authority, the government, or the prevailinglaws, resulting in a lack of transparency and certainty.

4-49
Tab
le 4
-18
Hig
hlig
hts
of
Ind
ia’s
co
mm
itm
ents
on
bas
ic t
elec
om
mu
nic
atio
n s
ervi
ces
Co
vera
ge
of
Co
mm
itm
ents
Fo
reig
n In
vest
men
tsM
arke
t A
cces
sP
rin
cip
les
Exe
mp
tio
ns
1R
egu
lato
ry
Art
icle
II M
FN
2.C
. Tel
ecom
mun
icat
ion
Ser
vice
sLi
mite
d to
25%
fore
ign
Allo
ws
one
carr
ier
per
Indi
a ha
s ac
cept
edIn
dia
has
liste
d an
MF
Na.
loca
l voi
ceC
PC
752
1ow
ners
hip
in o
ne a
dditi
onal
“ser
vice
are
a” to
com
pete
only
lim
ited
port
ions
exem
ptio
n fo
r th
e di
ffere
nt2
c.ci
rcui
t-sw
itche
d da
taC
PC
752
3ca
rrie
r in
eac
h lo
cal s
ervi
ce a
rea
with
DoT
/MT
NL
for
10 y
ears
of th
e re
fere
nce
acco
untin
g ra
tes
that
2
f.fa
csim
ileC
PC
752
1in
199
8.if
it ha
s be
en d
eter
min
ed b
ypa
per.
VS
NL
has
nego
tiate
d w
ith2
g.pr
ivat
e le
ased
circ
uit
CP
C 7
522
the
auth
oriti
es th
at a
nee
dva
rious
fore
ign
carr
iers
.2
exis
ts. T
erm
s an
d co
nditi
ons
CIn
terc
onne
ctio
nar
e no
t def
ined
.su
bjec
t to
Doe
s no
t allo
w a
cces
s in
the
non-
tran
spar
ent
long
-dis
tanc
e an
dpr
oced
ures
.in
tern
atio
nal m
arke
t.C
The
reg
ulat
or is
not
Res
ale
of v
oice
ser
vice
s is
inde
pend
ent o
f any
not p
erm
itted
.te
leco
mm
unic
atio
n
rest
rictio
ns a
nd
requ
ired
to b
e
serv
ice
prov
ider
.C
Cro
ss-s
ubsi
diza
tion
is n
ot p
rohi
bite
d.
o.ot
her
No
CP
CLi
mite
d to
25%
fore
ign
Allo
ws
two
cellu
lar
serv
ice
Cce
llula
r
owne
rshi
p in
reg
iona
l duo
poly
,op
erat
ors
each
ser
vice
are
aex
cept
in M
TN
L in
199
8.fo
r 10
yea
rs if
it h
as b
een
3
dete
rmin
ed b
y th
eau
thor
ities
that
a n
eed
exis
ts.
DoT
/MT
NL
may
ente
r th
ese
mar
kets
at a
nytim
e. T
erm
s an
d co
nditi
ons
are
not d
efin
ed.
Onl
y G
SM
tech
nolo
gy is
allo
wed
for
cellu
lar
serv
ice
prov
ider
s.
WT
O m
embe
rs w
ere
aske
d to
sch
edul
e co
mm
itmen
ts o
n ba
sic
tele
com
mun
icat
ion
serv
ices
foun
d in
the
GA
TT
Sec
reta
riat‘s
Ser
vice
s S
ecto
ral C
lass
ifica
tion
1
List
. T
his
list d
efin
ed e
ach
serv
ice
usin
g th
e U
nite
d N
atio
ns’ P
rovi
sion
al C
entr
al P
rodu
ct C
lass
ifica
tion
(CP
C)
Cod
e, fo
und
to th
e rig
ht o
f the
sch
edul
ed s
ervi
ces
whe
re a
pplic
able
. W
TO
mem
bers
cou
ld s
ched
ule
com
mitm
ents
on
“oth
er”
tele
com
mun
icat
ion
serv
ices
at t
heir
disc
retio
n.
S
ervi
ce is
one
com
pone
nt o
f a m
ore
aggr
egat
ed C
PC
item
. 2
Indi
a re
serv
es th
e rig
ht fo
r D
oT/M
TN
L to
ent
er e
ach
serv
ice
area
.3
Sou
rce:
Com
pile
d by
US
ITC
sta
ff fr
om W
TO
, GA
TS
, Ind
ia: S
ched
ule
of S
peci
fic C
omm
itmen
ts, s
upp.
2 (
GA
TS
/SC
/42/
Sup
pl.2
), A
pr. 1
997.

India’s policy on market access for each service area will be reviewed 10 years after71
the license to determine whether competition is permitted. WTO, GBT, “Report of the Group on Basic Telecommunications,” Feb. 15, 1997.72
4-50
If the designated authority determines that a need exists, India will allow one additionalcarrier to provide local wireline services in competition with the Department ofTelecommunications (DoT) or Mahanagar Telephone Nigam Ltd. (MTNL) within eachservice area for at least 10 years. The carriers that receive licenses in each service71
area may provide voice, facsimile, and data transmission services using circuit-switchedtechnology. Further, licensees may provide leased circuits to their customers withintheir service area, but may not sell excess capacity over these circuits. Licensees may,however, grant franchises on a commission basis for providing payphone services.India makes no commitments with respect to long-distance and internationaltelecommunication services other than to review the status of each of these markets in1999 and 2004, respectively. Although the introduction of competition into the Indianlocal exchange market per India’s commitments constitutes a rollback, Indianregulators retain broad discretion in determining the conditions of market entry, makingthe value of the commitment difficult to discern.
Foreign carriers’ access to India’s cellular service market is also subject to therequirement that a designated authority determine the need for such service; therebyIndia preserves broad discretion in this area, as well. Where there is a perceived needfor cellular service, India allows two cellular operators in each service area for 10 yearsand these operators are restricted to the use of terrestrial-based GSM technology.However, India reserves the right to allow DoT and/or MTNL to enter each servicearea, which could substantially alter competitive conditions within a given service area.India’s commitments regarding market access for cellular services appear to constituterollbacks, although the value of the rollbacks will be determined by regulatory practice.
India has taken an MFN exemption that is reportedly intended to preserve its right toapply different accounting rates to foreign operators. India has listed this exemptiondespite the WTO’s understanding that practices consistent with the internationalaccounting rates system are not actionable under the WTO dispute settlement process.72
Regulatory Principles
India scheduled no commitment preventing cross-subsidization, thus allowing DoT andMTNL to subsidize competitive local exchange operations with monopoly revenuesfrom long-distance operations. India’s commitments with regard to interconnectionprovide that interconnection with a major supplier be ensured at points “specified in thelicense,” rather than at “any technically feasible point” per the GBT reference paper.Significantly, India does not bind sections of the reference paper that ensureinterconnection in a timely fashion under terms, conditions, or rates that aretransparent, reasonable, economically feasible, nondiscriminatory, or unbundled.India’s interconnection commitments appear to constitute a standstill.

WTO, GATS, Indonesia: Schedule of Specific Commitments, supp. 273
(GATS/SC/43/Suppl.2), Apr. 1997.
4-51
India accepts the reference paper’s requirement that universal service be defined in atransparent and nondiscriminatory manner, but not the obligation to make itcompetitively neutral or no more burdensome than necessary. Finally, India scheduledno commitments to make publicly available the normal time period for reaching adecision on license applications, to conduct its procedures for the allocation and use ofscarce resources in a transparent and nondiscriminatory manner, or to make publiclyavailable the current state of allocated frequency bands. In the absence of strongercommitments on procompetitive regulatory principles, it is not clear that market accessand investment commitments pertaining to either basic (see table 4-18) or enhancedtelecommunication services (table 4-19) will materially increase opportunities for U.S.participants in India’s market.
Table 4-19Highlights of India’s commitments on enhanced telecommunication services
Coverage of Commitments Foreign Investment Market Access1
2.C. Telecommunication services Limited to 51% foreign ownership. Allows for all servicesh. electronic mail CPC 7523 except electronic data2
i. voice mail CPC 7523 interchange and code2
j. on-line information and protocoland database conversion.retrieval CPC 75232
l. enhanced facsimile(including store andforward) CPC 75232
n. on-line informationand/or data processing CPC 8432
WTO members scheduled commitments on enhanced telecommunication services in their initial GATS1
schedules, adopted in April 1994. Service is one component of a more aggregated CPC item.2
Source: Compiled by USITC staff from WTO, GATS, India: Schedule of Specific Commitments(GATS/SC/42), Apr. 1994.
Indonesia
Indonesia scheduled commitments that allow limited foreign participation in theprovision of voice, packet- and circuit-switched data transmission, telex, and telegraphservices (table 4-20). In addition, Indonesia scheduled commitments regarding73
teleconferencing, cellular, Internet, paging, and public pay phone services. Indonesiascheduled no commitments regarding facsimile and private leased line services.Indonesia permits foreign participation in the local, long-distance, and internationalservice markets, through wireline, cellular, and satellite networks, on both a facilitiesand resale basis. However, foreign carriers may participate in the Indonesian marketonly through joint ventures or operations with Indonesia’s incumbent carriers.Indonesia scheduled binding commitments to observe most of the procompetitiveprinciples outlined in the GBT reference paper.

4-52
Tab
le 4
-20
Hig
hlig
hts
of
Ind
on
esia
’s c
om
mit
men
ts o
n b
asic
tel
eco
mm
un
icat
ion
ser
vice
s
Co
vera
ge
of
Co
mm
itm
ents
Fo
reig
n In
vest
men
tM
arke
t A
cces
sR
egu
lato
ry P
rin
cip
les
Exe
mp
tio
ns
1A
rtic
le II
MF
N
2.C
.T
elec
omm
unic
atio
n se
rvic
esA
llow
s 35
% fo
reig
n ow
ners
hip
Loca
l ser
vice
s ar
e pr
ovid
edA
dopt
ed r
efer
ence
pap
erN
one
– In
done
sia
Loca
lin
199
8.ex
clus
ivel
y by
PT
Tel
kom
and
5on
reg
ulat
ory
prin
cipl
essc
hedu
led
MF
N-
a.vo
ice
CP
C 7
521
b.ci
rcui
t-sw
itche
d da
taC
PC
752
32
o.ot
her
Cte
leco
nfer
enci
ng
regi
onal
join
t ope
ratio
ns.
in e
ntire
ty.
base
d
Mar
ket p
artic
ipat
ion
requ
ires
join
tC
Com
petit
ive
acco
rdin
g al
l WT
Ove
ntur
e, jo
int o
pera
tion,
or
safe
guar
dsm
embe
rs a
cces
sco
ntra
ct m
anag
emen
tC
Inte
rcon
nect
ion
to it
s m
arke
t on
the
arra
ngem
ent.
CU
nive
rsal
ser
vice
sam
e te
rms
and
For
eign
man
agem
ent a
ndC
Sca
rce
reso
urce
tech
nica
l exp
ert p
erso
nnel
are
allo
catio
nlim
ited
to 2
0 na
tura
l per
sons
.
CLi
cens
ing
crite
riaco
nditi
ons.
Reg
ulat
or is
not
nece
ssar
ily s
epar
ate
from
any
sup
plie
r of
basi
c te
leco
mm
unic
atio
nse
rvic
es.
com
mitm
ents
,
Long
-dis
tanc
eA
llow
s 35
% fo
reig
n ow
ners
hip
Long
-dis
tanc
e se
rvic
es a
rea.
voic
e C
PC
752
1b.
circ
uit-
switc
hed
data
CP
C 7
5232
o.ot
her
Cte
leco
nfer
enci
ng
in 1
998.
prov
ided
exc
lusi
vely
by
PT
Tel
kom
.
Mar
ket p
artic
ipat
ion
requ
ires
join
tve
ntur
e, jo
int o
pera
tion,
or
cont
ract
man
agem
ent
arra
ngem
ent.
For
eign
man
agem
ent a
ndte
chni
cal e
xper
t per
sonn
el a
relim
ited
to 2
0 na
tura
l per
sons
.
See
foot
note
s at
end
of t
able
.

4-53
Tab
le 4
-20—
Co
nti
nu
edH
igh
ligh
ts o
f In
do
nes
ia’s
co
mm
itm
ents
on
bas
ic t
elec
om
mu
nic
atio
n s
ervi
ces
Co
vera
ge
of
Co
mm
itm
ents
Fo
reig
n In
vest
men
tM
arke
t A
cces
sR
egu
lato
ry P
rin
cip
les
Exe
mp
tio
ns
1A
rtic
le II
MF
N
Inte
rnat
iona
lA
llow
s 35
% fo
reig
n ow
ners
hip
inC
ross
-bor
der
supp
ly o
fa.
voic
eC
PC
752
1b.
circ
uit-
switc
hed
data
CP
C 7
5232
c.pa
cket
-sw
itche
d da
taC
PC
752
32
d.te
lex
CP
C 7
5232
e.te
legr
aph
CP
C 7
522
o.ot
her
No
CP
CC
tele
conf
eren
cing
1998
.in
tern
atio
nal s
ervi
ces
isal
low
ed o
nly
thro
ugh
netw
orks
of P
T In
dosa
t and
PT
Sat
elin
do.
Cal
lbac
k is
not p
erm
itted
.
Whe
n or
igin
atin
g w
ithin
Indo
nesi
a, in
tern
atio
nal
serv
ices
are
pro
vide
dex
clus
ivel
y by
PT
Indo
sat
and
PT
Sat
elin
do.
Mar
ket p
artic
ipat
ion
requ
ires
join
t ven
ture
, joi
nt o
pera
tion,
or, f
or v
oice
, circ
uit-
and
pa
cket
-sw
itche
d da
tatr
ansm
issi
on s
ervi
ces,
cont
ract
man
agem
ent
arra
ngem
ent.
For
eign
man
agem
ent a
ndte
chni
cal e
xper
t per
sonn
elar
e lim
ited
to 2
0 na
tura
lpe
rson
s.
See
foot
note
s at
end
of t
able
.

4-54
Tab
le 4
-20—
Co
nti
nu
edH
igh
ligh
ts o
f In
do
nes
ia’s
co
mm
itm
ents
on
bas
ic t
elec
om
mu
nic
atio
n s
ervi
ces
Co
vera
ge
of
Co
mm
itm
ents
Fo
reig
n In
vest
men
tM
arke
t A
cces
sR
egu
lato
ry P
rin
cip
les
Exe
mp
tio
ns
1A
rtic
le II
MF
N
Dom
estic
Allo
ws
35%
fore
ign
owne
rshi
p in
Cro
ss-b
orde
r su
pply
of
a.vo
ice
(cel
lula
r)C
PC
752
1/3
o.ot
her
CP
CS
Cpa
ging
CIn
tern
et a
cces
sC
publ
ic p
ay p
hone
1998
.In
tern
et a
cces
s is
allo
wed
onl
yth
roug
h ne
twor
ks o
f PT
Indo
sat a
nd P
T S
atel
indo
unt
il20
05.
Mar
ket p
artic
ipat
ion
requ
ires:
join
t ven
ture
for
cellu
lar;
join
tve
ntur
e w
ith s
tate
-ow
ned
com
pany
for
PC
S; j
oint
vent
ure
or jo
int o
pera
tion
for
Inte
rnet
acc
ess
and
pagi
ng;
and
join
t ven
ture
, joi
ntop
erat
ion,
or
cont
ract
man
agem
ent f
or p
ay p
hone
serv
ices
.
For
eign
man
agem
ent a
ndte
chni
cal e
xper
t per
sonn
el a
relim
ited
to 2
0 na
tura
l per
sons
.
WT
O m
embe
rs w
ere
aske
d to
sch
edul
e co
mm
itmen
ts o
n ba
sic
tele
com
mun
icat
ion
serv
ices
foun
d in
the
GA
TT
Sec
reta
riat’s
Ser
vice
s S
ecto
ral C
lass
ifica
tion
1
List
. T
his
list d
efin
ed e
ach
serv
ice
usin
g th
e U
nite
d N
atio
ns’ P
rovi
sion
al C
entr
al P
rodu
ct C
lass
ifica
tion
(CP
C)
Cod
e, fo
und
to th
e rig
ht o
f the
sch
edul
ed s
ervi
ces
whe
re a
pplic
able
. W
TO
mem
bers
cou
ld s
ched
ule
com
mitm
ents
on
“oth
er”
tele
com
mun
icat
ion
serv
ices
at t
heir
disc
retio
n.
S
ervi
ce is
one
com
pone
nt o
f a m
ore
aggr
egat
ed C
PC
item
.2
Sou
rce:
Com
pile
d by
US
ITC
sta
ff fr
om W
TO
, GA
TS
, Ind
ones
ia: S
ched
ule
of S
peci
fic C
omm
itmen
ts, s
upp.
2 (
GA
TS
/SC
/43/
Sup
pl.2
), A
pr. 1
997.

Indonesia did not submit a response to the WTO questionnaire regarding the structure74
and regulation of its telecommunication market. Consequently, it is not possible tocharacterize Indonesia’s commitments as rollback, standstill, or regressive measures. A foreign supplier of any classification of telecommunication service to Indonesia must75
be a world-class operator with extensive international experience. A joint venture is a legal entity organized under Indonesian law and having its domicile76
in Indonesia. It is funded by both foreign and Indonesian capital. WTO, Indonesia:Schedule of Specific Commitments, Apr. 1997. A joint operation is an undertaking between one or several foreign and Indonesian77
enterprises of temporary nature, to handle one or several projects/businesses withoutestablishing a new statutory body according to Indonesian laws. WTO, Indonesia: Scheduleof Specific Commitments, Apr. 1997. Contract management is a contract organized under Indonesian law to provide78
temporary management of telecommunication facilities. WTO, Indonesia: Schedule ofSpecific Commitments, Apr. 1997. Three such service suppliers are currently operating on a nonexclusive basis.79
4-55
Foreign Investment
Indonesia scheduled a commitment that limits foreign equity participation to 35percent. In addition, foreign investors may acquire stakes only in certain companies.In terms of local service, foreign investors may acquire equity only in the five jointventures that have been granted regional monopolies until 2011. Foreign investmentin long-distance services is limited to PT Telekomunikasi Indonesia (Telkom) until2006, and in international services, to PT Indonesian Satellite Corporation (Indosat)and PT Satelit Palapa Indonesia (Satelindo) until 2005. Also, foreign investors in localcellular service may acquire stakes only in seven operators. Although foreigninvestment in PCS services is limited, Indonesia places no quantitative limit on thenumber of operators. Foreign investment in Internet, paging, and public pay phoneservices is also limited to 35 percent, and subject to vague quantitative licensingrestrictions. Indonesia’s commitments on foreign investment appear to represent aslight improvement over conditions prevalent in 1994. 74
Market Access
Indonesia’s commitments on voice, circuit-switched data transmission, andteleconferencing services vary according to whether they are provided over local, long-distance, or international networks. Through 2011, these services may be providedover local networks only by Telkom and five regional joint venture partners. Through2006, these services may be provided over long-distance networks exclusively byTelkom. Through 2005, these services may be provided over international networksexclusively by Indosat and Satelindo. Commercial presences established to provide75
such services must take the form of joint ventures, joint operations, or contract76 77
management arrangements with Indonesian companies.78
Indonesia’s schedule also lists commitments on international packet-switched datatransmission, telex, and telegraph services. Commercial presences established to79
provide these services must take the form of joint ventures or joint operations withIndonesian companies and cross-border traffic must pass through the networks ofIndosat or Satelindo. In addition, Indonesia scheduled commitments regarding

Seven operators are currently providing mobile cellular telephone services.80
More than 30 licenses have been issued to Internet access service providers.81
Currently there are 10 national paging operators and over 70 local paging operators.82
Cross-border supply of international Internet access service is allowed only through83
networks of Indosat and Satelindo. Several local companies provide pay phone services. The division of revenue between84
a pay phone operator and Telkom is determined by the government. WTO, GATS, Israel: Schedule of Specific Commitments, supp. 285
(GATS/SC/44/Suppl.2), Apr. 1997.
4-56
cellular, PCS, Internet access, paging, and public pay phone services. Foreign80 81 82
provision of these services is subject to restrictions on forms of establishment. Cellularservices may be provided only through a joint venture; PCS, through a joint venturewith a state-owned company; Internet access and paging, through a joint venture or83
joint operation; and public pay phone services, through a joint venture, joint84
operation, or contract management arrangement.
Indonesia’s commitments on market access appear to represent a standstill. Telkomand Indosat remain the primary providers of domestic and international basictelecommunication services, and have been granted exclusive concessions that willendure for several years. The joint ventures, which allow limited foreign participation,were being organized in 1994, and therefore their presence does not reflect a significantliberalization of market access.
Regulatory Principles
Indonesia adopted most of the procompetitive regulatory principles listed in the GBTreference paper. However, the language in Indonesia’s schedule indicates thatIndonesia does not necessarily commit to a regulatory body that is separate fromsuppliers of basic telecommunication services. Consequently, the degree to whichforeign providers of basic and value-added services (table 4-21) will receivenondiscriminatory treatment remains unclear.
Israel
Israel’s commitments apply to all basic telecommunication services except telex andtelegraph services (table 4-22). In addition, Israel’s commitments apply to paging85
and satellite services. With the exception of local and long-distance public voiceservices, which remain under monopoly control for both facilities- and resale-basedservices, the commitments allow foreign firms to provide services and control facilitiesbased on all means of network technology. Israel’s investment provisions permitforeign firms to acquire and hold a significant stake in all existing providers and toestablish a commercial presence subject to the availability of licenses. Finally, thecommitments obligate Israel to uphold procompetitive regulatory principles outlinedin the GBT reference paper.

USITC staff have attempted to identify rollback, standstill, and regressive commitments86
by comparing the commitments inscribed in Israel’s supplementary telecommunicationschedule with questionnaire responses provided by Israel in 1995. The Negotiating Groupon Basic Telecommunications (NGBT) circulated a questionnaire upon the commencementof extended negotiations to gather and share information regarding conditions and regulatorypractices in each basic telecommunications market.
4-57
Table 4-21Highlights of Indonesia’s commitments on enhanced telecommunication servicesCoverage of Commitments Foreign Investment Market Access1
2.C. Telecommunication services Foreign service suppliers must pay Five foreign servicec. voice mail CPC 7523 higher paid-up capital compared to suppliers can2
h. electronic mail CPC 75232 domestics. This measure will be establish a2
o. other eliminated in the year 2020. commercialC comp. time presence.
sharing CPC 8432
C videotex CPC 7527/292
C electronic mailbox CPC 75232
C file transfer CPC 75299C home telemet.
alarm CPC 75299C entertainment CPC 75299C MIS CPC 75299
WTO members scheduled commitments on enhanced telecommunication services in their initial GATS1
schedules adopted in April 1994. Service is one component of a more aggregated CPC item.2
Source: Compiled by USITC staff from WTO, GATS, Indonesia: Schedule of Specific Commitments(GATS/SC/43), Apr. 1994.
Foreign Investment
Israel’s commitments regarding foreign investment vary by service. For internationalservices, foreign investment in any of three licensed providers, domestic carrier BezeqTelecom, and international carriers Barak Ltd. and Golden Lines Ltd., may not exceed74 percent. For wireless services, foreign ownership is limited to 80 percent. Foreigninvestors may acquire a stake in Bezeq, although Israel does not specify the level offoreign ownership allowed. The Israeli Government remains the majority shareholderof Bezeq, effectively controlling the level of private participation.
Prior to negotiations, the Israeli Government permitted foreign investment in Bezeq andimposed no formal limit on foreign participation in the firm. Until then, Bezeq was thesole supplier of domestic and international voice services. Subsequent to negotiations,Israel preserved Bezeq’s monopoly on domestic voice services, but licensed twoadditional providers of international voice services, Barak and Golden Lines, andpermitted majority foreign investment in both. Thus, Israel’s de jure positionregarding foreign investment has not changed; it was open to substantial foreigninvestment before negotiations, and remained so afterward. In this sense, Israel’scommitment on foreign investment may be viewed as a standstill. However, byallowing foreign investors to establish majority ownership of the new licensees, itappears that Israel’s de facto position regarding foreign investment became more open.Thus, in sum, Israel’s commitment on foreign investment may be viewed as a modestrollback. 86

4-58
Tab
le 4
-22
Hig
hlig
hts
of
Isra
el’s
co
mm
itm
ents
on
bas
ic t
elec
om
mu
nic
atio
n s
ervi
ces
Co
vera
ge
of
Co
mm
itm
ents
Fo
reig
n In
vest
men
tM
arke
t A
cces
sR
egu
lato
ry P
rin
cip
les
Exe
mp
tio
ns
1A
rtic
le II
MF
N
2.C
. T
elec
omm
unic
atio
n se
rvic
esU
nspe
cifie
d am
ount
of f
orei
gnB
ezeq
is th
e ex
clus
ive
Ado
pted
ref
eren
ceN
one
– Is
rael
Dom
estic
owne
rshi
p in
exc
lusi
ve m
onop
oly
prov
ider
unt
il 20
02.
pape
r on
reg
ulat
ory
sche
dule
d M
FN
-a.
voic
eC
PC
752
1b.
pack
et-s
witc
hed
data
CP
C 7
5232
c.ci
rcui
t-sw
itche
d da
taC
PC
752
32
d.fa
csim
ileC
PC
752
1/29
2
g.pr
ivat
e-le
ased
circ
uit
CP
C 7
522/
232
prov
ider
, Bez
eq.
prin
cipl
es in
ent
irety
. ba
sed
CC
ompe
titiv
eac
cord
ing
all
safe
guar
dsW
TO
mem
bers
CIn
terc
onne
ctio
nac
cess
to it
sC
Uni
vers
al s
ervi
cem
arke
ts o
n th
eC
Lice
nsin
g cr
iteria
sam
e te
rms
and
CIn
depe
nden
tco
nditi
ons.
regu
lato
rC
Sca
rce
reso
urce
allo
catio
n
com
mitm
ents
,
Inte
rnat
iona
lLi
mite
d to
74%
fore
ign
owne
rshi
p in
3E
xclu
sive
rig
hts
rese
rved
toa.
voic
eC
PC
752
1c.
circ
uit-
switc
hed
data
CP
C 7
5232
g.pr
ivat
e-le
ased
circ
uit
CP
C 7
522/
232
licen
sed
inte
rnat
iona
l ser
vice
thre
e lic
ense
d op
erat
ors
prov
ider
s in
199
8.un
til 2
002.
Dom
estic
wire
less
Lim
ited
to 8
0% fo
reig
n ow
ners
hip
inLo
cal p
artn
er r
equi
red.
a.vo
ice
CP
C 7
521
1998
.
f.in
tern
atio
nal f
acsi
mile
CP
C 7
521/
29A
llow
s 10
0% fo
reig
n ow
ners
hip
inA
llow
s in
199
8.2
o.ot
her
No
CP
C19
98.
Cpa
ging
Csa
telli
te
o.ot
her
No
CP
CA
llow
s 10
0% fo
reig
n ow
ners
hip
inA
llow
s in
199
8, h
owev
er,
Cdo
mes
tic c
lose
dus
er g
roup
sC
dom
estic
priv
ate
netw
orks
1998
.re
sale
of e
xces
s ca
paci
tyan
d tr
ansm
issi
on to
third
part
ies
not p
erm
itted
.
WT
O m
embe
rs w
ere
aske
d to
sch
edul
e co
mm
itmen
ts o
n ba
sic
tele
com
mun
icat
ion
serv
ices
foun
d in
the
GA
TT
Sec
reta
riat’s
Ser
vice
s S
ecto
ral C
lass
ifica
tion
1
List
. T
his
list d
efin
ed e
ach
serv
ice
usin
g th
e U
nite
d N
atio
ns’ P
rovi
sion
al C
entr
al P
rodu
ct C
lass
ifica
tion
(CP
C)
Cod
e, fo
und
to th
e rig
ht o
f the
sch
edul
ed s
ervi
ces
whe
re a
pplic
able
. W
TO
mem
bers
cou
ld s
ched
ule
com
mitm
ents
on
“oth
er”
tele
com
mun
icat
ion
serv
ices
at t
heir
disc
retio
n.
S
ervi
ce is
one
com
pone
nt o
f a m
ore
aggr
egat
ed C
PC
item
.2
Sou
rce:
Com
pile
d by
US
ITC
sta
ff fr
om W
TO
, GA
TS
, Isr
ael:
Sch
edul
e of
Spe
cific
Com
mitm
ents
, sup
p. 2
(G
AT
S/S
C/4
4/S
uppl
.2),
Apr
. 199
7.

4-59
Market Access
Israel’s schedule indicates that Bezeq’s monopoly provision of domestic facilities-based voice services over the public network will continue until 2002. In addition, until2002, foreign firms wishing to provide most other basic telecommunication servicesover the domestic public network must do so on a resale basis using Bezeq’s facilities.This restriction extends to radio-based, packet- and circuit-switched data transmission,and facsimile services. Private networks and closed user groups must also use Bezeq’snetwork until 2002. Although Bezeq maintains these exclusive rights until 2002,Israel’s indication that Bezeq’s historical privileges will be terminated qualifies as arollback commitment.
Bezeq International, Barak, and Golden Lines, which hold the only licenses to provideinternational services in Israel, will also continue to hold exclusive privileges until2002. Only these three carriers may provide international facilities-based voiceservices over the wireline network, and firms wishing to provide international circuit-switched services and international private leased circuit services must do so throughthe networks of one of these carriers. As before, Israel’s indication that these privilegeswill expire by 2002 qualifies as a rollback commitment.
Segments of the Israeli telecommunication service market that remain free ofrestrictions as of 1998 include international facsimile services, paging services, andsatellite voice and data services. Israel’s commitments in these areas appear to bestandstills.
Regulatory Principles
Israel scheduled a commitment to uphold the obligations contained in the GBTreference paper on procompetitive principles in their entirety. These obligationsinclude implementing competitive safeguards, providing for interconnection with thepublic network, and guaranteeing universal service. In addition, the procompetitiveprinciples require Israel to maintain an independent regulator and make licensingcriteria publicly available. Since Israel’s regulatory environment had generally beenoperating under similar principles, this commitment qualifies as a standstill. However,by making a binding commitment to uphold these principles, Israel strengthened itsnew commitments on basic services as well as those previously scheduled on enhancedtelecommunication services (table 4-23). Israel’s commitment to abide byprocompetitive regulatory principles provides greater regulatory transparency andgreater certainty for all foreign telecommunication providers.

WTO, GATS, Japan: Schedule of Specific Commitments, supp. 287
(GATS/SC/46/Suppl.2), Apr. 1997.
4-60
Table 4-23Highlights of Israel’s commitments on enhanced telecommunication services
Coverage of Commitments Foreign Investment Market Access1
2.C. Telecommunication services Allows 100 % foreign ownership. Data and messagesData and message must be transmittedtransmission only. CPC 7523 via the infrastructure of2
Presumably, this includes: a local licensee. h. electronic mail CPC 75232
i. voice mail CPC 75232
j. on-line informationand data baseretrieval CPC 75232
k. electronic datainterchange CPC 75232
l. enhanced facsimile(including store andforward) CPC 75232
WTO members scheduled commitments on enhanced telecommunication services in their initial GATS1
schedules, adopted in April 1994. Service is one component of a more aggregated CPC item.2
Source: Compiled by USITC staff from WTO, GATS, Israel: Schedule of Specific Commitments(GATS/SC/44), Apr. 1994.
Japan
Japan’s commitments under the WTO agreement apply to all basic telecommunicationservices, except for telegraph services (table 4-24), over which dominant carriers87
Nippon Telegraph and Telephone (NTT) and Kokusai Denshin Denwa (KDD) willcontinue to exercise domestic and international monopolies, respectively. Japan’scommitments permit foreign firms to provide local, long-distance, and internationalservices through wireline, cellular, and satellite networks. Foreign firms are allowed100 percent ownership of both facilities-based telecommunication service providers aswell as resale providers, with the exception of NTT and KDD. Japan has scheduled acommitment to observe all of the procompetitive regulatory principles outlined in theGBT reference paper.
Foreign Investment
Under its WTO commitments, Japan permits 100 percent foreign ownership of alltelecommunication service providers except NTT and KDD. Foreign ownership ofNTT and KDD, either direct or indirect, continues to be limited to 20 percent andJapanese nationality is required for NTT and KDD board members and auditors.Japan’s investment commitments, with the exception of those pertaining to NTT and

4-61
Tab
le 4
-24
Hig
hlig
hts
of
Jap
an’s
co
mm
itm
ents
on
bas
ic t
elec
om
mu
nic
atio
n s
ervi
ces
Co
vera
ge
of
Co
mm
itm
ents
Fo
reig
n In
vest
men
t M
arke
t A
cces
sP
rin
cip
les
Exe
mp
tio
ns
1R
egu
lato
ry
Art
icle
II M
FN
2.C
. Tel
ecom
mun
icat
ion
serv
ices
Allo
ws
100%
fore
ign
owne
rshi
pA
llow
s in
199
8.A
dopt
ed r
efer
ence
pap
er o
n N
one )
Japa
n2
a.vo
ice
CP
C 7
521
with
the
exce
ptio
n of
NT
T a
ndre
gula
tory
prin
cipl
es in
sche
dule
d an
b.pa
cket
-sw
itche
d da
taC
PC
752
3K
DD
in 1
998.
entir
ety.
MF
N-b
ased
3
c.ci
rcui
t-sw
itche
d da
taC
PC
752
3co
mm
itmen
ts,
3
d.te
lex
CP
C 7
523
Lim
ited
to 2
0% in
NT
T a
ndC
Com
petit
ive
safe
guar
dsac
cord
ing
all
3
f.fa
csim
ileC
PC
752
1/29
KD
D.
CIn
terc
onne
ctio
nW
TO
mem
bers
3
g.pr
ivat
e le
ased
circ
uit
CP
C 7
522/
23C
Uni
vers
al s
ervi
ceac
cess
to it
s3
o.ot
her
No
CP
CC
Lice
nsin
g cr
iteria
mar
kets
on
the
CIn
depe
nden
t reg
ulat
orsa
me
term
s an
dC
Sca
rce
reso
urce
cond
ition
s.al
loca
tion
WT
O m
embe
rs w
ere
aske
d to
sch
edul
e co
mm
itmen
ts o
n ba
sic
tele
com
mun
icat
ion
serv
ices
foun
d in
the
GA
TT
Sec
reta
riat’s
Ser
vice
s S
ecto
ral C
lass
ifica
tion
List
. 1
Thi
s lis
t def
ined
eac
h se
rvic
e us
ing
the
Uni
ted
Nat
ions
’ Pro
visi
onal
Cen
tral
Pro
duct
Cla
ssifi
catio
n (C
PC
) C
ode,
foun
d to
the
right
of t
he s
ched
uled
ser
vice
s w
here
appl
icab
le.
WT
O m
embe
rs c
ould
sch
edul
e co
mm
itmen
ts o
n “o
ther
” te
leco
mm
unic
atio
n se
rvic
es a
t the
ir di
scre
tion.
Jap
an d
id n
ot s
ched
ule
com
mitm
ents
with
res
pect
to te
legr
aph
serv
ices
.2
Ser
vice
is o
ne c
ompo
nent
of a
mor
e ag
greg
ated
CP
C it
em.
3
Sou
rce:
Com
pile
d by
US
ITC
sta
ff fr
om W
TO
, GA
TS
, Jap
an: S
ched
ule
of S
peci
fic C
omm
itmen
ts, s
upp.
2 (
GA
TS
/SC
/46/
Sup
pl.2
), A
pr. 1
997.

USITC staff have attempted to identify rollback, standstill, and regressive 88
commitments by comparing the commitments inscribed in Japan’s supplementarytelecommunication schedule with questionnaire responses provided by Japan in 1994. TheNegotiating Group on Basic Telecommunications (NGBT) circulated a questionnaire uponthe commencement of extended negotiations to gather and share information regardingconditions and regulatory practices in each basic telecommunications market. Japan, Questionnaire on Basic Telecommunications, p. 4.89
These subsectors include voice, packet- and circuit-switched data transmission, telex,90
telegraph, facsimile, and private leased circuit services.
4-62
KDD, represent a modest rollback of the restrictions that were in force prior to88
negotiations, as Japan’s Telecommunications Business Law restricted foreignownership of facilities-based carriers to one-third of total capital. Japan’s foreign89
investment commitments pertaining to NTT and KDD represent a standstill.
Market Access
With the exception of telegraph services, Japan places no restrictions on the foreignprovision of basic telecommunication services. Japan has scheduled significantrollback commitments, which provide for international resale of private leased circuitcapacity for the provision of all basic telecommunication services (except telegraphservices). Prior to the WTO agreement, Japan prohibited international resale of90
private leased circuit capacity. In addition, Japan terminated restrictions on theconstruction and operation of new telecommunication networks, thereby registeringan additional rollback.
Regulatory Principles
Japan scheduled a commitment to abide by the GBT reference paper onprocompetitive principles in its entirety. When WTO negotiations on basictelecommunication services commenced, facilities-based suppliers were neitherrequired to provide interconnection for other basic telecommunication networks unlessordered to do so by the Ministry of Posts and Telecommunications (MPT), nor tomake public the details of such agreements. The terms of the regulatory referencepaper therefore represent a modest rollback of interconnection restrictions. Japan’snew obligations with respect to interconnection, in conjunction with the commitmentto observe other procompetitive principles, strengthen and preserve Japan’scommitments pertaining to both basic and enhanced telecommunication services (table4-25).

WTO, GATS, Korea: Schedule of Specific Commitments, supp. 291
(GATS/SC/48/Suppl.2), Apr. 1997.
4-63
Table 4-25Highlights of Japan’s commitments on enhanced telecommunication services
Coverage of commitments Foreign Investment Market Access1
2.C. Telecommunication services Allows 100% foreign ownership in Allows for allh. electronic mail CPC 7523 all services. services.2
i. voice mail CPC 75232
j. on-line informationand data baseretrieval CPC 75232
k. electronic datainterchange CPC 75232
l. enhanced facsimile(including store and forward) CPC 75232
m. code and protocolconversion No CPC
n. on-line informationand/or data processing(including transactionprocessing) CPC 8432
o. other No CPC
WTO members scheduled commitments on enhanced telecommunication services in their initial GATS1
schedules, adopted in April 1994. Service is one component of a more aggregated CPC item.2
Source: Compiled by USITC staff from WTO, GATS, Japan: Schedule of Specific Commitments(GATS/SC/46), Apr. 1994.
Korea
Korea scheduled commitments that allow foreign provision of all basictelecommunication services, as well as cellular, personal communication, paging,trunked radio, and mobile data services, on both a facilities and resale basis (table 4-26). Also, Korea’s commitments permit foreign firms to provide local, long-91
distance, and international services through all means of network technology.However, Korea’s commitments include significant restrictions on foreign investmentand market access, as discussed below. Korea committed to observe theprocompetitive regulatory principles found in the GBT reference paper.
Foreign Investment
Korea’s commitments presently limit foreign interest in Korea Telecom, the country’slargest carrier, to 20 percent, but provide for an increase to 33 percent in 2001.Korea’s commitments also stipulate that the ceiling on an individual’s ownership ofKorea Telecom is 3 percent. With respect to other facilities-based providers of basic

4-64
Tab
le 4
-26
Hig
hlig
hts
of
Ko
rea’
s co
mm
itm
ents
on
bas
ic t
elec
om
mu
nic
atio
n s
ervi
ces
Co
vera
ge
of
Co
mm
itm
ents
Fo
reig
n In
vest
men
tM
arke
t A
cces
sP
rin
cip
les
Exe
mp
tio
ns
1R
egu
lato
ry
Art
icle
II M
FN
2.C
.Tel
ecom
mun
icat
ion
serv
ices
Will
allo
w 3
3% fo
reig
nF
orei
gn p
rovi
sion
of
Ado
pted
ref
eren
ceN
one
– K
orea
a.vo
ice
CP
C 7
521
owne
rshi
p in
mos
t fac
ilitie
s-in
tern
atio
nal v
oice
pape
r on
reg
ulat
ory
sche
dule
d M
FN
-b.
pack
et-s
witc
hed
data
CP
C 7
523
base
d se
rvic
e pr
ovid
ers
until
resa
le a
nd d
omes
ticpr
inci
ples
in e
ntire
ty.
base
d2
c.ci
rcui
t-sw
itche
d da
taC
PC
752
320
01, w
hen
it w
ill a
llow
49%
voic
e re
sale
res
tric
ted
com
mitm
ents
,2
d.te
lex
CP
C 7
523
owne
rshi
p.un
til 2
001
and
1999
,C
Com
petit
ive
acco
rdin
g al
l2
e.te
legr
aph
CP
C 7
523
resp
ectiv
ely.
Will
allo
wsa
fegu
ards
WT
O m
embe
rsf.
facs
imile
CP
CW
ill a
llow
49%
fore
ign
the
prov
isio
n of
all
CIn
terc
onne
ctio
nac
cess
to it
s75
21/2
9ow
ners
hip
in r
esal
e vo
ice
serv
ices
in 2
001.
CU
nive
rsal
ser
vice
mar
ket o
n th
e2
g.pr
ivat
e le
ased
CP
Cse
rvic
es b
egin
ning
199
9, a
ndC
Lice
nsin
g cr
iteria
sam
e te
rms
and
7522
/23
will
allo
w 1
00%
in 2
001.
CIn
depe
nden
t reg
ulat
orco
nditi
ons.
2
o.ot
her
No
CP
CC
Sca
rce
reso
urce
Cdi
gita
l cel
lula
r
Cpa
ging
C
PC
S
C
TR
S
C
mob
ile d
ata
Will
allo
w 2
0% a
ggre
gate
allo
catio
nfo
reig
n ow
ners
hip
of K
orea
nT
elec
om u
ntil
2001
, whe
n it
will
allo
w 3
3%.
WT
O m
embe
rs w
ere
aske
d to
sch
edul
e co
mm
itmen
ts o
n ba
sic
tele
com
mun
icat
ion
serv
ices
foun
d in
the
GA
TT
Sec
reta
riat’s
Ser
vice
s S
ecto
ral C
lass
ifica
tion
1 List
. T
his
list d
efin
ed e
ach
serv
ice
usin
g th
e U
nite
d N
atio
ns’ P
rovi
sion
al C
entr
al P
rodu
ct C
lass
ifica
tion
(CP
C)
Cod
e, fo
und
to th
e rig
ht o
f the
sch
edul
ed s
ervi
ces
whe
re a
pplic
able
. W
TO
mem
bers
cou
ld s
ched
ule
com
mitm
ents
on
“oth
er”
tele
com
mun
icat
ion
serv
ices
at t
heir
disc
retio
n.
S
ervi
ce is
one
com
pone
nt o
f a m
ore
aggr
egat
ed C
PC
item
.2
Sou
rce:
Com
pile
d by
US
ITC
sta
ff fr
om W
TO
, GA
TS
, Kor
ea: S
ched
ule
of S
peci
fic C
omm
itmen
ts, s
upp.
2 (
GA
TS
/SC
/48/
Sup
pl.2
), A
pr. 1
997.

Measures are characterized as standstill, rollback, or regressive commitments by92
comparing measures specified in Korea’s supplementary telecommunications schedule withquestionnaire responses provided by Korea in 1994. The NGBT circulated questionnairesupon the commencement of negotiations to gauge market conditions and regulatorypractices. Korea, Response to Questionnaire on Basic Telecommunications, Oct. 20, 1994. GSPs are allowed to provide voice, telegraph, telex, leased line, data communication,93
facsimile, and other services designated by the Minister of Communications. SSPs are allowed to provide telecommunication services that are narrowly defined in94
terms of technology or geography, such as cellular, paging, trunked radio, and other servicesdesignated by the Minister of Communications. In 1994, Korea allowed no foreign investment in the following GSP services: voice,95
telex, telegraph, facsimile, and private leased circuits. Korea, Response to Questionnaire onBasic Telecommunications, Oct. 20, 1994.
4-65
services, Korea limits foreign equity participation to 33 percent until 2001, when thelimit will increase to 49 percent. Korea will permit foreign equity participation of upto 49 percent in firms operating on a resale basis starting January 1, 1999, andterminate the limit entirely on January 1, 2001.
Korea’s bindings on foreign investment in Korea Telecom and other facilities-basedproviders constitute rollback commitments. In 1994, no foreign equity participation92
or ownership in general service providers (GSP) was allowed, as stipulated by article93
6 of the Korean Telecommunication Business Law. Korea’s foreign investmentrestrictions on specific service providers (SSP) represent standstill commitments as94
they mirror previous foreign investment limitations.95
Market Access
Korea’s commitments impose a number of market access restrictions on foreign firms’provision of facilities-based and resale-based telecommunication services. Foreignprovision of international voice resale services is restricted through December 31,2000. The ability to provide such services will require that foreign firms establishoperations in Korea. Foreign provision of domestic voice resale services will beopened in 1999.
Since the end of the Uruguay Round, Korea has rolled back many limitations onmarket access in the provision of local, long-distance, and international services. In1994, there was virtually no foreign participation in the supply of wireline services.Korea’s commitments may improve the negligible rate of market penetration bypermitting competition in some telecommunication service sectors for the first time.
Regulatory Principles
Korea adopted the GBT reference paper on procompetitive regulatory principles in itsentirety. Korea scheduled commitments to maintain and/or establish competitivesafeguards, to provide interconnection in a transparent and timely manner, to makelicensing criteria publicly available, and to establish independent regulators. Althoughthese commitments represent a standstill from the situation reported in 1994, they mayprove valuable as U.S. telecommunication service providers have reportedlyexperienced difficulty entering the Korean market. In particular, Korea’s obligation

WTO, GATS, Malaysia: Schedule of Specific Commitments, supp. 296
(GATS/SC/52/Suppl.2), Apr. 1997.
4-66
to provide interconnection to foreign providers under nondiscriminatory terms and tomaintain safeguards on cross-subsidization should improve the ability of U.S. andother non-Korean firms to compete in the Korean market for enhancedtelecommunication services. Korea predominantly scheduled full commitments withrespect to enhanced services during the Uruguay Round (table 4-27).
Table 4-27Highlights of Korea’s commitments on enhanced telecommunication services
Coverage of Commitments Foreign Investment Market Access1
2.C. Telecommunication services Allows 100% foreign Allows for all services.h. electronic mail CPC 7523 ownership in all services.2
i. voice mail CPC 75232
j. on-line informationand databaseretrieval CPC 75232
k. electronic datainterchange CPC 75232
l. enhanced facsimile(including store andforward) CPC 75232
m. code and protocolconversion No CPC
n. on-line informationand/or data processing(including transactionprocessing) CPC 8432
WTO members scheduled commitments on enhanced telecommunication services in their initial GATS1
schedules, adopted in April 1994. Service is one component of a more aggregated CPC item.2
Source: Compiled by USITC staff from WTO, GATS, Korea: Schedule of Specific Commitments(GATS/SC/48), Apr. 1994.
Malaysia
Malaysia’s scheduled commitments address voice, packet- and circuit-switched datatransmission, facsimile, and private leased circuit services, as well as cellular, paging,trunked radio, and video transport services (table 4-28). Foreign carriers may96
provide these services on a facilities basis through local, long-distance, andinternational networks using wireline, cellular, or satellite technology. However,foreign carriers may only enter the Malaysian market by acquiring shares of Malaysiancarriers, subject to a 30-percent foreign equity limit. Malaysia scheduledcommitments to observe only certain of the procompetitive principles outlined in theGBT reference paper.

4-67
Tab
le 4
-28
Hig
hlig
hts
of
Mal
aysi
a’s
com
mit
men
ts o
n b
asic
tel
eco
mm
un
icat
ion
ser
vice
s
Co
vera
ge
of
Co
mm
itm
ents
Fo
reig
n In
vest
men
tM
arke
t A
cces
sP
rin
cip
les
Exe
mp
tio
ns
1R
egu
lato
ryA
rtic
le II
MF
N
2.C
.Tel
ecom
mun
icat
ion
serv
ices
Allo
ws
30%
fore
ign
owne
rshi
p in
Allo
wed
onl
y th
roug
hA
dopt
ed r
egul
ator
y N
one
– M
alay
sia
(Fac
ilitie
s-ba
sed
only
) m
inor
ity o
wne
rshi
p of
prin
cipl
es o
f its
ow
nsc
hedu
led
MF
N-
a.vo
ice
CP
C 7
521
b.pa
cket
-sw
itche
d da
taC
PC
752
32
c.ci
rcui
t-sw
itche
d da
taC
PC
752
32
f.fa
csim
ileC
PC
752
1/29
2
g.pr
ivat
e le
ased
circ
uits
CP
C 7
522/
232
o.ot
her
Can
alog
ue/d
igita
l cel
lula
rC
pagi
ngC
trun
ked
radi
oC
vide
o tr
ansp
ort
Csa
telli
te e
arth
sta
tions
Cin
tern
atio
nal s
witc
hing
and
gat
eway
faci
litie
s
exis
ting
licen
sed
oper
ator
s.ex
istin
g lic
ense
d op
erat
ors
crea
tion.
Val
ue o
fba
sed
in 1
998.
regu
lato
ry p
rinci
ples
co
mm
itmen
ts,
Res
ale
is n
ot p
erm
itted
.W
TO
mem
bers
uncl
ear.
acco
rdin
g al
l
acce
ss to
its
mar
ket o
n th
esa
me
term
s an
dco
nditi
ons.
WT
O m
embe
rs w
ere
aske
d to
sch
edul
e co
mm
itmen
ts o
n ba
sic
tele
com
mun
icat
ion
serv
ices
foun
d in
the
GA
TT
Sec
reta
riat’s
Ser
vice
s S
ecto
rial C
lass
ifica
tion
1
List
. T
his
list d
efin
ed e
ach
serv
ice
usin
g th
e U
nite
d N
atio
ns’ C
entr
al P
rodu
ct C
lass
ifica
tion
(CP
C)
Cod
e, fo
und
to th
e rig
ht o
f the
sch
edul
ed s
ervi
ces
whe
reap
plic
able
. W
TO
mem
bers
cou
ld s
ched
ule
com
mitm
ents
on
“oth
er”
tele
com
mun
icat
ion
serv
ices
at t
heir
disc
retio
n.
S
ervi
ce is
one
com
pone
nt o
f a m
ore
aggr
egat
ed C
PC
item
.2
Sou
rce:
Com
pile
d by
US
ITC
sta
ff fr
om W
TO
, GA
TS
, Mal
aysi
a: S
ched
ule
of S
peci
fic C
omm
itmen
ts, s
upp.
2 (
GA
TS
/SC
/52/
Sup
pl.2
), A
pr. 1
997.

Malaysia did not submit a response to the WTO questionnaire regarding the structure97
and regulation of its telecommunications market. Consequently, USITC staff have consultedsecondary sources in order to characterize the nature of Malaysia’s commitments.
4-68
Foreign Investment
Foreign ownership remains limited up to 30 percent in 1998. Also, foreign ownershipis only allowed through acquisition of shares of an existing licensed publictelecommunication operator (PTO). Malaysia’s commitments regarding foreigninvestment appear to represent a standstill.97
Market Access
Malaysia guarantees market access with respect to most facilities-based basictelecommunication services, though only through acquisition of up to 30 percent ofexisting carriers, as described above. Malaysia makes no commitment regardingresale services. Malaysia’s commitments pertaining to market access appear torepresent a standstill.
Regulatory Principles
Malaysia scheduled a commitment to observe a list of regulatory principles annexedto its schedule. The value of this commitment is unclear. For instance, Malaysia’sannex contains no explicit ban on cross-subsidization as the term is commonlyunderstood. Further, the annex does not specify that universal service obligationsshould be competitively neutral, that licensing criteria will be publicly available, orthat interconnection provisions will be cost-based, transparent, or subject to impartialdispute settlement. In the absence of a binding commitment to explicitlyprocompetitive regulatory principles, the value of Malaysia’s commitments on basictelecommunication services, as well as enhanced telecommunication services (table4-29), is uncertain.
Table 4-29Highlights of Malaysia’s commitments in enhanced telecommunication services
Coverage of Commitments Foreign Investment Market Access1
2.C. Telecommunication services Limited to 30% foreign Market access is allowed only h. electronic mail CPC 7523 ownership. through a locally incorporated 2
i. voice mail CPC 7523 joint venture with Malaysian 2
j. on-line retrieval CPC 7523 individuals, Malaysian- 2
l. enhanced facsimile CPC 7523 controlled corporations, or 2
m. code and protocol through partial purchase of an conversion No CPC existing licensed service
o. otherC mobile data CPC 75232
C telex CPC 75232
provider.
Simple resale of data and transmission services is not permitted.
WTO members scheduled commitments on enhanced telecommunication services in their initial GATS1
schedules, adopted in April 1994. Service is one component of a more aggregated CPC item.2
Source: Compiled by USITC staff from WTO, GATS, Malaysia: Schedule of Specific Commitments(GATS/SC/52), Apr. 1994.

WTO, GATS, Mexico: Schedule of Specific Commitments, supp. 298
(GATS/SC/56/Suppl.2), Apr. 1997. USITC staff have attempted to identify rollback, standstill, and regressive commitments99
by comparing the commitments inscribed in Mexico’s supplementary telecommunicationschedule with questionnaire responses provided by Mexico in 1994. The Negotiating Groupon Basic Telecommunications (NGBT) circulated a questionnaire upon the commencementof extended negotiations to gather and share information regarding conditions and regulatorypractices in each basic telecommunications market.
4-69
Mexico
Mexico’s commitments apply to all basic telecommunication services except for telexand telegraph services, and also include provisions regarding paging and cellularservices (table 4-30). Mexico’s commitments allow foreign firms access to local,98
long-distance, and international service markets through wireline and cellular networktechnology. The commitments primarily address facilities-based services, althoughthey indicate that resale will be permitted once the necessary regulatory structure is inplace. Mexico’s commitments allow foreign firms to acquire, establish, and hold aminority stake in telecommunication providers. Finally, Mexico scheduled acommitment to observe the procompetitive regulatory principles outlined in the GBTreference paper.
Foreign Investment
Mexico’s commitments permit foreign firms to own or acquire up to 49 percent of alltelecommunication service providers and facilities. The 49-percent limit may beexceeded for cellular communication services, provided that the investor receivespermission from the Foreign Investment Commission. The only other investmentrestrictions are that resellers, which Mexico calls commercial agencies, may not beowned by public telecommunication concessionaires or foreign governments.Mexico’s broad 49-percent equity limitation reflects the Law on Foreign Investmentthat was in place before 1994. Consequently, Mexico’s commitments regardinginvestment are generally indicative of a standstill position. However, provisions99
indicating that foreign investment may exceed 49 percent in cellular services and thatforeign firms may provide local resale services may be considered modest rollbacks.
Market Access
Mexico’s commitments indicate that cross-border provision of the services addressedin its schedule must be routed through the facilities of an enterprise that has receivedan operating concession from the Ministry of Communications and Transport (SCT).For services provided through a commercial presence, firms must receive a concessionfrom SCT. Mexico’s commitments do not indicate that there is any difference intreatment for local, long-distance, or international service, although theimplementation of regulatory reforms begun in the long-distance market has not yetreached the local market. The commitments allow the use of wireline and cellulartechnology. With respect to satellite technology, Telecomunicaciones de Mexico

4-70
Tab
le 4
-30
Hig
hlig
hts
of
Mex
ico
’s c
om
mit
men
ts o
n b
asic
tel
eco
mm
un
icat
ion
ser
vice
s
Co
vera
ge
of
Co
mm
itm
ents
Fo
reig
n In
vest
men
t M
arke
t A
cces
sP
rin
cip
les
Exe
mp
tio
ns
1R
egu
lato
ry
Art
icle
II M
FN
2.C
.T
elec
omm
unic
atio
n se
rvic
esA
llow
s up
to 4
9% fo
reig
nC
ross
-bor
der
supp
ly o
f A
dopt
ed r
efer
ence
N
one
– M
exic
oa.
voic
eC
PC
752
1ow
ners
hip
in 1
998.
inte
rnat
iona
l ser
vice
s m
ust
bepa
per
on r
egul
ator
y
sche
dule
d M
FN
-b.
pack
et-s
witc
hed
data
CP
C 7
523
rout
ed th
roug
h th
e fa
cilit
ies
ofpr
inci
ples
in e
ntire
ty.
base
d2
c.ci
rcui
t-sw
itche
d da
taC
PC
752
3F
or c
ellu
lar
A a
nd B
ban
dan
ent
erpr
ise
that
has
aco
mm
itmen
ts,
2
f.fa
csim
ileC
PC
freq
uenc
ies,
fore
ign
conc
essi
on g
rant
ed b
y th
eC
Com
petit
ive
acco
rdin
g al
l WT
O75
21/2
9in
vest
men
t in
exce
ss o
f 49%
Min
istr
y of
Com
mun
icat
ions
and
sa
fegu
ards
mem
bers
acc
ess
2
g.pr
ivat
e le
ased
circ
uit
CP
Cw
ill b
e pe
rmitt
ed fo
llow
ing
aT
rans
port
(S
CT
).C
Inte
rcon
nect
ion
to it
s m
arke
t on
7522
/23
favo
rabl
e de
cisi
on b
y th
eC
Uni
vers
al s
ervi
ceth
e sa
me
term
so.
othe
rN
o C
PC
For
eign
Inve
stm
ent
A c
once
ssio
n is
req
uire
d to
CLi
cens
ing
crite
riaan
d co
nditi
ons.
Cpa
ging
Cce
llula
r on
the
“A”
and
“B”
band
s3
Cco
mm
erci
al a
genc
ies3
Com
mis
sion
.pr
ovid
e te
leco
mm
unic
atio
n C
Inde
pend
ent
For
com
mer
cial
age
ncie
s, o
rpr
esen
ce.
CS
carc
e re
sour
cere
selle
rs, p
ublic
allo
catio
nte
leco
mm
unic
atio
nF
orei
gn g
over
nmen
ts m
ay n
otco
nces
sion
aire
s m
ay n
ot h
old
prov
ide
tele
com
mun
icat
ion
an in
vest
men
t pos
ition
.se
rvic
es.
For
eign
gov
ernm
ents
may
not
Tel
ecom
unic
acio
nes
de M
exic
opa
rtic
ipat
e in
an
ente
rpris
e se
t(T
elec
omm
) ha
s ex
clus
ive
right
sup
in a
ccor
danc
e w
ith M
exic
anto
link
s w
ith I
ntel
sat a
ndla
w.
Inm
arsa
t.
serv
ices
thro
ugh
a co
mm
erci
alre
gula
tor
See
foot
note
s at
end
of t
able
.

4-71
Tab
le 4
-30—
Co
nti
nu
edH
igh
ligh
ts o
f M
exic
o’s
co
mm
itm
ents
on
bas
ic t
elec
om
mu
nic
atio
n s
ervi
ces
Co
vera
ge
of
Co
mm
itm
ents
Fo
reig
n In
vest
men
t M
arke
t A
cces
sP
rin
cip
les
Exe
mp
tio
ns
1R
egu
lato
ryA
rtic
le II
MF
N
Ser
vice
s ot
her
than
inte
rnat
iona
lse
rvic
es th
at r
equi
re th
e us
e of
sate
llite
s m
ust u
se M
exic
ansa
telli
te in
fras
truc
ture
unt
il th
eye
ar 2
002.
A p
erm
it is
sued
by
the
SC
T is
requ
ired
in o
rder
to p
rovi
de a
publ
ic fa
csim
ile s
ervi
ce.
Onl
yen
terp
rises
set
up
in a
ccor
danc
ew
ith M
exic
an la
w m
ay o
btai
nsu
ch a
per
mit.
Ope
rato
rs o
f priv
ate
netw
orks
wis
hing
to e
xplo
it se
rvic
esco
mm
erci
ally
mus
t obt
ain
aco
nces
sion
from
the
SC
T,
whe
reup
on s
uch
netw
orks
assu
me
the
char
acte
r of
pub
licne
twor
ks.
For
com
mer
cial
age
ncie
s, o
rre
selle
rs, a
per
mit
is r
equi
red
and
ente
rpris
es m
ust b
ees
tabl
ishe
d in
acc
orda
nce
with
Mex
ican
law
. H
owev
er, t
he S
CT
will
not
issu
e pe
rmits
unt
ilre
leva
nt r
egul
atio
ns a
re is
sued
.
WT
O m
embe
rs w
ere
aske
d to
sch
edul
e co
mm
itmen
ts o
n ba
sic
tele
com
mun
icat
ion
serv
ices
foun
d in
the
GA
TT
Sec
reta
riat’s
Ser
vice
s S
ecto
ral C
lass
ifica
tion
1
List
. T
his
list d
efin
ed e
ach
serv
ice
usin
g th
e U
nite
d N
atio
ns’ C
entr
al P
rodu
ct C
lass
ifica
tion
(CP
C)
Cod
e, fo
und
to th
e rig
ht o
f the
sch
edul
e se
rvic
es w
here
appl
icab
le.
WT
O m
embe
rs c
ould
sch
edul
e co
mm
itmen
ts o
n “o
ther
” te
leco
mm
unic
atio
n se
rvic
es a
t the
ir di
scre
tion.
Fre
quen
cies
825
-835
/870
-880
and
835
-845
/880
-890
MH
Z.
2
Sou
rce:
Com
pile
d by
US
ITC
sta
ff fr
om W
TO
, GA
TS
, Mex
ico:
Sch
edul
e of
Spe
cific
Com
mitm
ents
, sup
p. 2
(G
AT
S/S
C/5
6/S
uppl
.2),
Apr
. 199
7.

Mexico is delaying full competition in satellite services until 2002 in order to allow the100
buyer of the newly privatized satellites, the joint venture led by Loral, sufficient time torecoup some of its investment. However, under the recent U.S./ Mexico satellite agreement,U.S. fixed-satellite service companies will be able to offer services in the Mexican domesticmarket no later than January 1, 1999. FCC, News, “International Bureau AnnouncesSigning of Fixed-Satellite Services Protocol with Mexico,” Oct. 17, 1997, found at Internetaddress http://www.fcc.gov/, retrieved Nov. 5, 1997. Mexican Government representative, interview by USITC staff, Washington, DC, Oct.101
24, 1997.
4-72
(Telecomm) retains exclusive rights to links with Intelsat and Inmarsat, and providersof domestic long-distance satellite services must use the Mexican satelliteinfrastructure until 2002. Finally, Mexico indicates that resale of100
telecommunications will be permissible once relevant regulations are in place.However, the Mexican Government reportedly does not have plans to develop suchregulations, hence, the provision of resale services appears to be proscribedindefinitely. Despite this weakness in its schedule, Mexico’s commitments101
generally reflect a rollback from previous market access conditions by guaranteeingmarket access for most basic services and by committing to terminate most restrictionson satellite communications by 2002.
Regulatory Principles
Mexico scheduled a commitment to uphold all of the procompetitive regulatoryprinciples outlined in the GBT reference paper. In so doing Mexico implementedsafeguards to prevent anticompetitive practices, to ensure interconnection onnondiscriminatory terms, to provide licensing criteria publicly, and to maintain anindependent regulator. These commitments reflect a standstill position. Nevertheless,these safeguards increase the value of Mexico’s commitments on basic and enhancedtelecommunication services (table 4-31), the latter of which guaranteed market accessfor the provision of selected services through a commercial presence from 1995onward. Without such a guarantee, foreign firms could still have been subject todiscriminatory or exclusionary practices.

4-73
Table 4-31Highlights of Mexico’s commitments on enhanced telecommunication services
Coverage of Commitments Foreign Investment Market Access1
2.C. Telecommunication services Limited to 49% foreign ownership of A permit is required in o. other: the registered capital of order to provide services
value-added services, defined as enterprises. using radio-electrictelecommunication services which space. A permit fromutilize computerized processing the Ministry of systems that: Communications and C affect the format, content, Transport (SCT) is
protocol or similar aspects of required in order tothe information transmitted to establish private the user; networks and supply
C give the client additional, value-added services. different or restructured The central equipmentinformation; or and systems for
C involve interaction between the providing special user and the information telecommunicationstored. services must be
2
located in Mexican territory.
There is an exclusiveprovider ofcomputerized airlinereservation services.
30% of excess capacityof private circuits may berented or sold.
A permit from the SCTis required for cross-border connections.
Long-distance servicesfor third parties areprohibited.
WTO members scheduled commitments on enhanced telecommunication services in their initial GATS1
schedules, adopted in April 1994. Under the NAFTA, U.S. and Canadian firms may invest up to 100% in providers of enhanced2
telecommunication services.
Source: Compiled by USITC staff from WTO, GATS, Mexico: Schedule of Specific Commitments(GATS/SC/56), Apr. 1994.

WTO, GATS, New Zealand: Schedule of Specific Commitments, supp. 2102
(GATS/SC/62/Suppl.2), Apr. 1997. USITC staff have attempted to identify rollback, standstill, and regressive103
commitments by comparing the commitments inscribed in New Zealand’s supplementarytelecommunication schedule with questionnaire responses provided by New Zealand in1994. The Negotiating Group on Basic Telecommunications ( NGBT) circulated aquestionnaire upon the commencement of extended negotiations to gather and shareinformation regarding conditions and regulatory practices in each basic telecommunicationsmarket.
4-74
New Zealand
New Zealand’s commitments cover all basic telecommunication services, plus paging,teleconferencing, personal communication, cellular, trunked radio, and mobile dataservices (table 4-32). New Zealand’s commitments provide foreign carriers with102
access to local, long-distance, and international service markets through all means ofnetwork technology, both on a facilities basis and through resale. With one notableexception, foreign investors face no significant impediments to investing in NewZealand’s telecommunication service industry. New Zealand scheduled bindingcommitments to observe the procompetitive regulatory principles found in the GBTreference paper in their entirety.
Foreign Investment
New Zealand restricts foreign ownership in Telecom New Zealand, the country’slargest carrier, to 49.9 percent and requires one-half of the firm’s board of directorsto be New Zealand citizens. Aside from this limitation, New Zealand permits 100percent foreign investment in all telecommunication service providers, althoughacquisitions over NZ$10 million must be approved by the Overseas InvestmentCommission unless they involve less than 25 percent of an individual company.
New Zealand’s commitments generally represent a standstill. The foreign103
ownership limitation of 49.9 percent in Telecom has been in place since privatizationin 1990 and foreign firms were able to construct their own networks, invest inconsortia, and operate their own facilities prior to the negotiations in 1994. Likewise,New Zealand did not previously place any restrictions on the provision of resaleservices, except for measures based on reciprocity with Australia.
Market Access
New Zealand scheduled commitments that allow foreign provision of alltelecommunication services, thereby guaranteeing broad market access to foreignfirms. New Zealand’s market access commitments represent standstill commitments,as they bind New Zealand’s already liberal telecommunication market.

4-75
Tab
le 4
-32
Hig
hlig
hts
of
New
Zea
lan
d’s
co
mm
itm
ents
on
bas
ic t
elec
om
mu
nic
atio
n s
ervi
ces
Co
vera
ge
of
Co
mm
itm
ents
Fo
reig
n In
vest
men
t M
arke
t A
cces
sP
rin
cip
les
Exe
mp
tio
ns
1R
egu
lato
ryA
rtic
le II
MF
N
2.C
. T
elec
omm
unic
atio
n se
rvic
esA
llow
s 10
0% fo
reig
n ow
ners
hip
inA
llow
s fo
r al
l ser
vice
s in
Ado
pted
ref
eren
ceN
one
– N
ewa.
voic
eC
PC
752
119
98, e
xcep
t a 4
9.9%
fore
ign
1998
.pa
per
on r
egul
ator
yZ
eala
ndb.
pack
et-s
witc
hed
data
CP
C 7
523
equi
ty li
mit
in T
elec
om N
ewpr
inci
ples
in e
ntire
ty.
sche
dule
d M
FN
-2
c.ci
rcui
t-sw
itche
d da
taC
PC
752
3Z
eala
nd.
base
d2
d.te
lex
CP
C 7
523
CC
ompe
titiv
eco
mm
itmen
ts,
2
e.te
legr
aph
CP
C 7
522
safe
guar
dsac
cord
ing
all W
TO
2
f.fa
csim
ileC
PC
752
1/29
CIn
terc
onne
ctio
nm
embe
rs a
cces
s2
g.pr
ivat
e le
ased
circ
uit
CP
C 7
522/
23C
Uni
vers
al s
ervi
ceto
its
mar
ket o
n2
o.ot
her
No
CP
CC
Lice
nsin
g cr
iteria
the
sam
e te
rms
Cpa
ging
Cte
leco
nfer
enci
ngC
pers
onal
com
mun
icat
ion
serv
ices
(P
CS
)C
cellu
lar
Ctr
unke
d ra
dio
Cm
obile
dat
a
CIn
depe
nden
tan
d co
nditi
ons.
regu
lato
rC
Sca
rce
reso
urce
allo
catio
n
WT
O m
embe
rs w
ere
aske
d to
sch
edul
e co
mm
itmen
ts o
n ba
sic
tele
com
mun
icat
ion
serv
ices
foun
d in
the
GA
TT
Sec
reta
riat‘s
Ser
vice
s S
ecto
ral C
lass
ifica
tion
1
List
. T
his
list d
efin
ed e
ach
serv
ice
usin
g th
e U
nite
d N
atio
ns’ P
rovi
sion
al C
entr
al P
rodu
ct C
lass
ifica
tion
(CP
C)
Cod
e, fo
und
to th
e rig
ht o
f the
sch
edul
ed s
ervi
ces
whe
re a
pplic
able
. W
TO
mem
bers
cou
ld s
ched
ule
com
mitm
ents
on
“oth
er”
tele
com
mun
icat
ion
serv
ices
at t
heir
disc
retio
n.
S
ervi
ce is
one
com
pone
nt o
f a m
ore
aggr
egat
ed C
PC
item
.2
Sou
rce:
Com
pile
d by
US
ITC
sta
ff fr
om W
TO
, GA
TS
, New
Zea
land
: Sch
edul
e of
Spe
cific
Com
mitm
ents
, sup
p. 2
(G
AT
S/S
C/6
2/S
uppl
.2),
Apr
. 199
7.

ITU, Asia-Pacific Telecommunication Indicators, box 6.2, p. 56.104
Ibid. 105
4-76
Regulatory Principles
New Zealand has adopted the procompetitive regulatory principles outlined in theGBT reference paper in their entirety. Nevertheless, New Zealand’snoninterventionist regulatory approach, while it appears liberal, may actually impedecompetition. New Zealand’s regulatory system requires telecommunication service104
providers to resolve disputes among themselves, including those pertaining tointerconnection. This may require lengthy negotiations. For instance, theinterconnection dispute between Clear Communications and Telecom was resolvedonly after an expensive, 4-year legal battle through several levels of New Zealand’slegal system. Thus, the extent to which New Zealand’s regulatory approach will105
promote competition in its basic and enhanced telecommunication service markets(table 4-33) is unclear.
Table 4-33Highlights of New Zealand’s commitments on enhanced telecommunication services
Coverage of Commitments Foreign Investment Market Access1
2.C. Telecommunication services Allows for 100% foreign ownership in Allows for allh. electronic mail CPC 7523 all services. services.2
i. voice mail CPC 75232
j. on-line informationand data baseretrieval CPC 75232
k. electronic datainterchange CPC 75232
l. enhanced facsimile CPC 75232
m. code and protocolconversion No CPC
n. on-line informationand/or dataprocessing CPC 8432
WTO members scheduled commitments on enhanced telecommunication services in their initial1
GATS schedules, adopted in April 1994. Service is one component of a more aggregated CPC item.2
Source: Compiled by USITC staff from WTO, GATS, New Zealand: Schedule of Specific Commitments(GATS/SC/62), Apr. 1994.

WTO, GATS, Norway: Schedule of Specific Commitments, supp. 2106
(GATS/SC/66/Suppl.2), Apr. 1997. USITC staff have attempted to identify rollback, standstill, and regressive107
commitments by comparing the commitments inscribed in Norway’s supplementarytelecommunication schedule with questionnaire responses provided by Norway in 1994. The Negotiating Group on Basic Telecommunications (NGBT) circulated a questionnaireupon the commencement of extended negotiations to gather and share information regardingconditions and regulatory practices in each basic telecommunications market.
4-77
Norway
Norway allows foreign provision of all basic telecommunication services, includingmobile and personal communication systems (PCS). The commitments allow foreignfirms to provide local, long-distance, and international services via wireline, cellularand satellite networks. Norway lists no restrictions on foreign ownership oftelecommunication carriers and allows foreign firms to provide services on a facilitiesbasis or through resale of existing capacity (table 4-34). Norway also scheduled106
commitments to observe all of the procompetitive principles outlined in the GBTreference paper.
Foreign Investment
Norway places no limitations on foreign investment in basic telecommunicationservices. Foreign firms may acquire, establish or hold up to 100 percent equity intelecommunication carriers, which represents a significant rollback. Prior to107
negotiations, foreign providers had been limited to minority status in Norwegiancarriers.
Market Access
Norway grants full market access to foreign providers of basic telecommunicationservices. The commitments open the entire telecommunication service industry toforeign competition, and lift the restrictions on the facilities-based voice servicesformerly reserved for Telenor, Norway’s dominant carrier. These commitments, too,represent significant rollbacks.
Regulatory Principles
Norway scheduled commitments to adopt the GBT reference paper on procompetitiveprinciples in its entirety. Commitments on these regulatory principles, which providefor interconnection, public disclosure of licensing criteria, independent regulation, andtransparent allocation and use of scarce resources, represent significant rollbacks.Prior to negotiations, for example, there was no requirement in Norway to disclosepublicly interconnection arrangements.

4-78
Tab
le 4
-34
Hig
hlig
hts
of
No
rway
’s c
om
mit
men
ts o
n b
asic
tel
eco
mm
un
icat
ion
ser
vice
s
Co
vera
ge
of
Co
mm
itm
ents
Fo
reig
n In
vest
men
t M
arke
t A
cces
sP
rin
cip
les
Exe
mp
tio
ns
1R
egu
lato
ryA
rtic
le II
MF
N
2.C
.Tel
ecom
mun
icat
ion
serv
ices
Allo
ws
100%
fore
ign
owne
rshi
p in
Allo
ws
in 1
998.
Ado
pted
ref
eren
ceN
one
– N
orw
aya.
voic
eC
PC
752
119
98.
pape
r o
n re
gula
tory
sche
dule
d M
FN
-b.
pack
et-s
witc
hed
data
CP
C 7
523
prin
cipl
es in
ent
irety
.ba
sed
2
c.ci
rcui
t-sw
itche
d da
taC
PC
752
3co
mm
itmen
ts,
2
d.te
lex
CP
C 7
523
CC
ompe
titiv
eac
cord
ing
all
2
e.te
legr
aph
CP
C 7
522
safe
guar
dsW
TO
mem
bers
2
f.fa
csim
ile
CP
C 7
5212
/29
CIn
terc
onne
ctio
nac
cess
to it
s2
g.pr
ivat
e le
ased
circ
uit
CP
C 7
5222
/232
CU
nive
rsal
ser
vice
mar
ket o
n th
eo.
othe
rN
o C
PC
CLi
cens
ing
crite
riasa
me
term
s an
dC
mob
ileC
pers
onal
com
mun
icat
ion
serv
ices
(P
CS
)
CIn
depe
nden
tco
nditi
ons.
regu
lato
rC
Sca
rce
reso
urce
allo
catio
n
WT
O m
embe
rs w
ere
aske
d to
sch
edul
e co
mm
itmen
ts o
n ba
sic
tele
com
mun
icat
ion
serv
ices
foun
d in
the
GA
TT
Sec
reta
riat’s
Ser
vice
s S
ecto
ral C
lass
ifica
tion
1
List
. T
his
list d
efin
ed e
ach
serv
ice
usin
g th
e U
nite
d N
atio
ns’ P
rovi
sion
al C
entr
al P
rodu
ct C
lass
ifica
tion
(CP
C)
Cod
e, fo
und
to th
e rig
ht o
f the
sch
edul
e se
rvic
esw
here
app
licab
le.
WT
O m
embe
rs c
ould
sch
edul
e co
mm
itmen
ts o
n “o
ther
” te
leco
mm
unic
atio
n se
rvic
es a
t the
ir di
scre
tion.
Ser
vice
is o
ne c
ompo
nent
of a
mor
e ag
greg
ated
CP
C it
em.
2
Sou
rce:
Com
pile
d by
US
ITC
sta
ff fr
om W
TO
, GA
TS
, Nor
way
: Sch
edul
e of
Spe
cific
Com
mitm
ents
, sup
p. 2
(G
AT
S/S
C/6
6/S
uppl
.2),
Apr
. 199
7.

4-79
Adherence to these principles will improve the ability of U.S. firms to provide bothbasic and enhanced telecommunication services. Commitments for the latter werefinalized during the Uruguay Round, and inscribed in national schedules published inApril 1994 (table 4-35).
Table 4-35Highlights of Norway’s commitments on enhanced telecommunication services
Coverage of commitments Foreign Investment Market Access1
2.C. Telecommunication services Allows 100% foreign ownership Allows for all services.h. electronic mail CPC 7523 in all services.2
i. voice mail CPC 75232
j. on-line information and data base retrieval CPC 75232
k. electronic data interchange CPC 75232
l. enhanced facsimile(including store andforward) CPC 75232
m. code and protocolconversion No CPC
n. on-line informationand /or data processing(including transactionsprocessing) CPC 8432
o. other No CPCC videotextC enhanced services
on licensed wirelessnetworks includingpaging and excludingvoice transmission
WTO members scheduled commitments on enhanced telecommunication services in their initial GATS1
schedules, adopted in April 1994. Service is one component of a more aggregated CPC item.2
Source: Compiled by USITC staff from WTO, GATS, Norway: Schedule of Specific Commitments(GATS/SC/66), Apr. 1994.

WTO, GATS, Poland: Schedule of Specific Commitments, supp. 2108
(GATS/SC/71/Suppl.2), Apr. 1997. USITC staff have attempted to identify rollback, standstill, and regressive109
commitments by comparing the commitments inscribed in Poland’s supplementarytelecommunication schedule with questionnaire responses provided by Poland in 1996. TheNegotiating Group on Basic Telecommunications (NGBT) circulated a questionnaire uponthe commencement of extended negotiations to gather and share information regardingconditions and regulatory practices in each basic telecommunications market.
4-80
Poland
Poland’s WTO commitments cover all basic telecommunication services, as well ascable television, radio, cellular, mobile satellite, and paging services (table 4-36).108
In 2003, Poland will allow foreign firms to provide local, long-distance, andinternational services on a facilities or resale basis via any means of technology. In2003, Poland will also loosen restrictions on foreign investment, allowing foreignentities to acquire up to 49 percent of all basic service providers. Poland adopted theprocompetitive regulatory principles contained in the GBT reference paper in theirentirety.
Foreign Investment
Poland’s commitments indicate that foreign investment in telecommunicationcompanies is only permitted in the form of limited liability or joint stock companiesestablished in Poland. Further, the majority of the board of directors must be Polishcitizens residing in Poland. Through 2003, Poland’s commitments gradually increasethe number of market segments open to foreign investors. Poland currently allows100 percent foreign ownership of paging service providers, and 49 percent foreignownership of providers of local voice, packet- and circuit-switched data transmission,facsimile, private leased circuit, cable television, radio, and cellular services. In year2000, Poland will permit 49 percent foreign ownership of domestic telex andtelegraph service providers. And in 2003, Poland will allow 49 percent foreigninvestment in long-distance voice; international voice, telex, and telegraph; and mobilesatellite services. Nevertheless, Poland’s bindings regarding foreign investment, whileprogressively liberal, appear to be standstill commitments, reflecting plans laid priorto negotiations.109
Market Access
Poland scheduled commitments that gradually improve market access during 1998-2003. Markets for local voice, packet- and circuit-switched data transmission,facsimile, private leased circuits, paging, cable television, radio, and cellular servicesremain open. Markets for domestic telex and domestic telegraph services, currentlyprovided by Telekomunikacja Polska S.A. (TPSA), Poland’s dominant carrier, arescheduled to open in January 2000. Markets for long-distance and international voice,international telex, international telegraph, and mobile satellite services are scheduled

4-81
Tab
le 4
-36
Hig
hlig
hts
of
Po
lan
d’s
co
mm
itm
ents
on
bas
ic t
elec
om
mu
nic
atio
n s
ervi
ces
Co
vera
ge
of
Co
mm
itm
ents
Fo
reig
n In
vest
men
tM
arke
t A
cces
sP
rin
cip
les
Exe
mp
tio
ns
1R
egu
lato
ryA
rtic
le II
MF
N
2.C
.All
sect
ors
Lim
ited
to 4
9% fo
reig
n ow
ners
hip
inA
lice
nse
is r
equi
red
for
the
Ado
pted
ref
eren
ceN
one
–Pol
and
all s
ervi
ces
and
netw
orks
.pr
ovis
ion
of a
ll se
rvic
es,
and
pape
r on
reg
ulat
ory
sche
dule
d M
FN
-
For
eign
inve
stm
ent m
ust b
e in
the
com
pani
es r
egis
tere
d in
en
tiret
y.co
mm
itmen
ts,
form
of a
lim
ited
liabi
lity
or a
join
tP
olan
d, u
nles
s w
aive
d by
ac
cord
ing
all W
TO
stoc
k co
mpa
ny e
stab
lishe
d in
the
Min
iste
r of
C
Com
petit
ive
mem
bers
acc
ess
Pol
and.
The
maj
ority
of t
he b
oard
Com
mun
icat
ions
. Li
cens
ing
safe
guar
dsto
its
mar
ket o
n th
eof
dire
ctor
s m
ust b
e P
olis
h ci
tizen
sis
sub
ject
to p
ublic
ly a
vaila
ble
CIn
terc
onne
ctio
nsa
me
term
s an
dre
sidi
ng in
Pol
and
crite
ria.
CU
nive
rsal
ser
vice
cond
ition
s
is a
vaila
ble
only
to
prin
cipl
es in
base
d
CLi
cens
ing
crite
riaC
Inde
pend
ent
regu
lato
rC
Sca
rce
reso
urce
allo
catio
n
a.lo
ng-d
ista
nce
and
Allo
ws
49%
fore
ign
owne
rshi
p in
Will
allo
w in
200
3.in
tern
atio
nal v
oice
C
PC
752
120
03.
2
d.in
tern
atio
nal t
elex
CP
C 7
5232
e.in
tern
atio
nal
tele
grap
hC
PC
752
2
d.do
mes
tic te
lex
CP
C 7
523
Allo
ws
49%
fore
ign
owne
rshi
p in
Will
allo
w in
200
0.2
e.do
mes
tic te
legr
aph
2000
.
a.lo
cal v
oice
Allo
ws
49%
fore
ign
owne
rshi
p in
Allo
ws
in 1
998.
b.pa
cket
-sw
itche
d da
taC
PC
752
319
98.
2
c.ci
rcui
t-sw
itche
d da
taC
PC
752
32
f.fa
csim
ileC
PC
752
1/23
2
g.pr
ivat
e le
ased
ci
rcui
tsC
PC
752
22
o.ot
her
No
CP
CA
llow
s 10
0% fo
reig
n ow
ners
hip
inA
llow
s in
199
8.
Mus
t use
Cpa
ging
1998
.pa
n-E
urop
ean
pagi
ngsy
stem
s.
o.ot
her
No
CP
CLi
mite
d to
49%
fore
ign
owne
rshi
pA
llow
s in
199
8.C
cabl
e tv
and
rad
io n
etw
orks
in 1
998.
See
foot
note
s at
end
of t
able
.

4-82
Tab
le 4
-36—
Co
nti
nu
edH
igh
ligh
ts o
f P
ola
nd
’s c
om
mit
men
ts o
n b
asic
tel
eco
mm
un
icat
ion
ser
vice
s
Co
vera
ge
of
Co
mm
itm
ents
Fo
reig
n In
vest
men
tM
arke
t A
cces
sP
rin
cip
les
Exe
mp
tio
ns
1R
egu
lato
ryA
rtic
le II
MF
N
o.ot
her
No
CP
CLi
mite
d to
49%
fore
ign
owne
rshi
p in
Allo
ws
in 1
998,
req
uire
sC
publ
ic c
ellu
lar
mob
ile19
98.
the
use
of T
PS
A’s
inte
rnat
iona
l net
wor
ks u
ntil
2003
, but
will
allo
w th
e us
eof
mic
row
ave
conn
ectio
nsif
TP
SA
is u
nabl
e to
offe
rco
nnec
tions
.
o.ot
her
No
CP
CW
ill a
llow
100
% fo
reig
n ow
ners
hip
inA
llow
s in
200
3.C
mob
ile s
atel
lite
serv
ices
an
d ne
twor
ks20
03.
WT
O m
embe
rs w
ere
aske
d to
sch
edul
e co
mm
itmen
ts o
n ba
sic
tele
com
mun
icat
ion
serv
ices
foun
d in
the
GA
TT
Sec
reta
riat’s
Ser
vice
s S
ecto
ral C
lass
ifica
tion
1
List
. T
his
list d
efin
ed e
ach
serv
ice
usin
g th
e U
nite
d N
atio
ns’ P
rovi
sion
al C
entr
al P
rodu
ct C
lass
ifica
tion
(CP
C)
Cod
e, fo
und
to th
e rig
ht o
f the
sch
edul
ed s
ervi
ces
whe
re a
pplic
able
. W
TO
mem
bers
cou
ld s
ched
ule
com
mitm
ents
on
“oth
er”
tele
com
mun
icat
ion
serv
ices
at t
heir
disc
retio
n.
S
ervi
ce is
one
com
pone
nt o
f a m
ore
aggr
egat
ed C
PC
item
.2
Sou
rce:
Com
pile
d by
US
ITC
sta
ff fr
om W
TO
, GA
TS
, Pol
and:
Sch
edul
e of
Spe
cific
Com
mitm
ents
, sup
p. 2
(G
AT
S/S
C/7
1/S
uppl
.2),
Apr
. 199
7.

4-83
to open in 2003. Poland requires that cellular service providers use TPSA’sinfrastructure until 2003, unless TPSA is not able to provide network connections.Further, paging service providers are required to use pan-European paging systems.Finally, foreign providers must register in Poland and are subject to publicly availablelicensing requirements. While most of Poland’s commitments on basictelecommunication services are standstills, those allowing eventual foreign provisionof long-distance voice, international voice, telegraph, and mobile satellite servicesappear to constitute significant rollbacks.
Regulatory Principles
Poland scheduled commitments to abide by the GBT reference paper onprocompetitive principles in its entirety. Therefore, Poland is obligated to providesafeguards against anticompetitive practices, and measures that provide forinterconnection with public networks on nondiscriminatory terms, publicly availablelicensing criteria, independent regulators, and transparent and nondiscriminatoryallocation and use of scarce resources. Poland’s commitments regardingprocompetitive safeguards and interconnection represent significant rollbacks. Priorto negotiations, Poland had no safeguards in place and interconnection pricing wasreportedly arbitrary. Poland’s commitments on regulatory principles complement itsbasic and enhanced telecommunication commitments, although the latter are bestcharacterized as modest (table 4-37).
Table 4-37Highlights of Poland’s commitments on enhanced telecommunication services
Coverage of Commitment Foreign Investment Market Access1
2.C. Telecommunication services Limited to 49% foreign ownership in Use of public oro. other CPC 7522/23 inter-town lines. authorized networks2
Allows 100% foreign ownership in services.local services.
required for cross-border provision of
No foreign provideror Polish carrier withany foreigninvestment mayprovide internationalservices.
WTO members scheduled commitments on enhanced telecommunication services in their initial GATS1
schedules, adopted in April 1994. Service is one component of a more aggregated CPC item.2
Source: Compiled by USITC staff from WTO, GATS, Poland: Schedule of Specific Commitments(GATS/SC/71), Apr. 1994.

WTO, GATS, Singapore: Schedule of Specific Commitments, supp. 2110
(GATS/SC/76/Suppl.2), Apr. 1997. USITC staff have attempted to identify rollback, standstill, and regressive111
commitments by comparing the commitments inscribed in Singapore’s supplementarytelecommunication schedule with questionnaire responses provided by Singapore in 1995. The Negotiating Group on Basic Telecommunications (NGBT) circulated a questionnaireupon the commencement of extended negotiations to gather and share information regardingconditions and regulatory practices in each basic telecommunication market.
4-84
Singapore
Singapore’s commitments apply to voice, circuit- and packet-switched data, facsimile,and private leased circuit services, as well as cellular, mobile data, trunked radio, andpaging services (table 4-38). Singapore permits foreign firms to provide domestic110
and international services through wireline, cellular, and satellite networks. Singaporealso allows foreign firms to acquire majority interest in telecommunication carriersand facilities, although there may initially be few facilities-based carriers due tolicensing restrictions. Foreign firms may also provide resale services, although theymay not provide them over the public network. Singapore adopted the GBT referencepaper on procompetitive regulatory principles in its entirety.
Foreign Investment
Singapore scheduled a number of rollback commitments regarding foreign111
investment, although the value of these commitments is adversely affected by thecontinuation of licensing restrictions until April 2000. Foreign investors may acquirea 49-percent direct stake and an additional 24.99-percent indirect stake in facilities-based carriers, including dominant carrier SingTel, for a cumulative total of73.99 percent ownership. This represents a rollback from the 40-percent limit ondirect investment that was in effect prior to negotiations. Foreign investors may alsocumulatively acquire 73.99 percent of firms providing cellular voice, mobile data,trunked radio, and paging services, reflecting a rollback from the 49-percent limitationthat pertained to these services prior to negotiations. Finally, foreign investors mayestablish 100 percent ownership of resale service providers, reflecting another rollbackfrom the preexisting 49-percent foreign ownership limitation regarding resale services.
Market Access
Singapore scheduled a significant rollback commitment to license two additionalcarriers that will commence services in April 2000, terminating SingTel’s monopolyseven years ahead of Singapore’s previous schedule. These firms would be able toprovide domestic and international voice, packet- and circuit-switched datatransmission, facsimile, and leased circuit services. Singapore also scheduled arollback commitment that permits foreign firms to provide a variety of mobile servicesin 1998, although additional licenses to provide cellular voice services will not be

4-85
Tab
le 4
-38
Hig
hlig
hts
of
Sin
gap
ore
’s c
om
mit
men
ts o
n b
asic
tel
eco
mm
un
icat
ion
ser
vice
s
Co
vera
ge
of
Co
mm
itm
ents
Fo
reig
n In
vest
men
tM
arke
t A
cces
sR
egu
lato
ry P
rin
cip
les
Exe
mp
tio
ns
1A
rtic
le II
MF
N
2.C
.T
elec
omm
unic
atio
n S
ervi
ce (
faci
litie
s-Li
mite
d to
73.
99%
fore
ign
Tw
o ad
ditio
nal o
pera
tors
will
A
dopt
s th
e re
fere
nce
N
one
–ba
sed)
owne
rshi
p, b
ased
on
49%
be li
cens
ed in
199
8 fo
r th
e
pape
r on
reg
ulat
ory
S
inga
pore
a.vo
ice
CP
C 7
521
dire
ct in
vest
men
t and
prov
isio
n of
ser
vice
s on
pr
inci
ples
sche
dule
d2
b.pa
cket
-sw
itche
d da
taC
PC
752
324
.99%
indi
rect
inve
stm
ent.
A
pril
1, 2
000.
A
n
MF
N-b
ased
2
c.ci
rcui
t-sw
itche
d da
taC
PC
752
3un
spec
ified
num
ber
of
C
Com
petit
ive
com
mitm
ents
,2
f.fa
csim
ileC
PC
752
1/29
addi
tiona
l lic
ense
s w
ill b
e
safe
guar
dsac
cord
ing
all
2
g.pr
ivat
e le
ased
circ
uits
CP
C 7
522/
23gr
ante
d fo
r pr
ovis
ion
of
CIn
terc
onne
ctio
nW
TO
mem
bers
2
serv
ices
ther
eafte
r.C
Uni
vers
al s
ervi
ceac
cess
to it
sC
Lice
nsin
g cr
iteria
mar
kets
on
the
CIn
depe
nden
t reg
ulat
orsa
me
term
sC
Sca
rce
reso
urce
and
cond
ition
s.al
loca
tion
2.C
.T
elec
omm
unic
atio
n S
ervi
ceA
llow
s 10
0% fo
reig
nA
llow
s fr
om J
an. 1
, 199
8.(r
esal
e)ow
ners
hip.
a.vo
ice
CP
C 7
521
Res
elle
rs o
f voi
ce, p
acke
t-2
b.pa
cket
-sw
itche
d da
taC
PC
752
3an
d ci
rcui
t-sw
itche
d da
ta,
2
c.ci
rcui
t-sw
itche
d da
taC
PC
752
3fa
csim
ile, a
nd le
ased
circ
uit
2
f.fa
csim
ileC
PC
752
1/29
serv
ices
may
ope
rate
onl
y2
g.pr
ivat
e le
ased
circ
uits
CP
C 7
522/
23w
ithin
clo
sed
user
gro
ups
2
o.ot
her
and
priv
ate
netw
orks
.C
publ
ic r
adio
pag
ing
Cpu
blic
cel
lula
r m
obile
tele
phon
e
See
foot
note
s at
end
of t
able
.

4-86
Tab
le 4
-38—
Co
nti
nu
edH
igh
ligh
ts o
f S
ing
apo
re’s
co
mm
itm
ents
on
bas
ic t
elec
om
mu
nic
atio
n s
ervi
ces
Co
vera
ge
of
Co
mm
itm
ents
Fo
reig
n In
vest
men
tM
arke
t A
cces
sR
egu
lato
ry P
rin
cip
les
Exe
mp
tio
ns
1A
rtic
le II
MF
N
2.C
. M
obile
Ser
vice
so.
othe
r
CCpu
blic
mob
ile d
ata
CC
publ
ic tr
unke
d ra
dio
CC
publ
ic r
adio
pag
ing
CC
publ
ic c
ellu
lar
mob
ile te
leph
one
Ope
n co
mpe
titio
n fo
r pu
blic
Allo
ws
publ
ic m
obile
dat
asw
itche
d, le
ased
circ
uit,
and
trun
ked
radi
o, a
nd p
agin
g in
publ
ic r
adio
pag
ing
from
1998
.19
98.
A
llow
s pu
blic
cel
lula
r m
obile
An
unsp
ecifi
ed n
umbe
r of
from
Apr
il 1,
200
0.ad
ditio
nal
publ
ic c
ellu
lar
voic
e lic
ense
s w
ill b
egr
ante
d fr
om A
pril
1, 2
000.
Allo
ws
73.9
9% fo
reig
now
ners
hip,
bas
ed o
n 49
%di
rect
inve
stm
ent a
nd24
.99%
indi
rect
inve
stm
ent.
WT
O m
embe
rs w
ere
aske
d to
sch
edul
e co
mm
itmen
ts o
n ba
sic
tele
com
mun
icat
ion
serv
ices
foun
d in
the
GA
TT
Sec
reta
riat’s
Ser
vice
s S
ecto
ral
1
Cla
ssifi
catio
n Li
st.
Thi
s lis
t def
ined
eac
h se
rvic
e us
ing
the
Uni
ted
Nat
ions
’ Pro
visi
onal
Cen
tral
Pro
duct
Cla
ssifi
catio
n (C
PC
) C
ode,
foun
d to
the
right
of t
hesc
hedu
led
serv
ices
whe
re a
pplic
able
. W
TO
mem
bers
cou
ld s
ched
ule
com
mitm
ents
on
“oth
er”
tele
com
mun
icat
ion
serv
ices
at t
heir
disc
retio
n.
S
ervi
ce is
one
com
pone
nt o
f a m
ore
aggr
egat
ed C
PC
item
.2
Sou
rce:
Com
pile
d by
US
ITC
sta
ff fr
om W
TO
, GA
TS
, Sin
gapo
re: S
ched
ule
of S
peci
fic C
omm
itmen
ts, s
upp.
2 (
GA
TS
/SC
/76/
Sup
pl.2
), A
pr. 1
997.

4-87
granted until April 2000. Singapore’s commitment regarding resale services alsoqualifies as a rollback commitment. Beginning January 1998, Singapore allowsforeign resalers to provide voice, packet- and circuit-switched data transmission, andfacsimile services over local and international closed user group and private networks,and to provide cellular voice and paging services over the public network. The resaleof leased lines, while permitted, is limited by the condition that such lines may not beconnected to the public network. Prior to WTO negotiations, Singapore prohibitedresale services except in isolated cases over private networks, and reportedly did notenvision licensing resale services on a broader scale until April 2002.
Regulatory Principles
By adopting the GBT reference paper in its entirety, Singapore agreed to employregulations that will protect new operators from anticompetitive behavior by itsincumbent telecommunications carrier, SingTel, from 1998 onward. While prior tonegotiations the Telecommunication Authority of Singapore (TAS) prohibited SingTelfrom cross-subsidizing and applying discriminatory interconnection terms andconditions, TAS was not required to do so in the future in the absence of this GBTcommitment. Singapore’s commitment in this area therefore establishes greaterregulatory transparency and certainty for firms wishing to enter Singapore’stelecommunications market now and in the future. Singapore’s commitment onprocompetitive regulatory principles safeguards the benefits of new commitments onbasic telecommunications, as well as those on enhanced telecommunication services,finalized in April 1994 (table 4-39).
Table 4-39Highlights of Singapore’s commitments on enhanced telecommunication services
Coverage of Commitments Foreign Investment Market Access1
2.C. Telecommunication Services Allows 100% foreign Provision of services ish. electronic mail CPC 7523 ownership. subject to license from the2
i. voice mail CPC 7523 Telecommunications Authority2
j. on-line information of Singapore (TAS).and data retrieval CPC 75232
k. electronic data Foreign companies areinterchange CPC 7523 required to either set up a2
n. on-line information local branch of their companyand/or data processing registered with the Registry of(including transaction Companies and Businesses inprocessing) CPC 843 Singapore or grant a power of
attorney to a local agent forthe provision of VANservices.
May not carry traffic whichresembles any of the basictelecommunications services.
WTO members scheduled commitments on enhanced telecommunication services in their initial GATS1
schedules, adopted in April 1994. Service is one component of a more aggregated CPC item.2
Source: Compiled by USITC staff from WTO, GATS, Singapore: Schedule of Specific Commitments(GATS/SC/76), Apr. 1994.

WTO, GATS, South Africa: Schedule of Specific Commitments, supp. 2112
(GATS/SC/78/Suppl.2), Apr. 1997. USITC staff have attempted to identify rollback, standstill, and regressive113
commitments by comparing the commitments inscribed in South Africa’s supplementarytelecommunication schedule with questionnaire responses provided by South Africa in 1995. The Negotiating Group on Basic Telecommunications (NGBT) circulated a questionnaireupon the commencement of extended negotiations to gather and share information regardingconditions and regulatory practices in each basic telecommunications market.
4-88
South Africa
South Africa’s commitments address the following basic telecommunication services:voice, packet- and circuit-switched data transmission, telex, facsimile, and privateleased circuit services (table 4-40). Additionally, South Africa listed commitments112
for paging, personal radio communication, trunked radio, cellular (including mobiledata), and satellite-based services. South Africa makes no commitment to telegraphservices. Further, South Africa’s commitment on voice services does not apply tovalue-added networks. At present, South Africa reserves the provision of nearly allbasic telecommunication services, and access to all telecommunication facilities, to thestate-owned monopoly Telkom S.A. Ltd. However, on January 1, 2004, the countrywill allow foreign access to the local, long-distance, and international service markets,through all means of network technology. Foreign investors are limited to a minoritystake in South African carriers, and South Africa will continue to prohibit foreignprovision of resale services until at least year 2000. South Africa adopted most of theGBT reference paper on procompetitive regulatory principles.
Foreign Investment
South Africa currently allows aggregate foreign investment of 30 percent in Telkom,and will permit 30 percent foreign investment in a second provider when one isestablished. A second carrier will be established no later than December 31, 2003.The 30-percent foreign investment cap also applies to all other telecommunicationservices listed in the South African schedule. Prior to entering into WTO negotiationson basic telecommunications, South Africa did not permit foreign investment inTelkom. Thus, South Africa’s foreign investment commitment on facilities-basedproviders represents a rollback commitment. South Africa scheduled another113
rollback commitment that will permit foreign investment in resellers, although itdeclined to specify the terms and conditions of such investment. The resale marketwill be liberalized between years 2000 and 2003. However, with regard to cellular,paging, personal radio communication, and trunked radio services, it appears thatSouth Africa scheduled a regressive commitment, as current foreign investment incertain mobile carriers already exceeds the 30-percent limit. Vodafone (U.K.)currently holds a 32-percent stake in Vodacom Ltd., and Cable & Wireless (U.K.) andSBC (U.S.) hold a combined stake of 40.5 percent in Mobile Telephone NetworksLtd. (MTN).

4-89
Tab
le 4
-40
Hig
hlig
hts
of
So
uth
Afr
ica’
s co
mm
itm
ents
in b
asic
tel
eco
mm
un
icat
ion
ser
vice
s
Co
vera
ge
of
Co
mm
itm
ents
Fo
reig
n In
vest
men
tM
arke
t A
cces
sR
egu
lato
ry P
rin
cip
les
Exe
mp
tio
ns
1A
rtic
le II
MF
N
2.C
.Tel
ecom
mun
icat
ion
serv
ices
Lim
ited
to 3
0% fo
reig
nS
ervi
ces
rese
rved
to T
elko
mW
ith th
e ex
cept
ion
ofN
one
– S
outh
Afr
ica
a.vo
ice
CP
C 7
521
owne
rshi
p in
Tel
kom
inm
onop
oly
in 1
998.
One
not c
omm
ittin
g to
mak
esc
hedu
led
MF
N-b
ased
b.pa
cket
-sw
itche
d da
taC
PC
752
319
98, a
nd 3
0% fo
reig
nad
ditio
nal p
rovi
der
will
be
publ
ic th
e pe
riod
of ti
me
com
mitm
ents
,2
c.ci
rcui
t-sw
itche
d da
ta
CP
C 7
523
owne
rshi
p in
a s
econ
dal
low
ed b
y 20
04.
norm
ally
req
uire
d to
acco
rdin
g al
l WT
O2
d.te
lex
CP
C 7
523
oper
ator
in 2
004.
reac
h a
licen
sing
mem
bers
acc
ess
to it
s2
f.fa
csim
ileC
PC
752
1/29
Cro
ss-b
orde
r su
pply
of
deci
sion
, Sou
th A
fric
am
arke
t on
the
sam
e2
g.pr
ivat
e le
ased
circ
uit
CP
C 7
522/
23se
rvic
es is
allo
wed
onl
yad
opte
d th
e re
fere
nce
term
s an
d co
nditi
ons.
2
o.ot
her
No
CP
Cth
roug
h ne
twor
k of
Tel
kom
pape
r on
pro
-C
sate
llite
-bas
edm
onop
oly,
or
subs
eque
ntco
mpe
titiv
e re
gula
tory
du
opol
y.pr
inci
ples
.
Will
allo
w r
esal
e se
rvic
esC
Com
petit
ive
betw
een
2000
and
200
3.sa
fegu
ards
CIn
terc
onne
ctio
nC
Uni
vers
al s
ervi
ceC
Lice
nsin
g cr
iteria
CIn
depe
nden
tre
gula
tor
CS
carc
e re
sour
ceal
loca
tion
o.ot
her
No
CP
CLi
mite
d to
30%
fore
ign
Cro
ss-b
orde
r su
pply
of
•pa
ging
•pe
rson
al r
adio
com
mun
icat
ion
•tr
unke
d ra
dio
owne
rshi
p in
199
8.se
rvic
es is
allo
wed
onl
yth
roug
h ne
twor
k of
Tel
kom
mon
opol
y, o
r su
bseq
uent
duop
oly.
o.ot
her
No
CP
CLi
mite
d to
30%
fore
ign
Ser
vice
s ar
e re
serv
ed fo
r
•m
obile
cel
lula
r,
incl
udin
g m
obile
dat
aow
ners
hip
in tw
o ex
istin
gV
odac
om a
nd M
TN
in 1
998,
oper
ator
s in
199
8, a
nd in
aan
d a
third
ope
rato
r in
200
0.th
ird o
pera
tor
in 2
000.
Cro
ss-b
orde
r su
pply
of
serv
ices
is a
llow
ed o
nly
thro
ugh
netw
ork
of T
elko
mm
onop
oly,
or
subs
eque
ntdu
opol
y.
WT
O m
embe
rs w
ere
aske
d to
sch
edul
e co
mm
itmen
ts o
n ba
sic
tele
com
mun
icat
ion
serv
ices
foun
d in
the
GA
TT
Sec
reta
riat’s
Ser
vice
s S
ecto
ral C
lass
ifica
tion
1
List
. T
his
list d
efin
ed e
ach
serv
ice
usin
g th
e U
nite
d N
atio
ns’ P
rovi
sion
al C
entr
al P
rodu
ct C
lass
ifica
tion
(CP
C)
Cod
e, fo
und
to th
e rig
ht o
f the
sch
edul
ed s
ervi
ces
whe
re a
pplic
able
. W
TO
mem
bers
cou
ld s
ched
ule
com
mitm
ents
on
“oth
er”
tele
com
mun
icat
ion
serv
ices
at t
heir
disc
retio
n.
S
ervi
ce is
one
com
pone
nt o
f a m
ore
aggr
egat
ed C
PC
item
.2
Sou
rce:
Com
pile
d by
US
ITC
sta
ff fr
om W
TO
, GA
TS
, Sou
th A
fric
a: S
ched
ule
of S
peci
fic C
omm
itmen
ts, s
upp.
2 (
GA
TS
/SC
/78/
Sup
pl.2
), A
pr. 1
997.

4-90
Market Access
South Africa reserves the provision of voice, packet- and circuit-switched datatransmission, telex, facsimile, private leased circuit, and satellite services to theTelkom monopoly, or a subsequent duopoly operator. According to its commitments,South Africa will replace Telkom’s monopoly with a duopoly no later than yearend2003 and will also consider whether it is feasible to allow other facilities-basedproviders in addition to the duopoly by that time. Further, South Africa commits toexamine the feasibility of authorizing additional suppliers of satellite services in 2004.Mobile cellular services currently may be supplied by the existing duopoly only(Vodacom and MTN); however, South Africa will examine the feasibility of additionalcellular suppliers by the end of 1998, and it will grant one additional cellular licenseduring the next 2 years. With regard to paging, personal radio communication, andtrunked radio services, South Africa lists no limitations on establishing a minorityposition in a commercial presence. However, in the case of cross-border supply,foreign firms may provide services only through Telkom’s networks or those of thesubsequent duopoly.
South Africa has scheduled commitments that obligate it to move by 2004 from amonopolistic to a duopolistic market for the provision of all basic telecommunicationservices, except telegraph services. With respect to cellular services, South Africa hasscheduled a commitment to permit the market entry of one additional provider,bringing the number of cellular service providers to three. These commitments maybe characterized as modest rollback commitments. South Africa’s commitment toliberalize resale services between 2000 and 2003 is also a rollback commitment, asSouth Africa did not permit resale previously. South Africa appears to have scheduleda standstill commitment with respect to paging, personal radio communication, andtrunked radio system services.
Regulatory Principles
South Africa adopted the GBT reference paper on procompetitive regulatoryprinciples, with the exception that it did not undertake an obligation to make publicthe period of time normally required to reach a licensing decision. South Africa’scommitment to the principles outlined in the reference paper constitutes a rollbackcommitment. South Africa has already taken steps toward the implementation ofcertain regulatory principles, as exemplified by the Telecommunications Act of 1996and the creation of an independent regulatory authority for the telecommunicationindustry, the South African Telecommunications Regulatory Authority (SATRA).South Africa’s commitments to procompetitive regulatory principles should provevaluable to foreign entrants as the country gradually liberalizes its telecommunicationservices market.
With regard to enhanced telecommunication services (table 4-41), South Africa’scommitment to observe procompetitive regulatory principles is also significant. UnderSouth Africa’s initial commitments, telecommunication carriers could only provideenhanced telecommunication services with the consent and collaboration of Telkom.Now the independent regulator, SATRA, has assumed authority to license providersof enhanced telecommunications. Such services may only be provided through

South African Government, Telecommunications Act, 1996, Nov. 15, 1997, ch. 5, sec.114
40, para. 2.
4-91
Telkom’s network and facilities, but South Africa’s commitments to provide private114
leased circuit services and to observe procompetitive interconnection policies willlikely facilitate the creation of a competitive market for enhanced telecommunicationservices.
Table 4-41Highlights of South Africa’s commitments on enhanced telecommunication services
Coverage of Commitments Foreign Investment Market Access1
2.C. Telecommunication services Unclear. Limitations on bypass of Southh. electronic mail CPC 7523 African facilities for routing of2
i. voice mail CPC 7523 domestic and international2
j. on-line information traffic.and data baseretrieval CPC 7523 Applications from international2
k. electronic data VANS providers are dealt withinterchange CPC 7523 on an ad hoc basis.2
l. enhanced/value-added facsimileservices, includingstore and forward,store and retrieve CPC 75232
m. code and protocolconversion No CPC
n. on-line informationand/or data- processing (including transactionprocessing) CPC 8432
WTO members scheduled commitments on enhanced telecommunication services in their initial GATS1
schedules, adopted April 1994. Service is one component of a more aggregated CPC item.2
Source: Compiled by USITC staff from WTO, GATS, South Africa: Schedule of Specific Commitments(GATS/SC/78), Apr. 1994.

WTO, GATS, Switzerland: Schedule of Specific Commitments, supp. 2115
(GATS/SC/83/Suppl.2), Apr. 1997. USITC staff have attempted to identify rollback, standstill, and regressive116
commitments by comparing the commitments inscribed in Switzerland’s supplementarytelecommunication schedule with questionnaire responses provided by Switzerland in 1994. The Negotiating Group on Basic Telecommunications (NGBT) circulated a questionnaireupon the commencement of extended negotiations to gather and share information regardingconditions and regulatory practices in each basic telecommunications market.
4-92
Switzerland
Anticipating enactment of the Federal Law on Telecommunications in January 1998,the Swiss Government submitted a revised and substantially improved basictelecommunications schedule to the WTO on September 19, 1997. The followingdiscussion examines the revised schedule, which entered into force along with otherGBT schedules on February 5, 1998. In this schedule, Switzerland inscribedcommitments on all basic telecommunication services (table 4-42). The schedule115
provides foreign carriers with access to local, long-distance, and international servicemarkets through wireline, cellular, and satellite networks, on both a facilities andresale basis. The schedule also ensures that foreign carriers can acquire or establishsignificant stakes in Swiss carriers and other firms operating in the Swiss market, andobligates Switzerland to follow the procompetitive regulatory principles found in theGBT reference paper.
Foreign Investment
Switzerland permits 100 percent foreign ownership of all carriers in the Swiss market,irrespective of the services they provide. Switzerland’s relaxation of the investmentlimitation pertaining to its dominant carrier, Swisscom, appears to represent asignificant rollback. In addition, Switzerland’s provision for 100 percent foreign116
ownership of carriers that may compete with Swisscom to provide voice servicesappears to constitute a rollback commitment. Swiss provisions for 100 percentinvestment in firms providing basic services other than voice telephony register asstandstill commitments; these rights existed prior to WTO negotiations.
Market Access
With respect to market access, Switzerland again inscribes significant rollbackcommitments. Switzerland’s commitments allow foreign carriers to provide all basicservices on either a facilities or resale basis. Prior to WTO negotiations, carriersother than Swisscom, whether foreign or domestic, could only provide basic serviceson a resale basis. Such carriers had to obtain leased circuits from Swisscom.

4-93
Tab
le 4
-42
Hig
hlig
hts
of
Sw
itze
rlan
d’s
co
mm
itm
ents
on
bas
ic t
elec
om
mu
nic
atio
n s
ervi
ces
Co
vera
ge
of
Co
mm
itm
ents
Fo
reig
n In
vest
men
tM
arke
t A
cces
sP
rin
cip
les
Exe
mp
tio
ns
1R
egu
lato
ryA
rtic
le II
MF
N
2.C
.Tel
ecom
mun
icat
ion
serv
ices
Allo
ws
100%
fore
ign
Allo
ws
in 1
998.
Ado
pted
ref
eren
ce p
aper
Non
e –
Sw
itzer
land
a.vo
ice
serv
ices
CP
C 7
521
owne
rshi
p in
all
carr
iers
inon
reg
ulat
ory
prin
cipl
essc
hedu
led
MF
N-b
ased
2
b.pa
cket
-sw
itche
d C
PC
752
319
98.
in e
ntire
ty.
com
mitm
ents
,2
c.ci
rcui
t-sw
itche
d C
PC
752
3ac
cord
ing
all W
TO
2
d.te
lex
CP
C 7
523
CC
ompe
titiv
em
embe
rs a
cces
s to
its
2
e.te
legr
aph
CP
C 7
522
safe
guar
dsm
arke
t on
the
sam
e2
f.fa
csim
ileC
PC
752
1/23
CIn
terc
onne
ctio
nte
rms
and
cond
ition
s2
g.
priv
ate
leas
edC
Uni
vers
al s
ervi
ceci
rcui
tC
PC
752
2/23
CLi
cens
ing
crite
ria2
CIn
depe
nden
t reg
ulat
orC
Sca
rce
reso
urce
allo
catio
n
WT
O m
embe
rs w
ere
aske
d to
sch
edul
e co
mm
itmen
ts o
n ba
sic
tele
com
mun
icat
ion
serv
ices
foun
d in
the
GA
TT
Sec
reta
riat’s
Ser
vice
s S
ecto
ral
Cla
ssifi
catio
n1
List
. T
his
list d
efin
ed e
ach
serv
ice
usin
g th
e U
nite
d N
atio
ns’ P
rovi
sion
al C
entr
al P
rodu
ct C
lass
ifica
tion
(CP
C)
Cod
e, fo
und
to th
e rig
ht o
f the
sch
edul
ed s
ervi
ces
whe
re a
pplic
able
. W
TO
mem
bers
cou
ld s
ched
ule
com
mitm
ents
on
“oth
er”
tele
com
mun
icat
ion
serv
ices
at t
heir
disc
retio
n.
S
ervi
ce is
one
com
pone
nt o
f a m
ore
aggr
egat
ed C
PC
item
.2
Sou
rce:
Com
pile
d by
US
ITC
sta
ff fr
om W
TO
, GA
TS
, Sw
itzer
land
: Sch
edul
e of
Spe
cific
Com
mitm
ents
, sup
p. 2
(G
AT
S/S
C/8
3/S
uppl
.2),
Apr
. 199
7.
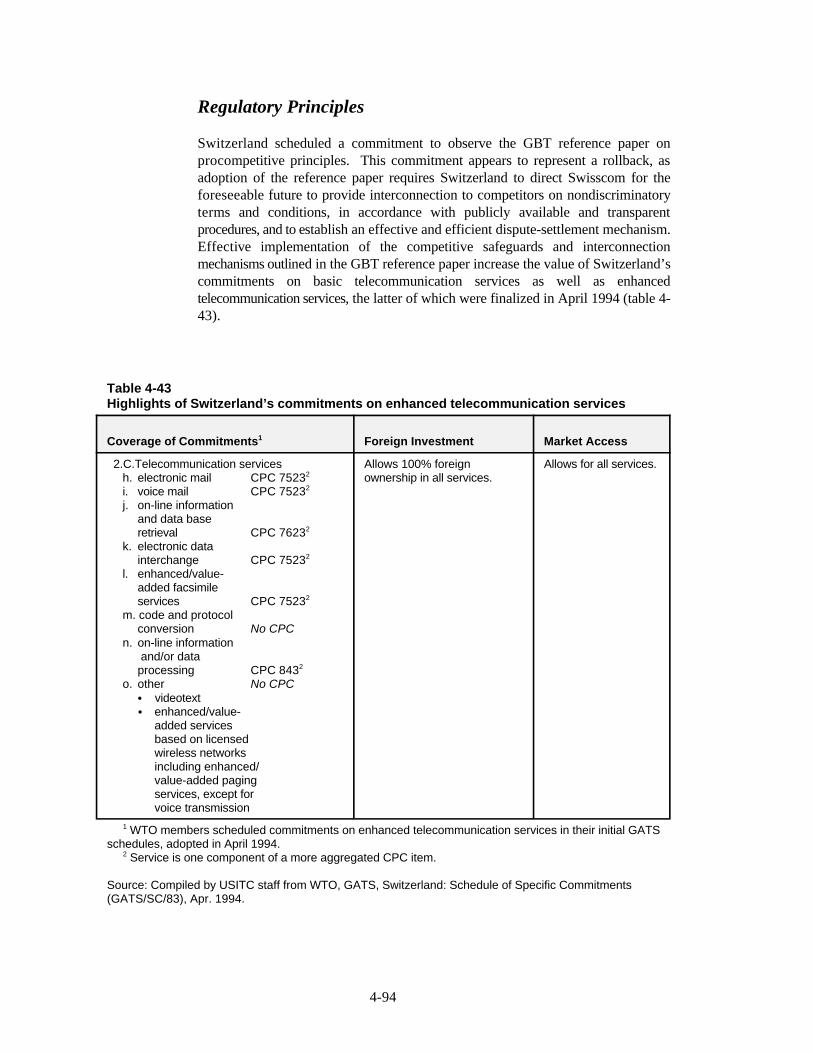
4-94
Regulatory Principles
Switzerland scheduled a commitment to observe the GBT reference paper onprocompetitive principles. This commitment appears to represent a rollback, asadoption of the reference paper requires Switzerland to direct Swisscom for theforeseeable future to provide interconnection to competitors on nondiscriminatoryterms and conditions, in accordance with publicly available and transparentprocedures, and to establish an effective and efficient dispute-settlement mechanism.Effective implementation of the competitive safeguards and interconnectionmechanisms outlined in the GBT reference paper increase the value of Switzerland’scommitments on basic telecommunication services as well as enhancedtelecommunication services, the latter of which were finalized in April 1994 (table 4-43).
Table 4-43Highlights of Switzerland’s commitments on enhanced telecommunication services
Coverage of Commitments Foreign Investment Market Access1
2.C.Telecommunication services Allows 100% foreign Allows for all services.h. electronic mail CPC 7523 ownership in all services.2
i. voice mail CPC 75232
j. on-line information and data base retrieval CPC 76232
k. electronic data interchange CPC 75232
l. enhanced/value-added facsimileservices CPC 75232
m. code and protocol conversion No CPC
n. on-line information and/or data processing CPC 8432
o. other No CPCC videotextC enhanced/value-
added servicesbased on licensedwireless networksincluding enhanced/value-added pagingservices, except forvoice transmission
WTO members scheduled commitments on enhanced telecommunication services in their initial GATS1
schedules, adopted in April 1994. Service is one component of a more aggregated CPC item.2
Source: Compiled by USITC staff from WTO, GATS, Switzerland: Schedule of Specific Commitments(GATS/SC/83), Apr. 1994.

WTO, GATS, Thailand: Schedule of Specific Commitments, supp. 2117
(GATS/SC/85/Suppl.2), Apr. 1997. Measures are characterized as standstill, rollback, or regressive commitments by118
comparing measures specified in Thailand’s supplementary telecommunication schedulewith questionnaire responses provided by Thailand in 1996. The NGBT circulatedquestionnaires upon the commencement of negotiations to gauge market conditions andregulatory practices. Thailand, Response to Questionnaire on Basic Telecommunications,Apr. 25, 1996.
4-95
Thailand
Thailand’s commitments address only four basic telecommunication services: voice,telex, telegraph, and facsimile services (table 4-44). Significantly, Thailand’s117
commitments are conditional upon the passage of current draft legislation, namely theTelecom Master Plan. Thailand’s commitments allow foreign firms to provide local,long-distance, and international services on a facilities basis via wireline, cellular, orsatellite networks. Thailand makes no commitment on resale services. Further,foreign equity may not exceed 20 percent, and the number of foreign shareholders maynot exceed 20 percent of the total number of shareholders in any entity. Finally,Thailand did not adopt the GBT reference paper on procompetitive principles.
Foreign Investment
Thailand’s foreign investment commitments are fully contingent upon the enactmentand implementation of pending telecommunication legislation and are scheduled toenter into force in 2006. Thailand’s conditional commitment to limit foreigninvestment and foreign shareholders to 20 percent is consistent with limitations oninvestment that were in place prior to Thailand’s entry to negotiations. Thus,Thailand scheduled a conditional standstill commitment regarding foreign investmentlimitations. Against the backdrop of its commitments on enhanced118
telecommunication services, Thailand’s basic telecommunications commitments seemmodest. During the Uruguay Round, Thailand scheduled commitments that allow 40percent foreign investment in enhanced services (table 4-45). Likewise, Thailand’sinitial GATS commitments limited the number of foreign shareholders in companiesproviding enhanced services to 40 percent of the total number of shareholders.
Market Access
Thailand’s market access commitments, too, are fully contingent on the enactment andimplementation of pending telecommunication legislation and are scheduled to enterinto force in 2006. Thailand stipulates several general conditions that presentsignificant limitations on market access. Most significantly, Thailand allows foreignprovision of basic telecommunication services on a facilities basis only, prohibiting

4-96
Tab
le 4
-44
Hig
hlig
hts
of
Th
aila
nd
’s c
om
mit
men
ts o
n b
asic
tel
eco
mm
un
icat
ion
ser
vice
s
Co
vera
ge
of
Co
mm
itm
ents
Fo
reig
n In
vest
men
tM
arke
t A
cces
sP
rin
cip
les
Exe
mp
tio
ns
1R
egu
lato
ry
Art
icle
II M
FN
2.C
.T
elec
omm
unic
atio
n se
rvic
esC
ondi
tiona
l upo
n th
eC
ondi
tiona
l upo
n th
eC
ondi
tiona
l upo
n th
eN
one
– T
haila
nda.
voic
e C
PC
752
1sc
hedu
led
MF
N-b
ased
d.te
lex
CP
C 7
523
com
mitm
ents
,3
e.te
legr
aph
CP
C 7
522
acco
rdin
g al
l WT
Of.
facs
imile
CP
C 7
521/
29m
embe
rs a
cces
s to
its
3
enac
tmen
t of n
eces
sary
enac
tmen
t of n
eces
sary
enac
tmen
t of
law
.la
w.
nece
ssar
y la
w.
Will
con
ditio
nally
allo
wA
llow
ed o
nly
inT
haila
nd d
id n
ot a
dopt
20%
fore
ign
owne
rshi
p of
colla
bora
tion
with
Tha
ith
e re
fere
nce
pape
r.fa
cilit
ies-
base
d se
rvic
es in
firm
und
er a
BT
O20
06 (
no r
esal
e).
arra
ngem
ent.
Tha
iland
mak
es a
The
num
ber
of fo
reig
nT
haila
nd c
ondi
tiona
llybi
nd it
s ve
rsio
n of
shar
ehol
ders
may
not
com
mits
to in
trod
uce
full
regu
lato
ry p
rinci
ples
inex
ceed
20%
of t
he to
tal
mar
ket a
cces
s an
d20
06.
num
ber
of s
hare
hold
ers.
natio
nal t
reat
men
t in
Mus
t be
a T
hai r
egis
tere
dco
mpa
ny.
CA
T h
as e
xclu
sive
rig
hts
2006
.
to In
tels
at a
nd In
mar
sat.
cond
ition
al o
ffer
to
2
mar
ket o
n th
e sa
me
term
s an
d co
nditi
ons.
WT
O m
embe
rs w
ere
aske
d to
sch
edul
e co
mm
itmen
ts o
n ba
sic
tele
com
mun
icat
ion
serv
ices
foun
d in
the
GA
TT
Sec
reta
riat’s
Ser
vice
s S
ecto
ral
1
Cla
ssifi
catio
n Li
st.
Thi
s lis
t def
ined
eac
h se
rvic
e us
ing
the
Uni
ted
Nat
ions
’ Pro
visi
onal
Cen
tral
Pro
duct
Cla
ssifi
catio
n (C
PC
) C
ode,
foun
d to
the
right
of t
hesc
hedu
led
serv
ices
whe
re a
pplic
able
. W
TO
mem
bers
cou
ld s
ched
ule
com
mitm
ents
on
“oth
er”
tele
com
mun
icat
ion
serv
ices
at t
heir
disc
retio
n.
P
revi
ousl
y un
der
the
GA
TS
, Tha
iland
took
an
MF
N e
xem
ptio
n fo
r se
rvic
e se
ctor
s “s
tipul
ated
in th
e re
leva
nt a
rtic
les
of th
e T
reat
y of
Am
ity a
nd2
Eco
nom
ic R
elat
ions
.” T
his
exem
ptio
n ap
plie
s to
the
Uni
ted
Sta
tes.
Und
er th
e te
rms
of th
e tr
eaty
, Tha
iland
may
“pr
ohib
it al
iens
from
est
ablis
hing
or
acqu
iring
inte
rest
s, o
r [m
ay] l
imit
the
exte
nt to
whi
ch a
liens
may
est
ablis
h or
acq
uire
inte
rest
s, in
ent
erpr
ises
eng
aged
with
in it
s te
rrito
ries
inco
mm
unic
atio
ns. .
. .”
U.S
. Dep
artm
ent o
f Sta
te, “
Tre
aty
of A
mity
and
Eco
nom
ic R
elat
ions
Bet
wee
n th
e U
nite
d S
tate
s of
Am
eric
a an
d th
e K
ingd
om o
fT
haila
nd,”
May
29,
196
6, T
AIS
No.
654
0, U
nite
d S
tate
s T
reat
ies
and
Oth
er In
tern
atio
nal A
gree
men
ts, v
ol. 1
9, p
t. 5.
Ser
vice
is o
ne c
ompo
nent
of a
mor
e ag
greg
ated
CP
C it
em.
3
Sou
rce:
Com
pile
d by
US
ITC
sta
ff fr
om W
TO
, GA
TS
, Tha
iland
: Sch
edul
e of
Spe
cific
Com
mitm
ents
, sup
p. 2
(G
AT
S/S
C/8
5/S
uppl
.2),
Apr
. 199
7..

Ibid., and APEC Telecommunications Working Group, Telecommunications119
Infrastructure and Regulatory Environment, 1994, p. 150. Prospective suppliers of global mobile satellite communications, such as Iridium Inc.120
and ICO Global Communications, have signed up the firms Thai SatelliteTelecommunications Co. (TSC) and South East Asia Inridium Co. as investors in theirglobal satellite projects. State-owned enterprises TOT and/or CAT grant these Thai firmsthe right to provide the services in exchange for a stake in the venture. TOT holds 13percent in TSC and 11 percent in South East Asia Iridium, whereas, CAT holds 10 percentin TSC and 25 percent in South East Asia Iridium. Suphaphan Plengmaneepun, “Satelliteproject to break even in 2 yrs: Iridium to start up in September, 1998,” Bangkok Post, July 8, 1997, found at Internet address http://www.bangkokpost.net/, retrieved July 9, 1997; andindustry representative, telephone interview by USITC staff, June 26, 1997.
4-974-97
Table 4-45Highlights of Thailand’s commitments on enhanced telecommunication services
Coverage of Commitments Foreign Investment Market Access1
2.C. Telecommunication services Must be a BTO arrangement Permitted inj. on-line information and data with a Thai registered collaboration with Thai
base retrieval CPC 7523 company. firm under the BTOn. on-line information and/or scheme, and must use
data processing services CPC 843 Limited to 40% foreign public2
o. other No CPC ownership. telecommunicationC videotexC teleconferenceC domestic leased circuits
network under nationalThe number of foreign telecommunicationshareholders may not exceed authorities. 40% of the total number ofshareholders.
o. other No CPC Must be a Thai registered Allowed for the provisionC equipment sales servicesC consulting services
company. of sales and consulting
Limited to 49% foreign commercial presenceownership. basis.
The number of foreign Cross-border supply ofshareholders must be less sales and consultingthan one-half of the total services remainnumber of shareholders. unbound.
services on a
WTO members scheduled commitments on enhanced telecommunication services in their initial GATS1
schedules, adopted in April 1994. Service is one component of a more aggregated CPC item.2
Source: Compiled by USITC staff from WTO, GATS, Thailand: Schedule of Specific Commitments(GATS/SC/85), Apr. 1994.
resale of network capacity. With regard to licensing requirements, service providers119
must maintain management personnel and a “head office” in Thai territory. Further,service providers must obtain a government license for each service they wish toprovide, and the number of licences available may be limited. Two state-owned120
enterprises continue to control telecommunication services in Thailand. Telephone

4-98
Organization of Thailand (TOT) provides and regulates service domestically andbetween Thailand and bordering countries. The Communications Authority ofThailand (CAT) is primarily responsible for international telecommunication servicesnot covered by TOT. Thailand’s commitments on market access for facilities-based,resale, local, long-distance, and international services are therefore best characterizedas standstill commitments.
Regulatory Principles
Thailand did not adopt the GBT reference paper. Thailand has, however, made aconditional regulatory commitment, pending the enactment of Thailand’stelecommunication legislation. Thailand conditionally commits to bind its own set ofregulatory principles in the future. These principles, like those in the GBT referencepaper, would pertain to competitive safeguards, interconnection, universal service,public availability of licensing criteria, independent regulation, and the allocation ofscarce resources. Nonetheless, Thailand essentially scheduled a standstill commitmentwith respect to regulatory practices, as its regulatory framework remains as it did priorto negotiations. The absence of commitments on regulatory principles leaves Thairegulators with broad discretionary powers, which may adversely affect the value ofThailand’s commitments on both basic and value-added telecommunication services.