Recent progress on JET towards the ITER reference mode of operation at high density
20
INSTITUTE OF PHYSICS PUBLISHING PLASMA PHYSICS AND CONTROLLED FUSION Plasma Phys. Control. Fusion 43 (2001) A11–A30 PII: S0741-3335(01)30055-6 Recent progress on JET towards the ITER reference mode of operation at high density J Ongena 1, 17 , W Suttrop 2 , M B´ ecoulet 3 , G Cordey 4 , P Dumortier 1 , Th Eich 5 , L C Ingesson 6 , S Jachmich 1 , P Lang 5 , A Loarte 7 , P Lomas 4 , G P Maddison 4 , A Messiaen 1 , M F F Nave 8 , J Rapp 5 , G Saibene 7 , R Sartori 7 , O Sauter 9 , J D Strachan 10 , B Unterberg 5 , M Valovic 4 , B Alper 4 , Ph Andrew 4 , Y Baranov 4 , J Brzozowski 10 , J Bucalossi 3 , M Brix 5 , R Budny 11 , M Charlet 4 , I Coffey 4 , M De Baar 6 , P De Vries 6 , C Gowers 4 , N Hawkes 4 , M von Hellermann 6 , D L Hillis 12 , J Hogan 12 , G L Jackson 13 , E Joffrin 3 , C Jupen 10 , A Kallenbach 2 , H R Koslowski 5 , K D Lawson 4 , M Mantsinen 4 , G Matthews 4 , P Monier-Garbet 3 , D McDonald 4 , F Milani 4 , M Murakami 12,13 , A Murari 14 , R Neu 2 , V Parail 4 , S Podda 14 , M E Puiatti 15 , E Righi 7 , F Sartori 4 , Y Sarazin 3 , A Staebler 2 , M Stamp 4 , G Telesca 15 , M Valisa 15 , B Weyssow 16 , K-D Zastrow 4 and EFDA-JET workprogramme contributors 18 1 LPP/ERM-KMS, Association EURATOM-Belgian State, B-1000 Brussels, Belgium 19 2 Max-Planck Institut f ¨ ur Plasmaphysik, EURATOM Association, D-85748 Garching, Germany 3 CEA Cadarache, F-13108 St Paul lez Durance, France 4 EURATOM/UKAEA Fusion Association, Culham, UK 5 Institut f ¨ ur Plasmaphysik, Forschungszentrum J¨ ulich GmbH, EURATOM Association, D-52425 J¨ ulich, Germany 19 6 FOM-Instituut voor Plasmafysica, EURATOM Association, Postbus 1207, NL-3430 BE Nieuwegein, The Netherlands 19 7 EFDA-Close Support Unit, D-85748 Garching, Germany 8 Centro de Fus˜ ao Nuclear, Association ‘EURATOM-IST’, 1096 Lisbon, Portugal 9 Centre de Recherches en Physique des Plasmas, Ecole Polytechnique de Lausanne, Association ‘EURATOM-Confederation Suisse’, Lausanne, Switzerland 10 Chalmers University of Technology, Association ‘EURATOM-NFR’, G¨ oteborg, Sweden 11 Princeton Plasma Physics Laboratory, Princeton University, NJ 08543, USA 12 Oak Ridge National Laboratory, Oak Ridge, TN 37831, USA 13 DIII-D National Fusion Facility, San Diego, CA 92186-5698, USA 14 Associazione EURATOM-ENEA sulla Fusione, Centro Ricerche Frascati, C.P. 65, 00044-Frascati, Rome, Italy 15 Consorzio RFX - Associazione Euratom-Enea sulla Fusione, Corso Stati Uniti 4, I-35127 Padova, Italy 16 Universit´ e Libre de Bruxelles, Association ‘EURATOM-Belgian State’, Physique Th´ eorique et Math´ ematique, Unit´ e de Physique des Plasmas, 1050 Brussels, Belgium Received 22 June 2001 Published 22 November 2001 Online at stacks.iop.org/PPCF/43/A11 17 Researcher at NFSR Belgium 18 See Appendix in post-deadline paper at the 18th IAEA Fusion Energy Conference, Sorrento, Italy: J Pamela, ‘Overview of recent JET results’, IAEA-CN-77-PD/1 19 Partners in the Trilateral Euregio Cluster (TEC) 0741-3335/01/SA0011+20$30.00 © 2001 IOP Publishing Ltd Printed in the UK A11
Transcript of Recent progress on JET towards the ITER reference mode of operation at high density

INSTITUTE OF PHYSICS PUBLISHING PLASMA PHYSICS AND CONTROLLED FUSION
Plasma Phys. Control. Fusion 43 (2001) A11–A30 PII: S0741-3335(01)30055-6
Recent progress on JET towards the ITERreference mode of operation at high density
J Ongena1,17, W Suttrop2, M Becoulet3, G Cordey4, P Dumortier1,Th Eich5, L C Ingesson6, S Jachmich1, P Lang5, A Loarte7, P Lomas4,G P Maddison4, A Messiaen1, M F F Nave8, J Rapp5, G Saibene7,R Sartori7, O Sauter9, J D Strachan10, B Unterberg5, M Valovic4,B Alper4, Ph Andrew4, Y Baranov4, J Brzozowski10, J Bucalossi3,M Brix5, R Budny11, M Charlet4, I Coffey4, M De Baar6, P De Vries6,C Gowers4, N Hawkes4, M von Hellermann6, D L Hillis12, J Hogan12,G L Jackson13, E Joffrin3, C Jupen10, A Kallenbach2, H R Koslowski5,K D Lawson4, M Mantsinen4, G Matthews4, P Monier-Garbet3,D McDonald4, F Milani4, M Murakami12,13, A Murari14, R Neu2,V Parail4, S Podda14, M E Puiatti15, E Righi7, F Sartori4, Y Sarazin3,A Staebler2, M Stamp4, G Telesca15, M Valisa15, B Weyssow16,K-D Zastrow4 and EFDA-JET workprogramme contributors18
1 LPP/ERM-KMS, Association EURATOM-Belgian State, B-1000 Brussels, Belgium19
2 Max-Planck Institut fur Plasmaphysik, EURATOM Association, D-85748 Garching, Germany3 CEA Cadarache, F-13108 St Paul lez Durance, France4 EURATOM/UKAEA Fusion Association, Culham, UK5 Institut fur Plasmaphysik, Forschungszentrum Julich GmbH, EURATOM Association, D-52425Julich, Germany19
6 FOM-Instituut voor Plasmafysica, EURATOM Association, Postbus 1207, NL-3430 BENieuwegein, The Netherlands19
7 EFDA-Close Support Unit, D-85748 Garching, Germany8 Centro de Fusao Nuclear, Association ‘EURATOM-IST’, 1096 Lisbon, Portugal9 Centre de Recherches en Physique des Plasmas, Ecole Polytechnique de Lausanne, Association‘EURATOM-Confederation Suisse’, Lausanne, Switzerland10 Chalmers University of Technology, Association ‘EURATOM-NFR’, Goteborg, Sweden11 Princeton Plasma Physics Laboratory, Princeton University, NJ 08543, USA12 Oak Ridge National Laboratory, Oak Ridge, TN 37831, USA13 DIII-D National Fusion Facility, San Diego, CA 92186-5698, USA14 Associazione EURATOM-ENEA sulla Fusione, Centro Ricerche Frascati, C.P. 65,00044-Frascati, Rome, Italy15 Consorzio RFX - Associazione Euratom-Enea sulla Fusione, Corso Stati Uniti 4, I-35127Padova, Italy16 Universite Libre de Bruxelles, Association ‘EURATOM-Belgian State’, Physique Theorique etMathematique, Unite de Physique des Plasmas, 1050 Brussels, Belgium
Received 22 June 2001Published 22 November 2001Online at stacks.iop.org/PPCF/43/A11
17 Researcher at NFSR Belgium18 See Appendix in post-deadline paper at the 18th IAEA Fusion Energy Conference, Sorrento, Italy: J Pamela,‘Overview of recent JET results’, IAEA-CN-77-PD/119 Partners in the Trilateral Euregio Cluster (TEC)
0741-3335/01/SA0011+20$30.00 © 2001 IOP Publishing Ltd Printed in the UK A11
A12 J Ongena et al
AbstractRecent progress towards obtaining high density and high confinement in JETas required for the ITER reference scenario atQ = 10 is summarized. Plasmaswith simultaneous confinement H98(y,2) = 1 and densities up to n/nGW ∼ 1are now routinely obtained. This has been possible (i) by using plasmas athigh (δ ∼ 0.5) and medium (δ ∼ 0.3–0.4) triangularity with sufficient heatingpower to maintain Type I ELMs, (ii) with impurity seeded plasmas at high(δ ∼ 0.5) and low (δ � 0.2) triangularity, (iii) with an optimized pellet injectionsequence, maintaining the energy confinement and raising the density, and(iv) by carefully tuning the gas puff rate leading to plasmas with peaked densityprofiles and good confinement at long time scales. These high performancedischarges exhibit Type I ELMs, with a new and more favourable behaviourobserved at high densities, requiring further studies. Techniques for a possiblemitigation of these ELMs are discussed, and first promising results are obtainedwith impurity seeding in discharges at high triangularity. Scaling studies usingthe new data of this year show a strong dependence of confinement on uppertriangularity, density and proximity to the Greenwald limit. Observed MHDinstabilities and methods to avoid these in high density and high confinementplasmas are discussed.
1. Introduction
The ITER reference operational scenario is the ELMy H-mode with a confinement qualityH98(y,2) = 1 and beta value βN = 1.8 at a line-averaged density normalized to the Greenwalddensity [1] n/nGW = 0.85 (with nGW (1020 m−3) = Ip (MA)/(πa2(m2)). Previous experimentsin JET and other tokamaks have shown that it becomes increasingly more difficult to keep goodconfinement properties in the ELMy H-mode at higher densities, usually obtained by gas puff.This year, however, discharges have been obtained at JET with simultaneous high density andhigh confinement using several techniques: (i) by increasing the triangularity of the plasma tohigh values δ ∼ 0.5, (ii) at medium triangularities δ ∼ 0.3–0.4 by increasing the additionalheating power so as to keep Type I ELMs, (iii) by impurity seeding in plasmas with both high andlow triangularity, (iv) by fuelling the plasma with an optimized pellet injection sequence, and(v) by carefully tuning the gas input, leading to density peaking and densities around or abovethe Greenwald factor on long time scales. Using these methods or combinations, confinementand density values have been reached as needed for the Q = 10 ITER reference scenario [2]during quasi-stationary periods of up to 6 s or up to 15 × τE, a duration which was limited bythe designed pulse length capabilities of JET. These long-pulse high performance dischargesexhibit Type I ELMs, and it is another challenge to mitigate the effect of ELMs, in order to avoidexcessive erosion or sputtering of the first wall. Several techniques for ELM mitigation havebeen studied with and without impurity radiation, and first results indicate possible promisingroutes to the realization of an operational scenario for ITER that combines high performancewith an acceptable heat exhaust. A significant influence of triangularity, density peakingand proximity to the Greenwald density on the scaling of the energy confinement is found.This paper summarizes the main results of experiments undertaken this year on JET, aimed atobtaining simultaneous high confinement and high density in view of ITER.

Progress of JET towards the ITER reference mode A13
2. High density and high confinement in highly shaped plasmas
Recent experiments on ASDEX, DIII-D, JET and JT-60 [3–7] have shown the positive influenceof triangularity on confinement. This year, the upper and lower triangularity of the plasma,δU and δL, have been varied independently in JET to study the influence of these parameterson plasma confinement. A large number of different plasma shapes have been tested. Oneof them is the so-called ‘ITER-like’ shape (elongation κ = 1.74 and average triangularityδ = (δU + δL)/2 ∼ 0.45–0.5). The working gas of the discharges is deuterium with a fewper cent (∼2–3%) of hydrogen. In what follows, the ratio Pheat/PL–H of the additional heatingpower to the L–H threshold power will be used as a convenient way to quantify the power levelused, as discussed in [8].
ITER-like plasmas (figure 1) simultaneously realize high density up to n/nGW = 1with slight peaking (n/nped = 1.2–1.3, where n is the line average over a central chord(R = 3.02 m) and nped is the line average over a chord in the edge region (R = 3.75 m)), highconfinement H98(y,2) ∼ 1 (with H98(y,2) the enhancement factor over ELMy H-mode as givenby the IPB98(y,2) scaling expression, see section 6.1 [2]), and high normalized beta βN = 2for quasi-stationary time intervals lasting several seconds (more than 6 s for the discharge offigure 1). This duration is close to the maximum, technically realizable, flat-top time in JETfor this operational scenario. To obtain good confinement conditions in high triangularityscenarios, in addition attention has to be paid to avoid large first ELMs. This was done usinggas puffs in the beginning of the discharge. The idea was to maintain the size of the firstELM below the level that creates seed islands for neoclassical tearing modes (NTM), as modenumbers m/n = 3/2 are often observed after large ELMs.
Pulse No: 52014 2.5MA / 2.7T
H98(y,2)~ 1
Prad / Ptot
n/nGW
(a.u
.)
20 21 22191817Time (s)
20 21 22191817
20 21 22191817
βN~ 2
PNBI ~ 14MW
D gas puff rate (1023s-1) 2
Type I ELM ~ 22HzDα
_1.0
0
1
2
0.5
0
Figure 1. Time traces of an ITER-like JET plasma (#52014, 2.5 MA/2.7 T) obtained at hightriangularity (δ ∼ 0.47) showing simultaneously realization n/nGW > 0.85, βN ∼ 2 andH98(y,2) ∼ 1 from about t = 20 s onwards.

A14 J Ongena et al
1.2
1.0
0.8
0.6
0.40.4 0.6 0.8 1.0 1.2
H98(y,2)
n / nGW
Open symbols: Type III ELMs
δ = 0.23 δ = 0.46δ = 0.14 δ = 0.38
ELMy H-Mode
ITER
_
Figure 2. Plot of the enhancement factorH98(y,2) versus the Greenwald factor n/nGW in dischargeseries with different triangularities and no impurities. Data for δ up to 0.38 have been obtained inthe MkII JET divertor [9]. The highest triangularity data (δ = 0.46) have been obtained this yearin the gasbox divertor (MkIIGB) configuration. The projected ITER design point is indicated bythe star. Open symbols correspond to discharges with Type III ELMs.
Typically, such plasmas have low frequency Type I ELMs [9]. At all triangularities, thereis a confinement degradation with density but higher triangularities achieve higher densitieswith good confinement (figure 2). Data from ITER-like plasmas now encompass the ITERdesign point (n/nGW = 0.85 and H98(y,2) = 1).
High confinement was also obtained with strong gas puff in lower triangularity plasmas(δ ∼ 0.3) by increasing the heating power sufficiently to maintain Type I ELMs. This was donefor two sets of discharges (figure 3) at medium triangularity (δ = 0.33) at low and high valuesfor Pheat/PL–H (1.6 < Pheat/PL–H < 2.1 and 2.4 < Pheat/PL–H < 4.2). The higher values forPheat/PL–H maintained higher confinement even with strong gas puff (leading to high densitiesup to the Greenwald limit), while lower Pheat/PL–H led to degradation of confinement withhigh gas puff rates, as illustrated in figure 3. The confinement degradation is correlated with achange from Type I to Type III ELMs and only densities below the Greenwald limit are reached.
Although the high density in these plasmas was reached by high gas fuelling rates,H98(y,2)
degraded by only 5–10% compared to the unfuelled case. The decreased sensitivity of energyconfinement to high gas puff rates of this type of discharges was explained in [9] in part bystabilization of ballooning mode turbulences in the edge due to triangularity. The net resultare plasmas with high stored energy and normalized beta value, high plasma density aroundthe Greenwald limit and consequently low plasma dilution characterized by a Zeff ∼ 1.5.
3. High density and high confinement impurity seeded plasmas
Experiments with impurity seeding on TEXTOR, DIII-D, JET and JT-60U [10] have shownthat it is possible to combine or even improve the confinement and density properties of

Progress of JET towards the ITER reference mode A15
1.2
1.0
0.8
0.6
0.70.6 0.8 0.9n/nGW
H98
(y,2
)
1.0 1.1_
Figure 3. The enhancement factorH98(y,2) for medium triangularity plasmas (δ ∼ 0.3) as a functionof the Greenwald number. Circles correspond to discharges at 1.9 MA/2.0 T with Pheat/PL–H >
2.4, squares to discharges at 2.4 MA/2.4 T and 1.9 MA/2.0 T with 1.6 < Pheat/PL–H < 2.4. Opensymbol indicates Type III, solid symbols Type I ELMs. Arrows show the direction of increasinggas puff rates. For the second class of discharges, confinement and density is reduced at high gaspuff rates, accompanied by the appearance of Type III ELMs.
plasmas (leading to high confinement, H98(y,2) ∼ 1, and high density, n/nGW ∼ 1) with highlevels of radiation in the edge. Experiments with radiative mantle plasmas started in JET in1999 [11] have been continued this year [12–18] in (i) low triangularity discharges with theX-point lowered onto or just inside the material barrier (called septum or dome) dividing theinboard and outboard sides of the divertor, resulting in the so-called ‘septum’ configuration,and (ii) discharges at high triangularity with a geometry close to the ITER one.
3.1. Impurity seeding in ‘septum’ discharges
This discharge type is mid-way between a divertor and a pumped limiter configuration.Surprisingly, these discharges have a lower H-mode threshold power than discharges withoutseptum [19] and thus remain in H-mode even at high radiation levels. Impurity seeding hasbeen applied to both low (δ = 0.2, κ = 1.6) and medium triangularity (δ = 0.3, κ = 1.72)discharges in the septum configuration (figure 4). About 0.5 s after the application of additionalheating, a strong gas puff was applied. Confinement was reduced during the gas puff phase, asseen in the reduction of the enhancement factorH98(y,2) to about 0.8. During the D2 puff phase,Ar was also puffed and both the radiative power level and plasma density increased. After theD2 gas fuelling valve closed, the density was constant (n/nGW ∼ 0.9) and the confinementwas restored to pre-puff values (H98(y,2) ∼ 1), with radiation fractions Prad/Ptot around 50%.In this way, values are obtained for the product H98(y,2) × n/nGW ∼ 0.9 at n/nGW ∼ 0.9,outstanding for low triangularity plasmas. Those values can be maintained stationary for 5 s orabout 12τE. This phase (from 20 s onwards in figure 4) is called the ‘afterpuff’ phase. Duringthe afterpuff phase, gentle Ar and D2 refuelling was applied keeping the radiation level and theplasma density constant. Only 15–20% of the input power was radiated in the divertor, withabout 30% of the input power radiated in the edge of the main plasma chamber. Ar seeding is

A16 J Ongena et al
14 16 18 20 22 24 26
Pulse No : 53030 2.5MA / 2.4T, Pnb= 14MW δU/L = 0.19 / 0.24 κ =1.67
Ar
D2
H98(y,2) ~ 1
PNI
Neutron Yield (1015 s-1)
E(MJ)
n/nGW ~ 0.9
5s or 12τE
Ar Intensity (a.u.)
Time (s)
Puff Afterpuff
_
0
2
4
6
0.5
0
1.0
Figure 4. Ar seeding in a low triangularity (δ ∼ 0.22) ELMy H-mode plasma with the X-pointon the septum. Time evolution of the enhancement factor H98(y,2), the Greenwald factor, neutronyield, plasma stored energy, bulk radiation and deuterium and Ar injection rate. The main puffphase consists of D and Ar injection, intended to increase both the density and radiation level inthe discharge. The ‘afterpuff’ phase (with reduced levels for D2 and Ar puff) had simultaneoushigh confinement and high density.
more adapted to the JET plasma parameters than Ne, as the latter leads to a higher Zeff for agiven radiation level.
Note that the electron density increase not only results from the extra electrons provided bythe ionization of the seeded Ar but genuine changes must take place in the particle confinementtime τp, the fuelling efficiency (as defined in [20]) or both in the presence of Ar.
The same technique (puff and afterpuff) was applied in septum discharges at mediumtriangularity (δ ∼ 0.3), leading to similar results. At δ ∼ 0.3 higher densities were obtainedwith D puff only, whereas at δ = 0.2 similar densities could only be obtained with additionalAr seeding during the D puff phase. Both low and high triangularity discharges with impurityseeding showed a peaking of the electron density profile.
The ELM frequency reduced during Ar seeding for a given (high) density and edgepedestal. Consequently smaller time integrated ELM losses occurred. This will be furtherdiscussed in section 7. Nevertheless, fundamental changes in bulk confinement must also takeplace, as the Ar seeding also correlated with χeff (calculated by TRANSP [21]) dropping in thecore [10]. Such an improvement of confinement has been demonstrated in L-mode divertorplasmas with impurity seeding in DIII-D and JET [38].
3.2. Impurity seeded ITER-like plasmas
Ar seeded ITER-like plasmas (figures 5(a) and (b)) showed a radiating mantle and Prad/Ptot =60–70%. ICRH has been applied to avoid impurity accumulation (see section 3.3). Ar seeding
Progress of JET towards the ITER reference mode A17
Reference plasma without Argon Seeding
Zeff
Dα
H98(y,2)
n/nGWPrad /Ptot
PNI = 15MW PICRH = 2MW
Pulse No: 53549 2.3MA/2.4T κ =1.7, δL = 0.35, δU = 0.48
_
Time (s)16 17 18 19 20 21 22 23
q(0)
0
1
2
30
0.5
1.0
1.0
0.9
0.8
Pulse No: 53550 2.3MA/2.4T κ =1.7, δL = 0.35, δU = 0.48
0
0.5
1.0
1
2
3
Dα
Ar
Argon Seeded plasma
0
Zeff
H98(y,2)
Prad/Ptot
PNI = 17MWPICRH= 2MW
n/nGW_
Time (s)16 17 18 19 20 21 22 23
1.0
0.9
0.8 q(0)
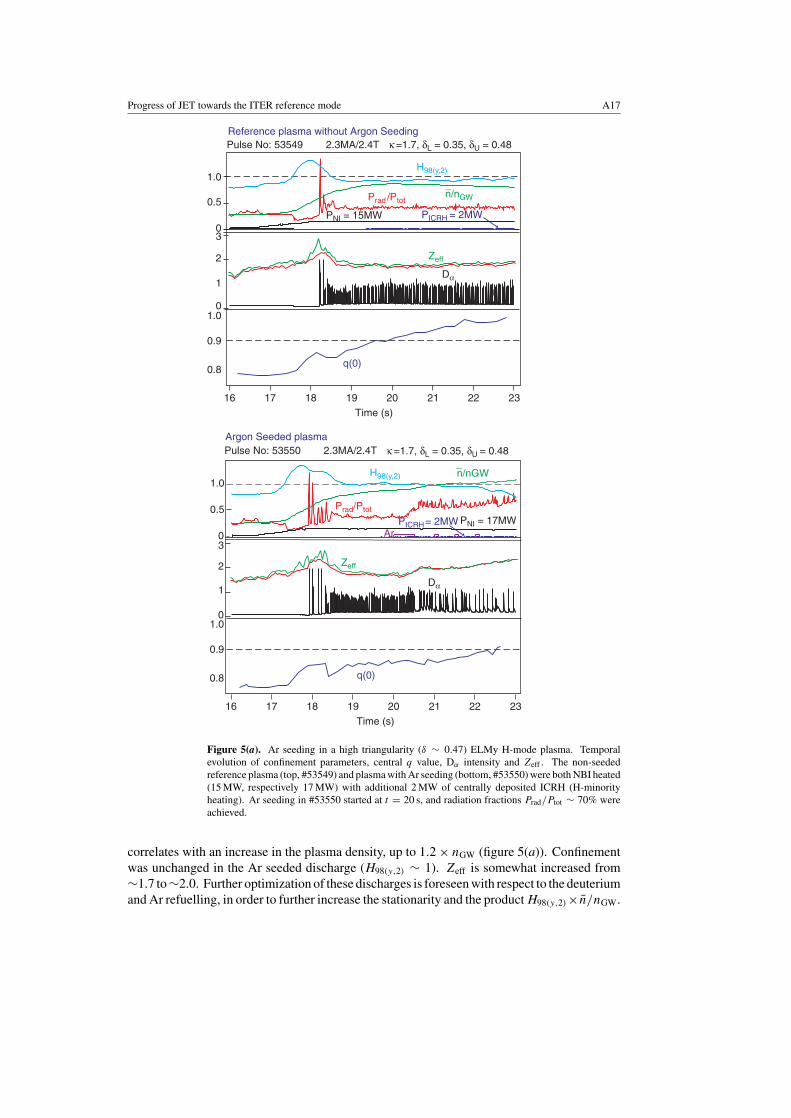
Figure 5(a). Ar seeding in a high triangularity (δ ∼ 0.47) ELMy H-mode plasma. Temporalevolution of confinement parameters, central q value, Dα intensity and Zeff . The non-seededreference plasma (top, #53549) and plasma with Ar seeding (bottom, #53550) were both NBI heated(15 MW, respectively 17 MW) with additional 2 MW of centrally deposited ICRH (H-minorityheating). Ar seeding in #53550 started at t = 20 s, and radiation fractions Prad/Ptot ∼ 70% wereachieved.
correlates with an increase in the plasma density, up to 1.2 × nGW (figure 5(a)). Confinementwas unchanged in the Ar seeded discharge (H98(y,2) ∼ 1). Zeff is somewhat increased from∼1.7 to ∼2.0. Further optimization of these discharges is foreseen with respect to the deuteriumand Ar refuelling, in order to further increase the stationarity and the productH98(y,2)× n/nGW.

A18 J Ongena et al
12
8
4
0
12
8
4
0
Time (s)
Outer divertor
Inner divertor
16 17 18 19 20 21 22 23
Tem
pera
ture
(x1
02°C
)
Outer divertor
Inner divertor
Time (s)16 17 18 19 20 21 22 23
Tem
pera
ture
(x1
02°C
)
12
8
4
0
12
8
4
0Argon seeding
Argon seeding
Reference plasma without Argon Seeding
Pulse No: 53549 2.3MA/2.4T κ =1.7, δL = 0.35, δU = 0.48
Pulse No: 53550 2.3MA/2.4T κ =1.7, δL = 0.35, δU = 0.48Argon Seeded plasma
Figure 5(b). Infrared measurements of the JET divertor target plates for the same discharges asfigure 5(a).
Infrared measurements at a fixed location in the inner and outer divertor (figure 5(b))showed a reduction in the surface temperature of the divertor target with Ar seeding. Theeffect is clearly visible in the inner divertor, and even more in the outer divertor, where thebase level drops from about 500◦C to about 100◦C and also the maximum temperature spikesdue to ELMs are reduced from 1300◦C to 600◦C [22]. Although these results are from firstIR thermographic measurements in such a scenario and further work is needed to consolidatethese findings, the result looks promising as a possible technique for ELM mitigation.
3.3. Application of central heating in impurity seeded plasmas tooptimize the impurity content
Sawteeth play an important role in maintaining a low dilution in the plasma centre of impurityseeded plasmas. In ELMy H-modes without impurity seeding, generally a slow increase inthe central safety factor q(0) is seen (see figure 5(a)). With excessive Ar injection rates,the following four effects are observed: (i) further increase in the central q leading tosawteeth disappearance when q(0) > 1 followed by impurity accumulation, (ii) an increasein MHD activity [15] which can lead to (iii) a decrease in the energy confinement time and

Progress of JET towards the ITER reference mode A19
0.70.6 0.8 0.9 1.0 1.1n/nGW
1.1
1.0
0.9
0.8
0.7
0.6
H98
(y,2
)xn/
n GW
_
_
Figure 6. Confinement plotted versus Greenwald number for Ar seeded plasmas (solid symbols)and reference cases (open symbols). Values are obtained by averaging over time intervals of 1.5 s(about 3τE for the discharges considered). Data belong to two distinct discharge types: (i) with theX-point on the septum at low δ = 0.15 (diamonds), and (ii) ITER-like discharges at high δ = 0.45(squares).
(iv) appearance of ELM free phases. The causality between these effects needs further study,but the current understanding is that the changes in the central part of the q profile induce theothers. Central heating is one means to counteract the modifications in the q profile and tokeep q(0) < 1, in order to keep the sawtooth MHD. At the higher densities reached in thesedischarges, the energy deposition of the beams becomes flatter and even hollow. Therefore,in addition to NBI heating, ICRH (H-minority heating) is applied with the resonance layerlocated on axis, at moderate heating levels (1–2 MW) to avoid sawtooth stabilization by RFinduced fast ions. The central electron temperature increased, and the central q remained belowunity (figure 5(a)). As a result, the sawteeth remained and core impurity accumulation did notoccur. Note that sawtooth activity reduces the central impurity content without increasing theimpurity content in the rest of the plasma, as deduced from Ar concentration and Zeff profiles.
AnH98(y,2)×n/nGW versus n/nGW diagram (figure 6) shows that low triangularity plasmaswith Ar seeding had 20% higher nτE than unseeded plasmas, while ITER shaped plasmas withAr had similar nτE as unseeded plasmas. Thus, Ar seeding generally allows one to combinegood confinement properties with high radiation levels in a mantle around the plasma. Furtherstudy is needed to reveal the physical mechanisms behind the confinement improvement withAr in the low triangularity discharges.
4. Slow density profile evolution
For a given line-averaged density and temperature profile, fusion power increases withincreased peaking of the plasma density, thus optimizing the fusion yield in a reactor. Severaltokamaks have observed density peaking on long time scales [23, 24]. JET [25] has alsorecently observed similar density peaking on long time scales for various plasma currents
A20 J Ongena et al
21 22 23 24 25 26 27Time (s)
PNI ~ 7.5MW
D2 gas puff rate (1022s-1)Dα (a.u.)
H98(y,2)
βN,th
n/nGW ~ 1.1_n/nGW
_0.8
1.2
0.6
0.4
0.2
0.0
1.0
2.0 2.5 3.0 3.5 4.0Major Radius (m)
ne(r) 1020m-3
t = 22.8 s t = 24.8 st = 26.1 s
0
5
0.0
0.5
1.0
0.0
0.5
1.0
0
1
2
Pulse No: 52463 1.9MA/2T, δ = 0.50
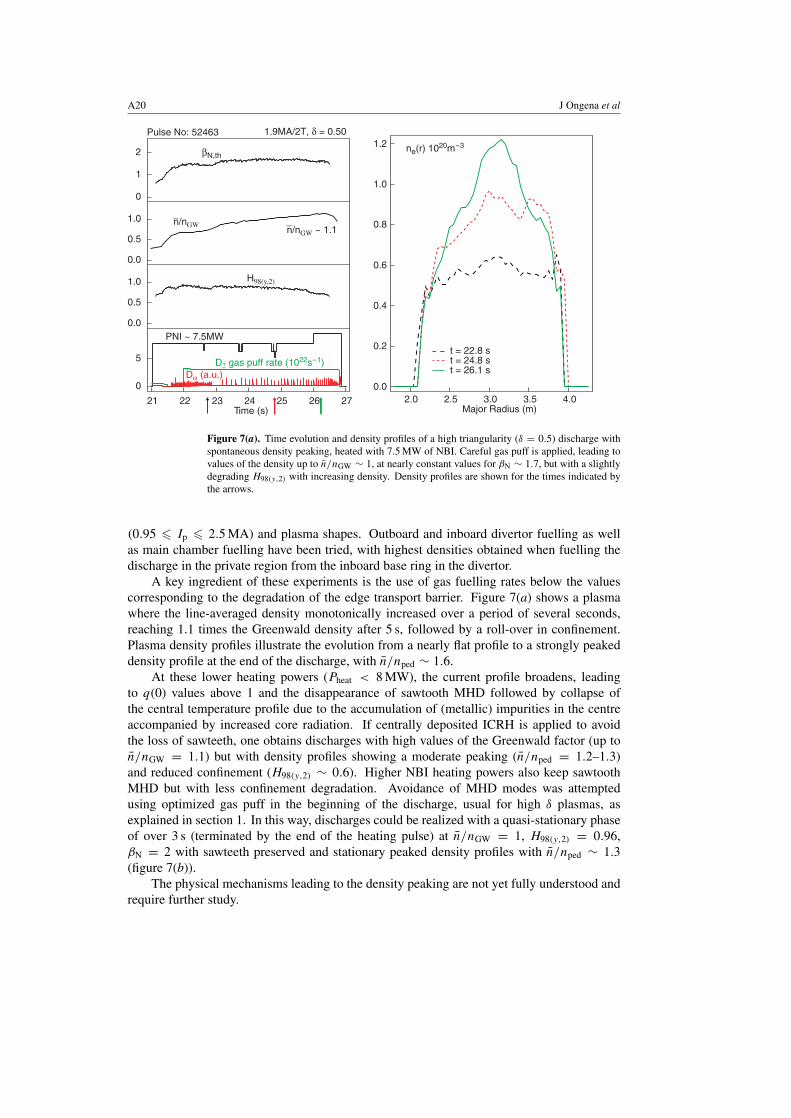
Figure 7(a). Time evolution and density profiles of a high triangularity (δ = 0.5) discharge withspontaneous density peaking, heated with 7.5 MW of NBI. Careful gas puff is applied, leading tovalues of the density up to n/nGW ∼ 1, at nearly constant values for βN ∼ 1.7, but with a slightlydegrading H98(y,2) with increasing density. Density profiles are shown for the times indicated bythe arrows.
(0.95 � Ip � 2.5 MA) and plasma shapes. Outboard and inboard divertor fuelling as wellas main chamber fuelling have been tried, with highest densities obtained when fuelling thedischarge in the private region from the inboard base ring in the divertor.
A key ingredient of these experiments is the use of gas fuelling rates below the valuescorresponding to the degradation of the edge transport barrier. Figure 7(a) shows a plasmawhere the line-averaged density monotonically increased over a period of several seconds,reaching 1.1 times the Greenwald density after 5 s, followed by a roll-over in confinement.Plasma density profiles illustrate the evolution from a nearly flat profile to a strongly peakeddensity profile at the end of the discharge, with n/nped ∼ 1.6.
At these lower heating powers (Pheat < 8 MW), the current profile broadens, leadingto q(0) values above 1 and the disappearance of sawtooth MHD followed by collapse ofthe central temperature profile due to the accumulation of (metallic) impurities in the centreaccompanied by increased core radiation. If centrally deposited ICRH is applied to avoidthe loss of sawteeth, one obtains discharges with high values of the Greenwald factor (up ton/nGW = 1.1) but with density profiles showing a moderate peaking (n/nped = 1.2–1.3)and reduced confinement (H98(y,2) ∼ 0.6). Higher NBI heating powers also keep sawtoothMHD but with less confinement degradation. Avoidance of MHD modes was attemptedusing optimized gas puff in the beginning of the discharge, usual for high δ plasmas, asexplained in section 1. In this way, discharges could be realized with a quasi-stationary phaseof over 3 s (terminated by the end of the heating pulse) at n/nGW = 1, H98(y,2) = 0.96,βN = 2 with sawteeth preserved and stationary peaked density profiles with n/nped ∼ 1.3(figure 7(b)).
The physical mechanisms leading to the density peaking are not yet fully understood andrequire further study.

Progress of JET towards the ITER reference mode A21
1.9MA/2T, δ = 0.50 Pulse No: 52979
18 20 22 24
Time (s)
PNI ~ 10.5 MW
n/nGW
Dα (a.u.) D2 gas puff rate (1022/s)
H98(y,2)
βN,th
_0.8
1.2
0.6
0.4
0.2
0.0
1.0
Major Radius (m)
ne(r) 1020m-3
0
5
100.40.60.81.0
0
1
2
0.40.60.81.0
t = 21.8 st = 22.8 st = 23.8 st = 24.4 s
2.0 2.5 3.0 3.5 4.0
Figure 7(b). Time evolution and density profiles of a high triangularity (δ = 0.5) discharge withspontaneous density peaking, heated with 10.5 MW of NBI. Gas puff is applied, leading to valuesof the density up to n/nGW ∼ 1, at nearly constant values for βN ∼ 2 and H98(y,2) ∼ 1. Densityprofiles are shown for the times indicated by the arrows.
5. Pellet injection
Pellet fuelling experiments have been conducted [26] to achieve long pulse operation atdensities in the vicinity of the Greenwald density with good energy confinement. A targetplasma configuration with δ ∼ 0.34 and at 2.5 MA/2.4 T was chosen, showing confinementcollapse when trying to fuel the density beyond n/nGW = 0.8 with gas puff only. Solid 4 mm3
deuterium cubes were launched at a speed of 160 m s−1 into the plasma from the high fieldside via an injection tube tilted by 44◦ with respect to the horizontal plane and with a tangencyradius at a normalized minor radius ρ ∼ 0.6–0.7. An optimized pellet fuelling scenarioshould minimize or avoid the following effects: (i) prompt particle losses causing too strongan increase of the neutral gas pressure and edge density, (ii) trigger of MHD activity by thepellet, and (iii) ELM bursts following pellet injection. Each of these pellet related effects cancause severe energy losses from the plasma.
Mitigation of the confinement losses resulting from pellet induced ELMs was achievedwith an adapted pellet fuelling cycle consisting of interrupting the injected pellet string. Thisleads to recovery of the plasma energy content, while the particle inventory still remains high.The finally optimized pellet sequence is composed of an initial density build-up phase at apellet injection rate of about 6 Hz followed by a phase where the density is sustained at aninjection rate of about 2 Hz. In this way, a density increase beyond the Greenwald limit wasachieved without significant persistent loss of the plasma energy content, as illustrated infigure 8. The initial pellet sequence causes the expected energy drop due to enhanced ELMactivity. The pellet string is then interrupted for about 0.5 s to allow for energy recovery,followed by a string at 2 Hz. With this reduced repetition rate, the transient energy dropinitiated by every pellet can be almost fully recovered before the next pellet arrives in theplasma. Moreover, successive pellets gradually increase the plasma density until finally a

A22 J Ongena et al
Dα
βN(M
J)
Time (s)
1.5
2.0
20 211918
Pellet timing
WDia
Pheat = 18 MW
n/nGW
Pulse No: 53212 2.5MA/2.4T δU/L= 0.34/0.3 κ = 1.67
_
0.6
0
0.8
1.0
1.2
4
6
Figure 8. Time evolution of the diamagnetic energy, normalized beta, Greenwald factor and theintensity of the Dα line for a medium triangularity JET discharge with an optimized pellet fuellingcycle. Squares indicate the timing sequence of the pellets. Solid lines correspond to the dischargewith pellets, dashed lines to a reference discharge without pellets (and without gas puff).
density above the Greenwald limit is achieved with a simultaneous high plasma energy contentof about 6 MJ and βN > 1.8, corresponding to anH98(y,2) ∼ 0.82. The energy and central line-averaged density of a reference discharge without gas puff or pellet injection are indicated bythe dashed lines in the figure for comparison. It is clear that the discharge with the optimizedpellet injection obtains the same energy content, however, at a much higher density as thenon-fuelled reference. Further experiments are planned next year aimed at improving thestationarity of these discharges.
A too high pellet injection rate can lead to severe cooling of the central plasma temperatureleading to reduction of the critical beta (because of the decrease of the ion gyroradius due tothe reduction in temperature) and therefore renders the plasma sensitive to the appearance ofNTMs. To keep the plasma temperature sufficiently high, dominant NBI heated plasmas werealso heated with centrally deposited ICRH, resulting indeed in reduction of the MHD activity.Raising the toroidal field is also beneficial to reduce MHD, but leads for a fixed power on thecontrary to Type III ELMs and reduced plasma performance.

Progress of JET towards the ITER reference mode A23
6. Confinement scaling of high triangularity discharges and comparison ofrecently obtained confinement data to the ITER design point parameters
6.1. Influence of triangularity, density peaking and the Greenwald factor onthe enhancement factor H98(y,2)
The new results described in the previous sections permit the investigation of the effect oftriangularity and density peaking on confinement. The data obtained are compared to thestandard IPB98(y,2) [2] scaling law:
τE,IPB98(y,2) = 0.0562 I 0.93p B0.15
t n0.41P−0.69A0.19i R1.97ε0.58κ0.78
with the usual units (s, MA, T, 1020m−3, MW and m). The residuals of the factor H98(y,2) =τE,exp/τE,IPB98(y,2) for a subset of the data which had accurate values of the pedestal densitynped (obtained from the interferometer channel at R = 3.75 m in JET) have been fitted to theupper triangularity, the Greenwald factor and the density peaking factor n/nped. This resultedin a corrected enhancement factor H98(y,2),corr defined as H98(y,2),corr = H98(y,2) ∗ Hcor withHcor = 0.84 + 0.17δU − 0.13n/nGW + 0.50(n/nped − 1). This expression shows clearly theincrease of confinement with triangularity δU and density peaking n/nped and the degradationwith increasing n/nGW. More refined expressions can be used [27], leading essentially to thesame conclusion. For an illustration of the influence of density peaking on the extrapolationto ITER, we take the ITER design point (δU = 0.5, n/nGW = 0.85, H98(y,2) = 1). Withoutpeaking, a confinement factor H98(y,2),corr ∼ 0.81 is found. With a modest density peaking(n/nped = 1.3), this rises to H98(y,2),corr ∼ 0.96.
6.2. Comparison of confinement data to the ITER design point
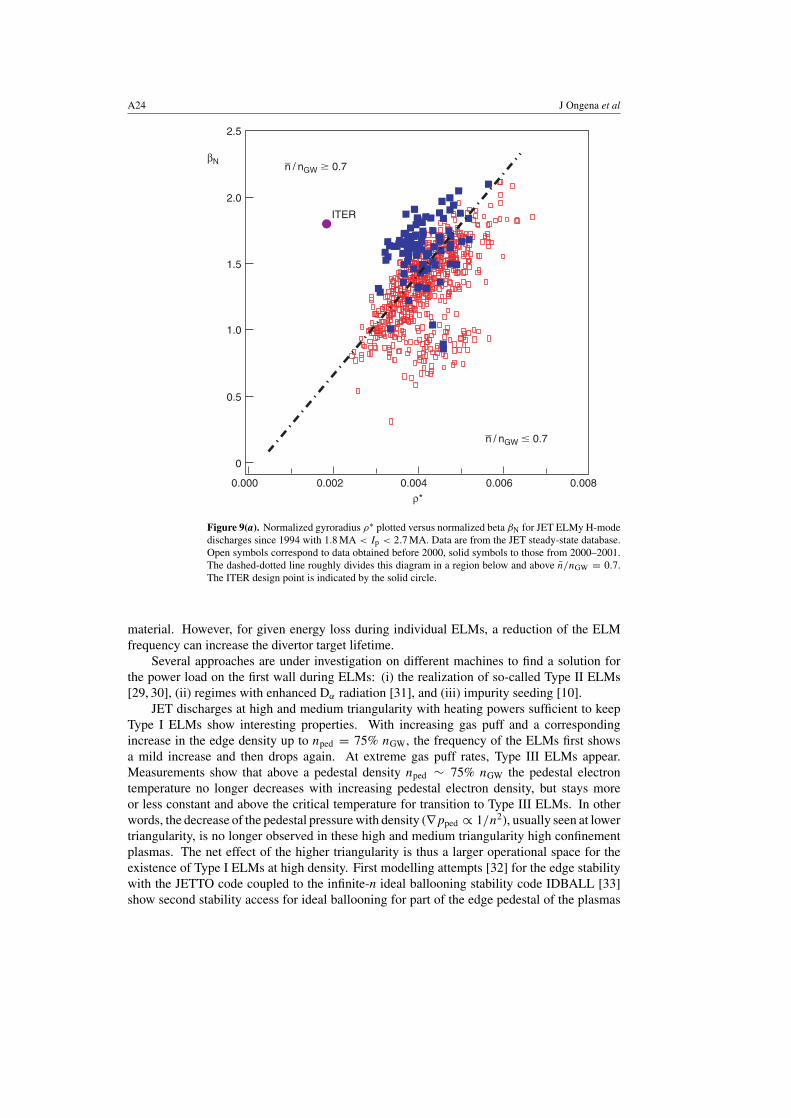
The present data, reaching ITER values for H98(y,2) and n/nGW, have a 2–3 times largernormalized gyroradius ρ∗, and 10 times larger collisionality ν∗ (figures 9(a) and (b)).
Although it is not possible with JET or any existing device to reach simultaneously β, ν∗
and ρ∗ as in ITER, only JET can generate β, ν∗ and ρ∗ data which are closest to dimensionlessITER parameters. First, one can match simultaneously ITER ν∗ and βN values in JET, byoperating at lower density with n/nGW ∼ 0.3–0.5, i.e. the normal operating density range inthe absence of gas puff or pellet injection. Second, as ρ∗ ∝ B−2/3a−5/6 [2] for fixed β and ν∗,operation at high magnetic fields (together with the large machine dimensions of JET) givesthe smallest ρ∗ values possible at this moment in any device. Experiments on JET are neededat higher field and current to operate closer to the ρ∗
ITER and hence improve the preparation forthe ITER operational scenario. To carry out such a programme, that is operating in excess of4.0 MA at the ITER β and ν∗, means that a total heating power in excess of 30 MW will berequired. It is planned that this level of power will be available towards the end of 2002.
7. ELMs in high density, high confinement plasmas andpossible mitigation techniques
High density, high confinement plasmas need a heat exhaust mechanism compatible with thefirst wall to be useful for a future fusion reactor. The power loss per ELM for ITER operatingat Q = 10 and 400 MW fusion power cannot be larger than ∼1% of the plasma stored energy,in order to avoid melting of tungsten and evaporation of carbon target materials [28]. Twoeffects are important when discussing the power losses by ELMS: (i) the peak power fluxduring the ELM itself, and (ii) the power flux averaged over many ELMs. High peak powerloss during ELMs can cause serious damage because of ablation and/or melting of the target
A24 J Ongena et al
0.000 0.002 0.004 0.006 0.008
βN
ρ*
ITER
n / nGW � 0.7_
n / nGW � 0.7_
2.0
2.5
1.5
1.0
0.5
0
Figure 9(a). Normalized gyroradius ρ∗ plotted versus normalized beta βN for JET ELMy H-modedischarges since 1994 with 1.8 MA < Ip < 2.7 MA. Data are from the JET steady-state database.Open symbols correspond to data obtained before 2000, solid symbols to those from 2000–2001.The dashed-dotted line roughly divides this diagram in a region below and above n/nGW = 0.7.The ITER design point is indicated by the solid circle.
material. However, for given energy loss during individual ELMs, a reduction of the ELMfrequency can increase the divertor target lifetime.
Several approaches are under investigation on different machines to find a solution forthe power load on the first wall during ELMs: (i) the realization of so-called Type II ELMs[29, 30], (ii) regimes with enhanced Dα radiation [31], and (iii) impurity seeding [10].
JET discharges at high and medium triangularity with heating powers sufficient to keepType I ELMs show interesting properties. With increasing gas puff and a correspondingincrease in the edge density up to nped = 75% nGW, the frequency of the ELMs first showsa mild increase and then drops again. At extreme gas puff rates, Type III ELMs appear.Measurements show that above a pedestal density nped ∼ 75% nGW the pedestal electrontemperature no longer decreases with increasing pedestal electron density, but stays moreor less constant and above the critical temperature for transition to Type III ELMs. In otherwords, the decrease of the pedestal pressure with density (∇pped ∝ 1/n2), usually seen at lowertriangularity, is no longer observed in these high and medium triangularity high confinementplasmas. The net effect of the higher triangularity is thus a larger operational space for theexistence of Type I ELMs at high density. First modelling attempts [32] for the edge stabilitywith the JETTO code coupled to the infinite-n ideal ballooning stability code IDBALL [33]show second stability access for ideal ballooning for part of the edge pedestal of the plasmas

Progress of JET towards the ITER reference mode A25
0.01 0.10 1.00
ν*
ITER
βNn / nGW � 0.7_
n / nGW � 0.7_
2.0
2.5
1.5
1.0
0.5
0
Figure 9(b). Normalized gyroradius ρ∗ plotted versus collisionality ν∗ for JET ELMy H-modedischarges since 1994 with 1.8 MA < Ip < 2.7 MA. Data are from the JET steady-state database.Open symbols correspond to data obtained before 2000, solid symbols to those from 2000–2001.The dashed-dotted line roughly divides this diagram in a region below and above n/nGW = 0.7.The ITER design point is indicated by the solid circle.
at high and medium triangularity, consistent with the decrease of the Type I ELM frequencywith density.
At high density (nped > 75% nGW) in high triangularity plasmas, broadband continuousedge-localized MHD activity is observed in between the (low frequency) ELMs. A comparisonof the power input and energy loss by Type I ELMs shows that during the interval betweenELMs there must be an additional energy loss channel. Under these conditions, the relativeenergy loss per ELM, !WELM/Wped, decreases together with the ELM frequency, which iscontrary to the usual Fishpool scaling [34] in which !WELM/Wped and the ELM frequencyare approximately inversely correlated. The exact nature of the mechanism leading to theseenhanced losses is a subject of further study. If power and particle exhaust can be taken over bycontinuous MHD activity rather than via an ELM burst, it could possibly be used to advantagefor an operational scenario compatible with the first wall.
The various observations on ELM behaviour with pellet injection, impurity seeding,high and medium triangularity discharges with Type I ELMs can be summarized in aunique relationship between the relative energy loss per ELM (!WELM/Wped) and thecollisionality in the pedestal before the ELM burst, ν∗
ped, showing a decrease of the relativeELM losses as a function of ν∗
ped [35] (figure 10). However, this experimental fact couldalso be attributed to the dependence of MHD on pedestal collisionality or to other processes

A26 J Ongena et al
0.01 0.1 1
∆WE
LM/W
ped
ν*ped
0
0.05
0.10
0.15
0.20
0.25
Figure 10. Relative ELM losses!WELM/Wped plotted versus edge pedestal collisionality ν∗ped, for
several discharges in JET (circles: medium triangularity discharges δ ∼ 0.33 at 2.5 MA/2.7 T;squares: medium triangularity discharges δ ∼ 0.33 at 2.5 MA/2.7 T with pellet injection;crossed squares: high triangularity δ ∼ 0.5 at 2.5 MA/2.7 T; up triangles: medium triangularitydischarges δ ∼ 0.33 at 1.9 MA/2.0 T; full diamonds: low triangularity δ ∼ 0.2 Ar seededdischarges at 2.5 MA/2.4 T; open diamonds: high triangularity δ ∼ 0.5 Ar seeded discharges at2.5 MA/2.7 T).
associated with the relative duration of the phase of enhanced MHD activity and thecharacteristic time of the parallel energy loss, depending in different ways on collisionality.According to the exact mechanism, the extrapolation of these results to ITER can differsubstantially.
Measurements of power deposition profiles (averaged over ELMs) on the divertor targetplates in discharges at 2.5 MA/2.4 T in JET and heated with 12 MW of NBI show that thepeak heat flux was strongly reduced (from 20 to 4 MW m−2) in discharges at higher densitiesobtained with D2 puff [36]. This reduction in the peak power load is observed because ofthe disappearance of the so-called ‘narrow feature’ in the power load profile on the target[35], indicating a decrease of the fast ion losses from the edge plasma, and is possibly furtherenhanced by a decrease of the peak power load during the ELM.
Summarizing, medium and high triangularity high density, high confinement plasmaswithout impurity seeding and with Type I ELMs show the following interesting ELM properties:(i) an ELM frequency which remains low even at high gas fuelling rates, (ii) the relative lossesper ELM !WELM/Wdia which do not increase with decreasing ELM frequency, and (iii) anELM average power flux which decreases with increasing fuelling.
In impurity seeded discharges, the presence of the impurity not only increases radiation, butalso changes the character of the ELMs [18, 34]. In low triangularity discharges, a differencehas been observed in the effect of the impurity on the character of the ELMs both during theD2 puff phase and during the afterpuff. Impurity seeding (by Ar or Ne) applied during themain D2 puff phase can change the ELMs from Type I to more benign high frequency Type IIIELMs, but with reduced confinement. Impurity seeding applied in the afterpuff reduces thefrequency of Type I ELMs and can, with excessive Ar seeding, lead to intermittent ELM-freephases and a tendency for impurity accumulation [13].
Progress of JET towards the ITER reference mode A27
In high triangularity discharges with adequate impurity seeding not only the ELMs ofType I remain, but they are also reduced in frequency. Also in this case, !WELM/Wdia doesnot follow the usual Fishpool scaling [36] at low frequency, and is reduced by a factor ofabout 5 [34]. This is consistent with the infrared thermographic measurements, indicating adramatic drop in the peak and base level temperature in the inner and even more in the outerdivertor (figure 5(b)). Although the estimates of ELM power loss from the profiles indicatevalues on the order of 2.5% of the stored energy [18], it is still unresolved where, and inwhat way, the lost power arrives at the first wall. Part of it could well be radiated away beforearriving at the target plates where the plasma is possibly in a partial detachment state. However,the extrapolation of this ELM buffering effect has to be further confirmed experimentally,as modelling [28] seems to indicate that with increasing !WELM the mitigation effect byradiation could be less efficient. These questions will be addressed in future campaigns.In any case, the results obtained until now show that impurity seeding is an importanttool to influence the ELM frequency and amplitude independent of the triangularity of theplasma [34].
8. MHD in high density, high confinement plasmas
NTMs often limit the performance of high density, high confinement discharges on JET.Dedicated experiments have demonstrated that NTMs are metastable in standard q95 ∼ 3.4scenarios as soon as the discharge is in H-mode. Furthermore, at the crash of long sawtoothperiods, NTMs can be destabilized at low βN values. On the contrary, reducing the amplitudeof the sawteeth reduces the chance to destabilize NTMs, leading to higher βN values before themode sets in. Therefore specific scenarios have been developed to avoid plasma perturbations(sawteeth with a large sawtooth period, large first ELMs or pellets) which could destabilizeNTMs. This has especially been beneficial for the high triangularity, high confinement studies[8, 9], and also for the experiments with density peaking on long time scales [25]. The roleand the need for a control of large sawteeth in inducing NTMs in discharges has been shownin [37], in particular, in relation to discharges with ICRH.
3/2 modes deteriorate the performance of standard scenarios, and 2/1 modes lead to adisruption. The higher m/n = 5/4 and 4/3 modes are usually destabilized before the 3/2modes and have therefore a lower threshold or the island needed to trigger these modes ismore easily generated. They are not as detrimental as the 3/2 modes as they are located moretowards the plasma centre. However, for the experiments with density peaking, which are moreprone to NTMs due to the steep density profiles leading to a non-negligible bootstrap currentfraction of 16–20%, they are important as they stop the monotonic increase of the centraldensity.
9. Conclusions and future work
Over the last year plasmas have been realized in JET with high confinement H98(y,2) ∼ 1 athigh densities n/nGW ∼ 1. This has been possible (i) by increasing the average triangularityof the plasmas, up to δ ∼ 0.5, and has been extended to plasmas with medium triangularityδ ∼ 0.3–0.4 by increasing the heating power so as to sustain Type I ELMs, (ii) in low andhigh triangularity plasmas using impurity seeding, showing, along with the good confinementproperties, high radiated power fractions (up to 70%) and (iii) by plasma fuelling with anoptimized pellet timing sequence, allowing sufficient time between the successive pellets forthe plasma energy to recover without losing too much density. Furthermore, experiments

A28 J Ongena et al
JET Until 2000
JET 2000 2001
0.4 0.6 0.8 1.0 1.2
H98
(y,
2)
ITER parameter domainβN= 1.8 – 2.5
ITER
n/nGW_
0.6
0.8
1.0
1.2
1.4
Figure 11. Confinement H98(y,2) plotted versus the Greenwald factor n/nGW for JET ELMyH-mode discharges since 1994 with 1.8 MA < Ip < 2.7 MA. Data are from the JET steady-statedatabase. Open symbols correspond to data obtained before 2000, solid symbols to those from2000–2001. The full circle corresponds to the ITER working point. The shaded zone roughlycorresponds to the ITER parameter domain with 1.8 < βN < 2.5.
showed (i) the importance of central heating to maintain sawtooth MHD, preventing impurityaccumulation, (ii) the influence of the deuterium gas puff rate in obtaining high confinementand density peaking, and (iii) the importance of Ar seeding to create a radiating belt and tocontribute to the mitigation of ELMs.
These techniques allowed JET (figure 11) to reach the ITER Q = 10 requirements.Moreover, two factors can lead to the decrease of the power load on the target plates: impurityseeding and high triangularity plasmas with broadband inter-ELM MHD activity.
The insights gained, the techniques learned and the data obtained this year are importantsteps towards ITER. Nevertheless, further work is needed to understand the physics of ELMs athigh density and with impurity seeding, and from there to improve the mitigation of ELMs, toextend the stationarity of the plasmas, study the influence of the different heating methods onconfinement and ELM behaviour, to mention but a few. In addition, an extension of the resultsobtained to higher currents, fields and heating powers is necessary to improve the extrapolationof the different high performance regimes to ITER.
Acknowledgments
It was a great pleasure to share the work with all the European and non-European colleaguesat JET this year. The excellent work done by colleagues from UKAEA responsible for theoperation of JET has been an important factor in the success of the 2000–2001 experimentalcampaigns. The work described in this paper has been performed under EFDA (EuropeanFusion Development Agreement).
Progress of JET towards the ITER reference mode A29
References
[1] Greenwald M et al 1988 Nucl. Fusion 28 2199[2] ITER Physics Basis 1999 Nucl. Fusion 39 2175[3] Stober J et al 2000 Plasma Phys. Control. Fusion 42 A211
W Suttrop et al 2000 Plasma Phys. Control. Fusion 42 A97[4] Osborne T H et al 2000 Plasma Phys. Control. Fusion 42 A175[5] Saibene G, Horton L D, Sartori R et al 1999 Nucl. Fusion 39 1133[6] Lomas P J et al 2000 Plasma Phys. Control. Fusion 42 B115[7] Kamada Y et al 1997 Proc. 16th Conf. Fusion Energy (Montreal, 1996) vol 1 (Vienna: IAEA) p 247[8] Sartori R 2001 Proc. 28th EPS Conf. on Controlled Fusion and Plasma physics (Funchal, 2001) (Europhys.
Conf. Abstracts) vol 25J (Geneva: EPS) P3.003[9] Saibene G 2001 Proc. 28th EPS Conf. on Controlled Fusion and Plasma physics (Funchal, 2001) (Europhys.
Conf. Abstracts) vol 25J (Geneva: EPS) P3.002[10] Ongena J et al 2001 Plasma Phys. 8 2188[11] Strachan J D et al 2000 Plasma Phys. Control. Fusion 42 A81[12] Dumortier P 2001 Proc. 28th EPS Conf. on Controlled Fusion and Plasma physics (Funchal, 2001) (Europhys.
Conf. Abstracts) vol 25J (Geneva: EPS) P3.004[13] Puiatti M E 2001 Proc. 28th EPS Conf. on Controlled Fusion and Plasma physics (Funchal, 2001) (Europhys.
Conf. Abstracts) vol 25J (Geneva: EPS)P3.007[14] Nave M 2001 Proc. 28th EPS Conf. on Controlled Fusion and Plasma physics (Funchal, 2001) (Europhys. Conf.
Abstracts) vol 25J (Geneva: EPS) P3.009[15] Koslowski H R 2001 Proc. 28th EPS Conf. on Controlled Fusion and Plasma physics (Funchal, 2001) (Europhys.
Conf. Abstracts) vol 25J (Geneva: EPS) P3.010[16] Jackson G 2001 Proc. 28th EPS Conf. on Controlled Fusion and Plasma physics (Funchal, 2001) (Europhys.
Conf. Abstracts) vol 25J (Geneva: EPS) P3.017[17] Tokar’ M 2001 Proc. 28th EPS Conf. on Controlled Fusion and Plasma physics (Funchal, 2001) (Europhys.
Conf. Abstracts) vol 25J (Geneva: EPS) P3.032[18] Jachmich S 2001 Proc. 28th EPS Conf. on Controlled Fusion and Plasma physics (Funchal, 2001) (Europhys.
Conf. Abstracts) vol 25J (Geneva: EPS) P3.013[19] Horton L et al Proc. 26th EPS Conf. on Control. Fusion and Plasma Phys. (Maastricht, 1999) paper
P1.021[20] Ehrenberg J et al 1996 Wall effects on particle recycling in tokamaks Physical Processes of the Interaction of
Fusion Plasmas with Solids (New York: Academic Press)[21] Ongena J Evrard M and Mccune D 2000 Fusion Tech. 37 313[22] Eich Th 2001 Proc. 28th EPS Conf. on Controlled Fusion and Plasma physics (Funchal, 2001) (Europhys. Conf.
Abstracts) vol 25J (Geneva: EPS) P5.010[23] Mahdavi M A et al Proc. 18th IAEA Fusion Energy Conf. (Sorrento, Italy, 4–10 Oct. 2000) paper IAEA-CN-77/
EXP1/04[24] Stober J 8th European Fusion Physics Workshop (Leysin, 13–15 Dec. 2000)[25] Valovic M 2001 Proc. 28th EPS Conf. on Controlled Fusion and Plasma physics (Funchal, 2001) (Europhys.
Conf. Abstracts) vol 25J (Geneva: EPS)P3.008[26] Lang P T 2001 Proc. 28th EPS Conf. on Controlled Fusion and Plasma physics (Funchal, 2001) (Europhys.
Conf. Abstracts) vol 25J (Geneva: EPS) P3.012[27] Cordey G et al 2001 Proc. 28th EPS Conf. on Controlled Fusion and Plasma physics (Funchal, 2001) (Europhys.
Conf. Abstracts) vol 25J (Geneva: EPS) P3.011[28] Loarte A Proc. 18th IAEA Fusion Energy Conf. (Sorrento, Italy, 4–10 Oct. 2000) paper IAEA-CN-77/
ITERP/11(R)[29] Kamada Y et al 2000 Plasma Phys. Control. Fusion 42 A247[30] Stober J et al 2001 Nucl. Fusion 41 1123[31] Greenwald M et al 1999 Phys. Plasmas 6 1943[32] Parail V 2001 Proc. 28th EPS Conf. on Controlled Fusion and Plasma physics (Funchal, 2001) (Europhys. Conf.
Abstracts) vol 25J (Geneva: EPS) P5.027[33] Hender T, UKAEA Fusion, Association ‘UKAEA-Euratom’ Private communication[34] Fishpool G M 1998 Nucl. Fusion 38 1373[35] Loarte A 2001 Proc. 28th EPS Conf. on Controlled Fusion and Plasma physics (Funchal, 2001) (Europhys.
Conf. Abstracts) vol 25J (Geneva: EPS) P3.005

A30 J Ongena et al
[36] Fundamenski W et al 2001 Proc. 28th EPS Conf. on Controlled Fusion and Plasma physics (Funchal, 2001)(Europhys. Conf. Abstracts) vol 25J (Geneva: EPS) P4.073
[37] Sauter O et al 2001 Proc. 28th EPS Conf. on Controlled Fusion and Plasma physics (Funchal, 2001) (Europhys.Conf. Abstracts) vol 25J (Geneva: EPS) P5.001
[38] Jackson G 2001 Proc. 28th EPS Conf. on Controlled Fusion and Plasma physics (Funchal, 2001) (Europhys.Conf. Abstracts) vol 25J (Geneva: EPS) P3.017


![Jet [Novela] Biblioteca](https://static.fdokumen.com/doc/165x107/6321c71564690856e108db2b/jet-novela-biblioteca.jpg)