Recent and Historic Population Trends in Bering Sea and Aleutian Island Fishing Communities: Hubs...
22
Draft Revised 03/01/07 Recent and Historic Population Trends in Bering Sea and Aleutian Island Fishing Communities: Hubs and Spokes, Booms and Busts Amanda Poole Alaska Fisheries Science Center and University of Washington and Jennifer Sepez Alaska Fisheries Science Center INTRODUCTION This report examines demographic change in Bering Sea and Aleutian Island (BSAI) fishing communities since 1920. We undertook this research in an attempt to begin introducing human population dynamics as an indicator for regional ecosystem analyses. As ocean temperatures rise in response to global climate change, ecosystems at the higher latitudes are expected to see the most dramatic effects. Since all of the communities in the Bering Sea and Aleutian Islands are highly resource dependent, we expect to see effects on local populations. By examining past population trends in relation to ecosystem factors, we are laying the groundwork for tying population to ecosystem in a manner that can be used to predict the demographic effects of global climate change in the region. We focus here on human inhabitants of the Bering Sea coast, using total population by community and by Census area as the primary indicator, with some analysis of other population characteristics such as ethnicity. This approach is concordant with research on arctic communities that uses crude population growth or loss as a general measure to determine community viability, as this indicator is easy to understand, locally meaningful, and points to the capacity of people in these places to “dwell and prosper for some period, finding sources of income and meaningful lives” (Aarsaether et.al. 2004). This research project examined birth rates, migration, indigeneity, boom-bust economic cycles, and seasonality as factors in understanding population trends in the region. Ecosystem factors are a result of changes in fish populations, fisheries management, industry conditions and markets (especially fish prices), and climate characteristics. The methods sections gives details on how and why communities were selected for inclusion in the study. The rest of the paper describes and analyzes the causes of demographic trends in BSAI fishing communities since 1920, points to the impacts of population decline or growth on local communities, and finally, suggests opportunities for including demographic indicators in future research on fisheries science and policy in conjunction with global climate change. METHODS Demographic indices used in this study include population change by community and aggregated Census areas or boroughs for each decade between 1920─2000 (data from U.S. Census), and yearly between 1990─2005 (data from the Alaska Department of Labor and Workforce Development (ADLWD)). A borough is the Alaskan administrative unit most similar to a county. A Census area is a U.S. Census designated geography most similar to a county, which is applied by the Census to areas where there is no county equivalent (such as much of Southwestern Alaska). Statistics on percent Alaska Native population in each community were also considered, along with aggregate data on ethnicity and migration statistics for Census Areas and boroughs provided by the ADLWD. 1
Transcript of Recent and Historic Population Trends in Bering Sea and Aleutian Island Fishing Communities: Hubs...
Draft Revised 03/01/07
Recent and Historic Population Trends in Bering Sea and Aleutian Island Fishing Communities: Hubs and Spokes, Booms and Busts
Amanda PooleAlaska Fisheries Science Center and University of Washington
andJennifer Sepez
Alaska Fisheries Science Center
INTRODUCTIONThis report examines demographic change in Bering Sea and Aleutian Island (BSAI) fishing
communities since 1920. We undertook this research in an attempt to begin introducing human population dynamics as an indicator for regional ecosystem analyses. As ocean temperatures rise in response to global climate change, ecosystems at the higher latitudes are expected to see the most dramatic effects. Since all of the communities in the Bering Sea and Aleutian Islands are highly resource dependent, we expect to see effects on local populations. By examining past population trends in relation to ecosystem factors, we are laying the groundwork for tying population to ecosystem in a manner that can be used to predict the demographic effects of global climate change in the region.
We focus here on human inhabitants of the Bering Sea coast, using total population by community and by Census area as the primary indicator, with some analysis of other population characteristics such as ethnicity. This approach is concordant with research on arctic communities that uses crude population growth or loss as a general measure to determine community viability, as this indicator is easy to understand, locally meaningful, and points to the capacity of people in these places to “dwell and prosper for some period, finding sources of income and meaningful lives” (Aarsaether et.al. 2004).
This research project examined birth rates, migration, indigeneity, boom-bust economic cycles, and seasonality as factors in understanding population trends in the region. Ecosystem factors are a result of changes in fish populations, fisheries management, industry conditions and markets (especially fish prices), and climate characteristics. The methods sections gives details on how and why communities were selected for inclusion in the study. The rest of the paper describes and analyzes the causes of demographic trends in BSAI fishing communities since 1920, points to the impacts of population decline or growth on local communities, and finally, suggests opportunities for including demographic indicators in future research on fisheries science and policy in conjunction with global climate change.
METHODSDemographic indices used in this study include population change by community and aggregated
Census areas or boroughs for each decade between 1920─2000 (data from U.S. Census), and yearly between 1990─2005 (data from the Alaska Department of Labor and Workforce Development (ADLWD)). A borough is the Alaskan administrative unit most similar to a county. A Census area is a U.S. Census designated geography most similar to a county, which is applied by the Census to areas where there is no county equivalent (such as much of Southwestern Alaska). Statistics on percent Alaska Native population in each community were also considered, along with aggregate data on ethnicity and migration statistics for Census Areas and boroughs provided by the ADLWD.
1
Draft Revised 03/01/07
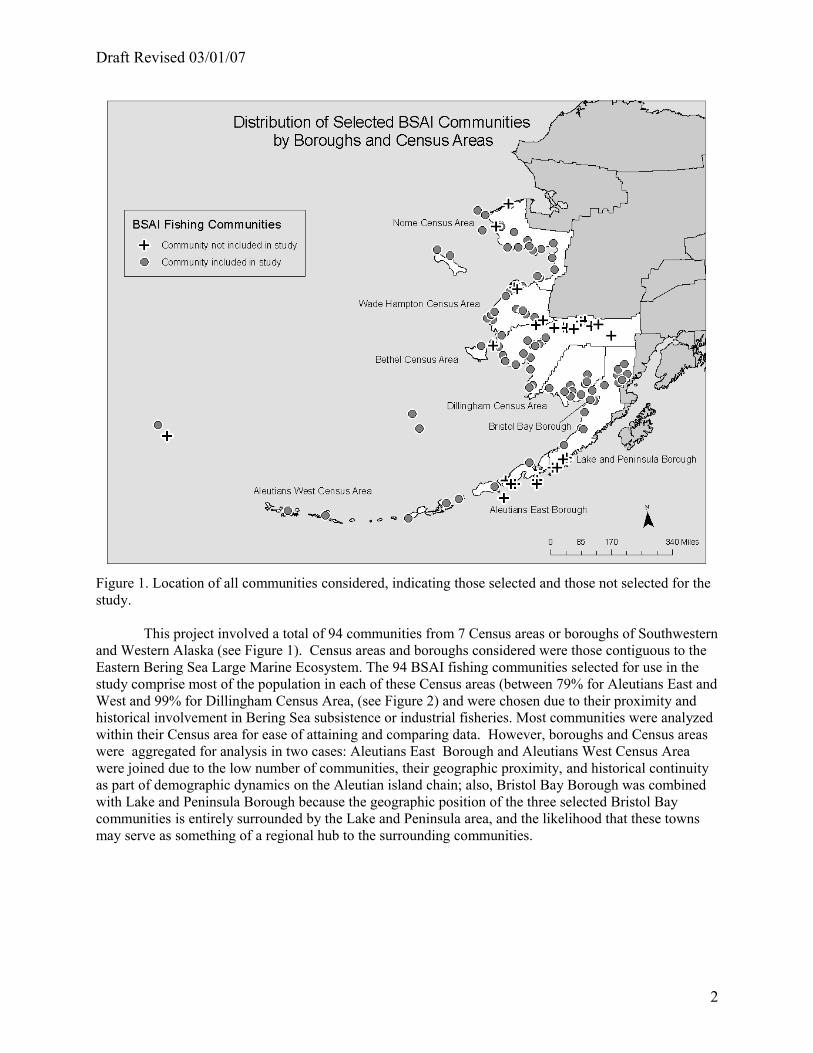
Figure 1. Location of all communities considered, indicating those selected and those not selected for the study.
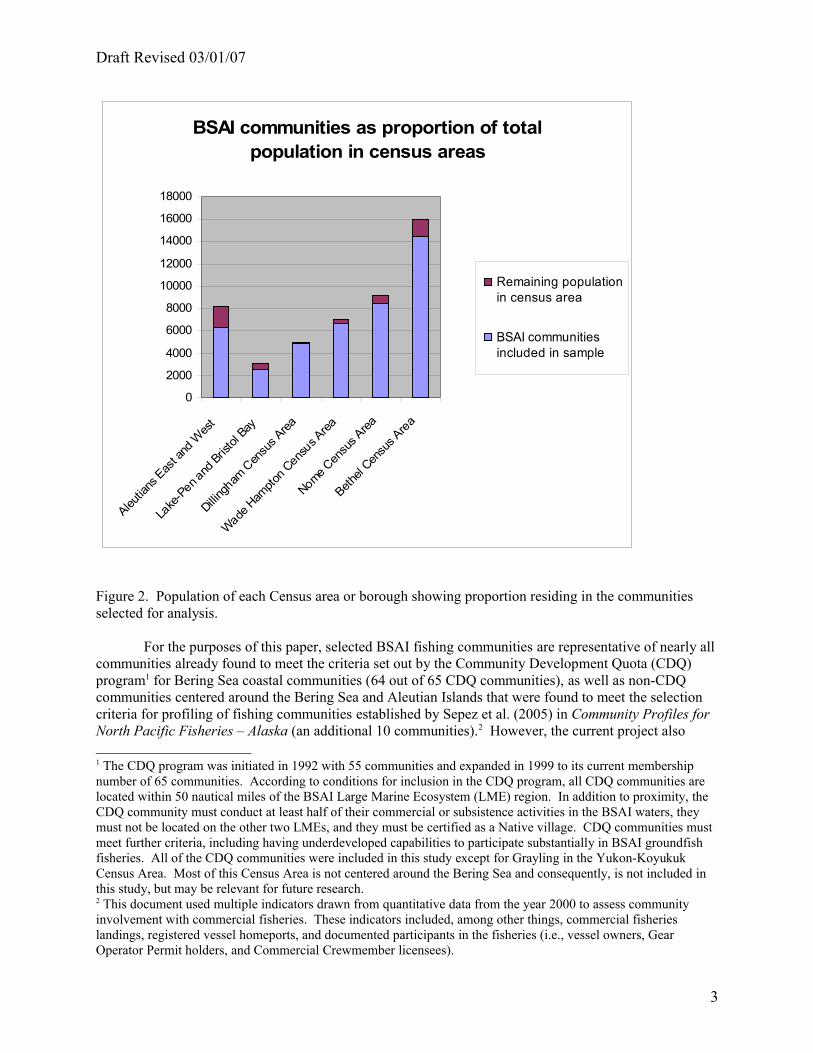
This project involved a total of 94 communities from 7 Census areas or boroughs of Southwestern and Western Alaska (see Figure 1). Census areas and boroughs considered were those contiguous to the Eastern Bering Sea Large Marine Ecosystem. The 94 BSAI fishing communities selected for use in the study comprise most of the population in each of these Census areas (between 79% for Aleutians East and West and 99% for Dillingham Census Area, (see Figure 2) and were chosen due to their proximity and historical involvement in Bering Sea subsistence or industrial fisheries. Most communities were analyzed within their Census area for ease of attaining and comparing data. However, boroughs and Census areas were aggregated for analysis in two cases: Aleutians East Borough and Aleutians West Census Area were joined due to the low number of communities, their geographic proximity, and historical continuity as part of demographic dynamics on the Aleutian island chain; also, Bristol Bay Borough was combined with Lake and Peninsula Borough because the geographic position of the three selected Bristol Bay communities is entirely surrounded by the Lake and Peninsula area, and the likelihood that these towns may serve as something of a regional hub to the surrounding communities.
2
Draft Revised 03/01/07
BSAI communities as proportion of total population in census areas
0
2000
4000
6000
8000
10000
12000
14000
16000
18000
Aleutia
ns E
ast a
nd W
est
Lake
-Pen a
nd B
ristol
Bay
Dillingh
am C
ensu
s Area
Wade H
ampto
n Cens
us Area
Nome Cen
sus A
rea
Bethel
Censu
s Area
Remaining populationin census area
BSAI communitiesincluded in sample
Figure 2. Population of each Census area or borough showing proportion residing in the communities selected for analysis.
For the purposes of this paper, selected BSAI fishing communities are representative of nearly all communities already found to meet the criteria set out by the Community Development Quota (CDQ) program1 for Bering Sea coastal communities (64 out of 65 CDQ communities), as well as non-CDQ communities centered around the Bering Sea and Aleutian Islands that were found to meet the selection criteria for profiling of fishing communities established by Sepez et al. (2005) in Community Profiles for North Pacific Fisheries – Alaska (an additional 10 communities).2 However, the current project also
1 The CDQ program was initiated in 1992 with 55 communities and expanded in 1999 to its current membership number of 65 communities. According to conditions for inclusion in the CDQ program, all CDQ communities are located within 50 nautical miles of the BSAI Large Marine Ecosystem (LME) region. In addition to proximity, the CDQ community must conduct at least half of their commercial or subsistence activities in the BSAI waters, they must not be located on the other two LMEs, and they must be certified as a Native village. CDQ communities must meet further criteria, including having underdeveloped capabilities to participate substantially in BSAI groundfish fisheries. All of the CDQ communities were included in this study except for Grayling in the Yukon-Koyukuk Census Area. Most of this Census Area is not centered around the Bering Sea and consequently, is not included in this study, but may be relevant for future research.2 This document used multiple indicators drawn from quantitative data from the year 2000 to assess community involvement with commercial fisheries. These indicators included, among other things, commercial fisheries landings, registered vessel homeports, and documented participants in the fisheries (i.e., vessel owners, Gear Operator Permit holders, and Commercial Crewmember licensees).
3
Draft Revised 03/01/07
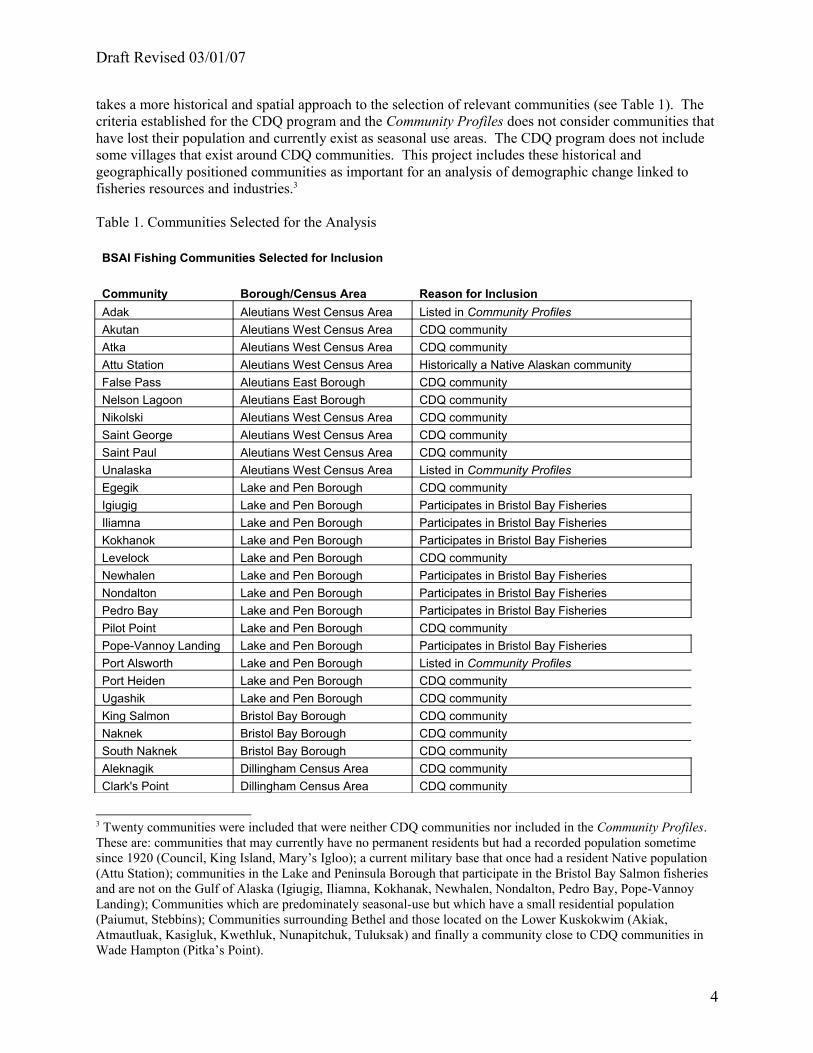
takes a more historical and spatial approach to the selection of relevant communities (see Table 1). The criteria established for the CDQ program and the Community Profiles does not consider communities that have lost their population and currently exist as seasonal use areas. The CDQ program does not include some villages that exist around CDQ communities. This project includes these historical and geographically positioned communities as important for an analysis of demographic change linked to fisheries resources and industries.3
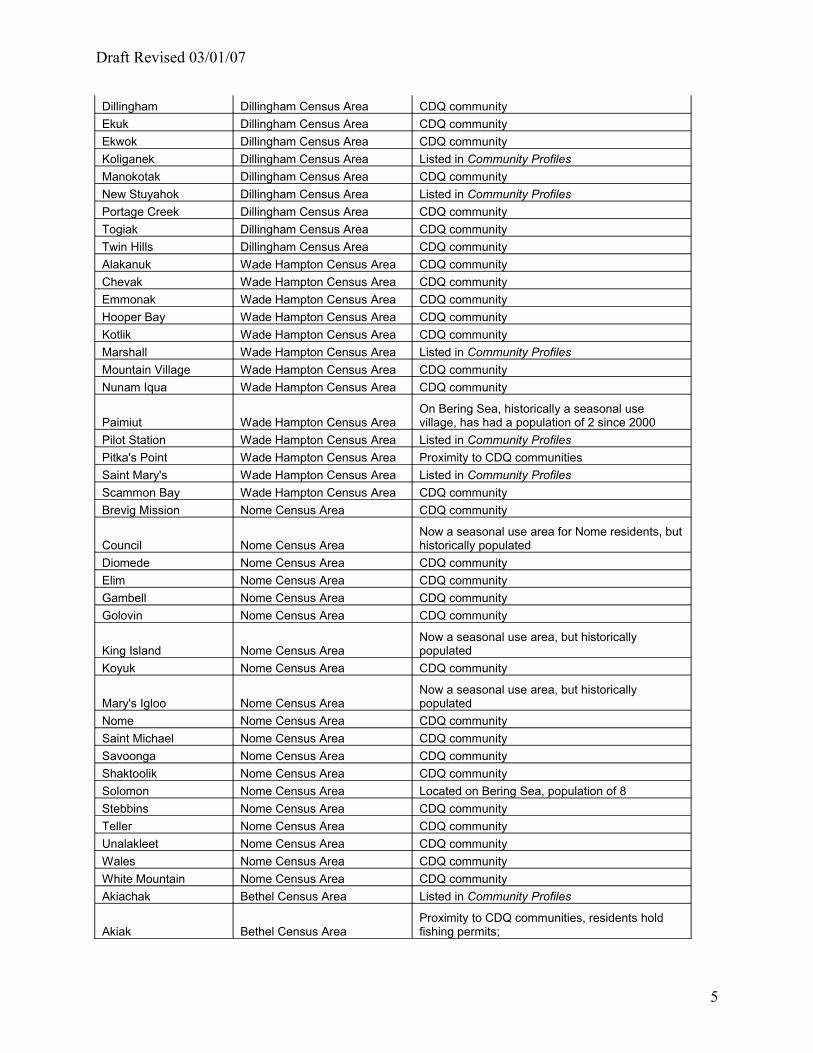
Table 1. Communities Selected for the Analysis
BSAI Fishing Communities Selected for Inclusion
Community Borough/Census Area Reason for Inclusion Adak Aleutians West Census Area Listed in Community Profiles Akutan Aleutians West Census Area CDQ communityAtka Aleutians West Census Area CDQ communityAttu Station Aleutians West Census Area Historically a Native Alaskan community False Pass Aleutians East Borough CDQ communityNelson Lagoon Aleutians East Borough CDQ communityNikolski Aleutians West Census Area CDQ communitySaint George Aleutians West Census Area CDQ communitySaint Paul Aleutians West Census Area CDQ communityUnalaska Aleutians West Census Area Listed in Community Profiles Egegik Lake and Pen Borough CDQ communityIgiugig Lake and Pen Borough Participates in Bristol Bay FisheriesIliamna Lake and Pen Borough Participates in Bristol Bay FisheriesKokhanok Lake and Pen Borough Participates in Bristol Bay FisheriesLevelock Lake and Pen Borough CDQ communityNewhalen Lake and Pen Borough Participates in Bristol Bay FisheriesNondalton Lake and Pen Borough Participates in Bristol Bay FisheriesPedro Bay Lake and Pen Borough Participates in Bristol Bay FisheriesPilot Point Lake and Pen Borough CDQ communityPope-Vannoy Landing Lake and Pen Borough Participates in Bristol Bay FisheriesPort Alsworth Lake and Pen Borough Listed in Community Profiles Port Heiden Lake and Pen Borough CDQ communityUgashik Lake and Pen Borough CDQ communityKing Salmon Bristol Bay Borough CDQ communityNaknek Bristol Bay Borough CDQ communitySouth Naknek Bristol Bay Borough CDQ communityAleknagik Dillingham Census Area CDQ communityClark's Point Dillingham Census Area CDQ community
3 Twenty communities were included that were neither CDQ communities nor included in the Community Profiles. These are: communities that may currently have no permanent residents but had a recorded population sometime since 1920 (Council, King Island, Mary’s Igloo); a current military base that once had a resident Native population (Attu Station); communities in the Lake and Peninsula Borough that participate in the Bristol Bay Salmon fisheries and are not on the Gulf of Alaska (Igiugig, Iliamna, Kokhanak, Newhalen, Nondalton, Pedro Bay, Pope-Vannoy Landing); Communities which are predominately seasonal-use but which have a small residential population (Paiumut, Stebbins); Communities surrounding Bethel and those located on the Lower Kuskokwim (Akiak, Atmautluak, Kasigluk, Kwethluk, Nunapitchuk, Tuluksak) and finally a community close to CDQ communities in Wade Hampton (Pitka’s Point).
4
Draft Revised 03/01/07
Dillingham Dillingham Census Area CDQ communityEkuk Dillingham Census Area CDQ communityEkwok Dillingham Census Area CDQ communityKoliganek Dillingham Census Area Listed in Community Profiles Manokotak Dillingham Census Area CDQ communityNew Stuyahok Dillingham Census Area Listed in Community Profiles Portage Creek Dillingham Census Area CDQ communityTogiak Dillingham Census Area CDQ communityTwin Hills Dillingham Census Area CDQ communityAlakanuk Wade Hampton Census Area CDQ communityChevak Wade Hampton Census Area CDQ communityEmmonak Wade Hampton Census Area CDQ communityHooper Bay Wade Hampton Census Area CDQ communityKotlik Wade Hampton Census Area CDQ communityMarshall Wade Hampton Census Area Listed in Community Profiles Mountain Village Wade Hampton Census Area CDQ communityNunam Iqua Wade Hampton Census Area CDQ community
Paimiut Wade Hampton Census AreaOn Bering Sea, historically a seasonal use village, has had a population of 2 since 2000
Pilot Station Wade Hampton Census Area Listed in Community Profiles Pitka's Point Wade Hampton Census Area Proximity to CDQ communitiesSaint Mary's Wade Hampton Census Area Listed in Community Profiles Scammon Bay Wade Hampton Census Area CDQ communityBrevig Mission Nome Census Area CDQ community
Council Nome Census AreaNow a seasonal use area for Nome residents, but historically populated
Diomede Nome Census Area CDQ communityElim Nome Census Area CDQ communityGambell Nome Census Area CDQ communityGolovin Nome Census Area CDQ community
King Island Nome Census AreaNow a seasonal use area, but historically populated
Koyuk Nome Census Area CDQ community
Mary's Igloo Nome Census AreaNow a seasonal use area, but historically populated
Nome Nome Census Area CDQ communitySaint Michael Nome Census Area CDQ communitySavoonga Nome Census Area CDQ communityShaktoolik Nome Census Area CDQ communitySolomon Nome Census Area Located on Bering Sea, population of 8Stebbins Nome Census Area CDQ communityTeller Nome Census Area CDQ communityUnalakleet Nome Census Area CDQ communityWales Nome Census Area CDQ communityWhite Mountain Nome Census Area CDQ communityAkiachak Bethel Census Area Listed in Community Profiles
Akiak Bethel Census AreaProximity to CDQ communities, residents hold fishing permits;
5
Draft Revised 03/01/07
Atmautluak Bethel Census AreaProximity to CDQ communities, residents hold fishing permits;
Bethel Bethel Census Area Listed in Community Profiles Chefornak Bethel Census Area CDQ communityEek Bethel Census Area CDQ communityGoodnews Bay Bethel Census Area CDQ community
Kasigluk Bethel Census AreaProximity to CDQ communities, residents hold fishing permits;
Kipnuk Bethel Census Area CDQ communityKongiganak Bethel Census Area CDQ community
Kwethluk Bethel Census AreaProximity to CDQ communities, residents hold fishing permits;
Kwigillingok Bethel Census Area CDQ communityMekoryuk Bethel Census Area CDQ communityNapakiak Bethel Census Area CDQ communityNapaskiak Bethel Census Area CDQ communityNewtok Bethel Census Area CDQ communityNightmute Bethel Census Area CDQ community
Nunapitchuk Bethel Census AreaProximity to CDQ communities, residents hold fishing permits;
Oscarville Bethel Census Area CDQ communityPlatinum Bethel Census Area CDQ communityQuinhagak Bethel Census Area CDQ communityToksook Bay Bethel Census Area CDQ community
Tuluksak Bethel Census AreaProximity to CDQ communities, residents hold fishing permits;
Tuntutuliak Bethel Census Area CDQ communityTununak Bethel Census Area CDQ community
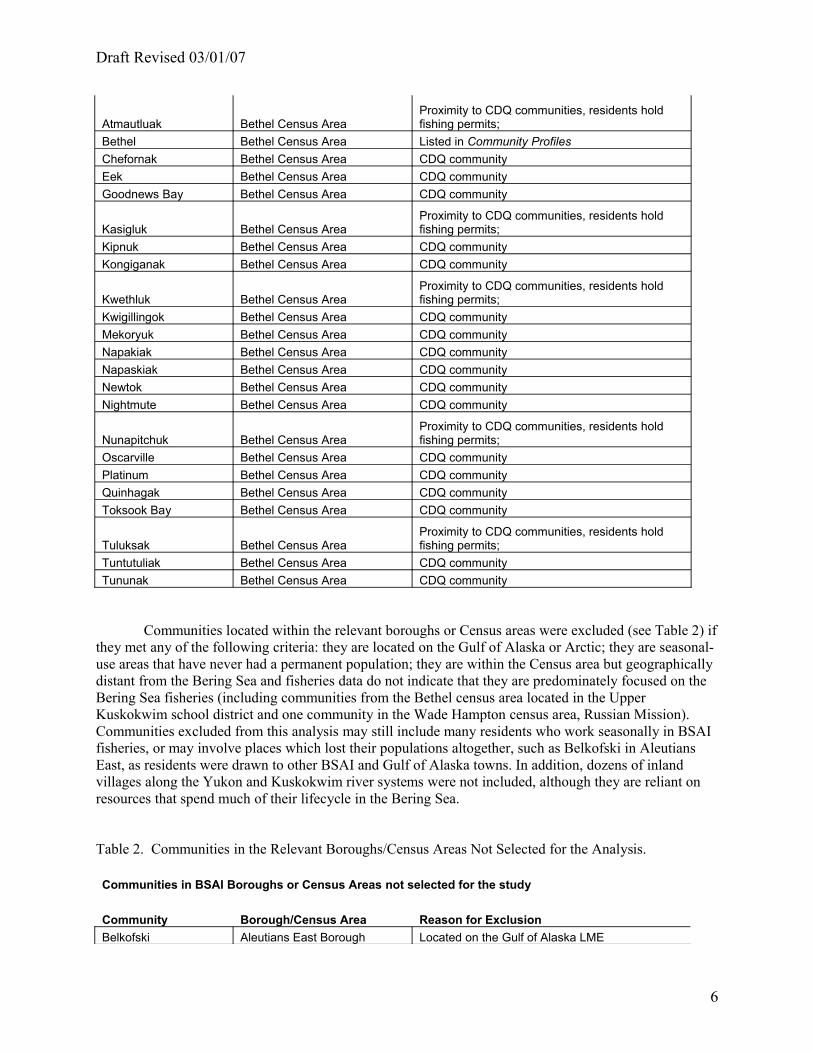
Communities located within the relevant boroughs or Census areas were excluded (see Table 2) if they met any of the following criteria: they are located on the Gulf of Alaska or Arctic; they are seasonal-use areas that have never had a permanent population; they are within the Census area but geographically distant from the Bering Sea and fisheries data do not indicate that they are predominately focused on the Bering Sea fisheries (including communities from the Bethel census area located in the Upper Kuskokwim school district and one community in the Wade Hampton census area, Russian Mission). Communities excluded from this analysis may still include many residents who work seasonally in BSAI fisheries, or may involve places which lost their populations altogether, such as Belkofski in Aleutians East, as residents were drawn to other BSAI and Gulf of Alaska towns. In addition, dozens of inland villages along the Yukon and Kuskokwim river systems were not included, although they are reliant on resources that spend much of their lifecycle in the Bering Sea.
Table 2. Communities in the Relevant Boroughs/Census Areas Not Selected for the Analysis.
Communities in BSAI Boroughs or Census Areas not selected for the study
Community Borough/Census Area Reason for Exclusion Belkofski Aleutians East Borough Located on the Gulf of Alaska LME
6
Draft Revised 03/01/07
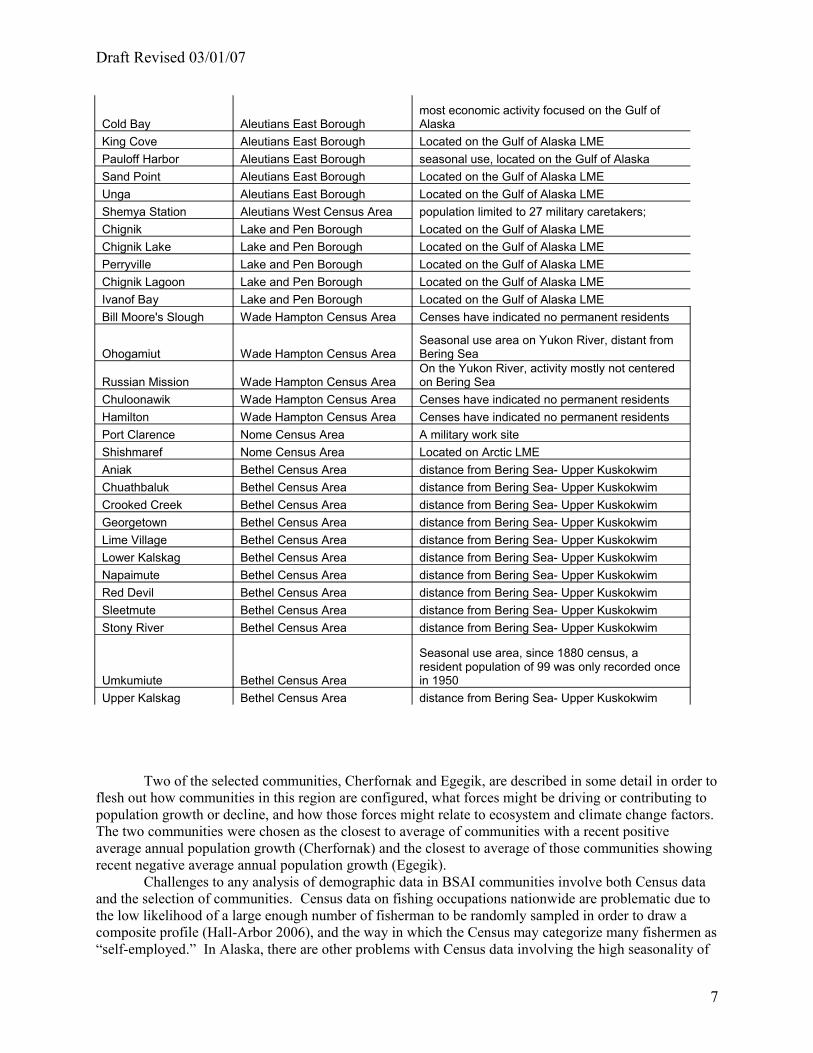
Cold Bay Aleutians East Boroughmost economic activity focused on the Gulf of Alaska
King Cove Aleutians East Borough Located on the Gulf of Alaska LMEPauloff Harbor Aleutians East Borough seasonal use, located on the Gulf of Alaska Sand Point Aleutians East Borough Located on the Gulf of Alaska LMEUnga Aleutians East Borough Located on the Gulf of Alaska LMEShemya Station Aleutians West Census Area population limited to 27 military caretakers; Chignik Lake and Pen Borough Located on the Gulf of Alaska LMEChignik Lake Lake and Pen Borough Located on the Gulf of Alaska LMEPerryville Lake and Pen Borough Located on the Gulf of Alaska LMEChignik Lagoon Lake and Pen Borough Located on the Gulf of Alaska LMEIvanof Bay Lake and Pen Borough Located on the Gulf of Alaska LMEBill Moore's Slough Wade Hampton Census Area Censes have indicated no permanent residents
Ohogamiut Wade Hampton Census AreaSeasonal use area on Yukon River, distant from Bering Sea
Russian Mission Wade Hampton Census AreaOn the Yukon River, activity mostly not centered on Bering Sea
Chuloonawik Wade Hampton Census Area Censes have indicated no permanent residentsHamilton Wade Hampton Census Area Censes have indicated no permanent residentsPort Clarence Nome Census Area A military work siteShishmaref Nome Census Area Located on Arctic LMEAniak Bethel Census Area distance from Bering Sea- Upper KuskokwimChuathbaluk Bethel Census Area distance from Bering Sea- Upper KuskokwimCrooked Creek Bethel Census Area distance from Bering Sea- Upper KuskokwimGeorgetown Bethel Census Area distance from Bering Sea- Upper KuskokwimLime Village Bethel Census Area distance from Bering Sea- Upper KuskokwimLower Kalskag Bethel Census Area distance from Bering Sea- Upper KuskokwimNapaimute Bethel Census Area distance from Bering Sea- Upper KuskokwimRed Devil Bethel Census Area distance from Bering Sea- Upper KuskokwimSleetmute Bethel Census Area distance from Bering Sea- Upper KuskokwimStony River Bethel Census Area distance from Bering Sea- Upper Kuskokwim
Umkumiute Bethel Census Area
Seasonal use area, since 1880 census, a resident population of 99 was only recorded once in 1950
Upper Kalskag Bethel Census Area distance from Bering Sea- Upper Kuskokwim
Two of the selected communities, Cherfornak and Egegik, are described in some detail in order to flesh out how communities in this region are configured, what forces might be driving or contributing to population growth or decline, and how those forces might relate to ecosystem and climate change factors. The two communities were chosen as the closest to average of communities with a recent positive average annual population growth (Cherfornak) and the closest to average of those communities showing recent negative average annual population growth (Egegik).
Challenges to any analysis of demographic data in BSAI communities involve both Census data and the selection of communities. Census data on fishing occupations nationwide are problematic due to the low likelihood of a large enough number of fisherman to be randomly sampled in order to draw a composite profile (Hall-Arbor 2006), and the way in which the Census may categorize many fishermen as “self-employed.” In Alaska, there are other problems with Census data involving the high seasonality of
7
Draft Revised 03/01/07
residence, labor, and migration patterns. The U.S. Census counts populations based on place of residence on April 1 of the Census year, without differentiation between long-term residents and transient workers. In many fishing communities in Alaska, the population fluctuates greatly during the year according to the fishing season. Due to an influx of processing workers, salmon communities may have much higher populations in the summer, crab and groundfish communities in the winter. Those communities with the greatest intra-annual population variability are the least well represented by the Census methodology.
Finally, a nested scales analytical framework in fisheries social science (Sepez et al. 2006) recognizes that community demographics may be interarticulated with global processes. Population trends and migration patterns along the Bering Sea and Aleutian Islands obviously link this region to state centers and global networks. Seafood and labor markets connect BSAI communities to Anchorage and Seattle, as well as Manila and Michoacan, Tokyo and Oslo, and beyond. Large scale environmental factors such as climate change and pollution also have their effect. Focusing the study on regional place-based fishing communities means excluding these non-local communities that may affect and be affected by Bering Sea communities and fisheries. For the limited purposes of this project, these dynamics have been noted, but not substantially considered.
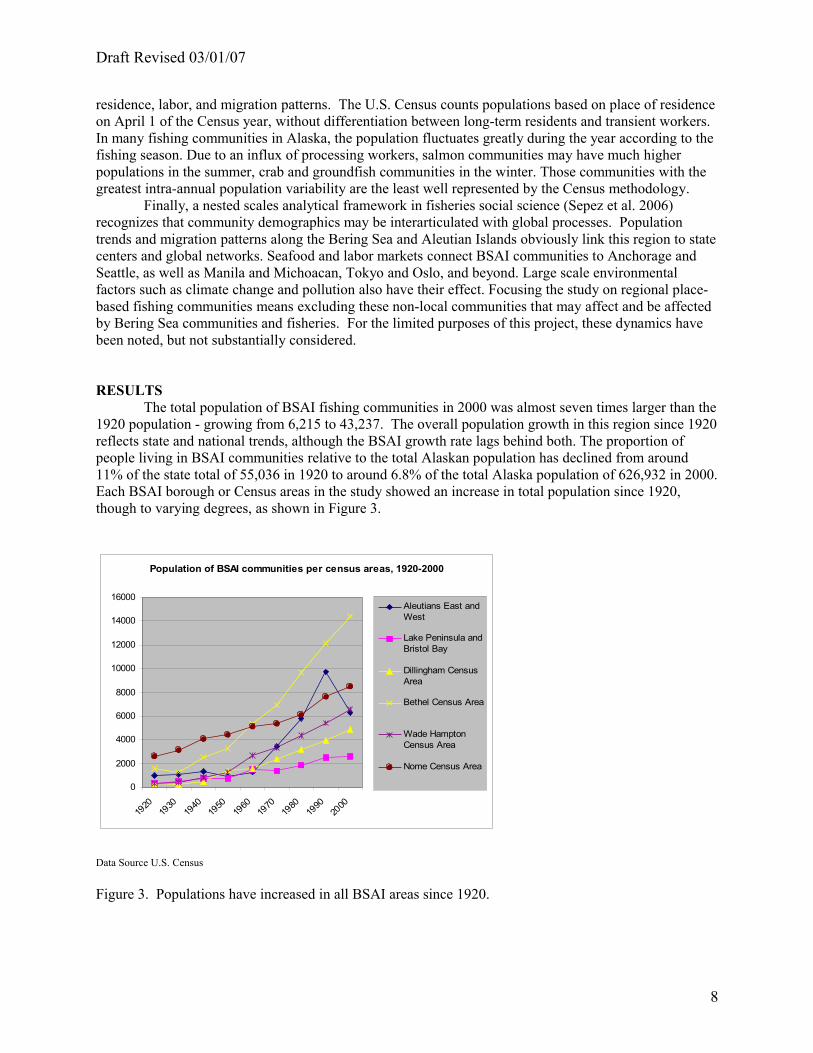
RESULTSThe total population of BSAI fishing communities in 2000 was almost seven times larger than the
1920 population - growing from 6,215 to 43,237. The overall population growth in this region since 1920 reflects state and national trends, although the BSAI growth rate lags behind both. The proportion of people living in BSAI communities relative to the total Alaskan population has declined from around 11% of the state total of 55,036 in 1920 to around 6.8% of the total Alaska population of 626,932 in 2000. Each BSAI borough or Census areas in the study showed an increase in total population since 1920, though to varying degrees, as shown in Figure 3.
Population of BSAI communities per census areas, 1920-2000
0
2000
4000
6000
8000
10000
12000
14000
16000
1920
1930
1940
1950
1960
1970
1980
1990
2000
Aleutians East andWest
Lake Peninsula andBristol Bay
Dillingham CensusArea
Bethel Census Area
Wade HamptonCensus Area
Nome Census Area
Data Source U.S. Census
Figure 3. Populations have increased in all BSAI areas since 1920.
8
Draft Revised 03/01/07
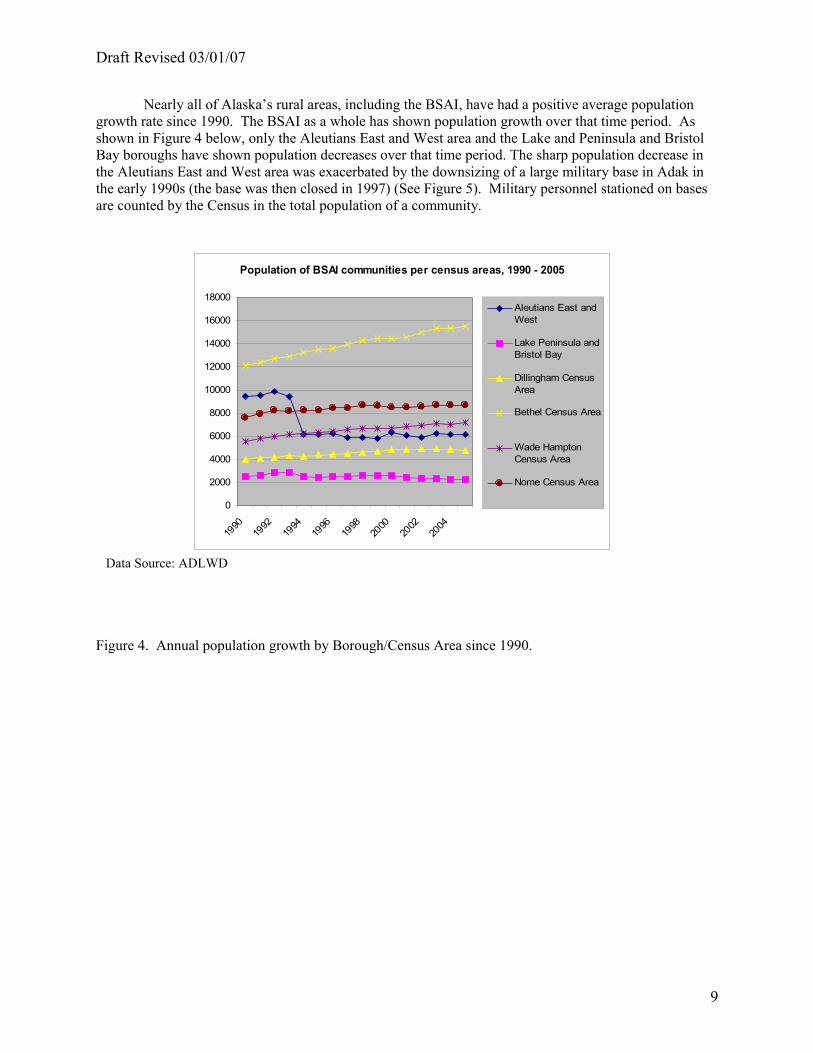
Nearly all of Alaska’s rural areas, including the BSAI, have had a positive average population growth rate since 1990. The BSAI as a whole has shown population growth over that time period. As shown in Figure 4 below, only the Aleutians East and West area and the Lake and Peninsula and Bristol Bay boroughs have shown population decreases over that time period. The sharp population decrease in the Aleutians East and West area was exacerbated by the downsizing of a large military base in Adak in the early 1990s (the base was then closed in 1997) (See Figure 5). Military personnel stationed on bases are counted by the Census in the total population of a community.
Population of BSAI communities per census areas, 1990 - 2005
0
2000
4000
6000
8000
10000
12000
14000
16000
18000
1990
1992
1994
1996
1998
2000
2002
2004
Aleutians East andWest
Lake Peninsula andBristol Bay
Dillingham CensusArea
Bethel Census Area
Wade HamptonCensus Area
Nome Census Area
Data Source: ADLWD
Figure 4. Annual population growth by Borough/Census Area since 1990.
9
Draft Revised 03/01/07
Average annual percent change of BSAI population by census areas, 1990 - 2005
-0.35
-0.33
-0.31
-0.29
-0.27
-0.25
-0.23
-0.21
-0.19
-0.17
-0.15
-0.13
-0.11
-0.09
-0.07
-0.05
-0.03
-0.01
0.01
0.03
0.05
0.07
0.09
0.11
Aleutians E&W total
LakePen/Bristol Total
Dillingham total
Wade Hampton Total
Nome Total
Bethel Area Total
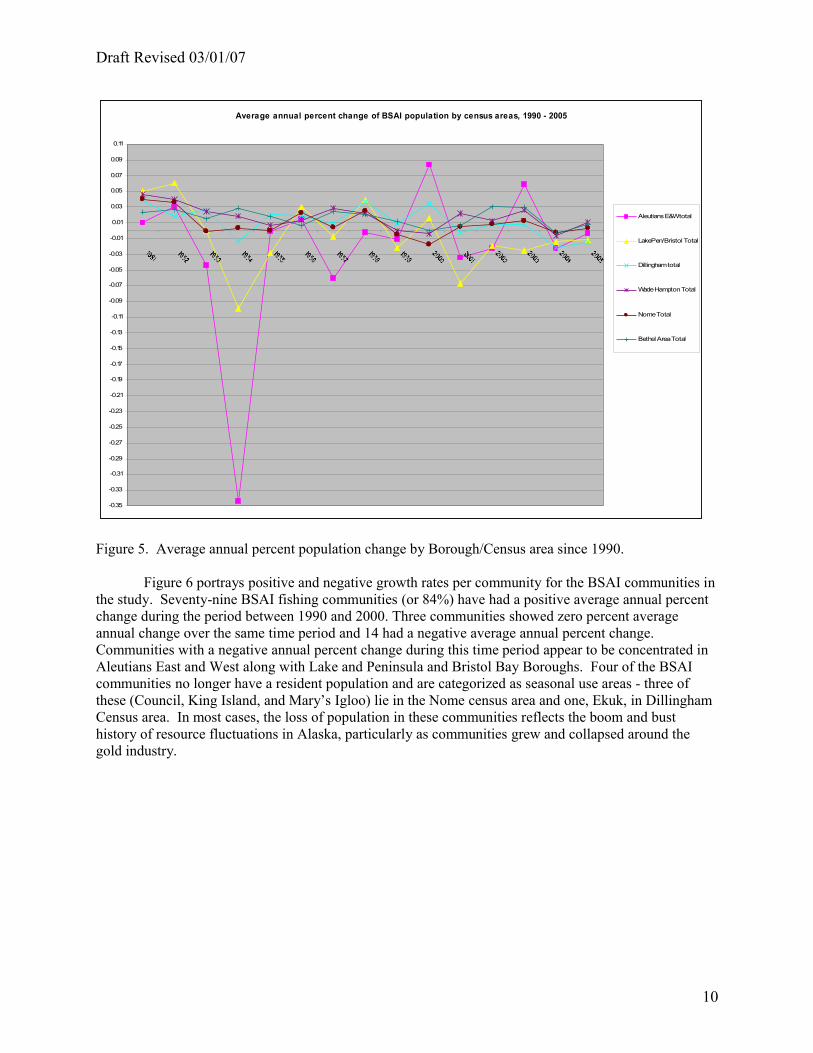
Figure 5. Average annual percent population change by Borough/Census area since 1990.
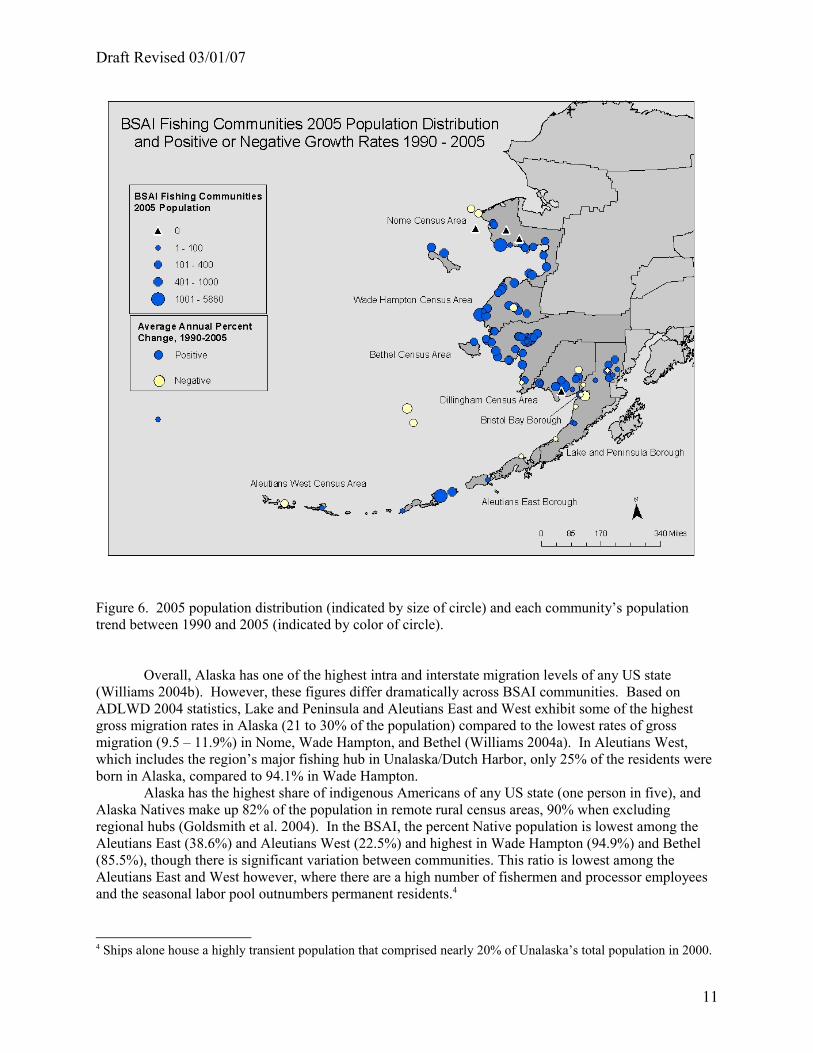
Figure 6 portrays positive and negative growth rates per community for the BSAI communities in the study. Seventy-nine BSAI fishing communities (or 84%) have had a positive average annual percent change during the period between 1990 and 2000. Three communities showed zero percent average annual change over the same time period and 14 had a negative average annual percent change. Communities with a negative annual percent change during this time period appear to be concentrated in Aleutians East and West along with Lake and Peninsula and Bristol Bay Boroughs. Four of the BSAI communities no longer have a resident population and are categorized as seasonal use areas - three of these (Council, King Island, and Mary’s Igloo) lie in the Nome census area and one, Ekuk, in Dillingham Census area. In most cases, the loss of population in these communities reflects the boom and bust history of resource fluctuations in Alaska, particularly as communities grew and collapsed around the gold industry.
10
Draft Revised 03/01/07
Figure 6. 2005 population distribution (indicated by size of circle) and each community’s population trend between 1990 and 2005 (indicated by color of circle).
Overall, Alaska has one of the highest intra and interstate migration levels of any US state (Williams 2004b). However, these figures differ dramatically across BSAI communities. Based on ADLWD 2004 statistics, Lake and Peninsula and Aleutians East and West exhibit some of the highest gross migration rates in Alaska (21 to 30% of the population) compared to the lowest rates of gross migration (9.5 – 11.9%) in Nome, Wade Hampton, and Bethel (Williams 2004a). In Aleutians West, which includes the region’s major fishing hub in Unalaska/Dutch Harbor, only 25% of the residents were born in Alaska, compared to 94.1% in Wade Hampton.
Alaska has the highest share of indigenous Americans of any US state (one person in five), and Alaska Natives make up 82% of the population in remote rural census areas, 90% when excluding regional hubs (Goldsmith et al. 2004). In the BSAI, the percent Native population is lowest among the Aleutians East (38.6%) and Aleutians West (22.5%) and highest in Wade Hampton (94.9%) and Bethel (85.5%), though there is significant variation between communities. This ratio is lowest among the Aleutians East and West however, where there are a high number of fishermen and processor employees and the seasonal labor pool outnumbers permanent residents.4
4 Ships alone house a highly transient population that comprised nearly 20% of Unalaska’s total population in 2000.
11
Draft Revised 03/01/07
Throughout the BSAI region, communities may loosely maintain hub-spoke relationships shaped by demographic, cultural, and infrastructure dynamics. Only five of the 94 BSAI communities have a population over 1000. Three of these communities, Dillingham, Nome, and Bethel, are counted as regional hubs by the State of Alaska -- meaning they serve as transportation, service, communication, and trade centers for surrounding villages. The other two communities are Hooper Bay -- a predominately Native Alaskan community that had an estimated population of 1,133 in 2005 and is characterized as a remote community due to its relative inaccessibility, and Unalaska -- a major fishing industry hub of 4,287 people. Although these larger towns represent only about 5% of the BSAI communities, they bear nearly 39% of the resident BSAI population. Around 61% of the population lives in 85 communities of under 1,000 people, located mostly in coastal and riverine areas. More than 60% of these communities have a population under 400. BSAI settlement show less population concentration in hub communities than other arctic regions; 2/3 of the total Arctic population is concentrated in relatively large settlements of over 5,000 (Bogoyavlenskiy et al. 2004).
DISCUSSIONThe two key factors affecting population growth rates anywhere are natural increase (birthrates
subtracting mortality), and migration. In fishing communities within the BSAI region both factors affect population dynamics, but they intersect in important ways with issues of seasonality and ethnicity.
High birth rates among Alaska Natives (50% higher than that of non-Natives) account for steady natural increase in many BSAI area populations (particularly Wade Hampton and Bethel), which serves to off-set out-migration from these areas. While relatively low for more industrial fishing areas like Unalaska, the average of births per 1,000 people in rural BSAI communities was well above the Census year 2000 national average of 14.1. In 2001, the birth rate in Wade Hampton was 27.3. With steady increases in the Alaska Native population, the Native labor force will be 40% larger in 2020 than it was in 2000 (Goldsmith et al. 2006).
Swift and dramatic changes in residency and migration patterns account for some of the region’s history of population trends and anomalies. The population of the BSAI region experienced disease-induced reduction of population similar to that all over Native North America following contact with Europeans, in this case Russian explorers and traders. Virtual enslavement and armed conflict between Aleuts and Russians were common in the Aleutians with the rise and fall of the fur trade, and led to the settlement of the previously unoccupied Pribilof Islands. In the Aleutian Islands, the population was literally decimated during this period, from an estimate of 12,000 in 1740 to 1,200 in 1800 (APIA 2004).
In the American period, the population of Alaska was low until it doubled with the gold rush at the end of the 19th century and it remained stable until WWII and the construction of the Alaska-Canadian Highway. Historically, the gold mining industry accounted for community growth, decline, and in some cases abandonment (e.g., Council and Mary’s Igloo) in the Nome area, while the fishing industry accounts for similar boom-bust dynamics in the Aleutians and Bethel, Dillingham, and Lake and Peninsula areas. Dutch Harbor/Unalaska expanded into an international hub of the fishing industry with the king crab boom in the 1960s. An acute drop in ex-vessel prices for salmon has been the most likely significant driver of negative population growth in the latter two Census Areas in the last decade. Unlike many other parts of the state, the oil and gas industry has not been a direct factor in BSAI population dynamics.
Since WWII, the military has been a significant source of migration in the state, and perhaps the most important factor in sudden population changes in the BSAI region. In the 1940’s Dutch Harbor housed a hastily developed, mixed military and civilian population of perhaps 40,000, several times the total population of the rest of the region. This dramatic population spike is not captured in the data because it fell between Census decades. Also in that time period, the Native population in the Aleutian Islands was dramatically redistributed following a forced evacuation of all Aleut villages by the U.S. military. After internment for the duration of the war in southeast Alaska, survivors were returned to the Aleutians, but a number of villages were never reconstituted (Kohlhoff 1995). The military population
12
Draft Revised 03/01/07
has declined from 10% of the total population of Alaska in 1990 to 7% in 2002. Downsizing and eventual closure of the military base closure in Adak accounts for Aleutians West population decline between 1992 and 1994, seen as a dramatic downward spike in Figure 5.
Patterns of human settlement and migration in Alaska have a long and continuing relationship to the availability of environmental resources – extending from small villages dependent on a mix of subsistence resources and wage labor, to the large population flows drawn by the fishing industry in industrial hubs like Unalaska. Generally, migration is an important coping strategy in the circumpolar North, where communities have long had to adapt to a highly dynamic environment. Studies of Arctic demography note, “the longevity of many Arctic cultures has been facilitated by adaptive responses such as migrations, rapid subsistence shifts, the development of new technologies, new economic practices, ecological manipulation, and other social and cultural transitions” (Robards and Alessa 2004: 416). The historical distribution of Native Alaskan settlements also depended upon the seasonality of subsistence resources, and migration was an effective adaptation to harsh, remote living conditions before this settlement pattern was replaced with more sedentary communities. Berardi (1999) describes the role played by schools in establishing permanent, or “persistent,” villages at many of these remote locations in the early 20th century. He notes that schools today “have become part of the system of public services and transfers that maintains these population centers where they would not otherwise be supported by resource-based production” (Berardi 1999:345).
Although remote communities have become more spatially rooted in the last hundred years in the BSAI, migration in response to ecological and economic opportunities is still a key adaptation in BSAI areas – if in unexpected ways. Given the history of communities that have lost a resident population to become seasonal use areas, one might expect to see a decline in other remote rural areas as people migrate to larger regional hubs or urban centers in search of employment and education, particularly in response to fluctuations in the fishing industry and the expansion or contraction of opportunities for people in small communities. The net effect of migration on growth in rural villages in Alaska is in fact negative. However, in many BSAI communities, positive growth rates dominate. These positive growth rates are likely driven by natural increase, with particularly high birth rates among Native Alaskans. In-migration by foreign-born workers is also a factor in fishing industry hub communities.
In the rural spoke communities, return migration is also a factor. In the Alaska version of the Todaro Paradox, Huskey et al. (2004) describe the out-migration of young Alaska Natives to urban centers for education and work opportunities, and the return migration to remote rural areas despite the high levels of unemployment there. This return migration is partly due to the social benefit of family networks, and the sustenance and income from subsistence activities which are most successful in natal villages where traditional environmental knowledge is an asset (Huskey et al. 2004). Recent research in Bristol Bay Borough (Dunkersloot 2006) suggests that demographic response to economic change in the salmon fishery there has led to decreased out-migration and higher birth rates among Alaska Native women. Since Alaska Native female out-migration accounts for current gender imbalances in many villages, changes in their migration patterns have consequences for population structure and cultural practices (Hamilton et al. 1997). Migration patterns point to the long-standing and growing ties between rural BSAI communities and urban spaces, and between BSAI communities and the BSAI ecosystem.
Marine socioeconomic studies suggest that migration may be a common dynamic among communities dependent on fisheries -- a highly mobile and often seasonal and annually variable resource. Dunkersloot demonstrates clear connections between migration patterns of the children of Native residents to spaces of urban opportunity and economic security arising from the prices of fish (Dunkersloot 2005). Perry and Sumaila (2006) draw from their research in West Africa to demonstrate how migration has long been “an integral part of the fish production system” that has been driven by the seasonality of fish availability along with economic opportunities. Although movement across national borders has often come with challenges, migration of fisherfolk in this region has enhanced the resilience of the fish production system to different scales and patterns of climate, resource, sociopolitical, and economic variability.
13
Draft Revised 03/01/07
Hub-spoke configurations may be characteristic of fishing communities in this region and more broadly. Hubs are large communities with a concentration of available services, such as Dillingham, Nome, Bethel and Unalaska. In the densely populated northeastern US, a recent participatory research project involving local fishing communities identified common concerns with fisheries infrastructure, finding that fishermen in smaller ports prioritized “access to a hub port” (Hall-Arber in press). Access to infrastructure is certainly a concern in Alaskan fishing communities as well, as communities have variable resources (ice facilities, docks, processing facilities) to participate in seasonal fishing industries. The relation between hubs and surrounding communities (economic, service, administrative, and demographic) deserves more research, as does the potential impact of CDQ programs in supporting the start and development of small processor plants and facilities in remote communities.5
BSAI communities are substantially tied to both subsistence and industrial fishing, though many small communities may operate on a scale that may be overlooked by regional or statewide research and administration. For example, fish processors in communities like Quinhagak and Chefornak may have a large local effect, but up until 2005 did not have a port code for the registration of annual government fish ticket reports. Community viability is an important consideration in small arctic communities as these places provide an important space for the flourishing of native Alaskan languages and culture and are important for the use and maintenance of natural resources, particularly due to place-based knowledge developed through a long history of adapting to the arctic environment.
Finally, the issue of seasonality also takes on significance in local demographic composition. As mentioned earlier, communities may swell with thousands of processor workers during peak fishing seasons. Research on social dynamics and impacts of the fishing industry in Unalaska argues that ‘resident’ becomes a contentious term when long-term locals become a minority with the influx of workers drawn to a fishing industry hub (Lowe 2006). Lowe draws from and refines prior social research in Unalaska to identify a continuum of ‘localness’ that is premised upon local observations of a person’s length of community stay largely based upon profession or type of involvement in the fishing industry. Lowe uses this continuum to examine the significance of place-based knowledge. We believe this typology has the potential to enable predictive measures of differential population level effects of changes in fisheries management, markets, climate regimes, or dynamics within subsistence and industrial fisheries. In assessing the community level impacts of climate change in northern Canada, Duerden (2004) observes that mining communities with a high population turnover and younger population perceive and react to environmental changes differently than largely native communities that are more stable and have a higher population of elders. In the case of BSAI communities, a continuum of residency may identify those populations more likely to ebb and flow with socioeconomic opportunities as opposed to those with other kinds of investment that are more entrenched in the community.
Community Examples: Chefornak and EgegikIn order to understand these population trends more concretely, we selected two communities,
Chrefornak and Egigik, for closer examination. To select these two, we first divided the communities into those showing positive average annual growth rates in the last 15 years and those showing negative average annual growth rates. We then selected the communities that were closest to the average in each group (see Figure 7).
5 The Coastal Villages Region Fund for example, has initiated small processing plants in Chefornak, Mekoryuk, Quinhagak, Tooksook Bay, Tununak, Hooper Bay, and Kipnuk. For some baseline socioeconomic data regarding the CDQ program, see Northern Economics, 2002.
14
Draft Revised 03/01/07
0
50
100
150
200
250
300
350
400
450
500
1990
1992
1994
1996
1998
2000
2002
2004
Egegik
Chefornak
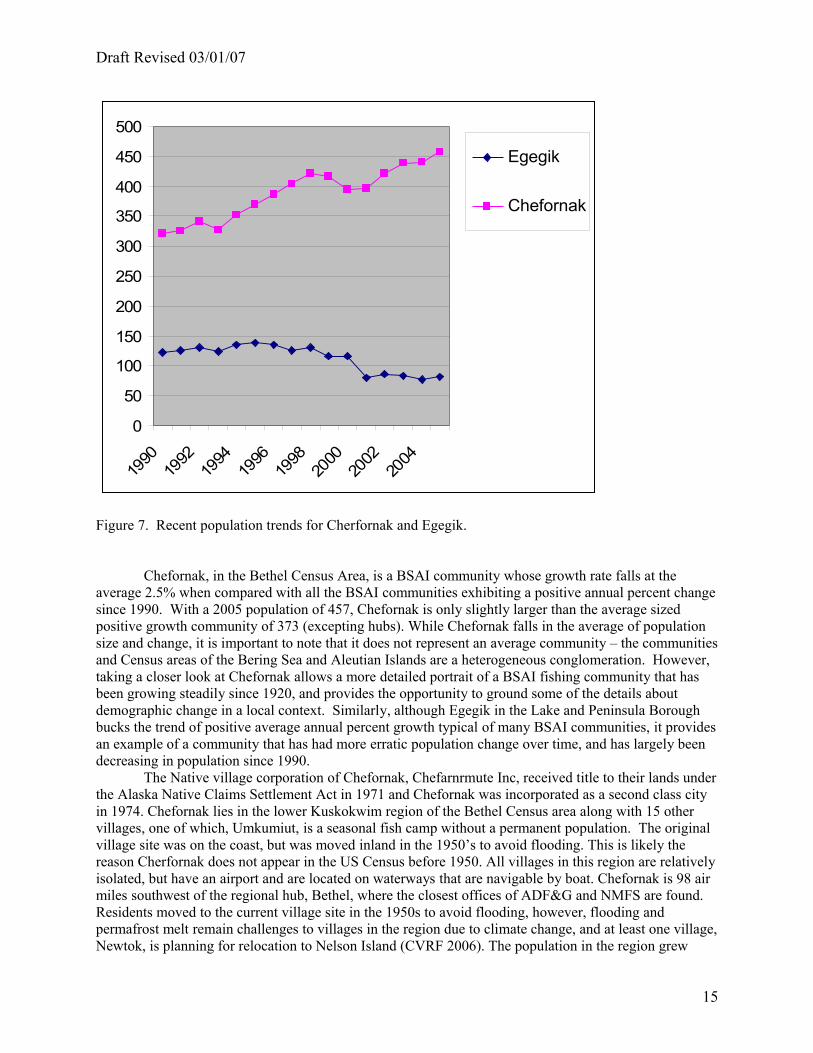
Figure 7. Recent population trends for Cherfornak and Egegik.
Chefornak, in the Bethel Census Area, is a BSAI community whose growth rate falls at the average 2.5% when compared with all the BSAI communities exhibiting a positive annual percent change since 1990. With a 2005 population of 457, Chefornak is only slightly larger than the average sized positive growth community of 373 (excepting hubs). While Chefornak falls in the average of population size and change, it is important to note that it does not represent an average community – the communities and Census areas of the Bering Sea and Aleutian Islands are a heterogeneous conglomeration. However, taking a closer look at Chefornak allows a more detailed portrait of a BSAI fishing community that has been growing steadily since 1920, and provides the opportunity to ground some of the details about demographic change in a local context. Similarly, although Egegik in the Lake and Peninsula Borough bucks the trend of positive average annual percent growth typical of many BSAI communities, it provides an example of a community that has had more erratic population change over time, and has largely been decreasing in population since 1990.
The Native village corporation of Chefornak, Chefarnrmute Inc, received title to their lands under the Alaska Native Claims Settlement Act in 1971 and Chefornak was incorporated as a second class city in 1974. Chefornak lies in the lower Kuskokwim region of the Bethel Census area along with 15 other villages, one of which, Umkumiut, is a seasonal fish camp without a permanent population. The original village site was on the coast, but was moved inland in the 1950’s to avoid flooding. This is likely the reason Cherfornak does not appear in the US Census before 1950. All villages in this region are relatively isolated, but have an airport and are located on waterways that are navigable by boat. Chefornak is 98 air miles southwest of the regional hub, Bethel, where the closest offices of ADF&G and NMFS are found. Residents moved to the current village site in the 1950s to avoid flooding, however, flooding and permafrost melt remain challenges to villages in the region due to climate change, and at least one village, Newtok, is planning for relocation to Nelson Island (CVRF 2006). The population in the region grew
15
Draft Revised 03/01/07
rapidly in the 1950s and although the growth rate has slowed, it has been steadily increasing in population. The area has historically been occupied by Yup’ik Eskimos and as of the 2000 census, 98% percent of Chefornak residents identified themselves as all or part Alaska Native. The median age in the community was 20.8 years, significantly younger than the US average of 35.3. Population growth has largely been due to high birth rates – in the Bethel Census Area in general, high birth rates have offset out-migration that would otherwise have factored as an annual average net loss of 6.8 people per 1,000 from 1991 to 2003 (DCED 2006). There are no foreign-born immigrants in Chefornak.
Like most of the Bethel Census Area, there is a large variation in unemployment rates in Chefornak over the course of the year due to the seasonal nature of the economic base which has been impacted in recent years by decreased salmon runs and falling prices. While residents from Chefornak and local villages rely on subsistence resources and seasonal commercial fishing work, the school district along with other government positions are often the largest year-round wage employers (Alaska DNR 2005). Chefornak has one school K-12 with 147 students and 8 teachers. The median per capita income of Chefornak residents in 2000 was $8474. Unemployment measured by standard national techniques was 7.9% with 33.7% not seeking employment, although actual unemployment and underemployment is likely higher. Chefornak has wells and septic tanks, but no piped water or sewage. Only 10% of households have plumbing.
Cherfornak has some involvement in commercial fisheries. Chefornak falls under the Coastal Villages Region Fund CDQ group, which describes the village as a distressed community with a 25.2% poverty rate (CVRF 2006). However, through the CDQ program, a halibut buying and processing operation was started in Chefornak, with plans to expand it in the coming years. Coastal Villages Seafood Inc. also processes a small amount of salmon and halibut in the community but until recently did not have a port code. Twenty-four out of 56 locally held commercial fishing permits were fished in 2000, and there were 8 vessel owners in residence from federal fisheries. There are no docking facilities in Cherfornak, although boats do operate in the area.
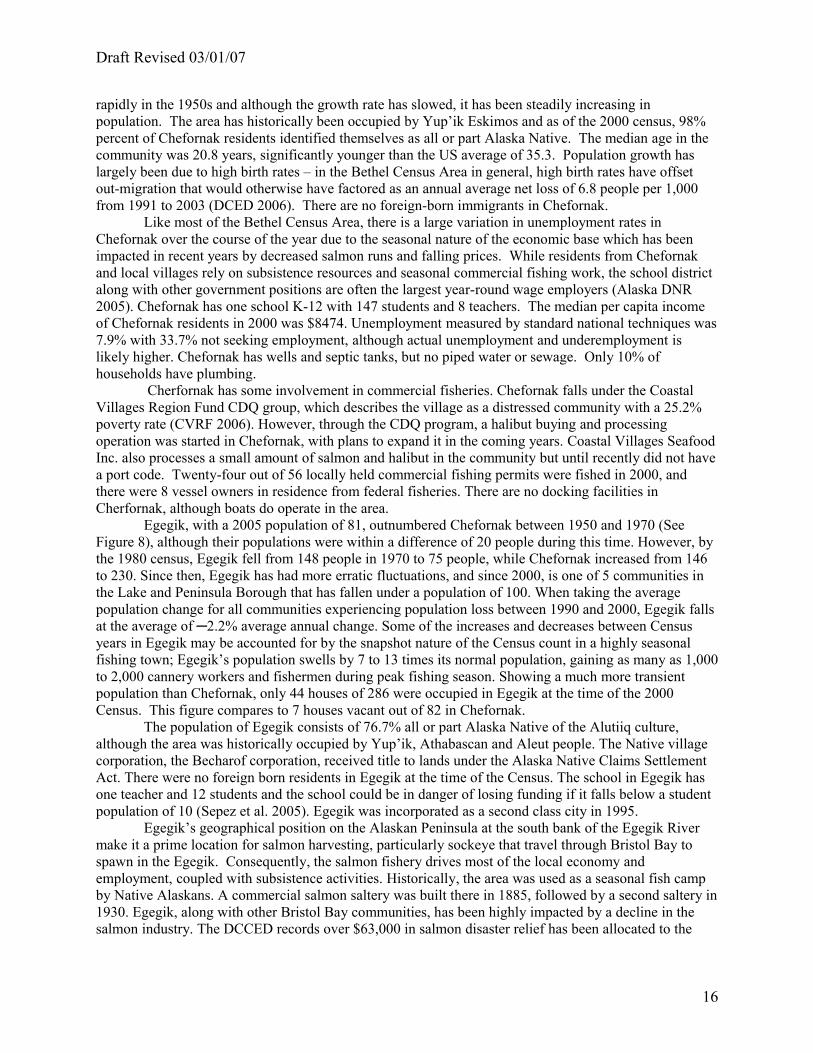
Egegik, with a 2005 population of 81, outnumbered Chefornak between 1950 and 1970 (See Figure 8), although their populations were within a difference of 20 people during this time. However, by the 1980 census, Egegik fell from 148 people in 1970 to 75 people, while Chefornak increased from 146 to 230. Since then, Egegik has had more erratic fluctuations, and since 2000, is one of 5 communities in the Lake and Peninsula Borough that has fallen under a population of 100. When taking the average population change for all communities experiencing population loss between 1990 and 2000, Egegik falls at the average of ─2.2% average annual change. Some of the increases and decreases between Census years in Egegik may be accounted for by the snapshot nature of the Census count in a highly seasonal fishing town; Egegik’s population swells by 7 to 13 times its normal population, gaining as many as 1,000 to 2,000 cannery workers and fishermen during peak fishing season. Showing a much more transient population than Chefornak, only 44 houses of 286 were occupied in Egegik at the time of the 2000 Census. This figure compares to 7 houses vacant out of 82 in Chefornak.
The population of Egegik consists of 76.7% all or part Alaska Native of the Alutiiq culture, although the area was historically occupied by Yup’ik, Athabascan and Aleut people. The Native village corporation, the Becharof corporation, received title to lands under the Alaska Native Claims Settlement Act. There were no foreign born residents in Egegik at the time of the Census. The school in Egegik has one teacher and 12 students and the school could be in danger of losing funding if it falls below a student population of 10 (Sepez et al. 2005). Egegik was incorporated as a second class city in 1995.
Egegik’s geographical position on the Alaskan Peninsula at the south bank of the Egegik River make it a prime location for salmon harvesting, particularly sockeye that travel through Bristol Bay to spawn in the Egegik. Consequently, the salmon fishery drives most of the local economy and employment, coupled with subsistence activities. Historically, the area was used as a seasonal fish camp by Native Alaskans. A commercial salmon saltery was built there in 1885, followed by a second saltery in 1930. Egegik, along with other Bristol Bay communities, has been highly impacted by a decline in the salmon industry. The DCCED records over $63,000 in salmon disaster relief has been allocated to the
16
Draft Revised 03/01/07
community. The Lake and Peninsula Borough has also received salmon disaster funds along with funds to mitigate the effects of closures designed to protect Steller sea lions.
0
50
100
150
200
250
300
350
400
450
1920
1930
1940
1950
1960
1970
1980
1990
2000
Egegik
Chefornak
Figure 8. Historic population trends for Cherfornak and Egegik.
There are five on-shore processors around Egegik, along with a number of floating processors. Forty-six of 72 permits were fished in 2000. Local fishing facilities include a number of private docks, a recently constructed public dock, a harbor for up to 150 vessels, a boat haul-out, and marine storage facilities. Other community facilities include a sewage and water system. About 50% of households had plumbing. There are scheduled air flights and charter flights to Egegik, along with barge service from Seattle. Unemployment at the time of the 2000 Census was 27.59%, with an additional 51% of adults not seeking work. The median per capita income was nearly twice that of Chefornak, at $16,352, and 6.9% of residents were living below the poverty level. Egegik is also a CDQ community under the Bristol Bay Economic Development Corporation.
Egegik, with its higher per capita income, much lower poverty levels, and more developed infrastructure and facilities, would seem like a more likely place to grow than Cherfornak if these factors drove population trends. Between 1950 and 1970, both villages appeared to be on a similar growth trajectory. The apparent sudden growth of Cherfornak prior to that is an effect of the entire village having moved a mile inland at that time and does not likely represent a population explosion. It is reasonable to assume that the pre-1950 trajectory of Cherfornak was similar to that of Egegik. What put them on such different paths after that?
Ecosystem FactorsThe explanation we propose is tied to the ecosystem: Egegik’s much greater dependence on
Bristol Bay salmon fisheries has been a key influence in its population history. Chefornak is not subject to
17
Draft Revised 03/01/07
the influence. At the time of the 2000 Census, Egegik had 39 salmon permit holders and a population of 116, or 34% of residents. This compares to Cherfornak with only 7 salmon permits in a population of 394 (or 2% of residents). Cherfornak residents appear to be involved more in halibut (27 permits) and herring (22 permits) fisheries. Egegik residents are also involved in these fisheries (10 halibut permits and 21 herring permits). Both communities are tied to other Bering Sea fisheries by participation in CDQ groups.
If reliance on commercial salmon fisheries is an important factor influencing the population in Egegik, we would expect to see population fluctuations that co-occur with significant events in the salmon fishery in the directions expected. That is in fact exactly what we see for Egegik. In 1974 the State implemented a limited entry management system in the salmon fisheries and this has been reported to have had severe negative effects on Native Alaskan participation in this fishery (Langdon 1980, Koslow 1986). The population in Egegik fell. The late 1980’s and early 1990’s were a boom era for salmon and salmon prices, perhaps accounting for the population increase at that time. The population in Egegik rose. Next came a sharp decline in salmon prices paid to harvest vessels, exacerbated in this region by a series of exceptionally low runs of the primary salmon species, sockeye (Oncorhynchus nerka), and a return to negative population growth for Egegik.
Recent research in Bristol Bay Borough villages suggests that salmon prices are in fact a key indicator of demographic patterns in the area, though the specific patterns are intertwined in complicated ways with age, ethnicity, and gender (Dunkersloot 2005, 2006). When we selected Chefornak and Egegik for more detailed examination, we had no idea that we would find such a rich contrast. We merely wanted to look at the average places for both positive and negative trends. The fact that we found something suggesting such a strong connection to ecosystem factors implies that further examination of communities could be very productive for the long term goal of modeling BSAI human population dynamics. Demographic models can then be integrated with various scenarios for regional effects of global climate change. Given the sensitivity of population in this region to ecosystem factors, it is indubitable that climate change is going to affect population.
Based on our knowledge of this area and these preliminary results, we believe there are several dimensions on which it will be most productive to focus at first. For ecosystem factors these are the price and availability of commercial fish species. Other ecosystem factors that are very important in climate change scenarios, such as extent and seasonality of sea ice and effects on marine mammals and subsistence fish species will likely to be less important to demographic change unless they indirectly affect the price or availability of commercial fish.
For community factors, the most productive avenue will be to classify communities as either hub or a spoke, based either on total population or on the presence of major seafood processing operations or not. The directionality of effects may differ greatly depending on this classification. These hub spoke classifications may need to be tempered with some understanding of how places are affected by the Community Development Quota program – a fisheries allocation program that facilitates participation of small local communities in the commercial harvest and processing of fish.
For social characteristics, it will be important to look at the structure of a community in terms of gender, indigeneity and employment status. These social characteristics can be used not only to characterize changing population structure, but also to refine the predicted demographic responses in of communities according the known behavioral characteristics of these populations. For example, transient processing workers will be more likely to leave hub communities under negative ecological conditions, while Native families are more likely to seek refuge in kin-based communities. Reproductive rates among women will also vary according to educational opportunities and other migration multipliers that seem to co-vary with economic success.
Another dimension to modeling the demographic effects of climate change in the Bering Sea and Aleutian Islands will be to add a spatially explicit dimension. A prediction of stable availability of a certain type of fish for the region as a whole could actually mask a situation where more southerly ports no longer had efficient access to those stocks and more northerly ports had a great increase in access. This could be facilitated by longer ice-free seasons for more northerly ports and increased shipping along
18

Draft Revised 03/01/07
northerly routes. However, such spatially explicit predictions about commercial fish stocks are not available for this region at this time and are likely to take years to develop.
Research methods will include retrospective modeling to uncover more correlations between observed trends and ecosystem events, ethnographic field work to untangle connections between individual characteristics and migration and reproduction behaviors. As bioeconomic models for climate change in this important resource dependent area are developed and refined, demographic models can be developed right along with them.
ConclusionThis study demonstrated that the BSAI has experienced regional population growth in recent
years (since 1990), and population growth as a longer term trend (since 1920). However, this growth has not been experienced uniformly by all communities or all boroughs (and Census areas). Although there is a net outmigration from rural Alaska, many rural communities in the BSAI are experiencing growth. Much of this growth is driven by a high birth rate among Native Alaskans. In-migration consists of both a return migration to Alaska Native villages from urban areas and in-migration to fishing community hubs driven by fishing industry dynamics.
Commercial fishing is also a key factor in understanding those communities which have kept pace with regional growth. Population loss is seen most clearly in the Lake and Peninsula and Bristol Bay Boroughs, also likely in response to fishing industry dynamics. These salmon dependent areas saw demographic responses to two key ecosystem factors: availability of fish and market prices of fish. Although these particular effects were not caused by global climate change, they offer an insight into the some of the key forces that will drive total population, population distribution, and population structure in the future. The next step in this research process will be to model how these findings will be affected by global climate change. As various climate change scenarios emerge from biological and economic sciences predicting ranges of specific changes in these two key ecosystem factors, demographic responses can also be predicted.
Population decline or growth in small communities can have a variety of impacts, as demographic information affects decision-making in government and private fields, and factors into health care provision, education, land use, environmental impacts, transportation, and other social services (Williams 2004a). Over 36% of federal dollars allocated to Alaska depend in some way on population, and CDQ quota shares are also provisioned in relation to population numbers. In the Gulf of Alaska, local community organization leaders have argued that the loss of fishing jobs due to salmon limited entry programs has led to population decline coupled with other social problems, including the perception of diminished local educational opportunities (Christiansen 2000). A baseline of demographic data and its analysis in relation to other socio-economic and ecological factors can provide a means for evaluating such claims and for assessing how and in what situations demographic change intersects with other scales of change over time, what Robards and Alessa (2004) term “timescapes” of change – the often nonlinear relationships between demographic, social, ecological, seasonal, and institutional dynamics.
19
Draft Revised 03/01/07
REFERENCES CITED
Aarsaether, N., and J. O. Baerenholdt. 2004. Chapter 8: Community Viability. Arctic Human Development Report. Akureyri: Stefansson Arctic Institute, Iceland.
Alaska Department of Commerce and Economic Development (DCED). 2006. Bethel Census Area: Economic Overview. Available at http://www.dced.state.ak.us/dca/AEIS/Bethel/General/Bethel_General_Narrative.htm, Accessed August 2006.
Alaska Department of Labor and Workforce Development. 2005. Place Estimates 2000-2005. Table 4.3 Alaska Places by Borough and Census Area 2000-2005, [Online]. Available: URL: http://www.labor.state.ak.us/research/pop/estimates/05t4-3x.xls (access 25 July 2006).
Alaska Department of Natural Resources (DNR). 2005. Cenaliulriit Coastal Resource Service Area Coastal Management Plan Public Review Draft June 2005 Chapter 6: Resource Inventory, Analysis and Area Designations. Available at http://www.dnr.state.ak.us/acmp/District/Plans/Cenaliulriit/11-Chapter%206-Inventory.pdf
Aleut Pribiliof Islands Association (APIA). 2004. Aleut History and Timeline. Available at URL: http://www.apiai.com/history.asp?page=history (accessed September 27, 2006).
Berardi, G. 1999. Schools, Settlement, and Sanitation in Alaska Native Villages. Ethnohistory 46:329-359.
Bogoyavlenskiy, D. and A. Siggner. 2004. Chapter 2: Arctic Demography. Arctic Human Development Report. Akureyri: Stefansson Arctic Institute, Iceland.
Christiansen, F. 2000. Chairman of the Gulf of Alaska Coastal Communities Coalition (GOACC) speech to the senate about implementation of 1996 amendments to the Magnuson-Stevens Act, January 2000. URL: http://commerce.senate.gov/hearings/0118chr.pdf, Accessed August 2006.
Coastal Villages Region Fund (CVRF). 2006. 2006-2008 CDQ Program Application. URL: http://www.dced.state.ak.us/bsc/CDQ/pub/CDQ_CV_CDP_2006.pdf, Accessed August 2006.
Duerden, F. 2004. Translating Climate Change Impacts at the Community Level. Arctic 57:204-212.
Dunkersloot, Rachel. 2006. “Social Change and the Lifepaths of Young Alaskans” Paper presented at Alaska’s Fishing Communities: Harvesting the Future Conference, Anchorage Alaska, March 21-22, 2006.
Dunkersloot, Rachel. 2005. Ecological Crisis, Social change, and the Lifepaths of young Alaskans. An Analysis of Shifting Patterns in Human-Environment Interaction in the Fisheries Dependent Region in Bristol Bay, Alaska. Master’s Thesis. University of Montana. Missoula.
Goldsmith, S., J. Angvik, L. Howe, A. Hill, and L. Leask. 2004. The Status of Alaska Natives Report, Volume I. Anchorage: Institute of Social and Economic Research, University of Alaska.
Goldsmith, S., et al. 2006. Understanding Alaska: People, Economy, and Resources. Anchorage: University of Alaska, Institute of Social and Economic Research. URL: www.alaskaneconomy.uaa.alaska.edu. Accessed August 2006.
20
Draft Revised 03/01/07
Hamilton, L.C., C.L. Seyfrit, and C. Bellinger. 1997. Environment and Sex Rations among Alaska Natives: An Historical Perspective. Population and Environment 18(3): 283-299.
Huskey, L., M. Berman, and A. Hill. 2004. Leaving Home, Migration as a labor market choice for Alaska Natives. The Annals of Regional Science 38:75-92.
Hall-Arber, M. In press. The Community Panels Project: Citizens’ Groups for Social Science Research and Monitoring. National Association of Practicing Anthropologists Bulletin 27.
Kohloff, Dean. 1995. When the Wind was a River: Aleut Evacuation in World War II. Seattle: University of Washington Press.
Koslow J. A. 1986. Limited Entry Policy and Impacts on Bristol Bay Fishermen. In: Contemporary Alaskan Native Economies. S. J. Langdon (ed.). University Press of America, Lanham, Md., pp. 47-62.
Langdon, S. J. 1980. Transfer Patterns in Alaskan Limited Entry Fisheries. Final Report for the Limited Entry Study Group of the Alaska Legislature, Juneau: State of Alaska.
Lowe, M. 2006. The Impact of Industrial Fishing on Localized Social and Environmental Change in Alaska’s Aleutian Islands. Dissertation in Anthropology, Columbia University.
Northern Economics, Inc. 2002. An Assessment of the Socioeconomic Impacts of the Western Alaska Community Development Quota Program. Report prepared for the Alaska Department of Community and Economic Development Division of Community and Business Development.
Perry, R. I., and U. R. Sumaila. 2006. Marine Ecosystem Variability and Human Community Responses: The Example of Ghana, West Africa. Forthcoming in Marine Policy
Robards, M., and L. Alessa. 2004. Timescapes of Community Resilience and Vulnerability in the Circumpolar North. Arctic 57: 415-427.
Williams, J. G. 2005. Projections for Alaska Population 2005-2029.
Williams, J. G. 2004a. Alaska Population Overview: 2001-2002 Estimates and Census 2000. The State of Alaska Department of Labor and Workforce Development, Research and Analysis Section, Demographics Unit.
Williams, J. G. 2004b. Migration. Alaska Economic Trends. July: 3-12
Williams, J. G. 2000. Alaska Population Overview: 1999 Estimates. The State of Alaska Department of Labor and Workforce Development, Research and Analysis Section, Demographics Unit
Sepez, J.A., B.D. Tilt, C.L. Package, H.M. Lazrus, and I Vaccaro. (2005). Community Profiles for North Pacific Fisheries- Alaska. NOAA Technical Memorandum NMFS-AFSC-160, 552 pp.
Sepez, J., K. Norman, A. Poole and B. Tilt. 2006. Fish Scales: Scale and Method in Social Science Research for North Pacific and West Coast Fishing Communities. Human Organization 65(3):283-296.
21

Draft Revised 03/01/07
The State of Alaska Department of Commerce, Community, and Economic Development (DCCED) website and online community database. URL: http://www.commerce.state.ak.us/dca/commdb/CF_COMDB.htm, Accessed June – September, 2006.
22