Micro and macronutrients in the southeastern Bering Sea: Insight into iron-replete and iron-depleted...
28
Micro- and macronutrients in the southeastern Bering Sea: Insight into iron-replete and iron-depleted regimes Ana M. Aguilar-Islas a, * , Matthew P. Hurst b , Kristen N. Buck a , Bettina Sohst a , Geoffrey J. Smith a , Maeve C. Lohan c , Kenneth W. Bruland a a Department of Ocean Sciences, University of California Santa Cruz, 1156 High Street, Santa Cruz, CA 95060, United States b Department of Chemistry, Humboldt State University, 1 Harpst Street, Arcata, CA 95521, United States c School of Earth, Ocean and Environmental Science, University of Plymouth, Portland Square, Plymouth PL4 8AA, UK Received 23 October 2006; accepted 27 December 2006 Available online 1 March 2007 Abstract Surface transects and vertical profiles of macronutrients, dissolved iron (D-Fe), and dissolved manganese (D-Mn) were investigated during August 2003 in the southeastern Bering Sea. We observed iron-limited, HNLC surface waters in the deep basin of the Bering Sea (15–20 lmol/kg nitrate, 0.07 nmol/kg D-Fe, and 61.0 nmol/kg D-Mn); nitrate-limited, iron-replete surface waters over the shelf (<0.1 lmol/kg nitrate, 0.5–4 nmol/kg D-Fe, and 2–33 nmol/kg D-Mn); and high biomass at the shelf break (‘‘Green Belt’’), where diatoms appeared to have been stressed by low D-Fe concentrations (<0.3 nmol/kg). Sources of nitrate and iron to the Green Belt were investigated. A mixture of Aleutian North Slope Cur- rent water (with elevated, but non-sufficient iron concentrations relative to its high nitrate concentrations) and surface waters from the vicinity of the Bering Canyon (with lower nitrate concentrations, but similar dissolved iron concentrations) was carried along the shelf break by the Bering Slope Current. This water mixture provided macro- and micronutrients at the southern end of the shelf break. The oceanic domain supplied additional macronutrients to Green Belt waters, while the bottom layer of the outer shelf domain supplied additional macro- and micronutrients through enhanced vertical mix- ing at the shelf break. Surface waters near the Pribilof Islands, where the highest surface D-Fe concentrations were observed (5–6 nmol/kg), represent a potential source of additional iron to Green Belt waters. During summer, the sub- surface water of the middle shelf domain is a potential source of nitrate to the nitrate depleted waters of the shelf. In this subsurface cool pool, we observed evidence of substantial denitrification with lower than expected nitrate concentrations. Ó 2007 Elsevier Ltd. All rights reserved. Keywords: Dissolved iron, Dissolved manganese; Nutrients; HNLC region; Trace metals; Regional index: USA, Alaska, southeastern Bering Sea 0079-6611/$ - see front matter Ó 2007 Elsevier Ltd. All rights reserved. doi:10.1016/j.pocean.2006.12.002 * Corresponding author. Tel.: +1 831 459 2682; fax: +1 831 459 4882. E-mail address: [email protected] (A.M. Aguilar-Islas). Progress in Oceanography 73 (2007) 99–126 Progress in Oceanography www.elsevier.com/locate/pocean
Transcript of Micro and macronutrients in the southeastern Bering Sea: Insight into iron-replete and iron-depleted...
Progress in Oceanography 73 (2007) 99–126
Progress inOceanography
www.elsevier.com/locate/pocean
Micro- and macronutrients in the southeastern BeringSea: Insight into iron-replete and iron-depleted regimes
Ana M. Aguilar-Islas a,*, Matthew P. Hurst b, Kristen N. Buck a, Bettina Sohst a,Geoffrey J. Smith a, Maeve C. Lohan c, Kenneth W. Bruland a
a Department of Ocean Sciences, University of California Santa Cruz, 1156 High Street, Santa Cruz, CA 95060, United Statesb Department of Chemistry, Humboldt State University, 1 Harpst Street, Arcata, CA 95521, United States
c School of Earth, Ocean and Environmental Science, University of Plymouth, Portland Square, Plymouth PL4 8AA, UK
Received 23 October 2006; accepted 27 December 2006Available online 1 March 2007
Abstract
Surface transects and vertical profiles of macronutrients, dissolved iron (D-Fe), and dissolved manganese (D-Mn) wereinvestigated during August 2003 in the southeastern Bering Sea. We observed iron-limited, HNLC surface waters in thedeep basin of the Bering Sea (15–20 lmol/kg nitrate, �0.07 nmol/kg D-Fe, and 61.0 nmol/kg D-Mn); nitrate-limited,iron-replete surface waters over the shelf (<0.1 lmol/kg nitrate, 0.5–4 nmol/kg D-Fe, and 2–33 nmol/kg D-Mn); and highbiomass at the shelf break (‘‘Green Belt’’), where diatoms appeared to have been stressed by low D-Fe concentrations(<0.3 nmol/kg). Sources of nitrate and iron to the Green Belt were investigated. A mixture of Aleutian North Slope Cur-rent water (with elevated, but non-sufficient iron concentrations relative to its high nitrate concentrations) and surfacewaters from the vicinity of the Bering Canyon (with lower nitrate concentrations, but similar dissolved iron concentrations)was carried along the shelf break by the Bering Slope Current. This water mixture provided macro- and micronutrients atthe southern end of the shelf break. The oceanic domain supplied additional macronutrients to Green Belt waters, whilethe bottom layer of the outer shelf domain supplied additional macro- and micronutrients through enhanced vertical mix-ing at the shelf break. Surface waters near the Pribilof Islands, where the highest surface D-Fe concentrations wereobserved (�5–6 nmol/kg), represent a potential source of additional iron to Green Belt waters. During summer, the sub-surface water of the middle shelf domain is a potential source of nitrate to the nitrate depleted waters of the shelf. In thissubsurface cool pool, we observed evidence of substantial denitrification with lower than expected nitrate concentrations.� 2007 Elsevier Ltd. All rights reserved.
Keywords: Dissolved iron, Dissolved manganese; Nutrients; HNLC region; Trace metals; Regional index: USA, Alaska, southeasternBering Sea
0079-6611/$ - see front matter � 2007 Elsevier Ltd. All rights reserved.
doi:10.1016/j.pocean.2006.12.002
* Corresponding author. Tel.: +1 831 459 2682; fax: +1 831 459 4882.E-mail address: [email protected] (A.M. Aguilar-Islas).
100 A.M. Aguilar-Islas et al. / Progress in Oceanography 73 (2007) 99–126
1. Introduction
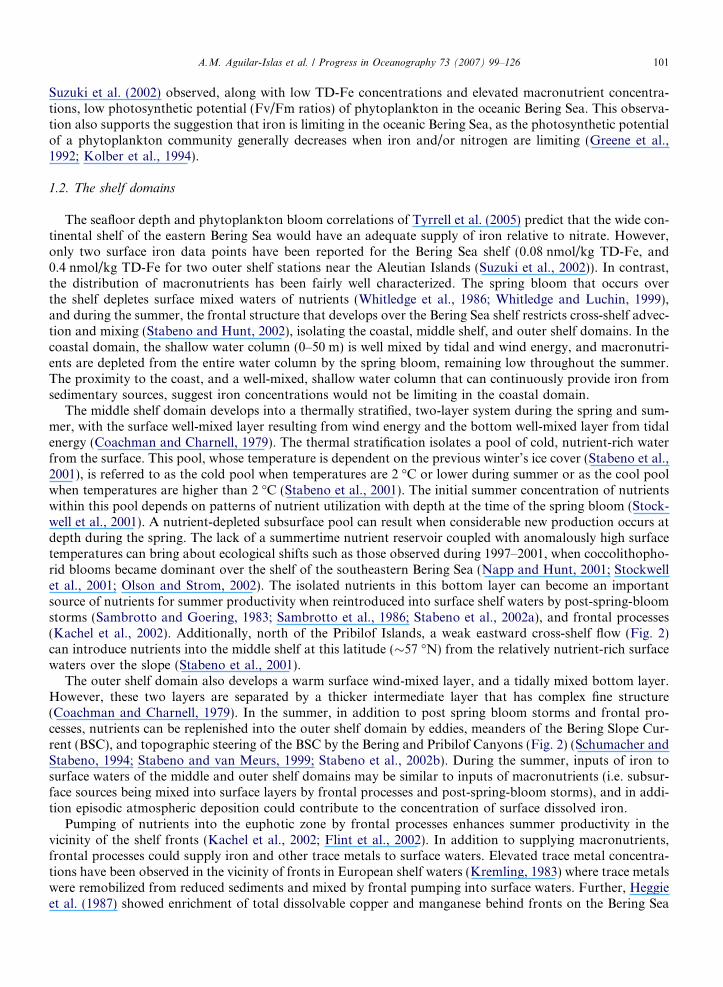
The Bering Sea area is almost equally divided by the shelf break into a deep basin and an extensive (600 kmwide) continental shelf lacking topographic features other than a few islands (Fig. 1). During the summer,wind and tidal energy lead to the formation of three well defined hydrographic domains over the broad shelf;the coastal domain (0–50 m depth), the middle domain (50–100 m depth), and the outer domain (100–170 mdepth) (Coachman and Charnell, 1979; Coachman, 1986) (Fig. 1). These domains are separated by the innerfront and middle front, or middle transition zone (Coachman and Charnell, 1979; Coachman, 1986; Stabenoet al., 2001). The inner front, centered near the 50 m isobath, forms the boundary between the typically ver-tically mixed shallow coastal domain and the two-layered middle shelf domain. The middle front, centerednear the 100 m isobath, forms the boundary between the middle shelf domain and the outer shelf domain.An additional front, the shelf break front, centered near the 170 m isobath, separates the outer domain fromthe deep basin (�3500 m) or oceanic domain.
The oceanic domain of the Bering Sea has been suggested to be a high-nutrient low-chlorophyll (HNLC)regime (Banse and English, 1999; Tyrrell et al., 2005), while the continental shelf is one of the most productiveareas of the world ocean (Walsh et al., 1989). The general pattern of summertime primary productivity in theBering Sea consists of low productivity in surface waters of the deep basin, high and sustained productivity atthe shelf break, and decreasing productivity from the shelf break towards the coast (Springer et al., 1996).
1.1. The oceanic domain
Satellite data and models suggest that the HNLC conditions observed in the oceanic domain of the BeringSea result from iron limitation (Banse and English, 1999; Fung et al., 2000; Moore et al., 2002), as is the casefor other HNLC subarctic North Pacific regimes such as the Gulf of Alaska (Martin and Fitzwater, 1988;Boyd et al., 2004). Scarce iron data (Fujishima et al., 2001; Suzuki et al., 2002; Takata et al., 2005) and limitedshipboard incubation experiments (Leblanc et al., 2005; Peers et al., 2005) also suggest the oceanic regime isunder iron limitation. In the surface mixed layer of the oceanic domain Fujishima et al. (2001) (two stations)and Takata et al. (2005) (one station) measured relatively low dissolved iron (D-Fe) concentrations (<0.3–0.7 nmol/kg and 0.1–0.3 nmol/kg, respectively), while Suzuki et al. (2002) (three stations) observed low totaldissolvable iron (TD-Fe) (samples acidified to pH 3.2 without filtration) concentrations (0.03–0.4 nmol/kg).Leblanc et al. (2005) and Peers et al. (2005) obtained marked increases in chlorophyll a (Chl a) in shipboardincubations when amending surface water samples from the oceanic Bering Sea with iron. Additionally,
Fig. 1. Map of surface transects and stations. Hydrographic, macro- and micronutrient data were collected along surface transects.Hydrographic and nutrient (except for Stations 3, 7, 9, 29, and 35) data were collected at all stations. Trace metals were collected atstations shown in yellow.
A.M. Aguilar-Islas et al. / Progress in Oceanography 73 (2007) 99–126 101
Suzuki et al. (2002) observed, along with low TD-Fe concentrations and elevated macronutrient concentra-tions, low photosynthetic potential (Fv/Fm ratios) of phytoplankton in the oceanic Bering Sea. This observa-tion also supports the suggestion that iron is limiting in the oceanic Bering Sea, as the photosynthetic potentialof a phytoplankton community generally decreases when iron and/or nitrogen are limiting (Greene et al.,1992; Kolber et al., 1994).
1.2. The shelf domains
The seafloor depth and phytoplankton bloom correlations of Tyrrell et al. (2005) predict that the wide con-tinental shelf of the eastern Bering Sea would have an adequate supply of iron relative to nitrate. However,only two surface iron data points have been reported for the Bering Sea shelf (0.08 nmol/kg TD-Fe, and0.4 nmol/kg TD-Fe for two outer shelf stations near the Aleutian Islands (Suzuki et al., 2002)). In contrast,the distribution of macronutrients has been fairly well characterized. The spring bloom that occurs overthe shelf depletes surface mixed waters of nutrients (Whitledge et al., 1986; Whitledge and Luchin, 1999),and during the summer, the frontal structure that develops over the Bering Sea shelf restricts cross-shelf advec-tion and mixing (Stabeno and Hunt, 2002), isolating the coastal, middle shelf, and outer shelf domains. In thecoastal domain, the shallow water column (0–50 m) is well mixed by tidal and wind energy, and macronutri-ents are depleted from the entire water column by the spring bloom, remaining low throughout the summer.The proximity to the coast, and a well-mixed, shallow water column that can continuously provide iron fromsedimentary sources, suggest iron concentrations would not be limiting in the coastal domain.
The middle shelf domain develops into a thermally stratified, two-layer system during the spring and sum-mer, with the surface well-mixed layer resulting from wind energy and the bottom well-mixed layer from tidalenergy (Coachman and Charnell, 1979). The thermal stratification isolates a pool of cold, nutrient-rich waterfrom the surface. This pool, whose temperature is dependent on the previous winter’s ice cover (Stabeno et al.,2001), is referred to as the cold pool when temperatures are 2 �C or lower during summer or as the cool poolwhen temperatures are higher than 2 �C (Stabeno et al., 2001). The initial summer concentration of nutrientswithin this pool depends on patterns of nutrient utilization with depth at the time of the spring bloom (Stock-well et al., 2001). A nutrient-depleted subsurface pool can result when considerable new production occurs atdepth during the spring. The lack of a summertime nutrient reservoir coupled with anomalously high surfacetemperatures can bring about ecological shifts such as those observed during 1997–2001, when coccolithopho-rid blooms became dominant over the shelf of the southeastern Bering Sea (Napp and Hunt, 2001; Stockwellet al., 2001; Olson and Strom, 2002). The isolated nutrients in this bottom layer can become an importantsource of nutrients for summer productivity when reintroduced into surface shelf waters by post-spring-bloomstorms (Sambrotto and Goering, 1983; Sambrotto et al., 1986; Stabeno et al., 2002a), and frontal processes(Kachel et al., 2002). Additionally, north of the Pribilof Islands, a weak eastward cross-shelf flow (Fig. 2)can introduce nutrients into the middle shelf at this latitude (�57 �N) from the relatively nutrient-rich surfacewaters over the slope (Stabeno et al., 2001).
The outer shelf domain also develops a warm surface wind-mixed layer, and a tidally mixed bottom layer.However, these two layers are separated by a thicker intermediate layer that has complex fine structure(Coachman and Charnell, 1979). In the summer, in addition to post spring bloom storms and frontal pro-cesses, nutrients can be replenished into the outer shelf domain by eddies, meanders of the Bering Slope Cur-rent (BSC), and topographic steering of the BSC by the Bering and Pribilof Canyons (Fig. 2) (Schumacher andStabeno, 1994; Stabeno and van Meurs, 1999; Stabeno et al., 2002b). During the summer, inputs of iron tosurface waters of the middle and outer shelf domains may be similar to inputs of macronutrients (i.e. subsur-face sources being mixed into surface layers by frontal processes and post-spring-bloom storms), and in addi-tion episodic atmospheric deposition could contribute to the concentration of surface dissolved iron.
Pumping of nutrients into the euphotic zone by frontal processes enhances summer productivity in thevicinity of the shelf fronts (Kachel et al., 2002; Flint et al., 2002). In addition to supplying macronutrients,frontal processes could supply iron and other trace metals to surface waters. Elevated trace metal concentra-tions have been observed in the vicinity of fronts in European shelf waters (Kremling, 1983) where trace metalswere remobilized from reduced sediments and mixed by frontal pumping into surface waters. Further, Heggieet al. (1987) showed enrichment of total dissolvable copper and manganese behind fronts on the Bering Sea

Fig. 2. A schematic of upper flow on the southeastern Bering Sea during summer (after Reed and Stabeno, 1999; Stabeno et al., 2001;Stabeno and Hunt, 2002).
102 A.M. Aguilar-Islas et al. / Progress in Oceanography 73 (2007) 99–126
shelf and demonstrated that the enrichment of these metals in the water column was due to their solubilizationat the sediment/water interface. Sediments over the Bering Sea shelf during the summer are rich in organicmatter derived from the spring bloom (Sambrotto et al., 1986; Stabeno and Hunt, 2002); and, suboxic/anoxicconditions develop within the surface sediments (Devol et al., 1997) to provide a source of reduced trace met-als, such as dissolved manganese (D-Mn) and D-Fe, to the overlying water column.
1.3. The Green Belt
The band of high and sustained productivity observed along the shelf edge of the Bering Sea is known asthe ‘‘Green Belt’’ (Springer et al., 1996). The processes sustaining that high productivity are not well under-stood, but an ‘‘Iron Curtain’’ hypothesis was proposed by Simpson, McRoy, and their co-authors at theASLO Aquatic Sciences meeting in 1999 and 2001 (Simpson and McRoy, 1999; McRoy et al., 2001). Thishypothesis is that the Green Belt results from nutrient-rich, iron-poor surface waters of the deep BeringSea basin mixing with the nutrient-poor, iron-rich surface waters of the shelf. However, prior to our study,no iron data existed to assess this hypothesis. There are important physical features in this region leadingto input of nutrients to the surface and promoting mixing of shelf and slope waters. These features includethe extensive (1000 km long) shelf break front that persists throughout the year along the continental slope(Kinder and Coachman, 1978), and the Bering Slope Current (BSC, Fig. 2) that flows along the outershelf/slope bathymetry in a northwest direction at moderate speeds (5–15 cm s�1) (Schumacher and Reed,1992). Associated with the BSC are mesoscale eddies, important for horizontal mixing of shelf and slopewaters with waters from the oceanic domain (Mizobata and Saitoh, 2004; Okkonen et al., 2004).
The width and location of the Green Belt are approximately coincident with the width and location of theshelf break front (Okkonen et al., 2004). The shelf break and middle fronts can sustain the primary produc-tivity of the Green Belt by supplying macro- and possibly micronutrients, such as iron and manganese, to theeuphotic zone. The BSC itself, which begins at the Bering Canyon near the Aleutian Islands and is fed by themacronutrient-rich Aleutian North Slope Current (ANSC) (Fig. 2), is also a potential source of nutrients toGreen Belt waters. Meanders of the BSC and eddies associated with this current likely help maintain primaryproductivity during the summer along the shelf edge. For example, Mizobata and Saitoh (2004) found a posi-tive correlation between eddy activity in the BSC eddy field and primary production along the shelf break.Eddies that tend to propagate northwestward along the shelf edge are anticyclonic (Mizobata and Saitoh,2004; Okkonen et al., 2004) and have associated nutrient-rich upwelled water around their periphery (Mizo-bata et al., 2002). In addition to bringing nutrients to the surface, eddies promote the mixing of waters from
A.M. Aguilar-Islas et al. / Progress in Oceanography 73 (2007) 99–126 103
the oceanic and outer shelf domains through advection (rather than through their onshore migration) (Mizo-bata and Saitoh, 2004). Eddies can also influence the width of the Green Belt by entraining high-chlorophyllsurface water from the outer shelf/upper slope and creating a locally wider Green Belt (Okkonen et al., 2004).
1.4. The Pribilof Islands
The Pribilof Islands are located near the shelf break (Fig. 1), and high productivity is observed in theirvicinity during the summer (Stabeno et al., 1999). Flint et al. (2002) proposed that the numerous fronts con-centrated in the relatively small area around the Pribilof Islands in the summer were responsible for the highproductivity associated with these islands. In addition to the middle and shelf break fronts, there is a coastalfront surrounding each island that separates the island coastal domain from the middle shelf domain (Flintet al., 2002). The coastal domains surrounding these islands are characterized by a well-mixed shallow watercolumn with several potential macronutrient sources throughout the summer, such as currents and cross-shelfflows (Kowalik and Stabeno, 1999; Stabeno et al., 1999). The proximity to the coast and the shallow well-mixed water column suggest iron concentrations would be elevated near the Pribilof Islands.
1.5. The Aleutian islands
The Aleutian Islands are the partially submerged continuation of the Aleutian Range. These rugged volca-nic islands have a continental shelf that narrows to the west, and is generally lacking on the northern side ofthe islands. Nutrient-rich water from the Alaskan Stream (AS) (Fig. 2) flows through the passes along theAleutian Archipelago into the Bering Sea, providing both a source of nutrients (Mordy et al., 2005) andthe water mass that creates the northeastward flowing Aleutian North Slope Current (Fig. 2) (Reed and Stab-eno, 1999). The ANSC is diverted north along the shelf break where it feeds into the BSC bringing nutrient-rich water to the Green Belt. Within the passes, the interaction of tides and island bathymetry produces vig-orous tidal mixing that results in nutrient enriched surface waters, especially in the central passes (Mordyet al., 2005). Nutrient concentrations in the eastern passes (those closer to the Alaskan Peninsula and BeringSea Shelf) tend to be lower due to the source waters entering the passes (Mordy et al., 2005). The inflowthrough Unimak Pass, the northeastern-most pass and the only pass in contact with the Bering Sea shelf,derives from the nutrient-poor Alaska Coastal Current (ACC) (Stabeno et al., 2002b; Mordy et al., 2005).During the summer the volume of ACC water flowing through this pass is relatively small, and so the bulkof water found in Unimak Pass and north of it likely comes from the nutrient-rich Bering Canyon (Stabenoet al., 2002b), explaining the relatively elevated nutrient values observed previously in this area during summer(Stabeno et al., 2002b). This water mass can be advected northwestwardly along the 100 m isobath (Fig. 2) at�4 cm s�1 contributing nutrients to the Green Belt; or it can be advected along the Alaskan Peninsula(�2 cm s�1) bringing nutrients to the inner and middle shelf (Reed and Stabeno, 1996; Stabeno et al.,2002b). The proximity to the coast and the deep mixing within the passes suggest iron concentrations wouldbe somewhat elevated in the Aleutian Archipelago. However, the lack of a shelf to trap iron-rich sediment,which would serve as an iron source to surface waters, suggests iron concentrations in this area may be rela-tively low compared to the elevated macronutrient concentrations.
1.6. Manganese as a tracer
Sources of D-Mn over the shelf are similar to those of D-Fe (sediment, riverine input, aeolian deposition).However, the higher solubility of manganese in seawater suggests D-Mn should be found at higher concen-trations compared to D-Fe over the shelf. In addition, the biological requirement for manganese is low com-pared to that of iron (Martin and Knauer, 1973; Finkel et al., 2006), and so D-Mn should behave relativelyconservatively with respect to salinity. Thus, in some instances, the concentration of surface D-Mn could beused to provide insight into the original concentration of iron prior to biological removal. Also, the surfacedistribution of TD-Mn in the deep basin (Minakawa et al., 1998) and shelf domains (Heggie et al., 1987)of the Bering Sea, shows decreasing concentrations from the coastal domain to the deep basin, suggesting sur-face D-Mn concentrations could serve to trace the hydrographic domains of the Bering Sea.
104 A.M. Aguilar-Islas et al. / Progress in Oceanography 73 (2007) 99–126
We propose that the supply of dissolved iron in conjunction with the supply of macronutrients to surfacewaters can explain the general summer productivity pattern described by Springer et al. (1996). Presentedherein are surface transects and vertical profiles from the Bering Sea deep basin and shelf domains that pro-vide spatial coverage of macronutrients, dissolved iron, dissolved manganese, and hydrographic information.These data sets are used to describe different iron regimes in the southeastern Bering Sea and to provide insightabout the productivity pattern observed during the summer in the Bering Sea.
2. Methods
2.1. Sample collection
Oceanographic data were collected in the southeastern Bering Sea from 11 August to 5 September 2003aboard the R/V Kilo Moana. Sampling took place from 8 am to 10 pm. Underway hydrographic data wereobtained from the ship’s flow-through seawater system. Hydrographic data for vertical profiles were collectedusing a Seabird CTD system equipped with a fluorometer. The CTD fluorometer had been calibrated to Chl a
values prior to our cruise, and the limited calibration performed aboard ship yielded a ratio of relative fluo-rescence units (RFU) to Chl a of 0.90 (r2 = 0.73, n = 16). Subsurface fluorescence data are presented in RFUand provide a rough estimate of Chl a values. Surface fluorescence from the ship’s surface water flow-throughsystem is shown in volts.
Samples for the determination of dissolved trace metals and macronutrients were collected by two methods.Subsurface samples were obtained using 30-L Teflon�-coated GO-Flo bottles (General Oceanics) attached toKevlar� hydroline (Bruland et al., 1979), and surface samples were collected underway with a clean surfacepump towfish system consisting of an all PTFE Teflon� contact diaphragm pump (Bruiser�, Osmonics) andPFA Teflon� tubing mounted to a PVC depressor vane 1 m above a 20 kg PVC fish. The tubing, PVC depres-sor vane and fish were attached by a Yacht-Braid� dacron line (New England rope). For underway surfacesampling (at 4–7 knots), the towfish system was deployed off the side of the ship using the ship’s crane to sus-pend the fish outside of the wake with the intake at a depth of approximately 1–3 m. In addition, macronu-trients were analyzed for hydrocast samples collected with the ship’s rosette. GO-Flo samples were filteredthrough acid-cleaned (Bruland et al., 2005) 142-mm diameter 0.4 lm absolute pore size polycarbonatetrack-etched (PCTE) membrane filters (Nuclepore�, Whatman�) held in PTFE Teflon� filter sandwiches(Millipore, Bedford, MA). Underway samples were filtered through acid-cleaned (Bruland et al., 2005)0.45 lm absolute pore size Teflon� membrane polypropylene capsule filters (Calyx�, MSI).
A subset of underway and subsurface samples were filtered sequentially through acid-clean (Hurst and Bru-land, 2007) 10 lm and 0.2 lm pore-size PCTE membrane filters (47 mm diameter. Nuclepore�, Whatman�)mounted in polypropylene filter sandwiches (Millipore, Bedford, MA).
2.2. Analytical methods
Macronutrients (nitrite + nitrate (referred to herein as nitrate), silicic acid, and phosphate) concentrationswere measured on a Lachat QuickChem 8000� Flow Injection Analysis system using standard methods (Par-sons et al., 1984). The standard error for nutrient measurements was within 2–3%.
Samples for the determination of trace metals were acidified to pH �1.7 using sub-boiled quartz-distilled6 N hydrochloric acid (Q-HCl), and were allowed to sit for at least 30 min after acidification prior to analysisfor dissolved manganese (D-Mn), or months prior to analysis for total dissolved iron (D-Fe). Dissolved man-ganese was determined onboard by flow injection (FI) with in-line preconcentration and spectrophotometricdetection (Aguilar-Islas et al., 2006). Replicate analysis (throughout the cruise) of a sample from the oceanicdomain of the Bering Sea (0.71 nmol/kg, n = 34) yielded a precision of ±0.05 nmol/kg. Procedural blanks ran-ged from 0.12 to 1.1 with a typical daily precision of ±0.06 nmol/kg. Shore-based analysis of surface and sub-surface D-Fe was carried out by sector field inductively coupled plasma mass spectrometry (SF-ICP-MS)using two sample pre-treatment methods (Hurst and Bruland, 2007; Lohan et al., 2005). The method describedby Hurst and Bruland (2007) was applied to samples sequentially filtered through the 10 lm and 0.2 lm filterassembly. The method described by Lohan et al. (2005) was used on samples filtered through 0.45 lm filter
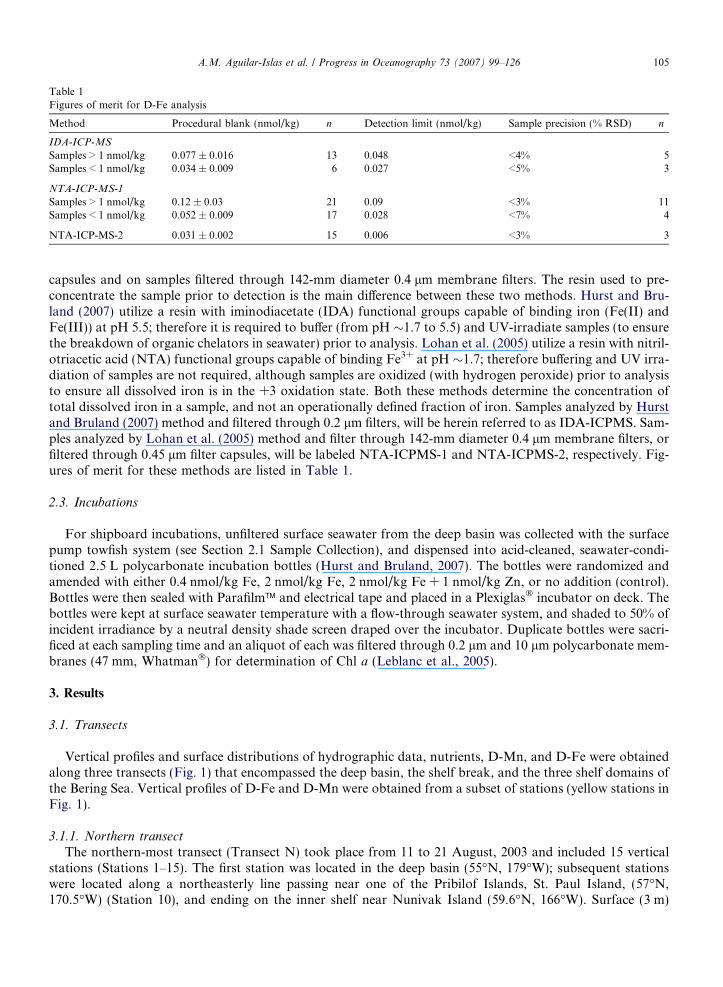
Table 1Figures of merit for D-Fe analysis
Method Procedural blank (nmol/kg) n Detection limit (nmol/kg) Sample precision (% RSD) n
IDA-ICP-MS
Samples > 1 nmol/kg 0.077 ± 0.016 13 0.048 <4% 5Samples < 1 nmol/kg 0.034 ± 0.009 6 0.027 <5% 3
NTA-ICP-MS-1
Samples > 1 nmol/kg 0.12 ± 0.03 21 0.09 <3% 11Samples < 1 nmol/kg 0.052 ± 0.009 17 0.028 <7% 4
NTA-ICP-MS-2 0.031 ± 0.002 15 0.006 <3% 3
A.M. Aguilar-Islas et al. / Progress in Oceanography 73 (2007) 99–126 105
capsules and on samples filtered through 142-mm diameter 0.4 lm membrane filters. The resin used to pre-concentrate the sample prior to detection is the main difference between these two methods. Hurst and Bru-land (2007) utilize a resin with iminodiacetate (IDA) functional groups capable of binding iron (Fe(II) andFe(III)) at pH 5.5; therefore it is required to buffer (from pH �1.7 to 5.5) and UV-irradiate samples (to ensurethe breakdown of organic chelators in seawater) prior to analysis. Lohan et al. (2005) utilize a resin with nitril-otriacetic acid (NTA) functional groups capable of binding Fe3+ at pH �1.7; therefore buffering and UV irra-diation of samples are not required, although samples are oxidized (with hydrogen peroxide) prior to analysisto ensure all dissolved iron is in the +3 oxidation state. Both these methods determine the concentration oftotal dissolved iron in a sample, and not an operationally defined fraction of iron. Samples analyzed by Hurstand Bruland (2007) method and filtered through 0.2 lm filters, will be herein referred to as IDA-ICPMS. Sam-ples analyzed by Lohan et al. (2005) method and filter through 142-mm diameter 0.4 lm membrane filters, orfiltered through 0.45 lm filter capsules, will be labeled NTA-ICPMS-1 and NTA-ICPMS-2, respectively. Fig-ures of merit for these methods are listed in Table 1.
2.3. Incubations
For shipboard incubations, unfiltered surface seawater from the deep basin was collected with the surfacepump towfish system (see Section 2.1 Sample Collection), and dispensed into acid-cleaned, seawater-condi-tioned 2.5 L polycarbonate incubation bottles (Hurst and Bruland, 2007). The bottles were randomized andamended with either 0.4 nmol/kg Fe, 2 nmol/kg Fe, 2 nmol/kg Fe + 1 nmol/kg Zn, or no addition (control).Bottles were then sealed with Parafilm� and electrical tape and placed in a Plexiglas� incubator on deck. Thebottles were kept at surface seawater temperature with a flow-through seawater system, and shaded to 50% ofincident irradiance by a neutral density shade screen draped over the incubator. Duplicate bottles were sacri-ficed at each sampling time and an aliquot of each was filtered through 0.2 lm and 10 lm polycarbonate mem-branes (47 mm, Whatman�) for determination of Chl a (Leblanc et al., 2005).
3. Results
3.1. Transects
Vertical profiles and surface distributions of hydrographic data, nutrients, D-Mn, and D-Fe were obtainedalong three transects (Fig. 1) that encompassed the deep basin, the shelf break, and the three shelf domains ofthe Bering Sea. Vertical profiles of D-Fe and D-Mn were obtained from a subset of stations (yellow stations inFig. 1).
3.1.1. Northern transect
The northern-most transect (Transect N) took place from 11 to 21 August, 2003 and included 15 verticalstations (Stations 1–15). The first station was located in the deep basin (55�N, 179�W); subsequent stationswere located along a northeasterly line passing near one of the Pribilof Islands, St. Paul Island, (57�N,170.5�W) (Station 10), and ending on the inner shelf near Nunivak Island (59.6�N, 166�W). Surface (3 m)
106 A.M. Aguilar-Islas et al. / Progress in Oceanography 73 (2007) 99–126
and subsurface (8–175 m) distributions of nutrient and hydrographic parameters along this transect show theshelf domains and fronts separating them (Fig. 3). The shallow, well-mixed coastal domain was relatively fresh(salinity <31.5) and warm (>9 �C) with low fluorescence (<2 RFU) and depleted nitrate (<0.1 lmol/kg), butcontained a small amount of residual silicic acid (�1–2 lmol/kg) (Fig. 3a–e). Surface D-Fe and D-Mn wereelevated (2–4 nmol/kg and 10–35 nmol/kg, respectively) (Fig. 4a and b).
The thermally stratified, two-layer, middle shelf domain had higher salinity (�32) than the coastal domain(Fig. 3b). The surface layer was warm (�11 �C), with low nutrient concentrations (<0.1 lmol/kg nitrate, and�1–6 lmol/kg silicic acid) and low fluorescence (<2 RFU) (Fig. 3). The bottom layer temperature was �4–5�C, forming a ‘‘cool pool’’ (>2�C), and had very low fluorescence, intermediate nutrient concentrations(Fig. 3), elevated D-Fe concentrations (�5 nmol/kg), and intermediate dissolved manganese concentrations(�6.5 nmol/kg) (Fig. 4). At the surface the middle shelf contained �0.5–2 nmol/kg D-Fe and 3–20 nmol/kgD-Mn with values increasing toward the coast (Fig. 4a and b). The influence of St. Paul Island in the middleshelf domain was apparent in the hydrographic parameters as a breakdown of the two-layer structure and theformation of a fairly homogeneous water column near the island (Fig. 3a–c). Temperature decreased to �9 �C(Fig. 3a), and nutrient distributions showed an increase at the surface (�3 lmol/kg nitrate, and 11 lmol/kgsilicic acid) (Fig. 3d and e). Three fronts were observed on the shelf (between 166.0� and 172�W, Fig. 3).The inner front, indicated at the surface by cooler temperature (�9.7 �C) (Fig. 3a), was located near the50 m isobath. Two additional fronts were observed near St. Paul Island (170�W and 171�W, Fig. 3). The frontwest of this island was broad and obscured the relatively narrow outer shelf domain along this transect. Con-centrations of D-Mn were enhanced inshore of these fronts (Fig. 4b). The highest surface D-Fe concentration(�6 nmol/kg) was observed within the Pribilof Island coastal domain.
An area of high fluorescence associated with the shelf break front and approximately 130 km in width (172–173�W, Fig. 3), with salinity between 32.4 and 32.7, marked the location of the Green Belt on this transect.Surface nitrate and silicic acid concentrations were 2–9 lmol/kg and 1–10 lmol/kg, respectively, in this region(Fig. 3d and e). Surface D-Fe concentrations within the Green Belt were 0.1 nmol/kg and lower, and D-Mnwas �2 nmol/kg (Fig. 4a and b). Dissolved iron at Station 8 (within the inner edge of the Green Belt) was lessthan 0.2 nmol/kg in the surface 30 m and increased to approximately 1 nmol/kg below the nutricline (Fig. 4a).D-Mn was also low at this station, with surface values �2 nmol/kg, and concentrations below the nutriclinedecreasing to �0.5 nmol/kg (Fig. 4b). As expected there was a general east to west gradient in salinity andnutrients, and a shallow thermocline. Nutrient concentrations in the surface waters of the deep basin weregreatly elevated (15 lmol/kg nitrate and 12–26 lmol/kg silicic acid), fluorescence was low, D-Mn was low(0.5–1 nmol/kg), and D-Fe concentrations were extremely low (0.030–0.050 nmol/kg).
3.1.2. Middle transect
The middle transect (Transect M) took place from 22 to 30 August, 2003 and included 18 vertical stations(Stations 16–33). This transect began in Bristol Bay, just north of Station 16 (58.3�N, 160�W); subsequent sta-tions were along a southwesterly line across the broad shelf, ending in the deep basin (54�N, 173�W) (Station33). Surface (3 m) and subsurface (8–175 m) distributions of nutrient and hydrographic parameters along thistransect show many of the same features observed in Transect N, but with some differences, such as a ther-mally stratified coastal domain, a colder cool pool, the absence of an island effect, and a broader Green Belt(Fig. 5) off the shelf break.
Fresher and warmer surface water was encountered in the coastal portion of this transect (Fig. 5a and b).Calm and warm conditions during this time resulted in weak thermal stratification of the coastal domain. Theinfluence from rivers and shelf sediments was seen in the concentration gradient of surface D-Fe and D-Mnfrom the coastal domain to the middle shelf domain (Fig. 6a and b, Stations 17–19). Subsurface concentra-tions of D-Fe and D-Mn were elevated (�2.5–4.5 nmol/kg and �18–34 nmol/kg, respectively) in the coastaldomain. Nitrate was depleted to concentrations <0.1 lmol/kg, but residual silicic acid remained (�4 lmol/kg)(Fig. 5d and e).
The surface temperature in the middle shelf domain was �12 �C (�1 �C warmer than in Transect N) andthe bottom temperature was between 3.5 and 4.5 �C (�1–2 �C cooler than in Transect N). Surface fluorescencewas low (�0.6 V), surface nitrate was depleted (<0.1 lmol/kg) and the concentration of residual surface silicicacid was �2 lmol/kg (Fig. 5). Surface D-Fe concentrations ranged from �0.5 to 1 nmol/kg and D-Mn con-
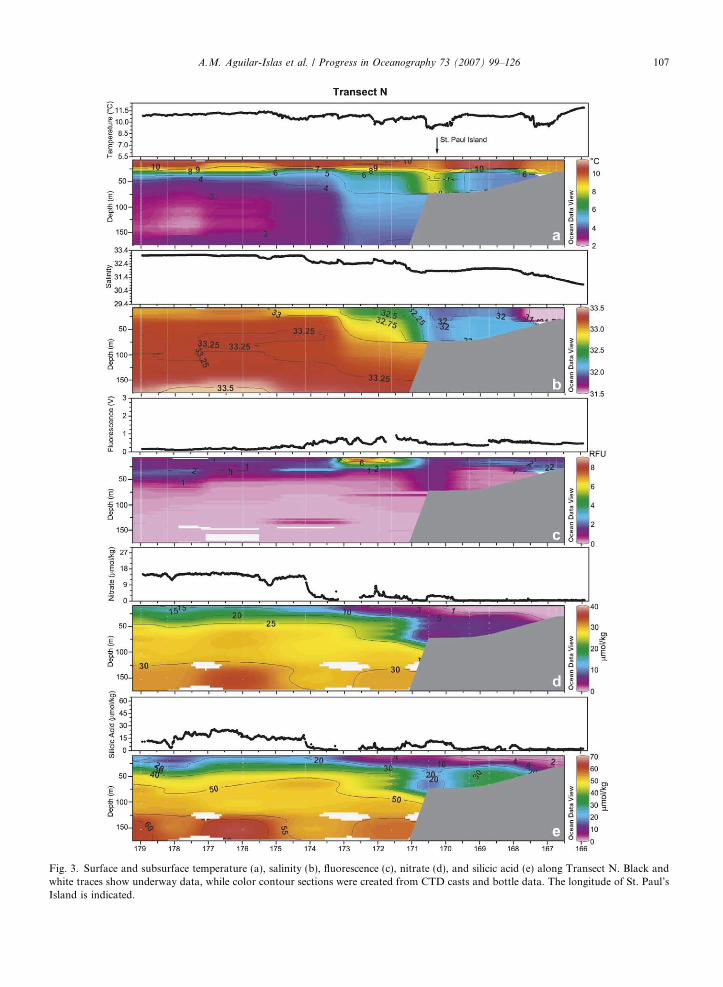
Fig. 3. Surface and subsurface temperature (a), salinity (b), fluorescence (c), nitrate (d), and silicic acid (e) along Transect N. Black andwhite traces show underway data, while color contour sections were created from CTD casts and bottle data. The longitude of St. Paul’sIsland is indicated.
A.M. Aguilar-Islas et al. / Progress in Oceanography 73 (2007) 99–126 107
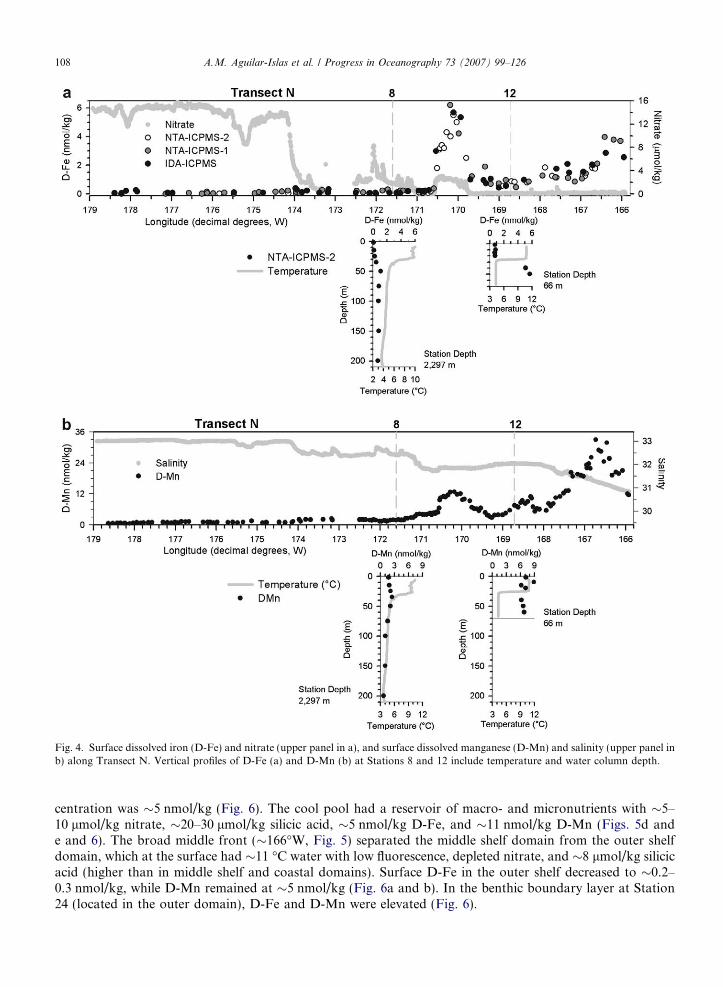
Fig. 4. Surface dissolved iron (D-Fe) and nitrate (upper panel in a), and surface dissolved manganese (D-Mn) and salinity (upper panel inb) along Transect N. Vertical profiles of D-Fe (a) and D-Mn (b) at Stations 8 and 12 include temperature and water column depth.
108 A.M. Aguilar-Islas et al. / Progress in Oceanography 73 (2007) 99–126
centration was �5 nmol/kg (Fig. 6). The cool pool had a reservoir of macro- and micronutrients with �5–10 lmol/kg nitrate, �20–30 lmol/kg silicic acid, �5 nmol/kg D-Fe, and �11 nmol/kg D-Mn (Figs. 5d ande and 6). The broad middle front (�166�W, Fig. 5) separated the middle shelf domain from the outer shelfdomain, which at the surface had �11 �C water with low fluorescence, depleted nitrate, and �8 lmol/kg silicicacid (higher than in middle shelf and coastal domains). Surface D-Fe in the outer shelf decreased to �0.2–0.3 nmol/kg, while D-Mn remained at �5 nmol/kg (Fig. 6a and b). In the benthic boundary layer at Station24 (located in the outer domain), D-Fe and D-Mn were elevated (Fig. 6).
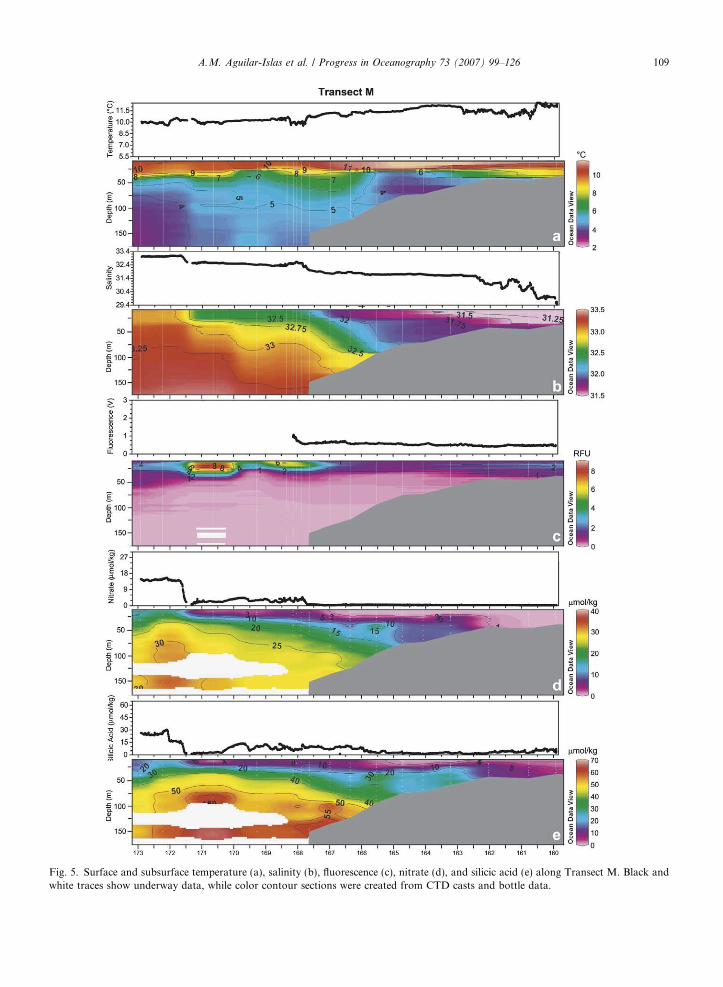
Fig. 5. Surface and subsurface temperature (a), salinity (b), fluorescence (c), nitrate (d), and silicic acid (e) along Transect M. Black andwhite traces show underway data, while color contour sections were created from CTD casts and bottle data.
A.M. Aguilar-Islas et al. / Progress in Oceanography 73 (2007) 99–126 109
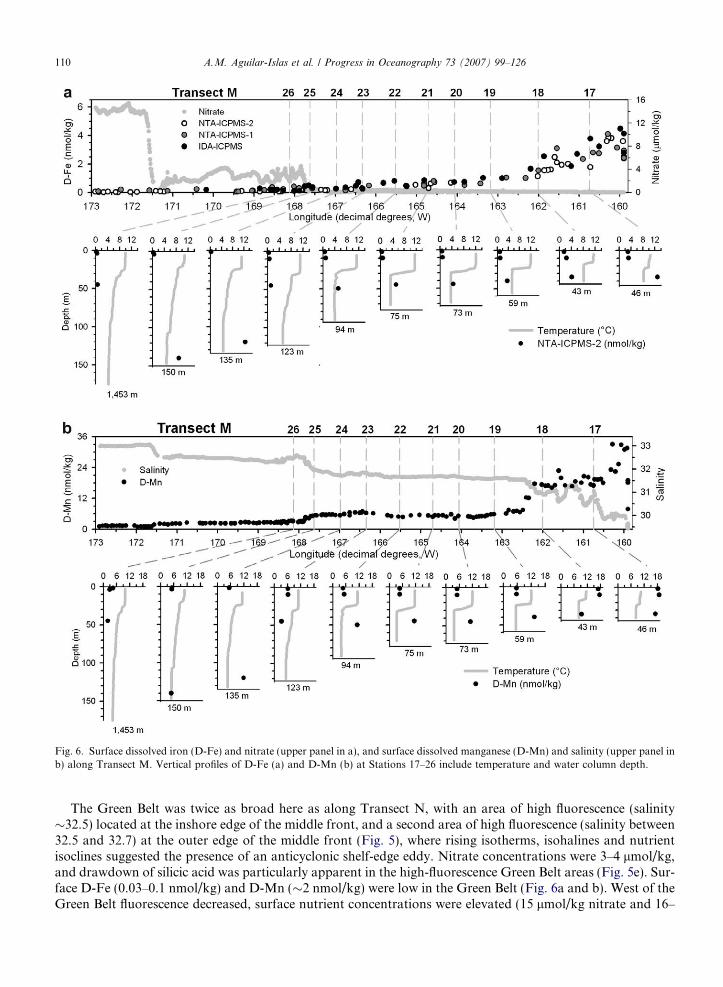
Fig. 6. Surface dissolved iron (D-Fe) and nitrate (upper panel in a), and surface dissolved manganese (D-Mn) and salinity (upper panel inb) along Transect M. Vertical profiles of D-Fe (a) and D-Mn (b) at Stations 17–26 include temperature and water column depth.
110 A.M. Aguilar-Islas et al. / Progress in Oceanography 73 (2007) 99–126
The Green Belt was twice as broad here as along Transect N, with an area of high fluorescence (salinity�32.5) located at the inshore edge of the middle front, and a second area of high fluorescence (salinity between32.5 and 32.7) at the outer edge of the middle front (Fig. 5), where rising isotherms, isohalines and nutrientisoclines suggested the presence of an anticyclonic shelf-edge eddy. Nitrate concentrations were 3–4 lmol/kg,and drawdown of silicic acid was particularly apparent in the high-fluorescence Green Belt areas (Fig. 5e). Sur-face D-Fe (0.03–0.1 nmol/kg) and D-Mn (�2 nmol/kg) were low in the Green Belt (Fig. 6a and b). West of theGreen Belt fluorescence decreased, surface nutrient concentrations were elevated (15 lmol/kg nitrate and 16–
A.M. Aguilar-Islas et al. / Progress in Oceanography 73 (2007) 99–126 111
32 lmol/kg silicic acid), and surface D-Fe was extremely low (0.020–0.050 nmol/kg). Here, as in Transect N,there was a general east to west gradient in salinity and nutrients, and a shallow thermocline.
3.1.3. Aleutian transectsThe Aleutian transects (Transects A1, A2 and A3) took place from 1 to 5 September, 2003 and included 11
vertical stations (Stations 34–38 and 40–45). Stations on Transect A1 (Stns 34–38, 40) resided on a southwest-erly line parallel to the eastern Aleutian Islands (Fig. 1). This transect included stations over the Bering Can-yon, and on the outer shelf near Unimak Island. Transect A2 was across a narrow central pass (near theIslands of the Four Mountains and Samalga Pass) into the North Pacific Ocean, and included Station 41. Sta-tions along Transect A3 (Stations 42–45) were positioned in a northeasterly arc from the Eastern AleutianIslands to the deep basin in an area where the ANSC turns northward and veers away from the AleutianIslands to become the BSC.
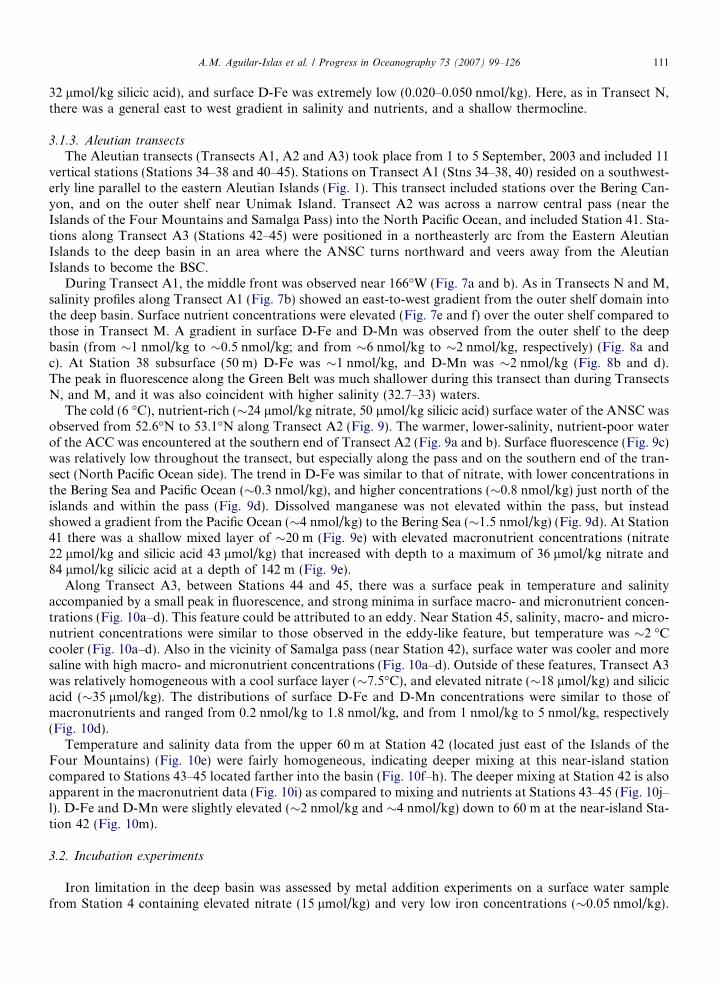
During Transect A1, the middle front was observed near 166�W (Fig. 7a and b). As in Transects N and M,salinity profiles along Transect A1 (Fig. 7b) showed an east-to-west gradient from the outer shelf domain intothe deep basin. Surface nutrient concentrations were elevated (Fig. 7e and f) over the outer shelf compared tothose in Transect M. A gradient in surface D-Fe and D-Mn was observed from the outer shelf to the deepbasin (from �1 nmol/kg to �0.5 nmol/kg; and from �6 nmol/kg to �2 nmol/kg, respectively) (Fig. 8a andc). At Station 38 subsurface (50 m) D-Fe was �1 nmol/kg, and D-Mn was �2 nmol/kg (Fig. 8b and d).The peak in fluorescence along the Green Belt was much shallower during this transect than during TransectsN, and M, and it was also coincident with higher salinity (32.7–33) waters.
The cold (6 �C), nutrient-rich (�24 lmol/kg nitrate, 50 lmol/kg silicic acid) surface water of the ANSC wasobserved from 52.6�N to 53.1�N along Transect A2 (Fig. 9). The warmer, lower-salinity, nutrient-poor waterof the ACC was encountered at the southern end of Transect A2 (Fig. 9a and b). Surface fluorescence (Fig. 9c)was relatively low throughout the transect, but especially along the pass and on the southern end of the tran-sect (North Pacific Ocean side). The trend in D-Fe was similar to that of nitrate, with lower concentrations inthe Bering Sea and Pacific Ocean (�0.3 nmol/kg), and higher concentrations (�0.8 nmol/kg) just north of theislands and within the pass (Fig. 9d). Dissolved manganese was not elevated within the pass, but insteadshowed a gradient from the Pacific Ocean (�4 nmol/kg) to the Bering Sea (�1.5 nmol/kg) (Fig. 9d). At Station41 there was a shallow mixed layer of �20 m (Fig. 9e) with elevated macronutrient concentrations (nitrate22 lmol/kg and silicic acid 43 lmol/kg) that increased with depth to a maximum of 36 lmol/kg nitrate and84 lmol/kg silicic acid at a depth of 142 m (Fig. 9e).
Along Transect A3, between Stations 44 and 45, there was a surface peak in temperature and salinityaccompanied by a small peak in fluorescence, and strong minima in surface macro- and micronutrient concen-trations (Fig. 10a–d). This feature could be attributed to an eddy. Near Station 45, salinity, macro- and micro-nutrient concentrations were similar to those observed in the eddy-like feature, but temperature was �2 �Ccooler (Fig. 10a–d). Also in the vicinity of Samalga pass (near Station 42), surface water was cooler and moresaline with high macro- and micronutrient concentrations (Fig. 10a–d). Outside of these features, Transect A3was relatively homogeneous with a cool surface layer (�7.5�C), and elevated nitrate (�18 lmol/kg) and silicicacid (�35 lmol/kg). The distributions of surface D-Fe and D-Mn concentrations were similar to those ofmacronutrients and ranged from 0.2 nmol/kg to 1.8 nmol/kg, and from 1 nmol/kg to 5 nmol/kg, respectively(Fig. 10d).
Temperature and salinity data from the upper 60 m at Station 42 (located just east of the Islands of theFour Mountains) (Fig. 10e) were fairly homogeneous, indicating deeper mixing at this near-island stationcompared to Stations 43–45 located farther into the basin (Fig. 10f–h). The deeper mixing at Station 42 is alsoapparent in the macronutrient data (Fig. 10i) as compared to mixing and nutrients at Stations 43–45 (Fig. 10j–l). D-Fe and D-Mn were slightly elevated (�2 nmol/kg and �4 nmol/kg) down to 60 m at the near-island Sta-tion 42 (Fig. 10m).
3.2. Incubation experiments
Iron limitation in the deep basin was assessed by metal addition experiments on a surface water samplefrom Station 4 containing elevated nitrate (15 lmol/kg) and very low iron concentrations (�0.05 nmol/kg).
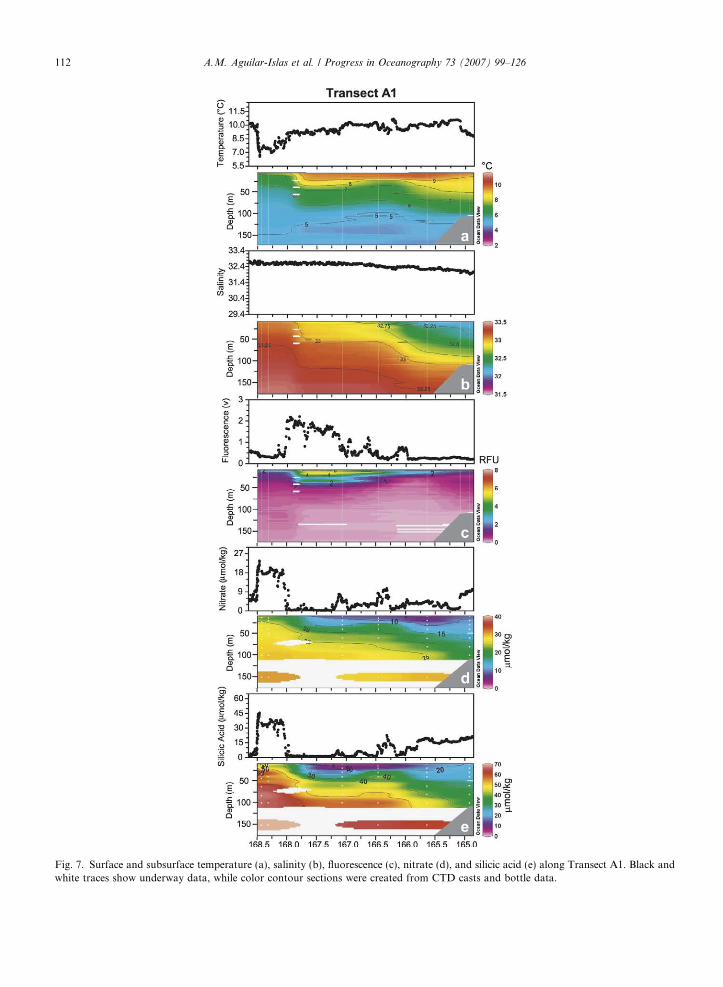
Fig. 7. Surface and subsurface temperature (a), salinity (b), fluorescence (c), nitrate (d), and silicic acid (e) along Transect A1. Black andwhite traces show underway data, while color contour sections were created from CTD casts and bottle data.
112 A.M. Aguilar-Islas et al. / Progress in Oceanography 73 (2007) 99–126
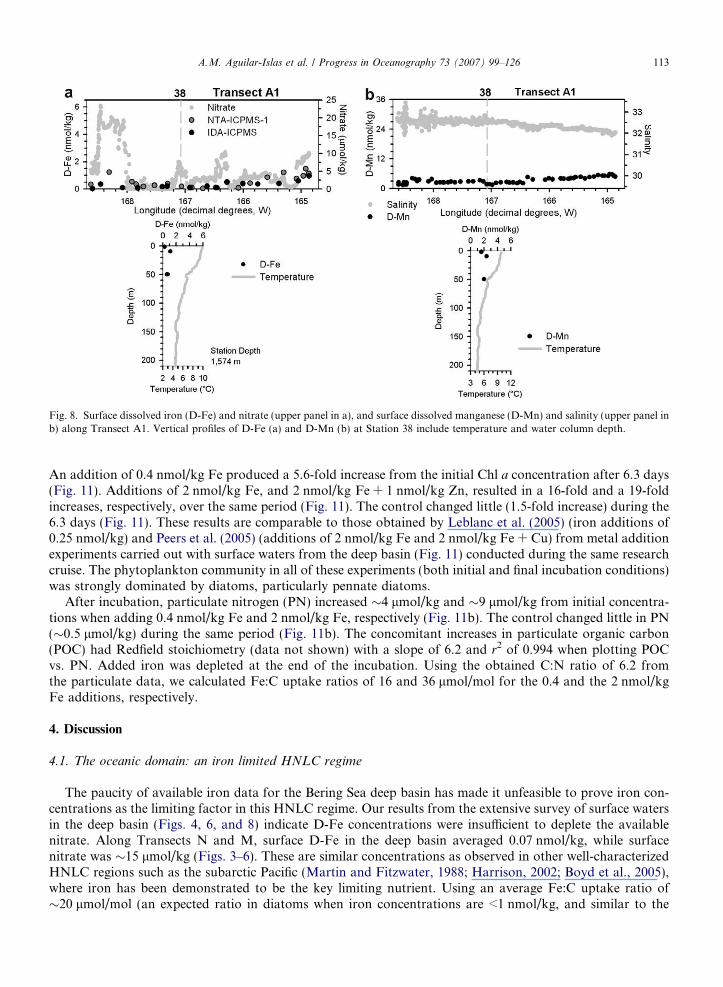
Fig. 8. Surface dissolved iron (D-Fe) and nitrate (upper panel in a), and surface dissolved manganese (D-Mn) and salinity (upper panel inb) along Transect A1. Vertical profiles of D-Fe (a) and D-Mn (b) at Station 38 include temperature and water column depth.
A.M. Aguilar-Islas et al. / Progress in Oceanography 73 (2007) 99–126 113
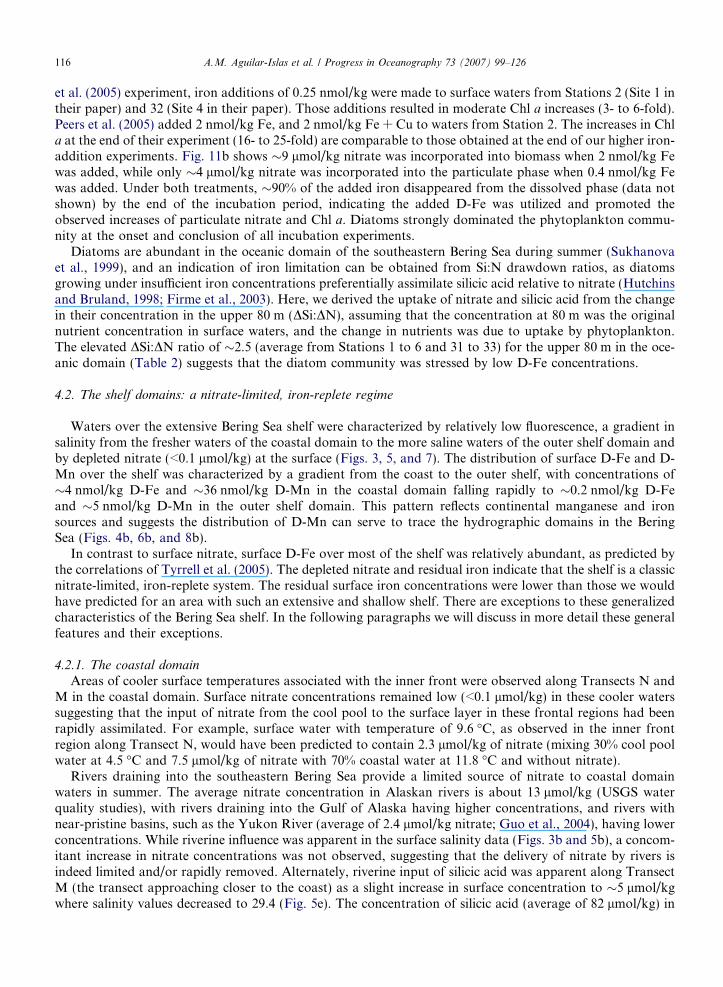
An addition of 0.4 nmol/kg Fe produced a 5.6-fold increase from the initial Chl a concentration after 6.3 days(Fig. 11). Additions of 2 nmol/kg Fe, and 2 nmol/kg Fe + 1 nmol/kg Zn, resulted in a 16-fold and a 19-foldincreases, respectively, over the same period (Fig. 11). The control changed little (1.5-fold increase) during the6.3 days (Fig. 11). These results are comparable to those obtained by Leblanc et al. (2005) (iron additions of0.25 nmol/kg) and Peers et al. (2005) (additions of 2 nmol/kg Fe and 2 nmol/kg Fe + Cu) from metal additionexperiments carried out with surface waters from the deep basin (Fig. 11) conducted during the same researchcruise. The phytoplankton community in all of these experiments (both initial and final incubation conditions)was strongly dominated by diatoms, particularly pennate diatoms.
After incubation, particulate nitrogen (PN) increased �4 lmol/kg and �9 lmol/kg from initial concentra-tions when adding 0.4 nmol/kg Fe and 2 nmol/kg Fe, respectively (Fig. 11b). The control changed little in PN(�0.5 lmol/kg) during the same period (Fig. 11b). The concomitant increases in particulate organic carbon(POC) had Redfield stoichiometry (data not shown) with a slope of 6.2 and r2 of 0.994 when plotting POCvs. PN. Added iron was depleted at the end of the incubation. Using the obtained C:N ratio of 6.2 fromthe particulate data, we calculated Fe:C uptake ratios of 16 and 36 lmol/mol for the 0.4 and the 2 nmol/kgFe additions, respectively.
4. Discussion
4.1. The oceanic domain: an iron limited HNLC regime
The paucity of available iron data for the Bering Sea deep basin has made it unfeasible to prove iron con-centrations as the limiting factor in this HNLC regime. Our results from the extensive survey of surface watersin the deep basin (Figs. 4, 6, and 8) indicate D-Fe concentrations were insufficient to deplete the availablenitrate. Along Transects N and M, surface D-Fe in the deep basin averaged 0.07 nmol/kg, while surfacenitrate was �15 lmol/kg (Figs. 3–6). These are similar concentrations as observed in other well-characterizedHNLC regions such as the subarctic Pacific (Martin and Fitzwater, 1988; Harrison, 2002; Boyd et al., 2005),where iron has been demonstrated to be the key limiting nutrient. Using an average Fe:C uptake ratio of�20 lmol/mol (an expected ratio in diatoms when iron concentrations are <1 nmol/kg, and similar to the
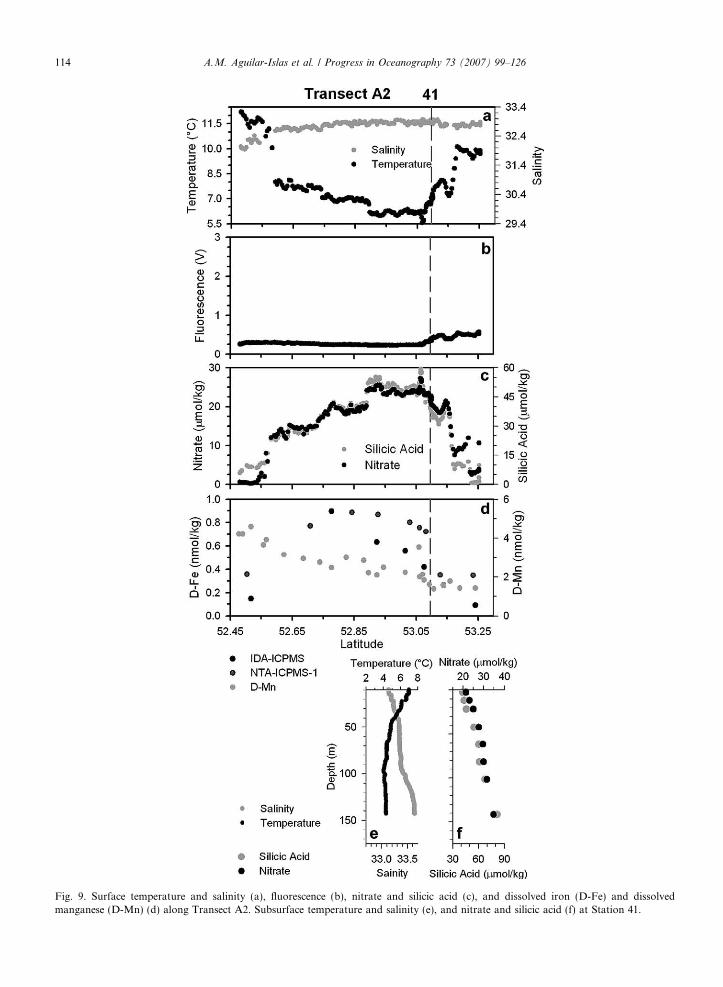
Fig. 9. Surface temperature and salinity (a), fluorescence (b), nitrate and silicic acid (c), and dissolved iron (D-Fe) and dissolvedmanganese (D-Mn) (d) along Transect A2. Subsurface temperature and salinity (e), and nitrate and silicic acid (f) at Station 41.
114 A.M. Aguilar-Islas et al. / Progress in Oceanography 73 (2007) 99–126
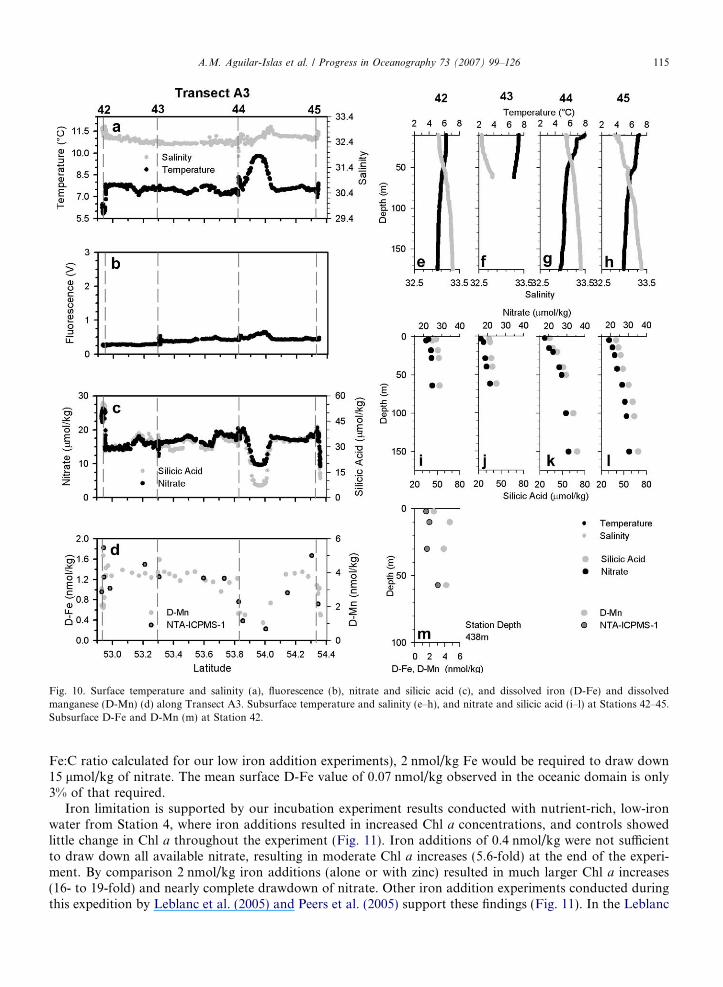
Fig. 10. Surface temperature and salinity (a), fluorescence (b), nitrate and silicic acid (c), and dissolved iron (D-Fe) and dissolvedmanganese (D-Mn) (d) along Transect A3. Subsurface temperature and salinity (e–h), and nitrate and silicic acid (i–l) at Stations 42–45.Subsurface D-Fe and D-Mn (m) at Station 42.
A.M. Aguilar-Islas et al. / Progress in Oceanography 73 (2007) 99–126 115
Fe:C ratio calculated for our low iron addition experiments), 2 nmol/kg Fe would be required to draw down15 lmol/kg of nitrate. The mean surface D-Fe value of 0.07 nmol/kg observed in the oceanic domain is only3% of that required.
Iron limitation is supported by our incubation experiment results conducted with nutrient-rich, low-ironwater from Station 4, where iron additions resulted in increased Chl a concentrations, and controls showedlittle change in Chl a throughout the experiment (Fig. 11). Iron additions of 0.4 nmol/kg were not sufficientto draw down all available nitrate, resulting in moderate Chl a increases (5.6-fold) at the end of the experi-ment. By comparison 2 nmol/kg iron additions (alone or with zinc) resulted in much larger Chl a increases(16- to 19-fold) and nearly complete drawdown of nitrate. Other iron addition experiments conducted duringthis expedition by Leblanc et al. (2005) and Peers et al. (2005) support these findings (Fig. 11). In the Leblanc
116 A.M. Aguilar-Islas et al. / Progress in Oceanography 73 (2007) 99–126
et al. (2005) experiment, iron additions of 0.25 nmol/kg were made to surface waters from Stations 2 (Site 1 intheir paper) and 32 (Site 4 in their paper). Those additions resulted in moderate Chl a increases (3- to 6-fold).Peers et al. (2005) added 2 nmol/kg Fe, and 2 nmol/kg Fe + Cu to waters from Station 2. The increases in Chla at the end of their experiment (16- to 25-fold) are comparable to those obtained at the end of our higher iron-addition experiments. Fig. 11b shows �9 lmol/kg nitrate was incorporated into biomass when 2 nmol/kg Fewas added, while only �4 lmol/kg nitrate was incorporated into the particulate phase when 0.4 nmol/kg Fewas added. Under both treatments, �90% of the added iron disappeared from the dissolved phase (data notshown) by the end of the incubation period, indicating the added D-Fe was utilized and promoted theobserved increases of particulate nitrate and Chl a. Diatoms strongly dominated the phytoplankton commu-nity at the onset and conclusion of all incubation experiments.
Diatoms are abundant in the oceanic domain of the southeastern Bering Sea during summer (Sukhanovaet al., 1999), and an indication of iron limitation can be obtained from Si:N drawdown ratios, as diatomsgrowing under insufficient iron concentrations preferentially assimilate silicic acid relative to nitrate (Hutchinsand Bruland, 1998; Firme et al., 2003). Here, we derived the uptake of nitrate and silicic acid from the changein their concentration in the upper 80 m (DSi:DN), assuming that the concentration at 80 m was the originalnutrient concentration in surface waters, and the change in nutrients was due to uptake by phytoplankton.The elevated DSi:DN ratio of �2.5 (average from Stations 1 to 6 and 31 to 33) for the upper 80 m in the oce-anic domain (Table 2) suggests that the diatom community was stressed by low D-Fe concentrations.
4.2. The shelf domains: a nitrate-limited, iron-replete regime
Waters over the extensive Bering Sea shelf were characterized by relatively low fluorescence, a gradient insalinity from the fresher waters of the coastal domain to the more saline waters of the outer shelf domain andby depleted nitrate (<0.1 lmol/kg) at the surface (Figs. 3, 5, and 7). The distribution of surface D-Fe and D-Mn over the shelf was characterized by a gradient from the coast to the outer shelf, with concentrations of�4 nmol/kg D-Fe and �36 nmol/kg D-Mn in the coastal domain falling rapidly to �0.2 nmol/kg D-Feand �5 nmol/kg D-Mn in the outer shelf domain. This pattern reflects continental manganese and ironsources and suggests the distribution of D-Mn can serve to trace the hydrographic domains in the BeringSea (Figs. 4b, 6b, and 8b).
In contrast to surface nitrate, surface D-Fe over most of the shelf was relatively abundant, as predicted bythe correlations of Tyrrell et al. (2005). The depleted nitrate and residual iron indicate that the shelf is a classicnitrate-limited, iron-replete system. The residual surface iron concentrations were lower than those we wouldhave predicted for an area with such an extensive and shallow shelf. There are exceptions to these generalizedcharacteristics of the Bering Sea shelf. In the following paragraphs we will discuss in more detail these generalfeatures and their exceptions.
4.2.1. The coastal domain
Areas of cooler surface temperatures associated with the inner front were observed along Transects N andM in the coastal domain. Surface nitrate concentrations remained low (<0.1 lmol/kg) in these cooler waterssuggesting that the input of nitrate from the cool pool to the surface layer in these frontal regions had beenrapidly assimilated. For example, surface water with temperature of 9.6 �C, as observed in the inner frontregion along Transect N, would have been predicted to contain 2.3 lmol/kg of nitrate (mixing 30% cool poolwater at 4.5 �C and 7.5 lmol/kg of nitrate with 70% coastal water at 11.8 �C and without nitrate).
Rivers draining into the southeastern Bering Sea provide a limited source of nitrate to coastal domainwaters in summer. The average nitrate concentration in Alaskan rivers is about 13 lmol/kg (USGS waterquality studies), with rivers draining into the Gulf of Alaska having higher concentrations, and rivers withnear-pristine basins, such as the Yukon River (average of 2.4 lmol/kg nitrate; Guo et al., 2004), having lowerconcentrations. While riverine influence was apparent in the surface salinity data (Figs. 3b and 5b), a concom-itant increase in nitrate concentrations was not observed, suggesting that the delivery of nitrate by rivers isindeed limited and/or rapidly removed. Alternately, riverine input of silicic acid was apparent along TransectM (the transect approaching closer to the coast) as a slight increase in surface concentration to �5 lmol/kgwhere salinity values decreased to 29.4 (Fig. 5e). The concentration of silicic acid (average of 82 lmol/kg) in
Fig. 11. Chlorophyll a increases (a), and particulate nitrogen data (b) for several incubation experiments. Metals were added to surfacewaters from Station 2 (Leblanc Site 1 and Peers), Station 4 (this study), and Station 32 (Leblanc Site 4). Leblanc data is from Leblanc et al.(2005) and Peers data is from Peers et al. (2005).
Table 2Nitrate to silicic acid ratios
Station Transect Location Slope Intercept
36 A1 Outer shelf 1.22 10.624 M Outer shelf 1.55 5.423 M Outer shelf 1.62 9.134 A1 Outer shelf 1.66 4.730 M Green Belt 1.67 5.025 M Outer shelf 1.70 5.643 A3 Aleutian 1.92 1.827 M Green Belt 1.98 0.98 N Green Belt 1.83 �1.26 N Deep basin 1.92 �3.5
26 M Green Belt 2.03 �0.628 M Green Belt 2.09 �3.331 M Deep basin 2.10 �1.45 N Deep basin 2.12 �12.0
38 A1 Green Belt 2.27 �14.844 A3 Deep basin 2.33 �9.241 A2 Aleutian 2.46 �13.345 A3 Deep basin 2.54 �10.833 M Deep basin 2.56 �25.142 A3 Aleutian 2.66 �13.01 N Deep basin 2.66 �24.6
37 A1 Deep basin 2.76 �12.54 N Deep basin 2.77 �30.5
40 A1 Deep basin 2.84 �16.12 N Deep basin 3.08 �41.3
The intercept is for silicic acid at 0 lmol/kg nitrate concentration. A slope of greater than �1.8 with a negative intercept is indicative ofiron limitation. A slope less than �1.8 with a positive intercept is indicative of iron replete conditions.
A.M. Aguilar-Islas et al. / Progress in Oceanography 73 (2007) 99–126 117
118 A.M. Aguilar-Islas et al. / Progress in Oceanography 73 (2007) 99–126
the Yukon River measured by Guo et al. (2004) was comparable to that of other temperate rivers, suggestingAlaskan rivers can be an important source of silicic acid to the coastal domain of the Bering Sea duringsummer.
Iron data for the coastal domain of the Bering Sea did not exist prior to this survey. The iron concentra-tions found in surface waters (1–4 nmol/kg) (Figs. 4a and 6a) are comparable to those over other continentalshelves, but in the lower range of values (Wells and Mayer, 1991; Statham et al., 1993; Gledhill et al., 1998;Johnson et al., 1999; Bruland et al., 2001, 2005). As expected, surface and limited subsurface data showeddecreasing D-Fe concentrations away from the coast. The abundance of D-Fe (Figs. 4a and 6a) along withthe depletion of nitrate (Figs. 3d and 5d) over the entire water column of the coastal domain indicate thisdomain was a classic nitrate-limited, iron-replete system during August 2003, and is unlikely to ever experienceiron limitation.
4.2.2. The middle self-domain
In summer 2003 the average temperature in the bottom layer of the middle shelf was the warmest (�4 �C)since 1982 (Ecosystem Consideration Chapters, Alaska Fisheries Science Center, NOAA). During August2003, we observed temperatures of �3.5–5 �C in the cool pool, with warmer temperatures along the northerntransect (4–5 �C). This northwest–southeast gradient in middle-shelf cool pool temperature had been previ-ously documented (Stabeno et al., 2002a). Nutrient concentrations in the cool pool (5–9 lmol/kg nitrate,and 10–35 lmol/kg silicic acid) during August 2003, were within the range of values previously observed(6–10 lmol/kg nitrate, and 15–30 lmol/kg silicic acid) by Whitledge et al. (1986).
Biological processes taking place during the spring and summer can also alter the concentration of nutri-ents initially present when the cold/cool pool is isolated. In any given year the isolated cold/cool pool canbe thought of as a benthic chamber where biological processes taking place during spring and summer canbe observed. One such process is sedimentary denitrification, which creates a nitrate gradient between theoxic water column and the underlying sediments, promoting nitrate diffusion into the sediments and lower-ing the N:P ratio within the cold/cool pool (Tanaka et al., 2004). We observed markedly lower nitrate con-centrations relative to what would be expected based upon the phosphate concentrations (N:P ratios of 3.7–5.6) in the cool pool along Transects N and M, suggesting sedimentary denitrification was important in2003. In comparison, N:P ratios in the subsurface outside the cool pool ranged from 13.8 to 16.1(Fig. 12). Additionally, the low fluorescence and the relatively elevated phosphate and silicic acid valuesin the cool pool indicate the drawdown of nitrate was not due to photosynthesis. Warmer temperatures dur-ing this time could have accelerated sedimentary denitrification, resulting in a cool pool considerablydepleted in nitrate with respect to phosphate. From Fig. 12, it appears that in excess of 10 lmol/kg, or60% of the nitrate in the cool pool was lost to sedimentary denitrification. Devol et al. (1997) measureddenitrification rates in western Arctic shelf sediments and estimated summer rates ranging from 0.97 to2.2 mmol NO�3 m�2 d�1. Using these estimates and assuming a bottom layer thickness of 20 m and a timeof 100 days, yield a loss of nitrate due to denitrification of 5–10 lmol/kg, in good agreement with the losseswe observed. Direct comparison of N:P ratios from August 2003 with those observed by Tanaka et al.(2004) during late summer in 2000 and 2001 (when the cold pool was �2 �C cooler) is not possible, sinceammonium concentrations were included in their ratios. Assuming the contribution from ammonium was 1–6 lmol/kg (Whitledge and Luchin, 1999), the N:P ratios in the cold pool during late summer 2000 and 2001were higher (�4–9) than those observed during August 2003. That suggests the temperature of the cold/coolpool could affect sedimentary denitrification in the underlying sediment. Determining the influence of thecold/cool pool temperature on sedimentary denitrification rates over the middle shelf is necessary, since thisprocess can be important to the nitrogen budget of the Bering Sea (Tanaka et al., 2004), and potentiallyalso important in supplying excess phosphate to the North Atlantic to stimulate nitrogen-fixation (Yamam-oto-Kawai et al., 2006).
An important consideration is that nitrate loss due to sedimentary denitrification could lead to lower pri-mary productivity in the coastal and middle shelf domains during summer and fall, when the nitrate-deficientsubsurface water is mixed into the already nitrate-depleted surface waters. For example, the coastal and mid-dle shelf stations in Fig. 12 (triangles and circles) showed substantial residual phosphate at the surface (wherenitrate is <0.1 lmol/kg). This is particularly apparent in Transect M, with the most extreme case at Station 18
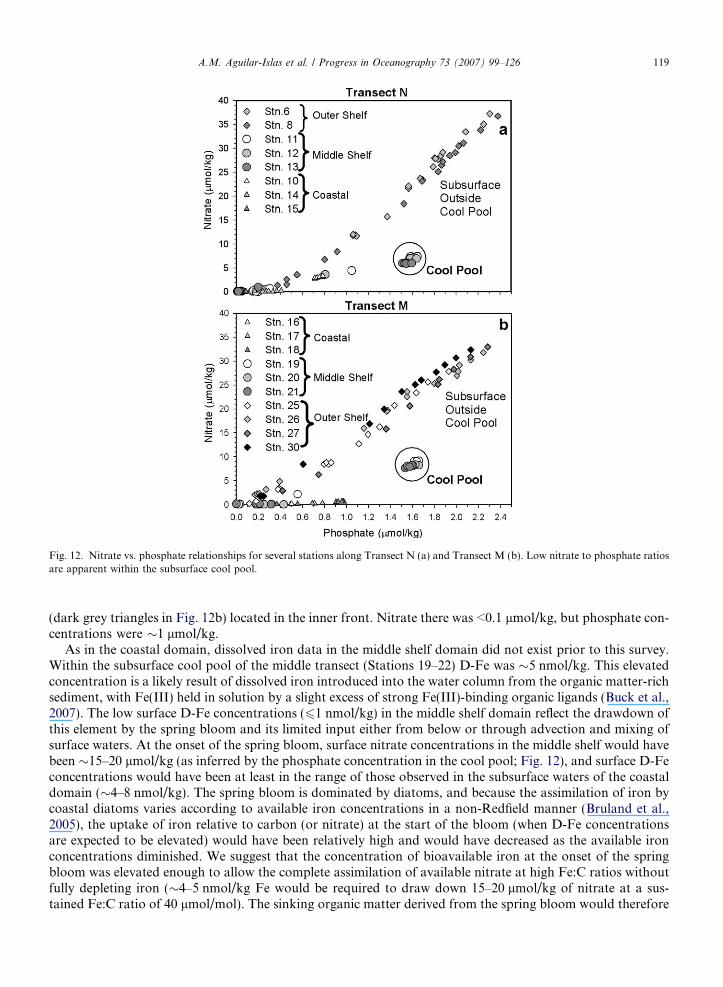
Fig. 12. Nitrate vs. phosphate relationships for several stations along Transect N (a) and Transect M (b). Low nitrate to phosphate ratiosare apparent within the subsurface cool pool.
A.M. Aguilar-Islas et al. / Progress in Oceanography 73 (2007) 99–126 119
(dark grey triangles in Fig. 12b) located in the inner front. Nitrate there was <0.1 lmol/kg, but phosphate con-centrations were �1 lmol/kg.
As in the coastal domain, dissolved iron data in the middle shelf domain did not exist prior to this survey.Within the subsurface cool pool of the middle transect (Stations 19–22) D-Fe was �5 nmol/kg. This elevatedconcentration is a likely result of dissolved iron introduced into the water column from the organic matter-richsediment, with Fe(III) held in solution by a slight excess of strong Fe(III)-binding organic ligands (Buck et al.,2007). The low surface D-Fe concentrations (61 nmol/kg) in the middle shelf domain reflect the drawdown ofthis element by the spring bloom and its limited input either from below or through advection and mixing ofsurface waters. At the onset of the spring bloom, surface nitrate concentrations in the middle shelf would havebeen �15–20 lmol/kg (as inferred by the phosphate concentration in the cool pool; Fig. 12), and surface D-Feconcentrations would have been at least in the range of those observed in the subsurface waters of the coastaldomain (�4–8 nmol/kg). The spring bloom is dominated by diatoms, and because the assimilation of iron bycoastal diatoms varies according to available iron concentrations in a non-Redfield manner (Bruland et al.,2005), the uptake of iron relative to carbon (or nitrate) at the start of the bloom (when D-Fe concentrationsare expected to be elevated) would have been relatively high and would have decreased as the available ironconcentrations diminished. We suggest that the concentration of bioavailable iron at the onset of the springbloom was elevated enough to allow the complete assimilation of available nitrate at high Fe:C ratios withoutfully depleting iron (�4–5 nmol/kg Fe would be required to draw down 15–20 lmol/kg of nitrate at a sus-tained Fe:C ratio of 40 lmol/mol). The sinking organic matter derived from the spring bloom would therefore
120 A.M. Aguilar-Islas et al. / Progress in Oceanography 73 (2007) 99–126
contain an elevated Fe:C ratio, and remineralization of this organic matter coupled with the loss of nitrate dueto sedimentary denitrification, would provide an elevated Fe:N ratio to the waters of the subsurface cold/coolpool.
Along Transect N an apparent input of D-Mn was observed at �168.4�W (Fig. 4b). This input corre-sponded to salinities between 32.00 and 32.05 (Fig. 14d), and produced a considerable increase in D-Mn con-centrations (from �4 nmol/kg to �11 nmol/kg), with simultaneous input of D-Fe (from �0.4 nmol/kg to�1 nmol/kg) (Figs. 4a and 14c). At this location (and salinity range), fluorescence increased slightly from�0.3 V to �0.7 V (Figs. 3c and 14a), and although an apparent input of nitrate was not observed(Fig. 3d), silicic acid concentrations show an input in this area (Fig. 3e), suggesting the concomitant supplyof nitrate was rapidly removed. An input of D-Fe larger than observed can be inferred from the large inputof D-Mn in this area, suggesting iron was removed at a high Fe:C ratio along with the uptake of nitrate toproduce the observed increase in fluorescence.
4.2.3. The Pribilof Islands domain
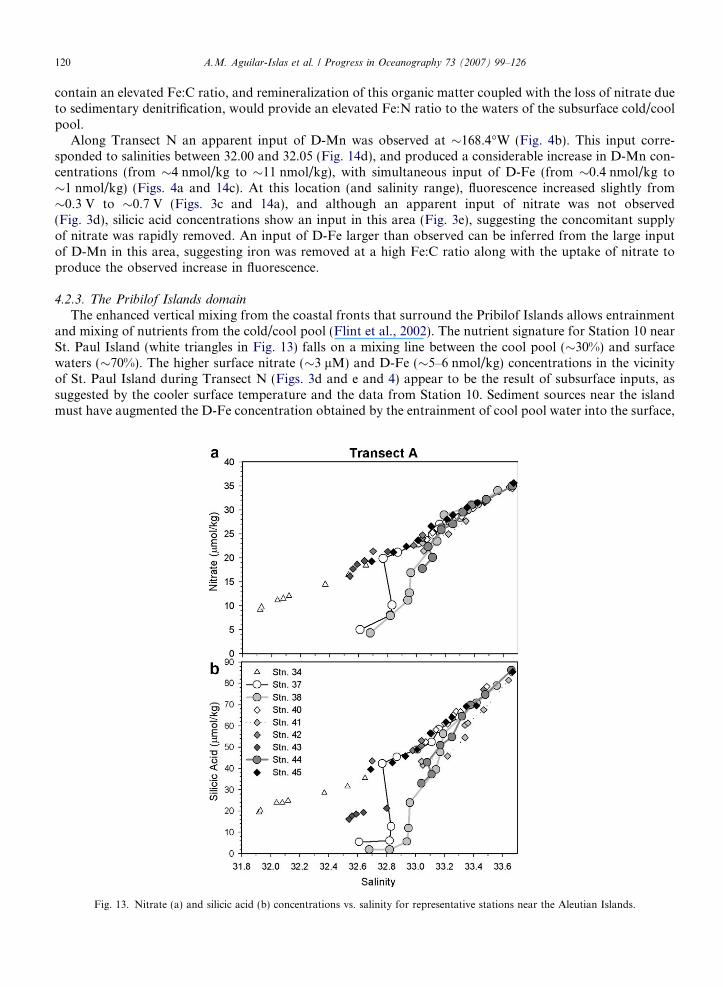
The enhanced vertical mixing from the coastal fronts that surround the Pribilof Islands allows entrainmentand mixing of nutrients from the cold/cool pool (Flint et al., 2002). The nutrient signature for Station 10 nearSt. Paul Island (white triangles in Fig. 13) falls on a mixing line between the cool pool (�30%) and surfacewaters (�70%). The higher surface nitrate (�3 lM) and D-Fe (�5–6 nmol/kg) concentrations in the vicinityof St. Paul Island during Transect N (Figs. 3d and e and 4) appear to be the result of subsurface inputs, assuggested by the cooler surface temperature and the data from Station 10. Sediment sources near the islandmust have augmented the D-Fe concentration obtained by the entrainment of cool pool water into the surface,
Fig. 13. Nitrate (a) and silicic acid (b) concentrations vs. salinity for representative stations near the Aleutian Islands.
A.M. Aguilar-Islas et al. / Progress in Oceanography 73 (2007) 99–126 121
as a mixture of 30% cool pool water and 70% surface water would produce a lower (�2.2 nmol/kg) D-Fe con-centration than observed. This additional sedimentary iron source supplies D-Fe in excess of what would beneeded to allow the complete drawdown of the accompanying nitrate (3 lmol/kg in this case), suggesting thatD-Fe brought to the surface by the Pribilof Islands’ fronts will tend to be elevated throughout the summer,and could provide an additional source of iron to Green Belt waters as suggested by the ‘‘Iron Curtain’’hypothesis.
4.2.4. Outer shelf domain
Nitrate remained depleted in the surface mixed layer of the outer shelf domain, but silicic acid exhibitedhigher concentrations than in the coastal domain or in surface waters of the middle shelf domain (Figs. 3and 5). Along Transects M, N, and A1, surface nitrate concentrations of >0.1 lmol/kg over the outer shelfwere only apparent near the middle front. Along Transect A1, higher nitrate concentrations were alsoobserved over the Bering Canyon (Fig. 7).
The lowest surface D-Fe concentrations (0.1–0.5 nmol/kg) over the Bering Sea shelf were observed in theouter shelf domain (Figs. 4, 6, and 7). Our values are comparable to those reported by Suzuki et al. (2002)(0.08 and 0.4 nmol/kg) for two outer shelf domain stations. Dissolved iron concentrations at intermediatedepths over the outer shelf were low, and our limited data suggest they only became elevated near the bottom(Fig. 6a, Stations 24 and 25). In this domain, summer storms are likely to bring to the surface the low-iron andrelatively nutrient-rich waters of the intermediate layer. This is reflected in the low D-Fe concentrations foundat the surface of the outer shelf domain, where D-Fe was as low as �0.1 nmol/kg. At this concentration ironcan limit diatom growth due to diffusion limitation (Hudson and Morel, 1990).
Isohalines originating near the shelf break at �75 m were observed to shoal and surface in areas where fluo-rescence was elevated (Figs. 3b, 5b, and 7b). These middle front isohalines suggest that waters from the bot-tom layer of the outer shelf with elevated macronutrients and D-Fe could be brought to the surface offshore ofthe shelf break and into Green Belt waters, providing a source of macro- and micronutrients to sustain largephytoplankton stocks. Similarly, a surface outcrop of the shelf break front was observed seaward of the shelfbreak in the Mid-Atlantic Bight, also producing increases in chlorophyll (Ryan et al., 1999).
4.3. Source waters to the Bering Slope Current and Green Belt
Circulation in the southeastern Bering Sea (Fig. 2) feeds waters into the BSC and Green Belt that are amixture of surface water from the vicinity of the Aleutian Islands, carried by the ANSC toward the BeringSea shelf (sampled during Transects A2 and A3), and surface water over the Bering Canyon (sampled duringTransect A1).
The cold temperature and low fluorescence, associated with highly elevated nutrient concentrations in sev-eral regions along Transects A2 and A3, were the result of the enhanced vertical mixing that takes place in thevicinity of the Aleutian Islands (Reed and Stabeno, 1999; Mordy et al., 2005). The concentration of D-Fe(average of 0.80 nmol/kg) supplied to the surface along with nutrients in these regions was much lower thanthe surface D-Fe concentrations near the Pribilof Islands (�5–6 nmol/kg). This is likely a reflection of thesteep topography and lack of a continental shelf to provide sedimentary iron sources.
Moderate fluorescence levels and residual nitrate concentrations were observed along Transects A2 andA3 where surface temperatures had warmed (Figs. 9b and 10b), suggesting that the concentrations of D-Fe (average of 0.82 nmol/kg) supplied from the Aleutian Islands to the ANSC were sufficient for increas-ing biomass and fluorescence, but insufficient to allow complete drawdown of the accompanying nitrateconcentrations (25 lmol/kg). For example, Fe:C ratios of 16 and 36 lmol/mol (calculated from our ironaddition experiments) would require 2.5 nmol/kg and 5.6 nmol/kg D-Fe to fully draw down 25 lmol/kgnitrate.
A plot of nutrient concentrations vs. salinity for representative stations along the Aleutian Islands transects(Fig. 13a and b) shows a simple mixing line between surface and subsurface waters for some stations, such as40 and 42. At other stations (37, 38, 41 and 44) there was evidence of nitrate and silicic acid uptake at thesurface (Fig. 13a and b). The DSi:DN ratios in the surface 80 m for Stations 37–42 and 44–45 were elevatedsimilarly to those observed in the HNLC waters of the oceanic domain along Transects N and M (Table
122 A.M. Aguilar-Islas et al. / Progress in Oceanography 73 (2007) 99–126
2), suggesting some degree of iron limitation. This is consistent with the moderate fluorescence increasesobserved along Transects A2 and A3 (Figs. 9b and 10b).
Surface waters in the vicinity of the Bering Canyon had similar D-Fe, but lower nitrate concentrations thanthe cold waters near the Aleutian Islands. Along Transect 1, isohalines suggest surface waters over the BeringCanyon had a source in the bottom layer of the outer shelf domain. The lower salinity at the surface also sug-gests mixing with outer shelf domain surface waters (Fig. 7b).
4.4. Green Belt
The interpretation of data from this study yields a picture containing complexities beyond the original‘‘Iron Curtain’’ hypothesis, which assumed mixing of surface waters between the oceanic domain (‘‘iron-lim-ited, nitrate-replete region’’) and the outer shelf domain (‘‘iron-replete, nitrate-limited region’’) to explain thepersistence of the Green Belt. Published iron data prior to this study were not sufficient either to prove thatlow iron concentrations are the limiting factor in the oceanic regime of the Bering Sea, or to show that theouter shelf contained elevated iron concentrations. We have now determined the low concentrations of D-Fe (�0.07 nmol/kg) in the oceanic regime were insufficient to allow complete drawdown of the elevated nitrateconcentrations found in this region. We have also shown that the outer shelf contained relatively low concen-trations of D-Fe in its surface and intermediate layers (0.1–0.5 nmol/kg), and that only the bottom layer con-tained elevated D-Fe concentrations.
Along Transects M, N, and A1, surface D-Fe concentrations were low (<0.3 nmol/kg) where fluorescencewas highest, indicating the Green Belt was not iron-replete, and that large diatom cells were likely experiencingsome degree of iron limitation. Five of six stations within the Green Belt (Station 8, 26–28, and 38) had ele-vated DSi:DN ratios in the surface 80 m (Table 2), with an average ratio of 2.0, further supporting the notionof a diatom community in the Green Belt stressed by low iron concentrations.
Property vs. salinity plots of the five surface transects (Fig. 14) provide insight into the surface sources ofnitrate, D-Fe, and D-Mn to the Green Belt. Waters with highest fluorescence along Transects N, and M, werecoincident with a surface salinity range of 32.4–32.7 (Fig. 14a). The spatial location of the transects in Fig. 14is indicated through shades of black; so that transects near the Aleutians (where the initial source waters to theGreen Belt are formed and mixed) are represented with black symbols, the middle transect with dark grey sym-bols, and the northern transect with light grey symbols. Double-headed arrows represent mixing of watermasses, and the thicker, downward pointing arrows represent nutrient drawdown. The initial Green Belt wateris the BSC, formed from a mixture of high salinity, macronutrient-rich ANSC water and lower salinity surfacewaters in the vicinity of the Bering Canyon (Fig. 14b). Nitrate, D-Fe, and D-Mn concentrations in the newlyformed BSC were �15–20 lmol/kg, 0.4–1.6 nmol/kg, and 1.4–3.7 nmol/kg, respectively (Fig. 14b and c), indi-cating that at its southern end the BSC contained elevated macronutrients and intermediate micronutrients toinitiate a bloom. As the BSC traveled along the shelf break, it mixed with waters of the outer shelf and oceanicdomains (grey double-headed arrows in Fig. 14b–d). Additional nitrate was provided by the oceanic domainalong Transects N and M, while, D-Fe and D-Mn did not have an apparent source from the surface waters ofthe outer shelf domain along these transects. Inputs of D-Fe and D-Mn to the Green Belt from the bottomlayer of the outer shelf domain (suggested by the surface outcrop of the middle front into Green Belt waters)were also not obvious in the surface D-Fe vs. salinity and D-Mn vs. salinity plots (Fig. 14c and d). However,the subsurface data from Station 8 showed slight increases with depth in D-Fe (0.1–0.5 nmol/kg) and D-Mn(1.8–2.5 nmol/kg) in the upper 40 m (Fig. 4), where isohalines originating at the shelf break were sampled(Fig. 3b). Surface and subsurface data suggest inputs of D-Fe and D-Mn from the bottom layer of the outerdomain to the Green Belt were small. Small but persistent input of D-Fe from these subsurface waters is con-sistent with the observed residual nitrate, and the low D-Fe concentrations in areas of high fluorescenceobserved along Transects N and M, and with the suggestion of iron stress by the elevated DSi:DN ratios inthe surface 80 m of the Green Belt (Table 2). The elevated surface D-Fe concentrations in the vicinity ofthe Pribilof Islands can potentially be mixed by eddies and/or meanders of the BSC into Green Belt waters,providing an additional source of D-Fe to help maintain the high biomass associated with the Green Belt.
We found the main sources of iron to the Green Belt are surface waters in the vicinity of the AleutianIslands, the bottom layer of the outer shelf domain, and surface waters in the vicinity of the Pribilof Islands.
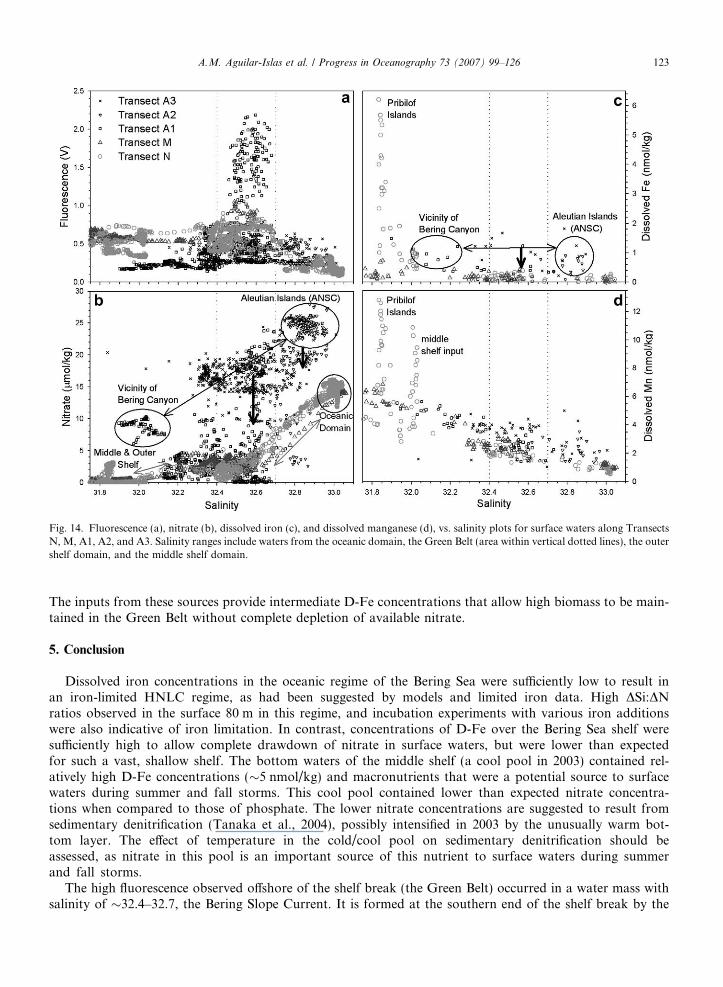
Fig. 14. Fluorescence (a), nitrate (b), dissolved iron (c), and dissolved manganese (d), vs. salinity plots for surface waters along TransectsN, M, A1, A2, and A3. Salinity ranges include waters from the oceanic domain, the Green Belt (area within vertical dotted lines), the outershelf domain, and the middle shelf domain.
A.M. Aguilar-Islas et al. / Progress in Oceanography 73 (2007) 99–126 123
The inputs from these sources provide intermediate D-Fe concentrations that allow high biomass to be main-tained in the Green Belt without complete depletion of available nitrate.
5. Conclusion
Dissolved iron concentrations in the oceanic regime of the Bering Sea were sufficiently low to result inan iron-limited HNLC regime, as had been suggested by models and limited iron data. High DSi:DNratios observed in the surface 80 m in this regime, and incubation experiments with various iron additionswere also indicative of iron limitation. In contrast, concentrations of D-Fe over the Bering Sea shelf weresufficiently high to allow complete drawdown of nitrate in surface waters, but were lower than expectedfor such a vast, shallow shelf. The bottom waters of the middle shelf (a cool pool in 2003) contained rel-atively high D-Fe concentrations (�5 nmol/kg) and macronutrients that were a potential source to surfacewaters during summer and fall storms. This cool pool contained lower than expected nitrate concentra-tions when compared to those of phosphate. The lower nitrate concentrations are suggested to result fromsedimentary denitrification (Tanaka et al., 2004), possibly intensified in 2003 by the unusually warm bot-tom layer. The effect of temperature in the cold/cool pool on sedimentary denitrification should beassessed, as nitrate in this pool is an important source of this nutrient to surface waters during summerand fall storms.
The high fluorescence observed offshore of the shelf break (the Green Belt) occurred in a water mass withsalinity of �32.4–32.7, the Bering Slope Current. It is formed at the southern end of the shelf break by the
124 A.M. Aguilar-Islas et al. / Progress in Oceanography 73 (2007) 99–126
combination of higher salinity, nitrate-rich, but relatively iron-poor Alaska North Slope Current water (orig-inating just north of the Aleutian Islands), and lower salinity, surface water over the Bering Canyon withsimilar D-Fe, but lower nitrate concentrations. As the BSC moves northwestward along the shelf break,the oceanic domain provides additional nutrients and the bottom layer of the outer shelf domain suppliesadditional D-Fe and macronutrients. Surface waters in the vicinity of the Pribilof Islands are a potentialsource of high D-Fe to the BSC. The Green Belt appears to be sustained by a combination of its initialnutrient chemistry and the continuous input of macro- and relatively lower concentrations of micronutrientsthat support its productivity, but do not allow complete drawdown of macronutrients.
Surface D-Mn behaved relatively conservatively with respect to salinity (Fig. 14d). It can be used to tracethe hydrographic domains of the Bering Sea and to provide insight into the original concentration of D-Feprior to biological removal.
Acknowledgements
This research was supported by NSF Grants OCE-0137085 and OCE-0526601 to K.W. Bruland. A.M.Aguilar-Islas was funded by a NSF Graduate Student Fellowship, and an Ida Benson Lynn Graduate StudentFellowship. We thank the Kudela lab for discrete Chl a values, and the Hutchins lab for PN and POC values.We gratefully acknowledge two anonymous reviewers for thoughtful suggestions to improve the original man-uscript. We thank the officers and crew of the R/V Kilo Moana.
References
Aguilar-Islas, A.M., Resin, J.A., Bruland, K.W., 2006. Catalytically enhanced spectrophotometric determination of manganese in
seawater by flow-injection analysis with a commercially available resin for on line preconcentration. Limnology and Oceanography
Methods 4, 105–113.
Banse, K., English, D.C., 1999. Comparing phytoplankton seasonality in the eastern and western subarctic Pacific and the western Bering
Sea. Progress in Oceanography 43, 235–288.
Boyd, P.W. et al., 2004. The decline and fate of an iron-induced subarctic phytoplankton bloom. Nature 428, 549–553.
Boyd, P.W., Strzepek, R., Takeda, S., Jackson, G., Wong, C.S., McKay, R.M., Law, C., Kiyosawa, H., Saito, H., Sherry, N., Johnson, K.,
Gower, J., Ramaiah, N., 2005. The evolution and termination of an iron-induced mesoscale bloom in the northeast subarctic Pacific.
Limnology and Oceanography 50, 1872–1886.
Bruland, K.W., Franks, R.P., Knauer, G.A., Martin, J.H., 1979. Sampling and analytical methods for the determination of copper,
cadmium, zinc and nickel in seawater. Analytica Chimica Acta 105, 233–245.
Bruland, K.W., Rue, E.L., Smith, G.J., 2001. Iron and macronutrients in California coastal upwelling regimes: implications for diatom
blooms. Limnology and Oceanography 45, 1661–1674.
Bruland, K.W., Rue, E.L., Smith, G.J., DiTullio, G.R., 2005. Iron, macronutrients and diatom blooms in the Peru upwelling regime:
brown and blue waters of Peru. Marine Chemistry 93, 81–103.
Buck, K.N., Lohan, M.C., Berger, C.J.M., Bruland, K.W., 2007. Dissolved iron speciation in two distinct river plumes and an estuary:
implications for riverine iron supply. Limnology and Oceanography 52, 843–855.
Coachman, L.K., 1986. Circulation, water masses, and fluxes on the southeastern Bering Sea shelf. Continental Shelf Research 5, 23–108.
Coachman, L.K., Charnell, R.L., 1979. On lateral water mass interaction – a case study, Bristol Bay, Alaska. Journal of Physical
Oceanography 9, 278–297.
Devol, A.H., Codispoti, L.A., Christensen, J.P., 1997. Summer and winter denitrification rates in western Artic shelf sediments.
Continental Shelf Research 17, 1029–1050.
Finkel, Z.V., Quigg, A., Raven, J.A., Reinfelder, J.R., Schofield, O.E., Falkowski, P.G., 2006. Irradiance and the elemental stoichiometry
of marine phytoplankton. Limnology and Oceanography 51, 2690–2701.
Firme, G.F., Rue, E.L., Weeks, D.A., Bruland, K.W., Hutchins, D.A., 2003. Spatial and temporal variability in phytoplankton iron
limitation along the California coast and consequences for Si, N, and C biogeochemistry. Global Biogeochemical Cycles 17 (1).
doi:10.1029/2001GB001824.
Flint, M.V., Sukhanova, I.N., Kopylov, A.I., Poyarkov, S.G., Whitledge, T.E., 2002. Plankton distribution associated with frontal zones
in the vicinity of the Pribilof Islands. Deep-Sea Research Part II 49, 6069–6093.
Fujishima, Y., Ueda, K., Maruo, M., Nakayama, E., Tokutome, C., Hasegawa, H., Matsui, M., Sohrin, Y., 2001. Distribution of trace
bioelements in the subarctic North Pacific Ocean and the Bering Sea (the R/V Hakuho Maru Cruise KH-97-2). Journal of
Oceanography 57, 261–273.
Fung, I.Y., Meyn, S.K., Tegen, I., Doney, S.C., John, J.G., Bishop, J.K.B., 2000. Iron supply and demand in the upper ocean. Global
Biogeochemical Cycles 14, 281–291.
Gledhill, M., van den Berg, C.M.G., Nolting, R.F., Timmermans, K.R., 1998. Variability in the speciation of iron in the northern North
Sea. Marine Chemistry 59, 283–300.
A.M. Aguilar-Islas et al. / Progress in Oceanography 73 (2007) 99–126 125
Greene, R.M., Geider, R.J., Kolber, Z., Falkowski, P.G., 1992. Iron-induced changes in light harvesting and photochemical energy
conversion processes in eukaryotic algae. Plant Physiology 100, 565–575.
Guo, L., Zahng, J.Z., Gueguen, C., 2004. Speciation and fluxes of nutrients (N, P, Si) from the upper Yukon River. Global
Biogeochemical Cycles 18, GB1038. doi:10.1029/2003GB002152.
Harrison, P.J., 2002. Station Papa time series: insight into ecosystem dynamics. Journal of Oceanography 58, 259–264.
Heggie, D., Klinkhammer, G., Cullen, D., 1987. Manganese and copper fluxes from continental margin sediments. Geochimica et
Cosmochimica Acta 51, 1059–1070.
Hudson, R.J.M., Morel, F.M.M., 1990. Iron transport in marine phytoplankton: kinetics of cellular and medium coordination reactions.
Limnology and Oceanography 35, 1002–1020.
Hurst, M.P., Bruland, K.W., 2007. An investigation into the exchange of iron and zinc between soluble, colloidal, and particulate size-
fractions in shelf waters using low-abundance isotopes as tracers in shipboard incubation experiments. Marine Chemistry 103, 211–
226.
Hutchins, D.A., Bruland, K.W., 1998. Iron-limited diatom growth and Si:N uptake ratios in a coastal upwelling regime. Nature 393, 561–
564.
Johnson, K.S., Chavez, F.P., Friederich, G.E., 1999. Continental-shelf sediment as a primary source of iron for coastal phytoplankton.
Nature 398, 697–700.
Kachel, N.B., Hunt Jr., G.L., Salo, S.A., Schumacher, J.F., Stabeno, P.J., Whitledge, T.E., 2002. Characteristics and variability of the
inner front of the southeastern Bering Sea. Deep Sea Research Part II 49, 5889–5909.
Kinder, T.H., Coachman, L.K., 1978. The front overlaying the continental slope in the eastern Bering Sea. Journal of Geophysics
Research 83, 4551–4559.
Kolber, Z.S., Barber, R.T., Coale, K.H., Fitzwater, S.E., Greene, R.M., Johnson, K.S., Lindley, S., Falkowski, P.G., 1994. Iron limitation
of phytoplankton photosynthesis in the equatorial Pacific Ocean. Nature 371, 145–149. doi:10.1038/371145a0.
Kowalik, Z., Stabeno, P., 1999. Trapped motion around the Pribilof Islands in the Bering Sea. Journal of Geophysical Research 104,
25667–25684.
Kremling, K., 1983. Trace metal fronts in European shelf waters. Nature 303, 225–227.
Leblanc, K., Hare, C.E., Boyd, P.W., Bruland, K.W., Sohst, B., Pickmere, S., Lohan, M.C., Buck, K., Ellewood, M., Hutchins, D.A.,
2005. Fe and Zn effects on the Si cycle and diatom community structure in two contrasting high and low-silicate HNLC areas. Deep-
Sea Research Part I 52, 1842–1864. doi:10.1016/j.dsr.2005.06.005.
Lohan, M.C., Aguilar-Islas, A.M., Franks, R.P., Bruland, K.W., 2005. Determination of iron and copper in seawater at pH 1.7 with a new
commercially available chelating resin, NTA Superflow. Analytica Chimica Acta 530, 121–129.
Martin, J.H., Knauer, G.A., 1973. The elemental composition of plankton. Geochimica et Cosmochimica Acta 37, 1639–1653.
Martin, J.H., Fitzwater, S., 1988. Iron deficiency limits phytoplankton growth in the north–east Pacific subactic. Nature 331, 341–343.
McRoy, C., Whitledge, T.E., Springer, A.M., Simpson, E.P. 2001. The nitrate front in the Bering Sea: is this an iron curtain? Oral
presentation abstract. http://www.aslo.org/meetings/aslomeetings.html.
Minakawa, M., Noriki, S., Tsunogai, S., 1998. Manganese in the Bering Sea and the northern North Pacific. Geochemical Journal 32, 315–
329.
Mizobata, K., Saitoh, S., 2004. Variability of Bering Sea eddies and primary productivity along the shelf edge during 1998–2000 using
satellite multisensor remote sensing. Journal of Marine Systems 50, 101–111.
Mizobata, K., Saitoh, S., Shiomoto, S., Miyamura, T., Shiga, N., Toratani, M., Kajiwara, Y., Sasaoka, K., 2002. Bering Sea cyclonic and
anticyclonic eddies observed during summer 2000 and 2001. Progress in Oceanography 55, 65–75.
Moore, J.K., Doney, S.C., Glover, D.M., Fung, I.Y., 2002. Iron cycling and nutrient-limitation patterns in surface waters of the World
Ocean. Deep-Sea Research Part II 49, 463–507.
Mordy, C.W., Stabeno, P.J., Ladd, C., Zeeman, S., Wisegarver, D.P., Salo, S.A., Hunt Jr., G.L., 2005. Nutrients and primary production
along the eastern Aleutian Island Archipelago. Fisheries Oceanography 14, 55–76.
Napp, J.M., Hunt Jr., G.L., 2001. Anomalous conditions in the south-eastern Bering Sea 1997: linkages among climate, weather, ocean,
and biology. Fisheries Oceanography 10, 61–68.
Okkonen, S.R., Schmidt, G.M., Cokelet, E.D., Stabeno, P.J., 2004. Satellite and hydrographic observations of the Bering Sea ‘Green Belt’.
Deep-Sea Research Part II 51, 1033–1051.
Olson, M.B., Strom, S.L., 2002. Phytoplankton growth, microzooplankton herbivory and community structure in the sourtheast Bering
Sea: insight into the formation and temporal persistence of an Emiliania huxleyi bloom. Deep-Sea Research Part II 49, 5969–5990.
Parsons, T.R., Maita, Y., Lalli, C.M., 1984. A Manual of Chemical and Biological Methods for Sweater Analysis. Pergamon Press.
Peers, G., Quesnel, S.A., Price, N.M., 2005. Copper requirements for iron acquisition and growth of coastal and oceanic diatoms.
Limnology and Oceanography 50, 1149–1158.
Reed, R.K., Stabeno, P.J., 1996. On the climatological mean circulation over the eastern Bering Sea shelf. Continental Shelf Research 16,
1297–1305.
Reed, R.K., Stabeno, P.J. 1999. The aleutian north slope current. In: Loughlin, T.R., Ohtani, K. (Eds.), Dynamics of the Bering Sea.
University of Alaska Sea Grant, Fairbanks, AK, pp. 177–191.
Ryan, J.P., Yoder, J.A., Barth, J.A., Cornillon, P.C., 1999. Chlorophyll enhancement and mixing associated with meanders of the shelf
break front in the Mid-Atlantic Bight. Journal of Geophysical Research 104, 23479–23493.
Sambrotto, R.N., Goering, J.J. 1983. Interannual variability of phytoplankton and zooplankton production on the southeast Bering Sea
shelf. In: Wooster, W.S. (Ed.), From Year-to-Year: Interannual Variability of the Environment and Fisheries of the Gulf of Alaska
and the Eastern Bering Sea, Washington State Sea Grant, Seattle, WA, pp. 161–177.
126 A.M. Aguilar-Islas et al. / Progress in Oceanography 73 (2007) 99–126
Sambrotto, R.N., Niebauer, H.J., Goering, J.J., Iverson, R.L., 1986. Relationships among vertical mixing, nitrate uptake, and
phytoplankton growth during the spring bloom in the southeast Bering Sea middle shelf. Continental Shelf Research 6, 161–198.
Schumacher, J.D., Reed, R.K., 1992. Characteristics of currents over the continental slope of the eastern Bering Sea. Journal of
Geophysical Research 97, 9423–9433.
Schumacher, J.D., Stabeno, P.J., 1994. Ubiquitous eddies in the eastern Bering Sea and their coincidence with concentrations in larval
Pollock. Fisheries Oceanography 3, 182–190.
Simpson, E., McRoy, C. 1999. Model evidence of a Bering Sea iron curtain. Oral presentation abstract. http://www.aslo.org/meetings/
aslomeetings.html.
Springer, A.M., McRoy, C.P., Flint, M.V., 1996. The Bering Sea Green Belt: shelf-edge processes and ecosystem production. Fisheries
Oceanography 5, 205–223.
Stabeno, P.J., van Meurs, P., 1999. Evidence of episodic on-shelf flow in the southeastern Bering Sea. Journal of Geophysical Research
104, 29715–29720.
Stabeno, P.J., Hunt Jr., G.L., 2002. Overview of the inner front and southeast Bering Sea carrying capacity programs. Deep-Sea Research
Part II 49, 6157–6168.
Stabeno, P.J., Schumacher, J.D., Salo, S.A., Hunt, Jr.,G.L., Flint, M. 1999. Physical environment around the Pibilof Islands. In: Loughlin,
T.R., Ohtani, K. (Eds.), Dynamics of the Bering Sea. University of Alaska Sea Grant, Fairbanks, AK, pp. 193–215.
Stabeno, P.J., Bond, N.A., Kachel, N.B., Salo, S.A., Schumacher, J.D., 2001. On the temporal variability of the physical environment over
the southeastern Bering Sea. Fisheries Oceanography 10, 81–98.
Stabeno, P.J., Kachel, N.B., Sullivan, P., Whitledge, T.E., 2002a. Variability along the 70-m isobath of the southeastern Bering Sea. Deep-
Sea Research Part II 49, 5931–5943.
Stabeno, P.J., Reed, R.K., Napp, J.M., 2002b. Transport through Unimak Pass, Alaska. Deep-Sea Research, Part II 49, 5919–5930.
Statham, P.J., Auger, Y., Burton, J.D., Choisy, P., Fischer, J.C., James, R.H., Morley, N.H., Ouddane, B., Puskaric, E., Wartel, W., 1993.
Fluxes of Cd, Co, Cu, Fe, Mn, Ni, Pb, and Zn through the Strait of Dover into the Southern North-Sea. Oceanologica Acta 16 (5–6),
541–552.
Stockwell, D.A., Whitledge, T.E., Zeeman, S.I., Coyle, K.O., Napp, J.M., Brodeur, R.D., Pinchuk, A.I., Hunt Jr., G.L., 2001. Anomalous
conditions in the southeastern Bering Sea, 1997: nutrients, phytoplankton and zooplankton. Fisheries Oceanography 10, 99.
doi:10.1046/j.1365–2419.2001.00158.x.
Sukhanova, I.N., Semina, H.J., Venttsel, M.V. 1999. Spatial distribution and temporal variability of phytoplankton in the Bering Sea. In:
Loughlin, T.R., Ohtani, K. (Eds.), Dynamics of the Bering Sea, University of Alaska Sea Grant, Fairbanks, AK, pp. 453–483.
Suzuki, K., Liu, H., Saino, T., Obata, H., Takano, M., Okamura, K., Sohrin, Y., Fujishima, Y., 2002. East–west gradients in the
photosynthetic potential of phytoplankton and iron concentration in the subarctic Pacific Ocean during early summer. Limnology and
Oceanography 46, 1581–1594.
Tanaka, T., Guo, L., Deal, C., Tanaka, N., Whitledge, T., Murat, A., 2004. N deficiency in a well-oxygenated cold bottom water over the
Bering Sea shelf: influence of sedimentary denitrification. Continental Shelf Research 24, 1271–1283.
Takata, H., Kuma, K., Iwade, S., Isoda, Y., 2005. Comparative vertical distributions of iron in the Japan Sea, the Bering Sea, and the
western North Pacific Ocean. Journal of Geophysical Research 110. doi:10.1029/2004JC002783.
Tyrrell, T., Merico, A., Waniek, J.J., Wong, C.S., Metzl, N., Whitney, F., 2005. Effect of seafloor depth on phytoplankton blooms in high-
nitrate, low-chlorophyll (HNLC) regions. Journal of Geophysical Research 110. doi:10.1029/2005JG000041.
Walsh, J.J., McRoy, C.P., Coachman, L.K., Goering, J.J., Nihoul, J.J., Whitledge, T.E., Blackburn, T.H., Parker, P.L., Wirick, C.D.,
Shuert, P.G., Grebmeier, J.M., Springer, A.M., Tripp, R.D., Hansell, D., Djenidi, S., Deleersnijder, E., Henriksen, K., Lund, B.A.,
Andersen, P., Muller-Karger, F.E., Dean, K., 1989. Carbon and nitrogen cycling with the Bering/Chukchi Seas: Sources regions for
organic matter affecting AOU demands of the Arctic Ocean. Progress in Oceanography 22, 277–359.
Wells, M.L., Mayer, L.M., 1991. Variations in the chemical lability of iron in estuarine, coastal and shelf waters and its implications for
phytoplankton. Marine Chemistry 32, 195–210.
Whitledge, T.E., Reeburgh, W.S., Walsh, J.J., 1986. Seasonal inorganic nitrogen distributions and dynamics in the southeastern Bering
Sea. Continental Shelf Research 5, 132–190.
Whitledge, T.E., Luchin, V.A. 1999. Summary of chemical distributions and dynamics in the Bering Sea. In: Loughlin, T.R., Ohtani, K.
Dynamics of the Bering Sea. University of Alaska Sea Grant, Fairbanks, AK, pp. 217–249.
Yamamoto-Kawai, M., Carmack, E., McLaughlin, F., 2006. Nitrogen balance and Arctic throughflow. Nature 443, 43.