Milton, Petrarch, and the Angst of the Christian Poet - Diginole ...
Upload
khangminh22Category
view
3download
0
Florida State University Libraries
Electronic Theses, Treatises and Dissertations The Graduate School
2007
Real-Time Construction Project ProgressTracking: A Hybrid Model for WirelessTechnologies Selection, Assessment, andImplementationAmine Ghanem
Follow this and additional works at the FSU Digital Library. For more information, please contact [email protected]
THE FLORIDA STATE UNIVERSITY
COLLEGE OF ENGINEERING
REAL-TIME CONSTRUCTION PROJECT PROGRESS TRACKING: A HYBRID MODEL FOR WIRELESS TECHNOLOGIES SELECTION, ASSESSMENT, AND
IMPLEMENTATION
By
AMINE GHANEM
A Dissertation submitted to the Department of Civil and Environmental Engineering
in partial fulfillment of the requirements for the degree of
Doctor of Philosophy
Degree Awarded: Summer Semester, 2007

ii
The members of the Committee approve the Dissertation of Amine Ghanem defended on June 8, 2007.
________________________
Yassir A. AbdelRazig Professor Directing Dissertation
________________________
Jeffrey R. Brown Outside Committee Member
________________________
John O. Sobanjo
Committee Member
________________________
Wei-Chou V. Ping Committee Member
Approved: ___________________________________________________________
C. J. Chen, Dean, College of Engineering, Florida State University
The Office of Graduate Studies has verified and approved the above named committee members.

iii
To My parents,
Abdallah and Aicha And my sisters
Lina, Dima, and Nadine Who made all of this possible
For their endless encouragement and support
And also to My fiancé
Nermine Majzoub For her love and patience

iv
ACKNOWLEDGEMENTS
First and foremost, I thank Allah for His continuous bounties and guidance
in my life.
This dissertation concludes a learning journey at Florida State University. I
am grateful to many individuals who contributed to my learning experience at
Florida State University.
I would like to express my sincerest thanks to many key people: At the top
of the list, my advisor, Dr. Yassir AbdelRazig for his valuable guidance,
inspiration, and advice. Sincere appreciation is also extended to my committee
members: Dr. Jeffrey R. Brown, Dr. John O. Sobanjo, and Dr. Wei-Chou V. Ping,
who gave their time and input to my research. I would like also to thank Dr.
Garold Oberlender for his unconditional support and valuable advice and
feedback.
The assistance offered by Sperry & Associates and Haskell Company to
collect valuable data should be gratefully acknowledged here.
This research would not have been possible without the people who took
part of the survey I performed, and to whom I have promised anonymity. I am
also very thankful to my colleagues Dr. Mohamad El-Gafy, Mr. Rassem Awwad,
and Mr. Hassan Ghanem whose help in some of the conceptual thinking was
invaluable.
v
TABLE OF CONTENTS List of Tables ....................................................................................Page ix List of Figures .....................................................................................Page xi Abstract ..........................................................................................Page xiii Chapter 1 Introduction ............................................................................Page 1 1.1 Background .......................................................................Page 1 1.2 Problem Statement............................................................Page 4 1.3 Research Objectives .........................................................Page 6 1.4 Research Methodology......................................................Page 7 1.4.1 Problem Identification...................................................Page 7 1.4.2 Model Formulation .......................................................Page 8 1.4.3 Model Implementation..................................................Page 8 1.5 Dissertation Organization ..................................................Page 10 Chapter 2 Prior Research Efforts............................................................Page 12 2.1 Project Tracking ................................................................Page 12 2.1.1 Technology in Material Tracking........................................Page 15 2.1.2 Technology in Equipment and Labor Tracking ..................Page 17 2.2 Computer & Wireless Integrated Construction ..................Page 18 2.3 Bar Code ...........................................................................Page 20 2.3.1 Bar Codes Applications in Construction ............................Page 21 2.4 RFID ..................................................................................Page 22 2.4.1 Tags or Transponder.........................................................Page 22 2.4.2 Antenna .............................................................................Page 23 2.4.3 Reader...............................................................................Page 24 2.4.4 RFID Applications in Construction.....................................Page 25 2.5 Construction Site Information ...........................................Page 26 2.5.1 Construction Site Information Needs.................................Page 27 2.5.2 Construction Site Information Users..................................Page 28 2.6 Survey of Wireless Technologies in Construction .............Page 29 2.6.1 Wireless Technologies in Construction..............................Page 29 2.6.2 Barriers to Wireless Applications in Construction ..............Page 30 Chapter 3 Background .......................................................................Page 32 3.1 Wireless Technologies ......................................................Page 32 3.1.1 Mobile Hardware ...............................................................Page 32 3.1.1.1 Personal Digital Assistants...........................................Page 33 3.1.1.2 Handheld Computers ...................................................Page 33
vi
3.1.1.3 Pen Tablet/Touch PC...................................................Page 33 3.1.1.4 Rugged Notebooks ......................................................Page 34 3.1.1.5 Wearable Computers/Digital Hardhats.........................Page 34 3.1.1.6 Digital Pen....................................................................Page 34 3.1.2 Networks............................................................................Page 35 3.1.2.1 Wireless Wide Area Networks......................................Page 36 3.1.2.2 Wireless Local Area Networks .....................................Page 36 3.1.2.3 Satellites Networks.......................................................Page 38 3.1.3 Mobile Applications ............................................................Page 39 3.1.3.1 CAD Applications .........................................................Page 39 3.1.3.2 Data Capture Applications...........................................Page 39 3.1.3.3 Project Management Application..................................Page 40 3.2 Technology Assessment Methods.....................................Page 40 3.2.1 Assumptions and Fundamentals of Utility Theory .............Page 41 3.2.2 Types of Utility Functions .................................................Page 43 3.2.3 Hierarchical Structure of MAUT.........................................Page 45 3.2.3.1 Defining Evaluation Objectives ....................................Page 45 3.2.3.2 Defining Alternative Attributes......................................Page 45 3.2.3.3 Attribute Characteristics ...............................................Page 46 3.2.3.4 Assigning Attribute Weights .........................................Page 46 3.2.4 Analytical Hierarchy Process.............................................Page 48 3.2.4.1 Setting Priorities ..........................................................Page 49 3.2.4.2 Pairwise Comparison Scale.........................................Page 49 3.2.4.3 Eigenvector Prioritization Method ................................Page 50 3.3 Computer Construction Simulation....................................Page 53 3.3.1 General Modeling and Simulation Systems.......................Page 53 3.3.1.1 GPSS...........................................................................Page 54 3.3.1.2 HOCUS ........................................................................Page 54 3.3.1.3 ITHINK.........................................................................Page 55 3.3.1.4 SLAMII.........................................................................Page 55 3.3.2 Construction Simulation Using Networks...........................Page 55 3.3.2.1 Cyclone........................................................................Page 55 3.3.2.2 RESQUE.....................................................................Page 56 3.3.2.3 COOPS........................................................................Page 57 3.3.2.4 CIPROS ......................................................................Page 57 3.3.2.5 STROBOSCOPE ........................................................Page 57 Chapter 4 Real time project progress tracking model ........................Page 59 4.1 Framework for real time project progress tracking.............Page 59 4.2 Hardware and Software Selection .....................................Page 61 4.2.1 Hardware Selection......................................................Page 61 4.2.1.1 Computer Alternatives .................................................Page 61 4.2.1.2 Wireless Infrastructure Alternatives.............................Page 64 4.2.1.3 Smart Chips Alternatives .............................................Page 65 4.2.2 Software Selection .......................................................Page 66
vii
4.3 Implementation Steps........................................................Page 66 4.3.1 Work Progress Measurement ......................................Page 69 4.4 Construction of Data Management System ......................Page 69 4.4.1 Data Dictionary..................................................................Page 70 4.4.2 Project Database...............................................................Page 73 4.4.2.1 Database Queries ........................................................Page 74 Chapter 5 Technology Selection and Assessment..................................Page 77 5.1 Assessment Model ............................................................Page 77 5.1.1 Defining the Problem.........................................................Page 77 5.1.2 Explanation of Model Attributes.........................................Page 79 5.1.3 Defining Attribute Measuring Scales..................................Page 82 5.2 Utility Function Survey.......................................................Page 83 5.2.1 Measuring Weights............................................................Page 84 5.2.2 Consistency Checks..........................................................Page 86 5.3 Procedure for Constructing Single AUF.............................Page 89 5.3.1 Multiple Attribute Utility Function Development .................Page 91 5.4 Sensitivity Analysis ............................................................Page 96 5.4.1 Effect of Changing Cost.....................................................Page 96 5.4.2 Effect of Changing Risk Weight.........................................Page 98 Chapter 6 Steel Construction Process Case Studies..............................Page 100 6.1 Case Study........................................................................Page 100 6.1.1 Case Study 1: Turbocor Project ........................................Page 100 6.1.2 Case Study 2: Jefferson County High School Project........Page 102 6.2 Steel Construction Process Overview ...............................Page 104 6.2.1 Preplanning and Fabrication..............................................Page 104 6.2.2 Shipment and Unloading ...................................................Page 105 6.2.3 Steel Erection ....................................................................Page 106 6.3 Model Existing Steel Construction Processes ...................Page 106 6.4 Productivity Measurement .................................................Page 108 6.4.1 PEB Simulation Model.......................................................Page 109 6.4.2 Process Inefficiency...........................................................Page 112 6.5 Steel Construction Process Updated.................................Page 114 6.5.1 Development of a Data Flow Diagram...............................Page 114 6.5.2 Proposed Process .............................................................Page 116 6.5.3 Simulation Model...............................................................Page 118 6.6 Simulation Outputs ............................................................Page 120 6.7 Proposed Model Benefits ..................................................Page 122 6.7.1 Function A: Site Inspection Savings ..................................Page 129 6.7.2 Function B: Problem Solving Savings................................Page 130 6.7.2.1 Cost Benefit Analysis ...................................................Page 132 6.7.2.2 Sensitivity and Break-Even Analysis ............................Page 133 6.7.3 Function C: Wireless Data Access Savings.......................Page 134
viii
6.7.3.1 Cost Benefit Analysis ...................................................Page 136 6.7.4 Function D: E-Document Management .............................Page 137 Chapter 7 Conclusions and Recommendations......................................Page 139 7.1 Summary of the Research.................................................Page 139 7.2 Research Contribution.......................................................Page 140 7.3 Limitations .........................................................................Page 142 7.4 Recommendations for Future Work...................................Page 142 APPENDICES .....................................................................................Page 144 A Smart Chips...............................................................................Page 144 B Survey .....................................................................................Page 152 C Case Study Documents.............................................................Page 160 D Simulation Input/Output Files ....................................................Page 176 REFERENCES .....................................................................................Page 190 BIOGRAPHICAL SKETCH ....................................................................Page 198
ix
LIST OF TABLES Table 2.1: Tracking Methods ..................................................................Page 13 Table 3.1: Pairwise Comparison Scale Presented by Saaty ...................Page 50 Table 3.2: Approximated Random Indices RI .........................................Page 52 Table 4.1: Rugged Mobile Device Comparison.......................................Page 63 Table 4.2: Database Dictionary...............................................................Page 71 Table 5.1: Attribute Measures.................................................................Page 82 Table 5.2: Assessment of UL...................................................................Page 90 Table 5.3: Assessment of UH ..................................................................Page 90 Table 5.4: Single Attribute Utility Functions ............................................Page 93 Table 5.5: Technology Alternatives.........................................................Page 94 Table 5.6: Alternatives Measures............................................................Page 94 Table 5.7: Utility of Alternatives Case Study 1 ........................................Page 95 Table 5.8: Utility of Alternatives Case Study 2 ........................................Page 95 Table 5.9: Utility Variations Based on Costs Changes............................Page 97 Table 5.10: Utility Variations Based on Risk Weight Changes................Page 98 Table 6.1: Productivity Ratings ...............................................................Page 109 Table 6.2: Simulated Productivity Results...............................................Page 121 Table 6.3: LCC Input Data ......................................................................Page 123 Table 6.4: LCC Calculation .....................................................................Page 124 Table 6.5: LCC Summary Case Study 1 .................................................Page 127 Table 6.6: LCC Summary Case Study 2 .................................................Page 128
x
Table 6.7: Benefits Calculation of Function A Case Study 1...................Page 129 Table 6.8: Benefits Calculation of Function A Case Study 2...................Page 130 Table 6.9: Benefits Calculation of Function B Case Study 1...................Page 131 Table 6.10: Benefits Calculation of Function B Case Study 2.................Page 132 Table 6.11: Cost Benefit Analysis of Function B Case Study 1...............Page 132 Table 6.12: Cost Benefit Analysis of Function B Case Study 2...............Page 132 Table 6.13: Benefits Calculation of Function C .......................................Page 134 Table 6.14: Rework & Process Elimination Savings Case Study 1.........Page 135 Table 6.15: Rework & Process Elimination Savings Case Study 2.........Page 135 Table 6.16: Summary of Benefits of Function C Case Study 1 ...............Page 135 Table 6.17: Summary of Benefits of Function C Case Study 2 ...............Page 135 Table 6.18: Cost Benefit Analysis of Function C Case Study 1 ..............Page 136 Table 6.19: Cost Benefit Analysis of Function C Case Study 2 ..............Page 136 Table 6.20: Benefits Calculation of Function D .......................................Page 137 Table 6.21: Summary of Benefits Case Study 1 .....................................Page 137 Table 6.22: Summary of Benefits Case Study 2 .....................................Page 138

xi
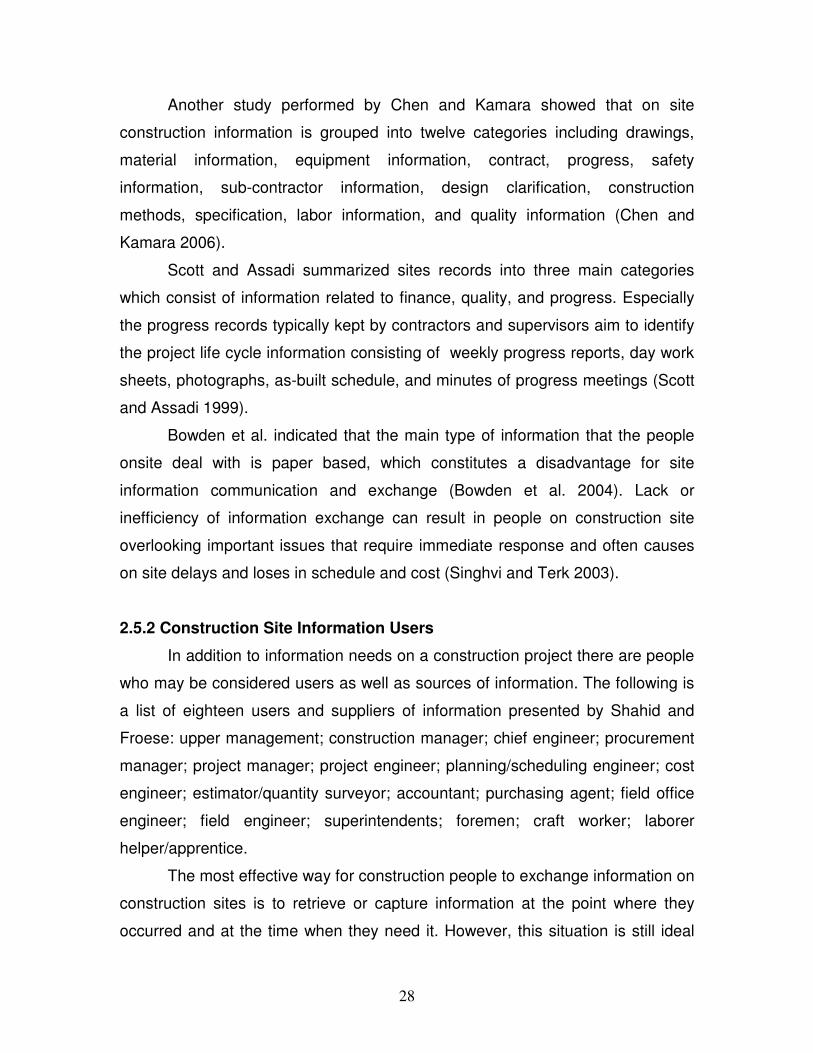
LIST OF FIGURES Figure 1.1: Construction Labor Productivity ............................................Page 2 Figure 1.2: Research Methodologies .....................................................Page 9 Figure 2.1: Basic Barcode Structure .......................................................Page 20 Figure 2.2: Antenna Sealed with RFID Tag ............................................Page 23 Figure 2.3: Handheld Stationary Readers...............................................Page 24 Figure 2.4: Digital Hardware Used in the Construction ...........................Page 29
Figure 2.5: Cutting Edge Tools Used in the Construction ......................Page 30
Figure 2.6: Barriers to Wireless Applications in Construction .................Page 31 Figure 3.1: Types of Mobile PC’s............................................................Page 35 Figure 3.2: Types of Utility Curves ..........................................................Page 44 Figure 3.3: Sample Comparison Matrix...................................................Page 49 Figure 3.4: Normalized Matrix.................................................................Page 50 Figure 3.5: Eigenvector Matrix ................................................................Page 51 Figure 3.6: Transition Matrix ...................................................................Page 51 Figure 4.1: Model Framework .................................................................Page 60 Figure 4.2: Data Exchange and Reporting..............................................Page 67 Figure 4.3: General System Configuration..............................................Page 68 Figure 4.4: Database Management System............................................Page 70 Figure 4.5: Project Database Tables and their Relationships .................Page 74 Figure 4.6: User Interface .......................................................................Page 75 Figure 4.7: Project Updates ....................................................................Page 75
xii
Figure 4.8: Erection Drawings.................................................................Page 76 Figure 5.1: Analytic Hierarchy Process ...................................................Page 78 Figure 5.2: Hierarchy of Influence as Applied in the Study .....................Page 81 Figure 5.3: Job Title Survey Respondents ..............................................Page 84 Figure 5.4: Pairwise Comparisons ..........................................................Page 85 Figure 5.5: Consistency Checks .............................................................Page 89 Figure 5.6: Cost Analysis ........................................................................Page 97 Figure 5.7: Risk Weight Analysis ............................................................Page 98 Figure 6.1: Different Construction Phases ..............................................Page 102 Figure 6.2: Aerial View of JCHS Site ......................................................Page 103 Figure 6.3: MSC Panel Fabrication.........................................................Page 103 Figure 6.4: Tilt-Up Panel Wall Erection ...................................................Page 104 Figure 6.5: PEB Fabrication....................................................................Page 105 Figure 6.6: Unloading Steel Members.....................................................Page 105 Figure 6.7: Erection.................................................................................Page 106 Figure 6.8: Materials and Information Flow.............................................Page 107 Figure 6.9: Shipping Simulation Model ...................................................Page 111 Figure 6.10: Erection Simulation Model ..................................................Page 112 Figure 6.11: To Be Materials and Information Flow ................................Page 115 Figure 6.12: Copying Information to the RFID Tags................................Page 117 Figure 6.13: Proposed Shipping Simulation Model .................................Page 119 Figure 6.14: Proposed Erection Simulation Model..................................Page 120 Figure 6.15: Cost-Benefit Chart for Two Variables..................................Page 133

xiii
ABSTRACT
A construction project is considered as a process that involves many
activities and a large amount of information of various types that are related to
each other. Successful project management requires controlling all aspects of a
construction project: quality and quantity of work, costs, and schedules to
guarantee the success of the project. So the construction project control aims to
effectively obtain real-time information of activities taking place on the site.
Meanwhile, paper-based documents of project management used are becoming
ineffective and can’t get quick responses to the office and project control center.
Integrating promising information technologies such as radio frequency
identification (RFID), mobile computing devices, and wireless technology can be
extremely useful for improving the effectiveness and convenience of information
flow in construction projects. The probable benefits are potentially enormous, but
the barriers associated with technology adoption within the construction industry,
currently outweigh this potential.
This research develops a control system for construction projects. The main
objectives of this research include (1) developing a framework for real time
construction project tracking; (2) applying such a system that integrates RFID
technology with mobile computing and wireless technology to increase the
efficiency of jobsite communication and data collection; (3) designing a database
system for construction activities and updates, providing real-time information
and wireless communication between offices and sites, subcontractors and
suppliers; (4) developing a hybrid model for wireless technologies selection,
assessment and implementation; (5) applying the model on pre-engineered steel
construction projects and performing life cycle cost and cost benefit analysis.
This model will greatly increase productivity and efficiency, will reduce labor
hours and time required for tracking.
1
CHAPTER 1
INTRODUCTION
1.1 Background
Construction is one of the largest industries in the United States, and its
second largest employer after government agencies. According to an
employment report from the U.S. Bureau Labor Statistics, construction
employment in the U.S. in the second quarter of 2005 account for roughly 7.2
million, or 5.4 percent of non-farm payroll employment (U.S. Census Bureau
2004). Moreover, the value of construction invested, a measure of the amount
spent on design, engineering, and construction, totaled $ 1 trillion in May 2004,
according to the Census Bureau. This amount is equivalent to roughly eight
percent of the U.S. gross domestic product (GDP). However the construction
industry has suffered from low performance due to low productivity, high accident
rates, late completion, and poor quality (Kashiwagi et al., 2004). In 2003, the U.S.
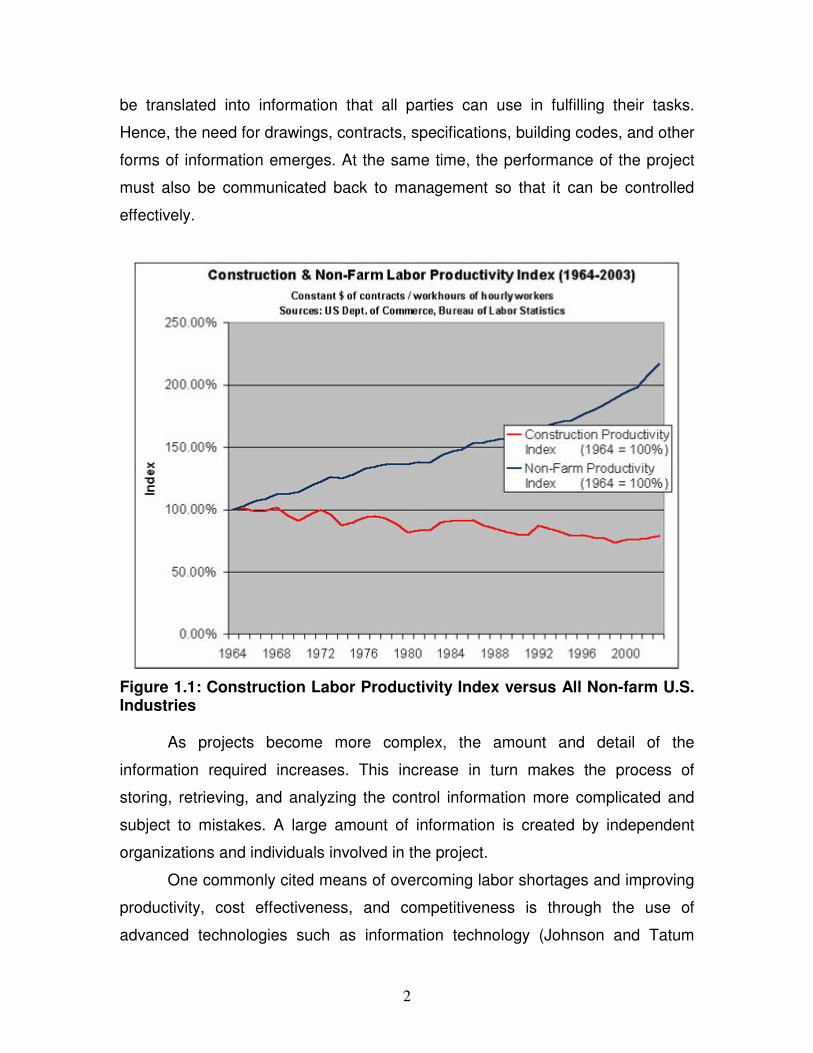
Bureau of Labor Statistics showed that labor productivity in construction has
been lagging behind other U.S. industries (see Figure 1) for the past 40 years.
A study performed by Nuntasunti (2003) summarized five factors
preventing the construction industry from improving performance: 1)
Fragmentation of the construction industry; 2) project specific nature of
construction; 3) temporary nature of relationships; 4) competitive bidding system;
and 5) stand alone islands of communication.
A construction project essentially involves a large amount of information of
various types. This is due to the fact that different parties perform independent
tasks on a project to produce a single final product. Since the design of a project
must somehow be communicated to many parties on the construction site, it is
important that clear information, coherent and efficient communication exist to
ensure successful work by all participants in the project. The specifications must
2
be translated into information that all parties can use in fulfilling their tasks.
Hence, the need for drawings, contracts, specifications, building codes, and other
forms of information emerges. At the same time, the performance of the project
must also be communicated back to management so that it can be controlled
effectively.
Figure 1.1: Construction Labor Productivity Index versus All Non-farm U.S. Industries
As projects become more complex, the amount and detail of the
information required increases. This increase in turn makes the process of
storing, retrieving, and analyzing the control information more complicated and
subject to mistakes. A large amount of information is created by independent
organizations and individuals involved in the project.
One commonly cited means of overcoming labor shortages and improving
productivity, cost effectiveness, and competitiveness is through the use of
advanced technologies such as information technology (Johnson and Tatum
3
1993). Information technology (IT) was developed as a means of meeting
complex information demands and of automating the tasks associated with them.
Advances in IT promised great leaps in productivity in the late 20th century,
however few industries have truly profited from IT’s promises. In the same
manner, automation technologies such as robotics offered similar benefits to the
construction industry with few tangible benefits yet realized (Skibniewsky and
Hendrickson 1990, Farid 1993).
The construction industry lags behind other industries in adopting
innovative new technologies. The need to accelerate the rate of technological
adoption in the construction industry has been well documented in the literature
(Mitropoulos and Tatum, 2000). This adoption comes from continuously seeking,
recognizing, and implementing new technologies that improve construction
processes (Laborde and Sanvido 1994). Each technology has its own technical,
economic, and risk considerations that make the selection process a difficult one.
The selection decision involves many tradeoffs among technology attributes.
Unlike the structured environment and highly repetitive processes in
manufacturing, construction poses many barriers to the implementation of
advanced technologies. Characteristic fragmentation, diversity, and fierce
competition of the construction industry combine to make research and
development (R&D) difficult (Tucker 1988). In a fiercely competitive environment
with thin profit margins, individual firms, especially the smaller ones, simply can’t
afford to conduct R&D or pay added regulatory costs of introducing new
technologies. In 1997, the industry spent only 0.6 percent of total revenues on
R&D, whereas most other industries committed 4 to 6 percent. An unfocused and
uncoordinated effort among the various R&D sectors makes this chronic under-
funding worse. The National Institute for Standards and Technology (NIST), the
Department of Transportation, and the Department of Energy sponsor conduct,
or cost-share with industry and academia research activities. The National
Science Foundation (NSF) funds more than 70 percent of academia’s
construction R&D efforts. The Army Corps of Engineer’s Engineering Research
and Development Center and the Naval Facilities Engineer Command’s
4
Engineering Service Center conduct lion’s share of government R&D. The
construction industry has barely just begun to examine ways of integrating its
management processes with information technology into a unified system. Non-
profit organizations such as the Construction Industry Institute (CII) and the
National Institute of Standards and Technology (NIST) are spearheading these
efforts through their FIATECH (Fully Integrated and Automated Technology) and
CONSIAT (Construction Integrated and Automation Technology) programs,
respectively, and are starting to address the barriers that stand in the way along
with research in Enterprise Resource Planning (ERP) in construction at other
institutions (O’Connor and Dodd 2000).
1.2 Problem Statement
During the construction phase of a project it is essential that efficient and
timely flow of information prevail throughout the process. The construction
industry is dynamic by nature and requires that all parties be kept informed of
activities that can ultimately affect the cost, schedule or performance of the work.
The paper-based documentation of site processes is ineffective anymore as it is
unable to deliver just in time information. At the same time paper documentation
can’t get the quick response from the office to the construction site and vice
versa. As a result, a gap in time and space between the job site and office
causes the lack and confusion of data and information. The effectiveness of
information and data acquisition influences the flow of information between the
office and the construction site. Field supervisory personnel on construction site
spend between 30-50% of their time recording and analyzing field data
(McCullouch 1997) and 2% of the work on construction sites is devoted to
manual tracking and recording of progress data (Cheok et al. 2000). Accuracy of
the collected data depends on judgments and writing skills of the people
collecting data (Liu 1995). In addition, since most data items are not captured
digitally, data transfer from a site to a field office requires additional time. When
the required data is not captured accurately or completely, extra communication
5
is needed between the site office and field personnel (Thorpe and Mead 2001).
These extra efforts are time consuming and waste of money. These inefficiencies
are embedded and distributed among many different activities and project
participants, and hence, the project team is generally not aware of the
implications and aggregate time and money waste associated with them.
Wireless technologies can be used to improve the accuracy and timeliness of the
data collected from sites and to improve communication flow. Previous research
on such technologies mainly discussed the technological feasibility of using a
particular technology to support various construction project tasks (Akinci et al.
2005, Jaselskis et al. 1995). But still there is a need for a comprehensive
framework to assess the effectiveness of using such technologies that
encompasses all different merits together: performance, reliability, risk, and cost.
The following section summarizes several problem areas in the
construction that this thesis will address:
(1) Independent islands of communication on the construction site:
Lacks of effective communication among various parties involved in
construction projects make information exchange inefficient. Moreover,
paper-based handling of change orders and Request for Information
(RFIs) increases difficulties in information exchange in a timely manner.
Even though project participants have been using various project
management tools to improve communication, there are still deficiencies
in updating the schedule and the progress of the construction project in a
real time fashion
(2) Obsolete paper-based and as-built drawings:
Paper prints are currently used to exchange design, shop, erection, and
as built drawings between project participants. Duplication of effort,
inconsistencies, errors, missing information, and extensive time needed to
find relevant information are common in paper-based documents.
(3) Decrease in productivity created by ineffective flow of information:
This problem is created by lack of information about availability of
materials on the construction site. Materials handling and storing is also a
6
problem. Time is commonly wasted trying to figure out where materials
are on the construction site, and whether or not there is enough quantity.
(4) Lack of assessing method for decision makers to select a
technology:
Each technology has its own technical, economic and risk consideration
that make the selection process difficult. Considering one aspect in
choosing and ignoring the others may not lead to the optimal decision.
Currently there are no tool that rationalizes and facilitates this complicated
decision making process.
1.3 Research Objectives
The overall objective of this research is to develop a hybrid model, based
on a combination of Radio Frequency Identification tags (RFID), mobile
computing, and wireless technologies in tracking the progress of construction
project. This research develops a project progress control system for
construction projects. Mainly, the control system is a central database that will
provide real-time and updated information for different parties on a construction
project. In addition, a multi-attribute utility model is developed to help decision
makers select the appropriate IT to the required construction application. Two
pre-engineered steel construction buildings are used as case studies application
of the proposed model
The detailed objectives of this research include:
(1) Investigating integration of RFID technology with Mobile computing and
wireless technology as a communication and data collection tool for
construction jobsite.
(2) Designing a central Database for construction activities and updates,
providing real-time information and facilitating wireless communication
between offices and sites, subcontractors and suppliers.
(3) Developing a framework for real-time construction project tracking.

7
(4) Developing a hybrid model for wireless technologies selection,
assessment and implementation.
(5) Applying the model on a pre-engineered steel construction and performing
a life cycle cost and cost benefit analysis, to illustrate the model
framework.
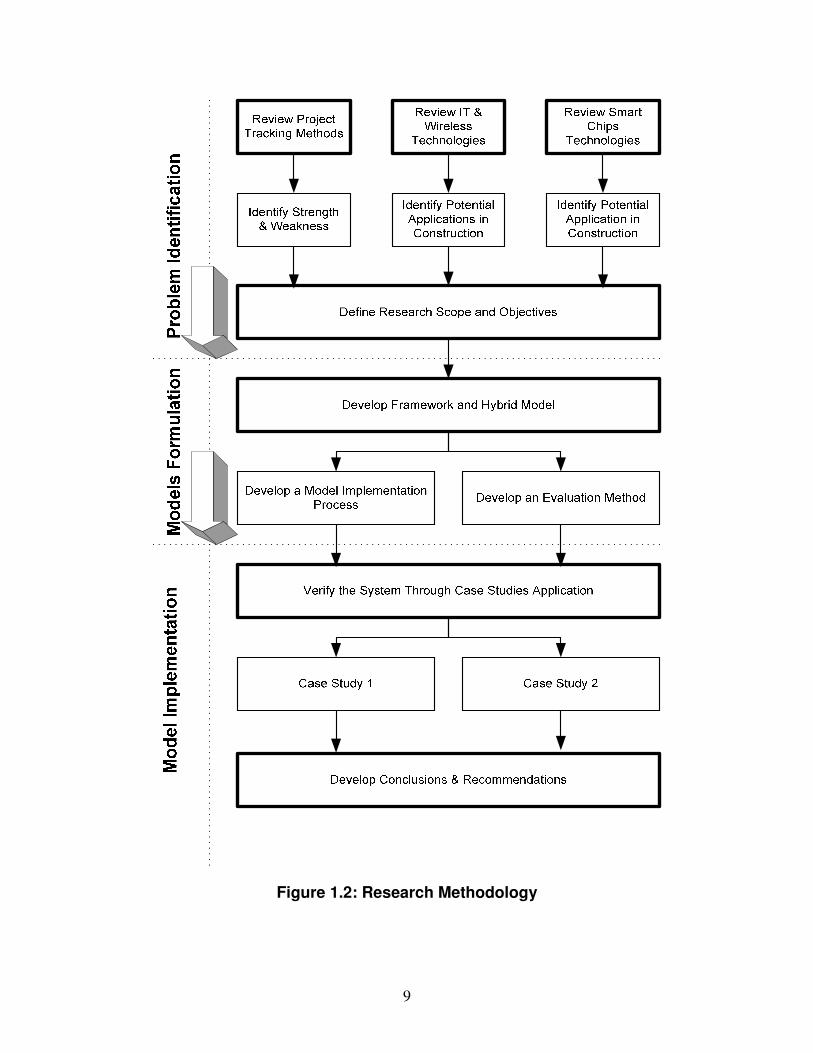
1.4 Research Methodology
This research is divided into three main phases: problem identification
phase, model formulation phase, and system implementation through real case
studies. Each phase includes several steps to achieve the objectives of that
particular phase. Figure 1.2 illustrates the different phases and steps for the
research methodology.
1.4.1 Problem Identification
This phase include reviewing current practices of project progress tracking
and information flow on the construction site to pinpoint the deficiencies in these
practices. The objective of this step is to establish the need for a more efficient,
up-to-date, and reliable practice for project control and monitoring. Another step
is reviewing the use of smart chips and wireless technologies in construction, and
discussing the different application of each technology. Moreover, another step is
to review a survey conducted by ASCE to identify barriers to wireless application.
The objective of the previous two steps is to find ways of to implement
technologies in construction and how to overcome the barriers to its
implementation.
The objectives of the problem identification phase are to define the scope
of the research and to establish the background necessary to accomplish the
research objectives. The focus of the research is to develop a framework for real
time project tracking, and to develop a hybrid assessment model for wireless
technologies. The system is considered hybrid because it uses two quantification
methods in assessment: subjective and objective.
8
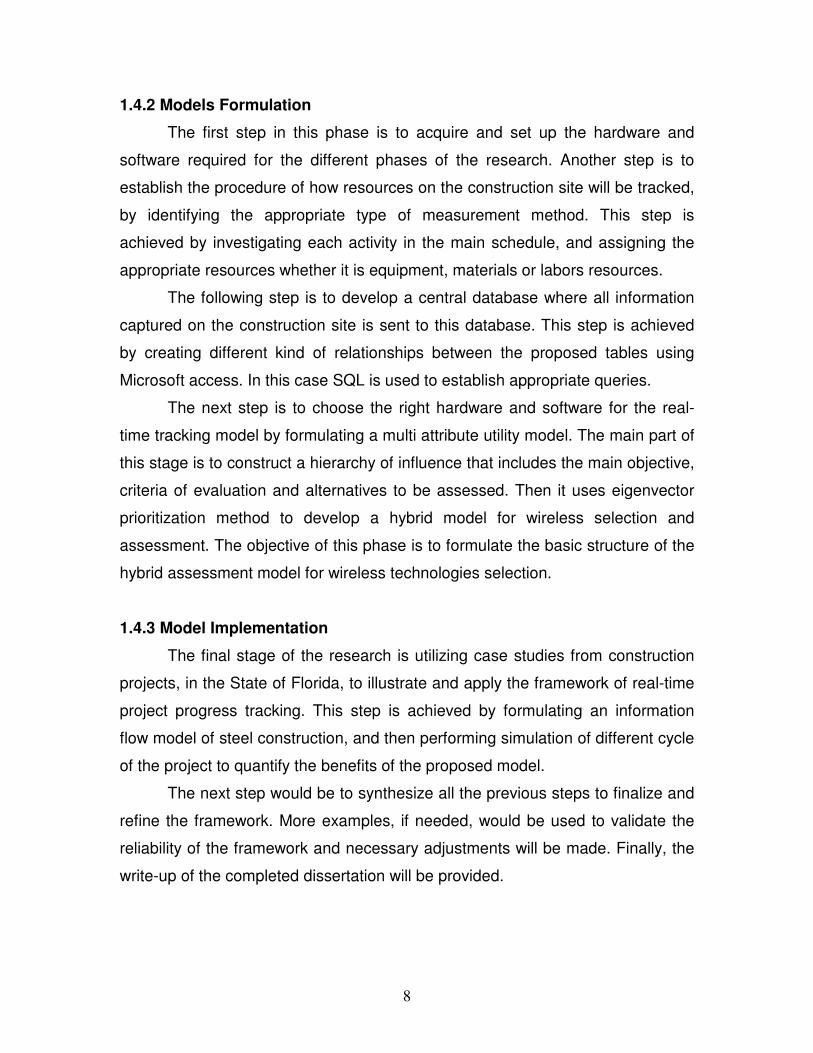
1.4.2 Models Formulation
The first step in this phase is to acquire and set up the hardware and
software required for the different phases of the research. Another step is to
establish the procedure of how resources on the construction site will be tracked,
by identifying the appropriate type of measurement method. This step is
achieved by investigating each activity in the main schedule, and assigning the
appropriate resources whether it is equipment, materials or labors resources.
The following step is to develop a central database where all information
captured on the construction site is sent to this database. This step is achieved
by creating different kind of relationships between the proposed tables using
Microsoft access. In this case SQL is used to establish appropriate queries.
The next step is to choose the right hardware and software for the real-
time tracking model by formulating a multi attribute utility model. The main part of
this stage is to construct a hierarchy of influence that includes the main objective,
criteria of evaluation and alternatives to be assessed. Then it uses eigenvector
prioritization method to develop a hybrid model for wireless selection and
assessment. The objective of this phase is to formulate the basic structure of the
hybrid assessment model for wireless technologies selection.
1.4.3 Model Implementation
The final stage of the research is utilizing case studies from construction
projects, in the State of Florida, to illustrate and apply the framework of real-time
project progress tracking. This step is achieved by formulating an information
flow model of steel construction, and then performing simulation of different cycle
of the project to quantify the benefits of the proposed model.
The next step would be to synthesize all the previous steps to finalize and
refine the framework. More examples, if needed, would be used to validate the
reliability of the framework and necessary adjustments will be made. Finally, the
write-up of the completed dissertation will be provided.
9
Figure 1.2: Research Methodology
10
1.5 Dissertation Organization
This thesis is organized into seven chapters. Chapter 1 gives an overview
of project progress tracking problems in the construction industry and
emphasizes on the importance of data exchange and communication among
project parties. This chapter also sheds some light on the lack of information to
assess usage of wireless technologies in construction. Research problem
statement and objectives are also presented. Chapter 2 describes available
technologies necessary for conducting this research. At the same time a
summary of previous research that has been done in this field is presented. Then
the results of a survey conducted by the ASCE Construction Institute Wireless
Committee to identify barriers to wireless technologies application in construction
are discussed. Chapter 3 lays down the background to conduct this research. It
starts with identifying different wireless technologies: hardware and software.
Then different methods to assess technologies are presented. Finally, the
chapter is completed with a description of computer simulation in construction.
Chapter 4 presents the developed construction project progress-tracking model
based on wireless technologies. This model provides updates in real-time
allowing the user to track the progress of percentage completed on the
construction site and to access project information from a central database.
Chapter 5 describes a quantitative process to select and assess the appropriate
IT to be used in the proposed real-time system using multi-attribute utility theory.
Chapter 6 presents two case studies for pre-engineered steel buildings where the
proposed model is applied. A detailed study of pre-fabricated steel process will
be discussed to show how the model functions. Then a simulation model of the
pre-engineered steel process is presented in order to illustrate the benefits of
applying the model. Conducting a value assessment analysis to quantify the
benefits concludes this chapter. Chapter 7 concludes the thesis with a summary,
conclusions, and recommendations for future study. Research contributions and
limitations are also outlined in this chapter. The appendices contain detailed
information of some of the issues discussed in the thesis. Appendix A contains

11
information about smart chips. Appendix B contains information of the survey
conducted in this research. Appendix C contains information about the data
gathered from both case studies. Appendix D contains information about the
simulation input and output files.
12
CHAPTER 2
PRIOR RESEARCH EFFORTS
This chapter lays necessary foundation for the research and includes
review of prior research efforts. The literature review of prior research efforts
includes reviewing the application of information technologies and the use of
barcode and Radio Frequency Identification (RFID) in the construction industry
and discusses the different application of each technology. In addition to the use
of smart chips, this chapter describes wireless technologies and its application on
the construction site. Then an ASCE survey presented by the CI wireless
committee is presented to identify barriers to wireless application. Finally the
needs for information and for users on the construction site are identified.
2.1 Project Tracking
A simple project can be planned as a list of tasks with their start and finish
dates written on a piece of paper. A complex plan on the other hand, might deal
with thousands of tasks, resources, and a project budget of billions of dollars. As
the project becomes more and more complex, so does the requirement for a
project management system. It is a good practice to monitor a project’s
performance continuously throughout its various phases in order to maintain
certain cost, time, quality, and safety criteria. This will also help ensure that a
project can be completed within budget, on schedule, at the desired quality, and
with an acceptable safety record.
One of the main way of controlling a project’s quality, cost, and schedule
performance is to continuously monitor activities during the construction phase in
order to keep track of work done: materials and equipments used versus installed

13
quantities. These quantities can then be compared against quantities estimated
during the planning phase to gauge the project’s performance.
Construction Industry Institute (CII) uses six different methods to measure
the work progress at the construction jobsite, depending on the type of work to
be done. Table 2.1 summarizes these methods.
Table 2.1: Tracking Methods (adapted from CII 1987a) Method Suitable for Measuring Examples
Units Completed
Activities that involve repeated production of easily measured work packages that consume roughly equal resources
Linear feet of wire or pipe installed, or cubic yards of concrete placed, etc.
Incremental Milestone
Sequential activities with clearly defined milestones
Pipe received/inspected, pipes supported, pipes aligned, pipes welded, pipes tested, pipes completed
Start/Finish Activities that do not have interim milestones or that are hard to quantify in terms of time and cost
Cleaning, testing, aligning, etc.
Supervisor Opinion
Minor activities where detailed analysis is not necessary
Painting, constructing support facilities, etc.
Cost Ratio Long term activities that may span the life of a project and are allocated bulk cost/time
Project management, quality assurance, etc.
Weighted or Equivalent Units
Long term activities that include multiple subtasks with different units of measurement
Structural steel erection (includes bolting, shimming, connecting, aligning, etc.)
In the 1980s, many project management packages were introduced to the
market. Primavera Project Planner and Microsoft Project are two of such
recognized standard commercial software. These programs provide an
automated means for project tracking and scheduling. However, access to these
softwares was limited to trained personnel working on certain machines in a
specific location (Pena-Mora et al. 2002). So once a project has started with an
original schedule, the actual field data is recorded on paper, email, word
14
processor, or a spreadsheet documents before reaching the scheduler on a
weekly or monthly basis.
Repass et al. (1995) developed a new tool called updater to improve
efficiency and effectiveness of construction schedule updating. It employs
emerging palm-held computer technology to automate processes currently bound
to manual paper-based methods due to incompatibilities between computers and
the harsh construction environment.
Chin et al. (2005) presented a real time 4D CAD + RFID for project
progress managements. The model mainly presented building elements in 3D
CAD models according to as-built progress, where the as-built information is
collected in real-time by sensing the progress throughout the supply chain using
RFID. 4D+RFID aimed at supporting processes with a focus on structural and
curtain wall elements, such as steel columns and beams, concrete slabs, and
curtain walls, which are typically on the critical path of project schedules in high-
rise building construction projects. The process is that RFID is applied to sense
the progress status of ordering, delivery, receiving, and erection of building
elements, and then the as-built progress information is presented in 3D CAD
models.
Poku et al. (2006) developed a system called PMS-GIS (Progress
Monitoring System with Geographical Information Systems) to represent
construction progress not only in terms of a CPM schedule but also in terms of a
graphical representation of the construction that is synchronized with the work
schedule. In PMS-GIS, the architectural design is executed using a computer-
aided drafting (CAD) program (AutoCAD), the work schedule is generated using
a project management software primavera (P3), the design and schedule
information (including percent complete information) are plugged into a GIS
package (ArcViewGIS), and for every update, the system produces a CPM-
generated bar chart alongside a 3D rendering of the project marked for progress.
The GIS-based system developed in this study helps to effectively communicate
the schedule/progress information to the parties involved in the project, because

15
they will be able to see in detail the spatial aspects of the project alongside the
schedule.
Memon et al. (2005) presented a system that integrated Auto CAD and
digital photos to track the progress of construction project. The system proposed
is called Digitalizing Construction Monitoring (DCM) Model. It has made a
practical attempt to automate the process of producing as-built construction
schedule by applying modern photogrammetry techniques to photographs and
integrating with CAD drawings. The applications of DCM model in monitoring the
progress enables project management team to better track and control the
productivity and quality of construction projects.
2.1.1 Technology in Material Tracking
Regardless of the type of project, enough resources must be allocated on
quantity tracking to acquire accurate and timely data that can be used effectively
to control a project and to make progress payment.
In any construction project the cost of materials can exceed half the cost
of construction. Many researches have indicated that in a typical industrial facility
50% to 60% of the total cost is for equipment and materials. The proportion in
terms of cost of materials has increased more than labor. Bernold and Treseler
(1991) stated that costs of materials have increased more than labor and they
pointed out that the construction industry spends 0.15% in material management
systems.
Some studies have shown that an effective material management system
can produce 6% improvement in labor productivity and a computerized system
can produce additional 4 -6% in savings (Stukhart 1995) . Researchers have
acknowledged the importance of materials and the impact that these have in the
total project cost, plan and operations.
The project management team must focus on materials management in
the following stages: Planning, Preliminary design, Final design, Procurement,
Vendor control, Construction, and Closeout. It is a mean of acquiring information
16
about installed quantities at the jobsite, which can then be matched with resource
expenditures such as labor hours, equipment use, etc. (Halpin 1985).
Potential application for materials tracking in commercial construction
include concrete placement operations and steel frame components tracking.
These applications provide viable uses because they offer incremental
improvements over existing methods, reduced labor costs, real-time identification
and tracking and they provide the potential for automatic billing upon receipt of
materials at a jobsite.
Jaselskis et al. (1995) proposed a system using RFID technology to
control concreting operations that would ensure proper delivery, billing, and
quality control for concrete. The process starts when the contractor places an
order with the concrete supplier. The requirements for the concrete mix and the
ID numbers for the assigned trucks would be transmitted to a computer in the
batch plant. Next the RFID tag would be programmed to provide concrete mix
admixtures, time of loading, and delivery location. When the truck arrives at the
jobsites, a scanner would read the RFID tag and communicate by RF link to the
jobsite computer. The RFID tag information would be matched with the electronic
data information from the plant. After the concrete placement is completed, the
concrete truck would again pass the scanner and the delivery completion time
would be transmitted to the concrete supplier to make plans for the next truck. In
the same paper, Jaselskis presented a system to manage critical materials on
the construction site. The system consists of assigning an RFID tag for each
material delivery vehicle. Each package of critical material would also have an
RFID tag. Both the vehicle and package tags would be read at the gate and
recorded on the jobsite computer. The jobsite computer would maintain
databases of materials on hand and their storage location, as well as materials
installed. The saved information was used to trigger payments from the
contractor to suppliers and generate requests for progress payments from the
contractor to the owner (Jaselskis et al. 1995)
Yagi et al. (2005) proposed the concept of parts and packets unified
architecture that allows parts or units to signal change in their attributes as they
17
go through the complex production system. The combination of RFID and glue
logic or active database was proposed as a possible control mechanism, which
achieves the required dynamic equilibrium for construction activity without
hindrance or halt of production at worst. When a chip implanted part passes
through a gate, the gate reads the product URL of the part. It determines what it
is, where it is, when it is, as well as in what state it is. The corresponding data
point in the glue logic is then altered, which generates an event and a chain of
succeeding actions.
Tserng et al. (2005) presented a web-based portal system that
incorporates wireless technology and mobile devices to improve the efficiency
and effectiveness of data acquisition on site and information sharing between
participants to assist the managers to control and monitor the delivery progress
in a construction supply chain delivery. The MConSCM system not only improves
the data acquisition on site efficiency by using automated bar code enabled PDA,
but also provides a monitor to control the construction progress.
2.1.2 Technology in Equipment Tracking
The jobsite productivity of a project involving considerable amount of time
and effort is affected by the selection of the appropriate type and size of
construction equipment. It is therefore important for site managers and
construction planners to be familiar with the characteristics of the major types of
equipment most commonly used in construction. Typically, construction
equipment is used to perform essentially repetitive operations and can be broadly
classified according to two basic functions: (1) operators such as cranes,
graders, etc. which stay within the confines of the construction site, and (2)
haulers such as dump trucks, ready mixed concrete truck, etc. which transport
materials to and from the site (Hendrickson 1998).
Real-time tracking of construction equipment, utilizing the GPS technology
and wireless communications to avoid collisions, offers a multitude of benefits
and can be used for optimizing productivity, in addition to safety and security
18
applications. The technology has applications in both automated as well as
traditional construction sites (Oloufa et al. 2003).
Goodrum et al. developed a prototype tool tracking system to track tools in
a mobile environment and to inventory hand tools that may be located in either
mobile gang boxes or truck boxes. Active RFID technology has significant
potential to improve tool inventory and allocation on a construction jobsite. The
RFID tags have the capability to provide adequate read range and durability
needed for a tool tracking and inventory system research used active RFID tags
in the prototype tool tracking system (Goodrum et al. 2005).
2.2 Computer and Wireless Integrated Construction
Advances in information technology have gradually changed how
construction data are managed in the field. These advances, such as mobile
computers, wireless communications, video conferencing, collaboration systems,
3D laser scanning, digital close range photogrammetry, and sensors have
provided new ways for collecting and managing project information.
Considerable amount of research is being done to remove the
dependency of a person on the desktop computer as the only means of
collaboration and accessing the network, as most projects tend to have a
substantial work force working on site or out of the office where it is not always
possible to have a desktop computer (Pena-Mora et al. 2002).
Some research at Carnegie Mellon University has explored the use of
handheld computing devices in the field for bridge inspection (Garrett et al.
1998). The equipment is non-encumbering and allows the engineer to perform
inspection in a natural manner.
Work at the University of Kent at Canterbury concentrated on examining
the special needs and environment of the field worker, reflecting on the handheld
computing instrument features required for a successful PDA for use in the field.
The research effort also involves development of novel software tools for the
19
mobile field workers but exploit existing handheld computing and sensor
technology (Pascoe 1998).
Liu et al. (1997) proposed the Digital Hard Hat (DHH) technology, which
enables dispersed users to capture and communicate multimedia field data to
collaboratively solve problems, and collect and share information. The DHH is a
pen based personal computer running Windows XP. It is used to collect
multimedia information. Special software called Multimedia Facility Reporting
System allows the field representative to save multimedia information into a
project specific database, which is then accessible to others through the World
Wide Web. The pen-based computer can also be used to communicate between
the construction site and other locations using a direct network connection, a
wireless network connection or any means of cellular communications.
Brilakis (2006) presented a case study on long-range, wireless
communications suitable for data exchange between construction sites and
engineering headquarters. He defined the requirements for a reliable wireless
communications model where common types of electronic construction data will
be exchanged in a fast and efficient manner, and construction site personnel will
be able to interact and share knowledge, information and electronic resources
with the office staff.
Singhvi et al. (2003) developed a context-aware information system
designed to deliver up to-date project information from the main office to the
construction site. The objective was to help the user manage the complexity of
the construction data by proactively tracking current resource requirements and
proactively obtaining access to context-relevant information and services. To
achieve this, the system used off-the-shelf handheld computing devices and an
on-site wireless network for local communication. This allowed continuous
access to data and resources as users moved around the job site. This work
highlighted the benefits of context-aware computing for on-site information
delivery at a construction site and the need for better communication methods.
Tsai et al. (2006) developed a synchronous system integrated with
wireless and speech technologies for on-site data collection. The system was
20
applied in a material management case study, in which construction workers
communicated directly with application devices to achieve synchronous
operations and simplify manual data entry. After the system tests, analytical
results relating to efficiency improvement indicate that the proposed synchronous
system increased productivity, time efficiency and comparative work efficiency
due to the decreased lead processes and operation time.
2.3 Barcode
The use of technology to improve the availability of tools and materials is
not a novel concept. Barcode have a long history of tracking materials not only in
construction but also in other industries. Barcode system components basically
consist of a reader, barcode labels, and printers. Many barcode symbologies are
used in a variety of applications. Each symbology represents the rules for
character encodation, error checking, printing and decoding requirements, and
many other features.
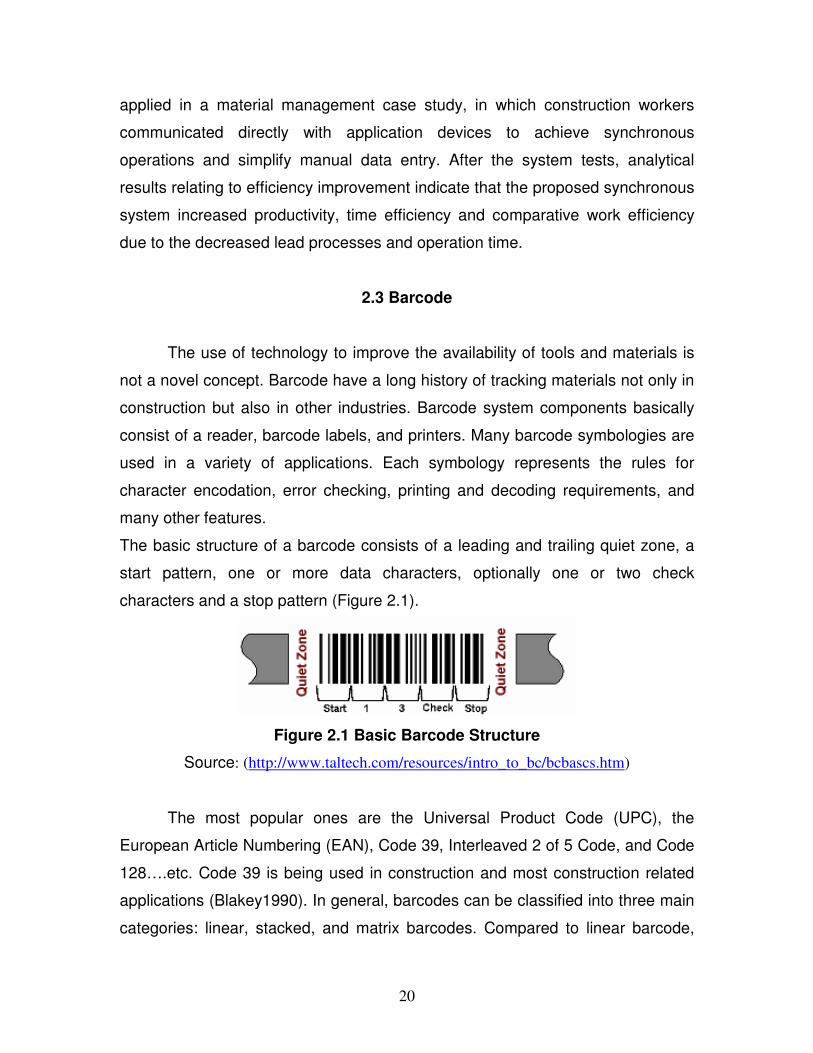
The basic structure of a barcode consists of a leading and trailing quiet zone, a
start pattern, one or more data characters, optionally one or two check
characters and a stop pattern (Figure 2.1).
Figure 2.1 Basic Barcode Structure
Source: (http://www.taltech.com/resources/intro_to_bc/bcbascs.htm)
The most popular ones are the Universal Product Code (UPC), the
European Article Numbering (EAN), Code 39, Interleaved 2 of 5 Code, and Code
128….etc. Code 39 is being used in construction and most construction related
applications (Blakey1990). In general, barcodes can be classified into three main
categories: linear, stacked, and matrix barcodes. Compared to linear barcode,
21
stacked and matrix barcodes have more data capacity and resist damage. More
information is presented in appendix A.
2.3.1 Barcodes Applications in Construction
As explained previously, barcode is an automatic identification solution
that streamlines identification and data acquisition. In the construction industry
barcode has been the point of attraction of a lot of research and it was
documented in some literatures. The application of barcode has been used in
many areas in the construction industry as follows: (1) to identify and find
materials and build components on a construction jobsite (Bell and McCulloch,
1988; Bernold, 1990; Anderson, 1993; Skibniewski and Wooldrige, 1992); (2) to
reduce loss and misidentification of material and equipment. With the utilization
of barcode system, it is possible to track construction assets such as tools and
equipment, identify them electronically, and track their movements. The
warehouse clerk can know where the asset was, and where it is now and, who
has it (Lundberg and Beliveau, 1989); (3) to manage construction equipment on
the jobsite (Wirt et al., 1999); (4) to track workers on the construction site. Some
construction companies are currently using time cards supplied with barcode
labels to access employee information such as the name, work area, and cost
accounting code. Work accomplished is credited to the employee account by
scanning the label on the time card (Bell and McCulloch, 1988); (5) to identify
documentation, drawings, material, equipment, and project activities. A barcode
label can be applied to construction blueprints and important construction
documents. The barcode labels can include data or instructions that enhance the
safety, the quality, and performance of construction activities (Stuckhart and
Cook, 1990; Rasdorf and Herbert, 1989); (6) to integrate barcode and GIS for
monitoring construction progress. Through systematic monitoring of the
construction process and representation of the erection progress, the scheduled
components for erection are repetitively tracked (Cheng and Chen, 2002).
Although an affordable technology, barcodes’ usage in construction
suffers some problems like short range and durability. Barcodes require a line of
22
sight and become unreadable if they are scratched or dirty. Radio Frequency
Identification technology seems to solve all these problems encountered by the
use of barcode.
2.4 RFID
Radio Frequency Identification (RFID) is identified as a part of automatic
identification technologies in which radio frequencies are used to capture and
transmit data. Information is communicated electronically via radio waves and
does not require contact or line-of-sight to transmit stored data; therefore, using
RFID technology for the collection and transfer of information provides one with
an inexpensive and non-labor intensive means of identifying and tracking
products. The RFID tag can contain all pertinent information about the item.
Unlike bar codes, RFID has the ability to offer the possibility of reading, writing,
transmitting, and storing and updating information, identify and track products
and equipment in real-time without contact or line-of-sight and the tags can
withstand harsh, rugged environments. An RFID system is composed of tags,
which carry the data in suitable transponders, and an RFID reader, which
retrieves the data from the tags (CII, 2002).
2.4.1 Tags or Transponder
The word transponder is derived from the two words: TRANSmitter and
resPONDER. The transponder or tag contains an antenna and integrated circuit
ship that is encapsulated to protect against the environment (see figure 2.2).
Tags are programmed with the data that identifies the item to which the tag is
attached. The tag can be either read only, read once/write many, or volatile
read/write. Read only tags are low capacity tags, usually hold approximately 8 to
128 bits of memory and used for identification purposes. In read/write tags, the
user can alter the information on the tag as many times.

23
Figure 2.2 Antenna sealed with RFID tag
There are two classifications of RFID tags: passive and active. The means
in which they receive power for transmission determines their classification.
Passive tags depend on a power source provided by the RFID reader’s energy
field and may have read-write or read-only capabilities, whereas, the active tags
have an internal power source and are rewritable. Passive tags generally have
shorter read ranges but have a life that usually outlasts the object that it is
identifying. Active tags have longer reading ranges, high memory, and better
noise protection. However, these tags are larger and heavier, more expensive,
and have a shorter life (3 – 10 years) than passive tags. Read-only tags are used
for simple identification purposes because they can only store a limited amount
of information that cannot be altered. Such tags may be used to identify a
package of nails or screws because they have many applications and are not
designated to a particular item or activity.
2.4.2 Antenna
The function of the antenna attached to a reader is to transmit an
electromagnetic field that activates a passive tag when it is within reading range.
Once a passive tag is activated it can transmit information from its antenna to
that of the reader where it is processed. During rewriting applications the antenna
of the reader acts as a relay device in the reverse direction, the reader
communicates a message through its antenna, which transfers and stores the
24
new data to the activated transducer via its antenna. The RFID tag’s antenna is
practically maintenance free and can be configured in a variety of shapes and
sizes ranging in size from a grain of rice to the size of a brick (Zebra
Technologies, 2002).
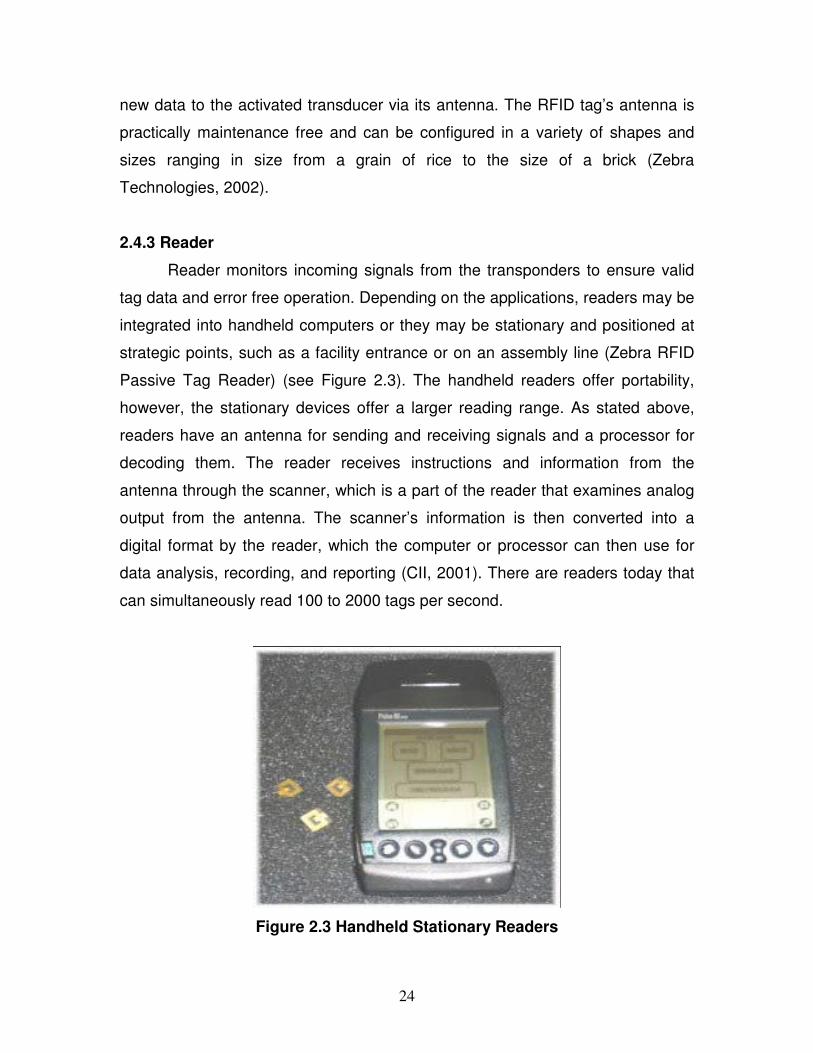
2.4.3 Reader
Reader monitors incoming signals from the transponders to ensure valid
tag data and error free operation. Depending on the applications, readers may be
integrated into handheld computers or they may be stationary and positioned at
strategic points, such as a facility entrance or on an assembly line (Zebra RFID
Passive Tag Reader) (see Figure 2.3). The handheld readers offer portability,
however, the stationary devices offer a larger reading range. As stated above,
readers have an antenna for sending and receiving signals and a processor for
decoding them. The reader receives instructions and information from the
antenna through the scanner, which is a part of the reader that examines analog
output from the antenna. The scanner’s information is then converted into a
digital format by the reader, which the computer or processor can then use for
data analysis, recording, and reporting (CII, 2001). There are readers today that
can simultaneously read 100 to 2000 tags per second.
Figure 2.3 Handheld Stationary Readers
25
2.4.4 RFID Applications in Construction
Radio Frequency Identification technologies provide a wireless means of
communication between objects and readers. RFID has a place in construction
because it provides the industry a potential to improve construction productivity,
quality, safety, and economy, cutting labor and material costs and enhancing
project schedules. There have been quite few publications on RFID research and
applications in construction.
Radio Frequency Identification (RFID) has emerged as a technology that
can be effectively applied for real time measurement of project information in the
construction industry, such as for labor management, safety management,
equipment management, and progress management of various works including
concrete, pipe spools, earthwork, structural steel works, and curtain walls.
Furthermore, it is expected that RFID will improve the limits on progress
management (Jaselski 2003, Yagi 2005, and Song 2005).
The most prominent application of RFID in construction has been its ability
to improve the efficiency of the materials and equipment management process.
In a case study conducted by Bechtel in their $338 million Red Hills Project, time
spent locating and tracking pipe support and hangers was reduced by 30% (CII,
2002).
Rohm & Hass conducted an RFID pilot study that received, identified, and
tracked Honeywell smart instrument installation. Benefits outlined from this case
study can be summarized in inventory shrinkage, decrease of rework costs,
improvement in data integrity (CII, 2001).
Ngai et al. (2005) presented a case study on the development of an RFID
prototype system that is integrated with mobile commerce in a container depot.
They concluded that the system keeps track of the locations of stackers and
containers, provides greater visibility of the operations data, and improves the
control processes.
El-Misalami (2003) proposed a system using RFID to track the activities of
workers and equipment at the construction site. The resulting records were used
to update the cost control system. Each worker would have a read write RFID tag
26
to record his activities. The tag would be approximately the size of a credit card
and could be used as a worker identification badge. The use of equipment would
be tracked by associating the equipment with the operator and the operator’s
activity. The system was adapted for both tool-room checkout and large
equipment management.
RFID can also provide security to construction jobsites. Workers,
operators, and equipment tagged with RFID can record and make certain proper
usage and handling of equipment, materials, and documents. These systems
would also ensure that only qualified equipment operators have the ability to
operate restricted equipment, reducing the likelihood of misuse and accidents
(Durfee 2002).
Song et al. (2006) presented a case study of fabricated pipe spools in
industrial projects. Field tests of current RFID technology were conducted to
determine technical feasibility for automatically identifying and tracking individual
pipe spools in lay down are yards and under shipping portals Potential benefits
found from the use of RFID technology in automated pipe spool tracking may
include (1) reduced time in identifying and locating pipe spools upon receipt and
prior to shipping, (2) more accurate and timely information on shipping, receiving,
and inventory, (3) reduced misplaced pipes and search time, and increased
reliability of pipe fitting schedule.
2.5 Construction Site Information
A construction project is considered as a process that involves many
activities and a large amount of information that are related to each other. During
the construction phase of a project it is essential that good and timely flow of
information prevail throughout the process. A construction project essentially
involves a large amount of information of various types. This is due to the fact
that different parties perform independent tasks on a project to produce a single
final product. Since the design of a project must somehow be communicated to a
lot of parties on the construction site, it is important that clear information,
27
coherent and efficient communication exist to ensure successful work by all
participants in the project. The specifications must be translated into information
that all parties can use in fulfilling their tasks. Hence, the need for drawings,
contracts, specifications, building codes, and other forms of information emerges.
At the same time, the performance of the project must also be communicated
back to management so that it can be controlled effectively. In order to explore
and develop new effective methods of information management on the
construction site, the starting point should be identification of on site construction
information.
2.5.1 Construction Site Information Needs
Information needs in construction have increased as projects have
become more complex and owner demands have become more challenging.
During jobsite project execution, there are three variables which can either hold
back or facilitate successful results, mainly quality, quantity, and timing of
information. The information needs on a construction project have been
extensively documented in the construction IT literature and have been
organized into thirteen major categories from a generic construction project
perspective (Stuckhart and Nomani 1992, de la Garza and Howitt 1998). These
thirteen categories include employee time, attendance, and work tracking;
schedule and resource control; materials management; tool tracking; document
control; drawing control; quality control; equipment management; request for
information (RFI); cost management; jobsite record keeping; submittals; and
safety monitoring. Each category was further divided into more detailed
subcategories. For example, the group of request for information contains the
following seven subcategories: design intent and clarification, subcontractor
information, contract specifications, contract drawings, work package information,
means and methods, and implementation problems. Refer to Appendix A to see
a detailed table of jobsite information needs as presented by De la Garza and
Howitt.
28
Another study performed by Chen and Kamara showed that on site
construction information is grouped into twelve categories including drawings,
material information, equipment information, contract, progress, safety
information, sub-contractor information, design clarification, construction
methods, specification, labor information, and quality information (Chen and
Kamara 2006).
Scott and Assadi summarized sites records into three main categories
which consist of information related to finance, quality, and progress. Especially
the progress records typically kept by contractors and supervisors aim to identify
the project life cycle information consisting of weekly progress reports, day work
sheets, photographs, as-built schedule, and minutes of progress meetings (Scott
and Assadi 1999).
Bowden et al. indicated that the main type of information that the people
onsite deal with is paper based, which constitutes a disadvantage for site
information communication and exchange (Bowden et al. 2004). Lack or
inefficiency of information exchange can result in people on construction site
overlooking important issues that require immediate response and often causes
on site delays and loses in schedule and cost (Singhvi and Terk 2003).
2.5.2 Construction Site Information Users
In addition to information needs on a construction project there are people
who may be considered users as well as sources of information. The following is
a list of eighteen users and suppliers of information presented by Shahid and
Froese: upper management; construction manager; chief engineer; procurement
manager; project manager; project engineer; planning/scheduling engineer; cost
engineer; estimator/quantity surveyor; accountant; purchasing agent; field office
engineer; field engineer; superintendents; foremen; craft worker; laborer
helper/apprentice.
The most effective way for construction people to exchange information on
construction sites is to retrieve or capture information at the point where they
occurred and at the time when they need it. However, this situation is still ideal
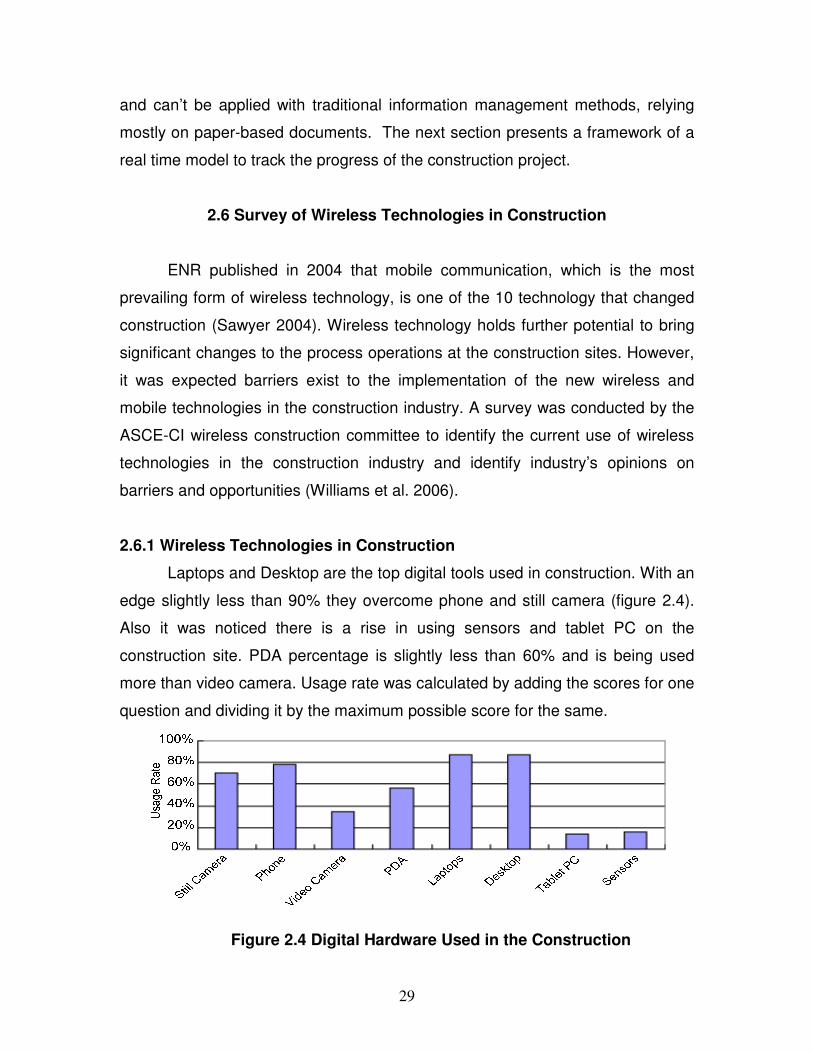
29
and can’t be applied with traditional information management methods, relying
mostly on paper-based documents. The next section presents a framework of a
real time model to track the progress of the construction project.
2.6 Survey of Wireless Technologies in Construction
ENR published in 2004 that mobile communication, which is the most
prevailing form of wireless technology, is one of the 10 technology that changed
construction (Sawyer 2004). Wireless technology holds further potential to bring
significant changes to the process operations at the construction sites. However,
it was expected barriers exist to the implementation of the new wireless and
mobile technologies in the construction industry. A survey was conducted by the
ASCE-CI wireless construction committee to identify the current use of wireless
technologies in the construction industry and identify industry’s opinions on
barriers and opportunities (Williams et al. 2006).
2.6.1 Wireless Technologies in Construction
Laptops and Desktop are the top digital tools used in construction. With an
edge slightly less than 90% they overcome phone and still camera (figure 2.4).
Also it was noticed there is a rise in using sensors and tablet PC on the
construction site. PDA percentage is slightly less than 60% and is being used
more than video camera. Usage rate was calculated by adding the scores for one
question and dividing it by the maximum possible score for the same.
Figure 2.4 Digital Hardware Used in the Construction
30
Using another set of questions regarding the use of cutting edge computer
tools and means, CAD percentage was the most used with a percentage of more
than 60%. Video conference, web portal, and e-Learning come in second place
with 42%. RFID and GIS are still underused and have low percentage of less
than 20%. What is surprising is the percentage of barcode which is relatively low
especially that it has been introduced to the construction industry for a while.
��
���
���
���
���
����
�
��
����������
�������
�����������
���!!����
"#
�$
%����&���'������
Figure 2.5 Cutting Edge Tools Used in the Construction
2.6.2 Barriers to Wireless Applications in Construction
It appears the respondents did not reach a consensus about the major
barrier to the uses of new technology. Lack of collaboration, high cost, and
insufficient tech support and training are among the primary reasons given for a
reluctance to implement information technologies (Figure 2.6). A main concern
for owners, general managers or any person in charge on job site is the amount
of money to spend in order to get benefit from the technology in question.
Wireless communication is an expensive technology. There are a lot of expenses
to be taken into consideration, and a detailed study should be completed to make
sure that the importance and savings resulting from the usage of this technology
worth the expenses. Some of the costs of investing in wireless technology that
need to be considered are: the purchase of the equipment and software, the
maintenance and upgrading of the hardware, the upgrading and licensing of

31
software, the fee of wireless services providers, the salaries of in-house technical
support personnel, the training of the users (De la Garza & Howitt, 1998).
The typical construction project brings together several disciplines and a
large number of subcontractors that have little incentive for sharing risks. Each
subcontractor is held responsible for their individual work which promotes a low
tolerance for risk within the industry. This prevents technology adoption.
Training and tech support need is another major concern of the
respondents. This lack of expertise may be a sign that use of wireless technology
in construction is still at its early stage. Data security and risk of data loss also
are barriers to its application. Till now, all communication systems are
susceptible to being violated and there is possibility that the information
transmitted being received by undesired users. So the information sent has to be
classified according to importance and how sensible it is so that precautions
would be taken.
Another factor that we can’t overlook is the lack of metrics to assess value
and quantify benefits of applying these technologies.
Figure 2.6 Barriers to Wireless Applications in Construction

32
CHAPTER 3
BACKGROUND
This chapter lays necessary background for the research and includes
necessary information to conduct the research. First a detailed description of
wireless technologies is given, accompanied with identification of different parts
pertaining to this technology. Then a review of the concept of decision-making
and utility theory is presented. That includes an outline about the basics and
assumptions of the utility theory, followed by a description of different techniques
used in multi criteria decision-making. Furthermore, a definition of computer
simulation and its uses in construction is discussed to lay the necessary
background for the coming chapters.
3.1 Wireless Technologies
Wireless services represent a progression of technology, and a new era of
telecommunications, but these services have been used for over a century and
remain synonymous with radio. There are several evolving technologies that
have the ability to improve the efficiency of the construction process. In this
research we are limiting evolving technologies to mobile computing. The concept
of mobile computing has been considered to consist of three major components:
computer, networks and mobile applications (Rebolj and Menzel 2004).
Computers, which can be used indoors, and outdoors by users include table
PCs, all kinds of pocket computers, palmtops and wearable computers.
3.1.1 Mobile Hardware
Primary mobile computing hardware that’s available today for the
construction site application are made up of the following groupings: 1) personal
33
digital assistants, 2) handheld computers, 3) pen tablet/touch PC, 4) rugged
notebook PC, 5) wearable computers/digital hardhats, and 6) digital pens
(COMIT 2005).
3.1.1.1 Personal Digital Assistants
A PDA is a digital organizer. The basic features are a calendar, task list,
and memo pad. They require software designed specifically for PDAs such as
Palm OS or Pocket PC operating systems. Palm and Pocket PC are the two
main rival manufacturers of PDA systems. The feature that eventually made
PDAs more useful tools is the ability to easily synchronize information with
desktop computers. When a PDA is connected to a desktop computer and
synchronized, both pieces of hardware are automatically updated with
information. The more sophisticated PDAs have the capability of performing word
processing functions, spreadsheet and industry specific applications, and provide
e-mail and internet access. The most sophisticated PDAs on the market today
are very powerful tools that may have upwards of 160 megabytes of memory and
400 megahertz processors, integrated wireless connectivity, bluetooth short
range wireless connectivity with other devices, and voice recognition capabilities
(COMIT 2005). They can also be integrated with other technologies such as
digital cameras, GPS, barcodes, and RFID.
3.1.1.2 Handheld Computers
Handheld computers refer to larger devices that have the same basic
functionality of a notebook computer but just in a smaller package. They have
smaller QWERTY style keyboards and smaller screens, and are thus convenient
to carry around, but more difficult to operate and view than notebooks. They
generally run a windows based operating system, have all the same upgrade
options of a sophisticated PDA, and are more powerful.
3.1.1.3 Pen Tablet/Touch PC
Tablet PCs or pen computers have been given this name because they all
have touch screen interfaces that can be manipulated with a pen, also known as
34
a stylus. They are usually made to meet the rugged standards since they are
intended for use in the field. They run on a full desktop operating system that has
been modified for touch screen interface and handwriting recognition. Most tablet
PCs offer all the features available to sophisticated PDAs and handheld
computers, plus some additional features and more power. An average size
tablet PC is about the size of a standard sheet of paper.
3.1.1.4 Rugged Notebooks
Rugged notebooks are simply laptop computers that have been designed
to withstand harsh environments for use in the field. They are quite often used for
mounting on all terrain vehicles that will be exposed to the environment, such as
earth moving equipment or military vehicles. These laptops have all the
capabilities of their non-rugged partners and are generally the same size as the
average to small sized laptops.
3.1.1.5 Wearable Computers/Digital Hardhats
This group of mobile computing devices refers to a network of devices that
can be worn by the user in the field. The general scenario is as follows. The
computing device will be one of the devices described in the previous sections
that can be worn in a vest or jacket. The computer is connected to other devices
such as a head set with microphone and video camera. The computer is
wirelessly integrated to the company server via a local network on site. The
wireless network also allows for conferencing with team members in the office.
The general idea is that you have complete access to relevant data and team
members while at a remote location with almost hands free operation.
3.1.1.6 Digital Pen
Digital pens have the least amount of features and power of all the
computing hardware devices being discussed in this paper. They serve the sole
purpose of electronically recording notes in the field. They solve the double data
entry problem for handwritten notes or memos only; however, they do have the
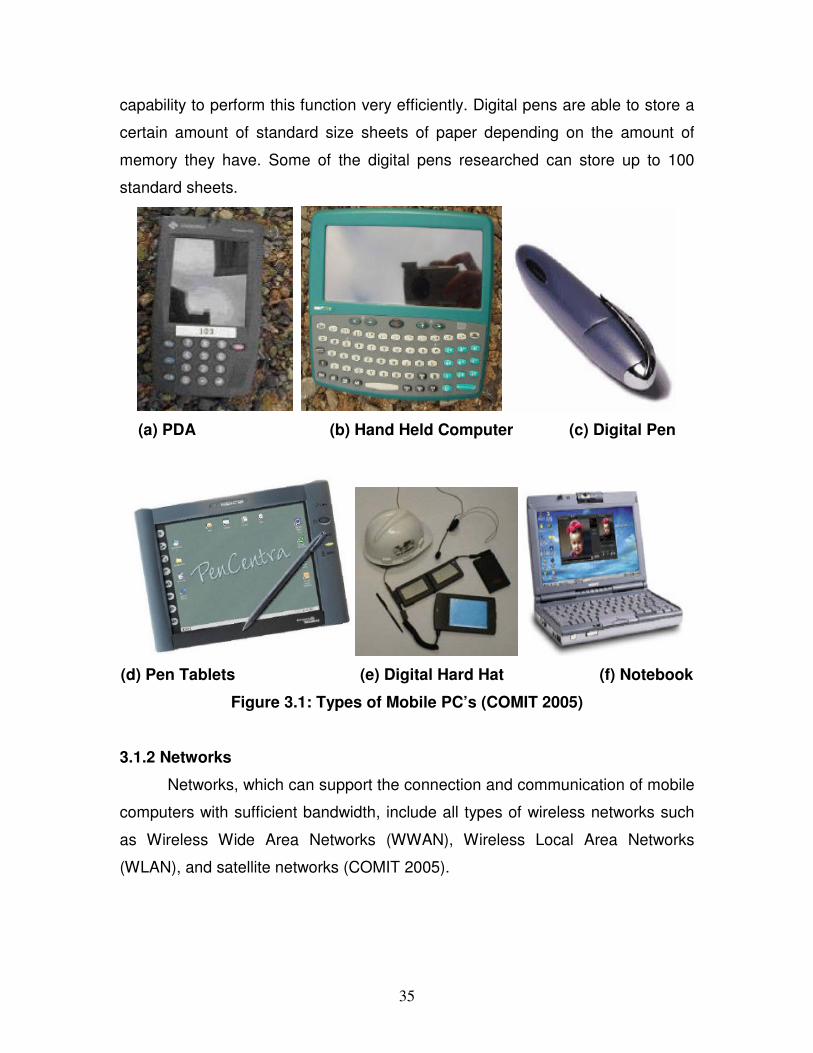
35
capability to perform this function very efficiently. Digital pens are able to store a
certain amount of standard size sheets of paper depending on the amount of
memory they have. Some of the digital pens researched can store up to 100
standard sheets.
(a) PDA (b) Hand Held Computer (c) Digital Pen
(d) Pen Tablets (e) Digital Hard Hat (f) Notebook
Figure 3.1: Types of Mobile PC’s (COMIT 2005)
3.1.2 Networks
Networks, which can support the connection and communication of mobile
computers with sufficient bandwidth, include all types of wireless networks such
as Wireless Wide Area Networks (WWAN), Wireless Local Area Networks
(WLAN), and satellite networks (COMIT 2005).
36
3.1.2.1 Wireless Wide Area Networks
WWAN covers a much more broad area than wireless LAN. According to
Fisher and Wang, today’s most wireless data links in the U.S takes place across
conventional second generation (2G) personal communication networks. The
transmission speed provided by 2G is up to 20 kbps. With the advent of 3G
networks, communication speed can reach 2 Mbps in fixed applications, although
most commercial deployments offer actual transmission rates closer to 100 kbps
in mobile environments. Although the third generation wireless technology has
not yet been fully implement throughout the world, the world’s leading companies
in this market. Samsung are already laying the groundwork for forth generation
(4G) technology.
3.1.2.2 Wireless Local Area Networks
Wireless Local Area Networks (WLAN) are implemented as an extension
to wired LANs within a building and can provide the final few meters of
connectivity between a wired network and the mobile user. The original
specifications developed for wireless LANs was based on the IEEE 802.11.
Since then, three offshoots that are in wide use have been developed: 802.11a,
802.11b, and 802.11g. 802.11a and 802.11b were developed at the same time.
These two standards use different radio transmission techniques, have different
data rates, and operate under different bands of the radio spectrum. WiFi
Technology is probably the most widely adopted wireless technology for
commercial and home uses (Prasad and Ruggieri, 2003). It represents a full
spectrum of related technology ranging from 802.1a, 802.1b, 802.1g, to the most
recent 802.1n. Many off-shelf products are currently available and have been
used under various working conditions. The setup process and maintenance is
fairly simply with comparatively low cost. However WiFi technology only provides
limited range up to a few hundred yards even with the latest technology and
optional signal boosters. To counter this problem, Wireless Mesh Network
(Wikipedia, 2006) can be formed with peer-to-peer wireless access point to
provide larger coverage. WiMax (IEEE 802.16) (Wikipedia, 2006) is a new
37
wireless technology currently undeveloped. It provides much larger range and
data bandwidth than WiFi does, which enable it transfers data intensive streams
such as videos. With a range up to 30 miles, a WiMax network can cover most
construction sites special cases such as road construction. Some municipals
have been considering using this technology to provide WiMax based wireless
cloud to cover the entire city. WiMax may become available some time in 2007.
There are three physical layers for WLANs: two radio frequency
specifications, and one infrared. WLAN configurations vary from simple,
independent, peer-to-peer connections between a set of PCs, to more complex,
intra building infrastructure networks. There are also point to point and point to
multipoint wireless solutions. In a typical WLAN infrastructure configuration, there
are two basic components:
i) Access Points: An access point/base station connects to a LAN by
means of Ethernet cable. Usually installed in the ceiling, access points receive,
buffer, and transmit data between the WLAN and the wired network
infrastructure. A single access point supports on average twenty users and has a
coverage varying from 20 meters in areas with obstacles (walls, stairways,
elevators) and up to 100 meters in areas with clear line of sight. A building may
require several access points to provide complete coverage and allow users to
roam seamlessly between access points.
ii) Wireless Client Adapter: A wireless adapter connects users via an
access point to the rest of the LAN. A wireless adapter can be a PC card in a
laptop, an ISA or PCI adapter in a desktop computer, or can be fully integrated
within a handheld device.
Bluetooth is a technology specification for small form factor, low cost,
short-range wireless links between mobile PCs, mobile phones, and other
portable handheld devices, and connectivity to the Internet. Bluetooth covers a
range of up to ten meters in the unlicensed 2.4 GHz band. Because 802.11
WLANs also operate in the same band, there are interference issues to consider.
Bluetooth technology and products started being available in 2001, but
38
interoperability seems to be a big problem. By mid 2002, WLANs migrate to the
5GHz band to avoid this problem.
Broadband wireless (BW) is an emerging wireless technology that allows
simultaneous wireless delivery of voice, data, and video. BW is considered a
competing technology with digital subscriber line (DSL). It is generally
implemented in metropolitan areas and requires clear line of sight between the
transmitter and receiving users.
3.1.2.3 Satellites Networks
Satellite-based wireless networks provide an alternative to ground-based
wireless or wired networks. Satellite services, since their onset, have had the
ability to provide limited quality two-way-voice, circuit-switched data, packet
switched data, and paging. Their fundamental advantage is the ability to cover a
widespread area, often-global coverage (De la Garza and Howitt, 1998). It may
be necessary to use a Satellite-based system if no other service is provided in
the area. Like GMS/GPRS, satellite service must be obtained from a wireless
provider. The price of satellite service started out much higher than the other
wireless infrastructure options, but has been steadily dropping and is getting
cheaper every year. In some cases satellite based communications will work out
cheaper than an ordinary mobile telephone service or even a wired line. As
satellite communication devices are becoming ever cheaper and more portable,
many more opportunities to exploit their wire-free capabilities will become
apparent (Web 2, 2004).
Current applications of satellite-based wireless services within the
construction industry include: 1) construction site set-up when there is insufficient
time to get suitable landlines installed quickly, 2) fax, email, Internet and intranet
access, as well as videoconferencing for roving professionals, 3) satellite
payphones for use by employees, 4) rapid download of data for design, analysis,
and project management to pre-empt crisis, avert slippages in schedule and
minimize cost, 5) seamless linking of construction sites into wider information
networks, 6) remote fault diagnostics, 7) remote training facilities, and 8) remote
39
video surveillance. The three main cost elements involved with setting up satellite
service are equipment purchases; service fees; and set up, training and license
fees (Web 2, 2004).
3.1.3 Mobile Applications
Mobile applications with the attributes of context-sensitivity and
personalization can support mobile users’ work processes and enable them to
work together collaboratively and cooperatively in a mobile computing
environment. Based on commercially available products and related research,
mobile applications can be grouped into the following categories: 1) CAD
applications, 2) data capture, and 3) project management.
3.1.3.1 CAD Applications
Construction personnel using mobile devices equipped with mobile CAD
applications can view, mark-up, create, edit and collaborate on 2D/3D AutoCAD
compatible designs and digital blueprints anywhere and at anytime when they
are on construction work sites. Users of mobile CAD applications may contact
anyone who needs the support of drawings and designs in the construction field,
such as engineers, project managers, designers and drafters. Most mobile CAD
applications are compatible with popular mobile devices running Windows CE,
Windows Mobile or Palm Operating Systems. In order to communicate drawing
files with desktop PCs, mobile CAD applications can connect and exchange data
with PCs by using ActiveSync for Windows OS or HotSync for Palm OS.
Example applications include PocketCAD, PowerCAD and ZipCAD.
3.1.3.2 Data Capture Applications
Software developed for data capture purposes encompasses tasks such
as punch lists, timesheets, maintenance inspections, construction progress
reporting, materials tracking reporting, or virtually any form that requires a pen
and clipboard by traditional methods. Data capture software come in two types:
1) task specific, which is developed specifically for one task such as punch lists;
40
or 2) form building software, which can be manipulated to create what ever form
is desired. SHERPA (Ward et al., 2003) is one of the mobile data capture
systems, which enables users to utilize workforce driven mobile computers to
collect real time piling work data in the field through a WLAN.
3.1.3.3 Project Management Applications
Applications in the project administration area provide users with the
capabilities of project and programme management such as construction activity
review, activity monitoring and updating, progress management, risk
management, Microsoft Project file view and update, and material and equipment
management, through their on-hand mobile computers. Available commercial
applications include Primavera Mobile Management, CYtools, and OnSite FDM.
Several programs are available that allow for viewing and updating of Microsoft
Project files on both Palm and Pocket PC devices. They include Project@Hand
by Natra Software for the Palm and CYProject by P.E. Wilson Consulting, LLC
(Williams 2003). Both of these packages allow bar charts to be displayed and
activities updated on site.
3.2 Technology Assessment Methods
In technology selection, decision makers have to consider the various
project implication and benefits/drawbacks of one technology versus another.
Many tangible and intangible criteria are considered while evaluating these
options and to arrive to the best technology that serves their needs.
Complications arise when the alternative technologies under consideration are
new and not enough data is available to effectively evaluate all advantages and
disadvantages. The lack of sufficient historical data constrains a decision maker
to carefully analyze the tangible and intangible impact of the advanced
technology on project performance.
Decision theory is concerned with goal-directed behavior in the presence
of options. When the evaluation problem has multiple dimensions, intuitive
41
judgments may become exceedingly difficult. Utility Function model was
developed to help individual decision maker facing a choice involving uncertainty
about outcomes (Dyer et al. 1992).
The main consideration is how to structure and assess an aggregate utility
function such that:
U (x1, x2, …….. xn) = ƒ [u1(x1), u2(x2), …….. un(xn)], Equation 3.1
Where Ui designates a utility function over single attribute xi
Within construction research, multiple attribute utility theory (MAUT) has
been used to select procurement systems (Chan et al. 2001), contractors
(Cheung and Suen 2002), contractor’s markup (Marzouk and Moselhi 2003),
engineering performance assessment (Georgy et al. 2005), and dewatering
systems (Wang et al. 2002). Others have used MAUT for IT related problems,
such as selecting the appropriate networking technology (Abduh and
Skibniewsky 2003), evaluating the performance of IT solutions (Stewart and
Mohammed 2001) and IT decision making in construction (Elmisalami et al.
2006).
3.2.1 Assumptions and Fundamentals of the Utility Theory
The term utility, according to (Baird 1989), refers to the relative liking on
the part of an evaluator for particular outcomes. Assuming a predefined set of
engineering performance measures, a mathematical function between all
possible outcomes of each individual measure and their corresponding relative
liking to the evaluator could be developed. A multiple attribute utility function
integrates these individual utility functions into a single platform, thus, providing a
collective assessment of engineering performance on a project.
Lifson (1972), Keeney and Raiffa (1976), Howard and Matheson (1977),
and Raiffa and Tversky (1988) described the basics and assumptions of the
utility theory. Von Neu mann and Morgenstern developed six constraints which
they felt were required to give mathematical rigor to the topic of utility theory (Von
Neu mann and Morgenstern 1954). The basic concept is that individual, or
42
organization will display a clear intuition of preference between two events, even
if these events are uncertain. The axioms are the most obvious semantic
constraints on preferences with lotteries. The set of axioms involve some very
complex mathematical proofs that this author feels it is beyond the scope of this
thesis.
The first axiom is that of Orderability: Given any two states, the rational
agent prefers one of them, else the two as equally preferable. The decision
maker possesses a complete ordering of all alternatives available to him.
Second axiom is that of Transitivity: Given any three states, if an agent
prefers A to B and prefers B to C, agent must prefer A to C.
The third axiom is related to Continuity: If some state B is between A and
C in preference, then there is a p for which the rational agent will be indifferent
between state B and the lottery in which A comes with probability p, C with
probability (1-p).
The forth axiom of Substitutability is described as follow: If an agent is
indifferent between two lotteries, A and B, then there is a more complex lottery in
which A can be substituted with B.
The fifth axioms deals with Monotonicity: If an agent prefers A to B, then
the agent must prefer the lottery in which A occurs with a higher probability
Lastly, the six axioms is Decomposability: Compound lotteries can be
reduced to simpler lotteries using the laws of probability.
43
3.2.2 Types of Utility Functions
Traditional multiple attribute utility theory provides a methodology for
selecting from among a set of alternatives in the presence of uncertainty. In this
process, the degree of liking of the various possible decision outcomes is
evaluated and further described by probability density functions (utility functions).
Based on the identified utility functions, the degree of liking for each alternative,
commonly referred to as the expected utility, is calculated and used in the
selection process.
The degree of liking of the various possible decision outcomes is
evaluated and further described by probability density functions. Based on the
identified utility functions, the degree of liking for each alternative, commonly
referred to as the expected utility, is calculated and used in the selection process.
The assessment of a multiple attribute utility function is usually
accomplished by decomposing this function into m single attribute functions.
Each of these single attribute utility functions, Ui(yi), i =1, 2,…..,m, identifies the
degree of liking on the part of the evaluator of the various possible values that
can be associated with attribute i. Among all, two values, UL and UH are of a
particular significance. Typically, UL represents the value where the degree of
liking reaches zero, while UH represents the value where the degree of liking
reaches its ultimate level of 1.0. This can be translated into
Ui (UL) = 0.0 and Ui (UH) = 1.0
Between the two values UL and UH, the degree of liking varies from 0.0 to
1.0. The shape of the utility function Ui(yi), that depicts such change depends on
the evaluator’s risk attitude.
For utility independent attributes, the additive multiple attribute utility
function takes the form
ui(y1, y2, ….., ym) = w1u1(y1) + w2u2(y2) + ...... wmum(ym) Equation 3.2
Where ui(yi) = single attribute utility function for attribute i and ranges from
0.0 to 1.0; yi range of values taken by attribute i ; and wi corresponds to the
relative importance of attribute i.
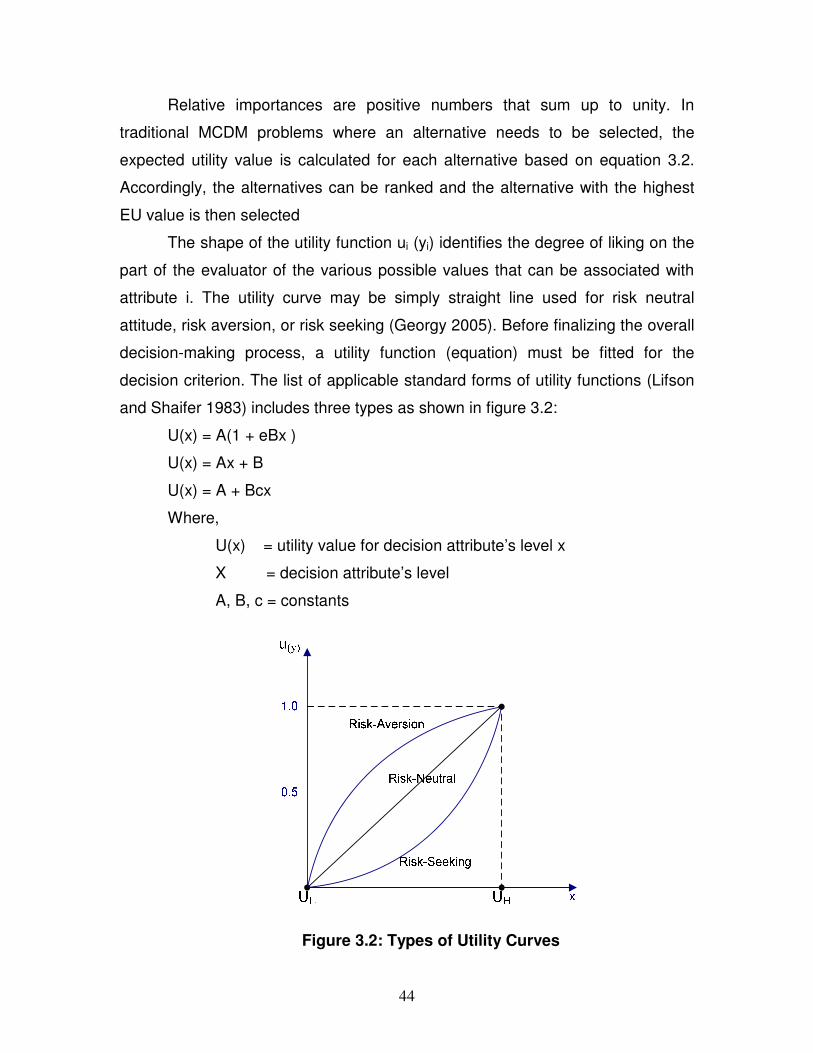
44
Relative importances are positive numbers that sum up to unity. In
traditional MCDM problems where an alternative needs to be selected, the
expected utility value is calculated for each alternative based on equation 3.2.
Accordingly, the alternatives can be ranked and the alternative with the highest
EU value is then selected
The shape of the utility function ui (yi) identifies the degree of liking on the
part of the evaluator of the various possible values that can be associated with
attribute i. The utility curve may be simply straight line used for risk neutral
attitude, risk aversion, or risk seeking (Georgy 2005). Before finalizing the overall
decision-making process, a utility function (equation) must be fitted for the
decision criterion. The list of applicable standard forms of utility functions (Lifson
and Shaifer 1983) includes three types as shown in figure 3.2:
U(x) = A(1 + eBx )
U(x) = Ax + B
U(x) = A + Bcx
Where,
U(x) = utility value for decision attribute’s level x
X = decision attribute’s level
A, B, c = constants
Figure 3.2: Types of Utility Curves
45
The straight-line function, used for risk neutral attitude, is commonly
employed in practical applications.
3.2.3 Hierarchical Structure of the Multi Attribute Utility Theory
3.2.3.1 Defining evaluation objectives
The evaluation theme in the utility function model is based upon how
much each alternative’s attribute achieves the objective of the comparison. An
objective generally indicates the direction in which we should strive to do better.
Organizing the model in a hierarchical structure is a good way to define different
levels of objectives. The high level objectives represent overall objectives. Then
each high level objective may branch into a number of low level objectives that
are finally defined in terms of alternative attributes (Pitz, 1984).
3.2.3.2 Defining Alternative Attributes
To capture and quantify all that is meant by an objective, several attributes
might be defined under each objective. Attributes represent the lowest level of
the objective hierarchy. Those attributes are the indicators that measure how
each alternative succeeds in meeting the objectives. Because each alternative
should have at least one attribute that is not available in other options, each
alternative must make unique contributions to the evaluation objectives.
However, at some point we will be faced with the proposition that further
achievement on one objective can only be accomplished at the expense of
achievement on the other (Keeney, 1976).
Thompson (1982) recommended limiting the attributes to be analyzed to
15 to 20 attributes. When alternatives have too many important attributes, the
evaluator should focus on the most important ones because the problem with too
many attributes is that they make the analysis cumbersome.
46
3.2.3.3 Attribute Characteristics
It is important that the set of attribute be complete, so that it covers all the
important aspects of the problem; operational, so that it can be meaningfully
used in the analysis; decomposable, so that aspects of the evaluation process
can be simplified by breaking it down into parts; non-redundant, so that double
counting of impacts can be avoided; and minimal, so that the problem dimension
is kept as small as possible (Keeney 1976). Once a satisfactory level of
determining the attributes is reached, the quantification process begins by
defining suitable attribute measures. For example, the cost attribute is measured
in dollars. Unfortunately, not all attribute measures are quantifiable. However,
those non-quantifiable attributes can be defined in a subjective way. An example
of non-quantifiable attributes would be the friendly use of a new technology. The
subjective ratings for this attribute would depend on the personal judgment of the
decision maker (El-Misalami 2001).
3.2.3.4 Assigning Attribute Weights
For each alternative, the aggregate utility value is determined by adding
the product of the multiplication of each single attribute utility with its assigned
weight. Attribute weights reflect the contribution of each attribute in the overall
utility index. Attribute weights are not just measures of importance; they also
reflect the range of variation along the attribute measuring scale. If the range of
variation is very small, the attribute weight diminishes and may exclude the
attribute from the model.
The integration of various measures of engineering performance in the
form of a multiple attribute utility function requires identifying a preference
structure that depicts the relative importance of each measure to the others.
Clemen in 1991 reported on various techniques for developing the preference
structure, including scoring methods, utility based methods, outranking methods,
goal programming, and analytic hierarchy process.
Scoring methods are among the simplest tools for solving multi attribute
decision problems. Given n alternatives and m attributes, the decision maker first

47
assigns weights, wi (i = 1,…, m), to each of the m attributes. In order to assess
these weights, the relative importance of each attribute is determined by the
decision maker on a scale of 1 to 10 or 1 to 100. The next step requires the
decision maker to evaluate how well each of the n alternatives performs with
respect to each of the m attributes. In order to accomplish this, a numerical value
is assigned to indicate the degree to which each alternative achieves each
attribute. The worth of each alternative is then computed using a linear weighted
sum relationship and the alternative with the highest value is selected as the best
option.
In the utility-based methods, the decision maker answers some trade-off
questions to specify the single attribute utility functions, to select the form of the
multi attribute function, and to determine the scaling constants. The primary
advantage of this approach is that the problem becomes a single objective once
the utility function has been assessed correctly, thus ensuring achievement of the
best compromise solution.
Outranking methods are classes of multi criteria decision-making
techniques that provide an ordinal ranking of the alternatives. It allows the
decision maker to choose the alternative that are preferred for most of the criteria
and do not result in an unacceptable level of any one criterion. This approach
examines the non-dominated alternatives and searches for a subset of the non
dominated solutions for which a certain degree of dissension is acceptable to the
decision maker.
Goal programming (GP) can be used only when there exists an explicit
mathematical relationship between decision variables and the objectives and
constraints. GP is a good technique for identifying an acceptable solution when a
minimum acceptable achievement level has been defined for each objective.
The Analytic hierarchy process (AHP) is a multi criteria decision-making
technique that allows the consideration of both objective and subjective factors in
selecting the best alternatives. This approach is used to arrive at a cardinal
ranking of alternatives for multi attribute decision problems.
48
Among all of the possibilities, this study uses the eigenvector prioritization
method, which is commonly employed in the AHP developed by Saaty (1980).
This method is a popular alternative for deriving the preference structure in
various practical applications of MCDM (Zeleny 1982; Mollaghasemi and Pet-
Edwards 1997). The major strengths this method brings are its systematic
procedure and its ability to examine the consistency of the evaluator’s judgments.
3.2.4 Analytical Hierarchy Process
The analytical hierarchy process (AHP) has found a wide application in
various decision problem such as conflict resolution, technological problems, and
economic problems (Vargas 1990; Abourizk et al. 1995; Saaty 1988). This
evaluation process has been defined as a theory of measurement with a capacity
to handle both tangible and intangible sets of criteria. AHP incorporates
judgments and personal values in a logical way. It allows the consideration of
both objective and subjective factors in selecting the best alternative. AHP allows
the user to establish criteria for decision-making in a hierarchy and analyzes
complex decision problem. The importance of establishing a hierarchy in a
decision problem is to properly account for the various factors involved in the
decision making process and establish their interdependencies. Although it is
important that a hierarchy should represent all major criteria and subcriteria, it is
not necessary for the hierarchy to be exhaustive. AHP is based on three
principles: decomposition, comparative judgments, and synthesis of priorities.
The decomposition principle requires that the decision problem be
decomposed into hierarchy that captures the important elements of the problem.
Higher elements in the hierarchy are more general goals and objectives, lower
elements in the hierarchy are more specific attributes, and the lowest levels are
the alternatives. Each level must be linked to the next higher level, and adjacent
elements within one level must not be too disparate.
The principle of comparative judgments requires assessments of pairwise
comparisons (on a scale of relative importance) of the elements within a given
level, with respect to their parent in the next higher level. These assessments are
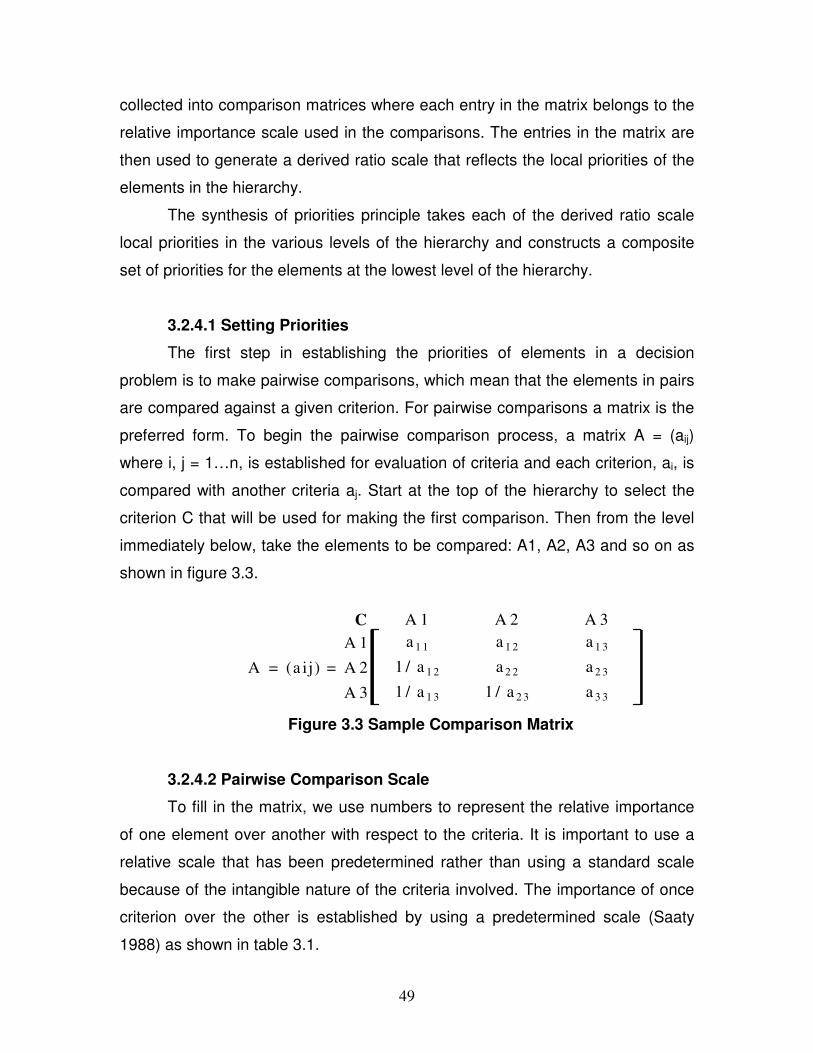
49
collected into comparison matrices where each entry in the matrix belongs to the
relative importance scale used in the comparisons. The entries in the matrix are
then used to generate a derived ratio scale that reflects the local priorities of the
elements in the hierarchy.
The synthesis of priorities principle takes each of the derived ratio scale
local priorities in the various levels of the hierarchy and constructs a composite
set of priorities for the elements at the lowest level of the hierarchy.
3.2.4.1 Setting Priorities
The first step in establishing the priorities of elements in a decision
problem is to make pairwise comparisons, which mean that the elements in pairs
are compared against a given criterion. For pairwise comparisons a matrix is the
preferred form. To begin the pairwise comparison process, a matrix A = (aij)
where i, j = 1…n, is established for evaluation of criteria and each criterion, ai, is
compared with another criteria aj. Start at the top of the hierarchy to select the
criterion C that will be used for making the first comparison. Then from the level
immediately below, take the elements to be compared: A1, A2, A3 and so on as
shown in figure 3.3.
C A 1 A 2 A 3
A 1 a 1 1 a 1 2 a 1 3
A = (a ij) = A 2 1 / a 1 2 a 2 2 a 2 3
A 3 1 / a 1 3 1 / a 2 3 a 3 3
Figure 3.3 Sample Comparison Matrix
3.2.4.2 Pairwise Comparison Scale
To fill in the matrix, we use numbers to represent the relative importance
of one element over another with respect to the criteria. It is important to use a
relative scale that has been predetermined rather than using a standard scale
because of the intangible nature of the criteria involved. The importance of once
criterion over the other is established by using a predetermined scale (Saaty
1988) as shown in table 3.1.

50
Table 3.1 Pairwise Comparison Scale presented by Saaty
Degree of
Importance
Definition Explanation
1 Equal importance Two elements contribute equally to the property
3 Moderate importance Experience and judgment slightly favor one element over another
5 Strong importance Experience and judgment strongly favor one element over another
7 Very strong importance An element is strongly favored and its dominance is demonstrated in practice
9 Extreme importance The evidence favoring one element over another is of the highest possible order of affirmation
2,4,6,8 Intermediate values between two adjacent degrees of importance
Compromise is need between two judgments
3.2.4.3 Eigenvector Prioritization Method
Using this matrix, the local priorities are determined by calculating the
normalized principal eigenvector [W]3*1, corresponding to the dominant
eigenvalue (max.
Mollaghasemi and Pet Edwards (1997) describe the process of calculating
the eigenvector of the matrix [Anorm]3*3. First the matrix is normalized by dividing
the values of each column on the sum of the column as shown in figure 3.4.
a11 a12 a13
a11+ a21+ a31 a12+ a22+ a32 a13+ a23+ a33
a21 a22 a23
[Anorm]3*3 = a11+ a21+ a31 a12+ a22+ a32 a13+ a23+ a33 =
a31 a32 a33
a11+ a21+ a31 a12+ a22+ a32 a13+ a23+ a33
A23
A33
A11 A12 A13
A21 A22
A31 A32
Figure 3.4 Normalized Matrix
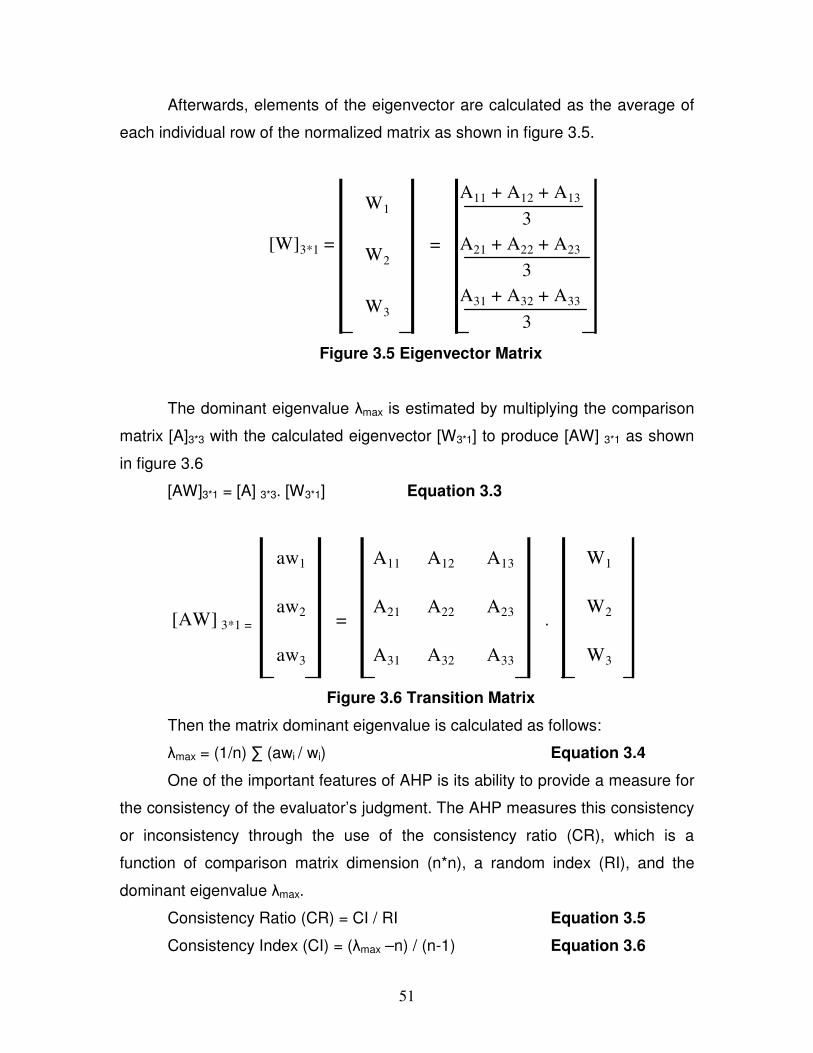
51
Afterwards, elements of the eigenvector are calculated as the average of
each individual row of the normalized matrix as shown in figure 3.5.
A11 + A12 + A13
3
[W]3*1 = = A21 + A22 + A23
3
A31 + A32 + A33
3
W1
W2
W3
Figure 3.5 Eigenvector Matrix
The dominant eigenvalue (max is estimated by multiplying the comparison
matrix [A]3*3 with the calculated eigenvector [W3*1] to produce [AW] 3*1 as shown
in figure 3.6
[AW]3*1 = [A] 3*3. [W3*1] Equation 3.3
[AW] 3*1 = = .
A31 A32
aw1
aw2
aw3
A22
A11 A12
A21
A33
W1
W2
W3
A13
A23
Figure 3.6 Transition Matrix
Then the matrix dominant eigenvalue is calculated as follows:
(max = (1/n) ) (awi / wi) Equation 3.4
One of the important features of AHP is its ability to provide a measure for
the consistency of the evaluator’s judgment. The AHP measures this consistency
or inconsistency through the use of the consistency ratio (CR), which is a
function of comparison matrix dimension (n*n), a random index (RI), and the
dominant eigenvalue (max.
Consistency Ratio (CR) = CI / RI Equation 3.5
Consistency Index (CI) = ((max –n) / (n-1) Equation 3.6
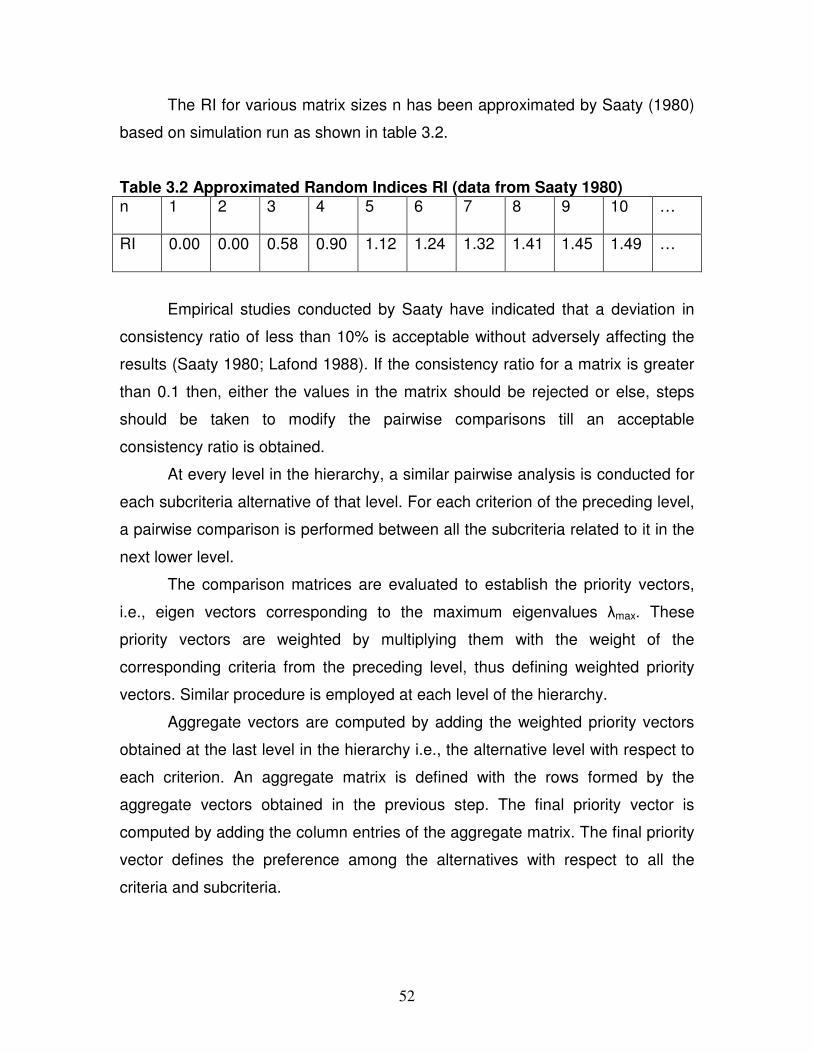
52
The RI for various matrix sizes n has been approximated by Saaty (1980)
based on simulation run as shown in table 3.2.
Table 3.2 Approximated Random Indices RI (data from Saaty 1980) n 1 2 3 4 5 6 7 8 9 10 …
RI 0.00 0.00 0.58 0.90 1.12 1.24 1.32 1.41 1.45 1.49 …
Empirical studies conducted by Saaty have indicated that a deviation in
consistency ratio of less than 10% is acceptable without adversely affecting the
results (Saaty 1980; Lafond 1988). If the consistency ratio for a matrix is greater
than 0.1 then, either the values in the matrix should be rejected or else, steps
should be taken to modify the pairwise comparisons till an acceptable
consistency ratio is obtained.
At every level in the hierarchy, a similar pairwise analysis is conducted for
each subcriteria alternative of that level. For each criterion of the preceding level,
a pairwise comparison is performed between all the subcriteria related to it in the
next lower level.
The comparison matrices are evaluated to establish the priority vectors,
i.e., eigen vectors corresponding to the maximum eigenvalues (max. These
priority vectors are weighted by multiplying them with the weight of the
corresponding criteria from the preceding level, thus defining weighted priority
vectors. Similar procedure is employed at each level of the hierarchy.
Aggregate vectors are computed by adding the weighted priority vectors
obtained at the last level in the hierarchy i.e., the alternative level with respect to
each criterion. An aggregate matrix is defined with the rows formed by the
aggregate vectors obtained in the previous step. The final priority vector is
computed by adding the column entries of the aggregate matrix. The final priority
vector defines the preference among the alternatives with respect to all the
criteria and subcriteria.
53
3.3 Computer Construction Simulation
Simulation is an important feature in engineering because it involved many
processes. It gained a lot of importance since the development of computers.
Computer simulation is a valuable management tool that is well suited to
the study of resource-driven construction operations.
In daily construction practice, construction designers make decisions
regarding complex construction processes. These decisions include construction
methods, selecting equipment, and planning operations. In some situations,
decisions are made with unexpected outcomes. This is because of the
complexity of the operations or the difficulty in visualizing all the processes
involved. In real life, testing a construction method is very expensive and time
consuming. However, simulation is a convenient technique to model “real-life”
construction operations.
3.3.1 General Modeling and Simulation Systems
General modeling and simulation systems are commonly used in
manufacturing and other industries. The uses of general modeling and simulation
languages in construction are demonstrated with models for equipment selection
(Teicholz, 1963), for the estimation of project durations (Carr, 1979), and for the
evaluation of resource allocation strategies (Moura, 1986).
Simulation systems can adopt one of several approaches or strategies.
Three simulation strategies are commonly recognized: event scheduling (ES),
activity scanning (AS), and process interaction (PI) (Martinez, 1996). In
manufacturing and other industries, the PI strategy combined with ES or AS is
very effective in modeling systems because entities that move have many
attributes that differentiate them; and the machines or resources that serve the
entities have a few attributes, and don’t interact too much. Examples of general
modeling and simulation systems are Petri Nets, GPSS, HOCUS, SIMAN,
QGERT, SIMSCRIPT, SIGMA, ITHINK, and SLAMII (Damrianant, 1998).

54
3.3.1.1 GPSS
GPSS (General Purpose Simulation System) is a simulation modeling
language that was developed in the early 1960’s by IBM. GPSS is oriented
toward queuing systems. A GPSS simulation consists of temporary transactions
and permanent facilities, which flow around a network of block diagrams. These
transactions are created and destroyed as the simulation proceeds and which
move through various GPSS blocks. There are about 40 standard building blocks
in GPSS. Facilities are used to represent the resources needed by the
transactions at the nodes of the network (Damrianant, 1998). The most recent
version of GPSS is GPSS/World (Schriber, 1994).
GPSS/World employs a set of new GPSS Blocks and commands, which
support input/output, rescheduling, continuous and mixed modeling and multiple
data types that include integer, real, and string objects. Also, GPSS World
includes an embedded programming language called PLUS. PLUS language
consists of only a few statement types that can be used just about anywhere
within the simulation, including GPSS Blocks. This feature improved the flow of
simulations. Several new GPSS Blocks have been added to GPSS World. The
new blocks such as, OPEN, CLOSE, READ, WRITE, and SEEK Blocks provided
a powerful interface to programs written in other languages.
3.3.1.2 HOCUS
HOCUS (Hand Or Computer Universal Simulator) (Hills, 1971), developed
in the early 1960’s, enhanced and popularized the concept of activity cycle
diagrams. A HOCUS activity cycle diagram consists of two kinds of nodes:
queues (circles) and activities (boxes) connected by arrows. HOCUS could be
used for both discrete and continuous process modeling. It has been used for
numerous large-scale simulations in several industries in Europe (Poole and
Szymankiewicz, 1977).

55
3.3.1.3 ITHINK
ITHINK is a commercial computational package that has been developed
for modeling system dynamics. ITHINK provides friendly user interface and
animation and it can be used to model discrete systems, such as in construction
(Paulson, 1985). However, its modeling methodology is difficult to use and
understand when it comes to modeling discrete systems (Damrianant, 1998).
3.3.1.4 SLAMII
SLAM (Simulation Language for Alternative Modeling) was developed in
1979 as a commercial simulation language (Schriber, 1994). SLAMII was
designed in 1981 as an enhancement to SLAM. SLAM and SLAMII allow
modeling in a network form. SLAMII is a high-level simulation language with
FORTRAN and C versions that can model complicated applications. SLAMII
network models can be built, animated, and run by using another computer
program named SLAMSYSTEM.
3.3.2 Construction Simulation Using Networks
All construction process simulation tools are based on activity cyclic
diagrams (ACDs) and on activity scanning (AS) simulation strategies. For the
past two decades, researchers have recognized the need to use computer
simulation to plan and analyze construction operations and activities.
Consequently, research in construction simulation and modeling has been
actively carried out, especially in academia.
3.3.2.1 CYCLONE (Cyclic Operations Network)
Interest in simulation applications in construction has been growing since
the introduction of the Cyclone methodology in 1973 (Ioannou 1990). CYCLONE
(Cyclic Operations Network) is one of the first and best known simulation
languages specifically designed to investigate the use of simulation networks for
modeling construction operations and activities is (Halpin, 1973, 1977). The
CYCLONE system has been used frequently to model construction processes.
56
This frequent use is due to the ability to provide a quantitative way of viewing,
planning, analyzing, and controlling the processes and operations (Halpin and
Riggs, 1992). It has been successfully used in modeling construction processes
such as concrete batch plant (Lluch and Halpin, 1982), tunneling (Touran and
Asai, 1987), and modeling construction resources and resolving construction
disputes (AbouRizk et al., 1992, and AbouRizk and Mohamed, 2000).
The Cyclone modeling methodology is a well established, widely used,
and simple methodology that is easy to learn and is effective for modeling
construction operations (Zayed et al. 2000). Among the six building blocks in the
Cyclone modeling methodology, both the Normal and the Combo elements
denote a work task within a process, but the former is used in a non-constrained
situation and the latter in a constrained one. The Queue element denotes the idle
state of a resource entity. Consolidation is a function used to consolidate flow
units at certain points in the system. The purpose of a Counter is to count the
number of times a key unit passes a particular control point in the network model
so that production can be measured. Finally, an Arc is a directional flow between
elements, which is used to model the resource entity's flow direction from node to
node.
MicroCYCLONE is a microcomputer-based program designed to run
CYCLONE simulation models. Before running the simulation, the graphical model
network should be converted into a numerical model using a specialized POL
(Problem-Oriented Language).
Many researchers have used CYCLONE as a base to build their
simulation systems such as Insight (Paulson et al., 1987), UM-CYCLONE
(Ioannou, 1989), Micro-CYCLONE (Lluch and Halpin, 1982), and
STROBOSCOPE (Martinez, 1996).
3.3.2.2 RESQUE
RESQUE is an acronym for RESource based QUEuing network simulation
system (Chang, 1986). RESQUE was designed as a significant enhancement to
57
Cyclone, where the model is not limited to the information conveyed by the
network.
3.3.2.3 COOPS
COOPS is an acronym for Construction Object Oriented Process
Simulation system (Liu, 1991). It is an extension and enhancement to CYCLONE
that was designed and implemented using an object oriented programming
language.
3.3.2.4 CIPROS
CIPROS is an acronym for Construction Integrated PROject and process
planning Simulation system (Tommelein et al., 1994). CIPROS is both a process
level and a project-planning tool. It contains an expandable knowledge base of
construction techniques and methods and makes extensive use of hierarchical
object-oriented representation of resources and their properties.
3.3.2.5 STROBOSCOPE
Stroboscope (State and ResOurce Based Simulation of Construction
ProcEsses) is a general-purpose simulation programming language specifically
designed to model construction operations (Martinez, 1996). It is based on
activity cycle diagrams (ACDs) and the activity scanning (AS) simulation
paradigm.
Stroboscope modeling elements have attributes, defined through
programming statements, which define how they behave throughout a simulation.
Resources in Stroboscope can be bulk or discrete, depending on their type. Bulk
resources represent entities that are not individual and cannot be uniquely
identified, such as sand, water, etc.
Discrete resources represent unique individual entities, such as a specific
truck, particular concrete block, etc. What mainly differentiate Stroboscope from
other simulation tools resides in its simulation language and its open design. Its
simulation language represents resources as objects that have assignable,
58
persistent, and dynamic properties and can actively and dynamically take into
consideration the state of the simulation process (Martinez, 1996).
Stroboscope’s open design allows the user to determine the input and
output at two levels. The first level uses Stroboscope’s built-in programmability
language. The second level extends Stroboscope through dynamic link libraries
created with high level languages: C and C++ (Martinez, 1996).
Stroboscope includes an optional Graphical User Interface (GUI) hosted
under Visio 3.0 or later version. Stroboscope also has some of the characteristics
that general-purpose programming languages have such as, built-in logarithmic
and trigonometric functions, conventional variables and arrays, and structured
flow control with if-elseif-else-endif blocks.
59
CHAPTER 4
REAL-TIME PROJECT PROGRESS TRACKING MODEL
This chapter presents a framework for real time construction project
progress tracking model. After identifying the computer hardware, software,
wireless communication and smart chips that constitutes the basic component of
the model, a detailed step to implement the system in construction is presented.
Then a description of the database that will hold the information is presented.
This database will act as a storage room and a bridge at the same time. It will link
the information sent from the construction site to the project schedule software.
Then the schedule will be automatically updated. At the same time the database
will allow the users to access information and retrieve drawings when needed.
4.1 Framework for Real Time Construction Project Progress Tracking
Based on chapter 2 and the information needed on the construction site,
this research try to integrate different automated data acquisition technologies to
collect data on construction sites, send the information through wireless
connection to a central database where it will be stored, and then use these
information to update the schedule and project progress instantly as soon as the
activities occur. The objective of the model presented is to track the quantity of
materials and equipment usage on the construction site in real-time fashion, and
be able to calculate the percentage complete of the activities based on the
tracking information. In addition to that, the model has another objective, which is
to link the independent islands of communication on the construction site, by
making information in the database available for corresponding users like
erection drawing for example (Ghanem et al. 2006).
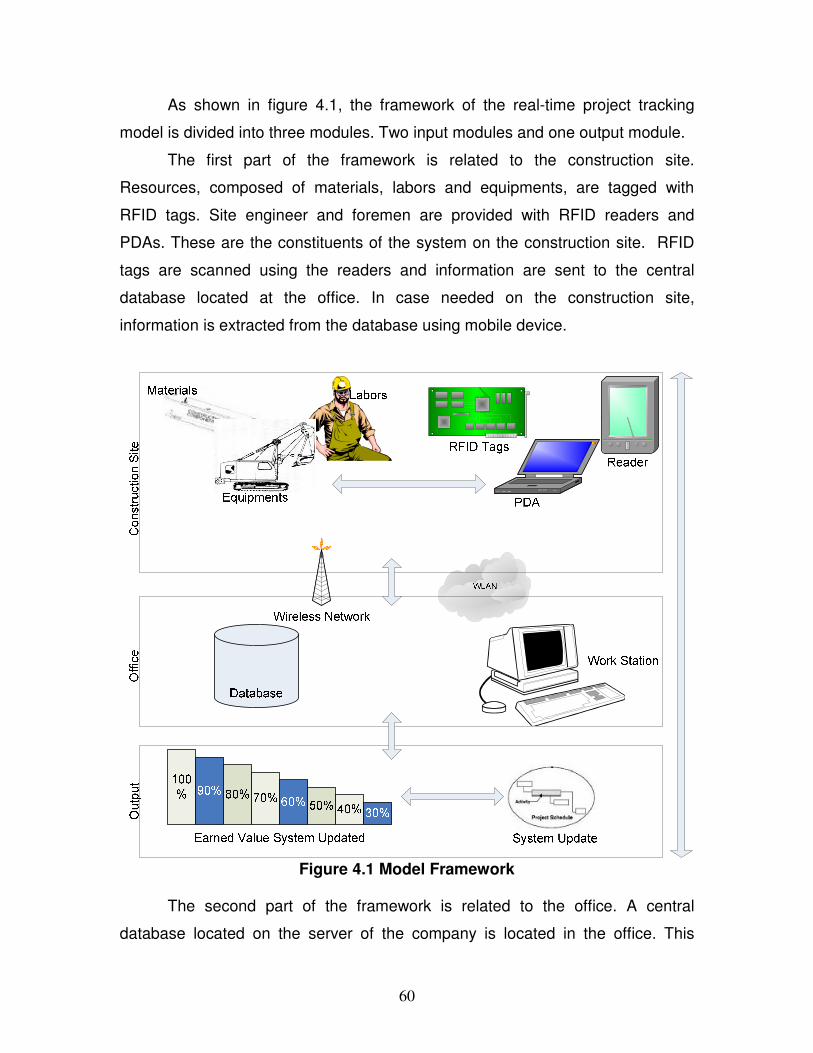
60
As shown in figure 4.1, the framework of the real-time project tracking
model is divided into three modules. Two input modules and one output module.
The first part of the framework is related to the construction site.
Resources, composed of materials, labors and equipments, are tagged with
RFID tags. Site engineer and foremen are provided with RFID readers and
PDAs. These are the constituents of the system on the construction site. RFID
tags are scanned using the readers and information are sent to the central
database located at the office. In case needed on the construction site,
information is extracted from the database using mobile device.
Figure 4.1 Model Framework
The second part of the framework is related to the office. A central
database located on the server of the company is located in the office. This
61
database is accessed from a work station. Construction and site office are linked
together using wireless network. Wireless network ensures dual ways of
communication. Information is sent to the database to be accessed by people off-
site, and people on construction site can access information stored in the
database.
The third part of the framework is the output. Updating the schedule
instantly allows the user to track the progress of the project and to conduct
analysis such as earned value analysis to get an objective measurement of how
much work has been accomplished on the project.
4.2 Hardware and Software Alternatives
The constituent objective of this model include (1) a wireless construction
site to ease mobility and network previously stand alone islands of
communication on a job site; (2) a hardware computing system; and (3) an
integrated Radio Frequency Identification to increase the efficiency and accuracy
of the job site data collection. The data needed for integrated cost and schedule
control must be identified, organized and stored in a relational database
management system. The softwares used in this analysis are products of
Microsoft because of the compatibility between Microsoft Project (MP) and
Microsoft Access (MA). Data stored in that model include project activities, which
have a cost account code to facilitate the link between MP and MA.
4.2.1 Hardware Selection
4.2.1.1 Computer Alternatives
Due to the harsh nature of a construction site, it was decided that the
mobile device must meet some rugged standards. The Ingress Protection (IP)
rating should be at least IP54 (Singletary 2006). This rating ensures that the
computer enclosure will stand up against wind-blown dust and rain. The
computer should be able to withstand the drop test from at least three feet to
62
allow repeated droppings while carrying it across the site. A drop test rating of
four feet is preferable, since this would allow repeated droppings from the chest
of an average height person. The computer display should be rated as sunlight-
readable, since it will often be used in direct sunlight. The mobile device must
support wireless networking options, which is not a problem for just about any
mobile device on the market today. The battery system must allow for at least
eight hours of normal operation to accommodate the average workday. Most
devices include a “hotswap-capable” option to allow switching out batteries while
the device is in use. This option combined with purchase of an extra battery
suffices for most battery types and mobile devices. Tablet computers were
deemed more appropriate than notebook computers for use on a construction
site where the user is most often standing up and walking the site.
Notebook computers are almost always heavier and have keyboards that
require two free hands to manipulate efficiently. The rugged notebooks are also
more expensive. Cost quotes and computer specifications were obtained through
websites and by consulting with various rugged computer manufacturers and
authorized resellers over the phone.
Table 5.10 gives a comparison of some of the rugged mobile devices
researched based on price and the requirements mentioned. The tablet computer
chosen to base the analysis on is the iX104C2V model manufactured by Xplore.
This model is moderately priced for rugged tablets and more rugged than most
with an IP 67 rating and drop test of four feet.
Field Manager could be equally accommodated on a handheld computer
or a PDA. The handheld computers are generally more highly priced. They do
have a slightly larger screen, but the difference was determined to be
insignificant. The rugged Recon PDA distributed by Rugged Notebooks was
selected for the analysis. It is priced comparably to some other rugged PDAs,
and like the tablet chosen is very rugged with an IP 67 rating and drop test of four
feet. For both the tablet and the PDA, cameras were selected as an add-on to
allow each user to communicate issues arising in the field more effectively.
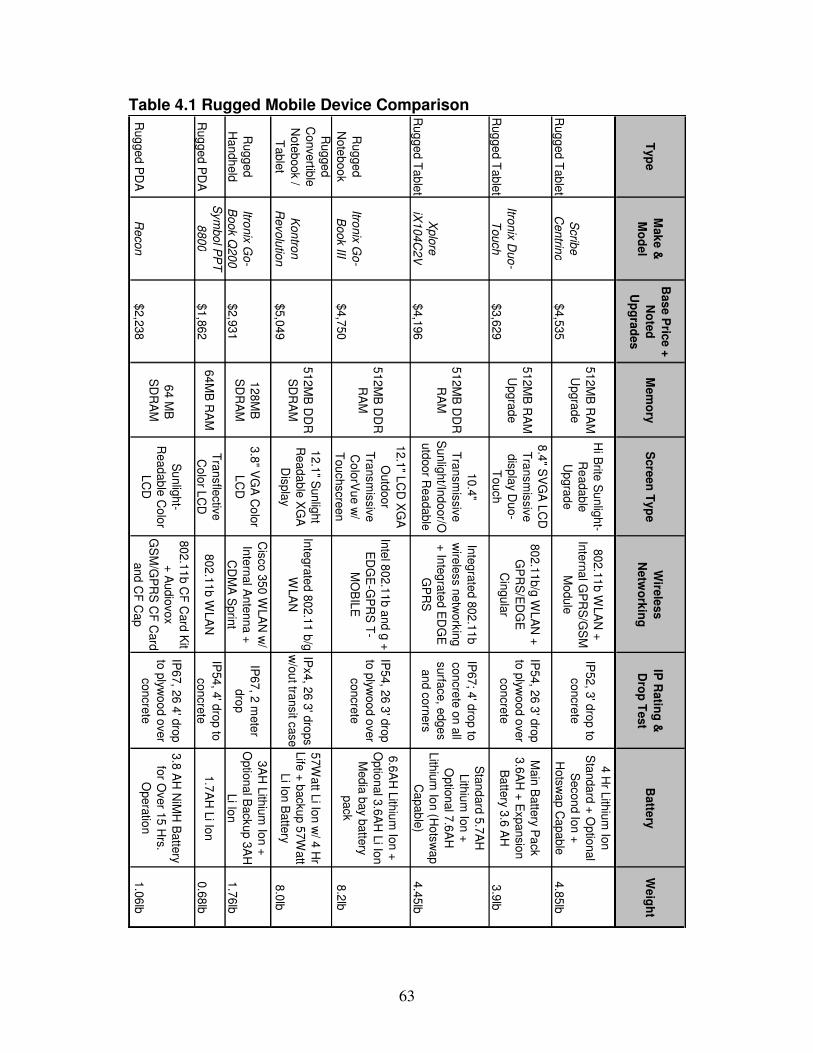
63
Table 4.1 Rugged Mobile Device Comparison
Typ
eM
ak
e &
Mo
del
Bas
e P
rice
+
No
ted
Up
gra
des
Mem
ory
Scre
en
Typ
eW
irele
ss
Netw
ork
ing
IP R
atin
g &
Dro
p T
est
Batte
ry
We
igh
t
Rug
ged
Table
t
Scrib
e
Centrin
o$4,5
35
512M
B R
AM
Upgra
de
Hi B
rite S
unlig
ht-
Re
adab
le
Up
gra
de
802.1
1b W
LA
N +
Inte
rna
l GP
RS
/GS
M
Module
IP52
, 3' d
rop to
concre
te
4 H
r Lith
ium
Ion
Sta
nda
rd +
Optio
nal
Secon
d Io
n +
Hotsw
ap C
apable
4.8
5lb
Rug
ged
Table
t
Itronix
Duo
-
Touch
$3,6
29
512M
B R
AM
Upgra
de
8.4
" SV
GA
LC
D
Tra
nsm
issive
dis
pla
y Duo
-
Touch
80
2.1
1b/g
WL
AN
+
GP
RS
/ED
GE
Cin
gula
r
IP5
4, 2
6 3
' dro
p
to p
lywoo
d o
ver
concre
te
Main
Batte
ry Pa
ck
3.6
AH
+ E
xpan
sion
Ba
ttery 3
.6 A
H3
.9lb
Rug
ged
Table
t
Xplo
re
iX104C
2V
$4,1
96
512M
B D
DR
RA
M
10
.4"
Tra
nsm
issive
Sunlig
ht/In
door/O
utd
oor R
ea
dable
Inte
gra
ted 8
02
.11b
wire
less n
etw
ork
ing
+ In
teg
rate
d E
DG
E
GP
RS
IP67
; 4' d
rop to
concre
te o
n a
ll
surfa
ce, e
dge
s
an
d c
orn
ers
Sta
nd
ard
5.7
AH
Lith
ium
Ion +
Optio
nal 7
.6A
H
Lith
ium
Ion (H
ots
wap
Ca
pab
le)
4.4
5lb
Rug
ged
Note
boo
k
Itronix
Go-
Book III
$4,7
50
512M
B D
DR
RA
M
12
.1" L
CD
XG
A
Outd
oo
r
Tra
nsm
issive
Co
lorV
ue w
/
Touchscre
en
Inte
l 802.1
1b
and g
+
ED
GE
-GP
RS
T-
MO
BIL
E
IP5
4, 2
6 3
' dro
p
to p
lywoo
d o
ver
concre
te
6.6
AH
Lith
ium
Ion +
Optio
nal 3
.6A
H L
i Ion
Media
bay b
atte
ry
pack
8.2
lb
Rug
ged
Conve
rtible
Note
bo
ok /
Table
t
Kon
tron
Revolu
tion
$5,0
49
512M
B D
DR
SD
RA
M
12.1
" Sunlig
ht
Re
ada
ble
XG
A
Dis
pla
y
Inte
gra
ted 8
02.1
1 b
/g
WLA
N
IPx4, 2
6 3
' dro
ps
w/o
ut tra
nsit c
ase
57W
att L
i Ion w
/ 4 H
r
Life
+ b
acku
p 5
7W
att
Li Io
n B
atte
ry8
.0lb
Rug
ged
Ha
ndh
eld
Itronix
Go-
Book Q
200
$2,9
31
128
MB
SD
RA
M
3.8
" VG
A C
olo
r
LC
D
Cis
co 3
50 W
LA
N w
/
Inte
rnal A
nte
nna +
CD
MA
Sprin
t
IP67
, 2 m
ete
r
dro
p
3A
H L
ithiu
m Io
n +
Optio
nal B
ack
up
3A
H
Li Io
n1.7
6lb
Rug
ged P
DA
Sym
bol P
PT
8800
$1,8
62
64
MB
RA
MT
ransfle
ctive
Colo
r LC
D802
.11b W
LA
NIP
54
, 4' d
rop to
concre
te1.7
AH
Li Io
n0.6
8lb
Rug
ged P
DA
Recon
$2,2
38
64 M
B
SD
RA
M
Su
nlig
ht-
Reada
ble
Colo
r
LC
D
802.1
1b C
F C
ard
Kit
+ A
udio
vox
GS
M/G
PR
S C
F C
ard
and
CF
Ca
p
IP6
7, 2
6 4
' dro
p
to p
lywoo
d o
ver
concre
te
3.8
AH
NiM
H B
atte
ry
for O
ver 1
5 H
rs.
Opera
tion
1.0
6lb

64
4.2.1.2 Wireless Infrastructure Alternatives
Cost quotes and specifications were gathered from wireless infrastructure
manufacturers and resellers through websites and phone conversations. The
802.11b WLAN equipment needed for the implementation consists of access
points (APs) with protective enclosures and omni-directional antennas.
The Orinoco AP-4000 was the access point chosen, along with 5dBi omni-
directional antennas. It was estimated that 2 APs and four antennas would
sufficiently provide wireless access to the project site. These APs cover the 2.4
to 2.5 GHz frequency band. Range boundaries characterize the circumference of
the radio cell that the access point produces (Web 1, 2006). The maximum
outdoor signal range (in the ideal wide-open situation) for this frequency band is
said to be between 1000 and 1500 feet outdoors. The indoor maximum range is
between 200 and 300 feet. One of the wireless provider representatives that
were consulted with claimed that the addition of an omni-directional antenna
could increase an AP’s range by 60%. Connectivity indicates the point at which a
device can associate with an AP at a specific data rate. The 802.11b standard
has a maximum data rate of 11Mbps. As the device moves away from the access
point, the data rate will drop from 11 to 5.5 to 2 to 1Mbps to no connectivity. A
data rate of 1Mbps is still relatively high and should be capable of supporting the
data transfer needed for this application.
The overall performance of the WLAN will be affected by interference and
number of users. A WLAN used on a construction site will have ever-changing
interference due to changing site conditions and equipment usage as the project
progresses. This application is considering only seven users of the WLAN, which
is extremely low and would not present a problem. The only way to truly know the
optimum number and location of APs on site is to perform a site survey. A
wireless specialist could be hired to do this, or the users themselves could test
the network by walking the site with their mobile device. The connectivity and
performance (based on ratio of packets sent to packets received) can be
checked this way. The LCC analysis includes the cost of bringing a wireless
consultant out to the site every three months to perform this service.
65
The price range of APs is approximately between $500 and $900. The AP
chosen has a price of $527. The Symbol AP-4131was quoted at $670 by a
Symbol reseller; therefore, the AP chosen is reasonably priced.
Cellular service providers were contacted to gather information for the two
alternatives using wireless subscriptions. T-Mobile and Cingular were contacted
for price quotes on unlimited data-usage plans for both PDAs and tablet
computers.
4.2.1.3 Smart Chips Alternatives
Cost quotes and specifications were gathered from smart chips
manufacturers and resellers through websites and phone conversations (Web 3
and 4 2006). The smart chips system needed on the construction site consisted
of a reader and an antenna to increase the range of connection. In addition to
that a search for different kind of tags and their specification was conducted.
After doing the search and comparison between different website and from
manufacturers’ feedback, IP4 was chosen as a reader. The IP4 delivers first-of-
its-kind capability by combining the power of a handheld mobile computing
device equipped with PAN, LAN and WAN radios. Users of the 700 Series Color
mobile computers have posted productivity gains and enjoyed application
flexibility enabled by the three radios personal area (PAN) or Bluetooth, local
area (LAN) and wide area (WAN) as well as the area and linear imagers
integrated into the handheld device. Combining those capabilities with the IP4
and the strength of the Microsoft Pocket PC platform gives users a high
performance mobile RFID solution.
The UHF large rigid RFID tags produced by Intermec were chosen as our
passive tags. It delivers superior performance on a variety of surfaces including
plastic, wood and metal. It exists in rugged shape designed for harsh industrial
applications and temperatures. According to the manufacturer no other tag on
the market can claim the ruggedness and worldwide usability of these tags (Web
5 and 6 2006). Pricing for tags is about $4 for a rigid tag and label inserts get
66
down to 15 cents per label. Appendix C has a description and specifications of
the equipment used as per the manufacturer publication.
4.2.2 Software Available
Microsoft Project (MP) was selected for all alternatives as the project
management software for the following reasons: (1) MP has integrated Earned
Value Management functions, and (2) MP is a Microsoft product and it is
compatible with other Microsoft product. Plus it has proven capabilities at
reasonable prices. MP 2003 was used in this study. It goes along with Microsoft
Access 2003, which was used to construct the database.
PocketCAD PRO 4.0 was also selected to include in the analysis. This
selection goes under the assumption that AutoCAD is already the computer
drawing tool being used by the company. At a relatively cheap price of $200 per
copy, this addition can be very beneficial by allowing drawings to be accessed
and manipulated for any purpose.
4.3 Implementation Steps
Each equipment or material has an ID that is connected to a certain
activity in the Master schedule. When the activity starts, the equipment and
materials are scanned with a precise message that specifies the status of the
activity. The activity can also be called by opening a scroll bar where all activities
are listed. Information regarding resource consumption is acquired and entered
by scanning the tags associated with these resources and data related to the
quantity or hour usage are directly entered. At the same time information related
to the installation procedure of the materials under study can be acquired from
the database system. Each worker has an ID card when scanned, data pertinent
to his working hours and the activity he is working on is entered. All these
information are sent instantly as soon it is entered to the database server,
through the wireless connectivity available on the construction site. All activities
have cost account codes to easily relate data to these activities. The process of
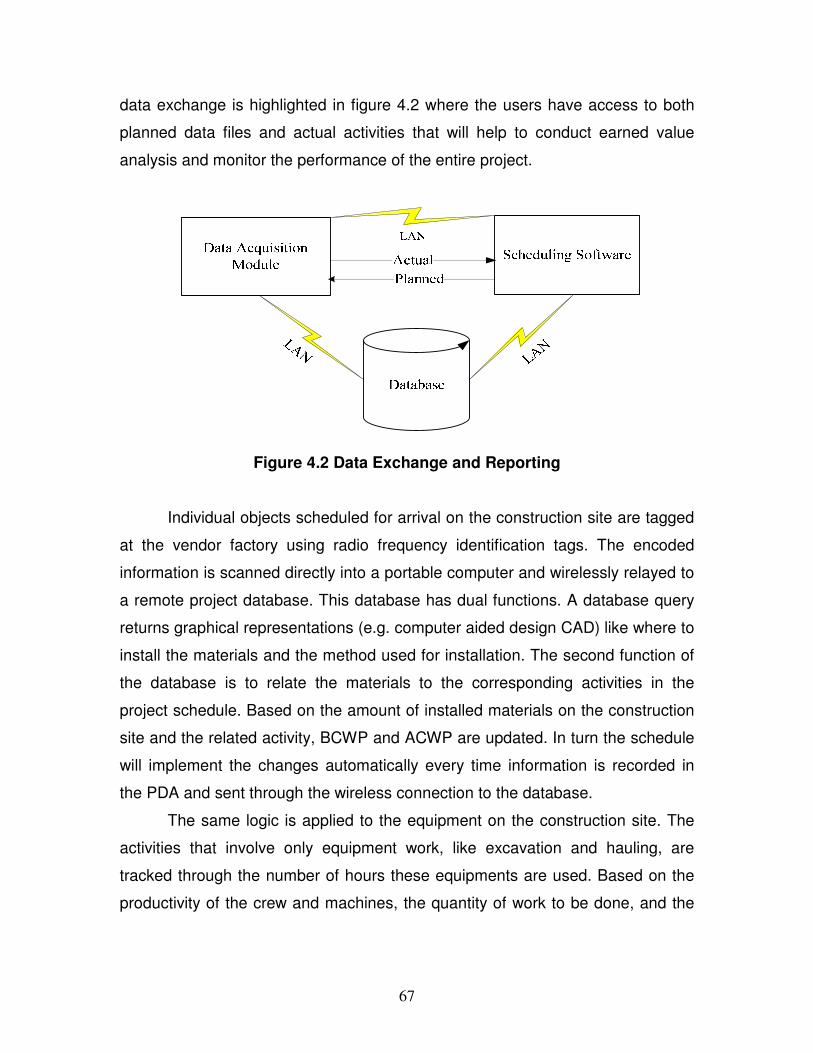
67
data exchange is highlighted in figure 4.2 where the users have access to both
planned data files and actual activities that will help to conduct earned value
analysis and monitor the performance of the entire project.
Figure 4.2 Data Exchange and Reporting
Individual objects scheduled for arrival on the construction site are tagged
at the vendor factory using radio frequency identification tags. The encoded
information is scanned directly into a portable computer and wirelessly relayed to
a remote project database. This database has dual functions. A database query
returns graphical representations (e.g. computer aided design CAD) like where to
install the materials and the method used for installation. The second function of
the database is to relate the materials to the corresponding activities in the
project schedule. Based on the amount of installed materials on the construction
site and the related activity, BCWP and ACWP are updated. In turn the schedule
will implement the changes automatically every time information is recorded in
the PDA and sent through the wireless connection to the database.
The same logic is applied to the equipment on the construction site. The
activities that involve only equipment work, like excavation and hauling, are
tracked through the number of hours these equipments are used. Based on the
productivity of the crew and machines, the quantity of work to be done, and the
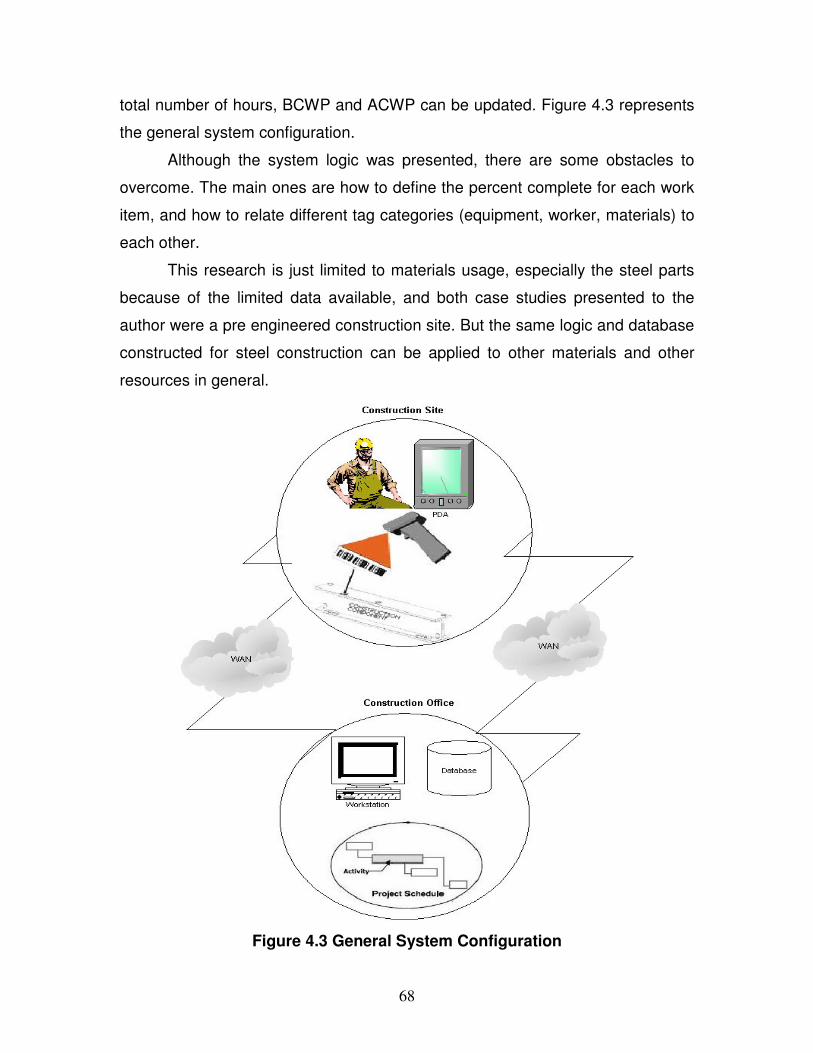
68
total number of hours, BCWP and ACWP can be updated. Figure 4.3 represents
the general system configuration.
Although the system logic was presented, there are some obstacles to
overcome. The main ones are how to define the percent complete for each work
item, and how to relate different tag categories (equipment, worker, materials) to
each other.
This research is just limited to materials usage, especially the steel parts
because of the limited data available, and both case studies presented to the
author were a pre engineered construction site. But the same logic and database
constructed for steel construction can be applied to other materials and other
resources in general.
Figure 4.3 General System Configuration

69
4.3.1 Work Progress Measurement
As mentioned in table 2.1 in chapter 2, based on the activity under
investigation, there exist 6 different types of measurement method. In our study,
we are concerned with steel construction, pre-engineered and fabricated part. So
the suitable two methods for our case studies are either units completed or
weighted or equivalent unit.
In the next section, we attempt to present a database where all the
information will be stored. This database will have a dual function to store
information, update schedule, keep users informed of all activities, and at the
same time retrieve information.
4.4 Construction of Data Management System
A database with single point of access to all data relating to the
construction site is used in this model. The intention is that this will encounter the
problems caused by duplicate or incomplete paper-based information on site and
also eliminate the need for user to carry bulky paper documentation. The
database also allows all users having access to all of the construction data
captured by other personnel. This allows for the free use of information between
users removing the burden of collating revised construction information caused
by unplanned sequence changes or schedule changes.
So a database management system (DBMS) is essential in supporting
project tracking and control functions. A database provides a platform to
organize, store and retrieve the planned and actual performance data of projects
in a logical and efficient manner. The DBMS queries the stored project data using
SQL (structured query language) to generate different management reports for
control purposes. It follows that the design of the database should follow a well-
defined structure to support the tracking and control of individual tasks at
different levels of reporting. The data structure should also facilitate the linkage of
those individual tasks to their respective construction trades.
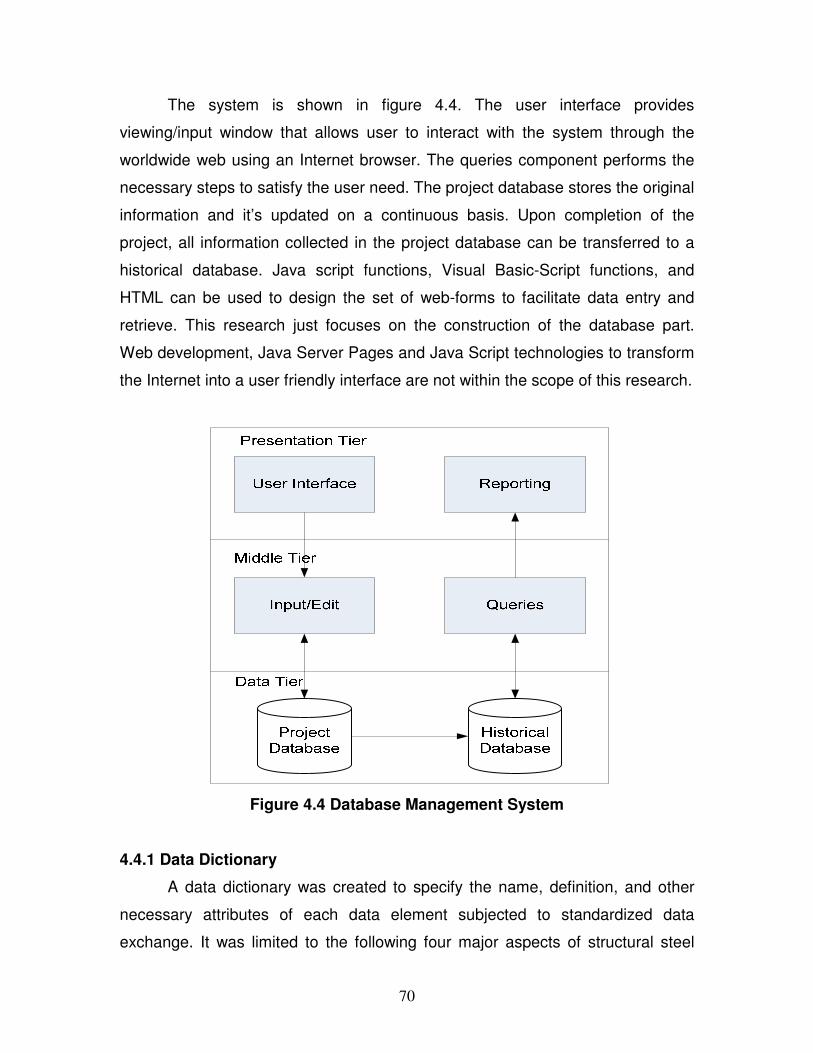
70
The system is shown in figure 4.4. The user interface provides
viewing/input window that allows user to interact with the system through the
worldwide web using an Internet browser. The queries component performs the
necessary steps to satisfy the user need. The project database stores the original
information and it’s updated on a continuous basis. Upon completion of the
project, all information collected in the project database can be transferred to a
historical database. Java script functions, Visual Basic-Script functions, and
HTML can be used to design the set of web-forms to facilitate data entry and
retrieve. This research just focuses on the construction of the database part.
Web development, Java Server Pages and Java Script technologies to transform
the Internet into a user friendly interface are not within the scope of this research.
Figure 4.4 Database Management System
4.4.1 Data Dictionary
A data dictionary was created to specify the name, definition, and other
necessary attributes of each data element subjected to standardized data
exchange. It was limited to the following four major aspects of structural steel
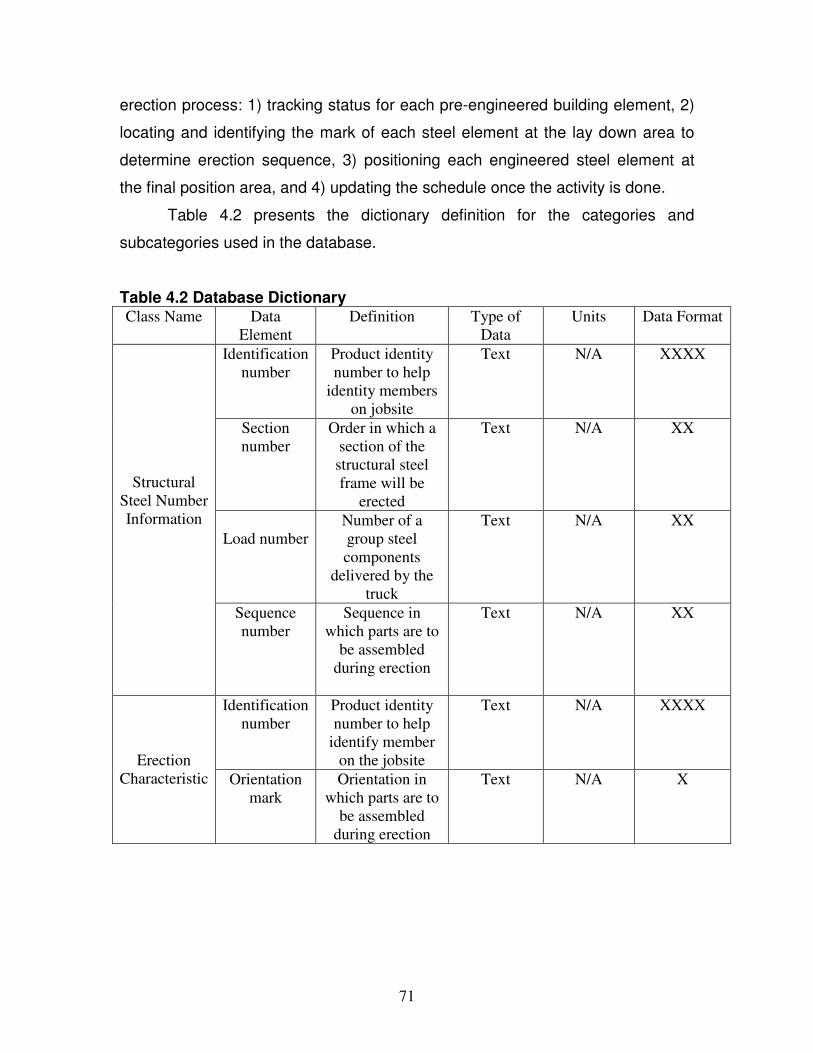
71
erection process: 1) tracking status for each pre-engineered building element, 2)
locating and identifying the mark of each steel element at the lay down area to
determine erection sequence, 3) positioning each engineered steel element at
the final position area, and 4) updating the schedule once the activity is done.
Table 4.2 presents the dictionary definition for the categories and
subcategories used in the database.
Table 4.2 Database Dictionary Class Name Data
Element
Definition Type of
Data
Units Data Format
Identification
number
Product identity
number to help
identity members
on jobsite
Text N/A XXXX
Section
number
Order in which a
section of the
structural steel
frame will be
erected
Text N/A XX
Load number
Number of a
group steel
components
delivered by the
truck
Text N/A XX
Structural
Steel Number
Information
Sequence
number
Sequence in
which parts are to
be assembled
during erection
Text N/A XX
Identification
number
Product identity
number to help
identify member
on the jobsite
Text N/A XXXX
Erection
Characteristic Orientation
mark
Orientation in
which parts are to
be assembled
during erection
Text N/A X

72
Table 4.2 Continued Class Name Data
Element
Definition Type of
Data
Units Data Format
Section
number
Order in which
section of
structural steel
frame will be
erected
Text N/A XX
Field date Date which erector
ask materials to be
delivered
Date/time dd-mm-yy N/A
Delivery
Request
Factory
delivery date
Date which factory
expects materials
to be delivered
Date/time dd-mm-yy N/A
Identification
number
Product identity
number to help
identify members
on jobsite
Text N/A XXXX
Erection start
Date which erector
start erection of
steel parts
Date/time dd-mm-yy N/A
Erection
status
Erection
completed
Date which erector
finish erection of
steel parts
Date/time dd-mm-yy N/A
Section
number
Order in which
section of the steel
frame will be
fabricated
Text N/A XX
Fabrication
start
Date which
fabricator start to
fabricate parts
Date/time dd-mm-yy N/A
Fabrication
Status
Fabrication
completed
Date which
fabricator finish to
fabricate parts
Date/time dd-mm-yy N/A
Delivery
start
Date which steel
fabricator start to
deliver steel parts
Date/time dd-mm-yy N/A Delivery
Status
Delivery
Completed
Date which steel
fabricator finish to
deliver steel parts
Date/time dd-mm-yy N/A
RFID Identification
number
Product identity
number to help
identify members
on jobsite
Text N/A XXXX
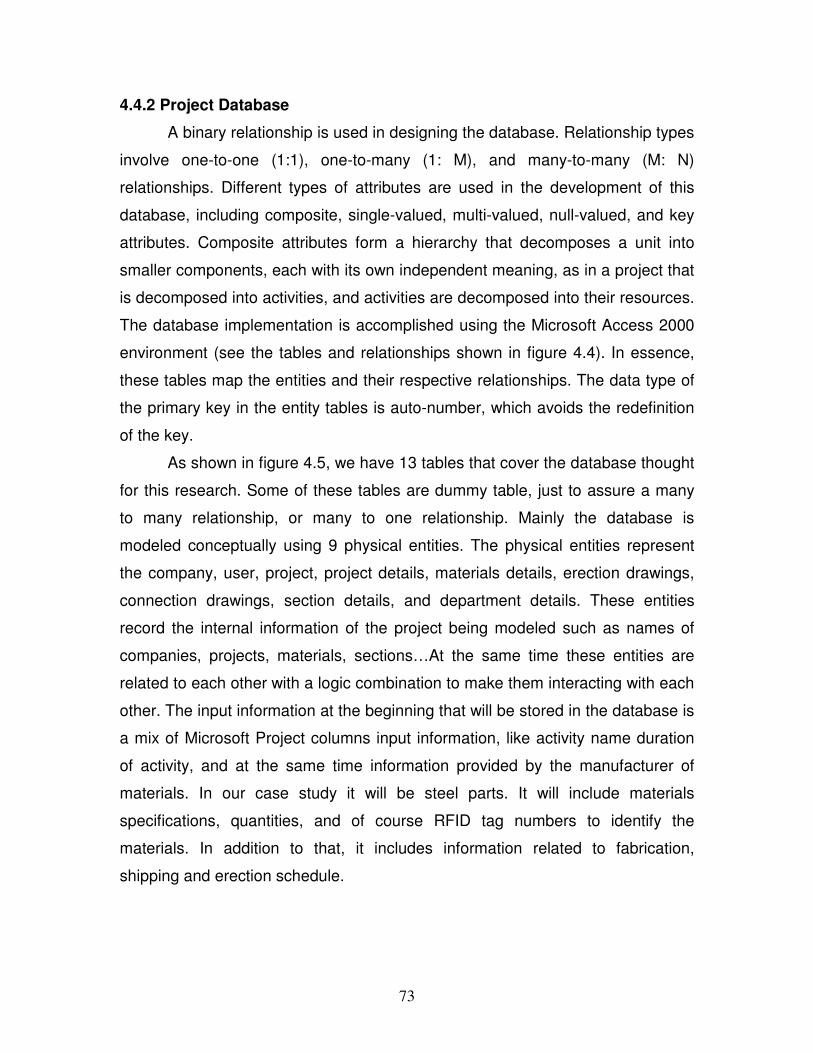
73
4.4.2 Project Database
A binary relationship is used in designing the database. Relationship types
involve one-to-one (1:1), one-to-many (1: M), and many-to-many (M: N)
relationships. Different types of attributes are used in the development of this
database, including composite, single-valued, multi-valued, null-valued, and key
attributes. Composite attributes form a hierarchy that decomposes a unit into
smaller components, each with its own independent meaning, as in a project that
is decomposed into activities, and activities are decomposed into their resources.
The database implementation is accomplished using the Microsoft Access 2000
environment (see the tables and relationships shown in figure 4.4). In essence,
these tables map the entities and their respective relationships. The data type of
the primary key in the entity tables is auto-number, which avoids the redefinition
of the key.
As shown in figure 4.5, we have 13 tables that cover the database thought
for this research. Some of these tables are dummy table, just to assure a many
to many relationship, or many to one relationship. Mainly the database is
modeled conceptually using 9 physical entities. The physical entities represent
the company, user, project, project details, materials details, erection drawings,
connection drawings, section details, and department details. These entities
record the internal information of the project being modeled such as names of
companies, projects, materials, sections…At the same time these entities are
related to each other with a logic combination to make them interacting with each
other. The input information at the beginning that will be stored in the database is
a mix of Microsoft Project columns input information, like activity name duration
of activity, and at the same time information provided by the manufacturer of
materials. In our case study it will be steel parts. It will include materials
specifications, quantities, and of course RFID tag numbers to identify the
materials. In addition to that, it includes information related to fabrication,
shipping and erection schedule.

74
Figure 4.5: Project Database Tables and their Relationships
4.4.2.1 Database Queries
Once the relationship and tables are established, next step is to perform
the required queries that will fulfill the need for this research. Some of the queries
constructed are fabrication schedule, shipping schedule, erection schedule,
section details, and project progress updates.
Figure 4.6 shows user interface of the database. Users just have to press
on one of the options available and the output will be displayed on the screen.
Figure 4.7 shows the output of the project update. At the beginning the
user has to enter the name of the activity, and then the remaining information will
appear.
Figure 4.8 shows erection drawings for certain section. It will include
details about the erection drawing pertaining to a certain section, in addition to
the connection details drawings. So the user on the construction site, having the
handheld computer in his hand, is able to access the information stored in the
database, and retrieve those information on a push of button.

75
Figure 4.6 User Interface
Figure 4.7 Project Updates
76
Figure 4.8 Erection drawings
Now that the framework of the real-time project tracking model was
presented, the next step is to develop an assessment system that will evaluator
to choose the right tools for the proposed model
77
CHAPTER 5
TECHNOLOGY SELECTION AND ASSESSMENT MODEL
This chapter presents a multi-attribute utility model to help in choosing
between different alternatives of using new technologies on the construction
sites. The theory’s basic idea is that the selection issue can be broken down into
alternative attributes. Based upon the user’s tradeoffs among attributes,
important weights are quantified and single attribute utilities are measured.
Finally, single attribute utilities are combined to develop one single aggregate
utility index for each alternative.
5.1 Assessment Model
The assessment model is divided in two parts. The first part consists of
developing the utility function model that will help evaluator to choose between
available technologies for real time project progress tracking. This phase include
presenting the main objective and identifying the attribute that will help the
evaluators in their decisions, and the alternatives to be assessed. The second
part consists of analysis and identifying the best alternative that serves our need.
Figure 5.1 presents the Analytic Hierarchy process flow chat.
5.1.1 Defining the Problem
Improving the information sharing between participants can enhance the
performance of project management and control. The information sharing is
composed of two main aspects: information acquisition and information
communication. Information acquisition problems in a construction project result
from the fact that most of the data and information are gathered from the
construction site. The effectiveness of information and data acquisition influences
the flow of information between the office and the construction site.
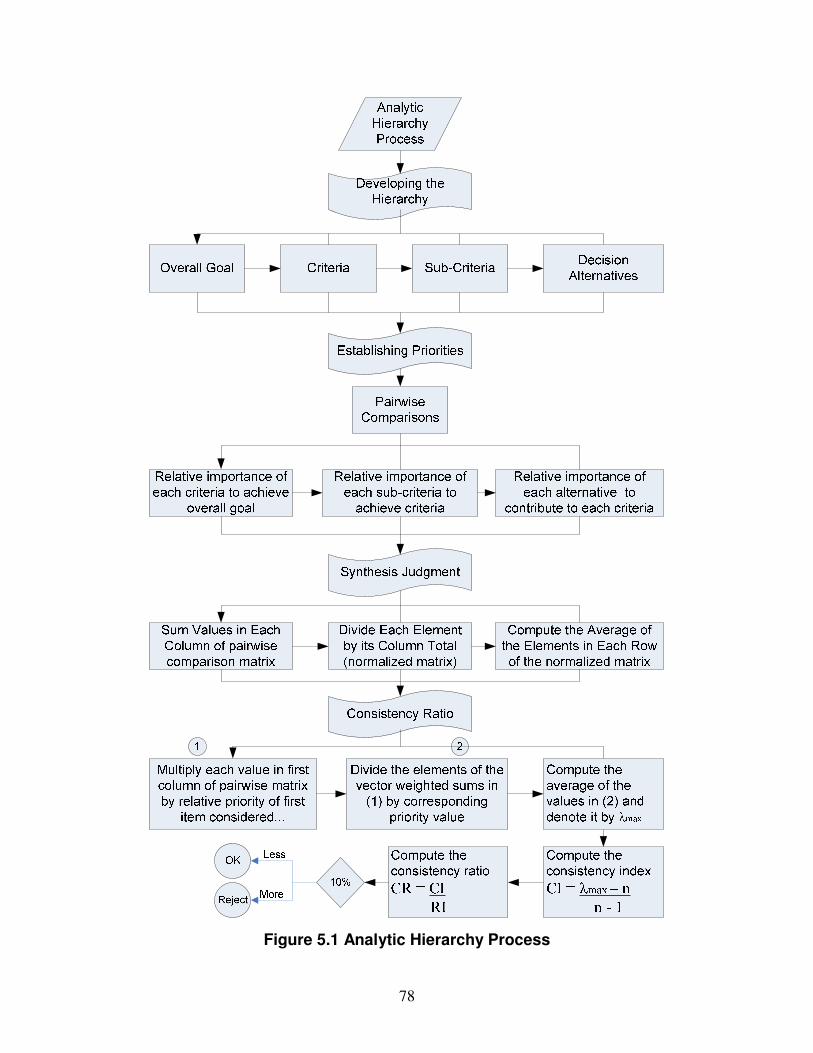
78
Figure 5.1 Analytic Hierarchy Process
79
However, on site engineers usually use written documents, drawings,
contracts, specifications, and shop drawings for job sites. As a result a gap in
time and space between the job site and office causes the duplex, lack and
confusion of data and information. In other words, existing means of processing
information and collecting data are not only consuming and costly, but also
reduce the performance of project management in information acquisition.
Furthermore, construction contractors normally depend on interactions over the
telephone or fax machine to communicate with suppliers, subcontractors, and
designers. Consequently, transactions are often lost or misunderstood. Such
means of communicating information between sites and offices, and among all
participants, are ineffective and inconvenient.
As mentioned in chapter 3 a good way to improve communication on the
construction and between construction site and office is by using information
technologies that will provide a framework for a real time project progress
tracking.
Because the Utility function requires developing selection criteria for
evaluation technology, three main objectives were identified: (1) technical merit,
(2) economic merit, and (3) low risk merit. Systems utilities were calculated
based on the degree to which these objectives were achieved (Ghanem et al.
2007).
5.1.2 Explanation of Model Attributes
The attributes structure listed in figure 5.2 can serve as a basis for
evaluating the selected project progress tracking systems. This section explains
the model attributes. Technical criteria are represented by nine attributes such as
technical requirement skills. Users on the construction site try to resist new
technologies especially if it involves a lot of training and effort to learn how the
system functions.
Battery life is an important factor in determining how long batteries operate
before they need a recharge. Some of the equipments are supplied with

80
rechargeable nickel cadmium cells. Others use disposable alkaline batteries.
Very few are powered by both types that include a backup source of power.
Wireless connection speed in order to update the host computer system
instantaneously as data reading occurs is a concern for people on the
construction site. Not all systems have this capability.
Rugged characteristic of the equipments used on the construction site
determine to what extent they can survive in harsh environment. These
equipment have passed durability tests up to military standards; they can
withstand falls, vibration, dust, and rain.
The screen size of both computers and PDA measured by inches is an
important attribute, because users have to check erection drawings and small
screen size tries to be an obstacle when tiny details need to be checked.
Some systems have the writing ability and others have the touching
screen ability. On the construction site while the user most of the time will be
standing and holding in one hand the equipment, probably it will affects its choice
regarding the writing system.
In addition to that the weight of the equipment is another concern when
the user will be holding it most of the time in his hand.
Another concern is the ability of the system to accommodate all required
software on the construction site. Mainly CAD and project management software
are a main concern for user on the construction site, in order to check the project
schedule and check the erection drawings when it is needed.
Accuracy of the system used especially when tags are being scanned on
the construction site is a concern too. Users tend to scan the tags from a
distance and interference with object or other tags has to be taken into
consideration.
Because technology cost is very important consideration, the initial
investment includes the equipment purchase cost, as well supporting cost for
software and accessories.
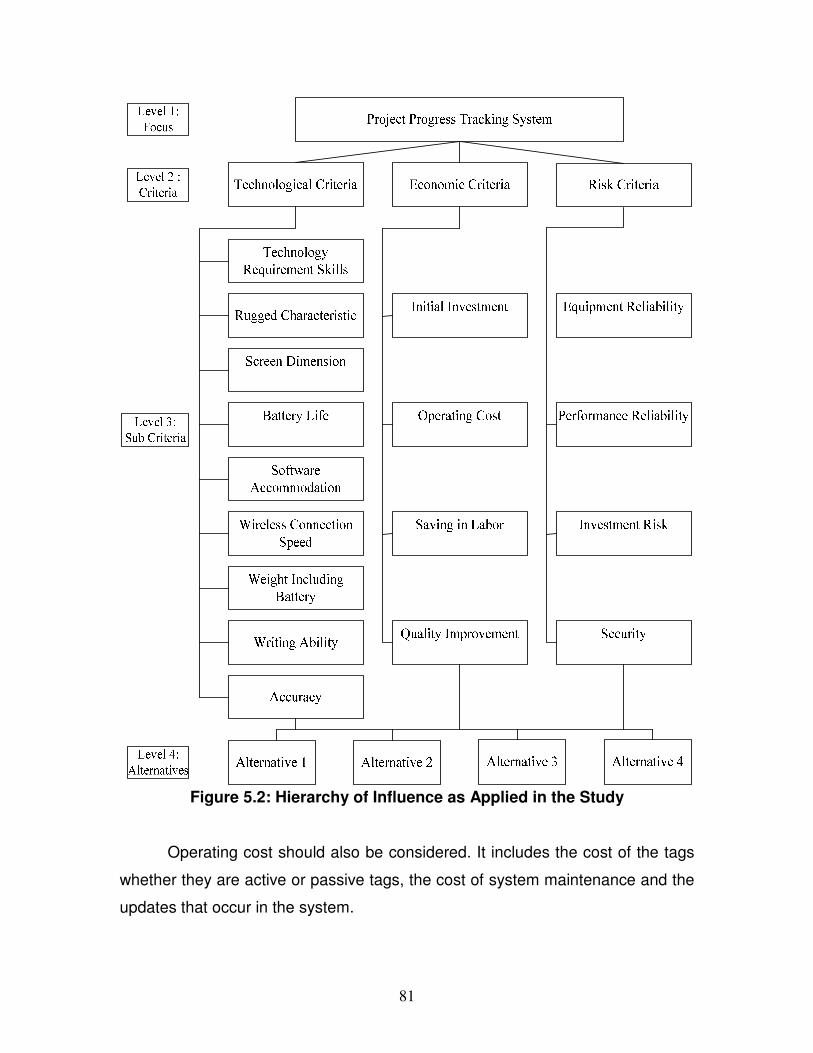
81
Figure 5.2: Hierarchy of Influence as Applied in the Study
Operating cost should also be considered. It includes the cost of the tags
whether they are active or passive tags, the cost of system maintenance and the
updates that occur in the system.

82
Incorporating new technologies into a company system is believed to
improve the quality of processes. But at the same time lead to cut in labor or
some people see it as saving in labor.
Concerning the risk factor resulting from using new technology, all risk
factor are included under the low risk criteria. Each evaluator evaluates
technologies based on how certain or uncertain he is about the technology.
Sources of uncertainty are numerous. Some sources could be related to the
system itself, such as the security of the system and how it can prevent hacking
the system. Another issue is a reliability issue that is associated with new
technologies. Equipment and performance reliability fall into this category. Users
want to make sure that the equipments and system they are using are reliable
with minimum down time.
5.1.3 Defining Attribute Measuring Scales
When the model objectives and attributes were satisfactorily defined, the
quantification process started by defining system attributes measures. Table 5.1
lists the measuring scales for the defined attributes. The measures scale is
based on literature review, reviewing manufacturers and associations’ websites,
and exchanging email with experts (Elmisalami et. al.2006, Abduh and
Skibniewski 2002, Singletary 2006).
Table 5.1 Attributes Measures Attributes Measures
Technical Requirement Skills
Very Low/ Low/Moderate/High
Accuracy Very Low/ Low/Moderate/High Rugged Characteristic IP # # Screen dimension 2/3/4/5/6/7/8/9/10 (inches) Battery life 1/2/3/4/5/6/7/8/9/10 (Hours) Weight including Battery 0.5/1/2/3/4/5/6/7/8/9/10 (Lb) Writing Ability Typing/Touching Software Accommodation CAD/Project Management/Both Wireless Connection Speed
kbps- Mbps
Initial Investment % of Project Total Cost
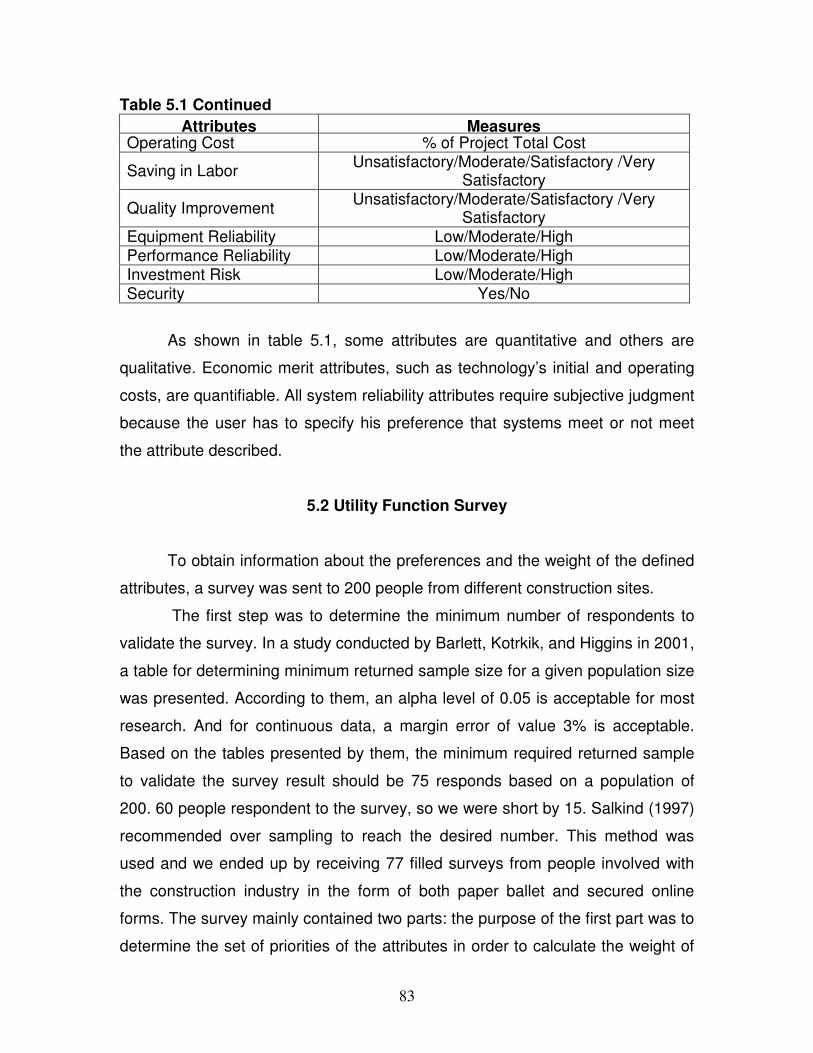
83
Table 5.1 Continued
Attributes Measures Operating Cost % of Project Total Cost
Saving in Labor Unsatisfactory/Moderate/Satisfactory /Very
Satisfactory
Quality Improvement Unsatisfactory/Moderate/Satisfactory /Very
Satisfactory Equipment Reliability Low/Moderate/High Performance Reliability Low/Moderate/High Investment Risk Low/Moderate/High Security Yes/No
As shown in table 5.1, some attributes are quantitative and others are
qualitative. Economic merit attributes, such as technology’s initial and operating
costs, are quantifiable. All system reliability attributes require subjective judgment
because the user has to specify his preference that systems meet or not meet
the attribute described.
5.2 Utility Function Survey
To obtain information about the preferences and the weight of the defined
attributes, a survey was sent to 200 people from different construction sites.
The first step was to determine the minimum number of respondents to
validate the survey. In a study conducted by Barlett, Kotrkik, and Higgins in 2001,
a table for determining minimum returned sample size for a given population size
was presented. According to them, an alpha level of 0.05 is acceptable for most
research. And for continuous data, a margin error of value 3% is acceptable.
Based on the tables presented by them, the minimum required returned sample
to validate the survey result should be 75 responds based on a population of
200. 60 people respondent to the survey, so we were short by 15. Salkind (1997)
recommended over sampling to reach the desired number. This method was
used and we ended up by receiving 77 filled surveys from people involved with
the construction industry in the form of both paper ballet and secured online
forms. The survey mainly contained two parts: the purpose of the first part was to
determine the set of priorities of the attributes in order to calculate the weight of

84
each attribute. The second part of the survey was to determine the utilities by
getting the evaluator preferences on the degree of liking for each attribute.
Appendix B contains the full form of the survey and the table developed by Barlet
et al. to determine the minimum size of survey filled.
Figure 5.3 illustrates the various job titles of the survey respondents. Most
of the responses are from engineers of companies with business areas in
building & civil construction. Other responses are scattered among all sectors
and job titles commonly found in the industry.
Figure 5.3 Job Title Survey Respondents
5.2.1 Measuring Weights
As mentioned before, the first part of the survey was used to determine
the preferences between the attributes. The pairwise comparison scale (table
3.1) presented by Saaty was used by the evaluator to represent the relative
importance of one element over another with respect to the criteria. The
responses to the pairwise comparisons at each level of the hierarchy were
placed into a comparison matrix. Only half of the matrices needed to be filled by
the evaluators because the other half is reciprocal. The numbers (on a scale 1 to
9) in the matrices corresponds to ratio scales.
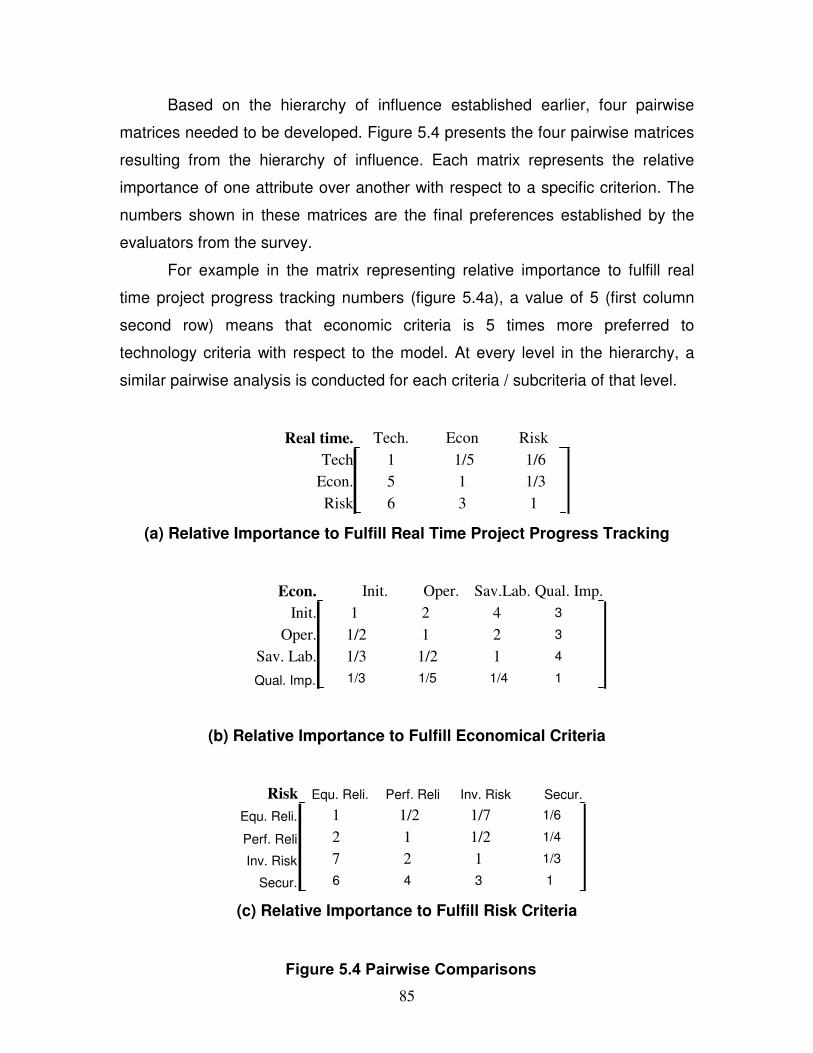
85
Based on the hierarchy of influence established earlier, four pairwise
matrices needed to be developed. Figure 5.4 presents the four pairwise matrices
resulting from the hierarchy of influence. Each matrix represents the relative
importance of one attribute over another with respect to a specific criterion. The
numbers shown in these matrices are the final preferences established by the
evaluators from the survey.
For example in the matrix representing relative importance to fulfill real
time project progress tracking numbers (figure 5.4a), a value of 5 (first column
second row) means that economic criteria is 5 times more preferred to
technology criteria with respect to the model. At every level in the hierarchy, a
similar pairwise analysis is conducted for each criteria / subcriteria of that level.
Real time. Tech. Econ Risk
Tech 1 1/5 1/6
Econ. 5 1 1/3
Risk 6 3 1
(a) Relative Importance to Fulfill Real Time Project Progress Tracking
Econ. Init. Oper. Sav.Lab. Qual. Imp.
Init. 1 2 4 3
Oper. 1/2 1 2 3
Sav. Lab. 1/3 1/2 1 4
Qual. Imp. 1/3 1/5 1/4 1
(b) Relative Importance to Fulfill Economical Criteria
Risk Equ. Reli. Perf. Reli Inv. Risk Secur.
Equ. Reli. 1 1/2 1/7 1/6
Perf. Reli 2 1 1/2 1/4
Inv. Risk 7 2 1 1/3
Secur. 6 4 3 1
(c) Relative Importance to Fulfill Risk Criteria
Figure 5.4 Pairwise Comparisons
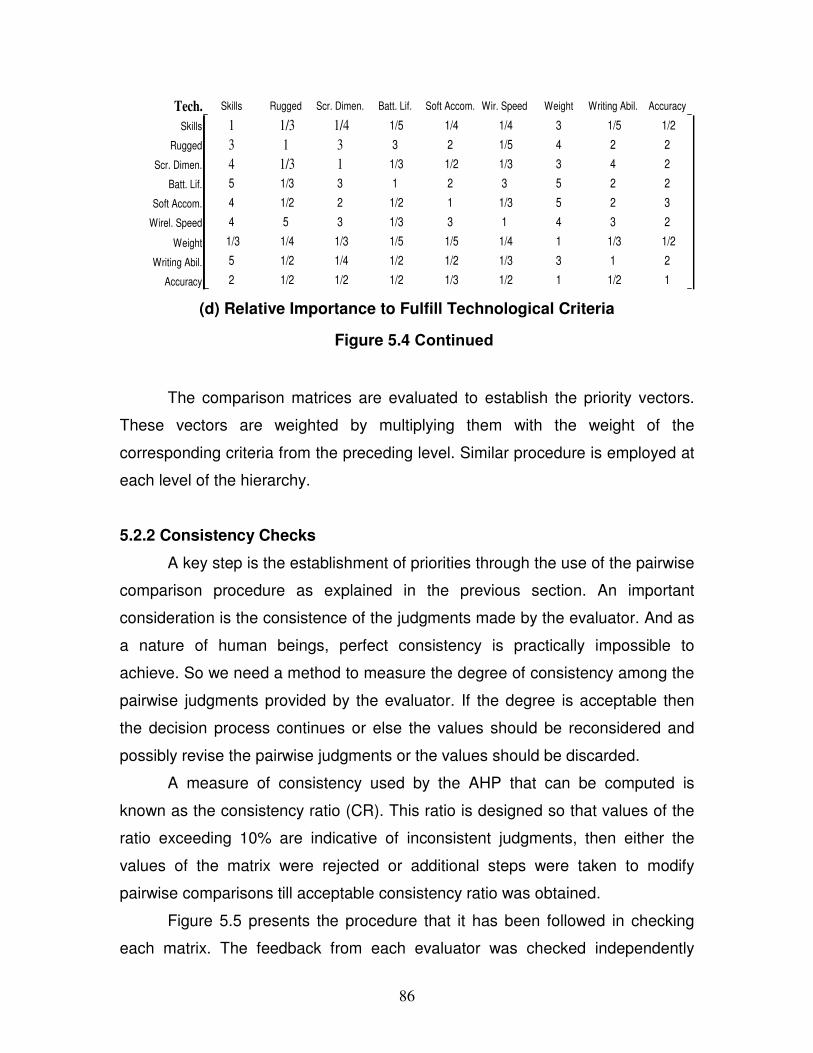
86
Tech. Skills Rugged Scr. Dimen. Batt. Lif. Soft Accom. Wir. Speed Weight Writing Abil. Accuracy
Skills 1 1/3 1/4 1/5 1/4 1/4 3 1/5 1/2
Rugged 3 1 3 3 2 1/5 4 2 2
Scr. Dimen. 4 1/3 1 1/3 1/2 1/3 3 4 2
Batt. Lif. 5 1/3 3 1 2 3 5 2 2
Soft Accom. 4 1/2 2 1/2 1 1/3 5 2 3
Wirel. Speed 4 5 3 1/3 3 1 4 3 2
Weight 1/3 1/4 1/3 1/5 1/5 1/4 1 1/3 1/2
Writing Abil. 5 1/2 1/4 1/2 1/2 1/3 3 1 2
Accuracy 2 1/2 1/2 1/2 1/3 1/2 1 1/2 1
(d) Relative Importance to Fulfill Technological Criteria
Figure 5.4 Continued
The comparison matrices are evaluated to establish the priority vectors.
These vectors are weighted by multiplying them with the weight of the
corresponding criteria from the preceding level. Similar procedure is employed at
each level of the hierarchy.
5.2.2 Consistency Checks
A key step is the establishment of priorities through the use of the pairwise
comparison procedure as explained in the previous section. An important
consideration is the consistence of the judgments made by the evaluator. And as
a nature of human beings, perfect consistency is practically impossible to
achieve. So we need a method to measure the degree of consistency among the
pairwise judgments provided by the evaluator. If the degree is acceptable then
the decision process continues or else the values should be reconsidered and
possibly revise the pairwise judgments or the values should be discarded.
A measure of consistency used by the AHP that can be computed is
known as the consistency ratio (CR). This ratio is designed so that values of the
ratio exceeding 10% are indicative of inconsistent judgments, then either the
values of the matrix were rejected or additional steps were taken to modify
pairwise comparisons till acceptable consistency ratio was obtained.
Figure 5.5 presents the procedure that it has been followed in checking
each matrix. The feedback from each evaluator was checked independently

87
using equation 3.5 and 3.6, and in case CR was greater than 10% additional
steps were taken or in some cases the matrix was rejected. Out of the 77 people
who replied to the survey, 21 matrices were rejected cause of failure to the
consistency check.
The first matrix of each row represents the normalized pairwise. The
normalized matrix is calculated by adding the values in each column of the
pairwise comparison matrix, and then dividing each element in the pairwise
comparison matrix by its column total. The second matrix provides an estimate of
the relative priorities of the elements being compared. It is calculated by
computing the average of the elements in each row of the normalized matrix.
These values from each set of matrix were used to develop the weight of each
attribute.
Then consistency is calculated as follows:
Step 1: Normalize the comparison matrix by dividing the values of each column
over the sum of this column.
Step 2: Calculate the elements of the eigenvector matrix by averaging the
elements of each individual row of the normalized matrix.
Step 3: Calculate the transition matrix by multiplying the comparison matrix with
the calculated eigenvector.
Step 4: Calculate the matrix dominant eigenvalue noted (max using equation 3.4.
Step 5: Compute the Consistency Ration (CR) based on equation 3.6
Step 1 Step 2
Real time Tech.
Tech 0.08 0.05 0.11 0.08
Econ. 0.42 0.24 0.22 0.29
Risk 0.50 0.71 0.67 0.63
Normal Matrix Eigenvector Matrix
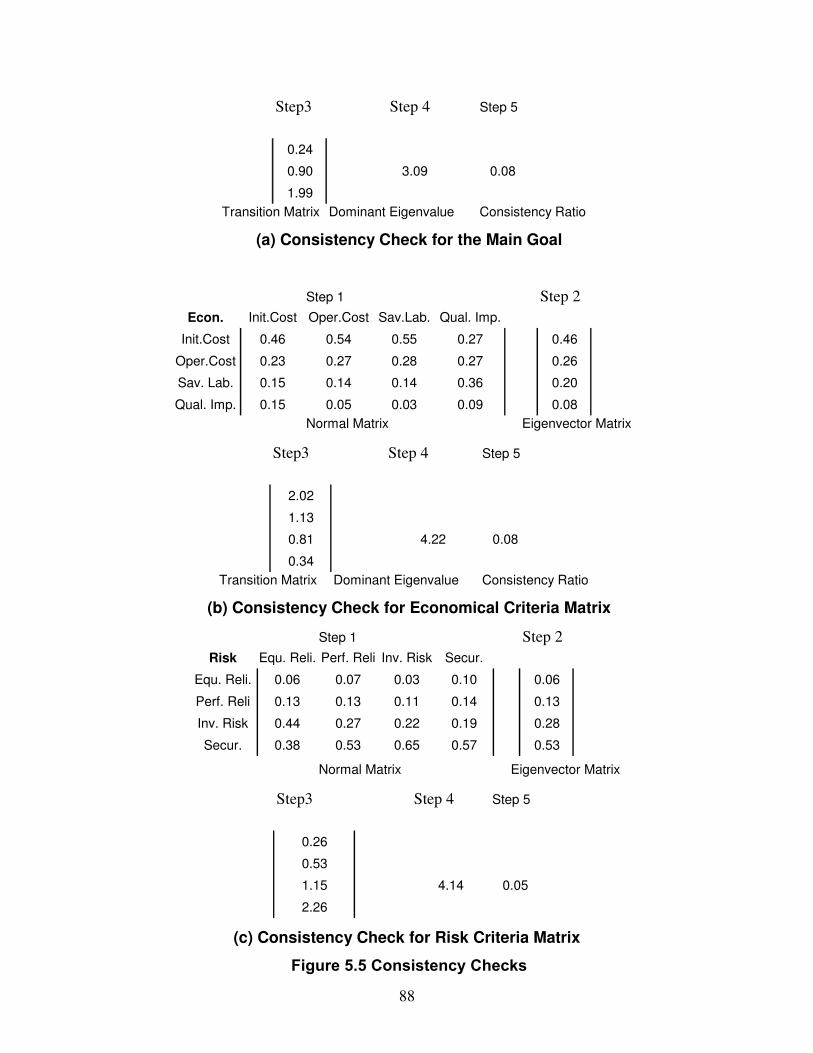
88
Step3 Step 4 Step 5
0.24
0.90 3.09 0.08
1.99
Transition Matrix Dominant Eigenvalue Consistency Ratio
(a) Consistency Check for the Main Goal
Step 1 Step 2
Econ. Init.Cost Oper.Cost Sav.Lab. Qual. Imp.
Init.Cost 0.46 0.54 0.55 0.27 0.46
Oper.Cost 0.23 0.27 0.28 0.27 0.26
Sav. Lab. 0.15 0.14 0.14 0.36 0.20
Qual. Imp. 0.15 0.05 0.03 0.09 0.08
Normal Matrix Eigenvector Matrix
Step3 Step 4 Step 5
2.02
1.13
0.81 4.22 0.08
0.34
Transition Matrix Dominant Eigenvalue Consistency Ratio
(b) Consistency Check for Economical Criteria Matrix
Step 1 Step 2
Risk Equ. Reli. Perf. Reli Inv. Risk Secur.
Equ. Reli. 0.06 0.07 0.03 0.10 0.06
Perf. Reli 0.13 0.13 0.11 0.14 0.13
Inv. Risk 0.44 0.27 0.22 0.19 0.28
Secur. 0.38 0.53 0.65 0.57 0.53
Normal Matrix Eigenvector Matrix
Step3 Step 4 Step 5
0.26
0.53
1.15 4.14 0.05
2.26
(c) Consistency Check for Risk Criteria Matrix
Figure 5.5 Consistency Checks
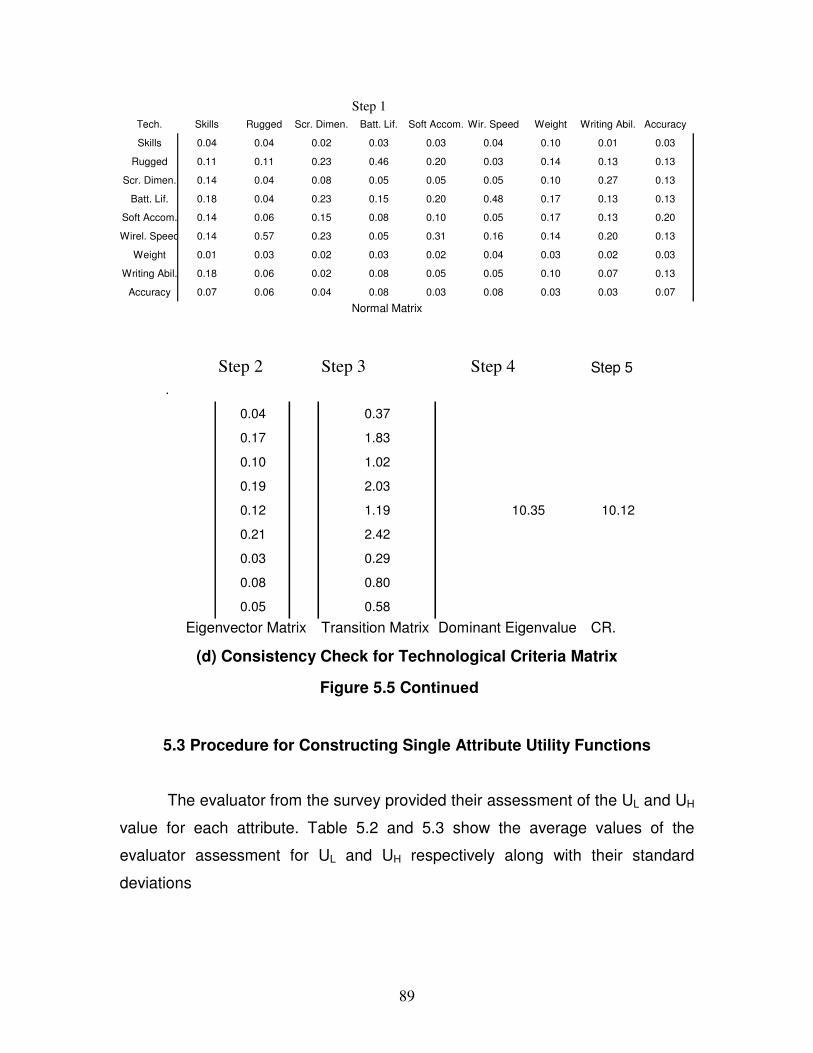
89
Step 1
Tech. Skills Rugged Scr. Dimen. Batt. Lif. Soft Accom. Wir. Speed Weight Writing Abil. Accuracy
Skills 0.04 0.04 0.02 0.03 0.03 0.04 0.10 0.01 0.03
Rugged 0.11 0.11 0.23 0.46 0.20 0.03 0.14 0.13 0.13
Scr. Dimen. 0.14 0.04 0.08 0.05 0.05 0.05 0.10 0.27 0.13
Batt. Lif. 0.18 0.04 0.23 0.15 0.20 0.48 0.17 0.13 0.13
Soft Accom. 0.14 0.06 0.15 0.08 0.10 0.05 0.17 0.13 0.20
Wirel. Speed 0.14 0.57 0.23 0.05 0.31 0.16 0.14 0.20 0.13
Weight 0.01 0.03 0.02 0.03 0.02 0.04 0.03 0.02 0.03
Writing Abil. 0.18 0.06 0.02 0.08 0.05 0.05 0.10 0.07 0.13
Accuracy 0.07 0.06 0.04 0.08 0.03 0.08 0.03 0.03 0.07
Normal Matrix
Step 2 Step 3 Step 4 Step 5
bil.
0.04 0.37
0.17 1.83
0.10 1.02
0.19 2.03
0.12 1.19 10.35 10.12
0.21 2.42
0.03 0.29
0.08 0.80
0.05 0.58
Eigenvector Matrix Transition Matrix Dominant Eigenvalue CR.
(d) Consistency Check for Technological Criteria Matrix
Figure 5.5 Continued
5.3 Procedure for Constructing Single Attribute Utility Functions
The evaluator from the survey provided their assessment of the UL and UH
value for each attribute. Table 5.2 and 5.3 show the average values of the
evaluator assessment for UL and UH respectively along with their standard
deviations
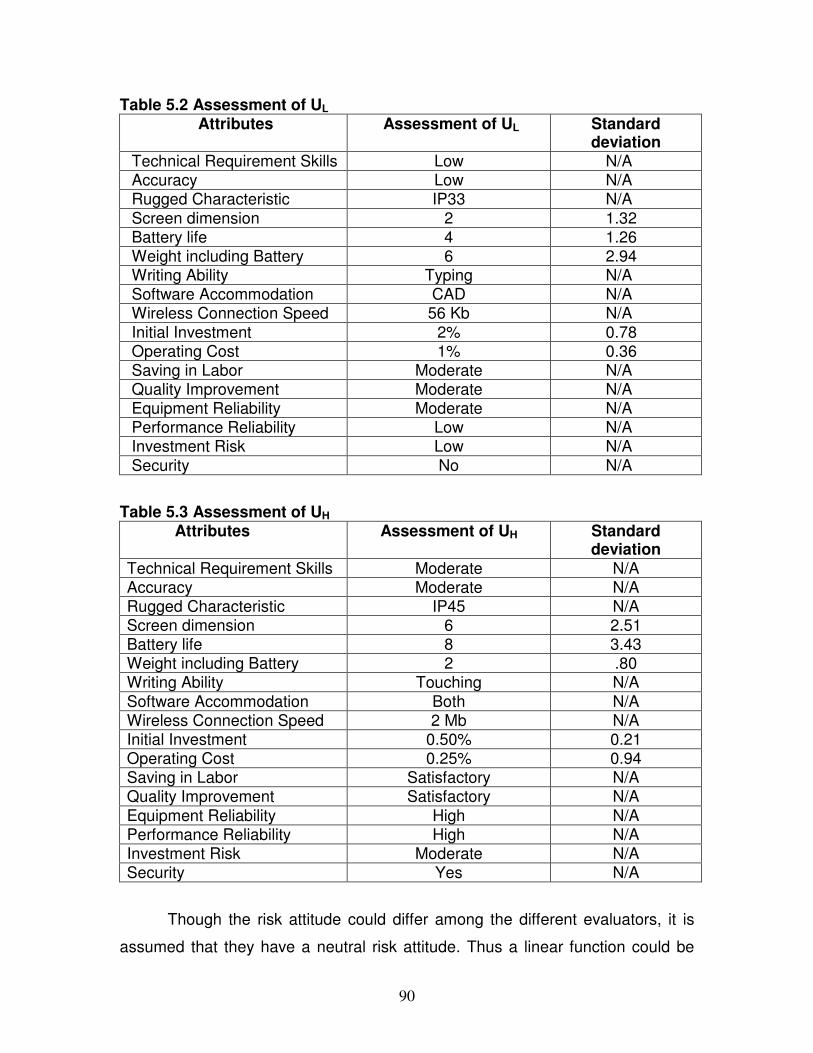
90
Table 5.2 Assessment of UL Attributes Assessment of UL Standard
deviation Technical Requirement Skills Low N/A Accuracy Low N/A Rugged Characteristic IP33 N/A Screen dimension 2 1.32 Battery life 4 1.26 Weight including Battery 6 2.94 Writing Ability Typing N/A Software Accommodation CAD N/A Wireless Connection Speed 56 Kb N/A Initial Investment 2% 0.78 Operating Cost 1% 0.36 Saving in Labor Moderate N/A Quality Improvement Moderate N/A Equipment Reliability Moderate N/A Performance Reliability Low N/A Investment Risk Low N/A Security No N/A
Table 5.3 Assessment of UH Attributes Assessment of UH Standard
deviation Technical Requirement Skills Moderate N/A Accuracy Moderate N/A Rugged Characteristic IP45 N/A Screen dimension 6 2.51 Battery life 8 3.43 Weight including Battery 2 .80 Writing Ability Touching N/A Software Accommodation Both N/A Wireless Connection Speed 2 Mb N/A Initial Investment 0.50% 0.21 Operating Cost 0.25% 0.94 Saving in Labor Satisfactory N/A Quality Improvement Satisfactory N/A Equipment Reliability High N/A Performance Reliability High N/A Investment Risk Moderate N/A Security Yes N/A
Though the risk attitude could differ among the different evaluators, it is
assumed that they have a neutral risk attitude. Thus a linear function could be
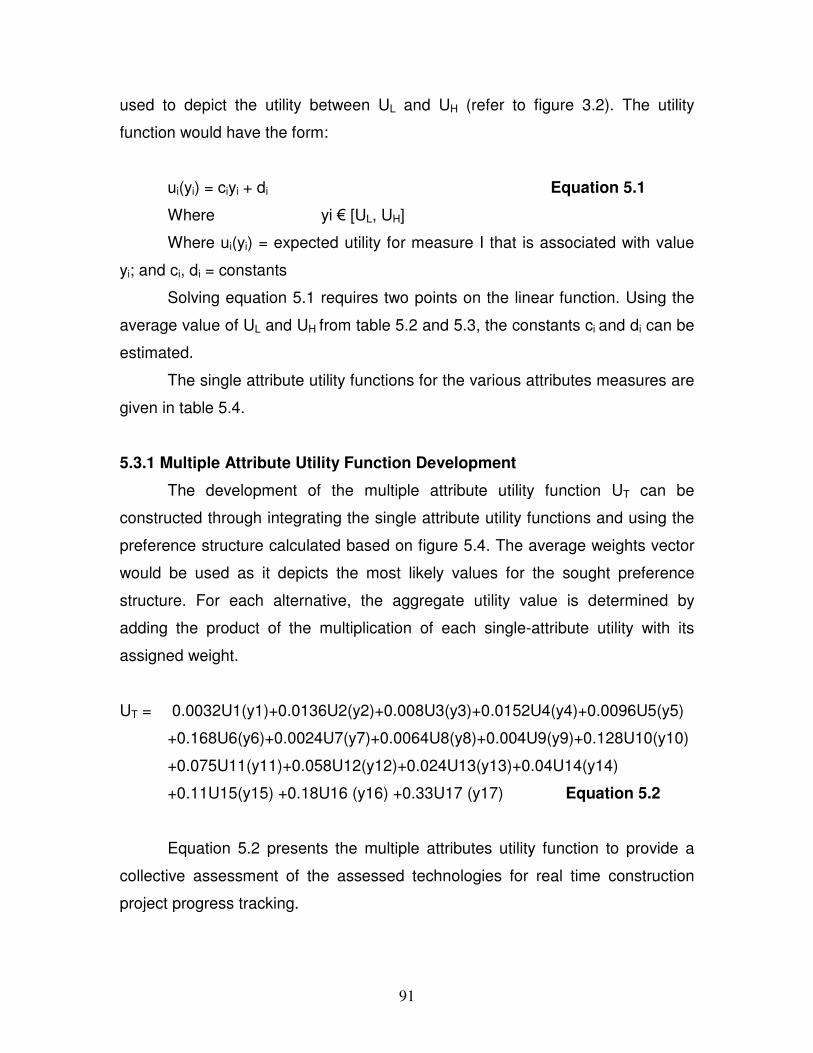
91
used to depict the utility between UL and UH (refer to figure 3.2). The utility
function would have the form:
ui(yi) = ciyi + di Equation 5.1
Where yi * [UL, UH]
Where ui(yi) = expected utility for measure I that is associated with value
yi; and ci, di = constants
Solving equation 5.1 requires two points on the linear function. Using the
average value of UL and UH from table 5.2 and 5.3, the constants ci and di can be
estimated.
The single attribute utility functions for the various attributes measures are
given in table 5.4.
5.3.1 Multiple Attribute Utility Function Development
The development of the multiple attribute utility function UT can be
constructed through integrating the single attribute utility functions and using the
preference structure calculated based on figure 5.4. The average weights vector
would be used as it depicts the most likely values for the sought preference
structure. For each alternative, the aggregate utility value is determined by
adding the product of the multiplication of each single-attribute utility with its
assigned weight.
UT = 0.0032U1(y1)+0.0136U2(y2)+0.008U3(y3)+0.0152U4(y4)+0.0096U5(y5)
+0.168U6(y6)+0.0024U7(y7)+0.0064U8(y8)+0.004U9(y9)+0.128U10(y10)
+0.075U11(y11)+0.058U12(y12)+0.024U13(y13)+0.04U14(y14)
+0.11U15(y15) +0.18U16 (y16) +0.33U17 (y17) Equation 5.2
Equation 5.2 presents the multiple attributes utility function to provide a
collective assessment of the assessed technologies for real time construction
project progress tracking.
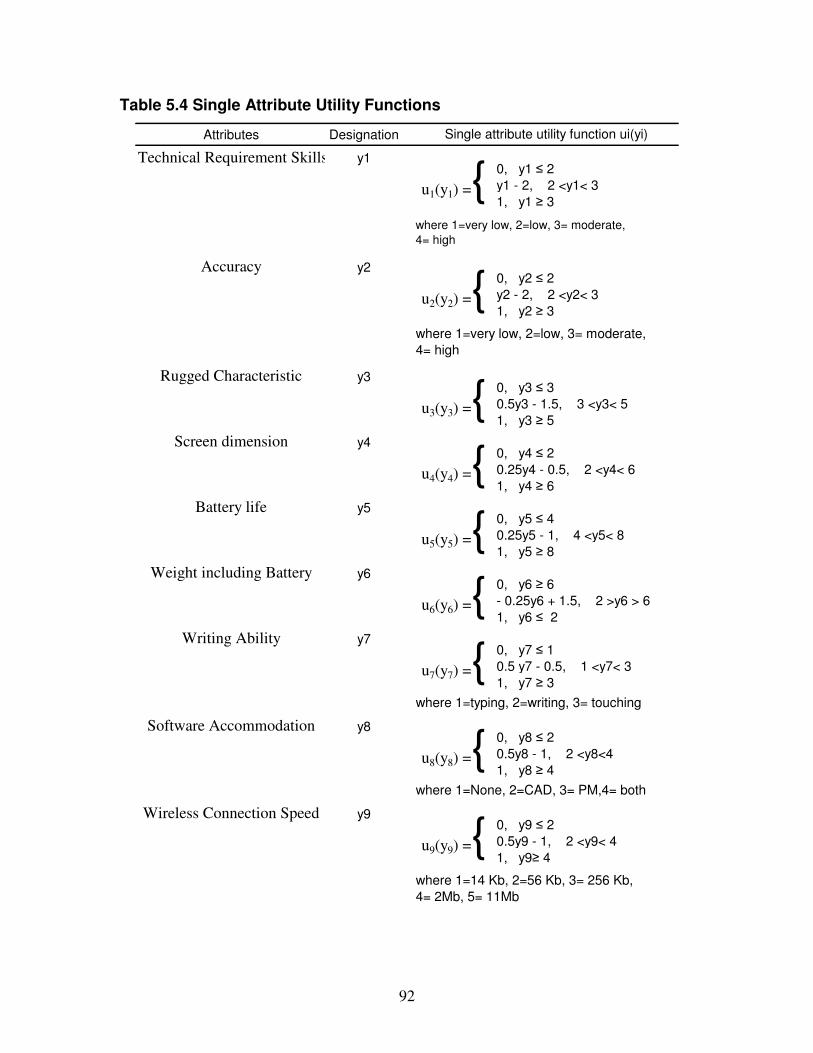
92
Table 5.4 Single Attribute Utility Functions
Attributes Designation
Technical Requirement Skills y1
Accuracy y2
Rugged Characteristic y3
Screen dimension y4
Battery life y5
Weight including Battery y6
Writing Ability y7
Software Accommodation y8
Wireless Connection Speed y9
Single attribute utility function ui(yi)
where 1=None, 2=CAD, 3= PM,4= both
u9(y9) ={0, y9 + 2
0.5y9 - 1, 2 <y9< 4
1, y9, 4
where 1=14 Kb, 2=56 Kb, 3= 256 Kb,
4= 2Mb, 5= 11Mb
u7(y7) ={0, y7 + 1
0.5 y7 - 0.5, 1 <y7< 3
1, y7 , 3
where 1=typing, 2=writing, 3= touching
u8(y8) ={0, y8 + 2
0.5y8 - 1, 2 <y8<4
1, y8 , 4
u6(y6) ={0, y6 , 6
- 0.25y6 + 1.5, 2 >y6 > 6
1, y6 + 2
u4(y4) ={0, y4 + 2
0.25y4 - 0.5, 2 <y4< 6
1, y4 , 6
u5(y5) ={0, y5 + 4
0.25y5 - 1, 4 <y5< 8
1, y5 , 8
where 1=very low, 2=low, 3= moderate,
4= high
u3(y3) ={0, y3 + 3
0.5y3 - 1.5, 3 <y3< 5
1, y3 , 5
0, y1 + 2
y1 - 2, 2 <y1< 3
1, y1 , 3u1(y1) ={
where 1=very low, 2=low, 3= moderate,
4= high
u2(y2) ={0, y2 + 2
y2 - 2, 2 <y2< 3
1, y2 , 3
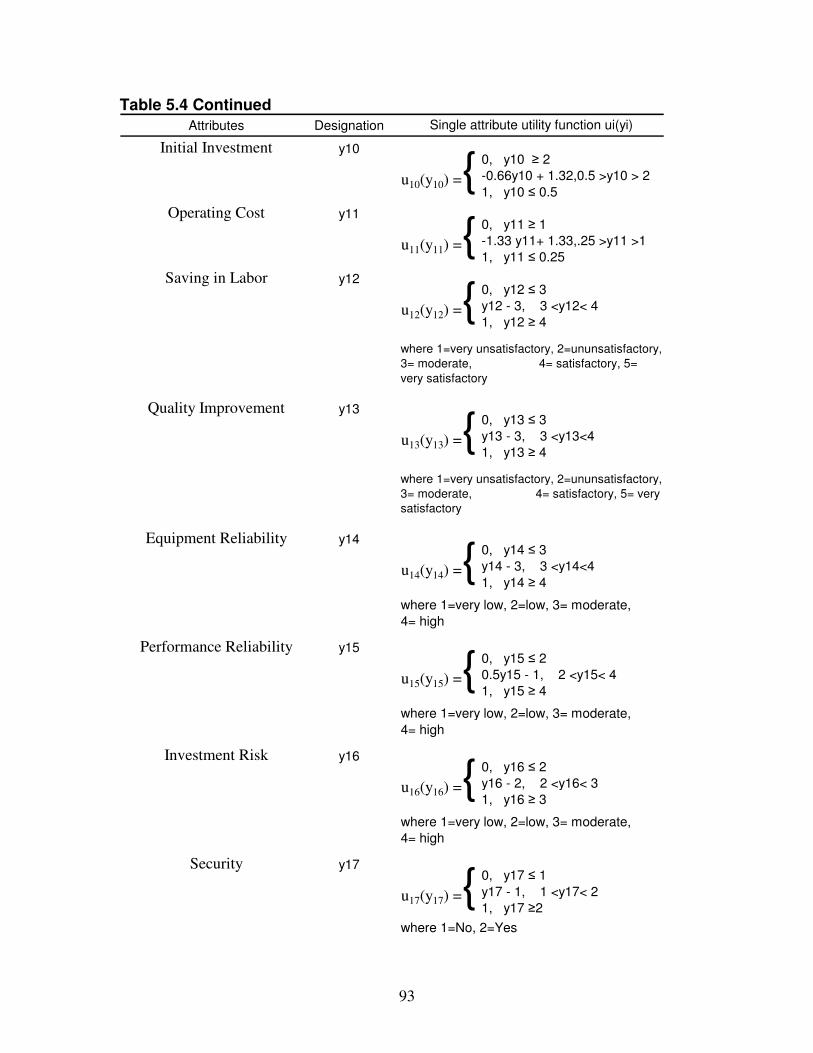
93
Table 5.4 Continued
Attributes Designation
Initial Investment y10
Operating Cost y11
Saving in Labor y12
Quality Improvement y13
Equipment Reliability y14
Performance Reliability y15
Investment Risk y16
Security y17
where 1=No, 2=Yes
Single attribute utility function ui(yi)
u16(y16) ={0, y16 + 2
y16 - 2, 2 <y16< 3
1, y16 , 3
where 1=very low, 2=low, 3= moderate,
4= high
u17(y17) ={0, y17 + 1
y17 - 1, 1 <y17< 2
1, y17 ,2
where 1=very low, 2=low, 3= moderate,
4= high
u15(y15) ={0, y15 + 2
0.5y15 - 1, 2 <y15< 4
1, y15 , 4
where 1=very low, 2=low, 3= moderate,
4= high
u13(y13) ={0, y13 + 3
y13 - 3, 3 <y13<4
1, y13 , 4
where 1=very unsatisfactory, 2=ununsatisfactory,
3= moderate, 4= satisfactory, 5= very
satisfactory
u14(y14) ={0, y14 + 3
y14 - 3, 3 <y14<4
1, y14 , 4
u12(y12) ={0, y12 + 3
y12 - 3, 3 <y12< 4
1, y12 , 4
where 1=very unsatisfactory, 2=ununsatisfactory,
3= moderate, 4= satisfactory, 5=
very satisfactory
u10(y10) ={0, y10 , 2
-0.66y10 + 1.32,0.5 >y10 > 2
1, y10 + 0.5
u11(y11) ={0, y11 , 1
-1.33 y11+ 1.33,.25 >y11 >1
1, y11 + 0.25
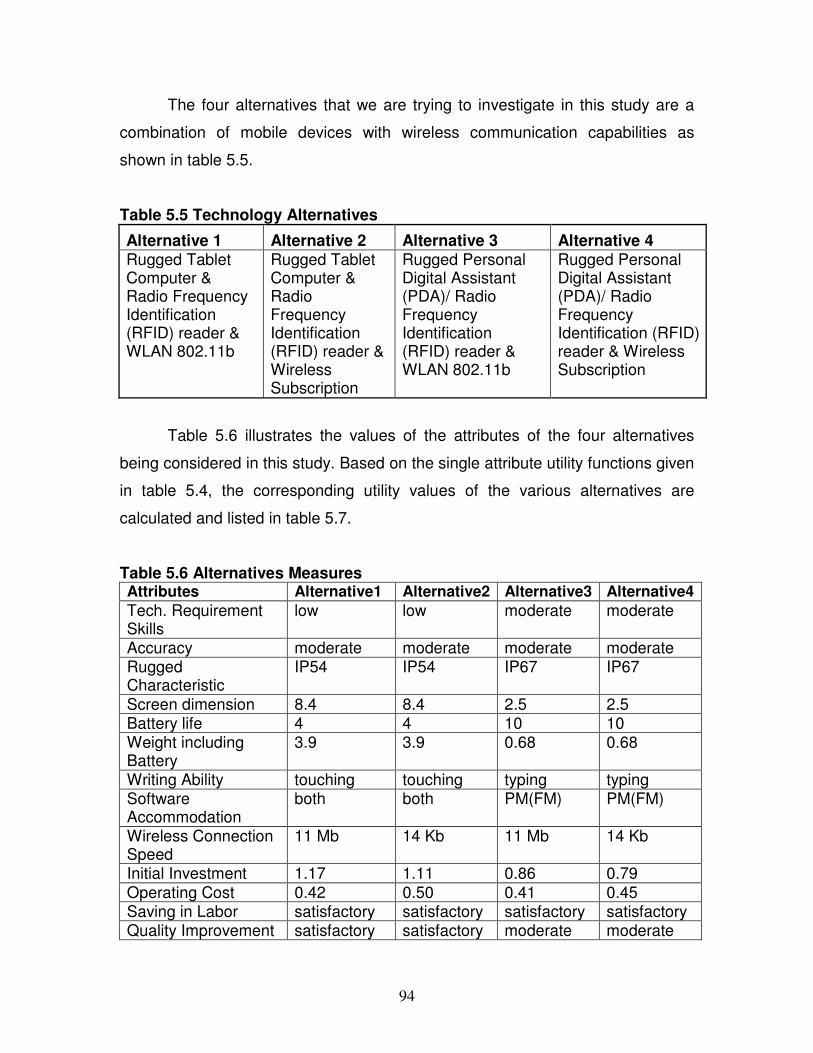
94
The four alternatives that we are trying to investigate in this study are a
combination of mobile devices with wireless communication capabilities as
shown in table 5.5.
Table 5.5 Technology Alternatives
Alternative 1 Alternative 2 Alternative 3 Alternative 4 Rugged Tablet Computer & Radio Frequency Identification (RFID) reader & WLAN 802.11b
Rugged Tablet Computer & Radio Frequency Identification (RFID) reader & Wireless Subscription
Rugged Personal Digital Assistant (PDA)/ Radio Frequency Identification (RFID) reader & WLAN 802.11b
Rugged Personal Digital Assistant (PDA)/ Radio Frequency Identification (RFID) reader & Wireless Subscription
Table 5.6 illustrates the values of the attributes of the four alternatives
being considered in this study. Based on the single attribute utility functions given
in table 5.4, the corresponding utility values of the various alternatives are
calculated and listed in table 5.7.
Table 5.6 Alternatives Measures Attributes Alternative1 Alternative2 Alternative3 Alternative4
Tech. Requirement Skills
low low moderate moderate
Accuracy moderate moderate moderate moderate Rugged Characteristic
IP54 IP54 IP67 IP67
Screen dimension 8.4 8.4 2.5 2.5 Battery life 4 4 10 10 Weight including Battery
3.9 3.9 0.68 0.68
Writing Ability touching touching typing typing Software Accommodation
both both PM(FM) PM(FM)
Wireless Connection Speed
11 Mb 14 Kb 11 Mb 14 Kb
Initial Investment 1.17 1.11 0.86 0.79 Operating Cost 0.42 0.50 0.41 0.45 Saving in Labor satisfactory satisfactory satisfactory satisfactory Quality Improvement satisfactory satisfactory moderate moderate
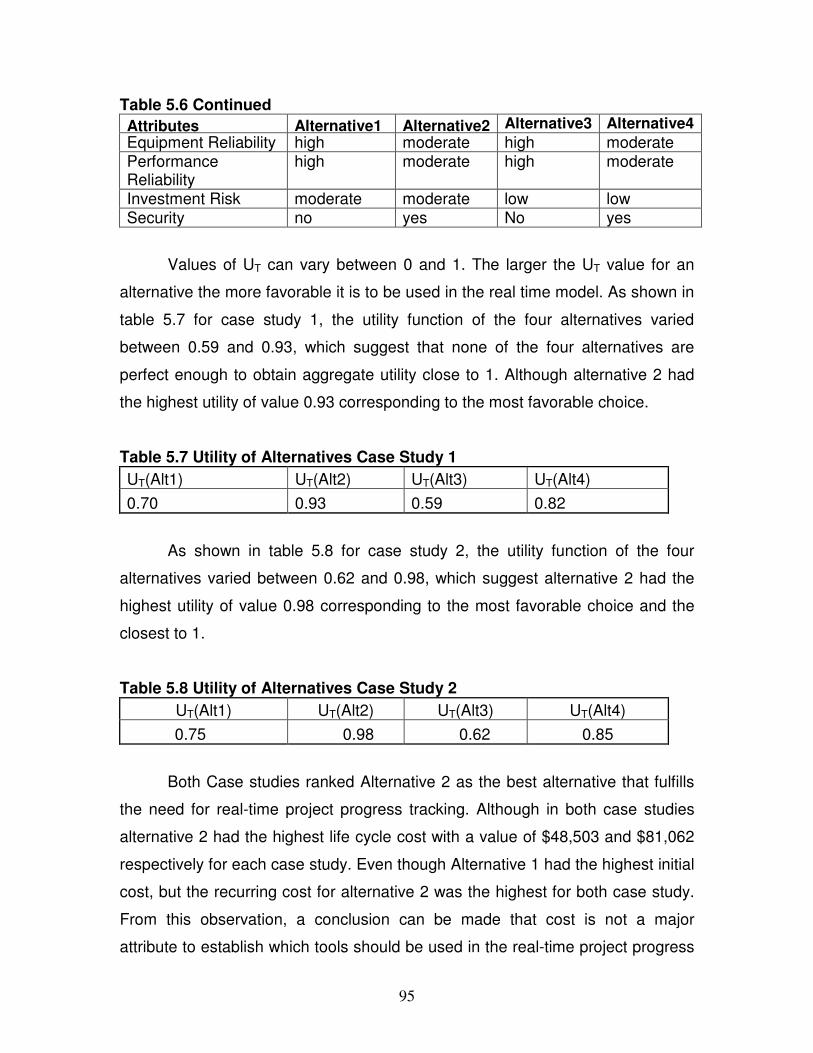
95
Table 5.6 Continued
Attributes Alternative1 Alternative2 Alternative3 Alternative4
Equipment Reliability high moderate high moderate Performance Reliability
high moderate high moderate
Investment Risk moderate moderate low low Security no yes No yes
Values of UT can vary between 0 and 1. The larger the UT value for an
alternative the more favorable it is to be used in the real time model. As shown in
table 5.7 for case study 1, the utility function of the four alternatives varied
between 0.59 and 0.93, which suggest that none of the four alternatives are
perfect enough to obtain aggregate utility close to 1. Although alternative 2 had
the highest utility of value 0.93 corresponding to the most favorable choice.
Table 5.7 Utility of Alternatives Case Study 1
UT(Alt1) UT(Alt2) UT(Alt3) UT(Alt4)
0.70 0.93 0.59 0.82
As shown in table 5.8 for case study 2, the utility function of the four
alternatives varied between 0.62 and 0.98, which suggest alternative 2 had the
highest utility of value 0.98 corresponding to the most favorable choice and the
closest to 1.
Table 5.8 Utility of Alternatives Case Study 2
UT(Alt1) UT(Alt2) UT(Alt3) UT(Alt4)
0.75 0.98 0.62 0.85
Both Case studies ranked Alternative 2 as the best alternative that fulfills
the need for real-time project progress tracking. Although in both case studies
alternative 2 had the highest life cycle cost with a value of $48,503 and $81,062
respectively for each case study. Even though Alternative 1 had the highest initial
cost, but the recurring cost for alternative 2 was the highest for both case study.
From this observation, a conclusion can be made that cost is not a major
attribute to establish which tools should be used in the real-time project progress
96
tracking model. Cost was embedded inside the assessment model as two
attributes: initial investment and operating cost. These two attributes are
represented as percentages of total cost of the project. So a sensitivity analysis
has to be done to determine the range of projects for which the cost will be a
major factor in taking decisions.
Another observation from the assessing model is noted. Evaluator gave
big importance for risk criteria, so it is good to know how this criteria influence our
choice. So another sensitivity analysis is conducted to see results change by
applying different risk scenarios.
Last but not least, an observation is made that both technical and
economical criteria have a complementary relationship. That mean the more the
requirements is needed, the more cost is associated with it. In this case the
attribute cost will get less value, but the technical merit will get greater utility
value and vice versa.
5.4 Sensitivity Analysis
The sensitivity analysis involved some additional calculation to examine
the effect of changing the model parameters on the final conclusion. The
sensitivity analysis in this research involves three different sensitivity analysis
tests. These tests are performed to check the assessment model response to
variation of preference weights in the pairwise comparison of criteria. The
following sections explain the effect of these factors in more detail.
5.4.1 Effect of Changing Cost
In the first test, the total cost is tested by changing the values of
alternative measures to three different values: 2%, 1%, and 0.5% corresponding
to a utility value: 0, 0.66, and 1 respectively as shown in figure 5.6. The other
attribute measures were kept to their original values.
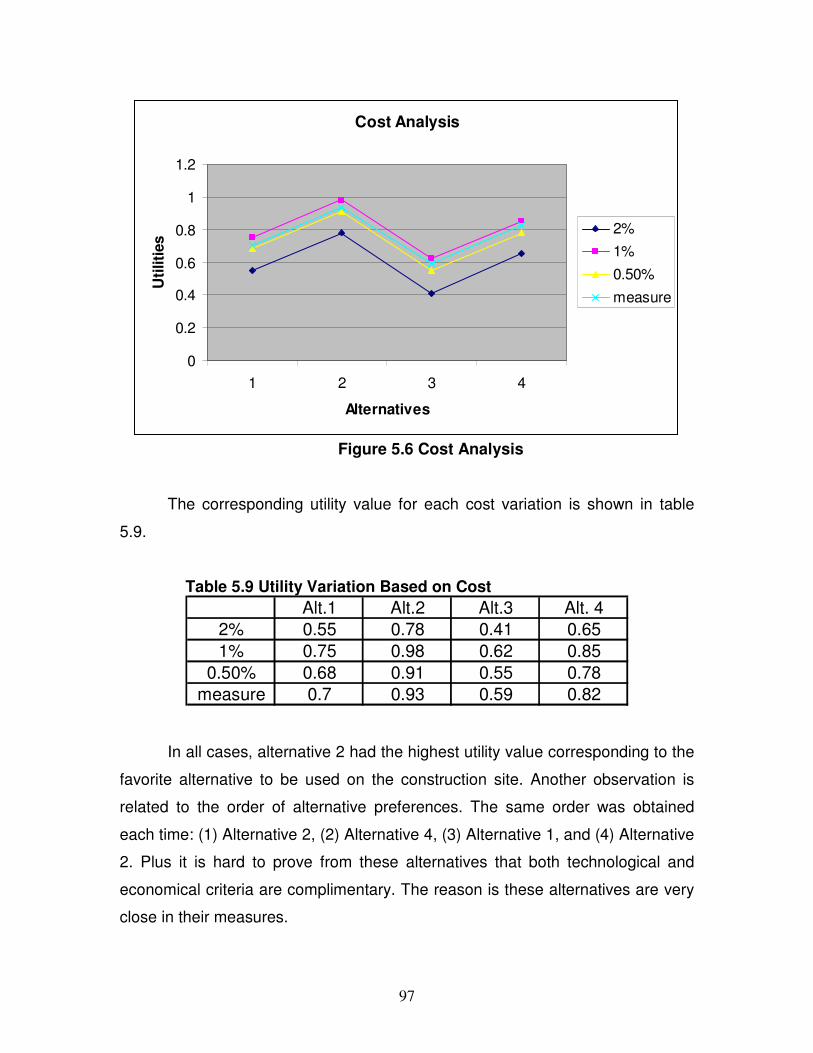
97
Cost Analysis
0
0.2
0.4
0.6
0.8
1
1.2
1 2 3 4
Alternatives
Uti
liti
es
2%
1%
0.50%
measure
Figure 5.6 Cost Analysis
The corresponding utility value for each cost variation is shown in table
5.9.
Table 5.9 Utility Variation Based on Cost
Alt.1 Alt.2 Alt.3 Alt. 42% 0.55 0.78 0.41 0.65
1% 0.75 0.98 0.62 0.85
0.50% 0.68 0.91 0.55 0.78measure 0.7 0.93 0.59 0.82
In all cases, alternative 2 had the highest utility value corresponding to the
favorite alternative to be used on the construction site. Another observation is
related to the order of alternative preferences. The same order was obtained
each time: (1) Alternative 2, (2) Alternative 4, (3) Alternative 1, and (4) Alternative
2. Plus it is hard to prove from these alternatives that both technological and
economical criteria are complimentary. The reason is these alternatives are very
close in their measures.

98
5.4.2 Effect of Changing Risk Weight
Evaluator gave risk merit the highest weight with a value of 0.63. In our
assessment model, risk criteria included four attributes: equipment reliability,
performance reliability, investment risk, and security. To measure to which extent
risk affects the user preferences output, three different weights were used: 0.25,
0.50, and 0.75 maintaining the other weight the same. The values of the utilities
resulting are shown in table 5.10 and in figure 5.7.
Table 5.10 Utility Variation Based on Risk Weight Changes
Alt.1 Alt.2 Alt.3 Alt.4
0.25 0.489 0.58 0.49 0.59
0.5 0.607 0.8 0.53 0.73
0.63 0.7 0.93 0.59 0.82
0.7 0.7 0.97 0.57 0.85
Risk Analysis
0
0.2
0.4
0.6
0.8
1
1.2
1 2 3 4
Alternatives
Uti
liti
es
0.25
0.5
0.63
0.7
Figure 5.7 Risk Analysis
From the risk analysis table, it is safe to conclude that the values of
weights less than 0.63 led to a change in alternatives ranking. In this case,
Alternative 4 is the favored one. The order of preferences is: (1) Alternative 4, (2)
Alternative 2, (3) Alternative 1, and (4) Alternative 3.

99
Risk merit is an important criterion in our multi-attribute model, and it affects the
user preferences when changed.

100
CHAPTER 6
MODEL APPLICATION IN STEEL CONSTRUCTION CASE
STUDIES
Two construction steel sites were selected as an experimental case facility
to get the data for this research. Pre-engineered buildings require repetitive
operations and assembly of many structural elements. Current information and
communication technology can be incorporated in the operational process for
efficient assembly at the job site. The structural steel construction processes of
two projects were observed and modeled to represent an overview of the current
practices of existing steel operations, find out potential productivity problems and
sources of waste, and explore the potential possibilities for improving current
processes. The second part of this chapter is to model the improved steel
process and compare the productivity of both models by using simulation
software. This chapter includes also an assessment of the benefits of
implementing the proposed model.
6.1 Case Study
Two construction steel projects constitute our case studies. The
first project we had the opportunity to monitor the progress of the construction
from the beginning. The second project we got all required data from the project
manager.
6.1.1 Case Study 1: Turbocor Project
The first construction project is Turbocor project, a 65,000 sq. ft. home for
a Canadian-based air-conditioning compressor manufacturer located in
Innovation Park, Tallahassee, Florida. Construction began November 2005 and
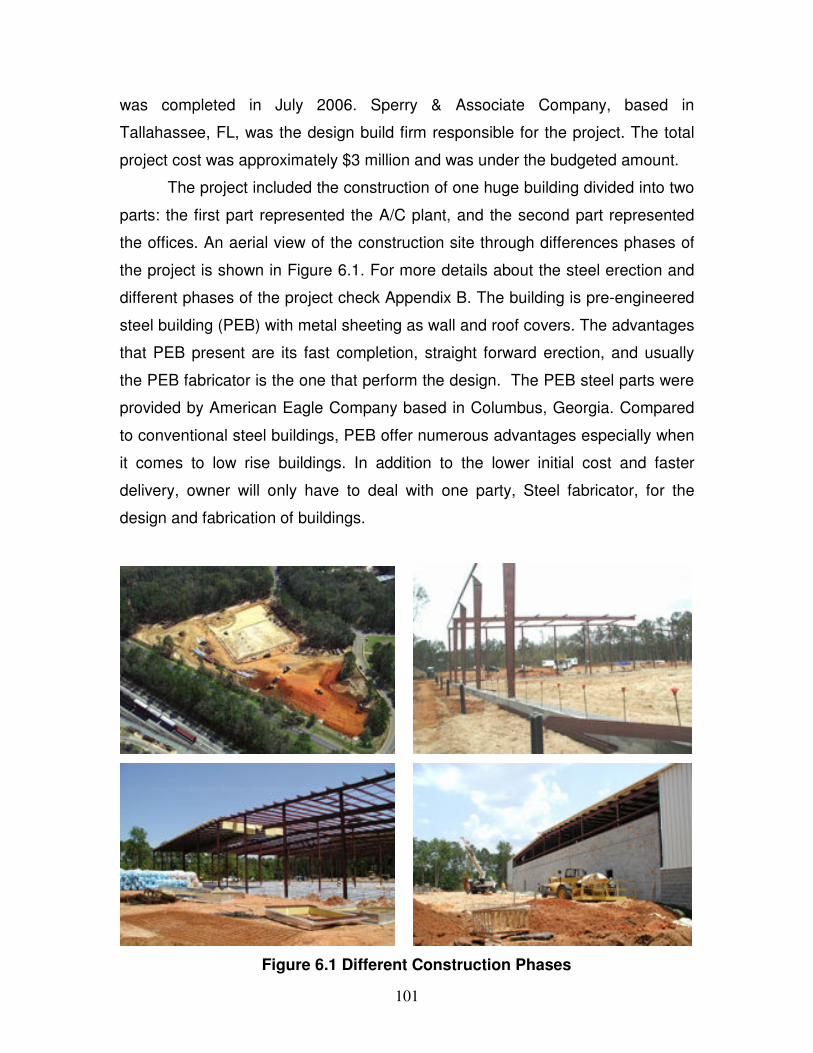
101
was completed in July 2006. Sperry & Associate Company, based in
Tallahassee, FL, was the design build firm responsible for the project. The total
project cost was approximately $3 million and was under the budgeted amount.
The project included the construction of one huge building divided into two
parts: the first part represented the A/C plant, and the second part represented
the offices. An aerial view of the construction site through differences phases of
the project is shown in Figure 6.1. For more details about the steel erection and
different phases of the project check Appendix B. The building is pre-engineered
steel building (PEB) with metal sheeting as wall and roof covers. The advantages
that PEB present are its fast completion, straight forward erection, and usually
the PEB fabricator is the one that perform the design. The PEB steel parts were
provided by American Eagle Company based in Columbus, Georgia. Compared
to conventional steel buildings, PEB offer numerous advantages especially when
it comes to low rise buildings. In addition to the lower initial cost and faster
delivery, owner will only have to deal with one party, Steel fabricator, for the
design and fabrication of buildings.
Figure 6.1 Different Construction Phases
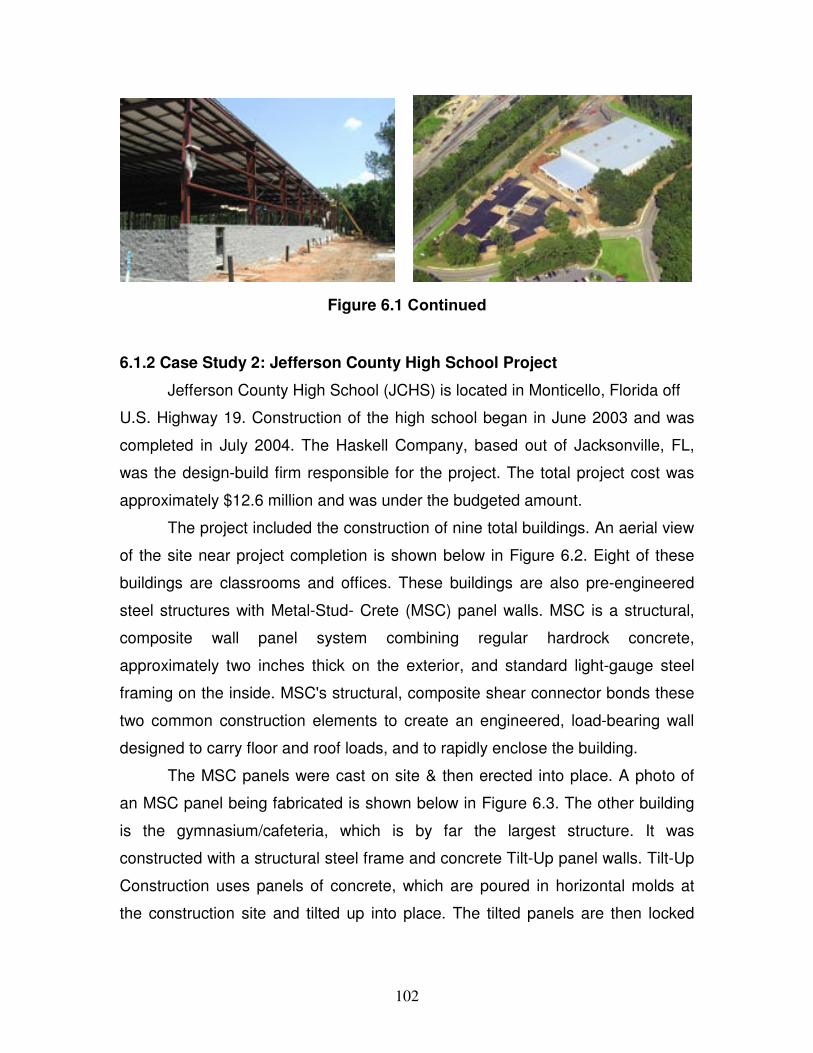
102
Figure 6.1 Continued
6.1.2 Case Study 2: Jefferson County High School Project
Jefferson County High School (JCHS) is located in Monticello, Florida off
U.S. Highway 19. Construction of the high school began in June 2003 and was
completed in July 2004. The Haskell Company, based out of Jacksonville, FL,
was the design-build firm responsible for the project. The total project cost was
approximately $12.6 million and was under the budgeted amount.
The project included the construction of nine total buildings. An aerial view
of the site near project completion is shown below in Figure 6.2. Eight of these
buildings are classrooms and offices. These buildings are also pre-engineered
steel structures with Metal-Stud- Crete (MSC) panel walls. MSC is a structural,
composite wall panel system combining regular hardrock concrete,
approximately two inches thick on the exterior, and standard light-gauge steel
framing on the inside. MSC's structural, composite shear connector bonds these
two common construction elements to create an engineered, load-bearing wall
designed to carry floor and roof loads, and to rapidly enclose the building.
The MSC panels were cast on site & then erected into place. A photo of
an MSC panel being fabricated is shown below in Figure 6.3. The other building
is the gymnasium/cafeteria, which is by far the largest structure. It was
constructed with a structural steel frame and concrete Tilt-Up panel walls. Tilt-Up
Construction uses panels of concrete, which are poured in horizontal molds at
the construction site and tilted up into place. The tilted panels are then locked
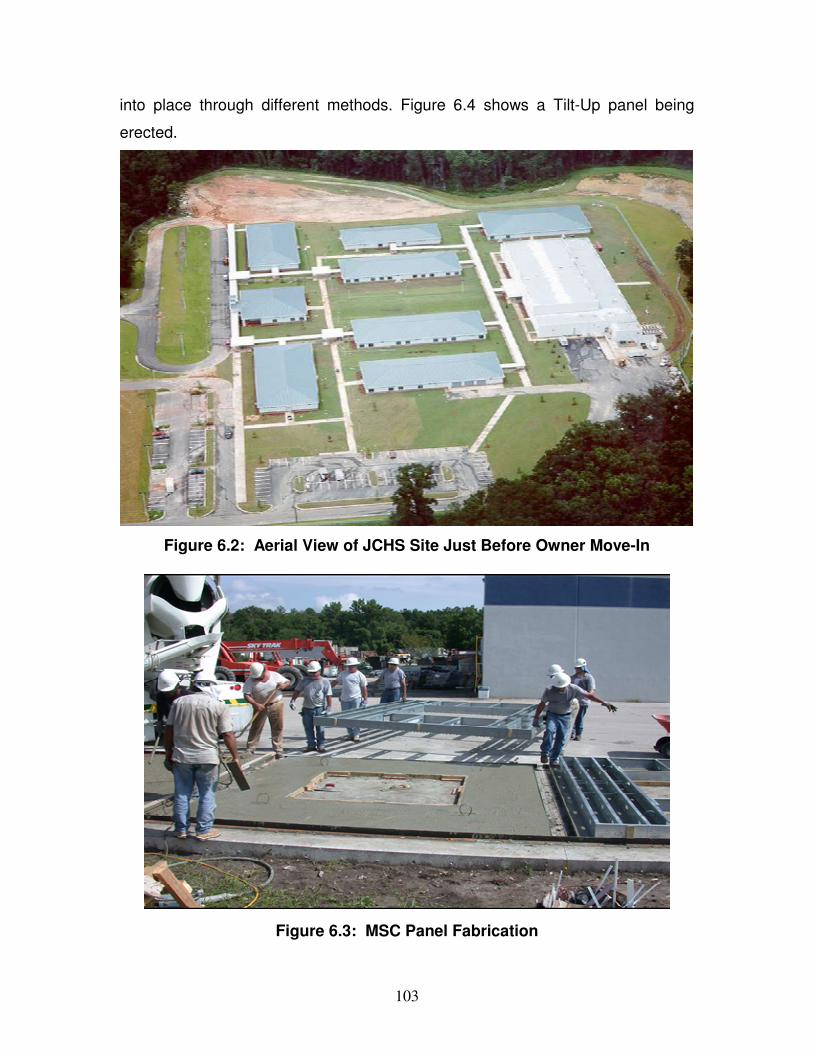
103
into place through different methods. Figure 6.4 shows a Tilt-Up panel being
erected.
Figure 6.2: Aerial View of JCHS Site Just Before Owner Move-In
Figure 6.3: MSC Panel Fabrication

104
Figure 6.4: Tilt-Up Panel Wall Erection
6.2 Steel Construction Process Overview
In this section, the whole steel construction processes of fabrication,
shipping, and erection are described. Key materials brought in during each phase
of the steel construction process are briefly described.
6.2.1 Preplanning and Fabrication
At an early stage, Sperry Associates, general contractor and American
Building Company, steel supplier worked together to discuss project site
constraints. They also determined the steel erection sequence, which represents
the order in which a zone or section of the structural steel frame is delivered and
erected to improve the efficiency of loading, delivery, unloading, and erection.
Based on the requirement of the general contractor master schedule, and the
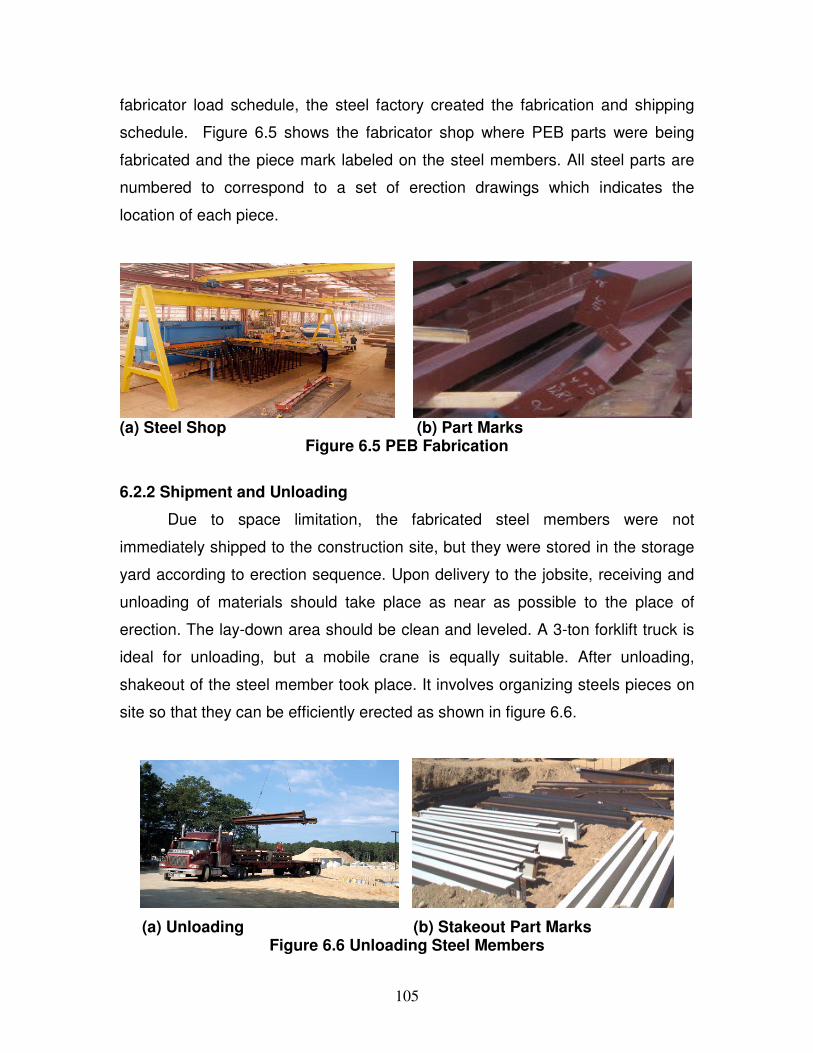
105
fabricator load schedule, the steel factory created the fabrication and shipping
schedule. Figure 6.5 shows the fabricator shop where PEB parts were being
fabricated and the piece mark labeled on the steel members. All steel parts are
numbered to correspond to a set of erection drawings which indicates the
location of each piece.
(a) Steel Shop (b) Part Marks
Figure 6.5 PEB Fabrication
6.2.2 Shipment and Unloading
Due to space limitation, the fabricated steel members were not
immediately shipped to the construction site, but they were stored in the storage
yard according to erection sequence. Upon delivery to the jobsite, receiving and
unloading of materials should take place as near as possible to the place of
erection. The lay-down area should be clean and leveled. A 3-ton forklift truck is
ideal for unloading, but a mobile crane is equally suitable. After unloading,
shakeout of the steel member took place. It involves organizing steels pieces on
site so that they can be efficiently erected as shown in figure 6.6.
(a) Unloading (b) Stakeout Part Marks Figure 6.6 Unloading Steel Members
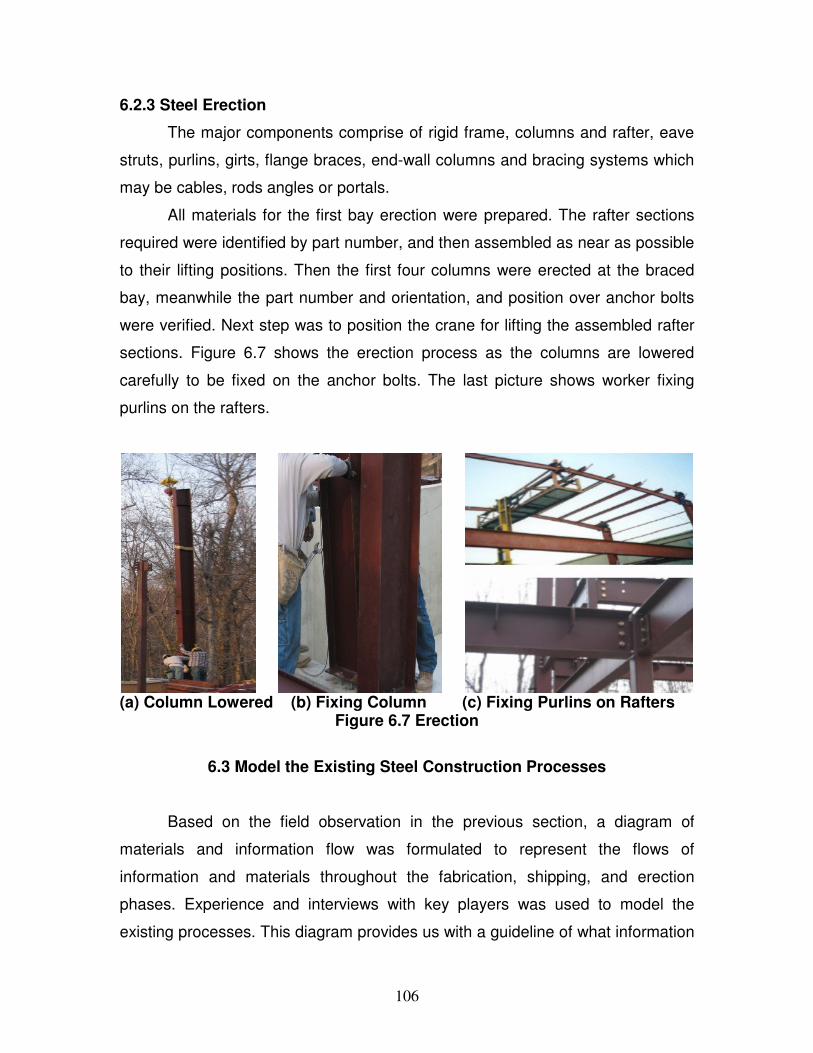
106
6.2.3 Steel Erection
The major components comprise of rigid frame, columns and rafter, eave
struts, purlins, girts, flange braces, end-wall columns and bracing systems which
may be cables, rods angles or portals.
All materials for the first bay erection were prepared. The rafter sections
required were identified by part number, and then assembled as near as possible
to their lifting positions. Then the first four columns were erected at the braced
bay, meanwhile the part number and orientation, and position over anchor bolts
were verified. Next step was to position the crane for lifting the assembled rafter
sections. Figure 6.7 shows the erection process as the columns are lowered
carefully to be fixed on the anchor bolts. The last picture shows worker fixing
purlins on the rafters.
(a) Column Lowered (b) Fixing Column (c) Fixing Purlins on Rafters
Figure 6.7 Erection
6.3 Model the Existing Steel Construction Processes
Based on the field observation in the previous section, a diagram of
materials and information flow was formulated to represent the flows of
information and materials throughout the fabrication, shipping, and erection
phases. Experience and interviews with key players was used to model the
existing processes. This diagram provides us with a guideline of what information
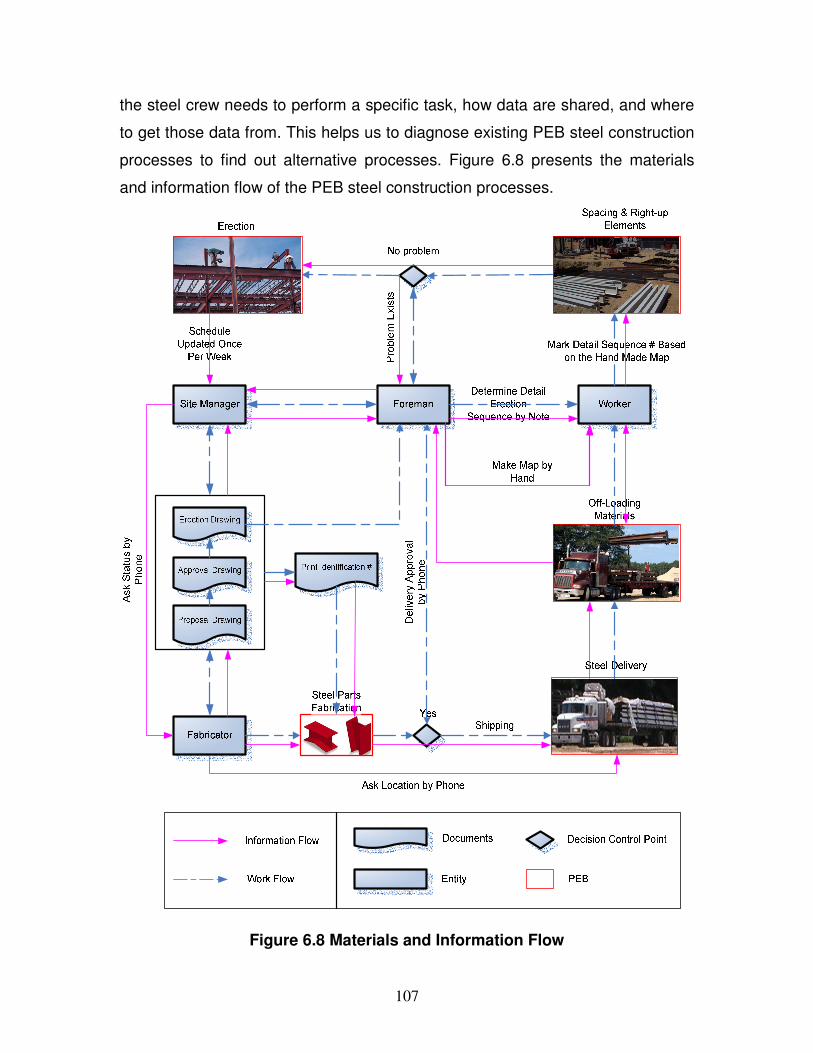
107
the steel crew needs to perform a specific task, how data are shared, and where
to get those data from. This helps us to diagnose existing PEB steel construction
processes to find out alternative processes. Figure 6.8 presents the materials
and information flow of the PEB steel construction processes.
Figure 6.8 Materials and Information Flow
108
As seen in the diagram, information and materials are passed from one
party to another via conventional approach. Key data sources within the defined
system are: fabricator, worker, foreman, and site manager. The next two sections
will define the productivity of the current practices and need for improvement.
6.4 Productivity Measurement
Spending time on the construction and observing tasks and movements of
the steel crew allowed us to collect productivity ratings data for PEB steel
operation. It is not possible to observe and analyze all of the tasks. Therefore,
sample measurement was taken for different processes and it was then
incorporated into a simulation model to measure work productivity.
Oglesby proposed three classifications for productivity ratings. The
classifications are: effective, contributory, and ineffective (Oglesby et al., 1989).
The percentages of crew time in all categories of the shakeout, unloading and
erection operations are summarized in table 6.1. The percentage rate is
calculated by dividing the observed number in each category by the total
observation.
It is noted that only 32% of total crew time was spent on the effective work
for the shakeout, unloading and erection operations while the contributory work
took 33% of crew time. The ineffective work accounts for 35% of crew time on
the average. Average time spent walking empty-handed, idle, non-work related
communication, searching for materials, and break time are respectively 5%,
10%, 9%, 5%, and 4%. These kinds of activities must be the areas to be
addressed for productivity improvement.
On the other hand, continuous time study involves the measurement of time
required to address the specific job under present conditions. Among all process,
we were interested into 4 of them: shipping, unloading, shakeout, and erection
operation. Those constitute one cycle in our study. It was proposed that
continuous time study be made of an average of three cycles for unloading,

109
shakeout and erection. The next section presents the implementation of our
study into a simulation model to study the cycle productivity.
Table 6.1 Productivity Ratings Percent of Total Number (Shakeout, Unloading & Erection)
Categories Items
Foreman Erector1 Erector2 Worker1 Worker2 Average
Effective Work
10% 36% 29% 30% 33% 32%
Communication 33% 14% 10% 15% 15% 17%
Searching for materials and tools
2% 20% 15% 9% 9% 11%
Read document
20% 0% 0% 0% 0% 4%
Contributory work
Subtotal 55% 34% 25% 24% 24% 33%
Walking empty-handed
6% 52% 7% 3% 3% 5%
Idle 4% 7% 10% 15% 17% 10%
Correcting error
0% 0% 0% 0% 0% 0%
Non work related communication
20% 4% 5% 9% 3% 9%
Searching for materials
2% 8% 6% 6% 8% 5%
Break time 2% 6% 1% 3% 3% 4%
Non identifiable 1% 0% 25% 10% 9% 9%
Ineffective work
Subtotal 35% 30% 17% 46% 43% 35%
Total 100% 100% 100% 100% 100% 100%
6.4.1 PEB Simulation Model
Micro Cyclone is used in this study in order to study the construction steel
processes. The elements of Micro Cyclone, originally developed by Halpin, are
used to model and simulate PEB steel operations.
The model formulated took into consideration the delivery and the
availability of the steel parts on the construction site. In addition to that, in case
110
there was a problem with erection or with the steel parts, there is a
communication back and forth between the construction site and the steel
fabricator. Based on a lot of trial and error and trying different simulation model,
the author decided to separate both the shipping process from the erection
simulation process. The reason behind it is shipping process takes more time
then erection and when placing both processes into one simulation model the
results looked inaccurate.
Figure 6.9 and 6.10 presents PEB steel simulation model for both shipping
and erection. The shipping model is formed of 10 entities covering one cycle of
the process. The cycle starts from loading the materials at the fabricator shop till
offloading material on construction site. The erection model is formed of 30
entities covering one cycle of the process. The cycle starts from steel parts
available on the constructions site till erection of one bay of the steel structure.
Once the graphical model was established the next step is to transform it
into an input language that Micro Cyclone understands. Appendix D includes the
input files for both simulation files. Durations and Resources were also
incorporated in the input file. The duration units used in the input file is hour.
Some entities that represent inefficiency in the processes were included in the
model. Once the user gets familiar with Cyclone program, transition from
graphical input to computer language the simulation software understand
become easy step. Web Cyclone is case sensitive and all typing should be done
in upper case letters.
As you notice in the model, some resources were idle when others were in
use. Next section discusses those entities, especially that they represent
opportunity for improvement our processes and increase efficiency and minimize
waste. The simulation output will be discussed, once the To Be information flow
diagram is established and its simulation model is performed.
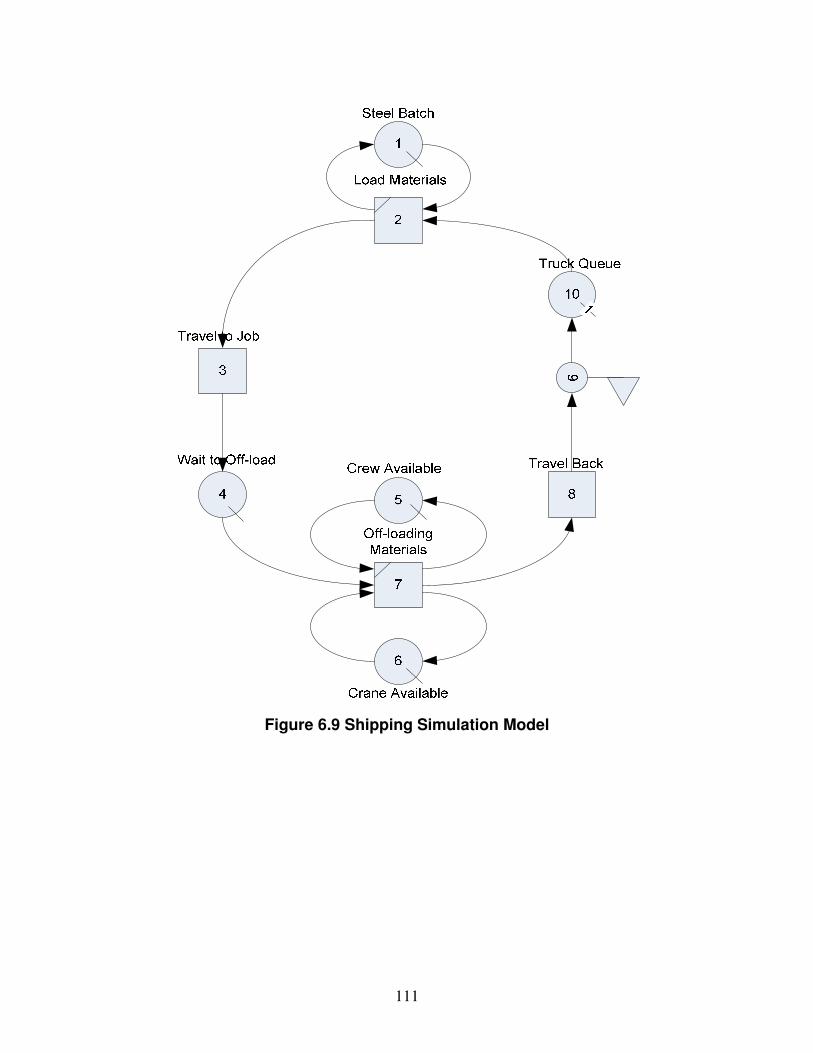
111
Figure 6.9 Shipping Simulation Model
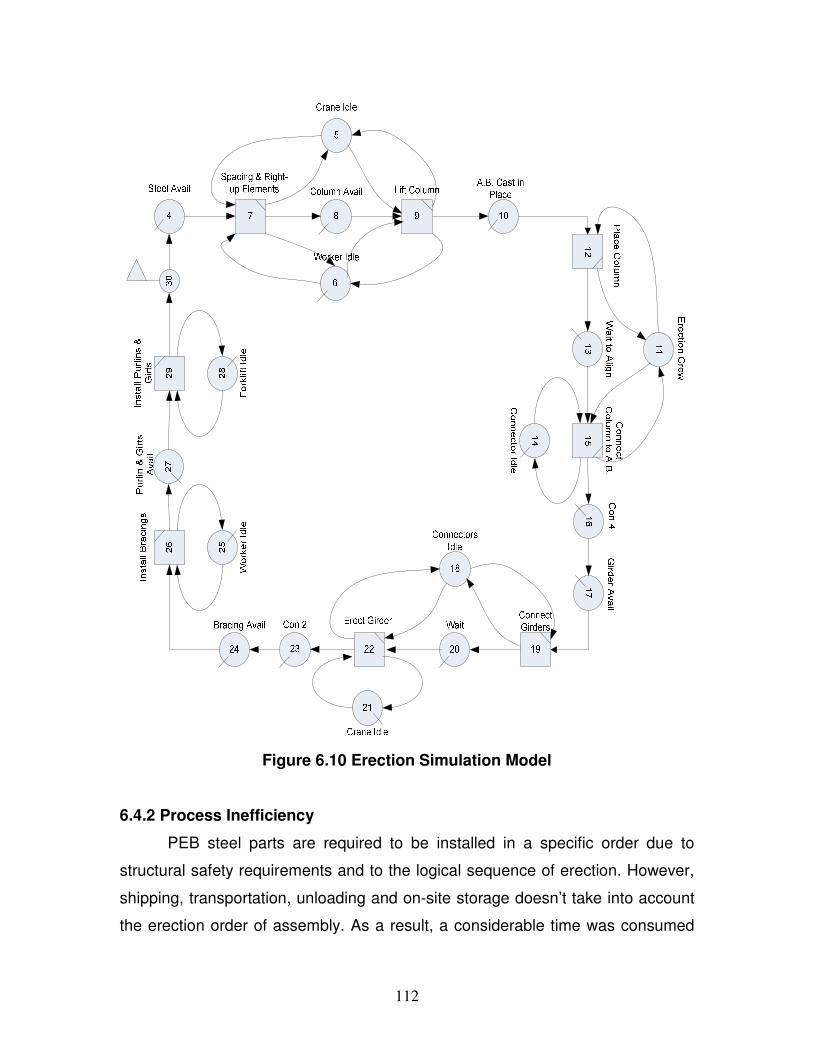
112
Figure 6.10 Erection Simulation Model
6.4.2 Process Inefficiency
PEB steel parts are required to be installed in a specific order due to
structural safety requirements and to the logical sequence of erection. However,
shipping, transportation, unloading and on-site storage doesn’t take into account
the erection order of assembly. As a result, a considerable time was consumed
113
locating, sorting, and identifying steel components. Instead of setting the steel
directly off the delivery trucks, all the steel was off loaded and shakeout was
done as the steel was delivered. This practice resulted in double handling of
materials in the erection operations.
Once fabricated, the fabricator labeled each steel member with a unique
piece mark and sequence number to identify it directly on the erection drawings
and its proper place. However, to make it easy to find materials for erection, the
workers marked each piece one more time with white chalk based on the
erection hand map they made. This process leads of course to considerable
unproductive duplication.
Another concern is raised when workers try to locate the exact material to
be erected. Foreman determines the exact order in which each steel member
has to be erected. Workers identify components with paper-based information.
As a result, a significant portion of time is spent in the lay-down areas searching
by hand to identify components.
During our interview with the people on the construction site, it was found
that material and information flow can be lost, disconnected and distorted while
flowing from information sources to end user. Good examples were given to the
author when he was on the construction site. Workers didn’t know when next
shipping date is scheduled. Connectors had no full idea of where each steel
element was positioned. Foreman had no idea of the status of a shop drawing
approval after implementing some changes and which sequence of steel
elements was fabricated and stored at the factory and ready to be shipped.
It was also noticed that critical information from the field to the office had a
delay and lacked real time touch. According to the productivity ratings data
mentioned in table 6.1, foreman spent most of his time communicating with
workers, 33% of his time on work related communication and 20% for non-work
related communication. These percentages are higher than the average values,
17 % and 9% respectively.
Another two communication problems identified with the current process
are with the approval drawings and request for information. Actually usual delays
114
associated with the steel supply process are encountered during approval stage
of shop drawings. Many weeks are wasted due to movement of hard copy
drawings from one party to another.
The other major delay in case problem aroused on the jobsite and can’t be
resolved at the field office, so the site engineer had to submit a request for
information (RFI) to the technical engineering department. RFIs were sent via fax
with a sketch and a reference in the drawings and in case photos were attached
they had to be mailed by federal express. This would delay RFI turnaround times.
6.5 Steel Construction Process Updated
A significant number of problems were identified in the previous section
resulting from inaccurate data transfers as well from delays and interruption in
information flow, thus leading to a wasteful operation and inefficiencies in some
processes. So a new approach needed to be developed to not only ensure
control of information in a timely manner, but also increase level of
communication between multiple processes units for structural steel construction.
The main purpose of this section is to present the improved processes on
the construction site after implementing the proposed model, and at the same
time to present the benefit of implementation by comparing the outputs of the
simulation models.
6.5.1 Development of a data flow diagram
In order to identify the benefits resulting from implementing the proposed
model for structural steel construction processes, “To Be” data flows diagrams
were determined based on the field observation. In the data flow diagram as
shown in figure 6.11, key issues that were addressed include real time piece
tracking, retrieval of information related to the steel parts, like its location on
erection drawings, position and its orientation, and updating the construction
schedule.
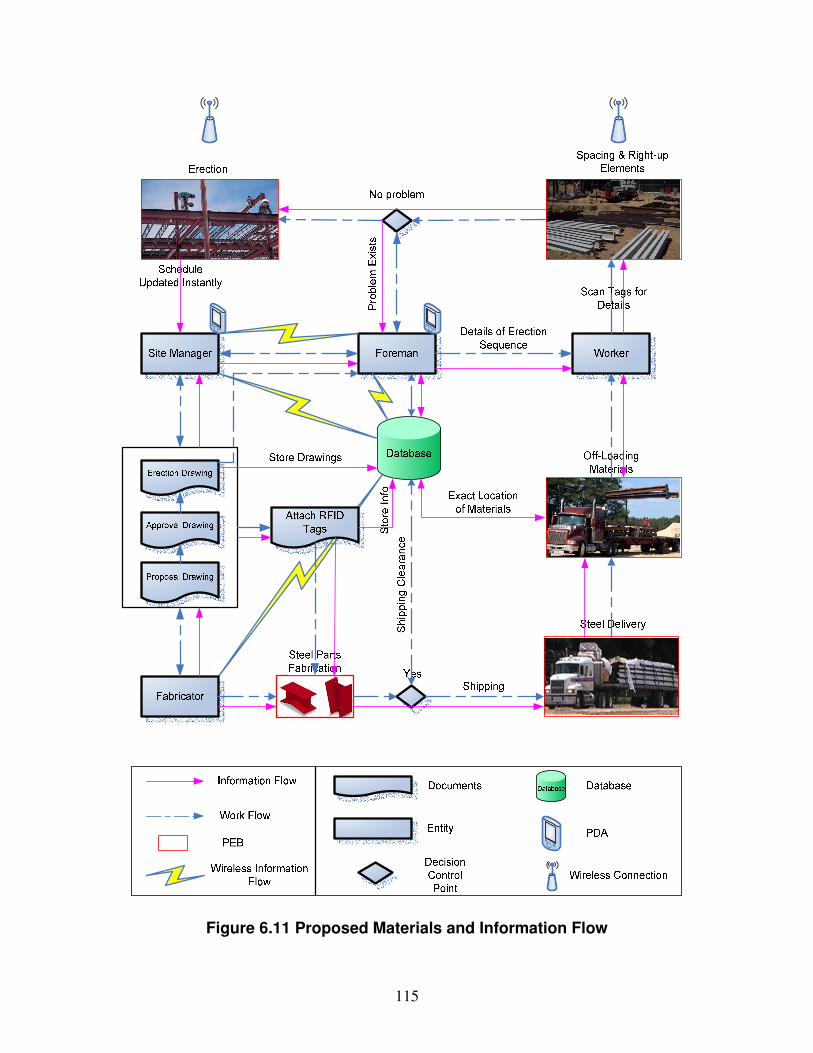
115
Figure 6.11 Proposed Materials and Information Flow
116
When the steel component’s identity can be read directly through a
portable RFID reader, the erection sequence and position information of each
piece in their final location are automatically extracted from the common
database through wireless networks in real time. This situation makes
information stored in the database accessed at any time by people on the
construction site, and updates make construction activities from the jobsite
available to all process units who need the information in real time.
6.5.2 Proposed Process
Construction materials may account for 50-60% of the total cost of a
construction project of the elements that comprise the constructed facility. In
industrial and heavy construction, mostly prefabricated objects, such as structural
steel, pre engineered building and precast concrete elements, are used and
installed on site. If the right material could be easily and precisely tracked, found,
and distributed to the right location at the right time, tremendous benefits would
ensue. Reducing unsuccessful searches for materials would reduce wasted
supervisory time, crew idle time, and disruptions to short interval planning, and
hence help to increase labor productivity, reduce materials stock piles, and
reduce materials management manpower (Bell & Stuckhart 1986).
The case studies presented in this research are mainly construction sites
with a traditional construction materials management processes involving
multiple manual checking, recording and tracking processes as unique tagged
materials are transferred between parties along a supply chain approach. In the
example of pre-engineered buildings, as stated before we were interested in
three main processes: fabrication, shipping and erection on the construction site.
First, fabricator fabricates the steel parts and then they are painted at
paint shop. Once painting is finished, materials are tagged with RFID tags and
stored in the fabricator store yard till it is time to ship them to the project site. The
tag includes holders with two slots that accept a tie-wrap plastic fastener to
attach the tags to the steel parts. Tags can be attached to the steel parts using
plastic ties and double sided tapes. Finally, the contractor on the job site receives
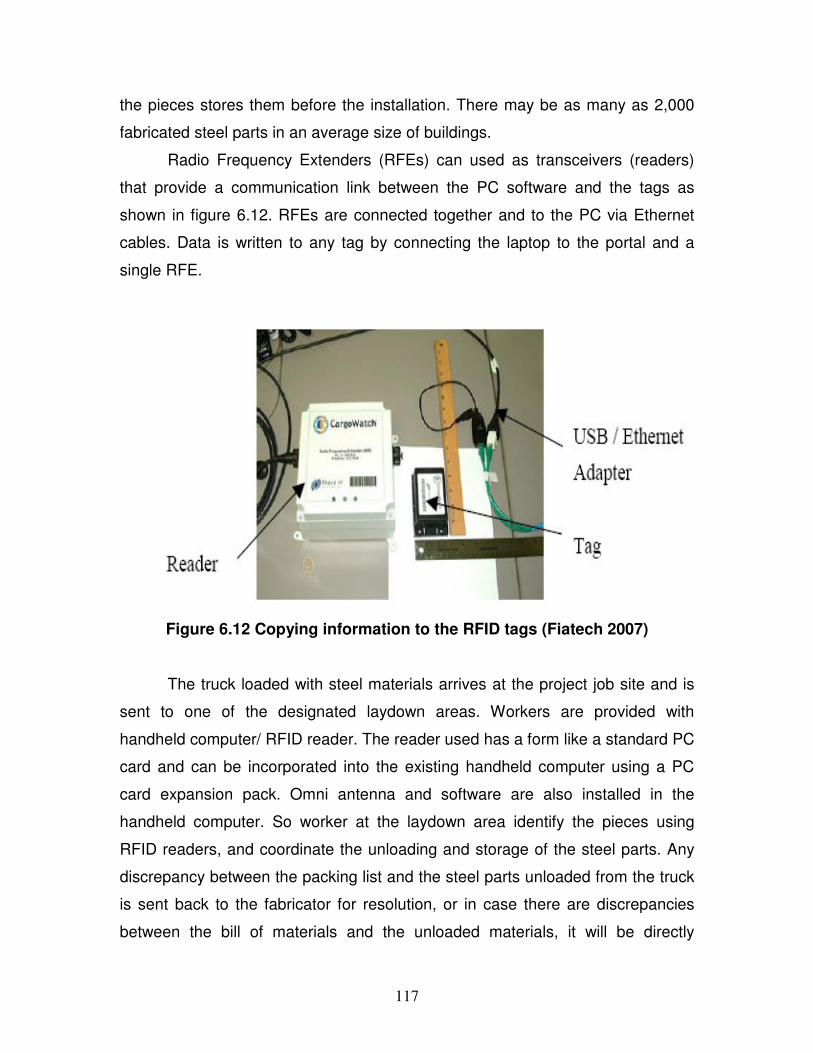
117
the pieces stores them before the installation. There may be as many as 2,000
fabricated steel parts in an average size of buildings.
Radio Frequency Extenders (RFEs) can used as transceivers (readers)
that provide a communication link between the PC software and the tags as
shown in figure 6.12. RFEs are connected together and to the PC via Ethernet
cables. Data is written to any tag by connecting the laptop to the portal and a
single RFE.
Figure 6.12 Copying information to the RFID tags (Fiatech 2007)
The truck loaded with steel materials arrives at the project job site and is
sent to one of the designated laydown areas. Workers are provided with
handheld computer/ RFID reader. The reader used has a form like a standard PC
card and can be incorporated into the existing handheld computer using a PC
card expansion pack. Omni antenna and software are also installed in the
handheld computer. So worker at the laydown area identify the pieces using
RFID readers, and coordinate the unloading and storage of the steel parts. Any
discrepancy between the packing list and the steel parts unloaded from the truck
is sent back to the fabricator for resolution, or in case there are discrepancies
between the bill of materials and the unloaded materials, it will be directly
118
captured and fabricator will be contacted. Savings are captured when the
simulation model for the improved process is performed, especially with the
improvement in productivity.
6.5.3 Simulation Model
Figure 6.13 and 6.14 presents PEB steel simulation model for both to be
shipping and to be erection. The shipping model is formed of 11 entities covering
one cycle of the process. The cycle starts from loading the materials at the
fabricator shop till offloading material on construction site and it included the
tagging of the steel parts with RFID tags. The erection model is formed of 30
entities covering once cycle of the process. The cycle starts from steel parts
available on the constructions site till erection of one bay of the steel structure.
This process is improved by eliminating some of the wasted time to locate the
right material and to go back to the site office to get erection drawings and get
details of connections.
Once the graphical model was established the next step is to transform it
into an input language that Micro Cyclone understands. Appendix D includes the
input files for both simulation files. Durations and Resources were also
incorporated in the input file. In this simulation model, after implementing the
proposed model and improving the different processes by using wireless
technologies, the duration assigned for each activity changed accordingly, time
wasted occurred in the previous model, were eliminated, some activities were
deleted which make the cycle faster, and most importantly productivity increased
as will be shown in the output of both simulation model. The output of the
simulation models are attached in Appendix D. These outputs contain different
information about process productivity and resources status through the different
phase of the simulation.

119
Figure 6.13 Proposed Shipping Simulation Model
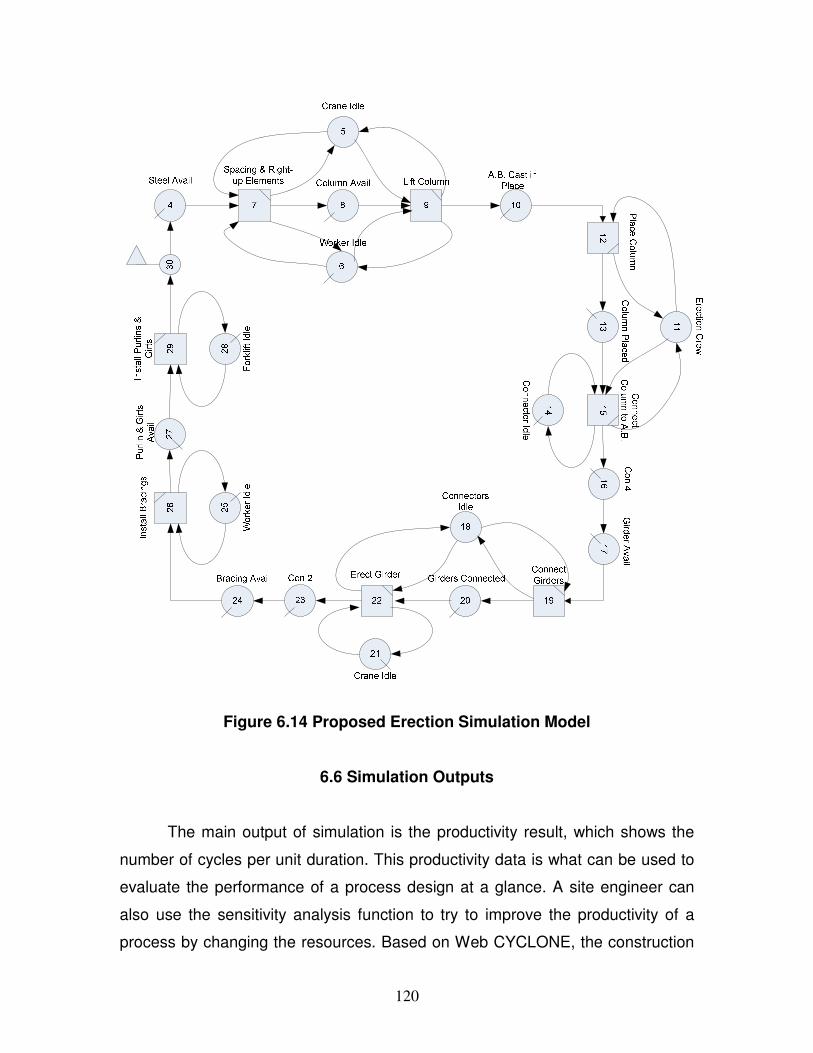
120
Figure 6.14 Proposed Erection Simulation Model
6.6 Simulation Outputs
The main output of simulation is the productivity result, which shows the
number of cycles per unit duration. This productivity data is what can be used to
evaluate the performance of a process design at a glance. A site engineer can
also use the sensitivity analysis function to try to improve the productivity of a
process by changing the resources. Based on Web CYCLONE, the construction

121
simulation result of a repetitive cycle in both projects was presented as the
productivity. For computing productivity of both shipping and erection process,
‘Hours’ was used as the time unit as shown in table 6.2
The cycle number in Table 6.2 represents the number of time both
systems cycle. For instance, one cycle of shipping steel materials (Refer to
Figure 6.9) includes Queue node (1: Steel batch) to Queue (10). In case of
erection process (Refer to Figure 6.10), Queue node (4: Steel Available) to
accumulator (30) is included in the one cycle of the system. It is usually defined
by user. Therefore, the productivity of shipping can be calculated through dividing
‘Cycle number’ by ‘Total simulation time (i.e., 30/107.3 = 0.279) and 300 / 2155.9
= 0.139 for erection). The same is done for the To Be processes.
Table 6.2 Simulated Productivity Results Total
Simulation Time (unit)
Cycle No.
Productivity (per time unit)
Production/Cycle Productivity
Shipping 107.3 30 0.279 1 truck 0.279 truck per hour
Proposed Shipping
67.1 30 0.447 1 truck 0.447 truck per hour
Erection 2155.9 300 0.139 1 bay 0.139 bay per hour
Proposed Erection
1699.3 300 0.176 1 bay 0.176 bay per hour
Based on the simulated productivity table, it takes 3.58 hours in order for
one truck to reach the construction site using the conventional process. On the
other hand it will take 2.24 hours in order for one truck to reach the construction
site. At the same time it takes 7.19 hours to erect one pre engineering steel bay.
But using the proposed process it will take 5.68 hours to erect one bay.
As summary, there will be saving in money at least one hour in the
shipping process and 1.5 hours in the erection process. Next section will quantify
those benefits and turn it into dollars.

122
6.7 Proposed Model Benefits
The objective of this section is to analyze the values of the integrated
wireless technologies model functions. Because the multifaceted benefits of the
various applications, different scientific methods will be used to measure the
value that the technology integrated model will incorporate into the construction
process. The first step is to establish the cost of the technology that was used in
this research and this can be achieved by conducting a life cycle cost analysis
(LCC).
The study period for this LCC is taken for one year, because benefits are
calculated for one-year period. Discount rates and inflation rates were estimated
as average figures. Some numbers were based on the previous research done
by Mr. Singletary (2006). Initial cost inputs and calculations are illustrated in table
6.3 and table 6.4. All the direct initial costs involved with purchasing the
necessary equipment were determined during the equipment selection and
alternative identification steps. Estimates for training and maintenance costs
were determined from contacting products representatives. Salaries of people
involved in the construction project were determined by consulting U.S.
Department of Labor. The cost of computer hardware was obtained by contacting
Xplore Technologies representative.
A study conducted by Venture Development Corporation after checking
approximately 260 different companies using computing solutions, showed that
the increased cost associated with service, support, and downtime of commercial
grade computers outweighed the increased initial cost of purchasing rugged
computers. The average figures for downtime per year associated with rugged
computers was used in the LCC analysis to calculate downtime due to device
failure.
All costs have been discounted back to the beginning of the first month
using the adjusted monthly discount rate. It has been assumed that planning &
feasibility costs were incurred at the same time as the equipment purchases and
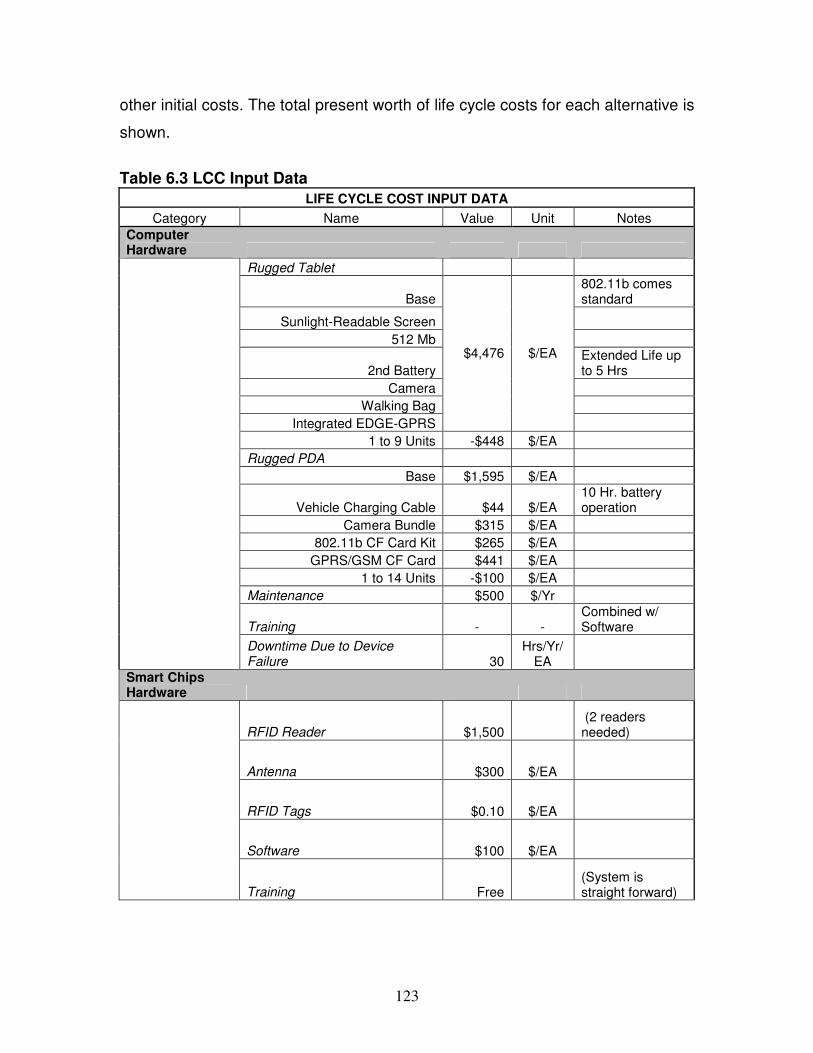
123
other initial costs. The total present worth of life cycle costs for each alternative is
shown.
Table 6.3 LCC Input Data
LIFE CYCLE COST INPUT DATA
Category Name Value Unit Notes
Computer Hardware
Rugged Tablet
Base 802.11b comes standard
Sunlight-Readable Screen
512 Mb
2nd Battery Extended Life up to 5 Hrs
Camera
Walking Bag
Integrated EDGE-GPRS
$4,476 $/EA
1 to 9 Units -$448 $/EA
Rugged PDA
Base $1,595 $/EA
Vehicle Charging Cable $44 $/EA 10 Hr. battery operation
Camera Bundle $315 $/EA
802.11b CF Card Kit $265 $/EA
GPRS/GSM CF Card $441 $/EA
1 to 14 Units -$100 $/EA
Maintenance $500 $/Yr
Training - - Combined w/ Software
Downtime Due to Device Failure 30
Hrs/Yr/ EA
Smart Chips Hardware
RFID Reader $1,500 (2 readers needed)
Antenna $300 $/EA
RFID Tags $0.10 $/EA
Software $100 $/EA
Training Free
(System is straight forward)
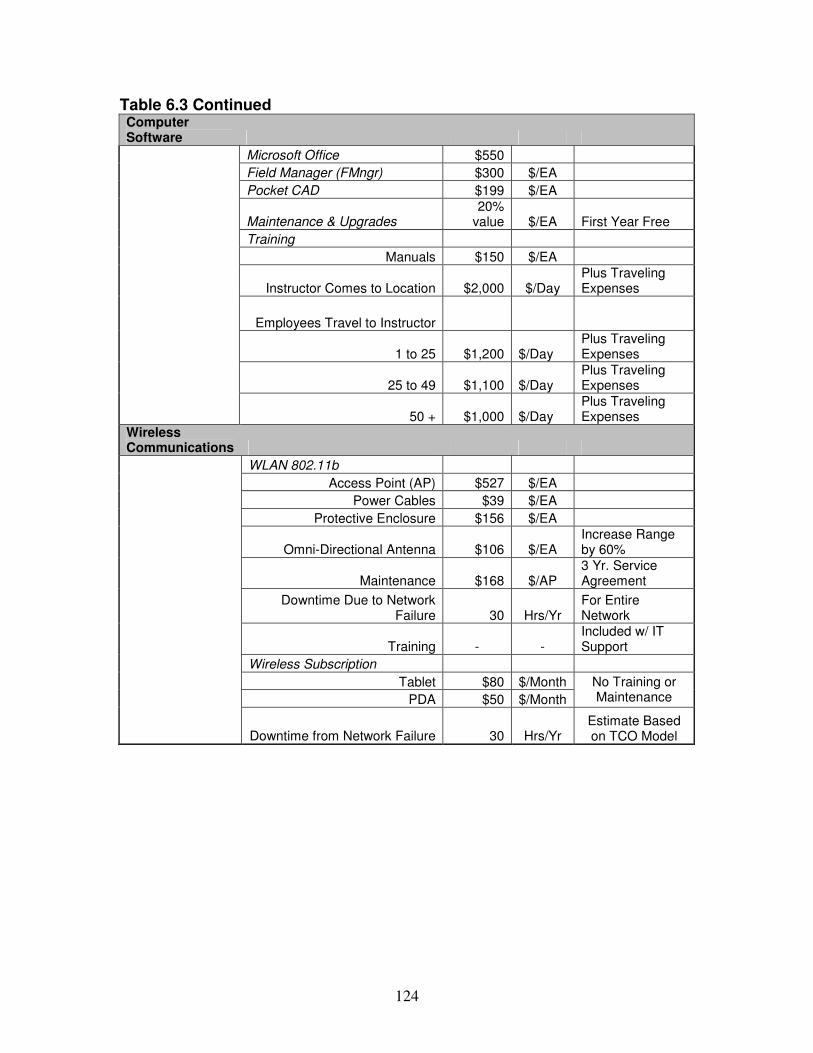
124
Table 6.3 Continued Computer Software
Microsoft Office $550
Field Manager (FMngr) $300 $/EA
Pocket CAD $199 $/EA
Maintenance & Upgrades 20%
value $/EA First Year Free
Training
Manuals $150 $/EA
Instructor Comes to Location $2,000 $/Day Plus Traveling Expenses
Employees Travel to Instructor
1 to 25 $1,200 $/Day Plus Traveling Expenses
25 to 49 $1,100 $/Day Plus Traveling Expenses
50 + $1,000 $/Day
Plus Traveling Expenses
Wireless Communications
WLAN 802.11b
Access Point (AP) $527 $/EA
Power Cables $39 $/EA
Protective Enclosure $156 $/EA
Omni-Directional Antenna $106 $/EA Increase Range by 60%
Maintenance $168 $/AP 3 Yr. Service Agreement
Downtime Due to Network Failure 30 Hrs/Yr
For Entire Network
Training - - Included w/ IT Support
Wireless Subscription
Tablet $80 $/Month
PDA $50 $/Month
No Training or Maintenance
Downtime from Network Failure 30 Hrs/Yr
Estimate Based on TCO Model
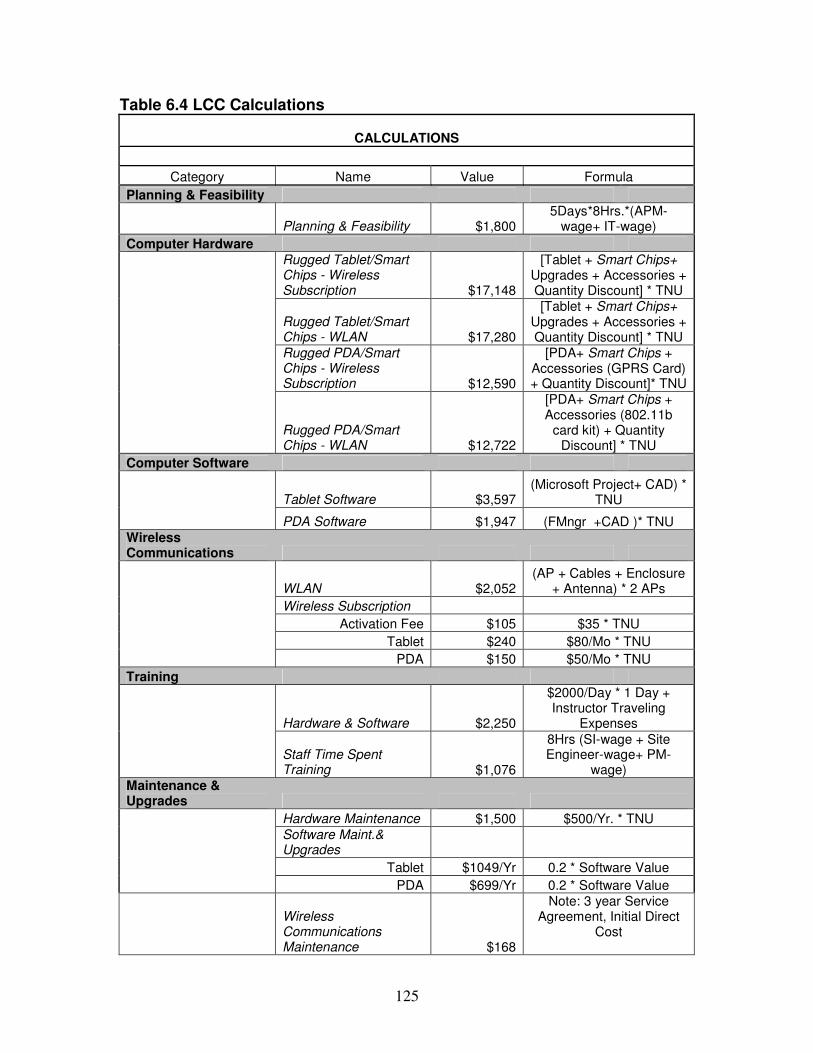
125
Table 6.4 LCC Calculations
CALCULATIONS
Category Name Value Formula
Planning & Feasibility
Planning & Feasibility $1,800 5Days*8Hrs.*(APM-
wage+ IT-wage)
Computer Hardware
Rugged Tablet/Smart Chips - Wireless Subscription $17,148
[Tablet + Smart Chips+ Upgrades + Accessories + Quantity Discount] * TNU
Rugged Tablet/Smart Chips - WLAN $17,280
[Tablet + Smart Chips+ Upgrades + Accessories + Quantity Discount] * TNU
Rugged PDA/Smart Chips - Wireless Subscription $12,590
[PDA+ Smart Chips + Accessories (GPRS Card) + Quantity Discount]* TNU
Rugged PDA/Smart Chips - WLAN $12,722
[PDA+ Smart Chips + Accessories (802.11b
card kit) + Quantity Discount] * TNU
Computer Software
Tablet Software $3,597 (Microsoft Project+ CAD) *
TNU
PDA Software $1,947 (FMngr +CAD )* TNU Wireless Communications
WLAN $2,052 (AP + Cables + Enclosure
+ Antenna) * 2 APs
Wireless Subscription
Activation Fee $105 $35 * TNU
Tablet $240 $80/Mo * TNU
PDA $150 $50/Mo * TNU
Training
Hardware & Software $2,250
$2000/Day * 1 Day + Instructor Traveling
Expenses
Staff Time Spent Training $1,076
8Hrs (SI-wage + Site Engineer-wage+ PM-
wage) Maintenance & Upgrades
Hardware Maintenance $1,500 $500/Yr. * TNU
Software Maint.& Upgrades
Tablet $1049/Yr 0.2 * Software Value
PDA $699/Yr 0.2 * Software Value
Wireless Communications Maintenance $168
Note: 3 year Service Agreement, Initial Direct
Cost
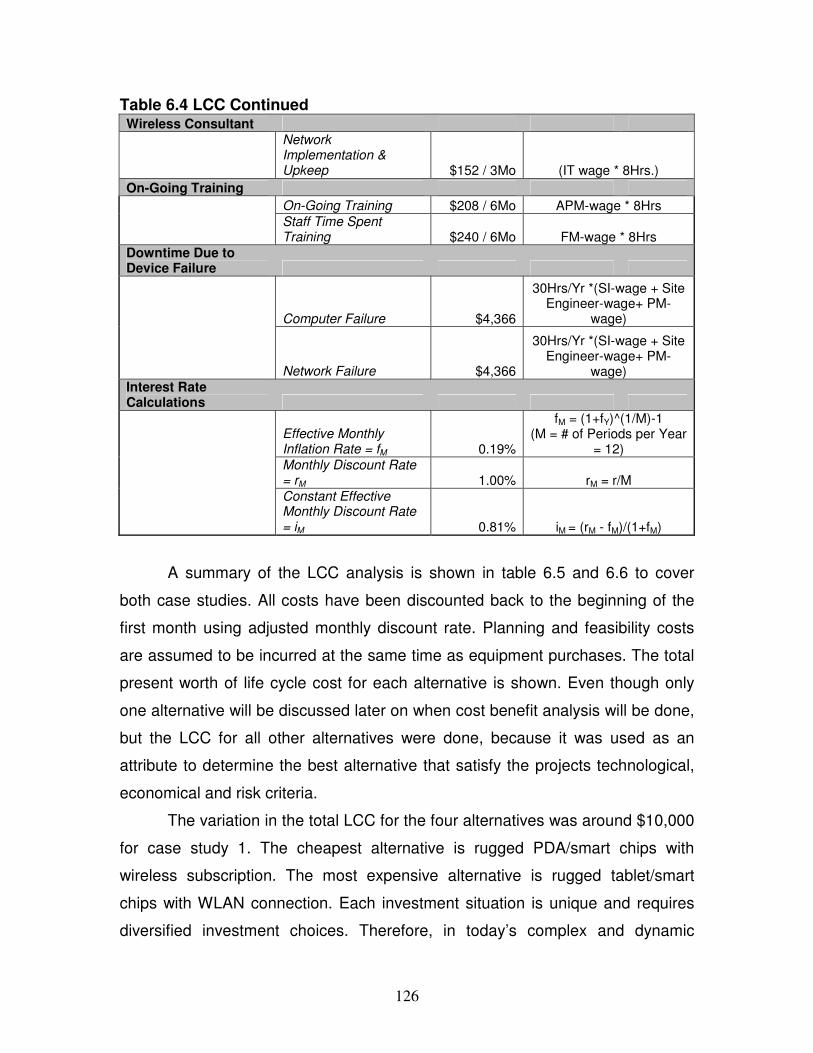
126
Table 6.4 LCC Continued Wireless Consultant
Network Implementation & Upkeep $152 / 3Mo (IT wage * 8Hrs.)
On-Going Training
On-Going Training $208 / 6Mo APM-wage * 8Hrs
Staff Time Spent Training $240 / 6Mo FM-wage * 8Hrs
Downtime Due to Device Failure
Computer Failure $4,366
30Hrs/Yr *(SI-wage + Site Engineer-wage+ PM-
wage)
Network Failure $4,366
30Hrs/Yr *(SI-wage + Site Engineer-wage+ PM-
wage) Interest Rate Calculations
Effective Monthly Inflation Rate = fM 0.19%
fM = (1+fY)^(1/M)-1 (M = # of Periods per Year
= 12)
Monthly Discount Rate = rM 1.00% rM = r/M
Constant Effective Monthly Discount Rate = iM 0.81% iM = (rM - fM)/(1+fM)
A summary of the LCC analysis is shown in table 6.5 and 6.6 to cover
both case studies. All costs have been discounted back to the beginning of the
first month using adjusted monthly discount rate. Planning and feasibility costs
are assumed to be incurred at the same time as equipment purchases. The total
present worth of life cycle cost for each alternative is shown. Even though only
one alternative will be discussed later on when cost benefit analysis will be done,
but the LCC for all other alternatives were done, because it was used as an
attribute to determine the best alternative that satisfy the projects technological,
economical and risk criteria.
The variation in the total LCC for the four alternatives was around $10,000
for case study 1. The cheapest alternative is rugged PDA/smart chips with
wireless subscription. The most expensive alternative is rugged tablet/smart
chips with WLAN connection. Each investment situation is unique and requires
diversified investment choices. Therefore, in today’s complex and dynamic
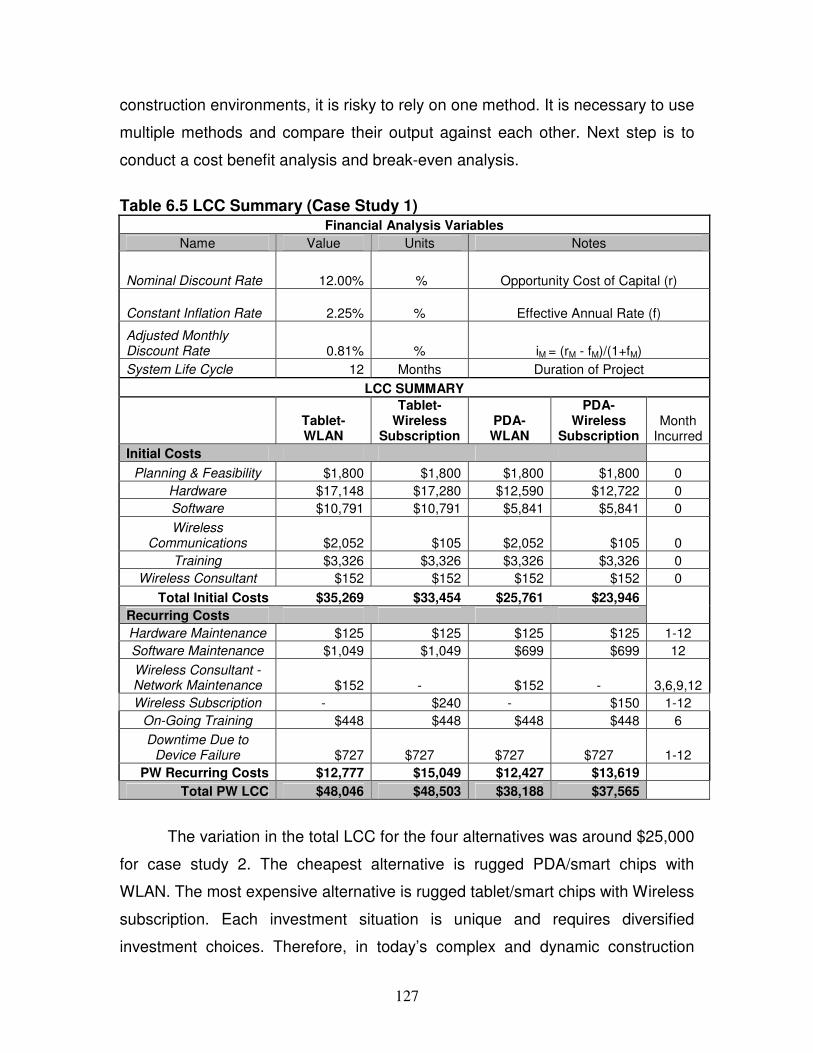
127
construction environments, it is risky to rely on one method. It is necessary to use
multiple methods and compare their output against each other. Next step is to
conduct a cost benefit analysis and break-even analysis.
Table 6.5 LCC Summary (Case Study 1)
Financial Analysis Variables
Name Value Units Notes
Nominal Discount Rate 12.00% % Opportunity Cost of Capital (r)
Constant Inflation Rate 2.25% % Effective Annual Rate (f)
Adjusted Monthly Discount Rate 0.81% % iM = (rM - fM)/(1+fM)
System Life Cycle 12 Months Duration of Project
LCC SUMMARY
Tablet-WLAN
Tablet-Wireless
Subscription PDA-WLAN
PDA-Wireless
Subscription Month
Incurred
Initial Costs
Planning & Feasibility $1,800 $1,800 $1,800 $1,800 0
Hardware $17,148 $17,280 $12,590 $12,722 0
Software $10,791 $10,791 $5,841 $5,841 0
Wireless Communications $2,052 $105 $2,052 $105 0
Training $3,326 $3,326 $3,326 $3,326 0
Wireless Consultant $152 $152 $152 $152 0
Total Initial Costs $35,269 $33,454 $25,761 $23,946
Recurring Costs
Hardware Maintenance $125 $125 $125 $125 1-12
Software Maintenance $1,049 $1,049 $699 $699 12
Wireless Consultant - Network Maintenance $152 - $152 - 3,6,9,12
Wireless Subscription - $240 - $150 1-12
On-Going Training $448 $448 $448 $448 6
Downtime Due to Device Failure $727 $727 $727 $727 1-12
PW Recurring Costs $12,777 $15,049 $12,427 $13,619
Total PW LCC $48,046 $48,503 $38,188 $37,565
The variation in the total LCC for the four alternatives was around $25,000
for case study 2. The cheapest alternative is rugged PDA/smart chips with
WLAN. The most expensive alternative is rugged tablet/smart chips with Wireless
subscription. Each investment situation is unique and requires diversified
investment choices. Therefore, in today’s complex and dynamic construction
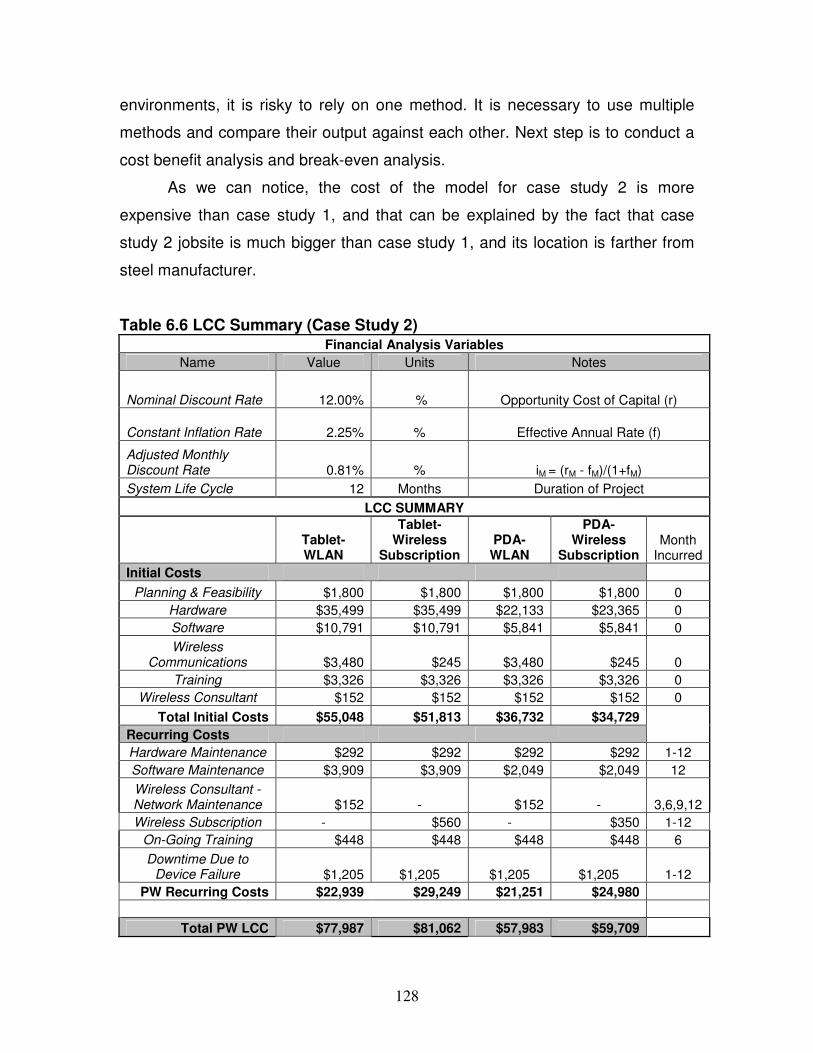
128
environments, it is risky to rely on one method. It is necessary to use multiple
methods and compare their output against each other. Next step is to conduct a
cost benefit analysis and break-even analysis.
As we can notice, the cost of the model for case study 2 is more
expensive than case study 1, and that can be explained by the fact that case
study 2 jobsite is much bigger than case study 1, and its location is farther from
steel manufacturer.
Table 6.6 LCC Summary (Case Study 2) Financial Analysis Variables
Name Value Units Notes
Nominal Discount Rate 12.00% % Opportunity Cost of Capital (r)
Constant Inflation Rate 2.25% % Effective Annual Rate (f)
Adjusted Monthly Discount Rate 0.81% % iM = (rM - fM)/(1+fM)
System Life Cycle 12 Months Duration of Project
LCC SUMMARY
Tablet-WLAN
Tablet-Wireless
Subscription PDA-WLAN
PDA-Wireless
Subscription Month
Incurred
Initial Costs
Planning & Feasibility $1,800 $1,800 $1,800 $1,800 0
Hardware $35,499 $35,499 $22,133 $23,365 0
Software $10,791 $10,791 $5,841 $5,841 0
Wireless Communications $3,480 $245 $3,480 $245 0
Training $3,326 $3,326 $3,326 $3,326 0
Wireless Consultant $152 $152 $152 $152 0
Total Initial Costs $55,048 $51,813 $36,732 $34,729
Recurring Costs
Hardware Maintenance $292 $292 $292 $292 1-12
Software Maintenance $3,909 $3,909 $2,049 $2,049 12
Wireless Consultant - Network Maintenance $152 - $152 - 3,6,9,12
Wireless Subscription - $560 - $350 1-12
On-Going Training $448 $448 $448 $448 6
Downtime Due to Device Failure $1,205 $1,205 $1,205 $1,205 1-12
PW Recurring Costs $22,939 $29,249 $21,251 $24,980
Total PW LCC $77,987 $81,062 $57,983 $59,709

129
6.7.1 Function A: Site Inspection Savings
This function addresses the need of three common types of inspection: 1)
structural, 2) material, and 3) safety. A structural inspector compares design
documents with the actual installation. In several locations during our site visit,
the structural inspector, Mr. Ramon Piera (case study 1), was faced with an
unclear design document, requiring him to get clarification from the designer
(situated in main office in Alabama). A material inspector verifies that a material
meets the requirements of the applicable specification. A safety inspector
identifies potentially hazardous situations and supervises compliance with safety
regulations. The suitable implementation of function A returns savings in travel
cost and time from jobsite to the site inspector’s remote office as well as
inspection time. Baseline assumptions for case study 1 are formulated to
calculate annual benefits.
• 30 % of the total inspections can be remotely supported by this function
• At least 30 minutes of inspection time per inspection
• The frequency of site inspection: two times per week
• Driving distance:150 miles
• Average driving cost per mile: $0.36
• Average cost per man-hour of the site inspector: $70 (U.S. Department of
Labor)
Based on the assumptions above, the annual benefits of this function are
projected in table 6.7.
Table 6.7 Benefits Calculation of Function A Driving Cost 150miles*($0.36/mile)*(4weeks/month)
*(12months/year)*30% *(2 inspection/week)
$1,555
Travel Time Cost
150min*(1hour/60min)*($70/hour) *(4weeks/month)*(12months/year) *30%*(2 inspection/week)
$5,040
Inspection Time Cost
30min*(1hour/60min)*($70/hour) *(4weeks/month)*(12months/year) *30%*(2 inspection/week)
$1,008
Total Cost per Inspector $7,603
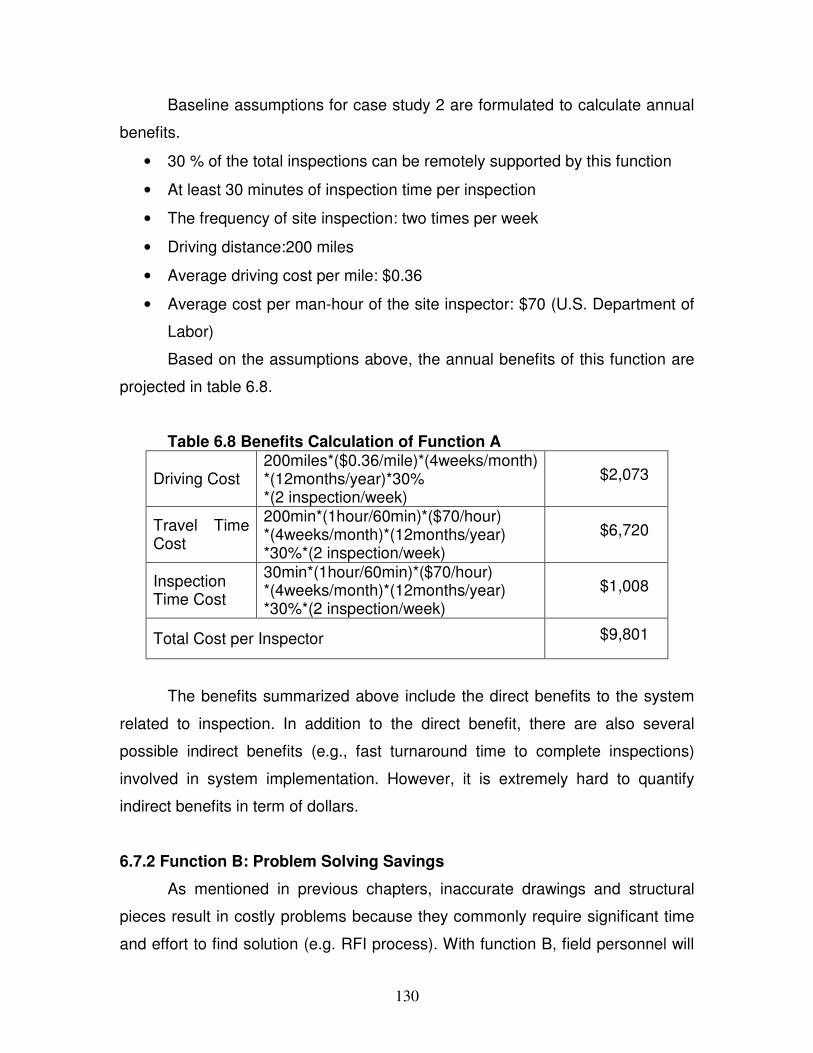
130
Baseline assumptions for case study 2 are formulated to calculate annual
benefits.
• 30 % of the total inspections can be remotely supported by this function
• At least 30 minutes of inspection time per inspection
• The frequency of site inspection: two times per week
• Driving distance:200 miles
• Average driving cost per mile: $0.36
• Average cost per man-hour of the site inspector: $70 (U.S. Department of
Labor)
Based on the assumptions above, the annual benefits of this function are
projected in table 6.8.
Table 6.8 Benefits Calculation of Function A
Driving Cost 200miles*($0.36/mile)*(4weeks/month) *(12months/year)*30% *(2 inspection/week)
$2,073
Travel Time Cost
200min*(1hour/60min)*($70/hour) *(4weeks/month)*(12months/year) *30%*(2 inspection/week)
$6,720
Inspection Time Cost
30min*(1hour/60min)*($70/hour) *(4weeks/month)*(12months/year) *30%*(2 inspection/week)
$1,008
Total Cost per Inspector $9,801
The benefits summarized above include the direct benefits to the system
related to inspection. In addition to the direct benefit, there are also several
possible indirect benefits (e.g., fast turnaround time to complete inspections)
involved in system implementation. However, it is extremely hard to quantify
indirect benefits in term of dollars.
6.7.2 Function B: Problem Solving Savings
As mentioned in previous chapters, inaccurate drawings and structural
pieces result in costly problems because they commonly require significant time
and effort to find solution (e.g. RFI process). With function B, field personnel will
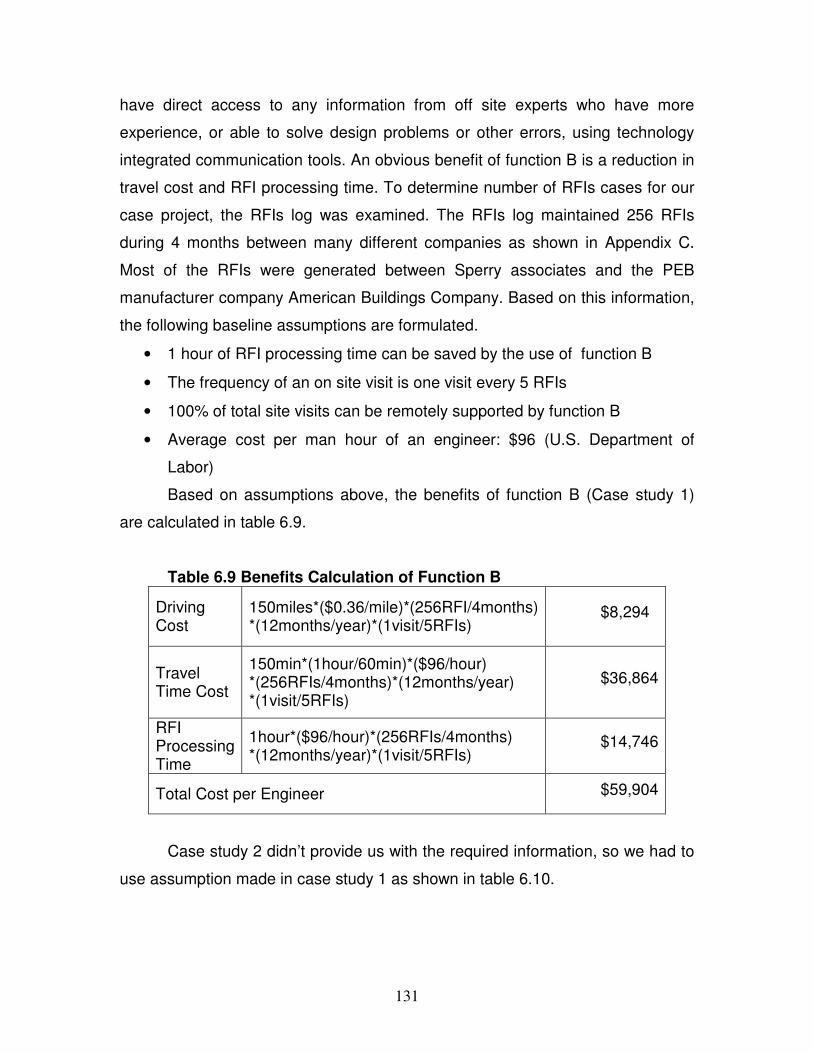
131
have direct access to any information from off site experts who have more
experience, or able to solve design problems or other errors, using technology
integrated communication tools. An obvious benefit of function B is a reduction in
travel cost and RFI processing time. To determine number of RFIs cases for our
case project, the RFIs log was examined. The RFIs log maintained 256 RFIs
during 4 months between many different companies as shown in Appendix C.
Most of the RFIs were generated between Sperry associates and the PEB
manufacturer company American Buildings Company. Based on this information,
the following baseline assumptions are formulated.
• 1 hour of RFI processing time can be saved by the use of function B
• The frequency of an on site visit is one visit every 5 RFIs
• 100% of total site visits can be remotely supported by function B
• Average cost per man hour of an engineer: $96 (U.S. Department of
Labor)
Based on assumptions above, the benefits of function B (Case study 1)
are calculated in table 6.9.
Table 6.9 Benefits Calculation of Function B
Driving Cost
150miles*($0.36/mile)*(256RFI/4months) *(12months/year)*(1visit/5RFIs)
$8,294
Travel Time Cost
150min*(1hour/60min)*($96/hour) *(256RFIs/4months)*(12months/year) *(1visit/5RFIs)
$36,864
RFI Processing Time
1hour*($96/hour)*(256RFIs/4months) *(12months/year)*(1visit/5RFIs)
$14,746
Total Cost per Engineer $59,904
Case study 2 didn’t provide us with the required information, so we had to
use assumption made in case study 1 as shown in table 6.10.

132
Table 6.10 Benefits Calculation of Function B Driving Cost
200miles*($0.36/mile)*(256RFI/4months) *(12months/year)*(1visit/5RFIs)
$11,058
Travel Time Cost
200min*(1hour/60min)*($96/hour) *(256RFIs/4months)*(12months/year) *(1visit/5RFIs)
$49,152
RFI Processing Time
1hour*($96/hour)*(256RFIs/4months) *(12months/year)*(1visit/5RFIs)
$14,746
Total Cost per Engineer $74,956
Indirect benefits (e.g., reduction in construction downtimes or RFIs
turnaround times) are not considered in this analysis due to difficulty in
quantifying cost.
6.7.2.1Cost Benefit Analysis
Based on table 6.9 and 6.10, the total cost and benefits are calculated in
table 6.11 and table 6.12 to calculate the economic impacts of function B.
Table 6.11 Cost Benefit Analysis of Function B
Costs Total cost using Alternative 2 $48,503
Driving Cost $8,294
Travel Time $36,864 Remote Problem Solving RFI Processing
Time $14,746 Benefits
Total Benefits $59,904
Benefit to Cost Ratio = $59,904/ $48,503 = 1.23
Net Benefits = $59,904 - $48,503 = $11,401
From the data in table 6.11, the benefits to cost ratio is 1.23 and the total
benefits of function B is $11,401 more than it total cost.
From the data in table 6.12, the benefits to cost ratio is 0.92
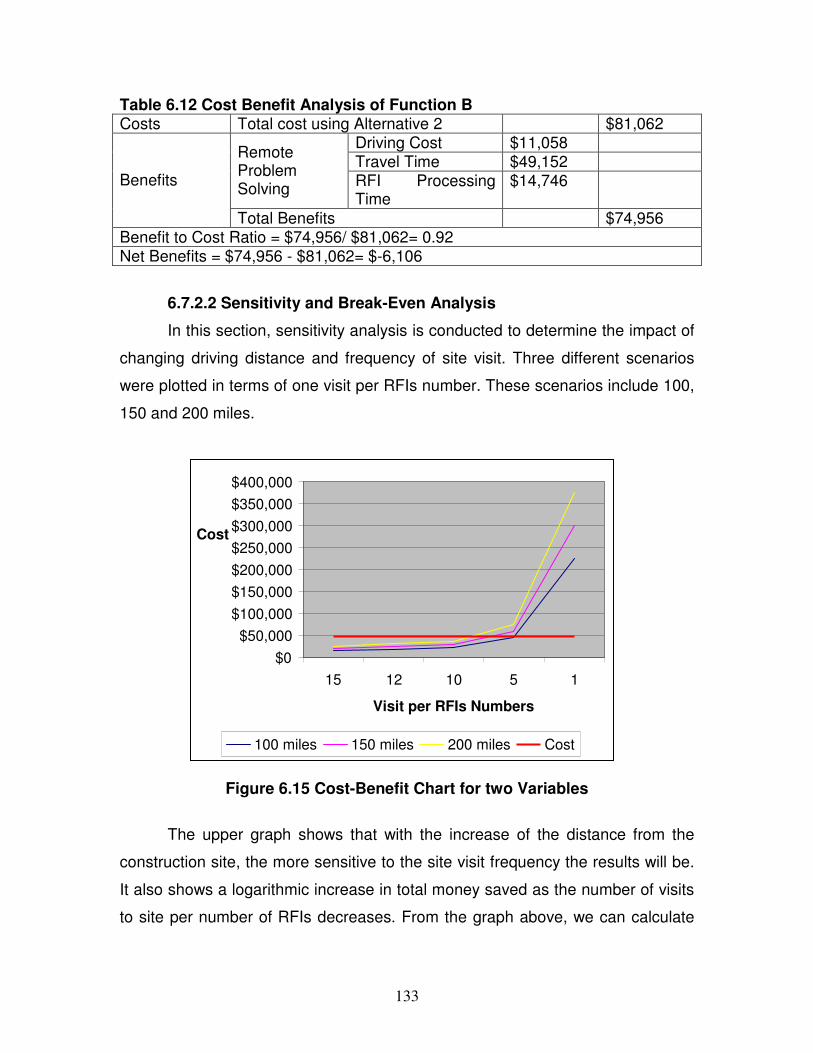
133
Table 6.12 Cost Benefit Analysis of Function B Costs Total cost using Alternative 2 $81,062
Driving Cost $11,058 Travel Time $49,152
Remote Problem Solving
RFI Processing Time
$14,746 Benefits
Total Benefits $74,956 Benefit to Cost Ratio = $74,956/ $81,062= 0.92 Net Benefits = $74,956 - $81,062= $-6,106
6.7.2.2 Sensitivity and Break-Even Analysis
In this section, sensitivity analysis is conducted to determine the impact of
changing driving distance and frequency of site visit. Three different scenarios
were plotted in terms of one visit per RFIs number. These scenarios include 100,
150 and 200 miles.
Figure 6.15 Cost-Benefit Chart for two Variables
The upper graph shows that with the increase of the distance from the
construction site, the more sensitive to the site visit frequency the results will be.
It also shows a logarithmic increase in total money saved as the number of visits
to site per number of RFIs decreases. From the graph above, we can calculate
$0
$50,000
$100,000
$150,000
$200,000
$250,000
$300,000
$350,000
$400,000
15 12 10 5 1
Visit per RFIs Numbers
Cost
100 miles 150 miles 200 miles Cost
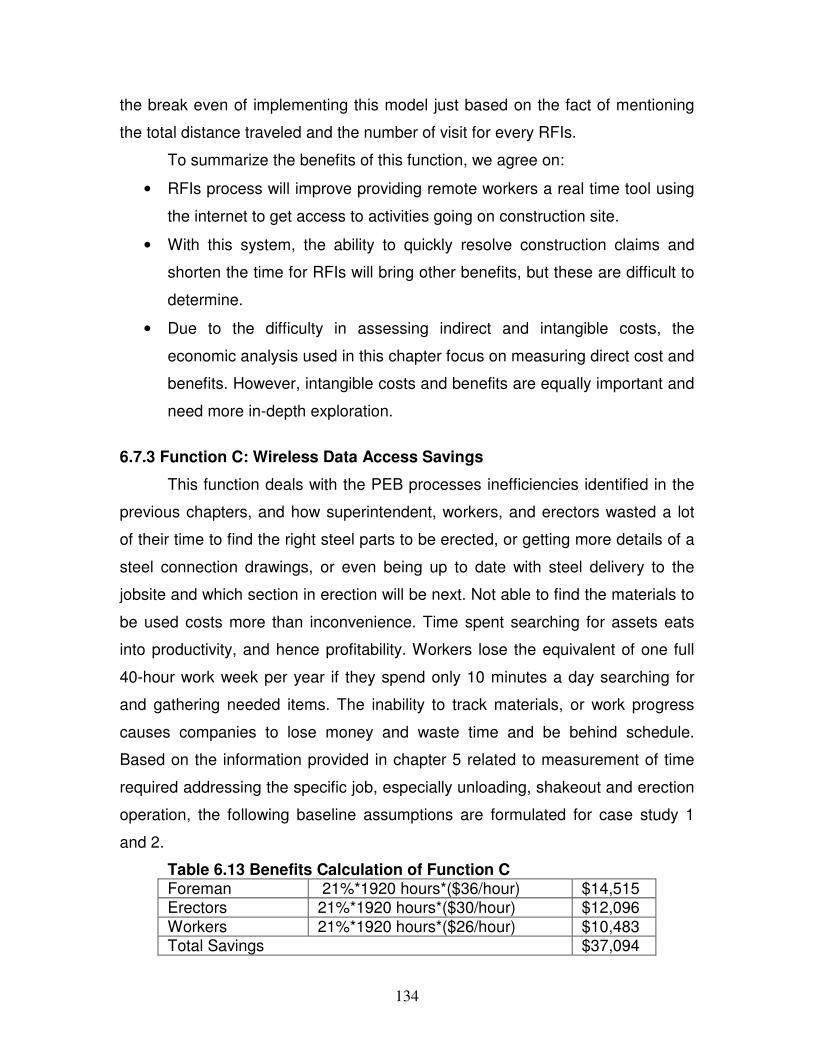
134
the break even of implementing this model just based on the fact of mentioning
the total distance traveled and the number of visit for every RFIs.
To summarize the benefits of this function, we agree on:
• RFIs process will improve providing remote workers a real time tool using
the internet to get access to activities going on construction site.
• With this system, the ability to quickly resolve construction claims and
shorten the time for RFIs will bring other benefits, but these are difficult to
determine.
• Due to the difficulty in assessing indirect and intangible costs, the
economic analysis used in this chapter focus on measuring direct cost and
benefits. However, intangible costs and benefits are equally important and
need more in-depth exploration.
6.7.3 Function C: Wireless Data Access Savings
This function deals with the PEB processes inefficiencies identified in the
previous chapters, and how superintendent, workers, and erectors wasted a lot
of their time to find the right steel parts to be erected, or getting more details of a
steel connection drawings, or even being up to date with steel delivery to the
jobsite and which section in erection will be next. Not able to find the materials to
be used costs more than inconvenience. Time spent searching for assets eats
into productivity, and hence profitability. Workers lose the equivalent of one full
40-hour work week per year if they spend only 10 minutes a day searching for
and gathering needed items. The inability to track materials, or work progress
causes companies to lose money and waste time and be behind schedule.
Based on the information provided in chapter 5 related to measurement of time
required addressing the specific job, especially unloading, shakeout and erection
operation, the following baseline assumptions are formulated for case study 1
and 2.
Table 6.13 Benefits Calculation of Function C Foreman 21%*1920 hours*($36/hour) $14,515 Erectors 21%*1920 hours*($30/hour) $12,096 Workers 21%*1920 hours*($26/hour) $10,483 Total Savings $37,094

135
The other benefits that can be calculated based on this function are work
process elimination and reduce in reworks. That was shown in the work process
flow of the PEB steel structure. Applying the proposed model on the construction
site, eliminate time to stakeout the materials once they are on the jobsite, and
eliminate the need to mark the steel parts again, to identify the parts when
erection starts. Based on measuring the time it took the workers to stakeout the
steel parts, and again to make their own notes to identify the steel parts and
mark them, it was safe enough to make the assumptions that 5% of the total cost
of the project would be saved by implementing function C.
Table 6.14 Rework and Process Elimination Savings for Case study 1 Rework and
Process Elimination
5%*$3,000,000 $150,000
Table 6.15 Rework and Process Elimination Savings for Case study 2
Rework and Process
Elimination 5%*$12,600,000 $630,000
So the total saving gained from function C for case study 1 will be:
Table 6.16 Summary of Benefits of Function C
Improving Efficiency
$37,094
Rework and Process
Elimination $150,000
Total Savings $187,094
So the total saving gained from function C for case study 2 will be:
Table 6.17 Summary of Benefits of Function C Improving Efficiency
$37,094
Rework and Process
Elimination $630,000
Total Savings $667,094
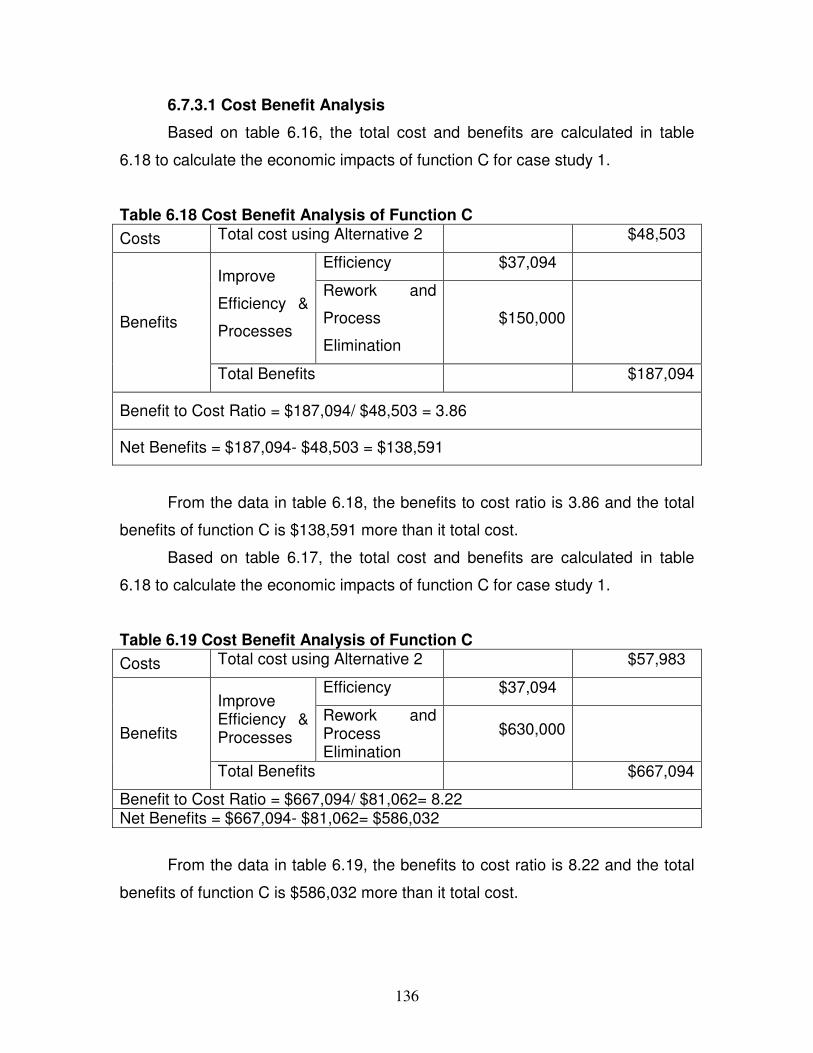
136
6.7.3.1 Cost Benefit Analysis
Based on table 6.16, the total cost and benefits are calculated in table
6.18 to calculate the economic impacts of function C for case study 1.
Table 6.18 Cost Benefit Analysis of Function C
Costs Total cost using Alternative 2 $48,503
Efficiency $37,094 Improve
Efficiency &
Processes
Rework and
Process
Elimination
$150,000
Benefits
Total Benefits $187,094
Benefit to Cost Ratio = $187,094/ $48,503 = 3.86
Net Benefits = $187,094- $48,503 = $138,591
From the data in table 6.18, the benefits to cost ratio is 3.86 and the total
benefits of function C is $138,591 more than it total cost.
Based on table 6.17, the total cost and benefits are calculated in table
6.18 to calculate the economic impacts of function C for case study 1.
Table 6.19 Cost Benefit Analysis of Function C
Costs Total cost using Alternative 2 $57,983
Efficiency $37,094 Improve Efficiency & Processes
Rework and Process Elimination
$630,000
Benefits
Total Benefits $667,094
Benefit to Cost Ratio = $667,094/ $81,062= 8.22 Net Benefits = $667,094- $81,062= $586,032
From the data in table 6.19, the benefits to cost ratio is 8.22 and the total
benefits of function C is $586,032 more than it total cost.
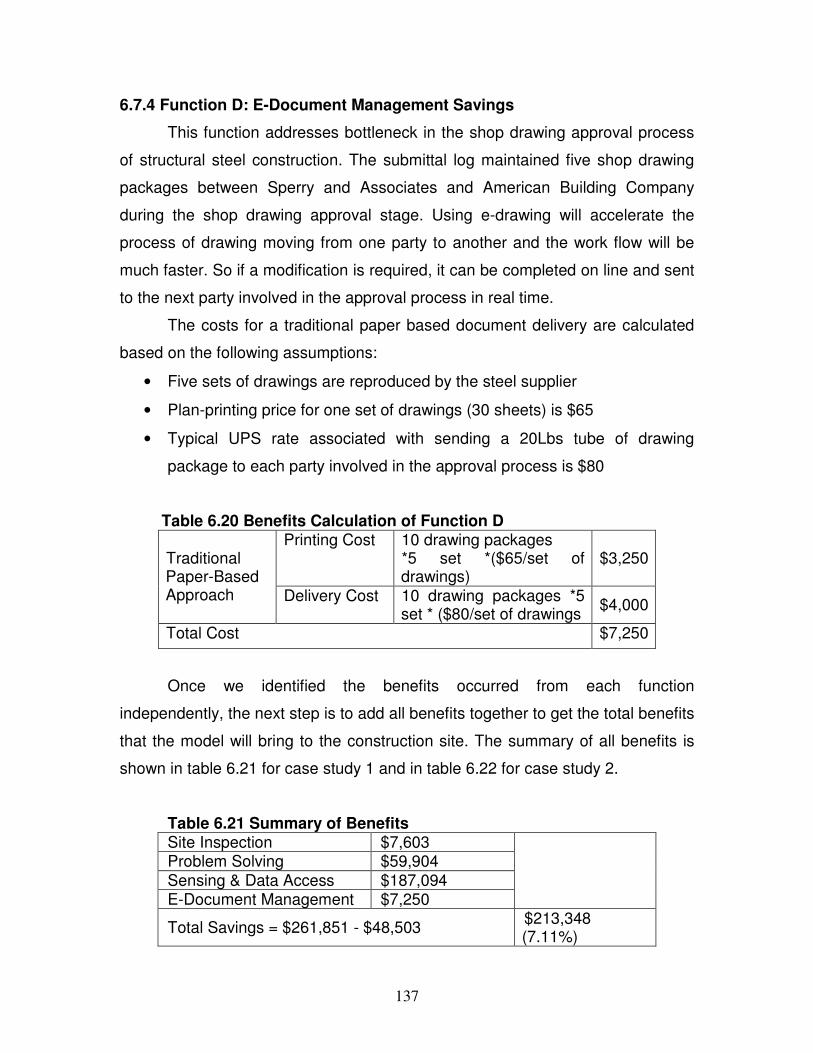
137
6.7.4 Function D: E-Document Management Savings
This function addresses bottleneck in the shop drawing approval process
of structural steel construction. The submittal log maintained five shop drawing
packages between Sperry and Associates and American Building Company
during the shop drawing approval stage. Using e-drawing will accelerate the
process of drawing moving from one party to another and the work flow will be
much faster. So if a modification is required, it can be completed on line and sent
to the next party involved in the approval process in real time.
The costs for a traditional paper based document delivery are calculated
based on the following assumptions:
• Five sets of drawings are reproduced by the steel supplier
• Plan-printing price for one set of drawings (30 sheets) is $65
• Typical UPS rate associated with sending a 20Lbs tube of drawing
package to each party involved in the approval process is $80
Table 6.20 Benefits Calculation of Function D Printing Cost 10 drawing packages
*5 set *($65/set of drawings)
$3,250 Traditional Paper-Based Approach Delivery Cost 10 drawing packages *5
set * ($80/set of drawings $4,000
Total Cost $7,250
Once we identified the benefits occurred from each function
independently, the next step is to add all benefits together to get the total benefits
that the model will bring to the construction site. The summary of all benefits is
shown in table 6.21 for case study 1 and in table 6.22 for case study 2.
Table 6.21 Summary of Benefits Site Inspection $7,603 Problem Solving $59,904 Sensing & Data Access $187,094 E-Document Management $7,250
Total Savings = $261,851 - $48,503 $213,348 (7.11%)
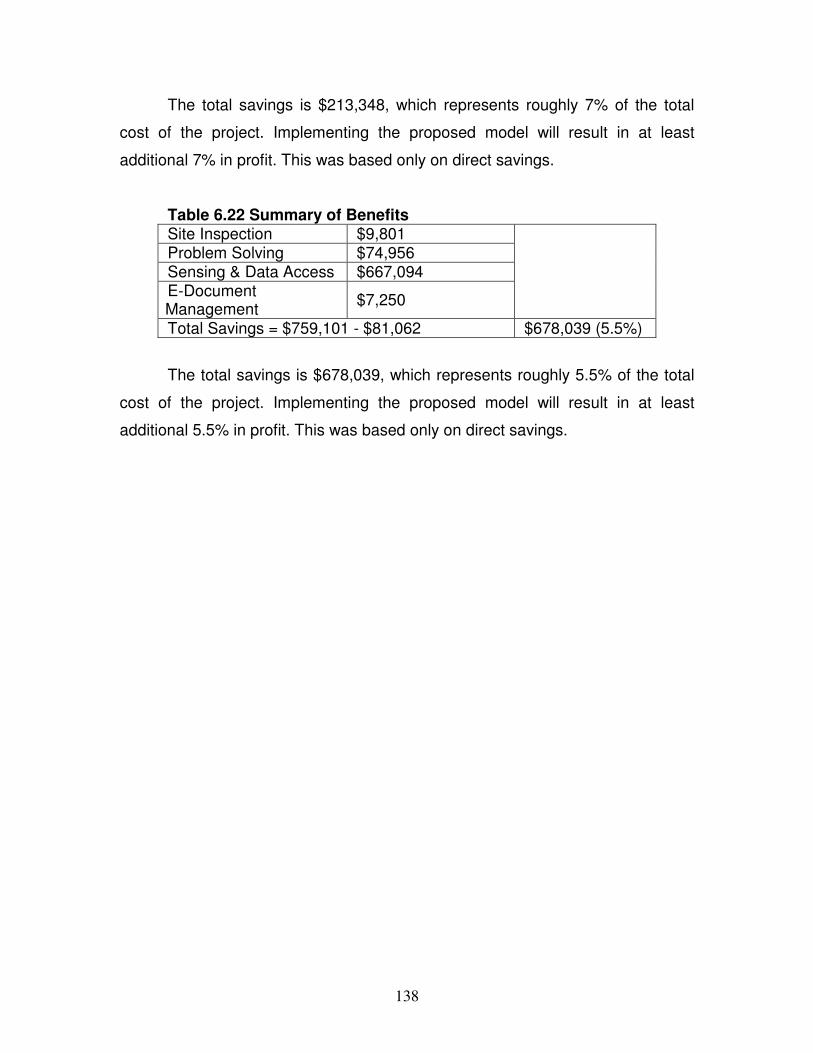
138
The total savings is $213,348, which represents roughly 7% of the total
cost of the project. Implementing the proposed model will result in at least
additional 7% in profit. This was based only on direct savings.
Table 6.22 Summary of Benefits Site Inspection $9,801 Problem Solving $74,956 Sensing & Data Access $667,094 E-Document Management
$7,250
Total Savings = $759,101 - $81,062 $678,039 (5.5%)
The total savings is $678,039, which represents roughly 5.5% of the total
cost of the project. Implementing the proposed model will result in at least
additional 5.5% in profit. This was based only on direct savings.
139
CHAPTER 7
CONCLUSIONS AND RECOMMENDATION
This dissertation proposed a framework for real-time project progress
tracking and a utility function model for wireless technology evaluation and
selection. This chapter summarizes the research and highlights the research
contributions. Subsequently the limitations of the research are discussed. Finally,
recommendations for future work are provided.
7.1 Summary of the research
The construction industry suffers from stagnant productivity, project
delays, quality problems and resistance to new technologies. Research studies
have shown that the major cause of the problems can be traced back to the lack
of effective communication among construction process units. One commonly
cited means to overcome this problem is through the use of advance
technologies. But the challenge arises when decision to choose the best
technology to fulfill the need because each system has its own technical,
economic, and risk considerations.
The goal of this research was to develop a model that helps decision
makers to choose the best information technology that fits their needs. The
model employed multiple-attribute utility functions for implementing a collective
approach to assess information technology alternatives into construction project.
Herein, utility functions provided a universal platform for integrating several
predefined measures of information technology into a single indicator of such
performance. To achieve that, a survey was performed to determine construction
people preferences for proposed attributes. Then single utility function are
integrated together to form the multiple attribute utility function. Then proposed
140
alternatives were tested in the evaluation model to determine the best alternative
to be used in our case studies.
Then the research proposed a framework for a real-time model for project
progress tracking. The basic premise of the proposed model is to network
previously stand alone islands of communication on a construction site to allow
for the network between different parties involved in the construction project. So
a database was developed to show where the information will be stored, how
they can be retrieved, and how the progress of the activities is implemented in
the master schedule to keep all parties updated.
Then two case studies were used to highlight the values of implementing
such model on the construction site. That was achieved first by studying the
construction process, developing flow diagram, and then performing simulation
analysis to determine productivity before and after implementing the real-time
project progress-tracking model.
7.2 Research Contribution
The contributions of this research include:
• A framework for tracking construction project using wireless technologies and
database management system is developed. The model integrates RFID with
mobile computing technology and wireless technologies to increase the
efficiency and accuracy of the jobsite data collection and schedule update.
There has been some previous research works that utilize this kind of
technology on construction site to track materials and equipments locations.
The real-time progress tracking model not only tracks materials, labors and
equipment of construction site, but it also updates the project schedule
instantly as soon as the activity occurs.
• Furthermore, a central database management system is developed to act as
a storage room for the information sent. At the same time this database plays
the role of a library to get the required information while on the construction
141
site and not able to access the site office. Simple queries using SQL are
presented to represents some of the information needs on the construction
site.
• This research identifies the need to improve construction site efficiency by
implementing information technology. Barriers to implementation of such
systems on construction site are identified. Some of the barriers are lack of
assessment method to incorporate different criteria in the user judgment and
lack of metrics to assess benefits. So the need to a decision support tool and
a clear benefit assessment metrics arises.
• A hybrid decision support model for real-time project tracking model selection
is developed. The model applies principles from multi-attribute decision theory
to help decision makers to select and evaluate the appropriate information
technology for the required construction application. This model is based on
analytic hierarchy process that applied eigenvector method to determine the
users’ preferences. The model evaluates each proposed criteria and give it a
utility function value. The alternative with the highest utility value corresponds
to the best alternative that fulfills the need. With small modifications, the
hybrid decision model can be used to assess other can of goals by just
modifying the required attributes for assessment.
• For models implementation, two steel construction projects were used as
examples for the proposed models. An information flow diagram, followed by
simulation model for Pre-Engineered process from shipping the steel
materials till erection on the construction site was developed. Then a
feasibility study of implementing the proposed project tracking model and its
impact on the construction project was conducted. Because the multifaceted
benefits of the various applications, different scientific methods were used to
measure the value that the technology integrated model will incorporate into
the construction process.

142
7.3 Limitations
The utility function model developed in this study provides a
comprehensive approach to assess information technology that can be used on
construction site to update project progress. However, there are some limitations
in the present model, especially regarding the assumption made for the utility risk
attitude. Although the attributes developed cover the majority of users concerns,
but these attribute may change if the main objective changes. Establishing
priorities between attribute is also an obstacle because of lack of enough data
and people in the construction industry that are willing to spend sometime on
taking a survey.
Although the framework for real time project progress tracking suggested
a full monitoring of resources such as equipment material and labors. This study
was just limited to materials and especially to pre-engineered steel parts because
of the limited data we were able to collect from the construction sites.
The quantification of benefits is based on theoretical background and
related research project. The proposed model needs to be implemented in a real
case study to strengthen the conclusions regarding application of wireless
technologies on the construction site.
7.4 Recommendations for Future Work
The construction industry is very conservative, and will only adopt new
information technologies if they are simple to implement, and provide immediate
benefits. Hopefully, the value assessment study we included in this thesis will
open the window for real time tracking using information technology.
The model presented in this research should be fully developed by writing
a computer program to link Microsoft project and Microsoft Access, and then link
Microsoft Access to the RFID software. It is recommended that a pilot project be
conducted by construction companies looking to invest in the proposed model
before completely changing the current process. If the pilot project is a success

143
and the company wants to implement this change for all future projects, then
further effort should go into planning and research to ensure that a smoothly
running system is being developed.
The survey developed in this survey should be continued by getting a
bigger population size. At the end the bigger the population is, the better the level
of confidence and the less the margin of error allowed.
This research only attempted to evaluate two categories of hardware
computing and wireless connection. Future work should include more categories
like wearable computers.
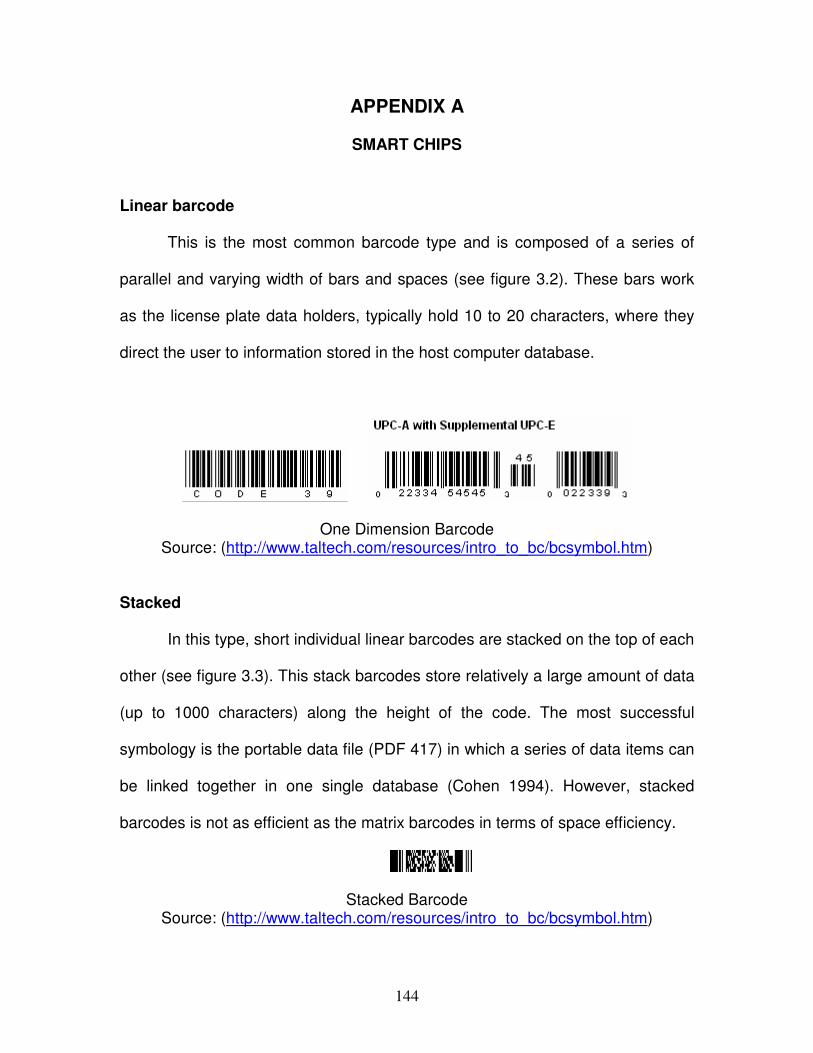
144
APPENDIX A
SMART CHIPS
Linear barcode
This is the most common barcode type and is composed of a series of
parallel and varying width of bars and spaces (see figure 3.2). These bars work
as the license plate data holders, typically hold 10 to 20 characters, where they
direct the user to information stored in the host computer database.
One Dimension Barcode Source: (http://www.taltech.com/resources/intro_to_bc/bcsymbol.htm)
Stacked
In this type, short individual linear barcodes are stacked on the top of each
other (see figure 3.3). This stack barcodes store relatively a large amount of data
(up to 1000 characters) along the height of the code. The most successful
symbology is the portable data file (PDF 417) in which a series of data items can
be linked together in one single database (Cohen 1994). However, stacked
barcodes is not as efficient as the matrix barcodes in terms of space efficiency.
Stacked Barcode Source: (http://www.taltech.com/resources/intro_to_bc/bcsymbol.htm)
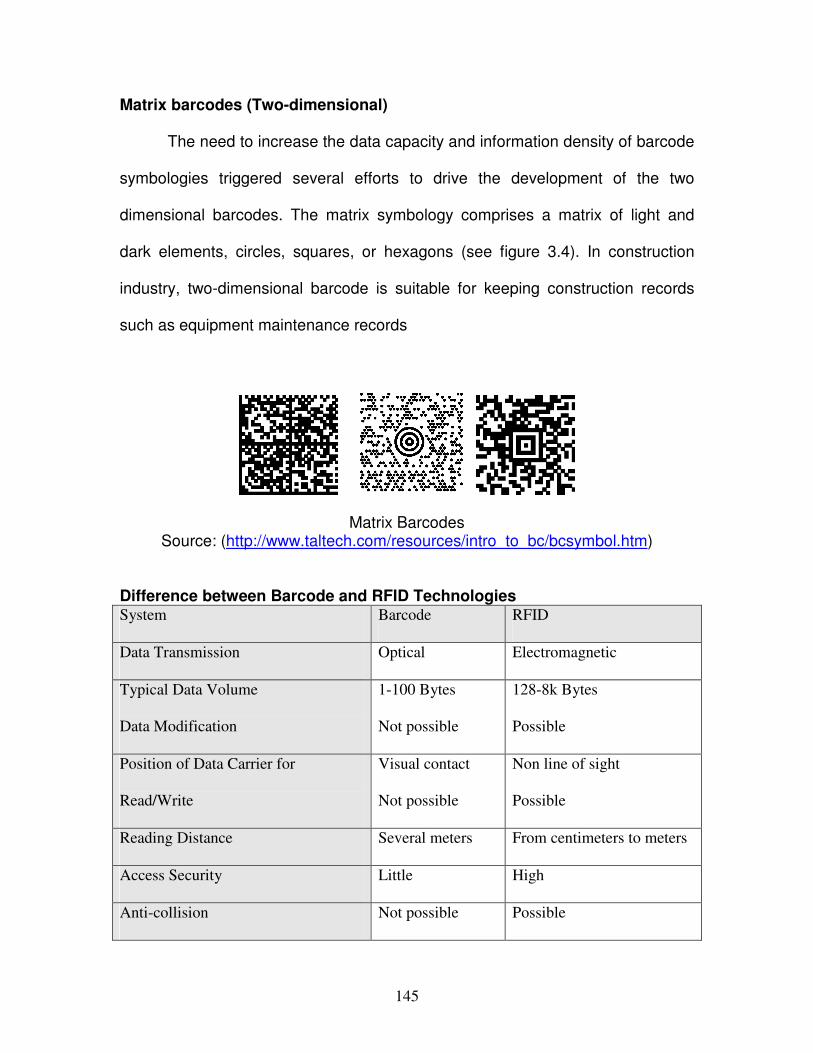
145
Matrix barcodes (Two-dimensional)
The need to increase the data capacity and information density of barcode
symbologies triggered several efforts to drive the development of the two
dimensional barcodes. The matrix symbology comprises a matrix of light and
dark elements, circles, squares, or hexagons (see figure 3.4). In construction
industry, two-dimensional barcode is suitable for keeping construction records
such as equipment maintenance records
Matrix Barcodes Source: (http://www.taltech.com/resources/intro_to_bc/bcsymbol.htm)
Difference between Barcode and RFID Technologies
System Barcode RFID
Data Transmission Optical Electromagnetic
Typical Data Volume
Data Modification
1-100 Bytes
Not possible
128-8k Bytes
Possible
Position of Data Carrier for
Read/Write
Visual contact
Not possible
Non line of sight
Possible
Reading Distance Several meters From centimeters to meters
Access Security Little High
Anti-collision Not possible Possible
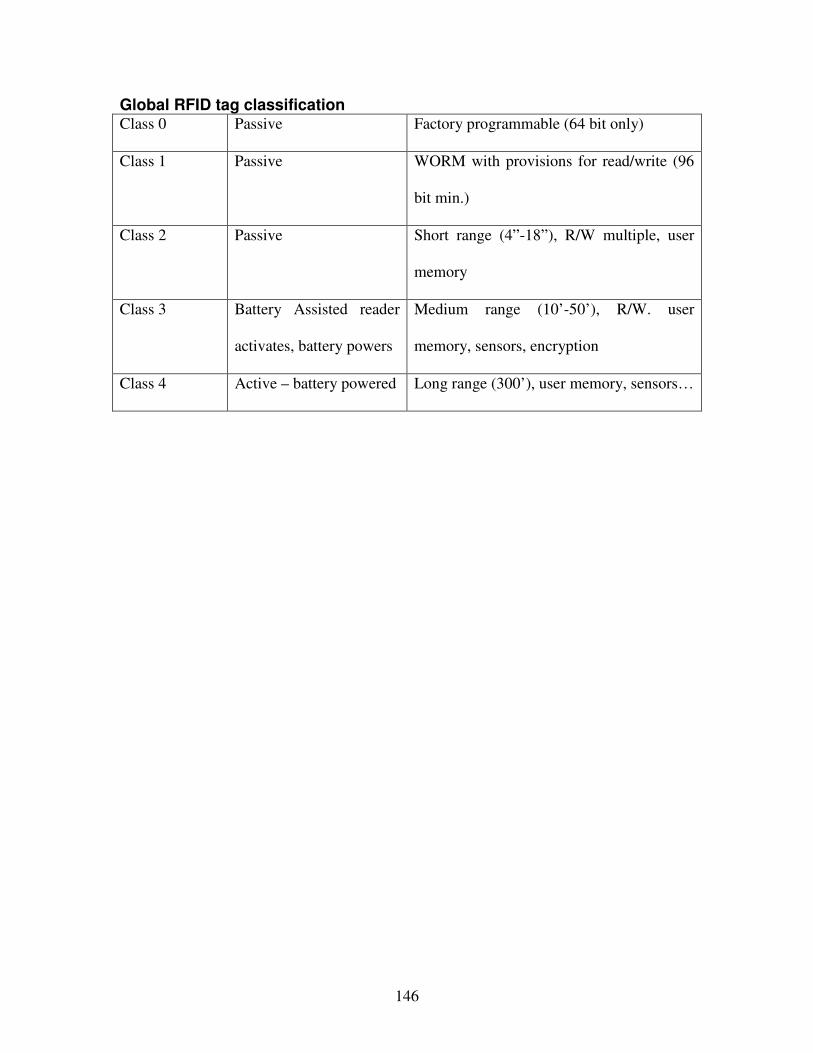
146
Global RFID tag classification Class 0 Passive Factory programmable (64 bit only)
Class 1 Passive WORM with provisions for read/write (96
bit min.)
Class 2 Passive Short range (4”-18”), R/W multiple, user
memory
Class 3 Battery Assisted reader
activates, battery powers
Medium range (10’-50’), R/W. user
memory, sensors, encryption
Class 4 Active – battery powered Long range (300’), user memory, sensors…
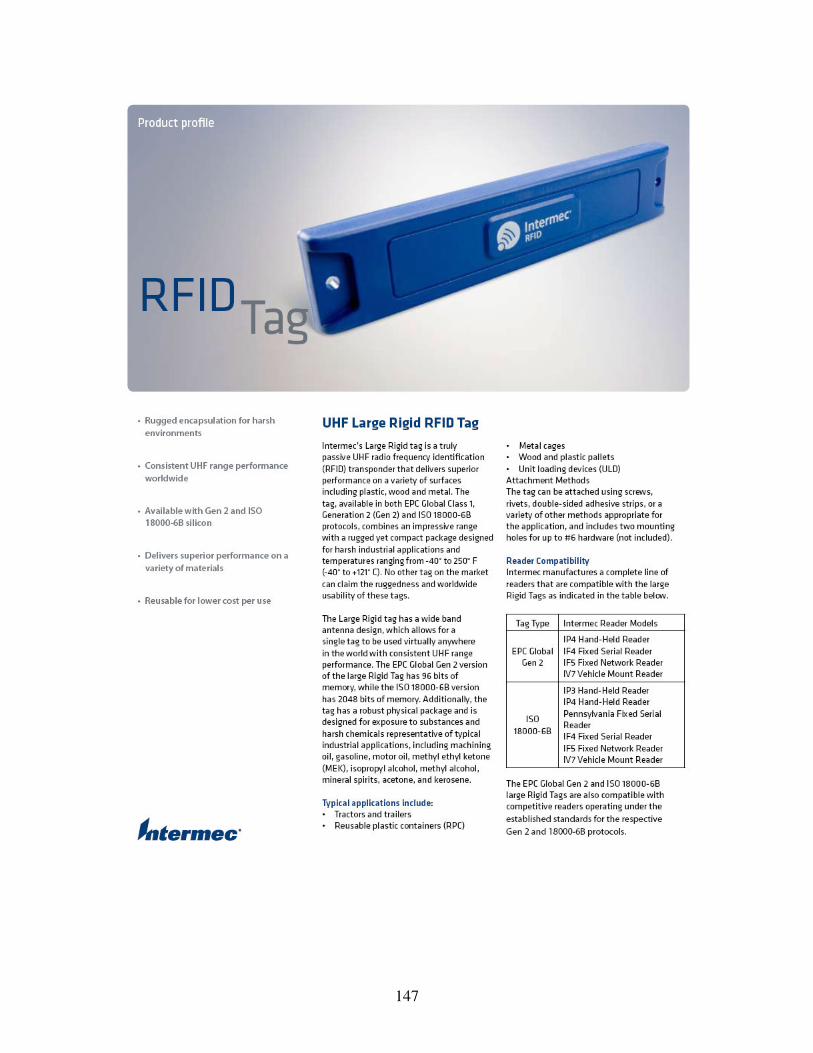
147

148
Passive RFID Tag
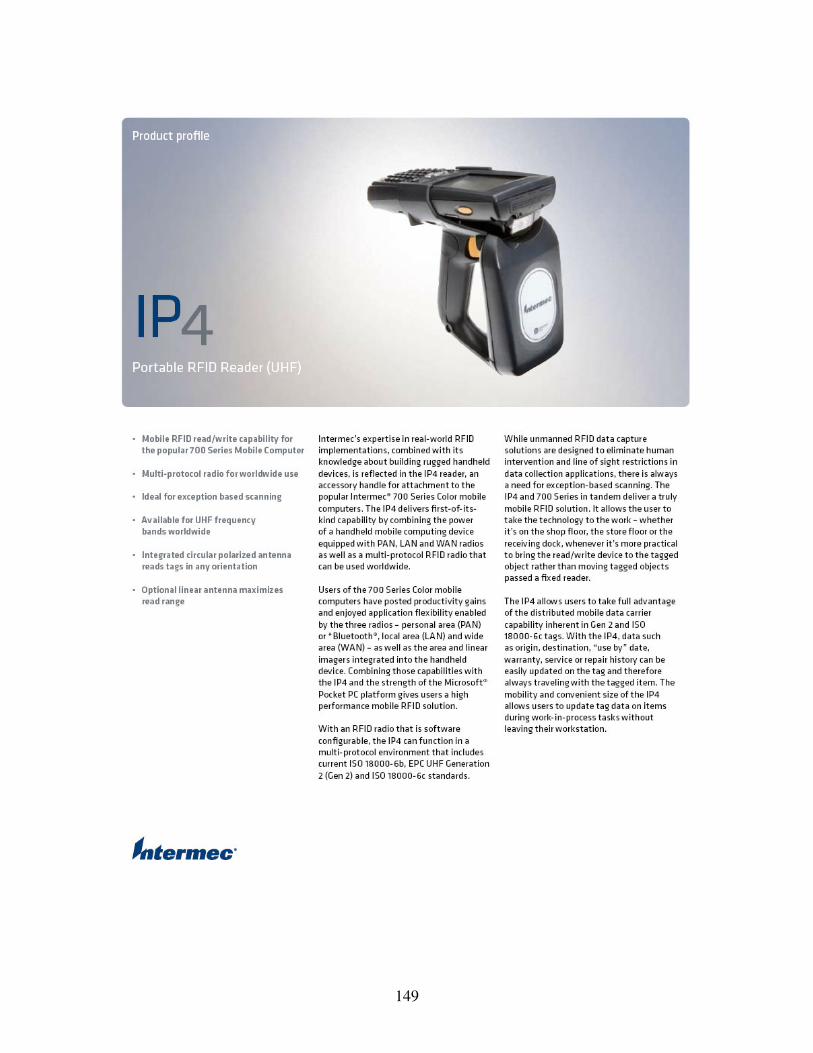
149
150
Handheld RFID Reader
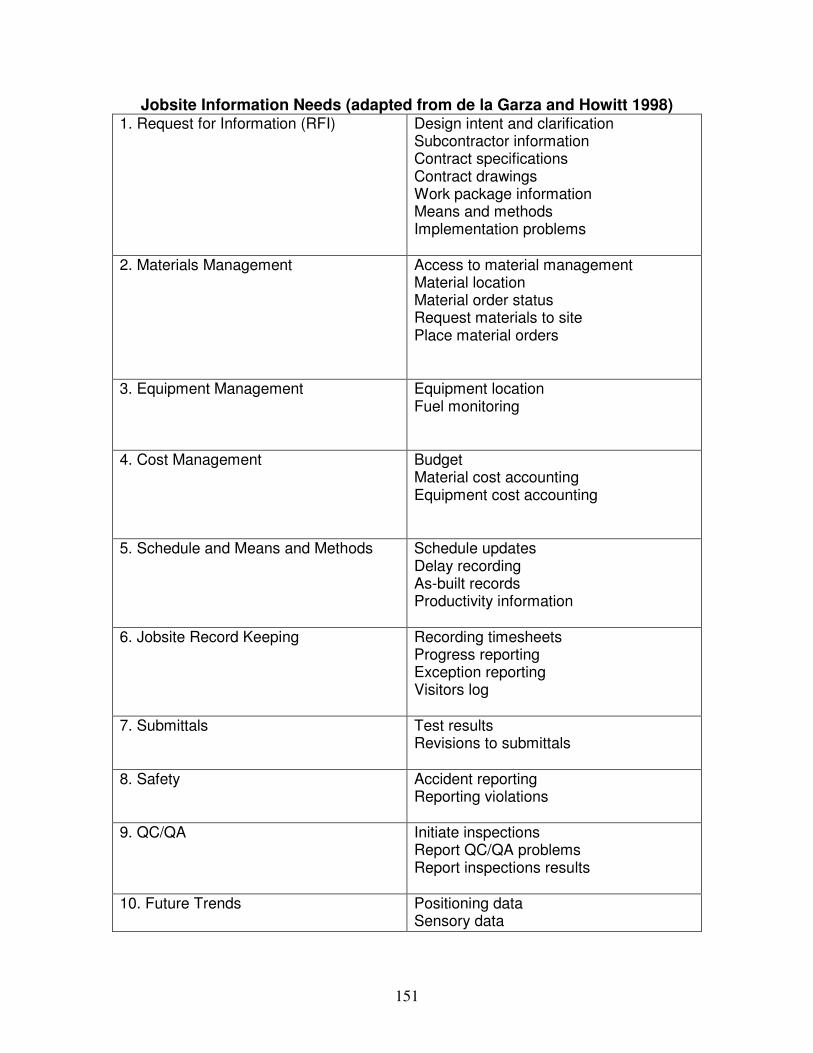
151
Jobsite Information Needs (adapted from de la Garza and Howitt 1998) 1. Request for Information (RFI)
Design intent and clarification Subcontractor information Contract specifications Contract drawings Work package information Means and methods Implementation problems
2. Materials Management Access to material management Material location Material order status Request materials to site Place material orders
3. Equipment Management Equipment location Fuel monitoring
4. Cost Management Budget Material cost accounting Equipment cost accounting
5. Schedule and Means and Methods Schedule updates Delay recording As-built records Productivity information
6. Jobsite Record Keeping Recording timesheets Progress reporting Exception reporting Visitors log
7. Submittals Test results Revisions to submittals
8. Safety Accident reporting Reporting violations
9. QC/QA Initiate inspections Report QC/QA problems Report inspections results
10. Future Trends Positioning data Sensory data

152
APPENDIX B
SURVEY
Because of your strong expertise in the construction industry and/or information technologies, we would be grateful if you could respond to the attached survey. This survey is part of an industry-oriented research project conducted at Florida State University, U.S.A., under the supervision of Doctor Y. AbdelRazig.
The survey focuses on the evaluation of existing information technology such as PDA’s, tablet PC’s, RFID, wireless communication to be used on the construction site to track the progress of construction project. The determination of usefulness will be based of on the preferences of professionals like yourself in using the available technologies to bridge the stand alone island of communication on the construction site. The basic criteria for evaluation are presented based on a thorough literature review. The results of this survey will be ultimately used to develop an evaluation tool for information technologies in the construction industry.
It will take you about 15-20 minutes to answer the questionnaire. Your participation will be most appreciated and your responses will not be released to any other parties without your consent.
To take the survey, click the link below http://www.eng.fsu.edu/~ghaneam
Regards,
Amine Ghanem, Ph.D. Candidate Email: [email protected] FAMU-FSU College of Engineering

153
Informed Consent
This survey is being conducted by Amine Ghanem, a graduate student with Florida State
University's College of Engineering, as research for his thesis on assessing the feasibility
of implementing wireless technologies in construction. Dr. Yassir AbdelRazig is the
Graduate Advisor for this student, and will be the professor overseeing this research.
Your participation in this research is voluntary, and consists of filling a series of online
tables about user preferences that will take approximately 20 minutes. By law, you must
be 18 years old or older to participate in this research. By submitting your survey you are
indicating your consent to participate, and that you are at least 18 years old. You may
withdraw consent at any point by closing the Web page before completing and submitting
the survey. There will be no penalty for non-participation. All answers will be kept
completely anonymous, and information obtained during the course of the study will
remain confidential to the extent allowed by law.
If you are uncomfortable supplying your name, email address, and company name, you
may complete the survey without including this data.
If you are interested in receiving the final results please provide us with your name and
email address at the end of the survey.
If you have any questions about your rights as a subject for this research you may contact
the Chair of the Human Subjects Committee, Institutional Review Board, at 850-644-
8633. If you have any questions regarding this research please contact Amine Ghanem
by email at [email protected] or by phone 850-410-6211. Dr. AbdelRazig can be reached at
Section 1: General Information
Name *
Email Address *
Company Name *
Education Level
Experience
Position
* Optional fields
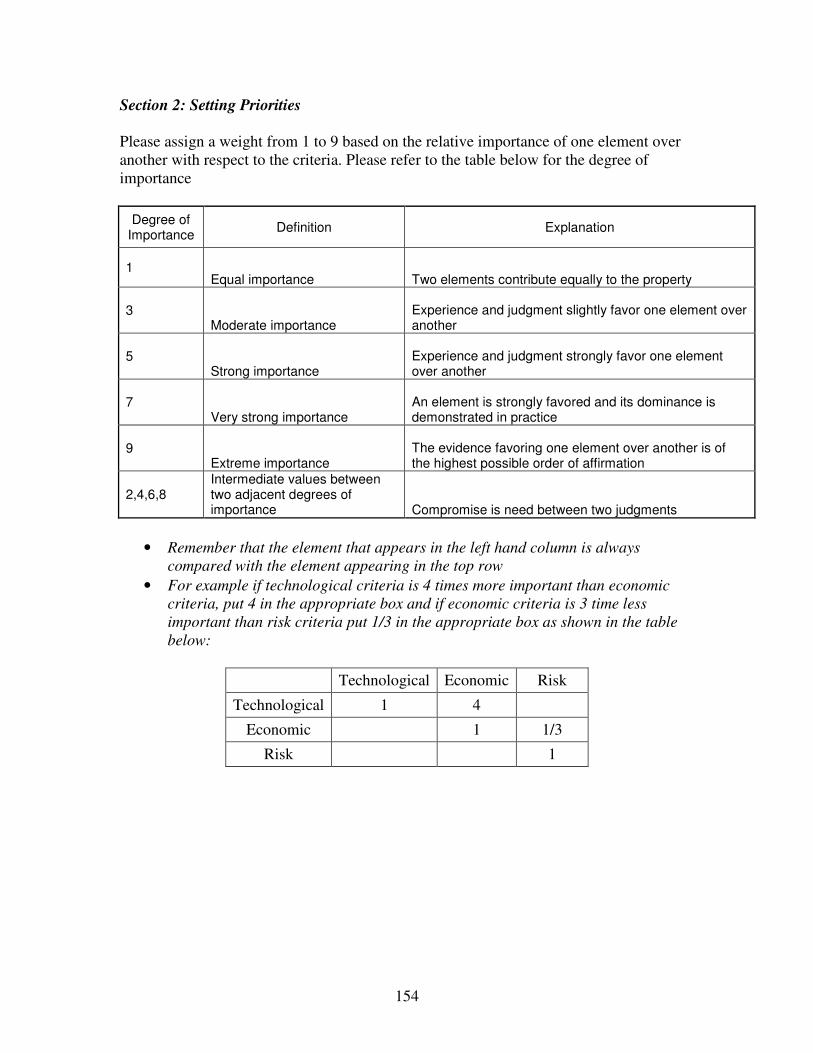
154
Section 2: Setting Priorities
Please assign a weight from 1 to 9 based on the relative importance of one element over
another with respect to the criteria. Please refer to the table below for the degree of
importance
Degree of Importance
Definition Explanation
1 Equal importance Two elements contribute equally to the property
3 Moderate importance
Experience and judgment slightly favor one element over another
5 Strong importance
Experience and judgment strongly favor one element over another
7 Very strong importance
An element is strongly favored and its dominance is demonstrated in practice
9 Extreme importance
The evidence favoring one element over another is of the highest possible order of affirmation
2,4,6,8 Intermediate values between two adjacent degrees of importance Compromise is need between two judgments
• Remember that the element that appears in the left hand column is always
compared with the element appearing in the top row
• For example if technological criteria is 4 times more important than economic
criteria, put 4 in the appropriate box and if economic criteria is 3 time less
important than risk criteria put 1/3 in the appropriate box as shown in the table
below:
Technological Economic Risk
Technological 1 4
Economic 1 1/3
Risk 1

155
1) Please fill the table below with the degree of importance in order to fulfill a real
time project progress tracking
2) Please fill the table below with the degree of importance in order to fulfill the
technological importance
Technical
Requirement
Skills
Accuracy Rugged
Characteristic
Screen
dimension
Battery
life
Weight
including
Battery
Writing
Ability
Software
Accommodation
Wireless
Connection
Speed
Technical
Requirement
Skills 1
Accuracy 1
Rugged Characteristic
1
Screen
dimension 1
Battery life 1
Weight
including
Battery
1
Writing Ability 1
Software
Accommodation 1
Wireless
Connection
Speed
1
3) Please fill the table below with the degree of importance in order to fulfill the
economical importance
Initial
Investment
Operating
Cost
Saving in
Labor
Quality
Improvement
Initial
Investment 1
Operating
Cost 1
Saving in
Labor 1
Quality
Improvement 1
Technological Economic Risk
Technological 1
Economic 1
Risk 1
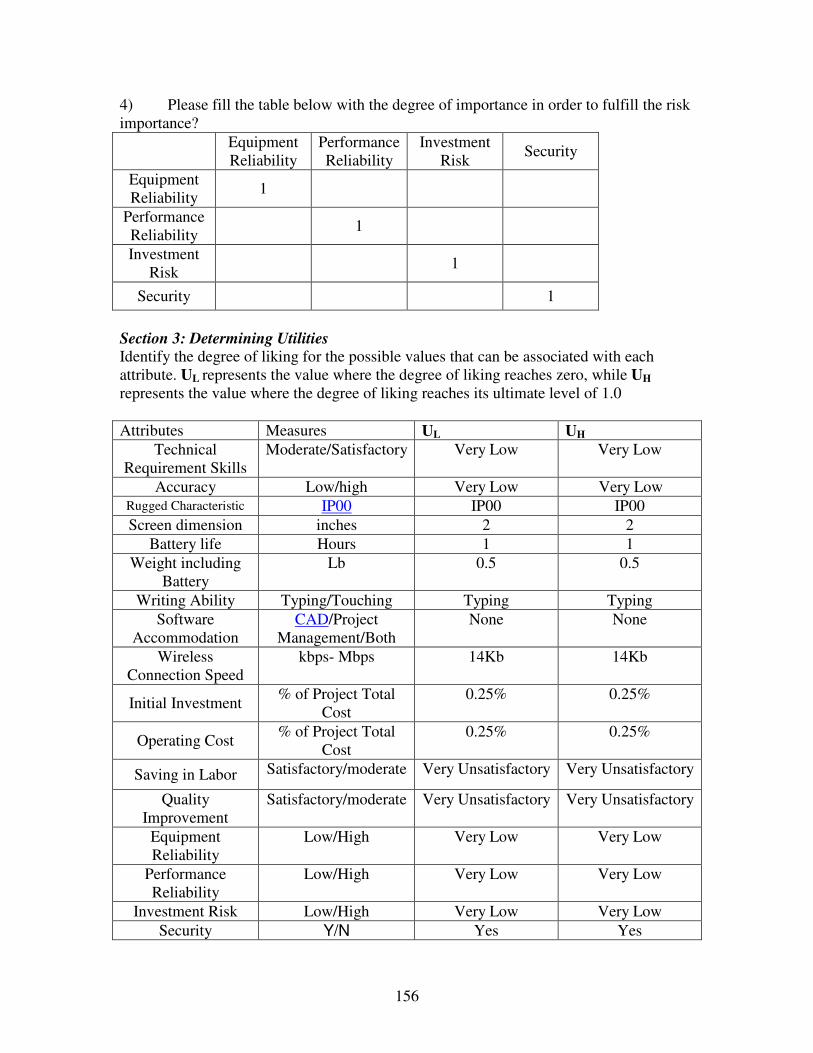
156
4) Please fill the table below with the degree of importance in order to fulfill the risk
importance?
Equipment
Reliability
Performance
Reliability
Investment
Risk Security
Equipment
Reliability 1
Performance
Reliability 1
Investment
Risk 1
Security 1
Section 3: Determining Utilities
Identify the degree of liking for the possible values that can be associated with each
attribute. UL represents the value where the degree of liking reaches zero, while UH
represents the value where the degree of liking reaches its ultimate level of 1.0
Attributes Measures UL UH
Technical
Requirement Skills
Moderate/Satisfactory Very Low Very Low
Accuracy Low/high Very Low Very Low Rugged Characteristic IP00 IP00 IP00
Screen dimension inches 2 2
Battery life Hours 1 1
Weight including
Battery
Lb 0.5 0.5
Writing Ability Typing/Touching Typing Typing
Software
Accommodation
CAD/Project
Management/Both
None None
Wireless
Connection Speed
kbps- Mbps 14Kb 14Kb
Initial Investment % of Project Total
Cost
0.25% 0.25%
Operating Cost % of Project Total
Cost
0.25% 0.25%
Saving in Labor Satisfactory/moderate Very Unsatisfactory Very Unsatisfactory
Quality
Improvement
Satisfactory/moderate Very Unsatisfactory Very Unsatisfactory
Equipment
Reliability
Low/High Very Low Very Low
Performance
Reliability
Low/High Very Low Very Low
Investment Risk Low/High Very Low Very Low
Security Y/N Yes Yes

157
Thank you very much for your willingness to participate in this short survey. If you
are interested in receiving the final result please provide us with your information
below:
Name
Email Address
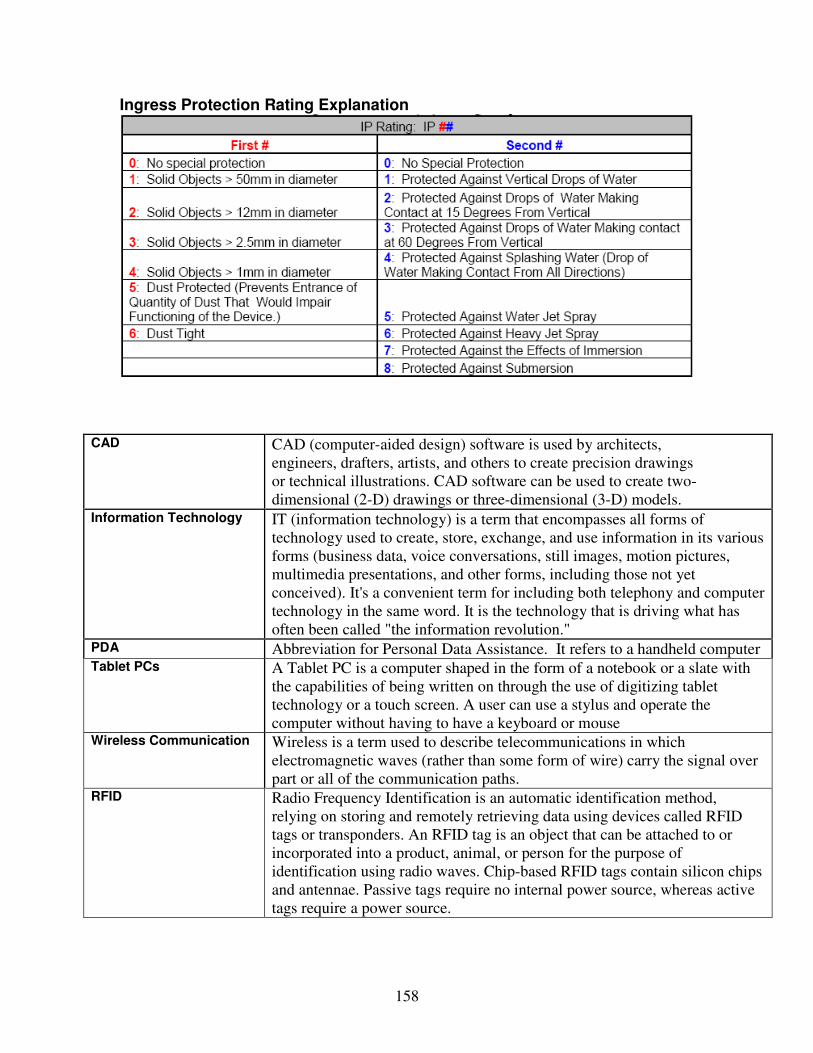
158
Ingress Protection Rating Explanation
CAD CAD (computer-aided design) software is used by architects,
engineers, drafters, artists, and others to create precision drawings
or technical illustrations. CAD software can be used to create two-
dimensional (2-D) drawings or three-dimensional (3-D) models. Information Technology IT (information technology) is a term that encompasses all forms of
technology used to create, store, exchange, and use information in its various
forms (business data, voice conversations, still images, motion pictures,
multimedia presentations, and other forms, including those not yet
conceived). It's a convenient term for including both telephony and computer
technology in the same word. It is the technology that is driving what has
often been called "the information revolution." PDA Abbreviation for Personal Data Assistance. It refers to a handheld computer Tablet PCs A Tablet PC is a computer shaped in the form of a notebook or a slate with
the capabilities of being written on through the use of digitizing tablet
technology or a touch screen. A user can use a stylus and operate the
computer without having to have a keyboard or mouse Wireless Communication Wireless is a term used to describe telecommunications in which
electromagnetic waves (rather than some form of wire) carry the signal over
part or all of the communication paths. RFID Radio Frequency Identification is an automatic identification method,
relying on storing and remotely retrieving data using devices called RFID
tags or transponders. An RFID tag is an object that can be attached to or
incorporated into a product, animal, or person for the purpose of
identification using radio waves. Chip-based RFID tags contain silicon chips
and antennae. Passive tags require no internal power source, whereas active
tags require a power source.
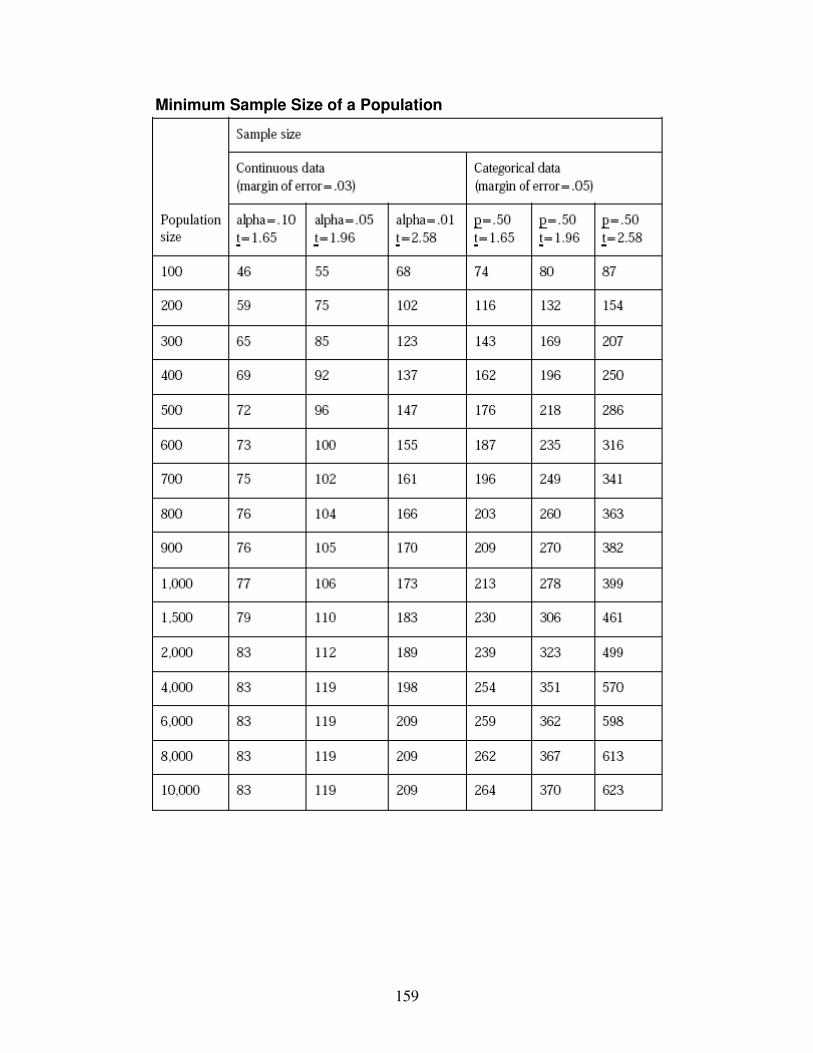
159
Minimum Sample Size of a Population
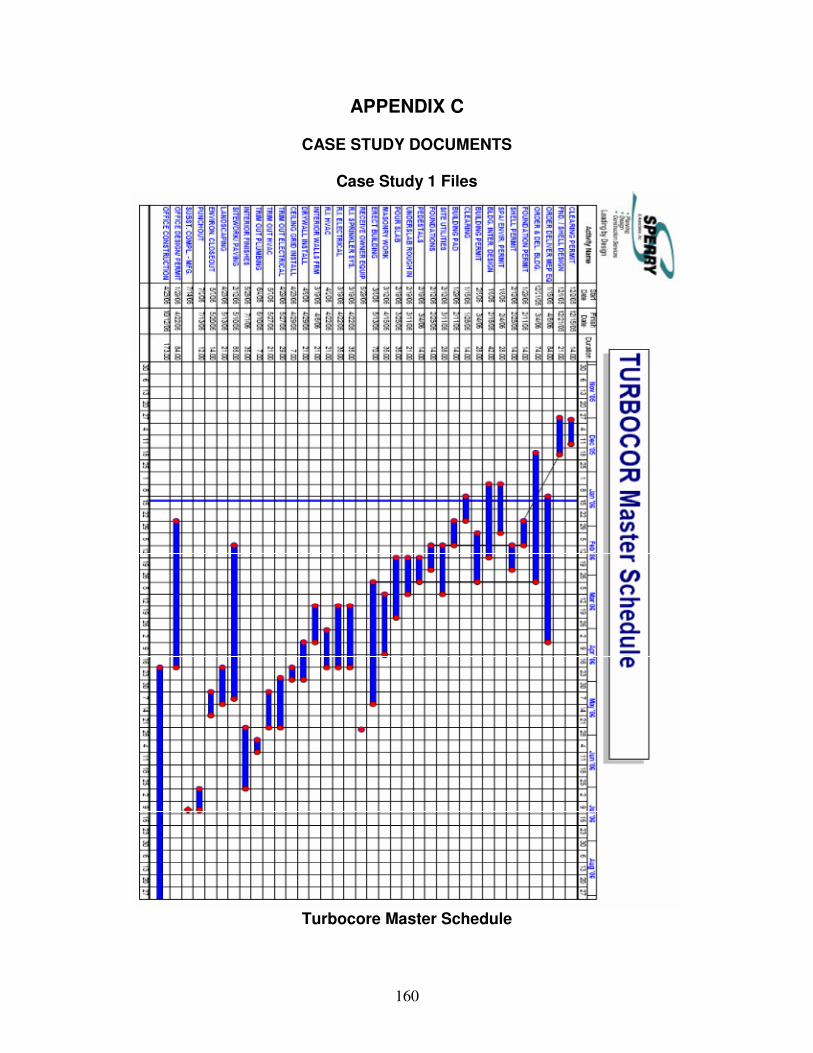
160
APPENDIX C
CASE STUDY DOCUMENTS
Case Study 1 Files
Turbocore Master Schedule
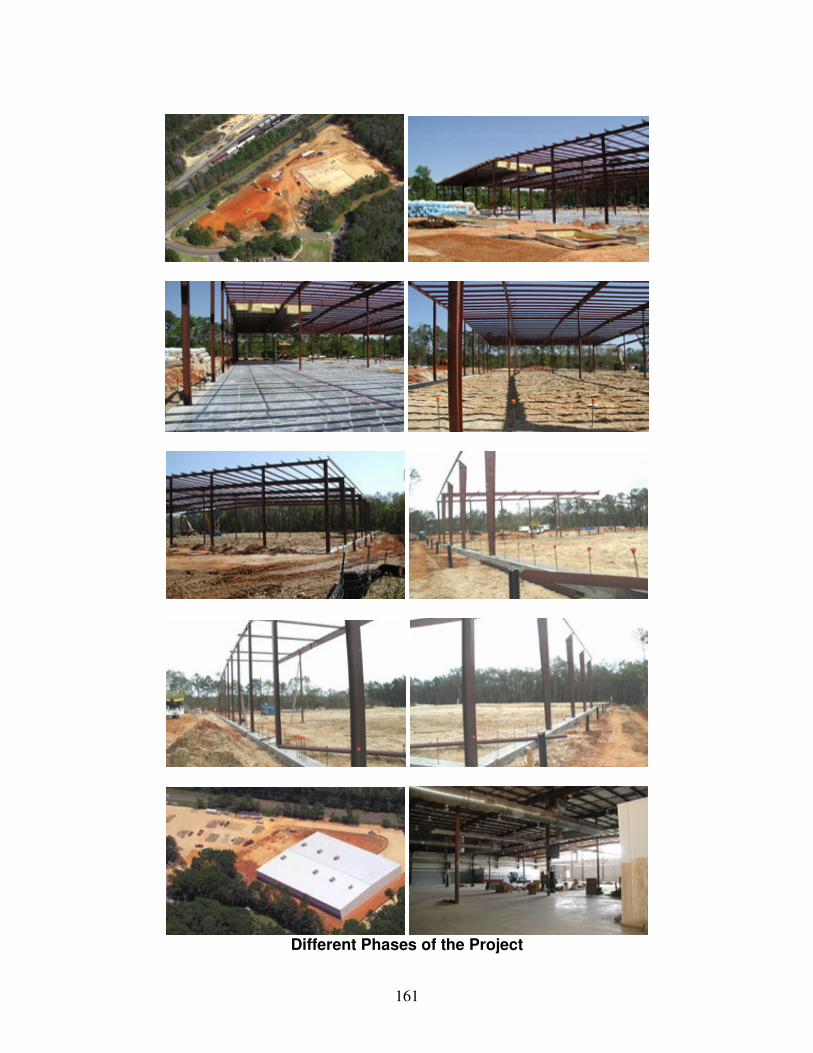
161
Different Phases of the Project

162
Pre-Engineered Building Elevation

163
Pre-Engineered Building Elevation Continue
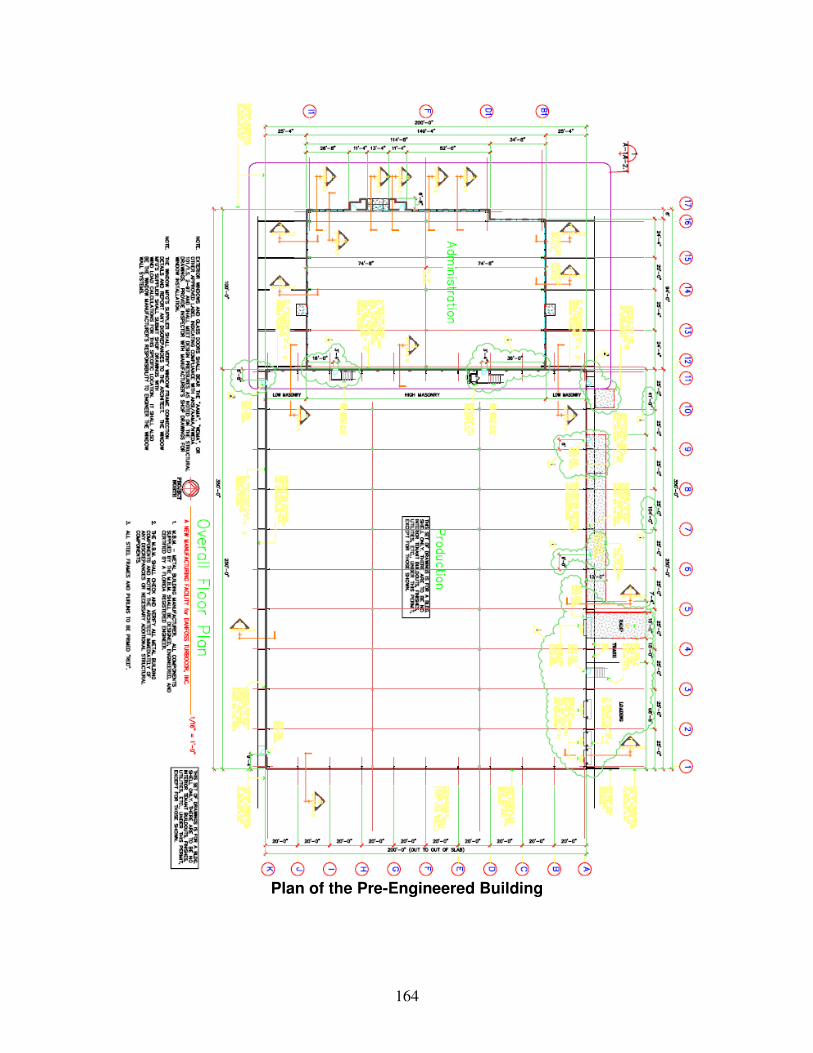
164
Plan of the Pre-Engineered Building
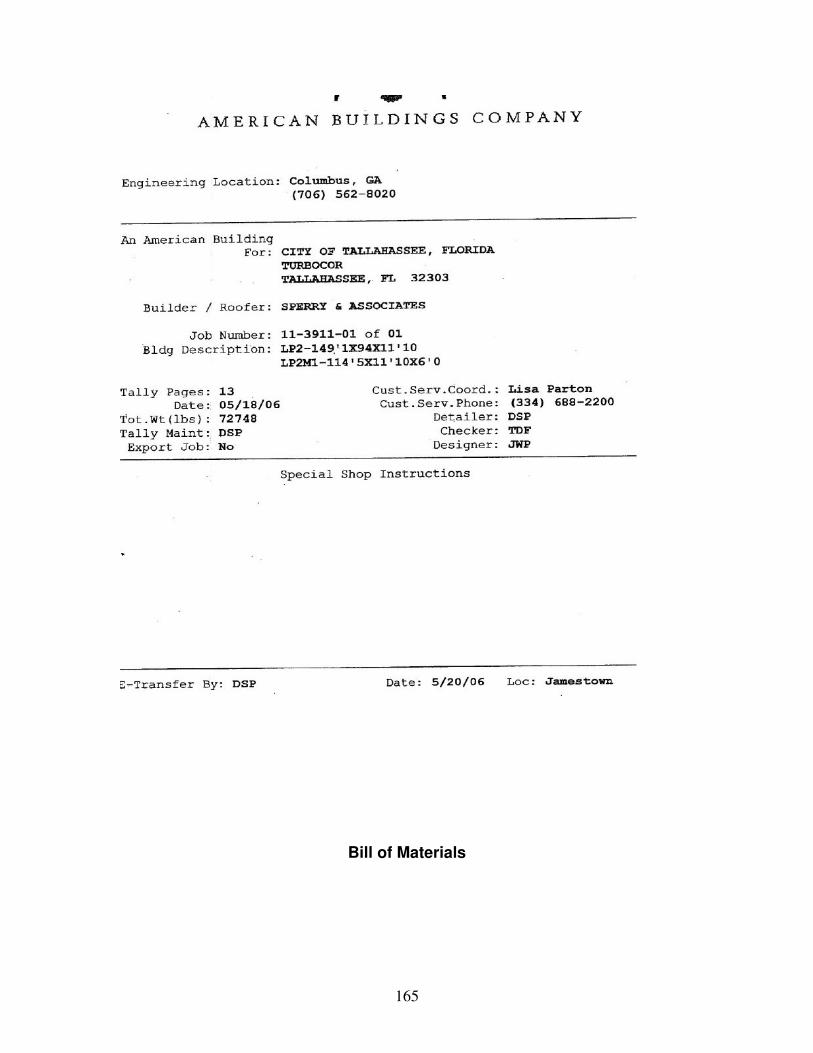
165
Bill of Materials
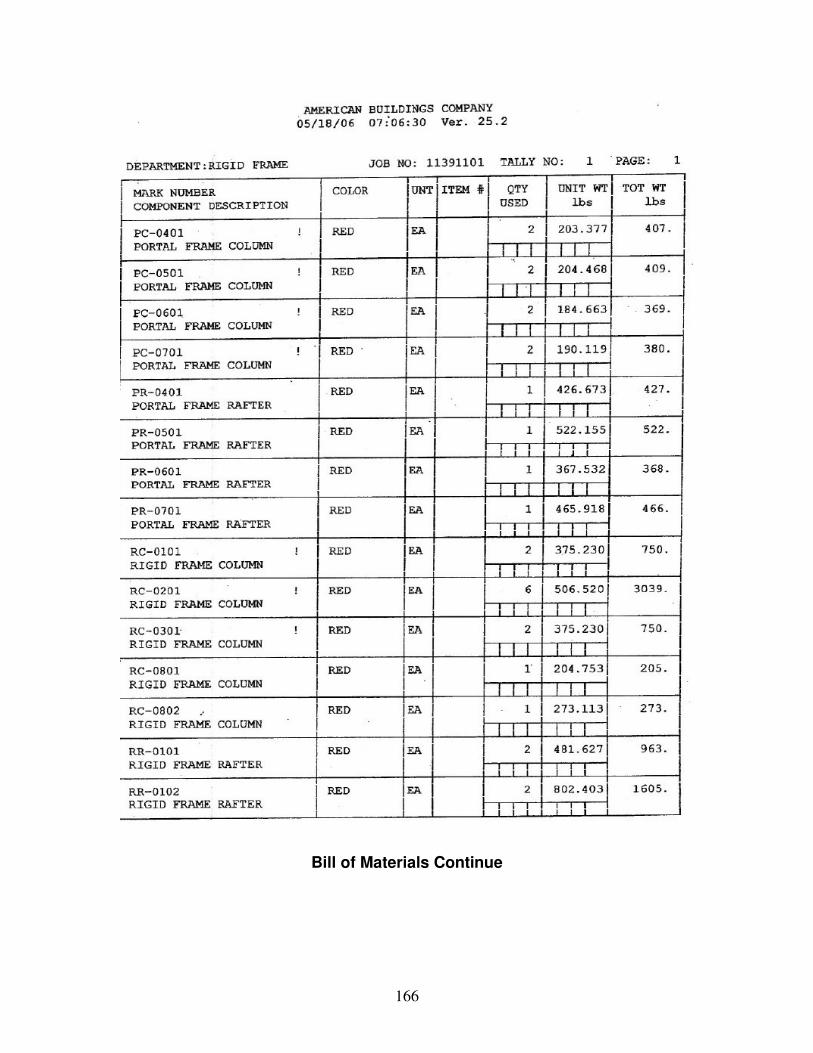
166
Bill of Materials Continue
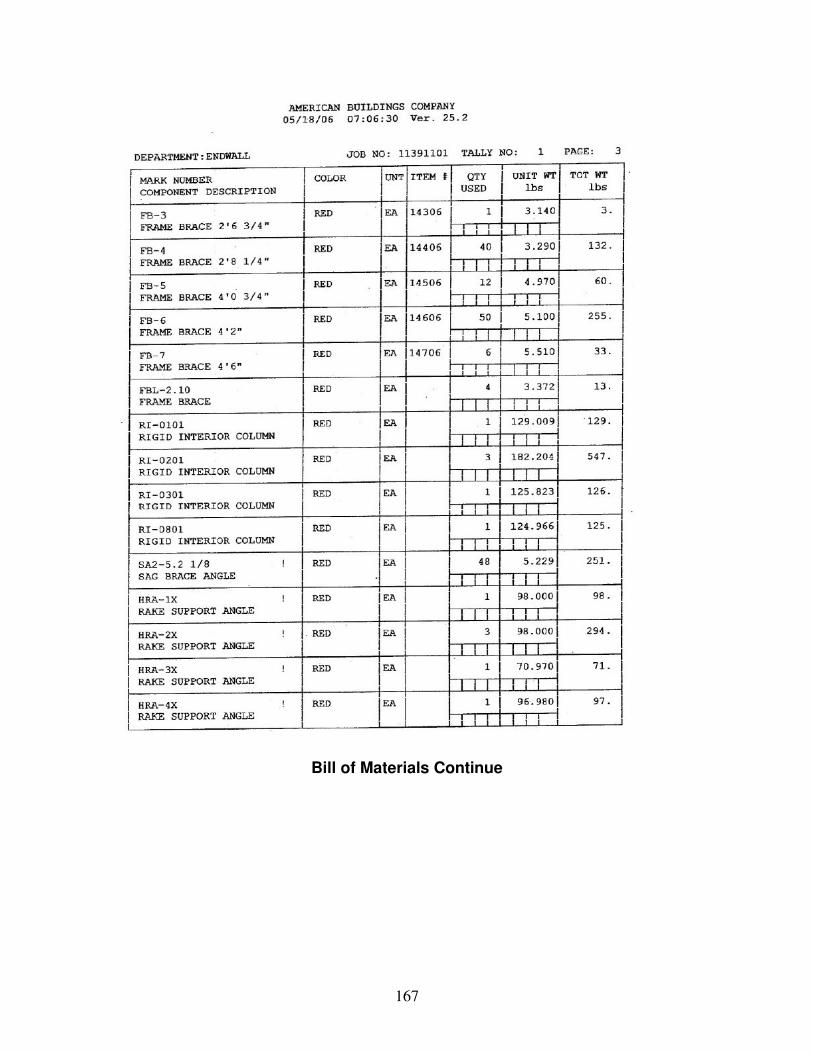
167
Bill of Materials Continue
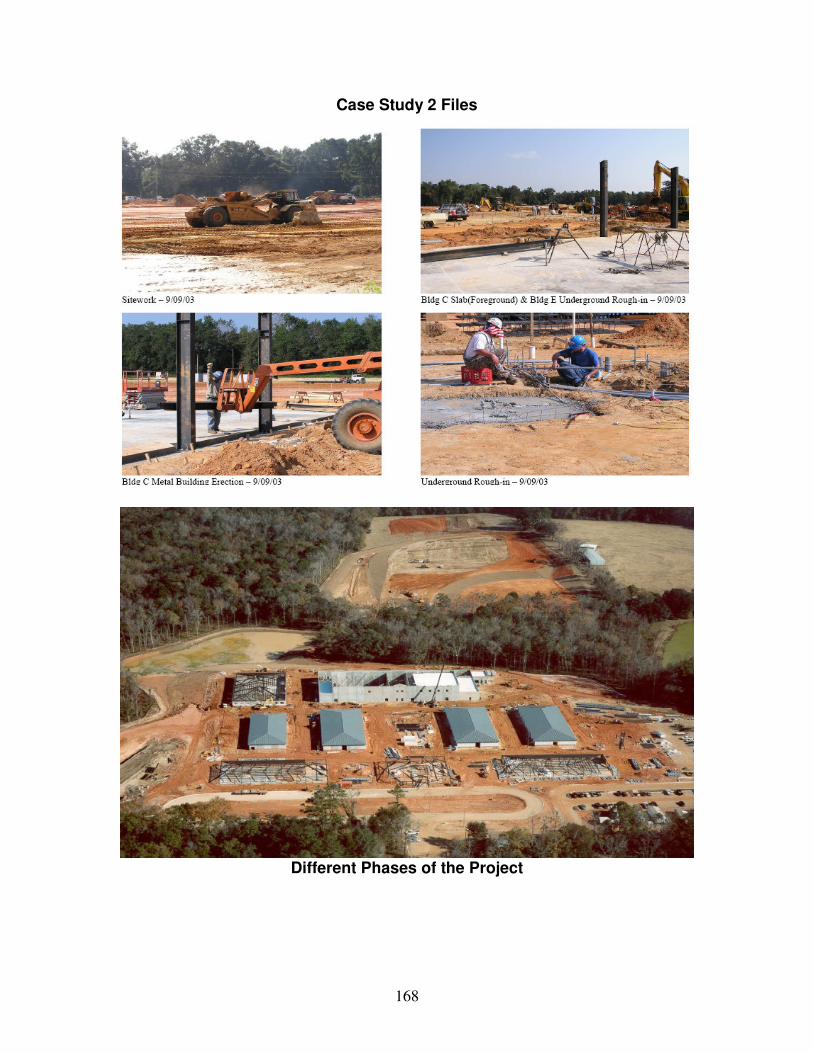
168
Case Study 2 Files
Different Phases of the Project
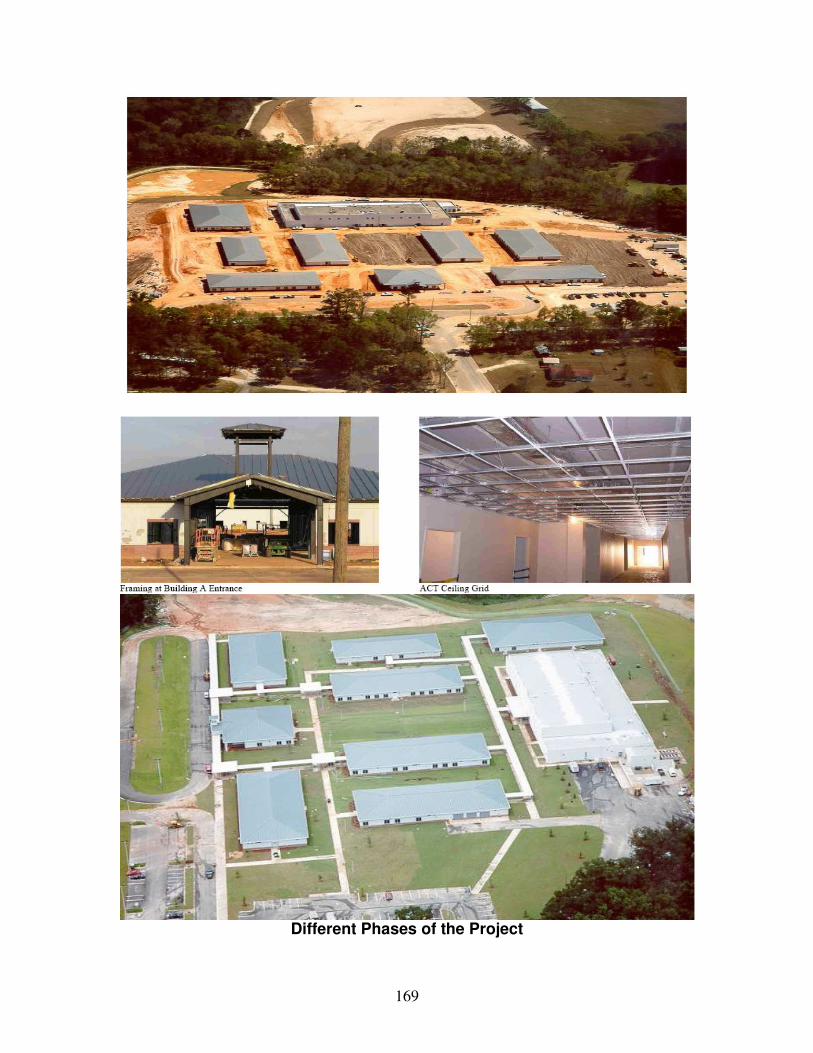
169
Different Phases of the Project

170
Master Schedule

171
Master Schedule Continue
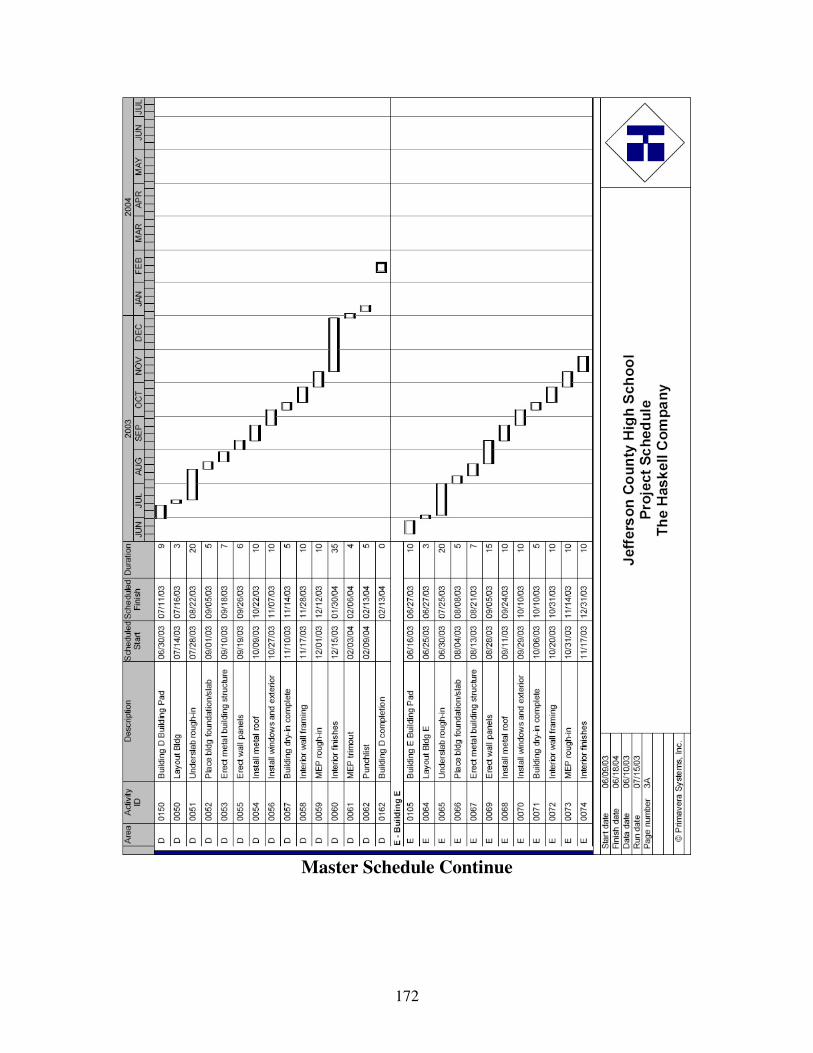
172
Master Schedule Continue
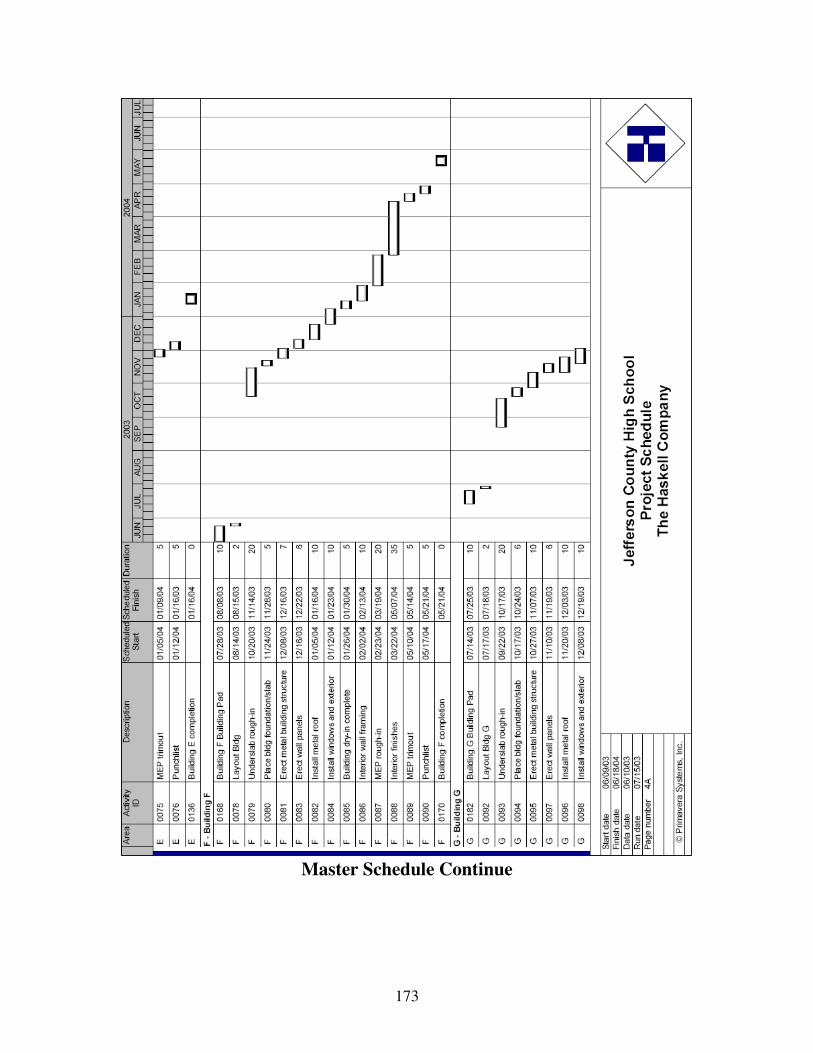
173
Master Schedule Continue
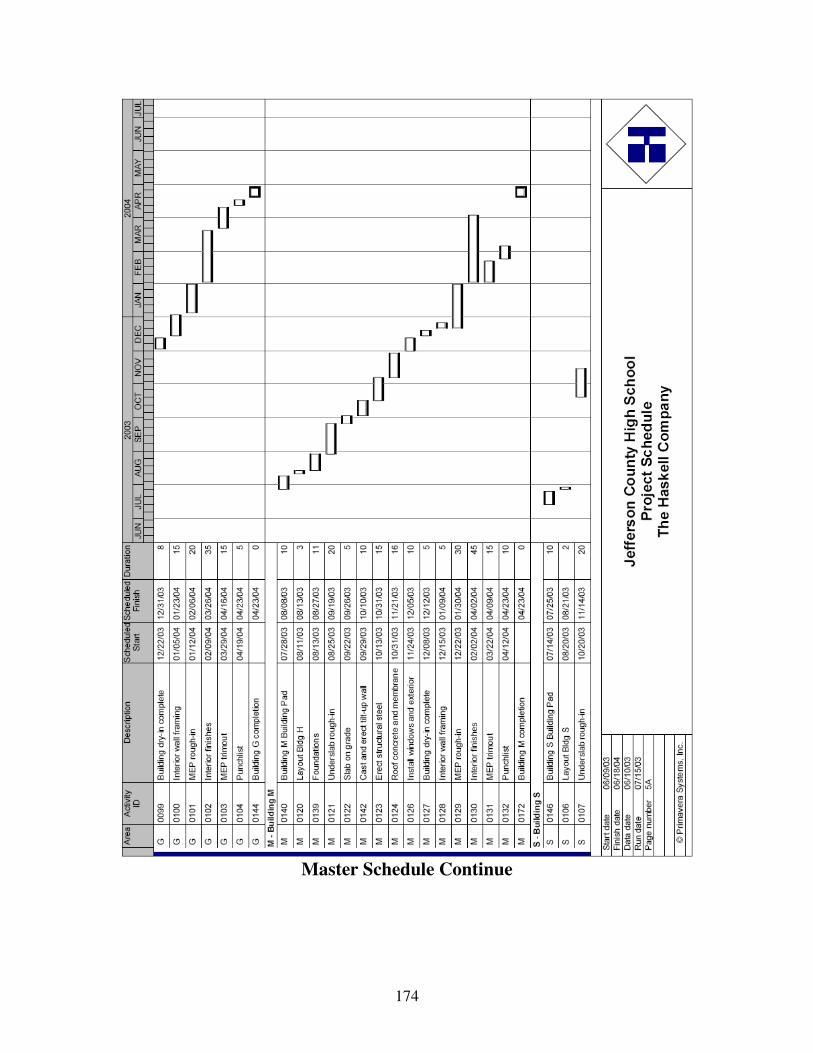
174
Master Schedule Continue
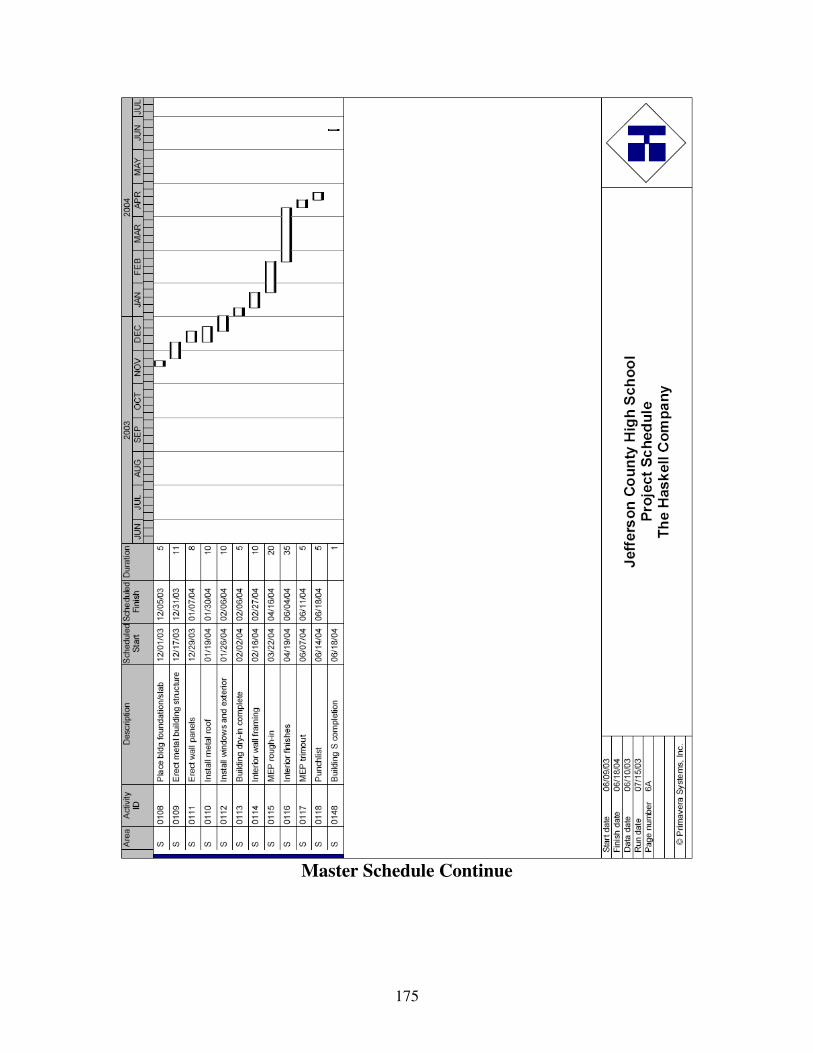
175
Master Schedule Continue
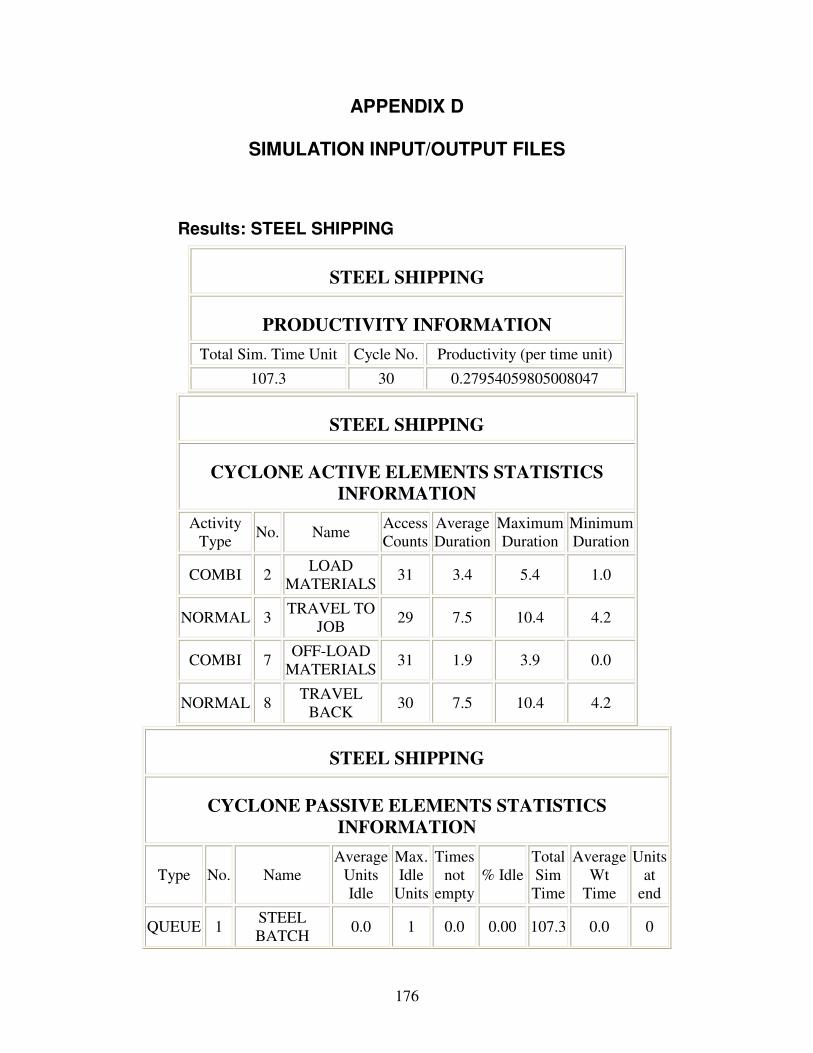
176
APPENDIX D
SIMULATION INPUT/OUTPUT FILES
Results: STEEL SHIPPING
STEEL SHIPPING
PRODUCTIVITY INFORMATION
Total Sim. Time Unit Cycle No. Productivity (per time unit)
107.3 30 0.27954059805008047
STEEL SHIPPING
CYCLONE ACTIVE ELEMENTS STATISTICS
INFORMATION
Activity
Type No. Name
Access
Counts
Average
Duration
Maximum
Duration
Minimum
Duration
COMBI 2 LOAD
MATERIALS 31 3.4 5.4 1.0
NORMAL 3 TRAVEL TO
JOB 29 7.5 10.4 4.2
COMBI 7 OFF-LOAD
MATERIALS 31 1.9 3.9 0.0
NORMAL 8 TRAVEL
BACK 30 7.5 10.4 4.2
STEEL SHIPPING
CYCLONE PASSIVE ELEMENTS STATISTICS
INFORMATION
Type No. Name
Average
Units
Idle
Max.
Idle
Units
Times
not
empty
% Idle
Total
Sim
Time
Average
Wt
Time
Units
at
end
QUEUE 1 STEEL
BATCH 0.0 1 0.0 0.00 107.3 0.0 0
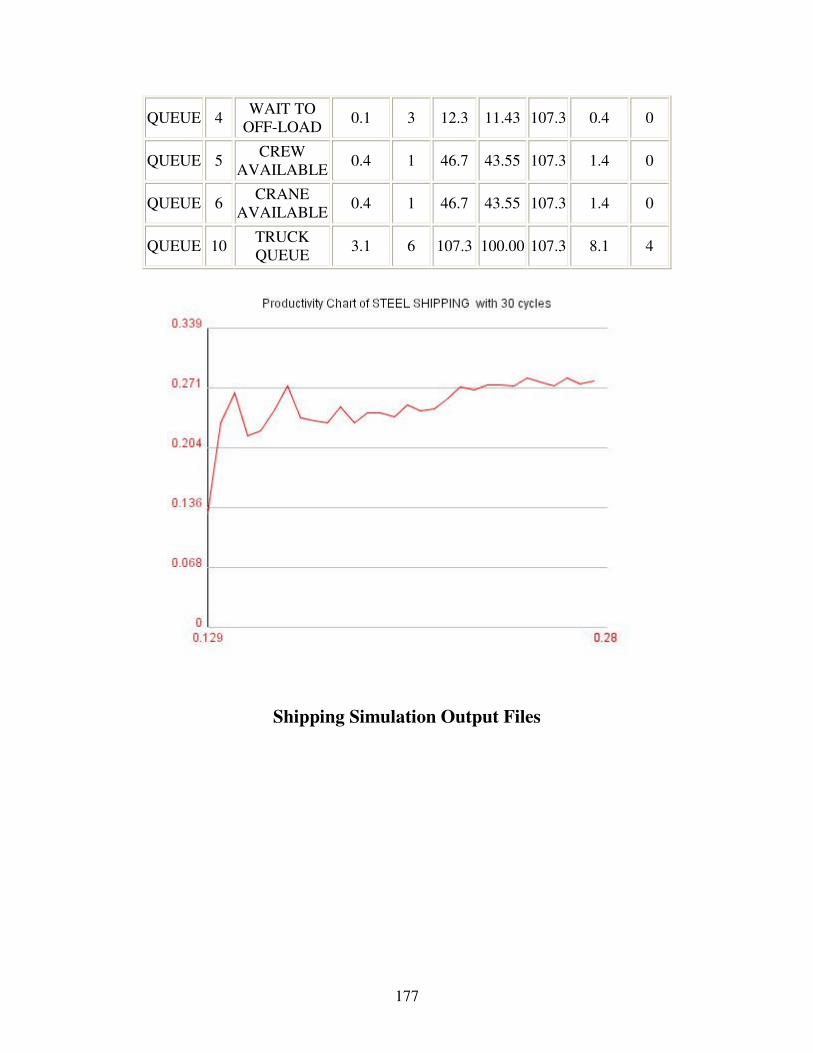
177
QUEUE 4 WAIT TO
OFF-LOAD 0.1 3 12.3 11.43 107.3 0.4 0
QUEUE 5 CREW
AVAILABLE 0.4 1 46.7 43.55 107.3 1.4 0
QUEUE 6 CRANE
AVAILABLE 0.4 1 46.7 43.55 107.3 1.4 0
QUEUE 10 TRUCK
QUEUE 3.1 6 107.3 100.00 107.3 8.1 4
Shipping Simulation Output Files
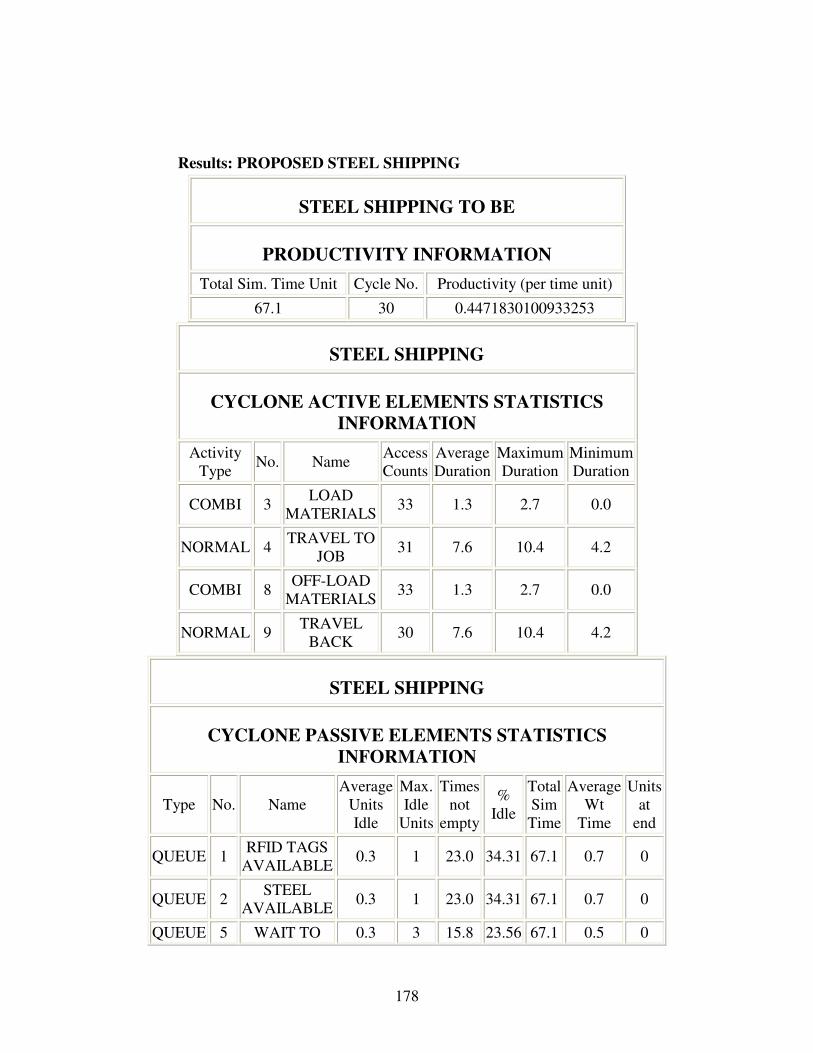
178
Results: PROPOSED STEEL SHIPPING
STEEL SHIPPING TO BE
PRODUCTIVITY INFORMATION
Total Sim. Time Unit Cycle No. Productivity (per time unit)
67.1 30 0.4471830100933253
STEEL SHIPPING
CYCLONE ACTIVE ELEMENTS STATISTICS
INFORMATION
Activity
Type No. Name
Access
Counts
Average
Duration
Maximum
Duration
Minimum
Duration
COMBI 3 LOAD
MATERIALS 33 1.3 2.7 0.0
NORMAL 4 TRAVEL TO
JOB 31 7.6 10.4 4.2
COMBI 8 OFF-LOAD
MATERIALS 33 1.3 2.7 0.0
NORMAL 9 TRAVEL
BACK 30 7.6 10.4 4.2
STEEL SHIPPING
CYCLONE PASSIVE ELEMENTS STATISTICS
INFORMATION
Type No. Name
Average
Units
Idle
Max.
Idle
Units
Times
not
empty
%
Idle
Total
Sim
Time
Average
Wt
Time
Units
at
end
QUEUE 1 RFID TAGS
AVAILABLE 0.3 1 23.0 34.31 67.1 0.7 0
QUEUE 2 STEEL
AVAILABLE 0.3 1 23.0 34.31 67.1 0.7 0
QUEUE 5 WAIT TO 0.3 3 15.8 23.56 67.1 0.5 0

179
OFF-LOAD
QUEUE 6 CREW
AVAILABLE 0.3 1 23.2 34.58 67.1 0.7 0
QUEUE 7 CRANE
AVAILABLE 0.3 1 23.2 34.58 67.1 0.7 0
QUEUE 11 TRUCK
QUEUE 0.4 6 15.6 23.26 67.1 0.6 2
Proposed Shipping Simulation Output Files
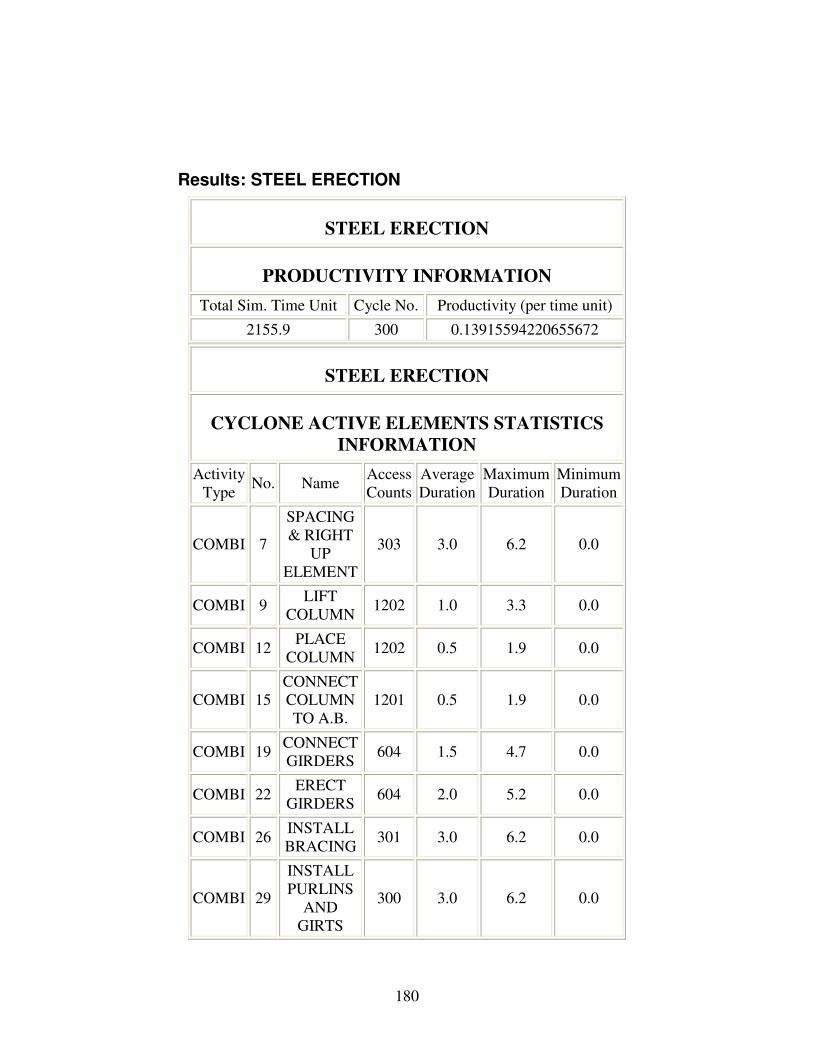
180
Results: STEEL ERECTION
STEEL ERECTION
PRODUCTIVITY INFORMATION
Total Sim. Time Unit Cycle No. Productivity (per time unit)
2155.9 300 0.13915594220655672
STEEL ERECTION
CYCLONE ACTIVE ELEMENTS STATISTICS
INFORMATION
Activity
Type No. Name
Access
Counts
Average
Duration
Maximum
Duration
Minimum
Duration
COMBI 7
SPACING
& RIGHT
UP
ELEMENT
303 3.0 6.2 0.0
COMBI 9 LIFT
COLUMN 1202 1.0 3.3 0.0
COMBI 12 PLACE
COLUMN 1202 0.5 1.9 0.0
COMBI 15
CONNECT
COLUMN
TO A.B.
1201 0.5 1.9 0.0
COMBI 19 CONNECT
GIRDERS 604 1.5 4.7 0.0
COMBI 22 ERECT
GIRDERS 604 2.0 5.2 0.0
COMBI 26 INSTALL
BRACING 301 3.0 6.2 0.0
COMBI 29
INSTALL
PURLINS
AND
GIRTS
300 3.0 6.2 0.0
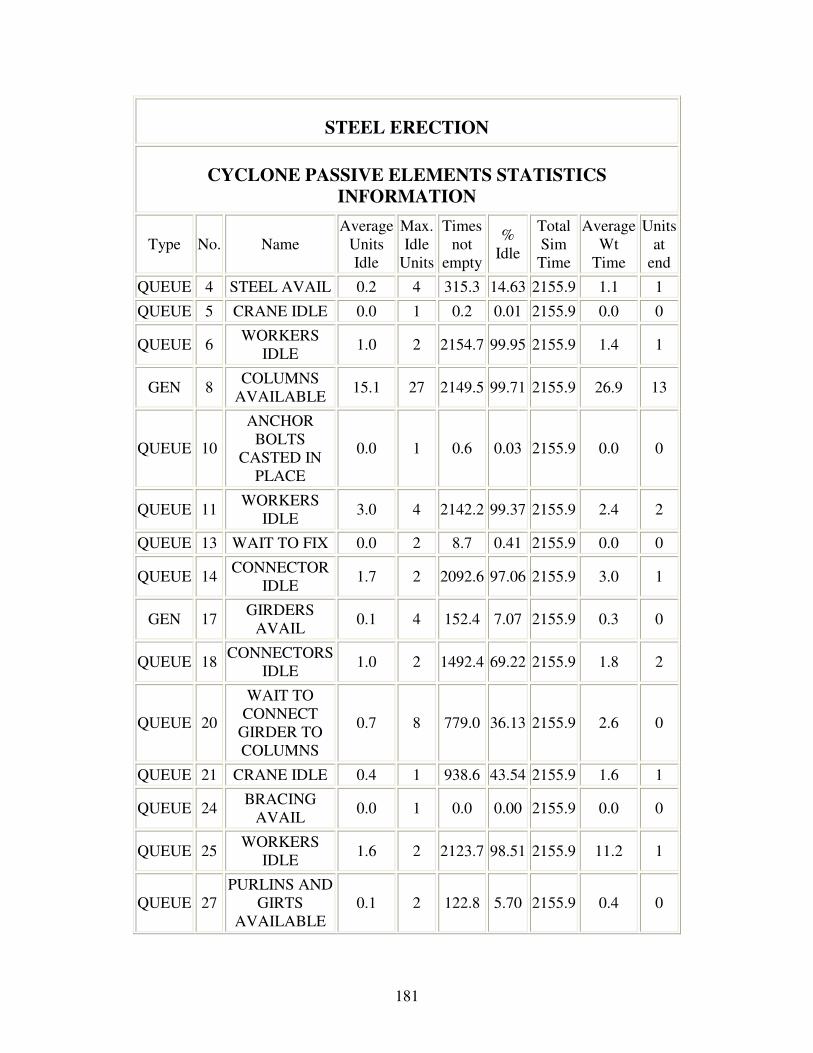
181
STEEL ERECTION
CYCLONE PASSIVE ELEMENTS STATISTICS
INFORMATION
Type No. Name
Average
Units
Idle
Max.
Idle
Units
Times
not
empty
%
Idle
Total
Sim
Time
Average
Wt
Time
Units
at
end
QUEUE 4 STEEL AVAIL 0.2 4 315.3 14.63 2155.9 1.1 1
QUEUE 5 CRANE IDLE 0.0 1 0.2 0.01 2155.9 0.0 0
QUEUE 6 WORKERS
IDLE 1.0 2 2154.7 99.95 2155.9 1.4 1
GEN 8 COLUMNS
AVAILABLE 15.1 27 2149.5 99.71 2155.9 26.9 13
QUEUE 10
ANCHOR
BOLTS
CASTED IN
PLACE
0.0 1 0.6 0.03 2155.9 0.0 0
QUEUE 11 WORKERS
IDLE 3.0 4 2142.2 99.37 2155.9 2.4 2
QUEUE 13 WAIT TO FIX 0.0 2 8.7 0.41 2155.9 0.0 0
QUEUE 14 CONNECTOR
IDLE 1.7 2 2092.6 97.06 2155.9 3.0 1
GEN 17 GIRDERS
AVAIL 0.1 4 152.4 7.07 2155.9 0.3 0
QUEUE 18 CONNECTORS
IDLE 1.0 2 1492.4 69.22 2155.9 1.8 2
QUEUE 20
WAIT TO
CONNECT
GIRDER TO
COLUMNS
0.7 8 779.0 36.13 2155.9 2.6 0
QUEUE 21 CRANE IDLE 0.4 1 938.6 43.54 2155.9 1.6 1
QUEUE 24 BRACING
AVAIL 0.0 1 0.0 0.00 2155.9 0.0 0
QUEUE 25 WORKERS
IDLE 1.6 2 2123.7 98.51 2155.9 11.2 1
QUEUE 27
PURLINS AND
GIRTS
AVAILABLE
0.1 2 122.8 5.70 2155.9 0.4 0
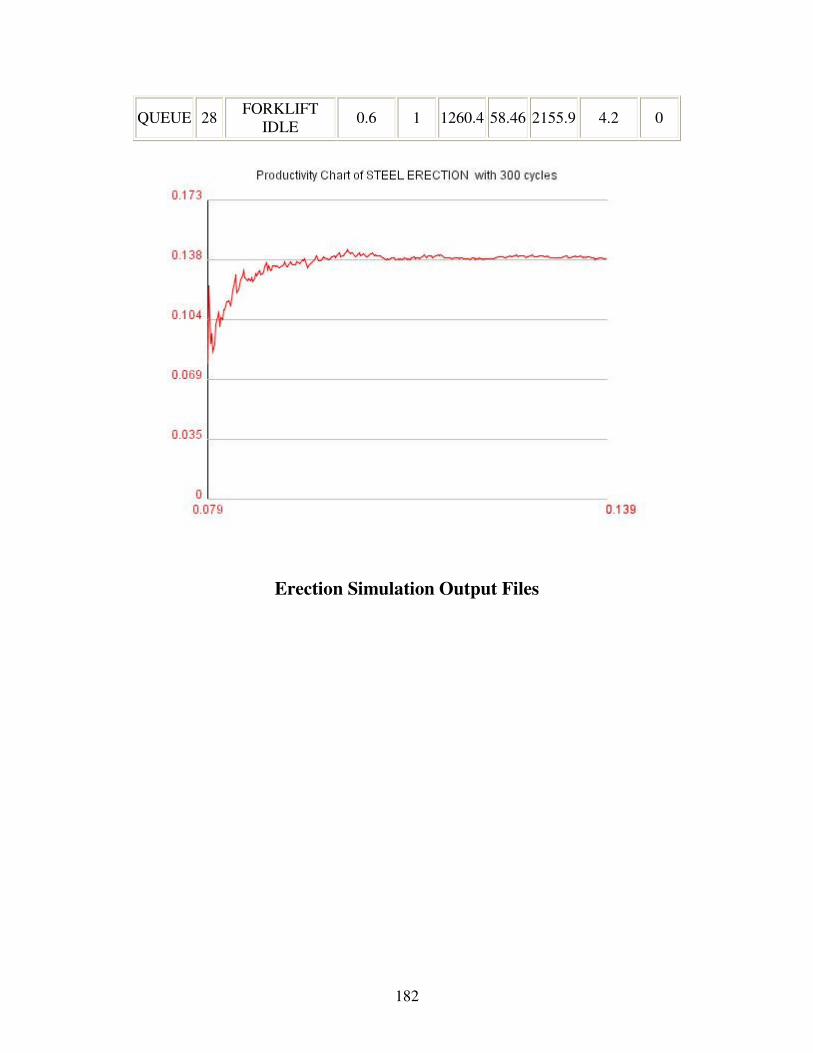
182
QUEUE 28 FORKLIFT
IDLE 0.6 1 1260.4 58.46 2155.9 4.2 0
Erection Simulation Output Files
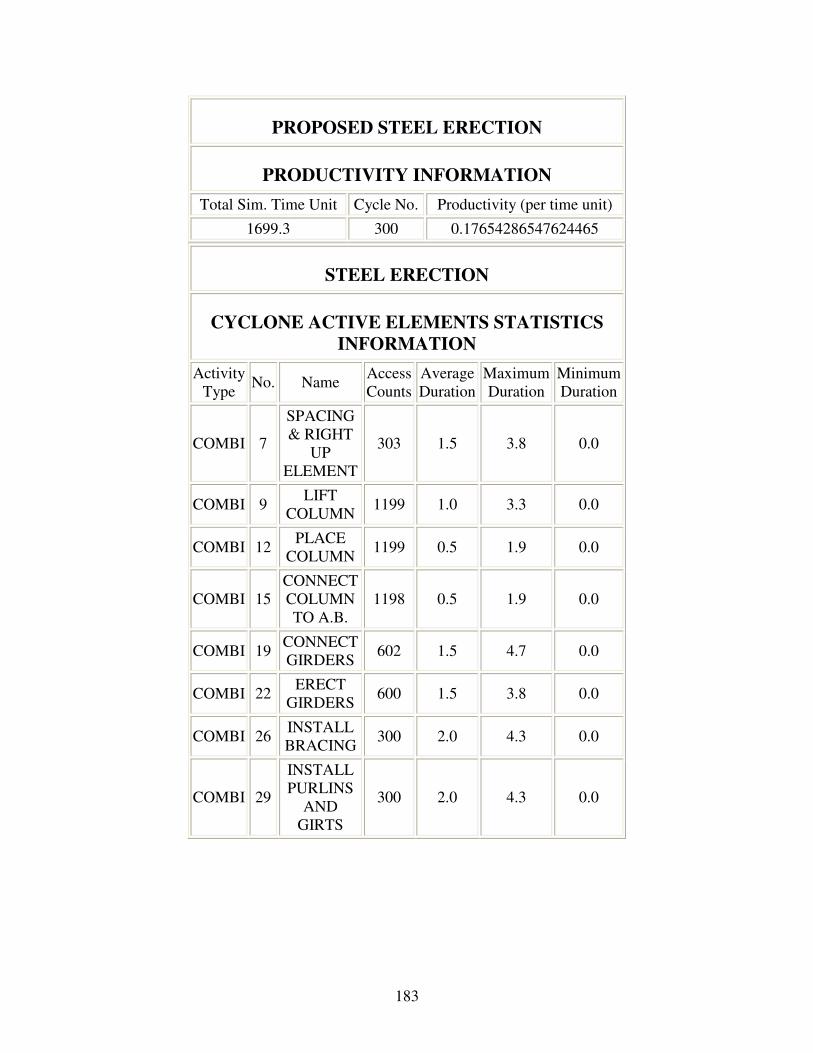
183
PROPOSED STEEL ERECTION
PRODUCTIVITY INFORMATION
Total Sim. Time Unit Cycle No. Productivity (per time unit)
1699.3 300 0.17654286547624465
STEEL ERECTION
CYCLONE ACTIVE ELEMENTS STATISTICS
INFORMATION
Activity
Type No. Name
Access
Counts
Average
Duration
Maximum
Duration
Minimum
Duration
COMBI 7
SPACING
& RIGHT
UP
ELEMENT
303 1.5 3.8 0.0
COMBI 9 LIFT
COLUMN 1199 1.0 3.3 0.0
COMBI 12 PLACE
COLUMN 1199 0.5 1.9 0.0
COMBI 15
CONNECT
COLUMN
TO A.B.
1198 0.5 1.9 0.0
COMBI 19 CONNECT
GIRDERS 602 1.5 4.7 0.0
COMBI 22 ERECT
GIRDERS 600 1.5 3.8 0.0
COMBI 26 INSTALL
BRACING 300 2.0 4.3 0.0
COMBI 29
INSTALL
PURLINS
AND
GIRTS
300 2.0 4.3 0.0

184
STEEL ERECTION
CYCLONE PASSIVE ELEMENTS STATISTICS
INFORMATION
Type No. Name
Average
Units
Idle
Max.
Idle
Units
Times
not
empty
%
Idle
Total
Sim
Time
Average
Wt
Time
Units
at
end
QUEUE 4 STEEL AVAIL 0.1 4 237.3 13.96 1699.3 0.8 1
QUEUE 5 CRANE IDLE 0.0 1 0.0 0.00 1699.3 0.0 0
QUEUE 6 WORKERS
IDLE 1.0 2 1698.5 99.95 1699.3 1.1 1
GEN 8 COLUMNS
AVAILABLE 16.4 27 1698.5 99.95 1699.3 23.1 16
QUEUE 10
ANCHOR
BOLTS
CASTED IN
PLACE
0.0 1 0.7 0.04 1699.3 0.0 0
QUEUE 11 WORKERS
IDLE 2.9 4 1689.1 99.40 1699.3 1.8 3
QUEUE 13 COLUMN
PLACED 0.0 2 10.0 0.59 1699.3 0.0 0
QUEUE 14 CONNECTOR
IDLE 1.6 2 1634.9 96.21 1699.3 2.3 1
GEN 17 GIRDERS
AVAIL 0.1 4 119.9 7.06 1699.3 0.2 0
QUEUE 18 CONNECTORS
IDLE 0.9 2 1071.6 63.06 1699.3 1.3 1
QUEUE 20 GIRDER
CONNECTED 0.5 8 502.1 29.55 1699.3 1.4 1
QUEUE 21 CRANE IDLE 0.5 1 791.9 46.60 1699.3 1.3 0
QUEUE 24 BRACING
AVAIL 0.0 1 0.0 0.00 1699.3 0.0 0
QUEUE 25 WORKERS
IDLE 1.6 2 1679.9 98.86 1699.3 9.2 2
QUEUE 27
PURLINS AND
GIRTS
AVAILABLE
0.0 2 50.5 2.97 1699.3 0.2 0
QUEUE 28 FORKLIFT 0.6 1 1102.4 64.87 1699.3 3.7 1
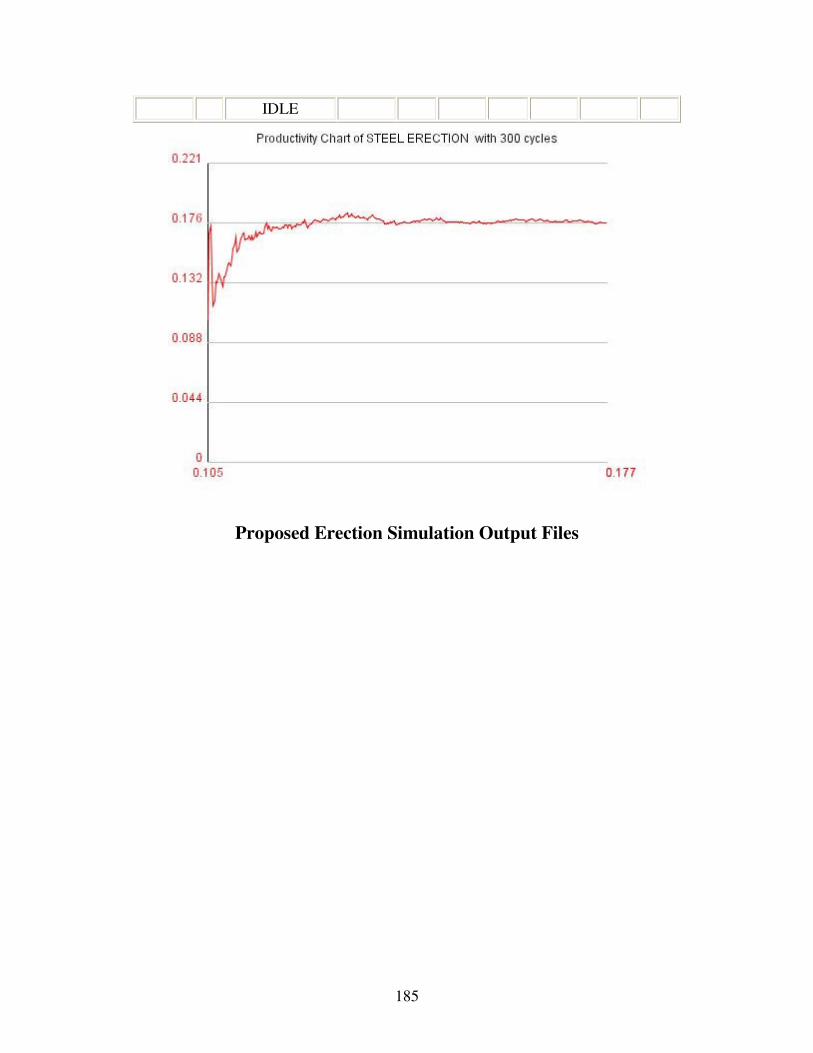
185
IDLE
Proposed Erection Simulation Output Files

186
Input Files
NAME STEEL SHIPPING LENGTH 1000 CYCLES 30
NETWORK INPUT
1 QUE 'STEEL BATCH'
2 COM SET 1 'LOAD MATERIALS' FOL 1 3 PRE 1 10
3 NOR 'TRAVEL TO JOB' SET 2 FOL 4
4 QUE 'WAIT TO OFF-LOAD'
5 QUE 'CREW AVAILABLE'
6 QUE 'CRANE AVAILABLE'
7 COM SET 3 'OFF-LOAD MATERIALS' FOL 5 6 8 PRE 4 5 6
8 NOR 'TRAVEL BACK' SET 4 FOL 9
9 FUN COU FOL 10 QUA 1
10 QUE 'TRUCK QUEUE'
DURATION INPUT
SET 1 NOR 3 1
SET 2 NOR 7 2
SET 3 NOR 1.5 1
SET 4 NOR 7 2
RESOURCE INPUT
1 'STEEL BATCH' AT 1
3 'TRUCK' AT 4
1 'CREW' AT 5
1 'CRANE' AT 6
6 'TRUCKS' AT 10
ENDDATA
Shipping Input Model
NAME STEEL ERECTION LENGTH 2000000 CYCLE 300
NETWORK INPUT
4 QUE 'STEEL AVAIL'
5 QUE 'CRANE IDLE'
6 QUE 'WORKERS IDLE'
7 COM 'SPACING & RIGHT UP ELEMENT' SET 6 PRE 4 5 6 FOL 5 6 8
8 QUE 'COLUMNS AVAILABLE' GEN 4
9 COM 'LIFT COLUMN' SET 9 PRE 5 6 8 FOL 5 6 10
10 QUE 'ANCHOR BOLTS CASTED IN PLACE'
11 QUE 'WORKERS IDLE'
12 COM 'PLACE COLUMN' SET 12 PRE 10 11 FOL 11 13
13 QUE 'WAIT TO FIX'
14 QUE 'CONNECTOR IDLE'
15 COM 'CONNECT COLUMN TO A.B.' SET 16 PRE 11 13 14 FOL 11 14 16
16 FUN CON 4 FOL 17
17 QUE 'GIRDERS AVAIL' GEN 2
18 QUE 'CONNECTORS IDLE'

187
19 COM 'CONNECT GIRDERS' SET 18 PRE 17 18 FOL 18 20
20 QUE 'WAIT TO CONNECT GIRDER TO COLUMNS'
21 QUE 'CRANE IDLE'
22 COM 'ERECT GIRDERS' SET 22 PRE 18 20 21 FOL 18 21 23
23 FUN CON 2 FOL 24
24 QUE 'BRACING AVAIL'
25 QUE 'WORKERS IDLE'
26 COM 'INSTALL BRACING' SET 25 PRE 24 25 FOL 25 27
27 QUE 'PURLINS AND GIRTS AVAILABLE'
28 QUE 'FORKLIFT IDLE'
29 COM 'INSTALL PURLINS AND GIRTS ' SET 28 PRE 11 27 28 FOL 11 28 30
30 FUN COU FOL 4 QUA 1
DURATION INPUT
SET 6 NOR 3 1
SET 9 NOR 1 0.5
SET 12 NOR 0.5 0.2
SET 16 NOR 0.5 0.2
SET 18 NOR 1.5 1
SET 22 NOR 2 1
SET 25 NOR 3 1
SET 28 NOR 3 1
RESOURCE INPUT
4 'COLUMN' AT 4
1 'CRANE' AT 5
2 'WORKERS' AT 6
1 'COLUMN' AT 8
4 'ERECTORS' AT 11
2 'CONNECTORS' AT 14
2 'GIRDERS' AT 17
2 'CONNECTORS' AT 18
1 'CRANE' AT 21
2 'WORKERS' AT 25
1 'FORKLIFT' AT 28
ENDDATA
Erection Input Model
NAME STEEL SHIPPING LENGTH 1000 CYCLES 30
NETWORK INPUT
1 QUE 'RFID TAGS AVAILABLE'
2 QUE 'STEEL AVAILABLE'
3 COM SET 1 'LOAD MATERIALS' FOL 1 2 4 PRE 1 2 11
4 NOR 'TRAVEL TO JOB' SET 2 FOL 5
5 QUE 'WAIT TO OFF-LOAD'
6 QUE 'CREW AVAILABLE'
7 QUE 'CRANE AVAILABLE'
8 COM SET 3 'OFF-LOAD MATERIALS' FOL 6 7 9 PRE 5 6 7
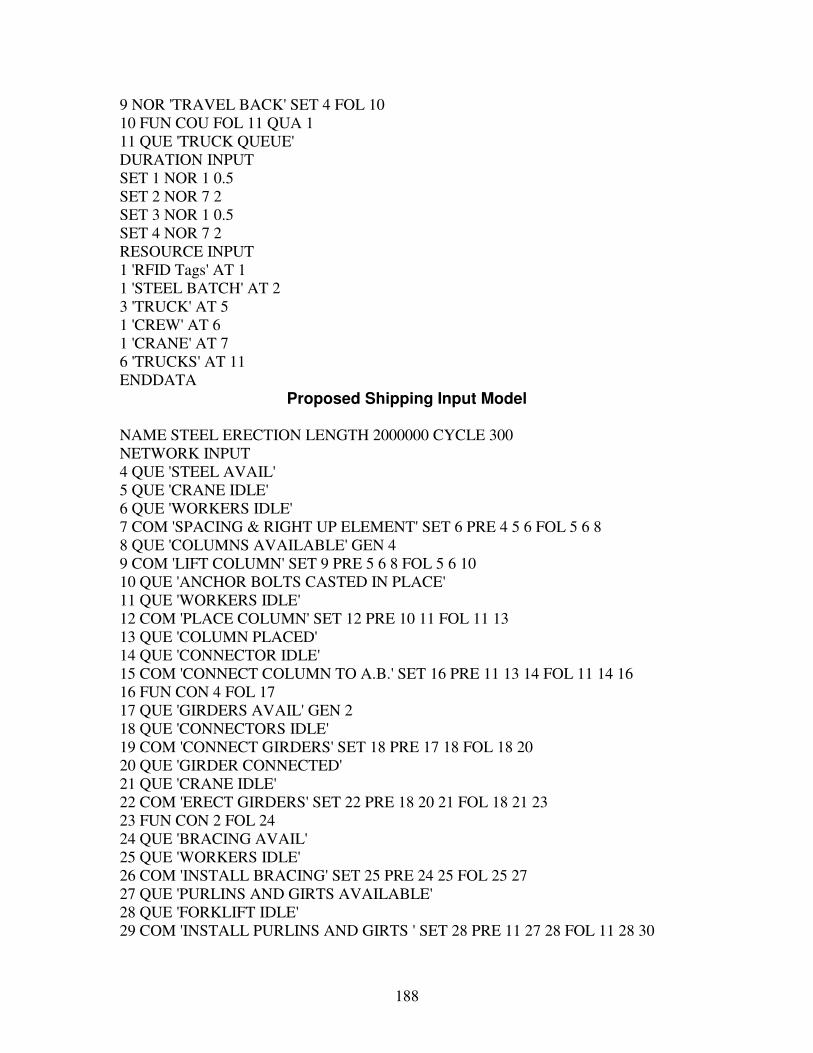
188
9 NOR 'TRAVEL BACK' SET 4 FOL 10
10 FUN COU FOL 11 QUA 1
11 QUE 'TRUCK QUEUE'
DURATION INPUT
SET 1 NOR 1 0.5
SET 2 NOR 7 2
SET 3 NOR 1 0.5
SET 4 NOR 7 2
RESOURCE INPUT
1 'RFID Tags' AT 1
1 'STEEL BATCH' AT 2
3 'TRUCK' AT 5
1 'CREW' AT 6
1 'CRANE' AT 7
6 'TRUCKS' AT 11
ENDDATA
Proposed Shipping Input Model
NAME STEEL ERECTION LENGTH 2000000 CYCLE 300
NETWORK INPUT
4 QUE 'STEEL AVAIL'
5 QUE 'CRANE IDLE'
6 QUE 'WORKERS IDLE'
7 COM 'SPACING & RIGHT UP ELEMENT' SET 6 PRE 4 5 6 FOL 5 6 8
8 QUE 'COLUMNS AVAILABLE' GEN 4
9 COM 'LIFT COLUMN' SET 9 PRE 5 6 8 FOL 5 6 10
10 QUE 'ANCHOR BOLTS CASTED IN PLACE'
11 QUE 'WORKERS IDLE'
12 COM 'PLACE COLUMN' SET 12 PRE 10 11 FOL 11 13
13 QUE 'COLUMN PLACED'
14 QUE 'CONNECTOR IDLE'
15 COM 'CONNECT COLUMN TO A.B.' SET 16 PRE 11 13 14 FOL 11 14 16
16 FUN CON 4 FOL 17
17 QUE 'GIRDERS AVAIL' GEN 2
18 QUE 'CONNECTORS IDLE'
19 COM 'CONNECT GIRDERS' SET 18 PRE 17 18 FOL 18 20
20 QUE 'GIRDER CONNECTED'
21 QUE 'CRANE IDLE'
22 COM 'ERECT GIRDERS' SET 22 PRE 18 20 21 FOL 18 21 23
23 FUN CON 2 FOL 24
24 QUE 'BRACING AVAIL'
25 QUE 'WORKERS IDLE'
26 COM 'INSTALL BRACING' SET 25 PRE 24 25 FOL 25 27
27 QUE 'PURLINS AND GIRTS AVAILABLE'
28 QUE 'FORKLIFT IDLE'
29 COM 'INSTALL PURLINS AND GIRTS ' SET 28 PRE 11 27 28 FOL 11 28 30
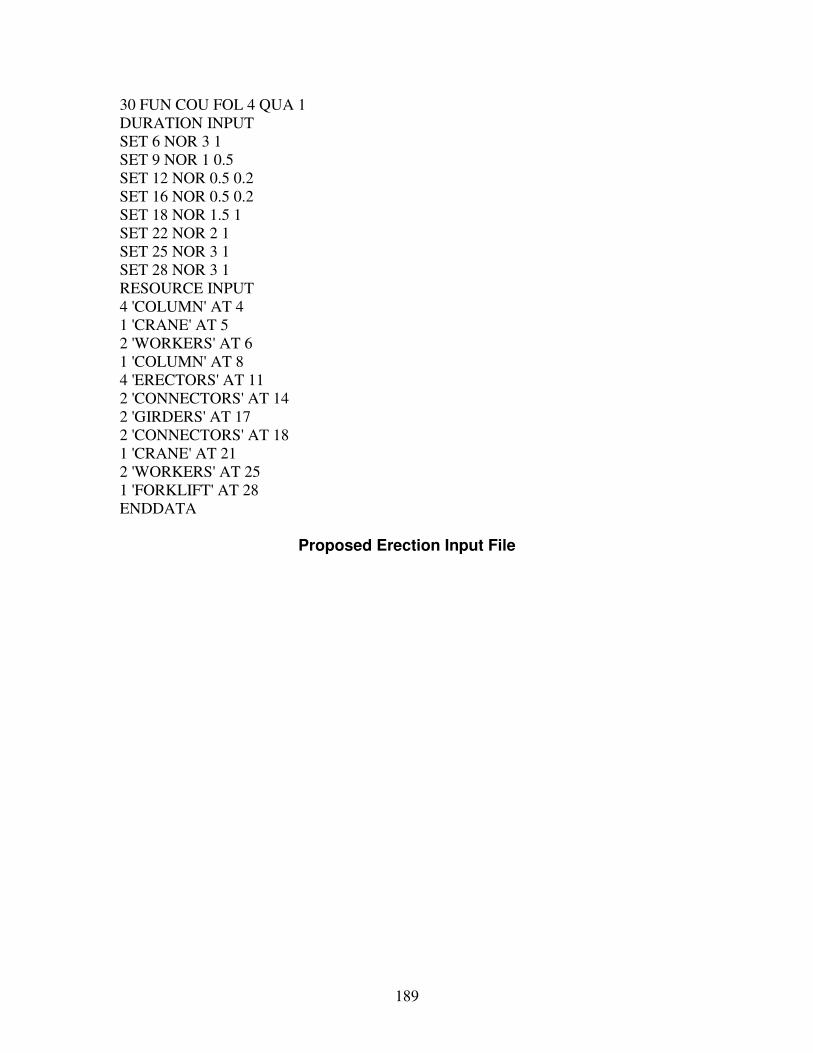
189
30 FUN COU FOL 4 QUA 1
DURATION INPUT
SET 6 NOR 3 1
SET 9 NOR 1 0.5
SET 12 NOR 0.5 0.2
SET 16 NOR 0.5 0.2
SET 18 NOR 1.5 1
SET 22 NOR 2 1
SET 25 NOR 3 1
SET 28 NOR 3 1
RESOURCE INPUT
4 'COLUMN' AT 4
1 'CRANE' AT 5
2 'WORKERS' AT 6
1 'COLUMN' AT 8
4 'ERECTORS' AT 11
2 'CONNECTORS' AT 14
2 'GIRDERS' AT 17
2 'CONNECTORS' AT 18
1 'CRANE' AT 21
2 'WORKERS' AT 25
1 'FORKLIFT' AT 28
ENDDATA
Proposed Erection Input File
190
REFERENCES
1) Abduh, M., Skibnieski, M. (2002). “Utility Assessment of Electronic Networking Technologies for Design-Build Projects”. Journal of Automation in Construction (12) 167-183
2) Abou-Zeid, A.M., “Data flow identification to support project
automation/integration and productivity,” Ph.D. Dissertation, Civil Engineering Department, University of Wisconsin-Madison, 1993.
3) Akinci, B., Boukamp, F., Gordon, C., Huber, D., Lyons, C., and Park, K.
(2005). “A formalism for utilization of sensor systems and integrated project models for active construction quality control.” Automation in Construction, 15(2), 124–138.
4) Anderson, M. R. (1993), “Barcodes bring savings”. Engineering News Record,
29, 45. 5) Association for Automation Identification and Data Capture Technologies
(AIM) (2002). Shrouds of Time: The History of RFID. http://www.aimglobal.org 6) Attia, T (2000), “The impact of communication technologies on group problem
solving performance in construction,” Ph.D. Dissertation, Department of Civil Engineering, North Carolina State University, NC 27695
7) Bairstow, L., (1998) “Bringing Computer Technology to the Job Site,”
ConstrucTECH, 1(1), http://www.constructech.com/ 8) Barlett, J. E., Kotrlik, J.W., Higgins C.C. (2001). “Organizational Research:
Determining Appropriate Sample Size in Survey Research”. Information technology, learning, and performance journal, vol.19, n. 1
9) Barringer, H. P., and Weber, D. P. (1996). “Life cycle cost tutorial”. Fifth
international conference on process plant reliability. Houston, Texas. 10) Bell, L. C. & McCulloch, B. G. (1988), “Bar code application in construction”.
Journal of Construction Engineering and Management, ASCE, 114(2), 263–78
11) Bernold, L. E. (1990), “Testing bar code technology in construction
environment”. Journal of Construction Engineering and Management, ASCE, 116(4), 643–55.
12) Bernold, L.,E., Treseler, J.,F., (1991) “Vendor analysis for best buy in
construction ,” Journal of construction engineering and management, vol.117, No. 4, pp. 645-658
191
13) Blakey, L. (1990) “Barcodes: Prescription for precision, performance, and productivity”. Journal of Construction Engineering and Management, ASCE, 116(3), 468-477.
14) Brilakis, I. (2006) “Remote Wireless Communications for Construction
Management: A Case Study”. Joint International Conference on Computing and Decision Making in Civil and Building Engineering, Montreal, Canada.
15) C. Harmon, R. Adams, Reading between the lines, Helmers Publishing, Inc.,
Pterborough, NH, 1984 16) Cheng, M. Y. & Chen, J. C. (2002), “Integrating bar code and GIS for
monitoring construction progress”. International Journal of Automation in Construction, 11(3), 23–33.
17) Cheok, G. S., Lipman, R. R., Witzgall, C., Bernal, J., and Stone, W. C.
(2000). NIST Construction Automation Program Rep. No: 4 Non- Intrusive Scanning Technology for Construction Status Determination, Building and Fire Research Laboratory, National Institute of Standards and Technology, Gaithersburg, Md
18) Chin, S., Yoon, S., Kim, Y.S., Ryu, J., Choi, C., Cho, and C.Y. (2005)
“Realtime 4D CAD + RFID Project Progress Management”. Construction Research Congress, San Diego, USA.
19) CII. (2001). “Radio Frequency Identification Tagging”. RFID Tagging
Research Team – Research Summary 151-1 20) CII. (2002).”RFID in the Construction Industry”. 21) Coe, L. (1993), Wireless Radio, A Brief History, McFarland & Company, Inc.,
North Carolina. 22) COMIT. (2003). "Current status of Mobile IT." Construction Opportunities for
Mobile IT. 23) COMIT: Construction Opportunities for Mobile IT. 2005.
http://www.comitproject.org.uk/ 24) Construction Industry Institute (CII) (1986a), Project Control for Engineering,
Publication 6-1, The Construction Industry Institute, The University of Texas at Austin, Austin, Texas.
25) Construction Industry Institute (CII) (1987a), Model Planning and Controlling
System for EPC of Industrial Projects, Publication 6-3, The Construction Industry Institute, The University of Texas at Austin, Austin, Texas.
192
26) Computer Economics, Inc. (2004) “Handheld Computer Market Projections,”
Computer Economics, Inc. website, http://www.computereconomics.com/
27) De la Garza, J.M., Howitt, I., (1998) “ Wireless communication and computing at the construction jobsite,” Journal of Automation in Construction, v. 7, n. 4, pp. 327-347
28) Dell’Isola A., J., Kirk J., S. (19950. “Life cycle costing design professionals”. McGraw-hill, New York.
29) Dhillon, B., S. (1989). “Life cycle costing”. Gordon and Breach Science Publisher, Amsterdam, Holland.
30) Durfee, Adam and Paul Goodrum. RFID, MEMS, and their Applications in the Field of Construction. White Paper. 11 January, 2002
31) El-Dirabi, T., Rasic, I. (2004). “Framework for managing life cycle cost of smart infrastructure systems”. Journal of computing in civil engineering, vol.18, n. 2, pp. 115-119
32) El-Misalami, T., Jaselskis, E., (2003). “Implementing Radio Frequency Identification in the construction process”. Journal of construction engineering and management, vol. 129, n. 6, pp. 680-688
33) El-Misalami, T., Wlaters, R., Jaselskis, E., (2006). “Construction IT Decision Making Using Multiattribute Utility Theory for Use in a Laboratory Information Management System”. Journal of construction engineering and management, (12) 1275-1283
34) Farid, F. (1993), “Editorial,” Journal of Construction Engineering and Management, ASCE, v119, n2, pp193-195
35) Garett, J. II., Sieworiek, D. P., and Smailagic, A. (1998). “Wearable computer for Bridge inspection.” Proc. Int. Symposium on wearable computers, Pittesburgh, 160-161
36) Ghanem, A., AbdelRazig, Y. (2007) “Real time Construction Project Progress
Tracking: A Utility Function Model for Technology Evaluation and Selection”, Proceeding of the Construction Research Congress, Grand Bahamas Island
37) Ghanem, A., and AbdelRazig, Y. (2006) “A Framework for Real-Time
Construction Project Progress Tracking”, Proceeding of the 10th International Conference on Engineering, Construction and Operations in Challenging Environments, Houston, Texas
193
38) Goodrum, P., Mclaren, M., Durfee, A., (2005), “The application of active radio frequency identification technology for tool tracking on construction job sites,” Journal of Automation in Construction
39) Halpin, D.W. (1985), “Financial and Cost Concepts for Construction Management”, John Wiley & Sons, Inc. New York, Ny
40) Halpin, D. W. and Riggs, L. S. (1992). “Planning and analysis of Construction
Operations”, New York: John Wiley & Sons.
41) Inglesby, T. (2000) “Handheld Computing: In the field, Handhelds Can Make a Difference,” ConstruTech, 3(4), http://www.construtech.com/
42) Ioannou, P. G. (1990) “UM-Cyclone Discrete Even Simulation System Reference Manual.” UMCEE Report No. 89-11 Civil and Environmental Engineering Department, University of Michigan
43) Jaselskis, E., Anderson, M., Jahren, C., Rodriguez, Y., Njos, S. (1995). “Radio Frequency Identification applications in construction industry”. Journal of construction engineering and management, vol. 121, n. 2, pp. 189-196
44) Johnson, K.D. and Tatum, C.B. (1993), “Technology in Marine Construction Firms,” Journal of Construction Engineering and Management, v119, n1, pp148-162
45) Karkkainen, M. (2003). “Increasing efficiency in the supply chain for short life goods using RFID tagging”. International journal of retail & distribution management, vol. 31, n. 10, pp. 529-536.
46) Kashiwagi D., Sullivan K., Greenwood D., Kovell J., and Egbu C. (2004). “Source of construction industry instability and performance problems”. Performance based studies research group, Arizona State University
47) Kidston, P., (2005) “Controlling construction project using earned value analysis”
48) Laborde M., Sanvido V., (1994). “Introducing new process technologies into construction companies”. Journal of construction engineering and management, Vol. 120, No. 3, 488-508
49) Liu, L. Y. (1995). “Digital data-collection device for construction site documentation.” Proc., 2nd Congress on Computing in Civil Engineering, Atlanta, 1287–1293.
50) Liu, L. Y. (1997). “Construction field data collection using the digital hardhat”. Proceeding of Fifth Construction Congress, Minneapolis, MN
194
51) Lundberg, E. J. & Beliveau, Y. J. (1989), “Automated lay-down yard control system—ALYC”. Journal of Construction Engineering and Management, ASCE, 115(4), 535–44.
52) McCullouch B., (1997). “Automating field data collection on construction organizations.” Proc., 5th Construction Congress: Managing Engineered Construction in Expanding Global Markets, Minneapolis, 957–963.
53) Memon, Z. A., Majid, M., Mustaffar, M. (2005) “An Automatic Project Progress Monitoring Model by Integrating Auto CAD and Digital Photos”. Proceedings of the ASCE International Conference on Computing in Civil Engineering, Cancun, Mexico.
54) Mitropoulos P., Tatum C. B., (2000). „Forces driving adoption of new information technologies“. Journal of construction engineering and management, Sept./Oct. 340-348
55) National Science Foundation, Science Resources Studies Division, Academic Sciences and Engineering Expenditures, 1, http://www.nsf.gov/cgi-bin/pubsys/browser/select.
56) Ngai, E., Cheng, T., Au, S., Lai, K. (2005). “Mobile commerce integrated with RFID technology in a container depot”
57) Nuntasunti, S. (2003). “The effect of visual based information logistics in construction”. Ph.D. dissertation, department of civil engineering, North Carolina State University, NC 27695
58) Oberlender, G.D. (2000), Project Management for Engineering and Construction, The McGraw-Hill Companies, Inc., Boston, MA
59) O’Connor, J.T. and Dodd, S.C. (2000), “Achieving integration on capital projects with enterprise resource planning systems,” Automation in Construction, Elsevier Science B.V., Amsterdam, The Netherlands, v9, n5-6, pp515-524, September
60) Oglesby, C. H., Parker, H. W., and Howell, G. A. (1989). “Productivity Improvement in Construction.” New York: McGraw-Hill.
61) Oloufa, A., Ikeda, M., Oda, H. (2003). “Situational awareness of construction equipment using GPS, wireless and web technologies”, Journal of automation in construction, vol. 12, pp. 737-748
62) Pascoe, J., Ryan, N. S., and Morse, D. R. (1998). “Human computer giraffe interaction: HCI in the field.” Workshop on human computer interaction with mobile devices, GIST technical report G98-1, University of Glasgow
195
63) Pena-Mora, F., Dwivedi, G. 2002, “Multiple device collaborative and real time
analysis system for project management in civil engineering”, Journal of computing in Civil Engineering
64) Prasad R., Ruggieri M. Editorial (2003). “Unified Global Infrastructure”, Wireless Personal Communications, Vol. 26, Nos. 2–3, pp. 89–91.
65) Poku, S., Arditi, D. (2006) “Construction Scheduling and Progress Control Using Geographical Information systems”. Journal of Computing in Civil Engineering, volume 20, (5), p 351-360
66) Rasdorf, W. J. & Herbert, M. J. (1989), “Bar codes on the job site”. ID System, 9(3), 32–36.
67) Rebolj, D., and Menzel, K. (2004). "Mobile computing in construction (Editorial)."Electronic Journal of Information Technology in Construction, 9 (Special Issue Mobile Computing in Construction), pg. 281-283.
68) Repass, K., De la Garza J., Thabet, W., (1999) “Mobile schedule tracking technology at the jobsite” In Proceedings of Construction Congress VI, Feb. 20-22
69) Salkind, N. J. (1997). Exploring research (3rd ed.). Upper Saddle River, NJ: Prentice Hall.
70) Singletary, M. (2006). “Assessing the Financial Feasibility of Implementing Wireless Technologies for Construction Management”. Master dissertation, College of Engineering, Florida State University
71) Shahid, S. and Froese T. (1998). “Project Management. Information Control Systems,” Canadian Journal of Civil. Engineering, v 25, n 4, pp 735-754
72) Sherie Winston, “Georgine to Leave Building Trades,” Engineering News-Record (31 January 2000): 14
73) Singhvi, V., Fish, W. and Terk, M. (2003) “Context-Aware Information System for Construction Site Applications” Proceedings of Construction Research Congress In Construction - Wind of Change: Integration and Innovation
74) Skibmiewski, M., and Hendrickson, C. (1990) “Automation and Robotics for Road Construction and Maintenance,” Journal of Transportation Engineering, ASCE, v116,n3
75) Skibniewski, M. J. & Wooldridge, S. C. (1992), “Robotic materials handling for automated building construction technology”. International Journal of Automation in Construction, 1(3), 251–66

196
76) Song, J., Haas, C., Caldas, C., Ergen, E., Akinci, B. (2006) “Automating the Task of Tracking the Delivery and Receipt of Fabricated Pipe Spools in Industrial Project”. Journal of Automation in Construction, 15 p 166-177
77) Stukhart, G. & Cook, K. L. (1990), “Bar code standardization in industrial
construction”. Journal of Construction Engineering and Management, ASCE, 116(3), 416–31
78) Thorpe, T., and Mead, S. (2001). “Project-specific web sites: Friend or foe?”
Journal of Construction Engineering and Management, 127(5), 406–413. 79) Tsai, M. K., Yang, J. B., and Lin, C. Y. (2007) “Integrating Wireless and
Speech Technologies for Synchronous On-Site Data Collection”. Journal of Automation in Construction, 16 p 378-391
80) Tserng, H., Dzeng, R., Lin, Y., Lin, S. (2005). “Mobile construction supply
chain management using PDA and bar codes”. Computer Aided Civil and Infrastructure Engineering, vol. 20, pp. 242-264
81) Tucker, R.L. (1988) “High Payoff Areas for Automation Applications,”
Proceedings of the 6th International Symposium on Automation and Robotics in Construction, Japan Industrial Robot Association, Tokyo, Japan, pp9-16
82) Tucker, R.L., Haas, C.T., Borcherding, J.D., Allmon E., and Goodrum, P.M.
(1999) “U.S. Construction Labor Productivity Trends, 1970-1998,” Center for Construction Industry Studies, Report No. 7, The University of Texas at Austin, Austin, Texas, March 1999
83) U.S. Census Bureau, 1997 Economic Census: Construction, Appendix A-8,
10 January 2000, www.census.gov 84) U.S. Census Bureau, 2004 Economic Census, www.census.gov 85) Ward, M. J., Thorpe, A., and Price, A. D. F. (2003). "SHERPA: Mobile
wireless data capture for piling works." Computer-Aided Civil and Infrastructure Engineering, 18, pg. 299-312.
86) Wikipedia, (2006). “WiMax”. (Available at
http://en.wikipedia.org/wiki/802.16e) 87) Wikipedia, (2006). “Wireless Mesh Network”. (Available at
http://en.wikipedia.org/wiki/Wireless_mesh_network) 88) William, Trefor P. (2003). “Applying Hand held Computers in the Construction
Industry.” Practice Periodical on Structural Design and Construction. 8.4.
197
89) Wirt, D., Showalter, W. E. & Crouch, G. (1999), “Integrating permanent equipment tracking with electronic operations and maintenance manuals, Durability of Building Material and Component”. Information Technology in Construction, vol. 4, NCR Research Press, pp. 2716–23.
90) Yagi et al., Arai, E., Arai, T. (2005). “Parts and packets unification radio frequency identification application for construction”. Journal of automation in construction, vol. 4, pp. 477-490
91) Zebra Technologies (2002). “Small labels provide big savings opportunities
for electronics manufacturers”. www.zebra.com/IS/manuf_electronics.htm 92) Zayed T. M., and Halpin, D. W. (2000) “Simulation as a Tool for Resource
Management”. Proceeding of the 2000 Winter Simulation Conference. 93) Web 1: Geier, Jim. “Defining Access Point Range Boundaries.” Wi-fi Plane
Tutorials. 27 May 2003. http://www.wifiplanet.com/tutorials/article.php/2212591
94) Web 2: http://www.technology-watch.info/ Technology Watch for the UK Construction Industry. 2004.
95) Web 3 www.product-catalog.com/scscindex.cfm 96) Web 4 www.intermec.com 97) Web 5 http://www.rfidjournal.com/article/articleprint/712/-1/1/ 98) Web 6 http://www.symbol.com/products/whitepapers/rfid_key_issues.html 99) Web 7 http://www.jhsph.edu/wireless/history.html 100) Web 8 http://www.technology-watch.info/ Technology Watch for the UK
Construction Industry. 2004. 101) Web 9 http://www.zebra.com

198
BIOGRAPHICAL SKETCH
EDUCATIONAL BACKGROUND
Ph.D. in Civil Engineering (Construction Management), Florida State University,
Tallahassee FL, (Summer 2007)
Dissertation: A Framework for Real-time Construction Project Progress Tracking
Cumulative GPA 4.0
Advisor: Dr. Yassir AbdelRazig
Areas of specialization: Wireless Technologies, Smart Chips, RFID, Bar Codes,
Scheduling and Project Control, Estimation, Project Management,
Risk Analysis.
M.S. in Civil Engineering (Construction Management), Oklahoma State University,
Stillwater, Ok 2002
Cumulative GPA 4.0
Advisor: Dr. Garold Oberlender & Dr. Rock Spencer
Graduation Project: Six Sigma in Construction
B.S. in Civil Engineering (Construction Management) Beirut Arab University,
Lebanon 2001
Cumulative GPA 3.2/4.0
Advisor: Dr. Waleed Chatila
Graduation Project: Management and Rehabilitation of an existing building
SUMMARY OF EXPERTISE
� Project Management
� Construction Estimation
� Information Technologies in Construction
� Project Control and Scheduling
� Simulation Model
� Risk Analysis
� Cost Benefit Analysis
� Applications of GIS in transportation systems

199
PROFESSIONAL CERTIFICATIONS
Registered Professional Engineer in Lebanon, June 2001
RESEARCH / PROFESSIONAL EXPERIENCE
Florida State University, Tallahassee, FL 2004-to date
Research Assistant Works involved building an Integrated Wireless Communication Model for Construction
Projects and conduct a cost benefit analysis of the model.
Oklahoma State University, Stillwater, OK, summer 2002
Research Assistant
Works involved Highways Technology, Computer Programming
Oklahoma State University, Stillwater, OK, spring 2002
Research Assistant
Work involved Computer Programming, CPM method, Linear Schedule
Arabian Construction Company (ACC), Tripoli, Lebanon, summer 2000
Internship (Site Engineer)
Supervising the construction of three buildings, providing daily reports, and ensuring
quality control
Zakhem Engineers, Beirut, Lebanon, summer 1999
Internship
Laboratory work (taking and testing specimens) of a highway project
TEACHING EXPERIENCE
Florida State University, Tallahassee, FL, summer 2006
Adjunct Instructor for EGM 3512-Engineering Mechanics
Florida State University, Tallahassee, FL, 2004 - to date
Teaching Assistant to Dr. AbdelRazig
Assisted in preparation of the course notes, homework, labs, tutoring students during
office hours
Courses assisted: CCE 4004-Construction Engineering, CEG 2202-Site Investigation,
TTE 3004-Transportation Engineering, EGM 3512-Engineering Mechanics

200
WORK EXPERIENCE
Zamil Steel Khobar, Saudi Arabia, 2003-2004
Project & Sales Engineer
Design, Estimate, and Schedule of Pre-Engineered Steel building. Assist in creation of
project proposals by securing project specifications from clients and communicating the
same to design teams. Liaison with client during proposal/quotation stage until projects
are awarded. Provide support to client and design team during project implementation.
PROFESSIONAL DEVELOPMENT ACTIVITIES
University-wide teaching Conference (spring 2006)
Workshop & Seminars
o Using Group Activities
o Advances PowerPoint
o Mentor Training Workshop
o Using Feedback to Improve Teaching Skills
o Leading Class Discussions
o Designing New Courses
o Aligning Your Teaching Philosophy with Learning Objectives
o Developing a Learner-Centered Syllabus
o Applying Creative Thinking Techniques in the Classroom
o Cultural, Instructional, and Language Issues in the Classroom
Preparing Future Faculty (PFF)
Electronic Campus
o New Features in Blackboard
o Blackboard Uploading Content
o Advanced PowerPoint

201
o Blackboard Communication
o Blackboard Grading and Assessments
FAMU Researchers Workshop Series
o Elements of Proposal Development
o A Primer for a Successful Grant
o Do’s and Don’ts of Collaboration
PUBLICATIONS
Ghanem, A., AbdelRazig, Y.: “Real time Construction Project Progress Tracking: A
Utility Function Model for Technology Evaluation and Selection”, to be presented in the
Construction Research Congress, Grand Bahamas Island, May 2007
Ghanem, A., AbdelRazig, Y., and Mehdi, S. M.: “Evaluation of a Real Time
Construction Project Progress Tracking”, to be presented in Joint International
Conference on Construction Culture, Innovation, and Management, Dubai, UAE,
November, 2006
El-Gafy, M., Ghanem, A.: “Resource Allocation in repetitive Construction Schedules
using Ant Colony Optimization”, to be presented in Joint International Conference on
Construction Culture, Innovation, and Management, Dubai, UAE, November, 2006
Ghanem, A., Abichoux, T., and AbdelRazig, Y.: “Sprayfield Technology to Treat
Wastewater Treatment Plant Effluent”, accepted in the 3rd International Conference on
Water Resources in Mediterranean Basin, Tripoli, Lebanon, November, 2006
Ghanem, A., and AbdelRazig, Y.: “Evaluation of Wireless Technologies in
Construction”, proceeding of the International Conference on Construction and Real
Estate Management, 13th Rinker International Conference, Orlando, Florida, October,
2006
Ghanem, A., and AbdelRazig, Y.: “A Framework for Real Time Construction Project
Progress Tracking”, proceeding of the 10th International Conference on Engineering,
Construction and Operations in Challenging Environments, Houston, Texas, March, 2006
El-Gafy, M., AbdelRazig, Y., and Ghanem, A.: “Dynamic Construction Site Layout
Using Ant Colony Optimization”, proceeding of the 85th meeting of the Transportation
Research Board (TRB), Washington DC., February, 2006
202
Ghanem, A., Mehdi S., and AbdelRazig, Y.: “Risk Management in Engineering Design
Projects”, the Journal of Project Management, under review
Ghanem, A., Oberlender, G.: “Six Sigma in Construction Projects”, creative components
submitted as fulfillment of Master Degree
Ghanem, A., Chatila, W.: “Management and Rehabilitation of an Existing Building”, thesis
submitted as fulfillment of Bachelor Degree
LISTINGS
Who's who in the USA Chancellor's list, 2004-2005
AFFILIATIONS
PHI KAPPA PHI (Oklahoma Chapter) Honor Society for excelling school
achievements: Member since 2002
Tau Beta Pi (Florida Etta Chapter) Engineering Honor Society: Member since 2005
(Treasurer)
Fiatech Student Member, Involved with Smart Chips project since 2006
Congress of Graduate Students Representing College of Engineering (Chair of
housing, parking & Transportation Committee)
American Society of Civil Engineers (ASCE): Student member since 2001
Oklahoma State University Alumni Association: Member since 2003
Lebanese Engineers Syndicate: Member since 2001
Arab Cultural Association (ACA)
Editorship & Professional Services
Associated School of Construction: Reviewer for the 43rd
ASC International
Conference
Habitat for Humanity: Volunteer

203
AWARDS
The Conference Presentation Grant. Awarded by the Florida State University Office of
Graduate Studies to assist in Conference presentation, (March 2006 and October 2006).
The Dissertation Research Grant. Awarded by the Florida State University Office of
Graduate Studies to assist the research of my dissertation, October 2006.
Best Teaching Award. Nominated by the Florida State University for best Teaching
Assistant, March 2007
Copyright © 2022 FDOKUMEN