
RBS Ann Review 01-07 - AnnualReports.com
272
Make it happen rbs.com Annual Report and Accounts 2005 Profit before tax up 21% Total income up 14% Adjusted earnings per share up 8% Dividend up 25%
-
Upload
khangminh22 -
Category
Documents
-
view
3 -
download
0
Transcript of RBS Ann Review 01-07 - AnnualReports.com

Make it happenrbs.com
Annual Report and Accounts 2005
Profit beforetax up
21%
Totalincome up
14%
Adjustedearnings pershare up
8%
Dividend up
25%

Make it happen
The Royal Bank of Scotland was
founded in Edinburgh in 1727.
By 1900 it had over 130 branches in Scotland andhad opened its first branch in London. During the1920s and 30s it established a significant presencein England through the acquisition of Glyn, Mills andWilliams Deacon’s. By 1970, having merged with theNational Commercial Bank of Scotland, it was theleading bank in Scotland, with over 700 branches.
During the 1980s RBS diversified its business,pioneering the direct distribution of motor insurancethrough the establishment of Direct Line in 1985,and entering US banking in 1988 with the acquisitionof Citizens Bank of Rhode Island.
In the 1990s RBS re-engineered its retail bankingbusiness, removing processing activities frombranches, and segmenting the Bank’s customersand associated service propositions. Over the sameperiod RBS developed and implemented its multi-brand, multiple channel strategy, launching DirectBanking in 1994, and the UK’s first comprehensiveinternet banking service in 1997, together withfinancial services operations in partnership withVirgin and Tesco in the same year.
In 2000 RBS successfully completed the £21 billionacquisition of NatWest, the biggest takeover inBritish banking history, creating a Group with over 20 million customers, £400 billion assets and 110,000 employees worldwide. The NatWestintegration was completed successfully in February2003, with the original targets for cost savings andrevenue benefits exceeded.
Since the acquisition of NatWest, RBS has continuedto grow the business through the combination ofstrong organic growth and acquisitions. In the US,Citizens’ footprint has been expanded from NewEngland into the Mid-Atlantic states through theacquisition of the Mellon Bank regional franchise,and into the Midwest through the acquisition ofCharter One, completed in 2004. Citizens is nowone of the top ten US commercial bankingorganisations by deposits. In insurance, theacquisition of Churchill broadened the product anddistribution channel capabilities of Direct Line andcreated the second largest general insurer in theUK. In corporate banking, RBS has entered the US,Continental European and Asia Pacific markets.
In August 2005, RBS signed strategic investment and co-operation agreements with Bank of China,the second largest bank in China.

Report and accounts
51 Section 01Operating and financial review
107 Section 02Governance
133 Section 03Financial statements
231 Section 04Additional information
259 Section 05Shareholder information
Gro
up r
evie
wD
ivis
iona
l rev
iew
Cor
pora
tere
spon
sibi
lity
Gov
erna
nce
and
finan
cial
rev
iew
01
Highlights of 2005
Contents02 Financial highlights
04 Chairman’s statement
06 Group Chief Executive’s review
08 Group profile
10 Divisional profile
Divisional review
14 Corporate Markets
22 Retail Markets
30 Ulster Bank Group
32 Citizens
38 RBS Insurance
42 Manufacturing
Corporate responsibility
46 Corporate responsibility
47 2005 activities
48 Community investment
Annual Report and Accounts 2005
� Group operating profit up 16% to £8.3 billion
� Profit before tax up 21% to £7.9 billion
� Total dividend for the year of 72.5p per share, up 25%
� Share repurchase of up to £1 billion
� Income up 14% to £25.6 billion
� Cost:income ratio, excluding acquisitions,41.8% unchanged from 2004
� Adjusted earnings per ordinary share up 8% to 175.9p
The financial comparisons are with 2004 pro forma results which have been prepared on the basis set out on page 57.

Fin
anci
al h
ighl
ight
sFinancial highlights
Adjusted earnings per share (pence)
The Group’s total income grew by 14% to £25,569 million in 2005.
Group operating profit increased by 16%to £8,251 million in 2005.
Group profit before tax rose by 21%to £7,936 million in 2005.
Profit before tax(£m)
2001 2002 2003 2004
5,778
6,540
7,068
8,101
2001 2002 2003 20042001 2002 2003 2004 2004pro forma
2005
14,558
17,016
19,281
22,754 22,515
25,569
UK GAAP IFRS UK GAAP IFRS UK GAAP IFRS
2004pro forma
2005
7,108
8,251
2004*pro forma
2005*
45.344.2
42.640.8
41.8 41.8
2001 2002 2003 2004
127.9
146.3
157.2
172.5
2001 2002 2003 2004
4,252
4,852
6,076
6,917
UK GAAP IFRS UK GAAP IFRS
2004pro forma
2005
6,543
7,936
2004pro forma
2005
162.6
175.9
2001 2002 2003 2004 2005
38.0
43.7
50.3
58.0
72.5
Income (£m)
Adjusted cost:income ratio(%)
Group operating profit – profit before tax,purchased intangibles amortisation,integration costs and net gain on sale ofstrategic investments and subsidiaries (£m)
Earnings per share increased by 8% to175.9p for 2005, adjusted for purchasedintangibles amortisation, integrationcosts and net gain on sale of strategicinvestments and subsidiaries, and in2001 – 2003 for the AVS dividend.
Dividend per ordinary share (pence)
The directors have recommended a final dividend of 53.1p per ordinaryshare which, when added to the interimdividend of 19.4p, makes a total for 2005of 72.5p, an increase of 25%.
*excluding acquisitions and at constant exchange rates
The Group’s cost:income ratio, excludingacquisitions and at constant exchange rates,was 41.8%. The cost:income ratio is calculatedexcluding purchased intangibles amortisation,integration costs and net gain on sale ofstrategic investments and subsidiaries, andafter netting operating lease depreciationagainst rental income.
� Group operating profit up 16%� Profit before tax up 21%� Adjusted earnings per ordinary share up 8% to 175.9p� Total dividend for the year up 25% to 72.5p per share
02
The annual accounts have, for the first time, been prepared in accordance with International Financial Reporting Standards. Certain standards relating to financialinstruments were not adopted until 1 January 2005. As explained on page 58, the Group has provided comparative information on a pro forma basis that includes the estimated effect of these standards for the year ended 31 December 2004.

Gro
up r
evie
w
03
2001 2002 2003 2004 2005
47.8
43.2
48.8
55.6 56.1
Market capitalisation(£bn)
The Group’s market capitalisation at 31 December 2005 was £56.1 billioncompared with £55.6 billion a year earlier.
Geographic analysis of incomedetermined by location of customer
Geographic analysis of operatingprofit determined by location ofcustomer
Geographic analysis:Employees
%
UK 75
US 19
Europe 5
Rest of World 1
75
19
5
1
Geographic analysis:Operating profit
%
UK 58
US 28
Europe 13
Rest of World 1
58
28
13
1
Geographic analysis:Income
%
UK 73
US 18
Europe 8
Rest of World 1
73
18
8
1
0
20
40
60
80
120
100
140
160
FTSE 100RBS
2000 20052004
Source: Datastream
200320022001
Index
Total shareholder return performance
The performance graph illustrates theperformance of the company over the pastfive years in terms of total shareholderreturn compared with that of the companiescomprising the FTSE 100 index. This indexhas been selected because it represents across-section of leading UK companies.The total shareholder return for thecompany and the FTSE 100 have beenrebased to 100 for 2000.
2005

04
Cha
irm
an’s
sta
tem
ent
2005 was another year of excellentperformance by the Group. Increasedearnings and strong capital generationhave enabled us to continue investing for organic growth, as well as raise ourdividend significantly and embark on aprogramme of repurchasing our shares.
Financial performanceIn 2005, Group operating profit increased by 16% to £8,251million (2004 – £7,108 million). Total income grew by 14% to£25,569 million (2004 – £22,515 million), while operating expensesalso grew by 14% to £11,298 million (2004 – £9,871 million).
We have maintained a high level of efficiency across theGroup, reaping the benefits of scale from our Manufacturingoperations while continuing to invest in our businesses.
All acquisition integration benefits are being achieved at orahead of expectations. The integration of Churchill, acquired in September 2003, was completed in September 2005 withbenefits in excess of those forecast at acquisition.
CapitalOur first use of additional capital is to invest in profitablebusiness growth, and we see many opportunities to do soacross the Group. Whilst having no plans for large acquisitions,we will continue to evaluate good opportunities to supplementorganic growth, using strict investment criteria and leveragingour proven integration capabilities. In addition, it has alwaysbeen our plan to be capital generative beyond the developmentneeds of our businesses, and our 2005 results represent animportant milestone in that ambition as we are able to returncapital to shareholders in the form of an increased dividendand share buyback.
Staff profit sharingReflecting the strong financial performance of the Group,we are delighted that our staff are once again sharing in oursuccess with a profit share for the year at 10% of basic salaries.
Board of directorsThe past year has seen significant change for our Board.I am delighted that Sir Tom McKillop agreed to join last year as our Deputy Chairman. Subject to his election, he will takeover from me as Chairman at the Annual General Meeting on28 April 2006. As chief executive of AstraZeneca PLC heenjoyed wide experience of operating successfully in differentinternational markets and his comprehensive understanding of financial services from his previous directorship of a majorbank will be of great value to us.
We bade farewell to Sir Angus Grossart, Lord Vallance, EileenMackay and Iain Robertson as non-executive directors, andFred Watt as Group Finance Director. Their contribution duringa period of dramatic growth and change for RBS has beenhighly appreciated, as has their experience of the economiccycle and its impact on business. On behalf of the Board I would like to pay tribute to their loyal service and express our thanks for the valued contribution they have made.
Over the same period we have welcomed the appointment oftwo new non-executive directors, Janis Kong and, with effectfrom 1 March 2006, Bill Friedrich. I am confident that, with theirdifferent backgrounds and experience across our key markets,both will greatly strengthen the Board as we embark on ournext phase of growth.
On 1 February 2006 Guy Whittaker joined the Board as GroupFinance Director. He is an experienced senior executive of thehighest calibre, with great breadth of international experiencein financial services. On 14 February 2006 the Group was alsovery pleased to announce the appointments of Johnny Cameron,Chief Executive of Corporate Markets, and Mark Fisher, ChiefExecutive of Manufacturing, as executive directors, with effectfrom 1 March 2006.
OutlookLeaving an organisation which has been so important to me for the last 18 years will mark a milestone for me also, but I am pleased to be doing so at a time when the business is in such good shape. We have demonstrated our ability to generate capital consistently from a stable and diverseplatform and I believe we are well placed to take advantage of the many opportunities that lie ahead, for the benefit of ourshareholders, customers and staff.
Sir George Mathewson, Chairman
Chairman’s statement

Gro
up r
evie
w
05
2005

06
Gro
up C
hief
Exe
cutiv
e’s
revi
ewGroup Chief Executive’s review

Gro
up r
evie
w
07
Our results for 2005 demonstrate thestrength and momentum of the Groupand the capabilities of our diversebusiness platform. We increased our total income by 14% and held ourcost:income ratio, before acquisitions,steady at 41.8%. Group operating profitincreased by 16% to £8,251 million.All our divisions increased their incomeand contribution to Group profit.
We are particularly pleased with the geographic mix of ourprofits, 42% of which came from our international operations.Our profits in Europe, outside the UK, have grown to be equalto Citizens’ profits before the acquisition of Charter One. Themajority of this growth is organic. Strong organic incomegrowth has been a recurring theme of our results over recentyears and provided over 70% of our increase in 2005.
During the course of the year we established Retail Markets in order to strengthen the co-ordination and delivery of ourmulti-brand retail strategy. At the beginning of 2006 the formerCorporate Banking & Financial Markets division was renamedCorporate Markets and we reorganised our activities into twobusinesses, UK Corporate Banking and Global Banking &Markets, to enhance our ability to serve the needs of thesedistinct customer segments.
Bank of ChinaIn August 2005 we signed strategic investment and co-operation agreements with Bank of China, the second largestbank in China. Following regulatory approvals, the transaction was completed in December. RBS led a consortium thatinvested $3.1 billion, taking a 10% stake in Bank of China.We have ourselves invested $1.6 billion, financed by the sale of our shares in Banco Santander Central Hispano S.A.We are working closely with Bank of China to develop business co-operation initiatives in areas such as credit cards, wealth management and corporate banking. We arealso supporting Bank of China in key infrastructure areas,including risk and financial management, human resourcesand information technology.
Our customersCustomer numbers increased in all our divisions, with TheRoyal Bank of Scotland securing top position amongst the highstreet banks for personal customer satisfaction and NatWestmoving into joint second position. This result reflects ourinvestment in our branches and our people to support them,and improved access through a wide choice of channels.
Our peopleIn the 2005 Employee Opinion Survey the Group improved itsscore in each of the 14 categories surveyed. At 86%, responseto the 2005 Employee Opinion Survey was even higher thanpreviously. We have launched new initiatives to encourageinnovation and leadership. Our new Business School andprogrammes developed in conjunction with Harvard BusinessSchool are helping to develop the vision and quality ofmanagement that the Group will need in challenging markets in the future.
Our shareholdersStrong earnings and capital generation strengthened our Tier 1 capital ratio to 7.6% at the end of 2005 and our totalcapital ratio to 11.7%. We are committed to capital strengthand efficiency, returning capital to our shareholders boththrough increasing dividends and when appropriate via sharebuybacks. This year the Board proposed a 25% increase in ourdividend to 72.5p per share, representing an increased payoutratio of 41%. In addition, we intend to repurchase up to £1billion of our shares over the next 12 months.
Sir George MathewsonGeorge Mathewson will retire as the Group's Chairman at theAnnual General Meeting. Under his leadership, initially asGroup Chief Executive, RBS has enjoyed an unparalleledperiod of growth and success both at home and internationally.Very few can match his 18-year legacy of consistently increasingvalue generation. Personally and on behalf of his colleagues,I would like to thank George for his outstanding contribution.
OutlookWhilst displaying both opportunities and threats, the economicoutlook for 2006 in all of the major economies in which weoperate would appear to be supportive of the continuedmomentum of the Group. We believe that we have built astrong platform for future growth with a diverse range ofopportunities in a number of geographies, and taken togetherwith our strong capital base, continuing good credit metrics,and firm cost control, we remain optimistic about the futureprospects of the Group.
Sir Fred Goodwin, Group Chief Executive
2005

08
Gro
up p
rofil
eGroup profile
Corporate Markets
Citizens
Corporate Markets
Retail Markets
Ulster Bank Group
RBS Insurance
Manufacturing
United Kingdom US
2005
Income (£bn) 18.8
Operating profit (£bn) 4.8
Loans to customers (£bn) 281
Deposits by customers (£bn) 235
Employees 103,000
2005
Income (£bn) 4.6
Operating profit (£bn) 2.3
Loans to customers (£bn) 90
Deposits by customers (£bn) 85
Employees 26,000
Geographic analysis of income and operating profit determined by location of customer

Gro
up r
evie
w
09
2005
Corporate Markets
Retail Markets
Ulster Bank Group
RBS Insurance
Manufacturing
Corporate Markets
Retail Markets
Europe Asia Pacific
2005
Income (£bn) 2.0
Operating profit (£bn) 1.1
Loans to customers (£bn) 42
Deposits by customers (£bn) 18
Employees 7,000
2005
Income (£bn) 0.2
Operating profit (£bn) 0.1
Loans to customers (£bn) 4
Deposits by customers (£bn) 5
Employees 1,000
TOTAL 2005
Income (£bn) 25.6
Operating profit (£bn) 8.3
Loans to customers (£bn) 417
Deposits by customers (£bn) 343
Employees (full time equivalent basis) 137,000

10
Div
isio
nal p
rofil
eDivisional profile
Corporate Markets
Chief ExecutiveJohnny Cameron
UK Corporate BankingGeographical spreadUK
Global Banking & MarketsGeographical spreadUK, Europe, US and Asia
Market data
�No.1 UK corporate and commercialrelationship bank
�No.1 for UK payments
�No.1 for card transaction processing
�No.1 for deposits
�No.1 for lending
�No.1 for asset finance
�No.1 for invoice finance
�No.1 for foreign exchange
�No.1 for sterling interest ratederivatives
Market data
�Serves over 95% of the FTSE 100
�Serves over 80% of Fortune 100companies in the US
�Banking relationships with over 90%of the Dow Jones Eurostoxx 50
�Top 10 globally for total debtissuance
�No.2 securitisation house globally
�No.1 project finance bank globally
�No.3 commercial aircraft financierglobally
�Top 5 globally for foreign exchange
Market data
�No.1 for structured syndicated loans in Europe
�No.1 leveraged finance house in Europe
�No.1 train operating lessor inEurope
�No.1 bookrunner of Agencycommercial mortgage-backedsecurities
�No.1 in US government sales for liquid products
Corporate Markets (formerly Corporate Banking & Financial Markets) is a leading provider of banking services and integrated financial solutions to corporate customers in the UKand major corporates and financial institutions globally.
Since the start of 2006 we have organised Corporate Markets into two distinct businesses:UK Corporate Banking, which focuses on the needs of UK domestic and internationalcorporate and commercial customers, and Global Banking & Markets, which supports therequirements of large international corporates and financial institutions around the world.

Gro
up r
evie
w
11
2005
Retail Markets
Chief ExecutiveGordon Pell
Retail BankingGeographical spreadUK
Retail DirectGeographical spreadUK and Europe
Wealth ManagementGeographical spreadUK, Europe, Asia and offshore locations
Retail Markets has the largest network of bank branches and ATMs in the UK; it has leadingpositions in the UK in credit card issuing, merchant acquiring, consumer finance andsupermarket banking; and it provides services to clients through premier brands in UKprivate banking and UK offshore banking. It offers a wide range of banking, financial,insurance, life assurance, pension, credit card and charge card products and client servicesfor private, corporate, expatriate and offshore customers.
Retail Markets brands include The Royal Bank of Scotland and NatWest in retail banking and credit cards. MINT and Tesco Personal Finance also offer cards, and a range ofproducts and services are available through The One account, First Active UK, Direct LineFinancial Services, Lombard Direct and other brands. Through Streamline and InternationalMerchant Services, which includes WorldPay and Bibit, we are the leading merchantacquirer in Europe. Wealth Management brands include Coutts Group, Adam & Company,Royal Bank of Scotland International and NatWest Offshore.
Market data
�Largest retail network in the UK
�2,274 branches
�Largest ATM network in the UK
�Over 14 million personal customers
�Largest provider of banking servicesto small and medium sizedenterprises (SMEs) in the UK
�Over 1.1 million business customers
Market data
�Over 17.5 million customer accounts
�Over 11 million credit card andstorecard accounts in the UK
�Over 2 million customer accounts in Europe
Market data
�Coutts – premier UK private bankingbrand
�Over 100,000 private bankingcustomers
�Third largest foreign-owned privatebank in Switzerland
�160,000 offshore customers

Ulster Bank Group
Chief ExecutiveCormac McCarthy
Geographical spreadIsland of Ireland
Ulster Bank Group operates across the island of Irelandproviding a full range of banking and financial products and services for personal customers and corporates viabranches, telephone and the internet. Ulster Bank Grouphas the largest share of personal banking customers in Northern Ireland and is the third largest bank in theRepublic of Ireland. In 2005 Ulster Bank Group launchedmarket-leading mortgage and current account products and a new brand identity with the RBS logo.
Market data
�Largest share of personal bankingcustomers in Northern Ireland
�Third largest bank in the Republic of Ireland
�1.6 million personal and businesscustomers across the island of Ireland
�304 branches and business outlets
12
Div
isio
nal p
rofil
eDivisional profile continued
Citizens is the eighth largest commercial bankingorganisation in the US, based on deposits. The Charter Oneacquisition in August 2004 enabled it to expand into sixadjacent states in the northeastern and midwestern US.Citizens offers personal banking, residential mortgages,home equity loans, credit cards and merchant cardservices, and a wide variety of commercial bankingservices through its extensive, convenient network of citycentre, local and supermarket branches.
Market data
�Eighth largest commercial bankingorganisation in the US by deposits
�Second largest supermarket banker in the US
�4.6 million personal customers,450,000 business customers and 1.6 million retail credit card customeraccounts
�Retail branch footprint extends to 13states and 30% of the US consumerpopulation
�With credit cards and our partnershipwith Kroger our total retail andcorporate presence stretches across40 states
�Over 1,100 traditional bank branches
�Over 520 in-store branches
�More than 3,800 ATMs
Citizens
Chairman and Chief Executive OfficerLarry Fish
Geographical spreadNew England, Mid-Atlantic andMidwest regions of the US

Gro
up r
evie
w
13
2005
Manufacturing
Chief ExecutiveMark Fisher
Geographical spreadUK and Europe
RBS Insurance
Chief ExecutiveAnnette Court
Geographical spreadUK and Europe
Manufacturing’s diverse range of services supports the customer-facing operations of the Group’s multiplebrands. It provides customer support via telephony,account management, lending, mortgage processing and money transmission.
Group Technology develops and maintains the infrastructureand technology that supports the branches, ATMs andinternet banking for customers of Corporate Markets,Retail Markets and RBS Insurance.
Purchasing is responsible for the vast majority of purchasingundertaken by the Group, leveraging its scale to maximisecost efficiencies.
The Group’s property portfolio is managed, maintained and refurbished by Manufacturing, which also oversees the property investment programme.
Market data
�No.1 in the UK for cheque payments
�No.1 in the UK for Bank AutomatedClearing System (BACS) transactions
�No.1 in the UK for Clearing HouseAutomated Payment System (CHAPS)transactions
�Runs the UK’s largest ATM network
RBS Insurance is the second largest general insurer in theUK and a growing provider of general insurance in Spain,Italy and Germany. It sells and underwrites insurance via the telephone, the internet, partnerships and a network ofbrokers. Its brands, including Direct Line, Churchill, Privilege,Green Flag and NIG, are some of the best known in the UK.
Market data
�Second largest general insurer in the UK
�No.1 for UK car insurance
�No.2 for UK home insurance
�25.9 million in-force policies
�8.7 million UK car policies
�4.6 million UK home policies
�Largest tele-direct insurer in Spain
�1.9 million international car policies

14
Cor
pora
te B
anki
ng &
Fin
anci
al M
arke
tsCorporate Markets
14
Cor
pora
te M
arke
ts
Make it happen
� Profit contribution £5,224 million (2004 – £4,196 million)� Total income up 17%� Profit up 24%
Kew Gardens has an international reputation.In 2005 they selected RBS for the quality ofonline banking data we offered alongside a verycompetitive and flexible interest bearing account.RBS is UK market leader in the provision ofbanking services to the charitable sector.

Div
isio
nal r
evie
w
15
Corporate Markets is focused onthe provision of financial services to commercial and corporatecustomers in the UK and to large corporates and financialinstitutions around the world. In2005 Corporate Markets increasedincome by 17% to £8,815 million.
��� The former Corporate Banking & FinancialMarkets division was renamed Corporate Marketson 1 January 2006, when we reorganised ouractivities into two businesses, UK CorporateBanking and Global Banking & Markets, in order toenhance our focus on the distinct needs of thesetwo customer segments.
��� Corporate Markets’ extensive product range includes cash and liquidity management and comprehensive debt, risk management andtreasury services. Debt services include overdraft,bilateral and syndicated lending; primary bondissuance; trade finance; asset finance; andstructured finance solutions for property, acquisitionfinance, project finance and infrastructure finance(including PPP/PFI). Risk management and treasuryservices include trading of corporate, institutionaland public sector debt; futures brokerage; foreignexchange; and money markets, currency derivativeand interest rate risk management services.
UK Corporate Banking provides customers with a fullsuite of banking products and specialist services tomeet domestic and international needs. We continueto be the UK’s No.1 corporate and commercialrelationship bank and market leader in the UK inpayments, card transaction processing, deposits,lending, asset finance, invoice finance, foreignexchange and sterling interest rate derivatives.
��� Our corporate and commercial bankingbusiness has 86,000 customers supported by 1,500 dedicated relationship and businessdevelopment managers operating out of170 corporate centres spread across the UK.
��� We differentiate ourselves through thestrength of our long-term relationships with ourcustomers. Service is delivered by a network ofexperienced and highly trained relationshipmanagers operating in their local communities.Acting as a single point of contact, they workproactively with our product teams to deliver theright solutions for their customers’ needs. Qualityoperational service is provided by specialistcustomer service teams who are also closelyaligned with our relationship managers.
��� In addition to our core banking offering oflending, payments, deposits and internationalservices, our specialist businesses offer a full rangeof financing solutions to UK customers. Lombard isthe market-leading provider of asset financing andmanagement services from traditional hire purchase,leasing and contract hire through to bespokesolutions. RBS Invoice Finance’s services includefactoring, invoice discounting, asset-backed lending,trade cycle finance and bad debt protection.Lombard and RBS Invoice Finance have 400 sales staff working out of 53 offices, and over100,000 customers.
2005
Make it happen
Delivery

16
Cor
pora
te M
arke
ts
Make it happen
Corporate Markets continued
2005 successes include:��� RBS jointly underwrote and syndicated a £1.2 billion funding package to enable TravisPerkins to acquire Wickes, creating one of thelargest building supply businesses in the UK. Wethen acted as sole adviser on the raising of $400million of debt in the US Private Placement market,Travis Perkins’ first such transaction. As a leadbanker to the enlarged group we also provideclearing services, interest rate hedging and Lettersof Credit to support its international business.
��� We acted as an Underwriter and Bookrunnerfor Premier Foods, one of the largest suppliers of grocery products in the UK, in a £780 millionfinancing package to support the acquisition ofMarlow Foods Limited, owner of the Quorn brand,the UK’s leading meat alternative.
��� Our relationship team, working with FinancialMarkets’ colleagues, provided South Yorkshirebased Castings Technology International withfunding for new flagship premises, allowing thecompany to grow its business and create 48 newjobs in the region.
��� A strong relationship with Icelandic ready-prepared foods group Bakkavör resulted in RBSbeing mandated to structure and jointly arrange a £500 million facility to enable Bakkavör to acquirethe entire share capital of Geest and refinance its debt.
��� As the leading UK clearing bank for TNT, weprovide a comprehensive range of payment andcheque reconciliation services, including integratedIT systems and secure e-mail communication withour service centre. Our close relationship enablesus to integrate product delivery and enhance ourcustomer service.
��� Lombard provided a funding package to support the installation of a revolutionary new ‘G-Force’ rollercoaster ride at Drayton Manor Theme Park in Staffordshire.
��� RBS Invoice Finance delivered a committed£16.5 million stock and debtor funding package for Hargreaves Group, a leading bulk haulage andaggregates business. This allowed the customer to complete the acquisition of Monckton Coke &Chemical Co whilst refinancing existing credit lines.
��� We helped Joy Mining Machinery to managethe payment risks associated with exporting to theFar East, Russia and North Africa. Our Letter ofCredit processing expertise enabled the companyto trade safely in these countries.
Global Banking & Markets is a leading bankingpartner to major corporates and financial institutionsaround the world, specialising in providing thesecustomers with a full range of debt financing, riskmanagement and investment services.
��� We serve our Global Banking & Marketscustomers from offices in 20 countries, with a leadingposition in the UK, established and strongly-growingpositions in the US and continental Europe and an increasing capability in Asia-Pacific. Thesesophisticated customers benefit from our sectoralexpertise, product excellence and access to markets.
��� A focus on long-term relationships backedby our strong balance sheet and suite of value-added product capabilities is at the heart of ourapproach to our customers. This approach enabledexcellent growth across the full range of productsand markets that Global Banking & Markets serves.We have relationships with the overwhelming majorityof the members of each of the FTSE 100 index,the Fortune 100 list and the Dow Jones Eurostoxx50 index.
��� The integration of our banking operations inthe US with RBS Greenwich Capital, our industry-leading US government bonds and asset-backedsecurities business, has delivered excellent resultsduring 2005, with strong growth in new corporaterelationships, corporate loan syndications andinterest rate derivative volumes.
RBS, through UK Corporate Banking, is the UK’s No.1 relationship bank.

Div
isio
nal r
evie
w
17
2005
Fondo ImmobiliPubblici.RBS Italy led three banksin the underwriting of thefirst closed-end real estatefund for the €3.3 billiontransfer of property fromthe Italian Ministry ofEconomy and Finance tothe newly created FIP.
��
Open University.RBS has a long standingrelationship with TheOpen University, Britain’sfirst university dedicatedto distance learning.In 2005 the OpenUniversity consolidated its loan facilities with RBSas sole lender.
� � BloomsburyPublishing is one ofBritain’s most successfulpublishing houses. It isbest known for titles suchas Harry Potter and thePru Leith Cookery booksand is a long-standing UK Corporate Bankingcustomer.
��

18
Cor
pora
te B
anki
ng &
Fin
anci
al M
arke
tsCorporate Markets continued
18
Cor
pora
te M
arke
ts
Our focus on long-term relationships backed by value-adding solutions has won Global Banking& Markets major corporate and institutional customers around the world. We have relationshipswith over 95% of the FTSE 100, over 80% of Fortune 100 companies in the US and over 90% ofthe Dow Jones Eurostoxx 50.
Make it happen
Pernod Ricard.In April 2005 Pernod Ricard completed theacquisition of Allied Domecq. RBS was one offour Bookrunners for the €9.2 billion facilityoffering specialist expertise in €/£ foreignexchange hedging and structured loans.

Div
isio
nal r
evie
w
19
2005
��� A controlled expansion of our franchise overthe last five years across France, Germany, Spain,Italy and the Nordic region has enabled us tocapture and develop major client relationships incontinental Europe. We now provide a full range of products to customers in these countries.
��� In the Asia Pacific region we have selectivelybuilt up our presence, particularly where we haveidentified opportunities to leverage our expertise indelivering financial markets products to financialinstitutions. We continue to achieve impressiveresults from the region, where we now employ 500 people. In Australia our wide range of productshas been particularly successful with both corporateand institutional customers.
��� Our worldwide team of structured financeprofessionals provides specialised financing solutionsfor acquisitions, property, projects, infrastructureand commercial equipment including aircraft, shipsand trains. In Europe we have a long-standingmarket-leading position in leveraged finance as a preferred partner to financial sponsors. Globallywe are the No.1 project finance bank and No.3commercial aircraft financier.
��� Our financial markets activities benefit fromour established platform and the real scale that wehave developed. We are able to provide a full rangeof solutions that deliver against different customerrequirements, from rapid access to electronicplatforms, to high quality advice and excellentexecution by highly skilled sales people.
2005 successes include:��� RBS arranged and underwrote £1.7 billionof debt facilities to finance Gala Group’sacquisition of Coral Eurobet in the UK. Thistransaction was one of the largest-ever sterlingleveraged transactions (awarded Domestic Deal of the Year by Acquisitions Monthly).
��� We were awarded the role of Sole LeadArranger on the €470 million debt refinancing of
the api Energia Power Project in Italy due to ourlong-term relationship, structuring expertise andmarket-leading position. api Energia is one of threeintegrated gasification combined cycle plants inEurope showcasing an environmentally friendlygasification process which converts refinery residueto electrical power. This transaction and our ongoingsupport have enabled the api Group to continuewith its development plans and long-term growthobjectives.
��� RBS was instrumental in the largest PublicTender Offer ever made by a privately ownedcompany in Germany, when it served as the exclusivefinancial arranger to Spohn Cement GmbH in itsacquisition of Heidelberg Cement AG. RBS wasmandated as Sole Bookrunner to underwrite andarrange the financing needs of the bid, including theprovision of acquisition facilities totalling €3.1 billion.
��� When RBS co-arranged the US$1.2 billionprivate placement for Wolseley, the world’s largestdistributor of heating and plumbing products, it set a market record for private placements.
��� RBS jointly led the £18 billion acquisition ofUK mobile operator 02 by Telefónica, underwriting£6.1 billion. This was one of the largest acquisitionsin the telecom sector and the largest ever singleacquisition made by a Spanish company (awardedMost Impressive Loan and Best Western EuropeanLoan by Euroweek).
��� The UK Debt Management Office and HerMajesty’s Treasury mandated RBS to act as one offour Bookrunners in the UK Government’s first eversyndicated offering in sterling bonds and the first50 year inflation bond in the world.
��� Through long-standing relationships with bothof the UK’s leading cable companies, deep sectorknowledge and tactical use of our balance sheet wehelped to pave the way for the merger between NTLand Telewest, thereby consolidating our position as atop-tier partner bank to this customer.

20
Cor
pora
te B
anki
ng &
Fin
anci
al M
arke
tsCorporate Markets continued
20
Cor
pora
te M
arke
ts
We’ve been the fastest growing debt issuance bank globally over the last four years.
��� RBS was the only bank to be awarded bothBookrunner and Mandated Lead Arranger roles infunding each of the three deals to acquire stakes in France's leading motorway companies from theFrench government. This was achieved through thecombined strength of our multi-product platform,infrastructure sector expertise and local corporaterelationships. Our teams led the underwriting ofinnovative and competitive financing packagestotalling some €17.5 billion in support of the €21.3 billion-worth of acquisitions.
��� As Joint Mandated Lead Arranger andUnderwriter, via our offices in France and Spain,RBS provided an innovative financing structure for€532 million of debt to fund the €1.1 billion highspeed rail link concession to be built through thePyrenees between Perpignan and Figueras(awarded EMEA Infrastructure Deal of the Year, PFIAwards, and EMEA Rail Transport Deal of the Yearby Project Finance Magazine).
��� RBS Greenwich Capital acted as JointBookrunner for the US$750 million 10-year GlobalNotes offering for Harrah’s operating company,Harrah’s Entertainment Inc. Harrah’s is a leadingentertainment and casino group and is the onlyinvestment grade gaming company in the world. Bytaking advantage of an attractive financing windowthe transaction was twice over-subscribed.
��� In Australia we completed our first leveragedfinance transaction as Joint Mandated Lead Arrangerand Bookrunner for the US$1.7 billion acquisition ofDyno Nobel, a leading global supplier of commercialexplosives, by a consortium of investors.
��� RBS acted as Joint Arranger of a cross-border securitisation for SC First Bank (previouslyKorea First Bank) raising €500 million in triple-Arated notes. The issue was more than 2.5 timesover-subscribed with more than 30 institutionalinvestors and was structurally innovative, marking
the first instance an amortising junior note wasintroduced for a Korean cross-border mortgage-backed securitisation.
��� RBS Aviation Capital, working closely withour Shanghai Branch, completed a major JapaneseOperating Lease financing with China SouthernAirlines. The deal comprised an initial US$93 millionbridge loan financing of three Boeing 737-700aircraft from RBS Shanghai which wassubsequently restructured into a JapaneseOperating Lease financed through RBS Tokyo.
Selected Awards:��� Best UK Bank
Euromoney Awards for Excellence 2005
��� European Loan House of the Year
IFR
��� European ABS Arranger of the Year 2005
ISR Awards
��� Securitisation House of the Year - Europe
The Banker
��� Top Bank for European Leveraged Finance
Financial News
��� Mezzanine Debt provider of the year
European Venture Capital (& Private Equity) Journal
��� EMEA Bank of the Year – Project Finance
PFI awards
��� Best Bank in Foreign Exchange in London
FX Week
��� Best Bank in Asian Prime Brokerage
AsiaMoney FX Survey
Make it happen

Hyatt Corporation.The international hotelgroup, headquartered in Chicago, embarked on a significant hotelinvestment in 2005. RBSin New York was joint leadarranger for the US$1 billionloan facility.
��
Adidas. We acted asagent on a US$1 billionprivate placement forAdidas, a global leader in the sporting goodsindustry. It was the largestsuch placement in the USout of Germany. Thefunding will largely be usedto finance their acquisitionof Reebok in the US.
� � Monro Muffler.RBS Securities and CharterOne in Chicago joinedforces as Lead Arranger and Sole Bookrunner forMonro Muffler, which runs a network for automotiverepairs, showing thestrength of the RBSplatform in the US.
��
Div
isio
nal r
evie
w
21
2005

22
Ret
ail M
arke
ts
RBS – Child Trust Fund.RBS was one of the first banks to offer a Child Trust Fund in response to theGovernment’s commitment to give £250 to each child born after September 2002.RBS has matched the £250 with discountedretail vouchers and created a newstakeholder product to capitalise on the value the child will receive at 18.
Retail Markets
� Profit contribution £4,207 million (2004 – £4,064 million)� Total income up 7%� Profit up 4%
Make it happen

Div
isio
nal r
evie
w
23
2005
Retail Markets was established in June 2005 to strengthen co-ordination and delivery ofour full range of retail servicesthrough all our brands andchannels. It has brought togetherthe three businesses – RetailBanking, Retail Direct and WealthManagement – which focus on the interests of our personal and small business customers.In a challenging market, RetailMarkets increased total income by 7% to £8,213 million.
��� The number of personal Retail Bankingcustomers increased by 274,000 (2%), with personalcurrent accounts up 275,000 (2%); Retail Directincreased its total customer accounts by 734,000(4%); and Wealth Management increased its clientbase with Coutts UK personal customers up 7%and Adam & Company up 11%.
��� In Retail Banking, average loans andadvances to customers grew by 11%, with averagemortgage balances up 12%, personal lending up10% and small business lending up 9%. In RetailDirect, average loans to customers grew by 15%,personal loan balances grew by 11% andmortgage lending grew by 34%. In WealthManagement, average loans to clients grew by20%, while average client deposits grew by 11%.
Retail Banking has the largest network of bankbranches and ATMs in the UK and is the leading bankfor small business customers. In 2005 Retail Bankingincreased its total income by 5% to £5,433 million.
��� In 2005 our measures to improve customerservice were rewarded when The Royal Bank ofScotland secured top position amongst the high streetbanks, and NatWest moved into joint second position,for customers who rate themselves “extremelysatisfied” with their main current account provider.Source: Gfk Financial Research Survey, 12 months to November2005; high street banks defined as RBS, NatWest, Barclays, LloydsTSB, HSBC and HBOS.
��� We added nearly 800 people to our Royal Bank of Scotland and NatWest branch networksand telephony service, improved personal accessfor customers by opening new branches andcontinuing our refurbishment programme, increasedthe number of branches open on Saturdays andextended our mobile banking service.
��� Our quality of service has also beenenhanced by our new Customer Service Review/Personal Service Review, which enables our peopleto run a comprehensive financial health checktailored to a customer’s individual circumstances.The Review offers recommendations to meet thecustomer’s immediate and future needs. Ourrevised Customer Account Opening system enablesour customers to open additional accounts withinminutes, whether they use our branches, telephoneservice or the internet.
��� Continued emphasis on long-term savings,assisted by excellent salesforce recruitment andretention, resulted in an increase of 25% in sales inour joint venture for life assurance and investments.The second half of 2005 saw record sales volumes,up 52% on the same period in 2004. Our team ofFinancial Planning Managers continues to grow, withmore of them located in our branches to broaden theservices we can offer through the network. The launchof new investment products enabled us to provide ourcustomers with more choice and better value.
Make it happen
Passion

24
Ret
ail M
arke
tsRetail Markets continued
Retail Banking provides customers with a choice of when and how they do their banking through access to branches, a 24-hour telephone banking service, a network of ATMs and a full internet banking service.
��� The Royal Bank of Scotland and NatWestattracted more than 135,000 new Stakeholder Child Trust Funds during 2005, making us one of the key providers of this product.
��� Partly through its network of 54 campusbranches, NatWest yet again achieved No.1 statusfor student accounts. Of first-year students inEngland and Wales, 44% chose to open a studentaccount with us.
��� The Royal Bank of Scotland launched FirstHome Saver, a new savings account designed tohelp customers get onto the property ladder byencouraging them to save regularly for the deposit,and by giving a tax-free bonus on taking out aRoyal Bank of Scotland mortgage.
��� In September 2005, Royal Bank of ScotlandBusiness was voted No.1 for service to small businesscustomers in Scotland.
��� Mentor, our Business Advice Service forEmployment Law, Health & Safety and Tax, reachedmore than 15,000 customers last year. It is thefastest-growing service of its type in the UK andincreased income by 18% whilst delivering significantimprovements to our proposition, including trainingin Health & Safety and Employment Law.
��� Loans to our small business customers were up 9% in 2005. Deposits by small businesscustomers, taking advantage of our competitiverange of products, grew by 4%.
��� 13,000 customers have opened a FlexibleBusiness Loan, our market-leading product thatenables business customers to customise theirloan. They can choose from a range of options at
the start of their loan, and can then update theirchoices if their circumstances alter. We alsolaunched Client Money Services, a unique productthat enables our business customers to managetheir client funds simply and easily.
Retail Direct has leading positions in the UK in credit card issuing, merchant acquiring,consumer finance and supermarket banking.In 2005 Retail Direct increased its total income by 11% to £1,966 million.
��� Retail Direct’s Credit Cards business is one of Europe’s leading issuers of personal andcommercial credit cards, as well as one of themajor global merchant acquirers.
��� The personal cards issuing business issuespersonal credit cards to customers of The RoyalBank of Scotland and NatWest primarily throughbranches, and also to non-banked customers usingthe MINT brand through direct channels.
��� During 2005, we introduced an enhancedcredit card offer for The Royal Bank of Scotlandand NatWest brand cards, with preferential pricingfor current account holders. In addition, the MINTbrand continued to improve the quality and breadthof service it offers to customers by launching motorand home insurance.
��� The commercial cards business hasmaintained its leading position in the UK. It offers arange of corporate cards, purchasing cards andtravel solutions to a broad range of businesses. Itenhanced its services by including ‘Smart dataonline’ as part of the onecard package. This allowsbusiness customers to receive and analyse alltransaction data centrally.
Make it happen

NatWest BusinessManagers. In 2005NatWest re-introducedlocal business managerscovering 180 keybranches. In FarehamChris Jack meets NickBowes of Airport Bodyshopon his premises.
��
Google.Retailer Card Servicesprovides Google with a multi-currency capability,which enables theprocessing and settlementof credit card transactionsin a wide choice of majorinternational currencies.
��
NatWest MobileBank. Last year NatWestlaunched a new mobilebank in Cornwall bringingbanking services to 13local communities weekly,travelling around 20,000miles per year. Here it isseen on the Cornish coast.
� �
Div
isio
nal r
evie
w
25
2005

26
Ret
ail M
arke
tsRetail Markets continued
Retail Direct offers a full range of financial services products through a number ofbrands and a variety of convenient channels in the UK and continental Europe.
Tesco Personal Finance in Hungary.Our joint venture with Tesco isdeveloping its presence in Europe.Financial services products are nowavailable through Tesco PersonalFinance in Hungary.
Make it happen

Div
isio
nal r
evie
w
27
2005
��� Our merchant acquiring business is thefourth-largest merchant acquirer globally. Thebusiness enhanced its product range during 2005,enabling retailers to offer customers the ability totop up their mobile phones through point-of-saleterminals. The business is now European leader inonline merchant acquiring.
��� Retail Direct has worked closely with theGroup’s Irish mortgage business, First Active,to launch the brand in the UK. First Active hasestablished itself as one of the fastest-growing UKmortgage lenders with total gross lending of £3.9billion in 2005, and has expanded its product rangewith the launch of a buy-to-let mortgage product.
��� RBS’s mortgage intermediary business wasbrought under the stewardship of Retail Directduring 2005, in order to co-ordinate the Group’smortgage brand offer in the growing intermediarymarketplace.
��� During the year the number of customeraccounts at Tesco Personal Finance exceeded fivemillion. First Active supported the launch of twonew TPF mortgage products, making TPF the onlysupermarket bank to offer mortgages. Retail Directalso continued to support the development ofTesco’s financial services operations in CentralEurope and Asia.
��� Elsewhere in Europe our relationship withTchibo, a major German retailer, has grownsuccessfully, with the offer of consumer loans nowextended across the store network in Germany and online.
Wealth Management provides private banking andinvestment services to its global clients through anumber of leading UK and overseas private bankingsubsidiaries and offshore banking businesses.It has a network of more than 50 offices globally.In 2005 Wealth Management increased its totalincome by 10% to £814 million.
��� Investment assets under managementincreased by 18%. Investment programmes withinWealth Management have grown by 18% to US$27billion and continue to perform competitivelyagainst industry benchmarks. Coutts is a significantinvestor in multi-manager hedge funds with morethan US$7 billion invested.
��� Adam & Company continued its eleven yearrecord of double-digit profit growth, and opened anew office in Aberdeen.
��� The Offshore Bank grew income by 7% and launched a Spanish Mortgage productavailable across the Group to all customers.Offshore mortgage balances increased by 35%and Royal Bank of Scotland International is a leading provider in the UK offshore islands of electronic banking services.
��� Coutts continued to enhance its position asthe leading private bank in the UK and increased itsclient base by 7%. A philanthropy service waslaunched in 2005, which won Coutts the title of BestProvider of Philanthropy Services. Coutts alsolaunched its Family Business Service, offeringspecialist advice as well as education andnetworking forums for family business owners.In parallel, Coutts created its family prize andsponsored the Guide to Giving. Internationally,Coutts celebrated 10 years in Singapore in 2005.

Make it happen
28
Ret
ail M
arke
tsRetail Markets continued
Wealth Management provides private banking and investment services to its global clients through anumber of leading UK and overseas private banking subsidiaries and offshore banking businesses.
Selected Awards��� The Royal Bank of Scotland – Best forOverall Customer Service category
2005 Personal Finance and Savings Readership Awards
��� NatWest Kirkham Branch – Customer ServiceTeam of the Year Financial Services Award
National Customer Service Awards 2005
��� The Royal Bank of Scotland – Best DirectBanking for the fifth year in a row
Your Money Direct Awards 2005
��� The Royal Bank of Scotland – Best OnlineBusiness Banking Provider for the second year in a row
Your Money Direct Awards 2005
��� Lombard – Best Online Loan Provider
Your Money Direct Awards 2005
��� NatWest Mortgages Direct – Best Mortgage Provider
Your Money Direct Awards 2005
��� Tesco Personal Finance – Best Overall Provider
Your Money Direct Awards 2005
��� NatWest Mortgages – Best Bank, Best LargeLoans and Highly Commended Remortgage Lender
Your Mortgage Awards
��� The Royal Bank of Scotland – Best Business Bank
Start Your Business Magazine
��� First Active – Best Mortgage Lender of theYear and Innovator of the Year
Mortgage Strategy Awards
��� First Active – Best Remortgage Lender
Mortgage Magazine Awards and Mortgage Advisor
& Homebuyer Awards
��� The One account – Best Current Account Mortgage Lender
Your Mortgage Magazine
��� Direct Line – Best Personal Loan Provider
MoneyFacts
��� Streamline – Best Merchant Acquirer 2005 – Europe
Lafferty Group
��� MINT – Best Credit Card Direct Mail,Peoples Choice award
Tank!/Direct Marketing Association
��� Commercial Cards – Best Business Charge Card Provider
Business Moneyfacts
��� Coutts – Best Private Bank in the UK
Euromoney
��� Coutts – Best Private Bank for super-affluentindividuals (US$500k to US$1m)
Euromoney
��� Coutts – Best Private Bank for high net worth individuals (US$1m to US$10m)
Euromoney
��� Coutts – Best provider of services to artists and entertainers
Euromoney
��� Coutts – Best provider of services to sports players
Euromoney

Div
isio
nal r
evie
w
29
2005
Stella McCartney isone of the most successfulof Britain’s young fashiondesigners with a now wellrecognised luxury brand.Stella and Coutts have a fruitful commercialrelationship includingexclusive customer eventsfor Coutts clients.
��
The One account.“One Day” as theadvertisements say… I’llhave my own music studio.Mark Young transferred his mortgage to The Oneaccount three years ago and saved enough toconvert one of the bed-rooms in the family home.
��
First Active.For Jill Hewitt and her nineyear old son Jack, value formoney is important. LastMay after consolidatingher mortgage and a homeimprovement loan into afixed rate mortgage withFirst Active, she savedover £100 a month.
� �

30
Uls
ter
Ban
k G
roup
Ulster Bank Group
� Profit contribution £530 million (2004 – £460 million)� Total income increased 15%� Profit up 15%
University of Limerick.Ulster Bank and University of Limerick share a passion for innovation and high standards.A 10-year agreement has underlined UlsterBank’s commitment to the education sectornationally and to the Munster region where theuniversity is located – covering the University’sown banking and on-campus banking forstudents, staff and local businesses.
Make it happen

Div
isio
nal r
evie
w
31
2005
Ulster Bank Group saw sustainedgrowth in 2005 and the launch of market-leading mortgage and current account products.A branch improvement programmeand a new Ulster Bank brandidentity moved us towards ourvision of becoming the best bankon the island of Ireland. UlsterBank Group’s total incomeincreased by 15% to £858 million.
��� Ulster Bank Group ended 2005 with 1.6million personal and business customers across theisland of Ireland.
��� Product development has been a key factorin Ulster Bank Group’s success. In November 2005we launched a radical overhaul of personal currentaccounts in Northern Ireland to provide free bankingto all personal customers.
��� First Active introduced the Republic ofIreland’s first 100% First Time Buyers’ Mortgageconfirming First Active’s reputation for innovativeproducts. These include the Current AccountMortgage and Elevator savings account.
��� Ulster Bank also led as the first clearing bankto extend its 100% mortgage to first-time buyersacross the island. The Switcher Mortgage packagehas made it easy for customers to switch to us.
��� Ulster Bank Group’s Corporate Banking and Financial Markets (CBFM) division continued to experience strong lending growth to its corporatecustomers. Average lending grew by 29% in 2005 –26% in Northern Ireland and 30% in the Republic of Ireland.
��� Important transactions completed during theyear included the banking business of United DairyFarmers, a leading dairy producer; funding theconstruction of major shopping centres in Essexand Dundalk, and working with the RBS SpecialistHealthcare team to win the mandate to funddevelopment of Beacon Hospital, a major newprivate hospital in Dublin.
��� 89 branches were overhauled as part of our improvement to the Ulster Bank branchnetwork, with work planned on a further 57 during2006. The Ulster Bank and First Active branchestogether create a network of 272 branches.
��� 2005 was also significant for the visibility of our brands. The Ulster Bank brand adopted the RBS logo in November, enhancing its identity as a member of the RBS Group, while First Activecontinued its targeted focus on the mortgage sector.
Awards��� Corporate Banking Excellence Award
KPMG’s Financial Services Excellence Awards
��� Best practice in recruitment andemployment of people with disabilities
02 Ability Award
��� Aimhigher programme – Northern IrelandBig Tick Award for Business in the CommunityExcellence and Chambers of Commerce in IrelandPresident’s Awards Commendation
Make it happen
Potential

Citizens
32
Citi
zens
� Profit contribution £1,575 million (2004 – £1,069 million)� Total income up 43%� Profit up 47%
Make it happen
K-Sea Transportation has been a businesscustomer with Citizens for over 3 years.It builds ferries, tugs and barges, one ofwhich is seen here on the famous StatenIsland crossing. To help fund furtherinvestment in its business K-Sea looked toCitizens Bank for a US$37 million SeniorCredit Facility, US$34 million in equipmentleases, and foreign exchange services.

2005
Div
isio
nal r
evie
w
33
Citizens ranks as the eighth largestcommercial banking organisationin the US by deposits. Last yearwas Citizens’ 13th consecutiveyear of record profits, achievedthrough the integration of CharterOne and strong organic growth.In 2005 Citizens increased itsincome by 42% to US$5,940 million.
��� Through Citizens Bank and Charter OneBank, Citizens’ network of retail and corporatebanking covers Connecticut, Delaware, Illinois,Indiana, Massachusetts, Michigan, New Hampshire,New Jersey, New York state, Ohio, Pennsylvania,Rhode Island and Vermont. Citizens has a retailand corporate presence in about 40 states.
��� The systems and account integration for 3 million customer accounts and around 8,000colleagues of the former Charter One Financial, Inc.,the company’s largest US acquisition, was completedin July 2005, five months ahead of schedule.
��� In 2005, all Citizens Bank and Charter Onebranches and facilities were re-branded, with morethan 70,000 new signs and ATM surrounds usingthe RBS logo, a new font for the bank name and thedistinctive Citizens green.
��� Citizens made more than 900,000 newconsumer loans totalling US$22 billion during 2005and processed more than 1.5 million credit
applications. Its Consumer Finance division is theNo.2 bank auto lender in the US and a top homeequity lender. The Consumer Finance divisionintroduced two new business lines: IndirectRecreational Vehicle and National Home Equity.Both new initiatives contributed operating profit intheir first year of operation.
��� Citizens’ “Switch Support” programme with automated concierge service has smoothedthe transition of customers switching to Citizensand Charter One from other banks.
��� Our supermarket banking programmecontinued its momentum during 2005, adding 34 branches in strategic locations with our primarypartners. With around 520 Citizens Bank andCharter One in-store branches, Citizens is now thesecond-largest supermarket banker in the US.
��� Building on this momentum, in January 2006 Citizens announced the opening of 75 branchesin Stop & Shop Supermarkets over the next threeyears, expanding its supermarket banking franchise into New York’s Hudson Valley, Rocklandand Westchester Counties and Long Island. Thepartnership with Stop & Shop began in the NewEngland franchise in 2001, where it has grown to125 stores.
��� RBS National Bank, now part of Citizens’ UScredit cards division, launched the Circle RewardsMasterCard that can be issued automatically when a qualifying customer opens an account at a Citizens Bank or Charter One branch.
Make it happen
Drive

Citizens continued
34
Citi
zens
Citizens was the No.2 US Small Business Administration lender in the US for the fourth consecutive year.
Citizens’ International Cash Management collaboration with Corporate Markets resulted in 300 new Citizens accounts with existing RBS customers.
Make it happen
Ryerson, Inc., based in Chicago, is NorthAmerica’s leading processor and distributorof metals. Our ability to meet the complexneeds of large commercial customers isdemonstrated in the partnership betweenRBS Corporate Markets, which providedRyerson with credit facilities, and CharterOne, which was able to offer treasurymanagement services.

2005
Div
isio
nal r
evie
w
35
��� Kroger Personal Finance, a joint venturebetween Citizens’ cards division and Kroger Co.,the second largest supermarket chain in the US,is offering KPF credit cards in nearly 2,200 storesand is branching out into other products.We launched seven different branded cardprogrammes in 2005 for Kroger customers,launched a MasterCard-branded gift card andstarted installing RBS Lynk-supported ATMs into a number of Kroger locations.
��� Citizens was the No.1 US Small BusinessAdministration (SBA) lender in the Mid-Atlantic,Midwest and New England regions in 2005, and the No.2 lender in the US for the fourth consecutiveyear. We made over 10,000 SBA-backed loans,totalling more than US$416 million, whichrepresented a 79% increase in volume over 2004.
��� In its first year of Citizens ownership,Charter One’s new Business Banking team grew its SBA lending to No.1 in the Midwest in both thenumber of loans written and total dollars loanedduring 2005. Charter One became top SBA lenderin Illinois, Indiana, Michigan and Ohio.
��� Also in Ohio, Charter One is sponsoring the new Charter One Global Enterprise Center inCleveland to fuel economic growth by maximisingnortheast Ohio’s international businessdevelopment potential.
��� In addition to lending at the communitybanking, middle market and large corporate levels, Citizens Corporate Banking services hasworked effectively in partnership with RBSCorporate Markets. This provides additional expertiseand flexibility to meet the needs of larger customersand craft complex financings. Services include
interest rate protection, foreign exchange, cashmanagement, asset finance and administration,asset-based lending and private equity capital.
��� The management and business of RBSAsset Finance, Inc. has been transferred from RBS Corporate Markets to Citizens. This integrationcombined the existing Citizens asset financecompany, Citizens Leasing, with Charter One’s ICX Corporation and the group formerly known as RBS Lombard to form RBS Asset Finance.The combined company is the eighth largest bank-affiliated leasing company in the US.
��� During 2005, RBS transferred to Citizens the operating control of the electronic processingprovider RBS Lynk. RBS Lynk began cross-sellingmerchant services to small business customersthrough Citizens and Charter One branches andtheir business bankers.
��� In late 2004, Citizens established newInternational Cash Management services withCorporate Markets for companies doing business in the US and the EU, resulting in nearly 300 newcustomer accounts at Citizens during 2005 forexisting RBS customers. These customers use anextensive array of cash management services, andhave brought in more than US$80 million of newcore deposits.
��� Since it began in 2004, Citizens’ Job Bankoffered US$144 million in loan funds at below-market rates to 11 companies that agreed to createan estimated 4,536 jobs. Citizens’ Housing Bankoffered US$167 million in low-interest loan funds tonon-profit housing developers to create 2,286affordable housing units in New England and Ohio.Both programmes will be extended in 2006.

36
Citi
zens
Citizens continued
Citizens is among the top 10 rankings in deposits among US commercial banking organisations.It ranks seventh in branches and ninth in ATMs.
Citizens was one of just two companies in 2005 to receive the US Chamber of Commerce Corporate Stewardship Award.
Make it happen
��� Citizens’ support for the community isextensive. Examples include a comprehensive,multi-million dollar investment plan to increase homeownership, strengthen commercial retail districts,and create an education district in Albany, New York;a new innovative product for low/moderate-incomehomebuyers introduced by CCO Mortgage Corp intraditionally under-served areas; a strong partnershipwith the Chicago Urban League on housing andfinancial literacy; US$700,000 of help with heating costsfor more than 345 homeless shelters in eight statesthrough the “Shelter Heating Assistance Campaign”;and assistance through our Champions in ActionSM
programme for close to 70 small, non-profit agenciesdedicated to a range of housing, health and youthissues in New England, Pennsylvania and Ohio.
��� Citizens’ support for its own people includesthe Home Buyer Assistance Programme, whichsince 2002 has helped more than 2,000 colleaguespurchase primary residences – often their firsthomes – with forgivable loans totalling more thanUS$10 million. The military leave policy, which bridgespay and benefits to cover the duration of militaryleave, has benefited more than 190 colleagues, andover 70 employees with serving family membershave been given time off with pay, air fares andhelp with travel expenses to visit their loved ones.
��� Since June 2005 Citizens has promotedlocal volunteering through the “Join Us” campaignand its associated website, which also providesinformation on the Champions in Action programmeand enables visitors to let Citizens know about localnon-profit organisations that they feel deserve thebank’s attention. Citizens created a special TsunamiSabbatical to send a colleague to Indonesia forthree months to help with relief and rebuildingefforts through Plan International. Citizens also
matched colleague donations for Hurricane Katrinarelief efforts, added its own corporate contribution,and collected customer donations to The RedCross and The Salvation Army through its networkof more than 1,600 branches.
��� Charter One secured the naming rights to thepreviously designated Lakefront Pavilion, a summerconcert performance centre on Northerly Island,between Lake Michigan and the Chicago skyline.
Awards��� Citizens was one of just two companies inthe United States to be awarded the US Chamberof Commerce Corporate Stewardship Award. Thisrecognition was for the company’s total performanceand contribution to economic, community andsocial progress. It noted Citizens’ Champions inAction, the Citizens Job Bank, and the company’sHome Buyer Assistance Programme.
��� Citizens Bank of Pennsylvania received the2005 Good Government Award from the League ofWomen Voters for its Citizens Job Bank initiative togrow new jobs during 2004 and 2005.
��� Citizens Financial Group received the 2005Secretary of Defense Employer Support FreedomAward, the US government’s highest honour forsupport of the Guard and Reserve for policies and programmes that support colleagues on activeduty well beyond US legal requirement.
��� Citizens received the Alfred P. Sloan Awardfor Business Excellence in Workplace Flexibilityfrom the Families and Work Institute, U.S. Chamberof Commerce’s Center for Workforce Preparationand the Center for Emerging Futures in recognitionof its many programmes to support employees.

2005
Div
isio
nal r
evie
w
37The Chicago
Defender is one of theoldest newspapers inAmerica serving the Afro-American community.Charter One built on itsSBA lending successoffering capital to innercity businesses like TheChicago Defender.
��
Circle Rewards.RBS National Bank, whichsells credit cards in the US, is now offering these to Citizens’ customers.In 2005 we launched Circle Rewards, a loyaltyprogramme with discountsfor air travel, hotels andbranded merchandise.
� � Fence America.RBS Lynk, based in Atlanta,offers a range of paymentsystems for retail andbusiness customers. FenceAmerica is one of the firstto use the innovative newproduct Treo, which allowscredit card payments to bemade via mobile phones.
��

RBS Insurance
38
RB
S I
nsur
ance
� Profit contribution £926 million (2004 – £881 million)� Total income up 8%� Profit up 5%
Churchill Home Insurance.David and Catherine Barton switched toChurchill Home Insurance last year.They loved the brand, saved £200 andfound the quality of service excellent.
Make it happen

Div
isio
nal r
evie
w
39
2005
RBS Insurance is the secondlargest general insurer in the UK.It sells and underwrites insurancevia the telephone, the internet,partnerships and a network ofbrokers. Its brands, includingDirect Line, Churchill, Privilege,Green Flag and NIG, are some ofthe best known in the UK. In 2005RBS Insurance increased its totalincome by 8% to £5,489 million.
��� The integration of the Direct Line andChurchill businesses was completed at the start ofSeptember 2005, within two years, ahead of timeand within budget. The combined businesses nowhave close to 20,000 employees.
��� We celebrated the 20th anniversary of theDirect Line red telephone in 2005. When it firstopened for business in April 1985, Direct Lineemployed just 63 people. Today it employs around6,500 people and handles an average of 12,000 carquotes every day.
��� Across its range of brands and products,RBS Insurance increased its total policies in-forceby 1.6 million to 25.9 million. Within this, total carpolicies increased by 5.7% to 10.6 million acrossthe UK and continental Europe.
��� In the United Kingdom, RBS Insurance isthe No.1 car insurer, with 8.7 million policies, andthe No.2 home insurer, with 4.6 million policies.
��� RBS Insurance now has over 4.9 million carrescue policies sold through Direct Line, Churchill,Green Flag, Privilege and many partners undertheir brands.
��� In continental Europe, RBS Insuranceincreased its car insurance policies by 14% to 1.9 million.
��� RBS Insurance is the No.2 travel insuranceprovider with 2.3 million policies; its pet policiesincreased by 20% to 0.6 million.
��� Direct Line launched several majorenhancements to its car product, including a NoClaims Discount (NCD) for named drivers on a Direct Line policy, multi-car discounts, matchedNCD and an NCD earned on company cars andmotorbikes.
��� Línea Directa became Spain’s sixth largestmotor insurer this year with 1.2 million in-forcepolicies and is now selling breakdown cover directto customers. Direct Line in Germany launchedmotor legal protection.
��� Since the re-launch of Privilege in August 2004, the ‘you don’t have to be posh to beprivileged’ campaign has delivered excellent brandrecognition and sales, with in-force car policiesincreasing by 50% and breakdown policies by 43% respectively.
Make it happen
Focus

RBS Insurance continued
40
RB
S I
nsur
ance
RBS Insurance is the strength behind some of the UK’s biggest and best known insurance brands offering customers more choice and better products.
��� Churchill launched its new travel product inJune, with customers now able to tailor cover totheir individual travel needs.
��� TRACKER, which specialises in recoveringstolen vehicles, was acquired in 2005. TRACKERtraced and recovered more than £36 million worth ofstolen cars and plant equipment over the year. In onecase, a vehicle was recovered in just 21 minutes.
��� NIG held six SME Business Academyroadshows throughout the country. The keyobjective of these events was to build NIG’s profile in the regions and forge close links with brokersand SME customers.
��� NIG joined imarket, the industry e-commerceinitiative designed to make it easier for brokers totransact commercial business electronically.
��� Continuing their consumer champion roles,Direct Line and Green Flag were again the headlinesponsors of Road Safety Week. Organised by roadsafety charity Brake each November to highlightroad safety issues, the 2005 theme was childpedestrian safety.
��� Direct Line partnered Durham Police in ahigh profile campaign to tackle the problem ofuninsured driving. By the end of 2005, more than1,000 uninsured vehicles, which Direct Lineestimates would have caused up to 2,000accidents, had been removed from the streets of Durham County.
Awards��� Direct Line – Car Insurer of the YearPersonal Finance Magazine
��� Direct Line – Best Motor Insurance ProviderYour Money Magazine
��� Direct Line – Best Online Motor InsuranceProviderYour Money Magazine
��� Direct Line – Best Household InsurerYour Mortgage Magazine
��� Direct Line – Special Achievement AwardSuperbrands
��� Churchill – Best Home and ContentsInsurance ProviderYour Money Direct Awards
��� Churchill – Travel Insurer of the YearInternational Travel Insurance Journal Awards
��� Churchill – Customer Service ComplaintsTeam of the YearThe National Customer Service Awards
��� Green Flag – Best Breakdown ProviderYour Money Magazine
��� Green Flag – Best Online Breakdown ProviderYour Money Magazine
��� Green Flag – UK Roadside AssistanceCompany of 2005Institute of Transport Management Awards
��� NIG – Risk Management Product of the Year(for All Risk Management (ARM))European Risk Management Awards
Make it happen

Div
isio
nal r
evie
w
41
2005
TRACKER hasprovided Balfour BeattyPower Networks with theability to track its vehicles24:7 via data on the internet.It has greatly improvedvehicle management,efficiency, flexibility anddriver safety and reducedinsurance premiums.
��
NIG. For the brokermarket, quick and accurateonline quotations are animportant part of theircompetitive offering. NIG’sCommercial Quotes systemis regularly accessed bybrokers such as SaffronInsurance to providecommercial insurance fortheir customers.
��
Direct Line.Over 1,000 uninsured carshave been taken off theroads as part of a jointinitiative between DurhamPolice and Direct Line.Drivers who can't provideevidence of insurancewithin 14 days have theircars crushed.
� �

42
Man
ufac
turin
gManufacturing
Manufacturing is the backbone of RBS, supplying IT, processing, telephone, property andpurchasing support for the Group’s customer-facing divisions.
Gogarburn. On 14 September 2005,Her Majesty The Queen and His RoyalHighness The Duke of Edinburgh formallyopened the new RBS headquarters inEdinburgh. It provides a superb workingenvironment, together with fitness, nurseryand conference facilities.
Make it happen

Div
isio
nal r
evie
w
43
2005
In 2005 Manufacturing redesignedits operations so that morecustomers’ queries are resolvedby the first person they contactand errors are reduced. Goodprogress was made with theintegration of Ulster Bank onto theGroup’s platform. Manufacturing’spurchasing and propertyoperations were benchmarked as“World Class” during the year.
��� Our network of over 7,400 ATMs processed690 million transactions during 2005. The dailyaverage volume was 1.9 million transactions,dispensing £119 million.
��� In 2005 we reduced the time it takes for acustomer to receive a fully operational debit cardafter loss or theft from 12 days to within three days.
��� Manufacturing processed 262,000 newmortgage applications and 61,000 extra borrowingmortgage applications for Group customers.
��� During 2005 we introduced a programmecalled ‘Lean’ across our operations. Developed inthe Japanese car industry and used worldwide,‘Lean’ is a customer-focused approach that usestargeted tools and techniques to remove waste,improve the flow of work and improve customerservice.
��� Broadening the skills of our teams in ourtelephone and service centres, and changing theirincentives, has generated a more responsiveworking culture. Customers enjoy better servicebecause we try to solve as many issues for them as we can in a single phone call.
��� We now have dedicated centres dealingwith corporate customers – helping to make theGroup one of the top service providers forcorporate and commercial customers in 2005.
��� In November 2005 a new Tesco PersonalFinance Centre was created in Glasgow bringingtogether telephony, loans and savings functionsunder one management team. Combining theseareas has created efficiencies and improvedservice to customers by giving people in the Centrea greater understanding of the full range of productsand services offered to customers.
��� The Group’s ‘Fraud Ring Task Force’ tacklesthe growing threat of ‘fraud rings’ – fraud caseslinked together which can fund terrorism andorganised crime. This team is already creatingconsiderable benefit for the Group in the earlyidentification and closure of fraud ring activity.
��� The Group remains focused on reducing the threats associated with electronic attacks likephishing – used by fraudsters to try to obtaincustomers’ security details over the Internet.During 2005 we experienced one of the lowestnumber of successful phishing attacks in the UKbanking industry.
��� In 2005 the key technology systemssupporting branches and other parts of the Group were available 99.95% of the time.
Make it happen
Determination

44
Man
ufac
turin
gManufacturing continued
Often referred to as “The Engine Room”, Manufacturing enables the Group to function 24 hours a day, 365 days a year.
��� In 2005 Group Workplace Operations, partof our Group Property function, was judged“World Class” by University College London, whomade the independent assessment using theglobally recognised ‘Attributes of a world class realestate organisation’ benchmark developed by theReal Estate Executive Board (REEB). REEB basethis benchmark model on the top 10% practicesdrawn from their membership of over 150 globalblue chip companies.
��� Manufacturing completed the delivery ofGogarburn, the Group’s new headquarters, onbudget and six months early.
��� Previously Royal Mail collected, sorted and delivered our mail to customers. We appointedUK Mail, a third party supplier, to collect and sortthe mail bags, and track and deliver them to theRoyal Mail for final delivery to the customer. By theyear end, UK Mail had processed over 200 millionenvelopes through downstream access, generatingsavings of £5 million. On average, 20% ofcustomers are now receiving their mail a day earlierthan they did formerly by 2nd class mail.
��� One customer service centre reduced itsuse of paper by 36% over 2005. Building on thisexperience, other centres are significantly reducingtheir use of paper.
��� RBS Group Purchasing achieved the highestscores within the 2005 Excellence in Procurementstudy, run by supply chain experts A.T. Kearney.The study, a multi-industry benchmark, involvedmore than 300 global blue chip companies andreinforced further our position as World Classglobal sourcing leaders.
��� Feedback from the employee opinion surveyshowed a significant improvement in engagementand motivation across Manufacturing, after more
than 1,500 people attended workshops oncoaching, developing and motivating their teams.
��� Offshore Operations took part in the Jerseyworkplace challenge which contributed to raisingover £25,000 for Jersey Hospice and Save theChildren in 2005.
Awards��� World Class Accreditation – StrategicSourcing team, Group Purchasing
A.T. Kearney
��� 100% Service Availability Programme,IT Team of the Year
European Banking Technology Award
��� Most innovative application of technology
Institute of Financial Services
��� Global Innovator’s Award – Group Property
CoreNet
��� Industry Champion
European Call Centre Awards
��� Top prize for Business Infrastructure andFacilities Management Strategy and Delivery
Royal Institute of Chartered Surveyors Property Management Awards
��� Corporate Occupier of the year
Scottish Property Awards, second year in a row
��� Gogarburn campus – most significantcontribution to the property industry in Scotland for 2005
Variety Club of Scotland
��� The Group’s internal mail handling servicewon a World Mail Award in the Quality category in May 2005.
Make it happen

Div
isio
nal r
evie
w
45
2005
Gogarburn.Gogarburn provides a firstclass working environmentand has received anumber of awards forenvironmental bestpractice.
��
Document Solutionsprocessed 345 millioncustomer communicationsin 2005, making it one ofthe largest mailing facilitiesin Europe. This enlargedfacility in Scotlandincreased capacity andresilience for the Group.
��
Ulster Bankrefurbishment.89 branches such as thisone at Dorset Street inDublin were upgraded as part of our £50 millionimprovement to the UlsterBank branch network, withwork planned on a further57 during 2006.
� �

46
Cor
pora
te R
espo
nsib
ility
Toynbee Hall is based in the east end ofLondon. Through our partnership RBS hascreated an innovative programme ofmodules to help adults better understand andmanage their finances, including the materialfor Services Against Financial Exclusionwhich will be rolled out across the UK.
Corporate Responsibility
Our prime responsibility is to ensure our business is run successfully, sustainably and with integrity. In 2005 our Sustainability Dow Jones score improved by 12% to 76%,scoring 28% above the global average for the sector.
Make it happen

2005
Cor
por
ate
Res
pon
sib
ility
47
There is a strong business case for building the trust ofstakeholders, and we can do this by demonstrating that weunderstand our responsibilitiesand operate with integrity.Below are some of our activities in 2005.
Financial inclusion��� We have 800,000 basic bank accountholders, an increase of 20% over 2004.
��� We have more than one-third of the basicbank accounts accessible through Post Offices.
��� Our 15 mobile banks bring banking servicesto 300 rural communities each week in the UK.
��� In 2005 the Group’s small business lendingin the 5% most deprived wards in the UK stood at£659 million.
Equator Principles��� During 2005, we contributed to the revisionof the Equator Principles to take account of theInternational Finance Corporation’s (IFC) revisedperformance standards.
Our people��� We were awarded the Gold standard inRace for Opportunity, positioning us sixth overall.
��� In 2005 we launched ‘The LeadershipJourney’, a Group-wide approach to developingleadership skills.
��� 86% of employees across the Groupparticipated in our 2005 Employee Opinion Survey.The Group scored above the Global FinancialServices Norm in every category. 84% ofrespondents believe that the Group is sociallyresponsible in the community.
The environment��� In 2005 66.9% of the Group’s electricity inthe UK and Ireland came from renewable sources,one of the highest percentages in the FinancialServices sector.
��� The Group’s new Edinburgh headquartersat Gogarburn has received a number of awards forenvironmental best practice, including BREEAM“Excellent” and ISO 14001.
��� In December 2005, the Group switched torecycled paper for office use in the UK and Ireland.
Benchmarking and Indexes
The Group continues to meet the sociallyresponsible investment criteria required forinclusion in the FTSE4Good Index.
The Group ranked 4th in the Dow JonesSustainability World Index for the banking sector,bringing our overall score to 76%, an increase of 12%. Our score was 28% above the globalaverage for the sector.
Our 2004 Corporate Responsibility Report ranked14th amongst the 100 largest global companies inthe 2005 Fortune 100 CR performance assessment.This placed the Group second amongst the 25Financial Service sector companies.
Key statistics
£368.3 billion loaned to ourcustomers
In the UK we are the sixthlargest employer in the FTSE100 paying £4.9 billion to ouremployees in salaries
£2.7 billion paid to the UKExchequer
£2.0 billion paid to ourshareholders in dividends
£7.5 billion paid to suppliers
634 million free UK ATMtransactions, dispensing £39.5 billion

48
Cor
pora
te R
espo
nsib
ility
Corporate Responsibility continued
The RBS group’s £56.2 million Community Investment programme goes beyond simple financialdonation and aims to generate long term benefit through genuine partnerships with charities,community groups, employees and other stakeholders.
Community investment In the UK, we focus on three programmes that we believe have a strong and positive impact:Supporting Staff Giving, Money Matters andMoving On.
Supporting Staff Giving��� In 2005, over 14,500 of our staff took part in our unique double matched payroll givingscheme which generated £8.5 million for 3,200charities across the UK and Ireland. In additionRBS supported a TV advertising campaign by 3 charities – Cancer Research UK, NSPCC andOxfam – which encouraged more employers and employees to take part in payroll giving.
��� 7,000 Community Cashback Awardstotalling £2.5 million were made to good causes,supported by our staff through fundraising orvolunteering.
��� Together with a £1 million Christmasdonation shared between the Top 10 Give As You Earn charities nominated by our staff, the three schemes generated a record £12 million in charitable donations.
Money Matters��� In 2005, Face 2 Face with Finance, theGroup’s unique programme to provide financialeducation, helped 260,000 young people betterunderstand personal finance. 550 members ofstaff worked with teachers to deliver lessons andinteractive activities.
��� The Group’s commitment to the MoneyAdvice Trust led to the take up of 5,324 freetraining places by personal money advisers,improving the quality of advice given to people in greatest financial hardship.
��� The Lone Parent Helpline responded to 25,465 calls (up from 21,000 in 2004) anddistributed 4,689 information packs.
Moving On��� The number of employees volunteering withThe Prince’s Trust and Fairbridge has increased thisyear with more than 1,600 employees now involvedwith both charities.
��� 112 schools completed Year One of theSupergrounds programme, which transformsschool grounds nominated through local retailbranches into attractive and stimulating places tolearn and play in safety. A further 183 schools arenow taking part in Year Two of the programme.
��� In 2005 the Group continued to support the Aimhigher Roadshows in England, Wales, Scotlandand Northern Ireland.
In the US, Citizens has a long history of working inpartnership with its local community. Activities focuson five key areas: affordable housing, economicdevelopment and job creation, financial literacy,volunteering and the Champions in Actionprogramme. Further details are on page 36.
Make it happen
Make it happen

2005
Cor
por
ate
Res
pon
sib
ility
49First Tee. Using golf
to teach life skills – RBS in the US has helped Sonya Mendez through TheFirst Tee programme. AsAchiever of the Year, shewon US$10,000 towardscollege education and is now mentored by an RBS employee.
��
Supergrounds.Communities across the UK have seen theirplaygrounds transformedinto Supergrounds.Youngsters like these on the Isle of Skye areamongst 250,000 who arenow more active outdoors.
� � School Banks.New to the Face2Faceprogramme – the schoolbanks train pupils tomanage a branch helpingthem to understand moneyand the banking system.In the first year, 20 schoolbanks have been establishedacross the UK.
��

50

section
01O
per
atin
g a
ndfin
anci
al r
evie
w
51
Op
erat
ing
and
fin
anci
al r
evie
w
Annual Report and Accounts 2005
Operating and financial review
Contents52 Presentation of information
53 Forward-looking statements
54 Description of business
56 Risk factors
57 Financial highlights
58 Summary consolidatedincome statement
61 Analysis of results
69 Divisional performance
82 Consolidated balance sheet
84 Cash flow
85 IFRS compared with US GAAP
85 Capital resources
86 Risk management

52
Ope
ratin
g an
d fin
anci
al r
evie
wPresentation of information
In the Report and Accounts, and unless specified otherwise,the term ‘company’ means The Royal Bank of Scotland Groupplc, ‘RBS’ or the ‘Group’ means the company and its subsidiaryundertakings, ‘the Royal Bank’ means The Royal Bank ofScotland plc and ‘NatWest’ means National Westminster Bank Plc.
The company publishes its financial statements in poundssterling (“£” or “sterling”). The abbreviations ‘£m’ and ‘£bn’represent millions and thousands of millions of poundssterling, respectively, and references to ‘pence’ representpence in the United Kingdom (“UK”). Reference to ‘dollars’ or‘$’ are to United States of America (“US”) dollars. Theabbreviations ‘$m’ and ‘$bn’ represent millions and thousandsof millions of dollars, respectively, and references to ‘cents’represent cents in the US. The abbreviation ‘€’ represents the‘euro’, the European single currency and the abbreviations ‘€m’and ‘€bn’ represent millions and thousands of millions of euros,respectively.
Certain information in this report is presented separately fordomestic and foreign activities. Domestic activities primarilyconsist of the UK domestic transactions of the Group. Foreignactivities comprise the Group’s transactions conductedthrough those offices in the UK specifically organised toservice international banking transactions and transactionsconducted through offices outside the UK.
The geographic analysis in the average balance sheet andinterest rates, changes in net interest income and averageinterest rates, yields, spreads and margins in this report havebeen compiled on the basis of location of office – UK andOverseas. Management believes that this presentationprovides more useful information on the Group’s yields,spreads and margins of the Group’s activities than would beprovided by presentation on the basis of the domestic andforeign activities analysis used elsewhere in this report as itmore closely reflects the basis on which the Group ismanaged. ‘UK’ in this context includes domestic transactionsand transactions conducted through the offices in the UKwhich service international banking transactions.
The Group distinguishes its trading from non-trading activitiesby determining whether a business unit’s principal activity istrading or non-trading and then attributing all of that unit’sactivities to one portfolio or the other. Although this methodmay result in some non-trading activity being classified astrading, and vice versa, the Group believes that any resultingmisclassification is not material.
International Financial Reporting StandardsAs required by the Companies Act 1985 and Article 4 of theEuropean Union IAS Regulation, the consolidated financialstatements of the Group have been prepared, for the first time,in accordance with International Financial Reporting Standardsadopted by the International Accounting Standards Board(IASB) and interpretations issued by the International FinancialReporting Interpretations Committee of the IASB (together‘IFRS’) as endorsed by the European Union. The Group,however, has taken advantage of the option in IFRS 1 ‘First-time Adoption of International Financial Reporting Standards’to implement IAS 39 ‘Financial Instruments: Recognition andMeasurement’ (IAS 39), IAS 32 ‘Financial Instruments:Disclosure and Presentation’ (IAS 32) and IFRS 4 ‘InsuranceContracts’ (IFRS 4) from 1 January 2005 without restating its2004 income statement and balance sheet.
The Group’s 2004 financial statements were prepared inaccordance with then current UK generally acceptedaccounting principles (“UK GAAP” or “previous GAAP”)comprising standards issued by the UK Accounting StandardsBoard, pronouncements of the Urgent Issues Task Force,relevant Statements of Recommended Accounting Practiceand provisions of the Companies Act 1985. The Group alsopresents information under generally accepted accountingprinciples in the US (“US GAAP”).
To allow more meaningful comparison with the 2005 results,pro forma results have been prepared for 2004. The pro formaresults include the effect of standards relating to financialinstruments and insurance contracts (IAS 32, IAS 39 and IFRS 4) and the basis of preparation of these results isdescribed on page 57.

section
01O
per
atin
g a
ndfin
anci
al r
evie
w
53
Op
erat
ing
and
fin
anci
al r
evie
w
Annual Report and Accounts 2005
Certain sections in this document contain ‘forward-lookingstatements’ as that term is defined in the United States PrivateSecurities Litigation Reform Act of 1995, such as statementsthat include the words ‘expect’, ‘estimate’, ‘project’, ‘anticipate’,‘believes’, ‘should’, ‘intend’, ‘plan’, ‘probability’, ‘risk’, ‘Value-at-Risk (“VaR”)’, ‘target’, ‘goal’, ‘objective’, ‘will’, ‘endeavour’, ‘outlook’,‘optimistic’, ‘prospects’ and similar expressions or variations onsuch expressions including, but not limited to, sections such as‘Chairman’s statement’ and ‘Group Chief Executive’s review’.
In particular, this document includes forward-lookingstatements relating, but not limited, to the Group’s potentialexposures to various types of market risks, such as interestrate risk, foreign exchange rate risk and commodity and equityprice risk. Such statements are subject to risks anduncertainties. For example, certain of the market risk disclosuresare dependent on choices about key model characteristics andassumptions and are subject to various limitations. By theirnature, certain of the market risk disclosures are only estimatesand, as a result, actual future gains and losses could differmaterially from those that have been estimated.
Other factors that could cause actual results to differ materiallyfrom those estimated by the forward-looking statementscontained in this document include, but are not limited to:general economic conditions in the UK and in other countriesin which the Group has significant business activities orinvestments, including the United States; the monetary and
interest rate policies of the Bank of England, the Board ofGovernors of the Federal Reserve System and other G-7central banks; inflation; deflation; unanticipated turbulence ininterest rates, foreign currency exchange rates, commodityprices and equity prices; changes in UK and foreign laws,regulations and taxes; changes in competition and pricingenvironments; natural and other disasters; the inability tohedge certain risks economically; the adequacy of loss reserves;acquisitions or restructurings; technological changes; changesin consumer spending and saving habits; and the success ofthe Group in managing the risks involved in the foregoing.
The forward-looking statements contained in this documentspeak only as of the date of this report, and the Group doesnot undertake to update any forward-looking statement toreflect events or circumstances after the date hereof or toreflect the occurrence of unanticipated events.
For a further discussion of certain risks faced by the Group,see Risk factors on page 56.
Forward-looking statements

54
Ope
ratin
g an
d fin
anci
al r
evie
wOperating and financial review
Description of businessIntroductionThe Royal Bank of Scotland Group plc is the holding companyof one of the world’s largest banking and financial servicesgroups, with a market capitalisation of £56 billion at the end of2005. Headquartered in Edinburgh, the Group operates in theUK, US and internationally through its two principal subsidiaries,the Royal Bank and NatWest. Both the Royal Bank and NatWestare major UK clearing banks whose origins go back over 275years. In the US, the Group’s subsidiary Citizens is ranked theeighth largest commercial banking organisation by deposits.The Group has a large and diversified customer base andprovides a wide range of products and services to personal,commercial and large corporate and institutional customers.
The Group had total assets of £776.8 billion and shareholders’equity of £35.4 billion at 31 December 2005. It is stronglycapitalised with a total capital ratio of 11.7% and tier 1 capitalratio of 7.6% as at 31 December 2005.
Organisational structure and business overviewThe Group’s activities are organised in the following businessdivisions: Corporate Markets (formerly Corporate Banking &Financial Markets), Retail Markets (comprising Retail Banking,Retail Direct and Wealth Management), Ulster Bank, Citizens,RBS Insurance and Manufacturing. A description of each ofthe divisions is given below.
Corporate Markets is focused on the provision of debt and riskmanagement services to medium and large businesses andfinancial institutions in the UK and around the world. CorporateBanking & Financial Markets was renamed Corporate Marketson 1 January 2006 when its activities were reorganised intotwo businesses, UK Corporate Banking and Global Banking &Markets, in order to enhance our focus on the distinct needs ofthese two customer segments. These two divisions broadlycorrespond to the analysis of Corporate Markets by customergrouping presented in this review.
Corporate Markets provides an integrated range of corebanking, structured finance and financial markets productsand services, including acquisition finance, trade finance,leasing, factoring, treasury services, money markets, foreignexchange, derivatives, bond origination and trading, sovereigndebt trading, futures brokerage and interest rate riskmanagement services.
Corporate Markets is the largest provider of banking, financeand risk management services to Mid-Corporate andCommercial customers in the UK. Through its network ofrelationship managers across the country it provides the fullrange of Corporate Markets products and services to small,medium and large companies.
Corporate Markets is a leading banking partner to majorcorporations and financial institutions around the world,specialising in providing a full range of debt financing, riskmanagement and investment services to its Global Banking & Markets customers.
Retail Markets was established in June 2005 to strengthen co-ordination and delivery of our multi-brand retail strategy.Retail Markets comprises Retail Banking, Retail Direct andWealth Management.
Retail Banking is one of the leading retail banks in the UK. Thedivision comprises both the Royal Bank and NatWest retail brands.It offers a full range of banking products and related financialservices to the personal, premium and small business markets.
In the personal banking market, Retail Banking offers acomprehensive product range: money transmission, savings,loans, mortgages and insurance. In the small business market,Retail Banking provides a full range of services which includemoney transmission and cash management, short, mediumand long-term financing, deposit products and insurance.
Customer choice and product flexibility are central to the RetailBanking proposition and customers are able to access servicesthrough a full range of channels: branches, ATMs, the internetand the telephone.
Retail Direct consists of the Group’s non-branch based retailbusinesses. Retail Direct issues a comprehensive range ofcredit and charge cards to personal and corporate customersand provides card processing services for retail businesses.It also includes Tesco Personal Finance, The One account,First Active UK, Direct Line Financial Services and LombardDirect, all of which offer products to customers through directchannels principally in the UK. In continental Europe, RetailDirect offers a similar range of products through the RBS andComfort Card brands.
Wealth Management provides private banking and investmentservices to its clients through a number of leading UK andoverseas private banking subsidiaries and offshore bankingbusinesses. Coutts is one of the world’s leading internationalwealth managers with over 20 offices worldwide, includingSwitzerland, Dubai, Monaco, Hong Kong and Singapore, as wellas its premier position in the UK. Adam & Company is the majorprivate bank in Scotland. The offshore banking businesses – TheRoyal Bank of Scotland International and NatWest Offshore –deliver retail banking services to local and expatriate customers,principally in the Channel Islands, the Isle of Man and Gibraltar.
Ulster Bank brings together Ulster Bank and First Active toprovide a highly effective challenger to the larger competitorsin the Irish banking market. Serving personal and smallbusiness customers, Ulster Bank Retail Banking providesbranch banking, wealth management and direct bankingthroughout the Republic of Ireland and Northern Ireland. Witha continued focus on providing customer choice and value,First Active serves personal and small business customersthrough its separately branded product offerings and branchnetwork throughout the Republic of Ireland. Both First Activeand Ulster Bank retain their own brands, branch networks anddistinctive customer propositions and benefits are achieved by selling more mortgage and savings products to UlsterBank’s customers and a broader range of banking products toFirst Active’s customers.

section
01O
per
atin
g a
ndfin
anci
al r
evie
w
55
Op
erat
ing
and
fin
anci
al r
evie
w
Annual Report and Accounts 2005
Ulster Bank Corporate Banking & Financial Markets caters forthe banking needs of business and corporate customers,including treasury and money market activities, asset finance,ebanking and international services.
Citizens is the second largest commercial banking organisationin New England and the eighth largest commercial bankingorganisation in the US measured by deposits. Citizens providesretail and corporate banking services under the Citizens brandin Connecticut, Delaware, Massachusetts, New Hampshire, NewJersey, New York state, Pennsylvania, Rhode Island and Vermontand the Charter One brand in Illinois, Indiana, Michigan andOhio. Through its branch network Citizens provides a full rangeof retail and corporate banking services, including personalbanking, residential mortgages and cash management. Inaddition, Citizens engages in a wide variety of commerciallending, consumer lending, commercial and consumer depositproducts, merchant credit card services, insurance products,trust services and retail investment services.
RBS Insurance is the second largest general insurer in the UK,by gross earned premiums. Through the Direct Line, Churchilland Privilege brands it sells and underwrites personalinsurance over the telephone and the internet in the UK.Through the Direct Line brand, RBS Insurance also sells andunderwrites personal insurance in Spain, Italy and Germany.Through UKI Partnerships, our partnership business, weoperate insurance schemes on behalf of third parties who inturn sell insurance products to their customers. NIG sellspersonal and commercial products through a network ofintermediaries, while Inter Group acts as an insuranceadministrator and Devitt Insurance Services operates as aspecialist broker administrator.
Manufacturing supports the customer facing businesses in theUK and Ireland and manages the Group’s telephony, accountmanagement and money transmission operations. It is alsoresponsible for information technology operations anddevelopment, global purchasing, property and other services.
Manufacturing drives optimum efficiencies in high volumeprocessing activities, leverages the Group’s purchasing powerand has become a centre of excellence for managing largescale and complex change programmes such as integration.
CompetitionThe Group faces intense competition in all the markets itserves. In the UK, the Group’s principal competitors are theother UK retail and commercial banks, building societies andthe other major international banks represented in London.
Competition for corporate and institutional customers in the UKis from UK banks and from large foreign financial institutionswho are also active and offer combined investment andcommercial banking capabilities. In asset finance, the Groupcompetes with banks and specialised asset finance providers,both captive and non-captive.
In the small business banking market, the Group competeswith other UK clearing banks, specialist finance providers and,for smaller businesses, building societies.
In the personal banking segment the Group competes with UKbanks and building societies, major retailers, life assurancecompanies and internet-only players. In the mortgage market theGroup competes with UK banks and building societies. NatWestLife and Royal Scottish Assurance compete with IndependentFinancial Advisors and life assurance companies. The competitivesituation in the long-term savings market is dynamic due to theuncertainties created by regulatory change and the continuedevolution of institutions, particularly in the mutual sector.
In the UK credit card market large retailers and specialist cardissuers, including major US operators, are active in addition to the UK banks. Competitive activity is across a number ofdimensions including introductory and longer term pricing,loyalty and reward schemes, and packaged benefits. Whilstcompetition remains intense, pricing of introductory interestrate offers has become less aggressive. In addition to physicaldistribution channels, providers compete through directmarketing activity and the internet.
In Wealth Management, The Royal Bank of Scotland Internationalcompetes with other UK and international banks to offeroffshore banking services. Coutts and Adam & Companycompete as private banks with UK clearing and private banks,and with international private banks.
RBS Insurance competes in personal lines insurance and to alimited extent in commercial insurance. There is strongcompetition from a range of insurance companies which nowoperate telephone and internet direct sales businesses. RBSInsurance also competes with local insurance companies inthe direct motor insurance markets in Spain, Italy and Germany.
In Ireland, Ulster Bank and First Active compete in retail andcommercial banking with the major Irish banks and buildingsocieties, and with other UK and international banks andbuilding societies active in the market. Competition isintensifying as UK, Irish and other European institutions seekto expand their businesses.
In the United States, where competition is intense, Citizenscompetes in the New England, Mid-Atlantic and Mid-West retailand mid-corporate banking markets with local and regionalbanks and other financial institutions. The Group alsocompetes in the US in large corporate lending and specialisedfinance markets, and in fixed-income trading and sales.Competition is principally with the large US commercial andinvestment banks and international banks active in the US.
In other international markets, principally in continental Europe,the Group faces competition from the leading domestic andinternational institutions active in the relevant national markets.

56
Ope
ratin
g an
d fin
anci
al r
evie
wOperating and financial review continued
Risk factorsSet out below are certain risk factors which could affect theGroup’s future results and cause them to be materially differentfrom expected results. The Group’s results are also affected bycompetition and other factors. The factors discussed in thisreport should not be regarded as a complete andcomprehensive statement of all potential risks anduncertainties.
The financial performance of the Group is affected byborrower credit quality and general economic conditions,in particular in the UK, US and EuropeRisks arising from changes in credit quality and therecoverability of loans and amounts due from counterpartiesare inherent in a wide range of the Group’s businesses.Adverse changes in the credit quality of the Group’s borrowersand counterparties or a general deterioration in UK, US,European or global economic conditions, or arising from systemicrisks in the financial systems, could affect the recoverabilityand value of the Group’s assets and require an increase in theprovision for impairment losses and other provisions.
Changes in interest rates, foreign exchange rates, equity pricesand other market factors affect the Group’s businessThe most significant market risks the Group faces are interestrate, foreign exchange and bond and equity price risks.Changes in interest rate levels, yield curves and spreads mayaffect the interest rate margin realised between lending andborrowing costs. Changes in currency rates, particularly in thesterling-dollar and sterling-euro exchange rates, affect thevalue of assets and liabilities denominated in foreigncurrencies and affect earnings reported by the Group’s non-UK subsidiaries, mainly Citizens, RBS Greenwich Capital andUlster Bank, and may affect income from foreign exchangedealing. The performance of financial markets may causechanges in the value of the Group’s investment and tradingportfolios. The Group has implemented risk managementmethods to mitigate and control these and other market risks towhich the Group is exposed. However, it is difficult to predictwith accuracy changes in economic or market conditions andto anticipate the effects that such changes could have on theGroup’s financial performance and business operations.
The Group’s insurance businesses are subject to inherent risksinvolving claimsFuture claims in the Group’s general and life assurancebusiness may be higher than expected as a result of changingtrends in claims experience resulting from catastrophicweather conditions, demographic developments, changes inmortality and other causes outside the Group’s control. Suchchanges would affect the profitability of current and futureinsurance products and services. The Group re-insures someof the risks it has assumed.
Operational risks are inherent in the Group’s businessThe Group’s businesses are dependent on the ability toprocess a very large number of transactions efficiently andaccurately. Operational losses can result from fraud, errors byemployees, failure to document transactions properly or toobtain proper authorisation, failure to comply with regulatoryrequirements and Conduct of Business rules, equipmentfailures, natural disasters or the failure of external systems, forexample, the Group’s suppliers or counterparties. Although theGroup has implemented risk controls and loss mitigationactions, and substantial resources are devoted to developingefficient procedures and to staff training, it is only possible tobe reasonably, but not absolutely, certain that such procedureswill be effective in controlling each of the operational risksfaced by the Group.
Each of the Group’s businesses is subject to substantialregulation and regulatory oversight. Any significant regulatorydevelopments could have an effect on how the Groupconducts its business and on the results of operationsThe Group is subject to financial services laws, regulations,administrative actions and policies in each location in whichthe Group operates. This supervision and regulation, inparticular in the UK and US, if changed could materially affectthe Group’s business, the products and services offered or thevalue of assets.
Future growth in the Group’s earnings and shareholder valuedepends on strategic decisions regarding organic growth andpotential acquisitionsThe Group devotes substantial management and planningresources to the development of strategic plans for organicgrowth and identification of possible acquisitions, supportedby substantial expenditure to generate growth in customerbusiness. If these strategic plans do not meet with success,the Group’s earnings could grow more slowly or decline.
The risk of litigation is inherent in the Group’s operationsIn the ordinary course of the Group’s business, legal actions,claims against and by the Group and arbitrations arise; theoutcome of such legal proceedings could affect the financialperformance of the Group.
The Group is exposed to the risk of changes in tax legislationand its interpretation and to increases in the rate of corporateand other taxes in the jurisdictions in which in operates The Group’s activities are subject to tax at various rates aroundthe world computed in accordance with local legislation andpractice. Action by governments to increase tax rates or toimpose additional taxes would reduce the profitability of theGroup. Revisions to tax legislation or to its interpretation mightalso affect the Group's results in the future.

section
01O
per
atin
g a
ndfin
anci
al r
evie
w
57
Op
erat
ing
and
fin
anci
al r
evie
w
Annual Report and Accounts 2005
Financial highlightsPro forma
2005 2004 2004for the year ended 31 December £m £m £m
Total income (1) 25,569 23,391 22,515Profit before tax, purchased intangibles amortisation, integration costs and
net gain on sale of strategic investments and subsidiaries 8,251 7,849 7,108Profit before tax 7,936 7,284 6,543Profit attributable to ordinary shareholders 5,392 4,856 4,620Cost:income ratio (%) (2) 41.8% 39.8% 41.8%Basic earnings per share (pence) 169.4 157.4 149.8Adjusted earnings per share (pence) (3) 175.9 170.2 162.6Adjusted after-tax return on equity (%) (4) 18.2% 18.9% 18.5%
1 January2005 2004 2005
at 31 December £m £m £m
Total assets 776,827 588,122 696,510Loans and advances to customers 417,226 347,251 381,162Deposits 453,274 383,198 421,072Shareholders’ equity 35,435 33,905 30,022Risk asset ratio – tier 1 (%) 7.6 7.0 6.7
– total (%) 11.7 11.7 11.6
Notes:(1) Total income for the year ended 31 December 2005 excludes gains on sale of strategic investments and subsidiaries. In the statutory consolidated income statement on page
145, these items are included in total income.
(2) Cost:income ratio represents operating expenses excluding purchased intangibles amortisation, integration costs and loss on sale of subsidiaries, expressed as a percentage oftotal income excluding gain on sale of strategic investments and after netting operating lease depreciation against rental income, and excluding acquisitions.
(3) Adjusted earnings per share is based on earnings adjusted for purchased intangibles amortisation, integration costs and net gain on sale of strategic investments andsubsidiaries.
(4) Adjusted after-tax return on equity is based on profit attributable to ordinary shareholders adjusted for purchased intangibles amortisation, integration costs and net gain on sale ofstrategic investments and subsidiaries, and average equity shareholders’ funds.
Basis of preparation of pro forma resultsIn preparing its annual results, the Group has taken advantage of the option in IFRS 1 ‘First-time Adoption of International FinancialReporting Standards’ to implement IAS 39 ‘Financial Instruments: Recognition and Measurement’ (“IAS 39”), IAS 32 ‘FinancialInstruments: Disclosure and Presentation’ (“IAS 32”) and IFRS 4 ‘Insurance Contracts’ (“IFRS 4”) from 1 January 2005 withoutrestating its 2004 income statement and balance sheet. However, given the importance of these standards, the Group has provideddetailed pro forma information for the year ended 31 December 2004 reflecting the estimated effect of these standards to facilitateinter-period comparison. This pro forma information has been prepared on the following basis:
(i) The requirements of IAS 32, IAS 39 and IFRS 4 have been applied from 1 January 2004 except for the requirements relating tohedge accounting; no hedge ineffectiveness has been recognised in profit or loss.
(ii) Impairment provisions reflect the information and estimates on which previous GAAP provisions were established.
(iii) Classification of financial assets into held-to-maturity, held-for-trading, available-for-sale, loans and receivables or designated as at fair value through profit or loss at 1 January 2004 is consistent with the approach adopted on 1 January 2005 on implementationof IAS 39.

58
Ope
ratin
g an
d fin
anci
al r
evie
wOperating and financial review continued
Summary consolidated income statement for the year ended 31 December 2005The income statement set out below shows purchased intangibles amortisation, integration costs and net gain on sale of strategicinvestments and subsidiaries separately. In the statutory consolidated income statement on page 145, these items are included in non-interest income and operating expenses as appropriate.
Pro forma2005 2004 2004
£m £m £m
Net interest income 9,918 9,071 9,003Fees and commissions receivable 6,750 6,473 6,071Fees and commissions payable (1,841) (1,926) (1,920)Other non-interest income 4,963 4,126 3,838Insurance premium income 6,076 6,146 6,032Reinsurers’ share (297) (499) (509)Non-interest income 15,651 14,320 13,512Total income 25,569 23,391 22,515Operating expenses 11,298 9,797 9,871Profit before other operating charges 14,271 13,594 12,644Insurance claims 4,413 4,565 4,245Reinsurers’ share (100) (305) (299)Operating profit before impairment losses 9,958 9,334 8,698Impairment losses 1,707 1,485 1,590Profit before tax, purchased intangibles amortisation, integration costs and
net gain on sale of strategic investments and subsidiaries 8,251 7,849 7,108Amortisation of purchased intangible assets 97 45 45Integration costs 458 520 520Net gain on sale of strategic investments and subsidiaries 240 — —Profit before tax 7,936 7,284 6,543Tax on profit 2,378 1,995 1,856Profit for the year 5,558 5,289 4,687Minority interests 57 177 51Preference dividends 109 256 16Profit attributable to ordinary shareholders 5,392 4,856 4,620
Basic earnings per ordinary share 169.4p 157.4p 149.8pIntangibles amortisation 2.0p 1.2p 1.2pIntegration costs 9.9p 11.6p 11.6pNet gain on sale of strategic investments and subsidiaries (5.4p) — —Adjusted earnings per ordinary share 175.9p 170.2p 162.6p

section
01O
per
atin
g a
ndfin
anci
al r
evie
w
59
Op
erat
ing
and
fin
anci
al r
evie
w
Annual Report and Accounts 2005
2005 compared with 2004ProfitThe implementation of IAS 32, IAS 39 and IFRS 4 affected thetiming of recognition of income and costs, classification ofdebt and equity, impairment provisions and accounting forinsurance contracts in 2005. The effect of implementing therequirements of these standards in 2004 would have been toreduce profit before tax by £741 million for the year ended 31 December 2004.
Profit before tax, purchased intangibles amortisation, integrationcosts and net gain on sale of strategic investments andsubsidiaries increased by 5% or £402 million, from £7,849 million to £8,251 million. Profit before tax was up 9%,from £7,284 million to £7,936 million.
Total incomeTotal income, excluding the gain on sale of strategicinvestment, was up 9% or £2,178 million to £25,569 million.This reflected growth in all divisions particularly CorporateMarkets, Citizens and Ulster Bank. The effect of implementingthe requirements of IAS 32, IAS 39 and IFRS 4 in 2004 wouldhave been to reduce total income by £876 million for the yearended 31 December 2004.
Net interest income increased by 9% to £9,918 million.Average loans and advances to customers and averagecustomer deposits grew by 24% and 17% respectively. Theeffect of implementing the requirements of IAS 32, IAS 39 andIFRS 4 in 2004 would have been to reduce net interest incomeby £68 million for the year ended 31 December 2004. Interestincome is recognised on a constant yield basis under IFRS;under UK GAAP interest was recognised on an accrual basis.
Non-interest income increased by 9% to £15,651 million withgood growth in banking fee income, financial markets incomeand insurance premium income. Non-interest incomerepresents 61% of total income. The effect of implementing therequirements of IAS 39 and IFRS 4 in 2004 would have been toreduce non-interest income by £808 million for the year ended31 December 2004.
Operating expensesOperating expenses, excluding intangibles amortisation, integrationcosts and loss on sale of subsidiaries, rose by 15% to £11,298million. The effect of implementing the requirements of IAS 39and IFRS 4 in 2004 would have been to increase operatingexpenses by £74 million for the year ended 31 December 2004.
IntegrationIntegration costs were £458 million compared with £520 millionin 2004. Included in both periods are software amortisationunder IFRS relating to the acquisition of NatWest. The balanceprincipally relates to the integration of Churchill, First Activeand Citizens’ acquisitions, including Charter One which wasacquired in August 2004.
Cost:income ratioThe Group’s cost:income ratio in 2005 excluding acquisitionswas 41.8%, reflecting the impact on income in 2005 of IAS 32,IAS 39 and IFRS 4.
Net insurance claimsBancassurance and general insurance claims, afterreinsurance which under IFRS, include maturities andsurrenders, increased by 1% to £4,313 million. The increasereflects volume growth and maturities of our guaranteedcapital bonds. The effect of implementing the requirements of IFRS 4 in 2004 would have been to reduce net claims by£314 million for the year ended 31 December 2004.
Impairment lossesImpairment losses were £1,707 million compared with £1,485 million in 2004. Overall credit quality remained strong in 2005, with improvements in Corporate Markets partlyoffsetting higher impairment losses in Retail Markets. Theeffect of implementing the requirements of IAS 39 in 2004would have been to increase loan impairment losses by £105 million for the year ended 31 December 2004.
EarningsBasic earnings per ordinary share increased by 8% from 157.4pto 169.4p. Earnings per ordinary share, adjusted for purchasedintangibles amortisation, integration costs and net gain on saleof strategic investments and subsidiaries, increased by 3%,from 170.2p to 175.9p. The effect of implementing therequirements of IAS 32, IAS 39 and IFRS 4 in 2004 reducedboth basic and adjusted earnings per share by 7.6p, 5%.
A final dividend of 53.1p per ordinary share, up 29% isrecommended, giving a total dividend for the year of 72.5p, anincrease of 25%. If approved, the final dividend will be paid on9 June 2006 to shareholders registered on 10 March 2006. Thetotal dividend is covered 2.4 times by earnings beforepurchased intangibles amortisation, integration costs and netgain on sale of strategic investments and subsidiaries.
Balance sheetTotal assets of £776.8 billion at 31 December 2005 were up£188.7 billion, 32%, compared with 31 December 2004, with£108.4 billion of this increase arising from the implementationof IAS 32, IAS 39 and IFRS 4 on 1 January 2005, and thebalance reflecting business growth.
Loans and advances to customers were up £70.0 billion,20%, at £417.2 billion of which £33.9 billion resulted from theimplementation of IAS 32 and IAS 39, mainly as a result of thegrossing up of previously netted customer balances. Excludingthis and a decrease in reverse repos, down 24%, £15.7 billionto £48.9 billion, customer lending was up £51.8 billion, 16%,reflecting organic growth across all divisions.
Customer accounts were up £59.5 billion, 21% at £342.9 billionwith £31.7 billion arising from the implementation of IAS 32 andIAS 39, largely reflecting the grossing up of previously netted deposits. Excluding this and repos, which decreased£5.7 billion, 11% to £48.8 billion, deposits rose by £33.5 billion,13%, to £294.1 billion with good growth in all divisions.
Capital ratios at 31 December 2005 were 7.6% (Tier 1) and11.7% (Total).

60
Ope
ratin
g an
d fin
anci
al r
evie
wOperating and financial review continued
2005 compared with pro forma 2004ProfitProfit before tax, purchased intangibles amortisation,integration costs and net gain on sale of strategic investmentsand subsidiaries increased by 16% or £1,143 million, from£7,108 million to £8,251 million.
Profit before tax was up 21%, from £6,543 million to £7,936 million, reflecting strong organic income growth in all divisions and a full year’s contribution from acquisitionsmade during 2004.
Total incomeThe Group achieved strong growth in income during 2005.Total income was up 14% or £3,054 million to £25,569 million.Excluding acquisitions and at constant exchange rates, totalincome was up by 10%, £2,219 million.
Net interest income increased by 10% to £9,918 million andrepresents 39% of total income (2004 – 40%). Average loansand advances to customers and average customer depositsgrew by 23% and 17% respectively, or 17% and 12%respectively excluding acquisitions.
Net interest marginThe Group’s net interest margin at 2.55% was down from2.81% in 2004, due mainly to growth in corporate andmortgage lending and a flattening of the US dollar yield curve.
Non-interest income increased by 16% to £15,651 million andrepresents 61% of total income (2004 – 60%).
Operating expensesOperating expenses, excluding intangibles amortisation andintegration costs, rose by 14% to £11,298 million. Excludingacquisitions and at constant exchange rates, operatingexpenses were up by 10%, £962 million.
Cost:income ratioThe Group’s cost:income ratio was 42.4% compared with42.0% in 2004. Excluding acquisitions and at constantexchange rates, the cost:income ratio was unchanged at41.8%.
Net insurance claimsBancassurance and general insurance claims, afterreinsurance, which under IFRS include maturities andsurrenders, increased by 9% to £4,313 million reflectingvolume growth and maturities of our guaranteed capital bonds.
Impairment lossesImpairment losses were £1,707 million compared with £1,590 million in 2004, an increase of 7%, or 5% excludingacquisitions.
Risk elements in lending and potential problem loans represented1.60% of gross loans and advances to customers excludingreverse repos at 31 December 2005 (1 January 2005 – 1.84%).
Provision coverage of risk elements in lending and potentialproblem loans was 65% compared with 70% at 1 January2005. This reflects amounts written-off and the changing mixfrom unsecured to secured exposures.
IntegrationIntegration costs were £458 million compared with £520 millionin 2004. Included are software costs relating to the integrationof NatWest which were written-off as incurred under UK GAAPbut on transition to IFRS were capitalised and amortised. Allsuch software is now fully amortised. The balance principallyrelates to the integration of Churchill, First Active and Citizens’acquisitions, including Charter One which was acquired inAugust 2004.
Earnings and dividendsBasic earnings per ordinary share increased by 13%, from149.8p to 169.4p. Earnings per ordinary share adjusted forintangibles amortisation, integration costs and net gain on saleof strategic investments and subsidiaries increased by 8%,from 162.6p to 175.9p.
Balance sheetTotal assets were £776.8 billion at 31 December 2005, 12%higher than total assets of £696.5 billion at 1 January 2005.
Lending to customers, excluding repurchase agreements andstock borrowing (“reverse repos”), increased in 2005 by 16%or £51.8 billion to £368.3 billion. Customer deposits, excludingrepurchase agreements and stock lending (“repos”), grew by13% or £33.5 billion to £294.1 billion over the same period.
Capital ratios at 31 December 2005 were 7.6% (Tier 1) and11.7% (Total).
ProfitabilityThe adjusted after-tax return on ordinary equity, which is basedon profit attributable to ordinary shareholders beforeintangibles amortisation, integration costs and net gain on saleof strategic investments and subsidiaries, and averageordinary equity, was 18.2%.

section
01O
per
atin
g a
ndfin
anci
al r
evie
w
61
Op
erat
ing
and
fin
anci
al r
evie
w
Annual Report and Accounts 2005
Analysis of resultsNet interest income
Pro forma2005 2004 2004
£m £m £m
Interest receivable (1, 2) 21,505 16,666 17,082Interest payable (1, 2) (11,720) (7,548) (8,082)Net interest income (1, 2) 9,785 9,118 9,000
% % %Gross yield on interest-earning assets of the banking business 5.60 5.26 5.34Cost of interest-bearing liabilities of the banking business (3.35) (2.70) (2.80)Interest spread of the banking business 2.25 2.56 2.54Benefit from interest-free funds 0.30 0.32 0.27Net interest margin of the banking business 2.55 2.88 2.81
Yields, spreads and margins of the banking business % % %Gross yield (3)
Group 5.60 5.26 5.34UK 6.07 5.65 5.79Overseas 4.76 4.38 4.34
Interest spread (4)
Group 2.25 2.56 2.54UK 2.48 2.64 2.65Overseas 1.89 2.48 2.40
Net interest margin (5)
Group 2.55 2.88 2.81UK 2.66 2.90 2.86Overseas 2.35 2.83 2.71
The Royal Bank of Scotland plc base rate (average) 4.65 4.38 4.38London inter-bank three month offered rates (average):
Sterling 4.76 4.64 4.64Eurodollar 3.56 1.62 1.62Euro 2.18 2.11 2.11
Notes:
(1) Interest-earning assets and interest-bearing liabilities exclude the Retail bancassurance long-term assets and liabilities attributable to policyholders, in view of their distinctnature. As a result, net interest income has been adjusted by £59 million (2004 – £47 million).
(2) Interest income has been adjusted by £115 million (2004 – £49 million) and interest expense by £307 million (2004 – £99 million) to record interest on financial assets andliabilities designated as at fair value through profit or loss. Related interest-earning assets and interest-bearing liabilities have also been adjusted.
(3) Gross yield is the interest rate earned on average interest-earning assets of the banking business.
(4) Interest spread is the difference between the gross yield and the interest rate paid on average interest-bearing liabilities of the banking business.
(5) Net interest margin is net interest income of the banking business as a percentage of average interest-earning assets of the banking business.
2005 compared with 2004Group – The net interest margin at 2.55% was down 33 basispoints from 2.88% in 2004. The effect of implementing IAS 32and IAS 39 in 2004 would have been to decrease the 2004margin by 7 basis points.
UK – The UK net interest margin, down 24 basis points at2.66%, would have declined 20 basis points if IAS 32 and IAS 39 had been implemented in 2004.
Overseas – The Overseas net interest margin was down 48basis points from 2.83% to 2.35% of which 12 basis pointswould have been attributable to the effect of implementing IAS 32 and IAS 39 in 2004.
2005 compared with pro forma 2004The net interest margin at 2.55% was down 26 basis pointsfrom 2.81% in 2004. Product mix changes accounted for 17basis points of the decline, driven by organic growth in lowermargin mortgage lending and large corporate loans, and inrental assets as well as a change in deposit mix. The flatteningof the US dollar yield curve accounted for 6 basis points of thereduction:the remainder was due to price re-positioning ofsome of our products.
UK – The UK net interest margin declined 20 basis points to2.66%. This arose primarily from organic growth in lowermargin mortgage lending and large corporate loans, price re-positioning, changes in deposit mix and higher levels of rentalassets.
Overseas – The Overseas net interest margin declined 36 basispoints from 2.71% to 2.35% mainly reflecting flattening of the USdollar yield curve and growth in lower margin mortgage lending.

62
Ope
ratin
g an
d fin
anci
al r
evie
wOperating and financial review continued
Average balance sheet and related interest
2005 2004
Average Averagebalance Interest Rate balance Interest Rate
£m £m % £m £m %
AssetsTreasury bills and other eligible bills – UK 3,160 138 4.37 835 34 4.07
– Overseas 63 2 3.17 62 1 1.61Loans and advances to banks – UK 15,338 649 4.23 13,556 529 3.90
– Overseas 9,465 308 3.25 9,189 264 2.87Loans and advances to customers – UK 212,991 13,510 6.34 186,117 11,150 5.99
– Overseas 104,594 5,207 4.98 69,118 3,201 4.63Debt securities – UK 15,553 697 4.48 19,734 726 3.68
– Overseas 22,526 994 4.41 18,132 761 4.20
Total interest-earning assets – banking business (2, 3) 383,690 21,505 5.60 316,743 16,666 5.26
– trading business (4) 172,990 133,353
Total interest-earning assets 556,680 450,096Non-interest-earning assets (2, 3) 180,368 72,711
Total assets 737,048 522,807
Percentage of assets applicable to overseas operations 35.3% 32.9%
Liabilities and shareholders’ equity
Deposits by banks – UK 34,742 1,192 3.43 35,059 1,060 3.02– Overseas 27,383 891 3.25 16,425 398 2.42
Customer accounts: demand deposits – UK 73,653 2,056 2.79 67,519 1,568 2.32– Overseas 13,858 299 2.16 11,580 147 1.27
Customer accounts: savings deposits – UK 26,727 778 2.91 23,149 625 2.70– Overseas 21,700 381 1.76 18,349 252 1.37
Customer accounts: other time deposits – UK 60,454 2,328 3.85 51,440 1,699 3.30– Overseas 32,024 979 3.06 20,725 479 2.31
Debt securities in issue – UK 52,672 2,071 3.93 41,058 1,351 3.29– Overseas 19,621 633 3.23 12,320 229 1.86
Subordinated liabilities – UK 23,948 1,122 4.69 17,959 665 3.70– Overseas 2,642 154 5.83 235 15 6.38
Internal funding of trading business – UK (37,628) (1,125) 2.99 (35,317) (920) 2.60– Overseas (2,186) (39) 1.78 (758) (20) 2.64
Total interest-bearing liabilities – banking business (2, 3) 349,610 11,720 3.35 279,743 7,548 2.70
– trading business (4) 172,744 131,743
Total interest-bearing liabilities 522,354 411,486Non-interest-bearing liabilities Demand deposits – UK 17,484 17,157
– Overseas 11,181 9,101Other liabilities (3, 4) 153,081 53,978Shareholders’ equity 32,948 31,085
Total liabilities and shareholders’ equity 737,048 522,807
Percentage of liabilities applicable to overseas operations 33.5% 30.5%
Notes:
(1) The analysis into UK and Overseas has been compiled on the basis of location of office.
(2) Interest-earning assets and interest-bearing liabilities exclude the Retail bancassurance long-term assets and liabilities attributable to policyholders, in view of their distinctnature. As a result, net interest income has been adjusted by £59 million (2004 – £47 million).
(3) Interest income has been adjusted by £115 million (2004 – £49 million) and interest expense by £307 million (2004 – £99 million) to record interest on financial assets andliabilities designated as at fair value through profit or loss. Related interest-earning assets and interest-bearing liabilities have also been adjusted.
(4) Interest receivable and interest payable on trading assets and liabilities are included in income from trading activites.

section
01O
per
atin
g a
ndfin
anci
al r
evie
w
63
Op
erat
ing
and
fin
anci
al r
evie
w
Annual Report and Accounts 2005
Pro forma2004
Averagebalance Interest Rate
£m £m %
AssetsTreasury bills and other eligible bills – UK 832 34 4.09
– Overseas 62 1 1.61Loans and advances to banks – UK 13,589 551 4.05
– Overseas 9,190 264 2.87Loans and advances to customers – UK 188,141 11,493 6.11
– Overseas 70,947 3,243 4.57Debt securities – UK 18,907 735 3.89
– Overseas 18,063 761 4.21
Total interest-earning assets – banking business (2, 3) 319,731 17,082 5.34
– trading business (4) 148,545
Total interest-earning assets 468,276Non-interest-earning assets (2, 3) 155,493
Total assets 623,769
Percentage of assets applicable to overseas operations 28.7%
Liabilities and shareholders’ equity
Deposits by banks – UK 35,033 1,060 3.03– Overseas 16,806 421 2.51
Customer accounts: demand deposits – UK 68,859 1,633 2.37– Overseas 11,580 147 1.27
Customer accounts: savings deposits – UK 23,158 632 2.73– Overseas 18,349 252 1.37
Customer accounts: other time deposits – UK 51,436 1,699 3.30– Overseas 20,725 479 2.31
Debt securities in issue – UK 40,929 1,405 3.43– Overseas 13,787 229 1.66
Subordinated liabilities – UK 21,812 963 4.42– Overseas 2,311 102 4.41
Internal funding of trading business – UK (35,317) (920) 2.60– Overseas (758) (20) 2.64
Total interest-bearing liabilities – banking business (2, 3) 288,710 8,082 2.80
– trading business (4) 146,771
Total interest-bearing liabilities 435,481Non-interest-bearing liabilities Demand deposits – UK 17,263
– Overseas 9,096Other liabilities (3, 4) 134,523Shareholders’ equity 27,406
Total liabilities and shareholders’ equity 623,769
Percentage of liabilities applicable to overseas operations 26.7%
Notes:
(1) The analysis into UK and Overseas has been compiled on the basis of location of office.
(2) Interest-earning assets and interest-bearing liabilities exclude the Retail bancassurance long-term assets and liabilities attributable to policyholders, in view of their distinctnature. As a result, net interest income has been adjusted by £59 million (2004 – £47 million).
(3) Interest income has been adjusted by £115 million (2004 – £49 million) and interest expense by £307 million (2004 – £99 million) to record interest on financial assets andliabilities designated as at fair value through profit or loss. Related interest-earning assets and interest-bearing liabilities have also been adjusted.
(4) Interest receivable and interest payable on trading assets and liabilities are included in income from trading activites.

64
Ope
ratin
g an
d fin
anci
al r
evie
wOperating and financial review continued
Analysis of change in net interest income – volume and rate analysisVolume and rate variances have been calculated based on movements in average balances over the period and changes in interestrates on average interest-earning assets and average interest-bearing liabilities. Changes due to a combination of volume and rate are allocated pro rata to volume and rate movements.
2005 over 2004 2005 over pro forma 2004
Increase/(decrease) due to changes in: Increase/(decrease) due to changes in:Average Average Net Average Average Net volume rate change volume rate change
£m £m £m £m £m £m
Interest-earning assetsTreasury bills and other eligible bills
UK 101 3 104 102 2 104Overseas — 1 1 — 1 1
Loans and advances to banksUK 73 47 120 73 25 98Overseas 8 36 44 8 36 44
Loans and advances to customersUK 1,680 680 2,360 1,570 447 2,017Overseas 1,748 258 2,006 1,652 312 1,964
Debt securitiesUK (170) 141 (29) (141) 103 (38)Overseas 193 40 233 195 38 233
Total interest receivable of the banking businessUK 1,684 871 2,555 1,604 577 2,181Overseas 1,949 335 2,284 1,855 387 2,242
3,633 1,206 4,839 3,459 964 4,423Interest-bearing liabilitiesDeposits by banks
UK 10 (142) (132) 9 (141) (132)Overseas (326) (167) (493) (320) (150) (470)
Customer accounts: demand depositsUK (151) (337) (488) (119) (304) (423)Overseas (33) (119) (152) (33) (119) (152)
Customer accounts: savings depositsUK (102) (51) (153) (102) (44) (146)Overseas (50) (79) (129) (50) (79) (129)
Customer accounts: other time depositsUK (322) (307) (629) (322) (307) (629)Overseas (313) (187) (500) (313) (187) (500)
Debt securities in issueUK (427) (293) (720) (442) (224) (666)Overseas (180) (224) (404) (125) (279) (404)
Subordinated liabilitiesUK (254) (203) (457) (98) (61) (159)Overseas (140) 1 (139) (16) (36) (52)
Internal funding of trading businessUK 62 143 205 62 143 205Overseas 27 (8) 19 27 (8) 19
Total interest payable of the banking businessUK (1,184) (1,190) (2,374) (1,012) (938) (1,950)Overseas (1,015) (783) (1,798) (830) (858) (1,688)
(2,199) (1,973) (4,172) (1,842) (1,796) (3,638)Movement in net interest income
UK 500 (319) 181 592 (361) 231Overseas 934 (448) 486 1,025 (471) 554
1,434 (767) 667 1,617 (832) 785

section
01O
per
atin
g a
ndfin
anci
al r
evie
w
65
Op
erat
ing
and
fin
anci
al r
evie
w
Annual Report and Accounts 2005
2005 compared with 2004Non-interest income increased by £1,331 million, 9% to£15,651 million reflecting strong performances in CorporateMarkets and Citizens, and good growth in banking fee income,financial markets income and insurance premium income. Theeffect of implementing the requirements of IAS 39 and IFRS 4in 2004 would have been to reduce non-interest income by£808 million for the year ended 31 December 2004.
2005 compared with pro forma 2004Non-interest income increased by £2,139 million, 16% to£15,651 million and represents 61% of total income (2004 –60%). Excluding general insurance premium income, non-interest income rose by 24% or £1,883 million to £9,872 millionreflecting strong performances in Corporate Markets, up 23%or £1,097 million and Citizens, up 73% or £483 million.
Within non-interest income, fees and commissions receivableincreased by 11% or £679 million, to £6,750 million, while fees and commissions payable decreased by £79 million to£1,841 million.
Income from trading activities, which primarily arises fromproviding customers with debt and risk management productsin interest rate, currency and credit, was up £387 million, 20%.The increase on 2004 reflected increased customer volumes.
Other operating income increased by 39%, £738 million to£2,620 million. This was principally due to higher income fromrental assets, increased bancassurance income and realisedinvestment securities gains.
General insurance premium income, after reinsurance, rose by5%, or £256 million to £5,779 million reflecting volume growthin motor and home insurance products.
Non-interest incomePro forma
2005 2004 2004£m £m £m
Fees and commissions receivable 6,750 6,473 6,071Fees and commissions payable (1,841) (1,926) (1,920)Income from trading activities 2,343 1,988 1,956Other operating income 2,620 2,138 1,882
9,872 8,673 7,989
Insurance premium income 6,076 6,146 6,032Reinsurers’ share (297) (499) (509)
5,779 5,647 5,52315,651 14,320 13,512

66
Ope
ratin
g an
d fin
anci
al r
evie
wOperating and financial review continued
Operating expenses (excluding purchased intangibles amortisation and integration costs)Pro forma
2005 2004 2004£m £m £m
Administrative expenses:Staff costs 5,844 5,105 5,131Premises and equipment 1,274 1,142 1,143Other administrative expenses 2,592 2,174 2,221Total administrative expenses 9,710 8,421 8,495Depreciation and amortisation 1,588 1,376 1,376
11,298 9,797 9,871
2005 compared with 2004Operating expenses, excluding purchased intangiblesamortisation and integration costs, rose by 15% to £11,298million. The effect of implementing the requirements of IAS 39and IFRS 4 in 2004 would have been to increase operatingexpenses by £74 million for the year ended 31 December 2004.
2005 compared with pro forma 2004Operating expenses, excluding purchased intangiblesamortisation and integration costs, rose by 14% to £11,298 million to support the strong growth in businessvolumes. Excluding acquisitions and at constant exchangerates, operating expenses were up by 10%, £962 million.
Staff costs were up £713 million, 14% to £5,844 millionreflecting business growth. The number of staff increased by 400 to 137,000.
Premises and equipment expenses increased by £131 million,11% to £1,274 million reflecting our programme of investmentboth in the branch networks and in our major operationalcentres.
Other administrative expenses, up 17%, £371 million reflectedbusiness volume growth and ongoing expenditure onregulatory projects.
The Group’s ratio of operating expenses (excluding purchasedintangibles amortisation and integration costs and after nettingoperating lease depreciation against rental income) to totalincome was 42.4% compared with 42.0% in 2004. Excludingacquisitions and at constant exchange rates, the ratio wasunchanged at 41.8%.

section
01O
per
atin
g a
ndfin
anci
al r
evie
w
67
Op
erat
ing
and
fin
anci
al r
evie
w
Annual Report and Accounts 2005
Integration costsPro forma
2005 2004 2004£m £m £m
Staff costs 148 83 83Premises and equipment 39 35 35Other administrative expenses 131 149 149Depreciation and amortisation 140 253 253
458 520 520
Accruals in relation to integration costs are set out below.
At 31 December Currency translation Charge to Utilised during At 31 December2004 adjustments income statement the year 2005
£m £m £m £m £m
Staff costs – redundancy 11 1 23 (18) 17Staff costs – other 29 1 125 (140) 15Premises and equipment 13 2 39 (40) 14Other 44 2 271 (291) 26
97 6 458 (489) 72
Integration costs were £458 million compared with £520 millionin 2004 comprising amortisation of internally developedsoftware and other expenditure. Software costs were previouslywritten off as incurred under UK GAAP but under IFRS arenow amortised over 3-5 years. All software relating to the
NatWest integration was fully amortised by the end of 2005.The balance of integration costs principally relates to theintegration of Churchill, First Active and Citizens’ acquisitions,including Charter One which was acquired in August 2004.

68
Ope
ratin
g an
d fin
anci
al r
evie
wOperating and financial review continued
TaxationPro forma
2005 2004 2004£m £m £m
Tax 2,378 1,995 1,856
% % %UK corporation tax rate 30.0 30.0 30.0Effective tax rate 30.0 27.4 28.4
The actual tax charge differs from the expected tax charge computed by applying the standard rate of UK corporation tax as follows:
Pro forma2005 2004 2004
£m £m £m
Expected tax charge 2,381 2,185 1,963Interest on subordinated debt not allowable for tax 79 — 83Non-deductible items 230 110 110Non-taxable items (166) (128) (128)Taxable foreign exchange movements (10) (10) (10)Foreign profits taxed at other rates 77 49 49Unutilised losses – brought forward and carried forward (5) 6 6Adjustments in respect of prior periods (208) (217) (217)Actual tax charge 2,378 1,995 1,856
2005 compared with 2004Impairment losses were £1,707 million compared with £1,485 million in 2004 with higher provisions in Retail Marketspartly offset by improvements in Corporate Markets. The effectof implementing the requirements of IAS 39 in 2004 wouldhave been to increase loan impairment losses by £105 millionfor the year ended 31 December 2004.
2005 compared with pro forma 2004New impairment losses were up 8%, £145 million to £1,879 million. Recoveries of amounts previously written offwere up £28 million, 19% to £172 million. Consequently the net charge to the income statement was up £117 million, 7% to £1,707 million. Improvements in Corporate Markets partlyoffset higher impairment losses in Retail Markets.
Loan impairment losses were up from £1,507 million in 2004 to £1,703 million. Other impairment losses were £4 millioncompared with £83 million in 2004.
Total balance sheet provisions for impairment amounted to£3,887 million compared with £4,145 million at 1 January 2005.Total provision coverage (the ratio of total balance sheetprovisions for impairment to total risk elements in lending)decreased from 70% to 65%.
The ratio of total balance sheet provisions for impairment tototal risk elements in lending and potential problem loansdecreased to 65% compared with 70% at 1 January 2005.This reflects amounts written-off and the changing mix fromunsecured to secured exposure.
Impairment lossesPro forma
2005 2004 2004£m £m £m
New impairment losses 1,879 1,629 1,734less: recoveries of amounts previously written-off (172) (144) (144)Charge to income statement 1,707 1,485 1,590
Comprising:Loan impairment losses 1,703 1,402 1,507Other impairment losses 4 83 83Charge to income statement 1,707 1,485 1,590
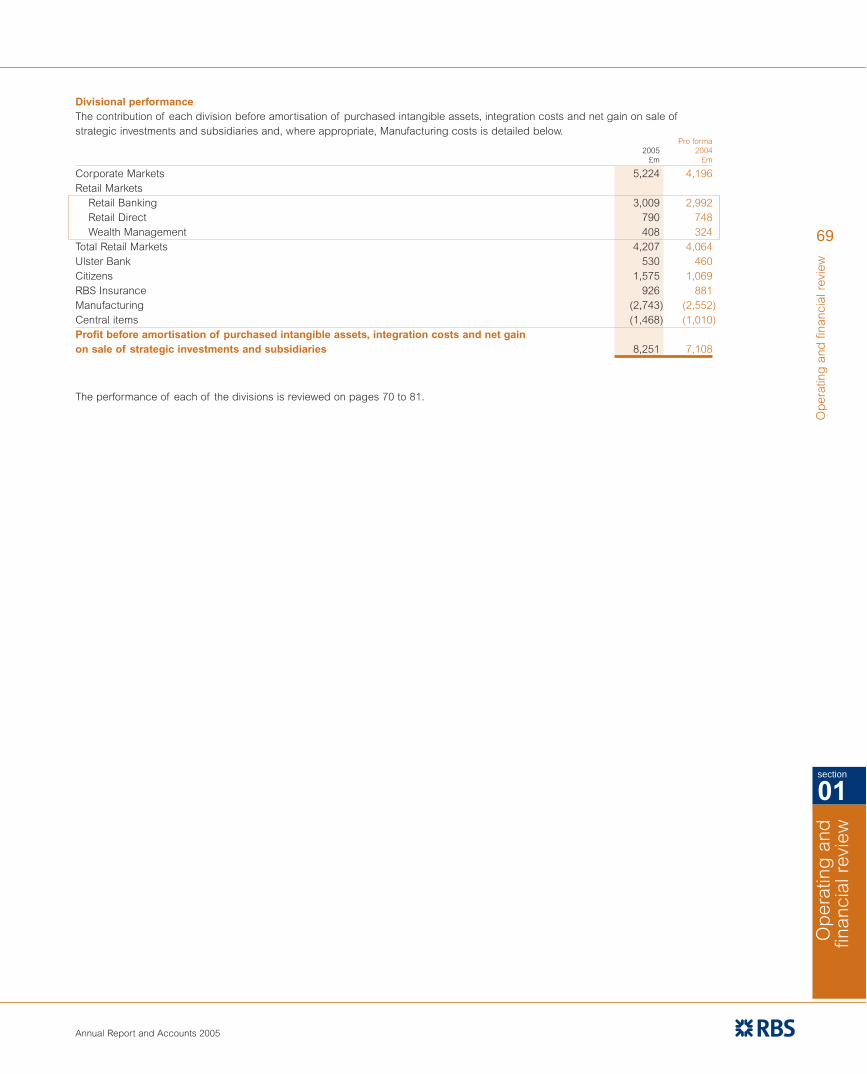
section
01O
per
atin
g a
ndfin
anci
al r
evie
w
69
Op
erat
ing
and
fin
anci
al r
evie
w
Annual Report and Accounts 2005
Divisional performanceThe contribution of each division before amortisation of purchased intangible assets, integration costs and net gain on sale ofstrategic investments and subsidiaries and, where appropriate, Manufacturing costs is detailed below.
Pro forma2005 2004
£m £m
Corporate Markets 5,224 4,196Retail Markets
Retail Banking 3,009 2,992Retail Direct 790 748Wealth Management 408 324
Total Retail Markets 4,207 4,064Ulster Bank 530 460Citizens 1,575 1,069RBS Insurance 926 881Manufacturing (2,743) (2,552)Central items (1,468) (1,010)Profit before amortisation of purchased intangible assets, integration costs and net gainon sale of strategic investments and subsidiaries 8,251 7,108
The performance of each of the divisions is reviewed on pages 70 to 81.

70
Ope
ratin
g an
d fin
anci
al r
evie
wOperating and financial review continued
Corporate MarketsPro forma
2005 2004£m £m
Net interest income 2,960 2,764Non-interest income 5,855 4,758Total income 8,815 7,522Direct expenses
– staff costs 2,000 1,705– other 523 459– operating lease depreciation 733 680
3,256 2,844Contribution before impairment losses 5,559 4,678Impairment losses 335 482Contribution 5,224 4,196
31 December 1 January2005 2005£bn £bn
Total assets* 409.2 359.4Loans and advances to customers – gross*
– banking book 158.7 136.9– trading book 11.8 10.1
Rental assets 13.2 11.5Customer deposits* 111.1 100.8Weighted risk assets 202.6 178.4
* excluding repos and reverse repos
Corporate Markets achieved excellent results in 2005, with totalincome up 17% to £8,815 million and contribution up 24% to£5,224 million, reflecting very good performances across ourbusinesses. We maintained a stable cost:income ratio and thecredit environment in all geographies remained benign.
RBS remains the number 1 corporate bank in the UK and wehave significantly expanded our franchise in Europe and NorthAmerica, where we are also focussing on the opportunities forincreased co-operation between Corporate Markets andCitizens. In Asia, our profile has benefited from theannouncement of the Group’s strategic partnership with Bankof China.
Our businesses continue to deliver good returns. Weighted risk assets rose by 14% over the course of the year to £202.6 billion, with much slower growth in the second halffollowing the above-trend spike in spot levels at mid-year.The ratio of income, after deducting operating leasedepreciation, to average weighted risk assets for 2005 wasbroadly stable at 4.1%, while the ratio of contribution toaverage weighted risk assets improved slightly.

section
01O
per
atin
g a
ndfin
anci
al r
evie
w
71
Op
erat
ing
and
fin
anci
al r
evie
w
Annual Report and Accounts 2005
Corporate Markets – Mid-Corporate and CommercialPro forma
2005 2004£m £m
Net interest income 1,760 1,607Non-interest income 1,257 1,171Total income 3,017 2,778Direct expenses
– staff costs 529 489– other 132 123– operating lease depreciation 335 322
996 934Contribution before impairment losses 2,021 1,844Impairment losses 218 277Contribution 1,803 1,567
31 December 1 January2005 2005£bn £bn
Total assets* 70.4 61.6Loans and advances to customers – gross* 67.9 59.4Customer deposits* 60.0 51.8Weighted risk assets 74.2 65.6
* excluding repos and reverse repos
Corporate Markets generated good results in the Mid-Corporate& Commercial customer segment in 2005, building on thestrength of its UK franchise. We maintained our market-leadingpositions in corporate and commercial banking, asset financeand invoice finance. Total income rose by 9% to £3,017 million,whilst contribution rose by 15% to £1,803 million.
Net interest income increased 10% to £1,760 million as a resultof strong growth in average lending, up £7.7 billion, or 16%and in average customer deposits, up £5.1 billion, or 12%.Average interest-bearing deposits grew particularly strongly.
Non-interest income rose by 7% to £1,257 million, reflectingour success in cross-selling our full range of products and
services to customers. Our business has benefited from theco-location of our Lombard and Invoice Finance managerswith our corporate and commercial banking operations.
Expense growth, excluding operating lease depreciation,was 8% which included a further investment in customer-facing staff.
Impairment losses were 21% lower than in 2004 at £218 million, reflecting a further improvement in our strongcredit metrics.

72
Ope
ratin
g an
d fin
anci
al r
evie
wOperating and financial review continued
Corporate Markets – Global Banking & MarketsPro forma
2005 2004£m £m
Net interest income excluding funding cost of rental assets 1,652 1,527Funding cost of rental assets (452) (370)Net interest income 1,200 1,157Fees and commissions receivable 1,060 871Fees and commissions payable (252) (219)Income from trading activities 1,964 1,681Income on rental assets 1,074 924Other operating income 752 330Non-interest income 4,598 3,587Total income 5,798 4,744Direct expenses
– staff costs 1,471 1,216– other 391 336– operating lease depreciation 398 358
2,260 1,910Contribution before impairment losses 3,538 2,834Impairment losses 117 205Contribution 3,421 2,629
31 December 1 January2005 2005£bn £bn
Total assets* 338.8 297.8Loans and advances to customers – gross*
– banking book 90.8 77.5– trading book 11.8 10.1
Rental assets 11.9 10.3Customer deposits* 51.1 49.0Weighted risk assets 128.4 112.8
* excluding repos and reverse repos
An excellent performance from our Global Banking & Marketscustomer segment in 2005 shows the fruits of the globalplatform we have built over the last five years, with good growthin all major geographies and across-the-board success inincome generation from our core banking, structured financeand financial markets activities.
Total income, after deducting operating lease depreciation,rose by 23% to £5,400 million, with contribution up 30% to£3,421 million, benefiting from cost discipline and continuingbenign credit conditions. Underlying income per full timeequivalent employee has grown from £646,000 in 2004 to£718,000 in 2005.
Debt underwriting volumes remained strong throughout thecourse of the year, reflecting our involvement in many of thelargest financings in the UK and Europe for both largecorporates and private equity sponsors. We were the fourthmost active bank worldwide in arranging and underwritingbank lending in 2005. A strong distribution performancebrought weighted risk assets to £128.4 billion at year-end, up14% over the year and back to a more consistent trend levelthan the amount at mid-year.
Non-interest income grew by 28% to £4,598 million. Afterdeducting operating lease depreciation and rental assetfunding costs, non-interest income now accounts for 69% ofGlobal Banking & Markets revenues.
We recorded good growth in fees earned from customerservices in risk management, financial structuring and debt-raising. A strong performance from RBS Greenwich Capital,which has been brought together with other Corporate Marketsactivities in North America, contributed to steady growth inincome from trading activities. Customer volumes were higheracross all products and particularly good in our credit marketsbusinesses. Average trading Value at Risk was held steady at avery conservative level, £12 million.
Our continuing success in aircraft, train, ship and hotel leasingdelivered good growth in net income from rental assets. Otheroperating income grew strongly, with our structured financeinvestment portfolio producing good realised gains, notably inthe second half of the year.
Growth in expenses, excluding operating lease depreciation,was 20%, reflecting variable performance-related costs.

section
01O
per
atin
g a
ndfin
anci
al r
evie
w
73
Op
erat
ing
and
fin
anci
al r
evie
w
Annual Report and Accounts 2005
Retail MarketsRetail Markets was established in June 2005 to strengthen co-ordination and delivery of our multi-brand retail strategy across ourproduct range, and comprises Retail Banking, Retail Direct and Wealth Management. The performance of each of these divisions isdiscussed on pages 74 to 76.
Pro forma2005 2004
£m £m
Net interest income 4,499 4,362 Non-interest income 3,714 3,322 Total income 8,213 7,684 Direct expenses
– staff costs 1,514 1,450 – other 821 856
2,335 2,306 Insurance net claims 486 398 Contribution before impairment losses 5,392 4,980 Impairment losses 1,185 916 Contribution 4,207 4,064
1 January2005 2005£bn £bn
Total banking assets 114.4 104.9 Loans and advances to customers
– mortgages 64.6 56.9– personal 21.5 20.2– cards 9.6 9.4– business 16.7 15.9
Customer deposits 105.9 97.0Investment management assets – excluding deposits 31.4 26.6Weighted risk assets 80.6 76.5
Total income increased by 7% to £8,213 million andcontribution by 4% to £4,207 million, with good discipline oncosts helping to offset increased impairment losses onunsecured lending.
At the end of 2004 we referred to the changes being seen inthe retail markets with the consumer transitioning from anenvironment which had seen several years of very fast growthin consumer lending to an increased emphasis on savings andinvestment.
As a consequence, we planned to refocus our strategy to growour sales of deposit and bancassurance products faster thanthe market, to exploit our potential for building profitable marketshare in the mortgage market and to concentrate more on the
development of our branch franchise, building on our strongservice proposition. During 2005 this transition has gatheredmomentum and we have achieved good progress in ourstrategies.
Branch deposit balances outgrew the market and ourbancassurance sales accelerated strongly, with annualpremium equivalent sales 25% higher than in 2004. Our shareof net mortgage lending, assisted by the launch of the FirstActive brand, reached 8% in 2005. Our credit card business,meanwhile, made excellent headway in marketing throughbranch channels; we gained 60% more credit card customersin our core NatWest and RBS brands in the second half than inthe same period of 2004.

74
Ope
ratin
g an
d fin
anci
al r
evie
wOperating and financial review continued
Retail BankingPro forma
2005 2004£m £m
Net interest income 3,175 3,173Non-interest income 2,258 1,999Total income 5,433 5,172Direct expenses
– staff costs 1,026 963– other 311 329
1,337 1,292Insurance net claims 486 398Contribution before impairment losses 3,610 3,482Impairment losses 601 490Contribution 3,009 2,992
31 December 1 January2005 2005£bn £bn
Total banking assets 77.1 72.8Loans and advances to customers – gross
– mortgages 47.3 44.1– personal 13.7 13.2– business 16.3 15.3
Customer deposits 77.7 71.9Weighted risk assets 54.0 51.1
Retail Banking produced a stronger performance in the secondhalf, when it achieved year-on-year income growth of 7%,compared with 3% in the first half. Total income for 2005 rose by 5% to £5,433 million and contribution by 1% to £3,009 million. Contribution before impairment lossesincreased by 4% to £3,610 million.
Overall customer numbers have increased since December2004 with personal customers up 274,000 (2%) and registeredinternet customers up 30%. During 2005 we continued todemonstrate our commitment to customer service, withsignificant progress in terms of the proportion of ourcustomers who are “extremely’’ satisfied and we are makingpleasing progress in the current account switcher market.Among the high street banks, Royal Bank of Scotland ranksfirst for customer satisfaction with NatWest now in joint secondplace. NatWest remains the number one bank for students. In2005, 44% of first year students in England and Wales choseto open new accounts with us compared with 42% in 2004.
Against the backdrop of a slower rate of growth in consumerborrowing, we have delivered robust growth in average loansand advances, which increased by 11%. Average mortgagelending grew by 12% to £46.1 billion, with particularly goodgrowth in higher margin products such as the offset mortgage.Average unsecured personal lending, where we took furthersteps to enhance our focus on high quality new business, wasup 10% to £13.3 billion. Average customer deposits grew by6% to £70.9 billion, with particularly good inflows into savingsproducts.
Net interest income was stronger in the second half, recoveringfrom a dip in the first half to reach £3,175 million for the full year.Net interest margin was lower in 2005 than in 2004 but secondhalf margin was similar to the first half, with increased productmargins offsetting mix effects. Spreads in mortgages andsome savings products improved in the latter part of the year.
Non-interest income rose by 13% to £2,258 million. Inbancassurance, Annualised Premium Equivalent incomeincreased by 25% to £171 million, with good sales of ChildTrust Funds and portfolio bonds. Excluding bancassurancepremium and other income, non-interest income increased by11% to £1,567 million, reflecting growth in income from corepersonal and small business banking services, and goodprogress in our private banking and investment businesses.
Direct expense growth was contained to 3%, despite someinvestment in future income initiatives in the second half. Staffcosts increased by 7% to £1,026 million as a result ofcontinued investment in customer-facing staff with over 500additional customer advisors in branches, an increase intelephone banking advisors, and continued expansion of ourbancassurance and investment businesses. We continue tomake efficiency gains in other areas resulting in a 5%decrease in other costs to £311 million.
Net claims in bancassurance, which under IFRS includematurities, surrenders and liabilities to policyholders, were£486 million compared with £398 million in 2004, reflectinghigher levels of bond maturities and increases in liabilities topolicyholders as a result of strong investment returns.
Impairment losses increased by 23% or £111 million to £601 million. The increased charge principally reflects thegrowth in lending over recent years, including 17% growth in2004. We have taken further steps to refine our credit policy andimproved our recoveries process. Mortgage arrears remainvery low. The average loan-to-value ratio on new mortgageswritten in 2005 was 62% and on the stock of mortgages was46%. Small business credit quality remains stable.

section
01O
per
atin
g a
ndfin
anci
al r
evie
w
75
Op
erat
ing
and
fin
anci
al r
evie
w
Annual Report and Accounts 2005
Retail DirectPro forma
2005 2004£m £m
Net interest income 882 779Non-interest income 1,084 995Total income 1,966 1,774Direct expenses
– staff costs 230 225– other 375 391
605 616Contribution before impairment losses 1,361 1,158Impairment losses 571 410Contribution 790 748
31 December 1 January2005 2005£bn £bn
Total assets 27.2 23.0Loans and advances to customers – gross
– mortgages 13.8 9.4– cards 9.5 9.3– other 4.0 3.8
Customer deposits 2.7 2.8Weighted risk assets 20.5 19.4
Total income rose by 11% to £1,966 million and contribution by6% to £790 million, a strong performance in the context ofslower growth in demand for unsecured credit and higherlevels of consumer arrears. This performance reflecteddisciplined pricing, tight cost control and stringent creditassessment. Contribution before impairment losses increasedby 18% to £1,361 million.
During the year, the number of customer accounts increasedby 734,000 (4%). In the light of changing market conditions wehave focussed our marketing efforts on existing customers,and this has resulted in very strong growth in our core NatWestand RBS brands. We gained 336,000 credit card accounts inthese brands in the second half, 60% more than in theequivalent period of 2004.
Net interest income increased by 13% to £882 million, reflectingthe success of the First Active brand in the UK mortgagemarket and the maturing of the MINT portfolio. MINT, launchedin December 2003, made a contribution of £37 million in 2005.Average loans and advances rose by 15% to £24.9 billion with the fastest growth coming in mortgages, up 34% at £11.9 billion. Personal loan growth slowed, reflecting strategicdecisions taken over the last 18 months to reposition pricingand tighten lending criteria for personal loans sold directly.
Net interest margin was only slightly lower than in 2004, aswider margins on our cards portfolio balanced the effects ofthe increasing weight of mortgage assets in our loan book.
Non-interest income was up 9% to £1,084 million, benefitingfrom higher volumes in both domestic and international cardacquiring, strong sales through Tesco Personal Finance, theintroduction of balance transfer fees and good growth inEurope.
Expenses decreased by 2% to £605 million, with stringent costcontrol across all activities, including reduced marketing costson personal loans. This was consistent with our more cautiousapproach to direct lending and with our successful focus onbranch recruitment.
Impairment losses rose by 39% to £571 million, reflectinghigher lending volumes as well as the increase in personalarrears signalled at the end of 2004. There are some signs ofa stabilisation of credit quality, assisted by the tightening oflending criteria. Mortgage arrears remain very low. Theaverage loan-to-value ratio on new mortgages written in 2005was 51% and on the stock of mortgages was 44%.

76
Ope
ratin
g an
d fin
anci
al r
evie
wOperating and financial review continued
Wealth ManagementPro forma
2005 2004£m £m
Net interest income 442 410Non-interest income 372 328Total income 814 738Expenses
– staff costs 258 262– other 135 136
393 398Contribution before impairment losses 421 340Impairment losses 13 16Contribution 408 324
31 December 1 January2005 2005£bn £bn
Loans and advances to customers – gross 7.8 7.1Investment management assets – excluding deposits 25.4 21.6Customer deposits 25.5 22.3Weighted risk assets 6.1 6.0
Total income rose by 10% to £814 million, reflecting goodgrowth across all our businesses, and contribution was 26%higher at £408 million. Coutts UK and Adam & Co both gainedgood numbers of customers, with Coutts up 7% and Adam up11%. 2005 also saw the continuation of rapid growth in Asia,where the number of private bankers increased by 20%, withparticular emphasis placed on recruitment for the Chinese andIndian markets.
Average lending increased by 20% and customer deposits by11%. This resulted in an 8% increase in net interest income to£442 million, with net interest margin reduced by the mix ofbusiness.
Non-interest income increased by 13% to £372 million, drivenby investment fees, with average assets under management up
9% to £23.1 billion as a result of good new business volumesin Coutts UK and the rise in equity markets. Assets undermanagement at the year end were £25.4 billion, an increase of18%.
Expenses decreased by 1% to £393 million, reflecting acontinued focus on efficiency. Despite continued investment ingrowth markets in both the UK and overseas, staff costs were2% lower than in 2004 which was affected by a number ofone-off costs. Other costs also decreased slightly.
Impairment losses amounted to £13 million, down £3 million.

section
01O
per
atin
g a
ndfin
anci
al r
evie
w
77
Op
erat
ing
and
fin
anci
al r
evie
w
Annual Report and Accounts 2005
Ulster BankPro forma
2005 2004£m £m
Net interest income 655 559Non-interest income 203 190Total income 858 749Expenses
– staff costs 191 170– other 79 74
270 244Contribution before impairment losses 588 505Impairment losses 58 45Contribution 530 460
31 December 1 January2005 2005£bn £bn
Total assets 35.9 28.7Loans and advances to customers – gross
– mortgages 13.2 10.1– other 15.0 12.9
Customer deposits 15.9 13.6Weighted risk assets 22.4 18.6
Average exchange rate – €/£ 1.463 1.474Spot exchange rate – €/£ 1.457 1.418
Total income increased by 15% to £858 million, withcontribution also up 15% to £530 million, as Ulster Bankachieved another year of strong growth, with excellentcustomer recruitment, robust lending volumes and very goodgrowth in deposits. First Active continues to perform well andin line with our integration plan. It led the Republic of Irelandmarket with the introduction of new mortgage products, as wellas launching new credit card and direct loan products.
The number of personal and business customers increased by68,000 in the year. Ulster Bank personal customer numbersrose by 9% in the Republic of Ireland, where our switchermortgage product has helped us to gain market share. InNorthern Ireland, Ulster Bank significantly enhanced itspersonal current account offering in the fourth quarter toprovide free banking to all customers.
Net interest income rose by 17% to £655 million. Average loansand advances increased by 33% to £25.0 billion and averagecustomer deposits by 21% to £14.4 billion. The continuing
strong growth in lending, particularly in mortgages andbusiness loans, led to a decline in net interest margin.
Non-interest income increased by £13 million or 7% to £203million. This reflected increased volumes of customertransactions and good growth in income from financial marketsservices.
Expenses increased by 11% to £270 million, as a result ofinvestment to support the growth of the business. Thisinvestment will continue into 2006. We have continued with ourbranch improvement programme, upgrading 50 branches inthe Republic of Ireland and 39 in Northern Ireland.
Impairment losses increased by £13 million to £58 million,reflecting the growth in lending.

78
Ope
ratin
g an
d fin
anci
al r
evie
wOperating and financial review continued
CitizensPro forma
2005 2004£m £m
Net interest income 2,122 1,619Non-interest income 1,142 659Total income 3,264 2,278Expenses
– staff costs 819 591– other 739 501
1,558 1,092Contribution before impairment losses 1,706 1,186Impairment losses 131 117Contribution 1,575 1,069
31 December 1 January2005 2005
US$bn US$bn
Total assets 158.8 141.7Loans and advances to customers – gross 104.6 91.7Customer deposits 106.3 99.2Weighted risk assets 106.4 93.5
Average exchange rate – US$/£ 1.820 1.832Spot exchange rate – US$/£ 1.721 1.935
Citizens performed well in 2005, delivering a strong underlyingperformance in challenging market conditions both from theold Citizens franchise and from Charter One. Total income, inUS dollars, rose by 42% to $5,940 million and contribution by46% to $2,867 million, including a full year’s contribution fromCharter One. Excluding Charter One and other acquisitions,income rose by 6% and contribution by 10%, despite theimpact of the flattening of the yield curve, which reduced netinterest margin and the rate of growth in net interest income.
We have grown our customer numbers in both personal andbusiness segments, with Charter One increasing its smallbusiness and corporate customer base by 10%. Co-operationbetween Citizens and RBS Corporate Markets is yielding goodresults. Citizens’ new international cash management servicehas already won nearly 300 new accounts with existing RBScustomers, bringing in more than $80 million of new coredeposits.
Our cards businesses, which are only active in the prime andsuperprime segments, have made good progress. Credit cardbalances increased by 19% to $2.5 billion, as RBS Nationallaunched into a number of new channels such as Charter Onebranches. RBS Lynk, our merchant acquiring business,increased its customer base by 24%.
The integration of Charter One progressed well and all phasesof the IT conversion were completed in July 2005, five monthsahead of schedule. This involved the conversion to Citizens’
systems of over 750 branches and three million customeraccounts spread over a wide geography. Despite the focus onthe integration process, Charter One achieved good growth inbusiness volumes, with loans and advances up 18% over thecourse of the year and customers deposits up 10%.
Net interest income increased by 30% to $3,861 million. Thisreflected strong growth in both lending and deposits.Excluding acquisitions, average lending increased by 13% or$6.7 billion, with robust growth in secured consumer lending,and average customer deposits by 9% or $5.7 billion. However,as a consequence of the flattening yield curve, net interestincome excluding acquisitions was only 3% higher at $2,534million.
Non-interest income was up 72% to $2,079 million. Excludingacquisitions, non-interest income grew by 15% to $1,004million, benefiting from higher fee income, increased studentloan and leasing activities, and investment gains.
Expenses were up 42% to $2,834 million. Expense growth,excluding acquisitions, was contained to 5%.
Impairment losses, including acquisitions, were up $25 millionto $239 million. Credit quality overall remained stable. Morethan 90% of our personal sector lending is secured, and as aresult there was minimal impact from the change in USbankruptcy laws in 2005.

section
01O
per
atin
g a
ndfin
anci
al r
evie
w
79
Op
erat
ing
and
fin
anci
al r
evie
w
Annual Report and Accounts 2005
RBS InsurancePro forma
2005 2004£m £m
Earned premiums 5,641 5,561Reinsurers’ share (246) (455)Insurance premium income 5,395 5,106Net fees and commissions (449) (485)Other income 543 460Total income 5,489 5,081Expenses
– staff costs 323 307– other 413 345
736 652Gross claims 3,903 3,815Reinsurers’ share (76) (267)Net claims 3,827 3,548Contribution 926 881
31 December 31 December2005 2004
In-force policies (000’s)
– Motor: UK 8,687 8,338– Motor: Continental Europe 1,862 1,639– Non-motor (including home, rescue, pet, HR24): UK 10,898 10,464
General insurance reserves – total (£m) 7,776 7,379
RBS Insurance produced a good performance in 2005, withtotal income increasing by 8% to £5,489 million andcontribution by 5% to £926 million. The integration of Churchillwas completed in September 2005, ahead of plan, andChurchill delivered greater transaction benefits thananticipated at the time of the acquisition. Following theintegration of Churchill, all our direct businesses in the UK nowoperate on a common platform.
RBS Insurance achieved 4% growth in UK motor policies inforce. In achieving this against a background of very strongcompetition in UK motor insurance, we benefited from thestrength of our brands and the diversity of our distributionchannels. Growth came through our direct brands, through ourpartnership business, where we operate insurance schemeson behalf of third parties who in turn sell insurance productsto their customers, and through NIG, our intermediary businessacquired as part of Churchill. Our businesses in Spain,Germany and Italy together delivered 14% growth in motorpolicies in force. Linea Directa, our joint venture with Bankinter,increased its customer base by 17% and, with more than 1million policies, is the largest direct motor insurer and sixthlargest motor insurer in Spain.
Total home insurance policies declined by 1%. Within this total,we continued to expand through our direct brands but therewas attrition of some partner-branded books.
In addition to expanding its intermediary business in motor andhome insurance, NIG achieved 10% growth in commercialpolicies sold to SMEs.
Expenses rose by 13%. Excluding the impact of a change inreinsurance arrangements, total income rose by 5% andexpenses by 4%. Net insurance claims on the same basis wereup by 5%, reflecting increased volumes, claims inflation inmotor and an increase in home claims following severe stormsin the UK in January 2005.
The UK combined operating ratio for 2005 was 93.6% (2004 –93.3%).

80
Ope
ratin
g an
d fin
anci
al r
evie
wOperating and financial review continued
Manufacturing Pro forma
2005 2004£m £m
Staff costs 740 753Other costs 2,003 1,799Total manufacturing costs 2,743 2,552
Analysis:Group Technology 945 852Group Purchasing and Property Operations 1,013 927Customer Support and other operations 785 773Total manufacturing costs 2,743 2,552
Manufacturing’s costs increased by 7% to £2,743 million.Excluding software amortisation, costs rose by 4%. Costsrelating to internal software development, which under UKGAAP were written off as incurred, are now under IFRScapitalised and amortised.
Group Technology costs increased by 11% to £945 million.Excluding software amortisation, costs were up 2%, withsupport for increased business volumes offset by efficiencyimprovements. The Group Efficiency Programme wassubstantially completed during the year, with majorimplementations such as a new system for handling customerqueries and a new customer account-opening platform. TheChurchill systems integration was completed in September 2005.
Group Purchasing and Property Operations costs increased by9% to £1,013 million. We improved the efficiency of ourproperty utilisation in 2005 while continuing our programme ofinvestment both in the branch networks and in our majoroperational centres, including Birmingham, Manchester andour new headquarters in Edinburgh.
Customer Support and other operations costs rose by just 2%,despite a much greater increase in the business volumessupported. Cash withdrawals from ATMs, for example, rose by13%, while we handled 10% more mortgage applications and7% more personal loan volumes. These increases wereabsorbed by improved efficiency through the delivery of newsystems and ways of working.

section
01O
per
atin
g a
ndfin
anci
al r
evie
w
81
Op
erat
ing
and
fin
anci
al r
evie
w
Annual Report and Accounts 2005
Employee numbers at 31 December 2005 2004
Corporate Markets 15,700 16,800Retail Banking 33,100 32,200Retail Direct 6,800 7,000Wealth Management 4,200 4,100Ulster Bank 4,400 4,100Citizens 24,400 24,000RBS Insurance 19,400 19,500Manufacturing 26,800 26,900Centre 2,200 2,000Group total 137,000 136,600
2005 compared with 2004The number of employees increased by 400 to 137,000, with increases in Retail Banking, Citizens and Ulster Bank partly offset by areduction in Corporate Markets.
Central itemsPro forma
2005 2004£m £m
Funding costs 810 615Departmental and corporate costs 658 395Total Central items 1,468 1,010
Total central items increased by £458 million to £1,468 million.
Funding costs at £810 million, were up £195 million largelybecause of the full year funding cost of the acquisition ofCharter One in August 2004. The Group’s primary objective isto hedge its economic risks. So as not to distort divisionalresults, volatility attributable to derivatives in economic hedgesthat do not meet the criteria in IFRS for hedge accounting istransferred to the Group’s central treasury function. Thisresulted in a charge of £45 million, in addition to a charge for£14 million for hedge ineffectiveness under IFRS.
Central departmental costs and other corporate items at £658million were £263 million higher than 2004. This was principallydue to higher pension costs and the centralisation of certainfunctions, and includes ongoing expenditure on regulatoryprojects such as Basel II and Sarbanes-Oxley Section 404.

82
Ope
ratin
g an
d fin
anci
al r
evie
wOperating and financial review continued
Consolidated balance sheet at 31 December 2005
31 December 1 January 31 December2005 2005 2004
£m £m £m
AssetsCash and balances at central banks 4,759 4,293 4,293Treasury bills and other eligible bills 5,538 6,109 6,110Loans and advances to banks 70,587 65,691 61,073Loans and advances to customers 417,226 381,162 347,251Debt securities 120,965 93,915 93,908Equity shares 9,301 5,231 4,723Intangible assets 19,932 19,242 19,242Property, plant and equipment 18,053 16,425 16,428Settlement balances 6,005 5,682 5,682Derivatives at fair value 95,663 89,905 17,800Prepayments, accrued income and other assets 8,798 8,855 11,612Total assets 776,827 696,510 588,122
LiabilitiesDeposits by banks 110,407 106,026 99,883Customer accounts 342,867 315,046 283,315Debt securities in issue 90,420 66,245 63,999Settlement balances and short positions 43,988 33,339 32,990Derivatives at fair value 96,438 91,277 18,876Accruals, deferred income and other liabilities 14,247 14,720 17,648Retirement benefit liabilities 3,735 2,940 2,940Deferred taxation liabilities 1,695 1,826 2,061Insurance liabilities 7,212 6,592 8,647Subordinated liabilities 28,274 27,526 20,366Total liabilities 739,283 665,537 550,725
EquityMinority interests 2,109 951 3,492Shareholders’ equity
Called up share capital 826 822 822Reserves 34,609 29,200 33,083
Total equity 37,544 30,973 37,397
Total liabilities and equity 776,827 696,510 588,122
Analysis of repurchase agreements included above
Reverse repurchase agreements and stock borrowingLoans and advances to banks 41,804 34,475 29,975Loans and advances to customers 48,887 64,599 52,184
90,691 99,074 82,159
Repurchase agreements and stock lendingDeposits by banks 47,905 47,841 43,342Customer accounts 48,754 54,485 42,134
96,659 102,326 85,476

section
01O
per
atin
g a
ndfin
anci
al r
evie
w
83
Op
erat
ing
and
fin
anci
al r
evie
w
Annual Report and Accounts 2005
Overview of consolidated balance sheetTo provide a more meaningful comparison, the commentarybelow compares the balance sheet at 31 December 2005 withthe opening balance sheet at 1 January 2005, which includesthe effect of applying IAS 32, IAS 39 and IFRS 4 from that date.
31 December 2005 compared with 1 January 2005Total assets of £776.8 billion at 31 December 2005 were up£80.3 billion, 12% compared with 1 January 2005, reflectingbusiness growth.
Treasury bills and other eligible bills decreased by £0.6 billion,9%, to £5.5 billion, reflecting trading activity.
Loans and advances to banks increased £4.9 billion, 7%, to£70.6 billion. Growth in reverse repurchase agreements andstock borrowing (“reverse repos”) up £7.3 billion, 21%, to£41.8 billion, were partially offset by a reduction in bankplacings, down £2.4 billion, 8% to £28.8 billion.
Loans and advances to customers were up £36.1 billion, 9%,to £417.2 billion. Within this, reverse repos decreased by 24%,£15.7 billion to £48.9 billion. Excluding reverse repos, lendingrose by £51.8 billion, 16% to £368.3 billion reflecting organicgrowth across all divisions.
Debt securities increased by £27.1 billion, 29%, to £121.0billion and Equity shares rose by £4.1 billion, 78%, to £9.3billion, principally due to increased holdings in CorporateMarkets.
Intangible assets increased by £0.7 billion, 4% to £19.9 billionlargely due to exchange rate movements.
Property, plant and equipment were up £1.6 billion, 10% to£18.1 billion, primarily reflecting growth in operating leaseassets.
Derivatives at fair value, assets and liabilities, have increasedreflecting growth in trading volumes and the effects of interestand exchange rates.
Deposits by banks rose by £4.4 billion, 4% to £110.4 billion tofund business growth mainly through increased inter-bankdeposits, up £4.3 billion, 7% to £62.5 billion. Repurchaseagreements and stock lending (“repos”) were broadly flat at£47.9 billion.
Customer accounts were up £27.8 billion, 9% at £342.9 billion.Within this, repos decreased £5.7 billion, 11% to £48.8 billion.Excluding repos, deposits rose by £33.5 billion, 13%, to £294.1billion with good growth in all divisions.
Debt securities in issue increased by £24.2 billion, 36%, to£90.4 billion primarily to meet the Group’s fundingrequirements.
The increase in settlement balances and short positions, up£10.6 billion, 32%, to £44.0 billion, reflected growth incustomer activity.
Subordinated liabilities were up £0.7 billion, 3% to £28.3 billion.This reflected the issue of £1.2 billion dated loan capital andthe effect of exchange rate movements, £1.3 billion, which waspartially offset by the redemption of £1.6 billion non-cumulativepreference shares and dated loan capital.
Equity minority interests increased by £1.2 billion to £2.1 billionreflecting the co-investors interest in the Group’s subsidiarythat invested in Bank of China and the issuance of preferredsecurities.
Shareholders’ equity increased by £5.4 billion, 18% to £35.4billion. The profit for the year of £5.5 billion, issue of £1.6billion non-cumulative fixed rate equity preference shares and£0.3 billion of ordinary shares in respect of scrip dividendsand the exercise of share options, were partly offset by thepayment of the 2004 final ordinary dividend, £1.3 billion, andthe 2005 interim ordinary dividend, £0.6 billion and preferencedividends, £0.1 billion.
The fair value of the assets of the Group’s post-retirementbenefit schemes was £17.4 billion (2004 – £14.8 billion) andthe present value of defined benefit obligations was £21.1billion (2004 – £17.7 billion). The increase in net pensionliability (after tax) to £2.7 billion from £2.1 billion is principallydue to movements in interest rates. The mortality assumptionsused in the valuation of liabilities were updated at the end of2004 and have not been changed.

84
Ope
ratin
g an
d fin
anci
al r
evie
wOperating and financial review continued
Cash flow2005 2004
£m £m
Net cash flows from operating activities 8,950 2,493Net cash flows from investing activities (2,612) (9,398)Net cash flows from financing activities (703) 7,119Effects of exchange rate changes on cash and cash equivalents (3,107) 1,686Net increase in cash and cash equivalents 2,528 1,900
2005The major factors contributing to the net cash inflow of £8,950million from operating activities in 2005 were the profit beforetax of £7,936 million, increases in deposits and debt securitiesin issue of £56,571 million, and increases in short positionsand settlement balances of £10,326 million, partially offset byincreases in securities of £28,842 million and increases inloans and advances of £36,778 million.
Net purchases of fixed assets of £2,592 million, includingoperating lease assets and computer and other equipment,were the main contributors to the net cash outflow frominvesting activities of £2,612 million.
The issue of £1,649 million preference shares and £1,234million subordinated debt were more than offset by dividendpayments of £2,007 million and the repayment of £1,553million of subordinated liabilities, resulting in a net cash outflowfrom financing activities of £703 million.
2004The major factors contributing to the net cash inflow of £2,493million from operating activities in 2004 were the profit beforetax of £7,284 million, increases in deposits and debt securitiesin issue of £72,146 million, and increases in short positionsand settlement balances of £8,796, partially offset byincreases in securities of £11,883 million and increase in loansand advances of £72,955 million.
Net purchases of fixed assets of £2,662 million, includingoperating lease assets and computer and other equipment,and net investment in business interests and intangible assetsof £7,968 million led to the net cash outflow from investingactivities of £9,398 million.
The issue of £1,358 million preference shares and £2,845 millionordinary shares, and £4,624 million subordinated liabilities,partly offset by the payment of £1,635 million of dividends,were the main contributors to the net cash inflow from financingactivities of £7,119 million.

section
01O
per
atin
g a
ndfin
anci
al r
evie
w
85
Op
erat
ing
and
fin
anci
al r
evie
w
Annual Report and Accounts 2005
IFRS compared with US GAAPThe Group’s financial statements are prepared in accordancewith IFRS, which differ in certain material respects from USGAAP as described on pages 221 to 229.
The net income available for ordinary shareholders under USGAAP was £4,475 million; £917 million lower than profitattributable to ordinary shareholders under IFRS of £5,392million. The principal reasons for the decrease are:
• a reduction of £556 million relating to financial instrumentsprincipally foreign exchange gains on available-for-salesecurities recognised in net income under IFRS but includeddirectly in equity under US GAAP together with theadjustment for financial assets and liabilities designated asat fair value through profit or loss; US GAAP does not permitsuch designation.
• higher pension costs under US GAAP compared with IFRSreflecting the deferral of actuarial gains and losses over theremaining service lives of current employees under US GAAP;such gains and losses are recognised in full under IFRS.
US GAAP shareholders’ equity at £40,229 million is £4,794million higher than IFRS equity of £35,435 million principallydue to the inclusion of certain preference shares, classifiedas debt under IFRS, in US GAAP equity; the reinstatement of goodwill deducted from equity under previous GAAP; andthe effect of deferring and amortising loan origination costs.
Capital resourcesThe following table analyses the Group’s regulatory capital resources at 31 December:
2005 2004 2003 2002 2001£m £m £m £m £m
Capital base Tier 1 capital 28,218 22,694 19,399 17,155 15,052Tier 2 capital 22,437 20,229 16,439 13,271 11,734Tier 3 capital — –– — — 172
50,655 42,923 35,838 30,426 26,958Less: investments in insurance subsidiaries, associated
undertakings and other supervisory deductions (7,282) (5,165) (4,618) (3,146) (2,698)Total capital 43,373 37,758 31,220 27,280 24,260
Weighted risk assetsBanking book:
On-balance sheet 303,300 261,800 214,400 193,800 176,000Off-balance sheet 51,500 44,900 36,400 28,700 22,000
Trading book 16,200 17,100 12,900 11,500 12,500371,000 323,800 263,700 234,000 210,500
Risk asset ratios % % % % %
Tier 1 7.6 7.0 7.4 7.3 7.1Total 11.7 11.7 11.8 11.7 11.5
Note: The comparative data in the table above are under UK GAAP as previously published and regulated. As from 1 January 2005,the Group was regulated on an IFRS basis.
It is the Group’s policy to maintain a strong capital base, toexpand it as appropriate and to utilise it efficiently throughoutits activities to optimise the return to shareholders whilemaintaining a prudent relationship between the capital baseand the underlying risks of the business. In carrying out thispolicy, the Group has regard to the supervisory requirementsof the Financial Services Authority (“FSA”). The FSA uses RiskAsset Ratio (“RAR”) as a measure of capital adequacy in the
UK banking sector, comparing a bank’s capital resources withits weighted risk assets (the assets and off-balance sheetexposures are ‘weighted’ to reflect the inherent credit andother risks); by international agreement, the RAR should be not less than 8% with a tier 1 component of not less than 4%.At 31 December 2005, the Group’s total RAR was 11.7% (2004 – 11.7%) and the tier 1 RAR was 7.6% (2004 – 7.0%).

86
Ope
ratin
g an
d fin
anci
al r
evie
wOperating and financial review continued
Risk management
Governance frameworkThe Board sets the overall risk appetite and philosophy for the Group. Various Board and executive sub-committees support thesegoals, as follows:
• Group Audit Committee is a non-executive committee thatsupports the Board in carrying out its responsibilities forfinancial reporting including accounting policies and inrespect of internal control and risk assessment. The GroupAudit Committee monitors the ongoing process of theidentification, evaluation and management of all significantrisks throughout the Group. The Committee is supported byGroup Internal Audit which provides an independentassessment of the design, adequacy and effectiveness ofthe Group’s internal controls.
• Advances Committee is a board committee that deals withall transactions that exceed the Group Credit Committee’sdelegated authority.
In addition to the responsibilities at Board level, operationalauthority and oversight is delegated to the Group ExecutiveManagement Committee (“GEMC”), which is responsible forimplementing a risk management framework consistent withthe Board’s risk appetite. The GEMC, in turn, is supported bythe following committees:
• Group Risk Committee (“GRC”) is an executive riskgovernance committee which recommends and approveslimits, processes and policies in respect of the effectivemanagement of all material non-balance sheet risks acrossthe Group.
• Group Credit Committee (“GCC”) is a credit approvalcommittee which deals with all transactions that exceed thedelegated authority of divisional credit committees.
• Group Asset and Liability Management Committee(“GALCO”), is an executive committee which is responsiblefor reviewing the balance sheet, funding, liquidity, structuralforeign exchange, intra-group limits, capital adequacy andcapital raising across the Group as well as interest rate riskin the banking book. In addition, GALCO monitors andreviews external, economic and environmental changesaffecting such risks.
These Committees are supported by two dedicated group levelfunctions, Group Risk Management (“GRM”), which hasresponsibility for credit, market, regulatory and enterprise riskand Group Treasury which is responsible for the managementof the Group’s balance sheet, capital raising, intra group creditexposure, liquidity and hedging policies. Both functions reportto GEMC and the Group Board through the Group FinanceDirector and play an active role in assessing and monitoringthe effectiveness of the divisional risk management functions.Heads of Group Risk Mangement and Internal Audit havedirect access to the Group Chief Executive and the Chairmanof the Group Audit Committee.
Group Audit Committee
Group Board of Directors
Advances Committee
Group ExecutiveManagement Committee
Group Credit CommitteeGroup Asset and
Liability ManagementCommittee
Group Risk CommitteeBoard Committees
Executive Committees
Key

section
01O
per
atin
g a
ndfin
anci
al r
evie
w
87
Op
erat
ing
and
fin
anci
al r
evie
w
Annual Report and Accounts 2005
Risk managementThe principal risks that the Group manages are as follows:
• Credit risk: is the risk arising from the possibility that theGroup will incur losses from the failure of customers to meettheir obligations.
• Liquidity risk: is the risk that the Group is unable to meet itsobligations as they fall due.
• Market risk: the Group is exposed to market risk because ofpositions held in its trading portfolios and its non-tradingbusinesses.
• Insurance risk: the Group is exposed to insurance risk, either directly through its businesses or through using insurance as a toolto mitigate other risk exposures.
• Enterprise risk: the Group separately defines operational and external risk. Operational risk is defined as the risk arising from theGroup’s people, processes, systems and assets. External risk comprises business, political and environmental risk.
• Regulatory risk: is the risk arising from failing to meet the requirements and expectations of our many regulators, or from a failureto address or implement any change in these requirements or expectations.
Risk appetiteRisk management across the Group is based on the riskappetite and philosophy set by the Board and the associatedrisk committees. The Board establishes the parameters for riskappetite for the Group through:
• Setting strategic direction.• Contributing to, and ultimately approving annual plans for
each division.• Regularly reviewing and monitoring the Group’s
performance in relation to risk through monthly BoardReports.
The Board delegates the articulation of risk appetite toGEMC and ensures that this is in line with the strategyand the desired risk reward trade off for the Group. Riskappetite is an expression of the maximum level of residualrisk that the Group is prepared to accept in order todeliver its business objectives and is assessed againstregular (often daily) controls and stress testing to ensurethat the limits are not compromised in abnormalcircumstances.
Risk appetite is usually defined in both quantitative andqualitative terms. Whilst different techniques are used toensure that the Group’s risk appetite is achieved, genericallythey can be classified as follows:
• Quantitative: encompassing stress testing, risk concentration, value at risk and credit related metrics, including the probability, loss and exposure at default.
• Qualitative: focuses on ensuring that the Group applies the correct principles, policies and procedures.
The annual business planning and performance management process and associated activities ensure the expression of riskappetite remains appropriate. GRC and GALCO support this work.
Stress testing
Concentration
EL, PD, EAD, LGD
PrinciplesPolicies
Procedures
Procedures
Policies
Stress testing
Principles
Polic
ies
Proc
edur
esR
isk
criti
calit
y
Valu
e at
ris
k
Str
ess
test
ing
Polic
ies
Guideli
nes
Stock of
liquid assets
Mismatch limits
Stress testing
Principles
PoliciesProcedures
Impact assessm
ent
Procedures
Princip
les
Policies
Quantitative Qualitative Quantitative Q
ualitative Quantitative Qualitative Quantitative
Qualita
tiv
e
Q
uant
itativ
e
Qua
litat
ive
Q
ualit
ativ
e
Quantitative
Market risk Liqui d
ity risk Regulatory risk
Enterprise
risk
In
sura
nce
risk
Cre
dit risk
Principal risk types
Regulatory risk
Liquidity Insurance Credit risk risk Market risk risk
Enterprise risk
Qualitative and quantitative elements of risk management

88
Ope
ratin
g an
d fin
anci
al r
evie
w
Risk organisationDivisional CEOs are specifically responsible for themanagement of risk within their divisions. As such, they areresponsible for ensuring that they have appropriate riskmanagement frameworks that are adequate in design, effectivein operation and meet minimum Group standards.
Divisional CEOs are supported by divisional Chief RiskOfficers (CROs) and Chief Financial Officers (CFOs). Animportant element that underpins the Group’s approach to themanagement of all risk is independence. In the case of CROs,it is enforced by joint reporting lines, both operationally to thedivisional CEO and functionally to the Group Chief Risk Officer.
Operating and financial review continued
Credit riskKey principles of credit risk managementThe objective of credit risk management is to enable the Groupto achieve sustainable and superior risk versus rewardperformance whilst maintaining credit risk exposure in line withapproved risk appetite.
Group Risk Management is responsible for setting standardsfor maintaining and developing credit risk managementthroughout the Group. This is achieved via a combination of governance structures, credit risk policies, controlprocesses and credit systems collectively known as theGroup’s Credit Risk Management Framework (“CRMF”).The framework is defined in detail in the Group’s ‘Principles forManaging Credit Risk’.
The key principles for credit risk management as defined in theCRMF include:
• Approval of all credit exposure must be granted prior to anyadvance or extension of credit.
• An appropriate credit risk assessment of the customer andrelated credit facilities must be undertaken prior to approvalof credit exposure. This must include a review of, amongstother things, the purpose of the credit and sources ofrepayment, compliance with affordability tests, repaymenthistory, capacity to repay, sensitivity to economic and marketdevelopments and risk-adjusted return.
• The Board delegates authority to Executive AdvancesCommittee, Group Credit Committee and divisional creditcommittees.
• Credit risk authority must be specifically granted in writing toall individuals involved in the granting of credit approval,whether this is exercised personally or collectively as part ofa credit committee. In exercising credit authority, theindividuals must act independently and with balancedcommercial judgement.
• Where credit authority is exercised personally, the individualmust not have any responsibility or accountability forbusiness revenue generation.
• All credit exposures, once approved, must be effectivelymonitored and managed and reviewed periodically againstapproved limits. Lower quality exposures are subject to agreater frequency of analysis and assessment.
• Customers with emerging credit problems must be identifiedearly and classified accordingly. Remedial actions must beimplemented promptly to minimise the potential loss to theGroup.
• Portfolio analysis and reporting must be used to identify andmanage credit risk concentrations and credit risk qualitymigration.
Each Division must establish its own CRMF consistent with theGroup CRMF. Divisional credit departments are responsible formaintaining the CRMF and ensuring that asset quality is withinspecified parameters. Divisional credit departments areindependent of business management and have no directresponsibility or accountability for revenue generation. Thisindependence is supported by the divisional head of credithaving dual reporting lines to the both the divisional CEO (viathe divisional Chief Risk Officer) and to the Head of GroupCredit Risk.
GRM undertakes regular assessment of the effectiveness ofeach divisional CRMF to ensure it complies with Groupstandards and is appropriate for the business beingundertaken. GRC and the GEMC review reports on the Group’sportfolio of credit risks on a monthly basis.
Credit approval processDifferent credit approval processes exist for each customertype in order to ensure appropriate skills and resources areemployed in credit assessment and approval whilst followingthe key principles relating to credit approval.
Wholesale risk exposures are aggregated to determine theappropriate level of credit approval required and to facilitateconsolidated credit risk management.

section
01O
per
atin
g a
ndfin
anci
al r
evie
w
89
Op
erat
ing
and
fin
anci
al r
evie
w
Annual Report and Accounts 2005
Credit authority is not extended to relationship managers:
• Assessments of corporate borrower and transaction risk areundertaken using a range of credit risk models supplemented,where appropriate, by management judgement. Specialistinternal credit risk departments independently oversee thecredit process and make credit decisions orrecommendations to the appropriate credit committee.
• Financial Markets counterparties are subject to similarmodelling techniques but are approved by a dedicated creditfunction which specialises in traded market product risk.
Consumer lending and personal businesses employ bestpractice credit scoring techniques to process small scale,large volume credit decisions. Scores from such systems arecombined with management judgement to ensure an effectiveongoing process of approval, review and enhancement. Creditdecisions for loans above specified thresholds are individuallyassessed.
Credit risk modelsCredit risk models are used throughout the Group to supportthe analytical elements of the credit risk managementframework, in particular the quantitative risk assessment partof the credit approval process, ongoing credit monitoring aswell as portfolio level analysis and reporting.
Credit risk modelling governanceThe Group’s ‘Principles for Managing Credit Risk’ outline thegovernance structure under which all credit risk models mustbe developed, reviewed and approved. GRM is responsible for:
• Establishing high level standards to which all credit riskmodels across the Group must adhere and thus ensuring aconsistency of approach to credit risk modelling across theGroup.
• Approving all credit risk models prior to implementation andreviewing existing models on at least an annual basis.
Divisional credit risk departments own the particular modelsand are responsible for:
• Developing credit risk models appropriate for the types ofborrower and facilities in their credit portfolios and obtainingapproval from GRM for their implementation.
• Validating the models on at least an annual basis (every twoyears for credit risk exposure measurements models) andsubmitting documentation of these validations to GRM withappropriate recommendations on recalibration, whereapplicable.
• Obtaining approval from GRM for any new methodology orparameter estimates used in existing credit risk models priorto implementation.
Credit risk models used by the Group can be broadly groupedinto four categories.
• Probability of default (“PD”)/customer credit grade – thesemodels assess the probability that the customer will fail tomake full and timely repayment of credit obligations over aone year time horizon. Each customer is assigned aninternal credit grade which corresponds to probability ofdefault. There are a number of different credit gradingmodels in use across the Group, each of which considersparticular customer characteristics in that portfolio. Thecredit grading models use a combination of quantitativeinputs, such as recent financial performance and customerbehaviour, and qualitative inputs, such as companymanagement performance or sector outlook.
Every customer credit grade across all grading scales in the Group can be mapped to a Group level credit grade(see page 90).
• Exposure at default (“EAD”) – these models estimate theexpected level of utilisation of a credit facility at the time ofa borrower’s default. The EAD will typically be higher thanthe current utilisation (e.g. in the case where furtherdrawings are made on a revolving credit facility prior todefault) but will not typically exceed the total facility limit.The methodologies used in EAD modelling recognise thatcustomers may make more use of their existing creditfacilities in the run up to a default.
• Loss given default (“LGD”) – these models estimate theeconomic loss that may be suffered by the Group on a creditfacility in the event of default. The LGD of a facility representsthe amount of debt which cannot be recovered and istypically expressed as a percentage of the EAD. The Group’sLGD models take into account the type of borrower, facilityand any risk mitigation such as the presence of any securityor collateral held. The LGD may also be affected by theindustry sector of the borrower, the legal jurisdiction in whichthe borrower operates as well as general economic conditionswhich may impact the value of any assets held as security.
• Credit risk exposure measurement – these models calculatethe credit risk exposure for products where the exposure isnot 100% of the gross nominal amount of the creditobligation. These models are most commonly used forderivative and other traded instruments where the amount ofcredit risk exposure may be dependent on external variablessuch as interest rates or foreign exchange rates.

90
Ope
ratin
g an
d fin
anci
al r
evie
wOperating and financial review continued
Credit risk assetsCredit risk assets measure the exposure to all products in theGroup’s credit portfolios which consist of loans and advances(including overdraft facilities), instalment credit, finance leasereceivables, debt securities and other traded instrumentsacross all customer types.
Credit risk assets are typically analysed excluding reverserepurchase agreements due to the short-term nature and lowcredit risk associated with this product. A breakdown of creditrisk assets by division is shown below.
1 January2005 2005
Reverse repurchase agreements £bn £bn
Banks 41.8 34.5Customers 48.9 64.6
90.7 99.1
Reverse repurchase agreements as at 31 December 2005 were £90.7 billion (1 January 2005 – £99.1 billion), a decrease of£8.4 billion (8%) during the year.
Credit risk asset qualityInternal reporting and oversight of risk assets is principallydifferentiated by credit ratings. Internal ratings are used toassess the credit quality of borrowers. Customers areassigned credit ratings, based on various credit gradingmodels that reflect the probability of default. All credit ratingsacross the Group map to a Group level asset quality scale.
Expressed as an annual probability of default, the upper andlower boundaries and the midpoint for each of these Grouplevel asset quality grades are as follows:
Asset Annual probability of defaultquality Minimum Midpoint Maximum S&P grade % % % equivalentAQ1 0.02 0.10 0.20 AAA to BBB-AQ2 0.21 0.40 0.60 BB+ to BBAQ3 0.61 1.05 1.50 BB- to B+AQ4 1.51 3.25 5.00 B+ to BAQ5 5.01 15.00 — B and below
0%
10%
20%
30%
40%
50%
AQ1 AQ2 AQ3 AQ4 AQ5
2005
2004
Distribution of credit risk assets by asset qualityOverall credit asset quality remained stable during 2005.As at 31 December 2005, exposure to investment gradecounterparties (AQ1) accounted for 47% (2004 – 49%) ofcredit risk assets and 98% (2004 – 97%) of exposures were tocounterparties rated AQ4 or higher. The exposure to the lowestasset quality (AQ5) reduced from 2.6% at 31 December 2004to 2.2% at 31 December 2005.
2005 2004Credit risk assets £bn £bn
Corporate Markets 273.0 235.2Retail Banking 78.0 72.2Retail Direct 26.6 21.7Wealth Management 8.9 10.7Citizens 74.5 59.4RBS Insurance 6.7 6.1Ulster Bank 30.5 22.3
498.2 427.6
Excluding reverse repurchase agreements, credit risk assets at 31 December 2005 were £498.2 billion (2004 – £427.6 billion), an increase of £70.6 billion (17%) during the year.
An analysis of reverse repurchase agreements is shown below.
Note: Graph data are shown net of provisions and reverserepurchase agreements.

section
01O
per
atin
g a
ndfin
anci
al r
evie
w
91
Op
erat
ing
and
fin
anci
al r
evie
w
Annual Report and Accounts 2005
Individuals
Public sectors and quasi government
Property
Banks
Financial services
Transport and storage
Manufacturing
Wholesale and retail trade
Tourism and leisure
Building and construction
Business services
Technology, media and telecommunications
Power and water
Natural resources and nuclear
Agriculture and fisheries
5% 10% 15% 20% 25% 30%
2005
2004
Note: Graph data are shown net of provisions and reverse repurchase agreements.
As at 31 December 2005, 30% of credit risk assets (2004 – 30%) relate to individuals (personal and retail customers) and includemortgage lending and other smaller loans that are intrinsically well-diversified. Corporate industry sectors, including public sectorand quasi government, account for 48% (2004 – 46%) of credit risk assets, with banks and other financial institutions representingthe remaining 22% (2004 – 24%) of credit risk assets.
Distribution of credit risk assets by industry sectorIndustry analysis plays an important part in assessing potential concentration risk from within the loan portfolio. Particular attentionis given to industry sectors where the Group believes there is a high degree of risk or potential for volatility in the future.
The Group also uses scenario analysis and stress testing in order to monitor the risk to clusters of correlated industry sectors.

92
Ope
ratin
g an
d fin
anci
al r
evie
wOperating and financial review continued
Distribution of credit risk assets by geographyThe Group is currently active in 27 countries, with its principal focus on the UK, North America and Europe.
During 2005 there was further geographic diversification ofcredit risk assets away from the UK and into the rest of Europeand North America. As at 31 December 2005, 49.3% of creditrisk assets were within the UK. North America and Europeaccount for 45.5% of credit risk assets with the remaining 5.2%in the rest of the world.
Distribution of credit risk assets by product and customer type
The Group also monitors the breakdown of the credit portfolio by customer type and product type. The Group’s largest exposure by credit risk assets is corporate customer lending products which represent 31% of credit risk assets as at 31 December 2005(2004 – 30%). As illustrated in the industry analysis this exposure is well diversified across industry sectors.
0%
20%
40%
60%
80%
100%
Rest of world Europe United KingdomNorth America
2004 2005
52.2 49.3
25.927.3
16.7 18.2
5.1 5.2
2004
2005
0% 5% 10% 15% 20% 25% 30% 35%
Lending to corporate customers
Lending to individuals (mortgages)
Debt securities to banks, sovereigns and quasi-government
Lending to individuals (other)
Debt securities to corporate customers
Lending to small businesses
Lending to banks, sovereigns and quasi government
Asset-backed securities
Other and off-balance sheet

section
01O
per
atin
g a
ndfin
anci
al r
evie
w
93
Op
erat
ing
and
fin
anci
al r
evie
w
Annual Report and Accounts 2005
1 January 31 December2005 2005 2004
REIL and PPL £m £m £m
Non-accrual loans(1) 5,926 5,836 4,733Accrual loans past due 90 days(2) 9 52 713Troubled debt restructurings(3) 2 — 24Total REIL 5,937 5,888 5,470
PPL(4) 19 11 280Total REIL and PPL 5,956 5,899 5,750
REIL and PPL as % of lending to customers loans and advances – gross(5) 1.60% 1.84% 1.92%
* following the implementation of IAS 39, the sub-categories of REIL and PPL are calculated as per notes 1 to 4 below.
(1) All loans against which an impairment provision is held are reported in the non-accrual category.
(2) Loans where an impairment event has taken place but no impairment recognised. This category is used for over-collateralised non-revolving credit facilities.
(3) Troubled debt restructurings represent loans that have been restructured following the granting of a concession by the Group to the borrower.
(4) Loans for which an impairment event has occurred but no impairment provision is necessary. This category is used for over-collateralised advances and revolving credit facilitieswhere identification as 90 days overdue is not feasible.
(5) Gross of provisions and excluding reverse repurchase agreements.
REIL as at 31 December 2005 was £5,937 million (1 January 2005 – £5,888 million), an increase of £49 million (1%) during the year.As a % of customer lending, REIL and PPL in aggregate show an improving trend, amounting to 1.60% of customer loans andadvances at 31 December 2005 (1 January 2005 – 1.84%).
REIL by divisionThe table below shows REIL by division.
1 January 31 December2005 2005 2004
REIL £m £m £m
Corporate Markets 1,465 2,098 1,892Retail Banking 2,988 2,526 2,399Retail Direct 889 671 601Wealth Management 58 65 99Ulster Bank 342 389 341Citizens 195 136 135RBS Insurance — 3 3
Total REIL 5,937 5,888 5,470
During 2005 REIL in Corporate Markets reduced by £633 million reflecting continued favourable conditions in the corporateenvironment in UK, Europe and the US. This was offset by a combined increase in REIL in Retail Banking and Retail Direct of £680million (21%) due to the weakening of the consumer environment in the UK.
Loan impairmentThe Group classifies impaired assets as either Risk Elements in Lending (“REIL”) or Potential Problem Loans (“PPL”). REIL representsnon-accrual loans, loans that are accruing but are past due 90 days and restructured loans. PPL represent impaired assets whichare not included in REIL but where known information about possible credit problems causes management to have serious doubtsabout the future ability of the borrower to comply with loan repayment terms.
Both REIL and PPL are reported gross of the value of any security held, which could reduce the eventual loss should it occur, andgross of any provision marked. Therefore impaired assets which are highly collateralised, such as mortgages, will have a lowcoverage ratio of provisions held against reported impaired balance.
The adoption of IAS 39 under IFRS at the start of 2005 resulted in changes to the methodology used to identify impaired assets andtherefore the way that REIL is calculated. Comparative financial information is given in the following tables for both 1 January 2005and 31 December 2004. Commentary is based on comparison with information at 1 January 2005, which reflects the impact of IAS32, IAS 39 and IFRS 4.
The table below sets out the Group’s loans that are classified as REIL and PPL:

94
Ope
ratin
g an
d fin
anci
al r
evie
w
Impairment loss provision methodologyProvisions for impairment losses are assessed under threecategories as described below:
Individually assessed provisions are the provisions required forindividually significant impaired assets which are assessed ona case by case basis, taking into account the financial conditionof the counterparty and any guarantor. This incorporates an estimate of the discounted value of any recoveries andrealisation of security or collateral. The asset continues to be assessed on an individual basis until it is repaid in full,transferred to the performing portfolio or written-off.
Collectively assessed provisions are provisions on impairedcredits below an agreed threshold which are assessed on aportfolio basis, to reflect the homogeneous nature of theassets, such as credit cards or personal loans. The provision isdetermined from a quantitative review of the relevant portfolio,taking account of the level of arrears, security and averageloss experience over the recovery period.
Latent loss provisions are provisions held against the estimatedimpairment in the performing portfolio which have yet to beidentified as at the balance sheet date. To assess the latentloss within the portfolios, the Group has developedmethodologies to estimate the time that an asset can remainimpaired within a performing portfolio before it is identified andreported as such.
Provision analysisThe Group’s consumer portfolios, which consist of small value,high volume credits, have highly efficient largely automatedprocesses for identifying problem credits and very shorttimescales, typically three months, before resolution oradoption of various recovery methods.
Corporate portfolios consist of higher value, lower volumecredits, which tend to be structured to meet individualcustomer requirements. Provisions are assessed on a case bycase basis by experienced specialists, as well as professionalvaluations of collateral and the expert judgement ofaccountants. The Group operates a clear provisionsgovernance framework which sets thresholds whereby suitableoversight and challenge is undertaken. These opinions andlevels of provision are overseen by the division’s ProvisionCommittee chaired by its Chief Executive, with representationfrom Group Risk Management. In addition, significant casesare presented to, and challenged by, the Group ProblemExposure Review Forum chaired by the Group Chief Executiveor the Group Finance Director.
Early and active management of problem exposures ensuresthat credit losses are minimised. Specialised units are used fordifferent customer types to ensure that the appropriate riskmitigation is taken in a timely manner.
Portfolio provisions are reassessed regularly as part of theGroup’s ongoing monitoring process.
Pro forma Statutory2005 2004 2004
Loan impairment charge £m £m £m
Latent loss provisions charge 14 75Collectively assessed provisions charge 1,399 1,059Individually assessed provisions charge 290 373Specific provision charge 1,386General provision charge 16Total charge to income statement 1,703 1,507 1,402
Charge as a % of customer loans and advances – gross(1) 0.46% 0.47% 0.47%
Operating and financial review continued
Notes:
(1) Gross of provisions and excluding reverse repurchase agreements.
Provisions for loan impairment charged to the income statement in 2005 were £1,703 million, up £196 million (13%) from pro forma 2004.As a percentage of customer lending, the impairment charge improved slightly from 0.47% to 0.46%.
The adoption of IAS 39 under IFRS at the start of 2005 resulted in changes to the methodology used to identify impaired assets and to calculate required provisions. The following table therefore shows 2004 on both a pro forma and statutory basis. Commentaryis based on comparisons with the pro forma information which reflects the impact of IAS 32, IAS 39 and IFRS 4.

section
01O
per
atin
g a
ndfin
anci
al r
evie
w
95
Op
erat
ing
and
fin
anci
al r
evie
w
Annual Report and Accounts 2005
£m
Balance as at 1 January 2005 4,145Currency and other adjustments 51Amounts written-off (2,040)Recoveries of amounts previously written-off 172Charge to income statement 1,703Discount unwind(1) (144)Balance as at 31 December 2005(2) 3,887
Notes:
(1) The impact of discounting inherent within the provisions balance is unwound as the time to receiving the expected recovery cash flows draws nearer.
(2) Includes provisions against loans and advances to banks of £3 million (1 January 2005 – £5 million).
An impairment provision calculated using the effective interest rate method leaves a discounted asset; the discount unwinds at aconstant effective rate until the outstanding asset is completely realised.
Summary of loan impairment provisionsA summary of the total customer provisions balance is shown in the table below.
As at 31 December 2005 total customer provisions were £3,884 million, down £256 million (6%) from 1 January 2005. The movementin provisions balance is shown at the bottom of the page.
Provisions coverageThe Group’s provision coverage ratios are shown in the table below.
The coverage ratio of closing provisions to REIL and PPL decreased from 70% to 65% during 2005. The lower coverage ratio reflectsa change of mix in the portfolios to more secured assets (e.g. residential mortgages) which, due to the level of collateral held,require a much lower level of provision.
Movement in loan impairment provisions balanceThe movement in provisions balance during 2005 is shown in the table below.
1 January 31 December2005 2005 2004
Loan impairment provisions(1) £m £m £m
Latent loss provisions 543 570Collectively assessed provisions 2,587 2,484Individually assessed provisions 754 1,086Specific provisions 3,607General provision 561Total provisions 3,884 4,140 4,168
Total provision as a % of customer loans and advances – gross(2) 1.0% 1.3% 1.4%
1 January 31 December2005 2005 2004
Total provision expressed as a:% of REIL 65% 70% 76%% of REIL and PPL 65% 70% 72%
Notes:
(1) Excludes provisions against loans and advances to banks of £3 million (1 January 2005 – £5 million; 31 December 2004 – £6 million).
(2) Gross of provisions and excluding reverse repurchase agreements.

96
Ope
ratin
g an
d fin
anci
al r
evie
wOperating and financial review continued
Liquidity riskLiquidity risk management within the Group focuses on bothoverall balance sheet structure and the day-to-day control,within prudent limits, of risk arising from the mismatch ofmaturities across the balance sheet and from undrawncommitments and other contingent obligations.
The management of liquidity risk within the Group isundertaken within limits and other policy parameters set byGALCO, which reviews monthly, and receives on an exceptionbasis, reports detailing compliance with those policyparameters. A weekly report is also provided to the Group’sexecutive management. Compliance is monitored and co-ordinated daily under the stewardship of the Group Treasury
function, both in respect of internal policy and the regulatoryrequirements of the Financial Services Authority.
Detailed liquidity position reports are compiled each day byGroup Treasury and reviewed daily and weekly with FinancialMarkets, who manage day-to-day and intra-day marketexecution within the policy parameters set.
In addition to their consolidation within the Group’s dailyliquidity management process, it is also the responsibility of allGroup subsidiaries and branches outside the UK to ensurecompliance with any separate local regulatory liquidityrequirements where applicable, subject to Group Treasuryoversight.
2005 2004Sources of funding £m % £m %
Customer accounts (excluding repos)Repayable on demand 172,853 27 169,016 32Time deposits 121,260 19 72,165 14
Total customer accounts (excluding repos) 294,113 46 241,181 46Debt securities over 1 year remaining maturity 22,293 3 9,931 2Subordinated liabilities 28,274 4 20,366 4Shareholders’ equity 35,435 6 33,905 6
380,115 59 305,383 58Debt securities up to 1 year remaining maturity 68,127 11 54,068 10Repo agreements with customers 48,754 7 42,134 8Deposits by banks (excluding repos) 62,502 10 56,541 11Repo agreements with banks 47,905 7 43,342 8Short positions 37,427 6 28,923 5Total 644,830 100 530,391 100
Diversification of funding sourcesThe structure of the Group’s balance sheet is managed to maintain substantial diversification, to minimise concentration across itsvarious deposit sources, and to contain the level of reliance on total and net short-term wholesale sources of funds within prudentlevels. As part of the Group’s planning process, the forecast structure of the balance sheet is regularly reviewed over the planhorizon and funding strategies and options are developed by Group Treasury and implemented after review and approval by GALCO.
The level of large deposits taken from banks, corporate customers, non-bank financial institutions and other customers, andsignificant cash outflows therefrom, are also reviewed regularly to monitor concentration and identify any adverse trends. During2005 the composition of the Group’s funding sources remained well diversified by counterparty, instrument, market and maturity.
Customer accounts (excluding repos), term debt securities ofover 1 year remaining maturity, subordinated liabilities andcapital continue to represent the core of the Group’s funding.These core funds in total increased by £74,732 million (24%)over the course of 2005 to represent 59% of total fundingexcluding other liabilities at 31 December 2005.
Customer accounts continue to provide a substantialproportion of the Group’s funding and comprise a welldiversified and stable source of funds from a wide range ofretail, corporate and non-bank institutional customers.Excluding repo agreements, customer accounts grew by
£52,932 million (22%), to maintain 46% of total fundingexcluding other liabilities at 31 December 2005.
Term debt securities with an outstanding term of over 1 yearincreased £12,362 million (124%) to represent 3% of theGroup’s funding at 31 December 2005, reflecting the activity ofthe Group in raising term funds through its Euro and USMedium Term Note and securitisation programmes.
Capital (shareholders’ equity and subordinated debt) increasedby £9,438 million (17%) and provides around 10% of totalfunding excluding other liabilities.

section
01O
per
atin
g a
ndfin
anci
al r
evie
w
97
Op
erat
ing
and
fin
anci
al r
evie
w
Annual Report and Accounts 2005
Short term wholesale deposits are taken from a wide range ofcounterparties, with the largest single depositor continuing torepresent less than 1% of the Group’s total funding. The levelof funding from short term unsecured debt issuance and bankdeposits, excluding repos and short positions, has increasedby £20,020 million (18%) to represent 20% of total fundingexcluding other liabilities at 31 December 2005, reflecting thehigher rate of growth in customer loans and advances (see‘net customer activity’ below).
Short positions and repos with corporate, institutionalcustomers and banks are undertaken primarily by RBS
Greenwich Capital in the US and by Financial Markets. Repoand short positions increased by £19,687 million (17%) torepresent 21% of total funding excluding other liabilities at 31December 2005.
The Group remains well placed to access various wholesalefunding sources from a wide range of counterparties andmarkets. The changing mix evident between customer repo,deposits by banks, debt securities in issue, and shortsprimarily reflects comparative pricing, maturity considerationsand investor/counterparty demand rather than a materialperceived trend.
2005 2004Net customer activity £m £m
Loans and advances to customers (gross, excluding reverse repos) 372,223 299,235 Customer accounts (excluding repos) 294,113 241,181 Customer lending less customer accounts 78,110 58,054
Loans and advances to customers as a % of customer accounts (excluding repos) 126.6% 124.1%
In prevailing economic conditions and with interest rates atrelatively low historical levels in the UK, US and Europe, it isanticipated that the growth in demand for further borrowing bycustomers is likely, in the medium term, to continue to exceedthat for customer deposits received, thus increasing netcustomer lending further and increasing gradually over timethe Group’s dependence on the wholesale market for funding.
The Group evaluates on a regular basis a range of balancesheet management and term funding strategies to address theconsequent potential impact on its structural liquidity riskposition and maintain that within its normal policy parameters.
Management of term structureThe degree of maturity mismatch within the overall long-termstructure of the Group’s assets and liabilities is also managedwithin internal policy limits, to ensure that term assetcommitments may be funded on an economic basis over theirlife. In managing its overall term structure, the Group analysesand takes into account the effect of retail and corporatecustomer behaviour on actual asset and liability maturitieswhere they differ materially from the underlying contractualmaturities.
Stress testingThe maintenance of high quality credit ratings is recognised asan important component in the management of the Group’sliquidity risk. Credit ratings affect the Group’s ability to raise,and the cost of raising, funds from the wholesale market andthe need to provide collateral in respect of, for example,changes in the mark-to-market value of derivative transactions.
Given its strong credit ratings, the impact of a single notchdowngrade would, if it occurred, be expected to have arelatively small impact on the Group’s economic access toliquidity. More severe downgrades would have a progressivelygreater impact but have an increasingly lower probability ofoccurrence.
As part of its stress testing of its access to sufficient liquidity,the Group regularly evaluates the potential impact of a rangeof levels of downgrade in its credit ratings and carries outstress tests of other relevant scenarios and sensitivity analyses.
Contingency funding plans are maintained to anticipate andrespond to any approaching or actual material deterioration inmarket conditions or in the Group’s credit ratings, and theGroup remains confident of its ability to manage its liquidityrequirements effectively in all such circumstances.
Daily risk managementThe primary focus of the Group’s day to day risk managementactivity is to ensure access to sufficient liquidity to meet itscashflow obligations within key time horizons out to one monthahead. The short-term maturity structure of the Group’sliabilities and assets is managed on a daily basis to ensure thatall material cashflow obligations, and potential cashflowsarising from undrawn commitments and other contingentobligations, can be met as they arise from day to day, eitherfrom cash inflows, from maturing assets, new borrowing or thesale or repurchase of various debt securities held (afterallowing for appropriate haircuts).
Net customer activityNet customer lending, excluding repos, rose by £20,056 million as the growth in loans and advances to customers continued toexceed the growth in customer accounts, thus increasing the degree of reliance on wholesale market funding to support loan growth.

98
Ope
ratin
g an
d fin
anci
al r
evie
wOperating and financial review continued
2005 2004Net short-term wholesale market activity £m £m
Debt securities, treasury bills and other eligible bills 126,503 100,018 Reverse repo agreements with banks and customers 90,691 82,159 Less: repos with banks and customers (96,659) (85,476)Short positions (37,427) (28,923)Insurance Companies’ debt securities held (5,724) (5,029)Debt securities charged as security for liabilities (9,578) (4,852)Net marketable assets 67,806 57,897
By remaining maturity up to 1 month:Deposits by banks (excluding repos) 35,153 34,041Less: loans and advances to banks (gross, excluding reverse repos) (16,381) (17,067)Debt securities in issue 20,577 15,505Net wholesale liabilities due within 1 month 39,349 32,479
Net surplus of marketable assets over wholesale liabilities due within 1 month 28,457 25,418
Short-term liquidity risk is managed on a consolidated basis forthe whole Group excluding the activities of Citizens andinsurance businesses, which are subject to regulatory regimesthat necessitate local management of liquidity.
Internal liquidity mismatch limits are set for all othersubsidiaries and non-UK branches which have material localtreasury activities in external markets, to ensure those activitiesdo not compromise daily maintenance of the Group’s overallliquidity risk position within the Group’s policy parameters.
The Group’s net surplus of marketable assets over net short-term wholesale liabilities due within one month increased by£3,039 million to £28,457 million at 31 December 2005.Overall access to liquidity to meet all foreseen needs remainscomfortably within the Group’s policy parameters.
Sterling liquidityOver 42% of the Group’s total assets are denominated insterling. For its sterling activity the FSA requires the Group on a consolidated basis to maintain daily a minimum ratio of 100% between:
1. a stock of qualifying high quality liquid assets (primarily UKand EU government securities, treasury bills, and cash heldin branches) and
2. the sum of :• sterling wholesale net outflows contractually due within
five working days (offset up to a limit of 50%, by 85% of sterling certificates of deposit held which maturebeyond five working days); and
• 5% of retail deposits with a residual contractual maturityof five working days or less.
The Group exceeded the minimum ratio requirementthroughout 2005.
The FSA also set an absolute minimum level for the stock ofqualifying liquid assets that the Group is required to maintaineach day. The Group has exceeded that minimum stockrequirement at all times during 2005.
The Group’s operational processes are actively managed toensure that both the minimum sterling liquidity ratio and theminimum stock requirement are achieved or exceeded at alltimes.
Liquidity in non-sterling currenciesFor non-sterling currencies, no specific regulatory liquidityrequirement is currently set for the Group by the FSA. However,the importance of managing prudently the liquidity risk in itsnon-sterling activities is recognised and the Group manages itsnon-sterling liquidity risk daily within net mismatch limits set forthe 0-8 calendar day and 0-1 month periods as a percentageof the Group’s total deposit and debt liabilities.
In measuring its non-sterling liquidity risk, due account is takenof the marketability within a short period of the wide range ofdebt securities held. Appropriate adjustments are applied ineach case, dependent on various parameters, to determine theGroup’s ability to realise cash at short notice via the sale orrepo of such marketable assets if required to meetunexpected outflows.
The level of contingent risk from the potential drawing ofundrawn or partially drawn commitments, back-up lines,standby lines and other similar facilities is also activelymonitored and reflected in the measures of the Group’s non-sterling liquidity risk. Particular attention is given to the US$commercial paper market and the propensity of the Group’scorporate counterparties who are active in raising funds fromthat market to switch to utilising facilities offered by the Groupin the event of either counterparty specific difficulties or asignificant widening of interest spreads generally in thecommercial paper market.

section
01O
per
atin
g a
ndfin
anci
al r
evie
w
99
Op
erat
ing
and
fin
anci
al r
evie
w
Annual Report and Accounts 2005
The Group also provides liquidity back-up facilities to both itsown conduits and certain other conduits which take fundingfrom the US$ commercial paper market. Limits sanctioned forsuch facilities totalled less than £11 billion at 31 December2005. The short-term contingent liquidity risk in providing suchback-up facilities is also mitigated by the spread of maturitydates of the commercial paper taken by the conduits.
The Group has operated within its non-sterling liquidity policymismatch limits at all times during 2005 and operationalprocesses are actively managed to ensure that is the casegoing forward.
Developments in liquidity risk management regulationFollowing the Basel Committee’s publication of SoundPractices for Managing Liquidity in Banking Organisations inFebruary 2000, a number of regulatory bodies internationallybegan reviewing their regulatory liquidity frameworks.
In the UK, the FSA published a discussion document – DP24 –in October 2003 setting out draft proposals for a newquantitative framework to operate in the UK. Comments madeto the FSA, by the Group and other banks collectively, inresponse to these proposals, made clear the desirability of aninternationally coordinated approach to the regulation ofliquidity. An international forum of regulators, chaired jointly bythe FSA and the US Federal Reserve Bank, was alsoestablished in 2004 to review regulation across the OECD.Their report is awaited. In 2005, the European Commission hasalso begun to consider the subject.
Following earlier consultation, the FSA also introduced inJanuary 2005, new requirements for liquidity managementsystems and controls, particularly in respect of stress testing,contingency funding plans and related documentation. TheGroup has complied with these requirements and will continueto do so going forward.
The Group has been, and continues to be, actively involved inworking with the various regulatory bodies to assist thedevelopment of an appropriate future regulatory liquidityregime which takes into account local national considerationsbut also gives due recognition to the integrated cross-borderapproach to the management of liquidity risk within mostinternational banking groups.
Taking account of the indicative future regulatory requirementspublished to date, the Group continues to develop its liquidityrisk reporting, management and stress testing capabilities.
Market riskThe Group is exposed to market risk because of positions heldin its trading portfolios and its non-trading business includingthe Group’s treasury operations. The Group manages themarket risk in its trading and treasury portfolios through itsmarket risk management framework, which is based on value-at-risk (“VaR”) limits, together with, but not limited to, stresstesting, scenario analysis, and position and sensitivity limits.Stress testing measures the impact of abnormal changes inmarket rates and prices on the fair value of the Group’s tradingportfolios. GEMC approves the high-level VaR and stress limits
for the Group. The Group Market Risk function, independentfrom the Group’s trading businesses, is responsible for settingand monitoring the adequacy and effectiveness of the Group’smarket risk management processes.
Value-at-riskVaR is a technique that produces estimates of the potentialnegative change in the market value of a portfolio over aspecified time horizon at given confidence levels. For internalrisk management purposes, the Group’s VaR assumes a timehorizon of one day and a confidence level of 95%. The Groupuses historical simulation models in computing VaR. Thisapproach, in common with many other VaR models, assumesthat risk factor changes observed in the past are a goodestimate of those likely to occur in the future and is, therefore,limited by the relevance of the historical data used. TheGroup’s method, however, does not make any assumptionabout the nature or type of underlying loss distribution.The Group typically uses the previous two years of marketdata. The Group’s VaR should be interpreted in light of thelimitations of the methodology used. These limitations include:
• Historical data may not provide the best estimate of the jointdistribution of risk factor changes in the future and may failto capture the risk of possible extreme adverse marketmovements which have not occurred in the historical windowused in the calculations.
• VaR using a one-day time horizon does not fully capture themarket risk of positions that cannot be liquidated or hedgedwithin one day.
• VaR using a 95% confidence level does not reflect the extentof potential losses beyond that percentile.
The Group largely computes the VaR of trading portfolios atthe close of business and positions may change substantiallyduring the course of the trading day. Controls are in place tolimit the Group’s intra-day exposure; such as the calculation ofthe VaR for selected portfolios. These limitations and the natureof the VaR measure mean that the Group cannot guaranteethat losses will not exceed the VaR amounts indicated.
TradingThe principal focus of the Group’s trading activities is clientfacilitation – providing products to the Group’s client base atcompetitive prices. The Group also undertakes: market making– quoting firm bid (buy) and offer (sell) prices with the intentionof profiting from the spread between the quotes; arbitrage –entering into offsetting positions in different but closely relatedmarkets in order to profit from market imperfections; andproprietary activity – taking positions in financial instruments asprincipal in order to take advantage of anticipated marketconditions. The main risk factors are interest rates, creditspreads and foreign exchange. Financial instruments held inthe Group’s trading portfolios include, but are not limited to,debt securities, loans, deposits, securities sale and repurchaseagreements and derivative financial instruments (futures,forwards, swaps and options). For a discussion of the Group’saccounting policies for, and information with respect to, itsexposures to derivative financial instruments, see Accountingpolicies and Note 19 on the accounts.

100
Ope
ratin
g an
d fin
anci
al r
evie
wOperating and financial review continued
2005 2004
Average Period end Maximum Minimum Average Period end Maximum MinimumTrading £m £m £m £m £m £m £m £m
Interest rate 7.3 7.4 10.9 5.1 6.0 5.4 8.5 4.1Credit spread 11.4 11.8 14.4 8.8 8.6 10.4 12.0 5.1Currency 1.8 1.4 10.7 0.5 1.1 1.2 2.7 0.5Equity and commodity 0.5 0.7 1.1 0.2 0.8 0.4 2.1 0.3Diversification (8.5) (6.5)
Total trading VaR 13.0 12.8 16.5 9.9 10.6 10.9 16.0 6.3
The VaR for the Group’s trading portfolios segregated by type of market risk exposure, including idiosyncratic risk, is presented inthe table below.
The Group’s trading activities are carried out principally by Global Banking & Markets. The charts below depict the number of dayson which Global Banking & Markets’ trading income fell within the stated ranges
0
5
10
15
20
25
30
35
40
45
50
< (4)
(4) > <(2)
(2) > <0
0 > <22 > <4
4 > <6
6 > < 8
8 > < 10
10 > < 12
12 > < 14
14 > < 16
16 > < 18
18 > < 20
20 > < 22
22 > < 24
24 > < 26
26 > < 28
28 > < 30
30 > < 32
32 > < 34
36 > < 38
38 > < 40
40 > < 42
42 > < 44< 44
0
5
10
15
20
25
30
35
40
45
50
< (4)
(4) > <(2)
(2) > <0
0 > <22 > <4
4 > <6
6 > < 8
8 > < 10
10 > < 12
12 > < 14
14 > < 16
16 > < 18
18 > < 20
20 > < 22
22 > < 24
24 > < 26
26 > < 28
28 > < 30
30 > < 32
32 > < 34
36 > < 38
38 > < 40
40 > < 42
42 > < 44
2005
2004
Num
ber
of
trad
ing
day
s
Trading income (£m)
Trading income (£m)
Num
ber
of
trad
ing
day
s

section
01O
per
atin
g a
ndfin
anci
al r
evie
w
101
Op
erat
ing
and
fin
anci
al r
evie
w
Annual Report and Accounts 2005
Non-tradingThe principal market risks arising from the Group’s non-tradingactivities are interest rate risk, currency risk and equity risk.Treasury activity and mismatches between the repricing ofassets and liabilities in its retail and corporate bankingoperations account for most of the non-trading interest raterisk. Non-trading currency risk derives from the Group’sinvestments in overseas subsidiaries, associates and branches.The Group’s venture capital portfolio and investments held byits general insurance business are the principal sources ofnon-trading equity price risk. The Group’s portfolios of non-trading financial instruments mainly comprise loans (includingfinance leases), debt securities, equity shares, deposits,certificates of deposits and other debt securities issued, loancapital and derivatives. To reflect their distinct nature, theGroup’s long-term assurance assets and liabilities attributableto policyholders have been excluded from these market riskdisclosures.
� Interest rate riskNon-trading interest rate risk arises from the Group’s treasuryactivities and retail and corporate banking businesses.
TreasuryThe Group’s treasury activities include its money marketbusiness and the management of internal funds flow within theGroup’s businesses. Money market portfolios include cashinstruments (principally debt securities, loans and deposits)and related hedging derivatives. VaR for the Group’s treasuryportfolios, which relates mainly to interest rate risk includingcredit spreads, was £3.5 million at 31 December 2005 (2004 –£5.7 million). During the year the maximum VaR was £5.8million (2004 – £9.3 million), the minimum £2.8 million (2004 –£5.7 million) and the average £4.0 million (2004 – £7.3 million).
Retail and corporate banking Structural interest rate risk arises in these activities whereassets and liabilities have different repricing dates. It is theGroup’s policy to minimise the sensitivity of net interest incometo changes in interest rates and where interest rate risk isretained to ensure that appropriate resources, measures andlimits are applied.
Structural interest rate risk is calculated in each division on thebasis of establishing the repricing behaviour of each assetand liability product. For many products, the actual interest raterepricing characteristics differ from the contractual repricing.In most cases, the repricing maturity is determined by themarket interest rate that most closely fits the historicalbehaviour of the product interest rate. For non-interest bearingcurrent accounts, the repricing maturity is determined by thestability of the portfolio. The repricing maturities used areapproved by Group Treasury and divisional asset and liabilitycommittees at least annually. Key conventions are reviewedannually by GALCO.
A static maturity gap report is produced as at the month-endfor each division, in each functional currency based on thebehaviouralised repricing for each product. It is Group policyto include in the gap report, non-financial assets and liabilities,mainly property, plant and equipment and the Group’s capital andreserves, spread over medium and longer term maturities. Thisreport also includes hedge transactions, principally derivatives.
Any residual non-trading interest rate exposures are controlledby limiting repricing mismatches in the individual balancesheets. Potential exposures to interest rate movements in themedium to long term are measured and controlled using aversion of the same VaR methodology that is used for theGroup’s trading portfolios but without discount factors. Netaccrual income exposures are measured and controlled interms of sensitivity over time to movements in interest rates.
Risk is managed within limits approved by GALCO through theexecution of cash and derivative instruments. Execution of thehedging is carried out by the relevant division through theGroup’s treasury functions. The residual risk position isreported to divisional asset and liability committees, GALCOand the Board.
Non-trading interest rate VaRNon-trading interest rate VaR for the Group’s treasury and retailand corporate banking activities was £81.5 million at 31December 2005 (2004 – £72.4 million) with the major exposurebeing to changes in longer term US dollar interest rates.During the year, the maximum VaR was £104.2 million (2004 –£89.7 million), the minimum £10.8 million (2004 – £51.5 million)and the average £65.5 million (2004 – £71.2 million).
Citizens was the main contributor to the Group’s non-tradinginterest rate VaR. It invests in a portfolio of highly rated andliquid investments, principally mortgage-backed securities.This balance sheet management approach is common for USretail banks where mortgages are originated and then sold toFederal agencies for funding through the capital markets.VaR, like all interest rate risk measures, has its limitations whenapplied to retail banking books and the management ofCitizens’ interest rate exposures involves a number of otherinterest rate risk measures and related limits. Two measuresthat are reported both to Citizens ALCO and the Board are:
• the sensitivity of net accrual earnings to a series of parallelmovements in interest rates; and
• economic value of equity (“EVE”) sensitivity to a series ofparallel movements in interest rates.

102
Ope
ratin
g an
d fin
anci
al r
evie
wOperating and financial review continued
The limits applied to these measures are set to parallel movements of +/-1% and +/-2%. The EVE methodology captures deposit re-pricing strategies and the embedded option risks that exist within both the investment portfolio of mortgage-backed securities andthe consumer loan portfolio. EVE is the present value of the cash flows generated by the current balance sheet. EVE sensitivity to a2% parallel movement upwards and downwards in US interest rates is shown below.
Percent increase/(decrease) in Citizens EVE2% parallel upward 2% parallel downward
movement in movement in US interest ratesUS interest rates (no negative rates allowed)
2005 % %
Period end (9.1) (8.2)Maximum (10.1) (9.8)Minimum (7.1) (4.4)Average (9.2) (7.9)
2004
Period end (9.2) (4.4)Maximum (12.6) (18.5)Minimum (5.2) (4.4)Average (9.3) (9.2)
For the Group, the other major structural interest rate risk arisesfrom a low interest rate environment, particularly in sterling,sustained for a number of years. In such a scenario, depositpricing may reach effective floors below which it is notpractical to reduce rates further whilst variable rate assetpricing continues to decline. A sustained low rate scenariowould also generate progressively reduced income from themedium and long term hedging of non-interest bearingliabilities. GALCO regularly reviews the impact of stressscenarios including the impact of substantial declines in ratesto ensure that appropriate risk management strategies areemployed. Resulting action may involve execution ofderivatives, product development and tactical pricing changes.
Note 34 on the accounts includes, on pages 195 and 196,tables that summarise the Group’s interest rate sensitivity gapfor its non-trading book at 31 December 2005 and 31 December2004. The tables show the contractual re-pricing for eachcategory of asset, liability and for off-balance sheet items anddo not reflect the behaviouralised repricing used in the Group’sasset and liability management methodology and the non-trading interest rate VaR presented above.
� Currency riskThe Group does not maintain material non-trading opencurrency positions other than the structural foreign currencytranslation exposures arising from its investments in foreignsubsidiaries and associated undertakings and their relatedcurrency funding. The Group’s policy in relation to structuralpositions is to match fund the structural foreign currencyexposure arising from net asset value, including goodwill, inforeign subsidiaries, equity accounted investments andbranches, except where doing so would materially increase thesensitivity of either the Group’s or the subsidiary’s regulatorycapital ratios to currency movements. The policy requiresstructural foreign exchange positions to be reviewed regularlyby GALCO. Foreign exchange differences arising on thetranslation of foreign operations are recognised directly inequity together with the effective portion of foreign exchangedifferences arising on hedging liabilities.

section
01O
per
atin
g a
ndfin
anci
al r
evie
w
103
Op
erat
ing
and
fin
anci
al r
evie
w
Annual Report and Accounts 2005
The tables below set out the Group’s structural foreign currency exposures.Foreign
currency StructuralNet investments borrowings foreign
in foreign hedging net currencyoperations investments exposures
2005 £m £m £m
US dollar 15,452 6,637 8,815Euro 2,285 139 2,146Swiss franc 431 430 1Chinese RMB 914 — 914Other non-sterling 76 72 4
19,158 7,278 11,880
2004
US dollar 12,367 6,580 5,787Euro 2,086 1,349 737Swiss franc 398 392 6Other non-sterling 116 112 4
14,967 8,433 6,534
The US dollar open structural foreign currency exposure reflects the action taken to mitigate the effect of the acquisition in 2004 ofCharter One on the Group’s capital ratios. However, the increase in this position and the Euro structural exposure over 2004 is largelya result of the exclusion from the table of preference shares classified as equity under IFRS. These instruments continue to beconsidered part of the currency funding of foreign operations for asset and liability management purposes. The exposure in ChineseRMB arises from the Group’s strategic investment in Bank of China.
� Equity riskNon-trading equity risk arises principally from the Group’sstrategic investments, its venture capital activities and itsgeneral insurance business. General insurance investmentstrategy is discussed below under insurance risk.
VaR is not an appropriate risk measure for the Group’s venturecapital investments, which comprise a mix of quoted andunquoted investments, or its portfolio of strategic investments.These investments are carried at fair value with changes in fairvalue recorded in profit or loss, or in equity.
Insurance riskThe Group is exposed to insurance risk, either directly throughits businesses or through using insurance as a tool to reduceother risk exposures.
An insurance contract transfers risk from the policyholder tothe insurer, whereby, in return for a premium paid,the insurer indemnifies the policyholder on the occurrence ofspecified events.
Insurance risk is the risk of fluctuations in the timing, frequencyand severity of insured events, relative to the expectations ofthe Group at the time of underwriting. This risk is managedaccording to the following separate components:
• Underwriting and pricing risk,• Claims management risk,• Reinsurance risk,• Reserving risk
Insurance risk is predictable, especially with the analysis oflarge volumes of data over time. There is, however, uncertaintyaround the predictions from various sources, for example,volatility of the weather. However, the Group has documentedrisk policies, coupled with governance frameworks to overseeand control and hence minimise the risks.
Underwriting and pricing riskThe Group manages underwriting and pricing risk through awide range of processes and forums, which include:
• Underwriting guidelines which exist for all businesstransacted restricting the types and classes of business thatmay be accepted;
• Pricing policies which are set by pricing committees, byproduct line and by brand;
• Centralised control of policy wordings and any subsequentchanges
Reinsurance and insurance of Group assets are centrallycontrolled in the same department as insurance risk and bothhave a similar framework of robust controls and processes.

104
Ope
ratin
g an
d fin
anci
al r
evie
wOperating and financial review continued
Claims management riskClaims management risk is the risk that claims are paidinappropriately. Claims are managed using a range of ITsystem controls and manual processes conducted byexperienced staff, to ensure that claims are handled in a timelyand accurate manner. Detailed policies and procedures existto ensure that all claims are handled appropriately, with eachmember of staff having a specified handling authority. Theprocesses include controls to avoid claims staff handling orpaying claims beyond their authorities, as well as controls toavoid paying invalid claims. Loss adjustors are used to handlecertain claims to conclusion.
Reinsurance riskReinsurance is used to protect the insurance results againstthe impact of major catastrophic events or unforeseen volumesof, or adverse trends in, large individual claims and to transferrisk that is outside the Group’s current risk appetite.
The following types of reinsurance are used where appropriate:
• Excess of loss ‘per individual risk’ reinsurance to protectagainst significantly large individual losses.
• Excess of loss catastrophe ‘event’ reinsurance to protectagainst major events, for example, windstorms or floods.
• Quota share reinsurance to protect against unforeseenadverse trends, where the reinsurer takes an agreedpercentage of premiums and claims.
• Other forms of reinsurance may be utilised according toneed, subject to approval by senior management or theboard as appropriate.
Reinsurance is only effective when the counterparty isfinancially secure. Before entering a contract with a newreinsurer, it must satisfy the Credit Risk Approval process that uses information derived internally and from securityratings agencies. Acceptable reinsurers are rated at A- or better unless specifically authorised by the RBS InsuranceGroup Board.
Reserving riskReserving risk relates to both premiums and claims. It is therisk that reserves are assessed incorrectly such thatinsufficient funds have been retained to pay or handle claimsas the amounts fall due, both in relation to those claims which have already occurred (in relation to the claims reserves, including claims handling expense reserves) or will occur in future periods of insurance (in relation to thepremium reserves).
a) Premium reservesIn respect of premium reserves, it is the Group’s policy toensure that the net unearned premium reserves anddeferred acquisition costs are adequate to meet theexpected cost of claims and associated expenses in relationto the exposure after the balance sheet date. To the extentthat the unearned premium reserves and deferredacquisition costs are inadequate, a liability adequacy
provision will be held which will initially write down anydeferred acquisition asset held. Once any deferredacquisition asset has been exhausted, an additional liabilityadequacy provision will be established.
b) Claims reservesIt is the Group’s policy to hold undiscounted claims reserves(including reserves to cover claims which have occurred butnot been reported (IBNR reserves)) for all classes at asufficient level to meet all liabilities as they fall due, havingregard to actuarial estimates and the volatility observed andexpected in the claims in each class.
The Group’s policy is to hold provisions for the major classes ofbusiness in excess of the actuarial best estimate. Thepercentage margin in excess of this estimate is assessed bysenior management, with particular reference to the volatilityobserved and expected in the claims in each class.
The Group’s focus is on high volume and relativelystraightforward products, for example home and motor. Thisfacilitates the generation of comprehensive underwriting andclaims data, which is used to monitor and accurately price therisks accepted. This attention to data analysis is reinforced bytight controls on costs and claims handling procedures.
Frequency and severity of specific risks and sources of uncertaintyMost general insurance contracts written by the Group areissued on an annual basis, which means that the Group’sliability extends for a 12 month period, after which the Group isentitled to decline or renew or can impose renewal terms byamending the premium or excess or both.
The following paragraphs explain the frequency and severity ofclaims and the sources of uncertainty for the key classes thatthe Group is exposed to:
a) Motor insurance contracts (private and commercial)Claims experience is quite variable, due to a wide number of factors, but the principal ones of these are age of driver,type of vehicle and use.
There are many sources of uncertainty that will impact theGroup's experience under motor insurance, includingoperational risk, reserving risk, premium rates not matchingclaims inflation rates, the social, economic and legislativeenvironment and reinsurance failure risks.
b) Property insurance contracts (residential and commercial)The major causes of claims for property insurance are theft,flood, escape of water, fire, storm, subsidence and varioustypes of accidental damage.
The major source of uncertainty in the Group’s propertyaccounts is the volatility of weather. Weather in the UK canaffect most of the above perils. Over a longer period, thestrength of the economy is also a factor. There are manyother sources of uncertainty which include operational,reserving and reinsurance issues.

section
01O
per
atin
g a
ndfin
anci
al r
evie
w
105
Op
erat
ing
and
fin
anci
al r
evie
w
Annual Report and Accounts 2005
c) Commercial other insurance contractsOther commercial claims come mainly from businessinterruption and loss arising from the negligence of theinsured (liability insurance). Business interruption lossescome from the loss of income, revenue and/or profit as aresult of property damage claims. Liability insurance can bebroken down between employers liability andpublic/products liability. The first is to indemnify employeesfor injury caused as a result of the insured’s negligence.Public/products liability is to indemnify a third party for injuryand/or damage as a result of an act of the Insured’snegligence. As liability insurance is written on anoccurrence basis, these covers are still subject to claimsthat manifest over a substantial period of time, but whereloss was in existence during the life of the policy.
Fluctuations in the social, economic and legislative climateare a source of uncertainty in the Group’s general liabilityaccount, and in particular court judgements and legislation(for example periodic payments under the Courts Act, a reviewof the Ogden tables used by the courts when setting personalinjury claim values), significant events (for example terroristattacks) and any emerging new heads of damage, types ofclaim that are not envisaged when the policy is written.
d) Creditor insuranceCreditor insurance contracts are designed to cover paymentson secured or unsecured lending. These contracts are for amaximum term of 5 years. The causes of creditor insuranceclaims are loss of income through accident, sickness orunemployment or, in some circumstances, loss of life.
The main source of uncertainty affecting the Group'screditor accounts is the economic environment.A recession could lead to an increased number and cost of unemployment, accident and sickness claims.Other sources of uncertainty include operational andreserving issues.
Life businessThe three regulated life companies of RBSG, NatWest LifeAssurance Limited, Royal Scottish Assurance plc and DirectLine Life Limited, are required to meet minimum capitalrequirements at all times under the Financial ServiceAuthority’s Prudential Sourcebook. The capital resourcescovering the regulatory requirement are not transferable toother areas of the Group. To ensure that the capitalrequirement is satisfied at all times, each company holds anadditional voluntary buffer above the absolute minimum.Sufficient capital resources are held to ensure that the capitalrequirements are covered over a two year projection period.Life insurance results are inherently uncertain, due to actualexperience being different to modelled assumptions. Suchdifferences affect regulatory capital resources, as do varyinglevels of new business. Therefore, projections are formallyreviewed twice a year. Where there is a shortfall of capital,various options are available to provide new capital.
The Group is not exposed to price, currency, credit, or interestrisk on unit linked life contracts but it is exposed to variation inmanagement fees. A decrease of 10% in the value of the assetswould reduce the asset management fees by £5 million perannum (2004 – £5 million). The Group also writes insurancecontracts with minimum guaranteed death benefits that exposeit to the risk that declines in the value of underlying investmentsmay increase the Group’s net exposure to death risk.
Frequency and severity of claims – for contracts where deathis the insured risk, the most significant factors that couldincrease the overall frequency of claims are epidemics or widespread changes in lifestyle, resulting in earlier or more claimsthan expected.
For contracts where survival is the insured risk, the mostsignificant factor is continued improvement in medical scienceand social conditions that would increase longevity.
For contracts with fixed and guaranteed benefits and fixedfuture premiums, there are no mitigating terms and conditionsthat reduce the insurance risk accepted. Participatingcontracts can result in a significant portion of the insurancerisk being shared with the insured party.
Sources of uncertainty in the estimation of future benefitpayments and premium receipts – the Group uses base tablesof standard mortality appropriate to the type of contract beingwritten and the territory in which the insured person resides.These are adjusted to reflect the Group’s experience, mortalityimprovements and voluntary termination behaviour.
Purchased insuranceThe Insurance Sourcing Department is responsible to GEMCfor the Group-wide purchase of insurance as a means ofreducing other risk exposures.
Enterprise riskIn order to adequately identify and manage the full range ofEnterprise risk, the Group has separately defined operationaland external risk:
Operational risk is defined as the risk arising within theorganisation from:
• People – risks arising from an inappropriate level of staff,inadequately skilled or managed.
• Process – risk caused by inadequate or failed internalprocesses.
• Systems – risks of inadequately designed or maintainedsystems.
• Assets – risk of damage, misappropriation or theft of theGroup’s physical, logical and intangible assets.

106
Ope
ratin
g an
d fin
anci
al r
evie
wOperating and financial review continued
External risk is defined as the risk arising outside of theorganisation in three main areas:
• Business – risks arising from product performance,competitor activity, supplier unreliability or customer activity.
• Political – risks caused by political unrest or uncertainty,activity by public interest groups or extremists, and non-compliance with, or changes to, current legislation.
• Environment – risks arising due to demographic, macro-economic, technical, cultural or environmental change.
Enterprise risk also includes the potential or actual impact oncorporate reputation arising from any of the Group’s activities.
Enterprise risk management is achieved through monitoring theGroup’s exposure to direct or indirect loss using a range ofpolicies, procedures, data, analytical tools and reportingtechniques. In particular, Group-wide risk management processesensure that enterprise risk issues are quickly escalated andresolved, that the risks inherent in new products are fully evaluated,and that emerging external risks are actively monitored.
Operational risk exposures and loss events for each divisionare captured through monthly Risk and Control returns, whichprovide details on the change of risk exposures for each riskcategory in the light of trends and the risk profile of eachdivision.
Regulatory riskRegulatory risk is the risk arising from failing to meet therequirements of our regulators. To mitigate this risk, the Groupis active in various regulatory developments affecting risk,capital and liquidity management. This includes working withdomestic and international trade associations, being activewith various regulators, especially the FSA and the mainregulatory groups, including the Basel Committee (see page256), the Committee of European Banking Supervisors, the EUCommission and US regulators.

section
02G
over
nanc
e
107
Annual Report and Accounts 2005
Governance
Contents108 Board of directors
and secretary
110 Report of the directors
115 Corporate governance
121 Directors’ remuneration report
130 Directors’ interests in shares
131 Statement of directors’responsibilities
Gov
erna
nce

108
Boa
rd o
fdi
rect
ors
and
secr
etar
yBoard of directors and secretary
Sir George Mathewson Sir Fred Goodwin
Guy WhittakerLawrence Fish Gordon Pell
Archie Hunter Joe MacHale
Janis Kong Jim Currie Bob Scott
Sir Steve Robson Peter Sutherland
Colin Buchan
Miller McLean, Secretary
Sir Tom McKillop
Charles ‘Bud’ Koch

section
02G
over
nanc
e
109
Boa
rd o
fdi
rect
ors
and
secr
etar
y
Annual Report and Accounts 2005
ChairmanSir George Mathewson (age 65)CBE, DUniv, LLD, FRSE, FCIBSC (Chairman), N (Chairman)Appointed to the Board inSeptember 1987 and asChairman in April 2001, SirGeorge Mathewson has a widebackground in finance,technology and managementand spent some of his careerin the United States. Hebecame Group Chief Executivein January 1992 and, in March2000, he was appointedExecutive Deputy Chairman.He is a director of The ScottishInvestment Trust PLC and theInstitute of InternationalFinance, Inc. He is alsopresident of the InternationalMonetary Conference, amember of the AdvisoryCommittee of BridgepointCapital Limited and a memberof the Financial ReportingCouncil. He was chiefexecutive of the ScottishDevelopment Agency from1981 to 1987 and is a formerpresident of the BritishBankers’ Association.
Deputy Chairman andChairman-designateSir Tom McKillop* (age 62)C, NAppointed to the Board asDeputy Chairman inSeptember 2005, Sir Tom is anon-executive director of BPp.l.c., and was formerly chiefexecutive of AstraZeneca plc.He was formely president ofthe European Federation ofPharmaceutical Industries andAssociations and chairman ofthe British Pharma Group. He isPro-Chancellor of the Universityof Leicester and a trustee ofthe Council for Industry andHigher Education.
Executive directorsSir Fred Goodwin (age 47)DUniv, FCIBS, FCIB, LLDGroup Chief ExecutiveCAppointed to the Board inAugust 1998, Sir Fred Goodwinis a Chartered Accountant. Hewas formerly chief executiveand director, Clydesdale BankPLC and Yorkshire Bank PLC.He is chairman of The Prince’sTrust, a non-executive directorof Bank of China Limited anda former president of theChartered Institute of Bankersin Scotland.
Lawrence Fish (age 61)Chairman and Chief ExecutiveOfficer of Citizens FinancialGroup, Inc.Appointed to the Board inJanuary 1993, Lawrence Fishis an American national. He isa career banker and was adirector of the Federal ReserveBank of Boston. He is a trusteeof The Brookings Institutionand a director of the FinancialServices Roundtable, TextronInc., and numerous communityorganisations in the USA.
Gordon Pell (age 56)FCIBS, FCIBChief Executive,Retail MarketsAppointed to the Board inMarch 2000, Gordon Pell wasformerly group director ofLloyds TSB UK Retail Bankingbefore joining NationalWestminster Bank Plc as adirector in February 2000 andthen becoming chief executive,Retail Banking. He is also adirector of Race for Opportunityand a member of the NationalEmployment Panel and theFSA Practitioner Panel.
Guy Whittaker (age 49)Group Finance DirectorCAppointed to the Board inFebruary 2006, Guy Whittakerwas formerly group treasurer atCitigroup Inc., based in NewYork, having previously held anumber of managementpositions within the financialmarkets business at Citigroup.He was elected a LadyBeaufort Fellow of Christ'sCollege Cambridge in 2004.
Non-executive directorsColin Buchan* (age 51)A, C, RAppointed to the Board in June 2002, Colin Buchan waseducated in South Africa andspent the early part of hiscareer in South Africa and theFar East. He has considerableinternational investmentbanking experience, as well asexperience in very large riskmanagement in the equitiesbusiness. He was formerly amember of the groupmanagement board of UBS AGand head of equities of UBSWarburg. He is chairman ofUBS Securities Canada Inc.and vice-chairman of StandardLife Investments Limited. He isalso a director of Merrill LynchWorld Mining Trust Plc, Merrill
Lynch Gold Limited, RoyalScottish National OrchestraSociety Limited and WorldMining Investment CompanyLimited.
Jim Currie* (age 64)D.LittRAppointed to the Board inNovember 2001, Jim Currie isa highly experienced seniorinternational civil servant whospent many years working inBrussels and Washington. Hewas formerly director generalat the European Commissionwith responsibility for the EU’senvironmental policy anddirector general for Customsand Excise and IndirectTaxation. He is also a directorof Total Holdings UK Limited,an international advisor toEversheds and a consultant toButera & Andrews UK Limited.
Archie Hunter* (age 62)A (Chairman), CAppointed to the Board inSeptember 2004, ArchieHunter is a CharteredAccountant. He was Scottishsenior partner of KPMGbetween 1992 and 1999 andPresident of The Institute ofChartered Accountants ofScotland in 1997/1998. He has extensive professionalexperience in the UK andNorth and South America.He is currently chairman ofMacfarlane Group plc, adirector of Edinburgh USTracker Trust plc, Convenor of Court at the University ofStrathclyde and a governor of the Beatson CancerResearch Institute.
Charles ‘Bud’ Koch (age 59)Appointed to the Board inSeptember 2004, Bud Koch isan American national. He hasextensive professionalexperience in the USA and iscurrently chairman of theboard of the Federal HomeLoan Bank of Cincinnati,chairman of the board of JohnCarroll University and a trusteeof Case Western ReserveUniversity. He was chairman,president and chief executiveofficer of Charter OneFinancial, Inc. and its whollyowned subsidiary, Charter OneBank, N.A between 1973 and2004. He is also a director ofAssurant, Inc.
Janis Kong* (age 55)OBE, DUnivAppointed to the Board inJanuary 2006, Janis Kong iscurrently executive chairman ofHeathrow Airport Limited,chairman of Heathrow ExpressLimited and a director of BAAplc and Portmeirion Group plc.She is also a member of theboard of Visit Britain andpreviously served as a memberof the board of the South EastEngland Regional DevelopmentAgency.
Joe MacHale* (age 54)AAppointed to the Board inSeptember 2004, Joe MacHaleis currently a non-executivedirector and chairman of theaudit committee of MorganCrucible plc, a non-executivedirector of Brit InsuranceHoldings plc, and a trustee of MacMillan Cancer Relief.He held a number of seniorexecutive positions with J PMorgan between 1979 and2001 and was latterly chiefexecutive of J P MorganEurope, Middle East and Africa Region.
Sir Steve Robson* (age 62)AAppointed to the Board in July2001, Sir Steve Robson is aformer senior UK civil servant,who had responsibility for awide variety of Treasurymatters. His early careerincluded the post of privatesecretary to the Chancellor ofthe Exchequer andsecondment to ICFC (now 3i).He was also a secondpermanent secretary of HMTreasury, where he wasmanaging director of theFinance and RegulationDirectorate. He is a non-executive director of JPMorgan Cazenove Holdings,Xstrata Plc and PartnershipsUK plc, and a member of theChairman’s AdvisoryCommittee of KPMG.
Bob Scott* (age 64)CBE, FCIBSC, N, R (Chairman)Appointed to the Board inJanuary 2001, Bob Scott is anAustralian national. He is thesenior independent director.He has many years experiencein the international insurancebusiness and played a leadingrole in the consolidation of theUK insurance industry. He is a
former group chief executive ofCGNU plc and chairman of theboard of the Association ofBritish Insurers. He is chairmanof Yell Group plc and a non-executive director of SwissReinsurance Company (Zurich),Jardine Lloyd ThompsonGroup plc and Focus DIYGroup Limited. He is also atrustee of the CrimestoppersTrust and an adviser to DukeStreet Capital.
Peter Sutherland* (age 59)KCMGC, NAppointed to the Board inJanuary 2001, Peter Sutherlandis an Irish national. He is aformer attorney general ofIreland and from 1985 to 1989was the EuropeanCommissioner responsible forcompetition policy. He ischairman of BP p.l.c. andGoldman Sachs Internationaland honorary president andmember of the AdvisoryCouncil for the EuropeanMovement – Ireland. He wasformerly chairman of AlliedIrish Bank and a directorgeneral of GATT and the WorldTrade Organisation.
Group Secretary and General Counsel Miller McLean (age 56)FCIBSC Miller McLean was appointedGroup Secretary in August1994. He is a trustee of theIndustry and Parliament Trust,a non-executive chairman ofThe Whitehall and IndustryGroup and a director of TheScottish Parliament andBusiness Exchange.
A member of the AuditCommittee
C member of the Chairman’sAdvisory Group
N member of the NominationsCommittee
R member of the RemunerationCommittee
* independent non-executivedirector

110
Rep
ort
ofth
e di
rect
ors
Report of the directors
The directors have pleasure in presenting their report togetherwith the audited accounts for the year ended 31 December 2005.
Profit and dividendsThe profit attributable to the ordinary shareholders of thecompany for the year ended 31 December 2005 amounted to£5,392 million compared with £4,856 million for the year ended31 December 2004, as set out in the consolidated incomestatement on page 145.
An interim dividend of 19.4p per ordinary share was paid on 7 October 2005 totalling £619 million (2004 – £529 million).The directors now recommend that a final dividend of 53.1pper ordinary share totalling £1,700 million (2004 – £1,308million) be paid on 9 June 2006 to members on the register at the close of business on 10 March 2006. Subject toapproval of the dividend at the Annual General Meeting,shareholders will be offered the opportunity to participate in a dividend reinvestment plan, which will replace the currentscrip dividend scheme.
Activities and business reviewThe company is a holding company owning the entire issuedordinary share capital of the Royal Bank, the principal directoperating subsidiary undertaking of the company. The “Group”comprises the company and all its subsidiary and associatedundertakings, including the Royal Bank and NatWest. TheGroup is engaged principally in providing a wide range ofbanking, insurance and other financial services. The financialrisk management objectives and policies of the Group andinformation on the Group’s exposure to price, credit, liquidityand cash flow risk are contained in Note 34 on the financialstatements. Details of the principal subsidiary undertakings ofthe company are shown in Note 15. A review of the businessfor the year to 31 December 2005, of recent events and oflikely future developments is contained in the Operating andfinancial review.
Business developmentsIn August 2005, the Group announced a strategic partnershipwith Bank of China (BoC). Subsequently, a Group-ledconsortium acquired a 10% shareholding in BoC through amajority-owned subsidiary for US$3.1 billion (£1.7 billion). TheGroup’s share of the investment (US$1.6 billion) was financedthrough the disposal of its 2.2% holding in the issued sharecapital of Banco Santander Central Hispano, S.A. Followingreceipt of all required regulatory approvals, the investment wascompleted in December 2005. The two banks will co-operateacross a range of business activities in China including creditcards, wealth management, corporate banking and personallines insurance. They will also closely co-operate in keyoperational areas including financial controls, riskmanagement, human resources and corporate governance.
Going concernThe directors are satisfied that the Group has adequateresources to continue in business for the foreseeable future.For this reason, they continue to adopt the ‘going concern’basis for preparing the accounts.
Ordinary share capitalDuring the year ended 31 December 2005, the ordinary sharecapital was increased by the following issues:
(a) 13.5 million ordinary shares allotted as a result of theexercise of options under the company’s executive,sharesave and option 2000 schemes and a further 0.7million ordinary shares allotted in respect of the exercise ofoptions under the NatWest executive and sharesave schemeswhich had been exchanged for options over the company’sshares following the acquisition of NatWest in 2000;
(b) 7.4 million ordinary shares allotted in lieu of cashdividends; and
(c) 2.3 million ordinary shares allotted under the company’semployee share ownership plan.
Details of the authorised and issued ordinary share capital at31 December 2005 are shown in Note 30.
Preference share capitalDetails of issues of preference shares during the year and theauthorised and issued share capital at 31 December 2005 areshown in Note 30.
Authority to repurchase sharesAt the Annual General Meeting in 2005, shareholders renewedthe authority for the company to make market purchases of up to 317,495,924 ordinary shares. The directors have notexercised this authority to date. The Group has howeverannounced its intention to repurchase up to £1 billion ofordinary shares over the course of the next 12 months, andshareholders will be asked to renew this authority at the AnnualGeneral Meeting in April.

section
02G
over
nanc
e
111
Rep
ort
ofth
e d
irect
ors
Annual Report and Accounts 2005
DirectorsThe names and brief biographical details of the directors areshown on page 109. All directors, except:
• Sir Angus Grossart, Lord Vallance and Iain Robertson, whoretired from the Board on 20 April 2005, and Eileen Mackay,who retired from the Board on 31 December 2005,
• Sir Tom McKillop, who was appointed to the Board on 1 September 2005, Janis Kong, who was appointed to theBoard on 1 January 2006, and Guy Whittaker, who wasappointed to the Board on 1 February 2006, and
• Fred Watt, who resigned from the Board on 31 January 2006,
served throughout the year and to the date of signing of thefinancial statements.
Sir Tom McKillop, Colin Buchan, Janis Kong, Bob Scott, PeterSutherland and Guy Whittaker will retire and offer themselvesfor election or re-election at the company’s Annual GeneralMeeting. Bill Friedrich, Johnny Cameron and Mark Fisher havebeen appointed as directors with effect from 1 March 2006and will also offer themselves for election at the company’sAnnual General Meeting.
Details of the service agreement for Guy Whittaker are set outon page 125. Johnny Cameron has a service agreement withThe Royal Bank of Scotland plc dated 29 March 1998 whichmay be terminated by Mr Cameron giving six months notice to the Royal Bank and by the Royal Bank giving 12 months noticeto Mr Cameron. Mark Fisher has a service agreement with TheRoyal Bank of Scotland plc dated 3 May 2000 which may beterminated by either party giving six months notice to the other.No other director seeking election or re-election has a serviceagreement.
Sir George Mathewson will retire as Chairman of the Boardwith effect from the conclusion of the Annual General Meetingon 28 April 2006. The Group has secured his continuedemployment to serve in an advisory role to the Group. Sir TomMcKillop will succeed Sir George as Chairman.
Directors’ interestsThe interests of the directors in the shares of the company at31 December 2005 are shown on page 130. None of thedirectors held an interest in the loan capital of the company orin the shares and loan capital of any of the subsidiaryundertakings of the company, during the period from 1 January2005 to 27 February 2006.
Employee propositionThe Group recognises that staff performance is central to thesuccessful delivery of its overall business strategy. Accordingly,the Group focuses on maintaining an employee propositionthat attracts, engages and retains the best available talent.
Employee recruitment Utilising a wide range of recruitment channels, including anopen internal jobs market, talent forums and detailedsuccession planning, the Group ensures that the recruitmentand development of employees is closely aligned toorganisational requirements. A strong standing as an employerof choice prompts applications from hundreds of thousands ofpotential candidates each year. Similarly, all vacancies aredisplayed internally and RBS employees can apply for any role.
The Group retains a high profile as a graduate recruiter,providing a wide range of development programmes. In 2005,more than 14,000 graduates applied for over 230 places with the Group. The Group also received the Association ofGraduate Recruiters Award for delivering the ‘Best IntegratedMarketing Recruitment Campaign’ targeted at graduates.
ShareholdingsAs at 27 February 2006, the company had been notified of the following interests in its shares, in accordance with section 198 of theCompanies Act 1985:
Number of shares % held Number of shares % held
Ordinary shares: 51⁄2% cumulative preference shares:Legal & General Group plc 98,761,695 3.40 Commercial Union Assurance plc 91,429 22.86Barclays PLC 126,816,644 3.97 Mr P. S. and Mrs J. Allen 86,999 21.75The Capital Group of Companies, Inc 95,578,555 3.01 Bassett-Patrick Securities Limited* 46,255 11.56
11% cumulative preference shares: E M Behrens Charitable Trust 20,000 5.00Guardian Royal Exchange Mrs Gina Wild 19,800 4.95
Assurance plc 129,830 25.97 Trustees of The Stephen CockburnWindsor Life Assurance Limited Pension Scheme 19,879 4.97
Company Limited 51,510 10.30 Miss Elizabeth Hill 16,124 4.03Mr S. J. and Mrs J. A. Cockburn 30,810 6.16 Mr W. T. Hardison Jr. 13,532 3.38Cleaning Tokens Limited 25,500 5.10 Ms C. L. Allen 13,200 3.30
Ms J. C. Allen 12,750 3.18
* Notification has been received on behalf of Mr A. W. R. Medlock and Mrs H. M. Medlock that they each have an interest in theholding of 51⁄2% cumulative preference shares registered in the name of Bassett-Patrick Securities Limited noted above and thatthere are further holdings of 5,300 and 5,000 shares, respectively, of that class registered in each of their names.

112
Rep
ort
ofth
e di
rect
ors
Report of the directors continued
Group-wide co-ordination and access to recruitment andinterview skills training ensures recruitment complies withinternal and regulatory requirements. In addition, the Groupcontinues to ensure all appointees are appropriatelyreferenced and screened prior to joining the organisation.
Employee reward The Group acknowledges that its continuing success is closelylinked to the performance, skills and individual commitment ofits employees. Significant focus is therefore given to offering anexceptional reward proposition to all RBS Group employees inorder to attract, motivate and retain the best available talent atevery level.
In 2005, employee costs of £5,992 million, including NationalInsurance and pension costs of £864 million, made up over athird of total expenditure.
The Group’s remuneration and benefits package, Total Reward,(consisting of salary, bonus, share scheme and competitivepension benefits) is acknowledged as one of the mostcomprehensive and flexible packages in the financial servicessector. Salary awards within the Group reflect individualperformance, offering greater increases for high performers,as well as acknowledging market competitor movements.
RBSelect, the Group’s benefits choice programme, forms partof the Total Reward package. It provides for UK staff in theGroup a flexible way of tailoring their reward to reflect theirown individual lifestyle needs. Options range from subsidisedchildcare vouchers and discounted personal insuranceproducts to environmentally friendly bicycle purchases.
Employees can also participate in bonus incentive plansspecific to their business and share in the Group’s ongoingsuccess through profit sharing, Buy As You Earn andSharesave schemes, which align their interests with those ofshareholders. UK employees participate in profit sharing that isdirectly related to the annual performance of the Group. Forthe last seven years this has amounted to a further 10 percentof basic salary.
To enable employees to get the most from Total Reward, a wide range of information about reward and benefits has beenintroduced through RBSpeople.com, an internet site offering24 hour access from home or work.
The RBS group Charity Lottery was launched during 2005.Employees contributing to the prize fund through a smallmonthly entry fee have the chance to win up to 50% of the totalfunds collected each month. The remainder, after payment ofa small lottery-operating fee, is donated to charity.
The Group continues to offer membership of its final pensionscheme, with the entire cost being met by the Group. Thelargest scheme is the Royal Bank of Scotland Group PensionFund, with 80,000 employee members in the UK.
Employee learning and development The Group actively encourages learning and development andis committed to creating and providing opportunities bothinside and outside the workplace. These experiences areprovided through a variety of developmental initiatives,technological innovations and learning networks and forums.Creating and maintaining a talented network of people acrossthe Group ensures not only a strong leadership capability, butalso a high performing workforce.
In 2005 a new Group-wide approach to leadershipdevelopment was launched. Called the “Leadership Journey”,it defines success at different leadership levels and the keydevelopmental challenges that employees face as theyprogress within the Group. A suite of developmentprogrammes has been designed and implemented to ensureappropriate leadership development, supporting thechallenges that individual leaders face whilst completingdifferent stages of the Leadership Journey.
A core component of this ongoing activity is the Group’sExecutive Leadership Programme (developed in conjunctionwith the Harvard Business School) and the establishment of anon-site business school at the Group Headquarters atGogarburn, Edinburgh, which opened in January 2006. TheBusiness School is central to the Group’s commitment todeveloping its leaders, and equipping them with the skills andconfidence necessary to lead in complex and challengingenvironments.
Employee communication Employee engagement is encouraged through a variety ofmeans including a corporate intranet, Group and divisionalmagazines, team meetings led by line managers, briefingsheld by senior managers and regular dialogue with employeesand employee representatives.
During 2005, the high quality of the Group’s internalcommunications was reflected by success in a number ofprestigious external awards schemes. Awards were attained atboth Group and divisional level and included a Gold Award forhub magazine, the Manufacturing division’s internalpublication, at the UK Communicators in Business Awards,and a Gold Award for the Group Communications team in theRegular Communications category at the International VisualCommunication Association Awards
The Group Chief Executive and other senior Group executivesregularly communicate with employees through ‘Question Time’style programmes, broadcast on the Group’s internal televisionnetwork. An ‘Open Air’ debate chaired by the Group ChiefExecutive on Diversity and Inclusion, seeking to ensureequality of opportunity for employees and customers, typifiesthis approach.

section
02G
over
nanc
e
113
Rep
ort
ofth
e d
irect
ors
Annual Report and Accounts 2005
Employee consultation The Group’s confidential global Employee Opinion Survey isexternally designed, undertaken and analysed annually onbehalf of the Group by International Survey Research (“ISR”).
The survey enables employees to maximise their contributionto the Group by expressing their views and opinions on arange of key issues.
The results from the 2005 survey, which 86% of Group employeescompleted, demonstrated significant improvements for the fifthsuccessive year. This year, for the very first time, the Groupscored above the ISR Global Financial Services Norm in everysingle category.
The survey results are presented at Board, divisional and teamlevels. Action plans are developed to address any issuesidentified. With continuing year-on-year improvement, strongdivisional results and improvements in all leading indicators, itis believed that results are sustainable, particularly given theGroup’s focus on continuous improvement.
In addition to direct communication and consultation withemployees, the Group recognises the trade union Amicus in the UK, and the Irish Bank Officials Association and theServices, Industrial, Professional and Technical Union inIreland. These formal relationships are complemented by workscouncil arrangements in many of the Group’s mainlandEurope-based operations.
The Group has an European Employee Communication Councilthat provides elected employee representatives with anopportunity to better understand market conditions and strategicdecisions with transnational impact on our European operations.
DiversityThe Group’s “Managing Diversity” policy sets a framework anda minimum standard within which all employees can develop to their full potential irrespective of race, gender, marital status,age, disability, religious belief, political opinion or sexualorientation. Each division has developed and delivered anaction plan incorporating both Group and division-specificpriorities to promote diversity across all areas of the employeelifecycle.
The success of this approach culminated in the Groupreceiving a Gold Standard Award in the Race for OpportunityBenchmarking Survey, having previously attained a Bronze in2004. The Group maintains its involvement in and support ofthe UK Employers’ Forum on Age, Employers’ Forum onDisability, Employers’ Forum on Belief, Stonewall and of theGovernment’s Age Positive campaign.
The Group is also committed to ensuring that all prospectiveapplicants for employment are treated fairly and equitablythroughout the recruitment process. Its comprehensiveresourcing standards cover the attraction and retention ofindividuals with disabilities. Reasonable adjustments are
provided to support applicants in the recruitment processwhere these are required. The Group provides reasonableworkplace adjustments for new entrants into the Group and forexisting employees who become disabled during theiremployment.
Health, safety, wellbeing and security The health, safety, wellbeing and security of RBS staff andcustomers continue to be a priority for the Group. Regularreviews are undertaken of both policies and processes toensure compliance with current legislation and best practice.The Group focus is on ensuring that these policies are closelylinked to the operational needs of the business.
Corporate responsibilityBusiness excellence requires that the Group meets changingcustomer, shareholder, investor, employee and supplierexpectations. The Group believes that meeting high standardsof environmental, social and ethical responsibility is key to theway it does business.
The Board regularly considers corporate responsibility issuesand receives a formal report twice each year. Further details ofthe Group’s corporate responsibility policies will be containedin the 2005 Corporate Responsibility Report.
Code of ethicsThe Group has adopted a code of ethics that is applicable to allof the Group’s employees and a copy is available upon request.
Charitable contributionsIn 2005 the contribution to the Group’s Community Investmentprogrammes increased to £56.2 million (2004 – £45.8 million).The total amount given for charitable purposes by the companyand its subsidiary undertakings during the year ended 31 December 2005 was £24.3 million (2004 – £20.1 million).
Corporate governanceThe company is committed to high standards of Corporategovernance. Details are given on pages 115 to 120.
Political donationsNo political donations were made during the year.
At the Annual General Meeting in 2002, shareholders gaveauthority for the company and certain of its subsidiaries tomake political donations and incur political expenditure up to a maximum aggregate sum of £675,000 as a precautionarymeasure in light of the wide definitions in The Political Parties,Elections and Referendums Act 2000, for a period of fouryears. These authorities have not been used and it is notproposed that the Group’s longstanding policy of not makingcontributions to any political party be changed. A resolution torenew a general Group authority will be proposed at theAnnual General Meeting on 28 April 2006.

114
Rep
ort
ofth
e di
rect
ors
Report of the directors continued
Policy and practice on payment of creditorsThe Group is committed to maintaining a sound commercialrelationship with its suppliers. Consequently, it is the Group’spolicy to negotiate and agree terms and conditions with itssuppliers, which includes the giving of an undertaking to paysuppliers within 30 days of receipt of a correctly preparedinvoice submitted in accordance with the terms of the contractor such other payment period as may be agreed.
At 31 December 2005, the Group’s trade creditors represented27 days (2004 – 27 days) of amounts invoiced by suppliers.The company does not have any trade creditors.
Directors' indemnitiesIn terms of section 309C of The Companies Act 1985 (asamended), the directors of the company, members of theGroup Executive Management Committee and ApprovedPersons of the Group (under the Financial Services andMarkets Act 2000) have been granted Qualifying Third PartyIndemnity Provisions by the company.
AuditorsThe auditors, Deloitte & Touche LLP, have indicated theirwillingness to continue in office. A resolution to re-appointDeloitte & Touche LLP as the company’s auditor will beproposed at the forthcoming Annual General Meeting.
By order of the Board.
Miller McLean Secretary 27 February 2006
The Royal Bank of Scotland Group plc is registered in Scotland No. 45551.

section
02G
over
nanc
e
115
Cor
por
ate
gov
erna
nce
Annual Report and Accounts 2005
The company is committed to high standards of corporategovernance, business integrity and professionalism in all itsactivities.
Throughout the year ended 31 December 2005, the companyhas complied with all of the provisions set out in the revisedCombined Code issued by the Financial Reporting Council inJuly 2003 (the “Code”) except in relation to the authorityreserved to the Board to make the final determination of theremuneration of the executive directors, which is explainedbelow in the paragraph headed ‘Remuneration Committee’.
The company has also complied with the Smith Guidance onAudit Committees in all material respects.
Under the US Sarbanes-Oxley Act of 2002, enhanced standardsof corporate governance and business and financial disclosureapply to companies, including the company, with securitiesregistered in the US. The Group complies with all currentlyapplicable sections of the Act.
Board of directorsThe Board is the principal decision-making forum for the company.It has overall responsibility for leading and controlling the companyand is accountable to shareholders for financial and operationalperformance. The Board approves Group strategy and monitorsperformance. The Board has adopted a formal schedule ofmatters detailing key aspects of the company’s affairs reservedto it for its decision. This schedule is reviewed annually.
The roles of the Chairman and Group Chief Executive aredistinct and separate, with a clear division of responsibilities.The Chairman leads the Board and ensures the effectiveengagement and contribution of all non-executive and executivedirectors. The Group Chief Executive has responsibility for allGroup businesses and acts in accordance with the authoritydelegated by the Board. Responsibility for the development ofpolicy and strategy and operational management is delegated tothe Group Chief Executive and other executive directors.
All directors participate in discussing strategy, performanceand the financial and risk management of the company.Meetings of the Board are structured to allow open discussion.
The Board met nine times during 2005 and was supplied withcomprehensive papers in advance of each Board meetingcovering the Group’s principal business activities. Members ofthe executive management attend and make regularpresentations at meetings of the Board.
Board balance and independenceThe Board currently comprises the Chairman, four executivedirectors and ten non-executive directors. The Board functionseffectively and efficiently, and is considered to be of anappropriate size in view of the scale of the company and thediversity of its businesses. The directors provide the Group withthe knowledge, mix of skills, experience and networks ofcontacts required. The Board Committees contain directorswith a variety of relevant skills and experience so that noundue reliance is placed on any individual.
The non-executive directors combine broad business andcommercial experience with independent and objectivejudgement. The balance between non-executive and executivedirectors enables the Board to provide clear and effectiveleadership and maintain the highest standards of integrityacross the company’s business activities. The names andbiographies of all Board members are set out on page 109.
The composition of the Board is subject to continuing reviewand the provisions of the Code will be taken into account inrespect of the balance of the Board. The Code requires theBoard to determine whether its non-executive members areindependent.
The Board comprises nine independent and five non-independent directors (including executive directors), inaddition to the Chairman. Sir Tom McKillop is Chairman-designate and Bob Scott has been nominated as the seniorindependent director.
The Board considers that all non-executive directors areindependent for the purposes of the Code, with the exceptionof Bud Koch who was formerly Chairman, President and ChiefExecutive Officer of Charter One Financial, Inc. which wasacquired by Citizens Financial Group, Inc. in 2004.
Re-election of directors At each Annual General Meeting, one third of the directorsretire and offer themselves for re-election and each directormust stand for re-election at least once every three years. Anynon-executive directors who have served for more than nineyears will also stand for annual re-election and the Board mayconsider their independence at that time. The proposed re-election of directors is subject to prior review by the Board.
The names of directors standing for re-election at the 2006Annual General Meeting are contained on page 111 and furtherinformation will be given in the Chairman’s letter to shareholdersin relation to the company’s Annual General Meeting.
Information, induction and professional developmentAll directors receive accurate, timely and clear information onall relevant matters. Any requests for further information orclarification are dealt with or co-ordinated by the GroupSecretary.
The Group Secretary is responsible for advising the Board,through the Chairman, on all governance matters. All directorshave access to the advice and services of the GroupSecretary who is responsible to the Board for ensuring thatBoard procedures are followed and that applicable rules andregulations are complied with. In addition, all directors areable, if necessary, to obtain independent professional adviceat the company’s expense.
Each new director receives a formal induction, including visitsto all the Group’s major businesses and meetings with seniormanagement. The induction is tailored to the director’s specificrequirements. Existing directors undertake such professionaldevelopment as they consider necessary in assisting them tocarry out their duties as directors.
Corporate governance

116
Cor
por
ate
gov
erna
nce
Corporate governance continued
Performance evaluationThe annual performance evaluation of the Board and itsCommittees was undertaken in the autumn of 2005. Theevaluation, which covered the operation and effectiveness ofthe Board, the Remuneration Committee and the NominationsCommittee, was conducted by the Group Secretary using adetailed questionnaire and meetings with each director.Amongst the areas reviewed were the composition of theBoard, Board processes and performance against objectives.
In addition, each director discussed his or her ownperformance with the Chairman and the senior independentdirector met individually with the executive directors and withthe non-executive directors as a group without the Chairmanpresent, to consider the Chairman’s performance. The reporton the Board evaluation, which was designed to assist theBoard in further improving its performance, was consideredand discussed by the Board as a whole and specific actionsare currently being implemented.
A review of the effectiveness of the Audit Committee wasundertaken during the year by PricewaterhouseCoopers andwas the subject of a separate report to the Board. Amongstthe areas reviewed were the composition and performance ofthe Committee and the Committee’s role in relation to internaland external audit, risk management and financial reporting.
Board CommitteesIn order to provide effective oversight and leadership, theBoard has established a number of Board Committees with particular responsibilities. The Committee chairmanshipand membership are reviewed on a regular basis. The namesand biographies of all Board Committee members are set outon page 109.
The terms of reference of the Audit, Remuneration andNominations committees and the standard terms andconditions of the appointment of non-executive directors areavailable on the Group's website (www.rbs.com) and copiesare available on request.
Audit CommitteeAll members of the Audit Committee are independent non-executive directors. The Audit Committee holds at least fivemeetings each year. The Audit Committee’s report is containedon pages 119 and 120.
Remuneration CommitteeAll members of the Remuneration Committee are independentnon-executive directors. The Remuneration Committee holds atleast three meetings each year.
The Remuneration Committee is responsible for assisting theBoard in discharging its responsibilities and making all relevantdisclosures in relation to the formulation and review of theGroup’s executive remuneration policy. The RemunerationCommittee makes recommendations to the Board on theremuneration arrangements for its executive directors and theChairman. The Directors’ Remuneration Report is contained on pages 121 to 129.
Responsibility for determining the remuneration of executivedirectors has not been delegated to the RemunerationCommittee, and in that sense the provisions of the Code havenot been complied with. The Board as a whole reserves theauthority to make the final determination of the remuneration ofdirectors as it considers that this two stage process allowsgreater consideration and evaluation and is consistent with theunitary nature of the Board. No director is involved in decisionsregarding his or her own remuneration.
Nominations CommitteeThe Nominations Committee comprises independent non-executive directors, under the chairmanship of the Chairman ofthe Board. The Nominations Committee meets as required.
The Nominations Committee is responsible for assisting theBoard in the formal selection and appointment of directors. Itconsiders potential candidates and recommends appointmentsof new directors to the Board. The appointments are based onmerit and against objective criteria, including the time availableto, and the commitment which will be required of, the potentialdirector.
In addition, the Nominations Committee considers successionplanning for the Chairman, Group Chief Executive and non-executive directors. The Nominations Committee takes intoaccount the knowledge, mix of skills, experience and networksof contacts which are anticipated to be needed on the Boardin the future. The Chairman, Group Chief Executive and non-executive directors meet to consider executive successionplanning. No director is involved in decisions regarding his orher own succession.
The Board is aware of the other commitments of its directorsand is satisfied that these do not conflict with their duties asnon-executive directors of the company.

section
02G
over
nanc
e
117
Cor
por
ate
gov
erna
nce
Annual Report and Accounts 2005
MeetingsThe number of meetings of the Board and the Audit,Remuneration and Nominations Committees and individualattendance by members is shown below.
Board Audit Remuneration Nominations
Total number of meetings
in 2005 9 9 5 5Number of meetings
attended in 2005
Sir George Mathewson 9 – – 5
Sir Tom McKillop* 2 – – 2
Lord Vallance** 4 – – –
Sir Angus Grossart** 4 – – –
Sir Fred Goodwin 9 – – –
Mr Buchan 9 8 5 –
Dr Currie 9 – 5 –
Mr Fish 6 – – –
Mr Hunter 9 9 – –
Mr Koch 9 – – –
Mr MacHale 9 9 – –
Miss Mackay 9 9 5 –
Mr Pell 9 – – –
Mr Robertson** 3 – – –
Sir Steve Robson 9 9 – –
Mr Scott 9 – 5 4
Mr Sutherland 8 – – 4
Mr Watt 9 – – –
* Sir Tom McKillop was appointed to the Board on 1 September 2005.
** Lord Vallance, Sir Angus Grossart and Iain Robertson retiredfrom the Board on 20 April 2005.
Relations with shareholdersThe company communicates with shareholders through theannual report and by providing information in advance of theAnnual General Meeting. Individual shareholders can raisematters relating to their shareholdings and the business of theGroup at any time throughout the year. Shareholders are giventhe opportunity to ask questions at the Annual General Meetingor submit written questions in advance. The chairmen of theAudit, Remuneration and Nominations Committees areavailable to answer questions at the Annual General Meeting.
Communication with the company’s largest institutionalshareholders is undertaken as part of the company’s investorrelations programme. During the year, the directors receivedcopies of analysts’ reports and a monthly report from theGroup’s investor relations department which includes ananalysis of share price movements, the Group’s performanceagainst the sector, and key broker comments. In addition,information on major investor relations activities and changesto external ratings are provided. In 2005, the senior
independent director attended results presentations toenhance his understanding of the views of major shareholdersand would be available to shareholders if concerns could notbe addressed through the normal channels. The arrangementsused to ensure that directors develop an understanding of theviews of major shareholders are considered as part of theannual Board performance evaluation.
The Chairman, Group Chief Executive, Group Finance Directorand, if appropriate, the senior independent directorcommunicate shareholder views to the Board as a whole.
In 2005, a survey of investor perceptions was undertaken onbehalf of the Board by independent advisers, and the findingswere considered by the Board.
Internal controlThe Board of directors is responsible for the Group’s system of internal control that is designed to facilitate effective andefficient operations and to ensure the quality of internal andexternal reporting and compliance with applicable laws andregulations. In devising internal controls, the Group has regardto the nature and extent of the risk, the likelihood of itcrystallising and the cost of controls. A system of internalcontrol is designed to manage, but not eliminate, the risk offailure to achieve business objectives and can only providereasonable, and not absolute, assurance against the risk ofmaterial misstatement, fraud or losses.
The Board has established a process for the identification,evaluation and management of the significant risks faced by the Group, which operated throughout the year ended 31 December 2005 and to 27 February 2006, the date thedirectors approved the Report and Accounts. This process isregularly reviewed by the Board and meets the requirements of the guidance ‘Internal Control: Guidance for Directors onthe Combined Code’ issued by the Institute of CharteredAccountants in England and Wales in 1999.
The effectiveness of the Group’s internal control system isreviewed regularly by the Board and the Audit Committee.Executive management committees or boards of directors ineach of the Group’s businesses receive quarterly reports onsignificant risks facing their business and how they are beingcontrolled. These reports are combined and submitted to theBoard as quarterly risk and control assessments. Additionaldetails of the Group’s approach to risk management are givenin the ‘Risk management’ section of the ‘Operating andfinancial review’ on pages 86 to 106. The Audit Committee alsoreceives regular reports from Group Risk Management andGroup Internal Audit. In addition, the Group’s independentauditors present to the Audit Committee reports that includedetails of any significant internal control matters which theyhave identified. The system of internal controls of theauthorised institutions and other regulated entities in the Groupis also subject to regulatory oversight in the UK and overseas.Additional details of the Group’s regulatory oversight are givenin the Supervision and Regulation section on pages 253 to 256.

118
Cor
por
ate
gov
erna
nce
Corporate governance continued
Disclosure controls and proceduresAs required by US regulations, the Group Chief Executive andthe Group Finance Director have evaluated the effectiveness ofthe company’s disclosure controls and procedures (as definedin the rules under the US Securities Exchange Act of 1934).This evaluation has been considered and approved by theBoard which has authorised the Group Chief Executive and theGroup Finance Director to certify that as at 31 December 2005,the company’s disclosure controls and procedures wereadequate and effective and designed to ensure that materialinformation relating to the company and its consolidatedsubsidiaries would be made known to them by others withinthose entities.
Changes in internal controlsThere was no change in the company’s internal control overfinancial reporting that occurred during the period covered bythis report that has materially affected, or is reasonably likely tomaterially affect, the company’s internal control over financialreporting.

section
02G
over
nanc
e
119
Cor
por
ate
gov
erna
nce
Annual Report and Accounts 2005
Audit Committee ReportThe members of the Audit Committee are Archie Hunter(Chairman), Colin Buchan, Joe MacHale, Eileen Mackay, untilher retirement on 31 December 2005, and Sir Steve Robson.All members of the Audit Committee are independent non-executive directors. The Audit Committee holds at least fivemeetings each year, two of which are held immediately prior to submission of the interim and annual financial statements to the Group Board. This core agenda is supplemented byadditional meetings as required, four being added in 2005.Audit Committee meetings are attended by relevant executivedirectors, the internal and external auditors and risk managementexecutives. At least twice per annum the Committee meetsprivately with the external auditors. The Audit Committee alsovisits business divisions and certain Group functions under a programme set at the beginning of each year.
The Board is satisfied that all the Audit Committee membershave recent and relevant financial experience. Although theBoard has determined that each Member of the AuditCommittee is an ‘Audit Committee Financial Expert’ and isindependent, each as defined in the SEC rules under the USSecurities Exchange Act of 1934 and related guidance, themembers of the Audit Committee are selected with a view tothe expertise and experience of the Audit Committee as awhole, and the Audit Committee reports to the Board as asingle entity. The designation of a director or directors as an‘Audit Committee Financial Expert’ does not impose on anysuch director any duties, obligations or liability that are greaterthan the duties, obligations and liability imposed on suchdirector as a member of the Audit Committee and Board in theabsence of such a designation. Nor does the designation of adirector as an ‘Audit Committee Financial Expert’ affect theduties, obligations or liability of any other member of the Board.
The Audit Committee is responsible for:
• assisting the Board in discharging its responsibilities and inmaking all relevant disclosures in relation to the financialaffairs of the Group;
• reviewing accounting and financial reporting and regulatorycompliance;
• reviewing the Group’s systems of internal control; and
• monitoring the Group’s processes for internal audit, riskmanagement and external audit.
Full details of the responsibilities of the Audit Committee areavailable at www.rbs.com/content/corporate_responsibility/corporate_governance/downloads/group_audit.pdf.
The Audit Committee has adopted a policy on the engagementof the external auditors to supply audit and non-audit services,which takes into account relevant legislation regarding theprovision of such services by an external audit firm. The AuditCommittee reviews the policy annually and prospectivelyapproves the provision of audit services and certain non-auditservices by the external auditors.
Annual audit services include all services detailed in theannual engagement letter including the annual audit andinterim reviews (including US reporting requirements), periodicprofit verifications and reports to regulators including skilledpersons reports commissioned by the Financial ServicesAuthority (e.g. Reporting Accountants Reports).
Annual audit services also include statutory or non-statutoryaudits required by any Group companies that are notincorporated in the United Kingdom. Terms of engagement forthese audits are agreed separately with management, and areconsistent with those set out in the audit engagement letter,as local regulations permit.
The prospectively approved non-audit services include thefollowing classes of service:
• capital raising, including consents, comfort letters andrelevant reviews of registration statements;
• provision of accounting opinions relating to the financialstatements of the Group;
• provision of reports that, according to law or regulation,must be rendered by the external auditors;
• tax compliance services;
• corporate finance services relative to companies that willremain outside the Group; and
• insolvency work relating to the Group’s customers.
The Audit Committee approves all other permitted non-auditservices on a case by case basis. The relevant submissions bymanagement outline the service required and confirm that theexternal auditor’s independence will not be compromised. Inaddition, the Audit Committee reviews and monitors theindependence and objectivity of the external auditors when itapproves non-audit work to be carried out by them, taking intoconsideration relevant legislation and ethical guidance.Information on the audit and non-audit services carried out bythe external auditors is detailed in Note 4 to the Group’saccounts.
The Audit Committee undertakes an annual evaluation toassess the independence and objectivity of the externalauditors and the effectiveness of the audit process, taking into consideration relevant professional and regulatoryrequirements. The results of this evaluation are reported to the Board.
The Audit Committee makes recommendations to the Board inrelation to the remuneration and terms of engagement of theexternal auditors and the re-appointment by the shareholdersat the Annual General Meeting in April 2006 of Deloitte &Touche LLP as the external auditors.

120
Cor
por
ate
gov
erna
nce
In 2004 KPMG conducted a review of the effectiveness ofGroup Internal Audit. It is intended that there will be anexternal review of the effectiveness of Group Internal Auditevery three years, with internal reviews continuing in theintervening years. In 2005 the Audit Committee conducted areview of Group Internal Audit that involved cross Groupparticipation and the external auditors.
During 2005 PricewaterhouseCoopers conducted an externalreview of the effectiveness of the Audit Committee. It isintended that there will be an external review of theeffectiveness of the Audit Committee every three years,with internal reviews by the Board continuing in the intervening years.
In 2005 the Audit Committee reviewed the audit committeestructure throughout the Group and as a result proposed to theBoard a reorganisation and strengthening of the structure toensure that audit committees would cover each separateGroup business appropriately. That recommendation wasaccepted by the Board and is now being implemented.
Archie HunterChairman of the Audit Committee27 February 2006
Corporate governance continued

section
02G
over
nanc
e
121
Dire
ctor
s’re
mun
era
tion
repo
rt
Annual Report and Accounts 2005
Directors’ remuneration report
The Remuneration CommitteeThe members of the Remuneration Committee are Bob Scott(Chairman), Colin Buchan, Jim Currie and Eileen Mackay,until her retirement on 31 December 2005. All members ofthe Remuneration Committee are independent non-executivedirectors.
During the accounting period, the Remuneration Committeereceived advice from Watson Wyatt, Mercer Human ResourceConsulting and Ernst & Young LLP on matters relating todirectors’ remuneration in the UK (Watson Wyatt and Ernst &Young) and US (Mercer). In addition, the RemunerationCommittee has taken account of the views of the Chairman ofthe Board and the Group Chief Executive on performanceassessment of the executive directors.
In addition to advising the Remuneration Committee, WatsonWyatt provided professional services in the ordinary course ofbusiness, including actuarial advice and benefitsadministration services to subsidiaries of the Group andinvestment consulting advice to The Royal Bank of ScotlandPension Trustees Limited. Mercer Human Resource Consultingprovided advice and support in connection with a range ofbenefits, pension actuarial and investment matters. Ernst &Young provided professional services in the ordinary course ofbusiness, including actuarial and corporate recovery advice.
Remuneration policyThe executive remuneration policy was approved by share-holders at the company’s Annual General Meeting in 2005.At the beginning of 2005, the Remuneration Committeedecided to conduct a comprehensive review of all aspects ofthe executive remuneration package. A review of this depthhad not been undertaken since 2000/2001. Its terms ofreference were to examine all aspects of the executiveremuneration strategy, policy and practice in light of thechanging business make up and strategy of the Group and theevolution of best practice on executive remuneration. Followingthis review, the Remuneration Committee made no change tothe overall executive remuneration policy, which is set outbelow. However, as a result of this review, the Group is makinga number of changes to executive director remunerationpractice which are described below.
The objective of the executive remuneration policy is toprovide, in the context of the company’s business strategy,remuneration in form and amount which will attract, motivateand retain high calibre executives. In order to achieve thisobjective, the policy is framed around the following coreprinciples:
• Total rewards will be set at levels that are competitive withinthe relevant market, taking each executive director’sremuneration package as a whole.
• Total potential rewards will be earned through achievementof demanding performance targets based on measuresconsistent with shareholder interests over the short, mediumand longer-term.
• Remuneration arrangements will strike an appropriate balancebetween fixed and performance-related rewards. Performance-related elements will comprise the major part of executiveremuneration packages. See illustrative charts below.
• Incentive plans and performance metrics will be structuredto be robust through the business cycle.
• Remuneration arrangements will be designed to support thecompany’s business strategy, to promote appropriateteamwork and to conform to best practice standards.
UK-based executive directors’ remuneration balance
The above diagram has been prepared to illustrate the use of performance metricsin the total compensation package. For the Group Chief Executive 22% of thepackage is fixed and 78% is performance related. For the other executive directors,28% is fixed and 72% is performance related. Values are entered on the basis of ontarget performance; long term incentives are shown at the approximate expectedvalue at grant. Pension and other benefits have been excluded. Financial metricsinclude profit growth, cost control and ROE.
The non-executive directors’ fees are reviewed annually by theBoard, on the recommendation of its Chairman. The level ofremuneration reflects the responsibility and time commitment ofdirectors and the level of fees paid to non-executive directorsof comparable major UK companies. Non-executive directorsdo not participate in any incentive or performance plan.
The Remuneration Committee approves the remunerationarrangements of senior executives below Board level who aremembers of the Group Executive Management Committee,on the recommendation of the Group Chief Executive, andreviews all long-term incentive arrangements which areoperated by the Group.
Components of executive remunerationUK based directorsSalarySalaries are reviewed annually as part of total remuneration,having regard to remuneration packages received by executivesof comparable companies. The Remuneration Committee usesa range of survey data from remuneration consultants andreaches individual salary decisions taking account of theremuneration environment and the performance andresponsibilities of the individual director.
BenefitsUK-based executive directors are eligible to participate in TheRoyal Bank of Scotland Group Pension Fund (“the RBS Fund”).
Base salary Financial (annual) Operational (annual)
All Employee Profit Share (annual) Mediam Term EPS growth and Share Price
Medium Term relative TSR and EPS Growth plus Share Price
Group Chief Executive Executive directors

122
Dire
ctor
s’re
mun
era
tion
repo
rtDirectors’ remuneration report continued
The RBS Fund is a non-contributory defined benefit fund whichprovides pensions and other benefits within Inland Revenuelimits. Certain directors receive additional pension and lifeassurance benefits in excess of Inland Revenue limits. Detailsof pension arrangements of directors are shown on page 129.
From April 2006, new tax legislation will apply to UK pensions;in particular any pension in excess of the Lifetime Allowancewill be subject to additional taxation. The Group will allowdirectors and employees whose benefits do, or are likely toexceed the Lifetime Allowance to opt-out of future tax-approved pension provision. In such cases the Group will paythe individual a salary supplement in lieu of pension provision.The Group will not meet the cost of any additional tax thatindividuals may incur as a result of their benefits exceeding thenew Lifetime or Annual Allowances.
Executive directors are eligible to receive a choice of variousemployee benefits or a cash equivalent, on a similar basis toother employees. In addition, as employees, executivedirectors are eligible also to participate in Sharesave, Buy AsYou Earn and the Group profit sharing scheme, which currentlypays up to 10 per cent of salaries, depending on the Group’sperformance. These schemes are not subject to performanceconditions since they are operated on an all-employee basis.Executive directors also receive death-in-service benefits.
Short-term annual incentivesAs part of the overall review of the executive remunerationpackage referred to above, short term incentive levels wereconsidered and the Remuneration Committee agreed to increaseannual incentive potentials to reflect market practice and thesetting of stretching new targets. As a result, from 2006individual UK-based executive directors will normally have amaximum annual incentive potential of between 160% and200% of salary. These will typically focus from year to year onthe delivery of a combination of appropriate Group andindividual financial and operational targets approved by theRemuneration Committee.
For the Group Chief Executive, the annual incentive is primarilybased on specific Group financial performance measures suchas operating profit, earnings per share growth and return on equity.The remainder of the Group Chief Executive’s annual incentiveis based on a range of non-financial measures which mayinclude measures relating to shareholders, customers and staff.
For the other executive directors a proportion of the annualincentive is based on Group financial performance and aproportion on division financial performance. The remainder ofeach individual’s annual incentive opportunity is dependent onachievement of a range of non-financial measures, specificobjectives and key result areas. Divisional performanceincludes measures such as operating income, costs, baddebts or operating profit. Non-financial measures includecustomer measures (e.g. customer numbers, customersatisfaction), staff measures (e.g. employee engagement) andefficiency and change objectives.
For exceptional performance, as measured by the achievementof significant objectives, executive directors may be awarded
incentive payments of up to 200% of salary, or 250% of salary,in the case of the Group Chief Executive. This discretion topay additional bonuses for exceptional performance was lastused in 2002 to recognise the successful integration of Natwest.
Long-term incentivesThe company provides long-term incentives in the form of shareoptions and share or share equivalent awards. Their objectiveis to encourage the creation of value over the long-term and toalign the rewards of the executive directors with the returns toshareholders.
The Group’s policy is to encourage executives to hold sharesand retain vested long-term incentives. This policy hassuccessfully built high levels of shareholdings and equityparticipation amongst executives. A table showing directors’interests in shares and the estimated value of the shares andvested long term incentives held by executives is shown onpage 130. In light of the already high levels of share priceexposure, the Remuneration Committee is not proposing tointroduce mandatory or guideline shareholding requirementsfor executives at this time.
Medium-term performance planThe medium-term performance plan (“MPP”) was approved byshareholders in April 2001. Each executive director is eligiblefor an annual award under the plan in the form of share orshare equivalent awards. Whilst the rules of the plan allowawards over shares worth up to one and a half times earnings,the Remuneration Committee has adopted a policy of grantingawards based on a multiple of salary. Normally awards aremade at one times salary to executive directors, with one and ahalf times salary being granted in the case of the Group ChiefExecutive. No changes will be made to this policy without priorconsultation with shareholders. All awards under the plan aresubject to three-year performance targets.
The award in 2005 is subject to two performance measures.First, the annual growth in the company’s earnings per share(“EPS”) must exceed the annualised growth of the Retail PricesIndex (”RPI”) plus three per cent. If this condition is satisfied,the company’s total shareholder return (“TSR”) is comparedwith the TSR of a comparator group of companies. Thecompanies are Aviva plc; Banco Santander Central Hispano S.A.(“BSCH”); Barclays PLC; Citigroup inc.; HBOS plc;HSBC Holdings PLC; Legal & General Group plc; Lloyds TSBGroup plc; Prudential plc and Standard Chartered PLC. Awardsmade under the plan will not vest if the company’s TSR is belowthe median of the comparator group. Achievement of the EPStarget and median TSR performance against the comparatorcompanies will result in vesting of 25% of the award, increasingto 200% if the company achieves a TSR ranking at first positionin the comparator group and exceeds the TSR of the secondplaced comparator company by at least 34%.
During 2005, the Remuneration Committee reviewed allelements of the plan including the performance conditions, thevesting schedule and the comparator group. As a result, it isintended that for awards made from 2006, 50% of the awardwill vest on a relative TSR measure and 50% will vest on growthin adjusted EPS over the three year performance period.

section
02G
over
nanc
e
123
Dire
ctor
s’re
mun
era
tion
repo
rt
Annual Report and Accounts 2005
The introduction of the EPS element is designed to ensure thatthe plan includes a performance measure which is in the clearline of sight for the participants and which reflects thebusiness strategy for the next few years.
For the TSR element, vesting will be based on the level ofoutperformance by the Group of the median of the comparatorgroup TSR over the performance period. The RemunerationCommittee believes this method of measuring relative TSRperformance provides a more approriate measure ofmanagement performance. This change is permitted under therules of the plan. Awards made under the plan will not vest ifthe company’s TSR is below the median of the comparatorgroup. Achievement of median TSR performance againstcomparator companies will result in vesting of 25% of theaward. Outperformance of median TSR performance by up to9% will result in vesting on a straight-line basis from 25% to125%, outperformance by 9% to 18% will result in vesting on astraight-line basis from 125% to 200%. Vesting at 200% willoccur if the company outperforms the median TSRperformance of the comparator group by at least 18%.
Following the Remuneration Committee’s review of the plan,the comparator group was amended to comprise UK andinternational banking groups, which the RemunerationCommittee considers more appropriate in the context of theGroup’s business and performance. For awards made from2006, the companies in the comparator group will be ABNAmro Holdings N.V.; BSCH; Barclays PLC; Citigroup Inc; HBOSplc; HSBC Holdings plc; Lloyds TSB Group plc and StandardChartered PLC.
For the EPS element, the level of EPS growth over the three yearperiod will be calculated by comparing the adjusted EPS in theyear prior to the year of grant with that in the final year of theperformance period. Each year the vesting schedule for the EPSgrowth measure will be agreed by the Remuneration Committeeat the time of grant, having regard to the business plan,performance relative to comparators and analysts’ forecasts.
OptionsThe executive share option scheme was approved by shareholders in January 1999. The operation of the schemewas reviewed as part of the overall executive remunerationreview and the Remuneration Committee is satisfied that nochanges are required. Each executive director is eligible for anannual grant of an option, exercisable at the market price atthe time of grant. Options granted to executive directors aretypically over shares worth one and a quarter times salary withan upper maximum in appropriate circumstances of two and ahalf times salary, over shares at the market value at date ofgrant. No payment is made by the executive director on thegrant of an option award.
All executive share option grants are subject to a performancecondition which is reviewed by the Remuneration Committeeannually. The performance target is currently that the optionsare exercisable only if, over a three year period from the date ofgrant, the growth in the company’s EPS has exceeded thegrowth in the RPI plus nine per cent. This EPS performancetarget, which is consistent with market practice, measures
underlying financial performance and represents a long-termtest of performance. For awards made from 2004, there is nore-testing of the performance condition.
US based director – Lawrence FishLawrence Fish's total remuneration package was reviewed in2004 by the Remuneration Committee as a result of theacquisition of Charter One and his changing RBSresponsibilities in North America. A new cash long-termincentive plan was approved by shareholders at the 2005Annual General Meeting. The remuneration policy for Mr Fish is as follows:
Base salary is set having regard to the levels of base salary inother US banks and the appropriate balance of fixed andvariable remuneration for US based executives of UK listedcompanies operating within the corporate governanceframeworks of the UK.
Benefits Mr Fish accrues pension benefits under a number ofarrangements in the US. Details are provided on page 129.In addition he is entitled to receive other benefits on a similarbasis to other Citizens employees.
Short term performance rewards take the form of an annualincentive plan which rewards the achievement of Group,business unit and individual financial and non-financial targets.The normal maximum annual bonus potential is two timessalary, although additional amounts to a maximum of a furthertwo times salary may be awarded, at the discretion of the Board,for exceptional performance as measured by the achievementof significant objectives.
Long term incentives consist of the following components:
• The two grants made under the Citizens Phantom 2000 Planvested on 1 January 2005 and 1 January 2006, respectively.The value of units at the time of vesting is performance-linked and is based on the cumulative economic profitgenerated by Citizens, the trend in economic profit and onthe external market trends in the US banking sector, usingprice/earnings ratios of comparator US banks. This measurewas chosen to establish a clear link between the potentialincentive and the performance of Citizens. No other grantswill be made under this plan.
• A grant under the RBS medium-term performance planwithin the levels, and on the same terms, available to UKbased executives.
• A grant under the executive share option scheme within thelevels, and on the same terms, available to UK basedexecutives.
• A grant under the new Citizens Long Term Incentive Plan.Performance is measured on a combination of Growth inProfit before Tax and Relative Return on Equity based on a comparison of Citizens with comparator US banks. Thetargets for this plan are set on an annual basis over the threeyear term of the grant.

124
Dire
ctor
s’re
mun
era
tion
repo
rtDirectors’ remuneration report continued
Information regarding executive directors’ service contracts is summarised in the table and notes below.
Date of current contract/ Notice period – Notice period – Name Employing company Normal retirement age from company from executive
Sir Fred Goodwin 1 August 1998 60 12 months 6 months The Royal Bank of Scotland plc
Mr Pell 20 February 2006 60 12 months 6 months The Royal Bank of Scotland plc
Mr Watt* 28 September 2000 60 12 months 6 months The Royal Bank of Scotland plc
Mr Fish 18 February 2004 65 12 months 12 monthsCitizens Financial Group, Inc.
* Mr Watt resigned as a director on 31 January 2006.
0
20
40
60
80
120
100
140
160
FTSE 100RBS
2000 20052004
Source: Datastream
200320022001
Index
Total shareholder return performanceThe undernoted performance graph illustrates the performance of the company over the past five years in terms of total shareholderreturn compared with that of the companies comprising the FTSE 100 index. This index has been selected because it represents across-section of leading UK companies. The total shareholder return for the company and the FTSE 100 have been rebased to 100 for 2000.
Service contractsThe company’s policy in relation to the duration of contractswith directors is that executive directors’ contracts generallycontinue until termination by either party, subject to the requirednotice, or until retirement date. The notice period under theservice contracts of executive directors will not normally exceed12 months. In relation to newly recruited executive directors,subject to the prior approval of the Remuneration Committee,the notice period from the employing company required toterminate the contract will not normally exceed 12 monthsunless there is a clear case for this. Where a longer period ofnotice is initially approved on appointment, it will normally bestructured such that it will automatically reduce to 12 months indue course.
All new service contracts for executive directors will be subjectto approval by the Remuneration Committee. Those contractswill normally include standard clauses covering theperformance review process, the company’s normal disciplinaryprocedure, and terms for dismissal in the event of failure toperform or in situations involving actions in breach of theGroup’s policies.
Any compensation payment made in connection with thedeparture of an executive director will be subject to approvalby the Remuneration Committee, having regard to the terms ofthe service contract and the reasons for termination.
Total shareholder return

section
02G
over
nanc
e
125
Dire
ctor
s’re
mun
era
tion
repo
rt
Annual Report and Accounts 2005
Chairman and non-executive directorsThe original date of appointment as a director of the company and the latest date for the next re-election are as follows:
Latest date forDate first appointed next re-election
Sir George Mathewson 1 September 1987 retires 28 April 2006Sir Tom McKillop 1 September 2005 2006Mr Buchan 1 June 2002 2006Dr Currie 28 November 2001 2008Mr Hunter 1 September 2004 2008Mr Koch 29 September 2004 2008Mrs Kong 1 January 2006 2006Mr MacHale 1 September 2004 2008Sir Steve Robson 25 July 2001 2008Mr Scott 31 January 2001 2006Mr Sutherland 31 January 2001 2006
The non-executive directors do not have service contracts or notice periods although they have letters of engagement reflecting their responsibilities and commitments. Under the company’s articles of association, all directors must retire by rotation and seek re-election by shareholders at least every three years. The dates in the table above reflect the latest date for re-election. However, in2007, at least one-third of the Board will retire by rotation as required by the company’s articles of association. No compensation would be paid to the Chairman or to any non-executive director in the event of early termination.
The tables and explanatory notes on pages 126 to 129 report the remuneration of each director for the year ended 31 December 2005and have been audited by the company’s auditors, Deloitte & Touche LLP.
Except as noted below, in the event of severance of contractwhere any contractual notice period is not worked, theemploying company may pay a sum to the executive in lieu ofthis period of notice. Any such payment would, at maximum,comprise base salary and a cash value in respect of fixedbenefits (including pension plan contributions). In the event ofsituations involving breach of the employing company’spolicies resulting in dismissal, reduced or no payments may bemade to the executive. Depending on the circumstances of thetermination of employment, the executive may be entitled, orthe Remuneration Committee may exercise its discretion toallow, the executive to exercise outstanding awards under long-term incentive arrangements subject to the rules of relevantplan. The exception to these severance arrangements relatesonly to Mr Fish.
If Mr Fish’s contract is terminated without cause, or if heterminates the contract for good reason (as defined in thecontract), he is entitled to a lump sum payment to compensatehim for the loss of 12 months salary plus annual bonus.Mr Fish would also be entitled to receive for this period health,life insurance and long term disability coverage and any otherbenefits determined in accordance with the plans, policies and practices of Citizens at the time of termination. TheRemuneration Committee has been advised that thesetermination provisions are less generous than the currentmarket practice in the US.
Group Finance Director – Guy WhittakerGuy Whittaker was appointed Group Finance Director on 1February 2006 and has a service contract with The Royal Bankof Scotland plc dated 19 December 2005. This service contractprovides for a normal retirement age of 60 and may beterminated by either party giving 12 months notice to the other.
In accordance with normal market practice, Mr Whittaker willbe recompensed for the value of restricted stock and unvestedoptions he forfeited on his departure from his previousemployer. In this respect he will be provided with ordinaryshares in The Royal Bank of Scotland Group plc worth£1,000,000 and restricted stock worth £1,450,000, the lattervesting in 3 tranches between 2007 and 2009. As Mr Whittakerforfeited his performance bonus from his previous employer, hereceived a cash payment of £1,195,181 and will receiverestricted stock worth £962,785, the latter vesting in 4 tranchesbetween 2007 and 2010. The provision of ordinary shares andthe vesting of restricted stock is subject to certain conditionsset out in Mr Whittaker’s service contract.
As Group Finance Director, Mr Whittaker will be eligible toreceive short-term annual incentives and long-term incentiveson the same basis as other UK-based executive directors.

126
Dire
ctor
s’re
mun
era
tion
repo
rtDirectors’ remuneration report continued
Directors’ remuneration
Salary/ Performance 2005 2004 fees bonus* Benefits Total Total
£000 £000 £000 £000 £000
ChairmanSir George Mathewson 579 — 28 607 581
Executive directorsSir Fred Goodwin 1,090 1,760 43 2,893 2,522Mr Fish ** 824 1,649 36 2,509 2,305Mr Pell 751 825 10 1,586 1,403Mr Watt 669 726 4 1,399 1,268
* includes 10% profit sharing
** Mr Fish is a non-executive director of Textron Inc. and retains the fees paid to him in this respect. For 2005, he received aremuneration package from Textron Inc. equivalent to approximately US$75,400.
Board 2005 2004Board fees committee fees Total Total
Non-executive directors £000 £000 £000 £000
Deputy ChairmanSir Tom McKillop (appointed 1 September 2005) 67 — 67 —Vice-chairmenLord Vallance of Tummel (retired 20 April 2005) 33 — 33 100Sir Angus Grossart (retired 20 April 2005) 33 — 33 100
Mr Buchan 55 54 109 100Dr Currie 55 13 68 60Mr Hunter 55 58 113 22Mr Koch† 55 — 55 12Mr MacHale 55 25 80 22Miss Mackay (retired 31 December 2005) 55 38 93 75Mr Robertson (retired 20 April 2005) 33 — 33 100Sir Steve Robson 55 25 80 65Mr Scott* 100 — 100 73Mr Sutherland 55 5 60 53
† In addition to his role as a non-executive director, Mr Koch has an agreement with Citizens Financial Group, Inc. to provide consultingservices for a period of three years following the acquisition by Citizens of Charter One Financial, Inc. For these services Mr Kochreceives $402,500 per annum.
* Mr Scott’s senior independent director fee covers all Board and Board Committee work including Chairmanship of the Remuneration Committee.
No director received any expense allowances chargeable to UK income tax or compensation for loss of office/termination payment.The non-executive directors did not receive any bonus payments or benefits.

section
02G
over
nanc
e
127
Dire
ctor
s’re
mun
era
tion
repo
rt
Annual Report and Accounts 2005
Share optionsOptions to subscribe for ordinary shares of 25p each in the company granted to, and exercised by, directors during the year to 31 December 2005 are included in the table below:
Options exercised in 2005
Options held at Options Market price at 1 January granted in date of exercise Option price Options held at 31 December 2005
2005 2005 Number £ £ Number Exercise period
Sir George Mathewson 69,257 9.33 69,257 11.05.01 – 10.05.08147,247 7.81 147,247 29.03.03 – 28.03.10
150 12.40 150 09.08.03 – 08.08.06*20,100 17.18 20,100 14.08.04 – 13.08.111,347 13.64 1,347 01.10.08 – 31.03.09*
19,500 18.18 19,500 14.03.05 – 13.03.1236,400 12.37 36,400 13.03.06 – 12.03.1336,044 17.34 36,044 11.03.07 – 10.03.14
41,570 17.29 41,570 10.03.08 – 09.03.15330,045 41,570 371,615
Sir Fred Goodwin 164,571 8.75 164,571 07.12.01 – 06.12.082,963 11.18 2,963 04.03.02 – 03.03.09
27,306 11.97 27,306 03.06.02 – 02.06.09153,648 7.81 153,648 29.03.03 – 28.03.1043,700 17.18 43,700 14.08.04 – 13.08.111,713 1,713 16.19 9.85 –
41,300 18.18 41,300 14.03.05 – 13.03.1272,800 12.37 72,800 13.03.06 – 12.03.13
144,175 17.34 144,175 11.03.07 – 10.03.14159,051 17.29 159,051 10.03.08 – 09.03.15
1,267 13.04 1,267 01.10.10 – 31.03.11*652,176 160,318 1,713 810,781
Mr Fish 107,877 9.33 107,877 11.05.01 – 10.05.08150 12.40 150 09.08.03 – 08.08.06*
37,603 17.29 37,603 10.03.08 – 09.03.15108,027 37,603 145,630
Mr Pell 51,216 7.81 51,216 29.03.03 – 28.03.1029,100 17.18 29,100 14.08.04 – 13.08.1127,600 18.18 27,600 14.03.05 – 13.03.1249,800 12.37 49,800 13.03.06 – 12.03.1347,217 17.34 47,217 11.03.07 – 10.03.14
50,607 17.29 50,607 10.03.08 – 09.03.15204,933 50,607 255,540
Mr Robertson** 56,635 9.33 56,635 11.05.01 – 10.05.0882,654 11.18 82,654 04.03.02 – 03.03.09
128,040 7.81 128,040 29.03.03 – 28.03.1036,400 17.18 36,400 14.08.04 – 13.08.11
303,729 303,729Mr Watt*** 70,148 12.83 70,148 04.09.03 – 03.09.10
23,300 17.18 23,300 14.08.04 – 13.08.1122,100 18.18 22,100 14.03.05 – 13.03.1242,500 12.37 42,500 13.03.06 – 12.03.1343,253 17.34 43,253 11.03.07 – 10.03.14
57,259 17.29 57,259 10.03.08 – 09.03.15201,301 57,259 258,560
* Options held under the sharesave and option 2000 schemes, which are not subject to performance conditions.
** Mr Robertson retired from the Board on 20 April 2005.
*** Mr Watt resigned from the Board on 31 January 2006.
The performance conditions for options granted in 2005 are detailed on page 123.

128
Dire
ctor
s’re
mun
era
tion
repo
rtDirectors’ remuneration report continued
No options had their terms and conditions varied during the accounting period to 31 December 2005. No payment is required on the award of an option.
The executive share options which are exercisable from March2002 onwards are subject to the satisfaction of an EPS growthtarget which provides that options are exercisable only if, overa three year period, the growth in the company’s EPS hasexceeded the growth in the RPI plus 9%. In respect of executiveshare options exercisable before March 2002 the performancecondition is that the growth in the company’s EPS over three
years has exceeded the growth in the RPI plus 6%.
The market price of the company’s ordinary shares at 31December 2005 was £17.55 and the range during the year to 31 December 2005 was £15.22 to £18.33.
In the ten year period to 31 December 2005, awards madeusing new issue shares under the company’s share plansrepresented 4.62% of the company’s issued ordinary sharecapital, leaving an available dilution headroom of 5.38%.
Medium Term Performance Plan Market Market Share interest End of periodScheme interests Awards price on Awards Awards price on (share for qualifying
(share equivalents) at granted award vested in exercised exercise equivalents) at conditions to 1 January 2005 in 2005 £ 2005* in 2005 £ 31 December 2005 be fulfilled
Sir Fred Goodwin 93,040 16.35 93,040 vested 31.12.0333,855 18.59 33,855 vested 31.12.0478,398 17.22 Nil — vested 31.12.0586,506 17.34 86,506 31.12.06
95,431 17.29 95,431 31.12.07291,799 308,832
Mr Fish 35,274 17.34 35,274 31.12.0610,495 17.29 10,495 31.12.07
35,274 45,769Mr Pell 22,026 16.35 22,026 vested 31.12.03
22,570 18.59 22,570 17.87 — vested 31.12.0435,715 17.22 Nil — vested 31.12.0537,774 17.34 37,774 31.12.06
40,486 17.29 40,486 31.12.07118,085 100,286
Mr Robertson** 77,533 16.35 77,533 17.05 — vested 31.12.03Mr Watt 18,877 18.59 18,877 vested 31.12.04
30,488 17.22 Nil — vested 31.12.0534,603 17.34 34,603 31.12.06
38,173 17.29 38,173 31.12.0783,968 91,653
* Awards were granted on 12 June 2003. The vesting level was nil and these awards have now lapsed.
** The exercise of awards for Mr Robertson occurred after his retirement from the Group Board on 20 April 2005.
Note:For any awards that have vested, participants holding option-based awards can exercise their right over the underlying shareequivalents at any time up to ten years from the date of grant.
No variation was made to any of the terms of the plan during the year. The performance measures are detailed on page pages 122 and 123.
Phantom 2000 Plan Awards granted during year
End of the period forPhantom 2000 units at Units awarded Market price qualifying conditions Benefits received Phantom 2000 units at
1 January 2005 during year on award to be fulfilled during year 31 December 2005
Mr Fish 1,000,000 01.01.04 US$7,670,900 –1,000,000 01.01.05 1,000,0002,000,000 1,000,000
No variation was made to any of the terms of the plan during the year. The performance measures are detailed on page 123.
Citizens Long Term Incentive PlanBenefits received
Interests at 1 January 2005 Awards granted during year during year Interests at 31 December 2005
Mr Fish LTIP* awards for the LTIP award for the LTIP award for the LTIP* awards for the 3 year periods: 3 year period: 3 year period: 3 year periods:
01.01.02 – 31.12.04 01.01.02 – 31.12.0401.01.03 – 31.12.05 was US$1,025,394 01.01.03 – 31.12.0501.01.04 – 31.12.06 01.01.04 – 31.12.06
01.01.05 – 31.12.07 01.01.05 – 31.12.07
* A new cash LTIP was approved by shareholders at the company’s Annual General Meeting in April 2005. Details are given on page 123. This replaces the previous LTIP which provided for a target payment of 60% of average salary over the three year periodand a maximum payment of 105% of average salary.

section
02G
over
nanc
e
129
Dire
ctor
s’re
mun
era
tion
repo
rt
Annual Report and Accounts 2005
Directors’ pension arrangementsDuring the year, Sir Fred Goodwin, Gordon Pell, Iain Robertsonand Fred Watt participated in The Royal Bank of ScotlandGroup Pension Fund (“the RBS Fund”). The RBS Fund is adefined benefit fund which provides pensions and otherbenefits within Inland Revenue limits.
The pension entitlements of Sir Fred Goodwin, Mr Pell, MrRobertson and Mr Watt within the RBS Fund are restricted by Inland Revenue limits as set out in the Finance Act 1989.Additional life assurance cover in excess of these limits isprovided by a separate arrangement. Arrangements have beenmade to provide Sir Fred Goodwin and Mr Pell with additionalpension benefits on a defined benefit basis outwith the RBSFund. The figures shown below include the accrual in respectof these arrangements. Mr Watt was provided with additionalpension benefits on a defined contribution basis andcontributions made in the year are shown below.
No changes are proposed to the level or form of pensionbenefits for any of the current directors as a result of thechanges in pension legislation which come into force in April2006 although as stated above directors will be able to opt out
of tax-approved pension provision if they wish and receive asalary supplement in lieu. In addition consideration will begiven to funding a greater proportion of the benefits.
Of the total transfer value as at 31 December 2005 shown,25% relates to benefits in funded pension schemes.Sir George Mathewson receives life insurance cover under anindividual arrangement. The non-executive directors do notaccrue pension benefits, other than Mr Robertson whocontinued to accrue benefits in the RBS Fund after hisappointment as a non-executive director.
Lawrence Fish accrues pension benefits under a number ofarrangements in the US. Defined benefits are built up underthe Citizens’ Qualified Plan, Excess Plan and SupplementalExecutive Retirement Arrangement. In addition, he is amember of two defined contribution arrangements – aQualified 401(k) Plan and an Excess 401(k) Plan.
As in the 2004 Report and Accounts, disclosure of thesebenefits has been made in accordance with the United KingdomListing Authority Listing Rules and the Combined Code and withthe Directors’ Remuneration Report Regulations 2002.
Transfer value Additional Additional for the additional
pension pension Increase pensionearned earned in transfer earned
Accrued during the during the Transfer Transfer value during during the entitlement at year ended year ended value as at value as at year ended year ended
Age at 31 December 31 December 31 December 31 December 31 December 31 December 31 December 31 December 2005 2005 2005* 2005 2004 2005 2005*
Defined benefit arrangements 2005 000 p.a. 000 p.a. 000 p.a. 000 000 000 000
Sir Fred Goodwin 47 £444 £63 £51 £5,119 £3,591 £1,528 £592Mr Pell 55 £302 £55 £47 £5,092 £3,592 £1,500 £790Mr Robertson 60 £37 £4 £3 £676 £565 £111 £48Mr Watt 45 £9 £2 £2 £96 £62 £34 £19Mr Fish 61 $1,384 $244 $244 $13,347 $10,046 $3,301 $2,350
* net of statutory revaluation applying to deferred pensions
Notes:
(1) There is a significant difference in the form of disclosure required by the Combined Code and the Directors’ Remuneration Report Regulations 2002. The former requires thedisclosure of the additional pension earned during the year and the transfer value equivalent to this pension based on stock market conditions at the end of the year. The latterrequires the disclosure of the difference between the transfer value at the start and end of the year and is therefore dependent on the change in stock market conditions overthe course of the year. The above disclosure has been made in accordance with the Combined Code and the Directors’ Remuneration Report Regulations 2002.
(2) Mr Robertson continued to accrue pension during his service with the Group in 2005 after resignation as a director. The figures above include the pension accrued during thissubsequent service.
(3) The transfer values disclosed above do not represent a sum paid or payable to the individual director. Instead they represent a potential liability of the company /pension scheme.
(4) No allowance is made in these transfer values for any enhanced benefits that may become payable on early retirement.
(5) The proportion of benefits represented by funded pension schemes for Sir Fred Goodwin, Gordon Pell and Lawrence Fish is 3%, 69% and 3% respectively. All benefits for Iain Robertson and Fred Watt are in funded pension schemes.
(6) Following Mr Pell’s appointment as Executive Chairman, Retail Markets, he was awarded enhanced pension benefits.
(7) In accordance with US market practice, Mr Fish’s pensionable remuneration is limited to $4 million per annum.
Contributions and allowances paid in the year ended 31 December 2005 under defined contribution arrangements were:2005 2004000 000
Mr Watt £144 £128Mr Fish $139 $91
Bob ScottChairman of the Remuneration Committee27 February 2006

130
Dire
ctor
s’in
tere
sts
in s
hare
sDirectors’ interests in shares
Preference sharesMr Fish held 20,000 non-cumulative preference shares of US$0.01each at 31 December 2005 (2004 – 20,000) and Mr Koch held20,000 non-cumulative preference shares of US$0.01 each at31 December 2005 (2004 – nil). No other director had aninterest in the preference shares during the year.
Loan notesNo director had an interest in loan notes during the year.
The company’s Register of Directors’ Interests, which is opento inspection, contains full details of directors’ shareholdingsand options to subscribe.
No director held a non-beneficial interest in the shares of thecompany at 31 December 2005, at 1 January 2005 or date ofappointment if later.
Sharesbeneficially
owned at 31 December 2005
1 January 2005 Vested Value as ator date of Shares MPP shares Vested 31 December
appointment owned or share share 2005 if later beneficially equivalents options Total (2,3)
ChairmanSir George Mathewson 250,816 260,159 — 256,254 516,413 £6,577,478
Executive directorsSir Fred Goodwin 64,960 66,762 126,895 433,488 627,145 £6,530,847Mr Fish 11,120 11,120 — 108,027 119,147 £1,082,677Mr Pell 582 582 22,026 107,916 130,524 £906,381Mr Watt 58,408 59,111 18,877 115,548 193,536 £1,708,409
Sharesbeneficially
owned at Shares1 January 2005 beneficially
or date of owned atappointment 31 December
if later 2005
Non-executive directorsSir Tom McKillop — 30,000Mr Buchan 5,000 5,000Dr Currie — 556Mr Hunter 1,500 3,500Mr Koch 20,000 20,000Mr MacHale 10,000 10,000Mr Scott 2,448 4,448Mr Sutherland — 5,590
No other director had an interest in the company’s ordinary shares during the year.
On both 9 January 2006 and 7 February 2006, 7 ordinary shares of 25p each were acquired by Sir Fred Goodwin under the Group’s Buy As You Earn share scheme.
Notes:
(1) The numbers shown in this table are taken from the audited disclosures shown elsewhere in this Annual Report.
(2) The value is based on the share price at 31 December 2005, which was £17.55. During the year ended 31 December 2005 the share price ranged from £15.22 to £18.33.
(3) The notional value of the vested share options has been calculated on the ‘in the money’ value.

section
02G
over
nanc
e
131
Sta
tem
ent
ofd
irect
ors’
resp
onsi
bili
ties
Annual Report and Accounts 2005
Statement of directors’ responsibilities
The Directors are required by Article 4 of the IAS Regulation(European Commission Regulation No 1606/2002) to prepareGroup accounts, and as permitted by the Companies Act 1985have elected to prepare Company accounts, for each financialyear in accordance with International Financial ReportingStandards. They are responsible for preparing accounts thatpresent fairly the financial position, financial performance, andcash flows of the Group and the Company. In preparing thoseaccounts, the directors are required to:
• select suitable accounting policies and then apply themconsistently;
• make judgements and estimates that are reasonable andprudent; and
• state whether applicable accounting standards have beenfollowed, subject to any material departures disclosed andexplained in the accounts.
The directors are responsible for keeping proper accountingrecords which disclose with reasonable accuracy at any timethe financial position of the Group and to enable them toensure that the Annual report and accounts complies with theCompanies Act 1985. They are also responsible forsafeguarding the assets of the company and the Group andhence for taking reasonable steps for the prevention anddetection of fraud and other irregularities.
By order of the Board.
Miller McLean Secretary27 February 2006

132

section
03Fi
nanc
ial
stat
emen
ts
133
Fin
anci
al s
tate
men
ts
Annual Report and Accounts 2005
Financial statements
Contents134 Independent auditors’ report
136 Accounting policies
145 Consolidated income statement
146 Balance sheets
147 Statements of recognisedincome and expense
148 Cash flow statements
149 Notes on the accounts

134
Inde
pend
ent
audi
tors
’rep
ort
to t
he m
embe
rs o
fT
he R
oyal
Ban
k of
Sco
tland
Gro
up p
lc
We have audited the financial statements of The Royal Bank ofScotland Group plc (“the company”) and its subsidiaries(together “the Group”) for the year ended 31 December 2005which comprise the accounting policies, the balance sheets asat 31 December 2005 and 2004, the consolidated incomestatement, the cash flow statements, the statements ofrecognised income and expense for each of the two years inthe period ended 31 December 2005 and the related Notes 1 to47. These financial statements have been prepared under theaccounting policies set out therein. We have also audited theinformation in the part of the directors’ remuneration report thatis described as having been audited.
This report is made solely to the company’s members, as abody, in accordance with section 235 of the Companies Act1985. Our audit work has been undertaken so that we mightstate to the company’s members those matters we arerequired to state to them in an auditors’ report and for no otherpurpose. To the fullest extent permitted by law, we do notaccept or assume responsibility to anyone other than thecompany and the company’s members as a body, for our auditwork, for this report, or for the opinions we have formed.
Respective responsibilities of directors and auditorsAs described in the ‘Statement of directors’ responsibilities’,the company’s directors are responsible for the preparation ofthe financial statements in accordance with applicable UnitedKingdom law and International Financial Reporting Standards(“IFRS”) as adopted for use in the European Union. They arealso responsible for the preparation of the other informationcontained in the 2005 Annual Report including the directors’remuneration report. Our responsibility is to audit the financialstatements and the part of the directors’ remuneration reportdescribed as having been audited in accordance with relevantUnited Kingdom legal and regulatory requirements andInternational Standards on Auditing (UK and Ireland).
We report to you our opinion as to whether the financialstatements give a true and fair view in accordance with therelevant framework and whether the financial statements andthe part of the directors’ remuneration report described ashaving been audited have been properly prepared inaccordance with the Companies Act 1985 and Article 4 of theIAS Regulation. We also report to you if, in our opinion, thedirectors’ report is not consistent with the financial statements,if the company has not kept proper accounting records, if wehave not received all the information and explanations werequire for our audit, or if information specified by lawregarding directors’ remuneration and transactions with thecompany and other members of the Group is not disclosed.
We also report to you if, in our opinion, the company has notcomplied with any of the four directors’ remunerationdisclosure requirements specified for our review by the ListingRules of the Financial Services Authority. These comprise theamount of each element in the remuneration package andinformation on share options, details of long term incentiveschemes, and money purchase and defined benefit schemes.We give a statement, to the extent possible, of details of anynon-compliance.
We review whether the corporate governance statementreflects the company’s compliance with the nine provisions ofthe Combined Code specified for our review by the ListingRules of the Financial Services Authority, and we report if itdoes not. We are not required to consider whether the Board’sstatements on internal control cover all risks and controls, orform an opinion on the effectiveness of the Group’s corporategovernance procedures or its risk and control procedures.
We read the directors’ report and the other informationcontained in the 2005 Annual Report as described in thecontents section including the unaudited part of the directors’remuneration report and consider the implications for ourreport if we become aware of any apparent misstatements ormaterial inconsistencies with the financial statements.
Basis of audit opinionWe conducted our audit in accordance with InternationalStandards on Auditing (UK and Ireland) issued by the AuditingPractices Board and with the standards of the United StatesPublic Company Accounting Oversight Board. An auditincludes examination, on a test basis, of evidence relevant tothe amounts and disclosures in the financial statements andthe part of the directors’ remuneration report described ashaving been audited. The Group is not required to have, norwere we engaged to perform, an audit of its internal controlover financial reporting. An audit includes consideration ofinternal control over financial reporting as a basis for designingaudit procedures that are appropriate in the circumstances,but not for the purposes of expressing an opinion on theeffectiveness of the Group’s internal controls over financialreporting. Accordingly, we express no such opinion. It alsoincludes an assessment of the significant estimates andjudgements made by the directors in the preparation of thefinancial statements and of whether the accounting policiesare appropriate to the circumstances of the company and theGroup, consistently applied and adequately disclosed.
We planned and performed our audit so as to obtain all theinformation and explanations which we considered necessaryin order to provide us with sufficient evidence to givereasonable assurance that the financial statements and thepart of the directors’ remuneration report described as havingbeen audited are free from material misstatement, whethercaused by fraud or other irregularity or error. In forming ouropinion, we also evaluated the overall adequacy of thepresentation of information in the financial statements and thepart of the directors’ remuneration report described as havingbeen audited.
Independent auditors’ report to the members of The Royal Bank of Scotland Group plc
Neither an audit nor a review provides assurance on the maintenance and integrity of the website, including controls used to achieve this,and in particular on whether any changes may have occurred to the financial information since first published. These matters are theresponsibility of the directors but no control procedures can provide absolute assurance in this area.

section
03Fi
nanc
ial
stat
emen
ts
135
Inde
pend
ent
audi
tors
’rep
ort
to t
he m
embe
rs o
fT
he R
oyal
Ban
k of
Sco
tland
Gro
up p
lc
Annual Report and Accounts 2005
UK opinionIn our opinion:• the Group financial statements give a true and fair view, in
accordance with IFRS as adopted for use in the EuropeanUnion, of the state of the Group’s affairs as at 31 December2005 and of its profit and cash flows for the year thenended;
• the company financial statements give a true and fair view, inaccordance with IFRS as adopted for use in the EuropeanUnion as applied in accordance with the requirements of theCompanies Act 1985, of the state of affairs of the companyas at 31 December 2005;
• the financial statements and the part of the directors’remuneration report described as having been audited havebeen properly prepared in accordance with the CompaniesAct 1985 and Article 4 of the IAS Regulation.
Separate opinion in relation to IFRSAs explained in the Accounting policies, the Group in additionto complying with its legal obligation to comply with IFRS asadopted for use in the European Union, has also complied withthe IFRS as issued by the International Accounting StandardsBoard. In our opinion the financial statements give a true andfair view, in accordance with IFRS, of the state of the Group’saffairs as at 31 December 2005 and of its profit for the yearthen ended.
US opinionIn our opinion, the financial statements present fairly, in allmaterial respects, the financial position of the Group as at 31December 2005 and 2004 and the results of its operations andits cash flows for each of the two years in the period ended 31December 2005 in conformity with IFRS.
IFRS vary in certain significant respects from accountingprinciples generally accepted in the United States of America.Information relating to the nature and effect of suchdifferences is presented in Note 46 to the financial statements.
Deloitte & Touche LLPChartered Accountants and Registered AuditorsEdinburgh, United Kingdom27 February 2006

136
Acc
ount
ing
polic
ies
1. Adoption of International Financial Reporting StandardsThe annual accounts have, for the first time, been prepared inaccordance with International Financial Reporting Standardsadopted by the International Accounting Standards Board(“IASB”), and interpretations issued by the International FinancialReporting Interpretations Committee of the IASB (together “IFRS”)as endorsed by the European Union (“EU”). The EU has notendorsed the complete text of IAS 39 ‘Financial Instruments:Recognition and Measurement’; it has relaxed some of thestandard’s hedging requirements. The Group has not takenadvantage of this relaxation and has adopted IAS 39 as issuedby the IASB. The date of transition to IFRS for the Group andthe company (The Royal Bank of Scotland Group plc) and thedate of their opening IFRS balance sheets was 1 January 2004.The company accounts have been presented in accordancewith the Companies Act 1985.
The main differences between IFRS and previously appliedgenerally accepted accounting principles (“UK GAAP”) andthe effect of implementing IFRS on the Group and companybalance sheets and shareholders’ funds as at 1 January and31 December 2004 and on the Group’s 2004 consolidatedincome statement are set out on pages 210 to 218.
On initial adoption of IFRS, the Group (and the company where relevant) applied the following exemptions from therequirements of IFRS and from their retrospective applicationas permitted by IFRS 1 ‘First-time Adoption of InternationalFinancial Reporting Standards’:
Business combinations – the Group has applied IFRS 3‘Business Combinations’ to business combinations thatoccurred on or after 1 January 2004. Business combinationsbefore that date have not been restated. Under UK GAAP,goodwill arising on acquisitions after 1 October 1998 wascapitalised and amortised over its estimated useful economiclife. Goodwill arising on acquisitions before 1 October 1998was deducted from equity. The carrying amount of goodwill inthe Group’s opening IFRS balance sheet was £13,131 million,its carrying value under UK GAAP as at 31 December 2003.
Fair value or revaluation as deemed cost – under UK GAAP, theGroup’s freehold and long leasehold property occupied for itsown use was recorded at valuation on the basis of existing usevalue. The Group has elected to use this valuation as at 31December 2003 as deemed cost for its opening IFRS balancesheet. At this date, the carrying value under UK GAAP offreehold and long leasehold property occupied for own usewas £2,391 million.
Compound financial instruments – the Group has notseparated compound instruments between liability and equitycomponents, as required by IAS 32 ‘Financial Instruments:Disclosure and Presentation’, where the liability componentwas not outstanding at 1 January 2004. UK GAAP did notpermit compound instruments to be separated between liabilityand equity components on issue.
Derecognition – the Group has applied the derecognitionrequirements of IAS 39 to transactions occurring on or after 1 January 1992.
Share based payments – IFRS 2 ‘Share-based Payment’ has beenapplied to equity instruments granted after 7 November 2002.
Implementation of IAS 32, IAS 39 and IFRS 4 ‘InsuranceContracts’ (incorporating the adoption of FRS 27 ‘LifeAssurance’) – as allowed by IFRS 1, the Group and thecompany implemented IAS 32, IAS 39 and IFRS 4 with effectfrom 1 January 2005 without restating the income statement,balance sheet and notes for 2004. The Group has adopted theAmendment to IAS 39 ‘The Fair Value Option’ issued by theIASB in June 2005 also from 1 January 2005. The effect ofimplementing IAS 32, IAS 39 and IFRS 4 on the Group andcompany balance sheets and shareholders’ funds as at 1January 2005 is set out on pages 219 to 220. In preparing the2004 comparatives, UK GAAP principles then current havebeen applied to financial instruments. The main differencesbetween UK GAAP and IFRS on financial instruments aresummarised on pages 212 to 214.
IFRS 1 prohibits retrospective application of some aspects of IFRS:
Derecognition of financial assets and liabilities – non-derivative financial assets and liabilities derecognisedbefore 1 January 1992 (the date from which thederecognition requirements of IAS 39 have beenimplemented) under the Group’s previous GAAP have notbeen recognised in its opening IFRS balance sheet.
Hedge accounting – hedging relationships of a type thatdoes not qualify for hedge accounting under IAS 39 are notreflected in the Group’s opening IFRS balance sheet.
Discontinued operations and assets classified as held for sale– the Group has applied IFRS 5 ‘Non-current Assets Heldfor Sale and Discontinued Operations’ from 1 January 2005.
The Group has adopted the Amendment ‘Actuarial Gains andLosses, Group Plans and Disclosures’ to IAS 19 ‘EmployeeBenefits’ from 1 January 2004. Actuarial gains and losses arerecognised in full as they occur outside profit or loss.
2. Accounting conventionThe company is incorporated in the UK and registered inScotland. The financial statements have been prepared on thehistorical cost basis except that the following assets and liabilitiesare stated at their fair value: derivative financial instruments,held-for-trading financial assets and financial liabilities, financialassets and financial liabilities that are designated as at fair valuethrough profit or loss, available-for-sale financial assets andinvestment property. Recognised financial assets and financialliabilities in fair value hedges are adjusted for changes in fair valuein respect of the risk that is hedged.
3. Basis of consolidationThe consolidated financial statements incorporate the financialstatements of the company and entities (including certainspecial purpose entities) controlled by the Group (itssubsidiaries). Control exists where the Group has the power to govern the financial and operating policies of the entity;generally conferred by holding a majority of voting rights.On acquisition of a subsidiary, its identifiable assets, liabilities and
Accounting policies

section
03Fi
nanc
ial
stat
emen
ts
137
Acc
ount
ing
polic
ies
Annual Report and Accounts 2005
contingent liabilities are included in the consolidated accounts attheir fair value. Any excess of the cost (the fair value of assetsgiven, liabilities incurred or assumed and equity instrumentsissued by the Group plus any directly attributable costs) of anacquisition over the fair value of the net assets acquired isrecognised as goodwill. The interest of minority shareholders isstated at their share of the fair value of the subsidiary’s net assets.
The results of subsidiaries acquired are included in theconsolidated income statement from the date control passes to the Group. The results of subsidiaries sold are included upuntil the Group ceases to control them.
All intra-group balances, transactions, income and expensesare eliminated on consolidation. The consolidated accounts areprepared using uniform accounting policies.
4. Revenue recognitionInterest income on financial assets that are classified as loansand receivables, available-for-sale or held-to-maturity andinterest expense on financial liabilities other than those at fairvalue through profit or loss are determined using the effectiveinterest rate method. The effective interest rate method is amethod of calculating the amortised cost of a financial assetor financial liability (or group of financial assets or liabilities)and of allocating the interest income or interest expense overthe expected life of the asset or liability. The effective interestrate is the rate that exactly discounts estimated future cashflows to the instrument’s initial carrying amount. Calculation ofthe effective interest rate takes into account fees receivable,that are an integral part of the instrument’s yield, premiums ordiscounts on acquisition or issue, early redemption fees andtransaction costs. All contractual terms of a financialinstrument are considered when estimating future cash flows.
Financial assets and financial liabilities held-for-trading ordesignated as at fair value through profit or loss are recordedat fair value. Changes in fair value are recognised in profit or losstogether with dividends and interest receivable and payable.
Commitment and utilisation fees are determined as a percentageof the outstanding facility. If it is unlikely that a specific lendingarrangement will be entered into, such fees are taken to profitor loss over the life of the facility otherwise they are deferredand included in the effective interest rate on the advance.
Fees in respect of services are recognised as the right toconsideration accrues through the provision of the service tothe customer. The arrangements are generally contractual andthe cost of providing the service is incurred as the service isrendered. The price is usually fixed and always determinable.The application of this policy to significant fee types is outlinedbelow.
Payment services: this comprises income received for paymentservices including cheques cashed, direct debits, ClearingHouse Automated Payments (the UK electronic settlementsystem) and BACS payments (the automated clearing housethat processes direct debits and direct credits). These aregenerally charged on a per transaction basis. The income isearned when the payment or transaction occurs. Payment
services income is usually charged to the customer’s account,monthly or quarterly in arrears. Accruals are raised for servicesprovided but not charged at period end.
Card related services: fees from credit card business include:
Commission received from retailers for processing creditand debit card transactions: income is accrued to theincome statement as the service is performed.
Interchange received: as issuer, the Group receives a fee(interchange) each time a cardholder purchases goods andservices. The Group also receives interchange fees fromother card issuers for providing cash advances through itsbranch and Automated Teller Machine networks. These feesare accrued once the transaction has taken place.
An annual fee payable by a credit card holder is deferredand taken to profit or loss over the period of the service i.e.12 months.
Insurance brokerage: this is made up of fees and commissionsreceived from the agency sale of insurance. Commission on thesale of an insurance contract is earned at the inception of thepolicy as the insurance has been arranged and placed. However,provision is made where commission is refundable in the event ofpolicy cancellation in line with estimated cancellations.
Investment management fees: fees charged for managinginvestments are recognised as revenue as the services areprovided. Incremental costs that are directly attributable tosecuring an investment management contract are deferred andcharged as expense as the related revenue is recognised.
Insurance premiums – see note 11 below.
5. Pensions and other post-retirement benefitsThe Group provides post-retirement benefits in the form ofpensions and healthcare plans to eligible employees.
For defined benefit schemes, scheme liabilities are measured onan actuarial basis using the projected unit credit method anddiscounted at a rate that reflects the current rate of return on ahigh quality corporate bond of equivalent term and currency tothe scheme liabilities. Scheme assets are measured at their fairvalue. Any surplus or deficit of scheme assets over liabilities isrecognised in the balance sheet as an asset (surplus) or liability(deficit). The current service cost and any past service coststogether with the expected return on scheme assets less theunwinding of the discount on the scheme liabilities is charged tooperating expenses. Actuarial gains and losses are recognisedin full in the period in which they occur outside profit or loss andpresented in the statement of recognised income and expense.Contributions to defined contribution pension schemes arerecognised in the income statement when payable.
6. Intangible assets and goodwillIntangible assets that are acquired by the Group are stated atcost less accumulated amortisation and impairment losses.Amortisation is charged to profit or loss using methods thatbest reflect the economic benefits over their estimated useful

138
Acc
ount
ing
polic
ies
economic lives and is included in Depreciation and amortisation.The estimated useful economic lives are as follows:
Core deposit intangibles 7 yearsOther acquired intangibles 5-10 yearsComputer software 3-5 years
Expenditure on internally generated goodwill and brands iswritten-off as incurred. Acquired goodwill being the excess ofthe cost of an acquisition over the Group’s interest in the netfair value of the identifiable assets, liabilities and contingentliabilities of the subsidiary, associate or joint venture acquiredis initially recognised at cost and subsequently at cost less anyaccumulated impairment losses. Goodwill arising on theacquisition of subsidiaries and joint ventures is included in thebalance sheet caption ‘Intangible fixed assets’ and that onassociates within their carrying amounts. The gain or loss onthe disposal of a subsidiary, associate or joint venture includesthe carrying value of any related goodwill.
7. Property, plant and equipmentItems of property, plant and equipment are stated at cost lessaccumulated depreciation (see below) and impairment losses.Where an item of property, plant and equipment comprisesmajor components having different useful lives, they areaccounted for separately. Property that is being constructed ordeveloped for future use as investment property is classified asproperty, plant and equipment and stated at cost untilconstruction or development is complete, at which time it isreclassified as investment property.
Depreciation is charged to profit or loss on a straight-line basisso as to write-off the depreciable amount of property, plantand equipment (including assets owned and let on operatingleases (except investment property – see note 20 below)) overtheir estimated useful lives. The depreciable amount is the costof an asset less its residual value. Land is not depreciated.Estimated useful lives are as follows:
Freehold and long leasehold buildings 50 yearsShort leaseholds unexpired period
of the leaseProperty adaptation costs 10 to 15 yearsComputer equipment up to 5 yearsOther equipment 4 to 15 years
8. Impairment of intangible assets and property,plant and equipmentAt each reporting date, the Group assesses whether there is anyindication that its intangible assets, or property, plant andequipment are impaired. If any such indication exists, the Groupestimates the recoverable amount of the asset and the impairmentloss if any. Goodwill is tested for impairment annually or morefrequently if events or changes in circumstances indicate that itmight be impaired. If an asset does not generate cash flows thatare independent from those of other assets or groups of assets,recoverable amount is determined for the cash-generating unit towhich the asset belongs. The recoverable amount of an asset isthe higher of its fair value less costs to sell and its value in use.Value in use is the present value of future cash flows from theasset or cash-generating unit discounted at a rate that reflects
market interest rates adjusted for risks specific to the asset orcash generating unit that have not been reflected in the estimationof future cash flows. If the recoverable amount of an intangible ortangible asset is less than its carrying value, an impairment loss isrecognised immediately in profit or loss and the carrying value ofthe asset reduced by the amount of the loss. A reversal of animpairment loss on intangible assets (excluding goodwill) orproperty, plant and equipment is recognised as it arises providedthe increased carrying value does not exceed that which it wouldhave been had no impairment loss been recognised. Impairmentlosses on goodwill are not reversed.
9. Foreign currenciesThe Group’s consolidated financial statements are presented insterling which is the functional currency of the company.
Transactions in foreign currencies are translated into sterling atthe foreign exchange rate ruling at the date of the transaction.Monetary assets and liabilities denominated in foreigncurrencies are translated into sterling at the rates of exchangeruling at the balance sheet date. Foreign exchange differencesarising on translation are recognised in profit or loss except fordifferences arising on cash flow hedges and hedges of netinvestments in foreign operations. Non-monetary itemsdenominated in foreign currencies that are stated at fair valueare translated into sterling at foreign exchange rates ruling atthe dates the values were determined. Translation differencesarising on non-monetary items measured at fair value arerecognised in profit or loss except for differences arising onavailable-for-sale non-monetary financial assets, for exampleequity shares, which are included in the available-for-salereserve in equity unless the asset is the hedged item in a fairvalue hedge.
The assets and liabilities of foreign operations, includinggoodwill and fair value adjustments arising on acquisition, aretranslated into sterling at foreign exchange rates ruling at thebalance sheet date. The revenues and expenses of foreignoperations are translated into sterling at average exchangerates unless these do not approximate to the foreign exchangerates ruling at the dates of the transactions. Foreign exchangedifferences arising on the translation of foreign operations arerecognised directly in equity.
10. LeasesContracts to lease assets are classified as finance leases ifthey transfer substantially all the risks and rewards ofownership of the asset to the customer. Other contracts tolease assets are classified as operating leases.
Finance lease receivables are stated in the balance sheet atthe amount of the net investment in the lease being theminimum lease payments and any unguaranteed residual valuediscounted at the interest rate implicit in the lease. Financelease income is allocated to accounting periods so as to give aconstant periodic rate of return before tax on the net investment.Unguaranteed residual values are subject to regular review toidentify potential impairment. If there has been a reduction inthe estimated unguaranteed residual value, the incomeallocation is revised and any reduction in respect of amountsaccrued is recognised immediately.
Accounting policies continued

section
03Fi
nanc
ial
stat
emen
ts
139
Acc
ount
ing
polic
ies
Annual Report and Accounts 2005
Rental income from operating leases is credited to the incomestatement on a receivable basis over the term of the lease.Operating lease assets are included within Property, plant and equipment and depreciated over their useful lives (seenote 7 above).
11. InsuranceGeneral insuranceGeneral insurance comprises short-duration contractsprincipally property and liability insurance contracts. Due tothe nature of the products sold – retail-based property andcasualty, motor, home and personal health insurance contracts– the insurance protection is provided on an even basisthroughout the term of the policy.
Premiums from general insurance contracts are recognised inthe accounting period in which they begin. Unearned premiumsrepresent the proportion of the net premiums that relate toperiods of insurance after the balance sheet date and arecalculated over the period of exposure under the policy, on adaily basis, 24th’s basis or allowing for the estimated incidenceof exposure under policies which are longer than twelvemonths. Provision is made where necessary for the estimatedamount of claims over and above unearned premiums includingthat in respect of future written business on discontinued linesunder the run-off of delegated underwriting authorityarrangements. It is designed to meet future claims and relatedexpenses and is calculated across related classes of businesson the basis of a separate carry forward of deferred acquisitionexpenses after making allowance for investment income.
Acquisition expenses relating to new and renewed business for all classes are expensed over the period during which thepremiums are earned. The principal acquisition costs sodeferred are commissions payable, costs associated with thetelesales and underwriting staff and prepaid claims handlingcosts in respect of delegated claims handling arrangements forclaims which are expected to occur after the balance sheetdate. Claims and the related reinsurance are recognised in theaccounting period in which the loss occurs. Provision is madefor the full cost of settling outstanding claims at the balancesheet date, including claims estimated to have been incurred butnot yet reported at that date, and claims handling expenses. Therelated reinsurance receivable is recognised at the same time.
Life assuranceThe Group’s long-term assurance contracts include whole-lifeterm assurance, endowment assurance, flexible whole-life,pension and annuity contracts that are expected to remain inforce for an extended period of time. Long-term assurancecontracts under which the Group does not accept significantinsurance risk are classified as financial instruments.The Group recognises the value of in-force long-termassurance contracts as an asset. Cash flows associated within-force contracts and related assets, including reinsurancecash flows, are projected, using appropriate assumptions as tofuture mortality, persistency and levels of expenses andexcluding the value of future investment margins, to estimatefuture surpluses attributable to the Group. These surpluses,discounted at a risk-adjusted rate, are recognised as aseparate asset. Changes in the value of this asset, which isdetermined on a post-tax basis, are included in operating profit.
The Group has reinsurance treaties that transfer significantinsurance risk. Liabilities for reinsured contracts are calculatedgross of reinsurance and a separate reinsurance asset recorded.
Premiums on long-term insurance contracts are recognised asincome when receivable. Claims on long term insurancecontracts reflect the cost of all claims arising during the year,including claims handling costs. Claims are recognised whenthe Group becomes aware of the claim.
12. TaxationProvision is made for taxation at current enacted rates ontaxable profits, arising in income or in equity, taking intoaccount relief for overseas taxation where appropriate.Deferred taxation is accounted for in full for all temporarydifferences between the carrying amount of an asset or liabilityfor accounting purposes and its carrying amount for taxpurposes, except in relation to overseas earnings whereremittance is controlled by the Group, and goodwill.
Deferred tax assets are only recognised to the extent that it isprobable that they will be recovered.
13. Financial assetsFinancial assets are classified into held-to-maturity investments;available-for-sale financial assets; held-for-trading; designatedas at fair value through profit or loss; or loans and receivables.
Held-to-maturity investments – a financial asset is classified asa held-to-maturity investment only if it has fixed or determinablepayments, a fixed maturity and the Group has the positiveintention and ability to hold to maturity. Held-to-maturityinvestments are initially recognised at fair value plus directlyrelated transaction costs. They are subsequently measured atamortised cost using the effective interest method (see note 4above) less any impairment losses.
Held-for-trading – a financial asset is classified as held-for-trading if it is acquired principally for the purpose of selling inthe near term, or forms part of a portfolio of financialinstruments that are managed together and for which there isevidence of short-term profit taking, or it is a derivative (not ina qualifying hedge relationship). Held-for-trading financialassets are recognised at fair value with transaction costs beingrecognised in profit or loss. Subsequently they are measuredat fair value. Gains and losses on held-for-trading financialassets are recognised in profit or loss as they arise.
Designated as at fair value through profit or loss – financialassets that the Group designates on initial recognition as beingat fair value through profit or loss are recognised at fair value,with transaction costs being recognised in profit or loss andare subsequently measured at fair value. Gains and losses onfinancial assets that are designated as at fair value throughprofit or loss are recognised in profit or loss as they arise.
Financial assets may be designated as at fair value throughprofit or loss only if such designation (a) eliminates orsignificantly reduces a measurement or recognitioninconsistency; or (b) applies to a group of financial assets,financial liabilities or both that the Group manages and

140
Acc
ount
ing
polic
ies
evaluates on a fair value basis; or (c) relates to an instrumentthat contains an embedded derivative which is not evidentlyclosely related to the host contract.
The principal category of financial assets designated as at fairvalue through profit or loss is policyholders’ assetsunderpinning insurance and investment contracts issued bythe Group's life assurance businesses. Fair value designationsignificantly reduces the measurement inconsistency thatwould arise if these assets were classified as available-for-sale.
Loans and receivables – non-derivative financial assets withfixed or determinable repayments that are not quoted in anactive market are classified as loans and receivables exceptthose that are classified as available-for-sale or as held-for-trading, or designated as at fair value through profit or loss.Loans and receivables are initially recognised at fair value plusdirectly related transaction costs. They are subsequentlymeasured at adjusted cost using the effective interest method(see note 4 above) less any impairment losses.
Available-for-sale – financial assets that are not classified asheld-to-maturity; held-for-trading; designated at fair valuethrough profit or loss; or loans and receivables are classified asavailable-for-sale. Financial assets can be designated asavailable-for-sale on initial recognition. Available-for-salefinancial assets are initially recognised at fair value plus directlyrelated transaction costs. They are subsequently measured atfair value. Impairment losses and exchange differencesresulting from retranslating the amortised cost of currencymonetary available-for-sale financial assets are recognised inprofit or loss together with interest calculated using the effectiveinterest rate (see note 4 above). Other changes in the fair valueof available-for-sale financial assets are reported in a separatecomponent of shareholders’ equity until disposal, when thecumulative gain or loss is recognised in profit or loss.
Regular way purchases of financial assets classified as loansand receivables are recognised on settlement date; all otherregular way purchases are recognised on trade date.
Fair value for a net open position in a financial asset that isquoted in an active market is the current bid price times thenumber of units of the instrument held. Fair values for financialassets not quoted in an active market are determined usingappropriate valuation techniques including discounting futurecash flows, option pricing models and other methods that areconsistent with accepted economic methodologies for pricingfinancial assets.
14. Impairment of financial assetsThe Group assesses at each balance sheet date whether thereis any objective evidence that a financial asset or group offinancial assets classified as held-to-maturity, available-for-saleor loans and receivables is impaired. A financial asset orportfolio of financial assets is impaired and an impairment lossincurred if there is objective evidence that an event or eventssince initial recognition of the asset have adversely affectedthe amount or timing of future cash flows from the asset.
Financial assets carried at amortised cost – if there is objectiveevidence that an impairment loss on a financial asset or group offinancial assets classified as loans and receivables or as held-to-maturity investments has been incurred, the Group measuresthe amount of the loss as the difference between the carryingamount of the asset or group of assets and the present value ofestimated future cash flows from the asset or group of assetsdiscounted at the effective interest rate of the instrument at initialrecognition. Impairment losses are assessed individually forfinancial assets that are individually significant and individuallyor collectively for assets that are not individually significant. Inmaking collective assessment of impairment, financial assetsare grouped into portfolios on the basis of similar riskcharacteristics. Future cash flows from these portfolios areestimated on the basis of the contractual cash flows andhistorical loss experience for assets with similar credit riskcharacteristics. Historical loss experience is adjusted, on thebasis of current observable data, to reflect the effects of currentconditions not affecting the period of historical experience.
Impairment losses are recognised in profit or loss and thecarrying amount of the financial asset or group of financialassets reduced by establishing an allowance for impairmentlosses. If in a subsequent period the amount of the impairmentloss reduces and the reduction can be ascribed to an eventafter the impairment was recognised, the previously recognisedloss is reversed by adjusting the allowance. Once animpairment loss has been recognised on a financial asset orgroup of financial assets, interest income is recognised on thecarrying amount using the rate of interest at which estimatedfuture cash flows were discounted in measuring impairment.
Financial assets carried at fair value – when a decline in thefair value of a financial asset classified as available-for-salehas been recognised directly in equity and there is objectiveevidence that the asset is impaired, the cumulative loss isremoved from equity and recognised in profit or loss. The lossis measured as the difference between the amortised cost ofthe financial asset and its current fair value. Impairment losseson available-for-sale equity instruments are not reversedthrough profit or loss, but those on available-for-sale debtinstruments are reversed, if there is an increase in fair valuethat is objectively related to a subsequent event.
15. Financial liabilitiesA financial liability is classified as held-for-trading if it isincurred principally for the purpose of selling in the near term,or forms part of a portfolio of financial instruments that aremanaged together and for which there is evidence of short-term profit taking, or it is a derivative (not in a qualifying hedgerelationship). Held-for-trading financial liabilities are recognisedat fair value with transaction costs being recognised in profit orloss. Subsequently they are measured at fair value. Gains andlosses are recognised in profit or loss as they arise. Financialliabilities that the Group designates on initial recognition asbeing at fair value through profit or loss are recognised at fairvalue, with transaction costs being recognised in profit or lossand are subsequently measured at fair value. Gains and losseson financial liabilities that are designated as at fair value throughprofit or loss are recognised in profit or loss as they arise.
Accounting policies continued

section
03Fi
nanc
ial
stat
emen
ts
141
Acc
ount
ing
polic
ies
Annual Report and Accounts 2005
Financial liabilities may be designated as at fair value throughprofit or loss only if such designation (a) eliminates orsignificantly reduces a measurement or recognitioninconsistency; or (b) applies to a group of financial assets,financial liabilities or both that the Group manages andevaluates on a fair value basis; or (c) relates to an instrumentthat contains an embedded derivative which is not evidentlyclosely related to the host contract.
The principal categories of financial liabilities designated as atfair value through profit or loss are (a) structured liabilitiesissued by the Group: designation significantly reduces themeasurement inconsistency between these liabilities and therelated derivatives carried at fair value, and (b) investmentcontracts issued by the Group's life assurance businesses: fairvalue designation significantly reduces the measurementinconsistency that would arise if these liabilities weremeasured at amortised cost.
All other financial liabilities are measured at amortised costusing the effective interest method (see note 4 above).
Fair value for a net open position in a financial liability that isquoted in an active market is the current offer price times thenumber of units of the instrument held or issued. Fair valuesfor financial liabilities not quoted in an active market aredetermined using appropriate valuation techniques includingdiscounting future cash flows, option pricing models and othermethods that are consistent with accepted economicmethodologies for pricing financial liabilities.
16. DerecognitionA financial asset is derecognised when it has been transferredand the transfer qualifies for derecognition. A transfer requiresthat the Group either: (a) transfers the contractual rights toreceive the asset’s cash flows; or (b) retains the right to theasset’s cash flows but assumes a contractual obligation to paythose cash flows to a third party. After a transfer, the Groupassesses the extent to which it has retained the risks andrewards of ownership of the transferred asset. If substantiallyall the risks and rewards have been retained, the asset remainson the balance sheet. If substantially all of the risks andrewards have been transferred, the asset is derecognised. Ifsubstantially all the risks and rewards have been neitherretained nor transferred, the Group assesses whether or not ithas retained control of the asset. If it has not retained control,the asset is derecognised. Where the Group has retainedcontrol of the asset, it continues to recognise the asset to theextent of its continuing involvement.
A financial liability is removed from the balance sheet when theobligation is discharged, or cancelled, or expires.
17. Capital instrumentsThe Group classifies a financial instrument that it issues as afinancial asset, financial liability or an equity instrument inaccordance with the substance of the contractual arrangement.An instrument is classified as a liability if it is a contractualobligation to deliver cash or another financial asset, or toexchange financial assets or financial liabilities on potentiallyunfavourable terms. An instrument is classified as equity if it
evidences a residual interest in the assets of the Group afterthe deduction of liabilities. The components of a compoundfinancial instrument issued by the Group are classified andaccounted for separately as financial assets, financial liabilitiesor equity as appropriate.
18. Derivatives and hedgingDerivative financial instruments are recognised initially, andsubsequently measured, at fair value. Derivative fair values aredetermined from quoted prices in active markets whereavailable. Where there is no active market for an instrument,fair value is derived from prices for the derivative’s componentsusing appropriate pricing or valuation models.
A derivative embedded in a contract is accounted for as stand-alone derivative if its economic characteristics are not closelyrelated to the economic characteristics of the host contract; unlessthe entire contract is carried at fair value through profit or loss.
Gains and losses arising from changes in fair value of aderivative are recognised as they arise in profit or loss unlessthe derivative is the hedging instrument in a qualifying hedge.The Group enters into three types of hedge relationship:hedges of changes in the fair value of a recognised asset orliability or firm commitment (fair value hedges); hedges of thevariability in cash flows from a recognised asset or liability or aforecast transaction (cash flow hedges); and hedges of the netinvestment in a foreign entity.
Hedge relationships are formally documented at inception. Thedocumentation includes identification of the hedged item andthe hedging instrument, details the risk that is being hedged andthe way in which effectiveness will be assessed at inception andduring the period of the hedge. If the hedge is not highlyeffective in offsetting changes in fair values or cash flowsattributable to the hedged risk, consistent with the documentedrisk management strategy, hedge accounting is discontinued.
Fair value hedge – in a fair value hedge, the gain or loss on thehedging instrument is recognised in profit or loss. The gain orloss on the hedged item attributable to the hedged risk isrecognised in profit or loss and adjusts the carrying amount ofthe hedged item. Hedge accounting is discontinued if thehedge no longer meets the criteria for hedge accounting or ifthe hedging instrument expires or is sold, terminated orexercised or if hedge designation is revoked. If the hedged itemis one for which the effective interest rate method is used, anycumulative adjustment is amortised to profit or loss over the lifeof the hedged item using a recalculated effective interest rate.
Cash flow hedge – where a derivative financial instrument isdesignated as a hedge of the variability in cash flows of arecognised asset or liability or a highly probable forecasttransaction, the effective portion of the gain or loss on thehedging instrument is recognised directly in equity. Theineffective portion is recognised in profit or loss. When theforecast transaction results in the recognition of a financial assetor financial liability, the cumulative gain or loss is reclassifiedfrom equity in the same periods in which the asset or liabilityaffects profit or loss. Otherwise the cumulative gain or loss isremoved from equity and recognised in profit or loss at the same

142
Acc
ount
ing
polic
ies
Accounting policies continued
time as the hedged transaction. Hedge accounting isdiscontinued if the hedge no longer meets the criteria for hedgeaccounting; if the hedging instrument expires or is sold,terminated or exercised; if the forecast transaction is no longerexpected to occur; or if hedge designation is revoked. On thediscontinuance of hedge accounting (except where a forecasttransaction is no longer expected to occur), the cumulativeunrealised gain or loss recognised in equity is recognised inprofit or loss when the hedged cash flow occurs or, if theforecast transaction results in the recognition of a financial assetor financial liability, in the same periods during which the assetor liability affects profit or loss. Where a forecast transaction isno longer expected to occur, the cumulative unrealised gain orloss is recognised in profit or loss immediately.
Hedge of net investment in a foreign operation – where aforeign currency liability hedges a net investment in a foreignoperation, the portion of foreign exchange differences arisingon translation of the liability determined to be an effectivehedge is recognised directly in equity. Any ineffective portion isrecognised in profit or loss.
19. Share-based paymentsThe Group grants options over shares in The Royal Bank ofScotland Group plc to its employees under various share optionschemes. The Group has applied IFRS 2 ‘Share-based Payment’to grants under these schemes after 7 November 2002 that hadnot vested on 1 January 2005. The expense for thesetransactions is measured based on the fair value on the date theoptions are granted. The fair value is estimated using valuationtechniques which take into account the option’s exercise price, itsterm, the risk free interest rate and the expected volatility of themarket price of The Royal Bank of Scotland Group plc’s shares.Vesting conditions are not taken into account when measuringfair value, but are reflected by adjusting the number of optionsincluded in the measurement of the transaction such that theamount recognised reflects the number that actually vest. The fairvalue is expensed on a straight-line basis over the vesting period.
20. Investment propertyInvestment property comprises freehold and leaseholdproperties that are held to earn rentals or for capital appreciationor both. It is not depreciated but is stated at fair value based onvaluations by independent registered valuers. Fair value isbased on current prices in an active market for similar propertiesin the same location and condition. Any gain or loss arising froma change in fair value is recognised in profit or loss. Rentalincome from investment property is recognised on a straight-linebasis over the term of the lease. Lease incentives granted arerecognised as an integral part of the total rental income.
21. Cash and cash equivalentsCash and cash equivalents comprises cash and demanddeposits with banks together with short-term highly liquidinvestments that are readily convertible to known amounts ofcash and subject to insignificant risk of change in value.
22. Shares in Group entitiesThe company’s investments in its subsidiaries are stated at costless any impairment.
Critical accounting policies and key sources of estimationuncertaintyThe reported results of the Group are sensitive to theaccounting policies, assumptions and estimates that underliethe preparation of its financial statements. UK company lawand IFRS require the directors, in preparing the Group'sfinancial statements, to select suitable accounting policies,apply them consistently and make judgements and estimatesthat are reasonable and prudent. In the absence of anapplicable standard or interpretation, IAS 8 ‘AccountingPolicies, Changes in Accounting Estimates and Errors’,requires management to develop and apply an accountingpolicy that results in relevant and reliable information in thelight of the requirements and guidance in IFRS dealing withsimilar and related issues and the IASB’s Framework for thePreparation and Presentation of Financial Statements.
The judgements and assumptions involved in the Group’saccounting policies that are considered by the Board to be themost important to the portrayal of its financial condition arediscussed below. The use of estimates, assumptions or modelsthat differ from those adopted by the Group would affect itsreported results.
Loan impairment provisionsThe Group’s loan impairment provisions are established torecognise incurred impairment losses in its portfolio of loansclassified as loans and receivables and carried at amortisedcost. A loan is impaired when there is objective evidence thatevents since the loan was granted have affected expectedcash flows from the loan. The impairment loss is the differencebetween the carrying value of the loan and the present valueof estimated future cash flows at the loan's original effectiveinterest rate.
At 31 December 2005, gross loans and advances tocustomers totalled £421,110 million (2004 – £351,419 million)and customer loan impairment provisions amounted to £3,884million (2004 – £4,168 million).
There are two components to the Group’s loan impairmentprovisions: individual and collective.
Individual component – all impaired loans that exceed specificthresholds are individually assessed for impairment. Individuallyassessed loans principally comprise the Group's portfolio ofcommercial loans to medium and large businesses. Impairmentlosses are recognised as the difference between the carryingvalue of the loan and the discounted value of management’sbest estimate of future cash repayments and proceeds fromany security held. These estimates take into account thecustomer’s debt capacity and financial flexibility; the level andquality of its earnings; the amount and sources of cash flows;the industry in which the counterparty operates; and therealisable value of any security held. Estimating the quantumand timing of future recoveries involves significant judgement.The size of receipts will depend on the future performance ofthe borrower and the value of security, both of which will beaffected by future economic conditions; additionally, collateralmay not be readily marketable. The actual amount of futurecash flows and the date they are received may differ from these

section
03Fi
nanc
ial
stat
emen
ts
143
Acc
ount
ing
polic
ies
Annual Report and Accounts 2005
estimates and consequently actual losses incurred may differfrom those recognised in these financial statements.
Collective component – this is made up of two elements: loanimpairment provisions for impaired loans that are below individualassessment thresholds (collective impaired loan provisions)and for loan losses that have been incurred but have not beenseparately identified at the balance sheet date (latent lossprovisions). These are established on a portfolio basis takinginto account the level of arrears, security, past loss experience,credit scores and defaults based on portfolio trends. The mostsignificant factors in establishing these provisions are theexpected loss rates and the related average life. These portfoliosinclude credit card receivables and other personal advancesincluding mortgages. The future credit quality of these portfoliosis subject to uncertainties that could cause actual credit losses todiffer materially from reported loan impairment provisions. Theseuncertainties include the economic environment, notably interestrates and their effect on customer spending, the unemploymentlevel, payment behaviour and bankruptcy trends.
PensionsThe Group operates a number of defined benefit pensionschemes as described in Note 3 on the financial statements.The assets of the schemes are measured at their fair value atthe balance sheet date. Scheme liabilities are measured usingthe projected unit method, which takes account of projectedearnings increases, using actuarial assumptions that give thebest estimate of the future cash flows that will arise under thescheme liabilities. These cash flows are discounted at theinterest rate applicable to high-quality corporate bonds of thesame currency and term as the liabilities. Any surplus or deficitof scheme assets over liabilities is recognised in the balancesheet as an asset (surplus) or liability (deficit). In determining thevalue of scheme liabilities, assumptions are made as to priceinflation, dividend growth, pension increases, earnings growthand employees. There is a range of assumptions that could beadopted in valuing the schemes’ liabilities. Different assumptionscould significantly alter the amount of the deficit recognised inthe balance sheet and the pension cost charged to the incomestatement. The assumptions adopted for the Group’s pensionschemes are set out in Note 3 on the financial statements. Thepension deficit recognised in the balance sheet at 31December 2005 was £3,735 million (2004 – £2,940 million).
Fair valueFinancial instruments classified as held-for-trading ordesignated as at fair value through profit or loss and financialassets classified as available-for-sale are recognised in thefinancial statements at fair value. All derivatives are measured atfair value. In the balance sheet, financial assets carried at fairvalue are included within Treasury and other eligible bills, Loansand advances to banks, Loans and advances to customers,Debt securities and Equity shares as appropriate. Financialliabilities carried at fair value are included within the captionsDeposits by banks, Customer accounts, Debt securities in issueand Subordinated liabilities. Derivative assets and Derivativeliabilities are shown separately on the face of the balancesheets. Gains or losses arising from changes in fair value offinancial instruments classified as held-for-trading or designatedas at fair value through profit or loss are included in the income
statement. Unrealised gains and losses on available-for-salefinancial assets are recognised directly in equity unless animpairment loss is recognised. The carrying value of a financialasset or a financial liability carried at cost or amortised cost thatis the hedged item in a qualifying hedge relationship isadjusted by the gain or loss attributable to the hedged risk.
Fair value is the amount for which an asset could be exchanged,or a liability settled, between knowledgeable, willing parties inan arm's length transaction. Fair values are determined byreference to observable market prices where available andreliable. Where representative market prices for an instrumentare not available or are unreliable because of poor liquidity, thefair value is derived from prices for its components usingappropriate pricing or valuation models that are based onindependently sourced market parameters, including interestrate yield curves, option volatilities and currency rates.
Financial assets carried at fair value include government, assetbacked and corporate debt securities, reverse repos, loans,corporate equity shares and derivatives. Financial liabilitiescarried at fair value include deposits, repos, short positions insecurities and debt securities issued. Fair value for a substantialproportion of these instruments is based on observable marketprices or derived from observable market parameters. Whereobservable prices are not available, fair value is based onappropriate valuation techniques or management estimates.
The Group’s derivative products include swaps, forwards,futures and options. Exchange traded instruments are valuedusing quoted prices. The fair value of over-the-counterinstruments is derived from pricing models which take accountof contract terms, including maturity, as well as quoted marketparameters such as interest rates and volatilities. Most of theGroup’s pricing models do not entail material subjectivitybecause the methodologies utilised do not incorporatesignificant judgement and the parameters included in themodels can be calibrated to actively quoted market prices.Values established from pricing models are adjusted for creditrisk, liquidity risk and future operational costs.
A negligible proportion of the Group’s trading derivatives arevalued directly from quoted prices, the majority being valuedusing appropriate valuation techniques. The fair value ofsubstantially all securities positions carried at fair value isdetermined directly from quoted prices.
Details of financial instruments carried at fair value are given inNote 34 on the financial statements.
General insurance claimsThe Group makes provision for the full cost of settling outstandingclaims arising from its general insurance business at thebalance sheet date, including claims estimated to have beenincurred but not yet reported at that date and claims handlingexpenses. General insurance claims provisions amounted to£4,913 million at 31 December 2005 (2004 – £4,504 million).
Provisions are determined by management based onexperience of claims settled and on statistical models whichrequire certain assumptions to be made regarding the

144
Acc
ount
ing
polic
ies
incidence, timing and amount of claims and any specificfactors such as adverse weather conditions. In order to calculatethe total provision required, the historical development ofclaims is analysed using statistical methodology to extrapolate,within acceptable probability parameters, the value ofoutstanding claims at the balance sheet date. Also included inthe estimation of outstanding claims are other assumptionssuch as the inflationary factor used for bodily injury claimswhich is based on historical trends and, therefore, allows forsome increase due to changes in common law and statute.Costs for both direct and indirect claims handling expenses arealso included. Outward reinsurance recoveries are accounted forin the same accounting period as the direct claims to which theyrelate. The outstanding claims provision is based on informationavailable to management and the eventual outcome may varyfrom the original assessment. Actual claims experience may differfrom the historical pattern on which the estimate is based andthe cost of settling individual claims may exceed that assumed.
GoodwillThe Group capitalises goodwill arising on the acquisition ofbusinesses, as disclosed in the Accounting policies. Thecarrying value of goodwill as at 31 December 2005 was£18,823 million (2004 – £18,032 million).
Goodwill is the excess of the cost of an acquisition over the fairvalue of its net assets. The determination of the fair value ofassets and liabilities of businesses acquired requires the exerciseof management judgement; for example those financial assetsand liabilities for which there are no quoted prices, and thosenon-financial assets where valuations reflect estimates ofmarket conditions such as property. Different fair values wouldresult in changes to the goodwill arising and to the post-acquisitionperformance of the acquisition. Goodwill is not amortised butis tested for impairment annually or more frequently if events orchanges in circumstances indicate that it might be impaired.
For the purposes of impairment testing goodwill acquired in abusiness combination is allocated to each of the Group’s cash-generating units or groups of cash-generating units expected tobenefit from the combination. Goodwill impairment testinginvolves the comparison of the carrying value of a cash-generating unit or group of cash generating units with itsrecoverable amount. The recoverable amount is the higher of theunit's fair value and its value in use. Value in use is the presentvalue of expected future cash flows from the cash-generatingunit or group of cash-generating units. Fair value is the amountobtainable for the sale of the cash-generating unit in an arm’slength transaction between knowledgeable, willing parties.
Impairment testing inherently involves a number of judgmentalareas: the preparation of cash flow forecasts for periods thatare beyond the normal requirements of management reporting;the assessment of the discount rate appropriate to thebusiness; estimation of the fair value of cash-generating units;and the valuation of the separable assets of each businesswhose goodwill is being reviewed.
Accounting developmentsInternational Financial Reporting StandardsThe International Accounting Standards Board (“IASB”) issued
IFRS 7 ‘Financial Instruments: Disclosures’ in August 2005.The standard replaces IAS 30 ‘Disclosures in the FinancialStatements of Banks and Similar Financial Institutions’ and thedisclosure provisions in IAS 32 ‘Financial Instruments: Disclosureand Presentation’. IFRS 7 requires disclosure of the significanceof financial instruments for an entity’s financial position andperformance and of qualitative and quantitative informationabout exposure to risks arising from financial instruments. Thestandard is effective for annual periods beginning on or after 1January 2007. Earlier application is encouraged.
At the same time the IASB issued an amendment ‘CapitalDisclosures’ to IAS 1 ‘Presentation of Financial Statements’. Itrequires disclosures about an entity's capital and the way it ismanaged. This amendment is also effective for annual periodsbeginning on or after 1 January 2007. Earlier application isencouraged.
The IASB has also issued three amendments to IAS 39‘Financial Instruments: Recognition and Measurement’. Thefirst, ‘Cash Flow Hedge Accounting of Forecast IntragroupTransactions’, published in April 2005, amends IAS 39 topermit the foreign currency risk of a highly probable forecastintragroup transaction to qualify as a hedged item inconsolidated financial statements. The amendment is effectivefor annual periods beginning on or after 1 January 2006.
The second, ‘The Fair Value Option’, published in June 2005,places conditions on the option in IAS 39 to designate on initialrecognition a financial asset or financial liability as at fair valuethrough profit or loss. The amendment is effective for annualperiods beginning on or after 1 January 2006. Earlier applicationis encouraged. The Group has adopted this amendment from 1 January 2005 (see accounting policies on page 136).
The third, ‘Financial Guarantee Contracts’, published in August2005, amends IAS 39 and IFRS 4 ‘Insurance Contracts’. Theamendments define a financial guarantee contract. Theyrequire such contracts to be recorded initially at fair value and subsequently at higher of the provision determined inaccordance with IAS 37 ‘Provisions, Contingent Liabilities and Contingent Assets’ and the amount initially recognisedless amortisation. The amendments are effective for annualperiods beginning on or after 1 January 2006.
In December 2005, the IASB issued amendments to IAS 21‘The Effects of Changes in Foreign Exchange Rates’ to clarifythat a monetary item can form part of the net investment inoverseas operations regardless of the currency in which it isdenominated and that the net investment in a foreign operationcan include a loan from a fellow subsidiary. The amendmentsare effective immediately but have not been endorsed by the EU.
The Group is reviewing IFRS 7 and the amendments to IAS 1and IAS 21 and those to IAS 39 that it has not implemented,to determine their effect on its financial reporting.
US GAAPFor a discussion of recent developments in US GAAP relevantto the Group, see Note 46 on the accounts.
Accounting policies continued

section
03Fi
nanc
ial
stat
emen
ts
145
Con
solid
ated
inco
me
stat
emen
t
Annual Report and Accounts 2005
2005 2004Note £m £m
Interest receivable 21,331 16,632Interest payable (11,413) (7,561)Net interest income 9,918 9,071Fees and commissions receivable 6,750 6,473Fees and commissions payable (1,841) (1,926)Income from trading activities 1 2,343 1,988Other operating income (excluding insurance premium income) 2,953 2,138Insurance premium income 6,076 6,146Reinsurers’ share (297) (499)Non-interest income 15,984 14,320Total income 25,902 23,391Staff costs 5,992 5,188Premises and equipment 1,313 1,177Other administrative expenses 2,816 2,323Depreciation and amortisation 1,825 1,674Operating expenses 2 11,946 10,362Profit before other operating charges 13,956 13,029Insurance claims 4,413 4,565Reinsurers’ share (100) (305)Operating profit before impairment losses 9,643 8,769Impairment losses 1,707 1,485Operating profit before tax 4 7,936 7,284Tax 5 2,378 1,995Profit for the year 5,558 5,289
Profit attributable to:Minority interests 57 177Preference shareholders 6 109 256Ordinary shareholders 5,392 4,856
5,558 5,289
Per 25p ordinary share:Basic earnings 9 169.4p 157.4p
Diluted earnings 9 168.3p 155.9p
Dividends 7 60.6p 52.5p
Consolidated income statementfor the year ended 31 December 2005

Balance sheetsat 31 December 2005
146
Bal
ance
she
ets
Group Company
2005 2004 2005 2004Note £m £m £m £m
Assets Cash and balances at central banks 4,759 4,293 — —Treasury bills and other eligible bills 10 5,538 6,110 — —Loans and advances to banks 11 70,587 61,073 9,122 4,106Loans and advances to customers 12 417,226 347,251 567 305Debt securities 13 120,965 93,908 — —Equity shares 14 9,301 4,723 — —Investments in Group undertakings 15 — — 20,851 21,900Intangible assets 17 19,932 19,242 — —Property, plant and equipment 18 18,053 16,428 — —Settlement balances 6,005 5,682 — —Derivatives at fair value 19 95,663 17,800 55 —Prepayments, accrued income and other assets 20 8,798 11,612 147 318Total assets 776,827 588,122 30,742 26,629
LiabilitiesDeposits by banks 21 110,407 99,883 951 174Customer accounts 22 342,867 283,315 55 —Debt securities in issue 23 90,420 63,999 2,942 1,608Settlement balances and short positions 24 43,988 32,990 — —Derivatives at fair value 19 96,438 18,876 — —Accruals, deferred income and other liabilities 25 14,247 17,648 14 301Retirement benefit liabilities 3 3,735 2,940 — —Deferred taxation liabilities 26 1,695 2,061 — —Insurance liabilities 27 7,212 8,647 — —
Subordinated liabilities 28 28,274 20,366 9,242 5,935
Total liabilities 739,283 550,725 13,204 8,018
Equity *
Minority interests 29 2,109 3,492 — —Shareholders’ equity
Called up share capital 30 826 822 826 822Reserves 31 34,609 33,083 16,712 17,789
Total equity 37,544 37,397 17,538 18,611
Total liabilities and equity 776,827 588,122 30,742 26,629
* includes non-equity minority interests and preference shares in 2004.
The accounts were approved by the Board of directors on 27 February 2006 and signed on its behalf by:
Sir George Mathewson Sir Fred Goodwin Guy WhittakerChairman Group Chief Executive Group Finance Director

section
03Fi
nanc
ial
stat
emen
ts
147
Sta
tem
ents
of
reco
gni
sed
inco
me
and
exp
ense
Annual Report and Accounts 2005
Statements of recognised income and expensefor the year ended 31 December 2005
Group Company
2005 2004 2005 2004Note £m £m £m £m
Available-for-sale investmentsNet valuation gains taken direct to equity 35 —Net profit taken to income on sales (582) —
Cash flow hedgesNet (losses)/gains taken direct to equity (67) 6
Exchange differences on translation of foreign operations 842 (606) — —Actuarial losses on defined benefit plans (799) (1,601) — —Other movements — — — (1)(Expense)/income before tax on items recognised direct in equity (571) (2,207) 6 (1)Tax on items recognised direct in equity 478 465 (2) —Net (expense)/income recognised direct in equity (93) (1,742) 4 (1)Profit for the year 5,558 5,289 2,074 2,874Total recognised income and expense for the year 5,465 3,547 2,078 2,873
Attributable to:Equity holders of the parent 5,355 3,558 2,078 2,873Minority interests 110 (11) — —
5,465 3,547 2,078 2,873
Effect of changes in accounting policies on the implementation of IFRSEquity holders of the parent (1,843) 1,243 (16,759) (15,798)Minority interests (2,878) (321) — —
(4,721) 922 (16,759) (15,798)

148
Cas
h flo
w s
tate
men
ts
Group Company
2005 2004 2005 2004Note £m £m £m £m
Operating activitiesOperating profit before tax 7,936 7,284 1,932 2,890
Adjustments for:Depreciation and amortisation 1,825 1,674 — —Interest on subordinated liabilities 1,271 681 583 318Charge for defined benefit pension schemes 462 397 — —Cash contribution to defined benefit pension schemes (452) (1,146) — —Other non-cash items 338 (767) (16) 1Net cash inflow from trading activities 11,380 8,123 2,499 3,209Changes in operating assets and liabilities (519) (4,264) 2,050 (148)Net cash flows from operating activities before tax 10,861 3,859 4,549 3,061Income taxes (paid)/received (1,911) (1,366) (18) 36Net cash flows from operating activities 36 8,950 2,493 4,531 3,097
Investing activitiesSale and maturity of securities 39,472 43,022 — —Purchase of securities (39,196) (41,790) — —Investment in subsidiaries — — (2,961) (6,342)Sale of property, plant and equipment 2,220 1,921 — —Purchase of property, plant and equipment (4,812) (4,583) — —Net investment in business interests and intangible assets 37 (296) (7,968) — —Loans to subsidiaries — — (337) (350)Repayments to subsidiaries — — 1,183 40Net cash flows from investing activities (2,612) (9,398) (2,115) (6,652)
Financing activitiesIssue of ordinary shares 163 2,845 163 2,845Issue of equity preference shares 1,649 1,358 1,649 1,358Issue of subordinated liabilities 1,234 4,624 337 1,424Proceeds of minority interests acquired 1,264 1,260 — —Costs of minority interests redeemed (121) (2) — —Repayments of subordinated liabilities (1,553) (718) (1,183) (40)Dividends paid (2,007) (1,635) (1,912) (1,488)Interest on subordinated liabilities (1,332) (613) (577) (318)Net cash flows from financing activities (703) 7,119 (1,523) 3,781Effects of exchange rate changes on cash and cash equivalents (3,107) 1,686 (76) —
Net increase in cash and cash equivalents 2,528 1,900 817 226Cash and cash equivalents 1 January 50,021 48,121 309 83Cash and cash equivalents 31 December 52,549 50,021 1,126 309
Cash flow statementsfor the year ended 31 December 2005

section
03Fi
nanc
ial
stat
emen
ts
149
Not
es o
n th
e ac
coun
ts
Annual Report and Accounts 2005
Notes on the accounts
IntroductionIAS 32 ‘Financial Instruments: Disclosure and Presentation’, IAS 39 ‘Financial Instruments: Recognition and Measurement’ and IFRS 4‘Insurance Contracts’ were implemented by the Group on 1 January 2005 and applied prospectively from that date and, as permittedby IFRS, without restating comparatives. Consequently, in the notes on the accounts affected by these standards, comparative datafor 2004 in accordance with previous GAAP have been presented.
1 Income from trading activities Group
2005 2004£m £m
Foreign exchange(1) 683 616Securities
– equities(2) 39 36– debt(3) 1,023 811
Interest rate derivatives(4) 598 5252,343 1,988
Notes:
(1) Includes spot and forward foreign exchange contracts and currency swaps, futures and options and related hedges and funding.
(2) Includes equities, equity derivatives, commodity contracts and related hedges and funding.
(3) Includes debt securities and related hedges and funding.
(4) Includes interest rate swaps, forward rate agreements, interest rate options, interest rate futures and credit derivatives and related hedges and funding.
2 Operating expenses Group
2005 2004£m £m
Administrative expensesStaff costsWages, salaries and other staff costs 5,084 4,421Social security costs 354 295Share-based compensation 44 36Pension costs (see note 3) – defined benefit schemes 462 397– defined contribution schemes 48 39
5,992 5,188Premises and equipment 1,313 1,177Other 2,816 2,323
10,121 8,688Depreciation and amortisationProperty plant and equipment (see note 18) 1,326 1,155Intangible assets (see note 17) 499 519
11,946 10,362
The average number of persons employed by the Group during the year, excluding temporary staff, was 144,900 (2004 – 133,300).

150
Not
es o
n th
e ac
coun
ts
3 Pension costsThe Group operates a number of pension schemes which are predominantly defined benefit schemes whose assets are independent ofthe Group’s finances. In addition to The Royal Bank of Scotland Group Pension Fund (‘Main Scheme’), the Group operates a number ofother UK and overseas pension schemes.
It also provides other post-retirement benefits, principally through subscriptions to private healthcare schemes in the UK and the US andunfunded post-retirement benefit plans. Provision for the costs of these benefits is charged to the income statement over the averageremaining future service lives of the eligible employees. The amounts are not material.
Interim valuations of the Group’s schemes were prepared to 31 December by independent actuaries, using the following assumptions:
Main Scheme All Schemes
Principal actuarial assumptions at 31 December (weighted average) 2005 2004 2005 2004
Discount rate 4.8% 5.4% 4.8% 5.4%Expected return on plan assets 6.5% 6.7% 6.5% 6.8%Rate of increase in salaries 4.0% 4.0% 3.9% 3.9%Rate of increase in pensions in payment 2.7% 2.7% 2.6% 2.7%Inflation assumption 2.7% 2.7% 2.7% 2.7%
The expected return on plan assets at 31 December is based upon the weighted average of the following assumptions of the returns on the major classes of plan assets:
Main Scheme All Schemes
2005 2004 2005 2004
Equities 7.7% 8.1% 7.7% 8.1%Index-linked bonds 4.1% 4.5% 4.1% 4.5%Government fixed interest bonds 4.1% 4.5% 4.1% 4.5%Corporate and other bonds 4.8% 5.4% 4.8% 5.4%Property 5.9% 6.3% 5.9% 6.3%Cash and other assets 4.2% 4.6% 3.7% 4.5%
The expected return on Main Scheme plan assets at 31 December 2004 has been adjusted to reflect the investment, in early January2005, of payments made to the fund on 31 December and included as cash and other assets at that date.
Post-retirement mortality assumptions (Main Scheme) 2005 2004 2003
Longevity at age 60 for current pensioners (years)Males 25.4 25.4 23.5Females 28.2 28.2 25.3
Longevity at age 60 for future pensioners (years)Males 26.2 26.2 24.8Females 29.0 29.0 26.5
Notes on the accounts continued

section
03Fi
nanc
ial
stat
emen
ts
151
Not
es o
n th
e ac
coun
ts
Annual Report and Accounts 2005
Main Scheme All Schemes
Present Presentvalue of value of
Fair value defined Net Fair value defined Netof plan benefit pension of plan benefit pensionassets obligations liability assets obligations liability
Changes in value of net pension liability £m £m £m £m £m £m
At 1 January 2004 11,797 13,594 1,797 12,862 14,898 2,036Currency translation and other adjustments — — — (18) (9) 9Income statement:
Expected return 838 (838) 920 (920)Interest cost 759 759 837 837Current service cost 400 400 469 469Past service cost — — 11 11
838 1,159 321 920 1,317 397Statement of recognised income and expense:
Actuarial gains and losses 392 1,825 1,433 408 2,009 1,601Acquisitions of subsidiaries — — — 45 88 43Contributions by employer 1,069 (1,069) 1,146 (1,146)Contributions by plan participants — — 3 3Benefits paid (494) (494) (534) (534)Expenses included in service cost (33) (33) (34) (34)At 31 December 2004 13,569 16,051 2,482 14,798 17,738 2,940Currency translation and other adjustments — — — 26 26 —Income statement:
Expected return 930 (930) 1,017 (1,017)Interest cost 865 865 953 953Current service cost 447 447 522 522Past service cost 3 3 4 4
930 1,315 385 1,017 1,479 462Statement of recognised income and expense:
Actuarial gains and losses 1,556 2,273 717 1,660 2,459 799Disposal of subsidiaries — — — — (14) (14)Contributions by employer 380 (380) 452 (452)Contributions by plan participants — — 4 4Benefits paid (504) (504) (550) (550)Expenses included in service cost (17) (17) (19) (19)At 31 December 2005 15,914 19,118 3,204 17,388 21,123 3,735
The Group expects to contribute £444 million to its defined benefit pension schemes in 2006 (Main Scheme – £384 million).Of the net pension liability, £104 million (2004 – £95 million) relates to unfunded schemes.

152
Not
es o
n th
e ac
coun
tsNotes on the accounts continued
4 Operating profit before taxOperating profit before tax is stated after taking account of the following: Group
2005 2004£m £m
Income Sales of available-for-sale securities– Gross gains 683– Gross losses (16)– Net profit 667
Sales of investment securities– Gross gains 197– Gross losses (30)– Net profit 167
Dividend income 108 79Share of associated undertakings’ net profit 41 24Rental income from investment properties 250 241Net gains on financial assets and liabilities
designated as at fair value through profit or loss 364
Expenses Interest on subordinated liabilities 1,271 681Direct operating expenses of investment properties 61 72Integration expenditure* relating to:
– acquisition of NatWest 129 280– other acquisitions 329 240
* Integration expenditure comprises:Staff costs 148 83Premises and equipment 39 35Other administrative expenses 131 149Depreciation and amortisation 140 253
458 520
3 Pension costs (continued)
Main Scheme All Schemes
Major plan assets as a percentage of total plan assets 2005 2004 2005 2004
Equities 61.3% 56.7% 61.6% 57.2%Index-linked bonds 18.1% 16.5% 16.8% 15.3%Government fixed interest bonds 1.8% 2.1% 2.6% 2.8%Corporate and other bonds 14.6% 12.5% 14.6% 12.7%Property 3.6% 3.1% 3.7% 3.2%Cash and other assets 0.6% 9.1% 0.7% 8.8%
The pension plan assets include a holding of the company’s ordinary shares with a fair value of £78 million (2004 – £73 million), ofwhich £76 million (2004 – £71 million) are held in the Main Scheme which also holds financial instruments issued by the Group with avalue of £299 million (2004 – £726 million).
Cumulative net actuarial losses of £2,400 million (2004 – £1,601 million) have been recognised in the statement of recognised income and expense, of which £2,150 million (2004 – £1,433 million) relate to the Main Scheme.
Main Scheme All Schemes
2005 2004 2003 2005 2004 2003
History of defined benefit schemes £m £m £m £m £m £m
Present value of defined benefit obligations 19,118 16,051 13,594 21,123 17,738 14,898Fair value of plan assets 15,914 13,569 11,797 17,388 14,798 12,862Net deficit 3,204 2,482 1,797 3,735 2,940 2,036
Experience losses on plan liabilities (41) (624) (68) (631)Experience gains on plan assets 1,556 392 1,660 408Actual return on pension schemes assets 2,486 1,230 2,677 1,328

section
03Fi
nanc
ial
stat
emen
ts
153
Not
es o
n th
e ac
coun
ts
Annual Report and Accounts 2005
Auditors’ remunerationAmounts paid to the auditors for statutory audit and other services were as follows: Group
2005 2004£m £m
Audit services – Statutory audit 9.9 8.2– Audit related including regulatory reporting* 7.0 1.1
16.9 9.3Further assurance services 6.8 3.0Tax services
– Compliance services 0.2 0.2– Advisory services — 0.2
0.2 0.4Other services 0.4 3.0Total 24.3 15.7
* Includes fees relating to the transition to IFRS and work in respect of US Sarbanes-Oxley Act Section 404 reporting requirements.
The auditors’ remuneration for statutory audit of the company was £0.1 million (2004 – £0.1 million). Non–audit fees paid to the auditors and their associates in the UK was £12.4 million (2004 – £6.4 million).
5 Tax Group2005 2004
£m £m
Current taxation:UK corporation tax charge for the year at 30% 2,280 2,091Over provision in respect of prior periods (101) (168)Relief for overseas taxation (171) (212)
2,008 1,711Deferred taxation:Current year charge 477 333Over provision in respect of prior periods (107) (49)Tax charge for the year 2,378 1,995
The actual tax charge differs from the expected tax charge computed by applying the standard rate of UK corporation tax of 30% as follows: 2005 2004
£m £m
Expected tax charge 2,381 2,185Interest on subordinated debt not allowable for tax 79 —Non-deductible items 230 110Non-taxable items (166) (128)Taxable foreign exchange movements (10) (10)Foreign profits taxed at other rates 77 49Unutilised losses brought forward and carried forward (5) 6Adjustments relating to prior periods (208) (217)Actual tax charge for the year 2,378 1,995
(1) Deferred tax assets of £51 million (2004 – £110 million) resulting from tax losses carried forward of £150 million (2004 – £291 million)have not been recognised as it is currently not certain that the assets will be recoverable. These assets may be recoverable if thelosses can be offset against suitable future taxable profits arising in the same tax jurisdiction.

154
Not
es o
n th
e ac
coun
tsNotes on the accounts continued
6 Profit attributable to preference shareholders Group
Dividends paid Finance cost Financeto equity included in cost of
preference interest preferenceshareholders payable shares
2005 2005 2004£m £m £m
Non-cumulative preference shares of US$0.01 58 115 105Non-cumulative convertible preference shares of US$0.01 — 73 90Non-cumulative convertible preference shares of €0.01 — 9 33Non-cumulative preference shares of €0.01 51 — 4Non-cumulative convertible preference shares of £0.01 — 15 15Appropriation for premium payable on redemption and issue costs — 8 9Total(3) 109 220 256
Equity 15Non-equity 241
Notes:
(1) In the year ended 31 December 2005, dividends of £55,000 (2004 – £55,000) were paid on the 11% cumulative preference shares of £1 and dividends of £22,000 (2004 – £22,000) were paid on the 5.5% cumulative preference shares of £1.
(2) Following the implementation of IAS 32 on 1 January 2005, several of the Group’s preference share issues are now included in subordinated liabilities and the finance costthereon is included in interest payable.
(3) Between 1 January 2006 and the date of approval of these accounts, dividends amounting to US$39 million have been declared in respect of equity preference shareholders forpayment on 31 March 2006.
7 Ordinary dividends Group
2005 2004 2005 2004p per share p per share £m £m
Final dividend for previous year declared during the current year 41.2 35.7 1,308 1,059Interim dividend 19.4 16.8 619 529Total dividends paid on ordinary equity shares 60.6 52.5 1,927 1,588
Final dividends are not accounted for until they have been ratified at the Annual General Meeting. At the meeting on 28 April 2006,a dividend in respect of 2005 of 53.1 pence per share (2004 – 41.2 pence per share) amounting to a total of £1.7 billion (2004 –£1.3 billion) is to be proposed. The financial statements for the year ended 31 December 2005 do not reflect this dividend which, ifapproved, will be accounted for in shareholders’ equity as an appropriation of retained profits in the year ending 31 December 2006.
8 Profit dealt with in the accounts of the companyAs permitted by section 230(3) of the Companies Act 1985, the primary financial statements of the company do not include an income statement. Condensed information is set out below:
Company
2005 2004£m £m
Dividends received from banking subsidiary 2,082 3,000Dividends received from other subsidiaries 100 —Total income 2,182 3,000Interest receivable from subsidiaries 577 313Interest payable to subsidiaries (189) (150)Other net interest payable and operating expenses (638) (273)Operating profit before tax 1,932 2,890Tax 142 (16)Profit for the year 2,074 2,874
Profit attributable to:Ordinary shareholders 1,965 2,618Other shareholders 109 256
2,074 2,874

section
03Fi
nanc
ial
stat
emen
ts
155
Not
es o
n th
e ac
coun
ts
Annual Report and Accounts 2005
9 Earnings per ordinary shareThe earnings per share are based on the following: Group
2005 2004£m £m
Earnings:Profit attributable to ordinary shareholders 5,392 4,856Add back dividends on dilutive convertible non-equity shares 65 66Diluted earnings attributable to ordinary shareholders 5,457 4,922
Number of shares – millions
Number of ordinary shares:Weighted average number of ordinary shares in issue during the year 3,183 3,085Effect of dilutive share options and convertible non-equity shares 60 73Diluted weighted average number of ordinary shares during the year 3,243 3,158
All convertible preference shares have a dilutive effect in the current year and as such have been included in the computation ofdiluted earnings per share. In 2004, $1,500 million of convertible preference shares was not included in the computation of dilutedearnings per share as their effect was anti-dilutive.
10 Treasury bills and other eligible bills Group
2005 2004£m £m
Treasury bills and similar securities 5,402 5,538Other eligible bills 136 572
5,538 6,110
Held-for-trading 3,004Available-for-sale 2,534
5,538
11 Loans and advances to banks Group Company
2005 2004 2005 2004£m £m £m £m
Held-for-trading 44,965 —Designated as at fair value through profit or loss 282 —Loans and receivables 25,340 9,122
70,587 61,073 9,122 4,106
Amounts above include:Items in the course of collection from other banks 2,901 2,629Due from subsidiaries 9,122 4,106
12 Loans and advances to customers Group Company
2005 2004 2005 2004£m £m £m £m
Held-for-trading 53,963 —Designated as at fair value through profit or loss 616 —Loans and receivables 350,960 567Finance leases 11,687 —
417,226 347,251 567 305
Amounts above include:Due from subsidiaries 567 305Subordinated advances 220 —

156
Not
es o
n th
e ac
coun
tsNotes on the accounts continued
SecuritisationsThe Group engages in securitisation transactions of itsfinancial assets including commercial and residential mortgageloans, commercial and residential mortgage related securities,US Government agency collateralised mortgage obligations,and other types of financial assets. In such transactions, theassets, or interests in the assets, are transferred generally to aspecial purpose entity which then issues liabilities to thirdparty investors.
Securitisations may, depending on the individual arrangement,result in continued recognition of the securitised assets;continued recognition of the assets to the extent of theGroup’s continuing involvement in those assets; orderecognition of the assets and the separate recognition, asassets or liabilities, of any rights and obligations created orretained in the transfer (see Accounting policy on page 141).The Group has securitisations in each of these categories.
Continued recognitionThe table below sets out the asset categories together the carrying amounts of the assets and associated liabilities.
2005 2004
Assets Liabilities Assets LiabilitiesAsset type £m £m £m £m
Residential mortgages (1, 2) 2,388 2,366 1,519 1,479Finance lease receivables (1, 3) 1,467 1,170 1,897 1,502Other loans (1, 4) 2,189 1,543 1,713 1,313Credit card receivables (5) 2,891 2,836 1,133 1,133Commercial paper conduits (6) 6,688 6,685 4,704 4,696
(1) At 31 December 2004, in accordance with previous GAAP, the financial assets in these categories were derecognised to the extent of non-recourse finance as the arrangementsqualified for the linked presentation.
(2) Mortgages have been transferred to special purpose vehicles, held ultimately by charitable trusts, funded principally through the issue of floating rate notes. The Group hasentered into arm’s length fixed/floating interest rate swaps with the securitisation vehicles and provides mortgage management and agency services to the vehicles. Onrepayment of the financing, any further amounts generated by the mortgages will be paid to the Group. In 2004, the Group recognised net income of £26 million.
(3) Certain finance lease receivables (leveraged leases) involve the Group as lessor obtaining non-recourse funding from third parties. This financing is secured on the underlyingleases and the provider of the finance has no recourse whatsoever to the other assets of the Group. In 2004, the Group recognised net income of £13 million.
(4) Other loans originated by the Group have been transferred to special purpose vehicles funded through the issue of notes. Any proceeds from the loans in excess of the amountsrequired to service and repay the notes are payable to the Group after deduction of expenses. In 2004, the Group recognised net income of £37 million.
(5) Credit card receivables in the UK have been securitised. Notes have been issued by a special purpose vehicle. The note holders have a proportionate interest in a pool of creditcard receivables that have been equitably assigned by the Group to a receivables trust. The Group continues to be exposed to the risks and rewards of the transferredreceivables through its right to excess spread (after charge offs).
(6) The Group sponsors commercial paper conduits. Customer assets are transferred into an SPE which issues notes in the commercial paper market. The Group supplies certainservices and contingent liquidity support to these vehicles on an arm’s length basis as well as programme credit enhancement.
12 Loans and advances to customers (continued)

section
03Fi
nanc
ial
stat
emen
ts
157
Not
es o
n th
e ac
coun
ts
Annual Report and Accounts 2005
Continuing involvementIn certain US securitisations of residential mortgagessubstantially all the risks and rewards have been neithertransferred nor retained, but the Group has retained control, ofthe assets and continues to recognise the assets to the extentof its continuing involvement. Securitised assets were £39.8billion; retained interests £863 million; subordination assets£609 million and related liabilities £609 million.
DerecognitionOther securitisations of the Group’s financial assets in the USqualify for derecognition as substantially all the risks andrewards of the assets have been transferred. The Groupcontinues to recognise any retained interests in thesecuritisation vehicles.
Disclosures are given below about those securitisations offinancial assets undertaken by the Group that resulted inderecognition or recognition to the extent of continuinginvolvement. The Group has classified these securitisations intothree broad categories: US Agency, consumer, and commercialsecuritisations. During 2005, the Group received proceeds ofapproximately £46.3 billion from securitisation trusts inconnection with new securitisations of Group assets and £9.6billion in connection with securitisation of third-party assets.
The Group recognised net pre-tax gains of approximately £182million (2004 – £111 million) relating to these securitisations.Net pre-tax gains are based on the difference between thesales prices and previous carrying values of assets prior todate of sale, are net of transaction costs, and exclude anyresults attributable to hedging activities, interest income,funding costs, and changes in asset values prior to, and inretained interest values subsequent to, the securitisation date.
At 31 December 2005, the fair value of the Group’s retainedinterests was approximately £2.1 billion (2004 – £1.4 billion).These retained interests comprise approximately £1,179 millionin US Agency based retained interests, £764 million in consumerbased retained interests and £128 million in commercial basedretained interests. These retained interests primarily relate tomortgage loans and securities and arose from securitisationsthat have taken place in current and prior years. Cash flowsreceived in 2005 from retained interests held at 31 December2005 in connection with securitisations that took place incurrent and prior years amounted to approximately £481 million (2004 – £383 million).

158
Not
es o
n th
e ac
coun
tsNotes on the accounts continued
Key economic assumptions used in measuring the value of retained interests at the date of securitisation resulting from securitisations completed during the year were as follows:
U.S. Agency Consumer Commercial retained retained retained
Assumptions interests interests interests
Prepayment speed 139 – 690 PSA 16 – 44% CPR (1) 0 – 100 CPY (1)
Weighted average life 1 – 20 years 1 – 10 years 1 – 20 yearsCash flow discount rate 0 – 26% 4 – 90% 5 – 81%Credit losses N/A (3) 0 – 2% CDR (4) N/A (5)
Key economic assumptions and the sensitivity of the current fair value of retained interests at 31 December 2005 to immediate adverse changes, as indicated below, in those assumptions are as follows:
U.S. Agency Consumer Commercial retained retained retained
Assumptions/impact on fair value interests interests interests
Fair value of retained interests at 31 December 2004 £1,179 million £764 million £128 millionPrepayment speed(6) 9 – 25% CPR (1) 16 – 80% CPR (1) 0 – 75 CPY (2)
Impact on fair value of 10% adverse change £0.5 million £26.1 million —Impact on fair value of 20% adverse change £0.6 million £47.1 million —Weighted average life 0 – 19 years 1 – 10 years 1 – 20 yearsCash flow discount rate 0 – 26% 4 – 96% 5 – 81%Impact on fair value of 10% adverse change £33.5 million £23.8 million £4.7 millionImpact on fair value of 20% adverse change £65.1 million £46.0 million £9.1 millionCredit losses N/A (3) 0 – 2% CDR (4) N/A (5)
Impact on fair value of 10% adverse change N/A £10.9 million N/AImpact on fair value of 20% adverse change N/A £19.8 million N/A
Notes:
(1) Constant prepayment rate – the CPR range represents the low and high points of a dynamic CPR curve.
(2) CPR with yield maintenance provision and thus prepayment risk is limited.
(3) Population consists of securities whose collateral is guaranteed by US Government sponsored entities and therefore, no credit loss has been assumed.
(4) Constant default rate.
(5) Population consists of only investment grade senior tranches; therefore, no credit losses are included in the assumptions.
(6) Prepayment speed has been stressed on an overall portfolio basis for US Agency retained interests due to the overall homogeneous nature of the collateral. Consumer andcommercial retained interests have been stressed on a security level basis.
The sensitivities depicted in the preceding table are hypothetical and should be used with caution. The likelihood of those percentvariations selected for sensitivity testing is not necessarily indicative of expected market movements because the relationship of thechange in the assumptions to the change in fair value may not be linear. Also, the effect of a variation in a particular assumption onthe fair value of a retained interest is calculated without changing any other assumptions. This might not be the case in actual marketconditions since changes in one factor might result in changes to other factors. Further, the sensitivities depicted above do notconsider any corrective actions that the Group might take to mitigate the effect of any adverse changes in one or more keyassumptions.
Mortgage-backed securitiesThe Group sells originated mortgage loans to US Agencies inreturn for securities backed by these loans and guaranteed bythe Agency whilst retaining the rights to service the mortgages.These securities may be subsequently sold. The purchaser hasrecourse to the Group for losses up to pre-determined levelson certain designated mortgages. The Group is not obliged,and does not intend, to support losses that may be suffered bythe Agencies. Under the terms of the sale agreements, the
Agencies have agreed to seek repayment only from the cashfrom the mortgage loans. Once the securities exchanged forthe loans have been sold the Group’s exposure is restricted tothe amount of the recourse. At 31 December 2005 mortgagesamounting to £385 million (2004 - £472 million) had been soldwith recourse and the related securities sold. These loanshave been derecognised; they qualified for the linkedpresentation under previous GAAP.
12 Loans and advances to customers (continued)

section
03Fi
nanc
ial
stat
emen
ts
159
Not
es o
n th
e ac
coun
ts
Annual Report and Accounts 2005
13 Debt securities Group
Bank andUK Other Other public building Other
government government sector body society issuers Total2005 £m £m £m £m £m £m
Held-for-trading 4,386 18,073 257 8 57,929 80,653Designated as at fair value through profit or loss 451 7 — 864 2,669 3,991Available-for-sale 662 17,807 40 9,613 7,411 35,533Loans and receivables — — — — 788 788At 31 December 2005 5,499 35,887 297 10,485 68,797 120,965
Available-for-saleGross unrealised gains 9 9 — 7 41 66Gross unrealised losses (7) (277) (1) (6) (64) (355)
2004
Investment securities 757 14,135 309 9,355 10,987 35,543Other securities 1,866 12,457 37 1,701 42,304 58,365At 31 December 2004(1) 2,623 26,592 346 11,056 53,291 93,908
Investment securities:Book value 757 14,135 309 9,355 10,987 35,543Gross unrecognised gains 2 85 1 5 78 171Gross unrecognised losses (22) (44) — (4) (285) (355)Valuation at 31 December 2004 737 14,176 310 9,356 10,780 35,359
(1) Amounts above include subordinated debt securities of £644 million at 31 December 2004.
Listed Unlisted Total2005 £m £m £m
Held-for-trading 41,544 39,109 80,653Designated as at fair value through profit or loss 3,043 948 3,991Available-for-sale 34,074 1,459 35,533Loans and receivables — 788 788At 31 December 2005 78,661 42,304 120,965
2004
Investment securities 25,647 9,896 35,543Other securities 30,946 27,419 58,365At 31 December 2004 56,593 37,315 93,908
The following table shows the Group’s available-for-sale debt securities by remaining maturity and the related yield (based on weightedaverages) as at 31 December 2005.
After 1 but After 5 butWithin 1 year within 5 years within 10 years After 10 years Total
Amount Yield Amount Yield Amount Yield Amount Yield Amount Yield £m % £m % £m % £m % £m %
UK government 111 7.0 357 5.6 187 5.5 7 2.3 662 5.8US government, federal agencies and states 52 2.2 292 2.3 829 1.9 14,976 3.6 16,149 3.5Other government 604 1.9 1,088 4.1 4 5.0 3 4.5 1,699 3.3Corporate debt securities 640 3.8 1,492 3.9 222 4.7 191 5.1 2,545 4.0Mortgage-backed securities 27 4.7 13 6.0 511 5.8 3,230 3.6 3,781 3.9Bank and building society 7,853 4.3 1,567 3.9 156 4.1 37 4.5 9,613 4.3Other 837 3.1 56 2.8 3 6.8 188 4.8 1,084 3.4
Total fair value 10,124 4.1 4,865 4.0 1,912 3.8 18,632 3.6 35,533 3.8

160
Not
es o
n th
e ac
coun
tsNotes on the accounts continued
13 Debt securities (continued)
The table below shows the number and fair value of available-for-sale debt-securities that were in an unrealised loss position at 31 December 2005.
Less than 12 months More than 12 months Total
Gross Gross Grossunrealised unrealised unrealised
Number Fair value losses Fair value losses Fair value lossesIssued by of issues £m £m £m £m £m £m
UK government 9 — — 217 7 217 7US government, federal agencies and states 511 13,390 228 1,475 35 14,865 263Other government 54 1,136 7 149 7 1,285 14Corporates 21 157 3 54 1 211 4Mortgage-backed securities 110 2,797 55 149 4 2,946 59Bank and building society 159 5,417 4 156 2 5,573 6Other 5 — 2 6 — 6 2
869 22,897 299 2,206 56 25,103 355
The Group considers that unrealised losses on available-for-sale debt securities are temporary principally because they reflectchanges in benchmark interest rates.
14 Equity shares Group
2005 2004Listed Unlisted Total Listed Unlisted Total
£m £m £m £m £m £m
Held-for-trading 2,937 4 2,941Designated as at fair value through profit or loss 2,113 428 2,541Available-for-sale 704 3,115 3,819
5,754 3,547 9,301Investment securities 1,213 1,227 2,440Other securities 2,282 1 2,283At 31 December 3,495 1,228 4,723
Available-for-saleGross unrealised gains 168 54 222Gross unrealised losses (5) (8) (13)
163 46 209Investment securities
Book value 1,213 1,227 2,440Gross unrecognised gains 356 169 525Gross unrecognised losses (78) (5) (83)
1,491 1,391 2,882
Unquoted equity investments at cost include £1.8 billion attributable to the Group’s investment in Bank of China which was completedon 31 December 2005. Also included are equity investments in the Federal Home Loans Bank and Federal Reserve Bank that areredeemable at cost (£0.8 billion). The remaining investments at cost cannot be measured reliably and comprised numerous smallshareholdings including those received on trouble debt restructuring. Disposals in the year generated gains of £85 million.
At 31 December 2005 the £13 million gross unrealised losses represented 23 equity issues with fair value of £30 million which were inan unrealised loss position for less than 12 months.

section
03Fi
nanc
ial
stat
emen
ts
161
Not
es o
n th
e ac
coun
ts
Annual Report and Accounts 2005
15 Investments in Group undertakingsInvestments in Group undertakings are carried at cost less impairment. Movements during the year were as follows:
Company
2005 2004£m £m
At 1 January 21,900 15,497Implementation of IAS 32 and IAS 39 on 1 January 2005 (4,004) —Currency translation and other adjustments (6) (399)Additions 2,961 6,802At 31 December 20,851 21,900
The principal subsidiary undertakings of the company are shown below. Their capital consists of ordinary and preference shares which are unlisted with the exception of certain preference shares issued by NatWest. The Royal Bank and RBS Insurance GroupLimited are directly owned by the company, and all of the other subsidiary undertakings are wholly owned directly, or indirectly throughintermediate holding companies, by these companies. All of these subsidiaries are included in the Group’s consolidated financialstatements and have an accounting reference date of 31 December.
Country ofincorporation
Nature of and principalbusiness area of operation
The Royal Bank of Scotland plc Banking Great BritainNational Westminster Bank Plc(1) Banking Great BritainCitizens Financial Group, Inc. Banking USCoutts & Co(2) Private banking Great BritainGreenwich Capital Markets, Inc. Broker dealer USRBS Insurance Group Limited Insurance Great BritainUlster Bank Limited(3) Banking Northern Ireland
Notes:(1) The company does not hold any of the NatWest preference shares in issue.
(2) Coutts & Co is incorporated with unlimited liability. Its registered office is 440 Strand, London WC2R 0Q5.
(3) Ulster Bank Limited and its subsidiary undertakings also operate in the Republic of Ireland.
The above information is provided in relation to the principal related undertakings as permitted by Section 231(5) of the Companies Act 1985. Full information on all related undertakings will be included in the Annual Return filed with the UK Companies House.

162
Not
es o
n th
e ac
coun
tsNotes on the accounts continued
16 Impaired and past-due financial assets Group
Net bookCost Provision value
2005 £m £m £m
Impaired financial assetsLoans and receivables and finance leases 5,926 3,344 2,582Available-for-sale 316 132 184
6,242 3,476 2,766
Group
2005 2004£m £m
Impairment losses charged to the income statementLoans and receivables and finance leases (see table below) 1,703Available-for-sale 4Loans and advances (see table below) 1,402Amounts written-off fixed asset investments 83Total 1,707 1,485
The following table shows impairment losses for loans and receivables and finance leases (2004 – loans and advances).
Group
20042005 Specific General Total
£m £m £m £m
At 1 January 4,174 3,332 553 3,885Implementation of IAS 39 (29) — — —Currency translation and other adjustments 51 (22) (76) (98)Acquisitions — 222 68 290Amounts written-off (1) (2,040) (1,449) — (1,449)Recoveries of amounts previously written-off 172 144 — 144Charged to the income statement 1,703 1,386 16 1,402Unwind of discount (144) — — —At 31 December (2) 3,887 3,613 561 4,174
(1) Amounts written-off during the year include £2 million relating to banks (2004 – nil).
(2) Balance at 31 December 2005 includes £3 million relating to banks (2004 – £6 million).
Loan impairmentAt 31 December 2005, the Group’s non-accrual loans, loans past due 90 days and troubled debt restructurings amounted to £5,937million (2004 – £5,470 million). Loan impairment provisions of £3,344 million (2004 – £3,561 million) were held against these loans.Average non-accrual loans, loans past due 90 days and troubled debt restructurings for the year to 31 December 2005 were £5,923million (2004 – £5,264 million).
IFRS
2005 2004£m £m
Gross income not recognised but which would have beenrecognised under the original terms of non-accrual and restructured loans
Domestic 334 235Foreign 62 58
396 293
Interest on non-accrual and restructured loans included in net interest incomeDomestic 130 58Foreign 14 7
144 65

section
03Fi
nanc
ial
stat
emen
ts
163
Not
es o
n th
e ac
coun
ts
Annual Report and Accounts 2005
17 Intangible assets Group
Core Other Internallydeposit purchased generated
Goodwill intangibles intangibles software Total2005 £m £m £m £m £m
Cost:At 1 January 2005 18,032 268 261 2,089 20,650Currency translation and other adjustments 786 31 30 — 847Acquisition of subsidiaries 113 — — — 113Additions — — 34 329 363Disposals and write-off of fully amortised assets (108) — — (124) (232)At 31 December 2005 18,823 299 325 2,294 21,741
Accumulated amortisation and impairment:At 1 January 2005 — 22 22 1,364 1,408Currency translation and other adjustments — 5 3 — 8Disposals and write-off of fully amortised assets — — — (106) (106)Charge for the year — 58 39 402 499At 31 December 2005 — 85 64 1,660 1,809
Net book value at 31 December 2005 18,823 214 261 634 19,932
2004
Cost:At 1 January 2004 13,131 — — 1,827 14,958Currency translation and other adjustments (518) (18) (2) — (538)Acquisition of subsidiaries 5,435 286 263 — 5,984Additions — — — 303 303Disposals and write-off of fully amortised assets (16) — — (41) (57)At 31 December 2004 18,032 268 261 2,089 20,650
Accumulated amortisation and impairment:At 1 January 2004 — — — 931 931Currency translation and other adjustments — (1) — — (1)Disposals and write-off of fully amortised assets — — — (41) (41)Charge for the year — 23 22 474 519At 31 December 2004 — 22 22 1,364 1,408
Net book value at 31 December 2004 18,032 246 239 725 19,242
The weighted average amortisation period of purchasedintangible assets, other than goodwill, subject to amortisationare:
Years
Core deposit intangibles 6Other purchased intangibles 7
The amortisation expense for each of the next five years iscurrently estimated to be:
£m
2006 1132007 1132008 1132009 672010 20

164
Not
es o
n th
e ac
coun
tsNotes on the accounts continued
Impairment review
Goodwill
Significant Business 2005 (1) 2004Division Acquisition Cash generating unit £m £m Basis of valuation Key assumptions
Corporate Markets NatWest* Core corporate banking 1,888 1,888 (2) EarningsCorporate Markets NatWest* Financial markets 1,563 1,563 (2) EarningsRetail Banking NatWest* NatWest Retail 3,095 2,721(2) EarningsCitizens Mellon Mid-Atlantic 1,209 1,197(1)
Citizens Charter One Charter One 4,471 Value-in-use:(acquired 2004) cash flow
RBS Insurance Churchill Churchill Group 794 775(1) Value-in-use:cash flow
(1) As at 30 September.
(2) As at 1 January 2004.
* Of the overall goodwill arising from the acquisition of NatWest in 2000, £2.7 billion (2004 – £3.1 billion) has been allocated to cash generating units other than those shown above.
** The key valuation parameters are the same as those used to support the Group’s decision to purchase the businesses.
18 Property, plant and equipment Group
Long Short Computers OperatingInvestment Freehold leasehold leasehold and other leaseproperties premises premises premises equipment assets Total
2005 £m £m £m £m £m £m £m
Cost or valuation:At 1 January 2005 4,162 2,878 404 842 3,143 9,447 20,876Currency translation and other adjustments (55) 17 11 18 67 469 527Reclassifications (2) 34 (31) — (1) — —Additions 348 331 25 322 597 3,136 4,759Subsequent expenditure on investment properties 53 — — — — — 53Change in fair value of investment properties 26 — — — — — 26Disposals and write-off of fully depreciated assets (176) (560) (71) (127) (466) (1,372) (2,772)Disposals of subsidiaries (9) (19) — (10) (30) (111) (179)At 31 December 2005 4,347 2,681 338 1,045 3,310 11,569 23,290
Accumulated depreciation and amortisation:At 1 January 2005 — 417 138 280 1,831 1,782 4,448Currency translation and other adjustments — 4 — 6 31 141 182Disposals and write-off of fully depreciated assets — (91) (24) (29) (340) (159) (643)Disposals of subsidiaries — — — (2) (21) (53) (76)Depreciation charge for the year — 60 7 64 390 805 1,326At 31 December 2005 — 390 121 319 1,891 2,516 5,237
Net book value at 31 December 2005 4,347 2,291 217 726 1,419 9,053 18,053
Expected earnings and cash generationmultiples, including control premium
Mellon businesstypical of recenttransactions in thesame regionTerminal growth rateafter year 7**
Allocation ofcommon resources
Terminal growth rateafter year 7**
17 Intangible assets (continued)

section
03Fi
nanc
ial
stat
emen
ts
165
Not
es o
n th
e ac
coun
ts
Annual Report and Accounts 2005
Group
Long Short Computers OperatingInvestment Freehold leasehold leasehold and other leaseproperties premises premises premises equipment assets Total
2004 £m £m £m £m £m £m £m
Cost:At 1 January 2004 4,076 2,635 312 655 2,712 7,537 17,927Currency translation and other adjustments 2 (18) — (10) (42) (184) (252)Reclassifications — 1 (5) (5) 9 — —Acquisition of subsidiaries — 164 32 41 133 487 857Additions 164 589 86 212 691 2,841 4,583Disposals and write-off of fully depreciated assets (80) (493) (21) (51) (360) (1,234) (2,239)At 31 December 2004 4,162 2,878 404 842 3,143 9,447 20,876
Accumulated depreciation and amortisation:At 1 January 2004 — 407 129 280 1,537 1,327 3,680Currency translation and other adjustments — (1) 3 (3) (17) (29) (47)Reclassifications — — — (2) 2 — —Acquisition of subsidiaries — — 5 — 14 28 47Disposals and write-off of fully depreciated assets — (19) (2) (4) (130) (232) (387)Depreciation charge for the year — 30 3 9 425 688 1,155At 31 December 2004 — 417 138 280 1,831 1,782 4,448
Net book value at 31 December 2004 4,162 2,461 266 562 1,312 7,665 16,428
2005 2004£m £m
Contracts for future capital expenditure not provided for in the accounts at the year end (excluding investment properties) 38 447
Contractual obligations to purchase, construct or develop investment properties or to repair, maintain or enhance investment property 4 155
Property, plant and equipment pledged as security 1,250 1,268
Investment properties are valued to reflect fair market value. Valuations are carried out by qualified surveyors who are members ofthe Royal Institution of Chartered Surveyors, or an equivalent overseas body. The 31 December 2005 valuation for a significantmajority of the Group’s investment properties was undertaken by external valuers.
The fair value of investment properties includes £100 million (2004 – £74 million) of appreciation since purchase. This increasewould normally be realised on disposal of the properties. Premises include £84 million (2004 – £570 million) assets in the course of construction.

166
Not
es o
n th
e ac
coun
tsNotes on the accounts continued
Group
Total derivatives
Notional amounts Assets Liabilities2005 £bn £m £m
Exchange rate contractsSpot, forwards and futures 885 10,758 10,214Currency swaps 221 3,228 3,849Options purchased 301 6,438 —Options written 315 — 6,101
Interest rate contractsInterest rate swaps 7,234 65,618 67,156Options purchased 814 5,988 —Options written 719 — 5.557Futures and forwards 1,482 268 325
Credit derivatives 217 1,455 1,355
Equity and commodity contracts 61 1,910 1,88195,663 96,438
Included in the above are cash flow hedging derivatives as follows:Spot, forwards and futures 5 25Interest rate swaps 431 373
Included in the above are fair value hedging derivatives as follows:Interest rate swaps 1,096 676
The company held derivative assets at fair value amounting to £55 million (notional amounts £1 billion).
Companies in the Group enter into various off-balance sheetfinancial instruments (derivatives) as principal either as atrading activity or to manage balance sheet foreign exchangeand interest rate risk. Derivatives include swaps, forwards,futures and options. They may be traded on an organisedexchange (exchange-traded) or over-the-counter (OTC).Holders of exchange traded derivatives are generally requiredto provide margin daily in the form of cash or other collateral.
Swaps include currency swaps, interest rate swaps, creditdefault swaps, total return swaps and equity and equity indexswaps. A swap is an agreement to exchange cash flows in thefuture in accordance with a pre-arranged formula. In currencyswap transactions, interest payment obligations are exchangedon assets and liabilities denominated in different currencies;the exchange of principal may be notional or actual. Interestrate swap contracts generally involve exchange of fixed andfloating interest payment obligations without the exchange ofthe underlying principal amounts.
Forwards include forward foreign exchange contracts andforward rate agreements. A forward contract is a contract tobuy (or sell) a specified amount of a physical or financialcommodity, at agreed price, on an agreed future date.Forward foreign exchange contracts are contracts for thedelayed delivery of currency on a specified future date.Forward rate agreements are contracts under which two
counterparties agree on the interest to be paid on a notionaldeposit of a specified maturity at a specific future date; thereis no exchange of principal.
Futures are exchange-traded forward contracts to buy (or sell)standardised amounts of underlying physical or financialcommodities. The Group buys and sells currency, interest rateand equity futures.
Options include exchange-traded options on currencies,interest rates and equities and equity indices and OTCcurrency and equity options, interest rate caps and floors andswaptions. They are contracts that give the holder the right butnot the obligation to buy (or sell) a specified amount of theunderlying physical or financial commodity at an agreed priceon an agreed date or over an agreed period.
The Group enters into fair value and cash flow hedges andhedges of net investments in foreign operations. Fair valuehedges principally involve interest rate swaps hedging theinterest rate risk in recognised financial assets and financialliabilities. Similarly the majority of the Group’s cash flowhedges relate to exposure to variability in future interestpayments and receipts on forecast transactions and onrecognised financial assets and financial liabilities and hedgedby interest rate swaps for periods of up to 28 years. The Grouphedges its net investments in foreign operations with currencyborrowings.
19 Derivatives at fair value

section
03Fi
nanc
ial
stat
emen
ts
167
Not
es o
n th
e ac
coun
ts
Annual Report and Accounts 2005
Group
Trading derivativesFair value
Notional amounts Assets Liabilities2004 £bn £m £m
Exchange rate contractsSpot, forwards and futures 746 17,133 18,566Currency swaps 178 6,281 6,314Options purchased 243 5,797 —Options written 256 — 5,324
Interest rate contractsInterest rate swaps 4,939 54,964 55,360Options purchased 296 3,168 —Options written 287 — 3,274Futures and forwards 1,091 475 479
Credit derivatives 59 264 285
Equity and commodity contracts 41 1,227 78389,309 90,385
Effect of netting (71,509) (71,509)
17,800 18,876
Non-trading derivativesUnder previous GAAP, hedging derivatives were accounted for in accordance with the treatment of the hedged transaction.As a result any gains or losses on the hedging instrument arising from changes in fair values were not recognised in the profit and loss account immediately but accounted for in the same manner as the hedged item. The Group established such non-trading derivative positions externally with third parties and also internally. The tables below include the components of the internal hedgingprogramme that transferred risks to the trading portfolio or to external third party participants in the derivatives market.
Group
Fair value Book value
Notionalamounts Positive Negative Assets Liabilities
2004 £bn £m £m £m £m
Exchange rate contractsSpot, forwards and futures 21 46 665 35 603Currency swaps and options 5 349 227 234 123
Interest rate contractsInterest rate swaps 121 1,617 1,342 623 650Futures, forwards and options 14 71 318 2 2
Credit derivatives 1 4 11 — 6
Equity and commodity contracts 2 207 62 102 152,294 2,625 996 1,399

168
Not
es o
n th
e ac
coun
tsNotes on the accounts continued
Group
Unrecognised Deferredgains and gains and
losses losses2004 £m £m
As at 1 January 2004 – gains 2,236 213– losses (2,205) (34)
31 179Recognised gains that arose in previous periods (781) (65)Recognised losses that arose in previous periods 537 4Unrecognised gains and losses arising in the year 224 —Unrecognised gains and losses deferred in the year 61 (61)Unrecognised gains and losses deferred and taken to profit or loss in the year — (30)At 31 December 2004 72 27
Of which – gains 1,571 483– losses (1,499) (456)
72 27
Maturity of replacement cost of over-the-counter contracts (trading and non-trading)Replacement cost indicates the Group’s derivatives credit exposure. The following table sets forth the gross positive fair values bymaturity. The replacement cost of internal trades is not included as there is no credit risk associated with them.
Group
Within One to Over one year five years five years Total
2004 £m £m £m £m
Before nettingExchange rate contracts 21,812 5,414 2,018 29,244Interest rate contracts 6,777 24,932 27,287 58,996Credit derivatives — 107 157 264Equity and commodity contracts 604 777 13 1,394
29,193 31,230 29,475 89,898
Financial institutions 70,417Others 19,481
89,898
20 Prepayments, accrued income and other assets Group Company
2005 2004 2005 2004£m £m £m £m
Prepayments 1,274 1,505 — —Accrued income 857 4,541 — 208Deferred expenses 372 898 — —Other assets 6,295 4,668 147 110
8,798 11,612 147 318
Amounts above include:Due from subsidiaries — 313
19 Derivatives at fair value (continued)

section
03Fi
nanc
ial
stat
emen
ts
169
Not
es o
n th
e ac
coun
ts
Annual Report and Accounts 2005
21 Deposits by banks Group Company
2005 2004 2005 2004£m £m £m £m
Held-for-trading 32,067 —Amortised cost 78,340 951
110,407 99,883 951 174
Amounts above include:Items in the course of transmission to other banks 722 802Due to subsidiaries 944 108
22 Customer accounts Group Company
2005 2004 2005 2004£m £m £m £m
Held-for-trading 34,645 —Designated as at fair value through profit or loss (1) 3,683 —Amortised cost 304,539 55
342,867 283,315 55 —
Amounts above include:Due to subsidiaries 55 —
(1) The amounts include insurance linked liabilities with a carrying value of £2,296 million. The carrying amount of other customer accounts designated as at fair value through profitor loss is £114 million greater than amortised cost. No amounts have been recognised in profit or loss for changes in credit risk associated with these liabilities as the changesare immaterial measured as the change in fair value from movements in the period in the credit risk premium payable by the Group.
23 Debt securities in issue Group Company
2005 2004 2005 2004£m £m £m £m
Held-for-trading 1,469 —Designated as at fair value through profit or loss (1) 11,068 —Amortised cost 77,883 2,942
90,420 63,999 2,942 1,608
(1) No amounts have been recognised in profit or loss for changes in credit risk associated with these liabilities as the changes are immaterial measured as the change in fair valuefrom movements in the period in the credit risk premium payable by the Group. The carrying amount is £365 million less than amortised cost.
24 Settlement balances and short positions Group
2005 2004£m £m
Settlement balances – amortised cost 6,561 4,067Short positions – held-for-trading:
Debt securities – Government 30,749 24,619Debt securities – Other issuers 5,355 4,002Treasury bills and other eligible bills 1,178 302Equity shares 145 —
43,988 32,990

170
Not
es o
n th
e ac
coun
tsNotes on the accounts continued
25 Accruals, deferred income and other liabilities Group Company
2005 2004 2005 2004£m £m £m £m
Notes in circulation 1,365 1,351 — —Current taxation 952 662 — 18Accruals 3,875 8,468 13 83Deferred income 3,333 3,095 — —Provisions for liabilities and charges (see table below) 162 198 — —Other liabilities 4,560 3,874 1 200
14,247 17,648 14 301
Amounts above include:Due to subsidiaries 1 150
(1) Other liabilities include £10 million (2004 – £20 million) in respect of share-based compensation.
Group
Property (1) Other (2) TotalProvisions for liabilities and charges £m £m £m
At 1 January 2005 164 34 198Currency translation and other movements 1 (1) —Charge to income statement 7 7 14Releases to income statement (14) (2) (16)Provisions utilised (29) (5) (34)At 31 December 2005 129 33 162
Notes:(1) The Group has a number of leasehold properties where rents payable and other unavoidable costs exceed the value to the Group. Such costs arise over the period of the lease
or to the expected termination date, and the provision has been discounted due to the long-term nature of certain of these obligations.(2) Other provisions arise in the normal course of business.
26 Deferred taxationProvision for deferred taxation has been made as follows: Group Company
2005 2004 2005 2004£m £m £m £m
Deferred tax liability 1,695 2,061 — —Deferred tax asset (included in Prepayments, accrued income and other assets, Note 20) (156) (47) (3) —Net deferred tax 1,539 2,014 (3) —
Group
FairAccelerated value of
capital Deferred Other financialPension allowances Provisions gains transition instruments Intangibles Hedging Other Total
£m £m £m £m £m £m £m £m £m £m
At 1 January 2004 under UK GAAP 75 2,440 (686) 38 — — — — 121 1,988Implementation of IFRS (excluding IAS 32 and IAS 39) (582) (75) — 109 7 — 243 — (2) (300)At 1 January 2004 restated (507) 2,365 (686) 147 7 — 243 — 119 1,688Charge to income statement (68) 419 2 (12) (44) — (79) — 66 284Charge to equity directly (424) (6) 4 — 56 — (2) — 7 (365)Acquisitions of subsidiaries — 514 — 7 (6) — — — — 515Other — (87) 22 — — — — — (43) (108)At 1 January 2005 (999) 3,205 (658) 142 13 — 162 — 149 2,014Implementation of IAS 32 and IAS 39 — — (24) — (288) 65 — 12 — (235)At 1 January 2005 restated (999) 3,205 (682) 142 (275) 65 162 12 149 1,779Charge to income statement 53 433 52 (21) (52) 48 (18) — (125) 370Charge to equity directly (238) — — — — (217) — (59) (39) (553)Other 2 15 (34) — — (4) 4 2 (42) (57)At 31 December 2005 (1,182) 3,653 (664) 121 (327) (108) 148 (45) (57) 1,539

section
03Fi
nanc
ial
stat
emen
ts
171
Not
es o
n th
e ac
coun
ts
Annual Report and Accounts 2005
Company
Total*£m
At 1 January 2004 and 1 January 2005 —Implementation of IAS 32 and IAS 39 (5)At 1 January 2005 restated (5)Charge to equity directly 2At 31 December 2005 (3)
*All relates to hedging.
27 Insurance liabilities
Group
2005 2004 £m £m
Life assurance business:Unit linked insurance contracts 325 306Other insurance contracts 1,974 1,735Investment contracts — 2,102
General insurance business 4,913 4,5047,212 8,647
General insurance business
(i) Claims and loss adjustment expenses
Group
Gross Reinsurance Net £m £m £m
Notified claims 2,812 (481) 2,331Incurred but not reported 1,087 (140) 947At 1 January 2004 3,899 (621) 3,278Cash paid for claims settled in the year (3,198) 462 (2,736)Increase in liabilities
– arising from current year claims 3,943 (484) 3,459– arising from prior year claims (139) 217 78
Net exchange differences (1) (1) (2)At 31 December 2004 4,504 (427) 4,077
Notified claims 3,137 (296) 2,841Incurred but not reported 1,367 (131) 1,236At 1 January 2005 4,504 (427) 4,077Cash paid for claims settled in the year (3,474) 147 (3,327)Increase in liabilities
– arising from current year claims 4,220 (96) 4,124– arising from prior year claims (344) 29 (315)
Net exchange differences 7 (1) 6At 31 December 2005 4,913 (348) 4,565
Notified claims 3,465 (208) 3,257Incurred but not reported 1,448 (140) 1,308At 31 December 2005 4,913 (348) 4,565

172
Not
es o
n th
e ac
coun
ts
(ii) Provisions for unearned premiums and unexpired short term insurance risks
Group
Gross Reinsurance Net Unearned premium provision £m £m £m
At 1 January 2004 2,472 (125) 2,347Increase in the year 423 — 423Release in the year — 27 27At 31 December 2004 2,895 (98) 2,797Release in the year (12) 71 59At 31 December 2005 2,883 (27) 2,856
Performance of life business (life contracts) in 2005Group
2005£m
Opening net assets 772New business contribution 34Profit from existing business:
Expected return 16Experience variances (13)
3Investment return variances 7Economic assumption changes (15)Other 23Closing net assets 824
New business contribution represents the present value of future profits on new insurance contract business written during the year.
Movement in provision for liabilities under life contracts and investment contracts (net of reinsurance)
Group
Life Investmentcontracts contracts
£m £m
At 1 January 2005 2,041 2,102Implementation of IAS 32, IAS 39 and IFRS 4 on 1 January 2005 47Premiums received 429 86Fees and expenses (11) (21)Investment return 252 333Actuarial adjustments (91) —Account balances paid on surrender and other terminations in the year (368) (204)At 31 December 2005 2,299 2,296
Following implementation of IFRS 4 ‘Insurance Contracts’ on 1 January 2005, investment contracts have been reclassified as customer accounts.
Changes in assumptions during the year were not material to the profit recognised.
Notes on the accounts continued
27 Insurance liabilities (continued)

section
03Fi
nanc
ial
stat
emen
ts
173
Not
es o
n th
e ac
coun
ts
Annual Report and Accounts 2005
2005 2004Assets backing unit-linked liabilities £m £m
Debt securities 1,497 1,491Equity securities 2,217 1,887Other investments 8 14Cash and cash equivalents 49 65
The associated liabilities are:Unit-linked contracts classified as insurance contracts 1,640 1,514Unit-linked contracts classified as investment contracts (within customer deposits) 2,131 1,943
There are no options and guarantees relating to life assurance contracts that could in aggregate have a material effect on theamount, timing and uncertainty of the Group’s future cash flows.
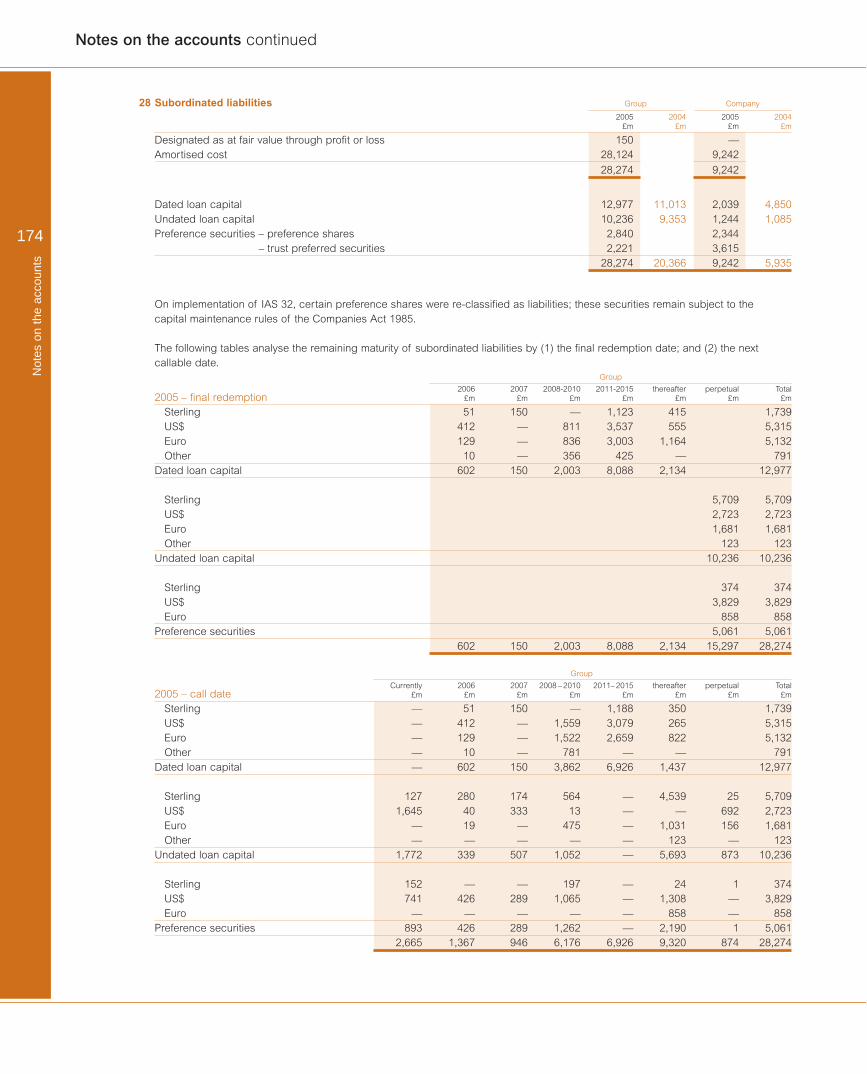
174
Not
es o
n th
e ac
coun
ts
28 Subordinated liabilities Group Company
2005 2004 2005 2004£m £m £m £m
Designated as at fair value through profit or loss 150 —Amortised cost 28,124 9,242
28,274 9,242
Dated loan capital 12,977 11,013 2,039 4,850Undated loan capital 10,236 9,353 1,244 1,085Preference securities – preference shares 2,840 2,344
– trust preferred securities 2,221 3,61528,274 20,366 9,242 5,935
On implementation of IAS 32, certain preference shares were re-classified as liabilities; these securities remain subject to the capital maintenance rules of the Companies Act 1985.
The following tables analyse the remaining maturity of subordinated liabilities by (1) the final redemption date; and (2) the nextcallable date.
Group
2006 2007 2008-2010 2011-2015 thereafter perpetual Total2005 – final redemption £m £m £m £m £m £m £m
Sterling 51 150 — 1,123 415 1,739US$ 412 — 811 3,537 555 5,315Euro 129 — 836 3,003 1,164 5,132Other 10 — 356 425 — 791
Dated loan capital 602 150 2,003 8,088 2,134 12,977
Sterling 5,709 5,709US$ 2,723 2,723Euro 1,681 1,681Other 123 123
Undated loan capital 10,236 10,236
Sterling 374 374US$ 3,829 3,829Euro 858 858
Preference securities 5,061 5,061602 150 2,003 8,088 2,134 15,297 28,274
Group
Currently 2006 2007 2008 – 2010 2011– 2015 thereafter perpetual Total2005 – call date £m £m £m £m £m £m £m £m
Sterling — 51 150 — 1,188 350 1,739US$ — 412 — 1,559 3,079 265 5,315Euro — 129 — 1,522 2,659 822 5,132Other — 10 — 781 — — 791
Dated loan capital — 602 150 3,862 6,926 1,437 12,977
Sterling 127 280 174 564 — 4,539 25 5,709US$ 1,645 40 333 13 — — 692 2,723Euro — 19 — 475 — 1,031 156 1,681Other — — — — — 123 — 123
Undated loan capital 1,772 339 507 1,052 — 5,693 873 10,236
Sterling 152 — — 197 — 24 1 374US$ 741 426 289 1,065 — 1,308 — 3,829Euro — — — — — 858 — 858
Preference securities 893 426 289 1,262 — 2,190 1 5,0612,665 1,367 946 6,176 6,926 9,320 874 28,274
Notes on the accounts continued

section
03Fi
nanc
ial
stat
emen
ts
175
Not
es o
n th
e ac
coun
ts
Annual Report and Accounts 2005
Group
2005 2006 2007-2009 2010-2014 thereafter perpetual Total2004 – final redemption £m £m £m £m £m £m £m
Sterling 165 — 150 486 913 — 1,714US$ 206 54 719 2,410 850 — 4,239Euro — — 391 2,621 1,645 — 4,657Other — — — 403 — — 403
Dated loan capital 371 54 1,260 5,920 3,408 — 11,013
Sterling 5,308 5,308US$ 2,372 2,372Euro 1,509 1,509Other 164 164
Undated loan capital 9,353 9,353371 54 1,260 5,920 3,408 9,353 20,366
Group
Currently 2005 2006 2007-2009 2010– 2014 thereafter perpetual Total2004 – call date £m £m £m £m £m £m £m £m
Sterling — 165 301 150 250 848 1,714US$ — 206 54 1,387 2,000 592 4,239Euro — — — 1,095 2,268 1,294 4,657Other — — — 403 — — 403
Dated loan capital — 371 355 3,035 4,518 2,734 11,013
Sterling — — 125 150 1,347 3,686 — 5,308US$ 1,316 44 103 255 — — 654 2,372Euro — — — 458 1,051 — — 1,509Other — — — — — 164 — 164
Undated loan capital 1,316 44 228 863 2,398 3,850 654 9,3531,316 415 583 3,898 6,916 6,584 654 20,366

176
Not
es o
n th
e ac
coun
tsNotes on the accounts continued
28 Subordinated liabilities (continued) Company
2006 2007 2008-2010 2011-2015 thereafter perpetual Total2005 – final redemption £m £m £m £m £m £m £m
Dated loan capital – US$ 33 — 232 1,572 202 2,039
Undated loan capital – US$ 1,244 1,244
Sterling 198 198US$ 4,567 4,567Euro 1,194 1,194
Preference securities 5,959 5,95933 — 232 1,572 202 7,203 9,242
Company
Currently 2006 2007 2008 – 2010 2011– 2015 thereafter perpetual Total2005 – call date £m £m £m £m £m £m £m £m
Dated loan capital – US$ — 33 — 232 1,572 202 — 2,039
Undated loan capital – US$ 484 24 44 — — — 692 1,244
Sterling — — — 197 — — 1 198US$ 595 371 115 1,065 — 2,421 — 4,567Euro — — — — — 1,194 — 1,194
Preference securities 595 371 115 1,262 — 3,615 1 5,9591,079 428 159 1,494 1,572 3,817 693 9,242
Company
2005 2006 2007-2009 2010-2014 thereafter perpetual Total2004 – final redemption £m £m £m £m £m £m £m
Sterling 40 — — — — — 40US$ — — 589 2,486 860 — 3,935Euro — — — 875 — — 875
Dated loan capital 40 — 589 3,361 860 — 4,850
Undated loan capital – US$ — — — — — 1,085 1,08540 — 589 3,361 860 1,085 5,935
Company
Currently 2005 2006 2007– 2009 2010– 2014 thereafter Perpetual Total2004 – call date £m £m £m £m £m £m £m £m
Sterling — 40 — — — — — 40US$ — — — 589 2,486 860 — 3,935Euro — — — — 875 — — 875
Dated loan capital — 40 — 589 3,361 860 — 4,850
Undated loan capital – US$ 284 44 103 — — — 654 1,085284 84 103 589 3,361 860 654 5,935
Notes:
(1) In the event of certain changes in tax laws, dated and undated loan capital issues may be redeemed in whole, but not in part, at the option of the Group, at the principal amountthereof plus accrued interest, subject to prior regulatory approval.
(2) At 31 December 2004 the principle amounts payable to dated and undated loan note holders would not have been materially different from the carrying amount.
(3) On 30 November 2005, the company gave notice of redemption of 8 million Exchangeble Capital Securities, Series A, of US$25 each on 31 December 2005.This occurred on the next banking day, 3 January 2006. On 15 December 2005, NatWest gave notice of redemption of 20 million Exchangeble Capital Securities, Series A,of US$25 each on 17 January 2006.

section
03Fi
nanc
ial
stat
emen
ts
177
Not
es o
n th
e ac
coun
ts
Annual Report and Accounts 2005
29 Minority interests Group
2005 2004£m £m
At 1 January 3,492 2,392Implementation of IAS 32 and IAS 39 on 1 January 2005 (2,541) —Currency translation adjustments and other movements 53 (188)Profit attributable to minority interests 57 177Dividends paid (95) (147)Equity raised 1,264 1,260Equity withdrawn (121) (2)At 31 December 2,109 3,492
Equity minority interests at 31 December 2004 were £158 million.
30 Share capital Allotted, called up and fully paid Authorised
1 January Issued during 31 December 31 December 31 December2005 the year 2005 2005 2004
£m £m £m £m £m
Equity sharesOrdinary shares of 25p 793 6 799 1,270 1,020Non-voting deferred shares of £0.01 27 — 27 323 323Total equity share capital 820 6 826 1,593 1,343
Non-equity sharesAdditional Value Shares of £0.01 — — — 27 27Non-cumulative preference shares of US$0.01 1 — 1 2 2Non-cumulative convertible preference shares of US$0.01 — — — — —Non-cumulative preference shares of €0.01 — — — — —Non-cumulative convertible preference shares of €0.01 — — — — —Non-cumulative convertible preference shares of £0.25 — — — 225 225Non-cumulative convertible preference shares of £0.01 — — — — —Cumulative preference shares of £1 1 — 1 1 1Non-cumulative preference shares of £1 — — — 300 300Total non-equity share capital 2 — 2 555 555Total share capital 822 6 828 2,148 1,898
Allotted, called up and fully paid Authorised
Number of shares – thousands 2005 2004 2005 2004
Equity sharesOrdinary shares of 25p 3,196,544 3,172,605 5,079,375 4,079,375Non-voting deferred shares of £0.01 2,660,556 2,660,556 32,300,000 32,300,000
Non-equity sharesAdditional Value Shares of £0.01 — — 2,700,000 2,700,000Non-cumulative preference shares of US$0.01 206,000 153,000 419,500 348,500Non-cumulative convertible preference shares of US$0.01 1,000 1,900 3,900 3,900Non-cumulative preference shares of €0.01 2,500 1,250 66,000 66,000Non-cumulative convertible preference shares of €0.01 — 750 3,000 3,000Non-cumulative convertible preference shares of £0.25 — — 900,000 900,000Non-cumulative convertible preference shares of £0.01 200 200 1,000 1,000Cumulative preference shares of £1 900 900 900 900Non-cumulative preference shares of £1 — — 300,000 300,000

178
Not
es o
n th
e ac
coun
tsNotes on the accounts continued
Ordinary sharesThe following issues of ordinary shares were made during theyear ended 31 December 2005:
(a) 13.5 million ordinary shares following the exercise ofoptions under the company’s executive, sharesave andoption 2000 schemes and a further 0.7 million ordinaryshares in respect of the exercise of options under theNatWest executive and sharesave schemes which hadbeen exchanged for options over the company’s sharesfollowing the acquisition of NatWest in 2000;
(b) 7.4 million ordinary shares in lieu of cash in respect of thefinal dividend for the year ended 31 December 2004 andthe interim dividend for the year ended 31 December2005; and
(c) 2.3 million ordinary shares under the company’s employeeshare ownership plan.
Consideration of £163 million was received on the issue ofordinary shares for cash and dividends of £124 million weresatisfied by the issue of shares.
During the year to 31 December 2005, options were grantedover 17.3 million ordinary shares under the company’sexecutive, sharesave and option 2000 schemes. At 31December 2005, options granted under the company’s variousschemes, exercisable up to 2015 at prices ranging from 496p to1841p per share, were outstanding in respect of 70.8 millionordinary shares.
In addition, options granted under the NatWest schemes wereoutstanding in respect of 0.8 million ordinary shares exercisableup to 2009 at prices ranging from 403p to 924p per share.
Preference sharesIn March 2005, the company redeemed 750,000 Series 1 non-cumulative convertible preference shares of €0.01 each at€1,000 per share and 500,000 Series 2 non-cumulativeconvertible preference shares of US$0.01 each at US1,000 per share.
In May 2005, the company issued 40 million Series N non-cumulative preference shares of US$0.01 each at US$25 pershare, the net proceeds being US$969 million.
In June 2005, the company issued 1.25 million Series 2 non-cumulative preference shares of €0.01 each at €1,000 pershare, the net proceeds being €1,226 million.
In November 2005, the company issued 22 million Series Pnon-cumulative preference shares of US$0.01 each at US$25per share, the net proceeds being US$533 million andredeemed 9 million Series J non-cumulative preference sharesof US$0.01 each at US$25 per share.
In December 2005, the company redeemed 400,000 Series 3non-cumulative convertible preference shares of US$0.01 eachat US$1,000 per share.
The costs of issue and discounts allowed on preferenceshares issued during the year were £42 million.
Under IFRS, certain of the Group's preference shares are classified as debt and are now included in subordinated liabilities on thebalance sheet. The following table shows the re-classification of the Group’s non-equity shares at 31 December 2004 in to equity sharesand subordinated liabilities (see Note 28) upon implementation of IAS 32 on 1 January 2005. All preference share capital redeemedduring the year was classified as debt and all capital issued during the year is classified as equity in accordance with IAS 32.
31 December 2004 1 January 2005
Adjustment toNon-equity historic cost Equity Debt
Share capital and share premium £m £m £m £m
Non-cumulative preference shares of US$0.01 1,951 35 499 1,487Non-cumulative convertible preference shares of US$0.01 978 — — 978Non-cumulative preference shares of €0.01 864 (4) 860 —Non-cumulative convertible preference shares of €0.01 529 — — 529Non-cumulative convertible preference shares of £0.01 197 — — 197Cumulative preference shares of £1 1 — — 1
4,520 31 1,359 3,192
30 Share capital (continued)

Annual Report and Accounts 2005
Non-cumulative preference sharesNon-cumulative preference shares entitle the holders thereof to receive periodic non-cumulative cash dividends at specified fixed ratesfor each Series payable out of distributable profits of the company.
The non-cumulative preference shares are redeemable at the option of the company, in whole or in part from time to time at the ratesdetailed below plus dividends otherwise payable for the then current dividend period accrued to the date of redemption.
Number Redemption Redemption of shares date on price
Class of preference share Series in issue or after per share
Non-cumulative preference shares of US$0.01 Series D 7 million 14 September 2005 US$25.00Series E 8 million 17 October 2006 US$25.00Series F 8 million 31 March 2007 US$25.00Series G 10 million 31 March 2003 US$25.00Series H 12 million 31 March 2004 US$25.00Series I 12 million 30 September 2004 US$25.00
Series K 16 million 30 June 2006 US$25.00Series L 34 million 30 September 2009 US$25.00Series M 37 million 30 September 2009 US$25.00Series N 40 million 30 June 2010 US$25Series P 22 million 31 December 2010 US$25
Non-cumulative convertible preference shares of US$0.01 Series 1 1 million 31 March 2010 US$1,000Non-cumulative preference shares of €0.01 Series 1 1.25 million 31 December 2009 €1,000
Series 2 1.25 million 30 June 2010 €1,000Non-cumulative convertible preference shares of £0.01 Series 1 0.2 million 31 December 2010 £1,000
In the event that the non-cumulative convertible preferenceshares are not redeemed on or before the redemption date, theholder may convert the non-cumulative convertible preferenceshares into ordinary shares in the company.
Under existing arrangements, no redemption or purchase ofany non-cumulative preference shares may be made by thecompany without the prior consent of the UK FinancialServices Authority.
On a winding-up or liquidation of the company, the holders ofthe non-cumulative preference shares will be entitled toreceive, out of any surplus assets available for distribution tothe company’s shareholders (after payment of arrears ofdividends on the cumulative preference shares up to the dateof repayment) pari passu with the cumulative preferenceshares, the non-cumulative sterling preference shares and allother shares of the company ranking pari passu with the non-cumulative preference shares as regards participation in thesurplus assets of the company, a liquidation distribution ofUS$25 per non-cumulative preference share of US$0.01,US$1,000 per non-cumulative convertible preference share ofUS$0.01, €1,000 per non-cumulative preference share of€0.01 and £1,000 per non-cumulative convertible preferenceshare of £0.01, together with an amount equal to dividends forthe then current dividend period accrued to the date ofpayment, before any distribution or payment may be made toholders of the ordinary shares as regards participation in thesurplus assets of the company.
Except as described above, the holders of the non-cumulativepreference shares have no right to participate in the surplusassets of the company.
Holders of the non-cumulative preference shares are notentitled to receive notice of or attend general meetings of thecompany except if any resolution is proposed for adoption bythe shareholders of the company to vary or abrogate any ofthe rights attaching to the non-cumulative preference shares orproposing the winding-up or liquidation of the company. In anysuch case, they are entitled to receive notice of and to attendthe general meeting of shareholders at which such resolutionis to be proposed and will be entitled to speak and vote onsuch resolution (but not on any other resolution). In addition, inthe event that, prior to any general meeting of shareholders,the company has failed to pay in full the three most recentquarterly dividend payments due on the non-cumulative dollarpreference shares, the two most recent semi-annual dividendpayments due on the non-cumulative convertible dollarpreference shares and the most recent annual dividendpayments due on the non-cumulative convertible europreference shares and on the non-cumulative convertiblesterling preference shares, the holders shall be entitled toreceive notice of, attend, speak and vote at such meeting on allmatters together with the holders of the ordinary shares, and inthese circumstances only, the rights of the holders of the non-cumulative preference shares so to vote shall continue until thecompany shall have resumed the payment in full of thedividends in arrears.
section
03Fi
nanc
ial
stat
emen
ts
179
Not
es o
n th
e ac
coun
ts

180
Not
es o
n th
e ac
coun
tsNotes on the accounts continued
31 Reserves Group Company
2005 2004 2005 2004£m £m £m £m
Share premium accountAt 1 January 12,964 8,175 12,964 8,175Reclassification of preference shares on implementation
of IAS 32 on 1 January 2005 (3,159) — (3,159) —Currency translation adjustments — (231) — (231)Shares issued during the year 1,972 4,550 1,972 4,550Conversion of exchangeable undated loan capital — 460 — 460Other movements — 10 — 10At 31 December 11,777 12,964 11,777 12,964
Merger reserveAt 1 January and 31 December 10,881 10,881 — —
Available-for-sale reserveImplementation of IAS 32 and IAS 39 on 1 January 2005 289 —Currency translation adjustments 4 —Unrealised gains in the year 35 —Realised gains in the year (582) —Taxation 181 —At 31 December (73) —
Cash flow hedging reserveImplementation of IAS 32 and IAS 39 on 1 January 2005 67 (13)Unrealised (losses)/gains in the year (67) 6Taxation 59 (2)At 31 December 59 (9)
Foreign exchange reserveAt 1 January (320) 90 — —Retranslation of net assets 1,588 (830) — —Foreign currency (losses)/gains on hedges of net assets (799) 420 — —At 31 December 469 (320) — —
Other reservesAt 1 January 150 157 150 157Own shares held in relation to employee share schemes — (7) — (7)At 31 December 150 150 150 150
Retained earningsAt 1 January 9,408 7,269 4,675 3,646Implementation of IAS 32 and IAS 39 on 1 January 2005 (1,078) — 81 —Currency translation adjustments and other movements — (8) — (1)Profit attributable to ordinary and equity preference shareholders 5,501 5,112 2,074 2,874Ordinary dividends paid (1,927) (1,588) (1,927) (1,588)Equity preference dividends paid (109) — (109) —Preference dividends – non-equity — (256) — (256)Share-based payments, net of tax 112 15 — —Actuarial losses recognised in post-retirement benefit schemes, net of tax (561) (1,136) — —At 31 December 11,346 9,408 4,794 4,675
Reserves at 31 December 34,609 33,083 16,712 17,789

section
03Fi
nanc
ial
stat
emen
ts
181
Not
es o
n th
e ac
coun
ts
Annual Report and Accounts 2005
UK law prescribes that only reserves of the company are taken into account for the purpose of making distributions and the permissibleapplications of the share premium account. The merger reserve arose on the acquisition of NatWest under UK GAAP accounting.
The Group optimises capital efficiency by maintaining reserves in subsidiaries, including regulated entities. Certain preference sharesand subordinated debt are also included within regulatory capital. The remittance of reserves to the parent or the redemption of sharesor subordinated capital by regulated entities may be subject to maintaining the capital resources required by the relevant regulator.
At 31 December 2005, 680,966 (2004 – 707,247) ordinary shares of 25p each of the company were held by the 1992 EmployeeShare Trust and 91,951 (2004 – 63,098) ordinary shares of 25p each were held by the 2001 Employee Share Trust in respect ofoptions under the executive option scheme and awards under the medium term performance plan.
32 LeasesMinimum amounts receivable and payable under non-cancellable leases Group
Year in which receipt or payment will occur
After 1 yearWithin 1 but within After 5
year 5 years years Total2005 £m £m £m £m
Finance lease assets:Amounts receivable 1,297 4,733 11,604 17,634Present value adjustment (462) (1,857) (3,628) (5,947)Other movements (26) (136) (231) (393)Present value amounts receivable 809 2,740 7,745 11,294
Operating lease assets:Amounts receivable 954 2,757 2,241 5,952
Operating lease obligations:Amounts payable:Premises 310 1,103 1,700 3,113Equipment 10 11 — 21
320 1,114 1,700 3,134
2004
Finance lease assets:Amounts receivable 1,382 4,110 10,901 16,393Present value adjustment (515) (2,127) (4,362) (7,004)Other movements (50) (170) (446) (666)Present value amounts receivable 817 1,813 6,093 8,723
Operating lease assets:Amounts receivable 833 1,895 2,493 5,221
Operating lease obligations:Amounts payable:Premises 316 1,114 2,246 3,676Equipment 12 18 — 30
328 1,132 2,246 3,706

182
Not
es o
n th
e ac
coun
tsNotes on the accounts continued
32 Leases (continued)2005 2004
£m £m
Nature of operating lease assets in balance sheetTransportation 7,742 6,185Cars and light commercial vehicles 978 895Other 333 585
9,053 7,665
Amounts recognised as income and expenseFinance lease receivables – contingent rental income (34) (51)Operating lease payables – minimum payments 332 319
Contracts for future capital expenditure not provided for at the year endOperating leases 594 423
Finance lease receivablesUnearned finance income 5,947 7,004Accumulated allowance for uncollectable minimum lease receivables 72 68
Residual value exposuresThe tables below give details of the unguaranteed residual values included in the carrying value of finance lease receivables (see page 181) and operating lease assets (see note 18).
Year in which residual value will be recovered
After 1 year After 2 yearsWithin 1 but within but within After 5
year 2 years 5 years years Total2005 £m £m £m £m £m
Operating leasesTransportation 579 912 895 3,229 5,615Cars and light commercial vehicles 612 115 77 — 804Other 26 21 84 21 152
Finance leases 26 32 104 231 3931,243 1,080 1,160 3,481 6,964
2004
Operating leasesTransportation 65 400 1,257 2,527 4,249Cars and light commercial vehicles 403 141 116 — 660Other 27 4 51 44 126
Finance leases 50 56 114 446 666545 601 1,538 3,017 5,701

section
03Fi
nanc
ial
stat
emen
ts
183
Not
es o
n th
e ac
coun
ts
Annual Report and Accounts 2005
33 Collateral
Securities repurchase agreements and lending transactionsThe Group enters into securities repurchase agreements and securities lending transactions under which it receives or transferscollateral in accordance with normal market practice. Under standard terms for repurchase transactions in the UK and US markets,the recipient of collateral has an unrestricted right to sell or repledge it, subject to returning equivalent securities on settlement ofthe transaction.
Securities transferred under repurchase transactions included within securities on the balance sheet were as follows:
2005 2004£m £m
Treasury and other eligible bills 896 1,593Debt securities 53,485 32,129
54,381 33,722
All of the above securities could be sold or repledged by the holder. Securities received as collateral under reverse repurchaseagreements amounted to £105.6 billion (2004 – £91.4 billion), of which £85.6 billion (2004 – £85.1 billion) had been resold or repledgedas collateral for the Group's own transactions.
Other collateral given
2005 2004Assets charged as security for liabilities £m £m
Loans and advances to customers 27,092 16,071Debt securities 9,578 4,852Property, plant and equipment 1,274 1,268Loans to banks 60 —Other 16 4
38,020 22,195
2005 2004Liabilities secured by charges on assets £m £m
Deposits by banks 11,407 5,628Customer accounts 6,761 2,001Debt securities in issue 11,347 6,561Other liabilities 20 —
29,535 14,190

184
Not
es o
n th
e ac
coun
ts
34 Financial instruments
Notes on the accounts continued
Financial risk management policies and objectives
The Board establishes the overall governance framework forrisk management and sets the risk appetite and philosophy forthe Group.
The principal financial risks that the Group manages are as follows:
• Credit risk: credit risk is the risk arising from the possibilitythat the Group will incur losses from the failure of customersto meet their obligations.
• Liquidity risk: the risk that the Group is unable to meet its’obligations as they fall due.
• Market risk: the Group is exposed to market risk because ofpositions held in its trading portfolios and its non-tradingbusinesses.
• Insurance underwriting risk: the Group is exposed to insurancerisk, either directly through its businesses or through usinginsurance as a tool to mitigate other risk exposures.
Credit riskThe objective of credit risk management is to enable the Groupto achieve sustainable and superior risk versus rewardperformance whilst maintaining credit risk exposure in line withapproved risk appetite.
The key principles for credit risk management are set out in theGroup’s Credit Risk Management Framework and include:
• Approval of all credit exposure must be granted prior to anyadvance or extension of credit.
• An appropriate credit risk assessment of the customer andrelated credit facilities must be undertaken prior to approvalof credit exposure. This must include an assessment of,amongst others, the purpose of the credit and sources ofrepayment, compliance with affordability tests, repaymenthistory, capacity to repay, sensitivity to economic and marketdevelopments and risk-adjusted return.
• The Board delegates authority to Executive AdvancesCommittee, Group Credit Committee and divisional creditcommittees. A divisional CEO may delegate a subset ofthe divisional credit risk authority to sub-committees or to individuals.
• Credit risk authority must be specifically granted in writing toall individuals involved in the granting of credit approval,whether this is exercised personally or collectively as part ofa credit committee. These individuals must act independentlyand with balanced commercial judgement in exercising creditauthority.
• Where credit authority is exercised personally, the individualmust not have any responsibility or accountability forbusiness revenue origination.
• All credit exposures, once approved, must be effectivelymonitored and managed and reviewed periodically againstapproved limits. Review occurs at least annually, with lowerquality exposures being subject to a greater frequency ofanalysis and assessment.
• Customers with emerging credit problems must be identifiedearly and classified accordingly. Remedial actions must beimplemented promptly to minimise the potential loss to theGroup and consideration should be given whether to transfercustomers with credit problems to a specialised problemmanagement or recovery unit.
• Portfolio analysis and reporting must be used to identify andmanage credit risk concentrations and credit risk qualitymigration.
Credit grading modelsIn order to support the analytical elements of the credit riskmanagement framework, in particular the risk assessment partof the credit approval process, ongoing monitoring and portfolioanalysis, the Group employs a range of credit risk models.These models can be broadly grouped into four categories.
• Probability of default (“PD”)/customer credit grade – thesemodels assess the probability that the customer will fail tomake full and timely repayment of credit obligations over aone year time horizon. Each customer is assigned aninternal credit grade which corresponds to a probability ofdefault. There are a number of different credit gradingmodels in use across the Group, each of which considersparticular characteristics of customer types in that portfolio.The credit grading models use a combination of quantitativeinputs, such as recent financial performance and customerbehaviour, and qualitative inputs, such as companymanagement performance or sector outlook.
Every customer credit grade across all grading scales in theGroup can be mapped to a Group level credit grade whichuses a five band scale from AQ1 to AQ5.
• Loss given default (“LGD”) – these models estimate theeconomic loss that may be suffered by the Group on a creditfacility in the event of default. The LGD of a facility representsthe amount of debt which cannot be recovered and istypically expressed as a percentage of the EAD. The Group'sLGD models take into account the type of borrower, facilityand any risk mitigation such as the presence of any securityor collateral held. The LGD may also be affected by theindustry sector of the borrower, the legal jurisdiction in whichthe borrower operates as well as general economic conditionswhich may impact the value of any assets held as security.

section
03Fi
nanc
ial
stat
emen
ts
185
Not
es o
n th
e ac
coun
ts
Annual Report and Accounts 2005
• Exposure at default (“EAD”) – these models estimate theexpected level of utilisation of a credit facility at the time ofa borrower’s default. The EAD will typically be higher thanthe current utilisation (e.g. in the case where furtherdrawings are made on a revolving credit facility prior todefault) but will not typically exceed the total facility limit.The methodologies used in EAD modelling recognise thatcustomers may make more use of their existing creditfacilities in the run up to a default.
• Credit risk exposure measurement – these models calculatethe credit risk exposure for products where the exposure isnot 100% of the gross nominal amount of the creditobligation. These models are most commonly used forderivative and other traded instruments where the amount ofcredit risk exposure may be dependent on external variablessuch as interest rates or foreign exchange rates.
Risk assetsThe Group’s portfolio consists of loans (including overdraftfacilities), instalment credit, finance lease receivables, debtsecurities and other traded instruments. In order to encompassthe entire range of products in the Group’s credit portfoliosexposure is monitored using risk assets, which coverexposures to all these asset and customer types.
Risk asset qualityInternal reporting and oversight of risk assets is principallydifferentiated by credit ratings. Internal ratings are used toassess the credit quality of borrowers. Customers areassigned credit ratings, based on various credit gradingmodels that reflect the probability of default. All credit ratingsacross the Group map to a Group level asset quality scale.
Provision analysisThe Group’s consumer portfolios, which consist of small value,high volume credits, have highly efficient largely automatedprocesses for identifying problem credits and very shorttimescales, typically three months, before resolution oradoption of various recovery methods.
Corporate portfolios consist of higher value, lower volumecredits, which tend to be structured to meet individualcustomer requirements. Provisions are assessed on a case bycase basis.
Early and proactive management of problem exposuresensures that credit losses are minimised. Specialised units areused for different customer types to ensure that theappropriate risk mitigation is taken in a timely manner.
Portfolio provisions are reassessed regularly as part of theGroup’s ongoing monitoring process.
Provisions methodologyUnder IAS 39 provisions are assessed under three categoriesas described below:
Individually assessed provisions are the provisions required forindividually significant impaired assets which are assessed on acase by case basis, taking into account the financial conditionof the counterparty and any guarantor. This incorporates anestimate of the discounted value of any recoveries andrealisation of security or collateral. The asset continues to beassessed on an individual basis until it is repaid in full,transferred to the performing portfolio or written off.
Collectively assessed provisions are the provisions on impairedcredits below an agreed value threshold which are assessedon a portfolio basis, to reflect the homogenous nature of theassets, such as credit cards or personal loans. The provision isdetermined from a quantitative review of the relevant portfolio,taking account of the level of arrears, security and averageloss experience over the recovery period.
Latent loss provisions are the provisions held against theestimated impairment in the performing portfolio which has yetto be identified and reported as at the balance sheet date. Toassess the latent loss within the portfolio, the Group hasdeveloped methodologies to estimate the time that an assetcan remain impaired within a performing portfolio before it isidentified and reported as such.
Liquidity riskLiquidity management within the Group focuses on both overallbalance sheet structure and the control, within prudent limits,of risk arising from the mismatch of maturities across the balancesheet and from undrawn commitments and other contingentobligations. It is undertaken within limits and other policyparameters set by Group Asset and Liability ManagementCommittee (GALCO).
The structure of the Group’s balance sheet is managed tomaintain substantial diversification, to minimise concentrationacross its various deposit sources, and to contain the level ofreliance on total and net short-term wholesale sources offunds within prudent levels.
The degree of maturity mismatch within the overall long-termstructure of the Group’s assets and liabilities is also managedwithin internal policy limits, to ensure that term asset commitmentsmay be funded on an economic basis over their life. Inmanaging its overall term structure, the Group analyses andtakes into account the effect of retail and corporate customerbehaviour on actual asset and liability maturities where theydiffer materially from the underlying contractual maturities.The short-term maturity structure of the Group’s assets andliabilities is managed on a daily basis to ensure that contractualcash flow obligations, and potential cash flows arising fromundrawn commitments and other contingent obligations, canbe met as they arise from day to day, either from cash inflowsfrom maturing assets, new borrowing or the sale or repurchaseof debt securities held.

186
Not
es o
n th
e ac
coun
tsNotes on the accounts continued
Short-term liquidity risk is managed on a consolidated basis forthe whole Group excluding the activities of Citizens and insurancebusinesses, which are subject to regulatory regimes thatnecessitate local management of liquidity.
Internal liquidity mismatch limits are set for all other subsidiariesand non-UK branches which have material local treasuryactivities in external markets, to ensure those activities do notcompromise daily maintenance of the Group’s overall liquidityrisk position within the Group’s policy parameters.
The level of large deposits taken from banks, corporatecustomers, non-bank financial institutions and other customersand significant cash outflows therefrom are also reviewed tomonitor concentrations and identify any adverse trends.
Market riskThe Group is exposed to market risk because of positions heldin its trading portfolios and its non-trading business includingthe Group’s treasury operations. The Group manages themarket risk in its trading and treasury portfolios through itsmarket risk management framework, which is based on value-at-risk (“VaR”) limits, together with, but not limited to, stresstesting, scenario analysis, and position and sensitivity limits.Stress testing measures the impact of abnormal changes inmarket rates and prices on the fair value of the Group’s tradingportfolios. GEMC approves the high-level VaR and stress limitsfor the Group. The Group Market Risk function, independentfrom the Group’s trading businesses, is responsible for settingand monitoring the adequacy and effectiveness of the Group’smarket risk management processes.
Value-at-risk (“VaR”)VaR is a technique that produces estimates of the potentialnegative change in the market value of a portfolio over aspecified time horizon at given confidence levels. For internalrisk management purposes, the Group’s VaR assumes a timehorizon of one day and a confidence level of 95%. The Groupuses historical simulation models in computing VaR. Thisapproach, in common with many other VaR models, assumesthat risk factor changes observed in the past are a goodestimate of those likely to occur in the future and is, therefore,limited by the relevance of the historical data used. TheGroup’s method, however, does not make any assumptionabout the nature or type of underlying loss distribution.The Group typically uses the previous two years of marketdata. The Group’s VaR should be interpreted in light of thelimitations of the methodology used. These limitations include:
• Historical data may not provide the best estimate of the jointdistribution of risk factor changes in the future and may failto capture the risk of possible extreme adverse marketmovements which have not occurred in the historical windowused in the calculations.
• VaR using a one-day time horizon does not fully capture themarket risk of positions that cannot be liquidated or hedgedwithin one day.
• VaR using a 95% confidence level does not reflect the extentof potential losses beyond that percentile.
The Group largely computes the VaR of trading portfolios atthe close of business and positions may change substantiallyduring the course of the trading day. Controls are in place tolimit the Group’s intra-day exposure; such as the calculation ofthe VaR for selected portfolios. These limitations and the natureof the VaR measure mean that the Group cannot guaranteethat losses will not exceed the VaR amounts indicated.
TradingThe principal focus of the Group’s trading activities is clientfacilitation – providing products to the Group’s client base atcompetitive prices. The Group also undertakes: market making –quoting firm bid (buy) and offer (sell) prices with the intention ofprofiting from the spread between the quotes; arbitrage –entering into offsetting positions in different but closely relatedmarkets in order to profit from market imperfections; andproprietary activity – taking positions in financial instruments asprincipal in order to take advantage of anticipated marketconditions. The main risk factors are interest rates, credit spreadsand foreign exchange. Financial instruments held in the Group’strading portfolios include, but are not limited to, debt securities,loans, deposits, securities sale and repurchase agreements andderivative financial instruments (futures, forwards, swaps andoptions). For a discussion of the Group’s accounting policies forderivative financial instruments, see Accounting policies.
2005 2004
Average Period end Maximum Minimum Average Period end Maximum MinimumTrading £m £m £m £m £m £m £m £m
Interest rate 7.3 7.4 10.9 5.1 6.0 5.4 8.5 4.1Credit spread 11.4 11.8 14.4 8.8 8.6 10.4 12.0 5.1Currency 1.8 1.4 10.7 0.5 1.1 1.2 2.7 0.5Equity and commodity 0.5 0.7 1.1 0.2 0.8 0.4 2.1 0.3Diversification (8.5) (6.5)
Total trading VaR 13.0 12.8 16.5 9.9 10.6 10.9 16.0 6.3
The VaR for the Group’s trading portfolios segregated by type of market risk exposure, including idiosyncratic risk, is presented inthe table below.
34 Financial instruments (continued)

section
03Fi
nanc
ial
stat
emen
ts
187
Not
es o
n th
e ac
coun
ts
Annual Report and Accounts 2005
Non-tradingThe principal market risks arising from the Group’s non-tradingactivities are interest rate risk, currency risk and equity risk.Treasury activity and mismatches between the repricing ofassets and liabilities in its retail and corporate bankingoperations account for most of the non-trading interest raterisk. Non-trading currency risk derives from the Group’sinvestments in overseas subsidiaries, associates and branches.The Group’s venture capital portfolio and investments held byits general insurance business are the principal sources ofnon-trading equity price risk. The Group’s portfolios of non-trading financial instruments mainly comprise loans (includingfinance leases), debt securities, equity shares, deposits,certificates of deposits and other debt securities issued, loancapital and derivatives. To reflect their distinct nature, theGroup’s long-term assurance assets and liabilities attributableto policyholders have been excluded from these market riskdisclosures.
� Interest rate riskNon-trading interest rate risk arises from the Group’s treasuryactivities and retail and corporate banking businesses.
TreasuryThe Group’s treasury activities include its money marketbusiness and the management of internal funds flow within theGroup’s businesses. Money market portfolios include cashinstruments (principally debt securities, loans and deposits)and related hedging derivatives.
Retail and corporate banking Structural interest rate risk arises in these activities whereassets and liabilities have different repricing dates. It is theGroup’s policy to minimise the sensitivity of net interest incometo changes in interest rates and where interest rate risk isretained to ensure that appropriate resources, measures andlimits are applied.
Structural interest rate risk is calculated in each division on thebasis of establishing the repricing behaviour of each assetand liability product. For many products, the actual interest raterepricing characteristics differ from the contractual repricing.In most cases, the repricing maturity is determined by themarket interest rate that most closely fits the historicalbehaviour of the product interest rate. For non-interest bearingcurrent accounts, the repricing maturity is determined by thestability of the portfolio. The repricing maturities used are
approved by Group Treasury and divisional asset and liabilitycommittees at least annually. Key conventions are reviewedannually by GALCO.
A static maturity gap report is produced as at the month-endfor each division, in each functional currency based on thebehaviouralised repricing for each product. It is Group policyto include in the gap report, non-financial assets and liabilities,mainly property, plant and equipment and the Group’s capitaland reserves, spread over medium and longer term maturities.This report also includes hedge transactions, principally derivatives.
Any residual non-trading interest rate exposures are controlledby limiting repricing mismatches in the individual balancesheets. Potential exposures to interest rate movements in themedium to long term are measured and controlled using aversion of the same VaR methodology that is used for theGroup’s trading portfolios but without discount factors. Netaccrual income exposures are measured and controlled interms of sensitivity over time to movements in interest rates.
Risk is managed within limits approved by GALCO through theexecution of cash and derivative instruments. Execution of thehedging is carried out by the relevant division through theGroup’s treasury function. The residual risk position is reportedto divisional asset and liability committees, GALCO and Board.
� Currency riskThe Group does not maintain material non-trading opencurrency positions other than the structural foreign currencytranslation exposures arising from its investments in foreignsubsidiaries and associated undertakings and their relatedcurrency funding. The Group’s policy in relation to structuralpositions is to match fund the structural foreign currencyexposure arising from net asset value, including goodwill, inforeign subsidiaries, equity accounted investments andbranches, except where doing so would materially increase thesensitivity of either the Group’s or the subsidiary’s regulatorycapital ratios to currency movements. The policy requiresstructural foreign exchange positions to be reviewed regularlyby GALCO. Gains or losses on foreign currency investmentsnet of any gains or losses on related foreign currency fundingor hedges are recognised in the statement of recognisedincome and expense.

188
Not
es o
n th
e ac
coun
tsNotes on the accounts continued
The tables below set out the Group’s structural foreign currency exposures. Foreigncurrency Structural
Net investments borrowings foreignin foreign hedging net currency
operations investments exposures2005 £m £m £m
US dollar 15,452 6,637 8,815Euro 2,285 139 2,146Swiss franc 431 430 1Chinese RMB 914 — 914Other non-sterling 76 72 4
19,158 7,278 11,880
2004
US dollar 12,367 6,580 5,787Euro 2,086 1,349 737Swiss franc 398 392 6Other non-sterling 116 112 4
14,967 8,433 6,534
The US dollar open structural foreign currency exposure reflects the action taken to mitigate the effect of the acquisition in 2004 ofCharter One on the Group’s capital ratios. However, the increase in this position and the Euro structural exposure over 2004 is largelythe result of the exclusion from the table of preference shares classified as equity under IFRS. These instruments continue to beconsidered part of the currency funding of foreign operations for asset and liability management purposes. The exposure in ChineseRMB arises from the Group’s strategic investment in Bank of China.
� Equity riskNon-trading equity risk arises principally from the Group’sstrategic investments, its venture capital activities and its generalinsurance business.
VaR is not an appropriate risk measure for the Group’s venturecapital investments, which comprise a mix of quoted andunquoted investments, or its portfolio of strategic investments.These investments are carried at fair value with changes in fairvalue recorded in profit or loss, or equity.
Insurance riskThe Group is exposed to insurance risk, either directly throughits businesses or through using insurance as a tool to reduceother risk exposures.
Insurance risk is the risk of fluctuations in the timing, frequencyand severity of insured events, relative to the expectations ofthe Group at the time of underwriting.
Underwriting and pricing riskThe Group manages underwriting and pricing risk throughunderwriting guidelines for all business transacted restrictingthe types and classes of business that may be accepted;pricing policies by product line and by brand; and centralisedcontrol of policy wordings and any subsequent changes.
Claims management riskThe risk that claims are paid inappropriately is managed usinga range of IT system controls and manual processesconducted by experienced staff, to ensure that claims arehandled in a timely and accurate manner. Detailed policies andprocedures exist to ensure that all claims are handledappropriately.
Reinsurance riskReinsurance protects against the effect of major catastrophicevents or unforeseen volumes of, or adverse trends in, largeindividual claims and to transfer risk that is outside the Group’scurrent risk appetite.
Reinsurance is only effective when the counterparty isfinancially secure. The rating profile of the top ten reinsurers ofthe Group which accounts for 67% of the total reinsurancedebtors is as follows:
Standard & Poor’s Rating Number of Reinsurers
AAA 1AAA- 1AA 3AA- 2A 2A- 1
34 Financial instruments (continued)

section
03Fi
nanc
ial
stat
emen
ts
189
Not
es o
n th
e ac
coun
ts
Annual Report and Accounts 2005
Reserving riskReserving risk relates to both premiums and claims. It is the risk that reserves are assessed incorrectly such that insufficient fundshave been retained to pay or handle claims as the amounts fall due. Claims development data provides information on the historicalpattern of reserving risk.
Accident year2001 2002 2003 2004 2005 Total
Insurance claims – gross £m £m £m £m £m £m
Estimate of ultimate claims costs:At end of accident year 2,395 3,013 3,658 3,705 4,247 17,018One year later (70) 91 (140) (186) — (305)Two years later 20 1 (106) — — (85)Three years later 12 (12) — — — —Four years later (40) — — — — (40)
Current estimate of cumulative claims 2,317 3,093 3,412 3,519 4,247 16,588Cumulative payments to date (2,119) (2,680) (2,637) (2,521) (2,035) (11,992)
Liability recognised on the balance sheet 198 413 775 998 2,212 4,596
Liability in respect of prior years 208Claims handling costs 109
Total liability included on the balance sheet 4,913
Accident year2001 2002 2003 2004 2005 Total
Insurance claims – net of reinsurance £m £m £m £m £m £m
Estimate of ultimate claims costs:At end of accident year 2,011 2,584 3,215 3,508 4,150 15,468One year later (61) 59 (106) (168) — (276)Two years later 22 (12) (103) — — (93)Three years later 13 (3) — — — 10Four years later (41) — — — — (41)
Current estimate of cumulative claims 1,944 2,628 3,006 3,340 4,150 15,068Cumulative payments to date (1,779) (2,254) (2,342) (2,367) (2,008) (10,750)
Liability recognised on the balance sheet 165 374 664 973 2,142 4,318
Liability in respect of prior years 138Claims handling costs 109
Total liability included on the balance sheet 4,565

190
Not
es o
n th
e ac
coun
tsNotes on the accounts continued
2005 2004
Earned Claims Loss Earned Claims Losspremiums incurred ratio premiums incurred ratio
£m £m % £m £m %
Residential property Gross 1,098 602 55 1,090 599 55Net 1,037 580 56 990 578 58
Personal motor Gross 3,312 2,603 79 3,179 2,506 79Net 3,257 2,601 80 2,976 2,360 79
Commercial property Gross 212 82 39 191 77 40Net 193 77 40 173 73 42
Commercial motor Gross 102 54 53 93 71 76Net 96 44 46 87 59 68
Creditor Gross 157 87 55 143 74 52Net 156 87 56 142 74 52
Other Gross 696 455 65 811 499 62Net 605 426 70 685 414 60
Total Gross 5,577 3,883 70 5,507 3,826 69Net 5,344 3,815 71 5,053 3,558 70
Claims reservesIt is the Group’s policy to hold undiscounted claims reserves(including reserves to cover claims which have occurred butnot been reported (IBNR reserves)) for all classes at asufficient level to meet all liabilities as they fall due.
The Group’s focus is on high volume and relativelystraightforward products, for example home and motor. Thisfacilitates the generation of comprehensive underwriting and
claims data, which is used to monitor and accurately price therisks accepted. This attention to data analysis is reinforced bytight controls on costs and claims handling procedures.
The following table indicates the diversity of risks underwritten,the frequency and severity of claims and the correspondingloss ratios for each major class of business, gross and net ofreinsurance.
Frequency and severity of specific risks and sources of uncertaintyMost general insurance contracts written by the Group areissued on an annual basis, which means that the Group’sliability extends for a 12 month period, after which the Group isentitled to decline or renew or can impose renewal terms byamending the premium or excess or both.
The following paragraphs explain the frequency and severity ofclaims and the sources of uncertainty for the key classes thatthe Group is exposed to:
a) Motor insurance contracts (private and commercial)Claims experience is quite variable, due to a wide number of factors, but the principal ones of these are age of driver,type of vehicle and use.
There are many sources of uncertainty that will affect theGroup's experience under motor insurance, includingoperational risk, reserving risk, premium rates not matchingclaims inflation rates, the social, economic and legislativeenvironment and reinsurance failure risks.
b) Property insurance contracts (residential and commercial)The major causes of claims for property insurance are theft,flood, escape of water, fire, storm, subsidence and varioustypes of accidental damage.
The major source of uncertainty in the Group’s propertyaccounts is the volatility of weather. Weather in the UK canaffect most of the above perils. Over a longer period, thestrength of the economy is also a factor.
c) Commercial other insurance contractsOther commercial claims come mainly from businessinterruption and loss arising from the negligence of the insured(liability insurance). Business interruption losses come fromthe loss of income, revenue and/or profit as a result ofproperty damage claims. Liability insurance comprisesemployers liability and public/products liability. Liabilityinsurance is written on an occurrence basis, and is subjectto claims over a substantial period of time, but where losswas in existence during the life of the policy.
Fluctuations in the social and economic climate are a sourceof uncertainty in the Group’s general liability account.Other sources of uncertainty are changes in the law, or itsinterpretation, and changes in the actuarial estimatesunderlying long-term claims. Other uncertainties aresignificant events (for example terrorist attacks) and anyemerging new heads of damage, types of claim that are notenvisaged when the policy is written.
The Group has no interest rate exposure from general insurance liabilities because provisions for claims under short term insurancecontracts are not discounted.
34 Financial instruments (continued)

section
03Fi
nanc
ial
stat
emen
ts
191
Not
es o
n th
e ac
coun
ts
Annual Report and Accounts 2005
d) Creditor insuranceCreditor insurance contracts are designed to coverpayments on secured or unsecured lending. Thesecontracts will be for a maximum term of 5 years. The causesof creditor insurance claims are loss of income throughaccident, sickness or unemployment or, in somecircumstances, loss of life.
The main source of uncertainty affecting the Group'screditor accounts is the economic environment.
Life businessThe three regulated life companies of RBSG, NatWest LifeAssurance Limited, Royal Scottish Assurance plc (“RSA”) andDirect Line Life Limited, are required to meet minimum capitalrequirements at all times under the Financial ServiceAuthority’s Prudential Sourcebook. The capital resourcescovering the regulatory requirement are not transferable toother areas of the Group. To ensure that the capital
requirement is satisfied at all times, each company holds anadditional voluntary buffer above the absolute minimum.Sufficient capital resources are held to ensure that the capitalrequirements are covered over a two year projection period.Life insurance results are inherently uncertain, due to actualexperience being different to modelled assumptions. Suchdifferences affect regulatory capital resources, as do varyinglevels of new business. Therefore, projections are formallyreviewed twice a year. Where there is a shortfall of capital,various options are available to provide new capital.
The Group is not exposed to price, currency, credit, or interestrisk on unit linked life contracts but it is exposed to variation inmanagement fees. A decrease of 10% in the value of theassets would reduce the asset management fees by £5 millionper annum (2004 – £5 million). The Group also writes insurancecontracts with minimum guaranteed death benefits that exposeit to the risk that declines in the value of underlying investmentsmay increase the Group’s net exposure to death risk.
Valuation discount rates 2005 2004
AssurancesLife policies 2.85% 3.00%Pensions policies 3.80% 4.00%
Annuities in payment (all reinsured) 4.00% 4.67%Interest rates
Sterling interest 2.85% net 3.0% netUnit growth 2.85% net 3.0% net
Expense inflation 4.0% net 4.0% net
Mortality assumptions are set with regard to recent experience and general industry trends.
Mortality tables used:Pre-2001 products – RSATerm assurances 72% AM80 ult -2 + 33% AIDS R6A Unit-linked life assurances 76.5% / 72% AM80 ult.-2+ 33% AIDS R6A Unit-linked pensions 90% AM80 ult.-2
Pre-2000 products – NatWest LifeTerm assurances 65% TM80 ultimate + 33% AIDS R6AUnit-linked assurances 60% AM80 ult.Rates above are for male, non-smokers.
Post-2000 productsTerm assurances 60% TM80 ult + 33% AIDS R6A
Expenses:2005 2004
Pre-2000 products – RSA per annum per annum
Lifestyle protection plan £29.81 £27.17Mortgage savings plan £67.05 £60.08
Pre-2000 products – NatWest LifeTerm assurances £26.79 £25.13Single premium unit-linked bonds £23.86 £22.38
Post-2000 productsTerm assurances £23.97 £22.38Guaranteed bonds £26.92 £25.13

192
Not
es o
n th
e ac
coun
ts
Frequency and severity of claims – for contracts where deathis the insured risk, the most significant factors that couldincrease the overall frequency of claims are epidemics or widespread changes in lifestyle, resulting in earlier or more claimsthan expected.
For contracts where survival is the insured risk, the mostsignificant factor is continued improvement in medical scienceand social conditions that would increase longevity.
For contracts with fixed and guaranteed benefits and fixed
future premiums, there are no mitigating terms and conditionsthat reduce the insurance risk accepted. Participatingcontracts can result in a significant portion of the insurancerisk being shared with the insured party.
Sources of uncertainty in the estimation of future benefitpayments and premium receipts – the Group uses base tablesof standard mortality appropriate to the type of contract beingwritten and the territory in which the insured person resides.These are adjusted to reflect the Group’s experience, mortalityimprovements and voluntary termination behaviour.
Notes on the accounts continued
Limitations of sensitivity analysis: the above tables demonstratethe effect of a change in a key assumption whilst otherassumptions remain unaffected. In reality, such an occurrenceis unlikely, due to correlation between the assumptions andother factors. It should also be noted that these sensitivities arenon-linear, and larger or smaller impacts should not beinterpolated or extrapolated from these results. The sensitivityanalyses do not take into consideration that assets and
liabilities are actively managed and may vary at the time thatany actual market movement occurs.
Purchased insuranceThe Insurance Sourcing Department is responsible to GEMCfor the Group-wide purchase of insurance as a means ofreducing other risk exposures.
Sensitivity factor Description of sensitivity factor appliedInterest rate and investment return Change in market interest rates of ± 1%.
The test allows consistently for similar changes to investment returns andmovements in the market value of backing fixed interest securities.
Expenses Increase in maintenance expenses of 10%Assurance mortality/morbidity Increase in mortality/morbidity rates for assurance contracts of 5%Annuitant mortality Reduction in mortality rates for annuity contracts of 5%
The above sensitivity factors are applied via actuarial and statistical models, with the following impact on the financial statements.
Impact on profit
and equityRisk factor Variability £m
Interest rates +1% (16)Interest rates –1% 20Expenses +10% (5)Assurance mortality/morbidity +5% (7)Annuitant mortality – 5% —
34 Financial instruments (continued)

section
03Fi
nanc
ial
stat
emen
ts
193
Not
es o
n th
e ac
coun
ts
Annual Report and Accounts 2005
Group
Remaining maturity 1 month Within 3-12 1-5 Over 5 Equityor less 3 months months years years shares Total
2005 £m £m £m £m £m £m £m
AssetsCash and balances at central banks 4,759 — — — — — 4,759Treasury bills and other eligible bills 779 1,252 3,507 — — — 5,538Loans and advances to banks 46,276 14,959 8,749 265 338 — 70,587Loans and advances to customers 139,732 48,881 42,485 66,488 119,640 — 417,226Debt securities 2,635 8,289 11,472 25,621 72,948 — 120,965Equity shares — — — — — 9,301 9,301Settlement balances 6,005 — — — — — 6,005Derivatives at fair value 4,816 7,282 11,778 31,667 40,120 — 95,663
LiabilitiesDeposits by banks 69,393 17,876 13,293 8,264 1,581 — 110,407Customer accounts 286,960 28,582 14,516 8,172 4,637 — 342,867Debt securities in issue 20,577 23,297 24,253 14,986 7,307 — 90,420Settlement balances and short positions 16,533 569 1,696 15,950 9,240 — 43,988Derivatives at fair value 4,962 6,733 12,740 32,067 39,936 — 96,438Subordinated liabilities 539 418 3,075 7,122 17,120 — 28,274
2004
AssetsCash and balances at central banks 4,293 — — — — — 4,293Treasury bills and other eligible bills 2,201 2,555 1,354 — — — 6,110Loans and advances to banks 36,482 11,867 11,902 266 556 — 61,073Loans and advances to customers 103,672 32,403 38,990 54,788 117,398 — 347,251Debt securities 2,002 2,967 11,635 18,267 59,037 — 93,908Equity shares — — — — — 4,723 4,723Settlement balances 5,682 — — — — — 5,682Derivatives at fair value 1,082 1,538 3,076 6,230 5,874 — 17,800
LiabilitiesDeposits by banks 65,489 18,888 10,474 3,675 1,357 — 99,883Customer accounts 232,982 25,801 15,502 7,803 1,227 — 283,315Debt securities in issue 15,505 24,711 13,852 8,261 1,670 — 63,999Settlement balances and short positions 4,738 577 282 19,486 7,907 — 32,990Derivatives at fair value 1,148 1,570 3,322 6,606 6,230 — 18,876Subordinated liabilities — 1,135 596 4,481 14,154 — 20,366

194
Not
es o
n th
e ac
coun
ts
Company
Remaining maturity 1 month 1-3 3-12 1-5 Over 5or less months months years years Total
2005 £m £m £m £m £m £m
AssetsLoans and advances to banks 435 1,476 780 1,510 4,921 9,122Loans and advances to customers — — — 262 305 567Derivatives at fair value — — — 55 — 55
LiabilitiesDeposits by banks 32 919 — — — 951Customer accounts — 55 — — — 55Debt securities in issue 909 2,033 — — — 2,942Subordinated liabilities 189 311 1,008 1,653 6,081 9,242
2004
AssetsLoans and advances to banks 196 664 351 680 2,215 4,106Loans and advances to customers — — — — 305 305
LiabilitiesDeposits by banks 174 — — — — 174Debt securities in issue 197 394 517 500 — 1,608Subordinated liabilities — — 368 731 4,836 5,935
Notes on the accounts continued
34 Financial instruments (continued)

section
03Fi
nanc
ial
stat
emen
ts
195
Not
es o
n th
e ac
coun
ts
Annual Report and Accounts 2005
Group
After 3 After 6 After 1months months year Total Non Fair valuebut less but less but less interest interest through Banking Trading
3 months than than than Over 5 earning/ earning/ profit or book bookor less 6 months 1 year 5 years years bearing Yield bearing loss total total Total
2005 £m £m £m £m £m £m % £m £m £m £m £m
AssetsLoans and advances
to banks 15,843 2,100 2,293 85 69 20,390 3.71 4,241 282 24,913 45,674 70,587Loans and advances
to customers 231,730 14,063 13,045 49,078 32,789 340,705 5.51 15,274 616 356,595 60,631 417,226Debt securities and
treasury bills 12,416 3,362 994 4,765 16,857 38,394 3.81 469 3,991 42,854 83,649 126,503Other assets — — — — — — 54,952 2,541 57,493 105,018 162,511Total assets 259,989 19,525 16,332 53,928 49,715 399,489 5.26 74,936 7,430 481,855 294,972 776,827
Liabilities and equityDeposits by banks 54,515 2,880 1,507 776 968 60,646 3.97 2,123 — 62,769 47,638 110,407Customer accounts 232,221 5,715 8,141 7,332 2,909 256,318 2.57 37,817 3,683 297,818 45,049 342,867Debt securities in issue 65,055 4,212 3,586 957 1,140 74,950 4.18 7 11,068 86,025 4,395 90,420Subordinated liabilities 3,965 1,492 116 5,749 16,339 27,661 6.84 110 150 27,921 353 28,274Other liabilities — — — — — — 29,576 — 29,576 139,848 169,424Shareholders’ equity — — — — — — 33,775 — 33,775 1,660 35,435Internal funding of
trading business (48,506) (4,913) (1,800) (9) — (55,228) 3.83 (801) — (56,029) 56,029 —Total liabilities and equity 307,250 9,386 11,550 14,805 21,356 364,347 3.82 102,607 14,901 481,855 294,972 776,827
Interest rate swaps (13,537) (2,849) (1,508) 1,182 16,712 — — —interest rate sensitivity gap(60,798) 7,290 3,274 40,305 45,071 35,142 (27,671) (7,471)Cumulative interest rate
sensitivity gap (60,798)(53,508)(50,234) (9,929) 35,142 35,142 7,471
Interest rate sensitivityThe following tables summarise the interest rate sensitivity gapfor the Group and the company at 31 December 2005 and 31December 2004. The tables show the contractual repricing foreach category of asset, liability and off-balance sheet items inthe banking book. A liability (or negative) gap position existswhen liabilities reprice more quickly or in greater proportionthan assets during a given period and tends to benefit netinterest income in a declining interest rate environment. Anasset (or positive) gap position exists when assets reprice
more quickly or in greater proportion than liabilities during agiven period and tends to benefit net interest income in a risinginterest rate environment. Contractual repricing terms do notreflect the potential impact of early repayment or withdrawal.Positions may not be reflective of those in subsequent periods.Major changes in positions can be made promptly as marketoutlooks change. In addition, significant variations in interestrate sensitivity may exist within the re-pricing periodspresented and among the currencies in which the Group hasinterest rate positions.
Trading bookThe table below sets out by time band the net effect on the Group’s profit or loss of a basis point (0.01%) increase in interest rates,assuming all trading positions remained unchanged.
Group
After 3 After 6 After 1months months yearbut less but less but less
3 months than than than Over 5or less 6 months 1 year 5 years years Total
2005 £’000 £’000 £’000 £’000 £’000 £’000
(Loss)/gain per basis point increase (487) (40) 180 (1,631) 1,146 (832)

196
Not
es o
n th
e ac
coun
tsNotes on the accounts continued
Group
After 3 After 6 After 1months months year Nonbut less but less but less interest Banking Trading
3 months than than than Over 5 earning/ book bookor less 6 months 1 year 5 years years bearing total total Total
2004 £m £m £m £m £m £m £m £m £m
AssetsLoans and advances to banks 14,829 5,140 1,367 77 482 3,272 25,167 35,906 61,073Loans and advances to customers 191,796 16,632 11,177 34,687 28,419 2,304 285,015 62,236 347,251Debt securities and treasury bills 12,530 4,088 3,656 6,133 13,548 2,416 42,371 57,647 100,018Other assets — — — — — 54,871 54,871 24,909 79,780Total assets 219,155 25,860 16,200 40,897 42,449 62,863 407,424 180,698 588,122
Liabilities and equityDeposits by banks 54,679 2,282 907 119 477 1,737 60,201 39,682 99,883Customer accounts 190,796 5,589 6,948 7,043 461 31,345 242,182 41,133 283,315Debt securities in issue 45,903 6,104 4,418 4,087 1,727 — 62,239 1,760 63,999Subordinated liabilities 4,401 1,020 302 2,151 12,438 — 20,312 54 20,366Other liabilities 4 5 8 49 126 33,469 33,661 52,993 86,654Shareholders’ equity — — — — — 32,755 32,755 1,150 33,905Internal funding of trading business (42,516) (313) (1,088) (9) — — (43,926) 43,926 —Total liabilities and equity 253,267 14,687 11,495 13,440 15,229 99,306 407,424 180,698 588,122
Off-balance sheet items (2,126) (6,906) (1,160) 1,560 8,632 —interest rate sensitivity gap (36,238) 4,267 3,545 29,017 35,852 (36,443)Cumulative interest rate sensitivity gap (36,238) (31,971) (28,426) 591 36,443
34 Financial instruments (continued)

section
03Fi
nanc
ial
stat
emen
ts
197
Not
es o
n th
e ac
coun
ts
Annual Report and Accounts 2005
Company
After 3 After 6 After 1months months year Total Nonbut less but less but less interest interest Banking
3 months than than than Over 5 earning/ earning/ Bookor less 6 months 1 year 5 years years bearing Yield bearing Total
2005 £m £m £m £m £m £m % £m £m
AssetsLoans and advances to banks 1,803 554 119 1,585 5,061 9,122 6.05 — 9,122Loans and advances to customers 305 — — 262 — 567 2.82 — 567Investment in subsidiaries — — — — — — — 20,851 20,851Other assets — — — — — — — 202 202Total assets 2,108 554 119 1,847 5,061 9,689 5.86 21,053 30,742
Liabilities and equityDeposits by banks 951 — — — — 951 4.42 — 951Customer accounts 55 — — — — 55 — — 55Debt securities in issue 2,942 — — — — 2,942 4.55 — 2,942Other liabilities — — — — — — — 14 14Subordinated liabilities 1,317 567 116 1,603 5,639 9,242 6.83 — 9,242Shareholders’ equity — — — — — — — 17,538 17,538Total liabilities and equity 5,265 567 116 1,603 5,639 13,190 6.12 17,552 30,742
Interest rate swaps — — — — — — —interest rate sensitivity gap (3,157) (13) 3 244 (578) (3,501) 3,501Cumulative interest rate sensitivity gap (3,157) (3,170) (3,167) (2,923) (3,501) (3,501)

198
Not
es o
n th
e ac
coun
tsNotes on the accounts continued
The following table shows the carrying values and the fair values of financial instruments on the balance sheets.
Group Company
2005 2005 2004 2004 2005 2005 2004 2004Carrying Fair Carrying Fair Carrying Fair Carrying Fair
value value value value value value value value£m £m £m £m £m £m £m £m
Financial assetsCash and balances at central banks 4,759 4,759 4,293 4,293 — — — —
Treasury bills and other eligible bills — —Held-for-trading 3,004 3,004 — —Available-for-sale 2,534 2,534 — —
Banking business 3,189 3,189 — —Trading business 2,921 2,921 — —
5,538 5,538 6,110 6,110 — — — —
Loans and advance to banksHeld-for-trading 44,965 44,965 — —Designated as at fair value through profit or loss 282 282 — —Loans and receivables 25,340 25,336 9,122 9,122
Banking business 25,167 25,111 4,106 4,106Trading business 35,906 35,906 — —
70,587 70,583 61,073 61,017 9,122 9,122 4,106 4,106
Loans and advance to customersHeld-for-trading 53,963 53,963 — —Designated as at fair value through profit or loss 616 616 — —Loans and receivables 350,960 354,670 567 567Finance leases 11,687 11,687 — —
Banking business 285,015 287,289 305 305Trading business 62,236 62,236 — —
417,226 420,936 347,251 349,525 567 567 305 305
Debt securitiesHeld-for-trading 80,653 80,653 — —Designated as at fair value through profit or loss 3,991 3,991 — —Available-for-sale 35,533 35,533 — —Loans and receivables 788 788 — —
Banking business 39,182 38,998 — —Trading business 54,726 54,726 — —
120,965 120,965 93,908 93,724 — — — —
Equity sharesHeld-for-trading 2,941 2,941 — —Designated as at fair value through profit or loss 2,541 2,541 — —Available-for-sale 3,819 3,819 — —
Banking business 4,237 4,679 — —Trading business 486 486 — —
9,301 9,301 4,723 5,165 — — — —
Settlement balances 6,005 6,005 5,682 5,682 — — — —
Derivatives at fair value 95,663 95,663 17,800 17,800 55 55 — —
34 Financial instruments (continued)

section
03Fi
nanc
ial
stat
emen
ts
199
Not
es o
n th
e ac
coun
ts
Annual Report and Accounts 2005
Group Company
2005 2005 2004 2004 2005 2005 2004 2004Carrying Fair Carrying Fair Carrying Fair Carrying Fair
value value value value value value value value£m £m £m £m £m £m £m £m
Financial liabilitiesDeposits by banks
Held-for-trading 32,067 32,067 — —Amortised cost 78,340 78,218 951 951
Banking business 60,201 59,294 174 174Trading business 39,682 39,682 — —
110,407 110,285 99,883 98,976 951 951 174 174
Customer accountsHeld-for-trading 34,645 34,645 — —Designated as at fair value through profit or loss 3,683 3,683 — —Amortised cost 304,539 305,252 55 55
Banking business 242,182 241,971 — —Trading business 41,133 41,133 — —
342,867 343,580 283,315 283,104 55 55 — —
Debt securities in issueHeld-for-trading 1,469 1,469 — —Designated as at fair value through profit or loss 11,068 11,068 — —Amortised cost 77,883 78,089 2,942 2,942
Banking business 62,239 62,238 1,608 1,608Trading business 1,760 1,760 — —
90,420 90,626 63,999 63,998 2,942 2,942 1,608 1,608
Settlement balances and short positions 43,988 43,988 32,990 32,990 — — — —
Derivatives at fair value 96,438 96,438 18,876 18,876 — — — —
Subordinated liabilitiesDesignated as at fair value through profit or loss 150 150 — —Amortised cost 28,124 29,598 9,242 9,639
Banking business 20,312 21,652 5,935 6,184Trading business 54 54 — —
28,274 29,748 20,366 21,706 9,242 9,639 5,935 6,184
Analysis of total assets and liabilities2004
£m
Assets: denominated in sterling 279,433denominated in currencies other than sterling 308,689
588,122
Liabilities: denominated in sterling 282,660denominated in currencies other than sterling 305,462
588,122

200
Not
es o
n th
e ac
coun
tsNotes on the accounts continued
Industry risk – geographical analysisGroup
Loans and Treasury bills,advances to banks debt securities Netting and
and customers and equity shares Derivatives Other (1) Total offset (2)2005 £m £m £m £m £m £m
UKCentral and local government 4,082 20,061 175 407 24,725 1,584Manufacturing 14,861 462 1,088 — 16,411 3,829Construction 8,389 53 126 — 8,568 1,655Finance 99,123 49,532 66,132 2,129 216,916 84,330Service industries and business activities 53,504 3,404 2,148 162 59,218 6,290Agriculture, forestry and fishing 2,685 17 2 — 2,704 265Property 41,074 401 1,123 — 42,598 3,157Individuals
Home mortgages 65,286 — 3 — 65,289 2,690Other 26,987 564 — 186 27,737 688
Finance leases and instalment credit 13,909 4 — — 13,913 —Interest accruals 1,503 774 — — 2,277 —Total UK 331,403 75,272 70,797 2,884 480,356 104,488
USCentral and local government 472 27,420 — 112 28,004 —Manufacturing 3,369 89 91 — 3,549 6Construction 730 30 8 — 768 —Finance 33,811 24,672 21,023 3,818 83,324 22,059Service industries and business activities 10,440 661 113 — 11,214 11Agriculture, forestry and fishing 92 — — — 92 —Property 5,215 5 39 — 5,259 15Individuals
Home mortgages 34,783 922 — — 35,705 —Other 14,396 — — — 14,396 —
Finance leases and instalment credit 2,973 — — — 2,973 —Interest accruals 424 194 — — 618 2Total US 106,705 53,993 21,274 3,930 185,902 22,093
EuropeCentral and local government 297 301 — — 598 121Manufacturing 6,429 — — — 6,429 891Construction 2,382 — — — 2,382 1,931Finance 8,259 2,214 450 8 10,931 4,988Service industries and business activities 9,908 10 11 — 9,929 3,735Agriculture, forestry and fishing 514 — — — 514 577Property 5,078 49 — — 5,127 2,682Individuals
Home mortgages 8,848 — — — 8,848 11,310Other 3,585 105 — — 3,690 1,584
Finance leases and instalment credit 1,311 — — — 1,311 —Interest accruals 115 26 — — 141 —Total Europe 46,726 2,705 461 8 49,900 27,819
Rest of the WorldCentral and local government 243 1,709 1,379 — 3,331 —Manufacturing 102 — 7 — 109 1Construction 65 — — — 65 —Finance 3,680 2,233 1,728 3 7,644 896Service industries and business activities 1,610 24 17 — 1,651 —Agriculture, forestry and fishing 3 — — — 3 —Property 112 — — — 112 1Individuals
Home mortgages 216 — — — 216 —Other 792 — — — 792 —
Finance lease and instalment credit — — — — — —Interest accruals 43 — — — 43 —Total Rest of the World 6,866 3,966 3,131 3 13,966 898
(1) Includes settlement balances of £6,005 million.
(2) This column shows the amount by which exposures to counterparties are reduced by the existence of a legal right of set off (on the basis that the financial asset will be collectedin accordance with its terms) and under master netting arrangements. The credit risk of financial assets subject to a master netting arrangement is eliminated only to the extentthat financial liabilities due to the same counterparty will be settled after the assets are realised. The extent to which the Group's credit risk is reduced through a master nettingarrangement may change substantially within a short period following the balance sheet date because the exposure is affected by each transaction subject to the arrangement.
34 Financial instruments (continued)

section
03Fi
nanc
ial
stat
emen
ts
201
Not
es o
n th
e ac
coun
ts
Annual Report and Accounts 2005
Group
Loans and Treasury bills,advances to banks debt securities Netting and
and customers and equity shares Derivatives Other (1) Total offset (2)2005 £m £m £m £m £m £m
TotalCentral and local government 5,094 49,491 1,554 519 56,658 1,705Manufacturing 24,761 551 1,186 — 26,498 4,727Construction 11,566 83 134 — 11,783 3,586Finance 144,873 78,651 89,333 5,958 318,815 112,273Service industries and business activities 75,462 4,099 2,289 162 82,012 10,036Agriculture, forestry and fishing 3,294 17 2 — 3,313 842Property 51,479 455 1,162 — 53,096 5,855Individuals
Home mortgages 109,133 922 3 — 110,058 14,000Other 45,760 669 — 186 46,615 2,272
Finance lease and instalment credit 18,193 4 — — 18,197 —Interest accruals 2,085 994 — — 3,079 2
491,700 135,936 95,663 6,825 730,124 155,298
(1) Includes settlement balances of £6,005 million.
(2) This column shows the amount by which exposures to counterparties are reduced by the existence of a legal right of set off (on the basis that the financial asset will be collectedin accordance with its terms) and under master netting arrangements. The credit risk of financial assets subject to a master netting arrangement is eliminated only to the extentthat financial liabilities due to the same counterparty will be settled after the assets are realised. The extent to which the Group's credit risk is reduced through a master nettingarrangement may change substantially within a short period following the balance sheet date because the exposure is affected by each transaction subject to the arrangement.
35 Memorandum items
Contingent liabilities and commitmentsThe amounts shown in the table below are intended only to provide an indication of the volume of business outstanding at 31 December. Although the Group is exposed to credit risk in the event of non-performance of the obligations undertaken by customers, the amounts shown do not, and are not intended to, provide any indication of the Group’s expectation of future losses.
Group Company
2005 2004 2005 2004£m £m £m £m
Contingent liabilities:Guarantees and assets pledged as collateral security 12,253 10,438 448 448Other contingent liabilities 6,394 5,655 — —
18,647 16,093 448 448Commitments:Undrawn formal standby facilities, credit lines and other commitments to lend
– less than one year 121,911 109,653 — —– one year and over 81,110 69,577 — —
Other commitments 3,529 1,547 — —206,550 180,777 — —

202
Not
es o
n th
e ac
coun
tsNotes on the accounts continued
Banking commitments and contingent obligations, which havebeen entered into on behalf of customers and for which thereare corresponding obligations from customers, are not includedin assets and liabilities. The Group’s maximum exposure tocredit loss, in the event of non-performance by the other partyand where all counterclaims, collateral or security provesvalueless, is represented by the contractual nominal amount of these instruments included in the table. These commitmentsand contingent obligations are subject to the Group’s normalcredit approval processes and any potential loss is taken intoaccount in assessing provisions for bad and doubtful debts inaccordance with the Group’s provisioning policy.
Contingent liabilitiesGuarantees – the Group gives guarantees on behalf ofcustomers. A financial guarantee represents an irrevocableundertaking that the Group will meet a customer’s obligationsto third parties if the customer fails to do so. The maximumamount that the Group could be required to pay under aguarantee is its principal amount as disclosed in the table above.The Group expects most guarantees it provides to expire unused.
Other contingent liabilities – these include standby letters ofcredit, supporting customer debt issues and contingentliabilities relating to customer trading activities such as thosearising from performance and customs bonds, warranties andindemnities.
CommitmentsCommitments to lend – under a loan commitment the Groupagrees to make funds available to a customer in the future.Loan commitments, which are usually for a specified term maybe unconditionally cancellable or may persist, provided allconditions in the loan facility are satisfied or waived.Commitments to lend include commercial standby facilities andcredit lines, liquidity facilities to commercial paper conduitsand unutilised overdraft facilities.
Other commitments – these include forward asset purchases,forward deposits placed and undrawn note issuance andrevolving underwriting facilities, documentary credits and othershort-term trade related transactions.
Regulatory enquiries and investigations – in the normal courseof business the Group and its subsidiaries co-operate withregulatory authorities in various jurisdictions in their enquiries orinvestigations into alleged or possible breaches of regulations.
Additional contingent liabilities arise in the normal course ofthe Group’s business. It is not anticipated that any material losswill arise from these transactions.
LitigationProceedings, including a consolidated class action, have beenbrought in the United States against a large number ofdefendants, including the Group, following the collapse ofEnron. The claims against the Group could be significant butare largely unquantified. The Group considers that it hassubstantial and credible legal and factual defences to theseclaims and it continues to defend them vigorously. A courtordered mediation commenced in September 2003 but nomaterial progress has been made towards a resolution of theclaims, although a number of other defendants have reachedsettlements in the principal class action. The Group is unablereliably to estimate the possible loss in relation to these mattersor the effect that the possible loss might have on the Group’sconsolidated net assets or its operating results or cash flows in any particular period. In addition, pursuant to requestsreceived from the US Securities and Exchange Commissionand the Department of Justice, the Group has provided copies of Enron-related materials to these authorities and has co-operated fully with them.
Members of the Group are engaged in other litigation in theUnited Kingdom and a number of overseas jurisdictions,including the United States, involving claims by and againstthem arising in the ordinary course of business. The Group hasreviewed these other actual, threatened and known potentialclaims and proceedings and, after consulting with its legaladvisers, is satisfied that the outcome of these other claimsand proceedings will not have a material adverse effect on its consolidated net assets, operating results or cash flows in any particular period.
Trustee and other fiduciary activitiesIn its capacity as trustee or other fiduciary role, the Group may hold or place assets on behalf of individuals, trusts,companies, pension schemes and others. The assets and theirincome are not included in the Group’s financial statements.
35 Memorandum items (continued)

section
03Fi
nanc
ial
stat
emen
ts
203
Not
es o
n th
e ac
coun
ts
Annual Report and Accounts 2005
36 Net cash inflow from operating activities Group Company
2005 2004 2005 2004£m £m £m £m
Operating profit before tax 7,936 7,284 1,932 2,890Decrease/(increase) in prepayments and accrued income 1,064 (333) 4 (17)Interest on subordinated liabilities 1,271 681 583 318(Decrease)/increase in accruals and deferred income (1,200) 1,750 8 (7)Provisions for impairment losses 1,707 1,402 — —Loans and advances written-off net of recoveries (1,870) (1,305) — —Unwind of discount on impairment losses (144) — — —Profit on sale of property, plant and equipment (91) (69) — —Loss/(profit) on sale of subsidiaries and associates 80 (4) — —Profit on sale of securities (667) (167) — —Charge for defined benefit pensions 462 397 — —Cash contribution to defined benefit pension schemes (452) (1,146) — —Other provisions utilised (34) (47) — —Depreciation and amortisation 1,825 1,674 — —Other non-cash items 1,493 (1,994) (28) 25Net cash inflow from trading activities 11,380 8,123 2,499 3,209(Increase)/decrease in loans and advances to banks and customers (36,778) (72,955) (14) 77Increase in securities (28,842) (11,883) — —(Increase)/decrease in other assets (2,390) (2,208) 5 33(Increase)/decrease in derivative assets (5,758) (3,753) 50 21Changes in operating assets (73,768) (90,799) 41 131Increase in deposits by banks and customers 32,424 53,073 832 18Increase in insurance liabilities 620 866 — —Increase/(decrease) in debt securities in issue 24,147 19,073 1,328 (269)Increase/(decrease) in other liabilities 571 919 (55) (19)Increase/(decrease) in derivative liabilities 5,161 3,808 (96) (9)Increase in settlement balances and short positions 10,326 8,796 — —Changes in operating liabilities 73,249 86,535 2,009 (279)Total income taxes paid (1,911) (1,366) (18) 36Net cash inflow from operating activities 8,950 2,493 4,531 3,097
37 Analysis of the net investment in business interests and intangible assetsGroup
2005 2004£m £m
Fair value given for businesses acquired (85) (8,157)Cash and cash equivalents acquired — 457Non-cash consideration 10 4Net outflow of cash in respect of purchases (75) (7,696)
Cash and cash equivalents in businesses sold 10 —Other assets sold 208 18Non-cash consideration (30) —(Loss)/profit on disposal (80) 4Net inflow of cash in respect of disposals 108 22Dividends received from joint ventures 16 9Cash expenditure on intangible assets (345) (303)Net outflow (296) (7,968)

204
Not
es o
n th
e ac
coun
ts
38 Interest received and paid Group Company
2005 2004 2005 2004£m £m £m £m
Interest received 21,608 17,025 488 337Interest paid (11,878) (8,164) (704) (402)
9,730 8,861 (216) (65)
39 Analysis of changes in financing during the yearGroup Company
Share capital Subordinated liabilities Share capital Subordinated liabilities
2005 2004 2005 2004 2005 2004 2005 2004£m £m £m £m £m £m £m £m
At 1 January 13,786 8,944 20,366 16,998 13,786 8,944 5,935 5,393Implementation of IAS 32 (3,161) 7,160 (3,161) 3,308At 1 January 2005 restated 10,625 8,944 27,526 16,998 10,625 8,944 9,243 5,393Issue of ordinary shares 163 2,845 163 2,845Issue of equity preference shares 1,649 1,358 1,649 1,358Net proceeds from issue of
subordinated liabilities 1,234 4,624 337 1,424Repayment of subordinated liabilities (1,553) (718) (1,183) (40)Net cash inflow/(outflow) from financing 1,812 4,203 (319) 3,906 1,812 4,203 (846) 1,384Acquisitions of subsidiaries — — — 397 — — — —Currency translation 166 179 1,067 (475) 166 179 845 (382)Other non-cash movements — 460 — (460) — 460 — (460)At 31 December 12,603 13,786 28,274 20,366 12,603 13,786 9,242 5,935
40 Analysis of cash and cash equivalents Group Company
2005 2004 2005 2004£m £m £m £m
At 1 January – cash 23,723 20,937 60 19– cash equivalents 26,298 27,184 249 64
Net cash inflow 2,528 1,900 817 226At 31 December 52,549 50,021 1,126 309
Comprising:Cash and balances at central banks 4,456 4,035 — —Treasury bills and debt securities 998 3,016 — —Loans and advances to banks repayable on demand 47,095 42,970 1,126 309Cash and cash equivalents 52,549 50,021 1,126 309
Certain subsidiary undertakings are required to maintain balances with the Bank of England which, at 31 December 2005, amounted to £303 million (2004 – £260 million). Certain subsidiary undertakings are required by law to maintain reserve balances with the FederalReserve Bank in the US. Such reserve balances amounted to US$156 million at 31 December 2005 (2004 – US$132 million).
Notes on the accounts continued

section
03Fi
nanc
ial
stat
emen
ts
205
Not
es o
n th
e ac
coun
ts
Annual Report and Accounts 2005
41 Segmental analysis
The directors manage the Group primarily by class of business and present the segmental analysis on that basis. Segments chargemarket prices for services rendered to other parts of the Group with the exception of Manufacturing and central resources. Theexpenditure incurred by Manufacturing relates to shared costs principally in respect of the Group's UK and Ireland banking andinsurance operations. These costs reflect activities that are shared between the various customer-facing divisions and consequentlycannot be directly attributed to individual divisions. Funding charges between segments are determined by Group Treasury, havingregard to commercial demands.
(a) DivisionsGroup
Revenue Total Income
Depreciation Operating Inter Inter Operating and profit
External segment Total External segment Total expenses amortisation Provisions before tax2005 £m £m £m £m £m £m £m £m £m £m
Corporate Markets 14,633 3,724 18,357 11,062 (2,247) 8,815 (2,440) (816) (335) 5,224Retail Banking 7,086 1,333 8,419 5,507 (74) 5,433 (1,810) (13) (601) 3,009Retail Direct 3,751 183 3,934 2,123 (157) 1,966 (580) (25) (571) 790Wealth Management 870 1,129 1,999 (235) 1,049 814 (379) (14) (13) 408Ulster Bank 1,638 150 1,788 973 (115) 858 (246) (24) (58) 530Citizens 4,878 4 4,882 3,353 (89) 3,264 (1,407) (151) (131) 1,575RBS Insurance 6,194 67 6,261 5,501 (12) 5,489 (4,536) (27) — 926Manufacturing 55 6 61 (61) (34) (95) (2,125) (523) — (2,743)Central items 15 5,161 5,176 (2,654) 1,679 (975) (500) 5 2 (1,468)Eliminations — (11,757) (11,757) — — — — — — —Operating profit before
amortisation ofpurchased intangibles,integration costs andnet gain on sale ofstrategic investments 39,120 — 39,120 25,569 — 25,569 (14,023) (1,588) (1,707) 8,251
Amortisation ofintangibles — — — — — — — (97) — (97)
Integration costs — — — — — — (318) (140) — (458)Net gain on sale of
strategic investments 333 — 333 333 — 333 (93) — — 240Operating profit before tax 39,453 — 39,453 25,902 — 25,902 (14,434) (1,825) (1,707) 7,936
Group
Revenue Total Income
Depreciation Operating Inter Inter Operating and profit
External segment Total External segment Total expenses amortisation Provisions before tax2004 £m £m £m £m £m £m £m £m £m £m
Corporate Markets 11,809 4,007 15,816 9,548 (1,897) 7,651 (2,084) (760) (581) 4,226Retail Banking 6,907 1,283 8,190 5,460 120 5,580 (1,969) (10) (389) 3,212Retail Direct 3,917 109 4,026 1,933 (156) 1,777 (552) (27) (313) 885Wealth Management 861 918 1,779 18 755 773 (368) (30) (18) 357Ulster Bank 1,281 53 1,334 800 (57) 743 (224) (27) (40) 452Citizens 2,929 15 2,944 2,265 3 2,268 (1,003) (77) (117) 1,071RBS Insurance 5,630 33 5,663 5,064 (25) 5,039 (4,145) (31) — 863Manufacturing 43 15 58 (66) — (66) (2,132) (424) — (2,622)Central items — 2,065 2,065 (1,631) 1,257 (374) (204) 10 (27) (595)Eliminations — (8,498) (8,498) — — — — — — —Operating profit before
amortisation ofpurchased intangiblesand integration costs 33,377 — 33,377 23,391 — 23,391 (12,681) (1,376) (1,485) 7,849
Amortisation ofintangibles — — — — — — — (45) — (45)
Integration costs — — — — — — (267) (253) — (520)Operating profit before tax 33,377 — 33,377 23,391 — 23,391 (12,948) (1,674) (1,485) 7,284

206
Not
es o
n th
e ac
coun
tsNotes on the accounts continued
2005 2004
Cost to Cost toacquire fixed acquire fixed
assets and assets andintangible intangible
Assets Liabilities assets Assets Liabilities assetsGroup £m £m £m £m £m £m
Corporate Markets 499,206 456,258 3,674 352,889 320,263 3,438Retail Banking 83,077 83,334 1 78,521 76,726 107Retail Direct 27,210 2,941 23 23,479 4,160 80Wealth Management 10,078 26,369 42 9,034 23,478 17Ulster Bank 35,875 29,878 77 27,405 21,891 564Citizens 92,197 77,471 301 71,597 58,888 6,165RBS Insurance 12,523 8,925 172 11,215 8,356 38Manufacturing 5,638 1,788 998 5,548 2,149 1,318Central items 11,023 52,319 — 8,434 34,814 —Group 776,827 739,283 5,288 588,122 550,725 11,727
Segmental analysis of goodwill is as follows:Group
Corporate Retail Retail Wealth RBS UlsterMarkets Banking Direct Management Citizens Insurance Bank Centre Total
£m £m £m £m £m £m £m £m £m
At 1 January 2005 186 83 174 153 6,635 961 425 9,415 18,032Currency translation and other adjustments (5) — (3) (4) 809 — (11) — 786Arising on acquisitions during the year 1 1 8 — — 103 — — 113Disposals (96) — — (12) — — — — (108)At 31 December 2005 86 84 179 137 7,444 1,064 414 9,415 18,823
41 Segmental analysis (continued)

section
03Fi
nanc
ial
stat
emen
ts
207
Not
es o
n th
e ac
coun
ts
Annual Report and Accounts 2005
(b) Geographical segments
The geographical analyses in the tables below have been compiled on the basis of location of office where the transactions arerecorded
Group
Rest ofUK USA Europe the world Total
2005 £m £m £m £m £m
Net interest income 6,942 2,225 713 38 9,918Fees and commissions (net) 3,466 1,100 263 80 4,909Income from trading activities 1,263 959 56 65 2,343Other operating income 2,330 211 403 9 2,953Insurance premium income (net of reinsurers’ share) 5,462 — 317 — 5,779Total income 19,463 4,495 1,752 192 25,902
Operating profit before tax 5,278 2,032 602 24 7,936
Total assets 492,962 205,514 62,203 16,148 776,827
Total liabilities 473,581 191,189 58,527 15,986 739,283
Net assets attributable to equity shareholders and minority interests 19,381 14,325 3,676 162 37,544
Contingent liabilities and commitments 161,927 51,392 10,714 1,164 225,197
Cost to acquire property, plant and equipment and intangible assets 3,353 337 1,581 17 5,288
2004
Net interest income 6,454 1,825 751 41 9,071Fees and commissions (net) 3,455 717 301 74 4,547Income from trading activities 1,113 821 18 36 1,988Other operating income 1,741 109 284 4 2,138Insurance premium income (net of reinsurers’ share) 5,390 — 257 — 5,647Total income 18,153 3,472 1,611 155 23,391
Operating profit before tax 5,059 1,575 583 67 7,284
Total assets 382,623 145,748 45,845 13,906 588,122
Total liabilities 362,297 131,449 43,129 13,850 550,725
Net assets attributable to equity shareholders and minority interests 20,326 14,299 2,716 56 37,397
Contingent liabilities and commitments 151,489 37,972 6,791 618 196,870
Cost to acquire property, plant and equipment and intangible assets 3,811 6,178 1,736 2 11,727

208
Not
es o
n th
e ac
coun
tsNotes on the accounts continued
42 Directors’ and key management remuneration Group
2005 2004Directors’ remuneration £000 £000
Non-executive directors – emoluments 924 874Chairman and executive directors – emoluments 8,994 8,421Chairman and executive directors – contributions and allowances in respect of defined
contribution pension schemes 220 17810,138 9,473
Chairman and executive directors – amounts receivable under long-term incentive plans 4,778 2,189Chairman and executive directors – gains on exercise of share options 11 5
14,927 11,667
Retirement benefits are accruing to four directors (2004 – five) under defined benefit schemes, two (2004 – two) of whom also accrued benefits under defined contribution schemes.
The executive directors may also participate in the company’s executive share option, sharesave and option 2000 schemes and details of their interests in the company’s shares arising from their participation are contained on page 127. Details of the remunerationreceived by each director during the year and each director’s pension arrangements are given on pages 126 to 129.
Compensation of key managementThe aggregate remuneration of directors and other members of key management during the year was as follows:
Group
2005 2004£000 £000
Short-term benefits 26,180 23,652Post-employment benefits 9,383 5,298Other long-term 4,215 —Share-based payments 1,568 5,200
41,346 34,150

section
03Fi
nanc
ial
stat
emen
ts
209
Not
es o
n th
e ac
coun
ts
Annual Report and Accounts 2005
(a) At 31 December 2005, the amounts outstanding in relation to transactions, arrangements and agreements entered into byauthorised institutions in the Group, as defined by UK Law, were £149,537 in respect of loans to six persons who weredirectors of the company (or persons connected with them) at any time during the financial period and £2,055 to one personwho was an officer of the company at any time during the financial period.
(b) For the purposes of IAS 24 ‘Related Party Disclosures’, key management comprise directors of the company and members ofthe Group Executive Management Committee. The captions in the Group’s primary financial statements include the followingamounts attributable, in aggregate, to key management:
43 Transactions with directors, officers and others
2005 2004 £000 £000
Loans and advances to customers 3,090 2,497Customer accounts 12,604 8,021
Key management have banking relationships with Group entities which are entered into in the normal course of business.
Key management had no reportable transactions or balances with the company except for dividends.
(a) Group companies provide development and other types of capital support to businesses in their roles as providers of finance.These investments are made in the normal course of business and on arm’s-length terms. In some instances, the investmentmay extend to ownership or control over 20% or more of the voting rights of the investee company. However, these investmentsare not considered to give rise to transactions of a materiality requiring disclosure under IAS 24.
(b) The Group recharges The Royal Bank of Scotland Group Pension Fund with the cost of administration services incurred by it.The amounts involved are not material to the Group.
(c) In accordance with IAS 24, transactions or balances between Group entities that have been eliminated on consolidation are notreported.
(d) The captions in the primary financial statements of the parent company include amounts attributable to subsidiaries. Theseamounts have been disclosed in aggregate in the relevant notes to the financial statements.
44 Related parties

210
Not
es o
n th
e ac
coun
ts
UK GAAP
(a) GoodwillGoodwill arising on acquisitions after 1 October 1998 iscapitalised and amortised over its estimated useful economiclife. Goodwill arising on acquisitions before 1 October 1998was deducted from equity. Goodwill is reviewed for impairmentat the end of the first full year following an acquisition andsubsequently if events or changes in circumstances indicatedthat its carrying value might not be recoverable,
(b) Intangibles other than goodwillComputer software development costsMost computer software development costs are written off asincurred.
Other intangiblesAn intangible asset acquired in a business combination iscapitalised separately from goodwill only if it can be disposedof separately from the revenue-earning activity to which itcontributes and its value can be measured reliably.
(c) LeasingFinance lease income is recognised so as to give a level rateof return on the net cash investment in the lease; tax cashflows are taken into account in allocating income.
Assets held under operating leases are depreciated on astraight-line or reverse-annuity basis.
(d) DividendsDividends payable on ordinary shares are recorded in theperiod to which they relate.
(e) ConsolidationUK GAAP requires consolidation of entities controlled by thereporting entity. Control is the ability to direct the financial andoperating policies of an entity.
(f) Life assuranceTo reflect the distinct nature of long-term assurance assets andliabilities attributable to policyholders, they are shownseparately on the consolidated balance sheet; the results oflife assurance business are presented as a single contributionto profit before tax.
Changes in embedded value determined on a post-tax basisare grossed up for inclusion in the income statement.
45 Transition to IFRS(1) Significant differences between the Group’s UK GAAP accounting policies applied in its 2004 financial statements and its IFRS accounting policies
IFRS
Goodwill is recorded at cost less any accumulated impairmentlosses. Goodwill is tested annually for impairment or morefrequently if events or changes in circumstances indicate that itmight be impaired.
The carrying amount of goodwill in the Group’s opening IFRSbalance sheet (as at 1 January 2004) was £13,131 million, itscarrying value under UK GAAP as at 31 December 2003.
Computer software development costs are capitalised if theycreate an identifiable intangible asset. They are amortised overtheir estimated useful life of three years. Net computersoftware development costs of £818 million were recognisedon transition to IFRS.
An intangible asset is recognised as an asset separately fromgoodwill if it is separable or if it arises from contractual orother legal rights regardless of whether these rights aretransferable or separable.
Core deposit intangibles of £268 million, mortgage servicingrights of £81 million, customer relationships of £162 millionand other intangibles of £18 million were recognised inbusiness combinations that took place in 2004.
IFRS requires a level rate of return on the net investment in thelease. Tax cash flows are not reflected in the pattern of incomerecognition.
Assets held on operating leases are depreciated on a straight-line basis.
Dividends are recorded in the period in which they aredeclared.
All entities controlled by the Group are consolidated togetherwith special purpose entities (SPEs) where the substance ofthe relationship between the reporting entity and the SPEindicates that it is controlled by the reporting entity.
Assets, liabilities, income and expense of life assurancebusiness are consolidated on a line-by-line basis.
Movements in embedded value are not grossed up, insteadthey are included net of tax in profit before tax.
Notes on the accounts continued

section
03Fi
nanc
ial
stat
emen
ts
211
Not
es o
n th
e ac
coun
ts
Annual Report and Accounts 2005
UK GAAP
(g) Associates and joint venturesAn associate is an entity in which the reporting entity holds aparticipating interest and over whose operating and financialpolicies it exercises a significant influence in practice. A jointventure is an entity in which the reporting entity in practiceshares control with other investors. Associates are accountedfor using the equity method and joint ventures using the grossequity method.
(h) Property, plant and equipmentThe Group’s freehold and long leasehold property occupied forits own use is recorded at valuation on the basis of existinguse value.
(i) Investment propertyInvestment property is revalued annually to open market valueand changes in market value reflected in the Statement of totalrecognised gains and losses.
(j) Share-based paymentsNo expense is recognised for options over The Royal Bank ofScotland Group plc shares granted to employees.
(k) PensionsPension scheme assets are measured at fair value using mid-market prices.
(l) Income taxDeferred tax is not accounted for in relation to revaluations of fixedassets where there is no commitment to dispose of the asset or inrelation to taxable gains or losses on sales of fixed assets that arerolled over into the tax cost of replacement fixed assets.
(m) Cash flow statementsCash comprises cash and balances with central banks and loansand advances to banks repayable on demand.
Under UK GAAP, cash flows are classified under the followingheadings:
• operating activities• dividends from joint ventures and associates• returns on investments and servicing of finance• taxation• capital expenditure and financial investment• acquisitions and disposals• ordinary equity dividends paid• financing
IFRS
The definitions of associate and joint venture are similar tothose in UK GAAP. However, significant influence is defined asthe power to participate in the financial and operating policiesof the associate. A joint venture is an entity where the strategicfinancial and operating decisions require the unanimousconsent of the parties sharing control. Associates areaccounted for using the equity method. The Groupproportionately consolidates its joint ventures.
The Group’s freehold and long leasehold property occupied forits own use is recorded at cost less depreciation.
The Group has elected to use the UK GAAP valuation as at31 December 2003 as deemed cost for freehold and longleasehold property occupied for its own use in its openingIFRS balance sheet (1 January 2004).
Investment property is stated at fair value. Any gain or lossarising from a change in fair value is recognised in profit or loss.
The Group has applied IFRS 2 ‘Share-based Payment’ togrants of options over shares after 7 November 2002 that hadnot vested on 1 January 2005. The expense for thesetransactions is measured based on the fair value on the datethe options are granted. The fair value is expensed on astraight-line basis over the vesting period.
Pension scheme assets are measured at fair value using bidprices.
Deferred tax is provided on fixed asset revaluations and ontaxable gains and losses on fixed asset sales rolled over intothe tax cost of replacement assets.
Cash and cash equivalents comprise cash on hand anddemand deposits with banks together with short-term highlyliquid investments that are readily convertible to knownamounts of cash and subject to insignificant risk of changes invalue.
Under IFRS cash flows are classified into operating, investingand financing activities.

212
Not
es o
n th
e ac
coun
ts
UK GAAP
(n) Financial instruments: financial assets Loans are measured at cost less provisions for bad anddoubtful debts, derivatives held-for-trading are carried at fairvalue and hedging derivatives are accounted for inaccordance with the treatment of the item being hedged (see Derivatives and hedging below).
Debt securities and equity shares intended for use on acontinuing basis in the Group’s activities are classified asinvestment securities and are stated at cost less provision forany permanent diminution in value. The cost of datedinvestment securities is adjusted for the amortisation ofpremiums or discounts. Other debt securities and equityshares are carried at fair value.
(o) Financial instruments: financial liabilitiesUnder UK GAAP, short positions in securities and tradingderivatives are carried at fair value; all other financial liabilitiesare recorded at amortised cost.
(p) Liabilities and equity Under UK GAAP, all shares are classified as shareholders'funds. An analysis of shareholders’ funds between equity andnon-equity interests is given.
IFRS
Under IAS 39, financial assets are classified into held-to-maturity; available-for-sale; held-for-trading; designated as atfair value through profit or loss; and loans and receivables.Financial assets classified as held-to-maturity or as loans andreceivables are carried at amortised cost. Other financialassets are measured at fair value. Changes in the fair value ofavailable-for-sale financial assets are reported in a separatecomponent of shareholders’ equity. Changes in the fair value offinancial assets held-for-trading or designated as at fair valueare taken to profit or loss. Financial assets can be classified asheld-to-maturity only if they have a fixed maturity and thereporting entity has the positive intention and ability to hold tomaturity. Trading financial assets are held for the purpose ofselling in the near term. IFRS allows any financial asset to bedesignated as at fair value through profit or loss on initialrecognition. Unquoted debt financial assets that are notclassified as held-to-maturity, held-for-trading or designated asat fair value through profit or loss are categorised as loans andreceivables. All other financial assets are classified asavailable-for-sale.
IAS 39 requires all financial liabilities to be measured atamortised cost except those held-for-trading and those thatwere designated as at fair value through profit or loss on initialrecognition.
There is no concept of non-equity shares in IFRS. Instrumentsare classified between equity and liabilities in accordance withthe substance of the contractual arrangements. A non-derivative instrument is classified as equity if it does notinclude a contractual obligation either to deliver cash or toexchange financial instruments with another entity underpotentially unfavourable conditions, and, if the instrument willor may be settled by the issue of equity, settlement does notinvolve the issue of a variable number of shares. Onimplementation of IAS 32, non-equity shares with a balancesheet value of £3,192 million and £2,568 million of non-equityminority interests were reclassified as liabilities.
Notes on the accounts continued
Impementation of IAS 32, IAS 39 and IFRS 445 Transition to IFRS (continued)

section
03Fi
nanc
ial
stat
emen
ts
213
Not
es o
n th
e ac
coun
ts
Annual Report and Accounts 2005
UK GAAP
(q) Effective interest rate and lending feesUnder UK GAAP, loan origination fees are recognised whenreceived unless they are charged in lieu of interest.
(r) Derivatives and hedging Under UK GAAP non-trading derivatives are accounted for onan accruals basis in accordance with the accounting treatmentof the underlying transaction or transactions being hedged. Ifa non-trading derivative transaction is terminated or ceases tobe an effective hedge, it is re-measured at fair value and anygain or loss amortised over the remaining life of the underlyingtransaction or transactions being hedged. If a hedged item isderecognised the related non-trading derivative is remeasuredat fair value and any gain or loss taken to the incomestatement.
Embedded derivatives are not bifurcated from the hostcontract.
(s) Loan impairment Under UK GAAP provisions for bad and doubtful debts aremade so as to record impaired loans at their ultimate netrealisable value. Specific provisions are established againstindividual advances or portfolios of smaller balancehomogeneous advances and the general provision coversadvances impaired at the balance sheet date but which havenot been identified as such. Interest receivable from loans andadvances is credited to the income statement as it accruesunless there is significant doubt that it can be collected.
IFRS
IAS 39 requires the amortised cost of a financial instrument tobe calculated using the effective interest method. The effectiveinterest rate is the rate that discounts estimated future cashflows over an instrument’s expected life to its net carryingvalue. It takes into account all fees and points paid that are anintegral part of the yield, transaction costs and all otherpremiums and discounts.
On implementation of IAS 39, the carrying value of financialassets was reduced by £708 million and financial liabilitiesincreased by £224 million, deferred tax was reduced by £283million and shareholders’ equity reduced by £649 million.
Under IAS 39, all derivatives are measured at fair value. Hedgeaccounting is permitted for three types of hedge relationship:fair value hedge – the hedge of changes in the fair value of arecognised asset or liability or firm commitment; cash flowhedge – the hedge of variability in cash flows from arecognised asset or liability or a forecasted transaction; andthe hedge of a net investment in a foreign entity. In a fair valuehedge the gain or loss on the derivative is recognised in profitor loss as it arises offset by the corresponding gain or loss onthe hedged item attributable to the risk hedged. In a cash flowhedge and in the hedge of a net investment in a foreign entity,the element of the derivative’s gain or loss that is an effectivehedge is recognised directly in equity. The ineffective elementis taken to the income statement. Certain conditions must bemet for a relationship to qualify for hedge accounting. Theseinclude designation, documentation and prospective andactual hedge effectiveness. On implementation of IAS 39, non-trading derivatives were remeasured at fair value.
A derivative embedded in a contract is accounted for as astand-alone derivative if its economic characteristics are notclosely related to the economic characteristics of the hostcontract, unless the entire contract is carried at fair valuethrough profit or loss.
IFRS require impairment losses on financial assets carried atamortised cost to be measured as the difference between theasset's carrying amount and the present value of estimatedfuture cash flows discounted at the asset's original effectiveinterest rate. There is no concept of specific and generalprovision – under IFRS impairment is assessed individually forindividually significant assets but can be assessed collectivelyfor other assets. Once an impairment loss has beenrecognised on a financial asset or group of financial assets,interest income is recognised on the carrying amount using therate of interest at which estimated future cash flows werediscounted in measuring impairment.
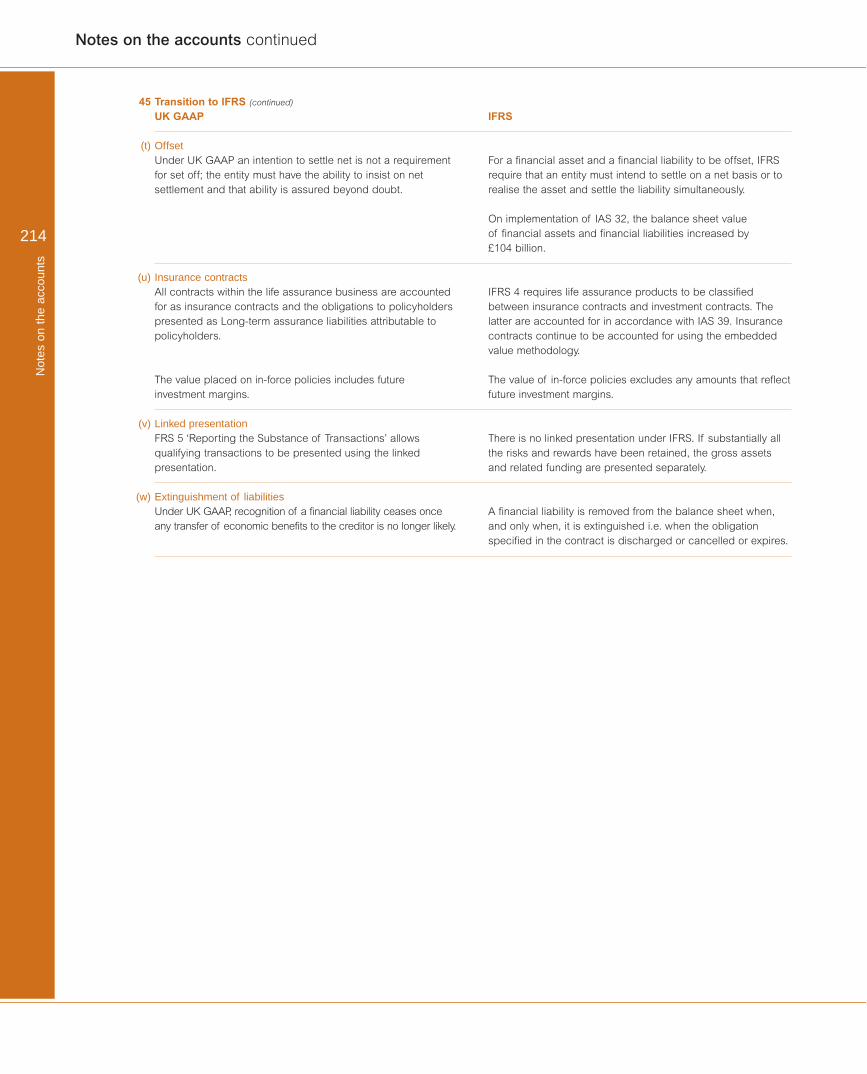
214
Not
es o
n th
e ac
coun
ts
UK GAAP
(t) Offset Under UK GAAP an intention to settle net is not a requirementfor set off; the entity must have the ability to insist on netsettlement and that ability is assured beyond doubt.
(u) Insurance contractsAll contracts within the life assurance business are accountedfor as insurance contracts and the obligations to policyholderspresented as Long-term assurance liabilities attributable topolicyholders.
The value placed on in-force policies includes futureinvestment margins.
(v) Linked presentationFRS 5 ‘Reporting the Substance of Transactions’ allowsqualifying transactions to be presented using the linkedpresentation.
(w) Extinguishment of liabilitiesUnder UK GAAP, recognition of a financial liability ceases onceany transfer of economic benefits to the creditor is no longer likely.
IFRS
For a financial asset and a financial liability to be offset, IFRSrequire that an entity must intend to settle on a net basis or torealise the asset and settle the liability simultaneously.
On implementation of IAS 32, the balance sheet value of financial assets and financial liabilities increased by £104 billion.
IFRS 4 requires life assurance products to be classifiedbetween insurance contracts and investment contracts. Thelatter are accounted for in accordance with IAS 39. Insurancecontracts continue to be accounted for using the embeddedvalue methodology.
The value of in-force policies excludes any amounts that reflectfuture investment margins.
There is no linked presentation under IFRS. If substantially allthe risks and rewards have been retained, the gross assetsand related funding are presented separately.
A financial liability is removed from the balance sheet when,and only when, it is extinguished i.e. when the obligationspecified in the contract is discharged or cancelled or expires.
Notes on the accounts continued
45 Transition to IFRS (continued)

section
03Fi
nanc
ial
stat
emen
ts
215
Not
es o
n th
e ac
coun
ts
Annual Report and Accounts 2005
(2) Analysis of IFRS adjustments, excluding IAS 32, IAS 39 and IFRS 4
Opening balance sheet at 1 January 2004 – Group Software Share development Investment based Employee Total
UK GAAP Dividends Income tax Leases Consolidation costs property payment benefits Insurance adjustments IFRS£m £m £m £m £m £m £m £m £m £m £m £m
AssetsCash and balances at central banks 3,822 — — — — — — — — — — 3,822Treasury bills and other eligible bills 4,846 — — — — — — — — — — 4,846Loans and advances to banks 54,392 — — — (2) — — — — 1,013 1,011 55,403Loans and advances to customers 252,531 — — (147) 1,798 — (448) — — (541) 662 253,193Debt securities 79,949 — — — 123 — — — — 1,076 1,199 81,148Equity shares 2,300 — — — — — — — — 1,745 1,745 4,045Intangible assets 13,131 — — — — 896 — — — — 896 14,027Property, plant and equipment 13,927 — — (127) 76 (78) 448 — — 1 320 14,247Settlement balances 2,857 — — — — — — — — — — 2,857Derivatives at fair value 14,087 — — — — — — — — (40) (40) 14,047Prepayments, accrued income
and other assets 9,029 — — — 72 1 — — (10) 256 319 9,348Long-term assurance assets 3,557 — — — — — — — — (3,557) (3,557) —Total assets 454,428 — — (274) 2,067 819 — — (10) (47) 2,555 456,983
LiabilitiesDeposits by banks 68,281 — — — — — — — — — — 68,281Customer accounts 236,963 — — — (1,002) — — — — (495) (1,497) 235,466Debt securities in issue 41,016 — — — 3,129 — — — — — 3,129 44,145Settlement balances and
short positions 21,369 — — — — — — — — — — 21,369Derivatives at fair value 15,173 — — — — — — — — (105) (105) 15,068Accruals, deferred income
and other liabilities 18,779 (1,059) — 2 238 — — 6 — (3,596) (4,409) 14,370Retirement benefit liabilities 1,445 — — — — — — — 591 — 591 2,036Deferred taxation liabilities 2,036 — 109 (75) 13 243 — (2) (584) (4) (300) 1,736Insurance liabilities — — — — — — — — — 7,781 7,781 7,781Subordinated liabilities 16,998 — — — — — — — — — — 16,998Minority interests 2,713 — — — (313) 5 — — — (13) (321) 2,392Shareholders’ equity 26,098 1,059 (109) (201) 2 571 — (4) (17) (58) 1,243 27,341Long-term assurance liabilities 3,557 — — — — — — — — (3,557) (3,557) —Total liabilities and equity 454,428 — — (274) 2,067 819 — — (10) (47) 2,555 456,983

216
Not
es o
n th
e ac
coun
ts
Opening balance sheet at 1 January 2004 – Company Valuation of Total
UK GAAP Dividends subsidiaries adjustments IFRS£m £m £m £m £m
AssetsLoans and advances to banks 4,257 — — — 4,257Loans and advances to customers 382 — — — 382Investments in Group undertakings 32,354 — (16,857) (16,857) 15,497Prepayments, accrued income and other assets 355 — — — 355Total assets 37,348 — (16,857) (16,857) 20,491
LiabilitiesDeposits by banks 156 — — — 156Debt securities in issue 1,877 — — — 1,877Accruals, deferred income and other liabilities 1,377 (1,059) — (1,059) 318Subordinated liabilities 5,393 — — — 5,393Shareholders’ equity 28,545 1,059 (16,857) (15,798) 12,747Total liabilities and equity 37,348 — (16,857) (16,857) 20,491
Reconciliation of shareholders’ funds as at 1 January 2004 Group Company£m £m
UK GAAP shareholders’ funds 26,098 28,545Standards applicable to all periods:Valuation of subsidiaries — (16,857)Proposed dividend 1,059 1,059Software development costs 814 ––Leasing (276) ––Share-based payments (6) ––Other (72) ––Tax effect on adjustments (167) ––Deferred tax (109) ––Shareholders' funds under IFRS 27,341 12,747
Notes on the accounts continued
45 Transition to IFRS (continued)

section
03Fi
nanc
ial
stat
emen
ts
217
Not
es o
n th
e ac
coun
ts
Annual Report and Accounts 2005
Balance sheet at 31 December 2004 – GroupProperty Software Share
plant and development Investment based Employee TotalUK GAAP Dividends Income tax equipment Leases Consolidation costs property payment benefits Insurance Goodwill adjustments IFRS
£m £m £m £m £m £m £m £m £m £m £m £m £m £m
AssetsCash and balances at
central banks 4,293 — — — — — — — — — — — — 4,293Treasury bills and other
eligible bills 6,110 — — — — — — — — — — — — 6,110Loans and advances
to banks 60,889 — — — — (2) — — — — 186 — 184 61,073Loans and advances
to customers 345,469 — — — (132) 3,173 — (449) — — (810) — 1,782 347,251Debt securities 91,211 — — — — 618 — — — — 2,079 — 2,697 93,908Equity shares 2,960 — — — — — — — — — 1,763 — 1,763 4,723Intangible assets 17,576 — — — — — 725 — — — — 941 1,666 19,242Property, plant and
equipment 16,294 — — (60) (153) 67 (168) 447 — — 1 — 134 16,428Settlement balances 5,682 — — — — — — — — — — — — 5,682Derivatives at fair value 17,884 — — — — (37) — — — — (47) — (84) 17,800Prepayments, accrued
income and otherassets 11,299 — — — (9) 118 — 1 — (4) 283 (76) (313) 11,612
Long-term assuranceassets 3,800 — — — — — — — — — (3,800) — (3,800) —
Total assets 583,467 — — (60) (294) 3,937 557 (1) — (4) (345) 865 4,655 588,122
LiabilitiesDeposits by banks 99,883 — — — — — — — — — — — — 99,883Customer accounts 285,062 — — — — (1,015) — — — — (732) — (1,747) 283,315Debt securities
in issue 58,960 — — — — 5,039 — — — — — — 5,039 63,999Settlement balances
and short positions 32,990 — — — — — — — — — — — — 32,990Derivatives at fair value 19,034 — — — — — — — — — (158) — (158) 18,876Accruals, deferred
income and otherliabilities 22,904 (1,308) — — 25 258 — — 20 — (4,251) — (5,256) 17,648
Retirement benefitliabilities 1,901 — — — — 14 — — — 1,025 — — 1,039 2,940
Deferred taxation liabilities 2,873 — 109 — (90) 9 164 1 (6) (1,008) 12 (3) (812) 2,061
Insurance liabilities — — — — — — — — — — 8,647 — 8,647 8,647Subordinated liabilities 20,366 — — — — — — — — — — — — 20,366Minority interests 3,829 — — — — (334) 6 — — — (9) — (337) 3,492Shareholders’ equity 31,865 1,308 (109) (60) (229) (34) 387 (2) (14) (21) (54) 868 2,040 33,905Long-term assurance
liabilities 3,800 — — — — — — — — — (3,800) — (3,800) —Total liabilities
and equity 583,467 — — (60) (294) 3,937 557 (1) — (4) (345) 865 4,655 588,122

218
Not
es o
n th
e ac
coun
tsNotes on the accounts continued
Balance sheet at 31 December 2004 – CompanyValuation
of TotalUK GAAP Dividends subsidiaries adjustments IFRS
£m £m £m £m £m
AssetsLoans and advances to banks 4,106 — — — 4,106Loans and advances to customers 305 — — — 305Investments in Group undertakings 36,870 — (14,970) (14,970) 21,900Prepayments, accrued income and other assets 322 (4) — (4) 318Total assets 41,603 (4) (14,970) (14,974) 26,629
LiabilitiesDeposits by banks 174 — — — 174Debt securities in issue 1,608 — — — 1,608Accruals, deferred income and other liabilities 1,609 (1,308) — (1,308) 301Subordinated liabilities 5,935 — — — 5,935Shareholders’ equity 32,277 1,304 (14,970) (13,666) 18,611Total liabilities 41,603 (4) (14,970) (14,974) 26,629
Consolidated income statement for the year ended 31 December 2004
Property,including Software Share
investment development based Employee TotalUK GAAP property Leases Consolidation costs payments benefits Insurance Goodwill Other adjustments IFRS
£m £m £m £m £m £m £m £m £m £m £m £m
Net interest income 9,208 (21) (18) (67) 16 — — (47) — — (137) 9,071Non-interest income 8,602 22 27 (142) — — (85) 251 — (2) 71 8,673Insurance net premium income 4,944 — — 109 — — — 594 — — 703 5,647Total income 22,754 1 9 (100) 16 — (85) 798 — (2) 637 23,391Operating expenses 10,846 5 49 2 278 36 (83) 106 (875) (2) (484) 10,362Insurance net claims 3,480 — — 78 — — — 702 — — 780 4,260Operating profit before
impairment losses 8,428 (4) (40) (180) (262) (36) (2) (10) 875 — 341 8,769Impairment losses 1,511 — — (26) — — — — — — (26) 1,485Operating profit before tax 6,917 (4) (40) (154) (262) (36) (2) (10) 875 — 367 7,284Tax 2,155 1 (12) (40) (79) (11) — (17) (2) — (160) 1,995Profit for the year 4,762 (5) (28) (114) (183) (25) (2) 7 877 — 527 5,289
Company income statement for the year ended 31 December 2004
TotalUK GAAP Other adjustments IFRS
£m £m £m £m
Profit for the year 2,878 (4) (4) 2,874
45 Transition to IFRS (continued)

section
03Fi
nanc
ial
stat
emen
ts
219
Not
es o
n th
e ac
coun
ts
Annual Report and Accounts 2005
(3) Analysis of IAS 32, IAS 39 and IFRS 4 adjustments
Balance sheet at 1 January 2005 – GroupIFRS prospective adjustments
IFRS Provisioning Fair IFRS31 December Other Debt Classification/ Embedded and Hedging/ Revenue Insurance value Total 1 January
2004 Offset IAS 39 equity measurement derivatives impairment measurement Derecognition recognition contracts option Other adjustments 2005£m £m £m £m £m £m £m £m £m £m £m £m £m £m £m
Assets
Cash and balances at central banks 4,293 — — — — — — — — — — — — — 4,293
Treasury bills and other eligible bills 6,110 — — — (1) — — — — — — — — (1) 6,109
Loans and advances to banks 61,073 4,425 165 — — — — 4 — — 23 — 1 4,618 65,691
Loans and advances to customers 347,251 28,566 1,533 — (31) — (82) 518 4,022 (615) — — — 33,911 381,162
Debt securities 93,908 — 747 — (241) — — 50 (580) — 31 — — 7 93,915
Equity shares 4,723 — — — 507 — — — — — — — 1 508 5,231
Intangible assets 19,242 — — — — — — — — — — — — — 19,242
Property, plant and equipment 16,428 — — — — — — — — (3) — — — (3) 16,425
Settlement balances 5,682 — — — — — — — — — — — — — 5,682
Derivatives at fair value 17,800 71,509 — — (18) 114 — 520 — — — (20) — 72,105 89,905
Prepayments,accrued incomeand other assets 11,612 (29) (2,445) — (1) 3 — (379) 327 (90) (142) — (1) (2,757) 8,855
Total assets 588,122 104,471 — — 215 117 (82) 713 3,769 (708) (88) (20) 1 108,388 696,510
Liabilities
Deposits by banks 99,883 4,425 207 — — — — 10 1,501 — — — 6,143 106,026
Customer accounts 283,315 28,566 937 — (2) (39) — (11) 177 — 2,102 — 1 31,731 315,046
Debt securities in issue 63,999 — 342 — (25) — — (1,060) 2,131 — — 858 — 2,246 66,245
Settlement balances
and short positions 32,990 — 349 — — — — — — — — — — 349 33,339
Derivatives at fair value 18,876 71,509 — — (19) 188 — 1,599 — — — (876) — 72,401 91,277
Accruals, deferred income and other assets 17,648 (29) (2,346) (60) 32 (32) — (636) 130 224 (162) (49) — (2,928) 14,720
Retirement benefit liablities 2,940 — — — — — — — — — — — — — 2,940
Deferred taxation liabilities 2,061 — — — 65 — (24) 12 (51) (283) 46 — — (235) 1,826
Insurance liabilities 8,647 — — — — — — — — — (2,055) — — (2,055) 6,592
Subordinated liabilities 20,366 — 511 5,820 — — — 782 — — — 47 — 7,160 27,526
Minority interests 3,492 — — (2,493) — — — — — — (48) — — (2,541) 951
Shareholders’ equity 33,905 — — (3,267) 164 — (58) 17 (119) (649) 29 — — (3,883) 30,022
Total liabilitiesand equity 588,122 104,471 — — 215 117 (82) 713 3,769 (708) (88) (20) 1 108,388 696,510

220
Not
es o
n th
e ac
coun
tsNotes on the accounts continued
Balance sheet at 1 January 2005 – CompanyIFRS prospective adjustments
IFRS Fair IFRS31 December Debt/ Other Hedging & value Total 1 January
2004 equity IAS 32/39 measurement option adjustments 2005£m £m £m £m £m £m £m
AssetsLoans and advances to banks 4,106 3,959 91 — — 4,050 8,156Loans and advances to customers 305 153 95 — — 248 553Investment in Group undertakings 21,900 (4,004) — — — (4,004) 17,896Derivatives at fair value — — 101 4 — 105 105Prepayments, accrued income and other assets 318 — (287) (17) — (304) 14Total assets 26,629 108 — (13) — 95 26,724
LiabilitiesDeposits by banks 174 — — — — — 174Debt securities in issue 1,608 — 6 — — 6 1,614Derivatives at fair value — — 96 — — 96 96Accruals, deferred income and other liabilities 301 (31) (146) — (45) (222) 79Subordinated liabilities 5,935 3,219 44 — 45 3,308 9,243Shareholders’ funds 18,611 (3,080) — (13) — (3,093) 15,518Total liabilities 26,629 108 — (13) — 95 26,724
Reconciliation of shareholders’ funds Group Company£m £m
UK GAAP shareholders’ funds at 31 December 2004 31,865 32,277Standards applicable to all periods:Valuation of subsidiaries — (14,970)Proposed dividend 1,308 1,308Goodwill and other intangibles 865 —Software development costs 551 —Leasing (319) —Share-based payments (20) —Other (159) (4)Tax effect on adjustments (77) —Deferred tax (109) —Shareholders’ funds under IFRS at 31 December 2004 33,905 18,611Standards applicable from 1 January 2005:Non-equity shares reclassified to debt (3,192) (3,192)Revenue recognition (932) —Derecognition (170) —Securities 229 —Investments in Group undertakings adjusted to historic cost — 108Other (53) (14)Tax effect on adjustments 235 5Shareholders’ funds under IFRS at 1 January 2005 30,022 15,518Equity – minority interests 951 —Equity under IFRS at 1 January 2005 30,973 15,518
Group Company
Fair value on Carrying value Fair value on Carrying valueimplementation of IAS 39 under UK GAAP implementation of IAS 39 under UK GAAP
As at 1 January 2005 £m £m £m £m
Financial assets– designated as at fair value through profit or loss 2,579 2,728 — —– Available-for-sale 40,161 39,718 — —
Financial liabilities– designated as at fair value through profit or loss 9,976 10,071 — —
45 Transition to IFRS (continued)

section
03Fi
nanc
ial
stat
emen
ts
221
Not
es o
n th
e ac
coun
ts
Annual Report and Accounts 2005
46 Significant differences between IFRS and US GAAPThe consolidated accounts of the Group have been prepared in accordance with IFRS issued and extant at 31 December 2005which differ in certain significant respects from US GAAP. The significant differences which affect the Group are summarised below inthree separate sections:
Section (1) covers significant differences between US GAAP and IFRS for the income statement for the year ended 31 December 2005and the balance sheet at 31 December 2005. These differences include those between US GAAP and IAS 32, IAS 39 and IFRS 4.As permitted by IFRS 1, the Group implemented IAS 32, IAS 39 and IFRS 4 from 1 January 2005 without restating comparatives.
Section (2) sets out the significant differences between US GAAP and IFRS for 2004.
Section (3) summarises those areas where, though the recognition and measurement principles in US GAAP and IFRS are the same,adjustments to IFRS amounts are required due to differing implementation dates for the Group.
(1) For 31 December 2005
IFRS
(a) Acquisition accountingAll integration costs relating to acquisitions are expensed aspost-acquisition expenses.
(b) Property revaluation and depreciationFreehold and long leasehold property occupied for the Group'suse is carried at cost less accumulated depreciation.Depreciation is charged based on an estimated useful life of50 years. As permitted by IFRS 1, valuation as at 31 December2003 is its deemed cost.
Investment properties are carried at fair value; changes in fairvalue are included in the income statement.
(c) Leasehold property provisionsProvisions are recognised on leasehold properties when thereis a commitment to vacate the property.
(d) Loan origination Only costs that are incremental and directly attributable to theorigination of a loan are deferred over the period of the relatedloan or facility.
(e) Pension costsPension scheme assets are measured at their fair value.Scheme liabilities are measured on an actuarial basis using theprojected unit method and discounted at the current rate ofreturn on a high quality corporate bond of equivalent term andcurrency. Any surplus or deficit of scheme assets comparedwith liabilities is recognised in the balance sheet as an asset(surplus) or liability (deficit). An asset is only recognised to theextent that the surplus can be recovered through reducedcontributions in the future or through refunds from the scheme.
US GAAP
Certain restructuring and exit costs incurred in the acquiredbusiness are treated as liabilities assumed on acquisition andtaken into account in the calculation of goodwill.
Under US GAAP, revaluations of property are not permitted.Depreciation is charged, and gains or losses on disposal arebased on the historical cost for both own-use and investmentproperties.
Provisions are recognised on leasehold properties at the timethe property is vacated.
Certain direct (but not necessarily incremental) costs aredeferred and recognised over the period of the related loan orfacility.
US GAAP requires a similar method but allows a certainportion of actuarial gains and losses to be deferred andallocated in equal amounts over the average remaining servicelives of current employees. An additional minimum liabilitymust be recognised if the accumulated benefit obligation (thecurrent value of accrued benefits without allowance for futuresalary increases) exceeds the fair value of plan assets and theGroup has recorded a prepaid pension cost or has an accruedliability that is less than the unfunded accumulated benefitobligation. Movements in the additional minimum liability,together with the related deferred tax, are recognised in aseparate component of equity.

222
Not
es o
n th
e ac
coun
tsNotes on the accounts continued
IFRS
(f) Long-term assurance business IFRS requires bancassurance contracts to be analysedbetween insurance and investment contracts. Investmentcontracts are accounted for as financial instruments. Insurancecontracts are accounted for using an embedded valuemethodology: the shareholders’ interest in the long-termassurance fund is valued as the discounted value of the cashflows expected to be generated from in-force policies togetherwith net assets in excess of the statutory liabilities.
(g) Financial instrumentsFinancial assets designated as at fair value through profit or lossUnder IFRS, a financial asset may be designated as at fairvalue through profit or loss on initial recognition.
Debt securities classified as loans and receivablesNon-derivative financial assets with fixed or determinablerepayments that are not quoted in an active market areclassified as loans and receivables except those that areclassified as held-to-maturity, held-for-trading, available-for-saleor designated as at fair value through profit or loss. Loans andreceivables are initially recognised at fair value plus directlyrelated transaction costs. They are subsequently measured atadjusted cost using the effective interest method less anyimpairment losses. The Group has classified some debtsecurities as loans and receivables.
Financial assets other than debt securities and equity sharesclassified as available-for-saleUnder IAS 39 financial assets classified as available-for-salemay take any legal form.
Foreign exchange gains and losses on monetary available-for-sale financial assetsFor the purposes of recognising foreign exchange gains andlosses, a monetary available-for-sale financial asset is treatedas if it were carried at amortised cost in the foreign currency.Accordingly, for such financial assets, exchange differencesresulting from retranslating amortised cost are recognised inprofit or loss.
Financial liabilitiesAll financial liabilities held-for-trading are classified as suchand carried at fair value with changes in fair value recognisedin net income. A financial liability may be designated as at fairvalue through profit or loss.
US GAAP
US GAAP also requires bancassurance contracts to beclassified either as insurance or investment contracts; howeverUS GAAP does not permit embedded value reporting.
US GAAP requires deferred acquisition cost and incomeaccounting for all contracts. Where investment contract policycharges benefit future periods, they are deferred andamortised.
Such designation is not allowed under US GAAP.
Under US GAAP, these debt securities are classified asavailable-for-sale securities with unrealised gains and lossesreported in a separate component of equity, except when theunrealised loss is considered other than temporary in whichcase the loss is included in net income.
Under US GAAP, only debt and equity securities can beclassified as available-for-sale. (Such securities are measuredat fair value with unrealised gains and losses reported in aseparate component of equity).
Such differences are included with other unrealised gains andlosses and reported in a separate component of equity.
Only financial liabilities that are derivatives and short positionsare carried at fair value with changes in fair value recognisedin net income.
46 Significant differences between IFRS and US GAAP (continued)

section
03Fi
nanc
ial
stat
emen
ts
223
Not
es o
n th
e ac
coun
ts
Annual Report and Accounts 2005
IFRS
(h) Derivatives and hedging activitiesGains and losses arising from changes in fair value of aderivative are recognised as they arise in profit or loss unlessthe derivative is the hedging instrument in a qualifying hedge.The Group enters into three types of hedge relationship:hedges of changes in the fair value of a recognised asset orliability or firm commitment (fair value hedges); hedges of thevariability in cash flows from a recognised asset or liability or aforecast transaction (cash flow hedges); and hedges of the netinvestment in a foreign entity.
(i) Liabilities and equity The Group classifies a financial instrument that it issues as a financial asset, financial liability or an equity instrument in accordance with the substance of the contractualarrangement. An instrument is classified as a liability if there is a contractual obligation to deliver cash or another financialasset, or to exchange financial assets or financial liabilities onpotentially unfavourable terms. An instrument is classified asequity if it evidences a residual interest in the assets of theGroup after the deduction of liabilities.
(j) Offset arrangementsA financial asset and a financial liability are offset and the netamount reported in the balance sheet when, and only when,the reporting entity currently has a legally enforceable right toset off the recognised amounts; and intends either to settle ona net basis, or to realise the asset and settle the liabilitysimultaneously.
Arrangements such as master netting arrangements do notgenerally provide a basis for offsetting.
US GAAP
US GAAP principles are similar to IFRS. There are howeverdifferences in their detailed application. The Group has notrecognised any hedge relationships for US GAAP purposesexcept hedges of net investments in foreign operations. Allderivatives are measured at fair value with changes in fairvalue recognised in net income.
Under US GAAP, preference shares issued by the Group areclassified as equity as they are perpetual and redeemable onlyat the option of the Group.
Certain trusts and partnerships that are subsidiaries underIFRS are not consolidated under US GAAP because the Group is not their primary beneficiary. As a result securitiesissued by them are reclassified from minority interests tosubordinated liabilities.
Under US GAAP, debit and credit balances with the samecounterparty may be offset only where there is a legallyenforceable right of set-off and the intention to settle on a netbasis. However, fair value amounts for forward, interest rateswap, currency swap, option, and other conditional orexchange contracts executed with the same counterpartyunder a master netting agreement may be offset as mayrepurchase and reverse repurchase agreements that areexecuted under a master netting agreement with the samecounterparty and have the same settlement date.
This GAAP difference has no effect on net income orshareholders’ equity.

224
Not
es o
n th
e ac
coun
ts
IFRS or relevant UK GAAP
(a) Acquisition accountingAll integration costs relating to acquisitions are expensed aspost-acquisition expenses.
(b) Property revaluation and depreciationFreehold and long leasehold property occupied for the Group'suse is carried at cost less accumulated depreciation.Depreciation is charged based on an estimated useful life of50 years. As permitted by IFRS 1, valuation as at 31 December2003 is its deemed cost.
Investment properties are carried at fair value; changes in fairvalue are included in the income statement.
(c) Leasehold property provisionsProvisions are raised on leasehold properties when there is acommitment to vacate the property.
(d) Loan origination feesCertain loan fees, together with related costs, are recognisedin the income statement as received or incurred.
(e) Pension costsPension scheme assets are measured at their fair value.Scheme liabilities are measured on an actuarial basis using theprojected unit method and discounted at the current rate ofreturn on a high quality corporate bond of equivalent term andcurrency. Any surplus or deficit of scheme assets comparedwith liabilities is recognised in the balance sheet as an asset(surplus) or liability (deficit). An asset is only recognised to theextent that the surplus can be recovered through reducedcontributions in the future or through refunds from the scheme.
(f) Long-term assurance businessThe shareholders’ interest in the long-term assurance fund isvalued as the discounted value of the cash flows expected tobe generated from in-force policies together with net assets inexcess of the statutory liabilities.
(g) Extinguishment of liabilitiesRecognition of a financial liability ceases once any transfer ofeconomic benefits to the creditor is no longer likely.
US GAAP
Certain restructuring and exit costs incurred in the acquiredbusiness are treated as liabilities assumed on acquisition andtaken into account in the calculation of goodwill.
Under US GAAP, revaluations of property are not permitted.Depreciation is charged, and gains or losses on disposal arebased on the historical cost for both own-use and investmentproperties.
Provisions are recognised on leasehold properties at the timethe property is vacated.
Applicable non-refundable loan fees and certain direct costsare deferred and recognised over the period of the relatedloan or facility.
US GAAP requires similar valuations but allows a certainportion of actuarial gains and losses to be deferred andallocated in equal amounts over the average remaining servicelives of current employees. An additional minimum liabilitymust be recognised if the accumulated benefit obligation (thecurrent value of accrued benefits without allowance for futuresalary increases) exceeds the fair value of plan assets and theGroup has recorded a prepaid pension cost or has an accruedliability that is less than the unfunded accumulated benefitobligation. Movements in the additional minimum liability,together with the related deferred tax, are recognised in aseperate component of equity.
US GAAP does not permit embedded value reporting. USGAAP requires bancassurance contracts to be classified eitheras insurance or investment contracts.
US GAAP requires deferred acquisition cost and incomeaccounting for all contracts. Where investment contract policycharges benefit future periods, they are deferred and amortised.
A financial liability is derecognised only when the creditor ispaid or the debtor is legally released from being the primaryobligator under the liability, either judicially or by the creditor.
(2) For 2004 As indicated above, as permitted by IFRS 1, in the preparation of the Group's 2004 consolidated income statements and balancesheets, all IFRS have been applied except those relating to financial instruments and insurance contracts where UK GAAP principlesthen current have been applied.
Notes on the accounts continued
46 Significant differences between IFRS and US GAAP (continued)

section
03Fi
nanc
ial
stat
emen
ts
225
Not
es o
n th
e ac
coun
ts
Annual Report and Accounts 2005
IFRS or relevant UK GAAP
(h) SecuritiesThe Group’s debt and equity securities are classified as beingheld as investment securities or for trading purposes. Investmentsecurities are stated at cost less provision for any permanentdiminution in value. Premiums and discounts on dated debtsecurities are amortised to interest income over the period tomaturity. Securities held for trading purposes are carried at fairvalue with changes in fair value recognised in profit or loss.
(i) Derivatives and hedging activitiesNon-trading derivatives are entered into by the Group to hedgeexposures arising from transactions entered into in the normalcourse of banking activities. They are recognised in the accountsin accordance with the accounting treatment of the underlyingtransaction or transactions being hedged. To be classified as non-trading, a derivative must match or eliminate the risk inherent inthe hedged item from potential movements in interest rates,exchange rates and market values. In addition, there must be ademonstrable link to an underlying transaction, pool of transactionsor specified future transaction or transactions. Specified futuretransactions must be reasonably certain to arise for the derivativeto be accounted for as a hedge. In the event that a non-tradingderivative transaction is terminated or ceases to be an effectivehedge, the derivative is remeasured at fair value and any resultingprofit or loss amortised over the remaining life of the underlyingtransaction or transactions being hedged. If a hedged item isderecognised, or a specified future transaction is no longer likelyto occur, the related non-trading derivative is remeasured at fairvalue and the resulting profit or loss taken to the income statement.
Monetary assets denominated in a foreign currency areretranslated at closing rates with exchange differences taken toprofit or loss. Equity shares financed by foreign currencyborrowings are retranslated at closing rates with exchangedifferences taken to reserves along with differences on therelated borrowings.
Embedded derivatives are not bifurcated from the host contract.
(j) ConsolidationAll entities controlled by the Group are consolidated togetherwith special purpose entities (SPEs) where the substance of therelationship between the reporting entity and the SPE indicatesthat it is controlled by the reporting entity.
US GAAP
Investment securities held by the Group’s private equity businessare considered to be held by investment companies andcarried at fair value, with changes in fair value being reflected innet income. The Group’s other investment debt securities andmarketable investment equity shares are classified as available-for-sale securities and measured at fair value with unrealisedgains and losses reported in a separate component of equity,except when the unrealised loss is considered other-than-temporary in which case the loss is included in net income.The Group recognises an other-than-temporary impairment on anavailable-for-sale equity share when its carrying value hasexceeded its market value for a period of more than twelve months.
The Group has not made changes in its use of non-tradingderivatives to meet the hedge criteria in SFAS 133 ‘Accountingfor Derivative Instruments and Hedging Activities’. For USGAAP purposes, its portfolio of non-trading derivatives isremeasured to fair value and changes in fair value reflected innet income.
SFAS 133 does not permit a non-derivative financial instrumentto be designated as the hedging instrument in a fair value hedgeof the foreign exchange exposure of available-for-sale securities.
SFAS 133 requires derivatives embedded in other financialinstruments to be accounted for on a stand-alone basis if theyhave economic characteristics and risks that differ from thoseof the host instrument.
US GAAP requires consolidation by the primary beneficiary ofa variable interest entity (VIE). An enterprise is the primarybeneficiary of a VIE if it will absorb a majority of the entity’sexpected losses, receive a majority of the entity's expectedresidual returns, or both. In accordance with the provisions ofFIN46R, trust preferred securities issued by subsidiaries are ineffect re-classified from minority interests to liabilities.
Certain trusts and partnerships that are subsidiaries underIFRS are not consolidated under US GAAP because the Groupis not their primary beneficiary. As a result securities issued bythem are reclassified from minority interests to subordinatedliabilities.

226
Not
es o
n th
e ac
coun
ts
IFRS or relevant UK GAAP
(k) Offset arrangementsDebit and credit balances with the same counterparty areaggregated into a single item where there is a right to insist onnet settlement and the debit balance matures no later than thecredit balance.
IFRS
Intangible assetsPurchased goodwillPurchased goodwill is recorded at cost less any accumulatedimpairment losses. Goodwill is tested annually (at 30 September)for impairment or more frequently if events or changes incircumstances indicate that it might be impaired.
Goodwill arising on acquisitions after 1 October 1998 wascapitalised and amortised over its estimated useful economiclife. Goodwill arising on acquisitions before 1 October 1998was deducted from equity. The carrying amount of goodwill inthe Group's opening IFRS balance sheet was its carrying valueunder UK GAAP as at 31 December 2003.
There was no restatement of previous acquisitions in 1998.In 2004 no amortisation was written back.
Other intangiblesUntil 2004 intangible assets acquired in a businesscombination were recognised separately from goodwill only ifthey were separable and reliably measurable. Thereafterintangibles have been recognised if they are separable orarise from contractual or other legal rights. All intangibles areamortised over their useful economic lives.
US GAAP
Under US GAAP, debit and credit balances with the samecounterparty may be offset only where there is a legallyenforceable right of set-off and the intention to settle on a netbasis. However, fair value amounts for forward, interest rateswap, currency swap, option, and other conditional orexchange contracts executed with the same counterpartyunder a master netting agreement may be offset as mayrepurchase and reverse repurchase agreements that areexecuted under a master netting agreement with the samecounterparty and have the same settlement date.
US GAAP
US GAAP requires the same treatment of purchased goodwill.This was adopted by the Group from 1 July 2001. Prior to thisgoodwill was recognised as an asset and amortised overperiods of up to 25 years. No amortisation was written back onthis change of policy. During 2005, the Group changed thedate for performing its annual goodwill impairment test from 1 January to 30 September for certain of its reporting units inorder to conform to the date selected by the Group uponadoption of IFRS.
The same treatment was adopted for US GAAP purposes from1 July 2001.
(3) Implementation timing differencesThis section sets out the areas where differences in amounts reported under IFRS and US GAAP arise because the effective dates ofstandards are different although the recognition and measurement principles are the same.
Other adjustments in the reconciliation of net income for the year ended 31 December 2005 from IFRS to US GAAP include refinementsto estimates arising from the implementation of IFRS.
Recent developments in US GAAPIn May 2005, the Financial Accounting Standards Board (FASB) issued Statement of Financial Accounting Standards 154 ‘AccountingChanges and Error Corrections’. The standard replaces APB 20 and SFAS 3 and amends the treatment of changes of accountingprinciple and the correction of errors. It is effective for accounting changes and corrections of errors made in fiscal years beginningafter 15 December 2005.
In February 2006, the FASB published SFAS 155 ‘Accounting for Certain Hybrid Financial Instruments – an amendment of FASBStatements No 133 and 140’ (SFAS 155) which is effective for all financial instruments acquired or issued by the Group after 1 January2007. The statement allows any hybrid financial instrument that contains an embedded derivative that would otherwise require bifurcationto be measured at fair value. The statement also eliminates the exemption from applying SFAS 133 to interests in securitised financial assets.
Notes on the accounts continued
46 Significant differences between IFRS and US GAAP (continued)

section
03Fi
nanc
ial
stat
emen
ts
227
Not
es o
n th
e ac
coun
ts
Annual Report and Accounts 2005
Selected figures in accordance with US GAAPThe following tables summarise the significant adjustments to consolidated net income available for ordinary shareholders andshareholders’ equity which would result from the application of US GAAP instead of IFRS. Where applicable, the adjustments are stated gross of tax with the tax effect shown separately in total.
2005 2004Consolidated statement of income £m £m
Profit attributable to ordinary shareholders – IFRS 5,392 4,856Adjustments in respect of:
Acquisition accounting — 66Property revaluation and depreciation (90) (65)Leasehold property provisions (26) (19)Loan origination 55 (85)Pension costs (363) (283)Long-term assurance business 10 (17)Extinguishment of liabilities — (94)Financial instruments (556) (628)Derivatives and hedging (119) 73Liabilities and equity 74 —Intangible assets – timing difference (66) (95)Other (59) (40)Taxation 223 240
Net income available for ordinary shareholders – US GAAP 4,475 3,909
2005 2004Consolidated shareholders’ equity £m £m
Shareholders’ equity – IFRS 35,435 33,905Adjustments in respect of:
Acquisition accounting 517 517Property revaluation and depreciation (403) (313)Leasehold property provisions 38 64Loan origination 614 (373)Pension costs 145 215Long-term assurance business (47) (163)Extinguishment of liabilities — (178)Financial instruments (259) 76Derivatives and hedging 260 238Liabilities and equity 2,298 —Intangible assets – timing difference 1,919 1,985Other — 140Taxation (288) 78
Shareholders’ equity – US GAAP 40,229 36,191
Total assets under US GAAP of £700.4 billion (2004 – £631.1 billion) primarily reflects the effect of certain arrangements that can benetted under US GAAP, together with the effect of adjustments made to shareholders’ equity.

228
Not
es o
n th
e ac
coun
ts
Earnings per shareBasic and diluted earnings per share (“EPS”) under US GAAP differ from IFRS only to the extent that the income calculated under USGAAP differs from that under IFRS.
2005 2004
No. of Per share No. of Per share Income* shares amount Income* shares amount
£m million pence £m million pence
Basic EPS 4,475 3,183 140.6 3,909 3,085 126.7Dilutive effect of share options and convertible preference shares 65 60 (0.6) 66 73 (0.8)Diluted EPS 4,540 3,243 140.0 3,975 3,158 125.9
* US GAAP net income available to ordinary shareholders, see page 227.
PensionsOn 1 April 2002, the Group’s main pension schemes, TheRoyal Bank of Scotland Staff Pension Scheme and the NationalWestminster Bank Pension Fund, were merged to form TheRoyal Bank of Scotland Group Pension Fund (“the plan”).The provisions of SFAS 87 ‘Employers’ Accounting forPensions’ have been applied to the plan, which covers most ofthe Group’s UK employees; the impact of US GAAP on theother Group schemes is considered to be immaterial.
A trust fund has been established under the plan, to whichpayments are made, determined on an actuarial basis,designed to build up reserves during the working life of full-time employees to pay such employees or their dependants apension after retirement. Such pensions are based on finalpensionable salaries and are related to the length of serviceprior to retirement. Pensions are limited to a maximum of
two-thirds of final salary for 40 years service or more. Staff donot make contributions for basic pensions but may makevoluntary contributions on a regular basis to purchaseadditional service qualification where less than 40 yearsservice will have been completed by normal retirement age.
The assets of the plan are held under separate trusts and, inthe long-term, the funding policy is to maintain assets sufficientto cover the benefits in respect of service to date, with dueallowance for future earnings increases. The plan assetsconsist mainly of fixed-income securities and listed securities.The investment policy followed for the plan seeks to deploy theplan assets primarily in UK and overseas equity shares and UKgovernment securities.
Disclosures required by SFAS 132R for the Group’s main schemeare set out below.
The Group has convertible preference shares totalling £200million (2004 – £200 million), €nil million (2004 – €750 million)and $1,000 million (2004 – $1,900 million). All of the convertiblepreference shares have a dilutive effect in the current year andas such have been included in the computation of dilutedearnings per share.
Outstanding options to purchase shares are excluded from thecomputation of diluted EPS where the exercise prices ofthe options are greater than the average market price of theordinary shares during the relevant period. At 31 December2005, there were 17.3 million such options outstanding (2004 –8.7 million).
Obligations and funded status2005 2004
Change in benefit obligation: £m £m
Projected benefit obligation at beginning of year 16,192 13,963Service cost 457 420Interest cost 860 768Past service cost 3 —Net actuarial gain 2,302 1,568Benefits and expenses paid (521) (527)Projected benefit obligation at year end 19,293 16,192
2005 2004Change in plan assets: £m £m
Fair value of plan assets at beginning of year 13,598 11,822Actual return on plan assets 2,477 1,234Employer’s contribution 380 1,069Benefits and expenses paid (521) (527)Market value of plan assets at year end 15,934 13,598
Notes on the accounts continued
46 Significant differences between IFRS and US GAAP (continued)

section
03Fi
nanc
ial
stat
emen
ts
229
Not
es o
n th
e ac
coun
ts
Annual Report and Accounts 2005
2005 2004Prepaid pension cost: £m £m
Funded status (3,359) (2,594)Unrecognised net actuarial loss 6,383 5,990Unrecognised prior service cost 11 12Unrecognised transition amount — (6)Prepaid pension cost at year end 3,035 3,402
2005 2004Components of net periodic pension cost: £m £m
Service cost 457 420Interest cost 860 768Expected return on plan assets (932) (840)Amortisation of prior service cost 4 1Amortisation of loss 364 263Amortisation of net transition asset (6) (8)Net periodic pension cost 747 604
Assumptions2005 2004
Weighted average assumptions used at 31 December: % per annum % per annum
Discount rate for liabilities 4.80 5.40Salary increases 3.95 3.95Pension increases 2.70 2.70Long-term rate of return on assets 6.47 6.95
2005 2004Weighted average allocations of market value of plan assets at 31 December: % %
Equity shares 61 57Debt securities 35 31Other 4 12Total 100 100
At 31 December 2005, the fund’s accumulated benefitobligation was underfunded by £1,433 million (2004 – £561million). This resulted in a reduction in the accumulated othercomprehensive income component of US GAAP shareholders’equity of £4,457 million (2004 – £3,951 million), comprising the excess of the accumulated benefit obligation over themarket value of assets of £1,433 million (2004 – £561 million),prepaid pension cost of £3,035 million (2004 – £3,402 million)less unrecognised prior service cost £11 million (2004 – £12million). This was reduced by deferred tax of £1,337 million(2004 – £1,185 million). At 31 December 2003, the fund had a surplus of assets over its accumulated benefit obligation andno minimum liability was recognised.
Cash flowsThe following pension payments under the main scheme,which reflect expected future service, as appropriate, areexpected to be paid:
£m
2006 5132007 5222008 5352009 5492010 565After 2011 3,156
The Group expects to contribute £392 million to its main UKpension plan in 2006.
47 Post balance sheet eventsThere have been no significant events between the year end and the date of approval of these accounts which would require a changeto or disclosure in the accounts.

230

section
04A
dd
ition
alin
form
atio
n
231
Ad
diti
onal
info
rmat
ion
Annual Report and Accounts 2005
Additional information
Contents232 Financial summary
232 Amounts in accordance withIFRS
241 Amounts in accordance with US GAAP
242 Amounts in accordance with UK GAAP
250 Exchange rates
251 Off balance sheet arrangements
253 Economic and monetary environment
253 Supervision and regulation
257 Description of property and equipment
257 Major shareholders

232
Add
ition
al in
form
atio
nAdditional information
Financial summaryThe Group’s accounts are prepared in accordance with IFRS, which differ in certain significant respects from US GAAP.For a discussion of such differences and a reconciliation between IFRS and US GAAP, see Note 46 on the accounts.The dollar financial information included below has been converted from sterling at a rate of £1.00 to US$1.7188, beingthe Noon Buying Rate on 30 December 2005.
Amounts in accordance with IFRS2005 2005 2004
Summary consolidated income statement – IFRS $m £m £m
Net interest income 17,047 9,918 9,071Non-interest income (1) 27,473 15,984 14,320Total income 44,520 25,902 23,391Operating expenses (2, 3, 4) 20,533 11,946 10,362Insurance net claims 7,413 4,313 4,260Operating profit before impairment losses 16,574 9,643 8,769Impairment losses 2,934 1,707 1,485Operating profit before tax 13,640 7,936 7,284Tax 4,087 2,378 1,995Profit for the year 9,553 5,558 5,289Minority interests 98 57 177Preference dividends 187 109 256Profit attributable to ordinary shareholders 9,268 5,392 4,856
Notes:
(1) Includes gain on sale of strategic investment of £333 million for the year ended 31 December 2005 (2004 – nil).
(2) Includes loss on sale of subsidiaries of £93 million for the year ended 31 December 2005 (2004 – nil).
(3) Includes integration expenditure of £458 million for the year ended 31 December 2005 (2004 – £520 million).
(4) Includes purchased intangibles amortisation of £97 million for the year ended 31 December 2005 (2004 – £45 million).
2005 2005 2004 Summary consolidated balance sheet – IFRS $m £m £m
Loans and advances 838,453 487,813 408,324Debt securities and equity shares 223,901 130,266 98,631Derivatives at fair value and settlement balances 174,747 101,668 23,482Other assets 98,109 57,080 57,685Total assets 1,335,210 776,827 588,122
Shareholders’ equity 60,906 35,435 33,905Minority interests 3,625 2,109 3,492Subordinated liabilities 48,597 28,274 20,366Total capital resources 113,128 65,818 57,763Deposits 779,087 453,274 383,198Derivatives at fair value, settlement balances and short positions 241,364 140,426 51,866Other liabilities 201,631 117,309 95,295Total liabilities and equity 1,335,210 776,827 588,122

section
04A
dd
ition
alin
form
atio
n
233
Ad
diti
onal
info
rmat
ion
Annual Report and Accounts 2005
Other financial data based upon IFRS: 2005 2004
Earnings per ordinary share – pence 169.4 157.4Diluted earnings per ordinary share – pence (1) 168.3 155.9Adjusted earnings per ordinary share – pence 175.9 170.2Dividends per ordinary share – pence 60.6 52.5Dividend payout ratio (2) 41% 35%Share price per ordinary share at period end – £ 17.55 17.52Market capitalisation at period end – £bn 56.1 55.6Net asset value per ordinary share – £ 10.14 9.26Return on average total assets (3) 0.73% 0.94%Return on average ordinary shareholders’ equity (4) 17.5% 18.3%Adjusted return on average ordinary shareholders’ equity (5) 18.2% 18.9%Average shareholders’ equity as a percentage of average total assets 4.5% 5.9%Risk asset ratio – Tier 1 7.6% 7.0%Risk asset ratio – Total 11.7% 11.7%Ratio of earnings to combined fixed charges and preference share dividends (6)
– including interest on deposits 1.67 1.88– excluding interest on deposits 6.05 7.43
Ratio of earnings to fixed charges only (6)
– including interest on deposits 1.69 1.94– excluding interest on deposits 6.50 9.70
Notes:
(1) All the convertible preference shares have a dilutive effect in the current year and as such have been included in the computation of diluted earnings per share. In 2004 theireffect was anti-dilutive.
(2) Dividend payout ratio represents the interim dividend paid and final dividend proposed as a percentage of profit attributable to ordinary shareholders before integration costs,amortisation of purchased intangibles and net gain on sale of strategic investments and subsidiaries (net of tax).
(3) Return on average total assets represents profit attributable to ordinary shareholders as a percentage of average total assets.
(4) Return on average ordinary shareholders’ equity represents profit attributable to ordinary shareholders expressed as a percentage of average ordinary shareholders’ equity.
(5) Adjusted return on average ordinary shareholders’ equity represents profit attributable to ordinary shareholders before integration costs, amortisation of purchased intangiblesand net gain on sale of strategic investments and subsidiaries expressed as a percentage of average ordinary shareholders’ equity.
(6) For this purpose, earnings consist of income before tax and minority interests, plus fixed charges less the unremitted income of associated undertakings (share of profits lessdividends received). Fixed charges consist of total interest expense, including or excluding interest on deposits and debt securities in issue, as appropriate, and the proportionof rental expense deemed representative of the interest factor (one third of total rental expenses).

234
Add
ition
al in
form
atio
nAdditional information continued
Amounts in accordance with IFRS
Analysis of loans and advances to customers – IFRSThe following table analyses loans and advances to customers before provisions by remaining maturity, geographical area and type of customer. Overdrafts are included in the ‘Within 1 year’ category.
After 1Within but within After 20051 year 5 years 5 years Total 2004
£m £m £m £m £m
UKCentral and local government 3,336 — 4 3,340 1,866Manufacturing 10,552 555 508 11,615 6,292Construction 5,790 726 758 7,274 5,024Finance 25,424 1,229 438 27,091 24,638Service industries and business activities 31,448 3,817 5,422 40,687 30,867Agriculture, forestry and fishing 1,644 399 602 2,645 2,481Property 24,401 3,264 5,234 32,899 26,448Individuals – home mortgages 19,576 4,284 41,426 65,286 57,535Individuals – other 15,935 6,806 3,582 26,323 26,459Finance leases and instalment credit 3,420 3,941 6,548 13,909 13,044Accrued interest 1,247 1 2 1,250Total domestic 142,773 25,022 64,524 232,319 194,654Overseas residents 39,446 6,167 6,621 52,234 48,183Total UK offices 182,219 31,189 71,145 284,553 242,837
OverseasUS 27,147 27,541 35,918 90,606 74,027Rest of the World 23,691 7,417 14,843 45,951 34,555Total Overseas offices 50,838 34,958 50,761 136,557 108,582Loans and advances to customers – gross 233,057 66,147 121,906 421,110 351,419Loan impairment provisions (3,884) (4,168)Loans and advances to customers – net 417,226 347,251
Fixed rate 30,966 29,099 40,683 100,748 101,227Variable rate 202,091 37,048 81,223 320,362 250,192Loans and advances to customers – gross 233,057 66,147 121,906 421,110 351,419
Cross border exposuresCross border exposures are defined as loans to banks and customers (including finance lease and instalment credit receivables) and other monetary assets, including non-local currency claims of overseas offices on local residents.
The Group monitors the geographical breakdown of these exposures based on the country of domicile of the borrower or guarantor of ultimate risk.
The table below sets out the Group’s cross border outstandings in excess of 0.75% of Group total assets (including acceptances),which totalled £776.8 billion (2004 – £588.5 billion). None of these countries has experienced repayment difficulties that haverequired refinancing of outstanding debt.
2005 2004£m £m
United States 34,246 28,795Germany 18,395 14,050France 13,402 9,604Cayman Islands 11,813 7,258Netherlands 8,026 8,871Spain 7,392 5,249Switzerland 7,061 *Republic of Ireland 6,008 *
* Less than 0.75% of Group total assets.

section
04A
dd
ition
alin
form
atio
n
235
Ad
diti
onal
info
rmat
ion
Annual Report and Accounts 2005
Loan impairment provisionsFor a discussion of the factors considered in determining the amount of the provisions, see ‘Loan impairment’ on page 93 and ‘Critical accounting polices – Loan impairment provisions on page 142.
The following table shows the elements of loan impairment provisions.IFRS
2005 2004£m £m
Provisions at the beginning of the yearDomestic 2,675 2,408Foreign 1,470 1,477
4,145 3,885Currency translation and other adjustments Domestic (7) (8)Foreign 58 (90)
51 (98)Acquisitions of businessesDomestic — 2Foreign — 288
— 290Amounts written-offDomestic (1,252) (901)Foreign (788) (548)
(2,040) (1,449)Recoveries of amounts written-off in previous yearsDomestic 97 85Foreign 75 59
172 144Charged to income statementDomestic 1,376 960Foreign 327 442
1,703 1,402Unwind of discountDomestic (130) —Foreign (14) —
(144) —Provisions at the end of the year (1)
Domestic 2,759 2,546Foreign 1,128 1,628
3,887 4,174
Gross loans and advances to customers Domestic 232,319 194,654Foreign 188,791 156,765
421,110 351,419Closing customer provisions as a % of gross loans and advances to customers (2)
Domestic 1.19% 1.31%Foreign 0.60% 1.04%Total 0.92% 1.19%
Customer charge to income statement as a % of gross loans and advances to customers Domestic 0.59% 0.49%Foreign 0.17% 0.28%Total 0.40% 0.40%
Notes:
(1) Includes closing provisions against loans and advances to banks of £3 million (2004 – £6 million).
(2) Closing customer provisions exclude closing provisions against loans and advances to banks.

236
Add
ition
al in
form
atio
nAdditional information continued
Loan impairment provisions (continued)
The following table presents additional information in respect of the loan impairment provisions.IFRS
2005 2004£m £m
Loans and advances to customers (gross) 421,110 351,419
Loan impairment provisions at end of year:– customers 3,884– banks 3
Specific provisions – customers 3,607Specific provisions – banks 6General provision 561
3,887 4,174
Customer provision at end of year as % of loans and advances to customers at end of year:Specific provisions 1.03%General provision 0.16%
1.19%
Average loans and advances to customers (gross) 402,473 299,430
As a % of average loans and advances to customers during the year:Total customer provisions charged to income statement 0.42% 0.47%
Amounts written-off (net of recoveries) – customers 0.46% 0.44%
Analysis of closing loan impairment provisionsThe following table analyses customer loan impairment provisions by geographical area and type of domestic customer.
IFRS
2005 2004
% of loans % of loans Closing to total Closing to total
provision loans provision loans £m % £m %
DomesticCentral and local government — 0.8 — 0.6Manufacturing 138 2.8 127 1.8Construction 74 1.7 71 1.4Finance 104 6.4 54 7.0Service industries and business activities 647 9.7 516 8.8Agriculture, forestry and fishing 26 0.6 23 0.7Property 63 7.8 64 7.5Individuals – home mortgages 36 15.5 32 16.4Individuals – other 1,513 6.3 1,277 7.5Finance leases and instalment credit 88 3.3 122 3.7Accrued interest — 0.3Total domestic 2,689 55.2 2,286 55.4Foreign 652 44.8 1,321 44.6Impaired book provisions 3,341 100.0 100.0
Latent book provisions 543
Specific provisions 3,607
General provision 561
Total provisions 3,884 4,168

section
04A
dd
ition
alin
form
atio
n
237
Ad
diti
onal
info
rmat
ion
Annual Report and Accounts 2005
Analysis of write-offsThe following table analyses amounts written-off by geographical area and type of domestic customer.
IFRS
2005 2004£m £m
DomesticManufacturing 40 55Construction 17 12Finance 21 19Service industries and business activities 176 163Agriculture, forestry and fishing 4 9Property 25 33Individuals – home mortgages 4 4Individuals – others 948 516Finance leases and instalment credit 15 90Total domestic 1,250 901Foreign 788 548Total write-offs* 2,038 1,449
* Excludes amounts written-off in respect of banks of £2 million (2004 – nil).
Analysis of recoveriesThe following table analyses recoveries of amounts written-off by geographical area and type of domestic customer.
IFRS
2005 2004£m £m
DomesticManufacturing 1 1 Construction 1 —Finance — 2Service industries and business activities 2 1Property 2 —Individuals – home mortgages — 1Individuals – others 84 78Finance leases and instalment credit 7 2Total domestic 97 85Foreign 75 59Total recoveries 172 144

238
Add
ition
al in
form
atio
nAdditional information continued
Risk elements in lending and potential problem loansThe Group’s loan control and review procedures do not include the classification of loans as non-accrual, accruing past due,restructured and potential problem loans, as defined by the SEC in the US. The following table shows the estimated amount ofloans that would be reported using the SEC’s classifications. The figures are stated before deducting the value of security held orrelated provisions.
IAS 39 requires interest to be recognised on a financial asset (or a group of financial assets) after impairment at the rate of interest usedto discount recoveries when measuring the impairment loss. Thus, interest on impaired financial assets is credited to profit or loss as thediscount on expected recoveries unwinds. Despite this, such assets are not considered performing. All loans that have an impairmentprovision are classified as non-accrual. This is a change from past practice where certain loans with provisions were classified as pastdue 90 days or potential problem loans (and interest accrued on them).
IFRS
2005 2004£m £m
Loans accounted for on a non-accrual basis (2):Domestic 4,977 3,658Foreign 949 1,075Total 5,926 4,733
Accruing loans which are contractually overdue 90 days or more as to principal or interest (3):Domestic 2 634Foreign 7 79Total 9 713
Loans not included above which are classified as ‘troubled debt restructurings’ by the SEC:Domestic 2 14Foreign — 10Total 2 24
Total risk elements in lending 5,937 5,470Potential problem loans (4)
Domestic 14 173Foreign 5 107
Total potential problem loans 19 280
Closing provisions for impairment as a % of total risk elements in lending 65% 76%
Closing provisions for impairment as a % of total risk elements in lending and potential problem loans 65% 72%
Risk elements in lending as a % of gross lending to customers excluding reverse repos 1.60% 1.83%
Notes:
(1) For the analysis above, 'Domestic' consists of the United Kingdom domestic transactions of the Group. 'Foreign' comprises the Group’s transactions conducted through officesoutside the UK and through those offices in the UK specifically organised to service international banking transactions.
(2) All loans against which an impairment provision is held are reported in the non-accrual category.
(3) Loans where an impairment event has taken place but no impairment recognised. This category is used for over-collateralised non-revolving credit facilities.
(4) Loans for which an impairment event has occurred but no impairment provision is necessary. This category is used for over-collateralised advances and revolving credit facilitieswhere identification as 90 days overdue is not feasible.
IFRS
2005 2004£m £m
Gross income not recognised but which would have beenrecognised under the original terms of non-accrual and restructured loans
Domestic 334 235Foreign 62 58
396 293
Interest on non-accrual and restructured loans included in net interest incomeDomestic 130 58Foreign 14 7
144 65

section
04A
dd
ition
alin
form
atio
n
239
Ad
diti
onal
info
rmat
ion
Annual Report and Accounts 2005
Analysis of deposits – product analysisThe following table shows the distribution of the Group’s deposits by type and geographical area:
IFRS
2005 2004£m £m
UKDomestic:Demand deposits – interest-free 28,833 22,307Demand deposits – interest-bearing 91,564 72,938Time deposits – savings 27,091 21,012Time deposits – other 73,097 76,995Overseas residents:Demand deposits – interest-free 396 387Demand deposits – interest-bearing 26,663 16,965Time deposits – savings 1,108 1,209Time deposits – other 53,997 52,629Total UK offices (1) 302,749 264,442OverseasDemand deposits – interest-free 13,248 10,371Demand deposits – interest-bearing 17,886 12,975Time deposits – savings 21,691 21,153Time deposits – other 97,700 74,257Total overseas offices (see below) 150,525 118,756Total deposits 453,274 383,198
Held for trading 66,712Fair value through profit or loss 3,683Amortised cost 382,879
Banking business 302,383Trading business 80,815Total deposits 453,274 383,198
OverseasUS 120,405 86,677Rest of the World 30,120 32,079Total overseas 150,525 118,756
Note:
(1) Presentation of product analysis data has been refined and 2004 has been restated onto a basis consistent with 2005.

240
Add
ition
al in
form
atio
nAdditional information continued
Short term borrowingsIFRS
2005 2004£m £m
Commercial paperOutstanding at year end 14,110 8,391Maximum outstanding at any month end during the year 16,853 8,391Approximate average amount during the year 15,329 7,450Approximate weighted average interest rate during the year 3.7% 1.9%Approximate weighted average interest rate at year end 4.2% 2.6%
Other short term borrowingsOutstanding at year end 105,483 95,381Maximum outstanding at any month end during the year 117,913 96,356Approximate average amount during the year 100,681 85,496Approximate weighted average interest rate during the year 3.4% 2.9%Approximate weighted average interest rate at year end 3.5% 3.1%
Average interest rates during the year are computed bydividing total interest expense by the average amountborrowed. Average interest rates at year end are average ratesfor a single day and as such may reflect one-day marketdistortions which may not be indicative of generally prevailing
rates. Original maturities of commercial paper are not inexcess of one year. ‘Other short-term borrowings’ consistprincipally of borrowings in the money markets included within‘Deposits by banks’ and ‘Customer accounts’ in the accounts,and generally have original maturities of one year or less.
Certificates of deposit and other time depositsThe following table shows details of the Group’s certificates of deposit and other time deposits over $100,000 or equivalent by remaining maturity.
Over 3 months Over 6 monthsWithin but within but within Over 2005
3 months 6 months 12 months 12 months Total£m £m £m £m £m
UK based companies and branchesCertificates of deposit 18,911 2,009 2,528 — 23,448Other time deposits 64,819 3,679 2,113 3,696 74,307
Overseas based companies and branchesCertificates of deposit 4,841 956 747 — 6,544Other time deposits 61,126 4,553 3,114 10,385 79,178Total 149,697 11,197 8,502 14,081 183,477

section
04A
dd
ition
alin
form
atio
n
241
Ad
diti
onal
info
rmat
ion
Annual Report and Accounts 2005
Amounts in accordance with US GAAP2005 2005 2004 2003 2002 2001
$m £m £m £m £m £m
Net income available for ordinary shareholders (1) 7,692 4,475 3,909 2,564 3,108 2,062Shareholders’ equity (1) 69,146 40,229 36,191 31,665 28,177 29,088Total assets (1) 1,203,823 700,386 631,100 488,046 430,573 386,696
Other financial data based upon US GAAP: 2005 2004 2003 2002 2001
Basic earnings per ordinary share – pence 140.6 126.7 87.5 107.9 74.7Diluted earnings per ordinary share – pence (2) 140.0 125.9 86.8 106.3 73.2Dividends per ordinary share – pence 60.6 52.5 45.6 39.7 34.5Dividend payout ratio 43.1% 40.6% 51.9% 36.7% 45.7%Return on average total assets (3) 0.64% 0.70% 0.55% 0.75% 0.57%Return on average ordinary shareholders’ equity (4) 13.4% 13.2% 9.5% 12.1% 8.8%Average shareholders’ equity as a percentage
of average total assets 5.4% 6.3% 6.5% 7.3% 7.7%Ratio of earnings to combined fixed charges and preference
share dividends (5)
– including interest on deposits 1.57 1.73 1.98 1.97 1.51– excluding interest on deposits 5.31 6.34 7.24 6.49 4.63
Ratio of earnings to combined fixed charges only (5)
– including interest on deposits 1.58 1.79 2.07 2.07 1.59– excluding interest on deposits 5.71 8.28 9.96 9.03 6.98
Notes:
(1) The dollar information included above has been converted from sterling at a rate of US$1.7188, the Noon Buying Rate on 30 December 2005.
(2) All convertible preference shares have a dilutive effect in the current year and as such have been included in the computation of diluted earnings per share. In prior years theireffect was anti-dilutive.
(3) Return on average total assets represents profit attributable to ordinary shareholders as a percentage of average total assets.
(4) Return on average ordinary shareholders’ equity represents profit attributable to ordinary shareholders expressed as a percentage of average ordinary shareholders’ equity.
(5) For this purpose, earnings consist of income before tax and minority interests, plus fixed charges less the unremitted income of associated undertakings (share of profits lessdividends received). Fixed charges consist of total interest expense, including or excluding interest on deposits and debt securities in issue, as appropriate, and the proportionof rental expense deemed representative of the interest factor (one third of total rental expenses).

242
Add
ition
al in
form
atio
nAdditional information continued
Amounts in accordance with UK GAAP2004 2003 2002 2001
Summary consolidated profit and loss account – UK GAAP £m £m £m £m
Net interest income 9,208 8,301 7,849 6,846Non-interest income 13,546 10,980 9,167 7,712Total income 22,754 19,281 17,016 14,558Operating expenses excluding goodwill amortisation (1) 9,931 8,753 8,738 7,716Goodwill amortisation 915 763 731 651General insurance claims (net) 3,480 2,195 1,350 948Profit before provisions 8,428 7,570 6,197 5,243Provisions for bad and doubtful debts 1,428 1,461 1,286 984Amounts written off fixed asset investments 83 33 59 7Profit on ordinary activities before tax 6,917 6,076 4,852 4,252 Tax on profit on ordinary activities 2,155 1,888 1,582 1,537Profit on ordinary activities after tax 4,762 4,188 3,270 2,715Minority interests (including non-equity) 250 210 133 90Preference dividends – non-equity 256 261 305 358
4,256 3,717 2,832 2,267 Additional Value Shares dividend – non-equity — 1,463 798 399Profit attributable to ordinary shareholders 4,256 2,254 2,034 1,868
Notes:
(1) Includes integration expenditure of £269 million for the year ended 31 December 2004 (2003 – £229 million; 2002 – £957 million; 2001 – £875 million).
2004 2003 2002 2001 Summary consolidated balance sheet – UK GAAP £m £m £m £m
Loans and advances to banks (net of provisions) 58,260 51,891 44,296 38,513Loans and advances to customers (net of provisions) 345,469 252,531 223,324 190,492 Debt securities and equity shares 94,171 82,249 68,928 65,597Intangible fixed assets 17,576 13,131 12,697 13,325Other assets 67,991 54,626 61,793 60,932Total assets 583,467 454,428 411,038 368,859
Called up share capital 822 769 754 893Share premium account 12,964 8,175 7,608 7,465Other reserves 10,856 11,307 11,922 12,354Profit and loss account 7,223 5,847 4,787 5,956Shareholders’ funds 31,865 26,098 25,071 26,668Minority interests 3,829 2,713 1,839 585Subordinated liabilities 20,366 16,998 13,965 12,530Total capital resources 56,060 45,809 40,875 39,783 Deposits by banks 99,081 67,323 54,720 40,038Customer accounts 285,062 236,963 219,161 198,995 Debt securities in issue 58,960 41,016 33,938 30,669Other liabilities 84,304 63,317 62,344 59,374Total liabilities 583,467 454,428 411,038 368,859

section
04A
dd
ition
alin
form
atio
n
243
Ad
diti
onal
info
rmat
ion
Annual Report and Accounts 2005
Other financial data based upon UK GAAP 2004 2003 2002 2001
Earnings per ordinary share – pence 138.0 76.9 70.6 67.6Diluted earnings per ordinary share – pence (1) 136.9 76.3 69.6 66.3Adjusted earnings per ordinary share – pence 172.5 157.2 146.3 127.9Dividends per ordinary share – pence 58.0 50.3 43.7 38.0Dividend payout ratio 43.2% 66.1% 62.3% 58.1%Share price per ordinary share at period end – £ 17.52 16.46 14.88 16.72 Market capitalisation at period end – £bn 55.6 48.8 43.2 47.8Net asset value per ordinary share – £ 8.62 7.82 7.43 7.79Return on average total assets (2) 0.82% 0.51% 0.52% 0.53%Return on average equity shareholders’ funds (3) 16.0% 9.8% 8.8% 8.9%Adjusted return on average equity shareholders’ funds (4) 20.1% 20.1% 18.3% 16.8%Average shareholders’ equity as a percentage
of average total assets 5.7% 5.9% 6.8% 7.2% Risk asset ratio – Tier 1 7.0% 7.4% 7.3% 7.1%Risk asset ratio – Total 11.7% 11.8% 11.7% 11.5%Ratio of earnings to combined fixed charges and preference
share dividends (5)
– including interest on deposits 1.84 1.95 1.74 1.49– excluding interest on deposits 7.09 7.08 5.20 4.45
Ratio of earnings to fixed charges only (5)
– including interest on deposits 1.90 2.04 1.83 1.55– excluding interest on deposits 9.26 9.73 7.24 6.52
Notes:
(1) Convertible preference shares have not been included in the computation of diluted earnings per share as their effect was anti-dilutive.
(2) Return on average total assets represents profit attributable to ordinary shareholders as a percentage of average total assets.
(3) Return on average equity shareholders’ funds represents profit attributable to ordinary shareholders expressed as a percentage of average equity shareholders’ funds.
(4) Adjusted return on average equity shareholders’ funds represents profit attributable to ordinary shareholders before integration costs, goodwill amortisation and the AVSdividend, in 2003, 2002 and 2001 expressed as a percentage of average equity shareholders’ funds.
(5) For this purpose, earnings consist of income before tax and minority interests, plus fixed charges less the unremitted income of associated undertakings (share of profits lessdividends received). Fixed charges consist of total interest expense, including or excluding interest on deposits and debt securities in issue, as appropriate, and the proportionof rental expense deemed representative of the interest factor (one third of total rental expenses).

244
Add
ition
al in
form
atio
n
Amounts in accordance with UK GAAP
Analysis of loans and advances to customersThe following table analyses loans and advances to customers before provisions by geographical area and type of customer.
UK GAAP
2004 2003 2002 2001£m £m £m £m
UKCentral and local government 1,866 1,217 1,521 706Manufacturing 6,292 6,384 7,386 7,401Construction 5,024 3,960 3,468 3,018Finance 25,157 18,948 12,396 8,517Service industries and business activities 30,850 29,290 26,022 25,033Agriculture, forestry and fishing 2,480 2,562 2,463 2,391Property 26,445 19,670 15,939 12,274Individuals – home mortgages 57,529 48,117 42,101 36,976Individuals – other 27,863 25,526 22,255 20,076Finance leases and instalment credit 13,083 11,703 11,723 11,258Total domestic 196,589 167,377 145,274 127,650Overseas residents 44,053 27,168 23,657 24,164Total UK offices 240,642 194,545 168,931 151,814
Overseas US 74,045 40,373 41,008 29,230Rest of the World 35,004 21,535 17,305 13,093Total overseas offices 109,049 61,908 58,313 42,323Loans and advances to customers – gross 349,691 256,453 227,244 194,137Provisions for bad and doubtful debts (4,222) (3,922) (3,920) (3,645)Loans and advances to customers – net 345,469 252,531 223,324 190,492
Fixed rate 100,729 81,918 80,326 62,282Variable rate 248,962 174,535 146,918 131,855Loans and advances to customers – gross 349,691 256,453 227,244 194,137
Cross border exposuresThe table below sets out the Group’s cross border outstandings in excess of 0.75% of Group total assets (including acceptances),which totalled £583.8 billion at 31 December 2004 (2003 – £455.0 billion). None of these countries has experienced repaymentdifficulties that have required refinancing of outstanding debt.
UK GAAP
2004 2003£m £m
United States 28,795 14,618Germany 14,050 15,073France 9,604 7,524Netherlands 8,871 6,830Cayman Islands 7,258 6,666Spain 5,249 3,421Japan 4,610 4,141
Additional information continued

section
04A
dd
ition
alin
form
atio
n
245
Ad
diti
onal
info
rmat
ion
Annual Report and Accounts 2005
Provisions for bad and doubtful debts
The following table shows the elements of provisions for bad and doubtful debts under UK GAAP.UK GAAP
2004 2003 2002 2001£m £m £m £m
Provisions at the beginning of the yearDomestic 2,452 2,581 2,467 2,370Foreign 1,477 1,346 1,186 783
3,929 3,927 3,653 3,153Currency translation and other adjustments Domestic (8) (2) (4) 4Foreign (90) (60) (58) 13
(98) (62) (62) 17Acquisitions of businessesDomestic 2 — 11 83Foreign 288 50 12 171
290 50 23 254Amounts written-offDomestic (920) (1,097) (743) (645)Foreign (548) (422) (293) (190)
(1,468) (1,519) (1,036) (835)Recoveries of amounts written-off in previous yearsDomestic 88 38 37 54Foreign 59 34 26 26
147 72 63 80Charged to profit and loss accountDomestic 986 932 813 601Foreign 442 529 473 383
1,428 1,461 1,286 984Provisions at the end of the year (1)
Domestic 2,600 2,452 2,581 2,467Foreign 1,628 1,477 1,346 1,186
4,228 3,929 3,927 3,653
Gross loans and advances to customers Domestic 196,589 167,377 145,274 127,650Foreign 153,102 89,076 81,970 66,487
349,691 256,453 227,244 194,137Closing customer provisions as a % of gross loans and advances to customers (2)
Domestic 1.32% 1.46% 1.78% 1.93%Foreign 1.06% 1.65% 1.63% 1.77%Total 1.21% 1.53% 1.72% 1.88%
Customer charge against profit as a % of gross loans and advances to customers Domestic 0.50% 0.56% 0.56% 0.47%Foreign 0.29% 0.59% 0.58% 0.58%Total 0.41% 0.57% 0.57% 0.51%
Notes:
(1) Includes closing provisions against loans and advances to banks of £6 million in 2004 (2003 – £7 million; 2002 – £7 million; 2001 – £8 million).
(2) Closing customer provisions exclude closing provisions against loans and advances to banks.

246
Add
ition
al in
form
atio
nAdditional information continued
Provisions for bad and doubtful debts (continued)
The following table presents additional information with respect to the provisions for bad and doubtful debts under UK GAAP.
UK GAAP
2004 2003 2002 2001£m £m £m £m
Loans and advances to customers (gross) 349,691 256,453 227,244 194,137
Provisions at end of year:Specific provisions – customers 3,648 3,356 3,323 3,031Specific provisions – banks 6 7 7 8General provision 574 566 597 614
4,228 3,929 3,927 3,653
Customer provision at end of year as % of loans and advances to customers at end of year:
Specific provisions 1.04% 1.31% 1.46% 1.56%General provision 0.17% 0.22% 0.26% 0.32%
1.21% 1.53% 1.72% 1.88%
Average loans and advances to customers (gross) 298,150 245,798 211,206 181,584
As a % of average loans and advances to customers during the year:Total customer provisions charged to profit and loss 0.48% 0.59% 0.61% 0.54%
Amounts written-off (net of recoveries) – customers 0.44% 0.59% 0.46% 0.42%
Analysis of closing provisions for bad and doubtful debtsThe following table analyses customer provisions for bad and doubtful debts by geographical area and type of domestic customer.
UK GAAP
2004 2003 2002 2001
% of loans % of loans % of loans % of loans Closing to total Closing to total Closing to total Closing to total
provision loans provision loans provision loans provision loans £m % £m % £m % £m %
DomesticCentral and local government — 0.5 — 0.5 — 0.6 — 0.4Manufacturing 127 1.8 156 2.5 205 3.2 209 3.8Construction 71 1.4 56 1.5 65 1.5 72 1.6Finance 54 7.2 34 7.4 71 5.5 73 4.4Service industries and business activities 516 8.8 599 11.4 699 11.5 627 12.9Agriculture, forestry and fishing 23 0.7 20 1.0 29 1.1 31 1.2Property 64 7.6 58 7.7 40 7.0 39 6.3Individuals – home mortgages 32 16.5 35 18.8 60 18.5 53 19.1Individuals – other 1,318 8.0 1,003 9.9 855 9.8 855 10.3Finance leases and instalment credit 122 3.7 136 4.6 208 5.2 164 5.8Total domestic 2,327 56.2 2,097 65.3 2,232 63.9 2,123 65.8Foreign 1,321 43.8 1,259 34.7 1,091 36.1 908 34.2Specific provisions 3,648 100.0 3,356 100.0 3,323 100.0 3,031 100.0General provision 574 566 597 614
Total provisions 4,222 3,922 3,920 3,645

section
04A
dd
ition
alin
form
atio
n
247
Ad
diti
onal
info
rmat
ion
Annual Report and Accounts 2005
Analysis of write-offsThe following table analyses amounts written-off by geographical area and type of domestic customer.
UK GAAP
2004 2003 2002 2001£m £m £m £m
DomesticManufacturing 55 99 111 61Construction 12 22 18 19Finance 19 54 35 8Service industries and business activities 163 393 180 176Agriculture, forestry and fishing 9 4 10 5Property 33 6 9 14Individuals – home mortgages 4 2 2 3Individuals – others 535 357 333 297Finance leases and instalment credit 90 160 45 62Total domestic 920 1,097 743 645Foreign 548 422 293 190Total write-offs* 1,468 1,519 1,036 835
* Includes amounts written-off in respect of banks of nil in 2004 (2003 – nil; 2002 – £1 million; 2001 – £6 million).
Analysis of recoveriesThe following table analyses recoveries of amounts written-off by geographical area and type of domestic customer.
UK GAAP
2004 2003 2002 2001£m £m £m £m
DomesticManufacturing 1 — 1 2 Construction — — — 1Finance 2 — — 1Service industries and business activities 1 3 1 5Property — — 1 1Individuals – home mortgages 1 — — —Individuals – others 81 26 27 41Finance leases and instalment credit 2 9 7 3Total domestic 88 38 37 54Foreign 59 34 26 26Total recoveries 147 72 63 80

248
Add
ition
al in
form
atio
nAdditional information continued
Risk elements in lending and potential problem loansThe Group’s loan control and review procedures do not include the classification of loans as non-accrual, accruing past due,restructured and potential problem loans, as defined by the SEC in the US. The following table shows the estimated amount ofloans that would be reported using the SEC’s classifications. The figures incorporate estimates and are stated before deducting the value of security held or related provisions.
UK GAAP
2004 2003 2002 2001£m £m £m £m
Loans accounted for on a non-accrual basis(3):Domestic 3,705 3,221 3,077 2,829Foreign 1,075 1,211 1,098 737Total 4,780 4,432 4,175 3,566
Accruing loans which are contractually overdue 90 days or more as to principal or interest(4):
Domestic 646 561 363 643Foreign 79 81 129 142Total 725 642 492 785
Loans not included above which are classified as ‘troubled debt restructurings’ by the SEC:
Domestic 14 53 144 26Foreign 10 30 60 116Total 24 83 204 142
Total risk elements in lending 5,529 5,157 4,871 4,493Potential problem loans(5)
Domestic 173 492 639 801Foreign 107 99 544 279
Total potential problem loans 280 591 1,183 1,080
Closing provisions for bad and doubtful debts as a % of total risk elements in lending 76% 76% 80% 81%
Closing provisions for bad and doubtful debts as a % oftotal risk elements in lending and potential problem loans 73% 68% 65% 65%
Risk elements in lending as a % of gross loans and advances to customers excluding reverse repos 1.86% 2.22% 2.37% 2.46%
Notes:
(1) For the analysis above, ‘Domestic’ consists of the UK domestic transactions of the Group. ‘Foreign’ comprises the Group’s transactions conducted through offices outside the UKand through those offices in the UK specifically organised to service international banking transactions.
(2) The classification of a loan as non-accrual, past due 90 days or troubled debt restructuring does not necessarily indicate that the principal of the loan is uncollectable in wholeor in part. Collection depends in each case on the individual circumstances of the loan, including the adequacy of any collateral securing the loan and therefore classification ofa loan as non-accrual, past due 90 days or troubled debt restructuring does not always require that a provision be made against such a loan. In accordance with the Group’sprovisioning policy for bad and doubtful debts, it is considered that adequate provisions for the above risk elements in lending have been made.
(3) The Group’s UK banking subsidiary undertakings account for loans on a non-accrual basis from the point in time at which the collectability of interest is in significant doubt.Certain subsidiary undertakings of the Group, principally Citizens, generally account for loans on a non-accrual basis when interest or principal is past due 90 days.
(4) Overdrafts generally have no fixed repayment schedule and consequently are not included in this category.
(5) Loans that are current as to the payment of principal and interest but in respect of which management has serious doubts about the ability of the borrower to comply withcontractual repayment terms. Substantial security is held in respect of these loans and appropriate provisions have already been made in accordance with the Group’sprovisioning policy for bad and doubtful debts.
UK GAAP
2004 2003 2002 2001£m £m £m £m
Gross income not recognised but which would have beenrecognised under the original terms of non-accrual and restructured loans
Domestic 237 237 234 173Foreign 58 55 73 60
295 292 307 233
Interest on non-accrual and restructured loans included in net interest incomeDomestic 58 60 47 42Foreign 7 3 7 14
65 63 54 56

section
04A
dd
ition
alin
form
atio
n
249
Ad
diti
onal
info
rmat
ion
Annual Report and Accounts 2005
Analysis of deposits – product analysisThe following table shows the distribution of the Group’s deposits by type and geographical area:
UK GAAP
2004 2003£m £m
UKDomestic:Demand deposits – interest-free 22,249 20,567Demand deposits – interest-bearing 78,178 78,670Time deposits – savings 18,205 13,238Time deposits – other 68,662 57,994Overseas residents:Demand deposits – interest-free 376 830Demand deposits – interest-bearing 12,740 9,559Time deposits – savings 836 1,014Time deposits – other 64,141 32,531Total UK offices 265,387 214,403OverseasDemand deposits – interest-free 10,371 7,937Demand deposits – interest-bearing 12,975 7,471Time deposits – savings 21,153 15,450Time deposits – other 74,257 59,025Total overseas offices (see below) 118,756 89,883Total deposits 384,143 304,286
Banking business 303,328 251,986Trading business 80,815 52,300Total deposits 384,143 304,286
OverseasUS 86,677 67,019Rest of the World 32,079 22,864Total overseas 118,756 89,883
Analysis of deposits – currency analysisThe following table shows the distribution of deposits by banks and customer accounts by sterling and other currencies:
UK GAAP
2004 2003£m £m
Deposits by banksSterling 18,958 14,574Other currencies 80,123 52,749Total deposits by banks 99,081 67,323
Customer accountsSterling 161,636 142,551Other currencies 123,426 94,412Total customer accounts 285,062 236,963Total deposits 384,143 304,286

250
Add
ition
al in
form
atio
nAdditional information continued
Exchange ratesExcept as stated, the following tables show, for the dates or periods indicated, the Noon Buying Rate in New York for cable transfers in sterling as certified for customs’ purposes by the Federal Reserve Bank of New York (the “Noon Buying Rate”):
January December November October September AugustUS dollars per £1 2006 2005 2005 2005 2005 2005
Noon Buying Rate High 1.7885 1.7740 1.7755 1.7855 1.8420 1.8148Low 1.7404 1.7188 1.7138 1.7484 1.7620 1.7695
2005 2004 2003 2002 2001
Noon Buying Rate Period end rate 1.7188 1.9160 1.7842 1.6095 1.4543 Average rate for the period (1) 1.8147 1.8356 1.6450 1.5043 1.4396
Consolidation rate (2)
Period end rate 1.7214 1.9346 1.7857 1.6128 1.4498Average rate for the period 1.8198 1.8325 1.6354 1.5032 1.4401
Notes:
(1) The average of the Noon Buying Rates on the last business day of each month during the period.
(2) The rates used by the Group for translating US dollars into sterling in the preparation of its financial statements.
(3) On 24 February 2006, the Noon Buying Rate was £1.00 = US$1.7448.
Short term borrowingsUK GAAP
2004 2003£m £m
Commercial paperOutstanding at year end 8,391 6,968Maximum outstanding at any month end during the year 8,391 7,032Approximate average amount during the year 7,450 5,499Approximate weighted average interest rate during the year 1.9% 1.6%Approximate weighted average interest rate at year end 2.6% 1.5%
Other short term borrowingsOutstanding at year end 95,381 84,795Maximum outstanding at any month end during the year 96,356 94,570Approximate average amount during the year 85,496 78,004Approximate weighted average interest rate during the year 2.9% 2.2%Approximate weighted average interest rate at year end 3.1% 2.0%
Average interest rates during the year are computed bydividing total interest expense by the average amountborrowed. Average interest rates at year end are average ratesfor a single day and as such may reflect one-day marketdistortions which may not be indicative of generally prevailing
rates. Original maturities of commercial paper are not inexcess of one year. ‘Other short-term borrowings’ consistprincipally of borrowings in the money markets included within‘Deposits by banks’ and ‘Customer accounts’ in the accounts,and generally have original maturities of one year or less.

section
04A
dd
ition
alin
form
atio
n
251
Ad
diti
onal
info
rmat
ion
Annual Report and Accounts 2005
Off-balance sheet arrangementsThe Group is involved with several types of off-balance sheetarrangements, including special purpose vehicles, lendingcommitments and financial guarantees.
Special purpose entities (“SPEs”)SPEs are vehicles set up for a specific, limited purpose, usuallydo not carry out a business or trade and typically have no employees. They take a variety of legal forms – trusts,partnerships and companies – and fulfil many differentfunctions. They constitute a key element of securitisationtransactions in which an SPE acquires financial assets fundedby the issue of securities. In the normal course of business,the Group arranges securitisations to facilitate clienttransactions and undertakes securitisations to sell financialassets or to obtain funding. It has established a number ofSPEs to act as commercial paper conduits for customers. SPEsare also utilised in its fund management activities to structureinvestment funds to which the Group provides investmentmanagement services.
Commercial paper conduits – the Group has established anumber of SPEs that act as multi-seller commercial paperconduits. These allow customers to access liquidity in thecommercial paper market by selling assets to the conduitwhich it finances by issuing commercial paper to third parties.The Group supplies certain services and contingent liquiditysupport to these vehicles on an arm’s length basis as well asprogramme credit enhancement. These vehicles with totalassets of £6,688 million at 31 December 2005 are consolidatedunder IFRS and US GAAP.
Residential mortgages and credit card securitisations – in theUK and Ireland, the Group has securitised portfolios ofresidential mortgages and credit card receivables totalling£5,279 million as at 31 December 2005. These assets havebeen transferred to SPEs funded by the issue of notes to third-party investors. These SPEs are consolidated under IFRS andUS GAAP and the securitised assets remain on the Group’sbalance sheet.
US securitisations – in the US, RBS Greenwich Capitalsecuritises commercial and residential mortgage loans,commercial and residential mortgage related securities, USGovernment agency collateralised mortgage obligations, andother types of financial assets. It also acts as an underwriterand depositor in securitisation transactions involving both clientand proprietary transactions. The majority of proprietarysecuritisations undertaken by RBS Greenwich Capital result insales treatment under IFRS and US GAAP. Certain transactionsmay not result in derecognition of the assets under IFRS or USGAAP: under US GAAP, transactions involving vehicles that arenot qualifying special purpose entities and where the Group isthe primary beneficiary; under IFRS, those where the Grouphas retained substantially all the risks and rewards of the assets.
Finance lease receivables – in the US, the Group has financedlease receivables with non-recourse funding from third parties.The transactions are shown gross of third-party financingunder IFRS but net under US GAAP.
Further disclosures about the Group’s securitisations are givenin Note 12 on the accounts.
Lending commitments and other commitmentsUnder a loan commitment, the Group agrees to make fundsavailable to a customer in the future. Loan commitments, whichare usually for a specified term, may be unconditionallycancellable or may persist, provided all conditions in the loanfacility are satisfied or waived. Commitments to lend includecommercial standby facilities and credit lines, liquidity facilitiesto commercial paper conduits and unutilised overdraft facilities.Other commitments include documentary credits, which arecommercial letters of credit providing for payment by theGroup to a named beneficiary against presentation ofspecified documents, forward asset purchases, forwarddeposits placed and undrawn note issuance and revolvingunderwriting facilities.
Guarantees and other contingent liabilitiesThe Group gives guarantees on behalf of customers. A financialguarantee represents an irrevocable undertaking that theGroup will meet a customer’s obligations to third parties if thecustomer fails to do so. The maximum amount that the Groupcould be required to pay under a guarantee is its principalamount. The Group expects most guarantees it provides toexpire unused. Other contingent liabilities include those arisingfrom standby letters of credit that support customer debtissues and those relating to customers’ trading activities suchas performance and customs bonds, warranties and indemnities.

252
Add
ition
al in
form
atio
nAdditional information continued
The Group’s contingent liabilities and commitments are set out below.More than More than1 year but 3 years but
Less than less than less than Over1 year 3 years 5 years 5 years Total
2005 £m £m £m £m £m
Guarantees and assets pledged as collateral security 1,584 3,916 3,760 2,993 12,253Other contingent liabilities 3,078 644 677 1,995 6,394Undrawn formal standby facilities, credit lines and other commitments to lend 132,126 15,077 33,466 22,352 203,021Other commitments 2,402 865 148 114 3,529Total 139,190 20,502 38,051 27,454 225,197
2004
Guarantees and assets pledged as collateral security 3,974 1,729 1,893 2,842 10,438Other contingent liabilities 3,076 785 293 1,501 5,655Undrawn formal standby facilities, credit lines and other commitments to lend 118,367 23,045 21,216 16,602 179,230Other commitments 881 415 6 245 1,547Total 126,298 25,974 23,408 21,190 196,870
Contractual obligationsThe table below summarises the Group’s contractual cash obligations by remaining maturity.
More than More than1 year but 3 years but
Less than less than less than Over1 year 3 years 5 years 5 years Total
2005 £m £m £m £m £m
Contractual cash obligationsDated loan capital 602 1,041 2,971 8,363 12,977Operating leases 310 591 512 1,700 3,113Unconditional obligations to purchase goods or services 659 458 148 20 1,285Total 1,571 2,090 3,631 10,083 17,375
2004
Contractual cash obligationsDated loan capital 371 527 2,863 7,252 11,013Operating leases 328 597 535 2,246 3,706Finance leases 17 38 11 126 192Unconditional obligations to purchase goods or services 733 421 148 152 1,454Total 1,449 1,583 3,557 9,776 16,365
The tables above do not include undated loan capital. Commitments for the purchase of software at 31 December 2005 were £139 million (2004 – £256 million).

section
04A
dd
ition
alin
form
atio
n
253
Ad
diti
onal
info
rmat
ion
Annual Report and Accounts 2005
Economic and monetary environmentMonetary policyThe Group’s earnings are affected by domestic and globaleconomic conditions. The policies of the UK government, andof governments in other countries in which the Group operates,also have an impact.
The UK government sets an inflation target, which changed inDecember 2003 from a 2.5% target based on the retail pricesindex excluding mortgage interest payments to a 2% target basedon the consumer prices index, in line with other European countries.
The Bank of England has operational independence in settingthe repo rate to achieve the inflation target. The Bank was givenindependence by the Chancellor of the Exchequer in 1997, withthe aim of making monetary policy free from political influence,and therefore more stable and credible. The Bank’s MonetaryPolicy Committee (“MPC”) meets each month to agree anychange to interest rates, and the minutes of these meetings arepublished two weeks later. One-off meetings can also be heldin exceptional circumstances. In response to the downturn inthe global economy and the terrorist attacks, the Bank ofEngland, along with other major central banks around the world,cut rates sharply in 2001. Rates remained at exceptionally lowlevels throughout 2002, and were reduced again in the first half of2003, reflecting the uncertain nature of the global and domesticeconomic circumstances. Signs of recovery in the globaleconomy led the Bank of England to increase rates five timessince November 2003, to 4.75%, before interest rates were cutto 4.5% in August 2005.
The value of sterling is also important for UK monetaryconditions. The monetary authorities do not have an exchangerate target, but movements in sterling play a role in the MPC’smonthly debates.
European Economic and Monetary Union (“EMU”)The European single currency, the euro, came into being on 1January 1999. The third stage of EMU started on schedule on1 January 1999. During the course of 1998, it was determinedthat eleven countries (Austria, Belgium, Finland, France,Germany, Ireland, Italy, Luxembourg, the Netherlands, Portugaland Spain) would participate. The UK, along with Denmark,exercised its right to opt out at that stage, and Sweden alsodetermined not to be part of this first wave.
On 31 December 1998, the European Currency Unit (the“ECU”) was replaced by the euro on the international currencymarkets, on a one-for-one basis. The rates for the euro againstother international currencies were based upon the officialclosing rates for the ECU. The bilateral rates for the legacycurrencies of the participating states were derived from theirrates within the Exchange Rate Mechanism and the closingvalue of the ECU. These rates, between the legacy currenciesand between these currencies and the euro, were fixed as of1 January 1999. The euro became the formal currency for alleleven then-participating states.
Euro notes and coins were introduced into circulation on 1 January 2002 in accordance with the Maastricht Treaty,
which required that legacy currency notes and coins bewithdrawn by 30 June 2002. Also on 1 January 1999, theEuropean Central Bank ("ECB") assumed responsibility for theoperation of monetary policy throughout the euro zone. TheECB sets one short-term interest rate to cover all twelvecountries.
The UK government continues to support EMU entry in principle,but has decided the UK will not adopt the single currency untilit is in the UK’s economic interests, with a positive referendumvote. The Chancellor of the Exchequer has laid down five keyeconomic conditions for UK participation. An assessment ofthese five tests took place in June 2003, resulting in thepublication of HM Treasury’s assessment, the 18 supportingEMU studies, and a third outline National Changeover Plan.While indicating that these five economic tests have yet to befully met, the government has set out a programme of economicreforms and structural assessments necessary to achievereadiness for entry. The Chancellor made a progress statementin Budget 2004, at which point he decided not to undertake animmediate further assessment of the entry tests.
The Group continues to co-operate with the UK government, andto work within the financial services sector, to develop thinkingand plans regarding a range of practical issues that would ariseif the UK were to decide to enter EMU. In particular, the Groupcontinues its involvement in discussions as to how a phasedtransition could be achieved, in order to minimise cost and risk.In addition, due attention is being paid to the implications, forelements of the Group and for customers, of the introduction ofeuro notes and coins and the withdrawal of sterling.
Uncertainty continues on the likelihood and timing of the eurobeing introduced in the UK. It is not possible to estimate withany degree of certainty the ultimate cost of making systemsand operations fully compliant. Expenditure in the year ended31 December 2005 in preparation for the possible introductionof the euro in the UK was minimal.
Supervision and regulation1 United Kingdom1.1 The regulatory regime applying to the UK financial
services industryThe Financial Services and Markets Act 2000 (“FSMA2000”), containing an integrated legislative framework forregulating most of the UK financial services industry, cameinto force at the end of 2001. This and subsequentamendments established the Financial Services Authority(the “FSA”) as the single statutory regulator responsible forregulating deposit taking, insurance and investmentbusiness in the UK.
Under the FSMA 2000, businesses require the FSA’spermission to undertake specified types of activitiesincluding entering into and carrying out contracts ofinsurance; managing, dealing in or advising on,investments; accepting deposits; and issuing electronicmoney (“regulated activities”). The FSA has publisheddetailed regulatory requirements contained in a Handbookof Rules and Guidance.

254
Add
ition
al in
form
atio
n
The FSA’s statutory objectives are to maintain confidence in,and to promote public understanding of, the UK financialsystem; to secure an appropriate degree of consumerprotection; and to reduce the scope for financial crime. Inachieving these objectives, the FSA must take account ofcertain “principles of good regulation” which includerecognising the responsibilities of authorised firms’ ownmanagement, facilitating innovation and competition andacting proportionately in imposing burdens on the industry.
1.2 Authorised firms in the GroupAs at 31 December 2005, 35 companies in the Group,spanning a range of financial services sectors (banking,insurance and investment business), are authorised andregulated to conduct regulated activities by the FSA. Thesecompanies are referred to as ‘authorised firms.’
The FSA supervises the banking business of the UK based banks in the Group, including the Royal Bank,NatWest, Coutts & Co, Ulster Bank Limited and TescoPersonal Finance Limited.
General insurance business is principally undertaken bycompanies in the RBS Insurance division, whilst lifeassurance business is undertaken by Royal ScottishAssurance plc and National Westminster Life AssuranceLimited (with the Group’s partner, the AVIVA Group) andDirect Line Life Insurance Company Limited. Investmentmanagement business is principally undertaken bycompanies in the Wealth Management division, includingAdam & Co Investment Management Limited and Coutts &Co Investment Management Limited, and in the CorporateMarkets division, RBS Asset Management Ltd.
1.3 The FSA’s regulatory approach and supervisory standardsThe regulatory regime focuses on the risks to the FSA ofnot meeting its statutory objectives and uses the full rangeof regulatory tools (including the authorisation of firms,rule-making, supervision, investigation and enforcement)available to the FSA. It is founded on a risk based,integrated approach to regulation.
The FSA can request information from and give directionsto, authorised firms. It may also require authorised firms toprovide independent reports prepared by professionals.The FSA can exercise indirect control over the holdingcompanies of authorised firms via its statutory powers toobject to persons who are, or will become, “controllers” ofthese firms.
As part of its regulatory approach the FSA carries out regularrisk assessments of the firms in the Group and they aresubject generally to direct and on-going FSA supervision.
Setting standards for firmsThe FSA carries out the prudential supervision andconduct of business regulation of all authorised firms andalso regulates the conduct of their business in the UK.Currently, the application of its conduct of business rulesto banking business is limited but detailed conduct ofbusiness requirements apply to general insuranceintermediary activities, mortgage businesses andinvestment business activities.
Prudential supervision includes monitoring the adequacy ofa firm's management, its financial resources and internalsystems and controls. Firms are required to submit regularreturns to the FSA which provide material for supervisoryassessment. Different prudential requirements haveapplied to different sectors of the financial servicesindustry. However, the FSA has prepared an IntegratedPrudential Sourcebook (“IPSB”) aimed at applying a moreharmonised and consistent approach to prudentialregulation across the whole industry. From 1 January 2005,insurers were the first industry segment to comply with theFSA's new IPSB requirements. Implementation for theremainder of the industry is expected in stages, from 1 January 2005 until 1 January 2008.
Many of the standards relating to the capital which firmsmust hold to absorb losses arising from risks to itsbusiness are determined by EU legislation or arenegotiated internationally. The current capital adequacyregime requires firms to maintain certain levels of capital,of certain specified types (or tiers), against particularbusiness risks.
In its supervisory role, the FSA sets requirements relatingto matters such as consolidated supervision, capitaladequacy, liquidity, large exposures, and the adequacy ofaccounting procedures and controls. Banks are required toset out their policy on “large exposures” and to inform theFSA of this. The policy must be reviewed annually and anysignificant departures from policies must be discussedwith the FSA. Large exposures must be monitored andcontrolled.
As regards the insurance industry, the FSA’s primaryobjective is to regulate and supervise the industry so thatpolicyholders have confidence that they have boughtappropriate products, and so that UK insurers are able tomeet their liabilities and treat customers fairly. The FSA setsrequirements relating to “margins of solvency” (i.e. theexcess of the value of assets over the amount of liabilities).Companies carrying out insurance business are requiredto submit regular returns covering reserves and solvency tothe FSA.
Additional information continued

section
04A
dd
ition
alin
form
atio
n
255
Ad
diti
onal
info
rmat
ion
Annual Report and Accounts 2005
Firms must also meet standards relating to seniormanagement and internal systems and controls and mustcomply with rules designed to reduce the scope for firmsto be used for money laundering. Revised Joint MoneyLaundering Steering Group Guidance Notes will come intoforce approximately mid 2006. The EU has published itsdraft Third Money Laundering Directive which willsupersede the two previous Anti Money LaunderingDirectives. Implementation is expected in 2007.
Conduct of business standards essentially govern keyaspects of firms’ relationships with customers, and requirethe provision of clear and adequate information, themanaging of conflicts of interest and the recommending ofproducts suitable to the needs of customers. Themarketing of financial products (particularly investmentproducts) is subject to detailed requirements.
1.4 Focus on customersAn important element in securing an appropriate degree ofconsumer protection is ensuring that suitablearrangements are made for dealing with customercomplaints. Firms are required to establish appropriateinternal complaint handling procedures and to reportcomplaints statistics to the FSA. Where an issue cannot beresolved by the parties it may be referred for independentassessment to the Financial Ombudsman Service.
The FSA’s high level principles require all regulated firms totreat their customers fairly. The FSA has undertaken anumber of industry wide thematic reviews on this issue, andthis is expected to continue in 2006. The FSA has indicatedthat it will include assessment of firms' effectiveness in thisarea in regular risk assessments of firms.
The Financial Services Compensation Scheme (financedby levies on authorised firms) is available to providecompensation up to certain limits if a firm collapses owingmoney to investors, depositors or policyholders.
1.5 FraudTowards the end of October 2004, the FSA launched itsnew policy on combating fraud in the financial servicesindustry – Fighting Fraud in Partnership. The FSA is workingon a programme of activities focusing on (i) actions that theFSA will take, (ii) FSA support for work by tradeassociations and the industry, (iii) creating closerrelationships with law enforcement agencies and, (iv) theGovernment making fraud a higher law enforcement priorityand leading the development of a fraud strategy. On 26October 2005, the Attorney General announced that theGovernment will carry out a wide ranging review of fraud toconsider the scale and costs to the country of fraud. Thefinal report is to be produced by late spring 2006.
1.6 EnforcementWhere appropriate, the FSA may discipline and/orprosecute for breaches of the legislative or regulatoryrequirements. The FSA works closely with the criminalauthorities and uses both civil and criminal powers. It canwithdraw a firm’s authorisation, discipline firms andindividuals, prosecute for various offences and requirefunds to be returned to customers.
The FSA also has powers under certain consumerlegislation to take action against authorised firms toaddress unfair terms in financial services consumercontracts.
1.7 Extension of the FSA’s responsibilitiesFrom 31 October 2004, the scope of the FSA’sresponsibilities was widened to cover the regulation andsupervision of mortgage lending and administration andthe provision of mortgage advice. Arrangements relating tothe sale and administration of general insurance (andcertain other insurance) contracts became regulated from14 January 2005.
1.8 Other relevant UK agencies and Government departmentsConsumer credit issues are covered by the Department ofTrade and Industry (“DTI”) and the Office of Fair Trading(“OFT”) and competition issues are dealt with by the OFT.
Changes to consumer credit regulation are beingpromulgated at both national and EU levels. A number ofchanges to the UK regime took effect in May 2005, and theConsumer Credit Bill, once enacted in 2006, will makefurther, more fundamental, changes. Negotiations alsocontinue on a draft EU Consumer Credit Directive, toharmonise core regulatory standards in each EU MemberState. The UK regime will need to change again when thisDirective is implemented in 2008 or later.
1.9 The European dimensionMuch of the regulatory agenda in the UK and otherEuropean Member States in which the Group operatescontinues to be set by the European Union. Legislationcomprising the Union’s Financial Services Action Plan isnearly complete and implemented, with attention nowturning to the policy agenda through to 2010. TheCommission wishes to pursue a different approach topolicymaking: costed, evidence-based and targeted.Nonetheless, there are some major initiatives already in thepipeline; including a revised Consumer Credit Directive, adirective to establish a Legal Framework for the EuroPayments Area, Solvency II (a revised EU capitalframework for insurance companies), and possiblelegislation on mortgage credit. In addition, the CapitalRequirements Directive and Markets in FinancialInstruments Directive, both of which apply to the Group areexpected to be implemented in the next two years. TheGroup has been increasingly engaged with EU andnational policymakers on all these priority measures, andwill aim to maintain this level of involvement.

256
Add
ition
al in
form
atio
n
2 United StatesAs the ultimate parent of Citizens’ subsidiary US banks, thecompany is a bank holding company within the meaning of,and subject to regulation and supervision under, the USBank Holding Company Act of 1956, as amended (the‘BHCA’), by the Board of Governors of the Federal ReserveSystem (the ‘Federal Reserve Board’). Under currentFederal Reserve Board policy, the company is expected toact as a source of financial strength to its US banksubsidiaries.
The BHCA generally prohibits the company from acquiring,directly or indirectly, the ownership or control of more than5% of the voting shares of any company engaged in non-banking activities in the United States unless the Board hasdetermined, by order or regulation, that such activities areso closely related to banking or managing or controllingbanks as to be a proper incident thereto. In addition, theBHCA requires the company to obtain the prior approval ofthe Federal Reserve Board before acquiring, directly orindirectly, the ownership or control of more than 5% of anyclass of the voting shares of any US bank or bank holdingcompany. With passage of the Gramm-Leach-Bliley Act of 1999 (the “GLBA”), bank holding companies that havemet certain eligibility criteria and elected to become‘financial holding companies’ are permitted to engage in a significantly expanded set of non-banking activities,including making controlling investments in non-bankbusiness ventures without prior approval from the FederalReserve Board under the Federal Reserve Board’smerchant banking authority. The company elected tobecome a financial holding company effective in February 2004. In November 2005, the company notifiedthe Federal Reserve Board that it had commenced itsmerchant banking activities through its US subsidiary,Greenwich Capital Markets, Inc.
The company’s US bank and non-bank subsidiaries, andthe Royal Bank’s US offices, are subject to directsupervision and regulation by various other federal andstate authorities. Citizens’ state chartered banksubsidiaries are subject to regulation and supervision bystate banking authorities and the US Federal DepositInsurance Corporation, and the Royal Bank’s New Yorkbranch is supervised by the New York State BankingDepartment. The company's US insurance agencies areregulated by state insurance authorities. The company’s USsecurities affiliates, including Greenwich Capital MarketsInc., are subject to regulation and supervision by the USSecurities and Exchange Commission and various self-regulating organisations. The futures activities ofGreenwich Capital Markets, Inc. are also subject tooversight by the US Commodity Futures TradingCommission and the Chicago Board of Trade. Charter OneBank N.A., Citizens Bank NA, and RBS National Bank areregulated and supervised primarily by the US Office of theComptroller of the Currency.
3 Regulatory developments for capital and risk managementThe Basel Committee on Banking Supervision, whichmeets at the Bank of International Settlements inSwitzerland, sets the standards for firm’s weighted riskasset calculations and associated regulatory capitaltriggers. This Committee published a revised framework,called Basel 2, in June 2004.
In the EU, the framework became law through the CapitalRequirements Directive (EU CRD) and associated changesto national laws or regulatory guidelines (for example theFSA’s Integrated Prudential Sourcebook). Within the US,regulators have the flexibility to implement Basel 2 directly,after a Final Notice of Prudential Rulemaking expectedlater in 2006. Full adoption of these new rules comes intoforce across the EU on 1 January 2008 and the US on 1 January 2009.
Application of Basel 2 differs between jurisdictions. The EUis applying Basel 2 to all banks and investment firms.The US is taking a different approach, mandating that theirlargest internationally active banks use the ‘Advanced’approaches for credit and operational risk calculations;other banks can either remain on Basel 1 (or a modifiedversion thereof, called Basel 1a) or ‘opt-into’ Basel 2. OurUS subsidiary, Citizens, currently falls outside the group ofmandated Basel 2 banks for the purposes of US regulation.
Basel 2, based around three Pillars, presents afundamental change to the current capital adequacyregime and will have wide ranging consequences for thebanking industry as a whole. RBS is making good progress in satisfying the requirements for credit, marketand operational risk which, together, represent theminimum capital standards (Pillar 1). Work on the otherPillars of Basel 2, supervisory review (Pillar 2) and marketdisclosures (Pillar 3) are also progressing as the standardsare emerging from the regulatory authorities.
Additional information continued

section
04A
dd
ition
alin
form
atio
n
257
Ad
diti
onal
info
rmat
ion
Annual Report and Accounts 2005
Description of property and equipmentThe Group operates from a number of locations worldwide,principally in the UK. At 31 December 2005, the Royal Bankand NatWest had 643 and 1,631 retail branches, respectively,in the UK. Ulster Bank and First Active had a network of 272branches in Northern Ireland and the Republic of Ireland.Citizens had 1,635 retail banking offices (including in-storebranches) covering Connecticut, Delaware, Illinois, Indiana,Massachusetts, Michigan, New Hampshire, New Jersey, NewYork, Ohio, Pennsylvania, Rhode Island and Vermont. Asubstantial majority of the UK branches are owned by theRoyal Bank, NatWest and their subsidiaries or are held underleases with unexpired terms of over 50 years. The Group’sprincipal properties include its headquarters at Gogarburn,Edinburgh, its principal offices in London at 135 and 280Bishopsgate and the Drummond House administration centrelocated at South Gyle, Edinburgh.
Total capital expenditure on premises (excluding investmentproperties), computers and other equipment in the year ended31 December 2005 was £1,275 million (2004 – £1,578 million).
Major shareholdersDetails of major shareholders of the company’s ordinary andpreference shares are given on page 111.
With the exception of Banco Santander Central Hispano S.A.which sold (i) 79 million shares representing 2.5% of thecompany’s ordinary share capital on 9 September 2004 and (ii) 82 million shares representing 2.5% of the company’sordinary share capital on 27 January 2005, there have been no significant changes in the percentage ownership of majorshareholders of the company’s ordinary and preference sharesduring the three years ended 27 February 2006. All shareholderswithin a class of the company’s shares have the same votingrights. The company is not directly or indirectly owned orcontrolled by another corporation or any foreign government.
At 27 February 2006, the directors of the company had optionsto purchase a total of 1,583,566 ordinary shares of the company.
As at 31 December 2005, almost all of the company’s US$denominated preference shares were held by shareholdersregistered in the US. All other shares were predominantly heldby shareholders registered outside the US.

258

section
05S
hare
hold
erin
form
atio
n
259
Sha
reho
lder
info
rma
tion
Annual Report and Accounts 2005
Shareholder information
Contents260 Financial calendar
260 Shareholder enquiries
260 Capital gains tax
261 Analyses of ordinary shareholders
261 Trading market
263 Dividend history
264 Taxation for US holders
268 Exchange controls
268 Memorandum and articles of association
268 Documents on display

260
Sha
reho
lder
info
rma
tion
Financial calendarAnnual General Meeting 28 April 2006 at 2.00 pm,
Edinburgh International Conference Centre,The Exchange, Morrison Street, Edinburgh
Interim results 4 August 2006
DividendsPayment dates:
Ordinary shares (2005 Final) 9 June 2006Ordinary shares (2006 Interim) October 2006Cumulative preference shares 31 May and 29 December 2006Non-cumulative dollar preference shares 31 March, 30 June, 29 September and 29 December 2006
Ex-dividend dates:Ordinary shares (2005 Final) 8 March 2006Cumulative preference shares 3 May 2006
Record dates:Ordinary shares (2005 Final) 10 March 2006Cumulative preference shares 5 May 2006
Shareholder enquiriesShareholdings in the company may be checked by visiting ourwebsite (www.rbs.com/shareholder). You will need the shareholderreference number printed on your share certificate or taxvoucher to gain access to this information.
Braille and audio Annual Review and Summary Financial StatementShareholders requiring a Braille or audio version of the AnnualReview and Summary Financial Statement should contact theRegistrar on 0870 702 0135.
ShareGiftThe company is aware that shareholders who hold a smallnumber of shares may be retaining these shares becausedealing costs make it uneconomical to dispose of them.ShareGift, the charity share donation scheme is a free serviceoperated by The Orr Mackintosh Foundation (registered charity1052686) to enable shareholders to donate unwanted sharesto charity.
Should you wish to donate your shares to charity in this wayyou should contact ShareGift for further information:
ShareGift, The Orr Mackintosh Foundation,46 Grosvenor Street, London W1K 3HNTel: 020 7337 0501www.ShareGift.org
Donating your shares in this way will not give rise to either again or a loss for UK capital gains tax purposes and you maybe able to reclaim UK income tax on gifted shares. Furtherinformation can be obtained from HM Revenue & Customs.
Capital gains taxFor shareholders who held RBS ordinary shares at 31 March1982, the market value of one ordinary share held was 103p.After adjusting for the 1 March 1985 rights issue, the 1 September1989 capitalisation issue and the bonus issue of AdditionalValue Shares on 12 July 2000, the adjusted 31 March 1982base value of one ordinary share held currently is 46.1p.
For shareholders who held NatWest ordinary shares at 31 March1982, the market value of one ordinary share held was 85.16pfor shareholders who accepted the basic terms of the RBSoffer. This takes account of the August 1984 and June 1986rights issues and the June 1989 bonus issue of NatWest ordinaryshares as well as the subsequent issue of Additional Value Shares.
When disposing of shares, shareholders are also entitled toindexation allowance (to April 1998 only in the case of individualsand non-corporate holders), which is calculated on the 31March 1982 value, on the cost of subsequent purchases fromthe date of purchase and on the subscription for rights fromthe date of that payment. Further adjustments must be madewhere a shareholder has chosen to receive shares instead ofcash for dividends. Individuals and non-corporate shareholdersmay also be entitled to some taper relief to reduce the amountof any chargeable gain on disposal of shares.
The information set out above is intended as a general guideonly and is based on current United Kingdom legislation andHM Revenue & Customs practice as at this date. Thisinformation deals only with the position of individualshareholders who are resident in the United Kingdom for taxpurposes, who are the beneficial owners of their shares andwho hold their shares as an investment. It does not deal withthe position of shareholders other than individualshareholders, shareholders who are resident outside theUnited Kingdom for tax purposes or certain types ofshareholders, such as dealers in securities.
Shareholder information

section
05S
hare
hold
erin
form
atio
n
261
Sha
reho
lder
info
rma
tion
Annual Report and Accounts 2005
Analyses of ordinary shareholders at 31 December 2005 %shareholdings millions of total
Individuals 168,687 233.5 7.3Banks and nominee companies 19,832 2,882.5 90.2Investment trusts 162 0.7 —Insurance companies 325 1.8 0.1Other companies 2,531 65.4 2.0Pension trusts 46 8.2 0.3Other corporate bodies 102 4.4 0.1
191,685 3,196.5 100.0
Range of shareholdings:10,000,001–1,000 128,045 43.7 1.410,001,001–10,000 58,577 158.6 5.010,010,001–100,000 3,738 93.1 2.911,100,001–1,000,000 929 301.4 9.411,000,001–10,000,000 341 951.8 29.810,000,001 and over 55 1,647.9 51.5
191,685 3,196.5 100.0
Trading market On 13 September 1995, 16 October 1996, 26 March 1997, 12 February 1998, 8 February 1999, 30 July 1999, 30 September 1999,12 June 2001, 30 September 2004, 26 August 2004, 19 May 2005 and 9 November 2005 the company issued the followingAmerican Depositary Shares (“ADSs”) in the United States:
7,000,000 Series D (“Series D ADSs”) representing 7,000,000 non-cumulative dollar preference shares, Series D;8,000,000 Series E (“Series E ADSs”) representing 8,000,000 non-cumulative dollar preference shares, Series E;8,000,000 Series F (“Series F ADSs”) representing 8,000,000 non-cumulative dollar preference shares, Series F;10,000,000 Series G (“Series G ADSs”) representing 10,000,000 non-cumulative dollar preference shares, Series G;12,000,000 Series H (“Series H ADSs”) representing 12,000,000 non-cumulative dollar preference shares, Series H;12,000,000 Series I (“Series I ADSs”) representing 12,000,000 non-cumulative dollar preference shares, Series I;9,000,000 Series J (“Series J ADSs”) representing 9,000,000 non-cumulative dollar preference shares, Series J;16,000,000 Series K (“Series K ADSs”) representing 16,000,000 non-cumulative dollar preference shares, Series K;34,000,000 Series L (“Series L ADSs”) representing 34,000,000 non-cumulative dollar preference shares, Series L;37,000,000 Series M (“Series M ADSs”) representing 37,000,000 non-cumulative dollar preference shares, Series M;40,000,000 Series N (“Series N ADSs”) representing 40,000,000 non-cumulative dollar preference shares, Series N; and 22,000,000 Series P (“Series P ADSs”) representing 22,000,000 non-cumulative dollar preference shares, Series P.
Each of the respective ADSs represents the right to receiveone corresponding preference share, and is evidenced by anAmerican Depositary Receipt (“ADR”) and is listed on the NewYork Stock Exchange (“NYSE”).
The ADRs evidencing the ADSs above were issued pursuant toDeposit Agreements, among the company, The Bank of NewYork, as depository, and all holders from time-to-time of ADRsissued thereunder. Currently, there is no non-United Statestrading market for any of the non-cumulative dollar preferenceshares. All of the non-cumulative dollar preference shares areheld by the depository, as custodian, in bearer form.
On 28 November 2005, the company redeemed the 9 millionSeries J non-cumulative preference shares of US$0.01 each.The company has given notice that it will, on 6 March 2006,redeem the 7 million Series D and the 12 million Series I, non-cumulative preference shares of US$0.01.
At 31 December 2005, there were 216 registered shareholders of Series D ADSs, 114 registered shareholders of Series EADSs, 133 registered shareholders of Series F ADSs, 83
registered shareholders of Series G ADSs, 82 registeredshareholders of Series H ADSs, 112 registered shareholders ofSeries I ADSs, 62 registered shareholders of Series K ADSs, 28registered shareholders of Series L ADSs, 1 registeredshareholder of Series M ADSs, 43 registered shareholders ofseries N ADSs and 55 registered shareholders of Series P ADSs.
On 29 March 1994 and 23 June 2003, respectively, the companyissued 8,000,000 Exchangeable Capital Securities (“X-CAPs”),Series A and 34,000,000 Exchangeable Capital Securities,Series B, each in connection with a public offering in the UnitedStates. On 30 September 2004, all of the outstanding Series BX-CAPs were exchanged into 34,000,000 non-cumulative dollarpreference shares, Series L. On 31 December 2005, all of theoutstanding Series A X-CAPS were redeemed.
On 20 August 2001, the company issued US$1.2 billion ofperpetual regulatory tier one securities (‘PROs’) in connectionwith a public offering in the United States.
The ADSs and the PRO’s are listed on the NYSE.
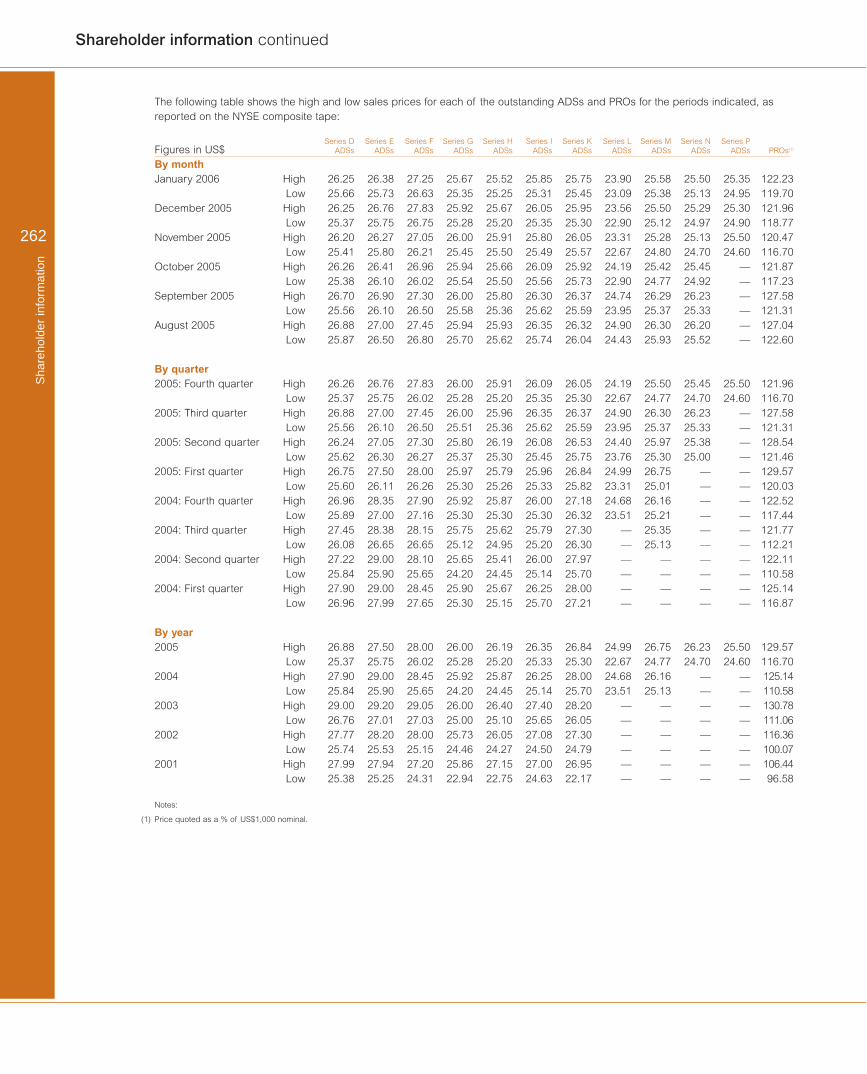
262
Sha
reho
lder
info
rma
tion
The following table shows the high and low sales prices for each of the outstanding ADSs and PROs for the periods indicated, asreported on the NYSE composite tape:
Series D Series E Series F Series G Series H Series I Series K Series L Series M Series N Series PFigures in US$ ADSs ADSs ADSs ADSs ADSs ADSs ADSs ADSs ADSs ADSs ADSs PROs(1)
By month January 2006 High 26.25 26.38 27.25 25.67 25.52 25.85 25.75 23.90 25.58 25.50 25.35 122.23
Low 25.66 25.73 26.63 25.35 25.25 25.31 25.45 23.09 25.38 25.13 24.95 119.70December 2005 High 26.25 26.76 27.83 25.92 25.67 26.05 25.95 23.56 25.50 25.29 25.30 121.96
Low 25.37 25.75 26.75 25.28 25.20 25.35 25.30 22.90 25.12 24.97 24.90 118.77November 2005 High 26.20 26.27 27.05 26.00 25.91 25.80 26.05 23.31 25.28 25.13 25.50 120.47
Low 25.41 25.80 26.21 25.45 25.50 25.49 25.57 22.67 24.80 24.70 24.60 116.70October 2005 High 26.26 26.41 26.96 25.94 25.66 26.09 25.92 24.19 25.42 25.45 — 121.87
Low 25.38 26.10 26.02 25.54 25.50 25.56 25.73 22.90 24.77 24.92 — 117.23September 2005 High 26.70 26.90 27.30 26.00 25.80 26.30 26.37 24.74 26.29 26.23 — 127.58
Low 25.56 26.10 26.50 25.58 25.36 25.62 25.59 23.95 25.37 25.33 — 121.31August 2005 High 26.88 27.00 27.45 25.94 25.93 26.35 26.32 24.90 26.30 26.20 — 127.04
Low 25.87 26.50 26.80 25.70 25.62 25.74 26.04 24.43 25.93 25.52 — 122.60
By quarter2005: Fourth quarter High 26.26 26.76 27.83 26.00 25.91 26.09 26.05 24.19 25.50 25.45 25.50 121.96
Low 25.37 25.75 26.02 25.28 25.20 25.35 25.30 22.67 24.77 24.70 24.60 116.702005: Third quarter High 26.88 27.00 27.45 26.00 25.96 26.35 26.37 24.90 26.30 26.23 — 127.58
Low 25.56 26.10 26.50 25.51 25.36 25.62 25.59 23.95 25.37 25.33 — 121.312005: Second quarter High 26.24 27.05 27.30 25.80 26.19 26.08 26.53 24.40 25.97 25.38 — 128.54
Low 25.62 26.30 26.27 25.37 25.30 25.45 25.75 23.76 25.30 25.00 — 121.462005: First quarter High 26.75 27.50 28.00 25.97 25.79 25.96 26.84 24.99 26.75 — — 129.57
Low 25.60 26.11 26.26 25.30 25.26 25.33 25.82 23.31 25.01 — — 120.032004: Fourth quarter High 26.96 28.35 27.90 25.92 25.87 26.00 27.18 24.68 26.16 — — 122.52
Low 25.89 27.00 27.16 25.30 25.30 25.30 26.32 23.51 25.21 — — 117.442004: Third quarter High 27.45 28.38 28.15 25.75 25.62 25.79 27.30 — 25.35 — — 121.77
Low 26.08 26.65 26.65 25.12 24.95 25.20 26.30 — 25.13 — — 112.212004: Second quarter High 27.22 29.00 28.10 25.65 25.41 26.00 27.97 — — — — 122.11
Low 25.84 25.90 25.65 24.20 24.45 25.14 25.70 — — — — 110.582004: First quarter High 27.90 29.00 28.45 25.90 25.67 26.25 28.00 — — — — 125.14
Low 26.96 27.99 27.65 25.30 25.15 25.70 27.21 — — — — 116.87
By year 2005 High 26.88 27.50 28.00 26.00 26.19 26.35 26.84 24.99 26.75 26.23 25.50 129.57
Low 25.37 25.75 26.02 25.28 25.20 25.33 25.30 22.67 24.77 24.70 24.60 116.702004 High 27.90 29.00 28.45 25.92 25.87 26.25 28.00 24.68 26.16 — — 125.14
Low 25.84 25.90 25.65 24.20 24.45 25.14 25.70 23.51 25.13 — — 110.582003 High 29.00 29.20 29.05 26.00 26.40 27.40 28.20 — — — — 130.78
Low 26.76 27.01 27.03 25.00 25.10 25.65 26.05 — — — — 111.062002 High 27.77 28.20 28.00 25.73 26.05 27.08 27.30 — — — — 116.36
Low 25.74 25.53 25.15 24.46 24.27 24.50 24.79 — — — — 100.072001 High 27.99 27.94 27.20 25.86 27.15 27.00 26.95 — — — — 106.44
Low 25.38 25.25 24.31 22.94 22.75 24.63 22.17 — — — — 96.58
Notes:
(1) Price quoted as a % of US$1,000 nominal.
Shareholder information continued

section
05S
hare
hold
erin
form
atio
n
263
Sha
reho
lder
info
rma
tion
Annual Report and Accounts 2005
Dividend history
Preference and other non-equity dividends2005
Subordinatedliabilities Equity 2004 2003 2002 2001
Amount per share $ £ $ £ £ £ £ £
Non-cumulative preference shares of US$0.01– Series B (1) — — — 0.13 1.65 1.73– Series C (1) — — — 0.11 1.40 1.47– Series D 2.05 1.13 1.11 1.23 1.34 1.41– Series E 2.03 1.12 1.10 1.21 1.32 1.40– Series F 1.91 1.06 1.04 1.15 1.25 1.31– Series G 1.85 1.02 1.00 1.11 1.21 1.27– Series H 1.81 1.00 0.98 1.09 1.18 1.24– Series I 2.00 1.10 1.08 1.20 1.31 1.38– Series J (2) 1.94 1.06 1.15 1.27 1.39 1.46– Series K 1.97 1.09 1.07 1.18 1.29 0.74– Series L 1.44 0.79 0.19 — — —– Series M 1.60 0.88 0.30 — — —– Series N 0.97 0.55 — — — —– Series P 0.22 0.13 — — — —
Non-cumulative convertible preference shares of US$0.01 – Series 1 91.18 50.33 49.05 54.89 59.15 62.70– Series 2 (3) 22.04 11.60 47.43 53.08 57.20 60.63– Series 3 (4) 78.16 43.03 41.74 45.57 49.81 53.74
Non-cumulative convertible preference shares of €0.01 – Series 1 (3) 19.83 11.54 44.19 49.58 44.45 41.34
Non-cumulative preference shares of €0.01 – Series 1 70.72 41.14 3.45 –– –– ––– Series 2 — — –– –– –– ––
Non-cumulative convertible preference shares of £0.01 – Series 1 126.97 73.87 73.87 73.87 73.87 73.87
Non-cumulative convertible preference shares of £0.25 — — — — — 0.08Additional Value Shares of £0.01 — — — 0.55 0.30 0.15
Ordinary dividends 2005 2004 2003 2002 2001
Amount per share cents pence pence pence pence pence
Interim 33.3 19.4 16.8 14.6 12.7 11.0 Final (5) 91.3 53.1 41.2 35.7 31.0 27.0Total dividends on equity shares 124.6 72.5 58.0 50.3 43.7 38.0
Notes:
(1) Redeemed on 30 January 2003.
(2) Redeemed on 28 November 2005.
(3) Redeemed on 31 March 2005.
(4) Redeemed on 30 December 2005.
(5) 2005 final dividends are proposed.
For further information, see Notes 6 and 7 on the accounts.

264
Sha
reho
lder
info
rma
tion
Shareholder information continued
Taxation for US HoldersThe following discussion summarises certain US federal andUK tax consequences of the acquisition, ownership anddisposition of non-cumulative dollar preference shares, ADSs,X-CAPs or PROs by a beneficial owner that is a citizen orresident of the United States or that otherwise will be subjectto US federal income tax on a net income basis in respect ofthe non-cumulative dollar preference shares, ADSs, X-CAPs orPROs (a “US Holder”). This summary assumes that a USHolder is holding non-cumulative dollar preference shares,ADSs, X-CAPs or PROs, as applicable, as capital assets. Thissummary does not address the tax consequences to a USHolder (i) that is resident (or, in the case of an individual,ordinarily resident) in the UK for UK tax purposes or (ii) generally,that is a corporation which alone or together with one or moreassociated companies, controls, directly or indirectly, 10% ormore of the voting stock of the company.
The statements and practices set forth below regarding USand UK tax laws, including the US/UK double taxationconvention relating to income and capital gains which enteredinto force on 31 March 2003 (the “Treaty”), and the US/UKdouble taxation convention relating to estate and gift taxes (the“Estate Tax Treaty”), are based on those laws and practices asin force and as applied in practice on the date of this Report.This summary is not exhaustive of all possible taxconsiderations and holders are advised to satisfy themselvesas to the overall tax consequences, including specifically theconsequences under US federal, state, local and other laws,and possible changes in taxation law, of the acquisition,ownership and disposition of non-cumulative dollar preferenceshares, ADSs, X-CAPs or PROs by consulting their own taxadvisers.
For the purposes of the Treaty, the Estate Tax Treaty and theUS Internal Revenue Code of 1986, as amended (the “Code”),US Holders of ADSs will be treated as owners of the non-cumulative dollar preference shares underlying such ADSs.
Preference shares or ADSsTaxation of dividendsThe company is not required to withhold tax at source fromdividend payments it makes or from any amount (including anyamounts in respect of accrued dividends) distributed by thecompany.
Dividends paid by the company will constitute foreign sourcedividend income for US federal income tax purposes to theextent paid out of the current or accumulated earnings andprofits of the company, as determined for US federal incometax purposes. Payments will not be eligible for the dividends-received deduction allowed to corporate US Holders.
Subject to applicable limitations that may vary depending upona holder’s individual circumstances, dividends paid to certainnon-corporate US Holders in taxable years beginning before 1 January 2009 will be taxable at a maximum tax rate of 15%.Non-corporate US Holders should consult their own taxadvisers to determine whether they are subject to any specialrules that limit their ability to be taxed at this favourable rate.
If a corporate US Holder is subject to UK corporation tax byreason of carrying on a trade in the UK through a permanentestablishment and its non-cumulative dollar preference shareor ADS is, or has been, used, held or acquired for thepurposes of that permanent establishment, certain provisionsintroduced by the Finance (No. 2) Act 2005 will apply if the USHolder holds its non-cumulative dollar preference share or ADSfor a “tax avoidance purpose”. If these provisions apply,dividends on the non-cumulative dollar preference share orADS, as well as certain fair value credits and debits arising inrespect of such share or ADS, will be brought within thecharge to UK corporation tax on income and the UK taxposition outlined in the preceding paragraphs will not apply inrelation to such US Holder.
Taxation of capital gainsA US Holder that is not resident (or, in the case of anindividual, ordinarily resident) in the UK will not normally beliable for UK tax on capital gains realised on the disposition ofsuch holder’s non-cumulative dollar preference share or ADSunless at the time of the disposal, in the case of a corporateUS Holder, such US Holder carries on a trade in the UKthrough a permanent establishment or, in the case of any otherUS Holder, such US Holder carries on a trade, profession orvocation in the UK through a UK branch or agency and suchnon-cumulative dollar preference share or ADS is or has beenused, held or acquired by or for the purposes of such trade (orprofession or vocation), permanent establishment, branch oragency. Special rules apply to individuals who are temporarilynot resident or ordinarily resident in the UK.
A US Holder will, upon the sale, exchange or redemption of anon-cumulative dollar preference share or ADS, generallyrecognise capital gain or loss for US federal income tax purposes(assuming that in the case of a redemption, such US Holderdoes not own, and is not deemed to own, any ordinary shares ofthe company) in an amount equal to the difference between theamount realised (excluding in the case of a redemption anyamount treated as a dividend for US federal income taxpurposes, which will be taxed accordingly) and the US Holder’stax basis in the non-cumulative dollar preference share or ADS.
A US Holder who is liable for both UK and US tax on gainrecognised on the disposal of a non-cumulative dollarpreference share or ADS will generally be entitled, subject tocertain limitations, to credit the UK tax against its US federalincome tax liability in respect of such gain.
Estate and gift taxA non-cumulative dollar preference share or ADS beneficiallyowned by an individual, whose domicile is determined to bethe United States for purposes of the Estate Tax Treaty andwho is not a national of the UK, will not be subject to UKinheritance tax on the individual’s death or on a lifetime transferof the non-cumulative dollar preference share or ADS, exceptin certain cases where the non-cumulative dollar preferenceshare or ADS (i) is comprised in a settlement (unless, at thetime of the settlement, the settlor was domiciled in the UnitedStates and was not a national of the UK); (ii) is part of the

section
05S
hare
hold
erin
form
atio
n
265
Sha
reho
lder
info
rma
tion
Annual Report and Accounts 2005
business property of a UK permanent establishment of anenterprise; or (iii) pertains to a UK fixed base of an individualused for the performance of independent personal services.The Estate Tax Treaty generally provides a credit against USfederal estate or gift tax liability for the amount of any tax paidin the UK in a case where the non-cumulative dollar preferenceshare or ADS is subject to both UK inheritance tax and USfederal estate or gift tax.
UK stamp duty and stamp duty reserve tax (“SDRT”)The following is a summary of the UK stamp duty and SDRTconsequences of transferring an ADS in registered form(otherwise than to the custodian on cancellation of the ADS) orof transferring a non-cumulative dollar preference share.A transfer of a registered ADS executed and retained in theUnited States will not give rise to stamp duty and an agreementto transfer a registered ADS will not give rise to SDRT.Stamp duty or SDRT will normally be payable on or in respectof transfers of non-cumulative dollar preference shares andaccordingly any holder who acquires or intends to acquirenon-cumulative dollar preference shares is advised to consultits own tax advisers in relation to stamp duty and SDRT.
X-CAPsUnited StatesBecause the X-CAPs have no stated maturity, can beexchanged for preference shares or ADSs at the option of thecompany, would be treated as if they were preference shares ina winding-up of the company, and the company may elect notto make payments on the X-CAPs, the X-CAPs will be treatedas equity for US federal income tax purposes.
Payments (including any UK withholding tax, as to which seebelow) will constitute foreign source dividend income for USfederal income tax purposes to the extent paid out of thecurrent or accumulated earnings and profits of the company,as determined for US federal income tax purposes. Paymentswill not be eligible for the dividends-received deduction allowedto corporate US Holders. A US Holder who is entitled under theTreaty to a refund of UK tax, if any, withheld on a payment will notbe entitled to claim a foreign tax credit with respect to such tax.
Subject to applicable limitations that may vary depending upona holder’s individual circumstances, dividends paid to certainnon-corporate US Holders in taxable years beginning before 1 January 2009 will be taxable at a maximum tax rate of 15%.Non-corporate US Holders should consult their own taxadvisers to determine whether they are subject to any specialrules that limit their ability to be taxed at this favourable rate.
A US Holder will, upon the sale, exchange or redemption ofX-CAPs, generally recognise capital gain or loss for US federalincome tax purposes (assuming that in the case of aredemption, such US Holder does not own, and is not deemedto own, any ordinary shares of the company) in an amountequal to the difference between the amount realised (excludingin the case of a redemption any amount treated as a dividendfor US federal income tax purposes, which will be taxedaccordingly) and the US Holders tax basis in the X-CAPs.
A US Holder who is liable for both UK and US tax on gainrecognised on the disposal of the X-CAPs will generally beentitled, subject to certain limitations, to credit the UK taxagainst its US federal income tax liability in respect of such gain.
Gain or loss will not be recognised by a US Holder upon theexchange of X-CAPs for preference shares or ADSs pursuantto the company’s exercise of its exchange right. A US Holder’sbasis in the preference shares or ADSs received in exchangefor its X-CAPs will be the same as the US Holder’s basis in theX-CAPs at the time of the exchange and the US Holder’s holdingperiod for the preference shares or ADSs received in the exchangewill include the holding period of the X-CAPs exchanged.
United KingdomTaxation of payments of interestPayments on the X-CAPs will constitute interest rather thandividends for UK withholding tax purposes. However, the X-CAPs will constitute ‘quoted eurobonds’ within the meaningof section 349 of the Income and Corporation Taxes Act 1988, and therefore payments of interest will not be subject to withholding or deduction for or on account of UK taxation as long as the X-CAPs remain at all times listed on the NewYork Stock Exchange or some other recognised stockexchange within the meaning of section 841 of the Incomeand Corporation Taxes Act 1988. In all other cases an amount must be withheld on account of UK income tax at the lowerrate (currently 20%) subject to any direction to the contrary by HM Revenue & Customs under the Treaty and except thatthe withholding obligation is disapplied in respect of paymentsto persons who the company reasonably believes are withinthe charge to corporation tax or fall within various categoriesenjoying a special tax status (including charities and pensionfunds), or are partnerships consisting of such persons (unlessHM Revenue & Customs directs otherwise).
If interest were paid under deduction of UK income tax (e.g.,if the X-CAPs lost their listing), US Holders may be able toclaim a refund of the tax deducted under the Treaty.
Any paying agent or other person through whom interest ispaid to, or by whom interest is received on behalf of, anindividual, may be required to provide information in relation to the payment and the individual concerned to HM Revenue &Customs. HM Revenue & Customs may communicate thisinformation to the tax authorities of other jurisdictions.
HM Revenue & Customs confirmed at around the time of issueof the X-CAPs that interest payments should not be treated asdistributions for UK tax purposes by reason of (i) the fact thatinterest may be deferred under the terms of issue or (ii) theundated nature of the X-CAPs, provided that at the time aninterest payment is made, the X-CAPs are not held by acompany which is ‘associated’ with the company or by a‘funded company’. A company will be associated with thecompany if, broadly speaking, it is in the same group as thecompany. A company will be a ‘funded company’ for thesepurposes if there are arrangements involving that companybeing put in funds (directly or indirectly) by the company, or an entity associated with the company. In this respect,

266
Sha
reho
lder
info
rma
tion
Shareholder information continued
Taxation for US Holders (continued)
HM Revenue & Customs has confirmed that a companyholding an interest in X-CAPs which incidentally has bankingfacilities with any company associated with the company willnot be a ‘funded company’ by virtue of such facilities.
Interest on the X-CAPs constitutes UK source income for UKtax purposes and, as such, may be subject to income tax bydirect assessment even where paid without withholding.However, interest with a UK source received without deductionor withholding on account of UK tax will not be chargeable toUK tax in the hands of a US Holder unless, in the case of acorporate US Holder, such US Holder carries on a trade in theUK through a UK permanent establishment or in the case ofother US Holders, such persons carry on a trade, profession or vocation in the UK through a UK branch or agency inconnection with which the interest is received or to which theX-CAPs are attributable. There are exemptions for interestreceived by certain categories of agents (such as somebrokers and investment managers).
EU Directive on taxation of savings incomeThe European Union has adopted a directive regarding thetaxation of savings income. The Directive requires MemberStates of the European Union to provide to the tax authoritiesof other Member States details of payments of interest or othersimilar income paid by a person to an individual in anotherMember State, except that Belgium, Luxembourg and Austriaare instead imposing a withholding system for a transitionalperiod unless during such period they elect otherwise.
Disposal (including redemption)A disposal (including redemption) of X-CAPs by a non-corporate US Holder will not give rise to any liability to UKtaxation on capital gains unless the US Holder carries on atrade (which for this purpose includes a profession or vocation)in the UK through a branch or agency and the X-CAPs are,or have been, held or acquired for the purposes of that trade,branch or agency. The exchange by such US Holder ofX-CAPs for preference shares or ADSs pursuant to thecompany’s exercise of its exchange right will not give rise to a charge to UK tax on capital gains even if such US Holderwould be subject to tax on a disposal of such holder’s X-CAPsin accordance with the tax treatment referred to previously.
A transfer of X-CAPs by a US Holder will not give rise to acharge to UK tax on accrued but unpaid interest payments,unless the US Holder is an individual or other non-corporatetaxpayer and at any time in the relevant year of assessment or accounting period carries on a trade in the UK through abranch or agency to which the X-CAPs are attributable.
Annual tax chargesCorporate US Holders of X-CAPs may be subject to annual UKtax charges (or relief) by reference to fluctuations in exchangerates and in respect of profits, gains and losses arising fromthe X-CAPs, but only if such corporate US Holders carry on atrade, profession or vocation in the UK through a UK permanentestablishment to which the X-CAPs are attributable.
Inheritance taxX-CAPs in bearer form physically held outside the UK shouldnot be subject to UK inheritance tax in respect of a lifetimetransfer by, or the death of, a US Holder who is neitherdomiciled nor deemed to be domiciled in the UK forinheritance tax purposes. However, in relation to X-CAPs heldthrough DTC (or any other clearing system), the position is notfree from doubt and the HM Revenue and Customs is known toconsider that the situs of securities held in this manner is notnecessarily determined by the place in which the securities arephysically held. If X-CAPs in bearer form are or becomesituated in the UK, or if X-CAPs are held in registered form,there may be a charge to UK inheritance tax as a result of alifetime transfer at less than fair market value by, or on thedeath of, such US Holder. However, exemption from, or areduction of, any such UK tax liability may be available underthe Estate Tax Treaty in the same manner as for non-cumulativedollar preference shares. US Holders should consult theirprofessional advisers in relation to such potential liability.
Stamp duty and SDRTNo UK stamp duty is payable on the transfer by delivery orredemption of bearer X-CAPs, whether in definitive form or inthe form of one or more global X-CAPs. No SDRT is payableon any agreement to transfer bearer X-CAPs, provided that theagreement is not made in contemplation of, or as part of anarrangement for, a takeover of the company.
No UK stamp duty will be payable in respect of any instrumentof transfer of depositary interests representing X-CAPs,provided that any instrument relating to such transfer is notexecuted in the UK, and remains at all times outside the UK.Depositary interests representing X-CAPs will not be“chargeable securities” for SDRT purposes, and consequentlya transfer of such depositary interests will not be subject toSDRT. Although the position is not clear, the transfer on the saleof X-CAPs in registered form may attract ad valorem UK stampduty or (if an unconditional agreement to transfer X-CAPs isnot completed by a duly stamped transfer) UK SDRT, generallyat the rate of 0.5% of the consideration paid, which, in thecase of stamp duty, will be rounded up to £5 or multiplesthereof. The transfer of X-CAPs in registered form to, or to anominee or agent for, a person whose business (i) is orincludes issuing depositary receipts or (ii) is or includes theprovision of clearance services, may give rise to a liability toUK stamp duty or (to the extent that UK stamp duty is not paidon an instrument of transfer) UK SDRT, generally at the rate of1.5% of the price of the X-CAPs transferred, which, in the caseof stamp duty, will be rounded up to £5 or multiples thereof.Such transfer of X-CAPs in bearer form may give rise to acharge to UK SDRT generally at the rate of 1.5% of the priceof the X-CAPs transferred. A charge to UK SDRT may alsoarise on the issue of X-CAPs whether in registered or bearerform to, or to a nominee or agent for, a person whose businessis or includes issuing depositary receipts or includes theprovision of clearance services, generally at the rate of 1.5%of the price of the X-CAPs issued.

section
05S
hare
hold
erin
form
atio
n
267
Sha
reho
lder
info
rma
tion
Annual Report and Accounts 2005
PROsUnited StatesPayments of interest on a PRO (including any UK withholdingtax, as to which see below) will constitute foreign sourcedividend income for US federal income tax purposes to theextent paid out of the current or accumulated earnings andprofits of the company, as determined for US federal incometax purposes. Payments will not be eligible for the dividends-received deduction allowed to corporate US Holders. A USHolder who is entitled under the Treaty to a refund of UK tax,if any, withheld on a payment will not be entitled to claim aforeign tax credit with respect to such tax.
Subject to applicable limitations that may vary depending upona holder’s individual circumstances, dividends paid to certainnon-corporate US Holders in taxable years beginning before 1January 2009 will be taxable at a maximum tax rate of 15%.Non-corporate US Holders should consult their own taxadvisers to determine whether they are subject to any specialrules that limit their ability to be taxed at this favourable rate.
A US Holder will, upon the sale, exchange or redemption of aPRO, generally recognise capital gain or loss for US federalincome tax purposes (assuming that in the case of aredemption, such US Holder does not own, and is not deemedto own, any ordinary shares of the company) in an amountequal to the difference between the amount realised (excludingany amount in respect of mandatory interest and any MissedPayments which are to be satisfied on a Missed PaymentSatisfaction Date, which would be treated as ordinary income)and the US Holder’s tax basis in the PRO.
A US Holder who is liable for both UK and US tax on gainrecognised on the disposal of PROs will generally be entitled,subject to certain limitations, to credit the UK tax against its USfederal income tax liability in respect of such gain.
United KingdomTaxation of payments on the PROsPayments on the PROs will constitute interest rather thandividends for UK withholding tax purposes. However, the PROswill constitute “quoted eurobonds” within the meaning of section349 of the Income and Corporation Taxes Act 1988 and thereforepayments of interest will not be subject to withholding ordeduction for or on account of UK taxation as long as the PROsremain at all times listed on a ‘recognised stock exchange’ withinthe meaning of section 841 of the Income and Corporation TaxesAct 1988. In all other cases, an amount must be withheld onaccount of UK income tax at the lower rate (currently 20%)subject to any direction to the contrary by HM Revenue &Customs under the Treaty and except that the withholdingobligation is disapplied in respect of payments to persons whothe company reasonably believes are within the charge tocorporation tax or fall within various categories enjoying a specialtax status (including charities and pension funds), or arepartnerships consisting of such persons (unless HM Revenue &Customs directs otherwise). Where interest has been paid underdeduction of UK withholding tax, US Holders may be able torecover the tax deducted under the Treaty.
Any paying agent or other person by or through whom interestis paid to, or by whom interest is received on behalf of, anindividual, may be required to provide information in relation tothe payment and the individual concerned to HM Revenue &Customs. HM Revenue & Customs may communicate thisinformation to the tax authorities of other jurisdictions.
HM Revenue & Customs confirmed at around the time of theissue of the PROs that interest payments would not be treatedas distributions for UK tax purposes by reason of (i) the factthat interest may be deferred under the terms of issue or (ii) the undated nature of the PROs, provided that at the timean interest payment is made, the PROs are not held by acompany which is ‘associated’ with the company or by a‘funded company’. A company will be associated with thecompany if, broadly speaking, it is part of the same group asthe company. A company will be a ‘funded company’ for thesepurposes if there are arrangements involving that companybeing put in funds (directly or indirectly) by the company, or anentity associated with the company. In this respect, HMRevenue & Customs has confirmed that a company holding aninterest in the PROs which incidentally has banking facilitieswith any company associated with the company will not be a‘funded company’ by virtue of such facilities.
Interest on the PROs constitutes UK source income for UK taxpurposes and, as such, may be subject to income tax bydirect assessment even where paid without withholding.However, interest with a UK source received without deductionor withholding on account of UK tax will not be chargeable toUK tax in the hands of a US Holder unless, in the case of acorporate US Holder, such US Holder carries on a trade in theUK through a UK permanent establishment or in the case ofother US Holders, such persons carry on a trade, profession orvocation in the UK through a UK branch or agency inconnection with which the interest is received or to which thePROs are attributable. There are exemptions for interestreceived by certain categories of agents (such as somebrokers and investment managers).
EU Directive on taxation of savings incomeThe European Union has adopted a directive regarding thetaxation of savings income. The Directive requires MemberStates of the European Union to provide to the tax authoritiesof other Member States details of payments of interest andother similar income paid by a person to an individual residentin another Member State, except that Belgium, Luxembourgand Austria are instead imposing a withholding system for atransitional period unless during such period they electotherwise.
Disposal (including redemption)A disposal (including redemption) of PROs by a non-corporateUS Holder will not give rise to any liability to UK taxation on capitalgains unless the US Holder carries on a trade (which for thispurpose includes a profession or a vocation) in the UK througha branch or agency and the PROs are, or have been, held oracquired for the purposes of that trade, branch or agency.

Shareholder information continued
Taxation for US Holders (continued)
A transfer of PROs by a US Holder will not give rise to a chargeto UK tax on accrued but unpaid interest payments, unless theUS Holder is an individual or other non-corporate taxpayer andat any time in the relevant year of assessment or accountingperiod carries on a trade in the UK through a branch or agencyto which the PROs are attributable.
Annual tax chargesCorporate US Holders of PROs may be subject to annual UKtax charges (or relief) by reference to fluctuations in exchangerates and in respect of profits, gains and losses arising fromthe PROs, but only if such corporate US Holders carry on atrade, profession or vocation in the UK through a UK permanentestablishment to which the PROs are attributable.
Inheritance taxIn relation to PROs held through DTC (or any other clearingsystem), the UK inheritance tax position is not free from doubtin respect of a lifetime transfer, or death of, a US Holder who is not domiciled nor deemed to be domiciled in the UK forinheritance tax purposes; HM Revenue & Customs is known toconsider that the situs of securities held in this manner is notnecessarily determined by the place where the securities areregistered. In appropriate circumstances, there may be acharge to UK inheritance tax as a result of a lifetime transfer atless than fair market value by, or on the death of, such USHolder. However, exemption from, or a reduction of, any suchUK tax liability may be available under the Estate Tax Treaty.US Holders should consult their professional advisers inrelation to such potential liability.
Stamp duty and SDRTNo stamp duty, SDRT or similar tax is imposed in the UK on theissue, transfer or redemption of the PROs.
Exchange controlsThe company has been advised that there are currently no UKlaws, decrees or regulations which would prevent the remittanceof dividends or other payments to non-UK resident holders ofthe company’s non-cumulative dollar preference shares.
There are no restrictions under the articles of association ofthe company or under UK law, as currently in effect, which limitthe right of non-UK resident owners to hold or, when entitled tovote, freely to vote the company’s non-cumulative dollarpreference shares.
Memorandum and articles of associationThe company’s Memorandum of Association (the “Memorandum”)and Articles of Association (the “Articles”) as in effect at thedate of this annual report are registered with the Registrar ofCompanies of Scotland. The Articles were last amended on 29April 2004 and have been filed with the SEC.
Documents on displayDocuments concerning the company may be inspected at 36 St Andrew Square, Edinburgh, EH2 2YB.
Executive directors’ service contracts and copies of directors’indemnities granted by the company in terms of section 309Cof the Companies Act 1985 may be inspected at thecompany’s office at Gogarburn, Edinburgh, EH12 1HQ(telephone 0131 626 4117).
In addition, we file reports and other information with the SEC.You can read and copy these reports and other information atthe SEC’s Public Reference Room at 100 F Street, N.E., Room1580, Washington, D.C. 20549. You can call the SEC at 1-800-SEC-0330 for further information on the Public Reference Roomor contact the offices of The New York Stock Exchange,on which certain of our securities are listed, at 20 BroadStreet, New York, New York 10005. The SEC also maintains a website at www.sec.gov which contains in electronic formeach of the reports and other information that we have filedelectronically with the SEC.
Sha
reho
lder
info
rma
tion
268

Important addresses
Shareholder enquiriesRegistrarComputershare Investor Services PLCPO Box 82The PavilionsBridgwater RoadBristol BS99 7NHTelephone: 0870 702 0135Facsimile: 0870 703 6009Email: [email protected]
Group SecretariatThe Royal Bank of Scotland Group plcPO Box 1000Business House FGogarburnEdinburgh EH12 1HQTelephone: 0131 556 8555Facsimile: 0131 626 3081
Investor Relations280 BishopsgateLondon EC2M 4RBTelephone: 0207 672 1578Email: [email protected]
Registered office36 St Andrew Square Edinburgh EH2 2YBTelephone: 0131 556 8555
Registered in Scotland No. 45551
Websitewww.rbs.com
Principal offices
The companyPO Box 1000 Gogarburn Edinburgh EH12 1HQTelephone: 0131 626 0000
The Royal Bank of Scotland plcPO Box 1000 Gogarburn Edinburgh EH12 1HQ280 Bishopsgate London EC2M 4RB
National Westminster Bank Plc135 Bishopsgate London EC2M 3UR
CitizensCitizens Financial Group, Inc.One Citizens Plaza Providence Rhode Island 02903 USA
Ulster Bank11-16 Donegall Square East Belfast BT1 5UBGeorge’s Quay Dublin 2
RBS InsuranceDirect Line House 3 Edridge Road Croydon Surrey CR9 1AGChurchill Court Westmoreland Road Bromley BR1 1DP
RBS Greenwich Capital600 Steamboat Road Greenwich Connecticut 06830 USA
Coutts Group440 Strand London WC2R 0QS
The Royal Bank of Scotland International LimitedRoyal Bank House 71 Bath Street St Helier Jersey Channel Islands JE4 8PJ
NatWest Offshore23/25 Broad Street St Helier Jersey Channel Islands JE4 8QG

The Royal Bank of Scotland Group plcGroup HeadquartersPO Box 1000GogarburnEdinburghEH12 1HQ