Mesozoic extensional tectonics in the southeast Iberian Chain
Upload
geologicalsurveyCategory
view
2download
0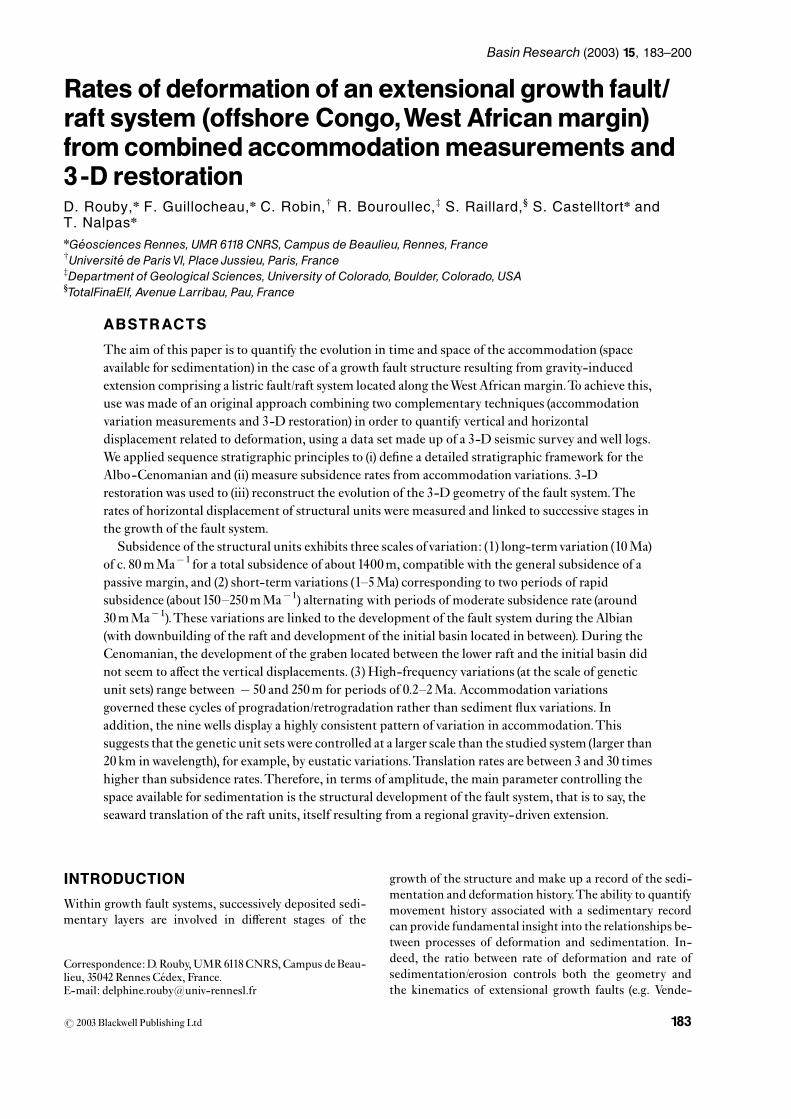
Rates of deformation of an extensional growth fault/raft system (offshore Congo,West Africanmargin)from combinedaccommodationmeasurements and3-D restorationD. Rouby,n F. Guillocheau,n C. Robin,w R. Bouroullec,z S. Raillard,‰ S. Castelltortn andT. Nalpasn
nGe¤ osciences Rennes, UMR 6118 CNRS, Campus de Beaulieu, Rennes, FrancewUniversite¤ de ParisVI, Place Jussieu, Paris, FrancezDepartment of Geological Sciences, University of Colorado, Boulder, Colorado, USA‰TotalFinaElf, Avenue Larribau, Pau, France
ABSTRACTS
The aim of this paper is to quantify the evolution in time and space of the accommodation (spaceavailable for sedimentation) in the case of a growth fault structure resulting from gravity-inducedextension comprising a listric fault/raft system located along theWest African margin.To achieve this,use was made of an original approach combining two complementary techniques (accommodationvariation measurements and 3-D restoration) in order to quantify vertical and horizontaldisplacement related to deformation, using a data set made up of a 3-D seismic survey andwell logs.We applied sequence stratigraphic principles to (i) de¢ne a detailed stratigraphic framework for theAlbo-Cenomanian and (ii) measure subsidence rates from accommodation variations. 3-Drestorationwas used to (iii) reconstruct the evolution of the 3-D geometry of the fault system.Therates of horizontal displacement of structural units were measured and linked to successive stages inthe growth of the fault system.Subsidence of the structural units exhibits three scales ofvariation: (1) long-termvariation (10Ma)
of c. 80mMa�1 for a total subsidence of about1400m, compatible with the general subsidence of apassive margin, and (2) short-term variations (1^5Ma) corresponding to two periods of rapidsubsidence (about150^250mMa�1) alternating with periods of moderate subsidence rate (around30mMa�1).These variations are linked to the development of the fault system during the Albian(with downbuilding of the raft and development of the initial basin located in between). During theCenomanian, the development of the graben located between the lower raft and the initial basin didnot seem to a¡ect the vertical displacements. (3) High-frequency variations (at the scale of geneticunit sets) range between � 50 and 250m for periods of 0.2^2Ma. Accommodation variationsgoverned these cycles of progradation/retrogradation rather than sediment £ux variations. Inaddition, the nine wells display a highly consistent pattern of variation in accommodation.Thissuggests that the genetic unit setswere controlled at a larger scale than the studied system (larger than20 km inwavelength), for example, by eustatic variations.Translation rates are between 3 and 30 timeshigher than subsidence rates.Therefore, in terms of amplitude, the main parameter controlling thespace available for sedimentation is the structural development of the fault system, that is to say, theseaward translation of the raft units, itself resulting from a regional gravity-driven extension.
INTRODUCTION
Within growth fault systems, successively deposited sedi-mentary layers are involved in di¡erent stages of the
growth of the structure and make up a record of the sedi-mentation and deformation history.The ability to quantifymovement history associated with a sedimentary recordcan provide fundamental insight into the relationships be-tween processes of deformation and sedimentation. In-deed, the ratio between rate of deformation and rate ofsedimentation/erosion controls both the geometry andthe kinematics of extensional growth faults (e.g. Vende-
Correspondence:D.Rouby,UMR6118CNRS,Campus deBeau-lieu, 35042 Rennes Ce¤ dex, France.E-mail: [email protected]
BasinResearch (2003) 15, 183–200
r 2003 Blackwell Publishing Ltd 183
ville, 1987; Vendeville et al., 1987; Vendeville & Cobbold,1988; Nalpas & Brun, 1993;Mauduit, 1998).
Starting from the sedimentary record, two di¡erenttechniques can be used to measure displacements relatedto deformation. One approach, based on sequence strati-graphy, is to measure the temporal and spatial variationsof space available for sedimentation (i.e. the accommoda-tion) controlled by absolute sea level variations as well astectonic movements of the basement (Jervey, 1988; Posa-mentier et al., 1988).Variations of accommodation can bemeasured for a given time step and location by summingthe decompacted thickness of sediments and the variationof bathymetry (Jervey, 1988).When corrected for eustasy,accommodation variations measure the vertical displace-ments related to deformation. A major strength of this ap-proach is that accommodation variations can be measuredat high resolution (generally for increments of time lessthan a million years). However, the main drawback is that,in this method, only vertical movements are measured.This approximation is acceptable for an intracratonicbasin (Robin, 1997; Robin et al., 1998; Robin et al., 2000) ora vertical normal fault (Dromart et al., 1998); however, wecan seldom ignore horizontal displacements associatedwith growth faults on the kilometre to tens of kilometrescale.
The second approach, based on structural geology, is toquantify the displacements associated with folding andfaulting of stratigraphic horizons using restoration techni-ques (e.g. Dahlstrom, 1969; Hossack, 1979; Gibbs, 1983).The restoration of a stratigraphic marker corresponds tothe reconstruction of its geometry before deformation.The di¡erence between the deformed (present day) andundeformed (restored) states gives the ¢eld of ¢nite displa-cements. Recent techniques allow the reconstruction to beperformed in 3-D (Gratier et al., 1991; Guillier, 1991; Gra-tier & Guillier, 1993; Samson, 1996; Williams et al., 1997;Rouby et al., 2000), that is to compute 3-D displacement¢elds.Themain drawback of this approach is that it usuallyprovides rates of deformation (if dating of the restored hor-izons is available) for time steps greater than a millionyears (Dromart et al., 1998).
These two approaches are therefore very complemen-tary to measure displacement rates related to deformationusing the sedimentary record, one providing a good tem-poral resolution and the other a description of the 3-Daspect of displacement and deformation.
The aim of this paper is to quantify the evolution, intime and space, of the space available for sedimentationin the case of a growth fault structure resulting from grav-ity-induced extension: a listric fault/raft system, locatedalong the West African margin. To achieve this, we usedan original approach combining these two complementarytechniques: accommodation variation measurements and3-D restoration.
In a previous study (Rouby et al., 2002), we establishedthe 3-D structural framework of the studied area, deter-mined its kinematics and quanti¢ed the increments ofdeformation. In order to do this, we:
(i) built a 3-D geometrical model of the growth fault/raftsystem (from a 3-D seismic data set andwell logs);
(ii) restored six stratigraphic horizons of the model in 3-D, which enabled
(iii) the reconstruction of the fault system geometry at sixincremental stages of its evolution.
In the present paper, we:
(i) present a sequence stratigraphic analysis of the welldata set;
(ii) compare the rates of vertical displacement, obtainedfrom accommodation variation measurements, withthe horizontal displacements obtained by 3-Drestoration;
(iii) discuss the parameters controlling the variations ofspace available for sedimentation at di¡erent spatialand temporal scales.
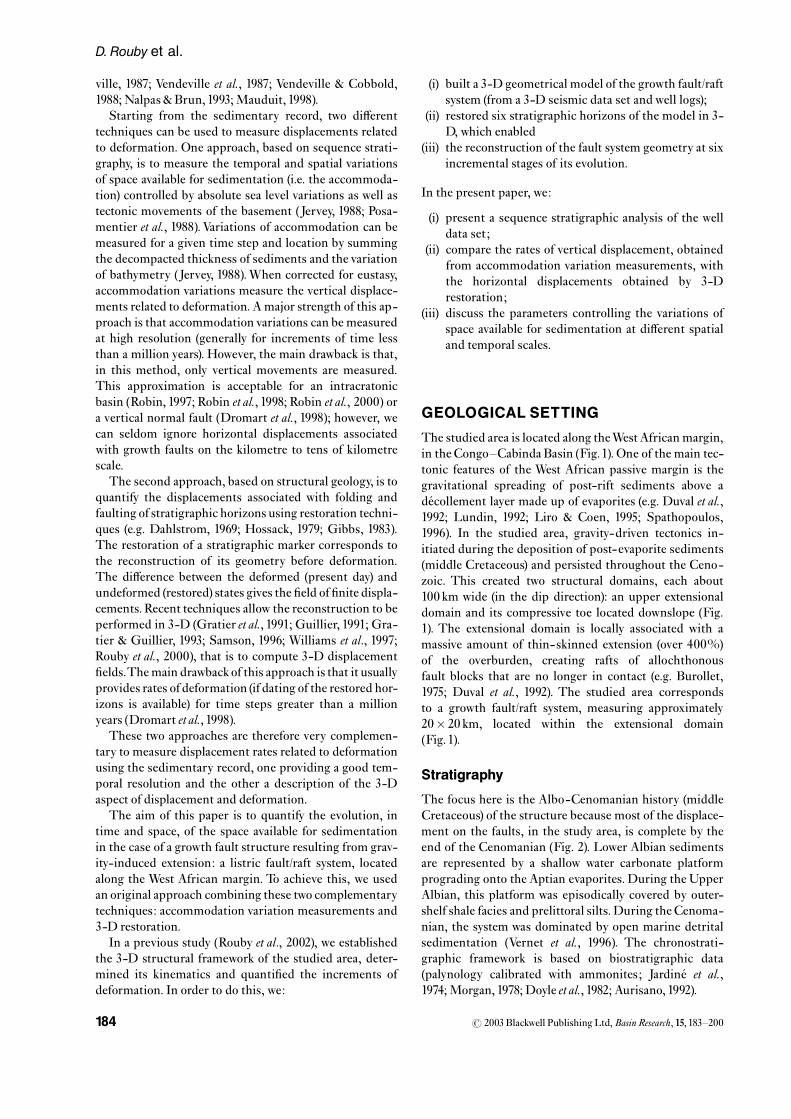
GEOLOGICAL SETTING
The studied area is located along theWest African margin,in the Congo^Cabinda Basin (Fig.1). One of the main tec-tonic features of the West African passive margin is thegravitational spreading of post-rift sediments above ade¤ collement layer made up of evaporites (e.g. Duval et al.,1992; Lundin, 1992; Liro & Coen, 1995; Spathopoulos,1996). In the studied area, gravity-driven tectonics in-itiated during the deposition of post-evaporite sediments(middle Cretaceous) and persisted throughout the Ceno-zoic. This created two structural domains, each about100 km wide (in the dip direction): an upper extensionaldomain and its compressive toe located downslope (Fig.1). The extensional domain is locally associated with amassive amount of thin-skinned extension (over 400%)of the overburden, creating rafts of allochthonousfault blocks that are no longer in contact (e.g. Burollet,1975; Duval et al., 1992). The studied area correspondsto a growth fault/raft system, measuring approximately20� 20 km, located within the extensional domain(Fig.1).
Stratigraphy
The focus here is the Albo-Cenomanian history (middleCretaceous) of the structure because most of the displace-ment on the faults, in the study area, is complete by theend of the Cenomanian (Fig. 2). Lower Albian sedimentsare represented by a shallow water carbonate platformprograding onto the Aptian evaporites. During the UpperAlbian, this platform was episodically covered by outer-shelf shale facies and prelittoral silts. During the Cenoma-nian, the system was dominated by open marine detritalsedimentation (Vernet et al., 1996). The chronostrati-graphic framework is based on biostratigraphic data(palynology calibrated with ammonites; Jardine¤ et al.,1974;Morgan, 1978; Doyle et al., 1982; Aurisano, 1992).
r 2003 Blackwell Publishing Ltd,Basin Research, 15, 183^200184
D. Rouby et al.
3-structural setting
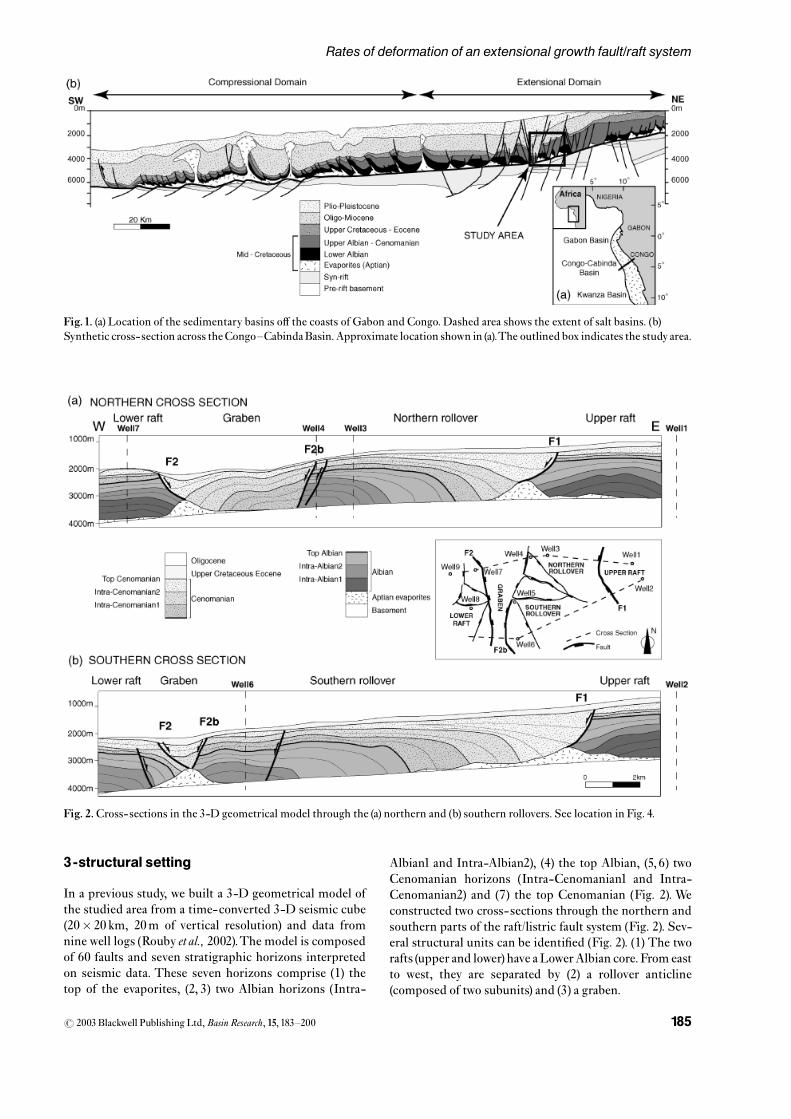
In a previous study, we built a 3-D geometrical model ofthe studied area from a time-converted 3-D seismic cube(20� 20 km, 20m of vertical resolution) and data fromnine well logs (Rouby et al., 2002).The model is composedof 60 faults and seven stratigraphic horizons interpretedon seismic data. These seven horizons comprise (1) thetop of the evaporites, (2, 3) two Albian horizons (Intra-
Albian1 and Intra-Albian2), (4) the top Albian, (5, 6) twoCenomanian horizons (Intra-Cenomanian1 and Intra-Cenomanian2) and (7) the top Cenomanian (Fig. 2). Weconstructed two cross-sections through the northern andsouthern parts of the raft/listric fault system (Fig. 2). Sev-eral structural units can be identi¢ed (Fig. 2). (1) The tworafts (upper and lower) have aLowerAlbian core. From eastto west, they are separated by (2) a rollover anticline(composed of two subunits) and (3) a graben.
Fig.1. (a) Location of the sedimentary basins o¡ the coasts of Gabon and Congo. Dashed area shows the extent of salt basins. (b)Synthetic cross-section across theCongo^CabindaBasin.Approximate location shown in (a).The outlined box indicates the study area.
Fig. 2.Cross-sections in the 3-D geometrical model through the (a) northern and (b) southern rollovers. See location in Fig. 4.
r 2003 Blackwell Publishing Ltd,Basin Research, 15, 183^200 185
Rates of deformation of an extensional growth fault/raft system
(1) The upper raft is bounded to the west by the main lis-tric fault F1, dipping seaward, while the lower raft isbounded to the east by the listric fault F2, dippinglandward (Fig. 2).
(2) The rollover anticline involves Upper Albian andCenomanian sediments and is bounded by F1 andF2b (antithetic with respect to F2). In map view, it iscomposed of two sub-units: the northern and south-ern rollovers separated by a transverse graben. Thistransverse graben is perpendicular to the main faults,that is, parallel to the expected principal direction ofdisplacement. It results from anN^S extensional com-ponent probably related to a divergence in displace-ment direction between the northern and southernrollover units.
(3) The graben involves Cenomanian sediments. It isbounded by a fault relay with a landward-dippingfault F2 to the NW, and a seaward-dipping fault F2bto the SE.
Note that the wells are located in current structural highs:the upper raft (two wells), the lower raft (three wells), thenorthern rollover (two wells) and the southern rollover(two wells). None is located in Cenomanian depocentres(Fig. 2).
MEASUREMENTOF VERTICALDISPLACEMENTS
First, we quanti¢ed vertical displacements by measuringaccommodation variations at well locations. To do so, werequire: (i) high-resolution time lines de¢ned across thebasin, and referred to absolute ages, (ii) lithological andporosity data and (iii) estimations of paleobathymetry(Robin et al.,1996).
Depositional environments
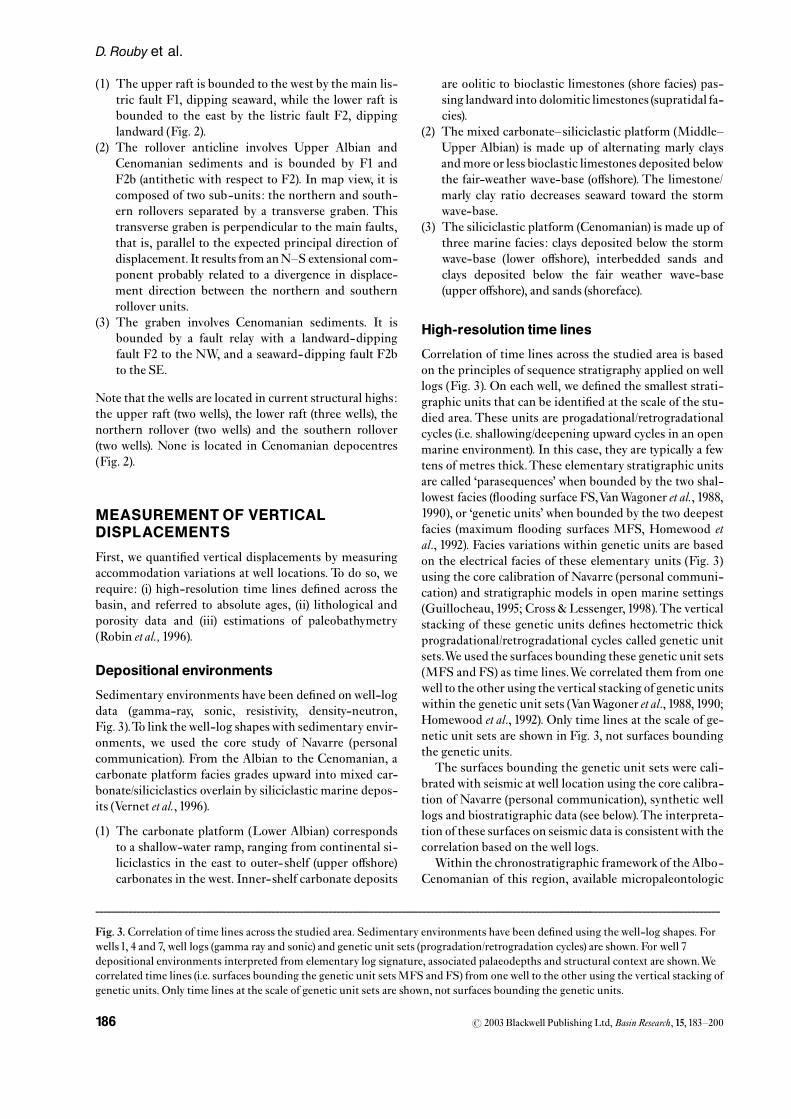
Sedimentary environments have been de¢ned onwell-logdata (gamma-ray, sonic, resistivity, density-neutron,Fig. 3).To link the well-log shapeswith sedimentary envir-onments, we used the core study of Navarre (personalcommunication). From the Albian to the Cenomanian, acarbonate platform facies grades upward into mixed car-bonate/siliciclastics overlain by siliciclastic marine depos-its (Vernet et al., 1996).
(1) The carbonate platform (Lower Albian) correspondsto a shallow-water ramp, ranging from continental si-liciclastics in the east to outer-shelf (upper o¡shore)carbonates in the west. Inner-shelf carbonate deposits
are oolitic to bioclastic limestones (shore facies) pas-sing landward into dolomitic limestones (supratidal fa-cies).
(2) The mixed carbonate^siliciclastic platform (Middle^Upper Albian) is made up of alternating marly claysandmore or less bioclastic limestones deposited belowthe fair-weather wave-base (o¡shore). The limestone/marly clay ratio decreases seaward toward the stormwave-base.
(3) The siliciclastic platform (Cenomanian) is made up ofthree marine facies: clays deposited below the stormwave-base (lower o¡shore), interbedded sands andclays deposited below the fair weather wave-base(upper o¡shore), and sands (shoreface).
High-resolution time lines
Correlation of time lines across the studied area is basedon the principles of sequence stratigraphy applied on welllogs (Fig. 3). On each well, we de¢ned the smallest strati-graphic units that can be identi¢ed at the scale of the stu-died area. These units are progadational/retrogradationalcycles (i.e. shallowing/deepening upward cycles in an openmarine environment). In this case, they are typically a fewtens of metres thick.These elementary stratigraphic unitsare called ‘parasequences’ when bounded by the two shal-lowest facies (£ooding surface FS,VanWagoner et al., 1988,1990), or ‘genetic units’ when bounded by the two deepestfacies (maximum £ooding surfaces MFS, Homewood etal., 1992). Facies variations within genetic units are basedon the electrical facies of these elementary units (Fig. 3)using the core calibration of Navarre (personal communi-cation) and stratigraphic models in open marine settings(Guillocheau, 1995; Cross & Lessenger, 1998).The verticalstacking of these genetic units de¢nes hectometric thickprogradational/retrogradational cycles called genetic unitsets.We used the surfaces bounding these genetic unit sets(MFS and FS) as time lines.We correlated them from onewell to the other using the vertical stacking of genetic unitswithin the genetic unit sets (VanWagoner et al., 1988, 1990;Homewood et al., 1992). Only time lines at the scale of ge-netic unit sets are shown in Fig. 3, not surfaces boundingthe genetic units.
The surfaces bounding the genetic unit sets were cali-bratedwith seismic at well location using the core calibra-tion of Navarre (personal communication), synthetic welllogs and biostratigraphic data (see below).The interpreta-tion of these surfaces on seismic data is consistentwith thecorrelation based on the well logs.
Within the chronostratigraphic framework of the Albo-Cenomanian of this region, available micropaleontologic
Fig. 3.Correlation of time lines across the studied area. Sedimentary environments have been de¢ned using the well-log shapes. Forwells1, 4 and 7, well logs (gamma ray and sonic) and genetic unit sets (progradation/retrogradation cycles) are shown. For well 7depositional environments interpreted from elementary log signature, associated palaeodepths and structural context are shown.Wecorrelated time lines (i.e. surfaces bounding the genetic unit setsMFS and FS) from one well to the other using the vertical stacking ofgenetic units. Only time lines at the scale of genetic unit sets are shown, not surfaces bounding the genetic units.
----------------------------------------------------------------------------------------------------------------------------------------------------------
r 2003 Blackwell Publishing Ltd,Basin Research, 15, 183^200186
D. Rouby et al.
r 2003 Blackwell Publishing Ltd,Basin Research, 15, 183^200 187
Rates of deformation of an extensional growth fault/raft system
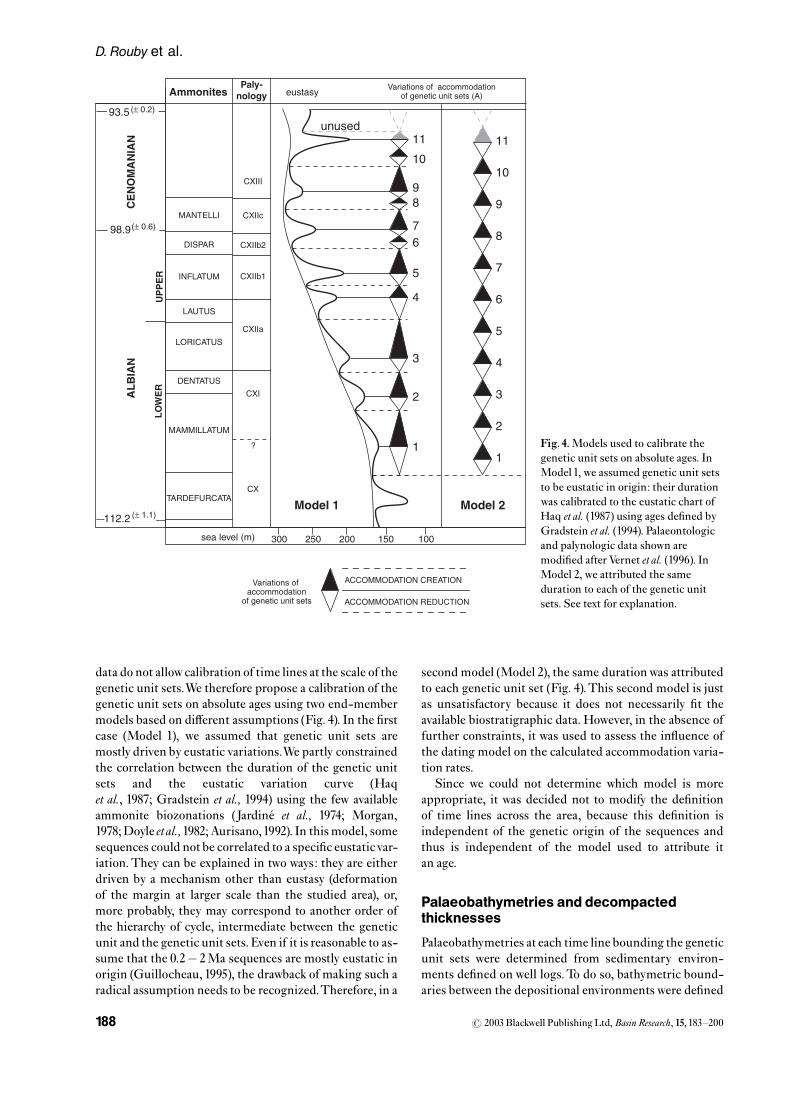
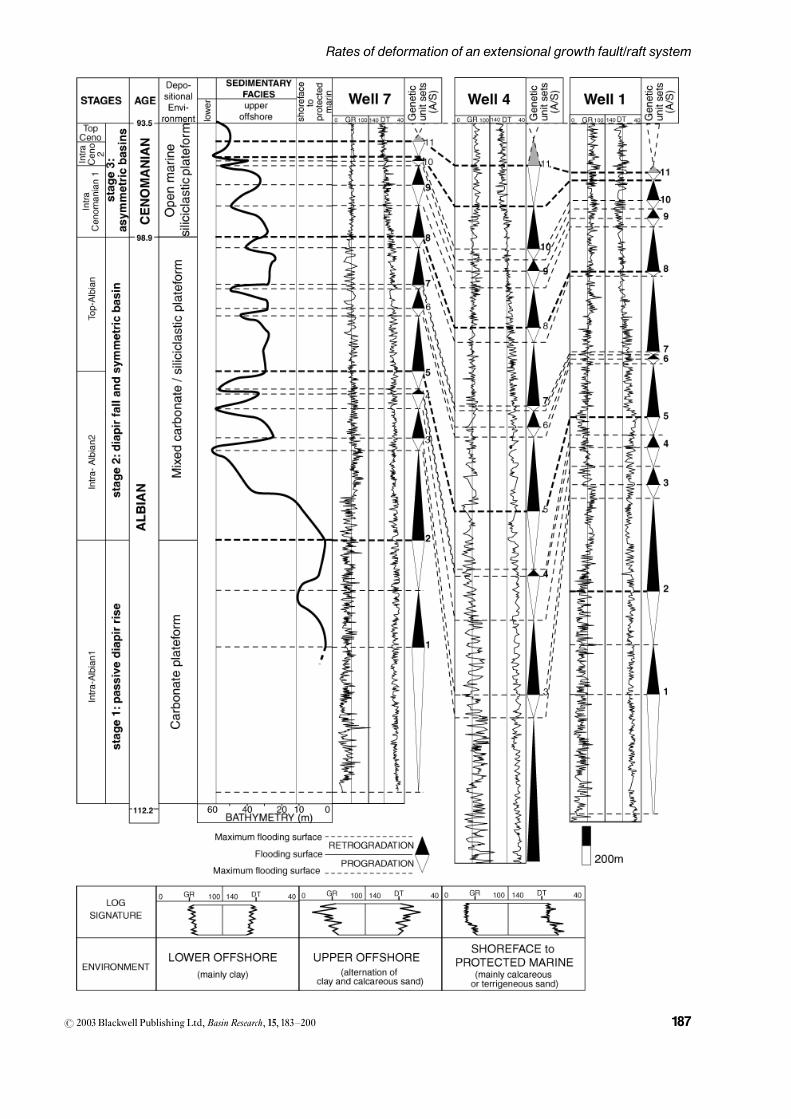
data do not allow calibration of time lines at the scale of thegenetic unit sets.We therefore propose a calibration of thegenetic unit sets on absolute ages using two end-membermodels based on di¡erent assumptions (Fig. 4). In the ¢rstcase (Model 1), we assumed that genetic unit sets aremostly driven by eustatic variations.We partly constrainedthe correlation between the duration of the genetic unitsets and the eustatic variation curve (Haqet al., 1987; Gradstein et al., 1994) using the few availableammonite biozonations (Jardine¤ et al., 1974; Morgan,1978;Doyle etal.,1982;Aurisano,1992). In this model, somesequences could not be correlated to a speci¢c eustaticvar-iation.They can be explained in two ways: they are eitherdriven by a mechanism other than eustasy (deformationof the margin at larger scale than the studied area), or,more probably, they may correspond to another order ofthe hierarchy of cycle, intermediate between the geneticunit and the genetic unit sets. Even if it is reasonable to as-sume that the 0.2� 2Ma sequences are mostly eustatic inorigin (Guillocheau, 1995), the drawback of making such aradical assumption needs to be recognized.Therefore, in a
second model (Model 2), the same durationwas attributedto each genetic unit set (Fig. 4).This second model is justas unsatisfactory because it does not necessarily ¢t theavailable biostratigraphic data. However, in the absence offurther constraints, it was used to assess the in£uence ofthe dating model on the calculated accommodation varia-tion rates.
Since we could not determine which model is moreappropriate, it was decided not to modify the de¢nitionof time lines across the area, because this de¢nition isindependent of the genetic origin of the sequences andthus is independent of the model used to attribute itan age.
Palaeobathymetries and decompactedthicknesses
Palaeobathymetries at each time line bounding the geneticunit sets were determined from sedimentary environ-ments de¢ned on well logs.To do so, bathymetric bound-aries between the depositional environments were de¢ned
1
2
3
4
5
6
7
8
9
10
11
1
2
3
4
5
67
89
10
11
Model 1 Model 2
unused
ACCOMMODATION CREATION
ACCOMMODATION REDUCTION
100150200250300
LO
WE
RU
PP
ER
CE
NO
MA
NIA
NA
LB
IAN
112.2
98.9
93.5 (± 0.2)
(± 0.6)
sea level (m)
eustasy
MANTELLI
CXIII
CXIIc
CXIIb2
CXIIb1
CXIIa
CXI
CX
DISPAR
INFLATUM
LAUTUS
LORICATUS
DENTATUS
MAMMILLATUM
TARDEFURCATA
?
AmmonitesPaly-
nology
Variations of accommodation
of genetic unit sets
Variations of accommodationof genetic unit sets (A)
(± 1.1)
Fig.4.Models used to calibrate thegenetic unit sets on absolute ages. InModel 1, we assumed genetic unit setsto be eustatic in origin: their durationwas calibrated to the eustatic chart ofHaq et al. (1987) using ages de¢ned byGradstein et al. (1994). Palaeontologicand palynologic data shown aremodi¢ed after Vernet et al. (1996). InModel 2, we attributed the sameduration to each of the genetic unitsets. See text for explanation.
r 2003 Blackwell Publishing Ltd,Basin Research, 15, 183^200188
D. Rouby et al.
at �10m (75m) for the fair-weather wave-base (bound-ary between the shoreface and the upper o¡shore), and� 60m (720m) for the storm wave-base (boundarybetween the upper and lower o¡shore).Within the uppero¡shore environment, bathymetric gradients were deter-mined from the sand^limestone/clay^marl ratio identi¢edon well logs. The error intervals de¢ned for bathymetricboundaries were intended to provide an evaluation of thevariability of the results depending upon the chosen de-positional pro¢le. The thickness of sediments measuredon the well logs and cores was corrected for (i) the dip ofthe strata and (ii) the compaction according to the lawsestablished by Sclater & Christie (1980).
Accommodation
Variations of accommodation
Variation of accommodation for a given time step and lo-cation was measured by summing the decompacted thick-ness of sediments and the variation of palaeobathymetry(Jervey, 1988). Positive accommodation values representaccommodation creation during the given time step,whereas negative values represent accommodation reduc-tion. Time steps corresponding to half cycles of geneticunit sets were used, that is, ranging from 0.2 to 2Ma inModel1 (Fig. 5a) or steps of 0.76Ma inModel 2. In the fol-lowing, for clarity, we refer to Model 1 unless otherwisespeci¢ed.
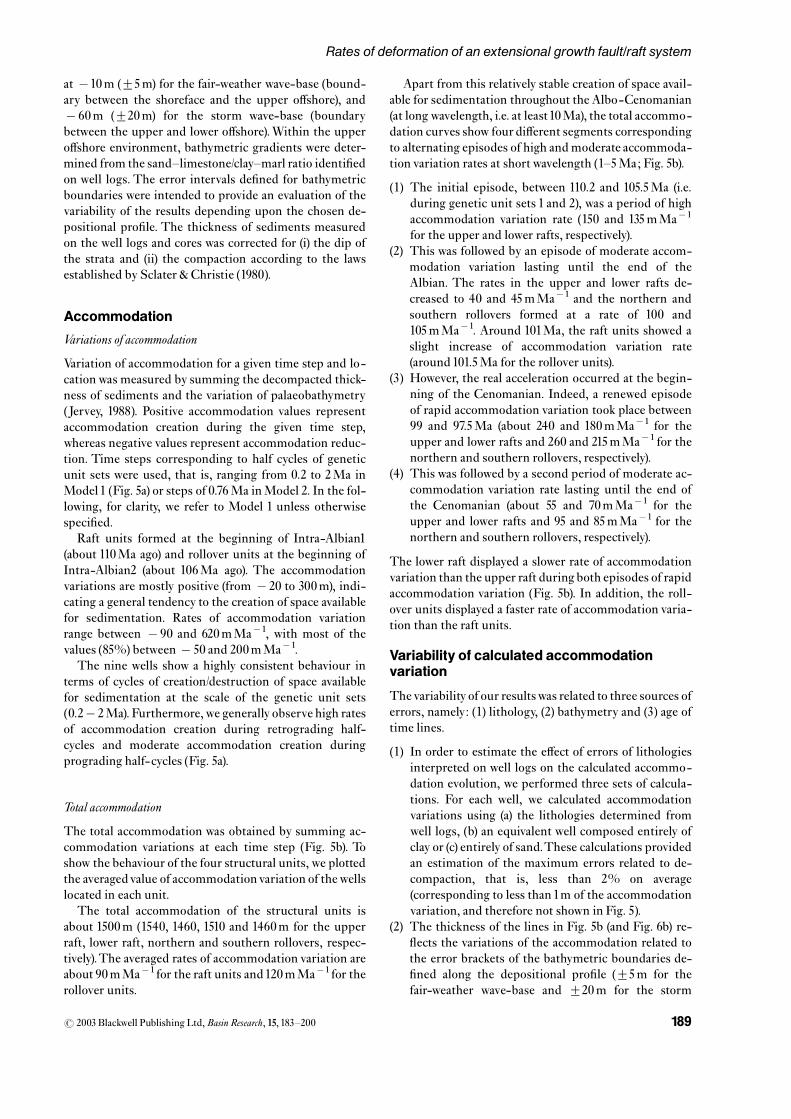
Raft units formed at the beginning of Intra-Albian1(about 110Ma ago) and rollover units at the beginning ofIntra-Albian2 (about 106Ma ago). The accommodationvariations are mostly positive (from � 20 to 300m), indi-cating a general tendency to the creation of space availablefor sedimentation. Rates of accommodation variationrange between � 90 and 620mMa�1, with most of thevalues (85%) between � 50 and 200mMa�1.
The nine wells show a highly consistent behaviour interms of cycles of creation/destruction of space availablefor sedimentation at the scale of the genetic unit sets(0.2� 2Ma). Furthermore,we generally observe high ratesof accommodation creation during retrograding half-cycles and moderate accommodation creation duringprograding half-cycles (Fig. 5a).
Total accommodation
The total accommodation was obtained by summing ac-commodation variations at each time step (Fig. 5b). Toshow the behaviour of the four structural units, we plottedthe averagedvalue of accommodationvariation of thewellslocated in each unit.
The total accommodation of the structural units isabout 1500m (1540, 1460, 1510 and 1460m for the upperraft, lower raft, northern and southern rollovers, respec-tively).The averaged rates of accommodation variation areabout 90mMa�1 for the raft units and120mMa�1 for therollover units.
Apart from this relatively stable creation of space avail-able for sedimentation throughout the Albo-Cenomanian(at long wavelength, i.e. at least10Ma), the total accommo-dation curves show four di¡erent segments correspondingto alternating episodes of high andmoderate accommoda-tion variation rates at short wavelength (1^5Ma; Fig. 5b).
(1) The initial episode, between 110.2 and 105.5Ma (i.e.during genetic unit sets 1 and 2), was a period of highaccommodation variation rate (150 and 135mMa�1
for the upper and lower rafts, respectively).(2) This was followed by an episode of moderate accom-
modation variation lasting until the end of theAlbian. The rates in the upper and lower rafts de-creased to 40 and 45mMa�1 and the northern andsouthern rollovers formed at a rate of 100 and105mMa�1. Around 101Ma, the raft units showed aslight increase of accommodation variation rate(around101.5Ma for the rollover units).
(3) However, the real acceleration occurred at the begin-ning of the Cenomanian. Indeed, a renewed episodeof rapid accommodation variation took place between99 and 97.5Ma (about 240 and 180mMa�1 for theupper and lower rafts and 260 and 215mMa�1 for thenorthern and southern rollovers, respectively).
(4) This was followed by a second period of moderate ac-commodation variation rate lasting until the end ofthe Cenomanian (about 55 and 70mMa�1 for theupper and lower rafts and 95 and 85mMa�1 for thenorthern and southern rollovers, respectively).
The lower raft displayed a slower rate of accommodationvariation than the upper raft during both episodes of rapidaccommodation variation (Fig. 5b). In addition, the roll-over units displayed a faster rate of accommodation varia-tion than the raft units.
Variability of calculated accommodationvariation
The variability of our resultswas related to three sources oferrors, namely: (1) lithology, (2) bathymetry and (3) age oftime lines.
(1) In order to estimate the e¡ect of errors of lithologiesinterpreted on well logs on the calculated accommo-dation evolution, we performed three sets of calcula-tions. For each well, we calculated accommodationvariations using (a) the lithologies determined fromwell logs, (b) an equivalent well composed entirely ofclay or (c) entirely of sand.These calculations providedan estimation of the maximum errors related to de-compaction, that is, less than 2% on average(corresponding to less than1m of the accommodationvariation, and therefore not shown in Fig. 5).
(2) The thickness of the lines in Fig. 5b (and Fig. 6b) re-£ects the variations of the accommodation related tothe error brackets of the bathymetric boundaries de-¢ned along the depositional pro¢le (75m for thefair-weather wave-base and 720m for the storm
r 2003 Blackwell Publishing Ltd,Basin Research, 15, 183^200 189
Rates of deformation of an extensional growth fault/raft system
wave-base). Variations in the results related to theassumed slope of the depositional pro¢le are 20%on average (about 13m of the accommodation varia-tion). However, if the direction of slope of the deposi-
tional pro¢le is preserved, the direction of theaccommodation gradient will also be preservedbetween given locations. Thus, even if errors onthe slope of the depositional pro¢le may produce
Fig. 5. (a)Variations of accommodation for the ninewells (see location inFig. 2). (b)Accommodation for the main structural units.Meanvalues of the wells locatedwithin the upper raft (wells1and 2) are shown in grey, in black for the lower raft (wells 7^9), in dashed light anddark grey for the northern rollover (wells 3 and 4) and in dashed black and grey for the southern rollover (wells 5 and 6). In both cases,values are computed for time steps corresponding to half-cycles of the genetic unit sets in bothModels 1 and 2. For clarity, we plottedusing the absolute ages of the genetic unit sets de¢ned inModel1.The thickness of the lines in (b) show the variability of the results dueto error bars on bathymetric boundaries: � 10m (75m) for the fair-weather wave-base and � 60m (720m) for the stormwave-base.Shaded areas indicate periods of highly variable accommodation rates (see text for explanation).
r 2003 Blackwell Publishing Ltd,Basin Research, 15, 183^200190
D. Rouby et al.
signi¢cant uncertainties in the absolute values of ac-commodationvariation, the relative variations are pre-served from one well to another (Robin, 1997).
(3) To evaluate the in£uence of the age model on the cal-culated accommodation variation rates, we comparedthe results obtained with Models 1 and 2(Fig. 4). The rates of accommodation variation areglobally lower for Model 2.They range between � 30and 470mMa�1, with most of the values (85%) be-tween � 30 and 200mMa�1 (Model 1: between � 90and 620mMa�1, with most of the values between� 50 and 200mMa�1). The averaged di¡erence be-tween the two models is760m/Ma, with 65% of thevalues in the725mMa�1 range. As expected, the lar-ger discrepancies occur for steps showing larger di¡er-ences in duration between the two models (i.e. duringIntra-Albian1and Intra-Albian2).
The in£uence of these various sources of errors is to alterthe absolute values of displacement magnitude and ratecalculated (in a di¡erent proportion, 2% for errors onlithology, 20% for errors on bathymetries and over 25%for errors on age of genetic unit sets).However, these errorsdo not alter the general tendencies and the relative beha-viour of the di¡erent well locations or structural units.
Subsidence
Variations in accommodation result from both absolutesea-level changes and vertical displacements related todeformation (subsidence). We used two di¡erent ap-proaches to extract the sea-level component to evaluatethe subsidence.
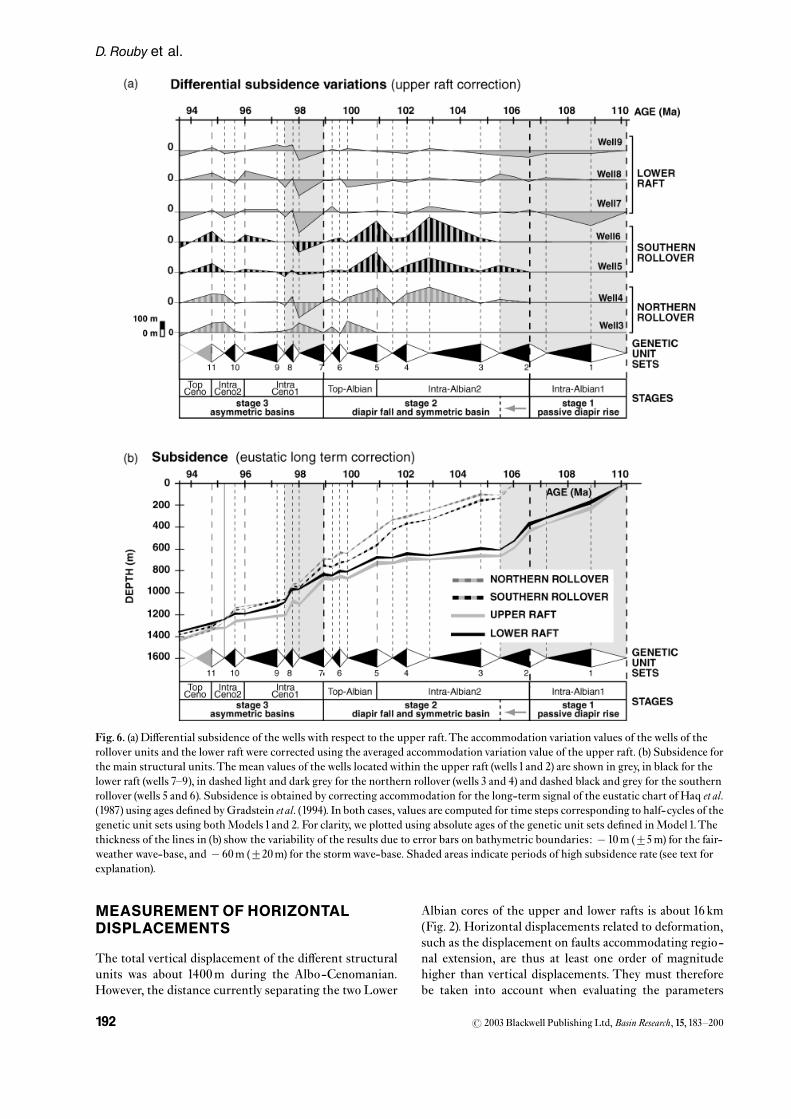
Di¡erential subsidence (upper raft correction)
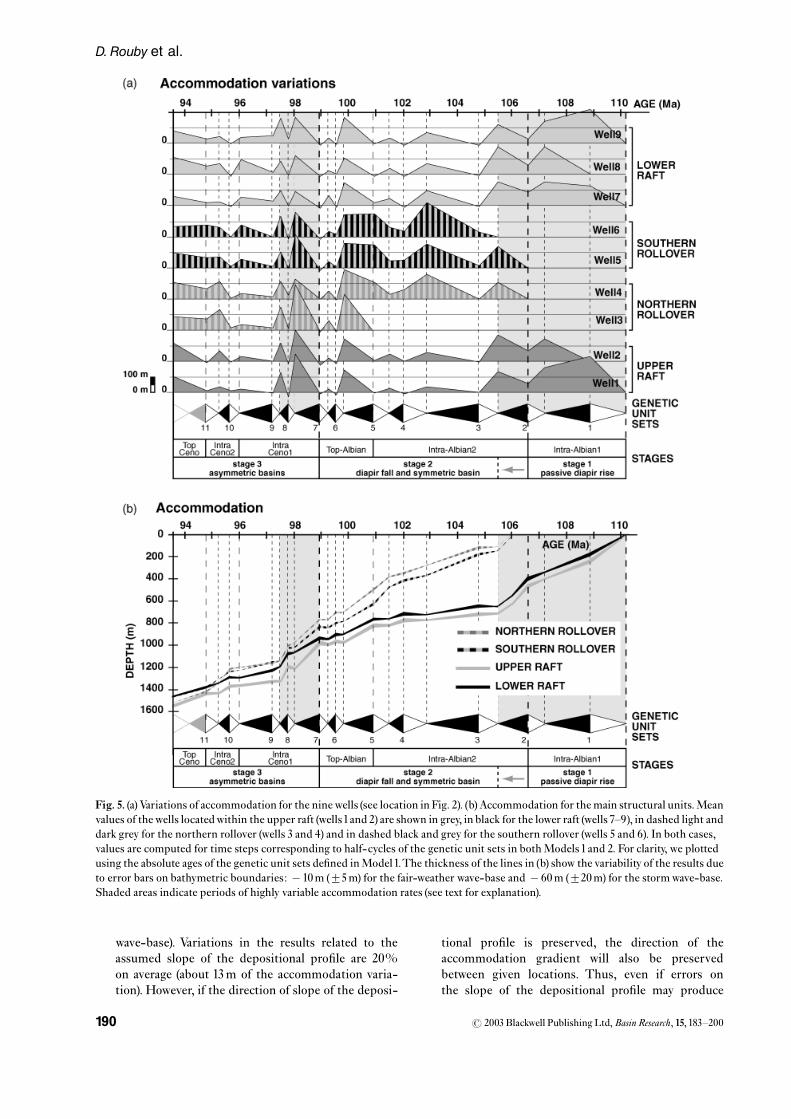
We ¢rst corrected the accommodation variations of therollover units and the lower raft from the averaged valuefrom the wells in the upper raft. Since absolute sea-levelvariations are a common signal in all wells, we obtainedthe di¡erential subsidence of the structural units with re-spect to the upper raft (Fig. 6a). Note that a negative subsi-dence represents a di¡erential uplift of the given unit withrespect to the upper raft, that is to say, a period duringwhich the upper raft is showing a larger subsidence rate.It should be pointed out that even if they are driven bydeformation in general and displacement on the faults inparticular, these rates of di¡erential subsidence representvertical displacements of the structural units and not dis-placement rates on the individual faults.
Throughout the Albo-Cenomanian, the structuralunits undergo alternating periods of high and moderate(or negative) di¡erential subsidence at high frequency(0.2^2Ma). In addition, the structural units display vary-ing types of behaviour with respect to the upper raft dur-ing the periods of short-wavelength variation (1^5Ma).
(1) During the ¢rst period of rapid accommodation varia-tion (and, in fact, throughout the Albian), the low
values of di¡erential subsidence for the lower raft withrespect to the upper raft indicate a closely similar be-haviour in both rafts.
(2) During the following period of moderate accommoda-tion variation rate (Intra-Albian2 and Top Albian), therollover units show a higher subsidence than the raftunits (i.e. a negative di¡erential subsidence).
(3) During the second period of rapid accommodation(i.e. during the ¢rst three increments of Intra-Ceno-manian1), both the rollover units and the lower raftshow lower subsidence than the upper raft (except forwell 3).
(4) During the following period of moderate accommoda-tion rate (i.e. until the end of the Cenomanian), thelower raft displays alternating periods of higher andlower subsidence rate compared with the upper raft,while the rollover units show slightly faster subsidencethan the raft unit.
Total subsidence (eustatic long-term correction)
ForModel1only, the subsidence of the structural units wasalso estimated by correcting the accommodation varia-tions from long-term variations in the eustatic signal(Fig. 6b). In contrast to the previous correction, this ap-proach provided absolute values of subsidence variation.However, it requires the assumption that the genetic unitsets are mostly eustatic in origin and, moreover, an accu-rate knowledge of absolute sea-level variations in the area.If the eustatic chart of Haq et al. (1987) for the Cretaceousin the southern Atlantic is fairly well accepted for the tim-ing of sea-level changes, the amplitudes of the variationsare less well constrained (Hallam, 1992). In the absence offurther constraints, we used the eustatic chart of Haq et al.(1987).
The subsidence variations are very similar to accom-modation variations, but with lower amplitudes. For long-term variations (at least 10Ma), the total subsidence of thestructural units is around 1400m (1430, 1350, 1430 and1380m for the upper raft, lower raft, northern and south-ern rollovers, respectively). The rates of subsidence rangebetween �120 and 620mMa�1, with most of the values(85%) between � 50 and 200mMa�1.This leads to aver-age displacement rates of about 80 and 110mMa�1 forthe raft and rollover units, respectively. This average rateof 80mMa�1 is consistent with the estimation of Spatho-poulos (1996) for areas farther south in the Congo Basin,which yield values ranging between 70 and 95 mMa�1 forthe same period.
The total subsidence curves also show alternatingperiods of high and moderate subsidence rates atshort wavelength (1^5Ma), contemporaneous withthose observed on the total accommodation variationsignal (see above). During the Albian, however, subsidencerates are about 10mMa�1 lower than the accommodationvariation rates. On the other hand, during the Cenoma-nian, they are similar to the accommodation variationrates.
r 2003 Blackwell Publishing Ltd,Basin Research, 15, 183^200 191
Rates of deformation of an extensional growth fault/raft system
MEASUREMENTOF HORIZONTALDISPLACEMENTS
The total vertical displacement of the di¡erent structuralunits was about 1400m during the Albo-Cenomanian.However, the distance currently separating the two Lower
Albian cores of the upper and lower rafts is about 16 km(Fig. 2). Horizontal displacements related to deformation,such as the displacement on faults accommodating regio-nal extension, are thus at least one order of magnitudehigher than vertical displacements. They must thereforebe taken into account when evaluating the parameters
Fig. 6. (a) Di¡erential subsidence of the wells with respect to the upper raft.The accommodation variation values of the wells of therollover units and the lower raft were corrected using the averaged accommodation variation value of the upper raft. (b) Subsidence forthe main structural units.The mean values of the wells locatedwithin the upper raft (wells 1 and 2) are shown in grey, in black for thelower raft (wells 7^9), in dashed light and dark grey for the northern rollover (wells 3 and 4) and dashed black and grey for the southernrollover (wells 5 and 6). Subsidence is obtained by correcting accommodation for the long-term signal of the eustatic chart of Haq et al.(1987) using ages de¢ned byGradstein etal. (1994). In both cases, values are computed for time steps corresponding to half-cycles of thegenetic unit sets using bothModels 1 and 2. For clarity, we plotted using absolute ages of the genetic unit sets de¢ned inModel 1.Thethickness of the lines in (b) show the variability of the results due to error bars on bathymetric boundaries: � 10m (75m) for the fair-weather wave-base, and � 60m (720m) for the stormwave-base. Shaded areas indicate periods of high subsidence rate (see text forexplanation).
r 2003 Blackwell Publishing Ltd,Basin Research, 15, 183^200192
D. Rouby et al.
controlling the variations in space available for sedimenta-tion within this raft/growth fault system. To reconstructthe 3-D geometry of the fault system through time andevaluate the horizontal component of displacement asso-ciated with gravity-driven extension, we restored six stra-tigraphic horizons of the 3-D geometrical model.
3-D restoration of the geometricalmodel andreconstructed isopachmaps
A full description and discussion (1) of the restorationmethod (procedures, assumptions, boundary conditions,domains of applicability, etc.) can be found in Rouby et al.(1993a, b; 2000) and (2) of the restoration of this fault sys-tem in Rouby et al. (2002). Here we only brie£y summarizethe procedure. Our method does not restore the actualfault surfaces, but the stratigraphic horizons. Initial datawere made up of surfaces representing stratigraphic hori-zons that are o¡set by the faults.We restored each surfaceseparately: we ¢rst unfolded it and then inverted the dis-placement on the faults in map view.The upper raft, thatis, the footwall of F1, was used as the stable reference forthe restoration.The di¡erence between the deformed andrestored states gave, for each restored horizon, the 3-D¢nite displacement ¢eld associatedwith faults and folds.
Each horizon of the 3-D geometrical model is asso-ciated with an isopach map.We applied the displacement¢eld calculated for each horizon to the corresponding iso-pach map to retrieve its geometry in the restored state (thereconstructed isopach map, Fig. 7).These maps show the3-Dgeometry of the depocentres at the time of depositionof the restored horizon. In this manner, by restoring sixstratigraphic horizons and reconstructing six isopachmaps, we established the evolution of the geometry of thefault system at six incremental steps of its evolution.
Note that this reconstruction does not take into accountcompaction because we do not actually restore sedimen-tary layers but single horizons. Also, since horizons arerestored rather than fault surfaces, the faults shown onthe maps are interpreted, after reconstruction, from thegeometry of the depocentres. It was assumed that thick-ened areas indicated faults thatwere active during the timestep corresponding to the isopach interval.The dip of thefaults was determined from the asymmetry of the depo-centres.
Evolution of the growth fault/raft system
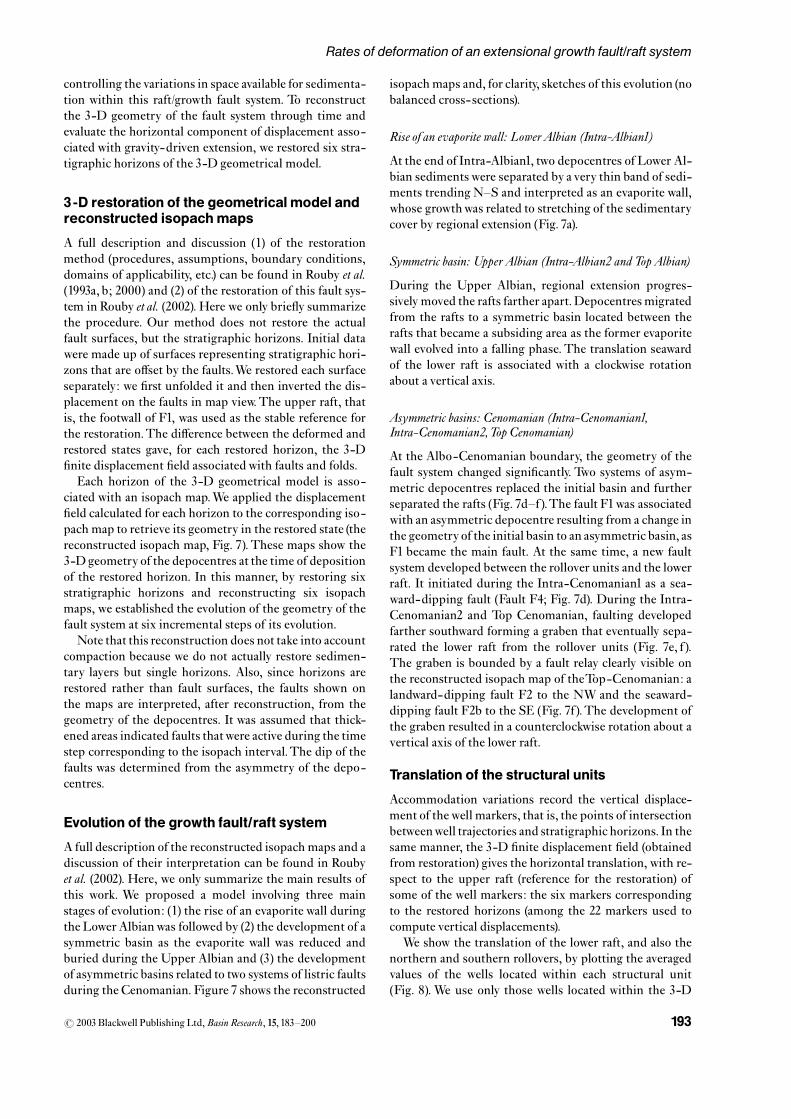
A full description of the reconstructed isopach maps and adiscussion of their interpretation can be found in Roubyet al. (2002). Here, we only summarize the main results ofthis work. We proposed a model involving three mainstages of evolution: (1) the rise of an evaporite wall duringthe Lower Albianwas followed by (2) the development of asymmetric basin as the evaporite wall was reduced andburied during the Upper Albian and (3) the developmentof asymmetric basins related to two systems of listric faultsduring the Cenomanian. Figure 7 shows the reconstructed
isopach maps and, for clarity, sketches of this evolution (nobalanced cross-sections).
Rise of an evaporite wall: Lower Albian (Intra-Albian1)
At the end of Intra-Albian1, two depocentres of Lower Al-bian sediments were separated by a very thin band of sedi-ments trending N^S and interpreted as an evaporite wall,whose growthwas related to stretching of the sedimentarycover by regional extension (Fig. 7a).
Symmetric basin: Upper Albian (Intra-Albian2 and Top Albian)
During the Upper Albian, regional extension progres-sively moved the rafts farther apart.Depocentres migratedfrom the rafts to a symmetric basin located between therafts that became a subsiding area as the former evaporitewall evolved into a falling phase. The translation seawardof the lower raft is associated with a clockwise rotationabout a vertical axis.
Asymmetric basins: Cenomanian (Intra-Cenomanian1,Intra-Cenomanian2,Top Cenomanian)
At the Albo-Cenomanian boundary, the geometry of thefault system changed signi¢cantly. Two systems of asym-metric depocentres replaced the initial basin and furtherseparated the rafts (Fig. 7d^f).The fault F1was associatedwith an asymmetric depocentre resulting from a change inthe geometry of the initial basin to an asymmetric basin, asF1 became the main fault. At the same time, a new faultsystem developed between the rollover units and the lowerraft. It initiated during the Intra-Cenomanian1 as a sea-ward-dipping fault (Fault F4; Fig. 7d). During the Intra-Cenomanian2 and Top Cenomanian, faulting developedfarther southward forming a graben that eventually sepa-rated the lower raft from the rollover units (Fig. 7e, f).The graben is bounded by a fault relay clearly visible onthe reconstructed isopach map of theTop-Cenomanian: alandward-dipping fault F2 to the NW and the seaward-dipping fault F2b to the SE (Fig. 7f).The development ofthe graben resulted in a counterclockwise rotation about avertical axis of the lower raft.
Translation of the structural units
Accommodation variations record the vertical displace-ment of the well markers, that is, the points of intersectionbetweenwell trajectories and stratigraphic horizons. In thesame manner, the 3-D ¢nite displacement ¢eld (obtainedfrom restoration) gives the horizontal translation, with re-spect to the upper raft (reference for the restoration) ofsome of the well markers: the six markers correspondingto the restored horizons (among the 22 markers used tocompute vertical displacements).
We show the translation of the lower raft, and also thenorthern and southern rollovers, by plotting the averagedvalues of the wells located within each structural unit(Fig. 8). We use only those wells located within the 3-D
r 2003 Blackwell Publishing Ltd,Basin Research, 15, 183^200 193
Rates of deformation of an extensional growth fault/raft system
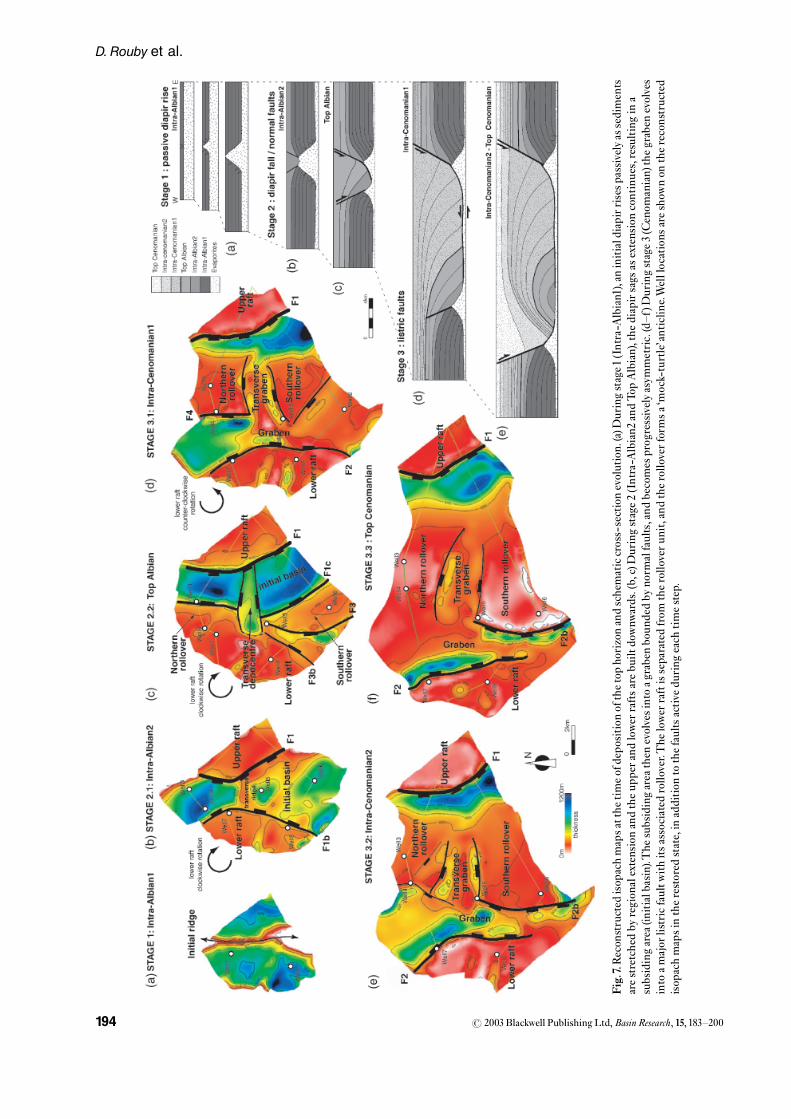
Fig.7.Recon
structed
isop
achmapsatthe
timeofdepo
sition
ofthetopho
rizonandschematiccross-sectionevolution.(a)D
uringstage1
(Intra-A
lbian1),an
initialdiapirrisespassivelyassediments
arestretchedby
region
alextensionandtheup
perand
lower
raftsarebu
iltdownw
ards.(b,c)Duringstage2(Intra-A
lbian2
andTo
pAlbian),the
diapirsags
asextensioncontinues,resultingin
asubsidingarea
(initialbasin).The
subsidingarea
then
evolvesintoagraben
boun
dedby
norm
alfaults,and
becomesprogressivelyasym
metric.(d^f)D
uringstage3(Cenom
anian)thegraben
evolves
into
amajor
listricfaultw
ithitsassociated
rollover.The
lower
raftisseparatedfrom
therolloverun
it,and
therolloverformsa‘mock-turtle’anticlin
e.Welllocations
areshow
non
thereconstructed
isop
achmapsin
therestored
state,in
addition
tothefaultsactiv
edu
ring
each
timestep.
r 2003 Blackwell Publishing Ltd,Basin Research, 15, 183^200194
D. Rouby et al.
geometrical model (i.e. wells 3 and 4 in the northern roll-over, wells 5 and 7 in the southern rollover and wells 7 and8 in the lower raft; Figs 2 and 7). It should be pointed outthat even if they are driven by displacement on the faults,these translation rates represent horizontal displacementsof the structural units and not displacement rates on theindividual faults. Also, since the oldest horizon to be re-stored corresponds to Intra-Albian1, we could not mea-sure translation rates between 110 and 106.5Ma. Thereference time for computing the translations is thereforethe end of Intra-Albian1 for the lower raft (105.5Ma; Fig.7a) and the end of Intra-Albian2 for the rollover units(101Ma; Fig. 7b). Figure 8 therefore does not suggest thatgravity-driven extension initiated after Intra-Albian1; onthe contrary, it probably started earlier during the LowerAlbian.
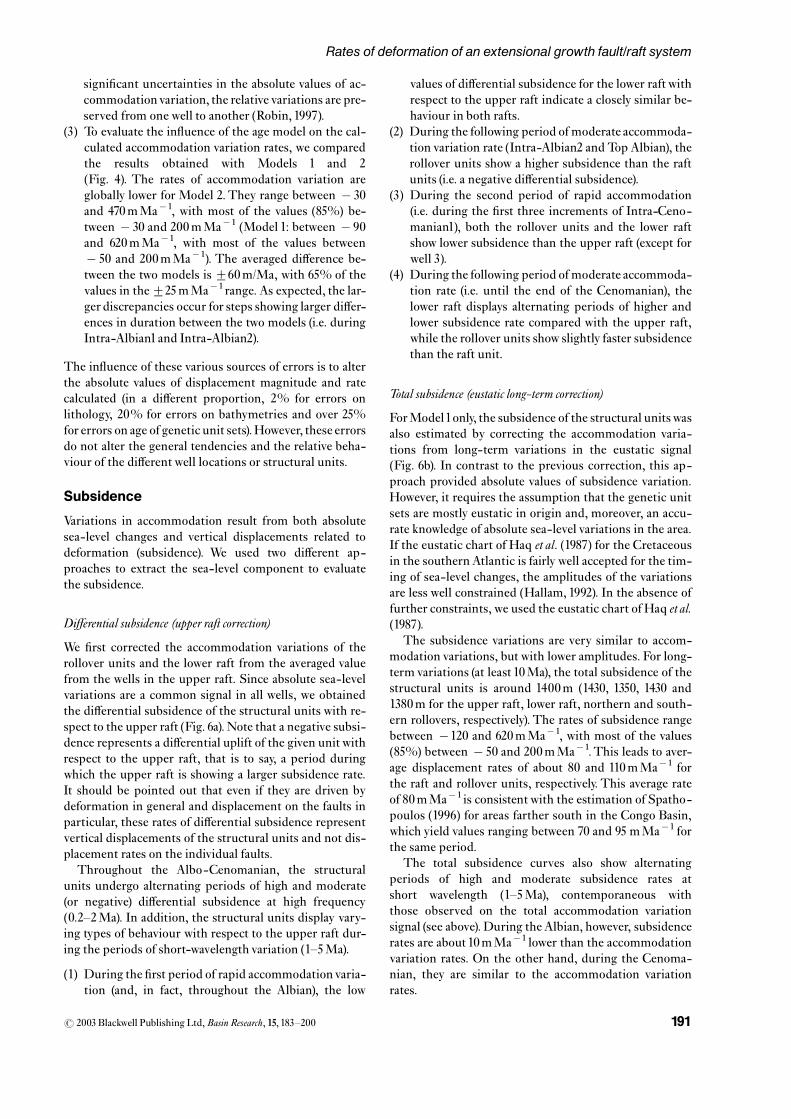
Translation rates range between 420 and 2220mMa�1
(Fig.8).During Intra-Albian2, the lower raft shows a mod-erate rate of translation (420mMa�1). During theTop Al-bian, the three structural units show a higher translationrate (990, 1500 and 1300mMa�1 for the northern andsouthern rollover and lower raft, respectively). During theCenomanian, the three units show a progressive increasein the translation rate (from 1020 to 2220mMa�1 for thelower raft, from 800 to1900mMa�1 for the southern roll-over and from 450 to 1100mMa�1 for the northern roll-over). The translation rate also increases from thenorthern and southern rollovers towards the lower raft.
Thus, throughout the Albo-Cenomanian, the southernrollover displays a higher translation rate than the north-ern rollover. In addition, the lower raft shows larger trans-
lation rates than the southern rollover, except during theTop Albian.
DISCUSSION
For the six well markers corresponding to the restoredhorizons, we can compare horizontal and vertical displa-cements measured at well locations by accommodationvariations and restoration.However, we should make somepreliminary remarks:
(i) Accommodationvariations correspond to absolute ver-tical displacement values whereas horizontal transla-tions are measured with respect to the upper raft (thestationary boundary for restoration).
(ii) As pointed out above, the reference time used to com-pute the translation is the end of the Intra-Albian1 forthe lower raft (end of Intra-Albian2 for the rolloverunits; Fig. 7b, c), whereas for vertical displacements itis the beginning of Intra-Albian1. Furthermore, trans-lation rates are minimum estimates since the upperraft was also translated seaward during the Albo-Cen-omanian.
(iii) Subsidence is measured over 22 time steps during theAlbo-Cenomanian, whereas translation is measuredover only six steps, giving a better temporal resolutionfor subsidence than translation.
(iv) 3-D restoration yields values for horizontal displace-ments across the whole studied area, whereas subsi-dence is measured only at well locations (i.e. at the
94 96 98 100 102 104 106 108 1100
2
4
6
8
10
12
14
DIS
PL
AC
EM
EN
T (
km)
Translation and subsidence
AGE (Ma)
1234567891011
LOWER RAFT
SOUTHERN ROLL-OVER
NORTHERN ROLL-OVER
SOUTHERN ROLL-OVER
NORTHERN ROLL-OVER
LOWER RAFT
SUBSIDENCE
TRANSLATION
420
1300
1500
990
1280
1900
1100
660450
1020
800
2040
2220
GENETICUNITSETS
STAGESIntra-Albian1Intra-Albian2Top-AlbianIntra
Ceno1Intra
Ceno2Top
Cenostage 1
passive diapir risestage 2
diapir fall and symmetric basinstage 3
asymmetric basins
Fig. 8.Horizontal and vertical displacements vs. time for the main structural units.Vertical displacements (solid lines) are absolutevalues, whereas horizontal displacements (dashed lines) are measured relative to the upper raft (the reference for the restoration).Themeanvalues of the wells locatedwithin the lower raft (wells 7 and 8) are shown in black, in light grey for the northern rollover (wells 3 and4) and in dark grey for the southern rollover (wells 5 and 6). Shaded areas indicate periods of high variability in accommodation andsubsidence rate (see text for explanation). Rates of translation are labelled in black (mMa�1).
r 2003 Blackwell Publishing Ltd,Basin Research, 15, 183^200 195
Rates of deformation of an extensional growth fault/raft system
location of current topographic highs, outside the de-pocentres of the Cenomanian; Fig. 2).
Interpretation of translation rateswithin thestructural framework
In a previous paper, we de¢ned the structural evolution ofthe fault system from 3-D restoration. Here, using a de-tailed stratigraphic framework, we are able to propose agesfor the restored horizons (using two end-member models)and, thus, to compute translation rates.We are now able todiscuss quantitatively these horizontal displacement rates(i.e. displacement of the structural units) within the pro-posed structural framework (i.e. displacement on faults;Figs 7 and 8).
During the Albian (stages 1 and 2), the seaward transla-tion of the raft was mostly related to the faults boundingthe initial basin (F1 and F1b, then F1 and F1c; Fig. 7b, c).The increasing translation rate of the raft (and the hightranslation rate of the rollover units) during theTopAlbian(up to1300mMa�1; Fig. 8) could therefore be related to anincrease in the rate of deformation accommodated bythese two faults.
During Intra-Cenomanian1, the graben initiated as theseaward-dipping fault F4, located between the northernrollover and the lower raft (Fig. 7d). At the same time, thetranslation rate of the raft decreased (Fig.8)with respect totheTopAlbian.This could be related to the fact that part ofthe displacement on F4 resulted in the counterclockwiserotation of the raft rather than in a seaward translation.However, the translation rate of the rollover units also de-creased at that time.Therefore, the rate of deformation ac-commodated by the faults bounding the initial basin alsodecreased as the basin became asymmetric.
On the contrary, during the Cenomanian, the transla-tion rate of the lower raft increased (from 1020 to2200mMa�1). The development of the graben thereforeallowed a two-fold increase in the rate of deformationaccommodated by the fault system (Figs 7e,f and 8). Thelower raft translated faster than the rollover units (Fig. 8)because its displacement resulted from not only F1 butalso the faults bounding the graben. By contrast, the trans-lation of the rollovers resulted only from F1 (Fig. 7). How-ever, the translation rate of the three units increasedduring the Cenomanian, indicating that the rate of defor-mation accommodated by F1also increased at that time.
Throughout the Albo-Cenomanian, the southern roll-over translated faster than the northern one (Fig. 8).Thisoccurred because the fault F1 accommodated a largeramount of displacement southward (as indicated by theclockwise rotation of the lower raft during the Upper Al-bian and the geometry of the associated depocentre whichwas narrowing northward during the Cenomanian; Fig. 7).
The relatively high rates of translation at the end of theCenomanian raise a question on the timing of the cessa-tion of deformation (Fig. 8). During the Albian^Cenoma-nian, we record only the phases of initiation and growth of
the fault system, as indicated by the progressive increase inthe rate of deformation (Mauduit &Brun,1998).This mustbe followed by a progressive decay of the deformation tozero. As pointed out above, most of the displacement onthe faults of the studied system occurred before the de-position of the Upper Cretaceous sediments since theupper tips are delimited by the discordance of the base ofthe Santonian (93.5Ma).This suggests that the rate of de-formation decreased from over 2000mMa�1 to almostzero over about 5Ma (using the ages de¢ned by Gradsteinet al., 1994). However, during this period we did not mea-sure displacement rates. Well and seismic data indicatethat a thin evaporite layer is preserved below the raft units(a few tens of metres thick) whereas no evaporites are pre-served below the rollover units and the graben directlyoverlying the basement (Fig. 2).The very rapid decay of de-formation could be attributed to the thinning of the eva-porite layer related to stretching of the sedimentary coverby regional extension. This increased the brittle/ductileratio (ratio of the thickness of post-evaporite sedimentsto evaporites) of the deformed sedimentary cover (e.g.Ven-deville,1987;Vendeville&Cobbold,1987;Mauduit&Brun,1998).Thus, the strength of the sedimentary cover was in-creased, and, in doing so, led to a decrease of deformationrate in the fault system.Below the rollovers and the graben,the extreme thinning of the evaporitic layer resulted in thecover coming into direct contact with the pre-salt succes-sion, blocking the displacement on the faults (e.g. Vende-ville, 1987; Vendeville & Jackson, 1992a,b; Mauduit &Brun,1998). In both cases, the accommodation of regionalextension (that continued throughout the Cenozoic in theCongo basin) must have been transferred to other faultsystems, located seaward or laterally (e.g.Vendeville, 1987;Mauduit & Brun, 1998).
Interpretation of vertical displacement rateswithin the structural framework
We are now quantitatively able to discuss vertical displace-ment rates of the structural units within the proposedstructural framework (Figs 6 and 7).Three time scales wereidenti¢ed in the rates of vertical displacement as seen inthe accommodation/subsidence signal (Figs 5 and 6):long-termvariations (at least10Ma), short-termvariations(1^5Ma) and high-frequency variations (0.2^2Ma).
Long-term variations (at least10Ma)
There was a constant creation of space available for sedi-mentation throughout the Albo-Cenomanian (Figs 5band 6b); since it is recorded in all wells, this correspondsto a signal originating at a larger scale than the studiedarea (larger than20 km).Assuming the studied fault systemformed between 10 and 30Ma after the end of the rifting(taking place during the Neocomian and Barremian), therate of subsidence of around80mMa�1is compatiblewitha general subsidence of the passive margin controlled by
r 2003 Blackwell Publishing Ltd,Basin Research, 15, 183^200196
D. Rouby et al.
the thermal regime of the thinned lithosphere as well asthe load of the sediment ¢lling (Allen & Allen, 1990).
Short-term variations (1^5Ma)
Variations of subsidence and accommodation at a shortwavelength (1^5Ma; Figs 5b and 6b) may tentatively beinterpreted within the structural framework de¢nedby restoration (Fig. 7).
(1) The ¢rst period of high accommodation variationand subsidence rate of the rafts (about 135mMa�1; Figs5b and 6b) is consistent with the ¢rst stage of evolution ofthe fault system: the growth of the raft units by down-building is coevalwith the passive rise of the evaporitewall(Fig.7a). Indeed,during stage1, the raft units trappedmostof the sediments preserved in the system (Fig. 7a).
The 3-D restoration (based only on six time steps) led usto de¢ne stage 1 as coeval with Intra-Albian1 (Rouby et al.,2002; Fig. 7). However, the vertical displacements of theraft units (established with 23 time steps) indicate that theinitial period of high subsidence rate of the raft units alsoinvolved the regressive half-cycle of genetic unit set 2,that is, the ¢rst increment of Intra-Albian2 (Fig. 6b). If weassume that this ¢rst period of high subsidence rate wasassociated with the initial phase of downbuilding of theraft units, we may extend the duration of the stage 1 up to105.5Ma (i.e. top of genetic unit set 2; Figs 5 and 6).
(2) During the following period of moderate subsidencerate of the raft units (about 30mMa�1until the end of theAlbian), the subsidence rate of the rollover units was high-er (about 90mMa�1; Fig. 6a). This is consistent with themigration of the depocentres from the rafts to the initialbasin as it became the main subsiding area (attributed tothe falling phase of the evaporite wall; Figs 10b, c and11d, e, Fig. 9). The rollover units therefore trapped mostof the sediments preserved in the system at that time,while less subsidence occurred on the raft units (Figs 6and 7b, c).
During theTop Albian, the four structural units show aslight increase in the subsidence rate (Fig. 6) coevalwith anincrease of the translation rate and of the displacementrate onF1 (Fig.8).This suggests that translation rate mightmodify the subsidence rate. Indeed, an increase in the rateof extension might increase the thinning of the sedimen-tary cover and the sliding of the structural units down-slope, and, in doing so, increase the subsidence rate of thestructural units.
(3, 4) Throughout the Cenomanian, regional extensionwas accommodated by two main fault systems (Fig. 7d^f).However, none of the wells were located within the depo-centres at that time. It is therefore di⁄cult to correlatedirectly the subsidence pattern with the displacement onthe faults active at that time.
The second period of high accommodation variationrates took place at the beginning of the Cenomanian(Fig. 5). Since it a¡ected all the structural units, its causehas to be found at a larger scale than the studied area (lar-ger than 20 km in wavelength). InModel 1, it is coeval with
the highest point of the eustatic variation curve (Fig. 4).Thus, part of the increase in accommodation variationcan be attributed to an absolute sea-level rise. However,even after correction of accommodation variations usingthe eustatic chart, this high displacement rate remainsvisible in the subsidence signal (Fig. 6b).Two hypotheses,not mutually exclusive, can be proposed to explain this:(i) The eustatic chart of Haq et al. (1987) underestimatesthe amplitude of the sea-level variations taking place atthat time. If so, part of the apparent subsidence can actu-ally be attributed to an absolute sea-level rise. (ii) Anotherpossibility (compatible with both Models 1 and 2) is thatthe increase in the subsidence rate resulted from an in-crease in the deformation rate, that is, an increase ofdisplacement rate on faults (as observed for the TopAlbian).We cannot, however, validate this hypothesis be-cause the time step we used to measure translation ratespans the period between 99 and 96Ma (i.e. the Intra-Cenomanian1). We cannot determine, during this timestep, whether the translation rate was constant or actuallyincreased and then decreased again in parallel with thesubsidence rate.
However, these hypotheses do not explain why the rateof subsidence at that time was higher for the upper raftthan for the other structural units (Fig.6).One possible ex-planation is that there may have been a topographic breakin the basement underlying the evaporite layer.This couldhave modi¢ed the vertical displacement of the upper raftas it underwent translation above it without a¡ecting theother units already located seaward. Such a topographicbreak has been seen on seismic data, upslope from the cur-rent location of the fault system, that is, at a location com-patible with the translation of the upper raft since the earlyCenomanian.
Whatever the interpretation(s), the development of thegraben during the Cenomanian does not appear to havemodi¢ed the vertical displacement of the well markers.This is because the wells were located outside the areassubsiding at that time.
High-frequency variations (0.2^2Ma)
For high-frequency variations of accommodation, two im-portant observations can be made: (1) The nine wells dis-play a highly consistent behaviour in terms of cycles ofcreation/removal of space available for sedimentation atthe scale of the genetic unit sets (0.2^2Ma; Fig. 5a).Genetic unit sets correspond to cycles in the ratio of ac-commodation variation versus sediment supply (cycles ofA/S ratio variation). (2) Generally, we observe high ratesof accommodation creation during retrogradationalhalf-cycles and moderate accommodation creation (or de-struction) during progradational half-cycles (Fig. 5a).Thisimplies that most of the progradation/retrogradationcycles were driven by accommodation variations (A) ratherthan sediment supply variations (S).
These two observations indicate that genetic unit setsare controlled by a process e¡ective at a larger scale than
r 2003 Blackwell Publishing Ltd,Basin Research, 15, 183^200 197
Rates of deformation of an extensional growth fault/raft system
the studied system (larger than 20 km in wavelength).Thisprocess can be either eustatic variations or deformation atmargin scale. The only deformation at margin scale pro-posed in the study area for this period is the thermal sub-sidence of a thinned lithosphere, which is not known forshowing rates varying at high frequency (0.2^2Ma).Therefore, in our case, among known mechanisms, thebest candidate would therefore be eustatic variations, sug-gesting a potential link between genetic unit sets and eu-static variations (dating Model 1). To further test thismodel, the sequence stratigraphic analysis should be ex-tended to other wells located along theWest African mar-gin, in order to quantify the common signal of sea-levelvariations at a more regional scale than can be achievedwith the present data set.
However, we should point out that even if the datingmodel may have an important impact on the calculatedrates of accommodation variation and subsidence, it doesnot a¡ect the averaged rates of displacements over theAlbo-Cenomanian. Neither does it in£uence the generaltrends in accommodation/subsidence or the relative beha-viour of the di¡erent units.
Control of space available for sedimentation
Accommodation variation measurements showed threetemporal scales of variation of vertical space available forsedimentation.The long-term variation (at least 10Ma) isabout 80mMa�1 for a total subsidence of about 1400m.The short-term variations correspond to alternatingperiods (1^5Ma) with rates of 30 and 150^250mMa�1.High-frequency variations mostly range between � 50and 250m for periods of 0.2^2Ma.
The 3-D restoration shows that rates of horizontal dis-placement resulting from the development of the faultsystem are 3^30 times higher than the subsidence rates(Fig. 8).Therefore, in terms of amplitude, the main para-meter controlling the space available for sedimentation isthe structural development of the fault system, that is tosay, the seaward translation of the structural units, itselfresulting from the regional gravity-driven extension(accommodated by faults becoming listric).
We are able to quantify variations of translation rates fortime steps between 2 and 6Ma (i.e. the time incrementsbetween restored stratigraphic horizons).We showed thatthese caused the variations of vertical space at short wave-length (1^5Ma), andwe suspect that variation of the trans-lation rate below our resolution could have causedvariations at higher frequencies (0.2^2Ma).
By de¢nition, the in£uence of the structural develop-ment of the fault system on the preservation of sedimentswas highly variable in time and space. Depocentres showcomplex geometries and migrated from the rafts to the in-itial graben and ¢nally towards the two systems of asym-metric depocentres (Fig. 7). Despite this variability, thecurrent thickness of the Albo-Cenomanian sedimentarycover is roughly constant across the studied area (Fig. 2).This indicates that, even if most of the space available for
sedimentation was created by major lateral translations ofthe structural units, the sediment £uxwas always large en-ough to ¢ll this space.
The in£uence of the development of the fault system onthe successive sedimentary environments requires furtherinvestigation. Nonetheless, it is interesting to comparevariations in accommodation and subsidence (Figs 5 and6) with the depositional environments (Fig. 4). The twoperiods of high accommodation rate (during the Intra-Al-bian1and at the beginning of theCenomanian) correspondto major changes in depositional environments: from acarbonate platform to amixed carbonate^siliciclastic plat-form at the end of the Lower Albian, and from a mixedcarbonate^siliciclastic platform to an open marinesiliciclastic platform at the beginning of the Cenomanian.
CONCLUSION
This study shows the power of an integrated approach inquantifying the kinematics of a fault system and the in£u-ence of its growth on variations of space available for sedi-mentation.
We used sequence stratigraphy to (1) de¢ne a detailedstratigraphic framework of the Albo-Cenomanian (weidenti¢ed 11 genetic unit sets using a stacking patterntechnique) and (2) measure subsidence rates (from accom-modation variation measurements). We then used 3-Drestoration to (3) reconstruct the evolution of the 3-Dgeometry of the fault system (the progressive separationof two rafts by regional extension, resulting in the develop-ment of a basin, located in between, that evolved in di¡er-ent stages) and, (4) measure the rates of horizontaldisplacement (ranging from 420mMa�1 to over2200mMa�1) and link their variations to the successivestages in the growth of the fault system.
These data allow us to quantify the parameters control-ling the space available for sedimentation at di¡erent spa-tial and temporal scales.The vertical space available variesat three temporal scales.
(i) The long-term variation (at least 10Ma) of about80mMa�1 for a total subsidence of about 1400m iscompatible with the general subsidence of a passivemargin related to the thermal regime of the thinnedlithosphere and the sedimentary ¢lling load.
(ii) The short-term variations (1^5Ma) correspond totwo periods of rapid subsidence (150^250m/Ma) al-ternating with periods of moderate subsidence rate(around 30mMa�1). We link these variations to thedevelopment of the fault system during the Albian(downbuilding of the raft and development of the in-itial basin). However, during the Cenomanian, the de-velopment of the graben does not seem to havea¡ected vertical displacements because well markersare located outside the subsiding areas.
(iii) High-frequency variations (at the scale of geneticunit sets) range between � 50 and 250m for periods
r 2003 Blackwell Publishing Ltd,Basin Research, 15, 183^200198
D. Rouby et al.
of 0.2^2Ma.These cycles of progradation/retrograda-tion were driven by accommodation variations ratherthan sediment £ux variations. The fact that all ninewells display a highly consistent pattern of accommo-dation variation suggests that the genetic unit setswere controlled at a larger scale than the studied sys-tem (larger than 20 km inwavelength), for example, byeustatic variations.
However, translation rates are between 3 and 30 timeshigher than subsidence rates. Therefore, in terms of am-plitude, the main parameter controlling space availablefor sedimentation is the structural development of thefault system, that is to say, the seaward translation of thestructural units, itself resulting from a regional gravity-driven extension.
ACKNOWLEDGEMENTS
We are grateful to Elf Congo for ¢nancial support of thisstudy and providing uswith the data set, aswell as TotalFi-naElf for technical support.We acknowledge M.S.N. Car-penter for improving the English style. J. Cartwrightprovided a thorough and stimulating review and contribu-ted strongly to improve the manuscript.
REFERENCES
Allen, P.A. & Allen, J.R. (1990) Basin Analysis. Principles andApplications. Blackwell Scienti¢c Publications, Oxford.
Aurisano, R.W. (1992) Palynostratigraphy, graphic correlationand the Albian^Cenomanian boundary o¡shore Gabon andCongo.Mem. Bull. Centres Rech. Explo. Prod. Elf, 13, 347^363.
Burollet, P.F. (1975) Tectonique en radeaux en Angola. Bull.Soc. Ge¤ ol. France,XXII, 503^504.
Cross,T.A. &Lessenger,M.A. (1998) Sediment volume parti-tioning: rationale for stratigraphic model evaluation and high-resolution stratigraphic correlation. In: Sequence Stratigraphy ^Concepts and Applications. (Ed. by F.M. Gradstein, K.O.
Sandvik & N.J. Milton) pp. 171–195, Norvegian
Petroleum Society (NPF), Spec. Publ. 8.Dahlstrom,C.D.A. (1969) Balanced cross section.Can. J. EarthSci., 6, 743^757.
Doyle, J.A., Jardine¤ ,S.&Doerenkamp,A. (1982)Afropollis, anew genus of early angiosperm pollen with notes on the Cre-taceous palynostratigraphy and paleoenvironments of north-ern Gondwana.Bull. Centres Rech. Explor. Prod. Elf, 6, 13^117.
Dromart,G.,Allemand,P.&Quiquerez,A. (1998) Calculat-ing rates of syndepositional normal faulting in the westernmargin of the Mesozoic Subalpine Basin (south-east France).Basin Res., 10, 235^260.
Duval, B., Cramez, C. & Jackson, M.P.A. (1992) Rafts tec-tonics in the Kwanza Basin, Angola. Marine Petrol. Geol., 9,389^404.
Gibbs, A.D. (1983) Balanced cross-section construction fromseismic sections in areas of extensional tectonics. J. Struct.Geol., 5, 153^160.
Gradstein,F.M.,Agterberg,F.P.,Ogg, J.G.,Hardenbol, J.,VanVeen,P.,Thierry, J.&Huang,Z. (1994)AMesozoic timescale. J. Geophys. Res., 99, 24051^24074.
Gratier, J.P.&Guillier,B. (1993)Compatibility constraints onfolded and faulted strata and calculation of total displacementusing computational restoration (UNFOLD program).J. Struct. Geol., 15, 391^402.
Gratier, J.P.,Guillier,B.,Delorme,A.&Odonne,F. (1991)Restoration and balanced cross section of a folded and faultedsurface by computer program: principle and application.J. Struct. Geol., 13, 11^115.
Guillier, B. (1991)De¤ pliage automatique de strates plisse¤ es et faille¤ es:application a' l’e¤ quilibrage des structures naturelles. UnpublishedPhDThesis, University of Grenoble, France.
Guillocheau, F. (1995) Nature, rank and origin of Phanerozoicsedimentary cycles.C. R. Acad. Sci. Paris, 320, 1141^1157.
Hallam,A. (1992) Phanerozoic Sea Level Changes. ColumbiaUni-versity Press, NewYork.
Haq, B.U., Hardenbol, J. & Vail, P.R. (1987) Chronology of£uctuating sea-levels since the Triassic. Science, 235, 1156^1166.
Homewood, P., Guillocheau, F., Eschard, R. & Cross, T.(1992) Corre¤ lation haute re¤ solution et stratigraphie ge¤ ne¤ tique:une de¤ marche inte¤ gre¤ e. Bull. Centres Rech. Explor. Prod. Elf, 16,375^381.
Hossack, J.R. (1979) The use of balanced cross section in thecalculation of orogenic contraction: a review. J. Geol. Soc.London, 136, 705^711.
Jardine¤ , S., Kieser, G. & Reyre, Y. (1974) Individualisationprogressive du continent africain a' travers les donne¤ es palyno-logiques de l’e' re secondaire. Bull. Soc. Ge¤ ol. Strasbourg, 27,68^85.
Jervey,M.T. (1988) Quantitative geological modeling of siliclas-tic rock sequences and their seismic expressions. In: Sea-levelChanges:An IntegratedApproach. (Ed. byC.K.Wilgus, B.S.Hast-ings, C.G. Kendall, H.W. Posamentier, C.A. Ross &J.C. Van Wagoner), Soc. Econ. Paleont. Min. Spec. Publ., 42,47^69.
Liro,L.M.&Coen,R. (1995)Salt deformation history and post-salt structural trends, o¡shore southern Gabon,West Africa.In: Salt Tectonics: A Global Perspective. (Ed. by M.P.A. Jackson,D.G. Roberts & S. Snelson), Amer. Assoc. Petrol. Geol. Mem.,65, 323^331.
Lundin, E.R. (1992) Thin-skinned extensional tectonics on asalt detachment, northern Kwanza Basin, Angola. MarinePetrol. Geol., 9, 405^411.
Mauduit,T. (1998) De¤ formation Gravitaire Synse¤ dimentaire sur uneMarge Passive. Mode¤ lisation Analogique et Application au Golf deGuine¤ e. Me¤ moires de Ge¤ osciences Rennes, 83, Ge¤ osciencesRennes, France.
Mauduit,T. & Brun, J.P. (1998) Growth fault/rollover systems.J. Geophys. Res., 103, 18119^18136.
Morgan, R. (1978) Albian to Senonian palynology of Site 364,Angola Basin. Init. Rep. Deep Sea Drill. Proj., 40, 915^951.
Nalpas,T. & Brun, J.P. (1993) Salt £ow and diapirism related toextension at crustal scale.Tectonophysics, 228, 349^362.
Posamentier, H.W., Jervey, M.T. & Vail, P.R. (1988) Eustaticcontrols on clastic deposition I ^ conceptual framework. In:Sea Level Changes: An Integrated Approach. (Ed. by C.K.Wilgus,B.S. Hastings, C.G. Kendall, H.W.Posamentier, C.A. Ross &J.C.VanWagoner), Soc. Econ. Paleont. Miner. Spec. Publ., 42,109^124.
r 2003 Blackwell Publishing Ltd,Basin Research, 15, 183^200 199
Rates of deformation of an extensional growth fault/raft system
Robin, C. (1997)Mesure Stratigraphique de la De¤ formation: Applica-tion a' L’e¤ volution Jurassique du Bassin de Paris. Me¤ moires deGe¤ osciences Rennes, 77, Ge¤ osciences Rennes, France.
Robin, C., Guillocheau, F. & Gaulier, J.M. (1996) Mesuredes signaux eustatiques et tectoniques au sein de l’enregistre-ment se¤ dimentaire d’un bassin intracratonique. Applicationau Lias du Bassin de Paris. C. R. Acad. Sci. Paris, 322, 1079^1086.
Robin,C.,Guillocheau, F. &Gaulier, J.M. (1998) Discrimi-nating between tectonic and eustatic controls on the strati-graphic record in the Paris Basin.Terra Nova, 10, 323^329.
Robin, C., Guillocheau, F., Allemand, P., Bourquin, S.,Dromart, G., Gaulier, J.M. & Prijeac, C. (2000) Echellesde temps et d’espace du contro“ le tectonique d’un bassin £exur-al intracratonique: le Bassin de Paris. Bull. Soc. Ge¤ ol. France,171, 181^196.
Rouby, D., Cobbold, P.R., Szatmari, P., Demercian, S.,Coelho,D.&Rici, J.A. (1993a)Least-squares palinspastic re-storation of regions of normal faulting. Application to theCampos Basin (Brazil).Tectonophysics, 221, 439^452.
Rouby, D., Cobbold, P.R., Szatmari, P., Demercian, S.,Coelho, D. & Rici, J.A. (1993b) Restoration in plan view offaulted Upper Cretaceous and Oligocene horizons and itsbearing on the history of salt tectonics in the Campos Basin(Brazil).Tectonophysics, 228, 435^445.
Rouby,D.,Raillard,S.,Guillocheau,F.,Bouroullec,R.&Nalpas, T. (2002) Kinematics of a growth fault/raft systemfrom restoration in 3D (West African Margin). J. Struct. Geol.,24, 783^796.
Rouby,D., Suppe, J. & Xiao, H. (2000) 3D restoration of com-plexly faulted and folded surfaces using multiple unfoldingmechanisms.Amer. Assoc. Petrol. Geol., 84, 805^829.
Samson, P. (1996) Equilibrage de structures ge¤ ologiques 3D dans lecadre du projet GOCAD. Unpublished PhDThesis, Institut Na-tional Polytechnique de Lorraine, Nancy, France.
Sclater, J.G.&Christie,P.A.F. (1980) Continental stretching:an explanation of the mid-Cretaceous subsidence of the Cen-tral North Sea Basin. J. Geophys. Res., 85, 3711^3739.
Spathopoulos,F. (1996) An insight on salt tectonics in the An-gola Basin, SouthAtlantic. In:Salt Tectonics. (Ed. byG.I. Alsop,D.J. Blundel & I. Davison), London, Geol. Soc. London Spec.Publ., 100, 153^174.
VanWagoner, J.C.,Mitchum,R.M.,Campion,K.M.&Rah-
manian, V.D. (1990) Siliciclastic Sequence Stratigraphy in WellLogs, Core and Outcrops: Concepts for High-Resolution Correlationof Time and Facies. Methods Explor. Ser. 7. Amer. Assoc. Petrol.Geol.
Van Wagoner, J.C., Posamentier, H.W., Mitchum, R.M.,Vail, P.R., Sarg, J.F., Loutit,T.S. & Hardenbol, J. (1988)An overview of the fundamentals of sequence stratigraphyand key de¢nitions. In: Sea Level Changes: An Integrated Ap-proach. (Ed. by C.K. Wilgus, B.S. Hastings, C.G. Kendall,H.W. Posamentier, C.A. Ross & J.C.VanWagoner), Soc. Econ.Paleont.Miner. Spec. Publ., 42, 39^45.
Vendeville, B. (1987) Champs de failles et tectonique en extension:mode¤ lisation experimentale: Me¤ m. Doc. Cent. Armoricain. Etud.Struct. Socles., 15, Rennes.
Vendeville,B.&Cobbold,P.R. (1987)Glissements gravitairessynse¤ dimentaires et failles normales listriques: mode' les ex-pe¤ rimentaux. C. R. Acad. Sci. Paris, 305, 1313^1319.
Vendeville, B. & Cobbold, P.R. (1988) How normal faultingand sedimentation interact to produce listric fault pro¢lesand stratigraphic wedges. J. Struct. Geol., 10, 649^659.
Vendeville, B.C. & Jackson,M.P.A. (1992a) The rise of dia-pirs during thin skinned extension. Marine Petrol. Geol., 9,331^353.
Vendeville,B.C.& Jackson,M.P.A. (1992b) The fall of diapirsduring thin skinned extension.Marine Petrol. Geol., 9, 354^371.
Vendeville,B.,Cobbold,P.R.,Davy,P.,Brun, J.P.&Chouk-
roune, P. (1987) Physical models of extensional tectonics atvarious scales. In: Continental extensional tectonics. (Ed. by M.P.Coward, J.F. Dewey & P.L. Hanckock), Geol. Soc. LondonSpec. Publ., 28, 95^107.
Vernet,R.,Assoua-Wande,C.,Massamba,L.&Sorriaux,P.(1996) Pale¤ oge¤ ographie du Cre¤ tace¤ (Albien-Maastrichtien) dubassin co“ tier congolais.Mem.Bull. Centres Rech. Explo. Prod. Elf,16, 39^55.
Williams, G.D., Kane, S.J., Buddin, T.S. & Richards, A.J.(1997) Restoration and balance of complex folded and faultedrockvolumes: £exural £attening, jigsaw ¢tting and decompac-tion in 3D. Tectonophysics, 273, 203^218.
Manuscript received: 08 May 2001; Manuscript accepted: 14October 2002.
r 2003 Blackwell Publishing Ltd,Basin Research, 15, 183^200200
D. Rouby et al.
Copyright © 2022 FDOKUMEN